Energy Policy Implications of Global Warming - SeaLevel.info
Upload
independentCategory
view
1download
0
www.elsevier.com/locate/gloplacha
Global and Planetary Change 39 (2003) 215–225
Warming permafrost in European mountains
Charles Harrisa,*, Daniel Vonder Muhllb, Ketil Isaksenc, Wilfried Haeberlid,Johan Ludvig Sollide, Lorenz Kingf, Per Holmlundg, Francesco Dramish,
Mauro Guglielmini, David Palaciosj
aDepartment of Earth Sciences, Cardiff University, P.O. Box 914, Cardiff CF10 3YE, UKbUniversity of Basel, Petergraben 35/3, CH-4051 Basel, Switzerland
cNorwegian Meteorological Institute, P.O. Box 43 Blindern, N-0313 Oslo, NorwaydDepartment of Geography, University of Zurich, Winterthurerstrasse 190, CH-8057 Zurich, SwitzerlandeDepartment of Physical Geography, University of Oslo, P.O. Box 1042, Blindern, N-0316 Oslo, Norway
fGeographical Institute, Justus Liebig University, Senckenbergstrasse 1, Giessen D35390, GermanygDepartment of Physical Geography, Stockholm University, S-10591 Stockholm, Sweden
hDepartment of Geological Sciences, Third University of Rome, Largo San Leonardo Murialdo, 1-00146 Rome, ItalyiGeological Survey of Lombardy, Milan, Italy
jDepartmento de AGR y Geografia Fısica, Universidad Complutense, Madrid 28040, Spain
Received 4 July 2002; accepted 23 April 2003
Abstract
Here we present the first systematic measurements of European mountain permafrost temperatures from a latitudinal transect
of six boreholes extending from the Alps, through Scandinavia to Svalbard. Boreholes were drilled in bedrock to depths of at
least 100 m between May 1998 and September 2000. Geothermal profiles provide evidence for regional-scale secular warming,
since all are nonlinear, with near-surface warm-side temperature deviations from the deeper thermal gradient. Topographic
effects lead to variability between Alpine sites. First approximation estimates, based on curvature within the borehole thermal
profiles, indicate a maximum ground surface warming of + 1 jC in Svalbard, considered to relate to thermal changes in the last
100 years. In addition, a 15-year time series of thermal data from the 58-m-deep Murtel–Corvatsch permafrost borehole in
Switzerland, drilled in creeping frozen ice-rich rock debris, shows an overall warming trend, but with high-amplitude
interannual fluctuations that reflect early winter snow cover more strongly than air temperatures. Thus interpretation of the
deeper borehole thermal histories must clearly take account of the potential effects of changing snow cover in addition to
atmospheric temperatures.
D 2003 Elsevier B.V. All rights reserved.
Keywords: Permafrost; Global warming; Borehole temperatures; European mountains
0921-8181/$ - see front matter D 2003 Elsevier B.V. All rights reserved.
doi:10.1016/j.gloplacha.2003.04.001
* Corresponding author. Tel.: +44-2920-874336; fax: +44-
2920-874326.
E-mail address: [email protected] (C. Harris).
1. Introduction
Initial measurements of geothermal profiles from
a series of six recently drilled boreholes in the high-
elevation mountain permafrost zone of Europe are
reported in this paper. All boreholes were drilled by
C. Harris et al. / Global and Planetary Change 39 (2003) 215–225216
the EU-funded Permafrost and Climate in Europe
(PACE) Project (Harris et al., 2001a,b) between May
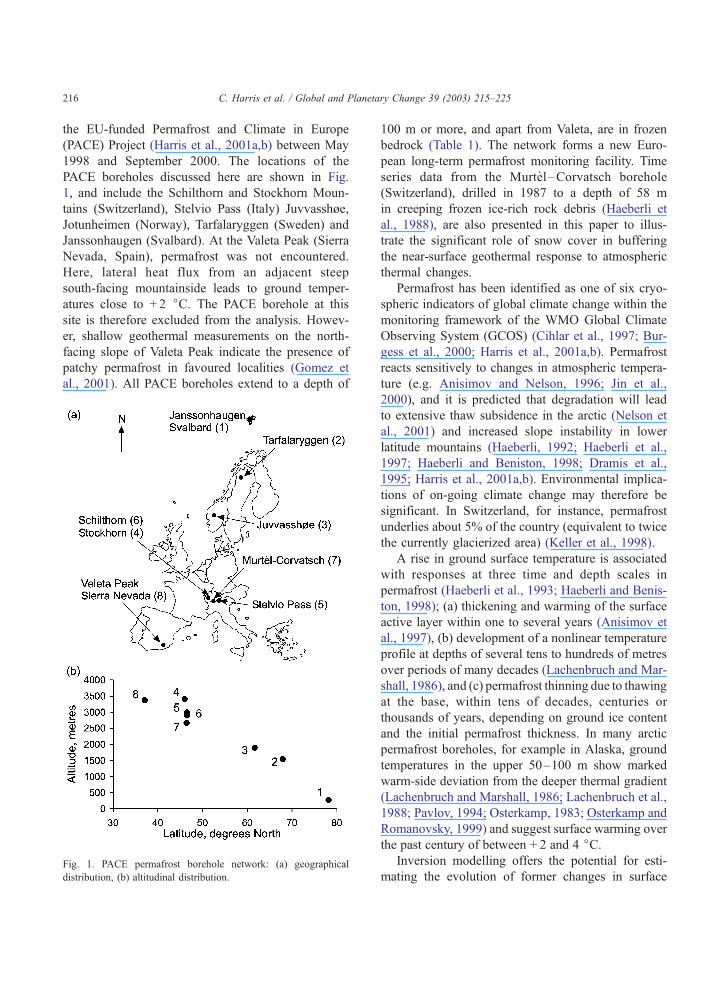
1998 and September 2000. The locations of the
PACE boreholes discussed here are shown in Fig.
1, and include the Schilthorn and Stockhorn Moun-
tains (Switzerland), Stelvio Pass (Italy) Juvvasshøe,
Jotunheimen (Norway), Tarfalaryggen (Sweden) and
Janssonhaugen (Svalbard). At the Valeta Peak (Sierra
Nevada, Spain), permafrost was not encountered.
Here, lateral heat flux from an adjacent steep
south-facing mountainside leads to ground temper-
atures close to + 2 jC. The PACE borehole at this
site is therefore excluded from the analysis. Howev-
er, shallow geothermal measurements on the north-
facing slope of Valeta Peak indicate the presence of
patchy permafrost in favoured localities (Gomez et
al., 2001). All PACE boreholes extend to a depth of
Fig. 1. PACE permafrost borehole network: (a) geographical
distribution, (b) altitudinal distribution.
100 m or more, and apart from Valeta, are in frozen
bedrock (Table 1). The network forms a new Euro-
pean long-term permafrost monitoring facility. Time
series data from the Murtel–Corvatsch borehole
(Switzerland), drilled in 1987 to a depth of 58 m
in creeping frozen ice-rich rock debris (Haeberli et
al., 1988), are also presented in this paper to illus-
trate the significant role of snow cover in buffering
the near-surface geothermal response to atmospheric
thermal changes.
Permafrost has been identified as one of six cryo-
spheric indicators of global climate change within the
monitoring framework of the WMO Global Climate
Observing System (GCOS) (Cihlar et al., 1997; Bur-
gess et al., 2000; Harris et al., 2001a,b). Permafrost
reacts sensitively to changes in atmospheric tempera-
ture (e.g. Anisimov and Nelson, 1996; Jin et al.,
2000), and it is predicted that degradation will lead
to extensive thaw subsidence in the arctic (Nelson et
al., 2001) and increased slope instability in lower
latitude mountains (Haeberli, 1992; Haeberli et al.,
1997; Haeberli and Beniston, 1998; Dramis et al.,
1995; Harris et al., 2001a,b). Environmental implica-
tions of on-going climate change may therefore be
significant. In Switzerland, for instance, permafrost
underlies about 5% of the country (equivalent to twice
the currently glacierized area) (Keller et al., 1998).
A rise in ground surface temperature is associated
with responses at three time and depth scales in
permafrost (Haeberli et al., 1993; Haeberli and Benis-
ton, 1998); (a) thickening and warming of the surface
active layer within one to several years (Anisimov et
al., 1997), (b) development of a nonlinear temperature
profile at depths of several tens to hundreds of metres
over periods of many decades (Lachenbruch and Mar-
shall, 1986), and (c) permafrost thinning due to thawing
at the base, within tens of decades, centuries or
thousands of years, depending on ground ice content
and the initial permafrost thickness. In many arctic
permafrost boreholes, for example in Alaska, ground
temperatures in the upper 50–100 m show marked
warm-side deviation from the deeper thermal gradient
(Lachenbruch and Marshall, 1986; Lachenbruch et al.,
1988; Pavlov, 1994; Osterkamp, 1983; Osterkamp and
Romanovsky, 1999) and suggest surface warming over
the past century of between + 2 and 4 jC.Inversion modelling offers the potential for esti-
mating the evolution of former changes in surface

Table 1
Summary of PACE borehole sites. MAAT is the Mean Annual Air Temperature
Borehole name
and depth
Date
drilled
Altitude
(m a.s.l.)
Topography Bedrock MAAT
(jC)Ground cover
Janssonhaugen Adventdalen,
Svalbard, 102 m
May 1998 275 Small rise in
valley floor
Fine-grained sandstone � 8 Thin weathered rock,
little vegetation
Tarfalaryggen,
Sweden, 100 m
March 2000 1540 Mountain ridge Massive amphibolite � 7 ca. 4 m weathered
bedrock
Juvvasshøe, Jotunheimen,
Norway, 129 m
August 1999 1894 Mountain plateau Gneiss � 4 3–4 m weathered
bedrock
Schilthorn Berner Oberland,
Switzerland, 101 m
August 2000 2900 Slope beneath
mountain summit
Calcareous schist � 3.5 Thin weathered
bedrock
Stockhorn plateau, Wallis,
Switzerland, 100.7 m
July 2000 3410 Crest plateau Albite–muscovite schist � 5.5 Weathered
bedrock
Stelvio Pass, Lombardia,
Italy, 100.3 m
May 1998 3000 Rounded summit Dolomitic limestone � 3.7 Weathered bedrock
Murtel –Corvatsch, 58 m June 1987 2670 Rock glacier Ice-rich boulders and scree � 3.5 Boulders
C. Harris et al. / Global and Planetary Change 39 (2003) 215–225 217
temperature from observed geothermal profiles (e.g.
Shen and Beck, 1991; Beltrami and Mareschal, 1995;
Beltrami and Harris, 2001) and since heat advection
by groundwater flow can be excluded in ice-bearing
permafrost, inversion modelling is particularly appro-
priate. However, in the European mountains, topo-
graphic influences on the upper thermal boundary
must be considered, and at lower latitudes the signif-
icance of aspect may be considerable, so that three-
dimensional analysis of the geothermal fields is a
critical component of inversion modelling. This anal-
ysis is currently in progress, and results are not yet
available. It is important to stress, therefore, that the
current paper presents only a first approximation of
likely surface warming at the PACE borehole sites
interpreted from the observed near-surface geothermal
profiles.
2. The monitoring network
The six PACE boreholes discussed in this paper
form a latitudinal transect extending from 46j31VN to
78j10VN from the Alps through the Scandinavian
mountains to Svalbard (Table 1). During drilling, bore-
holes were flushed with chilled compressed air, and no
liquids were used. The northernmost borehole at Jans-
sonhaugen, Svalbard (Fig. 1) lies above the Holocene
marine limit, in an area with no mining history. In all
cases bedrock lithology, observed from rock chippings
produced during drilling, was reported to be approxi-
mately uniform, although during drilling of the Stelvio
borehole, a few metres of icier frozen bedrock were
encountered at depths around 42 and 90 m. Standard-
ized instrumentation procedures included installation
of 30 individually calibrated thermistors with absolute
accuracy better than F 0.05 jC, at increasing down-
hole depth intervals (Harris et al., 2001b). Boreholes
were lined with plastic tubing to allow periodic recal-
ibration of thermistors. No fluid such as oil was
introduced inside the borehole liner. Data are recorded
every 6 h in the uppermost 5 m, and every 24 h at
greater depths. Long-term monitoring will contribute
data to the Global Terrestrial Network for Permafrost
(GTN-P) of the Global Climate Observing System
(GCOS). At all sites permafrost thickness exceeded
expectations on the basis of atmospheric temperatures.
In all cases, the depth of penetration of the seasonal
thermal signal was around 20 m.
3. Permafrost thermal profiles
Permafrost temperature profiles show near-surface
warm-side deviation from linear, with thermal gra-
dients increasing with depth. In the case of Schilthorn,
Juvvasshøe and Tarfalaryggen, the thermal gradient is
negative (decreasing with depth) to between 30 and
40 m (Table 2, Fig. 2). Borehole thermal gradients
may be influenced by four major factors; regional
geothermal heat flux, variation in lithology with depth,
ground surface topography (governing the shape of the
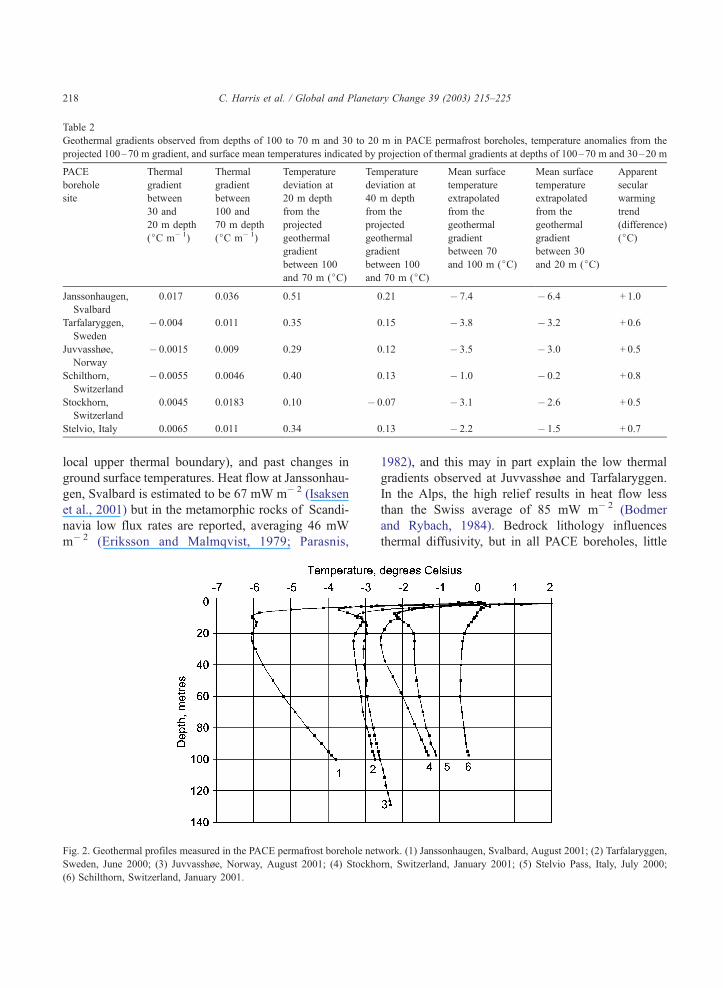
Table 2
Geothermal gradients observed from depths of 100 to 70 m and 30 to 20 m in PACE permafrost boreholes, temperature anomalies from the
projected 100–70 m gradient, and surface mean temperatures indicated by projection of thermal gradients at depths of 100–70 m and 30–20 m
PACE
borehole
site
Thermal
gradient
between
30 and
20 m depth
(jC m� 1)
Thermal
gradient
between
100 and
70 m depth
(jC m� 1)
Temperature
deviation at
20 m depth
from the
projected
geothermal
gradient
between 100
and 70 m (jC)
Temperature
deviation at
40 m depth
from the
projected
geothermal
gradient
between 100
and 70 m (jC)
Mean surface
temperature
extrapolated
from the
geothermal
gradient
between 70
and 100 m (jC)
Mean surface
temperature
extrapolated
from the
geothermal
gradient
between 30
and 20 m (jC)
Apparent
secular
warming
trend
(difference)
(jC)
Janssonhaugen,
Svalbard
0.017 0.036 0.51 0.21 � 7.4 � 6.4 + 1.0
Tarfalaryggen,
Sweden
� 0.004 0.011 0.35 0.15 � 3.8 � 3.2 + 0.6
Juvvasshøe,
Norway
� 0.0015 0.009 0.29 0.12 � 3.5 � 3.0 + 0.5
Schilthorn,
Switzerland
� 0.0055 0.0046 0.40 0.13 � 1.0 � 0.2 + 0.8
Stockhorn,
Switzerland
0.0045 0.0183 0.10 � 0.07 � 3.1 � 2.6 + 0.5
Stelvio, Italy 0.0065 0.011 0.34 0.13 � 2.2 � 1.5 + 0.7
C. Harris et al. / Global and Planetary Change 39 (2003) 215–225218
local upper thermal boundary), and past changes in
ground surface temperatures. Heat flow at Janssonhau-
gen, Svalbard is estimated to be 67 mW m� 2 (Isaksen
et al., 2001) but in the metamorphic rocks of Scandi-
navia low flux rates are reported, averaging 46 mW
m� 2 (Eriksson and Malmqvist, 1979; Parasnis,
Fig. 2. Geothermal profiles measured in the PACE permafrost borehole net
Sweden, June 2000; (3) Juvvasshøe, Norway, August 2001; (4) Stockho
(6) Schilthorn, Switzerland, January 2001.
1982), and this may in part explain the low thermal
gradients observed at Juvvasshøe and Tarfalaryggen.
In the Alps, the high relief results in heat flow less
than the Swiss average of 85 mW m� 2 (Bodmer
and Rybach, 1984). Bedrock lithology influences
thermal diffusivity, but in all PACE boreholes, little
work. (1) Janssonhaugen, Svalbard, August 2001; (2) Tarfalaryggen,
rn, Switzerland, January 2001; (5) Stelvio Pass, Italy, July 2000;
C. Harris et al. / Global and Planetary Change 39 (2003) 215–225 219
variation in lithology was observed during drilling.
Three-dimensional modelling of the temperature
field is necessary to assess the influence of topog-
raphy. However, initial data suggest that at the
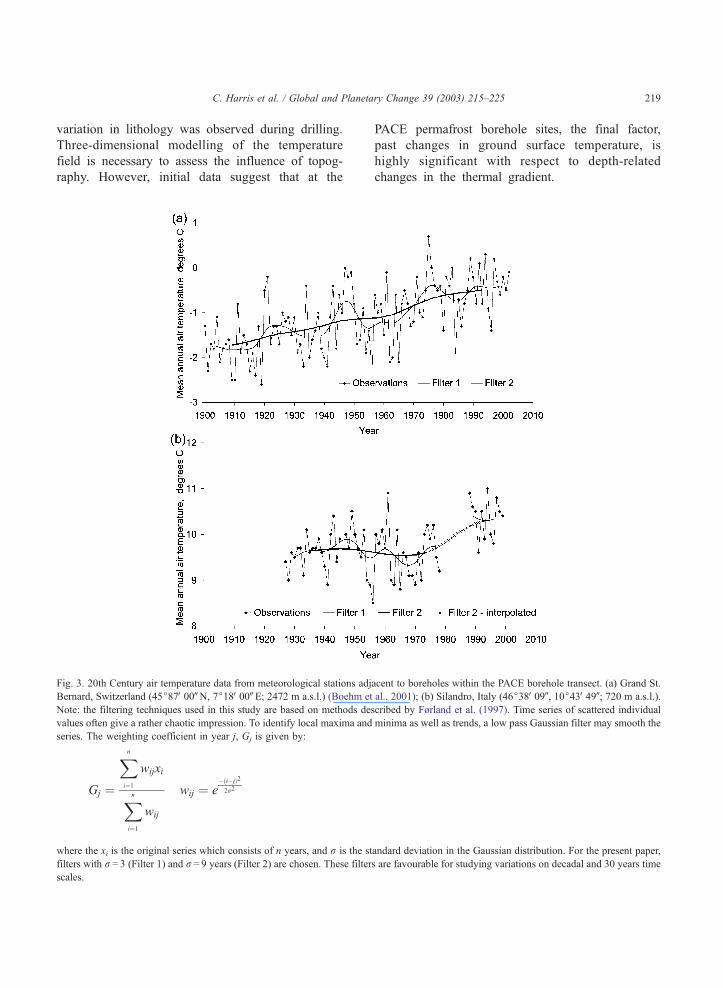
Fig. 3. 20th Century air temperature data from meteorological stations adj
Bernard, Switzerland (45j87V00WN, 7j18V00WE; 2472 m a.s.l.) (Boehm et
Note: the filtering techniques used in this study are based on methods des
values often give a rather chaotic impression. To identify local maxima and
series. The weighting coefficient in year j, Gj is given by:
Gj ¼
Xn
i¼1
wijxi
Xn
i¼1
wij
wij ¼ e�ði�jÞ2
2r2
where the xi is the original series which consists of n years, and r is the st
filters with r= 3 (Filter 1) and r= 9 years (Filter 2) are chosen. These filter
scales.
PACE permafrost borehole sites, the final factor,
past changes in ground surface temperature, is
highly significant with respect to depth-related
changes in the thermal gradient.
acent to boreholes within the PACE borehole transect. (a) Grand St.
al., 2001); (b) Silandro, Italy (46j38V09U, 10j43V49U; 720 m a.s.l.).
cribed by Førland et al. (1997). Time series of scattered individual
minima as well as trends, a low pass Gaussian filter may smooth the
andard deviation in the Gaussian distribution. For the present paper,
s are favourable for studying variations on decadal and 30 years time

C. Harris et al. / Global and Planetary Change 39 (2003) 215–225220

Fig. 5. Seasonal ground temperature variations within the PACE boreholes. Note the projected geothermal gradients between 30 and 20 m and
predicted ground surface mean temperatures. (a) Janssonhaugen, Svalbard: (b) Tarfalaryggen, Sweden: (c) Juvasshøe, Norway: (d) Stockhorn,
Switzerland: (e) Stelvio Pass, Italy: (f) Schilthorn, Switzerland.
C. Harris et al. / Global and Planetary Change 39 (2003) 215–225 221
The highest warm-side deviation of the 20 m depth
permafrost temperature from a linear extrapolation of
the deeper geothermal gradient (observed between 70
and 100 m) is 0.51 jC at the most northerly location
(Janssonhaugen, Svalbard) (Table 1). In the mainland
Fig. 4. 20th Century temperature data frommeteorological stations adjacent
as described in Fig. 3. (a) Svalbard Airport Svalbard (78j15V00UN, 15j28Va.s.l.). Data courtesy of the Swedish Meteorological and Hydrological Institu
626 m a.s.l.).
Scandinavian boreholes the deviation decreases south-
wards, being 0.35j at Tarfalaryggen, Sweden and
0.29 jC at Juvvasshøe, Norway. The steeper topogra-
phy and greater influence of aspect in the Alps is
reflected in greater variation in observed thermal
to boreholes within the PACE borehole transect. Filtering technique is
00UE; 28 m a.s.l.); (b) Abisko, Sweden (68j21VN, 18j49VE; 388 m
te (SMHI); (c) Kjoeremsgrende, Norway (62j05V63UN, 9j02V76UE;
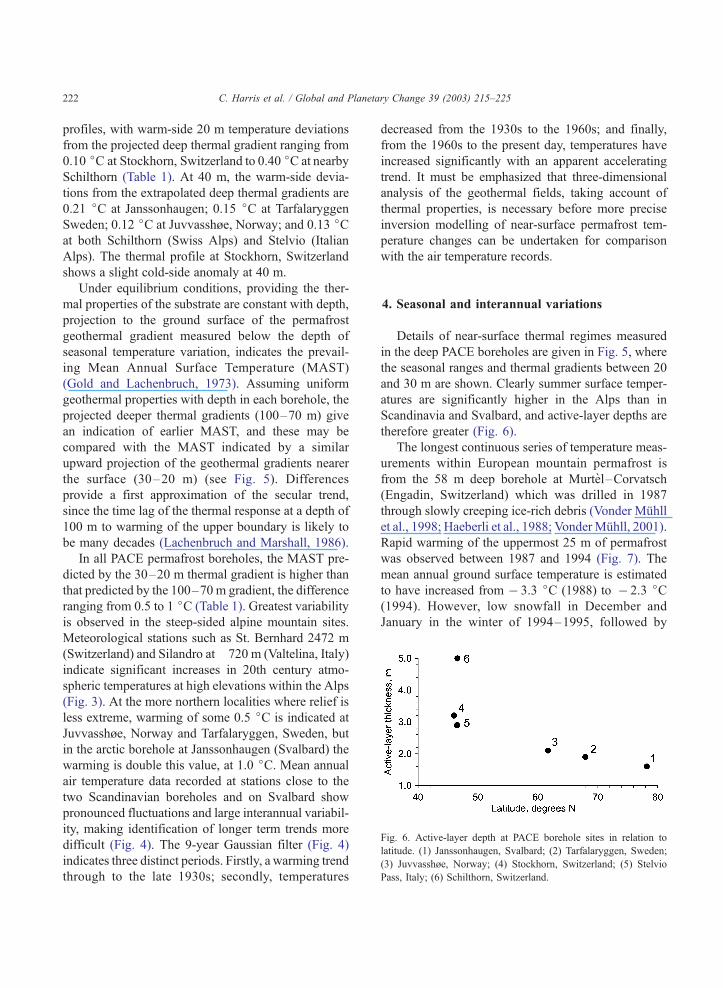
Fig. 6. Active-layer depth at PACE borehole sites in relation to
latitude. (1) Janssonhaugen, Svalbard; (2) Tarfalaryggen, Sweden;
(3) Juvvasshøe, Norway; (4) Stockhorn, Switzerland; (5) Stelvio
Pass, Italy; (6) Schilthorn, Switzerland.
C. Harris et al. / Global and Planetary Change 39 (2003) 215–225222
profiles, with warm-side 20 m temperature deviations
from the projected deep thermal gradient ranging from
0.10 jC at Stockhorn, Switzerland to 0.40 jC at nearby
Schilthorn (Table 1). At 40 m, the warm-side devia-
tions from the extrapolated deep thermal gradients are
0.21 jC at Janssonhaugen; 0.15 jC at Tarfalaryggen
Sweden; 0.12 jC at Juvvasshøe, Norway; and 0.13 jCat both Schilthorn (Swiss Alps) and Stelvio (Italian
Alps). The thermal profile at Stockhorn, Switzerland
shows a slight cold-side anomaly at 40 m.
Under equilibrium conditions, providing the ther-
mal properties of the substrate are constant with depth,
projection to the ground surface of the permafrost
geothermal gradient measured below the depth of
seasonal temperature variation, indicates the prevail-
ing Mean Annual Surface Temperature (MAST)
(Gold and Lachenbruch, 1973). Assuming uniform
geothermal properties with depth in each borehole, the
projected deeper thermal gradients (100–70 m) give
an indication of earlier MAST, and these may be
compared with the MAST indicated by a similar
upward projection of the geothermal gradients nearer
the surface (30–20 m) (see Fig. 5). Differences
provide a first approximation of the secular trend,
since the time lag of the thermal response at a depth of
100 m to warming of the upper boundary is likely to
be many decades (Lachenbruch and Marshall, 1986).
In all PACE permafrost boreholes, the MAST pre-
dicted by the 30–20 m thermal gradient is higher than
that predicted by the 100–70 m gradient, the difference
ranging from 0.5 to 1 jC (Table 1). Greatest variability
is observed in the steep-sided alpine mountain sites.
Meteorological stations such as St. Bernhard 2472 m
(Switzerland) and Silandro at 720 m (Valtelina, Italy)
indicate significant increases in 20th century atmo-
spheric temperatures at high elevations within the Alps
(Fig. 3). At the more northern localities where relief is
less extreme, warming of some 0.5 jC is indicated at
Juvvasshøe, Norway and Tarfalaryggen, Sweden, but
in the arctic borehole at Janssonhaugen (Svalbard) the
warming is double this value, at 1.0 jC. Mean annual
air temperature data recorded at stations close to the
two Scandinavian boreholes and on Svalbard show
pronounced fluctuations and large interannual variabil-
ity, making identification of longer term trends more
difficult (Fig. 4). The 9-year Gaussian filter (Fig. 4)
indicates three distinct periods. Firstly, a warming trend
through to the late 1930s; secondly, temperatures
decreased from the 1930s to the 1960s; and finally,
from the 1960s to the present day, temperatures have
increased significantly with an apparent accelerating
trend. It must be emphasized that three-dimensional
analysis of the geothermal fields, taking account of
thermal properties, is necessary before more precise
inversion modelling of near-surface permafrost tem-
perature changes can be undertaken for comparison
with the air temperature records.
4. Seasonal and interannual variations
Details of near-surface thermal regimes measured
in the deep PACE boreholes are given in Fig. 5, where
the seasonal ranges and thermal gradients between 20
and 30 m are shown. Clearly summer surface temper-
atures are significantly higher in the Alps than in
Scandinavia and Svalbard, and active-layer depths are
therefore greater (Fig. 6).
The longest continuous series of temperature meas-
urements within European mountain permafrost is
from the 58 m deep borehole at Murtel–Corvatsch
(Engadin, Switzerland) which was drilled in 1987
through slowly creeping ice-rich debris (Vonder Muhll
et al., 1998; Haeberli et al., 1988; Vonder Muhll, 2001).
Rapid warming of the uppermost 25 m of permafrost
was observed between 1987 and 1994 (Fig. 7). The
mean annual ground surface temperature is estimated
to have increased from � 3.3 jC (1988) to � 2.3 jC(1994). However, low snowfall in December and
January in the winter of 1994–1995, followed by
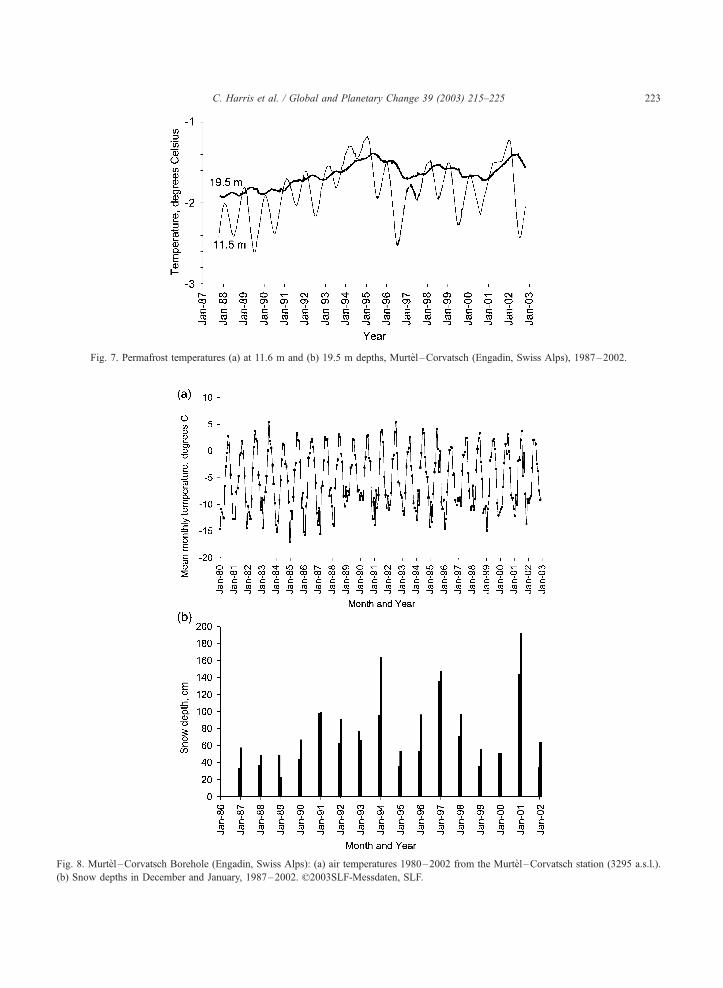
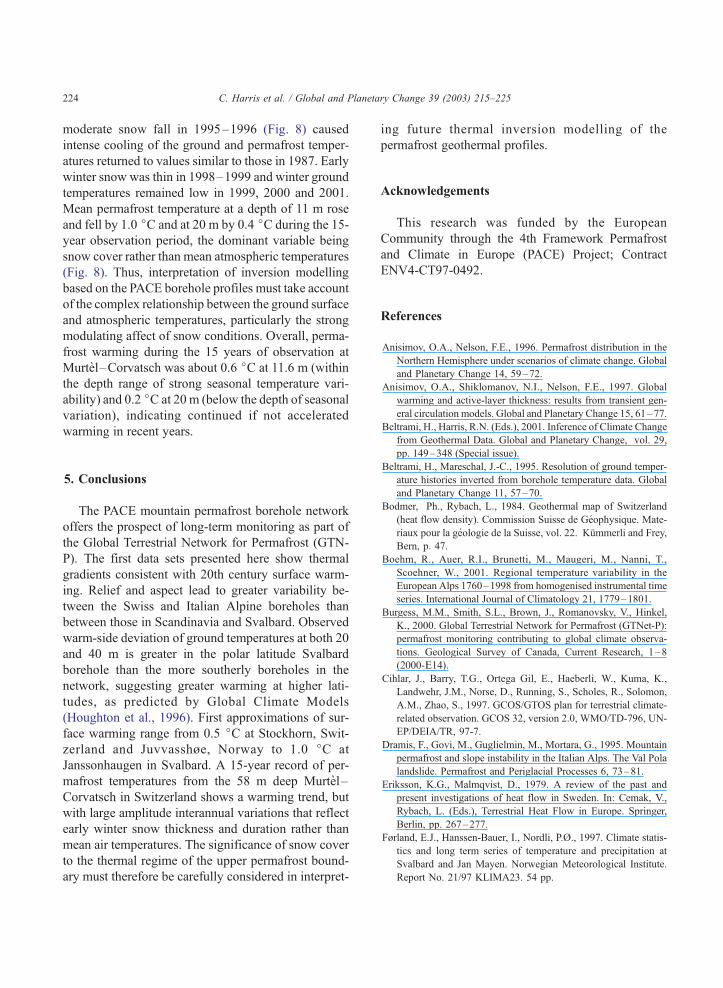
Fig. 8. Murtel –Corvatsch Borehole (Engadin, Swiss Alps): (a) air temperatures 1980–2002 from the Murtel –Corvatsch station (3295 a.s.l.).
(b) Snow depths in December and January, 1987–2002. n2003SLF-Messdaten, SLF.
Fig. 7. Permafrost temperatures (a) at 11.6 m and (b) 19.5 m depths, Murtel –Corvatsch (Engadin, Swiss Alps), 1987–2002.
C. Harris et al. / Global and Planetary Change 39 (2003) 215–225 223
C. Harris et al. / Global and Planetary Change 39 (2003) 215–225224
moderate snow fall in 1995–1996 (Fig. 8) caused
intense cooling of the ground and permafrost temper-
atures returned to values similar to those in 1987. Early
winter snow was thin in 1998–1999 and winter ground
temperatures remained low in 1999, 2000 and 2001.
Mean permafrost temperature at a depth of 11 m rose
and fell by 1.0 jC and at 20 m by 0.4 jC during the 15-
year observation period, the dominant variable being
snow cover rather than mean atmospheric temperatures
(Fig. 8). Thus, interpretation of inversion modelling
based on the PACE borehole profiles must take account
of the complex relationship between the ground surface
and atmospheric temperatures, particularly the strong
modulating affect of snow conditions. Overall, perma-
frost warming during the 15 years of observation at
Murtel–Corvatsch was about 0.6 jC at 11.6 m (within
the depth range of strong seasonal temperature vari-
ability) and 0.2 jC at 20m (below the depth of seasonal
variation), indicating continued if not accelerated
warming in recent years.
5. Conclusions
The PACE mountain permafrost borehole network
offers the prospect of long-term monitoring as part of
the Global Terrestrial Network for Permafrost (GTN-
P). The first data sets presented here show thermal
gradients consistent with 20th century surface warm-
ing. Relief and aspect lead to greater variability be-
tween the Swiss and Italian Alpine boreholes than
between those in Scandinavia and Svalbard. Observed
warm-side deviation of ground temperatures at both 20
and 40 m is greater in the polar latitude Svalbard
borehole than the more southerly boreholes in the
network, suggesting greater warming at higher lati-
tudes, as predicted by Global Climate Models
(Houghton et al., 1996). First approximations of sur-
face warming range from 0.5 jC at Stockhorn, Swit-
zerland and Juvvasshøe, Norway to 1.0 jC at
Janssonhaugen in Svalbard. A 15-year record of per-
mafrost temperatures from the 58 m deep Murtel–
Corvatsch in Switzerland shows a warming trend, but
with large amplitude interannual variations that reflect
early winter snow thickness and duration rather than
mean air temperatures. The significance of snow cover
to the thermal regime of the upper permafrost bound-
ary must therefore be carefully considered in interpret-
ing future thermal inversion modelling of the
permafrost geothermal profiles.
Acknowledgements
This research was funded by the European
Community through the 4th Framework Permafrost
and Climate in Europe (PACE) Project; Contract
ENV4-CT97-0492.
References
Anisimov, O.A., Nelson, F.E., 1996. Permafrost distribution in the
Northern Hemisphere under scenarios of climate change. Global
and Planetary Change 14, 59–72.
Anisimov, O.A., Shiklomanov, N.I., Nelson, F.E., 1997. Global
warming and active-layer thickness: results from transient gen-
eral circulation models. Global and Planetary Change 15, 61–77.
Beltrami, H., Harris, R.N. (Eds.), 2001. Inference of Climate Change
from Geothermal Data. Global and Planetary Change, vol. 29,
pp. 149–348 (Special issue).
Beltrami, H., Mareschal, J.-C., 1995. Resolution of ground temper-
ature histories inverted from borehole temperature data. Global
and Planetary Change 11, 57–70.
Bodmer, Ph., Rybach, L., 1984. Geothermal map of Switzerland
(heat flow density). Commission Suisse de Geophysique. Mate-
riaux pour la geologie de la Suisse, vol. 22. Kummerli and Frey,
Bern, p. 47.
Boehm, R., Auer, R.I., Brunetti, M., Maugeri, M., Nanni, T.,
Scoehner, W., 2001. Regional temperature variability in the
European Alps 1760–1998 from homogenised instrumental time
series. International Journal of Climatology 21, 1779–1801.
Burgess, M.M., Smith, S.L., Brown, J., Romanovsky, V., Hinkel,
K., 2000. Global Terrestrial Network for Permafrost (GTNet-P):
permafrost monitoring contributing to global climate observa-
tions. Geological Survey of Canada, Current Research, 1–8
(2000-E14).
Cihlar, J., Barry, T.G., Ortega Gil, E., Haeberli, W., Kuma, K.,
Landwehr, J.M., Norse, D., Running, S., Scholes, R., Solomon,
A.M., Zhao, S., 1997. GCOS/GTOS plan for terrestrial climate-
related observation. GCOS 32, version 2.0, WMO/TD-796, UN-
EP/DEIA/TR, 97-7.
Dramis, F., Govi, M., Guglielmin, M., Mortara, G., 1995. Mountain
permafrost and slope instability in the Italian Alps. The Val Pola
landslide. Permafrost and Periglacial Processes 6, 73–81.
Eriksson, K.G., Malmqvist, D., 1979. A review of the past and
present investigations of heat flow in Sweden. In: Cemak, V.,
Rybach, L. (Eds.), Terrestrial Heat Flow in Europe. Springer,
Berlin, pp. 267–277.
Førland, E.J., Hanssen-Bauer, I., Nordli, P.Ø., 1997. Climate statis-
tics and long term series of temperature and precipitation at
Svalbard and Jan Mayen. Norwegian Meteorological Institute.
Report No. 21/97 KLIMA23. 54 pp.
C. Harris et al. / Global and Planetary Change 39 (2003) 215–225 225
Gold, L.W., Lachenbruch, A.H., 1973. Thermal conditions in per-
mafrost—a review of North American literature. Proceedings
Second International Conference on Permafrost, Yakutsk,
U.S.S.R., North American Contribution. National Academy of
Sciences, Washington, U.S., pp. 3–25.
Gomez, A., Palacios, D., Ramos, M., Tanarro, L.M., Schulte, L.,
Salvador, F., 2001. Location of permafrost in marginal regions:
Corral del Valeta, Sierra Nevada, Spain. Permafrost and Perigla-
cial Processes 12, 93–110.
Haeberli, W., 1992. Construction, environmental problems and nat-
ural hazards in periglacial mountain belts. Permafrost and Peri-
glacial Processes 3, 111–124.
Haeberli, W., Beniston, M., 1998. Climate change and its impacts
on glaciers and permafrost in the Alps. Ambio 27, 258–265.
Haeberli, W., Huder, J., Keusen, H.-R., Pica, J., Rothlisberger, H.,
1988. Core drilling through rock–glacier permafrost. Proceed-
ings of the Fifth International Conference on Permafrost. Tapir,
Trondheim, pp. 937–942.
Haeberli, W., Holzle, M., Keller, F., Schmid, W., Vonder Muhll, D.,
Wagner, S., 1993. Monitoring the long-term evolution of moun-
tain permafrost in the Swiss Alps. Proceedings of the Sixth
International Conference on Permafrost, South China. Univer-
sity of Technology Press, Beijing, pp. 214–219.
Haeberli, W., Wegmann, M., Vonder Muhll, D., 1997. Slope stabil-
ity problems related to glacier shrinkage and permafrost degra-
dation in the Alps. Eclogae Geologicae Helvetiae 90, 407–414.
Harris, C., Davies, M.C.R., Etzelmuller, B., 2001a. The assessment
of potential geotechnical hazards associated with mountain per-
mafrost in a warming global climate. Permafrost and Periglacial
Processes 12, 145–156.
Harris, C., Haeberli, W., Vonder Muhll, D., King, L., 2001b. Per-
mafrost monitoring in the high mountains of Europe: the PACE
Project in its global context. Permafrost and Periglacial Pro-
cesses 12, 3–11.
Houghton, J.T., Meira Filho, L.G., Callander, B.A., Harris, N.,
Kattenberg, A., Maskell, K., 1996. Climate Change 1995: the
Science of Climate Change, Intergovernmental Panel on Climate
Change (IPCC). Cambridge Univ. Press, Cambridge. 572 pp.
Isaksen, K., Holmlund, P., Sollid, J.L., Harris, C., 2001. Three deep
alpine-permafrost boreholes in Svalbard and Scandinavia. Per-
mafrost and Periglacial Processes 12, 13–25.
Jin, H., Shuxun, L., Guodong, C., Shaoling, W., Li, X., 2000.
Permafrost and climatic change in China. Global and Planetary
Change 26, 387–404.
Keller, F., Frauenfelder, R., Gardaz, J.M., Holzle, M., Kneisel, C.,
Lugon, R., Philips, M., Reynard, E., Wenker, L., 1998. Perma-
frost map of Switzerland. In: Lewkowicz, A.G., Allard, M.
(Eds.), Proceedings, 7th International Conference on Perma-
frost. Collection Nordicana, vol. 57. Universite Laval, Quebec,
pp. 557–562.
Lachenbruch, A.H., Marshall, B.V., 1986. Changing climate: geo-
thermal evidence from permafrost in the Alaskan Arctic. Sci-
ence 234, 689–696.
Lachenbruch, A.H., Cladouhos, T.T., Saltus, R.W., 1988. Perma-
frost temperature and the changing climate. Proceedings of the
Fifth International Conference on Permafrost, vol. 3. Tapir,
Trondheim, pp. 9–17.
Nelson, F.E., Anisimov, O.E., Shiklomonov, O.I., 2001. Subsidence
risk from thawing permafrost. Nature 410, 889–890.
Osterkamp, T.E., 1983. Response of Alaskan permafrost to climate.
4th International Conference on Permafrost. National Academy
Press, Washington, pp. 145–152.
Osterkamp, T.E., Romanovsky, V.E., 1999. Evidence for warming
and thawing of discontinuous permafrost in Alaska. Permafrost
and Periglacial Processes 10, 17–37.
Parasnis, D.S., 1982. Temperature phenomena and heat flow esti-
mates in two Precambrian ore-bearing areas in north Sweden.
Geophysical Journal of the Royal Astronomical Society 143,
531–544.
Pavlov, A.V., 1994. Current changes of climate and permafrost in
the Arctic and sub-Arctic of Russia. Permafrost and Periglacial
Processes 5, 101–110.
Shen, P.Y., Beck, A.E., 1991. Least squares inversion of borehole
temperature measurements in functional space. Journal of Geo-
physical Research 96, 19965–19979.
Vonder Muhll, D., 2001. Thermal variations of mountain perma-
frost: an example of measurements since 1987 in the Swiss
Alps. In: Visconti, G., Beniston, M., Iannorelli, E.D., Barba,
D. (Eds.), Global Change in Protected Areas. Kluwer Academic
Publishing, Dordrecht, pp. 83–95.
Vonder Muhll, D., Stucki, T., Haeberli, W., 1998. Borehole temper-
atures in alpine permafrost: a ten year series. In: Lewkowicz,
A.G., Allard, M. (Eds.), Proceedings of the Seventh Interna-
tional Conference on Permafrost. Collection Nordicana, vol. 57.
Universite Laval, Quebec, pp. 1089–1095.
Copyright © 2022 FDOKUMEN