Flexural uplift of the Transantarctic Mountains
16
JOURNAL OF GEOPHYSICAL RESEARCH, VOL. 94, NO. B8, PAGES 10,315-10,330, AUGUST 10, 1989 Flexural Uplift of the Transantarctic Mountains T•M A. S•'• Geophysics Division,Department of Scientific and IndustrialResearch, Wellington, New Zealand URI S. TEN B mN• Department of Geophysics, Stanford University, Stanford, California The Transantarctic Moumains have formed at the continent-continent boundarybetween East and West Antarctica. High heat flow,thin crust, normal faulting, and past and present volcanism indicate that this approximately 3000-km-1ong boundary is divergent in character. Three principal structures have developed at andadjacent to the boundary: the Transantarctic Mountains, the Wilkes Basin, and the Victoria Land Basin. The Transantarctic Mountains form the east edge of EastAntarctica andconsist of a block-tilted mountain range up to 4500 m high. Running parallel but400-500 km behind, or to thewest of, theTransantarctic Mountains is theWilkesBasin. This isabroad subglacial basin where the bedrock surface isnow as much as1kmbelow sea level.East of and immediately adjacent to the Transantarctic Mountainfront is an areaof extension calledthe Victoria Land Basinwhereat least 4-5 km of Cenozoic sediments have been interpreted fromseismic reflection data. The wavelengths and amplitudes of these threestructures can be accounted for by the elastic flexureof two cantilevered lithospheric plates if the boundary between East and WestAntarctica is taken asa stress-free edge. Specifically, theWilkes Basin ismodeled asa flexural "outer low" coupled to upliftof theTransantarctic Mountains. Similarly, subsidence within theVictoria Land Basinis alsolinked to uplift of the Transantarctic Mountains via the VeningMeineszuplift-subsidence mechanism andsediment loading. The maximum flexural rigidity for East Antarctica is estimated to be about l0 :s N m (or effective elastic thiclmess, T., of 115+ l0 krn),one of thehighest values for continental rigidity fromlong- term loads. Flexural rigidity for the R})ss Embayment in West Antarctica is, on the other hand, found to be more than 2 orders of magnitude less at 4 x l0 a N m (T. = 19 + 5 kin). This rigidityvariation suggests a marked contrast in effective thermal age, and hence geotherms, between East Antarctica and the western Ross Embayment. Accordingly, one of the principal uplift mechanisms forthe Transantarctic Mountains isconsidered tobea thermal upliftassociated withlateral heat conduction from theextended and thinned West Antarctic lithosphere into thethicker lithosphere of EastAntarctica. Augmenting thermal uplift of the Transantarctic Mountains arethe effects of erosion andthe Vening Meinesz uplift effect. INTRODUCTION Mountain belts evolve in three general ways. Where plates converge, cordilleran andcollision-type mountain belts arefound [Dewey andB ird, 1970], whereas at sites o f divergence rift-shoulder- type mountains are likely to form[Heiskanen andVening Meinesz, 1958]. Cordilleranmountain belts are associated with subduction zones and are typifiedby the Rockies of North America and the Andes of South America. Collision-type mountain building occurs at continent-continent collision zones; examples include the Himalayas, theAlpsof southern Europe, and theSouthern Alps of New Zealand. Cordilleran and collision-type mountain building occur in a predominantly compressional stress field and arecharacterized by geological evidence of crustal shortening, folding andin general much structural complexity. In contrast, rift-shoulder-type mountain building occurs in a tensional stress field. Examples include the Red Sea Hills adjacent to the Gulf of Suez [Steckler, 1985],the shoulders of the Dead Sea Rift (U.S.ten Brink, N. Schoenberg, R. L. Kovach, and Z. Ben-Avraham, Gravity, crustal structure and upliftalong the Dead Sea transform, Submitted toTectonophysics, 1988), upliftof the southeast highlands of Australia [Weissel and Karner,1984]and the Wasatch mountains of Utah in theUnitedStates [Gilbert, 1890]. We might also include the "anorogenic" upliftof theSierra Nevada in eastern California, as proposed byChase and Wallace [1986],and Copyright 1989by the American Geophysical Union. Paper number 89J-B00750. 014 8-022 7/89/89•B-00750505.00 uplift of theBoothia Peninsula in Canada asdiscussed by Walcott [1970a]in this category. The three forms of mountain building are summarized in Figure 1. The Transantarctic Mountains (Figure 2) best fall into thelater classification of rift-shoulder mountains. They are characterized by a lackof folding or thrust faulting, andaregenerally described asa gentlytilted to block-faulted range reaching maximum heights of 4500 m [Robinson and Splettstoesser, 1984]. Running parallel and just offshore along the Ross Sea sector of the Trans antarctic Mountains isan asymmetric sedimentary basin, the Victoria Land Basin [Cooper et al., 1987]. Uplifts flanking rift structures like the Wasatch Front mountains and theGulf of Suez aretypically no more than1000-2000m high [e.g., Zandt and Owens,1980; Steckler, 1985]. Further, the half wavelength of these uplifts("half wavelength" being thedistance from the axis of maximum uplift to the topographical minimum formed behind the uplift) are generally of the order of 150 kin.In this regard the Transantarctic Mountains appear tobe an extreme case of theabove-mentioned areas. Uplift for the Transantarctic Mountains ismore like5000m [Fitzgeraldet al., 1986] and the halfwavelength of theuplift, aswill be demonstrated in thisstudy, is 400-500 km. Moreover, theTr•.santarctic Mountains have a lateralcontinuity (• 3000 km) matched onlyby mountain ranges like theAndes and the Himalayas. The principal purpose of thispaper is two fold: (1) present an interpretation of geological structure at, and adjacent to,the boundary between East and WestAntarctica in terms of imposed lithospheric loads and the flexural response of the lithosphere tothese loads, and (2) identify possible uplift mechanisms for the Transantarctic Mountains. Principal observations used in the study are seismic 10,315
-
Upload
independent -
Category
Documents
-
view
0 -
download
0
Transcript of Flexural uplift of the Transantarctic Mountains

JOURNAL OF GEOPHYSICAL RESEARCH, VOL. 94, NO. B8, PAGES 10,315-10,330, AUGUST 10, 1989
Flexural Uplift of the Transantarctic Mountains
T•M A. S•'•
Geophysics Division, Department of Scientific and Industrial Research, Wellington, New Zealand
URI S. TEN B mN•
Department of Geophysics, Stanford University, Stanford, California
The Transantarctic Moumains have formed at the continent-continent boundary between East and West Antarctica. High heat flow, thin crust, normal faulting, and past and present volcanism indicate that this approximately 3000-km-1ong boundary is divergent in character. Three principal structures have developed at and adjacent to the boundary: the Transantarctic Mountains, the Wilkes Basin, and the Victoria Land Basin. The Transantarctic Mountains form the east edge of East Antarctica and consist of a block-tilted mountain range up to 4500 m high. Running parallel but 400-500 km behind, or to the west of, the Transantarctic Mountains is the Wilkes Basin. This is a broad subglacial basin where the bedrock surface is now as much as 1 km below sea level. East of and immediately adjacent to the Transantarctic Mountain front is an area of extension called the Victoria Land Basin where at least 4-5 km of Cenozoic sediments have been interpreted from seismic reflection data. The wavelengths and amplitudes of these three structures can be accounted for by the elastic flexure of two cantilevered lithospheric plates if the boundary between East and West Antarctica is taken as a stress-free edge. Specifically, the Wilkes Basin is modeled as a flexural "outer low" coupled to uplift of the Transantarctic Mountains. Similarly, subsidence within the Victoria Land Basin is also linked to uplift of the Transantarctic Mountains via the Vening Meinesz uplift-subsidence mechanism and sediment loading. The maximum flexural rigidity for East Antarctica is estimated to be about l0 :s N m (or effective elastic thiclmess, T., of 115 + l0 krn), one of the highest values for continental rigidity from long- term loads. Flexural rigidity for the R})ss Embayment in West Antarctica is, on the other hand, found to be more than 2 orders of magnitude less at 4 x l0 a N m (T. = 19 + 5 kin). This rigidity variation suggests a marked contrast in effective thermal age, and hence geotherms, between East Antarctica and the western Ross Embayment. Accordingly, one of the principal uplift mechanisms for the Transantarctic Mountains is considered to be a thermal uplift associated with lateral heat conduction from the extended and thinned West Antarctic lithosphere into the thicker lithosphere of East Antarctica. Augmenting thermal uplift of the Transantarctic Mountains are the effects of erosion and the Vening Meinesz uplift effect.
INTRODUCTION
Mountain belts evolve in three general ways. Where plates converge, cordilleran and collision-type mountain belts are found [Dewey andB ird, 1970], whereas at sites o f divergence rift-shoulder- type mountains are likely to form [Heiskanen and Vening Meinesz, 1958]. Cordilleran mountain belts are associated with subduction zones and are typified by the Rockies of North America and the Andes of South America. Collision-type mountain building occurs at continent-continent collision zones; examples include the Himalayas, the Alps of southern Europe, and the Southern Alps of New Zealand.
Cordilleran and collision-type mountain building occur in a predominantly compressional stress field and are characterized by geological evidence of crustal shortening, folding and in general much structural complexity. In contrast, rift-shoulder-type mountain building occurs in a tensional stress field. Examples include the Red Sea Hills adjacent to the Gulf of Suez [Steckler, 1985], the shoulders of the Dead Sea Rift (U.S. ten Brink, N. Schoenberg, R. L. Kovach, and Z. Ben-Avraham, Gravity, crustal structure and uplift along the Dead Sea transform, Submitted to Tectonophysics, 1988), uplift of the southeast highlands of Australia [Weissel and Karner, 1984] and the Wasatch mountains of Utah in the United States [Gilbert, 1890]. We might also include the "anorogenic" uplift of the Sierra Nevada in eastern California, as proposed by Chase and Wallace [1986], and
Copyright 1989 by the American Geophysical Union.
Paper number 89J-B00750. 014 8-022 7/89/89•B-00750505.00
uplift of the Boothia Peninsula in Canada as discussed by Walcott [1970a] in this category. The three forms of mountain building are summarized in Figure 1.
The Transantarctic Mountains (Figure 2) best fall into the later classification of rift-shoulder mountains. They are characterized by a lack of folding or thrust faulting, and are generally described as a gently tilted to block-faulted range reaching maximum heights of 4500 m [Robinson and Splettstoesser, 1984]. Running parallel and just offshore along the Ross Sea sector of the Trans antarctic Mountains is an asymmetric sedimentary basin, the Victoria Land Basin [Cooper et al., 1987].
Uplifts flanking rift structures like the Wasatch Front mountains and the Gulf of Suez are typically no more than 1000-2000 m high [e.g., Zandt and Owens, 1980; Steckler, 1985]. Further, the half wavelength of these uplifts ("half wavelength" being the distance from the axis of maximum uplift to the topographical minimum formed behind the uplift) are generally of the order of 150 kin. In this regard the Transantarctic Mountains appear to be an extreme case of the above-mentioned areas. Uplift for the Transantarctic Mountains is more like 5000m [Fitzgeraldet al., 1986] and the half wavelength of the uplift, as will be demonstrated in this study, is 400-500 km. Moreover, the Tr•.santarctic Mountains have a lateral continuity (• 3000 km) matched only by mountain ranges like the Andes and the Himalayas.
The principal purpose of this paper is two fold: (1) present an interpretation of geological structure at, and adjacent to, the boundary between East and West Antarctica in terms of imposed lithospheric loads and the flexural response of the lithosphere to these loads, and (2) identify possible uplift mechanisms for the Transantarctic Mountains. Principal observations used in the study are seismic
10,315

10,316 STERN AND TEN BRINK' FLEXURAL UPLIFT OF THE TRANSANTARCTIC MOUNTAINS
(a) Cordilleran mountains
?-'z'• •/, •,; -,
(b) Continental Collision mountains
Fig. 1.
v
normal fault8
(c) Rift-shoulder mountains
Three cartoons demonstrating general types of mountain building.
180 o
900 E
Transantarctic
Gravity Anomaly •
E
0 1000 km I , I
ANTARC
5 Ross
4 3 Embayment Ross
Shelf
WEST
ANTARCTICA
-20 mgal 20 mgal
I 180 o
' 90 o W
Fig.2. Map of Antarctica showing the Transantarctic Mountains, the Ross Embayment, and the manner in which the Transantarctic Mountains forms the boundary between East and West Antarctica. Also shown are smoothed free air gravity anomalies of Antarctica [after Bentley, 1983]. The elongate, negative free air anomaly to the left of the Transantarctic Mountains is the -20 to -40 regal "Transantarctic gravity anomaly" [Bentley, 1983]. The subglacial Wilkes Basin is approximately coincident with this negative gravity anomaly. Locations are shown for the five topographic and bathymetric profries discussed in the text. The numbered profiles are as follows: (1) Beardmore, (2) Nimrod, and (3)-(5) Victoria Land profiles. Profile 3 is approximately coincident with the gravity profile shown in Figure 12.

STERN AND TEN BRINK: FLEXURAL UPLIFT OF THE TRANSANTARCTIC MOUNTAINS 10,317
Transantarctic Mountains
4 Polar Ice Cap E 3 ::::::.:.:•'•
-- 1 I ' I ' ' ' I '
0 200 -,,,, 000 Distance, km
kml Polar Transantarctic 6 -• Plateau Mountains Kukri Peneplain Ii Ross Ice
-I....-,-. - _•_•... ........... :.•:: ..... "-":•:."-:••• ................... i Shelf 0 •iii::!i!ii•ii•!!!•!•i•iii•i!i!:.•!h•:'.:.:.•::::•::::•:::•:' .............. •:•"• ' ß
ß :.:•*.•**..**• Beacon Supergroup (incl. Ferrar Dolerites)
•/////j P aleozoic and Precambrian Basement
0 10 20km i i i
Fig. 3. A cross section of the Wilkes Basin-Transantarctic Mountains-Ross Embayment, based on 1:250 000 USGS maps and map 3 (radio echo-sounding data) of Drewry' s [1983] Antarctic Geophysical Portfolio. Bathmerry in the Ross Embayment is from Robertson et al. [1982]. This profile runs adjacent to the Nimrod Glacier (profile 4 in Figure 2). (Bottom) Also shown is a blow up of a geological cross section through the Transantarctic Mountains showing the Kukri Peneplain, the underlying Precambrian basement, the Polar Plateau, and the Ross Embayment [after McGregor and Wade, 1969].
reflection and gravity data from the Ross Embayment and published gravity, radio echo-sounding, and geological observations from East Antarctica.
GEOLOGICAL AND STRUCTURAL BACKGROUND
In the following section each of the three structural elements shown in Figure 3a are briefly discussed.
The Wilkes Basin
Most geological inferences about the Wilkes Basin are based on geophysical data because the basin is covered by up to 3 km of ice. Radio echo sounding data have provided details on the rock-ice interface which forms the basin, showing the basin to vary in width from 200-600 km [Drewry, 1983]. These radio echo-sounding data also show that the basinruns parallel to the Transantarctic Mountains for almost its complete length, but with the axis of the basin set back about 400-500 km from the Transantarctic Mountains. Drewry [1976] interprets a -20 to -40 mGal free air gravity anomaly, in conjunction with magnetic anomaly data, over the basin as being due to 2-3 km of relatively low- density sediments within the basin.
The Tr ansantarctic Mountains
Basement rocks of the Transantarctic Mountains consist of early Paleozoic to a late Precambrian metamorphic-plutonic complex that is strongly folded and deformed. Unconformably overlying basement is a subhorizontal layered sequence of sedimentary rocks ranging in thickness from 2770 to 3500m [Barrett et al., 1986]. This is part of the Beacon Supergroup which is Dcvo•an to Jurassic in
age (Figure 3b). During the Jurassic the Beacon section and the basement complex were intruded by the Ferrar Group. This group includes diabase sills and dykes and associated basalt lava flows.
Uplift of the Transantarctic Mountains from geological data is summarised by Smith and Drewry [1984]. They estimate an average value of 90 m/m.y. for the last 45 m.y. More recent apatite fission dating from the Transantarctic Mountains show rates similar to that obtained from geological field observations [Gleadow et al., 1984; Fitzgerald eta/., 1986] i.e. 100 m/m.y. over the last 50 m.y., giving a total uplift of 5 kin. It is not known if uplift occurred in a uniform fashion over this period or in discrete intervals.
Along and within the Transantarctic Mountains are volcanic outcrops and volcanoes of the McMurdo Volcanic Group [Harrington, 1958]. These are principally alkaline volcanics with maximum K/Ar ages of 15-19 Ma [Armstrong, 1978; Stump et al., 1980]. Their distribution is shown in Figure 4. Most of these outcrops are found close to the coast with the exception of the Mt. Early outcrop in the southern Transantarctic Mountains which is some 200 km inland (Figure 4). Recent drilling in McMurdo Sound (Figure 4) has encountered basaltic pebbles within an Oligocene conglomerate [Barrett, 1986], suggesting that basaltic volcanism within or adjacem to the Transantarctic Mountains may have exJ•nded back as far as 30 Ma. A further fatcling of the drilling is that glacially derived sediments associated with the East Antarctic ice cap have been found with ages that go back to at least 35 Ma.
The Ross Embayment
The Ross Embayment encompasses the Ross Sea and the Ross Ice Shelf (Figure 4 ). Against the western edge of the embayment and at the boundary of the ice shelf with the Ross Sea are the

10,318 STERN AND TEN BRINK' FLEXURAL UPLIFT OF TttE TRANSANTARCTIC MOUNTAINS
170 ø E
A
A A A
A
A
A
AA
A
A
A A
A
I 180 ø 170 ø W I ZO ø
• MAP
1OOo• •EA -90 ø E Antarctica 9øøw
ROSS • /) •øE Antar•
;- x 1 1 1 -It' q'• / '000-% •'-----•1
4 -'x 270 _.• -• Ross "'- _ ...
"'- ' edge • •.• \ •
ROSS ICE SHELF ••.•)-7o %
A • // .•L/j•'.'• Cenozoic alkaline
A A • { ß Heat flow site and .... A A• •. value in mW/m2 •½' A -- 5oo-- Bathymetry (metres)
Mt. Early ^ ^ / + Drill hole A A
• 0 300km 140 ø E 180 ø 140 ø W I I I I
\ I /
Fig.4. Map of the Ross Embayment and the Ross Embayment sector of the Transantarctic Mountains. Positions of the drill holes DSDP 270 (middle of the embayment) and CIROS (Cenozoic Investigations in the Ross Sea) -1 ( west of Ross Archipelago) are shown. Heat flow values are from Blackman et al. [ 1987]. They consider the five most westem observations of heat flow to be the most reliable. The average of these data, excluding the single high value of 164 mW/m: from Ross Island, is about 70 mW/m :. V.L.B. is theVictoria Land Basin; A-A' is the seismic interpretation line shown in Figure 5; B-B' is the seismic line 409 discussed in the text.
principal volcanic edifices comprising the McMurdo Volcanic Group (Figure 4), or the Ross Archipelago [Thomson, 1916]. Geophysical and geological data indicate that the western Ross Embayment has, and is, an area of active crustal extension between East and West
Antarctica [ Davey, 1981; Dalziel and Elliot, 1982; McGinnis et al., 1985; Cooper and Davey, 1985]. Basement within the Embayment has been sampled at the Deep Sea Drilling Project (DSDP) drill hole 270 (Figure 4) and found to be Precambrian metamorphic rocks, similar to those found out cropping in the Transantarctic Mountains [Ford and Barrett, 1975].
Cooper et al. [1987] interpret multichannel seismic data from the Victoria Land Basin (Figure 4) as showing up to 14 km of stratified rock in a half-graben geometry. A summary interpretation of their data is given in Figure 5. Interpretation of the lower 8-12 km of the section is uncertain but is possibly a high-velocity (>5 km/s) late Mesozoic marine sedimentary section. The top 4-6 km is thought to be principally Cenozoic marine sediments (<4.5 km/s) that are coeval with uplift of the Transantarctic Mountains.
Above average heat flow is reported in the Ross Island-Victoria Land Basin-Dry Valley area. Within this region there are about five determinations of heat flow (Figure 4) for which the appropriate
corrections have been made [Blaclormn et al., 1987]. These data have an average value of about 70 mW/m 2 which is about 15% greater than the continental norm of 60 mW/m 2. From Figure 4 there is some suggestion of lower heat flow in the middle of the Ross Ice Shelf although, as Blackman et al. point out, the data are too sparse to draw fn'm conclusions about this area.
ISOSTATIC COMPENSATION WITHIN EAST ANTARCTICA
A principal contention of this study is that uplift of the Transantarctic Mountains is supported by a broad flexure of the strong East Antarctic lithosphere. In other words, the Transantarctic Mountains are regionally rather than locally isostatically compensated,
lsostasy ; Local Versus Regional Compensation
When loads such as seamounts, river deltas, ice caps, or thrust sheets are pl aceA upon the lithosphere, the accompanying deformation is often observed to extend well beyond the boundaries of the loads

STERN AND TEN BRINK: FLEXURAL UPLIFT OF THE TRANSANTARCTIC MOUNTAINS 10,319
5
o lO .--
15
2O
I Victoria Land Basin
A I Terror Rift I A'
I• Discovery Lee Graben I Arch -•1 Franklin Is.
-.",.-::.....;•:;.:;: ;.:?.'•?.:::.:% .% :- -_--7__• _• _ _:-------_•-_-_:_-_-_ __:.. :•_. •-:•--_-:: _• ...... •---c :__:_ _:• :--_ :: :_-:•J :_ •-? •-•. _ _;- :_c- ----:--',-'• - -- --":•-- - --•----: - -•-:-:-:;- - ':•?. •:i•:•::.:?:...?.----<• --: • :;:.:.:•?: '.•?• ..:¾:..•.¾:._¾':.•.c::...:::.-..•_...:-:7-.:::..::.• •,, •::_..:.•...::.....::.. --"••• ß .".:::.'i.' ============================ :--• ,• .":".::'.":::'.:.:';':":•.::::{:".' ============================================================ i' .':'.:':"-•:";•
' ::.. ?:."-'.... ::.. !'.i:!i "I:' .... ".': ••//•••11!:•:i•.•i•i:..:• ::•71':-":':. '•?•6{,'•/•••••••• • late Cenozoic intrusives
I ;; Neogene- P aleogene sediments I I • Pre-Beacon Paleozoic and L Precambrian basement _
B? possible Beacon Supergroup rocks
Fig. 5. A geological section across the Victoria Land Basin based on interpreted seismic reflection data [after Cooper eta/., 1987]. The division between Cenozoic and Mesozoic rocks is based on observed seismic velocities, i.e., Cenozoic velocity range is 1.7-4.5 km/s and rocks with a velocity range of 4.5-6.2 km/s are ascribed by Cooper et al. to Mesozoic sezliments. The Lee Arch is a late Cenozoic intrusion that has locally up warped the sedimemary sequence.
themselves. This is the phenomenon of lithospheric flexure [e.g., Gum. n, 1943]. Flexure can, to a first approximation, be modeled as the bending of a thin elastic plate (the lithosphere) that overlies a fluid substratum. The measure of how much the elastic plate, or the lithosphere, resists bending is governed by the flexural rigidity, D, which is related to the elastic thickness (3',) of the plate by
D = E T 3/12 ( 1-02) (1)
where E is Youngs modulus and o is Poiseone ratio. T• for the lithosphere is sometimes referred to as an"effective" elastic thickness [Watts and Cochran, 1974]' i.e., it is the portion of the lithosphere that responds elastically to a long-term load and is not necessarily equivalent to seismological and thermal der'tuitions of the lithosphere.
Flexural deformation of the lithosphere can be approximately described by the thin plate equation [Nadai, 1963]'
D V 4 W(x) + Ap g W (x) = P (2)
i.e., bending resistance + buoyancy forces = load where W(x) is the vertical displacement, g is gravitational acceleration, A@ is the density contrast between the material below and above the plate, and P is the load that drives the flexure.
From (2) compensation for a load P will be partitioned between the bending resistance and buoyancy forces. If the rigidity (D) of the plate is low, then buoyancy forces dominate and compensation for the load is said to be local. If on the other hand D is large and the bending resistance term becomes dominant, then the compensation is more regional in character. Thus between these two end-members of local and regional isostatic compensation a continum of compensation schemes exists.
Flexure With a Free Edge
Most studies of seamounts, sedimentary basins, and ice caps involve loading on a continuous elastic plate. Other loading cases, such as the subduction of an oceanic plate [Watts and Talwani, 1974] or the uplift of rift-shoulder mountains [Bott, 1976], require a model where the elastic plate is not continuous but has a free edge. Figure 6a shows conceptual examples of flexure for an elastic plate with a free edge. If the plate has a free edge along which the load is applied, the solution for (2) is given by
w (x) = (2•/g Spa) exp(-x/a) cos (x/a) (3)
where o[, the flexural parameter [Walcott, 1970b], is given in units of length by
a 4= 4D/g Ap (4)
7 P outer low
outer high
BDUCTION ZONE
Erosion
b/ Polar T ,,• sediment & end 1o•d ice cap Ross Sea
- T Thermal & end load
Fig. 6. (a) Two models showing an elastic plate subjected to a load P. The flexure resulting from a load (P) mimic• a rift shoulder or a subduction zone with their respective outer low and outer high. The amplitude and half wavelength of the outer high (or outer low) is a function of the flexural rigidity of the plate. (b) Also shown is an illustration of the flexural model that is applied to the East-West Antarctic boundary. Extension is presumed to exist between East and West Antarctica such that the two plates are effectively alecoupled along the steep normal fault that separates them. The diagonal hachured regions represent the respective crustal thicknesses for East and West Antarctica. Explanations for the various loads that are proposed to be acting on the plates are given in the text.
10,320 STERN AND TEN BRINK: FLEXURAL UPLIFT OF THE TRANSANTARCTIC MOUNTAINS
4800
-e- Nimrod
a/ .-e- Beardmore '3800
2800
1800
800
-200
-1200 -800 -600 -400 -200 0
Distance (km)
Modeled flexure •-/[4800 b/ Te= 115 km ,a/ /
reoo Wilkes Basin / •• • • • •
't.oo -200
-1200 -800 -600 -400 -200 0
Distance (km)
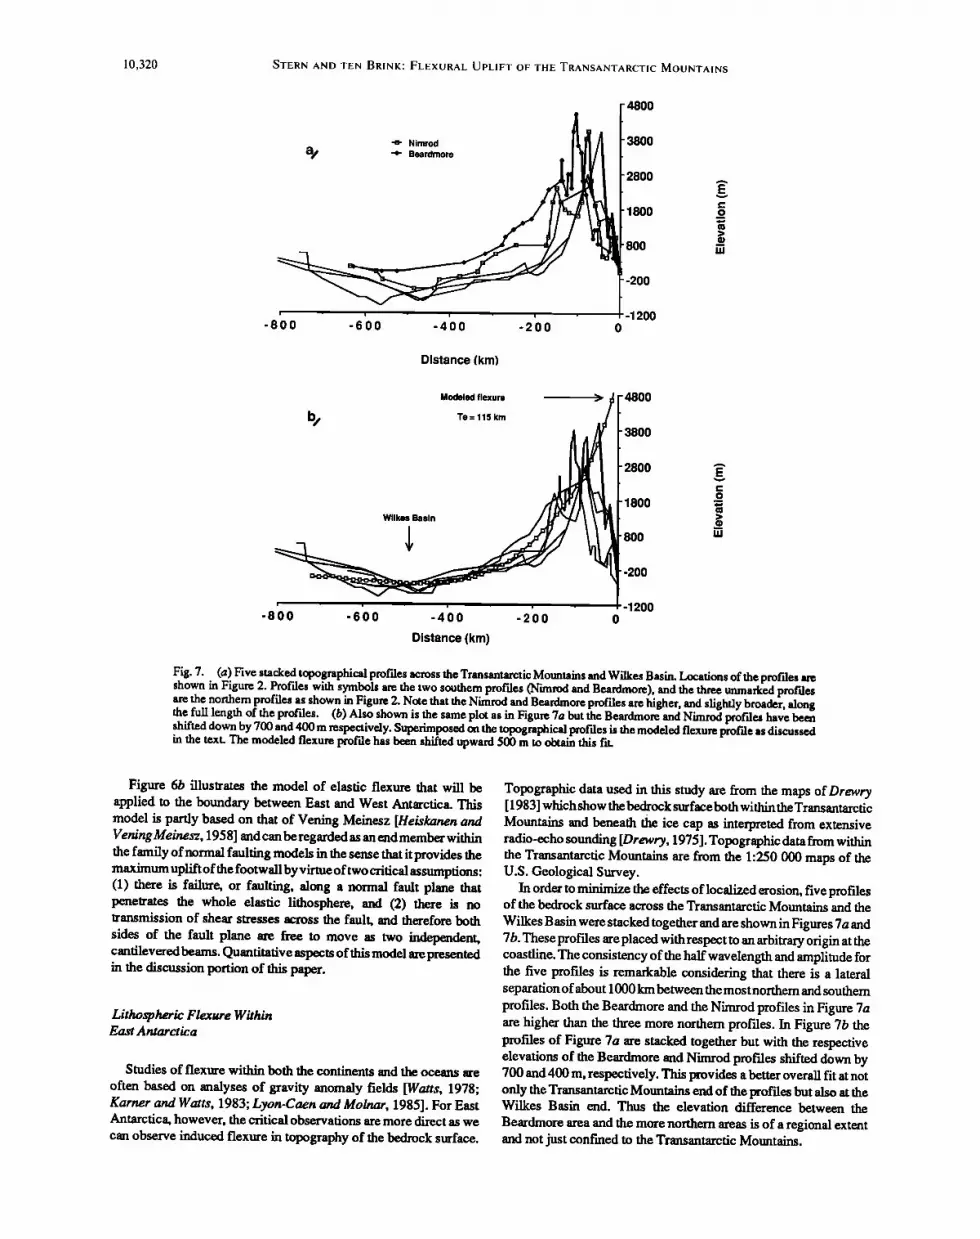
Fig. 7. (a) Five stacked topographical profiles across the Transantarctic Mountains and Wilkes Basin. Locations of the profiles are shown in Figure 2. Profiles with symbols are the two southern profiles (Nimrod and Beardmore), and the three unmarked profiles are the northern profiles as shown in Figure 2. Note that the Nimrod and Beardmore profiles are higher, and slightly broader, along the full length of the profiles. (b) Also shown is the same plot as in Figure 7a but the Beardmore and Nimrod profides have been shifted down by 700 and 400 m respectively. Superimposed on the topographical profiles is the modeled flexure proi"de as discussed in the text. The modeled flexure profile has been shifted upward 500 m to obtain this fit.
Figure 6b illustrates the model of elastic flexure that will be applied to the boundary between East and West Antarctica. This model is partly based on that of Vening Meinesz [Heiskanen and VeningMeinesz, 1958] and can be regarded as an end member within the family of normal faulting models in the sense that it provides the maximum uplift of the footwall by virtue of two critical assumption_s: (1) there is failure, or faulting, along a normal fault plane that penetrates the whole elastic lithosphere, and (2) there is no transmission of shear stresses across the fault, and therefore both sides of the fault plane are free to move as two independent, cantilevered beams. Quantitative aspects of this model are presented in the discussion portion of this paper.
Litho•'pheric Flexure Within East Antarctica
Studies of flexure within both the continents and the oceans are often based on analyses of gravity anomaly fields [Watts, 1978; Karner and Watts, 1983; Lyon-Caen and Molnar, 1985]. For East Antarctica, however, the critical observations are more direct as we can observe induced flexure in topography of the bedrock surface.
Topographic data used in this study are from the maps of Drewry [ 1983] which show the bedrock surface both within the Transantarctic Mountains and beneath the ice cap as interpreted from extensive radio-echo sounding [Drewry, 1975]. Topographic data from within the Transantarctic Mountains are from the 1:250 000 maps of the U.S. Geological Survey.
In order to m'mimize the effects of localized erosion, five profiles of the bedrock surface across the Transantarctic Mountains and the Wilkes Basin were stacked together and are shown in Figures 7a and 7b. These profiles are placed with respect to an arbitrary origin at the coastline. The consistency of the half wavelength and amplitude for the five profiles is remarkable considering that there is a lateral separation of about 1000 km between the most northern and southern profiles. Both the Beardmore and the Nimrod profiles in Figure 7a are higher than the three more northem profiles. In Figure 7b the profiles of Figure 7a are stacked together but with the respective elevations of the Beardmore and Nimrod profiles shifted down by 700 and 400 m, respectively. This provides a better overall fit at not only the Transantarctic Mountains end of the profiles but also at the Wilkes Basin end. Thus the elevation difference between the Beardmore area and the more northern areas is of a regional extent and not just confined to the Transantarctic Mountains.

STERN AND TEN BRINK' FLEXURAL UPLIFT OF THE TRANSANTARCTIC MOUNTAINS 10,321
A Flexural Model for the Transamarctic Moumains -Wilkes Basin
Three geological observations from the Trans antarctic Mountains provide the principal constraints for the flexural model: total amount of uplift, half wavelength of the uplift, and regional dip of the Kukfi Peneplain.
Uplift. Total uplift of the Transantarctic Mountains is estimated at about 5 km over the past 50 m.y. as previously discussed.
Half wavelength. From figures 7a and 7b the distance from the axis of maximum uplift in the Transantarctic Mountains to the minima of the Wilkes Basin is 450-500 km. From (3) the flexural half wavelength, or the distance from the load to the outer low (or high), is given by
x = (0.75)n a (5)
A value for the flexural parameter (o0 of about 200 km is thus implied. From (4) and (1), and taking Ap =2400 kg/m 3 (i.e., ice loading), values oft = 115 km and D = 102s N m can be estimated for the lithosphere of East Antarctica.
D/p. Separating the Beacon Supergroup from the underlying basement is a Devonian erosional surface referred to as the Kulcri
Peneplain [Gunn and Warren, 1962]. This peneplain (Figure 3) has been identified as far south as the Queen Maud Mountains [McGregor and Wade, 1969] and is seen as far north as in the Dry Valleys area of the Transantarctic Mountains opposite Ross Island [McKelvey and Web& 1961; Allen and Gibson, 1962]. In places the peneplain is disrupted by faulting, particularly in the south within the Queen Maud Range [Katz, 1982], and extending as far north as the Nimrod Glacier. Normal faulting, some evidence for strike-slip faulting, differential tiring, and even synclinal structures within the Beacon Supergroup are found [Barrett andElliot, 1973; Katz, 1982]. Overall, however, the uplift is generally asymmetric with the peneplain being tilted back beneath the Polar Ice Cap. Furthermore, on the basis of 5 published estimates and geological maps [e.g., Gunn and Walcott, 1962; Allen and Gibson, 1962; McKelvey and Web& 1961; McGregor and Wade, 1969; Hamilton, 1965], the average dip ( at a distance of about 40 km from the coast) on the peneplain is about 2-3 ø in a direction west and southwestwards toward the polar plateau. Higher dips have been reported at some localities [e.g., Gunn and Warren, 1962] but these are probably due to local block faulting. The range of 2-3 ø, at a distance of 3040 km inland from the coast, will therefore be adopted here as the representative "regional" dip for the Kukri Peneplain.
Superimposed on Figure 7b is the calculated displacement of our best fit flexural model. A finite difference routine (modified from Bodine et al. [1981]) was used to calculate the displacement due to the distributed loads on a plate where the rigidity could vary laterally. Results for simple load distributions and rigidity functions were checked against analytical solutions derived from the formulae given by Hetenyi [1946]. Input to the model is the downward directed load of the ice cap and an arbitary upward directed end load that is distributed near the free edge of the plate. This end load is partitioned into three specific processes: erosion, thermal uplift and an isostatic end load (Figure 8). Mechanical and geological interpretations of the uplift processes are described in more detail within the discussion section of this paper.
Of all the load distributions shown in Figure 8 only the ice load is well constrained by direct geophysical observations. The magnitudes and distribution of the thermal and end load, and erosion, can only be crudely estimated (see discussion). What can, however, be stated with confidence is that the total loading required
Te = 115 km
Rigidity profile
Te= 5 km-•NL0 •u
Erosion • o
x 1011 kg/m 2 •
Density = 2700 kg 0 i•
Thermal uplift •5•-100 • 4 x 10¹¹ kg/m /•1- 2oo •
Density = 54 kg/m3
End load I x 1011 kg/m
Density = 2850 kg/m 3/x 400 300 200 100 0
i i i i i i
Distance (km)
-0
2
Fig. 8. Summary of loads and rigidity profile for East Antarctica that were used in a finite difference program in order to calculate the modeled flexure profile shown in Figure 7b. Note that the densities and depth scale of the various loads differ but the horizontal scales are the same. The "end load"
is an arbitary load that is needed to obtain the required upldt after the effects of thermal uplift and erosion are estimated. The end load is distributed over a 5-km width with depth and magnitude parameters as shown. The magnitudes for the thermal uplift, erosion, and end load are given as equivalent line loads. Total upwardly directed loading is equivalent to a line load of 9 x 10 t• kg/m. Geological and mechanical interpretations of these loads are presented in the discussion section of the paper.
to produce uplift of the Transantarctic Mountains is equivalent to an upward directed line load of about 9 x 10 • kgJm in magnitude.
T at the Edge of the East Antarctic Plate
The flexural model follows the conceptual models shown in Figure 6 but with the modification that the flexural rigidity D, or
equivalently the effective elastic thickness (T•), decreases rapidlyas the free edge is approached. This modification is needed to satisfy the criterion of a 2-3 ø dipon the Kulcri Peneplain. Specifically, it was found that a satisfactory fit to the observations could be found with an elastic plate with a T of 115 lcm, to a distance of 130 km from the free edge, and then a linear decrease in T to a value of 5 km at the free edge.

10,322 STERN AND TEN BRINK: FLEXURAL UPLIFT OF THE TRANSANTARCTIC MOUNTAINS
/• 500 -a- Const.rigidity / ]- 500 • l- .-e- Vari. rigidity/•,• •
.....
5500
4500
35OO
2500
1500
500
-500
...... J -1500 i
-800 -600 -400 -2'00 0
Distance (km)
Fig. 9. A comparison of modeled flexure where one profile represents a plate that maintains a constant rigidity (and effective elastic thickness) right to the end of plate (open squares) and the other profile (closed squares) represents a plate that has rigidity dropping off rapidly at the end of the plate as shown in Figure 8. The same loads, shown in Figure 8, are applied to both models. At 40 km from the coast a 2 ø slope is produced by the variable rigidity plate and about a 1 o slope by the constant rigidity plate. Both models produce the same flexural half wavelength. The inset shows a blow up of the two profiles for the 100 km closest to the free edge.
Figure 9 shows the differences between a constant and variable rigidity plate when both plates are similarly loaded. These differences are small and only noticeable within 100 km of the free edge, but it is just here that we have detailed geological observations on both uplift and peneplain dip. Specifically, by allowing the rigidity of the plate to decrease near its edge about 20% more uplift at the free edge can be attained, and the dip angle is doubled from about 1ø to 2 ø at a distance of 30-40 km from the free edge.
There are good geophysical reasons why the lithosphere at the edge of the East Antarctic plate aliaears weak. Firsfly, curvature, and therefore bending moment, of the plate are high here which would result in near-surface elastic failure (i.e., faulting) and ductile flow
at depth. This would effectively reduce T, [Bodine et al., 1981; McNutt et al., 1988]. Secondly, it appears from limited heat flow data [Blackman et al., 1987] and the distribution (Figure 4) of Pliocene-Quatemary basaltic cinder cones [Armstrong, 1978] that at least part of the Transantarctic Mountains has, and is, experiencing an enhanced geothermal heat flux. This would also serve to reduce T as flexural rigidity is strongly dependent on the geothermal gradient [Kusznir and Karner, 1985].
A FLE• MODEL FOR THE Ross EMBAYMENT
Figure 10a shows a stack of five bathymetric profiles from the Ross Embayment (see Figure 2 for location). The three northem profiles are from the Ross Sea, and the two southem ones are from beneath the Ross Ice Shelf; all five profiles have been shifted so that their minima approximately coincide. Seismic reflection data of Cooper et al. [1987] show that these bathymetric lows, at least in the Victoria Land Basin, are coincident with maximum sediment thicknesses. Within the context of our elastic plate model for the western Ross Embayment (Figure 6b) the bathymetric lows mark the
locus of sediment loading, the bathymetric maximum is taken as the flexural outer high (Figure 6a), and the distance between the low and the high is taken as the flexural half wavelength.
There is considerable scatter in the stack ofprofiles in Figure 10a, especially when compared to the stack of five topographic and sub- ice profiles for East Antarctica (Figures 7a and 7b). In particular, the profiles from the Ross Sea indicate an apparent half wavelength of about 230 km, whereas the Nimrod and Beardmore profiles display a half wavelength of only 160 km.
In an attempt to investigate this discrepancy the interpreted seismic sections from the Victoria Land Basin were examined for
the purpose ofmodeling the deformation of a specific chronological horizon. Line 409 (Figure 4) from Cooper et al. [1987] was used for this analysis, as it is the least disrupted by late Cenozoic volcanic intrusions. Taking their interpreted depth section for line 409, depths to the Cenozoic/Mesozoic boundary were read off and are shown plotted on Figure 10b. Also plotted on the same figure are two flexural curves derived from (3). For both curves Ap = 900 kg/m 3 (i.e., sediment loading), and the flexural parameter (tl) was set at 65 and 95 km for the low- and high-rigidity curves, respectively. Clearly, the lower rigidity curve, corresponding to an effective
elastic thickness (7',) of 19 kin, and a flexural half wavelength of 160 km, gives a better fit. The high-rigidity curve in Figure 10b corresponds to a half wavelength of about 230 kin, as observed in the Ross Sea bathymetric profiles (Figure 10a). Therefore the 230 km halfwavelength ofbathymetry in the Ross Sea may be due to causes other than just flexure.
Our estimate for the effective elastic thickness (T•) in the Ross Embayment is 19 + 4 km, which from (1) corresponds to a flexural rigidity (D) of 4 + 2 x 10²² N m. These values are not as well determined as those for East Antarctica. Two possible reasons are suggested for the uncertainity. Firsfly, there may be lateral variations

STERN AND TEN BRINK' FLEXURAL UPLIFT OF THE TRANSANTARCTIC MOUNTAINS 10,323
o
-2oo
-4oo,
-6oo
-8oo
-lOOO o
• [- .osss•^ a/ I--e- BEARDMORE •
Distance (krn)
0
-1
1 Z/ ['•- Te--19km [ h -3'J • • I-*' T_e -_31.km I
-4
-5 o
Distance (km)
Fig. 10. (a) A stack of three bathymetric profiles from the Ross Sea and two profiles from beneath the Ross Ice Sheff (see Figure 2 for location). All profiles have been set so that their respective minima are approximately coincident. The Ross Sea profiles display haft wavelengths of about 230 km, whereas the Beardmore and Nimrod profiles display half wavelengths of about 160km. DataarefrommapsofDaveyandCooper[1987]. (b)Aplot of depth versus distance for the interpreted Cenozoic/Mesozoic boundary [after Cooper et al., 1987] is shown for seismic line 409 (location shown in Figure 4). Also plotted are two theoretical flexure curves calculated from (3). For both curves Ap = 900 kg/m • (i.e., sediment loading) and for the low- rigidity curve (T.= 19km) the applied line load (P) is lx 10•kg/m. For the higher-rigidity curve (T• = 31 km) the applied line load is 1.8 x 10" kg/m.
in rigidity within the Ross Embayment, and secondly, tectonic overprinting associated with rifting and extension [Davey, 1981; Dalziel and Elliot, 1982] may be swamping the subtle signature associated with lithospheric flexure.
Table 1 summarizes the derived elastic paramaters for both the Ross Embayment and East Antarctica.
GRAVlTY ANOMALIES AND FLEXURE
Evidence has been presented from topographic and seismic data that the uplift of the Transantarctic Mountains and subsidence of both the Wilkes and Victoria Land basins are controlled by flexure. Although the topographic profiles and the seismic stratigraphy show consistency with the flexural models in both half wavelength and amplitude, especially for East Antarctica, these models cannot be considered unique. For example, it is always
TABLE 1. Summary of derived elastic parameters
East Antarctica Ross Ernbayment
Flexural rigidity (D) I + 0.4 x 10 • N. m 4 + 3 x 10 •2 N. m Effective elastic
thickness (T•) 115 + 10 km 19 + 5 km
possible to devise a set of uplift and subsidence forces that will reproduce the observed topographical profile with local Airy-type compensation. Corroborative evidence that the three structures of the Wilkes Basin, the Transantarctic Mountains, and the Victoria Land Basin are indeed controlled by flexure comes from the distribution of free air gravity anomalies.
Free Air Gravity Anomalies
Free air gravity anomalies over the Wilkes Basin are shown in Figure 2. Lying parallel and behind the Transantarctic Mountains is the "Transantarctic gravity anomaly" [Bentley, 1983]. This free air gravity low of -20 to -40 mGal extends from near the South Pole almost to the North Victoria Land coast and corresponds closely with the topographic low of the Wilkes Basin.
Both Dr,wry [1976] and Bentley [1983] use a Bouguer plate approximation to explain this gravity low as being due to 1-3 km of sediments contained within the upper crust. A difficulty with this seemingly simple explanation is that it is unusual to have such a wide basin displaying entirely negative free air gravity anomalies. If compensation for the basin is local, as might be expected if the basin were formed by extension within a warm and weak lithosphere, then the gravity effect of the basin and its compensation mechanism will cancel except at the boundaries of the basin where small gravity edge effects will be found. In the case of the Wilkes Basin the negative free air anomalies persist for hundreds of kilometers. Hence the important question is not only what is causing this negative gravity anomaly, but also how is such an anomaly maintained.
The explanation advanced here for the Transantarctic gravity anomaly, and the Wilkes Basin, is that both are flexurally induced and maintained by the high rigidity of East Antarctica. In other words, the Wilkes Basin is the flexural outer low (Figure 6a) for the uplifted Transantarctic Mountains where the amplitude and half wavelength of a flexural outer low are dependent on the rigidity of the lithosphere. In the case of the Wilkes Basin the distance between the basin center and the Transantarctic Mountains is of the order of
500 km. When the effect of the ice load is taken into account, the maximum amplitude of downwarping within Wilkes Basin, due to induced flexure alone, is calculated to be about 300 m.
Following Watts and Talwani [1974], the gravity effect for an outer gravity high (or low in this case) can be approximated by the expression for an infinite Bouguer slab:
Ag = 2tog (P,-Pi) Az (6)
where G is the gravitational constant, Az is the flexurally induced displacement and p, and Pi are the densities of substratum beneath the plate and infill material above the plate, respectively. Taking values of Pa and Pi (ice in this case)as given in table 2, and Az = - 300 m, then from (6) a value of Ag = -30 mGal is obtained. This appears to be in accord with the observations (Figure 2). We cannot, nevertheless, totally refute the possibility [Dr,wry, 1976; Steed, 1983] that 1 or 2 km of locally compensated sediments exist within
TABLE 2. Physical constants used in this study
Parameter Value
Young's Modulus, E 8 x 10⁻¹⁰ N/m 2 Poisson's ratio, o 0.25
Water density, P•0 1000 kg/m • Ice density, Pi 900 kg/m • sediment density, p, 2400 kg/m • crustal rock density, Pc 2800 kg/m • Asthenosphere density, p, 3300 kg/m •

10,324 STERN AND TEN BRINK: FLEXURAL UPLIFT OF THE TRANSANTARCTIC MOUNTAINS
ss Island ROSS SEA
0 200km I I I
-20
A ' . • -40-->0 ' A" 't.
Fig. 11. Free air anomalies over the Ross Ice shelf [after Robertson et al., 1982]. The broad positive anomaly (densely hatched) running parallel to the Transantarctic Mountains, and about 200 km east of the Transantarctic Mountains, is here interpreted as an outer gravity high that is flexurally linked with downward flexure at the westem margin of the Ross Embayment.
the Wilkes Basin. But what the flexural model does demonstrate is that sediments are not necessary to explain the observed free air gravity anomalies associated with the Wilkes Basin.
Similarly, in the Ross Embayment we would predict a gravity outer high to be found some 150-200 km east of the flexural domwarping within the Victoria Land Basin. An inspection of the free air anomaly map over the Ross Ice Shelf (Figure 11) indeed shows a broad gravity high running parallel to the Transantarctic Mountains but offset about 200 km offshore. The relative amplitude of this gravity high is about 10 mGal, and in some places reaches 20 mGak depending on what zero level is taken. With values of Pa and P s (sediments) from Table 2 in (6), an outer topographic high (Az) of about 300-400 m is predicted. For a free-ended elastic plate the amplitude of an outer bulge is about 7% of the amplitude for the principal domwarp beneath the load [Turcotte and Schubert, 1982; p. 127]. Hence for a 350-m outer high the maximum Cenozoic sedimentary thickness in the Victoria Land Basin should be about 5000 m. This is roughly in accord with what is interpreted from the the seismic data (Figures 5 and 10b).
Gravity Profile Model
A series of gravity interpretation models across the Transantarctic Mountains were published by Robinson and Splettstoesser [ 1984]. Most of their models feature a sharp increase in crustal thickness, or decrease in crustal density, beneath the Transantarctic Mountains but with no change in upper-mantle density. Although the calculated gravity effects of some of these models satisfy the observed gravity anomalies, they do not provide any generic link between the Transantarctic Mountains, the Wilkes Basin, and the Victoria Land Basin. The model that is proposed here (Figure 12) incorporates the
flexural rigidity variation derived in this study, the thermal-density consequences of this variation, and links together the Wilkes Basin, the Transantarctic Mountains and the Victoria Land Basin as being the consequence of differential flexure at a lithospheric free edge.
The location of the gravity profile of Figure 12 is shown on Figure 2. The marine gravity data are free air anomalies from Davey and Cooper [ 1987], and the onshore gravity data are Bouguer anomalies from Robinson and Splettstoesser [1984] and data from files held at Geophysics Division, Department of Scientific and Industrial Research (DSIR), New Zealand. A Bouguer correction for land data from ice-covered areas has been made that corrects for both ice thickness and elevation of the rock surface above sea level and ice thickness below sea level. The estimated uncertainty for the Bouguer anomalies in Figure 12 is + 15 mGal. This high uncertainty is attributed to difficulties with elevation control both on the ice cap and within the Transantarctic Mountains [Crary, 1963].
Themodel of Figure 12 is constrained by the following properties: a crustal thickness of 21 km in the Victoria Land Basin [McGinnis et al., 1985], an average 25-km crustal thickness for the Ross Embayment [Davey, 1981 ], and an approximate crustal thickness of 40+ 5 km for East Antarctica as inferred from surface wave studies [Adams, 1972]. In addition, we impose the isostatic condition of a mass balance, above a yet to be determined compensation depth, between a typical crust upper mantle unit column from East Antarctica and one from the Ross Embayment.
A further important constraint on the gravity model comes from our finding of a rigidity, or T,, contrast between East Antarctica and the Ross Embayment. Watts [ 1978] shows that depth to the base of the elastic lithosphere within the oceans appears to follow the 450øC isotherm for a cooling plate model. A similar argument for both continental and oceanic lithosphere is made by Karner et al. [ 1983].

STERN AND TEN BRINK' FLEXURAL UPLIFT OF THE TRANSANTARCTIC MOUNTAINS 10,325
50
-50
-lOO
-15o
,• 2o E
40
observed
calculated
i i i i i
EAST ANTARCTICA
p=900 kg/m 3 IC••,•
p=2800 kg/m 3
T.A.M. WEST ANTARCTICA
,/
P = 33501kg/m• i•=•• I 4OO 8OO
Distance (km)
1
p = 2800 kg/m •
p= 3296 kg/m •
0 1200
Fig. 12. A gravity profile interpretation along profile 3 of Figure 2. Bouguer anomalies are on land and free air anomalies are off shore. On land, Bouguer corrections have been made for the ice that is above and below sea level. Bodies labeled 1 and 2 are seawater and sediments of density 1000 and 2400 kg/m 3, respectively. The best fit was obtained for a compensation depth between East and West Antarctica of 200 km and advancing the vertical, upper mantle density contrast boundary between East and West Antarctica 50 km westward beneath the Transantarctic Mountains.
Experimental rock mechanics [Goetze and Evans, 1979] also show that the transition from elastic to plastic behaviour within the lithosphere will be strongly dependent on temperature. Hence a strong contrast in geotherms, and thus upper mantle density, is implied by the two orders of magnitude difference in flexural rigidity between East Antarctica and the Ross Embayment. The exact location for the rigidity, and therefore upper mantle density contrast, is unclear but appears to occur beneath the Transantarctic Mountains.
Our best fit model (Figure 12) features a density contrast of 1.5% in the upper mantle above a compensation depth of 200 km, a 45-km- thick crust for East Antarctica, and the upper mantle density contrast boundary advancing 50 km beneath East Antarctica. Although the model in Figure 12 is clearly nonunique, it does demonstrate two important points. Firstly, the dipolar gravity anomaly pattern across the Transantarctic Mountains boundary is essentially a gravity edge effect similar to those observed at major lithospheric boundaries within the oceans [Sibuet et al., 1973], at continent-ocean boundaries [Walcott, 1972] and within continents [Stern et al., 1987]. The broad
gravity low that extends up to 600 km westwardofthe Transantarctic Mountains is therefore considered to be not due to the thick crust of
East Antarctica per se, but rather partly to the low-density mantle of West Antarctica being "sensed" out to large distances west of the East-West Antarctica edge, and partly due to induced flexure as discussed previously. The second noteworthy aspect of the model of Figure 12 is that the low-density mantle of West Antarctica is required to be advanced about 50 km beneath the Transantarctic Mountains. An uplift force beneath this 50-km-wide strip is thus implied. A physical interpretation of this uplift mechanism in terms of heat conduction and thermal expansion is presented in the discussion section of this paper.
Over the Ross Embayment there are several short (50-100 km) wavelength gravity highs (Figure 12) which we have made no attempt to explain, but whichDavey and Cooper [1987] account for in terms of Mesozoic-Cenozoic rift structures. Superimposed on these short-wavelength features is a broader gravity high, increasing to the east and which we interpret as being the fiexurally controlled, outer gravity high.

10,326 STERN AND TEN BRINK: FLEXURAL UPLIFT OF THE TRANSANTARCTIC MOUNTAINS
A region of thin (21 kin) crust is modeled as separating the East and West Antarctic plates (Figure 12). This is the section of crust immediatley beneath the Terror Rift section of the Victoria Land Basin (Figure 5) that was sampled by the refraction experiment of McGinnis et al. [1985].
DISCUSSION
Geological and mechanical interpretations of the proposed uplift mechanisms, summarized in Figure 8, are presented in the following discussion. Some alternative models of uplift for the Transantarctic Mountains are also discussed. Finally, we interpret the derived rigidities of the western Ross Embayment and East Antarctica in terms of effective thermal ages for the lithosphere.
Up lift Mechanisms
From Figure 8 the proposed forces acting on the East Antarctic lithosphere are thermal uplift, erosion, an isostatic end-load and the loading of the East Antarctic ice cap.
Thermal uplift. From the preceding gravity interpretation we found it necessary to advance the low-density mantle of West Antarctica about 50 km beneath the East Antarctic plate. This configuration would provide an uplift force to the Transantarctic Mountains which, if cast as an equivalent line load, is about 4 x 10 • kg/m in amplitude. We interpret this density anomaly, and hence uplift force, as being a consequence of lateral conduction of heat from arelatively shallow as thenosphere beneath the Ross Embayment into the lithosphere of East Antarctica. We can obtain an estimate for how long the density anomaly will take to develop in the following way:
The 2 orders of magnitude contrast in rigidity between the Ross Embayment and East Antarctica is taken to indicate a similarly large contrast in effective thermal age, and hence geotherms [Karner et al., 1983], between these two regions. Average geotherms for both regions were estimated from cooling plate models. Assuming that the two geotherms are steady state, and a purely lateral conduction of heat from the Ross Embayment to East Antarctica, we calculate with the two-dimensional heat flow equation [Carslaw and Jaeger, 1959] that it will take about 70 m.y. for the 50-km-wide region of upper mantle beneath the Transantarctic Mountains, as depicted in Figure 8, to rise in temperature an average of 450øC. For a value of thermal expansion of 3.4 x 10 ~5 øC -• this temperature rise will give the required average density drop of about 1.5%.
Erosion. Erosion as an uplift mechanism is a concept discussed by Walcott [1970a] and used by Stephenson and Lambeck [ 1985], for example, to account for the uplift of the south east Australian highlands. The essence of the concept is that as the mountain range erodes, a regional isostatic rebound, or uplift, follows such that the mean height of the mountain range may be decreasing, but a particle embedded within the range will be continually uplifted until it too is eroded away. Our estimate of a typical erosional profile for the Transantarctic Mountains is shown in Figure 8 and, when cast as an equivalent line load, amounts to 4 + 2 x 10 TM kg/m. This is a triangular cross section that approximates the missing rock between the observed topographic profiles and that of the flexure model shown in Figure 7b. This is an approximate estimate of erosion as no account is taken of effects such as erosion from some of the large outlet glaciers or possible subglacial erosion on the inland side of the Transantarctic Mountains.
Endload. After the above two effects are taken into account, there is still another 1 x 10 • • kg,/m of upwardly directed loading required to produce the Transantarctic Mountains. This amounts to only 11% of the total loading required. Our interpretation of this load is that it is a shoulder uplift mechanism as originally outlined by Vening
Meinesz [Heiskanen and Vening Meir•sz, 1958] and adpoted by, for example, Zandt and Owens [1980]. Figure 13 schematically illustrates the basis of the mechanism. A lithospheric section is placed under tension until elastic failure occurs along an inclined boundary. Because the lithosphere is buoyantly supported in the asthenosphere, the lithospheric limb of the footwall is effectively unloaded and will flex upward. The hanging wall, on the other hand, now has extra mass and will therefore flex downward. Providing there is complete decoupling between the hanging and footwalls, they will be free to move as two independent, cantilevered beams. The loading P acting on each side of the inclined fault is [Zandt and Owens, 1980]
P = 0.5 [( pc/pa)( Pa - Pc ) ] h2 tan O (7) where Pc and Pa are respective densities of the elastic plate and the displaced substratum, h is thickness of the elastic layer, and O = 90 ø - dip of the fault.
Taking values of Pc and Pa from table 2 and taking the dip of the fault as say 60 ø and values of h of 100 and 25 km, gives respective values for P of 18 x 10 tt and 1 x 10 tt kg/m. The Vening Meinesz effect is thus capable of producing a large end load if an effective elastic thickness of about 100 km is maintained right to the eastern edge of the East Antarctic plate. Our modeling of the uplift profile (Figures 7 and 8) suggests, however, that this is not the case as the effective T• of the Antarctic plate is required to drop off rapidly within 130 km of its eastern edge. From Figure 8 the 50-km-wide region over which the Vening Meinesz effect can be expected to act, T• is in the range 5 to 50 km. Accordingly, the Vening Meinesz effect will be acting on a zone with an effective average T of about 25 km, and the induced end load will therefore be about • x 10 • kg/m. A similar end load, but downwardly directed, will act on the western edge of the Ross Embayment.
A further difficulty with estimating the Vening Meinesz effect is that (7) assumes complete decoupling between the hanging wall and the footwall. In reality vertical forces may be exerted on the hanging walls and footwalls by each other [Jackson and McKenzie, 1983], and this will diminish their respective maximum displacements.
Ice load. Various workers have qualitatively speculated on the role that the ice cap load plays on deformation beneath the ice and within the Transantarctic Mountains [Grindley, 1967; Katz, 1982].
\ t " Pc \ h
(a) Pa
(b)
P
Fig. 13. Conceptual model of the Vening Meinesz rift model [after Heiskanen and Vening Meinesz, 1958]: h is the thickness of the elastic plate of density p c that is buoyantly supported by a weak fluid of density Pa' (a) After the plate is placed under tension an inclined fault occurs arid (b) each limb of the plate acts as an independent, cantilevered beam as shown. The load P arises from buoyancy forces as explained in the text and acts equally, but in opposite directions, near the free edge of each limb of the plate. The wavelength of induced flexure each side of the fault is a function of the flexural rigidity for the elastic plate.

STERN AND TEN BRINK: FLEXURAL UPLIFT OF THE TRANSANTARCTIC MOUNTAINS 10,327
Ice cap edg
ß .t•=•__•_•!,,• '•' Ice cap edge at 80 km ß i . i , i , i i
-5'50 -450 -350 -250 -1 50 -50
100
'-100 E • o E
v
-300
-500
-700
-900
Distance from coast (km)
Fig. 14. Two curves showing the displacement due to the ice cap alone. The curve with closed squares represents the effect of an ice cap that starts 150 km from the coast, and the open squares are for an ice cap starting 80 km (present position)from the coastline. Thus about 100 m of additional uplift at the coast is predicted to occur if the ice sheet edge retreats back 70 km from its present position.
A numerical analysis by Drewry [1983] of induced flexure suggests that the present day ice cap is depressing the Trans antarctic Moumains by about 500 m. Drewry assumed a continuous, constant rigidity plate for his analysis. One of the proposals of this study, however, is that both East and West Antarctica are separate plates with free edges at their common boundary, and a quite different pattern of induced flexure will result from a free-ended plate that is subjected to an ice cap load. Figure 14 shows two curves for the flexural displacement of East Antarctic lithosphere predicted by ice loading only; the rigidity profile for the lithosphere is that shown in Figure 8. The two profiles show the effect with the ice edge 80 km from the coast, which is its approximate position today, and with the edge 150 km from the coast. With its present position, the predicted effect of the ice cap is to induce a small uplift at the coast of about 22 m, and the hinge between uplift and subsidence will occur about 10 km inland. If the ice edge were to be at 150 km from the coast, about 100 m of uplift would be predicted at the coast, and the hinge point would move inland to about 100 km from the coast (Figure 14). Major fluctuations in the East Antarctic ice sheet are thought to have occurred during the late Cenozoic [Webb et al., 1984; Denton et al., 1984]. Therefore the difference between the two displacement curves (Figure 14) for the respective ice loads is significant as it shows that as the ice sheet waned and expanded it would have forced small amounts (•100 m) of uplift and subsidence, respectively, within the Transantarctic Mountains. This would have the effect of
adding noise to uplift data for the Transantarctic Mountains and also producing regional unconformities just offshore in the sedimems of the Ross Embayment. Overall, however, the present East Antarctic ice sheet appears to have had only a small effect on uplift of the Transantarctic Mountains.
In summary the three principal loads considered to drive the uplift of the Transantarctic Mountains are thermal uplift, erosion, and an isostatic end load. This list is not necessarily exhaustive. It is also emphasized that while the amplitude for the total loading of 9 x 10 • • kg/m (Figure 8) needed to produce and maintain the Transantarctic Mountains is well constrained, the exact mmmer in which this is
partitioned amongst the three uplift mechanisms is less certain.
Timing of Extension and Uplift
How the thinner lithosphere of West Antarctica was created and then placed against East Antarctica and at what time this occurred is unclear. In particular, timing of rifting events, and possible strike- slip faulting episodes, within the Ross Embayment is still speculative [e.g.,Schmidt and Rowley, 1986; Cooper et al., 1988]. Our analysis suggests it will take about 70 m.y. for an average 1.5% density
contrast, associated with thermal conduction, to penetrate 50 km beneath the edge of the Transantarctic Mountains and hence provide the necessary thermal uplift. Such a timing falls within the 90-65 Ma period for the initiation of extension within West Antarctica, as proposed by Smith and Drewey [1984] on the basis of plate reconstructions and magnetic anomaly dating.
A 70 Ma age for a major thermal event in the Ross Embayment is slightly earlier than the 50 M a start of uplift within the Transantarctic Mountains as proposed by Fitzgerald et al. [1986]. It is reasonable to anticipate, nevertheless, a delay between the start of the West Antarctic thermal event and initiation of uplift within the Transantarctic Mountains as it would take several millions, or tens
of millions, of years for thermal conduction to sufficently weaken the eastern edge of the East Antarctic plate, and thus set the uplift process under way.
Alternative Models of Uplift
Smith and Drewry's [ 1984] model for uplift of the Transantarctic Mountains features East Antarctica overriding hot oceanic asthenosphere at about 90 Ma with uplift following about 50 m.y. later by a delayed phase change in the upper mantle. They find that in order to get4 km of uplift a slab of eclogite 30 km thick is needed that will convert to a lower-density form of basalt (or granulite) at the crest-mantle boundary. This model is attractive in the sense that it links together the major thermal evem of the break up of Australia from Antarctica, some 90 m.y. ago, and the beginning ofuplift of the Transantarctic Mountains at 40-50 Ma. There is, however, a mechanical difficulty in distributing the uplift load close (•30 km) to the crest-mantle boundary. From similtaneously modeling both the gravity and flexural uplift profile we found it necessary to constrain the low-density uplift mechanism in a volume that extended 50 km laterally beneath the Transantarctic Moumains, and to a depth of at least 200 km (Figures 8 and 12).
Low-angle detachment faulting, or simple shear, is the most recent proposal for development of the Transantarctic Moumains and the western Ross Sea [Fitzgerald et al., 1986]. This model stems from ideas developed by Wernicke [ 1985] for explaining low-angle faulting and extension within the western United States. Central to the concept is that the lithosphere fails along an oblique detachment to produce an asymmetric uplift and subsidence of the lithosphere (Figure 15). In contrast to the Vening Meinesz model of Figure 13 the fault plane, or detachment surface, dips in the opposite direction so that the hanging wall exhibits the most uplift and the footwall subsides. The principal problem of the simple shear model, with regard to its application to the Transantarctic Mountains, is the small

10,328 STERN AND TEN BRINK: FLEXURAL UPLIFT OF THE TRANSANTARCTIC MOUNTAINS
uplift SIMPLE SHEAR
,•,,.-:,;z: ,.:,,:r.,; ;;?:;. ;.'. -;rt•i ,•, •:,; ,.'?.,;:: _,.::';-_,: z'_, r.:,' ;?.,::'-•z½ '-¾.?•,;'- '-•'...'-•,•._c•,•,,`, ,. _•••, ,_,,., •,.;; •,.;,• •', ,•"• •' footwall . .
hanging wall __ w.•'•?i..-•... Mantle Lithosphere •"'• .•. •. ..' :' .' . 5' :' ' '" ' : '. : : ' . : .' .'. '• . . . ."•.•_ . )z•."'•:: !:"'•;" ..... ::'::"::::::':':'::"':::'"'•.'.'- ;. • ß ,---
ß :.•.•,..'.:;';'-"'• "':'.'.';".".;:;.;';:;:Y.:;;':.;';;;';'..:.'..;.:'.'v'.?•..'.'.;...'•"•m..:-.-,•-•. ,. ....... ..--••:;::'"•,'• ........ ::::::::::::::::::::::::::::::::::::::::::::::::::::::::::::::::::::::::::::::::::::::::::::::::..-•--. ...... 100km ?.:•i::!i!.?:!ii!!!!.!:.:.'•/":": .... Asthenosphere ........ '"'":'"::'"'::•':•':;::•;:':'•':'::
Fig. 15. Predicted structure associated with a simple shear model [after Buck et al., 1988]. Uplift on the hanging wall is due to lithospheric thinning, and subsidence of the footwall is due to crustal thinning.
amount of uplift predicted for the hanging wall. For example, numerical investigations show that, given reasonable extension estimates, the maximum uplift of the hanging wall is only about 1000 m [Buck et al., 1988; Voorhoeve and Houseman, 1988; lssler et al., 1989]. This is clearly insufficent to account for the observed 5000 rn of uplift for the Transantarctic Mountains.
All of the above mentioned numerical investigations of simple shear assume local isostatic compensation. Issler et al. do, however, demonstrate the results of introducing an effective elastic thickness of T = 50 km into their model. They show that the footwall then experiences the maximum uplift, the hanging wall subsides, and a structure evolves that is effectively a Vening Meinesz model similar to that shown in Figure 13.
Rigidity Versus Age of Lithosphere
Flexural rigidity of continental and oceanic lithosphere appears to be a strong function of the "effective thermal age" of the lithosphere at the time it was loaded [Karner et al., 1983; Willet et al., 1985], the effective thermal age being the time since the last major metamorphic, thermal or orogenic event. Laboratory experiments and theoretical considerations indicate that rigidity is also a lesser function of the time since loading and average lithospheric composition [Kusznir and Karner, 1985]. More recently McNutt et al. [1988] show, from work within continental thrust belts, an inverse dependence of rigidity to applied bending stresses; the higher the curvature a flexed plate is subjected to, the weaker it appears to be.
Figure 16a demonstrates the theoretical dependence ofrigidity on just thermal age and lithospheric composition [after Kusznir and Karner, 1985]. As a quartz-rich lithosphere may appear weaker than an olivine-rich one, and as crustal thickness largely controls the relative quartz content of the lithosphere, the theoretical rigidity of the lithosphere for a given thermal age will display some dependence on crustal thickness as shown by the family of theoretical curves in Figure 16a. Figure 16b contains the same curves of Figure 16a but also includes superimposed continental rigidity determinations from other global locations. These data are from Table 1 of Kusznir and Karner [ 1985] but exclude determinations derived from short term (<10 s year) loads. Also shown in Figure 16b are the two estimates of flexural rigidity made in this study. The Ross Embayment estimate of 4 + 2 x 10²• N m is plotted for a crustal thickness of 25 km, implying an effective thermal age for the Ross Embayment of about 25 Ma. This anomalously young thermal age can be ascribed to extension and rifting, within the western Ross Embayment that seismic evidence suggests has been pervasive from the early Cenozoic to the present day. In contrast, the East Antarctic rigidity estimate of 10 •s N m is plotted (Figure 16b) against a thermal age at loading of 450-600 Ma. This choice of thermal age is based on the Ross and Beardmore Orogenies at 500-650 Ma [Adams et al., 1982] being the last major orogenic event for East Antarctica, and loading beginning at 50 Ma.
Figure 16b serves to highlight two important fmdings of this study. Firstly, at the Transantarctic Mountains front there is a juxtaposition of two continental plates with vastly different flexural rigidities and therefore strongly contrasting thermal characteristics.
10 7
Thermal Age at Loading (y)
108 109 I I
26 i' Thermal Age at Loading (y) 107 108 109
20 • •
E
• 22 [•'••1• .• Ross Embayment
'C-
• 24- •
-
26-
10 lo I
T = crustal thickness
600øC
10 lo I
Antarctica
Fig. 16. (a) Log-Log plot of flexural rigidity against thermal age of lithosphere at time of loading [after Kusznir and Karner, 1985]. Theoretical curves for differing crustal thicknesses are given indicating the interplay between quartz and olivine rheology and its effect on observed rigidity. The dotted curves are 300øC and 600øC isotherms for thermo elastic models in
which the effective elastic thickness is controlled by an isotherm that defines the elastic-plastic transition. (b) Also shown is a superposition of observations of continental rigidities on the plot of Figure 16a. Data are from table 1 of Kusznir and Karner [ 1985] but specifically exclude analyses based on short-term (<10 s years) loads. Also superimposed are two determinations of flexural rigidity made in this study. Note that the rigidities from the Ross Ernbayment and East Antarctica represent, respectively, the lowest and highest values for continental rigidity for this data set. Specific locations corresponding to the numbers are (1) Ganges Basin, (2) Appalachian Basin, O) Williston Basin, (4) Andarko Basin, (5) Michigan Basin, (6) Gulf Coast Basin, and (7) Molasse Basin.

STERN AND TEN BRINK: FLEXURAL UPLIFT OF THE TRANSANTARCTIC MOUNTAINS 10,329
Secondly, East Antarctica appears to be one of the most rigid cratons yet measured from a long term load.
CONCLUSIONS
Geological and crustal structure at and adjacent to the Trans antarctic Mountain front are interpreted in terms of lithospheric flexure. A simple manner in which to explain both the magnitude and wavelength ofthe uplift, and the observed dipon the Kukri Peneplain, is with a Vening-Meinesz type rift model of two canfilevered, independent beams. Such a model should be readily testable. For example, East Antarctica is regarded as being almost aseismic [Evison, 1967; Adams and Akato, 1986] but no microearthquake surveys have yet been carded out within the Trans antarctic Mountains to investigate low-magnitude earthquakes. If crustal seismicity is occurring within the Transantarctic Mountains, microeathquake data could provide information on how extension and uplift within the Transantarctic Mountains are manifested. With regard to crustal structure, our model does not require a major change in crustal thickness between the Wilkes Basin and the Trans antarctic Mountains,
although lowered upper mantle seismic velocites beneath the mountains would be expected. On the western Ross Ice Shelf we would predict seismic reflection surveys to reveal a flexurally controlled half-graben structure abutting the Transantarctic Mountains, with several kilometres of Cenozoic sediments within the graben.
The main findings of this study are summarized as follows: 1. The simplest model to account for both the uplift profile and the
observed gravity anomalies across the Transantarctic Mountains is one where two lithospheric plates of vastly different effective thermal ages are juxtaposed, and where no shear stresses are transmitted across their common boundary.
2. Three principal uplift forces for the Trans antarctic Mountains are identified: thermal uplift, erosion and the Vening Meinesz uplift effect.
3. The Transantarctic Mountain-Wilkes Basin topographical profile provides one of the clearest examples of continental litho- spheric flexure induced by a long-term load. This is probably due in part to the high rigidity of East Antarctica, which gives rise to the long (--500 km) flexural half wavelength, and in part to the presence of a long-lived ice cap that has slowed and evenly distributed the erosion process.
4. The Wilkes subglacial basin is best explained as a flexurally controlled basin produced as a form of regional compensation for uplift of the Transantarctic Mountains.
5. Flexural rigidities for East Antarctica and the Ross Embayment are estimated to be about 1 x 10²³ and 4 x 10²² N m, respectively. Corresponding lithospheric elastic thicknesses (Te) are 115 + 10 km and 19 + 5 km. These rigidity determinations are consistent with effective thermal ages for the lithosphere within East Antarctica and the Ross Embayment of about 600 Ma and 25 Ma respectively.
Acknowledgments. We thank our colleagues both in California and New Zealand for helpful discussions. In particular we are indebted to Alan Cooper (U.S.Geological Survey, Menlo Park), Peter Barrett and Dick Walcott from Victoria University of Wellington, New Zealand and Alan Smith, Cambridge University, England. Alan Cooper and Fred Davey (Geophysics Division ) freely provided original seismic data from the S.P. Lee Cruise in the Ross Sea and we acknowledge the considerable influence the findings of this cruise has had on our thinking. T.A.S. expresses gratitude to the Department of Geophysics, Stanford University, for providing facilities while on study leave from the DSIR. Partial support for this work was provided by NSF grant DPP-881316Z
Adams, R. D., Dispersion-wave studies in Antarctica, Antarct. Geol. Geophys. Symp. Antarct. Geol. Solid Earth Geophys., 1970, 473-480, 1972.
Adams, R. D. and A.M. Akato, Earthquakes in continental Antarctica, J. Geodyn., 6, 263-270, 1986.
Adams, C. J. D., J. E. Gabires, and G. W. GrindIcy, Orogenic history of the central Transantarctic Mountains; new K-At age data on the Precambrian-lower Paleozoic basement, in Antarctic Geoscience, edited by C.Craddock, pp. 817-826, University of Wisconsin Press,: Madison, 1982.
Allen, A.D., and G. W. Gibson, Geological investigations in southern Victoria Land, Antarctica, 6, outline of the geology of the Victoria Valley region, N. Z. J. Geol. Geophys., 5, 234-242, 1962.
Armstrong, R. L., K-At dating: late Cenozoic McMurdo Volcanic Group and dry valley history,Victorialand, Antarctica, N. Z. J. Geol. Geophys., 21,685-698, 1978.
Barrett, P.J., Antarctic Cenozoic history from MSSTS-1 drillhole, McMurdo Sound, Misc. Bull. 237, 176 pp., Dep. of Sci. and Ind. Res., Wellington, N. Z., 1986.
Barrett, P. J. and D. H. Elliot, Reconnaissance geological map of the Buckley Island Quadrangle, Transantarctic Mountains, Anatrctica, Antarctic Geol. Map A-3, U.S. Antarctic Research Program, 1973.
Barrett, P. J., D. H. Elliot, and J. F. Lindsay, The Beacon Supergroup (Devonian-Triassic) and Ferrar Group (Jurassic) in the Beardmore Glacier area, Antarctica, in Geology of the central Transantarctic Mountains, Antarctic Res. Ser., vol. 36, edited by M.D. Tumer and J. F. Splettstoesser, paper 14, pp. 339-428, A.G.U., Washington D.C., 1986.
Bentley, C. R., Crustal structure of Antarctica from geophysical evidence-a review, in Antarctic Earth Science, edited by R. L. Oliver, P. R. James and J. B. Iago, pp. 491-497, Australian Academy of Sciences, Canberra, Australia, 1983.
Blackman, D. K., R. P. Von Herzen and L. A. Lawyer, Heat flow and tectonics in the western Ross Sea, in The Antarctic continental margin : geology and geophysics ofthe western Ross Sea, EarthSci. Ser., vol. SB, edited by A. K. Cooper and F. J. Davey, pp. 179-190, Circum-Pacific Council for Energy and Mineral Resources, Houston, Texas, 1987.
Bodine, J. H., M. S. Steckler and A. B.Watts, Observations of flexure and the rheology of the oceanic lithoshere, J. Geophys. Res., 86, 3695-3707, 1981.
Bott, M. H. P., Formation of sedimentary basinsof the graben type by extension of the continental crust, Tectonophysics, 36, 77-86, 1976.
Buck, W. R., F. Martinez, M. S. Steckler and J. R. Cochran, Thermal consequences of lithospheric extension: Pure and simple shear, Tectonics, 7, 213-234, 1988.
Carslaw, H. S. and J. C. Jaeger, Conduction of Heat in Solids, 2nd ed., 510 pp., Oxford University Press, New York, 1959.
Chase, C. G. and T. C. Wallace, Uplift of the Sierra Nevada of Califomia, Geology, 14, 730-733, 1986.
Cooper, A. K. and F. I. Davey, Episodic rifting of Phanerozoic rocks in the Victoria Land Basin, westem Ross Sea, Antarctica, Science, 229, 1085-1087, 1985.
Cooper, A. K., F. J. Davey and J. C. Behrendt, Seismic stratigraphy and structure of the Victorialand basin, westem Ross Sea, Antarctica, in The Antarctic continental margin: geology and geophysics of the western Ross Sea,Earth Sci. Ser., vol. 5B, edited by A. K. Cooper and F. J. Davey, pp. 27-76, Circum-Pacific Council for Energy and Mineral Resources, Houston, 1987.
Cooper, A. K., F. J. Davey and K. Hinz, Crustal extension and origin of sedimentary basins beneath the Ross Sea and the Ross Ice Shelf, Antarctica, in Geological Evolution of Antarctica, edited by M. R. A. Thompson, J. A. Crame, and J. W. Thomson, Cambridge University Press, Cambridge, New York, in press, 1989.
Crary, A. P., Results of the US traverses in East Antarctica 1958-61, IGY Glaciol. Rep., Ser. 7, Am. Geogr. Soc., New York, 1963.
Dalziel, I.W.D., and D. H. Elliot, West Antarctica: problem child of Gondwanaland, Tectonics, 1, 3-20, 1982.
Davey, F. J., Geophysical studies in the Ross Sea region, J. R. Soc. N. Z., 11, 465-479, 1981.
Davey, F. J., and A. K. Cooper, Gravity studies of the Victoria Land basin and the Iselin bank, in The Antarctic continental margin: geology and geophysics of the western Ross Sea, Earth Sci. Set., vol.5B, edited by A. K. Cooper and F. J. Davey, pp. 119-138, Circum-Pacific Council for Energy and Mineral Resources, Houston, Texas, 1987.
Denton, G. H., M. L Prentice, D. E. Kellogg, and T. B. Kellogg, Late

10,330 STERN AND TEN BRINK: FLEXURAL UPLIFT OF THE TRANSANTARCTIC MOUNTAINS
Tertiary history of the Antarctic Ice sheet: Evidence from the dry valleys, Geology, 12,263-267, 1984.
Dewey, J. H., and J. M. Bird, Mountain belts and the new global tectonics, J. Geophys. Res., 75, 2625-2647, 1970.
Drewry, D. J., Radio echo sounding map of Antarctica, Polar Rec., 17, 359-374, 1975.
Drewry, D. J., Sedimentary basins of the East Antarctic craton from geophysical evidence, Tectonophysics, 36, 301-314, 1976.
Drewry, D. J. (ed.), Glaciological and Geophysical Folio, Scott Polar Research Institute, Cambridge, 1983.
Evison, F. E., Note on the aseismicity of Antarctica, N.Z.J. Geol. Geophys., 10,479-483, 1967.
Fitzgerald, P. G., M. Sandfiord, P. J. Barrett, and A. J. W. Gleadow, Asymmetric extension associated with uplift and subsidence in the Transantarctic Mountains and the Ross Ernbayment, Earth Planet. Sci. Lett., 81, 67-78, 1986.
Ford, A. B., and P. J. Barrett, Basement rocks of the south-central Ross Sea, site 270, in Initial Rep. Deep Sea Drill. Proj., 28,861-868, 1975.
Gilbert, G. K., Lake Bonneville, U.S. Geol. Surv. Monogr. 1., 438 pp., 1890. Gleadow, A. J. W., B.C. McKelvey, and K. U. Ferguson, Uplift history of
the Transantarctic Mountains in the Dry Valleys area, southern Victoria Land, from apatite fission track ages, N. Z. J. Geol. Geophys., 27, 457-464, 1984.
Goetze, C., and B. Evans, Stress and temperature in the bending lithopsphere as constrained by rock mechanics, Geophys. J . R. astron. Soc., 59, 463-478, 1979.
Grindley, G. W., The geology of the Millar Range, central Transantarctic Mountains, with notes on the glacial history and neotectonics of East Antarctica, N. Z. J. Geol. Geophys., 10, 557-598, 1967.
Gunn, B. M., and G. Warren, Geology of Victoria Land between the Mawson and Mulock Glaciers, Antarctica, N. Z. Geol. Surv. Bull., 71, 151 pp., 1962.
Gunn, B. M., and R. I. Walcott, The geology of the Mt. Markham region, Ross Dependency, Antarctica, N. Z. J. Geol. Geophys., 5, 407-426, 1962.
Gunn, R. A quantitative evaluation of the influence of the lithosphere on the anomalies of gravity, J. Franklin Inst., 236, 373-396, 1943.
Hamilton, W., Diabase sheets of the Taylor Glacier region, Victoria Land, Antarctica, U.S. Geol. Surv. Prof. Pap., 456-B, 71 pp., 1965.
Harrington, H. J., Nomenclature of rock units in the Ross Sea region, Antarctica, Nature, 182,290, 1958.
Heiskanen, W. A. and F. A. Vening Meinesz, The Earth and its Gravity Field, McGraw-Hill, New York, 470 pp., 1958.
Hetenyi, M., Beams on a Elastic Foundation, University of Michigan Press, Ann Arbor, 255 pp., 1946.
Issler, D., H. McQueen, and C. Beaumont, Thermal and isostatic consequences of simple shear extension of continental lithosphere, Earth Planet. Sci. Lett., 91,341-358, 1989.
Jackson, J., and D. McKenzie, The geometrical evolution of normal fault systems, J. Struct. Geol., 5, 471-482, 1983.
Kamer, G. D., and A. B. Watts, Gravity anomalies and flexure of the lithosphere at mountain ranges, J. Geophy. Res., 88 , 10449-10447, 1983.
Kamer, G. D., M. S. Steckler, and J. A. Thorne, Long-term thenno- mechanical properties of the continental lithosphere, Nature, 304, 250-253, 1983.
Katz, H. R., Post-Beacon tectonics in the region of Amundson and Scott glaciers, Queen Maud Range, Transantarctic Mountains, in Antarctic Geoscience, edited by C. Craddock, pp. 827-834, University of Wisconsin Press, Madison, 1982.
Kusznir, N., and G. D. Kamer, Dependence of the flexural rigidity of the continental lithosphere on rheology and temperature, Nature, 316, 138-142, 1985.
Lyon-Caen, H., and P. Molnar, Gravity anomalies, flexure of the Indian Plate, and the structure, support and evolution of the Himalayan and Gangs Basin, Tectonics, 4, 513-538, 1985.
McGinnis, L. D., R. H. Bowen, J. M. Erikson, B. J. Allred, and J. L. Kreaner, East-West Antarctic boundary in McMurdo Sound, Tectonophysics, 114,341-356, 1985.
McGregor, V. R. and F. A. Wade, Geology of the westem Queen Maud Mountains, in Geological maps of Antarctica, edited by V. C. Bushnell and C. Craddock, sheet 16, American Geographical Society, New York, 1969.
McNutt, M. K., M. Diament, and M. G. Kogan, Variations of elastic plate thickness at continental thrust belts, J. Geophys. Res., 93, 8825-8838, 1988.
McKelvey, B.C. and P. N. Webb, Geological reconnaissance in Victoria Land, Antarctica, Nature, 189, 545-547, 1961.
Nadai, A., Theory of Flow and Fracture of Solids, 348 pp., McGraw-Hill, New York, 1963.
Robertson, J. D., C. R. Bentley, J. W. Clough, and L. L. Greischar, Sea bottom topography and crustal structure below the Ross Ice Shelf, Antarctica, in Antarctic Geoscience, edited by C. Craddock, pp. 1083-1090, University of Wisconsin Press, Madison, 1982.
Robinson, E. S., and J. F. Spleustoesser, Structure of the Transantarctic Mountains determined from geophysical surveys, in Geology of the central Transantarctic Mountains, Antarctic Res. Ser., vol. 36, edited by M.D. Turner and J. F. Spleustoesser, paper 14, pp. 119-162, A.G.U., Washington D.C., 1986.
Schmidt, D. L., and P. D. Rowley, Continental rifting and transform faulting along the Jurassic Transantarctic Rift, Antarctica, Tectonics, 5,279-292, 1986.
Sibuet, J. C., X. Le Pichon, and J. Goslin, Thickness of lithosphere deduced from gravity edge-effects across the Mendocino Fault, Nature, 252, 576-679, 1973.
Smith, A. G. and D. J. Drewry, Delayed phase change due to hot asthenosphere causes Transantarctic uplift? Nature, 309, 536-538, 1984.
Steckler, M. S., Uplift and extension at the Gulf of Suez: indications of induced mantle convection, Nature, 317, 135-139, 1985.
Steed, R. H. N., Structural interpretations of Wilkes Land, in Antarctic Earth Science, edited by R. L. Oliver, P. R. James and J. B. Jago, pp. 567-572, Australian Academy of Sciences, Canberra, Australia, 1983.
Stephenson, R., and K. Lainbeck, Erosion-isostatic rebound models for uplift: an application to south-eastern Australia, Geophys. J. R. astron. Soc., 82, 31-55, 1985.
Stem, T. A., E.G. C. Smith, F. J. Davey, and K. J. Muirhead, Crustal and upper mantle structure of the northwestern North Island, New Zealand, from seismic refraction data, Geophys. J. R. astron. Soc., 91,913-936, 1987.
Stump, E., M. F. Sheridan, S. G. Borg, and J. F. Sutter, Early Miocene subglacial basalts, the East Antarctic ice sheet and uplift of the Transantarctic Mountains, Science, 207, 757-759,1980.
Thomson, J. A., Report on inclusions of the volcanic rocks of the Ross Archipelag o: British Antarctic Expedition, 1907-1909, report of scientific investigations, Geology, 2, 129-148, 1916.
Turcotte, D. L. and G. Schubert, Applications of Continuum Physics to geological Problems, 450 pp., John Wiley, New York, 1982.
Voorhoeve, H., and G. Houseman, The thermal evolution of lithosphere extending on a low-angle detachment zone, Basin Res., 1, 1-10, 1988.
Walcott, R. I., An isostatic origin for basement uplifts, Can. J. Earth Sci., 7, 1-7, 1970a.
Walcott, R. I., Flexural rigidity, thickness and viscosity of the lithosphere, J. Geophys. Res., 75, 3941-3954, 1970b.
Walcott, R. I., Gravity, flexure and the growth of sedimentary basins at a continental edge, Geol. Soc. Am. Bull., 83, 1845-1848, 1972.
Watts, A. B., An analysis of isostasy in the words oceans: 1. Hawaiian- Emperor Seamount Chain, J. Geophy. Res, 83, 5989-6004, 1978.
Watts, A. B., and J. R. Cochran, Gravity anomalies and flexure of the lithosphere along the Hawaiian-Emperor seamount chain, Geophys. J. R. astron. Soc., 38, 119-141, 1974.
Watts, A. B., and M. Talwani, Gravity anomalies seaward of deep-sea trenches and their tectonic implications, Geophys. J. R. astron. Soc., 36, 57-90, 1974.
Webb, P. N., D. M. Harwood, B.C. McKelvey, J. H. Mercer, and L. D. Stott, Cenozoic marne sedimentation and ice-volume on the East-Antarctic
craton, Geology, 12, 287-291, 1984. Weissel, J. K., and G. D. Kamer, Thermally induced uplift of the southeast
highlands of Australia, (abstract), Eos Trans. AGU, 65, 1115, 1984. Wemicke, B. Uniform-sense normal simple shear of the continental
lithosphere, Can. J. Earth Sci.,22, 108-125, 1985. Willet, S. D., D. S. Chapman, and H. J. Neugebauer, A thermomechanical
model of continental lithosphere, Nature, 314,520-523, 1985. Zandt, G., and G. Owens, Crustal flexure associated with normal faulting
and implications for seismicity along the Wasatch front, Utah, Bull. Seismol. Soc. Am., 70, 1501-1520, 1980.
T. A. Stem, Geophysics Division, Department of Scientific and Industrial Research, P.O. Box 1320, Wellington, New Zealand.
U.S. ten Brink, Department of Geophysics, Stanford University, Stanford, CA 94305.
(Received October 4, 1988; revised April 5, 1989;
accepted April 11, 1989.)