Effect of Cement Type and Curing Conditions on Flexural ...
10
Effect of Cement Type and Curing Conditions on Flexural Strength of Concrete of Pavement Slabs J. Zhang 1 , J. Harvey 2 , P. Monteiro 3 , A. Ali 2 1 Institute for Research in Construction, National Research Council of Canada; 2 University of California at Davis, California, USA, 3 University of California at Berkeley, California, USA ABSTRACT. Concrete flexural strength is the most important mechanical property for concrete pavement design. Short-term strength gain determines construction closure duration and the long-term strength determines the ability of a pavement to withstand stress and stress repetitions without cracking. This experimental study was aimed to better understand the flexural strength gain pattern of pavement concrete mixes, which were made of various potential cementitious materials and cured under various conditions. The experimental results and the statistical analysis of the importance of factors have identified the cement type and curing condition as the key factors for both strength gain rate and ultimate strength and consequently for proper selection of a mix design for pavement construction. Keywords: Concrete Pavement, Flexural Strength, Cement Type, Curing Conditions
-
Upload
khangminh22 -
Category
Documents
-
view
1 -
download
0
Transcript of Effect of Cement Type and Curing Conditions on Flexural ...
Effect of Cement Type and Curing Conditions on Flexural Strength of Concrete of Pavement Slabs
J. Zhang1, J. Harvey2, P. Monteiro3, A. Ali2
1Institute for Research in Construction, National Research Council of Canada; 2University of California at Davis, California, USA, 3University of California at
Berkeley, California, USA
ABSTRACT. Concrete flexural strength is the most important mechanical property for concrete pavement design. Short-term strength gain determines construction closure duration and the long-term strength determines the ability of a pavement to withstand stress and stress repetitions without cracking. This experimental study was aimed to better understand the flexural strength gain pattern of pavement concrete mixes, which were made of various potential cementitious materials and cured under various conditions. The experimental results and the statistical analysis of the importance of factors have identified the cement type and curing condition as the key factors for both strength gain rate and ultimate strength and consequently for proper selection of a mix design for pavement construction. Keywords: Concrete Pavement, Flexural Strength, Cement Type, Curing Conditions

1. INTRODUCTION Concrete pavement for highways typically consist of 150 to 350 mm concrete slabs placed on engineered base course and prepared subgrade. Most of the load bearing capacity in a concrete pavement is carried by the concrete slabs because their stiffness is much greater than that of the other layers [1]. The reaction of a concrete slab to the external loadings, such as traffic forces and restrained deformations, is that of a deflected beam subjected to flexural or bending loads. Therefore the flexural strength is the most pertinent strength property and used in nearly all pavement design methods. Most highway construction today is for maintenance, rehabilitation or reconstruction of existing pavements. Concrete pavement is most typically used for highway facilities with high traffic volumes, often in urban areas and on rural freeways, locations where the agency and road user costs of closing lanes for construction are often larger than the costs of materials and placement. Despite the construction restrain, sufficient construction closure durations are necessary for concrete to achieve a minimum flexural strength before opening the pavement to traffic while minimizing the risk that a substantial portion of the concrete pavement fatigue life will be exhausted or that a few heavy loads will exceed its strength, before the concrete has reached its long-term strength. For example, concrete pavements make up approximately 32 percent of the lane-kilometers in highway network operated by the California Department of Transportation (Caltrans). Caltrans uses various construction closure durations for concrete to achieve a typical criterion of minimum flexural strength of 2.8 MPa before opening to traffic for rehabilitation and reconstruction projects. Materials that can meet the strength gain requirements in the time required for reconstruction and rehabilitation may be classified into three categories: portland cements and blends, calcium sulfoaluminate cements, and calcium aluminate cements. Most agencies do not have extensive experience with these high early-strength materials on major projects. Selection of proper cementitious materials in a mix design is critical for the strength gain to meet the construction restraint and quality requirement, however, the curing conditions are also very important for pavement performance. A pavement slab is a flat member in contact with the ground that makes it difficult to maintain the curing temperature and moisture under ambient conditions. Since many of the cementitious materials under consideration have not been extensively used for pavement construction in the United States, it is essential to characterize their flexural strength development under various curing conditions.

There is a debate however, as to whether it is best to test for quality control in the field using flexural beams or compressive cylinders in the pavement community. The main arguments against the flexural beam test lie in the more intensive labor required and assumed greater variability of the test results, with the implied suggestion that correlation between the two strengths might be accurate enough to estimate flexural strength from compressive strength measurements. This paper was intended to study the following aspects of importance for concrete pavement rehabilitation and reconstruction: 1. The roles of cement type of interest and curing condition in flexural
strength development; 2. The relationship between flexural and compressive strength for the
different cement types and different curing conditions. To this end, laboratory flexural and compressive strengths for six concrete mix designs were measured under three curing conditions up to 90 days, and statistically analyzed. 2. EXPERIMENTAL PROGRAM Six mix designs were proportioned, which are typical of those used in pavement construction, or have been considered for use, from three categories of hydraulic cement as follows: 1. Portland cement
· Type I/II, referred to as “Type I/II”; · Type III, from two manufacturers, referred to as “Type III-A” and “Type III-B.”
2. Calcium sulfoaluminate cement, from two manufacturers, referred to as “CSA-A” and “CSA-B”; 3. Calcium Aluminate Cement, referred to as “CA”. The cement designations and their chemical compositions in oxides were shown a previous study [2].
The expected application of each of these concrete mixes is different as to the construction closure duration and desired time to reach the minimum flexural strength. The Type I/II mix was considered the baseline for the study, since it is a typical mix design used by Caltrans for pavements on projects where construction closure time is not an issue. The Type III-A mix and Type III-B mix were designed to provide the minimum strength required for opening to traffic for weekend and weekday closures (55- to 96-hours) but using different aggregates. The CSA-A, CSA-B, and CA mixes were designed to obtain the minimum strength in 4-8 hours for use in 7-to-10-hour overnight closures.
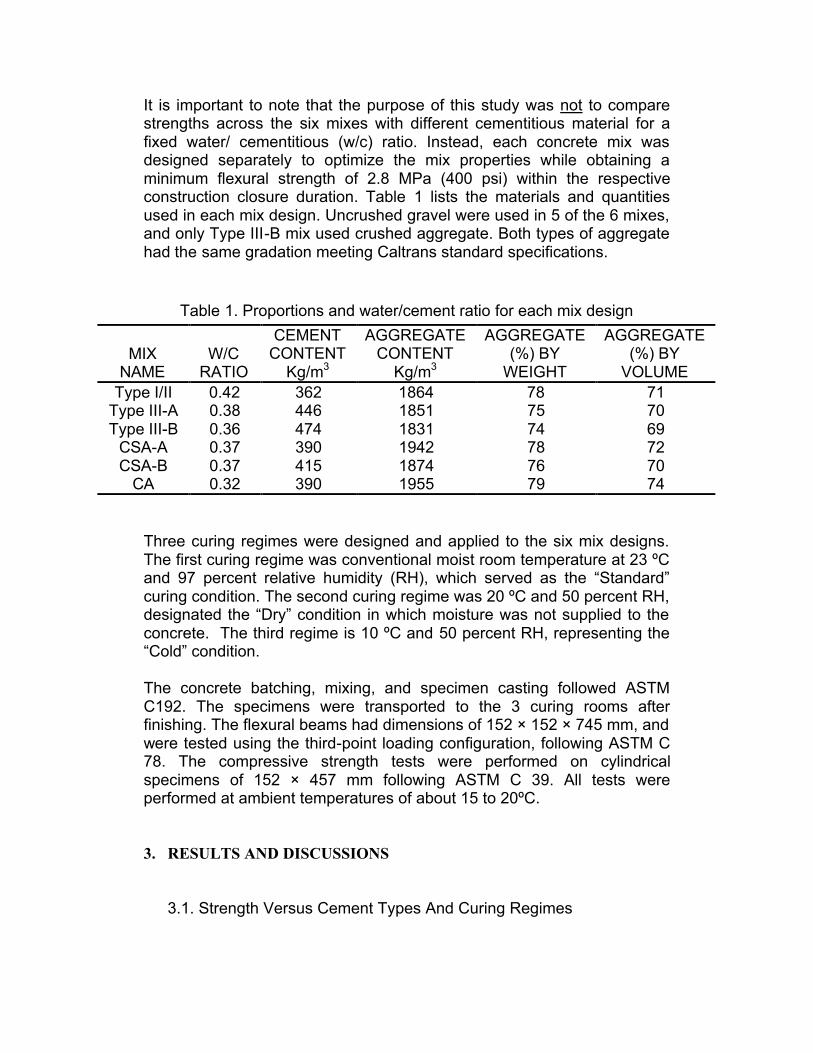
It is important to note that the purpose of this study was not to compare strengths across the six mixes with different cementitious material for a fixed water/ cementitious (w/c) ratio. Instead, each concrete mix was designed separately to optimize the mix properties while obtaining a minimum flexural strength of 2.8 MPa (400 psi) within the respective construction closure duration. Table 1 lists the materials and quantities used in each mix design. Uncrushed gravel were used in 5 of the 6 mixes, and only Type III-B mix used crushed aggregate. Both types of aggregate had the same gradation meeting Caltrans standard specifications.
Table 1. Proportions and water/cement ratio for each mix design
MIX NAME
W/C RATIO
CEMENT CONTENT
Kg/m3
AGGREGATE CONTENT
Kg/m3
AGGREGATE (%) BY
WEIGHT
AGGREGATE (%) BY
VOLUME Type I/II 0.42 362 1864 78 71
Type III-A 0.38 446 1851 75 70 Type III-B 0.36 474 1831 74 69
CSA-A 0.37 390 1942 78 72 CSA-B 0.37 415 1874 76 70
CA 0.32 390 1955 79 74 Three curing regimes were designed and applied to the six mix designs. The first curing regime was conventional moist room temperature at 23 ºC and 97 percent relative humidity (RH), which served as the “Standard” curing condition. The second curing regime was 20 ºC and 50 percent RH, designated the “Dry” condition in which moisture was not supplied to the concrete. The third regime is 10 ºC and 50 percent RH, representing the “Cold” condition. The concrete batching, mixing, and specimen casting followed ASTM C192. The specimens were transported to the 3 curing rooms after finishing. The flexural beams had dimensions of 152 × 152 × 745 mm, and were tested using the third-point loading configuration, following ASTM C 78. The compressive strength tests were performed on cylindrical specimens of 152 × 457 mm following ASTM C 39. All tests were performed at ambient temperatures of about 15 to 20ºC. 3. RESULTS AND DISCUSSIONS
3.1. Strength Versus Cement Types And Curing Regimes

Figure 1 shows the compressive (fc) and flexural strength (ft,fl) gain of the six mixes under the Standard curing regime. Both strengths of all the mixes increased continuously with time to 90 days except those of CA mix. The strengths of the six mixes ranged widely, e.g. the 90-day fc from 30 to 70 MPa and ft,fl from 3.8 to 6.9 MPa. It can also be seen that the compressive strength and flexural strength gains were consistent in that higher compressive strength was associated with higher flexural strength, e.g., the rankings of the 7-day strengths of the four mixes were the same as follows: Type I/II < Type III-A < Type III-B < CA, flexural strength Type I/II < Type III-A < Type III-B < CA, compressive strength For the compressive strength more than 50 percent of the 90-day strength has been achieved by the first day for all of the mixes except the Type I/II mix. The compressive and flexural strength of CA mix however, started to drop between 14 days and 90 days, which conformed to the well understood mechanism that CA concrete at later age becomes more porous, as a result of a conversion process of the metastable phases of CAH10 and C2AH8 to the stable and denser phase C3AH6 and γ-AH3 (gibbsite) [3]. These results showed clearly that the strength level and strength gain pattern were closely related with the selected cement type.
10
20
30
40
50
60
70
0 10 20 30 40 50 60 70 80 90 100AGE,days
CO
MPR
ESSI
VE
STR
ENG
TH, M
pa
Type I/II CSA-A Type III -B CA TType III-A CSA-B
1
2
3
4
5
6
7
8
9
0 10 20 30 40 50 60 70 80 90 100AGE, days
FLEX
UR
AL
STR
ENG
TH, M
pa
Type I/II CSA-AType III -B CA Type III-A CSA-B
(a) (b)
Figure 1 Standard curing regime :(a) compressive strength;(b) flexural strength.
The flexural strengths under the Cold and Dry curing regimes are shown in Figure 2. Compared with the Standard curing regime, the Cold curing regime resulted in a slower early-age strength gain, but the strengths continued to develop fast at later ages so that the 90-day strengths were greater for most of mixes than those under the Standard curing regime. As summarized in Table 2 of the 90-day strength for all three curing conditions, ft,fl of Type I/II mix was increased by 24% under the Cold regime as compared to the Standard regime, while ft,fl of other mixes

increased by 2.6% to 20.6%. Only the CA mix showed a decrease of 5.7%. In contrast, the Dry curing regime resulted in significantly lower long-term strengths than the Standard regime. The flexural strengths decreased from 13.8% to 32.4% compared with those cured under the Standard regime.
0
1
2
3
4
5
6
7
8
9
0 10 20 30 40 50 60 70 80 90 100Age, days
FLEX
UR
AL
STR
ENG
TH, M
Pa
Type I/II CSA-A Type III -B CA TargetType III-A CSA-B
1
2
3
4
5
6
7
8
9
0 10 20 30 40 50 60 70 80 90 100AGE,days
FLEX
UR
AL
STR
ENG
TH, M
pa Type I/II CSA-A Type III -B CA Type III-A CSA-B
(a) (b)
Figure 2 Flexural strength: (a) Cold curing regime; (b) Dry curing regime.
Table 2. 90-day flexural strength (MPa) for different curing regimes Curing Conditions Type I/II Type III-A Type III-B CSA-A CSA-B CA
3.74 5.14 5.38 6.95 5.46 6.83 Standard ( 0%) ( 0%) ( 0%) ( 0%) ( 0%) ( 0%) 2.68 4.40 4.64 4.70 4.39 5.16
Dry (-28.3%) (-14.4%) (-13.8%) (-32.4%)
(-19.6%)
(-24.5%)
4.65 6.20 5.65 7.94 5.60 6.44 Cold (24.3%) (20.6%) (5.0%) (14.2%) (2.6%) (-5.7%)
A unique flexural strength gain pattern was observed in the Dry curing regime for all the mixes. A temporary loss in strength occurred at the early ages as shown in Figure 2 (b), followed by the strength recovery. This phenomenon was observed previously by several researchers investigating the effect of moisture on the flexural strength of concrete [4,5], which might be explained by two mechanisms: 1. Macro-level. Differential shrinkage develops on specimens exposed to a dry environment. The outer areas on the cross section shrink more than the inner areas so that tensile stresses develop on the outer areas and compression stresses on the inside areas (Figure 3). These self-balanced stresses do not influence the compressive loading capacity, but will decrease the tensile/flexural loading capacity. 2. Micro-level. Tensile stresses develop in the cement paste surrounding the more rigid aggregate when the paste is undergoing drying shrinkage and the aggregates restrain the change in volume. This results in a

weaker bond between the two phases, which affects the flexural strength more than compressive strength. Proper identification of this period of strength loss is important for pavement applications. It implies that removal of specimens from moist curing immediately after the target strength is achieved could result in a temporary reduction in strength inducing early cracking.
Figure 3 Drying shrinkage induced stresses on the beam cross-section
3.2. Compressive And Flexural Strength Correlation It is known that the compressive strength and tensile strength are both functions of cement type, aggregate type, mix design, and curing condition, however, there is no direct proportionality between them. Figure 4 shows a plot of the flexural strength versus compressive strength for all the mixes, ages, and curing conditions, denoted by the discrete datum points. The two curves in the plot were the upper and lower boundaries of the correlation between the flexural and compressive strength, calculated by Eq. 1 and Eq. 2 where the direct tensile strength ft was converted to flexural strength ft,fl by Eq. 3 (CEP-FIP Model Code 90). It is apparent that most of the obtained data were within the two boundaries with a general trend that greater compressive strength was associated with greater flexural strength. The range between the upper and lower limits was however, very large. The flexural strengths near the upper boundary were almost two times greater than those at the lower boundary. As a result, it would not be practical to predict flexural strength precisely from compressive strength.

123456789
10
10 20 30 40 50 60 70 80COMPRESSIVE STRENGTH, MPa
FLEX
UR
AL
STR
ENG
TH, M
Pa 23C+97%RH20 C+ 50% RH10C+50% RHLower LimitUpper limit
Figure 4 Correlation of compressive strength and flexural strength
Furthermore, the data shown in Figure 4 were divided into three groups by curing condition. It is clear that most of the data obtained under the Dry curing regime were near the lower boundary, compared to those obtained in the other two curing regimes, indicating that the flexural strength was more adversely affected than the compressive strength. This in turn confirmed the hypothesis that the early drying shrinkage and the shrinkage gradient in the Dry curing regime had a stronger effect on flexural strength than on compressive strength. The correlation of compressive and flexural strength is therefore much influenced by curing conditions, which implies that using a correlation obtained under a standard lab condition could bring about considerable error in predicting the flexural strength of a concrete cured under real field conditions.
2/30 . 9 5 ( / 1 0 )t cf f= (1) 2 /31 . 8 5 ( / 1 0 )t cf f= (2)
7.00
7.00
, )(0.21)(0.2
hhhh
ff fltt += (3)
where h is the depth of the beam, and h0=100mm.
3.3. Statistical Analysis of Factor Significance From the data developed in this study, it is clear that both compressive and flexural, are influenced by the coupled effects of cement type, curing regime and specimen age. These couplings become more complicated to analyze when the variable of w/c ratio is added In this regard, statistical sensitivity analysis was performed as a helpful tool to understand the importance of these factors in the strength development and to evaluate the role of each factor. Figure 5 presents the sensitivity results on the compressive and flexural strength, in which: the long horizontal bar in

each plot is an average strength from all the data; each vertical bar represents a variable for analysis, labeled on the horizontal axis; each short horizontal bar on the vertical bars represents the mean value of the data for that factor level. The length of the vertical bars gives the range of values between the factor levels of each variable. The wider the range (or the longer the vertical bar), the more sensitive the strength is to that variable. To study the effect of small variation of w/c ratio on these six mixes (referred to as “target” mix designs), six additional mixes were also made by increasing the respective w/c ratios by 10% and their strengths were tested, referred to as “+ 10% w” mixes, as seen in the vertical bar for w/c ratio.
2026
3238
4450
Mea
n of
Com
pres
sive
Stre
ngth
Compressive strength
CA
CSA-A CSA-B
Type I/II
Type III -B
Type III-A
Plus 10% w
Target
10C + 50% RH
20C + 50% RH23C + 97% RH
Cement.Type Mix.Design Curing.type 2.7
3.2
3.7
4.2
4.7
5.2
Mea
n of
Fle
xura
l stre
ngth
Flexural Strength
CA
CSA-A CSA-B
Type I/II
Type III -B
Type III-A
Plus 10% w
Target10C + 50% RH
20C + 50% RH
23C + 97% RH
Cement.Type Mix.Design Curing.type
(a) (b)
Figure 5 The sensitivity analysis on: 1) compressive strength;2) flexural Strength
The following observations were made from the statistical analysis in Figure 5: 1. Cement type is the biggest factor affecting strength gain, followed by curing regime and w/c ratio variation by 10%. 2. Curing regime has different effects on the compressive and flexural strengths. On average, the Dry regime is the most adverse for flexural strength gain, while the Cold regime is most adverse for compressive strength gain. 3. The flexural strength appears to be more sensitive to the variation in w/c ratio (the length of the vertical bar for w/c ratio is relatively bigger) than the compressive strength. 4. It confirmed again that the flexural strength gain was consistent with the compressive strength gain, by the fact that the six mixes ranked in the same order for both strengths:
CA> Type III-B>CSA-B≅CSA-A>Type III-A>Type II (4)

4. CONCLUSIONS This paper reported the flexural strength and compressive strength gain patterns of six concrete mix designs cured under three conditions for pavement application. The following conclusions were drawn from the experimental results and statistical analysis: Between cement type and curing condition, cement type is the
factor that most controls concrete strength gain. Curing regime substantially influences the strength gain of a
concrete mix, both short term and long term gain. The Dry curing regime is the most detrimental curing condition for the flexural strength, because the drying shrinkage gradient induced tensile stresses on the cross section of beam specimens. The Cold curing regime is more detrimental to compressive strength than the Dry curing regime.
There is a great deal of variability in the correlation of compressive and flexural strength, and it varies substantially with concrete mix and curing regime. It is not practical to predict the flexural strength from the compressive strength.
5. ACKNOWLEDGEMENTS The authors would like to thank the California Department of Transportation for its support of this research. The views expressed are those of the authors and not necessarily those of the sponsor. They would also like to thank the concrete producers and Dr. Jeffrey Roesler for their assistance with the mix designs. 6. REFERENCES
[1] E. J. Yoder and M. W. Witczak, Principles of Pavement Design, New York : Wiley, 1975.
[2] P. Monteiro, K.Kurtis, J.Roesler, and J.Harvey, Accelerated test method for measuring sulfate resistance of hydraulic cements for Caltrans LLPRS Program, Institute of Transportation Studies, University of California, Report, April 2000. [3] P. C. Hewlett, Lea's Chemistry of Cement and Concrete. 4th Edition, Wiley, 1998. [4] D. Hordijk, H. Reinhardt, Fracture of concrete in uniaxial tensile experiments as influenced by curing conditions, Engineering Fracture Mechanics 35 (1990) 819-826. [5] C.D. Johnston, and E. H. Sidwel, Influence of drying on strength of concrete specimens. ACI Journal 66(1969)748-755.