an investigation of the tensile and flexural - Near East ...
149
AN INVESTIGATION OF THE TENSILE AND FLEXURAL PROPERTIES OF POLYETHYLENE, HIGH DENSITY POLYETHYLENE AND ULTRA HIGH MOLECULAR WEIGHT POLYETHYLENE A THESIS SUBMITTED TO THE GRADUATE SCHOOL OF APPLIED SCIENCES OF NEAR EAST UNIVERSITY BY OMED AZIZ AHMED In Partial Fulfillment of the Requirements for the Degree of Master of Science in Mechanical Engineering NICOSIA, 2015
-
Upload
khangminh22 -
Category
Documents
-
view
0 -
download
0
Transcript of an investigation of the tensile and flexural - Near East ...

AN INVESTIGATION OF THE TENSILE AND FLEXURAL
PROPERTIES OF POLYETHYLENE, HIGH DENSITY
POLYETHYLENE AND ULTRA
HIGH MOLECULAR WEIGHT POLYETHYLENE
A THESIS SUBMITTED TO THE GRADUATE
SCHOOL OF APPLIED SCIENCES
OF
NEAR EAST UNIVERSITY
BY
OMED AZIZ AHMED
In Partial Fulfillment of the Requirements for
the Degree of Master of Science
in
Mechanical Engineering
NICOSIA, 2015

I hereby declare that all information in this document has been obtained and presented in
accordance with academic rules and ethical conduct. I also declare that, as required by these
rules and conduct, I have fully cited and referenced all material and results that are not original
to this work.
Name, Last name: OMED AZIZ AHMED
Signature:
Date:

ii
ACKNOWLEDGMENTS
First of all, I would like to thank God for giving me the strength and courage to complete my
thesis. I would like to express my special thanks to my supervisor, Assist. Prof. Dr. Ali
EVCIL. Without him, it would be impossible for me to complete this work.
I would also like to thank Prof. Dr. Mahmut Ahsen SAVAS for his friendly manner, trust and
understanding. His kind treatment gave me courage to do my work.
I am indebted to my mother, brothers, sisters, and all my friends who encouraged me to
complete my master degree with their continuous support during the study.
I also want to express my special thanks to Dr. Sarkawt Rostam Hassan and the Slemani
Polytechnic University for their invaluable assistance.
Finally, I would like to thank the construction and housing the laboratory of Slemani and the
engineer Aryan W. Muhammed for their invaluable help and contribution to this study.
iii
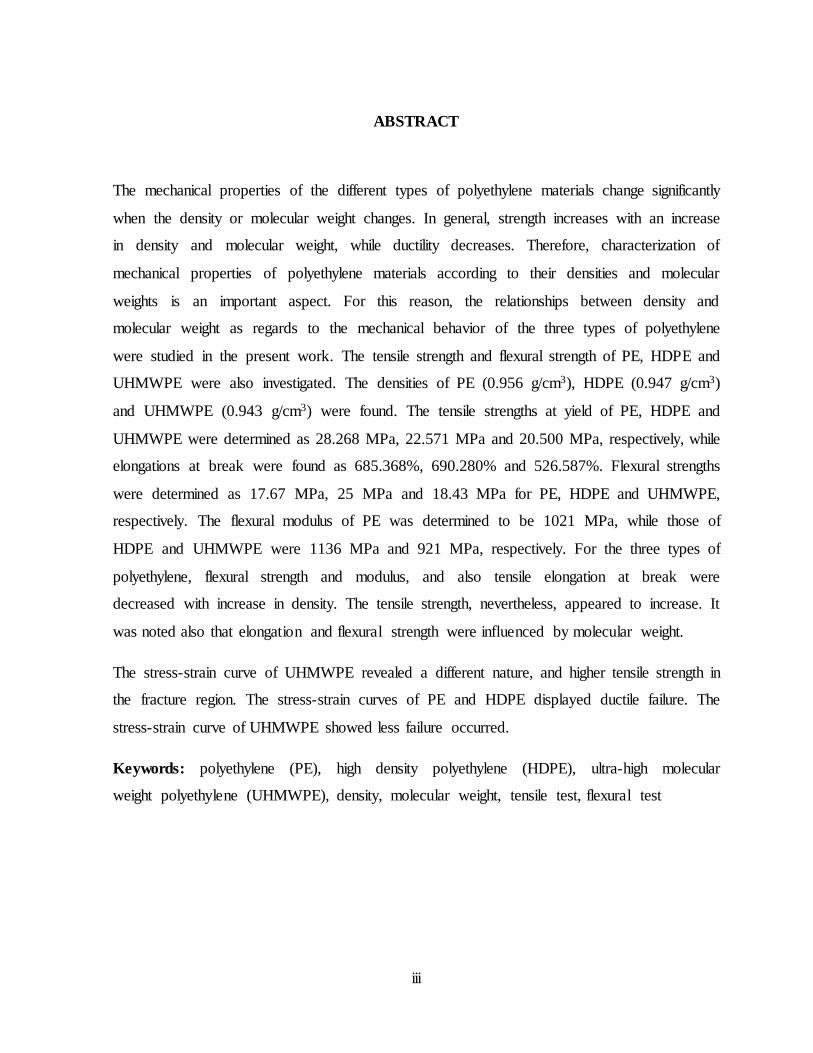
ABSTRACT
The mechanical properties of the different types of polyethylene materials change significantly
when the density or molecular weight changes. In general, strength increases with an increase
in density and molecular weight, while ductility decreases. Therefore, characterization of
mechanical properties of polyethylene materials according to their densities and molecular
weights is an important aspect. For this reason, the relationships between density and
molecular weight as regards to the mechanical behavior of the three types of polyethylene
were studied in the present work. The tensile strength and flexural strength of PE, HDPE and
UHMWPE were also investigated. The densities of PE (0.956 g/cm3), HDPE (0.947 g/cm3)
and UHMWPE (0.943 g/cm3) were found. The tensile strengths at yield of PE, HDPE and
UHMWPE were determined as 28.268 MPa, 22.571 MPa and 20.500 MPa, respectively, while
elongations at break were found as 685.368%, 690.280% and 526.587%. Flexural strengths
were determined as 17.67 MPa, 25 MPa and 18.43 MPa for PE, HDPE and UHMWPE,
respectively. The flexural modulus of PE was determined to be 1021 MPa, while those of
HDPE and UHMWPE were 1136 MPa and 921 MPa, respectively. For the three types of
polyethylene, flexural strength and modulus, and also tensile elongation at break were
decreased with increase in density. The tensile strength, nevertheless, appeared to increase. It
was noted also that elongation and flexural strength were influenced by molecular weight.
The stress-strain curve of UHMWPE revealed a different nature, and higher tensile strength in
the fracture region. The stress-strain curves of PE and HDPE displayed ductile failure. The
stress-strain curve of UHMWPE showed less failure occurred.
Keywords: polyethylene (PE), high density polyethylene (HDPE), ultra-high molecular
weight polyethylene (UHMWPE), density, molecular weight, tensile test, flexural test

iv
ÖZET
Polietilen malzemelerin mekanik özellikler, bu malzemelerin yoğunluk ve moleküler
ağırlıklarına göre belirgin bir şekilde değişiklik gösterir. Yoğunluk ve moleküler ağırlığın
artışı genellikle malzemenin mukavemetini artırırken sünekliğini azaltır. Bu nedenle,
polietilen malzemelerin mekanik özelliklerini yoğunluklarına ve moleküler ağırlıklarına göre
belirlemek önemlidir. Bu çalışmada polyetilen (PE), yüksek yoğunluklu polietilen (HDPE) ve
ultra yüksek moleküler ağırlıklı polietilen (UHMWPE) olamak üzere üç farklı malzeme
incelenmiştir. Malzemelerin yoğunlukları, sırası ile, 0.956 g/cm3, 0.947 g/cm3 ve 0.943 g/cm3
olarak belirlenmiştir. Söz konusu malzemelerin akma mukavemetleri, 28.268 MPa, 22.571
MPa ve 20.500 MPa, kopma uzamaları, 685.368%, 690.280% ve 526.587%, bükülme
dayanımları 17.67 MPa, 25 MPa ve 18.43 MPa ve bükülme karsayıları 1021 MPa, 1136 MPa
ve 921 MPa olarak tesbit edilmiştir. Yoğunluğun artışı ile bükülme dayanımının, bükülme
katsayısının ve kopma uzamasının arttığı gözlenirken akma mukavemetinin azaldığı
gözlenmektedir. Uzama ve mukavemet değerlerinin moleküler ağırlıktan etkilendiği
görülmüştür.
Sonuçlar, diğer plastiklere göre, UHMWPE malzemenin gerilme – genleme diyagramının
farklı bir yapıda olduğunu göstermektedir. UHMWPE malzemenin kopma bölgesindeki
mukavemeti tipik termoplastik polimerlere oranla daha yüksektir. PE ve HDPE malzemelerin
gerilme – genleme eğrileri viskoelastik ve sünek malzeme özelliklerini yansıtırken UHMWPE
malzemenin doğrusal ve kırılgan olduğu göze çarpmaktadır.
Anahtar Kelimeler: polietilen (PE) , yüksek yoğunluklu polietilen (HDPE) , ultra yüksek
moleküler ağırlıklı polietilen (UHMWPE) ,yoğunluk, moleküler ağırlık, gerilme testi, esneklik
testi.

v
TABLE OF CONTENTS
ACKNOWLEDGMENTS ............................................................................................................. ii
ABSTRACT................................................................................................................................... iii
ÖZET ............................................................................................................................................. iv
TABLE OF CONTENTS .............................................................................................................. v
LIST OF TABLE ........................................................................................................................viii
LIST OF FIGURES ...................................................................................................................... ix
LIST OF SYMBOLS USED ....................................................................................................... xi
LIST OF ABBREVIATIONS USED ......................................................................................... xii
CHAPTER ONE: INTRODUCTION
1.1 Objective ................................................................................................................................2
1.2 Chapter Contents....................................................................................................................2
CHAPTER TWO: LITERATURE REVIEW
2.1 Hydrocarbon Structures in Polymer Architecture..................................................................3
2.2 General Molecular or Structure of Polymers .........................................................................4
2.2.1 Molecular structure of polymers...............................................................................5
2.2.2 Molecular weights and molecular weight averages ..................................................7
2.2.2.1 Molecular number and weight ..............................................................................7
2.2.2.2 Polydispersity index...............................................................................................8
2.2.3 Molecular shape and secondary bonds .....................................................................9
2.2.4 Geometry of molecular structure chains .................................................................10
2.2.5 Configurations of molecular chains ........................................................................11
2.3 Polymer Types and Processing ............................................................................................12
2.4 Polymer Crystallinity and Crystals ......................................................................................14
2.5 Effect of Temperature on Thermoplastic Polymers .............................................................16
2.6 Mechanical Properties of Thermoplastic polymers .............................................................19
2.7 Mechanical Behavior of Polyethylene .................................................................................21

vi
2.7.1 Deformation of amorphous and ductile failure ........................................................21
2.7.2 Deformation of crystalline and brittle failure ..........................................................22
2.7.3 Strain hardening .......................................................................................................23
2.7.4 Environmental stress cracking .................................................................................24
2.8 Defects in Crystalline Polymers...........................................................................................24
2.9 Applications of Some Polymers...........................................................................................25
CHAPTER THREE: METHODOLOGY
3.1. Materials..............................................................................................................................29
3.1.1 Polyethylene..............................................................................................................29
3.1.2 High density polyethylene (HDPE) ..........................................................................31
3.1.3 Ultra-high molecular weight polyethylene (UHMWPE) ..........................................33
3.2 Density Testing ....................................................................................................................35
3.2.1 Sample perpetration ...................................................................................................35
3.2.2 Density tests ...............................................................................................................36
3.3 Tensile Testing .....................................................................................................................37
3.3.1 Sample preparation .....................................................................................................37
3.3.2 Tensile test ..................................................................................................................39
3.4 Flexural Testing ...................................................................................................................41
3.4.1 Sample preparation .....................................................................................................41
3.4.2 Flexural test.................................................................................................................42
CHAPTER FOUR: RESULTS AND DISCUSSION
4.1 Density Test .........................................................................................................................45
4.2 Tensile Test ..........................................................................................................................47
4.3 Flexural Test ........................................................................................................................51

vii
CHAPTER FIVE: CONCLUSIONS AND RECOMMENDATIONS
5.1 Conclusions ..........................................................................................................................59
5.2 Recommendations ................................................................................................................60
REFERENCES ............................................................................................................................61
APPENDICES ..............................................................................................................................68
APPENDIX 1: ISO Sandards ....................................................................................................69
APPENDIX 2: Tensile Test Data ............................................................................................125
APPENDIX 3: Flexural Test Data...........................................................................................140

viii
LIST OF TABLES
Table 2.1: Polymers from monomers………….........................................................................7
Table 2.2: Comparison of polymer categories……………...…………...…….....……….…..15
Table 2.3: Glass-transition melting and processing temperature ranges for thermoplastics... 21
Table 2.4: Some properties of selected thermoplastic polymers…...…………......................22
Table 2.5: Industrially important polymers…….…….............................................................29
Table 2.1: Classification of the density polyethylene according to the ASTM ………..........34
Table 3.2: Mechanical properties of PE…………….....………………….……….……..…..34
Table 3.3: Mechanical properties of black high-density polyethylene HDPE..................... ...36
Table 3.4: Mechanical properties of white UHMWPE…….…………………………….......38
Table 3.5: Specimen dimensions for tensile test…………………..…….……………….…..41
Table 3.6: Values of sample specimens width b in relation to thickness h…….……..……...44
Table 4.1: Results of density measurements of PE ……..…………….……………..............49
Table 4.2: Results of density measurements of HDPE …………………..………….….........49
Table 4.3: Results of density measurements of UHMWPE.....................................................50
Table 4.4: Results of tensile test of PE…………………...…………….….…..…………......53
Table 4.5: Results of tensile test of HDPE ……………………………..…….………….......53
Table 4.6: Results of tensile test of UHMWPE………………………………..……………..54
Table 4.7: Results of flexural test of PE……………..….........................................................58
Table 4.8: Results of flexural test of HDPE…………………………….. ………….…...…..59
Table 4.9: Results of flexural test of UHMWPE……...………………………………...…....59
Table 4.10: Comparison of tensile and flexural properties PE, HDPE and
UHMWPE with the supplier’s data ………………………………………..….....61

ix
LIST OF FIGURES
Figure 2.1: Double covalent bonds of ethylene………………………………………………...4
Figure 2.2: Triple bond of acetylene……………………………………………………………5
Figure 2.3: Structure of normal butane ……………………………………...………..……..…5
Figure 2.4: Repeat unit of hydrocarbon molecules of polyethylene………................................6
Figure 2.5: Molecular structure of linear polyethylene...............................................................7
Figure 2.6: Distribution of chain length in polymer samples: Number and weight fractions...10
Figure 2.7: Rotation of bonds around its axis with angle of 109.5o ………...……..................11
Figure 2.8: Irregular shape of polymer molecules.....................................................................12
Figure 2.9: Main geometry shapes…………………………………………………….………13
Figure 2.10: Head-to-tail structure of polystyrene………….……………………….…………14
Figure 2.11: Head-to-head structure polystyrene……………….……………………………...15
Figure 2.12: Schematic illustration of chain folding leading to lamellar stacking to form spherulites and lamellar crystallites. ......................................................................17
Figure 2.13: Fringed-micelle typical of polymer crystallinity.....................................................18
Figure 2.14: Effects of temperature on behavior thermoplastics and molecular structure……..19
Figure 2.15: Engineering stress-strain curve for typical thermoplastic polymers……………...23
Figure 2.16: Neck behavior of amorphous thermoplastics..........................................................24
Figure 2.17: Tensile deformation of amorphous polymers…………...........................................25
Figure 2.18: Stages of brittle fracture ………………….............................................................26
Figure 2.19: Diagram representation of the defects in crystallites of the polymers. ..................28
Figure 3.1: High-pressure process by ICI……………………………………………………..33
Figure 3.2: Lower -pressure process by ICI…………………………………………………...33
Figure 3.3: Crystal structure classification of polymers………................................................36
Figure 3.4: Test specimens of density test.................................................................................39
Figure 3.5: Sartorius MSU224S-000-DU materials testing machine….……….…...…...........40
Figure 3.6: Operation instructions for milling machine MOD 164...........................................40
Figure 3.7: Sample prepared for the tensile test........................................................................42
Figure 3.8: Testometric M500-100 AT universal testing machine............................................43

x
Figure 3.9: A 3D view of the flexural test sample ....................................................................45
Figure 3.10: WP 300.04 bending device......................................................................................46
Figure 3.11: Position of test specimen at start of test……….…..…………………...…............46
Figure 4.1: Stress-strain curve of PE obtained from sample 1 in Table 4.4..............................51
Figure 4.2: Stress-strain curve of HDPE sample 1 in Table 4.5……………………................52
Figure 4.3: Stress-strain curve of UHMWPE, sample 1 of Table 4.6……………...…………52
Figure 4.4: A tensile test sample of PE before and after the test...............................................54
Figure 4.5: A tensile test sample of HDPE before and after the test………………….............55
Figure 4.6: A tensile test sample of UHMWPE before and after the test..................... ………55
Figure 4.7: Force-deflection curve of PE for sample 1 of Table 4.7.…………….…......….....57
Figure 4.8: Force-deflection curve of HDPE for sample 1 of Table 4.8.………...………..….57
Figure 4.9: Force-deflection curve of UHMWPE for sample 1 of Table 4.9............................58
Figure 4.10: A test sample of PE before and after the flexural test.............................................60
Figure 4.11: A test sample of HDPE before and after the flexural test.......................................60
Figure 4.12: A test sample of UHMWPE before and after the flexural test.…...……………... 60

xi
LIST OF SYMBOLS USED
A: Area
b: Width
E: Young’s modulus
ɛ: Strain
Ef: Flexural Modulus
F: Force
h: Thickness
l: Length
m: Mass
s: Deflection
T: Temperature
Tg: Glass transition temperature
V: Volume
εf : Flexural strain
εR: Elongation at break
ρ: Density
ρa: Amorphous density
ρc: Crystalline density
ρs: Part density
σ: Stress
σf : Flexural strength
σS: Tensile strength at yield

xii
LIST OF ABBREVIATIONS USED
3D: Three dimension
DMA: Dynamic mechanical analysis
DSC: Differential scanning calorimetry
ESC: Environmental stress cracking
HDPE: High density polyethylene
ISO: International organization for standardization
MWD: Molecular weight distribution
PA: Polyamide
PC: Polycarbonate
PDI: Polydispersity index
PE: Polyethylene
PMMA: Poly (methyl methacrylate)
PP: Polypropylene
PS: Polystyrene
PTFE: Polytetrafluoroethylene
PVA: Poly vinyl alcohol
PVC: Poly Vinyl chloride
SAXS: Small-angle X-ray scattering
UHMWPE: Ultra-high molecular weight polyethylene
UV: Ultraviolet
1
CHAPTER 1
INTRODUCTION
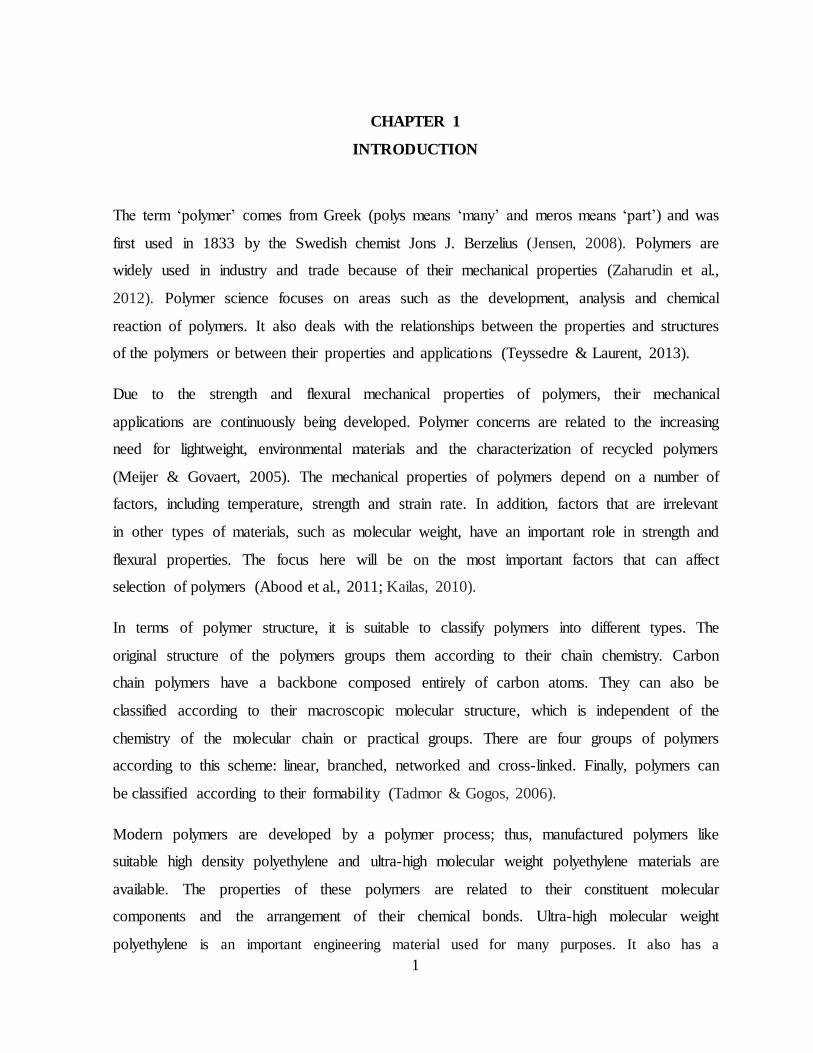
The term ‘polymer’ comes from Greek (polys means ‘many’ and meros means ‘part’) and was
first used in 1833 by the Swedish chemist Jons J. Berzelius (Jensen, 2008). Polymers are
widely used in industry and trade because of their mechanical properties (Zaharudin et al.,
2012). Polymer science focuses on areas such as the development, analysis and chemical
reaction of polymers. It also deals with the relationships between the properties and structures
of the polymers or between their properties and applications (Teyssedre & Laurent, 2013).
Due to the strength and flexural mechanical properties of polymers, their mechanical
applications are continuously being developed. Polymer concerns are related to the increasing
need for lightweight, environmental materials and the characterization of recycled polymers
(Meijer & Govaert, 2005). The mechanical properties of polymers depend on a number of
factors, including temperature, strength and strain rate. In addition, factors that are irrelevant
in other types of materials, such as molecular weight, have an important role in strength and
flexural properties. The focus here will be on the most important factors that can affect
selection of polymers (Abood et al., 2011; Kailas, 2010).
In terms of polymer structure, it is suitable to classify polymers into different types. The
original structure of the polymers groups them according to their chain chemistry. Carbon
chain polymers have a backbone composed entirely of carbon atoms. They can also be
classified according to their macroscopic molecular structure, which is independent of the
chemistry of the molecular chain or practical groups. There are four groups of polymers
according to this scheme: linear, branched, networked and cross-linked. Finally, polymers can
be classified according to their formability (Tadmor & Gogos, 2006).
Modern polymers are developed by a polymer process; thus, manufactured polymers like
suitable high density polyethylene and ultra-high molecular weight polyethylene materials are
available. The properties of these polymers are related to their constituent molecular
components and the arrangement of their chemical bonds. Ultra-high molecular weight
polyethylene is an important engineering material used for many purposes. It also has a

2
widespread range of properties, some of which are unique to polyethylene and do not occur in
other materials (Mitchell, 2004).
Polymer production plays a very significant part in human life since many of the products we
use every day are made from polymers. They not only influence our lifestyle, work and
production but they surround us everywhere: in the rooms of our houses and in the products
we use. Products made from polymers contribute to satisfying our basic human needs,
including housing, health, clothing and transportation. Ultra-high molecular weight
polyethylene (UHMWPE) has a very important use in implant materials. The list of fields for
application of polymer products is virtually never-ending (Nicholson et al., 1999).
1.1 Objectives
These types of polyethylene materials, especially high density polyethylene (HDPE), are
commonly used in the construction projects including projects of Kurdistan Regional
Government-Minister of Municipalities & Tourism and also in Cyprus for the water pipeline
from Turkey.
The purpose of this project is to investigate experimentally the tensile and flexural properties
of polyethylene (PE), high density polyethylene (HDPE) and ultra-high molecular weight
polyethylene (UHMWPE) and compare the results with those of previous studies, such as
Sangir and Direct plastic companies.
1.2 Contents
The remaining chapters of this thesis are organized as follows. Chapter two is a literature
review that gives general information about the structure and architecture of polymers and the
mechanical behaviour of polyethylene when a load is applied. Chapter three describes the
methodology used in the tensile and flexural tests. Chapter four presents the results of the tests
carried out in the study. Finally, chapter five concludes the thesis and outlines probable future
development of polymers based on this work.

3
CHAPTER 2
LITERATURE REVIEW
2.1 The Hydrocarbon Structure in Architecture of Polymers
Polymers are organic in origin. Most organic materials are hydrocarbons composed of
hydrogen and carbon, so their intramolecular bonds are covalent. A carbon atom has four
electrons and a hydrogen atom has one for covalent bonding. A covalent bond exists when
each of the two bonding atoms contributes one electron, such as for the molecule of methane
(CH4). Double and triple bonds between two carbon atoms include the sharing of two and
three couples of electrons, respectively. As an example, ethylene has the chemical formula
(C2H4), which means it has two carbon atoms that are doubly bonded together, and each one is
also single bonded to two hydrogen atoms, as shown in Figure 2.1.
Figure 2.1: Double covalent bonds of ethylene (Callister & Rethwisch, 2007)
On the other hand, a triple bond occurs in acetylene (C2H2) as shown in Figure 2.2.
Figure 2.2: Triple bond of acetylene (Callister & Rethwisch, 2007)
The term unsaturated is used for molecules that have double covalent bonds and triple
covalent bonds. The paraffin family shows some of the simple hydrocarbons. The paraffin
chain-like molecules consist of methane (CH4), ethane (C2H6) propane (C3H8) and butane
(C4H10). The covalent bonds in each molecule are strong, while only van der Waals and weak
4
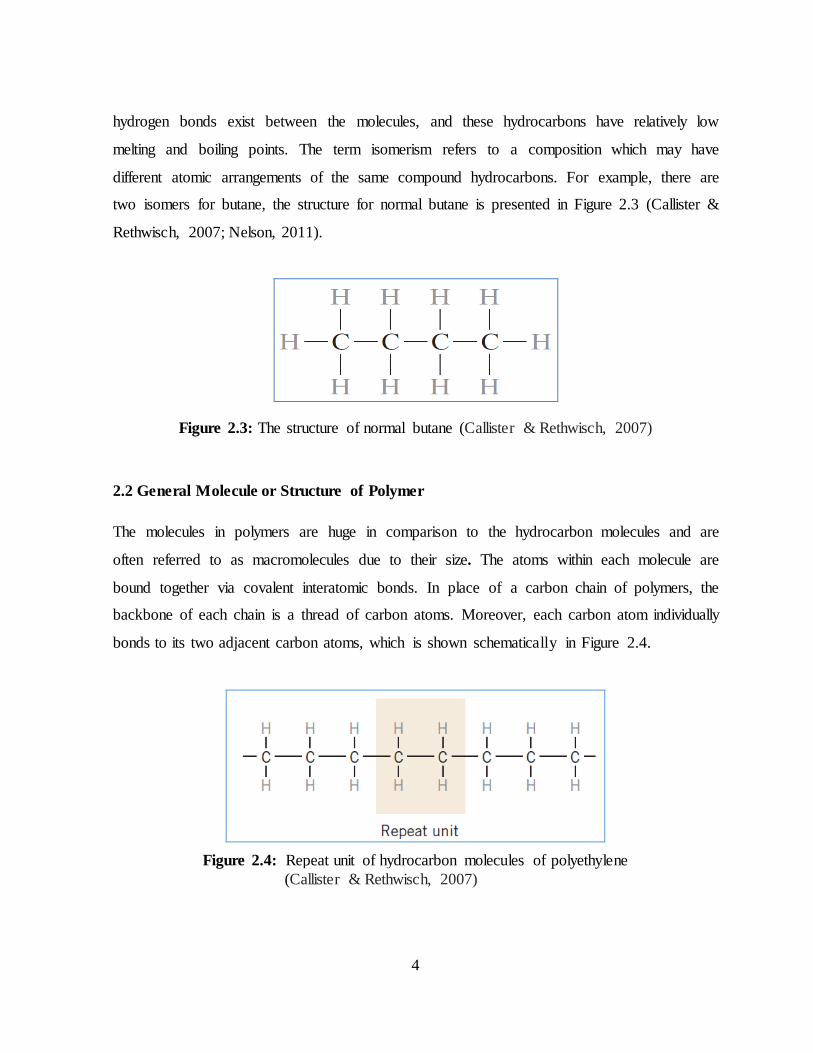
hydrogen bonds exist between the molecules, and these hydrocarbons have relatively low
melting and boiling points. The term isomerism refers to a composition which may have
different atomic arrangements of the same compound hydrocarbons. For example, there are
two isomers for butane, the structure for normal butane is presented in Figure 2.3 (Callister &
Rethwisch, 2007; Nelson, 2011).
Figure 2.3: The structure of normal butane (Callister & Rethwisch, 2007)
2.2 General Molecule or Structure of Polymer
The molecules in polymers are huge in comparison to the hydrocarbon molecules and are
often referred to as macromolecules due to their size. The atoms within each molecule are
bound together via covalent interatomic bonds. In place of a carbon chain of polymers, the
backbone of each chain is a thread of carbon atoms. Moreover, each carbon atom individually
bonds to its two adjacent carbon atoms, which is shown schematically in Figure 2.4.
Figure 2.4: Repeat unit of hydrocarbon molecules of polyethylene
(Callister & Rethwisch, 2007)

5
The term repeat unit refers to how these long molecules are composed of structural entities
which are successively repeated along the chain. The smallest molecule from the polymer can
be manufactured and is called a monomer. Hence, repeat unit and monomer mean different
things, but occasionally the term monomer unit or monomer is used instead of the proper term
repeat unit (Jones & Ashby, 2005; Callister & Rethwisch, 2007).
2.2.1 The Chemistry molecular structure of polymers
Polyethylene (PE) has a simple molecular structure which is presented in Figure 2.5. This
molecular structure corresponds to a chemical formula in the form of ― (CH2―CH2)n―. The
monomer element being presented within parentheses reveals that PE is manufactured from
ethylene gas (CH2══CH2) by breaking the double covalent bonds and joining the gas
molecules repeatedly at high pressure. For example, in the chemical formula of PE, values can
be as small as a hundred on up to hundreds of thousands (Madi, 2013).
Figure 2.5: Molecular structure of linear polyethylene, where each carbon atom is also covalently linked to two hydrogen atoms (Madi, 2013)
The chain molecular structures of several commercial polymers are shown in Table 2.1
Polypropylene (PP) and Poly(vinyl chloride) (PVC) have molecular structures similar to that
of polyethylene (PE), both having basic –C–C– chains but with the significant difference that
one hydrogen atom in the monomer is replaced by the methyl group, CH3, in PP and by
chlorine, Cl, in PVC (Teraoka, 2002).

6
Table 2.1: Polymers from monomers (Teraoka, 2002)
Monomer Polymers
Ethylene
Polyethylene
Propylene
Polypropylene
Vinyl chloride
Poly Vinyl chloride (PVC)
Styrene
Polystyrene
Acrylonitrile
Polyacrylonitrile
Methyl Methacrylate
Plexiglas or Lucite
Vinyl alcohol Polyvinyl alcohol (PVA)

7
Tetrafluoroethylene
Polytetrafluoroethylene(Teflon)
Polystyrene (PS) has a similar basic backbone –C–C– but one hydrogen atom is replaced by a
large aromatic ring (C6H6) (or benzene); it is a brittle polymer with low toughness. Some
polymers have different chemical structures such as in polytetrafluoroethylene (PTFE,Teflon),
where all hydrogen atoms are replaced by the element fluorine (F). Some polymers have
different backbones such as poly (methyl methacrylate) (PMMA), which has a simple
backbone containing its monomer of methyl CH3 and the methacrylate group COO–CH3.
Polyamide (PA) (nylon), another polymer, has an amide link (–NH–CO–) in the backbone
(Dasgupta et al., 1996).
2.2.2 Molecular weights and molecular weight averages
Molecular weight and molecular weight averages affect the properties of polymers. The
molecular weight provides information on the changes of the mechanical properties. Almost
every manufactured polymer material contains molecules in various degrees of
polymerization, and this determines the Average Molecular Weight. (Hamerton et al., 2014;
Tai, 2000).
2.2.2.1 Molecular numbers and weights
There are several ways of defining average molecular weight. The average molecular number
(Mn) can be acquired by dividing the chain lengths into a series of size ranges (i) and
determining the number fraction of chain lengths within each size range (i). Average
molecular weight (Mw) is also built on the weight fraction of molecules within the various
size ranges (i).
8
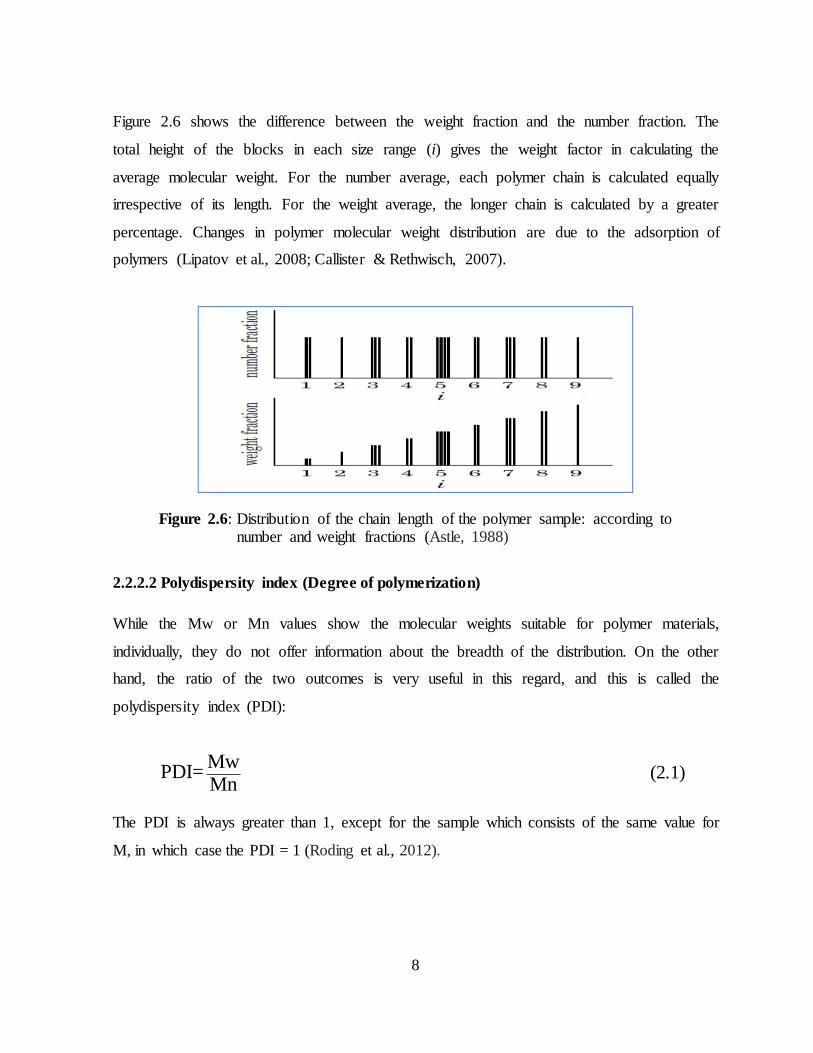
Figure 2.6 shows the difference between the weight fraction and the number fraction. The
total height of the blocks in each size range (i) gives the weight factor in calculating the
average molecular weight. For the number average, each polymer chain is calculated equally
irrespective of its length. For the weight average, the longer chain is calculated by a greater
percentage. Changes in polymer molecular weight distribution are due to the adsorption of
polymers (Lipatov et al., 2008; Callister & Rethwisch, 2007).
Figure 2.6: Distribution of the chain length of the polymer sample: according to number and weight fractions (Astle, 1988)
2.2.2.2 Polydispersity index (Degree of polymerization)
While the Mw or Mn values show the molecular weights suitable for polymer materials,
individually, they do not offer information about the breadth of the distribution. On the other
hand, the ratio of the two outcomes is very useful in this regard, and this is called the
polydispersity index (PDI):
Mw
PDI= Mn
(2.1)
The PDI is always greater than 1, except for the sample which consists of the same value for
M, in which case the PDI = 1 (Roding et al., 2012).

9
2.2.3 Molecular shape and secondary bonds
The atoms are held together in compounds by forces which are called chemical bonds. The
bonds between the carbon atoms within the chain and between the carbon and the hydrogen
are the covalent bonds and are based on the hybrid valence electrons of the carbon. This
outcome in the form of the molecule chain is shown in Figure 2.5. These hybrid valence
electrons totally fill the valence bond; thus, these polymers are often transparent and used as
insulators (Zumdahl, 2005).
When two polyethylene molecules have no distribution of valence electrons between them and
instead have a weak van der Waals bond, this is responsible for the softness of the
polyethylene. The Van der Waals, permanent hydrogen and dipole bonds, are secondary
bonds. They are about 10 to 50 times weaker than the primary bonds of the metals and
ceramics, with the same mechanical properties and have lower melting temperatures of 120 to
300OC. The hybrid rigidly carries out the angle of (109.5o) between the bonds, so the bond can
rotate around its axis as shown in Figure 2.7 (Carraher, 2013).
Figure 2.7: Rotation of the bonds around its axis with the angle of 109.5o (Callister & Rethwisch, 2007)
The actual form of the polyethylene molecule chain is not a straight bar. Thus, the polymer
chains have the irregular form sketched in the Figure 2.8. In the solid polymer, the individual
chains are intertwined. This intertwining of molecule chains has considerable influence on the
mechanical properties of polymers (Smith et al., 2006).

10
Figure 2.8: Irregular shape of a polymer molecule (Smith et al., 2006)
2.2.4 Geometry of the molecular chain structure
The shape of the molecule chains is very important in determining some of the mechanical
and thermal characteristics of polymers. The main geometric shapes are: linear, branched,
cross-linked and 3-D network as shown in Figure 2.9 (Kalpakjian & Schmid, 2010).
Linear
The linear polymer is the molecular chain of atoms arranged more or less in a straight line.
This base of the chain is called the backbone. As a whole, the bonds within the molecular
chain (intramolecular) are covalent. The common polymers with linear molecular structures
are polyethylene, nylon, polystyrene, poly (methyl methacrylate), poly (vinyl chloride) and
fluorocarbons.
Figure 2.9: Main geometry shapes: Linear, Branched, Cross-Linked and 3-D Network (Kalpakjian & Schmid, 2010)

11
Branched
Sometimes side-branch chains which are comparable in length to the main backbone chain are
attached to the main backbone chain, and such polymers are called branched polymers. Some
polymers, such as polyethylene, can be produced in linear or branched forms. The branching
affects the physical properties of polyethylene. The degree of the branching such as chain
length can also be controlled. The branching forces of the molecular chains are packed rather
loosely, making a lower density material. This has the result of decreasing the mechanical
properties and formation becomes more flexible. Low density polyethylene can be considered
an example (Dahotre & Harimkar, 2008).
Cross-Linked
In this type, the adjacent linear chains are connected one to another at different locations via
covalent bonds. The inter-molecular bonds inside the chains and between the chains are both
primary covalent bonds. The strong cross-linking bonds of the molecule chains are not
affected by temperature. The cross-linking types in plastics and elastomers are relatively
stronger. They do not melt, and thus are very difficult to recycle. The most common of the
cross linked polymers are rubbers and elastomeric materials (Lewis, 2001).
Network
When a repeat unit (monomer) has 3 or more double bonds the polymers will form a 3-
dimensional network instead of linear cross-linked chains. A polymer with a high degree of
cross-linking may be classified as a network polymer. The materials with 3-dimensional
networks (such as epoxies, phenol-formaldehyde and polyurethanes) have distinctive
mechanical and thermal properties (Hiemenz, 1984).
2.2.5 The configuration of the molecular chain
The term ‘Configuration’ refers to the organization of the atoms or group of atoms along a
molecular chain. Sometimes the term ‘microstructure’ is preferred instead. Configurational
isomerism includes various arrangements of the atoms and substituents in a molecular chain

12
which can be interconverted only by fracture or by the improvement of the primary chemical
bonds. Configuration designates different spatial arrangement groups of elements or side
chemical elements around the backbone of a molecular chain. Head-to-head and head-to-tail
configurations refer to the arrangement of the same atoms or groups of atoms all over
thedouble bond in the repeat unit. The head-to-tail and head-to-head configurations of a
polymer chain cannot be interchanged without breaking the primary chemical bonds. The
head-to-tail structure of polystyrene is shown in Figure 2.10, whereas the head-to-head
structure of polystyrene can be seen in Figure 2.11 (Akay, 2012; Callister & Rethwisch,
2007).
Figure 2.10: Head-to-tail structure of polystyrene (Akay, 2012)
Figure 2.11: Head-to-head structure of polystyrene (Akay, 2012)
2.3 Polymer Types and Processing
Polymers can also be classified according to their mechanical and thermal behavior.
Technologically, polymers are classified in two main classes, namely plastics and elastomers.
Plastics are important engineering materials for many reasons. They have a widespread range
of properties, some of which are unachievable in other materials, and in many cases are
relatively low in cost. Plastics are again classified into two groups as thermoplastics
(thermoplastic polymers) and thermosets (thermosetting polymers) depending on their
mechanical and thermal behavior. A comparison of major polymer categories is given in
Table 2.2 (Sinha, 2006).

13
Table 2.2: A comparison of polymer categories (Sinha, 2006)
Types General structure Example
Thermoplastics Flexible linear molecular chains (branched or straight) Polyethylene
Thermosets Rigid three dimensional network (chains may be
branched or linear)
Polyurethane
Elastomers Lightly cross linked thermosets or thermoplastics,
involving spring-like molecule chains
Natural rubber
Thermoplastics: The properties of thermoplastics increase or decrease when they are cooled
or heated. Thermoplastics become soft when heating is used and have a hard finish when
cooled. Thermoplastic materials are created by the application of heat and pressure. Some
examples of thermoplastics are polyethylene, polypropylene, PVC, polystyrene nylons,
polypropylene, acrylics and polymethyl methacrylate (plastic lenses or Perspex) (Clarke,
2011).
Thermosets: These plastics need heat and pressure to mold them into the required form. They
are shaped into a permanent form and treated via chemical reactions such as widespread cross-
linking. They cannot be melted or reformed into a new shape, but decay upon being heated to
high temperatures. Hence, unlike thermoplastics, thermosets cannot be recycled. Thermosets
are commonly stronger, but harder, than thermoplastics. Some advantages of thermosets in
engineering applications include high rigidity, high thermal stability, light weight, high
dimensional stability, high electrical resistance, thermal insulation properties and resistance to
creep. Thermoset polymers cannot be joined and melted by thermal methods like laser or
ultrasonic welding. Thermoset polymers are plastics with narrow cross-linked molecular
structures, examples of which are epoxy resin (EP), polyester resin (UP) and phenolic resin
(PF) (Klein, 2013).
Elastomers (rubbers): These polymers will stretch when a load is applied, even at room
temperature, and return to their original shape when the load is released. They are composed

14
of coil-like molecular chains; therefore, elongation can be reversed. The shape of the molecule
chains of elastomers are cross-linking and branched (Rinnbauer, 2014).
2.4 Polymer Crystallinity and Crystals
An important structural characteristic of polymers is that they are easily transformed from the
amorphous into the crystalline state. In fact, the transition of many polymers from amorphous
to crystalline state occurs at approximately room temperature. This is because polymer
crystallinity is not an automatic process.
A large number of structural characteristics contribute to the ability of amorphous chain
polymers to rearrange themselves in an ordered molecular structure. These factors (such as the
chemical components, the bond angles of the backbone and the side groups) are related to the
structural design of the chain. Crystalline polymers can be classified into two common
categories: extended chain crystallinity and folded chain crystallinity. The first type of
crystalline structure in polymers has a precise alignment and highly regular lamellae
(platelets) in the chains, each of which consists of a number of molecules. Some typical
examples of such extended chains are polyethylene, poly (vinyl alcohol) and poly (vinyl
chloride).
The second type of crystalline structure in polymers is chain folding. Polymer chains can fold
in a regular fashion to form plate-like crystallites called lamellae. The chains of a polymer not
only fold, but can extend from one lamella to another to form amorphous regions. In polymers
crystallized from the melt, these lamellae often radiate from a central nucleation site, forming
three-dimensional spherical structures called spherulites, as illustrated in Figure 2.12.

15
Figure 2.12: A schematic illustration of chain folding leading to lamellar stacking to form spherulites and lamellar crystallites (Mitchell, 2004)
As with the other classes of materials, polymers can be either polycrystalline or single
crystals. Polycrystalline polymers are more appropriately termed semi-crystalline polymers,
since the region between the crystalline domains in polymers can be quite large and result in a
significant amorphous component of the polymer. The crystalline regions in semi-crystalline
polymers are called crystallites. They have dimensions of several hundred angstroms, but the
length of a polymer chain is generally much larger than this.
A polymer crystal structure related to chain folding is called the fringed micelle model. Such
polymer chains do not fold in a regular fashion but extend from one crystalline region to
another, again forming amorphous regions between the crystallites as shown in Figure 2.13
(Mitchell, 2004).

16
Figure 2.13: The fringed-micelle typical of polymer crystallinity (Mitchell, 2004)
The crystalline region and amorphous region have various densities. Crystalline density (ρc) is
greater than amorphous density (ρa) because of its more compact structure. The percentage of
crystallinity in a semicrystalline polymer with main part density (ρs) can then be calculated
from the respective crystalline and amorphous densities:
(
% crystallinity )
100( )
ac s
as c
(2.2)
Polymer single crystals possess the density of the crystal, ρc. Polymer single crystals do not
usually form in the main part, but rather from more carefully controlled formation techniques
such as vapor deposition (Mitchell, 2004). On the other hand, differential scanning
calorimetry (DSC) is used to measure the degree of crystallinity in the polymers (Kong &
Hay, 2002).
2.5 Effects of Temperature on Thermoplastic Polymers
The properties of thermoplastics change depending upon temperature. For better design of
components and selection of processing techniques, investigation of the effects of temperature
on material properties is necessary. The effects of temperature on the behaviour of
thermoplastics and molecular structure is shown in Figure 2.14. Thermoplastics can be
crystalline or amorphous when they are cooled below their melting temperature. The

17
crystallinity in thermoplastics can be introduced by temperature (slow cooling) or by the
application of stress that can untangle chains. When tensile stress is applied to thermoplastics,
the weak bonding between the molecular chains can be overwhelmed, and the molecular
chains can slide and rotate relative to one another. The ease with which the chains slide
depends on both the polymer structure and the temperature.
Figure 2.14: The effects of temperature on the behavior of thermoplastics and their molecular structure (Askeland et al., 2011)
Degradation temperature
As a result of very high temperatures, the covalent bonds between the atoms in the linear
molecular chain may be destroyed, and the polymer material may char or burn. In
thermoplastics, decomposition occurs in the liquid state; in thermosets, the decomposition
takes place in the solid state. This is called the degradation (decomposition) temperature
(Ambuken et al., 2014).
Liquid polymers
Thermoplastic materials usually do not melt at a specific temperature. Furthermore, there is a
range of temperatures over which melting can happen. The approximate melting ranges of
typical polymers are shown in Table 2.3. At or above the melting temperature Tm, bonding

18
between the intertwined and twisted chains is weak. If a force is applied, the chains slide past
one another, and the polymer flows with virtually no elastic strain. The modulus of elasticity
and strength are nearly zero, and the polymer is suitable for casting and many forming
processes (Hourston, 2010; Askeland, et al., 2011).
Table 2.3: Glass-transition, melting and processing temperature ranges for thermoplastics
(Askeland et al., 2011)
Polymer
Melting
temperature
range
Glass transition
temperature
range (Tg)
Processing
temperature
range
Low density polyethylene 98-115 -90 to -25 149-232
high density polyethylene 130-137 -110 177-260
Polyvinyl chloride 175-212 87 ___
Polypropylene 160-180 -25 to -20 190-288
Polystyrene 240 85-125
Polytetrafluoroethylene (Teflon) 327
6,6-nylon 243-260 49 260-327
Polycarbonate 230 149 271-300
Polyester 255 75
Rubbery and leathery states
Below the melting temperature, the polymer molecular chains are still intertwined and twisted.
All of the polymers have an amorphous structure. Just below the melting temperature, the
polymer material behaves in a rubbery manner. At lower temperatures, bonding between the
molecular chains is stronger, the polymer material becomes stronger and stiffer and a leathery
behavior is observed. When stress is applied, both plastic and elastic deformation of the
polymer occurs. When the stress is removed, the elastic deformation rapidly improves, but the
polymer material is permanently deformed because of the movement in the molecular chains.
Permanent deformations can be accomplished, allowing the polymer to be designed into
suitable forms by extrusion and molding.

19
2.6 Mechanical Properties of Thermoplastic polymers
Most molten and solid thermoplastics can exhibit a non-Newtonian and viscoelastic behavior.
The non-Newtonian behavior includes the strain and stress which are not linearly linked with
the parts of the stress-strain curve. The viscoelastic behavior is caused when an external force
is applied to a thermoplastic polymer so that both plastic and elastic deformation occurs. The
deformation process of the polymer material depends on the amount and the length of time of
the force that is applied (Askeland, et al., 2011). The mechanical properties of the
thermoplastic polymers (as shown in Table 2.4) can be controlled by both morphological and
molecular architecture. A tensile test is used to determine the mechanical properties of the
polymer with a stress-strain curve. The curve for a typical thermoplastic polymer is illustrated
in Figure 2.15 (Varela et al., 2014).
Table 2.4: Some properties of selected thermoplastic polymers (Askeland et al., 2011)
Thermoplastic polymers
Tensile
strength
(MPa)
Elongation
%
Elastic
modulus
(MPa)
Density
(gm/cm3)
Polyethylene low density 20 800 275 0.92
Polyethylene high density 38 130 1241 0.96
Ultra-high molecular weight 48 350 689 0.934
Polyvinyl chloride (PVC) 62 100 4136 1.42
Polypropylene (PP) 41 700 1516 0.90
Polystyrene (PS) 55 60 3102 1.06
Polyacrylonitrile (PAN) 62 4 3998 1.15
(Teflon) 48 400 5515 2.17
Polyamide (PA)(Nylon) 82 300 3447 1.14
Polyester (PET) 72 300 4136 1.36
Polycarbonate (PC) 75 130 2757 1.20
Polyimide (PI) 117 10 2068 1.39

20
Elastic Behavior in thermoplastics can result in deformation. The covalent bonds in the
molecular chain become distorted and stretched when a stress is applied extending the
molecular chains too elastically. When the stress is released, the distortion rapidly returns to
its orginal shape. This behavior is similar to that of ceramics and metals, which are also
distorted elastically by the elongation of the covalent bonds. Furthermore, some parts of the
polymer chain may be deformed when the stress is released and these parts return to their
original length over a period of the time – often hours or months.
Figure 2.15: The engineering stress-strain curve for a typical thermoplastic
polymer (Askeland, et al., 2011)
Plastic behavior in an amorphous thermoplastic material means it is distorted plastically
when a stress forces it at maximum yield strength. Dissimilar deformation occurs in the case
of the metals, but plastic distortion is not a sign of dislocation movement. Instead, chains
stretch, slide, rotate and untangle under force to permanent distortion. The drop in stress
below the yield point can be clarified via this phenomenon. Originally, the molecular chains
may be highly intertwined and tangled. When the stress is adequately high, the chains begin to
straighten and untangle. Necking also takes place, allowing continued slipping of chains at
lower stress. Finally, the chains come closer together and parallel. Stronger van der Waals
bonding between the closely aligned molecular chains needs higher levels of stress to

21
complete the deformation and the fracture process as shown in Figure 2.16 (Askeland &
Phule, 2003).
Figure 2.16: Neck behavior of amorphous thermoplastics (Askeland et al., 2011)
2.7 Mechanical Behavior of Polyethylene
2.7.1 Deformation of amorphous polymers and ductile failure
Ductile failure is a type of failure that usually happens over a short length of time at high
levels of stress. From the macroscopic level, the ductile tensile failure results in the
commencement of observable necking (deformation) in the sample polymer. For polyethylene
materials, tensile ductile behavior is influenced by the nature of the semi-crystalline material.
As shown in Figure 2.17, tensile ductile deformation is illustrated by a stress-strain curve in
the polyethylene material on the micro scale. Before the yield point, no visible deformation is
observed in the material and the load is mostly carried by the lamellae of the rigid crystalline.
The strain developments of the stress also increase and a yield point occurs. During the period
between the yield point and the beginning of strain hardening, the load on the sample being
tested remains at a comparatively constant level. In this region, the deformation is the
combination of the amorphous phase reorganizing itself and the lamellae of the crystal sliding
past each other, but each separate crystal itself remains unbroken. As shown in Figure 2.17,
the strain values between 0.5 and 1.0 indicate increasing alignment, orientation of crystalline

22
phases and amorphous phases in the direction of the drawing as the the stress-strain values
increase. At a strain value of 1.5, a severe increase in the stress value shows that increased
strain causes strain hardening. For the duration of the strain hardening, the amorphous phase
has stretched to full extension resulting in more deformation of polymer material in this stage
due to the breaking and unfolding of the lamellae as presented in Figure 2.17. The breaking of
the lamellae into smaller portions results in the typical coarse tough surface of ductile failure.
When the deformation level of the molecular network reaches its limit, the lamellae start to
break up into a variety of blocks (Alvarado et al., 2010).
Figure 2.17: Tensile deformation of an amorphous polymer (Bartczak et al., 1992)
2.7.2 Deformation of crystalline polymers and brittle failure
Brittle failure is different from ductile failure since as the polymer material goes through
brittle failure, brake cleaning with little deformation of the material occurs and a smooth
fracture appears on the surface. Under the scanning electron microscope (SEM), it can be seen
that the surface actually involves short random pull outs (Cheng, 2008). Brittle failure occurs
when a low stress level is applied over a long period of time. As seen in Figure 2.18 (a-b),
from the first steps of brittle fracture the amorphous polymer starts to elongate under tension.
The reason for this is that over the longer time period the interlamellar associations under
stress start to untangle and relax while the remaining relationships develop very slowly. Once
the few remaining interlamellar associations extend to their boundaries, they are not capable

23
of pulling lamellae separately and this results in the brittle fracture of the polymer, as
demonstrated in Figure 2.18 (c). Microscopic analysis was employed to verify the deformation
mechanisms of the tensile method before and after yielding in the polyethylene materials
examined (Cheng, 2008).
Figure 2.18: Stages of brittle fracture; (a) lamellae starting to pull away (b) tie-molecules
stretching tight (c) complete break of lamellae (Cheng, 2008)
2.7.3 Strain hardening
Strain hardening is an event which is seen in completely drawn polymers. The reason for
increasing stress during the period of strain hardening is that the molecular orientation of the
polymer molecular chains increases the strength of the polymer material. Strain hardening
starts to happen once the most amorphous part of the polyethylene is extended to its restrictive
extensibility (Maria et al., 2008). The extensibility of the polymer network is affected by the
number of the load-behavior connection points in the system. In semi-crystalline polymer
materials [for example, high density polyethylene (HDPE)] the network connection points are
shaped by crystalline structures and physical entanglements. The deformations at high levels
of strain are similar to strain hardening, whereas extreme morphology reform takes place in
semi-crystalline polymer materials and the crystalline structure is destroyed (Peterlin, 1965).

24
2.7.4 Environmental stress cracking
Another type of stress failure is environmental stress cracking (ESC) which occurs in
polymers when they are subjected to a dangerous environment such as foamy water. It can be
observed in pipe networks and certain polymer applications. The kind of break related to
environmental stress cracking ESC is considered a clean crack, as a result of the brittle
fracture mechanism. All cracking in polymers due to dangerous environmental conditions
(such as the degradation of a polymer as a result of exposure to UV light) can be called
environmental stress cracking (ESC). The most important result of such cracking is
mechanical failure in the material. Environmental stress cracking (ESC) can cause the
catastrophic failure of polyethylene (PE) structures without any kind of visible warning.
Environmental stress cracking (ESC) happens at relatively low stress levels since such
structures are usually used as service loads (Brostow and Corneliussen, 1986).
2.8 Defects in Crystalline Polymers
Crystalline polymers are solid materials in which defects are caused by chain folding, chain
ends and limited molecular freedom of movement. The defects of the polymer result in global
(twisting, bending) or local (grain boundaries, dislocations) distortions of the molecular
symmetry with marked effects on the material properties. A diagram representation of the
defects in the crystallites of the polymer is given in Figure 2.19 to show the localization of the
distortion. A characteristic distortion is the twisting and curving of the organic crystals and the
polymer molecule, the defects being immediate. The crystalline regions in the polymers are
constructed on the long chain molecule structure and are accompanied by at least some
amorphous regions. While considered less severe than defect structures in ceramics and
metals, crystalline defects like vacancies, dislocations and interstitials have been detected in
polymers.

25
Figure 2.19: Diagram representation of defects in the crystallites of a polymer (Callister and Rethwisch, 2007)
Due to their relationship with the linear macromolecules, molecule chain ends can be
observed as point defects because they do not have the same chemical properties as the correct
chain. Vacancies, which are typically related to molecular chain ends, and external atoms
acting as interstitials are also presented. Screw dislocations and edge dislocations have been
detected in the polymers. In the crystalline regions of the polymers, where spherulites
compose the folded chain molecules structure, differences in folding may be observed as
defects (Kubel et al., 2000; Callister and Rethwisch, 2007).
2.9 Applications of Some Polymers
As regards the chemistry of polymers, it is necessary to note whether the molecular structure
has branching or side chains. Knowledge of the molecular structure of polymers can
contribute significantly while determining the application process. Those polymers which are
used in such applications are shown in Table 2.5. While some of the polymers can have a
simple backbone containing its monomer, other polymers can have side branches such as
methyl CH3 and the methacrylate group COO–CH3. Copolymers consist of two or more
different arrangements of monomers in the interior of the same macromolecules or chains.
This system can produce new materials with the desired mixture of properties.

26
Table 2.5: Properties and uses of some industrially important polymers (Askeland et al.,
2011)
Name Repeating
unit
Typical properties Typical use
High density
Polyethylene
Greatest difference in linear
and branched due to high
crystallinity; high Tm, Tg,
softening range; greater tensile
strength and hardness.
pipes, sheets, conduits, films,
housewares, extrusion
coating, bottles, toys, cable
insulation and wires
Low density
Polyethylene
Dependent on molecular weight
distribution, molecular weight,
etc.; good toughness and
outstanding electrical properties,
low density, moisture resistance,
resilience, high tear strength
sheeting; films for wrapping
bags, poachers, frozen foods,
textile materials, etc.;
tablecloths, cable insulators
and electrical wiring; coating
for papers, foils, other films;
squeeze bottles
Polytetrafluor
oethylene
(Teflon)
Chemical inertness, high
dielectric strength, low dielectric
loss, low friction properties,
constant mechanical and
electrical properties from 20°C
to about 250°C, ductile, high
impact strength
Coatings for frying pans;
cable and wire insulation;
insulation for oils, motors,
generators, transformers;
pumps; valve packings and
gaskets; non-lubricated
bearings
Poly (vinyl
chloride) and
poly
(vinylidene
Relatively unstable to light and
heat, resistance to chemicals,
fire, fungi, insects, moisture
floor coverings and film
sheets; food covers,
handbags, rainwear, electrical
cables, phonograph records

27
chloride)
Polypropylene
High tensile strength and
hardness, high resistance to
marring, good gloss; high
softening range permits polymer
to be sterilized; chemical
inertness, moisture resistance ,
good electrical properties
filaments, webbing, rope,
carpeting, cordage, small
housewares, injection
molding in automotives,
applications in appliance
Polystyrene
Easily colored; easily fabricated;
transparent; clear; fair thermal
and mechanical properties; good
resistance to acids, oxidizing,
bases and reducing agents
manufacture of heat- and
impact-resistant copolymers,
ABS resins, ion-exchange
resins, lighting fixtures, toys,
plastic optical components,
foam, home furnishing
packaging
Poly(vinyl
acetate)
Water sensitive with respect to
physical properties such as
strength and adhesion; fair
adhesion, generally good
weather ability
latex paints, chewing gum,
Poly(vinyl
butyral)
Good adhesion to rough/smoothe
surfaces good stability & clarity;
insensitivity to moisture
as interlayer in automotive
safety glass
Some polymers with different backbones, such as poly (methyl methacrylate) PMMA, are
used widely to replace glass in manufacturing. Polycarbonate (PC) is a very strong glassy
polymer and has good mechanical properties with a range of temperatures, very good
dimensional stability and good resistance to burning as well as environmental and chemical

28
conditions. PC is used commonly in transparent roof panels (Koutsos, 2009). Advances in the
science of polymers have led to an increase in novel transfer systems. The development of
new polymers with unique properties can open the way for a variety of applications previously
impossible. Water soluble polymers have widespread industrial applications such as paint,
paper, food, textiles, water treatment, coatings, adhesives and constructions. (Kadajji &
Betageri, 2011).

29
CHAPTER 3
METHODOLOGY
3.1 Materials
3.1.1 Polyethylene
Polyethylene (PE) is one of the most important thermoplastic polymers, but its use is limited
to certain applications because of its low melting point, swelling or solubility in hydrocarbons,
and its tendency to crack when stressed (Khonakdar et al., 2003). Polyethylene is derived from
either the modification of natural gas (a methane, ethane, propane mix) or the catalytic
cracking of crude oil into gasoline. Under the required temperature and pressure and with the
aid of a catalyst, the double bond of the ethylene monomer is unlocked and many monomers
connect to form long molecular chains. Today, the methods used for polyethylene
manufacturing are typically categorized as “low pressure” and “high pressure” processes.
High pressure process
Polyethylene was primarily produced in Britain in the 1930's via the high-pressure process by
ICI (Imperial Chemical Industries). They discovered that ethylene gas could be converted into
a white solid by heating it under very high pressure in the presence of minute quantities of
oxygen, as shown in Figure 3.1.
Figure 3.1: High-pressure process used by ICI (Priscilla, 2010)
The polymerisation reaction which occurs is a random one, producing a wide distribution of
molecule sizes. By controlling the reaction conditions, it is possible to choose the average
molecular weight and molecular weight distribution. Then via the high-pressure process used

30
by ICI, the new plastic ‘polythene’ was produced, and the density of the product is in the
range of about 0.915 to 0.930 g/cm3. This is known as LDPE.
Low pressure process
The creation of the LDPE material was followed by the innovation of HDPE in Germany and
Italy in 1952. Researchers succeeded in producing a new aluminum-based catalyst that
allowed the polymerization of ethylene at a much lower pressure level than the ICI process, as
shown in Figure 3.2
Figure 3.2: Lower-pressure process by ICI (Priscilla, 2010)
The polyethylene obtained using this process was found to be much stiffer than the one
produced by the ICI process since it had a density range of around 0.940 - 0.970 g/cm3. The
increased density and stiffness resulted from the much lower chain branching (Priscilla, 2010).
This polyethylene belongs to the same family of materials whether in the low density or the
high density form. According to the American Society for Testing and Materials (ASTM),
polyethylene materials can be separated into four different categories; however, polyethylene
material manufacturers use different material designations based on density or molecular
weight, as shown in the Table 3.1.

31
Tables 3.1: Classification of the density polyethylene according to the
ASTM (Contreras, J. A. 2007)
Type
ASTM
Industrial Acronym
Density (unit)
Terminology
I 0.910-0.925 Low ULLDPE,LLDPE,LDPE
II 0.926-0.940 Medium MDPE
III 0.941-0.959 High HDPE
IV 0.960 and above High-homopolymer HMWPE-UHMWPE
In this experimental work, the description and characteristic properties of the white
polyethylene sheets used in this study are shown in Table 3.2. The most common
characteristics of such plastics are their machinability, corrosion resistance, low weight and
good electrical insulation and thermal properties. The white polyethylene (PE) sheets can be
modified in size and colour (Anon, 2014).
Table 3.2: Mechanical properties of PE sheet (Anon, 2014)
Mechanical and physical properties Value Unit
Density ISO 1183 0.950 g/cm3
Tensile Strength at yield (σS) ISO 527 27 MPa
Elongation at yield (ɛS) ISO 527 9 %
Elongation at break (ɛR) ISO 527 700 %
Modulus of elasticity (Et) ISO 527 1150 MPa
Flexural strength ISO 178 22 MPa
3.1.2 High density polyethylene (HDPE)
High-density polyethylene (HDPE) has a density range of around 0.941 - 0.965 g/cm3 (0.941
< density < 0.965) and is the thermoplastic polymer material derived when carbon and
hydrogen atoms join together in an organized form. The distribution of the molecular weight
and the number of branching chains determine many of the mechanical and chemical
properties of the final product. The property characteristics of the polyethylene material

32
depend on the arrangement of the molecular chains. HDPE branches off the main molecular
chains. The number, size and type of molecular chains of these side molecular chains
determine such properties as density, tensile strength, stiffness, hardness, flexibility and
elongation. Since these are the result of the manufacturing effort, they last for the duration of
the service performance of the HDPE material.
HDPE is considered to be a semi-crystalline polymer material made up of both crystalline and
amorphous regions. The crystalline regions are very well ordered, neatly folded, layered (in
parallel) and closely packed molecular chains. Thus, a molecule chain has properties that are
locally directionally dependent on the crystal within the crystalline region. The amorphous
regions are tangled molecules branching off or preventing the closure and layered packing of
the trunks, the random resultant arrangement is less dense.
There are two types of interlamellar links; the first are tie-molecules that are chains
crystallized in two or more lamellae at the same time. The second type of inter-lamellar links
consists of physical chain entanglements that can be made up by the entanglements of cilia,
loose loops and even tie-molecules.
The distribution and size of the crystalline regions are a determining factor in the
environmental stress crack resistance and the tensile strength of the end product. During
processing, the energy and elevated temperatures associated with the shaping and forming of
the polyethylene cause random orientations of molecule chains in the molten material to
directionally align in the orifice of the extrude. When the bulk of a polyethylene chain is
overcome by tension, the polyethylene movements modify its shape (Gabriel & Moran,
1998).
Different lengths of these molecular chains produce different types of polyethylene, each one
taking unique mechanical properties. Longer molecular chain lengths typically produce an
increase in the tensile strength of the polyethylene (Hughes et al., 2013). Figure 3.3 provides
the arrangements of a crystal lamellae of polyethylene material at different density levels.
When the density increases, hardness, strength, and stiffness also increase; however,
increasing density also has some disadvantages. For example, increased density results in the
polyethylene becoming less ductile and more likely to crack (Alvarado et al., 2010).

33
Figure 3.3: Crystal structure classification of polymers (Bensason et al., 1996)
For this experimental work, high-density polyethylene (HDPE) is a very multi-purpose
engineering plastic. The description and properties of the HDPE sheet are given in Table 3.3
(Direct plastics, 2014).
Table 3.3: Mechanical properties of HDPE (Direct plastics, 2014)
Mechanical and physical properties Value Unit
Density ISO 1183 0.955 g/cm3
Tensile strength at yield (σS) ISO 527 25 MPa
Elongation at yield (ɛS) ISO 527 9 %
Modulus of elasticity in tension (Et) ISO 527 1000 MPa
Modulus of elasticity in flexion (Et) ISO 178 1000-1400 MPa
3.1.3 Ultra-high molecular weight polyethylene (UHMWPE)
Ultra-high molecular weight polyethylene (UHMWPE) is a type of polyethylene material
which is categorized as the liner homopolymer, and its monomers are identical to those of
other types of polyethylene – the fundamental polymer which is made from ethylene (C2H4).
The molecular weight of UHMWPE is 6,000,000 g/mol, while the molecular weight of HDPE
is 200,000 g/mol. Many processes are used to obtain UHMWPE in sheets and rods or any

34
shape the manufacturer needs. The sheets produced can range in size, the dimensions
depending on the size of the compression press used (Harris et al., 1996).
UHMWPE is a polymer with applications in several different areas. Ultra-high molecular
weight polyethylene is very important in the production of implant materials. It has uses in the
beverage and food industry because of its capacity to prevent the growth of bacteria and fungi.
In addition, it can be used in truck and dumptruck bedliners and in the cores of golf balls, for
snow and ski board surfaces and to decrease noise. UHMWPE also has applications in the
medical field, where it is used in total joint replacement. It has the highest resistance to
impacts in comparison with other plastic materials (Pal et al., 2005).
The several advantages discussed above contribute to the wide use of UHMWPE. In spite of
the advantages of this material, there are some drawbacks. As stated above, one advantage of
UHMWPE is its ability to resist wear. Unfortunately, there are some serious consequences
when dealing with wear, which can cause both mechanical and biological failure (Brunner,
2006).
Polyethylene has different molecular weights that were analysed with the help of wide-angle
X-ray diffraction, dynamic mechanical analysis (DMA) and small-angle X-ray scattering
(SAXS) to reveal the molecular weight dependence of the mechanical, thermal and crystalline
properties (Urena et al., 2014).
In this experimental work, the UHMWPE sheet has a very low friction coefficient and is an
excellent material for abrasion resistance and wear. This sheet is tough, smooth, lightweight
and easy to weld. The description and properties of the UHMWPE sheet are given in Table
3.4 (Direct plastics, 2014).

35
Table 3.4: Mechanical properties of UHMWPE (Direct plastics, 2014)
Mechanical and physical properties Value Unit
Density ISO 1183 0.930 g/cm3
Tensile strength at yield (σS) ISO 527 17 MPa
Elongation at yield (ɛS) ISO 527 11 %
Modulus of elasticity in tension (Et) ISO 527 700 MPa
Modulus of elasticity in flexion (Et) ISO 178 800 MPa
3.2 Density Testing
3.2.1 Sample preparation
The specimens consist of pieces of different polyethylene materials cut to any suitable shape
to facilitate proof identity. ISO 1183 was used and the dimensions of each piece must be
selected to document the precise measurement of the location center. Specimens that are less
than 5 mm in diameter are usually suitable, as shown in Figure 3.4. When cutting test
specimens from larger samples of different polyethylene materials, one must be careful to
ensure that the physical characteristics of the polyethylene materials are not changed due to
extreme high temperatures. The surface of the test specimen must be smooth and free from
hollows to minimize the set up of the air bubbles upon immersion in the liquid; otherwise,
there will be errors in testing ( EN ISO 1183, 2004).
Figure 3.4: Test specimens for the density test

36
3.2.2 Density tests
Density is the ratio of the mass (m) of the sample to its unit volume V (at temperature T)
expressed in kg/m3, (g/cm3). Specific gravity is the measure of the ratio of the mass (m) of the
sample material at room temperature (23oC) to the same volume of water. Density
determination by Sartorius MSU224S-000-DU is a very precise method. The theoretical
density can be computed using the following equation (Wolfhart, 2014) :
ρ = W1/ [(W1+W2) -W3] × Density of ethanol (0.79 g/cm3) (3.1)
Where W1 is the mass (m) of the test specimen in air, W3 is the mass (m) of the Sartorius
MSU224S-000-DU containing ethanol, and W2 is the mass (m) of the Sartorius MSU224S-
000-DU containing the test specimen and ethanol. Using the above formula, the density was
measured ( EN ISO 1183, 2004), (Wolfhart, 2014). Density is often used to see differences in
the physical structure or composition of plastic materials. The density of plastic materials
often depends on the test specimen preparation method chosen. For this study, ISO 1183 was
used to determine the density of different polyethylene materials. The test was carried out on a
Sartorius MSU224S-000-DU materials testing machine, as shown in Figure 3.5, using the test
liquid (ethanol-C₂H₅OH) at room temperature (23°C). The test procedure for the density test
is as follows: the test specimen is weighted in air, then weighted immersed in liquid (ethanol-
C₂H₅OH) at room temperature (23oC) and the density is calculated.
The accuracy of the method for measuring the density depends on many factors, such as
apparatus (Repeatability ≤ ± 0.07 mg, Linearity ≤ ± 0.2 mg, Weighing capacity 220 g,
Readability 0.1 mg.), liquid bath (capable of being thermostatically controlled to within
±0,1°C or ±0,5°C, depending on the sensitivity required) and calibrated glass floats (covering
the density range in which measurements are to be made and approximately evenly distributed
throughout this range. Determine the exact density of each glass float calibrated as above by
placing it in a mixture of two suitable liquids in the bath maintained at T ± 0,1°C, where T is
23°C or 27°C ( EN ISO 1183, 2004).
37
Figure 3.5: Sartorius MSU224S-000-DU materials testing machine
3.3 Tensile Testing
3.3.1 Sample preparation
The preparation of the test specimens for the tensile test includes cutting die from a sheet of
the raw material and then using the milling machine MOD 1643 (Figure 3.6) according to the
operation instructions.
Figure 3.6: Operation of the milling machine MOD 164

38
The thicknesses of the polyethylene materials used for test specimens are 8mm and 12.7 mm
according to ISO 527. The specimen and the dimensions are illustrated in Figure 3.7. The
dimensions and tolerance standards are shown in Table 3.5. The usual specimen shape used
for tensile tests is the dog-bone. For the duration of the test, a uniaxial load is applied at both
ends of the specimen. The ratio of the nominal strain to the crosshead speed is used for the
original gauge length of the specimens ( EN ISO 527-2, 1996), (Standard ASTM D638 2008)
and (Shan et al., 2007).
Table 3.5: Specimen dimensions for the tensile test ( EN ISO 527-2, 1996)
Symbol Description Dimensions (mm)
l3 Overall length 200 5
l1 Length of narrow parallel-sided portion 60 0.5
r Radius 60
l2 Distance between broad parallel-sided
portions
106 to120
b2 Width at ends 20,0 0.2
b1 Width of narrow portion 10,0 ± 0,2
h Preferred thickness That of the sheet
L0 Gauge length 50,0 ± 0,5
L Initial distance between grips 115 ± 1

39
Figure 3.7: Sample prepared for the tensile test ( EN ISO 527-2, 1996)
3.3.2 Tensile test
Tensile tests measure the force required for a break and the extent of elongation or stretching
of the specimen. The stress-strain curves are produced based on the tensile tests and are used
to determine tensile modulus. The data acquired from the results of the tensile tests can help
identify the best materials and design equipment to survive the application of forces and make
an important contribution to the quality control of materials (EN ISO 527-2, 1996), (Wolfhart,
2014). In this study, the ISO 527-2 tensile test standard is used. The specimen is positioned in
the grips of the test machine, and then the grip is pulled and stretched to the failure point. The
speed is determined in ISO 527-2 for the material requirement, and the tensile modulus and
elongation are determined by an extensometer. The test was carried out on the Testometric
M500-100 AT Universal testing machine, an advanced materials testing machine that uses a
wide range of testing applications up to (100) kN. The Testometric materials testing machine
has a twin column with a maximum crosshead movement of 1050 mm and is connected to a
computer as shown in Figure 3.8. Tensile tests for plastics enable the measurement of:
Tensile strength at yield point
Tensile modulus
Tensile strain

40
Elongation and percent of elongation at break
Elongation and percent of elongation at yield
The calculation and expression of the results of the stress at yield on the basis of the initial
cross-section area of the test specimen polyethylene materials were done using the following
equation:
o
F =
A (3.2)
The calculation of the elongation and percent elongation from yield was done using the
following equation:
o
o
l - l = ×100
l (3.3)
All the data produced is beneficial for research and development and for qualitative
characterization. Thus, all the factors must be carefully controlled to obtain accurate relative
results ( EN ISO 527-2, 1996), (Standard ASTM D638, 2008). The tensile behaviour of semi-
crystalline materials is analysed at dissimilar strain rates at a wide range of temperatures from
23 to 120oC (Gomez et al., 2012).
Figure 3.8: Testometric M500-100 AT universal testing machine

41
3.4 Flexural Testing
3.4.1 Sample preparation
The test specimens were cut from sheets and the actual dimensions used in calculations were
measured in accordance with test methods ISO 178. The dimensions of the specimens of the
solid polyethylene must be measured accurately; all dimensions are important in determining
the actual results for the different properties of the tests as shown in Figure 3.9. A variety of
specimen shapes can be used for tests, but for ISO 178 a specific type of specimen is
described. The dimensions of the preferred test specimen are:
Length, l: 80 2 mm
Width, b: 10.0 0.2 mm
Thickness, h: 4.0 0.2 mm
When it is undesirable or impossible to use the preferred test specimen, other test specimens
can be used. The following limits will apply. The length and thickness of the test specimen
must have the same measurements as the preferred test specimen, i.e.
l
= 20 ± 2h
(3.4)
The width of the specimen is given in Table 3.6.
Table 3.6: Values of the test specimen width b in relation to thickness h (ISO 178, 2001)
Nominal thickness h Width b
1 3 25 5
3 5 10.0 5
5 10 15.0 5
10 20 20.0 5
20 35 35 5
35 50 50.0 5

42
The size (in mm) of the polyethylene specimens used for this study is:
Length, l: 200 2 mm
Width, b: 20 0.2 mm
Thickness, h: 12.7 0.2 mm
The sizes of the high-density polyethylene and the ultra-high molecular weight polyethylene
specimens used in the study are:
Length, l: 100 2 mm
Width, b: 15 0.2 mm
Thickness, h: 8 0.2 mm
The polishing of the test specimens must be done in only one direction because the values
achieved on the specimens with machined surfaces may differ from those achieved on the
specimens with the original surfaces of the sheets (ISO 178, 2001), (ASTM D790 1997).
Figure 3.9: A 3D view of the flexural test sample
3.4.2 Flexural test
Flexural test methods were employed for the determination of the flexural properties of the
type of polyethylene materials used in this study. Flexural test techniques are usually
applicable to both semi-rigid and rigid polyethylene materials (ASTM D790, 1997). These
flexural test methods are applied using the three point loading organization appropriate for a
simple supported test beam. In this study, the ISO 178 flexural test standard was followed for
testing specimens of rigid polyethylene materials. The specimens were tested on the WP
300.04 bending device, a materials testing machine that has a maximum load range for testing

43
applications up to (20) kN. The specimen was positioned on the two supports and the central
loading edge must be arranged as shown in Figure 3.10.
Figure 3.10: WP 300.04 bending device (Tangkasanugerah, C., 2014)
The test speed is the rate of relative movement between the two supports and the loading edge.
The two supports and the midway loading edge must be arranged as illustrated in Figure 3.11.
The two supports and the midway loading edge must be parallel to within mm in excess
of the width of the test specimen.
Figure 3.11: Position of test specimen at the start of the test (ISO 178, 2001)

44
The calculation and expression of the results of the flexural test on polyethylene materials
regarding such parameters as flexural stress ( ) are done using the following equation:
2
3
2
FL
bh (3.5)
For the parameter of flexural strain ( ƒ ), the following equation is used:
ƒ 2
= 6sh
L (3.6)
The calculation of the flexural modulus ( ƒE ) is done using the following equation:
ƒ
ƒ
E
(3.7)
The bending specimen was investigated and the relationship between the load and the elastic
deformation was evaluated (ISO 178, 2001).

45
CHAPTER 4
RESULTS AND DISCUSSION
4.1 Density Test
Density tests were performed in the construction and housing laboratory of Slemani according
to the procedure outlined in ISO 1183. The machine used in the study was a Sartorius
MSU224S-000-DU. The dry weight of each sample was measured on an electronic balance of
the Sartorius MSU224S-000-DU. The samples were then weighed and submerged in Ethanol,
C₂H₅OH with a density of Ethanol is 0.79 g/cm3.
Three specimens with diameters of less than 5 mm were tested at each step and the average
values were considered. The density values of the polyethylene (PE), high density
polyethylene (HDPE) and ultra-high molecular weight polyethylene (UHMWPE) for each test
in this study are provided in Tables 4.1, 4.2 and 4.3 respectively. In addition, the densities of
polyethylene (PE), high density polyethylene (HDPE) and ultra-high molecular weight
polyethylene (UHMWP) were in the range of 0.940-0.960 g/m3.
Table 4.1: Results of the density measurements for PE
Test No.
(PE)
Mass in air
W1 (g)
Mass in liquid
W3 (g)
Liquid density
(g/cm3)
Density
(g/cm3)
1 0.1078 0.0186 0.79 0.955
2 0.1096 0.0192 0.79 0.958
3 0.1070 0.0185 0.79 0.955
Average 0,1081 0.0187 0.79 0.956
The average of the three densities measured for PE (0.956 g/cm3) here appeared to be greater
than is given by the ISO 1183 standard (0.950 g/cm3) seen in Table 3.2.

46
Table 4.2: Results of the density measurements for HDPE
Test No.
(HDPE)
Mass in air
W1 (g)
Mass in liquid
W3 (g)
Liquid density
(g/cm3)
Density
(g/cm3)
1 0.1015 0.0180 0.79 0.960
2 0.1052 0.0160 0.79 0.932
3 0.1071 0.0180 0.79 0.950
Average 0,1046 0.0173 0.79 0.947
The average of the three densities measured for HDPE (0.947 g/cm3) here was found to be
below the value (0.955 g/cm3) given by the ISO 1183 standard seen in Table 3.3, but still
within the range of values (0.941 - 0.959 g/cm3) stated in the ATEM and industrial
polyethylene density standard seen in Table 3.1.
Table 4.3: Results of the density measurements for UHMWPE
Test No.
(UHMWPE)
Mass in air
W1 (g)
Mass in liquid
W3 (g)
Liquid density
(g/cm3)
Density
(g/cm3)
1 0.1018 0.0159 0.79 0.936
2 0.1053 0.0175 0.79 0.947
3 0.1009 0.0167 0.79 0.947
Average 0.1026 0.0167 0.79 0.943
The average of the three densities measured for UHMWPE (0.943 g/cm3) here was greater
than the value given in the ISO 1183 standard (0.930 g/cm3) in Table 3.4 but less than the
range of values (0.960 g/cm3 and above) of the ATEM and industrial polyethylene density
standard seen in Table 3.1.

47
4.2 Tensile Test
Tensile tests were performed in the central construction and housing laboratories of the
Slemani Polyethylene Lab unit according to the procedure outlined in ISO 527-2. A universal
testing machine 0500-10084 – Testometric was used. A50.0 kN head load with 10.0 N
pretension and 50 mm gauge length was used for the test. The crosshead speed was fixed at
25.0 mm/min in all the experiments with PE, and 50.0 mm/min in all the experiments with
HDPE and UHMWPE. The dimensions of the specimens for PE were 10 mm in width, 200
mm in length and 12.7 mm in thickness. While the HDPE and UHMWPE samples had the
same width and length as PE, they had a thickness of 8 mm.
Young’s modulus (E), tensile strength at yield (σS), strain (ε), elongation at yield (εS) and
elongation at break (εR) were measured. Five specimens were tested at each step and the
average values were considered. The mechanical properties of the PE, HDPE and UHMWPE
samples are listed in Tables 4.4, 4.5 and 4.6 respectively.
The stress-strain curves of the PE, HDPE and UHMWPE samples are shown in Figures 4.1,
4.2 and 4.3, respectively. The stress-strain curves of PE and HDPE displayed ductile failure.
The stress-strain curve of UHMWPE differed dramatically from those of PE and HDPE since
it showed less failure behaviour.
As shown in Figures 4.1 and 4.2, an elastic deformation occurred in the PE and HDPE
materials. The covalent bonds in the molecular chain were distorted and stretched. In the PE
and HDPE materials, plastic deformation occurred when a stress forced maximum yield
strength. Chains undergoing plastic deformation stretch, slide, rotate, and untangle under force
to the point of permanent deformation. The stress-strain curve of UHMWPE shows that the
relationship between stress and strain is proportional to the strain increase when the stress
increases until it reaches the yield point. However, elastic deformation occurred and plastic
deformation did not, as shown in Figure 4.3.
As seen in Figures 4.4 and 4.5, ductile tensile failure can be observed as necking
(deformation) in the samples of PE and HDPE materials, where the behavior is influenced by
the nature of the covalent bonds in the molecular chain of those materials. The strain of

48
UHMWPE increased proportionally when the stress increased and necking did not occur, but
the thickness of the gauge length of the sample continued to thin down until it broke. The
brittle failure of the UHMWPE was different from the ductile failure of the PE and HDPE.
The UHMWPE material had a clean break with little deformation and a smooth fracture which
appeared on the surface as shown in Figure 4.6.
Figure 4.1: Stress-strain curve of PE obtained from sample 1 in Table 4.4
Figure 4.2: Stress-strain curve of HDPE sample 1 in Table 4.5

49
Figure 4.3: Stress-strain curve of UHMWPE sample 1 of Table 4.6
Table 4.4: Results of tensile test for PE
Test No.
(PE)
Tensile
strength at
yield (σy)
(MPa)
Tensile
strength(σS)
(MPa)
Strain
(ε)
Elongation
at yield
(εS)
Elongation
at break
(εR)
Young’s
Modulus
(E)
(MPa)
1 28.261 28.261 395.131 6.902 690.262 937.762
2 28.365 28.365 386.700 6.734 673.4 733.514
3 28.191 28.191 394.022 6.880 688.044 951.369
4 28.371 28.371 394.735 6.894 689.47 805.621
5 28.159 28.159 392.833 6.856 685.666 718.938
Average 28.268 28.268 392.684 6.853 685.368 829.440
The average of the five tensile strength values for PE (28.268 MPa) here appeared to be
greater than is given by the ISO 527 standard (27 MPa), as seen in Table 3.2. The average of
the five elongation at yield values for PE (6.853 %) here appeared to be lower than is given by
the ISO 527 standard (9%), as can be seen in Table 3.2. The average of the five elongation at

50
break values for PE (685.368) here appeared to be lower than is given by the ISO 527
standard (>700), as seen in Table 3.2.
Table 4.5: Results of tensile test for HDPE
Test No.
(HDPE)
Tensile
strength at
yield (σy)
(MPa)
Tensile
strength(σS)
(MPa)
Strain
(ε)
Elongation
at yield
(εS)
Elongation
at break
(εR)
Young’s
Modulus(E)
(N/mm2)
1 22.544 22.544 394.391 6.887 688.782 655.462
2 22.456 22.456 395.393 6.907 690.786 674.823
3 22.531 22.531 396.706 6.934 693.412 681.591
4 22.606 22.606 393.480 6.869 686.968 667.635
5 22.718 22.718 395.727 6.914 691.454 674.678
Average 22.571 22.571 395.139 6.902 690.280 670.849
The average of the five tensile strength values for HDPE (22.571 MPa) here was found to be
above the value (25 MPa) given by the ISO 527 standard, as seen in Table 3.3. The average of
the five elongation at yield values for HDPE (6.902 %) here appeared to be lower than is
given by the ISO 527 standard (9%), as shown in Table 3.3. The average of the five Young’s
Modulus values for HDPE (670.849 MPa) here appeared to be lower than is given by the ISO
527 standard (1241 MPa), as can be seen in Table 2.4.

51
Table 4.6: Results of tensile test for UHMWPE
Test No.
(UHMWPE)
Tensile
strength at
yield (σy)
(MPa)
Tensile
strength
(σS),(MPa)
Strain
(ε)
Elongation
at yield
(εS)
Elongation
at break
(εR)
Young’s
Modulus(E)
(MPa)
1 20.287 28.591 336.978 5.739 573.956 422.595
2 20.600 28.038 319.163 5.383 538.326 492.038
3 20.500 27.307 297.411 4.948 494.822 464.078
4 20.530 28.845 305.958 5.119 511.916 493.391
5 20.560 27.731 306.633 5.132 513.916 501.837
Average 20.500 28.102 313.228 5.264 526.587 474.787
The average of the five tensile strength at yield values for UHMWPE (20.500 MPa) was
greater than the value given in the ISO 527 standard (17 MPa) seen in Table 3.4. Nevertheless,
the average of the five elongation at yield values for UHMWPE (5.264%) appeared to be
lower than is given by the ISO 527 standard (11%), as can be seen in Table 3.4. The average
of the five Young’s Modulus values for UHMWPE (474.787 MPa) appeared to be lower than
is given by the ISO 527 standard (689 MPa), as shown in Table 2.4.
4.3 Flexural Test
The flexural tests were performed in the laboratories of Slemani Polytechnic University
according to the procedure outlined in ISO 178. The flexural tests were performed on a
universal testing WP 300.04 Bending Device (25.0 kN head load) machine with a 3 point
bend fixture. The specimen dimensions for PE were 20 mm in width, 200 mm in length and
12.7 mm in thickness, while the HDPE and UHMWPE were 15 mm in width, 100 mm in
length and 8 mm in thickness. Five specimens were tested at each step and the average values
were considered.
The force-deflection curves for PE, HDPE and UHMWPE are presented in Figures 4.7, 4.8
and 4.9 respectively. Force-deflection curves showed that the deflection in the beam in the PE,

52
HDPE, and UHMWPE increases with an increase in the force until the point where
deformation occurs and becomes permanent – (0.21, 9.77), (0.16, 5.01) and (0.13, 5.12)
respectively.
The flexural properties of strength, strain and modulus for PE, HDPE, and UHMWPE are
demonstrated in Tables 4.7, 4.8 and 4.9. The flexural strength of the PE, HDPE, and
UHMWPE samples was measured to find each material’s stiffness. Flexural strength was
determined by the maximum force that a PE, HDPE, and UHMWPE material could withstand
before it broke or yielded. Yield means that a material is past its recoverable deformation, so it
will no longer go back to the original shape.
Figures 4.10, 4.11, and 4.12 show the flexural test specimens of PE, HDPE, and UHMWPE
respectively. From the start before the yield point of the material, no visible flexion is
observed and a load is mostly carried by the lamellae of the amorphous and crystalline
regions. The flexural developments of the load also increase and a yield point occurs. The
yield is the deformation, it is the combination of the amorphous phase reorganizing itself and
the lamellae of the crystal sliding past each other, but each separate crystal itself remains
unbroken.
Figure 4.7: Force-deflection curve of PE for sample 1 of Table 4.7

53
Figure 4.8: Force-deflection curve of HDPE for sample 1 of Table 4.8
Figure 4.9: Force-deflection curve of UHMWPE for sample 1 of Table 4.9

54
Table 4.7: Results of flexural test for PE
Test No.
(PE)
Force
(kN)
Deflection
(s)
(mm)
Flexural
strength (σf)
(MPa)
Flexural
strain
(εf)
Flexural
Modulus (Ef)
(MPa)
1 0.21 9.77 19.53 0.0186 1050
2 0.22 10.12 20.46 0.0192 1065
3 0.18 9.2 16.74 0.0175 956
4 0.17 6.9 15.81 0.0131 1206
5 0.2 9.53 18.60 0.0181 1027
Average 0.19 9.10 17.67 0.0173 1021
The average of the five flexural strength values for PE (17.67 MPa) appeared to be less than is
given by the ISO 178 standard (22 MPa) seen in Table 3.2.
Table 4.8: Results of flexural test for HDPE
Test No.
(HDPE)
Force
(kN)
Deflection
(s)
(mm)
Flexural
strength (σf)
(MPa)
Flexural
strain
(εf)
Flexural
Modulus
(MPa)
1 0.16 5.01 25 0.024 1041
2 0.17 4.31 26.56 0.020 1328
3 0.16 4.09 25 0.019 1315
4 0.15 5.2 23.43 0.024 976
5 0.16 4.75 25 0.022 1136
Average 0.16 4.67 25 0.022 1136
The average of the five flexural modulus values for HDPE (1136 MPa) was found to be within
the range of values (1000 -1400 MPa) given by the ISO 178 standard (Table 3.3).

55
Table 4.9: Results of flexural test for UHMWPE
Test No.
(UHMWPE)
Force
(kN)
Deflection
(s)
(mm)
Flexural
strength (σf)
(MPa)
Flexural
strain
(εf)
Flexural
Modulus
(MPa)
1 0.13 5.12 20.31 0.024 846
2 0.12 3.61 18.75 0.017 1102
3 0.12 4.35 18.75 0.020 937
4 0.11 4.61 17.18 0.022 780
5 0.11 3.82 17.18 0.018 954
Average 0.118 4.30 18.43 0.020 921
The average of the five flexural modulus values for UHMWPE (921 MPa) appeared to be
greater than the 800 MPa given by the ISO 178 standard (Table 3.4).
Figure 4.10: A test sample of PE before and after the flexural test
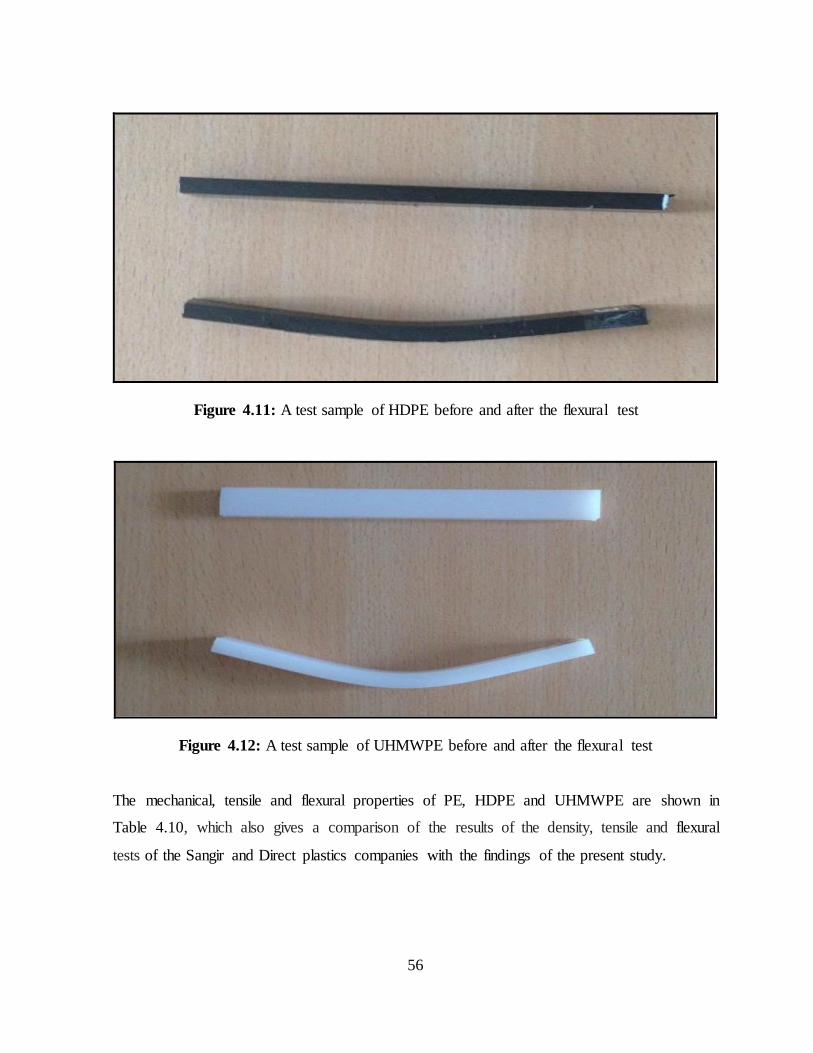
56
Figure 4.11: A test sample of HDPE before and after the flexural test
Figure 4.12: A test sample of UHMWPE before and after the flexural test
The mechanical, tensile and flexural properties of PE, HDPE and UHMWPE are shown in
Table 4.10, which also gives a comparison of the results of the density, tensile and flexural
tests of the Sangir and Direct plastics companies with the findings of the present study.

57
Table 4.10: Comparison of tensile and flexural properties of PE and HDPE and UHMWPE
with the supplier’s data
Material Property Standard Units PE HDPE UHMWPE
Density (ρ)1
Density (ρ)2
ISO 1183
ISO 1183
g/cm3
g/cm3
0. 956
0. 950
0. 947
0.955
0.943
0.930
Tensile strength at yield (σS) 1
Tensile strength at yield (σS)2
ISO 527
ISO 527
MPa
MPa
28.268
27
22.571
25
20.500
17
Elongation at yield (εS)1
Elongation at yield (εS)2
ISO 527
ISO 527
%
%
9
6.853
9
6.902
11
5.264
Elongation at break (εR)1
Elongation at break (εR)2
ISO 527
ISO 527
-
-
685.368
≥ 600
690.280
≥ 600
526.587
≥ 500
Young’s Modulus (E)1
Young’s Modulus (E)2
ISO 527
ISO 527
MPa
MPa
829.440
1150
670.849
1000
474.787
700
Flexural strength (σf)1
Flexural strength (σf)2
ISO 178
ISO 178
MPa
MPa
17.67
22
25
-
18.43
-
Flexural modulus (Ef)1
Flexural modulus (Ef)2
ISO 178
ISO 178
MPa
MPa
1021
-
1136
1000-
1400
921
800
1 present work 2 Direct Plastic& Anon, 2014

58
The polyethylene materials at higher density and molecular weight became more rigid and
reduced the elongation at break (Rosa et al., 2005). The basic molecular weight in different
solid polyethylene materials has a major influence on certain mechanical properties (Imbeni et
al., 2001).
A comparison of the results for different polyethylene samples shows that the mechanical,
tensile and flexural properties of PE were generally higher than those of HDPE and
UHMWPE. As shown in Table 4.10, there is some discrepancy between the results of the
present study and the Sangir and Direct plastics companies’ data, as well as that of ISO 527
and 178. This discrepancy may have arisen due to the choice of parameters for the tensile,
density and flexural tests, such as ambient temperature, humidity, dimensional compliance
and size of specimen (Gabauer, 2000).
The results of flexural testing are influenced by such factors as contact stress, wedging stress,
beam twisting and friction at beam contact points and load dislocation. The roles of corner
chamfers and load readout errors cannot be neglected either. Another error can result from
increasing the load manually (Baratta et al., 1987). The sensor of the machine test shows a
high sensitivity to flexion, so manually increasing the load in this test is also undesirable
(Kuang et al., 2002).
59
CHAPTER 5
CONCLUSIONS AND RECOMMENDATIONS
5.1 Conclusions
In this work, the density, tensile and flexural properties of three polyethylene types, namely,
PE, HDPE and UHMWPE were investigated. The physical and mechanical properties of
polyethylene were measured using three different tests (density, tensile and flexural test) and
compared with the results of previous studies.
The densities of PE (0.956 g/cm3), HDPE (0.947 g/cm3) and UHMWPE (0.943 g/cm3) were
found. The tensile strengths at yield of PE, HDPE and UHMWPE were 20.500 MPa, 22.571
MPa and 28.102 MPa, respectively, while elongations at break were 685.368%, 690.280% and
526.587%. Flexural strengths were 17.67 MPa, 25 MPa and 18.43 MPa for PE, HDPE and
UHMWPE, respectively. The flexural modulus of PE was 1021 MPa, while those of HDPE
and UHMWPE were 1136 MPa and 921 MPa, respectively, were also found.
While the densities of PE (0.950 g/cm3), HDPE (0.955 g/cm3) and UHMWPE (0.930 g/cm3),
were given by the supplier’s data of these materials. The tensile strengths at yield of PE (27
MPa), HDPE (25 MPa) and UHMWPE (17 MPa) and the elongations at break of PE (≥ 600),
HDPE (≥ 600) and UHMWPE (≥ 500). The flexural strength of PE (22 MPa), then the
flexural modulus HDPE (1000-1400 MPa) and UHMWPE (800 MPa), were given by the
supplier’s data of these materials.
It was found that density has an effect on the tensile strength at yield, elongation at break,
Young’s modulus and flexural strength of PE, HDPE and UHMWPE. Tensile strength at yield
and Young’s modulus increased, but flexural strength decreased as the density of polyethylene
increased. Elongation at yield and elongation at break decreased with the increase in the
molecular weight of the polyethylene materials.
The results showed that when compared to the other types of plastics, the stress-strain curve of
UHMWPE revealed a different nature. Unlike a typical thermoplastic polymer, it has a higher

60
tensile strength in the fracture region. The stress-strain curves of PE and HDPE displayed
ductile failure. The stress-strain curve of UHMWPE showed less failure occurred.
5.2 Recommendations
Based on the results of the study, the following recommendations for future research can be
made:
A full range of mechanical properties should be presented, for example, hardness and
impact tests can be conducted for PE, HDPE, and UHMWPE.
Efforts should be made to improve the determination of tensile strength at break for
polyethylene and high density polyethylene test specimens. As for the shorter test
specimen, an investigation should be carried out to determine tensile strength at break
because the shorter test specimen would reach full extension and fracture more readily.
Identifying the differences between the mode of stress-strain curves of UHMWPE and
other types of polyethylene would also be a useful direction for future studies to take.

61
REFERENCES
Abood, A., Saleh, A. , Ali, A., & Humood, L. (2011). Low cycle fatigue of different polymer
types PA, PVC and POM. 2-4.
Akay, M. (2012). Introduction to Polymer Science and Technology. Bookboon.
Alvarado-Contreras, J. A., Polak, M. A., Penlidis, A., & Cheng, J. J. (2010). Chain
entanglements and mechanical behavior of high density polyethylene. Journal of
engineering materials and technology, 1, 132.
Ambuken, P. V., Stretz, H. A., Koo, J. H., Messman, J. M., & Wong, D. (2014). Effect of
addition of montmorillonite and carbon nanotubes on a polyurethane High temperature
thermo mechanical properties. Polymer Degradation and Stability, 102, 160-169.
Anon (2015). corporate-brochure. Retrieved from www.sangir.com:
http://www.sangir.com/images/corporate-brochure (24 Jen.2015).
Askeland, D., Fulay, P., & Wright, W. (Stamford). The science and engineering of materials
(Sixth Edition ed.). 2011: Cengage Learning.
Astle, M. J., & Beyer, W. H. (1988). CRC handbook of chemistry and physics. CRC press.
ASTM Subcommittee D20. 10 on Mechanical Properties. (1997). Standard test methods for
flexural properties of unreinforced and reinforced plastics and electrical insulating
materials. American society for testing materials, 1-16.
Baratta, F. I., Matthews, W. T., & Quinn, G. D. (1987). Errors Associated With Flexure
Testing Of Brittle Materials (No. Mtl-Tr-87-35). Army Lab Command Watertown Ma
Materialtechnology Lab.
Bartczak, Z., Cohen, R. E., & Argon, A. S. (1992). Evolution of the crystalline texture of
high-density polyethylene during uniaxial compression. Macromolecules, 25(18),
4692-4704.

62
Bensason, S., Minick, J., Moet, A., Chum, S., Hiltner, A., & Baer, E. (1996). Classification of
homogeneous ethylene–75 ehavi copolymers based on comonomer content. Journal of
Polymer Science, 1301–1315.
Brostow, W., & Corneliussen, R. D. (1986). Failure of plastics. Hanser Pub.: Distributed in
the United States of America by Macmillan Pub..
Brunner, L. M. (2006). Ultra-high wear resistant polyethylenes (Doctoral dissertation, Ph. D.,
Thesis, ETH Zürich).
Callister, W. D., & Rethwisch, D. G. (2007). Materials science and engineering: an
introduction (Vol. 7, pp. 665-715). New York: Wiley.
Contreras, J. A. ( 2007). Micromechanical modelling of polyethylene. 15,16
Cheng, J. J. (2008). Mechanical and chemical properties of high density polyethylene: Effects
of microstructure on creep characteristics (Doctoral dissertation, University of
Waterloo).
Clarke Circle, F. J. (2011, JUNE 7). Educational Innovations. Retrieved from HEA-500
Thermoplastic Polymer.
Dahotre, N. B., & Harimkar, S. P. (2008). Laser fabrication and machining of materials (Vol.
51). New York: Springer.
Dasgupta, S., Hammond, W. B., & Goddard, W. A. (1996). Crystal structures and properties
of nylon polymers from theory. Journal of the American Chemical Society, 118(49),
12291-12301.
Direct plastics. (2014). HDPE Sheet – Direct Plastics Limited. Retrieved from
http://www.directplastics.co.uk/hdpe-sheet (Accessed 18 Dec. 2014).
Direct plastics. (2014). UHMWPE Sheet – Direct Plastics Limited. Retrieved from
http://www.directplastics.co.uk/uhmwpe-sheet (Accessed 18 Dec. 2014).

63
EN ISO 1183. (2004). Plastics — Methods for determining the density of non-cellular
plastics. 1-7.
EN ISO 178. (2003). Plastics Determination of flexural properties. 2-17.
EN ISO 527-2. (1996). Plastics- Determination of tensile properties. 4-8
Gabauer, W. (2000). Manual of Codes of Practice for the Determination of Uncertainties in
Mechanical Tests on Metallic Materials. (U. Cop, Ed.) the Estimation of Uncertainties
in Hardness Measurements, Project, 14.
Gabriel, L. H., & Moran, E. T. (1998). Service life of drainage pipe. Transportation Research
Board.
Hamerton, I., Howlin, B. J., & Yeung, S. Y. (2014). Studying structure–property relationships
in oligomeric engineering thermoplastics by controlled preparation of low molecular
weight polymers. Reactive and Functional Polymers, 81, 22-32.
Harris, J., Wang, A., Stark, C., & Doubleton. (1996). Mechanistic and morphological origins
of ultra-high molecular weight polyethylene wear debris in total joint replacement
prostheses. Proceedings of the Institution of Mechanical Engineers, Part H: Journal of
Engineering in Medicine, 210(3), 141-155.
Hiemenz, P. C. (1984). Polymer chemistry: the basic concepts. CRC press.
Hourston, D. J. (2010). Degradation of Plastics and Polymers. Degradation of polymers, 6-7.
Hughes, F., Prudom, A., & Swallowe, G. (2013). The high strain-rate 76 behavior of three
molecular weights of polyethylene examined with a magnesium alloy split-Hopkinson
pressure bar. Polymer Testing, 32(5), 827-834.
Imbeni, V., Martini, C., Lanzon, E., Poli, G., & Hutchings, I. M. (2001). Tribological 77
behavior of multi- layered PVD nitride coatings. Wear, 251, 997-1002.
ISO, U. (1993). 178: 2003. Plastics. Determination of flexural properties. (ISO 178: 2001).

64
Janssen, R., Meijer, I. H., Govaert, I. L., Schellekens, I. R., & Schrauwen, I. B. (2002).
Deformation and failure in semicrystalline polymer systems (Doctoral dissertation,
Master thesis, Eindhoven University of Technology).
Jensen, W. B. (2008). The origin of the polymer concept. Journal of Chemical Education 85,
no. 5: 624.
Jones, D. R., & Ashby, M. F. (2005). Engineering Materials 2: An Introduction to
Microstructures, Processing and Design. Butterworth-Heinemann.
Kadajji, V. G., & Betageri, G. V. (2011). Water soluble polymers for pharmaceutical
applications. Polymers, 3, 1972-2009.
Kailas, S. V. (2011). Applications and Processing of Polymers. In Material Science.
Kalpakjian, S., & Schmid, S. R. (2010). Manufacturing processes for engineering materials.
(5, Ed.) Pearson education.
Khonakdar, H. A., Morshedian, J., Wagenknecht, U., & Jafari, S. H. (2003). An investigation
of chemical crosslinking effect on properties of high-density polyethylene. Polymer,
44, 4301-4309.
Klein, R. (2013). Laser welding of plastics. John Wiley & Sons.
Kong, Y., & Hay, J. N. (2002). The measurement of the crystallinity of polymers by DSC.
Polymer, 43(14), 3873-3878.
Koutsos, V. (2009). Polymeric materials: an introduction. ICE Manual of Construction
Materials, 571-577.
Kuang, K. S., Cantwell, W. J., & Scully, P. J. (2002). An evaluation of a novel plastic optical
fiber sensor for axial strain and bend measurements. Measurement Science and
Technology, 22(4), 1523.

65
Lipatov, Y. S., Dudarenko, G. V., Chornaya, V. N., & Todosiichuk, T. T. (2008). Change of
molecular weight distribution of polymers by adsorption from binary and solutions.
Colloids and Surfaces A: Physicochemical and Engineering Aspects, 326(1), 53-60.
Madi, N. K. (2013). Thermal and mechanical properties of injection molded recycled high
density polyethylene blends with virgin isotactic polypropylene. Materials & Design,
46, 435-441.
Maria, A. P., Alexander , P., & Cheng, J. J. (2008). A tensile strain hardening test indicator of
environmental stress cracking resistance. Journal of Macromolecular Science®, Part
A: Pure and Applied Chemistry, 45.(8), 599-611.
Meijer, H. E., & Govaert, L. E. (2005). Mechanical performance of polymer systems: the
relation between structure and properties. Progress in polymer science, 30, 915-938.
Mitchell, B. S. (2004). An introduction to materials engineering and science for chemical and
materials engineers. John Wiley & Sons.
Nelson, P. G. (2011). Introduction to inorganic chemistry. Bookboon.
Nicholson, L. M., Whitley, K. S., Gates, T. S., & Hinkley, J. A. (1999). How molecular
structure affects mechanical properties of an advanced polymer. In International
Sample Symposium and Exhibition. Sample Society for the Advancement of Material,
794-808.
Pal, K., Bag, S., & Pal, S. (2005). Development and coating of porous ultra-high molecular
weight polyethylene plates. Trends Biomater Artif Organs, 19(1), 39-45.
Peterlin, A. (1965). Crystalline character in polymers. In Journal of Polymer Science Part C:
Polymer Symposia, 9(1), 61-89.
Polak, M. A., Penlidis, A., & Cheng, J. J. (2011). Influence of micro molecular structure on
environmental stress cracking resistance of high density polyethylene. Tunnelling and
Underground Space Technology, 26(4), 582-593.

66
Priscilla, L. (2010). The Polyethylene Manufacturing Process. The Manufacture Of
Polyethylene, 1-4.
Ray, I., Roy, S., & Khastgir, D. (1993). Interaction between ethylene vinyl acetate copolymer
and polyethylene. Polymer Bulletin, 30(6), 685-689.
Rinnbauer, M. (2014). Testing of Elastomers. Encyclopedia of Lubricants and Lubrication,
2050-2052.
Roding, M., Bernin, D., Jonasson, J., Sarkka, A., Topgaard, D., Rudemo, M., & Nyden, M.
(2012). The gamma distribution model for pulsed-field gradient NMR studies of
molecular-weight distributions of polymers. Journal of Magnetic Resonance, 222,
105-111.
Rosa, D. S., Guedes, C. G., & Casarin, F. (2005). Mechanical Behavior and Biodegradation of
Poly (ε-caprolactone)/Starch Blends with and without Expansor. Polymer Bulletin,
54(4-5), 321-333.
Shan, G. F., Yang, W., Yang, M. B., Xie, B. H., Feng, J. M., & Fu, Q. (2007). Effect of
temperature and strain rate on the tensile deformation of polyamide 6. Polymer,
48(10), 2958-2968.
Sinha, S. K. (2006). Scratching of materials and applications (Vol. 51). Elsevier.
Spangenberg, J. E. (2012). Caution on the storage of waters and aqueous solutions in plastic
containers for hydrogen and oxygen stable isotope analysis. Rapid Communications in
Mass Spectrometry, 26(22), 2627-2636.
Sperling, L. H. (2005). Introduction to physical polymer science. John Wiley & Sons.
Standard, A. T. (2008). D638: Standard Test Method for Tensile Properties of Plastics. ASTM
International, West Conchohocken.
Strong, A. B. (1996). Plastics Materials and Processing. New Jersey, Ohio: Prentice-
Hall, 675.

67
Tadmor, Z., & Gogos, C. G. (2006). Principles of polymer processing. John Wiley & Sons.
Tai, H. J. (2000). Molecular weight distribution in random crosslinking of polymer–
polyfunctional monomer systems. Polymer, 41(20), 7459-7469.
Tangkasanugerah, C. (2014, Dec 18 ). Profile – PT Tangkas Cite Anugerah. Retrieved from
http://www.tangkasanugerah.com.
Teyssedre, G., & Laurent, C. (2013). Advances in High-Field Insulating Polymeric Materials
over the Past 50 Years. IEEE electrical insulation magazine, 29(5), 26-36.
Urena, Y. R. C., Bettini, S. H. P., Munoz, P. R., Wittig, L., Rischka, K., & Lisboa-Filho, P. N.
(2015). In situ sonochemical synthesis of ZnO particles embedded in a thermoplastic
matrix for biomedical applications. Materials Science and Engineering: C, 49, 58-65.
Varela, J. C., Velo, M., Espinar, E., Llamas, J. M., Ruperez, E., Manero, J. M., & Javier Gil,
F. (2014). Mechanical properties of a new thermoplastic polymer orthodontic arch
wire. Materials Science and Engineering: C, 42, 1-6.
Wolfhart, H. (2015, Jen 22 ). Density and Specific Gravity ASTM D792, ISO 1183. Retrieved
from http://www.intertek.com/polymers/tensile-testing/astm-d638-iso-527 (22 Jen.
2015).
Wolfhart, H. (2015, Jen 22 ). Density and Specific Gravity ASTM D792,ISO 1183. Retrieved
from http://www.intertek.com/polymers/testlopedia/density-and-specific-gravity-astm-
d792 ( 22 Jen. 2015).
Zaharudin, N., Arief, Y. Z., Izzati, W. A., Adzis, Z., & Makmud, M. Z. (2012). UTM Inst. Of
High Voltage & High Current. In Power and Energy (PECon), 756-760.
Zumdahl, S. (2005). World of chemistry. Cengage Learning.

68
APPENDICES

69
APPENDIX 1
ISO Standards

70
BRITISH STANDARD
Plastics — Methods for
determining the
density of non-cellular
plastics —
Part 2: Density gradient column method
The European Standard EN ISO 1183-2:2004 has the status of a
British Standard
ICS 83.080.01
BS EN ISO 1183-2:2004
--̀
,,,,,,-̀
-̀,,̀
,,
,̀̀,,`---

71
BS EN ISO 1183-2:2004
National foreword
This British Standard is the official English language version of EN ISO 1183-2:2004. It is identical with ISO 1183-2:2004. It partially supersedes BS 2782-6:Methods 620A to 620D:1991. The UK participation in its preparation was entrusted to Technical Committee PRI/21, Testing of plastics, which has the responsibility to:
— aid enquirers to understand the text;
— present to the responsible international/European committee any
enquiries on the interpretation, or proposals for change, and keep the UK interests informed;
— monitor related international and European developments and
promulgate them in the UK.
A list of organizations represented on this committee can be obtained on request to its secretary.
Cross-references The British Standards which implement international or European publications referred to in this document may be found in the BSI Catalogue under the section entitled “International Standards Correspondence Index”, or by using the “Search” facility of the BSI Electronic Catalogue or of British Standards Online. This publication does not purport to include all the necessary provisions of a contract. Users are responsible for its correct application. Compliance with a British Standard does not of itself confer immunity from legal obligations.
Summary of pages This document comprises a front cover, an inside front cover, the EN ISO
title page, the EN ISO foreword page, the ISO title page, pages ii to iv, pages 1 to 10, an inside back cover and a back cover. The BSI copyright notice displayed in this document indicates when
the document was last issued.
Amendments issued since publication
This British Standard was
published under the authority Amd. No. Date Comments
of the Standards Policy and
Strategy Committee on
4 August 2004
© BSI 4 August 2004
ISBN 0 580 44210 1
--̀
,,,,,,-̀
-̀,,̀
,,
,̀̀,,`---
Copyright British Standards Institution Reproduced by IHS under license with BSI - Uncontrolled Copy No reproduction or networking permitted without license from IHS Not for Resale

72
EUROPEAN STANDARD
NORME EUROPÉENNE
EN ISO 1183-2
EUROPÄISCHE NORM July 2004
ICS 83.080.01
English version
Plastics - Methods for determining the density of non-cellular plastics - Part 2: Density gradient column method (ISO 1183-
2:2004)
Kunststoffe - Verfahren zur Bestimmung der Dichte von nicht
verschäumten Kunststoffen - Teil 2: Verfahren mit Dichtegradientensäule (ISO 1183-2:2004)
---
,̀,̀,,̀
,̀,,̀
-̀
CEN members are bound to comply with the CEN/CENELEC Internal Regulations which stipulate the conditions for giving this Euro pean -̀ ,,,,,,
Standard the status of a national standard without any alteration. Up -to-date lists and bibliographical references concerning such national -- standards may be obtained on application to the Central Secretariat or to any CEN member. This European Standard exists in three off icial versions (English, French, German). A version in any other language made by translation
under the responsibility of a CEN member into its ow n language and notif ied to the Central Secretariat has the same status as the off icial versions. CEN members are the national standards bodies of Austria, Belgium, Cyprus, Czech Republic, Denmark, Estonia, Finland, France, Germany, Greece, Hungary, Iceland, Ireland, Italy, Latvia, Lithuania, Luxembourg, Malta, Netherlands, Norw ay, Poland, Portugal, Slovakia, Slovenia, Spain, Sw eden, Switzerland and United Kingdom.
EUROPEAN COMMITTEE FOR STANDARDIZATION C O M I T É E U R O P É E N D E N O R M A L I S A T I O N E U R O P Ä I S C H E S K O M I T E E F Ü R N O R M U N G
Management Centre: rue de Stassart, 36 B-1050 Brussels
© 2004 CEN All rights of exploitation in any form and by any means reserved Ref. No. EN ISO 1183-2: 2004: E w orldwide for CEN national Members.
Copyright British Standards Institution Reproduced by IHS under license with BSI - Uncontrolled Copy No reproduction or networking permitted without license from IHS Not for Resale EN ISO 1183−2:2004
This European Standard was approved by CEN on 22 June 2004.
Plastiques - Méthodes de détermination de la masse volumique des plastiques non alvéolaires - Partie 2:
Méthode de la colonne à gradient de masse volumique (ISO 1183-2:2004)

73
I NESO 11-38:22( 400E)
Foreword
This document (EN ISO 1183-2:2004) has been
prepared by Technical Committee ISO/TC 61 "Plastics"
in collaborationwith Technical Committee CEN/TC 249
"Plastics", the secretariat of which is held by IBN.
This European Standard shall be given the status of a
national standard, either by publication of an identical text
or by endorsement, at the latest by January 2005, and
conflicting national standards shall be withdrawn at the
latest by January 2005.
According to the CEN/CENELEC Internal Regulations,
the national standards organizations of the following
countries are bound to implement this European
Standard: Austria, Belgium, Cyprus, Czech Republic,
Denmark, Estonia, Finland, France, Germany, Greece,
Hungary, Iceland, Ireland, Italy, Latvia, Lithuania, Luxembourg, Malta, Netherlands, Norway, Poland,
Portugal, Slovakia, Slovenia, Spain, Sweden,
Switzerland and United Kingdom.
Endorsement notice
The text of ISO 1183-2:2004 has been approved by
CEN as EN ISO 1183-2 2004 without any
modifications.
--̀
,,,,,,-̀
-̀,,̀
,,
,̀̀,,`---

74
EN ISO 1183−2:2004
INTERNATIONAL ISO
STANDARD 1183-2
First edition
2004-07-15
Plastics — Methods for determining
the density of non-cellular plastics —
Part 2:
Density gradient column method
Plastiques — Méthodes de détermination de la masse volumique
des plastiques non alvéolaires —
Partie 2: Méthode de la colonne à gradient de masse volumique
--`,,,,,,-`-`,,`,,`,`,,`---
Copyright British Standards Institution
Reproduced by IHS under license with BSI - Uncontrolled Copy
No reproduction or networking permitted without license from IHS Not for Resale

75
EN ISO 1183−2:2004 IS---3811
-̀,,̀,,̀
,̀,,̀
---
DPlcsid Fremia
ihTs PDF file may ctnoian emdebt dedyfepcaes. In ccaocnadrw eith A'ebods licensilop gnic,y this f ile mairp eb ynted iv row eb detu
slahl ton ide ebtlnu deess the typefaces w hice era hml era deddebicsnede to i dnanstlaled t noeh computfrep reormign tide ehtin.g In
w odlnidaot gnhis f ile, trapise atpecc tiereht nser ehnopsiiblity fo not infriigngn A'ebods licensilop gnic.y ehT ISO tneClar Secrteiraat
caceptl on siibality in this .aera Ai ebods a tredamafo kr Aebod SystemI sncotaropr.de
teDails fo teh softw acudorp erts sut deo crtaee this PDF file cna f ebi dnuon tlareneG eh Info leratit evo the f ile; tP ehDc -Frtaeion
marapterew setpo erimizde for irpnti.gn Evyre caer neeb sah taken to sneeru that the f ile is suitlbae fosu re yb ISO memdob rebeis. In
tlnu ehikletneve y ttah lborp aem leratit gno it is f,dnuo plsaee inform ttneC ehlar Secrteiraat ta the serddaig sleb nevw o.
© ISO 4002 All irthgs erse.devr lnUeto ssw rehise specif ied, on trap fo this lbupictaion maeb y cudorperro de tuilizi den yna form ro na ybm ynae,s
lecetrinoc ro mecinahcal, inclidung tohpcoiypodna gn micrfoilm, w ittuoh repmissii non w ritign from ietI rehSa Ot tsserdda eh ebolw or
IS'Os memreb i ydobn the cnuotrfo y ttseuqer ehe.r ISO cirypothg fofice saCe tsopale 65 eneG 1121-HC 02 av
leT. 4 + 10 947 22 1 11 xaF0 947 22 14 + 9 74 E-
mail [email protected] gr
We bwww.is.o gro Pulbisdehi n Sw itlrez dna
Copyright British Standards Institution Reproduced by IHS under license with BSI - Uncontrolled Copy No reproduction or networking permitted without license from IHS Not for Resale
© ISO– 4002 Allr ithgsr esedevr
EN ISO 1183−2:2004 IS-3811 O2:(4002E)
Contents Page Foreword............................................................................................................................... iv 1 Scope .......................................................................................................................................... 1 2 Normative references .................................................................................................................. 1 3 Terms and definitions.................................................................................................................. 1 4 Conditioning................................................................................................................................ 2 5 Method ........................................................................................................................................ 2 6 Test report................................................................................................................................... 4 Annex A (informative) Liquid systems suitable for density determinations ............................................. 6 Annex B (informative) Preparation of density gradient column................................................................ 7

76
EN ISO 1183−2:2004 IS-3811 O2:(4002E)
Foreword
ISO (the International Organization for Standardization) is a worldwide federation of national standards bodies
(ISO member bodies) . The work of preparing International Standards is normally carried out through ISO
technical committees. Each member body interested in a subject for which a technical committee has been
established has the right to be represented on that committee. International organizations, governmental and
non-governmental, in liaison with ISO, also take part in the work. ISO collaborates closely with the
International Electrotechnical Commission (IEC) on all matters of electrotechnical standardization.
International Standards are drafted in accordance with the rules given in the ISO/IEC Directives, Part 2.
The main task of technical committees is to prepare International Standards. Draft International Standards
adopted by the technical committees are circulated to the member bodies for voting. Publication as an
International Standard requires approval by at least 75 % of the member bodies casting a vote.
Attention is drawn to the possibility that some of the elements of this document may be the subject of patent
rights. ISO shall not be held responsible for identifying any or all such patent rights.
ISO 1183-2 was prepared by Technical Committee ISO/TC 61, Plastics, Subcommittee SC 5, Physical-
chemical properties.
--
Together with the other parts (see below), this part of ISO 1183 cancels and replaces ISO 1183:1987, which has been -̀ -
` , ,, , , , technically revised. ISO
1183` , ,` , ,` , `, , ` consists of the following parts, under the general title Plastics — Methods for determining the
---
density of non-cellular plastics:
Part 1: Immersion method, liquid pyknometer method and titration
method Part 2: Density gradient column method
Part 3: Gas pyknometer method
Copyright British Standards Institution Reproduced by IHS under license with BSI - Uncontrolled Copy No reproduction or networking permitted without license from IHS Not for Resale

77
ratio of the mass m of a sample to its volume V (at the temperature t) expressed in kg/m3, kg/dm3 (g/cm3), ---̀ ,,̀ ,,̀ ,̀ ,,̀ or
3.1 density
ρ
Plastics — Methods for determining the density of non-cellular plastics —
Part 2: Density gradient column method
WARNING — The use of this part of ISO 1183 may involve hazardous materials, operations or equipment. This part of ISO 1183 does not purport to address all of the safety problems, if any, associated with its use. It is the responsibility of the user of this part of ISO 1183 to establish appropriate health and safety practices and to determine the applicability of any regulatory limitations prior to use.
1 Scope
This part of ISO 1183 specifies a gradient column method for the determination of the density of non-cellular moulded or extruded plastics in void-free form. Density gradient columns are columns containing a mixture of two liquids, the density in the column increasing uniformly from top to bottom.
NOTE This part of ISO 1183 is applicable to pellets as long as they are void -free. Density is frequently used to follow variations in physical structure or composition of plastic materials. Density may also be useful in assessing the uniformity of samples or specimens. Often the density of plastic materials will depend upon the choice of specimen preparation method. When this is the case, precise details of the specimen preparation method will have to be included in the appropriate material specification.
2 Normative references
The following referenced documents are indispensable for the application of this document. For dated references, only the edition cited applies. For undated references, the latest edition of the referenced document (including any amendments) applies.
ISO 31-3, Quantities and units — Part 3: Mechanics
ISO 291, Plastics — Standard atmospheres for conditioning and testing
ISO 1183-1:2004, Plastics — Methods for determining the density of non-cellular plastics — Part 1: Immersion method, liquid pyknometer method and titration method
3 Terms and definitions
For the purposes of this document, the following terms and definitions apply.
INTENRATIONAL TSANDADR
EN ISO 1183−2:2004
IS-3811 O2:(4002E)

78
EN ISO 1183−2:2004 IS-3811 O2:(4002E)
Table 1 — Density terms
Term Symbol Formula tion Units
kg/m3
Density ρ m/V kg/dm3
(g/cm3
) kg/l (g/ml)
m3
/kg
Specific volume ν V/m (= 1/ρ) dm3
/kg (cm3
/g) l/kg (ml/g)
4 Conditioning
Conditioning and testing shall be in accordance with ISO 291 or the appropriate material standard. In general,
conditioning specimens to constant temperature is not required, because the determination itself brings the
specimen to the constant temperature of the test.
Specimens which change in density during the test to such an extent that the change is greater than the
required accuracy of the density determination shall be conditioned prior to measurement in accordance with
the applicable material specification. When changes in density with time or atmospheric conditions are the
primary purpose of the measurements, the specimens shall be conditioned as described in the material
specification and, if no material specification exists, then as agreed upon by the interested parties.
5 Method
5.1 Apparatus
5.1.1 Density gradient column, consisting of a suitable graduated column, not less than 40 mm in
diameter, with a cover. The height of the column shall be compatible with the accuracy required. A graduation
interval of 1 mm for the scale on the column is normal.
5.1.2 Liquid bath, capable of being thermostatically controlled to within 0,1 °C or 0,5 °C, depending on
the sensitivity required (see Annex B).
5.1.3 Calibrated glass floats, covering the density range in which measurements are to be made and
approximately evenly distributed throughout this range.
NOTE These may be purchased from an accredited source or prepared as described in 5.4.1.
5.1.4 Balance, accurate to 0,1 mg.
5.1.5 Siphon or pipette assembly, for filling the gradient column (5.1.1), as shown in Figure B.1 or B.2, or
any other suitable device.
5.2 Immersion liquids
Required are two miscible liquids of different densities, freshly distilled in the case of pure liquids. The
densities of various liquids are given in Annex A as a guide.
The liquid with which the specimen comes into contact during the measurement shall have no effect on the
specimen.
--`,,,,,,-`-`,,`,,`,`,,`---

79
EN ISO 1183−2:2004
IS-3811 O2:(4002E)
5.3 Specimens
Specimens shall consist of pieces of the material cut to any convenient shape for ease of identification. The
dimensions of each piece shall be chosen to permit accurate measurement of the position of the centre of the
piece.
When cutting specimens from larger samples, care shall be taken to ensure that the characteristics of the
material are not changed due to excessive heat generation. The surface of the specimen shall be smooth and
free from cavities to minimize the entrapment of air bubbles upon immersion in the liquid, otherwise errors will
be introduced.
NOTE Specimens of less than 5 mm in diameter are normally suitable.
5.4 Procedure
5.4.1 Preparation and calibration of glass floats
5.4.1.1 The glass floats (5.1.3) may be produced by any convenient method. They shall be approximately
spherical, of diameter not greater than 5 mm and fully annealed.
5.4.1.2 To prepare the glass floats for use, prepare a series of mixtures of about 500 ml of the two
immersion liquids (5.2) covering the density range to be used in the density gradient column (5.1.1). With the
floats and column at ambient temperature, place the floats carefully into these mixtures.
Adjust selected floats to match approximately the densities of the mixtures:
a) either by rubbing the float on a glass plate covered with a thin slurry of silicon carbide of particle size less
than 38 µm (400 mesh) or another suitable abrasive; -
`-`
,,,
,,,
-- b) or by etching the float with hydrofluoric acid.
,̀,
,̀,
,̀,̀
,̀ 5.4.1.3 Determine the exact density of each glass float calibrated as above by placing it in a mixture of
---
two suitable liquids (5.2) in the bath (5.1.2) maintained at (t 0,1) °C, where t is 23 °C or 27 °C (whichever will
be used for the density gradient column). If the float sinks, add the denser of the two liquids (if the float rises,
add the less dense) and stir gently to homogenize. Allow the mixture to stabilize. If the float still moves, adjust
the density of the mixture again. Repeat this procedure until the float remains stationary for at least 30 min.
5.4.1.4 For each float, determine, to the nearest 0,000 1 g/ml, the density of the solution in which the float
remained in equilibrium, using the pyknometer method (method B) described in ISO 1183-1:2004 or any other
suitable method. Apply the buoyancy correction described in ISO 1183-1:2004, Clause 6, if necessary. Record
this density as the density of the float.
NOTE Calibrated glass floats may also be purchased from accredited manufacturers.
5.4.2 Preparation of density gradient column
Methods for preparing the density gradient column are not specified in this part of ISO 1183, but examples of
two methods are given in Annex B.
5.4.3 Measure me nt of density
Wet three test specimens with the less dense of the two liquids used in the column and gently place them in
the column. Allow the column and specimens to reach equilibrium, which will require 10 min or more. Films
less than 0,05 mm thick require at least 1,5 h to settle. Rechecking thin-film specimens after several hours is
advisable.
for removing air bubbles from the specimens are a fine wire carefully manipulated or applying a vacuum to the column.
. Find the height of each specimen on the chart and read off the correspondi

80
ng density.
b) Calculation method
Calculate the density ρs,x of each specimen by interpolation, using the equation:
ρ s, x
ρ
F1 x − y ρ F2 − ρF1
(1)
z − y
where
ρF1 and ρF2 are the densities of the two floats at the lower and higher ends, respectively, of the density
range;
x is the distance of the specimen above an arbitrary level;
y and z are the distances above the same arbitrary level of the two floats of density ρF1 and ρF2,
respectively.
NOTE Method b) does not reveal calibration errors. These can only be detected by using method a), the graphical
method. Method b) can be used when the calibration is known to be linear within the range being used.
If the relationship between float position and density is not linear, a second order polynomial may be used for
interpolation of density.
Corrections for buoyancy, if required, can be calculated as described in ISO 1183-1:2004, Clause 6.
6 Test report
The test report shall include the following information:
a) a reference to this part of ISO 1183;
b) all details necessary for complete identification of the material tested, including the specimen preparation
method and pretreatment, if applicable;
c) the immersion liquids used;
British Standards Institution I ©SO – 4002 All irthgs ersedevr
Copyright 4
Reproduced by IHS under license with BSI - Uncontrolled Copy
No reproduction or networking permitted without license from IHS Not for Resale
--̀
,,,,,,-̀
-̀,,̀
,,
,̀̀,,`---

81
EN ISO 1183−2:2004 IS-3811 O2:(4002E)
d) the value of the density determined for each of the three specimens and the arithmetic mean of these
values; e) the temperature of the determination;
f) details of any buoyancy corrections made;
g) the date of the determination.
--̀
,,,,,,-̀
-̀,,̀
,,
,̀̀,,`---
Copyright British Standards Institution 4002 All irthgs ersedevr Reproduced by IHS under license with BSI - Uncontrolled Copy
No reproduction or networking permitted without license from IHS Not for Resale

82
EN ISO 1183−2:2004 IS-3811 O2:(4002E)
Annex A (informative)
Liquid systems suitable for density determinations
WARNING — Some of the following chemicals may be hazardous.
Table A.1 — Examples of suitable liquid systems
System
Density range
g/cm3
-`,
,,,
,,-
-
Methanol/benzyl alcohol 0,79 to 1,05
Isopropanol/water 0,79 to 1,00 -`
---
`,,
`,,
`,`
,,
`
Isopropanol/diethylene glycol 0,79 to 1,11
Ethanol/water 0,79 to 1,00
Toluene/carbon tetrachloride 0,87 to 1,60
Water/aqueous solution of sodium bromidea 1,00 to 1,41
Water/aqueous solution of calcium nitrate 1,00 to 1,60
Ethanol/aqueous solution of zinc chlorideb 0,79 to 1,70
Carbon tetrachloride/1,3-dibromopropane 1,60 to 1,99
1,3-Dibromopropane/ethylene bromide 1,99 to 2,18
Ethylene bromide/bromoform 2,18 to 2,89
Carbon tetrachloride/bromoform 1,60 to 2,89
Isopropanol/methylglycol acetate 0,79 to 1,00
a A density of 1,41 is equivalent to a mass fraction of about 40 % sodium bromide.
b A density of 1,70 is equivalent to a mass fraction of about 67 % zinc chloride.
The following may also be used in various mixtures:
Density (g/cm3
)
n-Octane 0,70
Dimethylformamide 0,94
Tetrachloroethane 1,60
Ethyl iodide 1,93
Methylene iodide 3,33
British Standards Institution I ©SO – 4002 All irthgs ersedevr
Copyright 6
Reproduced by IHS under license with BSI - Uncontrolled Copy
No reproduction or networking permitted without license from IHS Not for Resale

83
EN ISO 1183−2:2004 IS-3811 O2:(4002E)
Annex B (informative)
Preparation of density gradient column
--`,,,,,,-`-`,,`,,`,`,,`---
B.1 Place the graduated column in the thermostatically controlled bath (5.1.2). Select a suitable combination
of liquids (5.2) from the table in Annex A. When a sensitivity of 0,001 g/cm3
is required, the temperature of the bath should be maintained to within 0,5 °C and the density range covered by the column limited to less than
0,2 g/cm3
(preferably 0,1 g/cm3
). When a sensitivity of 0,000 1 g/cm3
is required, the temperature of the bath
should be maintained to within 0,1 °C, and the density range limited to less than 0,02 g/cm3
(preferably 0,01
g/cm3
). The extreme upper and lower parts of the column should not be used, and readings should not be taken outside the calibrated zone. Any of several methods for preparing the gradient column may be used, including the two methods given in
B.2 and B.3. B.2 Method 1: Assemble the apparatus as shown in Figure B.1, using two vessels of the same size and
volume. Then select appropriate amounts of two suitable liquids, which have previously been carefully de-
aerated by gentle heating or application of a vacuum. An effective method is with an ultrasonic cleaner. Place a suitable amount of the less dense liquid into vessel 2 (the amount should be at least half of the total
volume of liquid required in the gradient column — see Note 1) and turn on the magnetic stirrer. Adjust the
stirrer speed so that the surface of the liquid does not move significantly. Place an equal amount of the denser
liquid into vessel 1. Take care that no air is drawn into the liquid. Use the less dense liquid (starting liquid in vessel 2) to prime the siphon (5.1.5), which should be equipped with a capillary tip at the delivery end for flow
control, then start delivery of the liquid to the gradient column. Fill the column to the uppermost graduation
required (see Note 2). Allow the density gradient column thus prepared to settle for at least 24 h.
NOTE 1 Calculate the density ρ2 of the liquid in vessel 2 using the equation:
ρ 2 ρ max − 2 ρ max − ρ min V1
(2) V
where
ρ is the lower limit of the required density range, taken to be 0,01 g/cm3
lower than the density of the least
min dense glass float calibrated for the gradient column being used;
ρmax is the upper limit of the required density range, i.e. the density of the liquid in vessel 1, taken to be
0,005 g/cm3
higher than the density of the densest glass float calibrated for the gradient column being used;
V is the total volume required in the gradient column;
V1 is the initial volume of the liquid in vessel 1.
NOTE 2 Preparation of a suitable gradient column may require 1 h to 1,5 h or longer, depending upon the volume required
in the column. B.3 Method 2: Assemble the apparatus as shown in Figure B.2. This method is basically the same as method
1 except for the following points: a) the denser liquid is placed in vessel 2 and the less dense liquid in vessel 1;
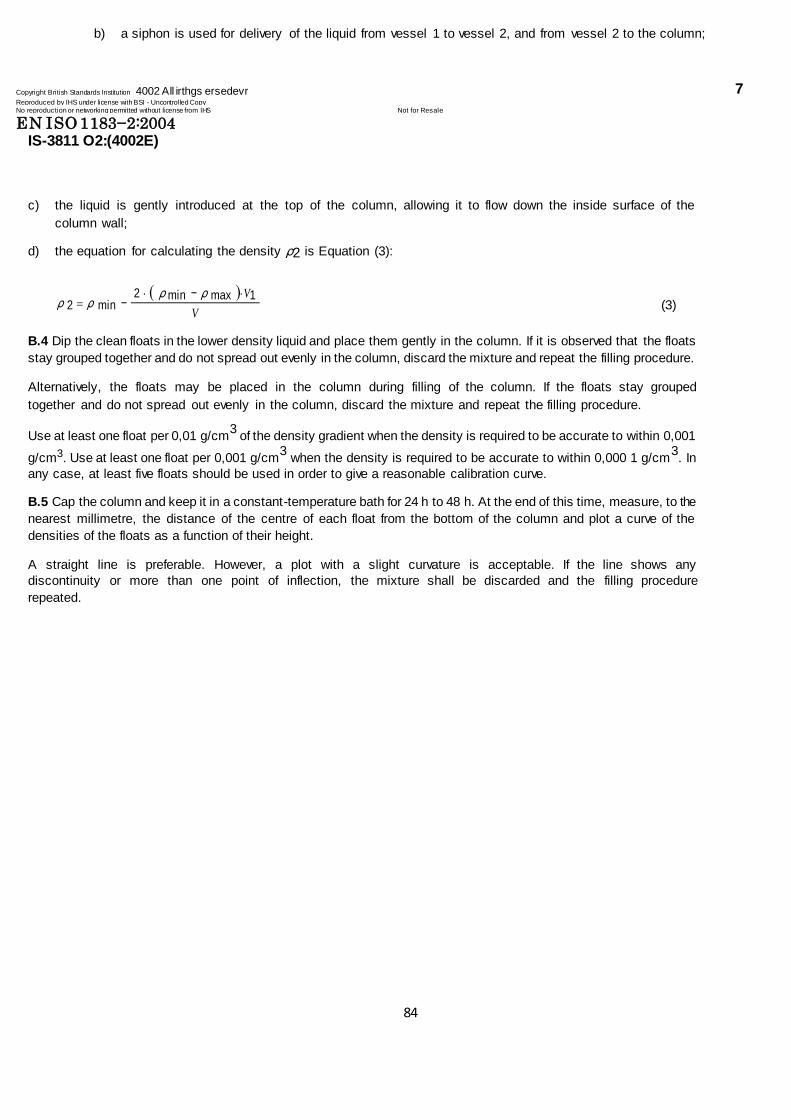
84
b) a siphon is used for delivery of the liquid from vessel 1 to vessel 2, and from vessel 2 to the column;
Copyright British Standards Institution 4002 All irthgs ersedevr 7 Reproduced by IHS under license with BSI - Uncontrolled Copy
No reproduction or networking permitted without license from IHS Not for Resale EN ISO 1183−2:2004
IS-3811 O2:(4002E)
c) the liquid is gently introduced at the top of the column, allowing it to flow down the inside surface of the
column wall;
d) the equation for calculating the density ρ2 is Equation (3):
ρ 2 ρ min − 2 ρ min − ρ max V1
(3)
V
B.4 Dip the clean floats in the lower density liquid and place them gently in the column. If it is observed that the floats
stay grouped together and do not spread out evenly in the column, discard the mixture and repeat the filling procedure.
Alternatively, the floats may be placed in the column during filling of the column. If the floats stay grouped
together and do not spread out evenly in the column, discard the mixture and repeat the filling procedure.
Use at least one float per 0,01 g/cm3 of the density gradient when the density is required to be accurate to within 0,001
g/cm3. Use at least one float per 0,001 g/cm3 when the density is required to be accurate to within 0,000 1 g/cm
3. In
any case, at least five floats should be used in order to give a reasonable calibration curve.
B.5 Cap the column and keep it in a constant-temperature bath for 24 h to 48 h. At the end of this time, measure, to the
nearest millimetre, the distance of the centre of each float from the bottom of the column and plot a curve of the
densities of the floats as a function of their height.
A straight line is preferable. However, a plot with a slight curvature is acceptable. If the line shows any
discontinuity or more than one point of inflection, the mixture shall be discarded and the filling procedure
repeated.

85
EN ISO 1183−2:2004 IS-3811 O2:(4002E)
Key 1 vessel 1 (more dense liquid) 2 vessel 2 (less dense liquid) 3 magnetic stirrer 4 column 5 capillary filling tube
Figure B.1 — Density gradient column filling apparatus for method 1

86
BS EN ISO BRITISH STANDARD
527-2:1996
BS2782-3:
Method322:
1994
Incorporating
Plastics — Amendment No.1
BS2782-3:
Method322:1994
Determination of renumbered
tensile properties —
Part2: Test conditions for moulding
and extrusion plastics
The European Standard ENISO 527-2:1996 has the status of a
British Standard
IMPORTANT NOTE. Before reading this method it is essential to read
BS2782-0, Introduction, issued separately.

87
BSEN ISO 527-2:1996
Committees responsible for this
British Standard
The preparation of this British Standard was entrusted by the Plastics and
Rubber Standards Policy Committee (PRM/-) to Technical Committee PRM/21,
upon which the following bodies were represented:
British Plastics Federation
British Textile Confederation
Department of the Environment (Building Research Establishment)
Department of Trade and Industry (National Physical Laboratory)
Electrical and Electronic Insulation Association (BEAMA Ltd.)
GAMBICA (BEAMA Ltd.)
Institute of Materials
Ministry of Defence
Packaging and Industrial Films Association
Pira International
RAPRA Technology Ltd.
This British Standard, having been prepared under the directionof the Plastics and Rubber Standards Policy Committee, was published underthe authority of the
Amendments issued since publication Standards Board and comes intoeffect on 15 January1994
Amd. No. Date Comments
© BSI07-1999 8639 November Indicated by a sideline in the margin
1996 The following BSI references relate to the work on this standard: Committee reference PRM/21 Draft for comment91/39044DC
ISBN 0 580 22701 4

88
BSEN ISO 527-2:1996
Contents
Page
Committees responsible Inside front cover
National foreword ii
Foreword 2
1 Scope 3
2 Normative references 3
3 Principle 3
4 Definitions 3
5 Apparatus 3
6 Test specimens 3
7 Number of test specimens 4
8 Conditioning 4
9 Procedure 4
10 Calculation and expression of results 4
11 Precision 4
12 Test report 4
Annex A (normative) Small specimens 6
Annex ZA (normative) Normative references to international
publications with their relevant European publications 8
Figure 1 — Test specimen types1A and1B 5
Figure A.1 — Test specimen types1BA and1BB 6
Figure A.2 — Test specimen types5A and5B 7
List of references Inside back cover
i © BSI 07-1999

89
BS EN ISO 527-2:1996
National foreword
This British Standard has been prepared by Technical Committee PRI/21 and is
the English language version of EN ISO527-2:1996 Plastics— Determination of
tensile properties— Part2: Test conditions for moulding and extrusion plastics .
Itis identical with ISO527-2:1993, published by the International Organization
for Standardization (ISO). Together with BS2782:Method321:1993 it supersedes
Method320A and 320B given in BS2782:Methods320A to320F:1976, which are
deleted by amendment.
Cross-references
International standard Corresponding British Standard
ISO293:1986 BS2782
Methods of testing plastics
Method901A:1988 Compression moulding test specimens
of thermoplastic material
(Identical)
ISO294:1975 Method910A:1977 Injection moulding test specimens of
thermoplastic materials
(Identical)
ISO295:1991 Method902A:1992 Plastics— Compression moulding of
test specimens of thermosetting materials
(Identical)
ISO527-1:1993 Method321:1993 Determination of tensile properties
General principles
(Identical)
ISO2818:1980 Method930A:1977 Preparation of test specimens by
machining
(Technically equivalent)
The Technical Committee has reviewed the provisions of ISO37:1977 and
ISO1926:1979, to which normative reference is made in the text, and has decided
that they are acceptable for use in conjunction with this standard.
WARNING NOTE. This British Standard, which is identical with ISO527-2, does
not necessarily detail all the precautions necessary to meet the requirements of
the Health and Safety at Work etc.Act1974. Attention should be paid to any
appropriate safety precautions and the method should be operated only by
trained personnel.
A British Standard does not purport to include all the necessary provisions of a
contract. Users of British Standards are responsible for their correct application.
Compliance with a British Standard does not of itself confer immunity
from legal obligations.
Summary of pages
This document comprises a front cover, an inside front cover, pagesi andii,
theEN ISO title page, pages2 to8, an inside back cover and a back cover.
This standard has been updated (see copyright date) and may have had
amendments incorporated. This will be indicated in the amendment table on the
inside front cover.
© BSI 07-1999 ii

90
EN ISO527-2 EUROPEAN STANDARD
NORME EUROPEENNE
May1996 EUROP ISCHE NORM
I C S 83 . 0 8 0
Descriptors: See ISO document
English version
Plastics— Determination of tensile properties—
Part2:Test conditions for moulding and extrusion plastics
(ISO527-2:1993 including Corr1:1994)
Plastiques— Détermination des propriétés en Kunstoffe— Bestimmung der
traction— Partie2: Conditions d’essai des Zugeigenschaften— Teil2: Prüfbedingungen
plastiques pour moulage et extrusion für Form- und Extrusionsmassen
(ISO527-2:1993inclus Corr1:1994) (ISO527-2:1993 einschlie lich Corr1:1994)
This European Standard was approved by CEN on1994-12-14. CEN members
are bound to comply with the CEN/CENELEC Internal Regulations which
stipulate the conditions for giving this European Standard the status of a
national standard without any alteration.
Up-to-date lists and bibliographical references concerning such national
standards may be obtained on application to the Central Secretariat or to any
CEN member.
This European Standard exists in three official versions (English, French,
German). A version in any other language made by translation under the
responsibility of a CEN member into its own language and notified to the
Central Secretariat has the same status as the official versions.
CEN members are the national standards bodies of Austria, Belgium,
Denmark, Finland, France, Germany, Greece, Iceland, Ireland, Italy,
Luxembourg, Netherlands, Norway, Portugal, Spain, Sweden, Switzerland and
United Kingdom.
CEN
European Committee for Standardization
Comité Européen de Normalisation
Europ isches Komitee für Normung
Central Secretariat: rue de Stassart 36, B-1050 Brussels
©1996 Copyright reserved to CEN members Ref. No. EN ISO527-2:1996E

91
EN ISO 527-2:1996
Foreword
The text of the International Standard from
Technical Committee ISO/TC61, Plastics, of the
International Organization for Standardization
(ISO) has been taken over as a European Standard
by Technical Committee CEN/TC249, Plastics, the
secretariat of which is held by IBN.
This European Standard shall be given the status of
a national standard, either by publication of an
identical text or by endorsement, at the latest by
November1996, and conflicting national standards
shall be withdrawn at the latest by November1996.
According to the CEN/CENELEC Internal
Regulations, the national standards organizations
of the following countries are bound to implement
this European Standard: Austria, Belgium,
Denmark, Finland, France, Germany, Greece,
Iceland, Ireland, Italy, Luxembourg, Netherlands,
Norway, Portugal, Spain, Sweden, Switzerland and
the United Kingdom.
© BSI 07-1999 2

92
ENISO 527-2:1996
1 Scope ISO527-1:1993, Plastics — Determination of tensile
properties — Part1: General principles. 1.1 This part of ISO527 specifies the test conditions
ISO1926:1979, Cellular plastics — Determination for determining the tensile properties of moulding of tensile properties of rigid materials.
and extrusion plastics, based upon the general
principles given in ISO527-1. ISO2818:—, Plastics — Preparation of test 2) specimens by machining .
1.2 The methods are selectively suitable for use with
the following range of materials: 3 Principle
— rigid and semirigid thermoplastics moulding, See ISO527-1:1993, clause 3 . extrusion and cast materials, including
compounds filled and reinforced by e.g.short 4 Definitions fibres, small rods, plates or granules but
excluding textile fibres For the purposes of this part of ISO527, the (seeISO527-4 and ISO527-5) in addition to
definitions given in ISO527-1 apply. unfilled types;
5 Apparatus — rigid and semirigid thermosetting moulding
and cast materials, including filled and See ISO527-1:1993, clause 5 .
reinforced compounds but excluding textile fibres
as reinforcement (seeISO527-4 and ISO527-5); 6 Test specimens — thermotropic liquid crystal polymers.
6.1 Shape and dimensions The methods are not suitable for use with materials
Wherever possible, the test specimens shall be reinforced by textile fibres dumb-bell-shaped types1A and1B as shown in (seeISO527-4 and ISO527-5), with rigid cellular Figure 1. Type1A is preferred for directly-moulded materials or sandwich structures containing multipurpose test specimens, type1B for machined cellular material. specimens.
1.3 The methods are applied using specimens which NOTE 1Types1A and1B test specimens having4mm may be either moulded to the chosen dimensions or thickness are identical to the multipurpose test specimens
machined, cut or punched from injection- or according to ISO3167, typesA andB, respectively.
compression-moulded plates. The multipurpose test For the use of small specimens, seeAnnex A.
specimen is preferred (seeISO3167:1993, 6.2 Preparation of test specimens
Plastics— Multipurpose test specimens ).
Test specimens shall be prepared in accordance with 2 Normative references the relevant material specification. When none
exists, or unless otherwise specified, specimens The following standards contain provisions which,
shall be either directly compression- or injection through reference in this text, constitute provisions
moulded from the material in accordance with of this part of ISO527. At the time of publication,
ISO293, ISO294 or ISO295, as appropriate, or the editions indicated were valid. All standards are
machined in accordance with ISO2818 from plates subject to revision, and parties to agreements based
that have been compression- or injection-moulded on this part of ISO527 are encouraged to
from the compound. investigate the possibility of applying the most
All surfaces of the test specimens shall be free from recent editions of the standards indicated below. visible flaws, scratches or other imperfections. From Members of IEC and ISO maintain registers of moulded specimens all flash, if present, shall be currently valid International Standards. removed, taking care not to damage the moulded
ISO37:1977, Rubber, vulcanized — Determination surface.
of tensile stress-strain properties. Test specimens from finished goods shall be taken
ISO293:1986, Plastics — Compression moulding from flat areas or zones having minimum curvature.
test specimens of thermoplastic materials. For reinforced plastics, test specimens should not be
ISO294:—, Plastics — Injection moulding of test machined to reduce their thickness unless
1) specimens of thermoplastic materials . absolutely necessary. Test specimens with
ISO295:1991, Plastics — Compression moulding of machined surfaces will not give results comparable
test specimens of thermosetting materials. to specimens having non-machined surfaces.
1 ) To be published. (Revision of ISO294:1975)
2 ) To be published. (Revision of ISO2818:1980)
3 © BSI 07-1999

93
EN ISO 527-2:1996
11 Precision 6.3 Gauge marks
See ISO527-1:1993, subclause 6.3 . The precision of this test method is not known,
because interlaboratory data are not available. 6.4 Checking the test specimens When interlaboratory data are obtained, a precision
See ISO527-1:1993, subclause 6.4 . statement will be added with the next revision.
7 Number of test specimens 12 Test report
See ISO527-1:1993, clause 7 . The test report shall include the following
information: 8 Conditioning a) a reference to this part of ISO527, including
See ISO527-1:1993, clause 8 . the type of specimen and the testing speed
according to: 9 Procedure
See ISO527-1:1993, clause 9 .
For the measurement of the modulus of elasticity,
the speed of testing shall be1mm/min for specimen
types1A and1B (seeFigure 1). For small specimens
see Annex A.
For itemsb) toq) in the test report, 10 Calculation and expression of see ISO527-1:1993,12b) to q).
results
See ISO527-1:1993, clause 10 .
© BSI 07-1999 4

94
ENISO 527-2:1996
Specimen type 1A 1B a l Overall length W 150 3
l Length of narrow parallel-sided portion 80± 2 60,0± 0,5 1 b r Radius 20 to25 W 60
c c l Distance between broad parallel-sided portions 104to113 106 to120 2 b Width at ends 20,0± 0,2 2 b Width of narrow portion 10,0± 0,2 1 h Preferred thickness 4,0± 0,2
L Gauge length 50,0± 0,5 0 L Initial distance between grips 115± 1 +5
l 2 0
NOTESpecimen type1A is preferred for directly-moulded multipurpose test specimens, type1B for machined specimens. a For some materials, the length of the tabs may need to be extended (e.g. l =200mm) to prevent breakage or slippage in the 3 testing jaws. b 2 2 r =[( l – l ) +( b – b ) ]/4 ( b – b )
2 1 2 1 2 1 c Resulting from l , r , b and b , but within the indicated tolerance. 1 1 2
Figure 1 — Test specimen types1A and1B
5 © BSI 07-1999
95
EN ISO 527-2:1996
Annex A (normative)
Small specimens
If for any reason it is not possible to use a standard type1 test specimen, specimens of the types1BA,1BB
(seeFigure A.1),5A or5B (seeFigure A.2) may be used, provided that the speed of testing is adjusted to
the value given in 5.1.2 , Table1 of ISO527-1:1993, which gives the nominal strain rate for the small test
specimen closest to that used for the standard-sized specimen. The rate of nominal strain is the quotient of
the speed of testing (see 4.2 in ISO527-1:1993) and the initial distance between grips. Where modulus
measurements are required, the test speed shall be1mm/min. It may be technically difficult to measure
modulus on small specimens because of small gauge lengths and short testing times. Results obtained from
small specimens are not comparable with those obtained from type1 specimens.
Type of specimen 1BA 1BB
l Overall length W 75 W 30 3 l Length of narrow parallel-sided portion 30 ± 0,5 12 ± 0,5 1 r Radius W 30 W 12
l Distance between broad parallel-sided portions 58 ± 2 23 ± 2 2 b Width at ends 10 ± 0,5 4 ± 0,2 2 b Width of narrow portion 5 ± 0,5 2 ± 0,2
1 h Thickness W 2 W 2
L Gauge length 25 ± 0,5 10 ± 0,2 0 L Initial distance between grips
+2 +1 l l
0 0 2 2 NOTEThe specimen types 1BA and 1BB are proportionally scaled to type 1B with a reduction factor of 1 : 2 and 1 : 5 respectively with the exception of thickness.
Figure A.1 — Test specimen types1BA and1BB
© BSI 07-1999 6

96
ENISO 527-2:1996
Type of specimen 5A 5B
l Overall length, minimum W 75 W 35 2 b Width at ends 12,5 ± 1 6 ± 0,5 2 l Length of narrow parallel-sided portion 25 ± 1 12 ± 0,5 1 b Width of narrow parallel-sided portion 4 ± 0,1 2 ± 0,1 1 r Small radius 8 ± 0,5 3 ± 0,1 1 r Large radius 12,5 ± 1 3 ± 0,1 2 L Initial distance between grips 50 ± 2 20 ± 2
L Gauge Length 20 ± 0,5 10 ± 0,2 0 h Thickness W 2 W 1
NOTETest specimen types 5A and 5B are approximately proportional to type 5 of ISO 527-3 and represent respectively types 2 and3 of ISO 37.
Figure A.2 — Test specimen types5A and5B
7 © BSI 07-1999

97
ENISO 527-2:1996
Annex ZA (normative)
Normative references to international publications with their relevant
European publications
This European Standard incorporates by dated or undated reference, provisions from other publications.
These normative references are cited at the appropriate places in the text and the publications are listed
hereafter. For dated references, subsequent amendments to or revisions of any of these publications apply
to this European Standard only when incorporated in it by amendment or revision. For undated references
the latest edition of the publication referred to applies.
Publication Year Title EN Year
ISO527-1 1993 Plastics— Determination of tensile EN ISO527-1 1996
properties — Part1: General
principles
© BSI 07-1999 8

98
BS EN ISO
527-2:1996 BSI—BritishStandardsInstitution BS2782-3:
Method322: BSI is the independent national body responsible for preparing 1994 BritishStandards. It presents the UK view on standards in Europe and at the
international level. It is incorporated by Royal Charter.
Revisions
BritishStandards are updated by amendment or revision. Users of
BritishStandards should make sure that they possess the latest amendments or
editions.
It is the constant aim of BSI to improve the quality of our products and services.
We would be grateful if anyone finding an inaccuracy or ambiguity while using
this BritishStandard would inform the Secretary of the technical committee
responsible, the identity of which can be found on the inside front cover.
Tel:02089969000. Fax:02089967400.
BSI offers members an individual updating service called PLUS which ensures
that subscribers automatically receive the latest editions of standards.
Buying standards
Orders for all BSI, international and foreign standards publications should be
addressed to Customer Services. Tel:02089969001. Fax:02089967001.
In response to orders for international standards, it is BSI policy to supply the
BSI implementation of those that have been published as BritishStandards,
unless otherwise requested.
Information on standards
BSI provides a wide range of information on national, European and
international standards through its Library and its Technical Help to Exporters
Service. Various BSI electronic information services are also available which give
details on all its products and services. Contact the Information Centre.
Tel:02089967111. Fax:02089967048.
Subscribing members of BSI are kept up to date with standards developments
and receive substantial discounts on the purchase price of standards. For details
of these and other benefits contact Membership Administration.
Tel:02089967002. Fax:02089967001.
Copyright
Copyright subsists in all BSI publications. BSI also holds the copyright, in the
UK, of the publications of the international standardization bodies. Except as
permitted under the Copyright, Designs and Patents Act 1988 no extract may be
reproduced, stored in a retrieval system or transmitted in any form or by any
means – electronic, photocopying, recording or otherwise – without prior written
permission from BSI.
This does not preclude the free use, in the course of implementing the standard,
of necessary details such as symbols, and size, type or grade designations. If these
details are to be used for any other purpose than implementation then the prior
written permission of BSI must be obtained.
If permission is granted, the terms may include royalty payments or a licensing
agreement. Details and advice can be obtained from the Copyright Manager. BSI Tel:02089967070.
389 Chiswick High Road
London
W4 4AL

99
D EUTSCHE NORM June 2003
Plastics Determination of {
flexural properties (ISO 178 : 2001)
English version of DIN EN ISO 178 EN ISO 178
ICS 83.080.01 Supersedes
February 1997 edition.
Kunsts toffe – Bestimm u ng der Biegeei gens c hafte n (ISO 178 : 2001)
European Standard EN ISO 178 : 2003 has the status of a DIN Standard.
A comma is used as the decimal mark er.
National foreword
This standard has been published in accordance with a decision taken by CEN/TC 249 to adopt, without alteration, International Standard ISO 178 as a European Standard. The responsible German body involved in its preparation was the Normenausschuss Kunststoffe (Plastics Standards Committee), Technical Committee Mechanische Eigenschaften und Probek örperherstellung. The DIN Standards corresponding to the International Standards referred to in clause 2 of the EN are as follows: ISO Standard DIN Standard(s)
ISO 291 DIN EN ISO 291 ISO 293 DIN 16770-1 and DIN EN ISO 293 *) ISO 294-1 DIN EN ISO 294-1 ISO 295 DIN EN ISO 295 ISO 2818 DIN EN ISO 2818 ISO 3167 DIN EN ISO 3167 ISO 10724-1 DIN EN ISO 10724-1
Amendments This standard differs from the February 1997 edition in that it has been revised in form and substance.
Previous editions
DIN 53452: 1941-05, 1944-11, 1952-02, 1977-04; DIN 53453: 1943-11, 1952-02, 1954-07, 1958-05, 1965-10, 1975-05; DIN 53457: 1968-05, 1987-06, 1987-10; DIN EN ISO 178: 1997-02.
*) Currently at draft stage.
Continued overleaf. EN comprises 17 pages.
© No part of this standard may be

100
reproduced without the prior permission of DIN Deutsches Institut für Normung e. V. , Berlin. Beuth Verlag GmbH, 10772 Berlin, Germany , has the exclusiv e right of sale f or German Standards (DIN-Normen).
DIN EN ISO 178 : 2003-06 English price group 12 Sales No. 1112
10.03

101
Page 2 DIN EN ISO 178 : 2003-06 National Annex NA Standards referred to (and not included in Normative references, Bibliography and Annex ZA) DIN 16770-1 Preparation of specimens of thermoplastic moulding materials by compression mould- ing
DIN EN ISO 291 Plastics – Standard atmospheres for conditioning and testing (ISO 291 : 1997) DIN EN ISO 294-1 Plastics – Injection moulding of test specimens of thermoplastic materials – Part 1: General principl es, and moulding of multipurpose and bar test specimens (ISO 294-1 : 1996)
DIN EN ISO 295 Plastics – Compression moulding of test specimens of thermosetting materials (ISO 295 : 1991)
DIN EN ISO 2818 Plastics – Preparation of test specimens by machining (ISO 2818 : 1994)
DIN EN ISO 3167 Plastics – Multi-purpose test specimens (ISO 3167 : 1993)
DIN EN ISO 10724-1 Injection moulding of test specimens of thermosetting powder moulding compounds (PMCs) – Part 1: General principles and moulding of multipurp os e test specimens (ISO 10724-1 : 1998)

102
EN ISO 178
February 2003 ICS 83.080.01 Supersedes EN ISO 178 : 1996.
English version
Plastics
Determination of flexural properties (ISO 178 : 2001)
Plastiques – Détermination des Kunststoffe – Bestimmung der propriétés en flexion (ISO 178 : 2001) Biegeeigenschaften (ISO 178 : 2001)
This European Standard was approved by CEN on 2002-12-12. CEN members are bound to comply with the CEN/CE NE LEC Internal Regulations which stipulate the conditions for giving this European Standard the status of a national standard without any alteration. Up-to-date lists and bibliographical references concerning such national stand-ards may be obtained on application to the Management Centre or to any CEN member. The European Standards exist in three official versions (English, French, German). A version in any other language made by translation under the responsibility of a CEN member into its own language and notified to the Management Centre has the same status as the official versions. CEN members are the national standards bodies of Austria, Belgium, the Czech Republic, Denmark, Finland, France, Germany, Greece, Hungary, Iceland, Ireland, Italy, Luxembourg, Malta, the Netherlands, Norway, Portugal, Slovakia, Spain, Sweden, Switzerland, and the United Kingdom.
ÈÉË
European Committee for Standardization
Comité Européen de Normalisation Europäisches Komitee für Normung
Management Centre: rue de Stassart 36, B-1050 Brussels
© 2003. CEN – All rights of exploitation in any form and by any means Ref . No. EN ISO 178 : 2003 E reserved w orldw ide for CEN national members.

103
Page 2 Page 2 EN ISO 178 : 2003 EN ISO 178 : 2003
Foreword International Standard ISO 178 : 2001 Plastics – Determination of flexural properties, which was prepared by ISO/TC 61 ‘Plastics’ of the International Organization for Standardization, has been adopted by Technical Committee CEN/TC 249 ‘Plastics’, the Secretariat of which is held by IBN, as a European Standard. This European Standard shall be given the status of a national standard, either by publication of an identical text or by endorsement, and conflicting national standards withdrawn, by August 2003 at the latest. In accordance with the CEN/CE NE LEC Internal Regulations, the national standards organizations of the follow-ing countries are bound to implement this European Standard: Austria, Belgium, the Czech Republic, Denmark, Finland, France, Germany, Greece, Hungary, Iceland, Ireland, Italy, Luxembourg, Malta, the Netherlands, Norway, Portugal, Slovakia, Spain, Sweden, Switzerland, and the United Kingdom. Endorsement notice The text of the International Standard ISO 178 : 2001 was approved by CEN as a European Standard without any modification. NOTE: Normative references to international publications are listed in Annex ZA (normative).
2
3
3
4
6
7
8
11
11
13
15
15
16
17
104
Page 3 Page 3 EN ISO 178 : 2003 EN ISO 178 : 2003

105
Page 4 Page 4 EN ISO 178 : 2003 EN ISO 178 : 2003

106
Page 5 Page 5 EN ISO 178 : 2003 EN ISO 178 : 2003
107
Page 6 Page 6 EN ISO 178 : 2003 EN ISO 178 : 2003

108
Page 7 Page 7 EN ISO 178 : 2003 EN ISO 178 : 2003

109
Page 8 Page 8 EN ISO 178 : 2003 EN ISO 178 : 2003

110
Page 9 Page 9 EN ISO 178 : 2003 EN ISO 178 : 2003
111
Page 10 Page 10 EN ISO 178 : 2003 EN ISO 178 : 2003

112
Page 11 Page 11 EN ISO 178 : 2003 EN ISO 178 : 2003

113
Page 12 Page 12 EN ISO 178 : 2003 EN ISO 178 : 2003

114
Page 13 Page 13 EN ISO 178 : 2003 EN ISO 178 : 2003

115
Page 14 Page 14 EN ISO 178 : 2003 EN ISO 178 : 2003

116
Page 15 Page 15 EN ISO 178 : 2003 EN ISO 178 : 2003
117
Page 16 Page 16 EN ISO 178 : 2003 EN ISO 178 : 2003
118
Page 17 Page 17 EN ISO 178 : 2003 EN ISO 178 : 2003

119
APPENDIX 2
Tensile Test Data

120

121

122
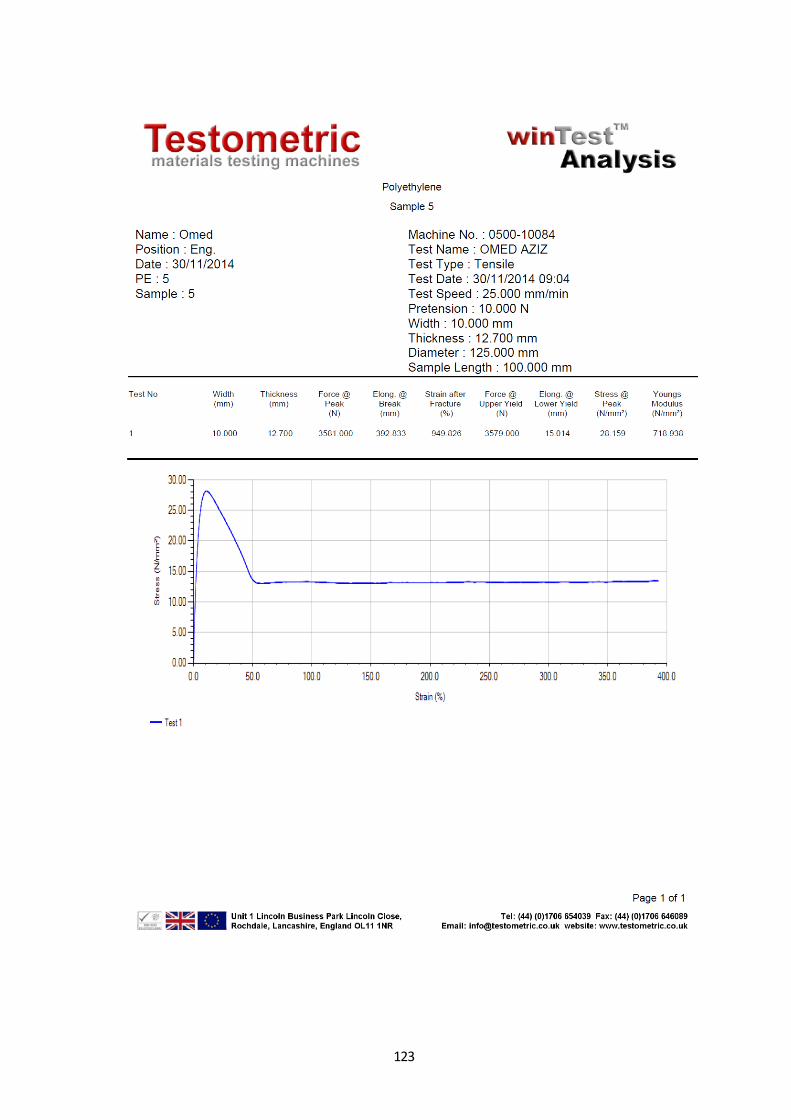
123

124

125

126
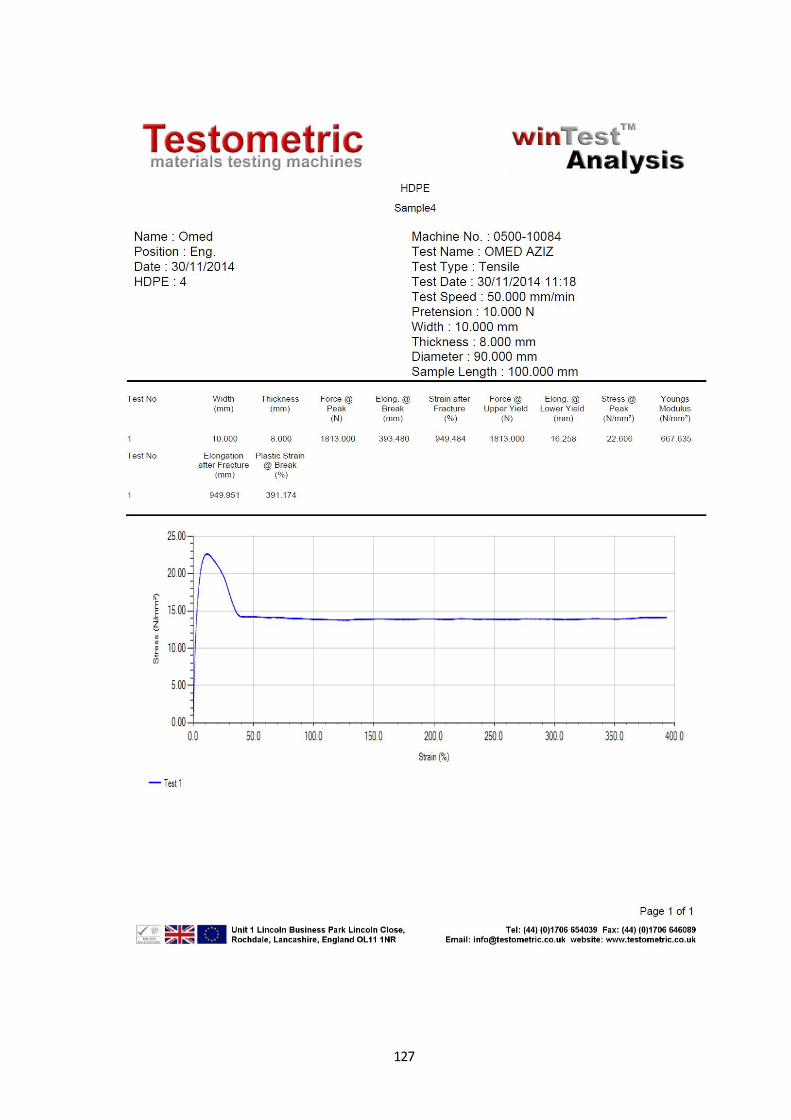
127

128

129

130

131
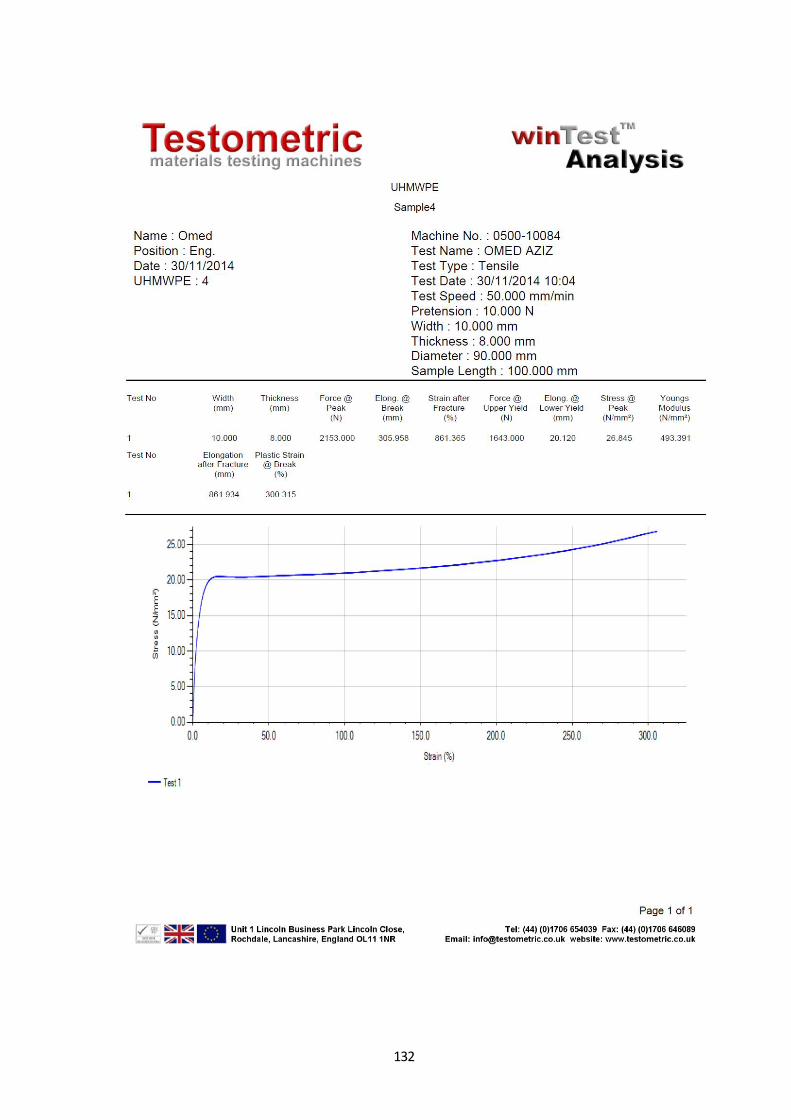
132

133

134
APPENDIX 3
Flexural Test Data
0.21, 9.77
0
2
4
6
8
10
12
14
16
18
20
0 0.2 0.4 0.6
Forc
e (k
N)
deflection (mm)
polyethylene 1
0.22, 10.12
0
5
10
15
20
0 0.2 0.4 0.6
Forc
e (
kN)
deflection (mm)
polyethylene 2
0.18, 9.2
0
5
10
15
20
0 0.2 0.4 0.6
Forc
e (
kN)
deflection (mm)
polyethylene 3
0.17, 6.9
0
5
10
15
20
0 0.2 0.4 0.6
Forc
e (
kN)
deflection (mm)
polyethylene 4
0.2, 9.53
0
5
10
15
20
0 0.1 0.2 0.3 0.4 0.5 0.6
Forc
e (
kN)
deflection (mm)
polyethylene 5
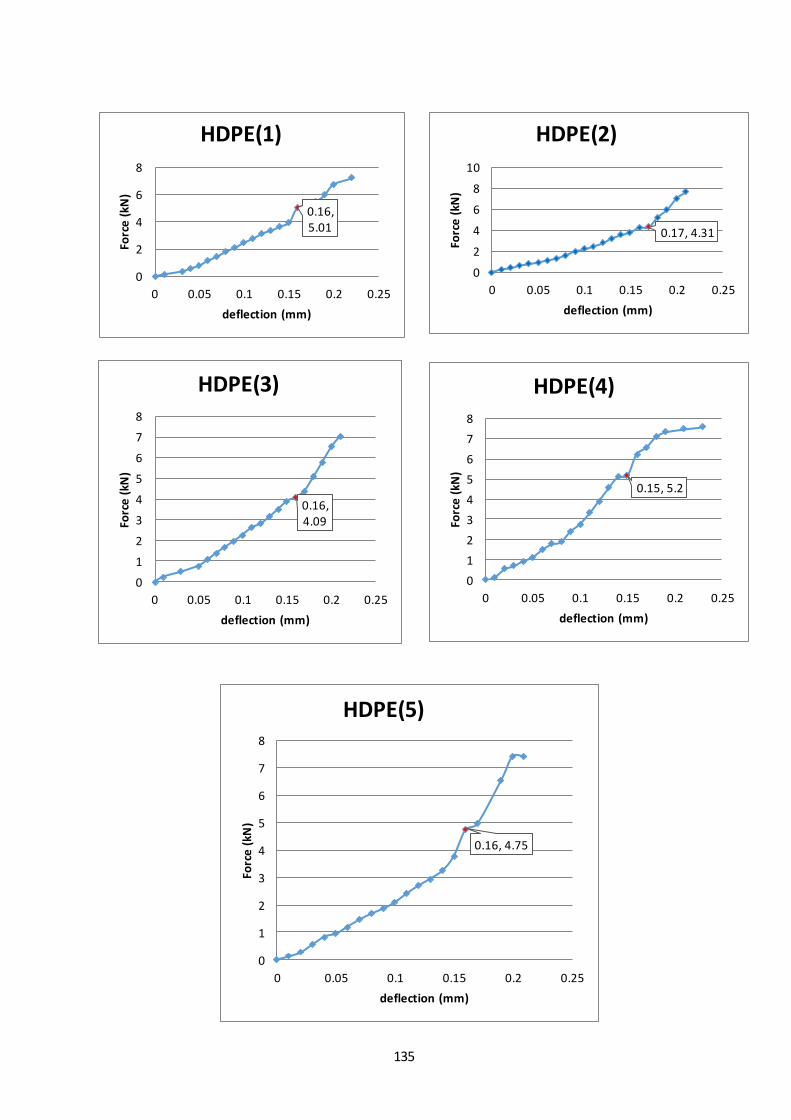
135
1.
2.
3.
4.
0.16, 5.01
0
2
4
6
8
0 0.05 0.1 0.15 0.2 0.25
Forc
e (
kN)
deflection (mm)
HDPE(1)
0.17, 4.31
0
2
4
6
8
10
0 0.05 0.1 0.15 0.2 0.25
Forc
e (
kN)
deflection (mm)
HDPE(2)
0.16, 4.09
0
1
2
3
4
5
6
7
8
0 0.05 0.1 0.15 0.2 0.25
Forc
e (
kN)
deflection (mm)
HDPE(3)
0.15, 5.2
0
1
2
3
4
5
6
7
8
0 0.05 0.1 0.15 0.2 0.25
Forc
e (
kN)
deflection (mm)
HDPE(4)
0.16, 4.75
0
1
2
3
4
5
6
7
8
0 0.05 0.1 0.15 0.2 0.25
Forc
e (
kN)
deflection (mm)
HDPE(5)

136
0.13, 5.12
0
2
4
6
8
10
0 0.05 0.1 0.15 0.2 0.25
Forc
e (
kN)
deflection (mm)
UHMWPE(1)
0.12, 3.61
0
1
2
3
4
5
6
7
8
0 0.1 0.2 0.3
Forc
e (
kN)
deflection (mm)
UHMWPE(2)
0.12, 4.35
0
1
2
3
4
5
6
7
8
9
0 0.05 0.1 0.15 0.2
Forc
e (
kN)
deflection (mm)
UHMWPE(3)
0.11, 4.61
0
1
2
3
4
5
6
7
8
0 0.05 0.1 0.15 0.2
Forc
e (
kN)
deflection (mm)
UHMWPE(4)
0.11, 3.82
0
1
2
3
4
5
6
7
0 0.05 0.1 0.15 0.2
Forc
e (
kN)
deflection (mm)
UHMWPE(5)