Dynamic compressive and splitting tensile tests on mortar ...
Upload
khangminh22Category
view
0download
0
1
Tensile Deformation and Fracture Properties of a 14YWT
Nanostructured Ferritic Alloy
M. E. Alama)*, S. Pala), K. Fieldsa), S. A. Maloyb), D. T. Hoelzerc), G. R. Odettea)
a) Materials Department, University of California, Santa Barbara, CA 93106, USA
b) Los Alamos National Laboratory, Los Alamos, NM 87545, USA
c) Materials Science and Technology Division, Oak Ridge National Laboratory, Oak
Ridge, TN 37830, USA
*Corresponding author. Tel.: +1 (805) 893-3848; fax +1 (805) 893-8651
E-mail address: [email protected] (M. E. Alam)
Abstract
A new larger heat of a 14YWT nanostructured ferritic alloy (NFA), FCRD NFA-1, was
synthesized by ball milling FeO and argon atomized Fe-14Cr-3W-0.4Ti-0.2Y (wt.%)
powders, followed by hot extrusion, annealing and cross rolling to produce an ≈10 mm-
thick plate. NFA-1 contains a bimodal size distribution of pancake-shaped, mostly very
fine scale, grains. The as-processed plate also contains a large population of microcracks
running parallel to its broad surfaces. The small grains and large concentration of Y-Ti-O
nano-oxides (NOs) result in high strength up to 800°C. The uniform and total elongations
range from ≈ 1 to 8%, and ≈ 10 to 24%, respectively. The strength decreases more
rapidly above ≈ 400°C and the deformation transitions to largely viscoplastic creep by ≈
600°C. While the local fracture mechanism is generally ductile-dimple microvoid
nucleation, growth and coalescence, perhaps the most notable feature of tensile
deformation behavior of NFA-1 is the occurrence of periodic delamination, manifested as
fissures on the fracture surfaces.

2
Keywords: Nanostructured ferritic alloy; Nano oxide; Delamination; Tensile properties;
Fractography.
1. Introduction
The success of advanced nuclear fission and future fusion energy sources depends on
the development of new, high performance structural materials that can sustain extended
component lifetimes in extremely hostile irradiation environments. Nanostructured
ferritic alloys (NFAs), which are leading candidates for these applications, have high
tensile, fatigue and creep strengths over a wide range of temperatures, as well as
outstanding irradiation tolerance and unique thermal stability up to 900ºC [1-3]. The
outstanding properties of 12-14%Cr NFAs are derived from the presence of submicron (~
500 nm) grains, high dislocation densities (0.5 - 2x10¹⁵/m2) and an ultrahigh population
(1023 - 1024/m3) of nanometer scale (2-4 nm) Y-Ti-O rich multifunctional nano-oxides
(NOs). The NOs retard dislocation climb and glide, stabilize grain and dislocation
structures, and trap helium in fine bubbles that retard swelling and grain boundary
embrittlement [1-7]. Unlike some high strength materials, NFAs exhibit significant
ductility and in some cases reasonable fracture toughness in standard test orientations [8-
12].
NFAs are typically described by a number designating their Cr content followed by
YWT indicating their primary micro-alloying elements, Y, W and Ti. A new 14YWT
NFA, named FCRD NFA-1, with a nominal composition of Fe-14Cr-3W-0.4Ti-0.2Y
(wt.%), was developed in a collaboration between the University of California, Santa

3
Barbara (UCSB), Los Alamos National Laboratory (LANL) and Oak Ridge National
Laboratory (ORNL). The objective was to achieve a good combination of strength,
ductility, toughness and irradiation tolerance in a larger heat of NFA. Processing NFA-1
involved an alternative path that involved including Y in the melt prior to gas atomization
and rapid solidification. Many small lab heats of precursor NFA, with different
processing and compositional variants, were first explored to identify the best practice
path [3, 10, 13-16]. This culminated in the final production of an extruded and cross-
rolled heat known as 14YWT-PM2 (PM2) [17]. NFA-1 is larger-scale heat (55 kg),
processed by the same route as PM2, in the form of an ≈ 10 mm thick plate [18].
Characterization of NOs, dislocations and grain structures of the NFA-1 are described
elsewhere [18]. Here we focus on the basic tensile deformation and fracture properties of
NFA-1. Companion studies of fracture toughness, texturing and the underlying
micromechanisms of deformation and fracture are reported elsewhere [19, 20]. Unlike
most previous results, a special effort is made here to characterize the effects of
orientation of the test specimens with respect to the plate geometry and primary
deformation processing directions. Further, the combined effect of prior plate
microcracking and subsequent delamination during testing, are systematically explored
for the first time. Tensile tests were carried out in air from room temperature to 800°C.
Scanning electron microscopy (SEM) was used to examine grain size, coarser oxide
features, microcracks, fracture surfaces, and the deformation patterns at the point of
material separation. Electron backscatter diffraction (EBSD) was used to characterize
grain texturing and grain boundaries, while limited transmission electron microscopy
(TEM) was used to identify the micromechanisms of microcrack formation.

4
2. Materials and Methods
2.1 Processing NFA-1
NFAs are typically processed by ball milling Fe-Cr-Ti-W and Y2O3 powders to
mechanically alloy the Y and O into solid solution. The powders are then consolidated by
high temperature hot isostatic pressing or extrusion [1,5]. The NOs precipitate during hot
consolidation, at sizes (d) and number densities (N) that depend on alloy composition and
temperature [14]. The consolidated NFA is then typically deformation processed, both to
achieve better properties and a final near net shape. In the case of NFA-1, Y was included
in the melt prior to gas atomization and rapid solidification. This was intended to explore
the possibility of minimizing the ball-milling step and to produce more uniform
distributions of NOs. ATI Powder Metals (Pittsburgh, PA) provided the atomized Fe-
14Cr-3W-0.4Ti-0.2Y powders with a controlled range of O contents. However, the Y was
found to be phase-separated after atomization, hence, the powders required extensive ball
milling for 40 h that was carried out by Zoz GmbH (Wenden, Germany) in a CM100b
attritor mill, with a ball mass-to-charge ratio of 10:1 and ball size of 5 mm. After ball
milling the Y was uniformly distributed. The final Zoz milling was carried out on a low
oxygen powder. In order to optimize the composition, the atomized powders were milled
with 10 mesh FeO powders to yield ≈ 0.125 wt.% O. The powders were then sealed in a
100 mm diameter mild steel can, degassed at 400ºC, and hot extruded at 850ºC through a
64 x 30 mm2 rectangular die. The extruded bar was annealed for 1 hour and then hot
cross-rolled to an ≈ 50% thickness reduction, both at 1000°C, to form an 15mm thick
section including the can, containing the 10 mm NFA-1 plate.
2.2 Characterization of the grain structure and coarse scale microstructures in NFA-1

5
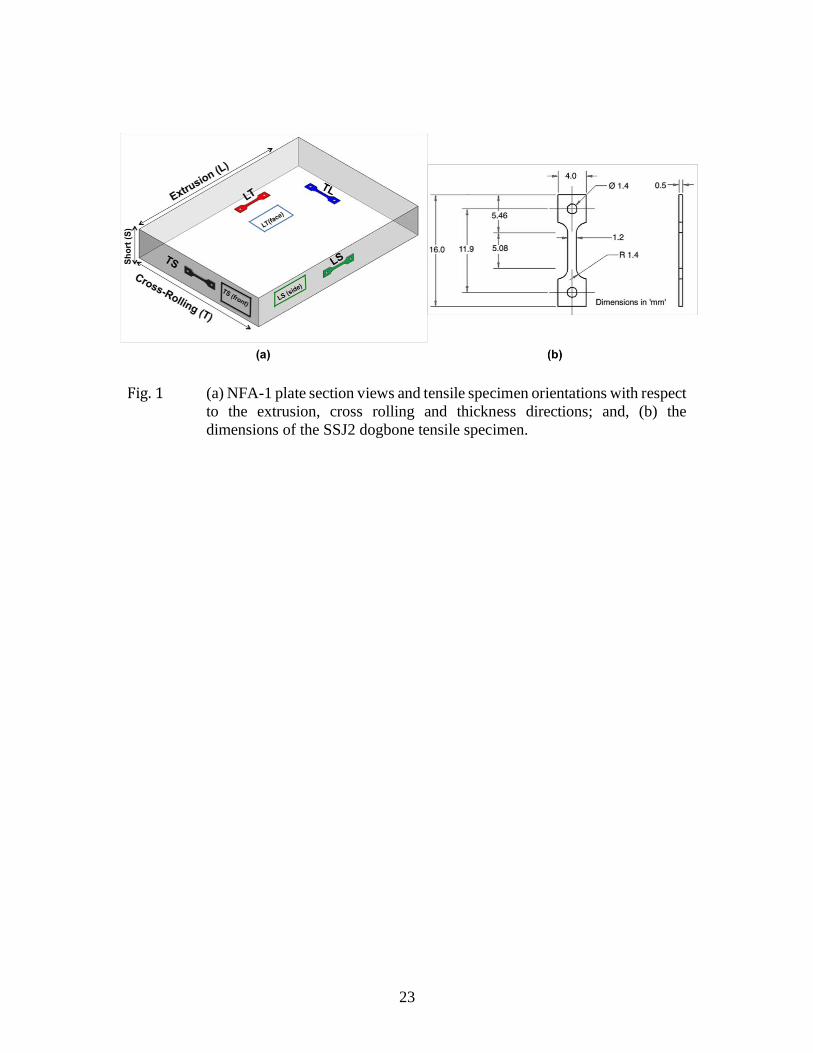
The grain structure of the NFA-1 was evaluated in the three plate sections,
designated as LT (face), LS (side, parallel to the rolling direction) and TS (front,
perpendicular to the rolling direction), as illustrated in Figure 1. The characterization
toolkit primarily included: a) SEM on an FEIx30, equipped with energy dispersive
spectroscopy (EDS); b) SEM on a dual beam Scanning Electron Microscope/Focused Ion
Beam (SEM/FIB) FEI Helios 600; and, c) electron backscatter diffraction (EBSD) on an
FEI Quanta 400F SEM. Typical sample preparation steps included 1500 grit grinding and
polishing with 20 nm colloidal silica. Some of the polished samples were etched with
Kroll’s reagent (92% distilled water, 6% nitric acid, and 2% hydrofluoric acid). The
longest (l) and shortest (s) dimensions of minimum 500 individual grains were tabulated
from the SEM and SEM/FIB micrographs using ‘ImageJ64’ software. The nominal grain
size was taken as d = (l+s)/2 and the aspect ratio as r = l/s. EBSD (parameters: voltage:
20KeV, spot size: 4, step size: 0.05µm and working distance: 10mm) was used to
characterize the textures induced by hot extrusion and cross-rolling. SEM and TEM, both
equipped with EDS, were used to characterize the coarser-scale precipitates and
microcracks [20-21]. SEM was also used extensively to characterize the fracture surfaces,
tensile deformation, cracking patterns, and delamination.
2.3 Mechanical Testing
Vickers microhardness measurements (Hv) were performed on polished surfaces of
the various plate sections at a 500g load using a LECO M-400A semi-automated testing
instrument. A total of 10 to 15 indents were made in all cases in accordance with ASTM
test standard E384-11e1 [22].

6
Tensile tests were performed on dog bone shaped and sub-sized flat specimens with a
nominal gauge section of 5.0x1.2x0.5 mm3 [23] in four different orientations designated
as LT, TL, LS and TS, as illustrated in Figure 1. Here the first letter designates the tensile
axis orientation parallel (L) or transverse (T) with respect to the extrusion direction;
while the second letter designates the plane of the plate that the specimen was extracted
from - either the broad face (L or T) or short plate thickness (S) front or side. Thus there
are 4 specimen orientations designated as LT and TL (for the face), and LS and TS (for
the side). The tensile specimens were cleaned with1500 grit paper to remove surface
oxidation and damage caused by the electrical discharge machining (EDM). A MTS 810
servo-hydraulic universal testing machine equipped with a clam shell furnace was used to
conduct the tests in air at temperatures ranging from ambient (≈ 22°C) to 800°C. Note,
the TS orientation was tested only at ambient temperature and 600ºC. The specimens
were heated to the target temperature and held for 10 minutes before loading at a
displacement rate of 0.30 mm/min, or a strain rate ≈ 10-3/s. A high temperature
extensometer, with ceramic arms extending into the furnace, was used to measure grip-to-
grip displacement. Tensile properties were generally determined in accordance with
ASTM test standard E8M-13 [24].
3. Results and Discussion
3.1 Microstructural characterization
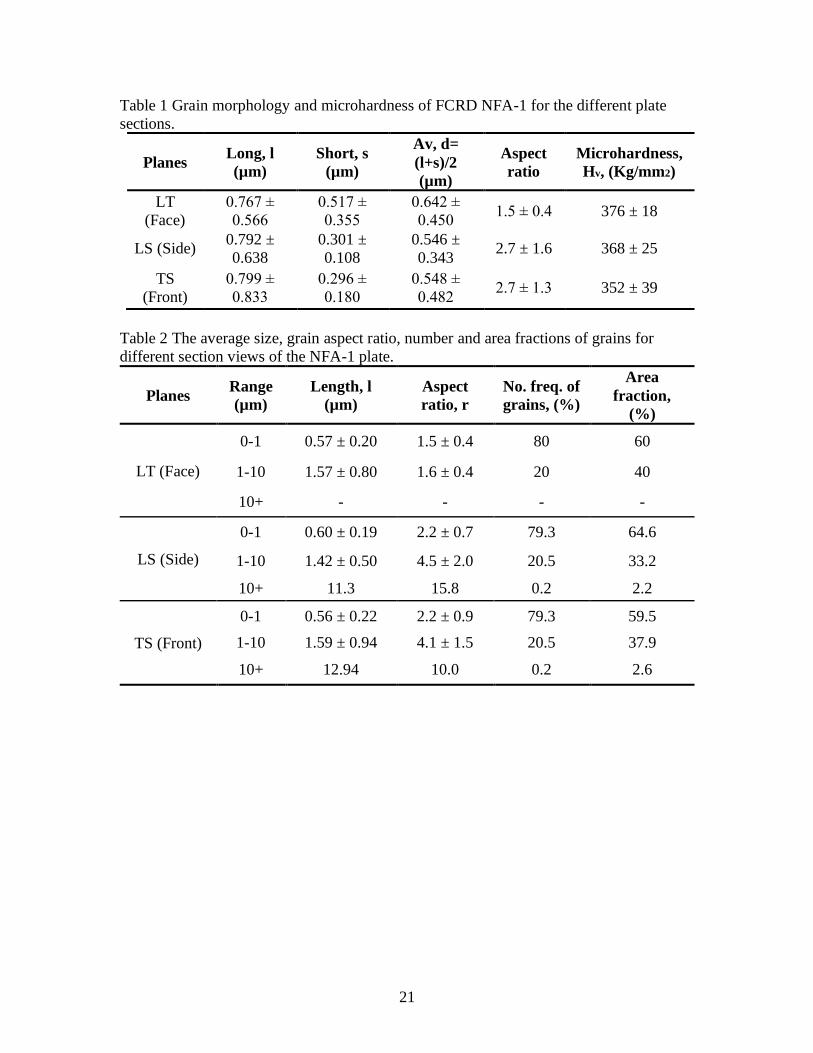
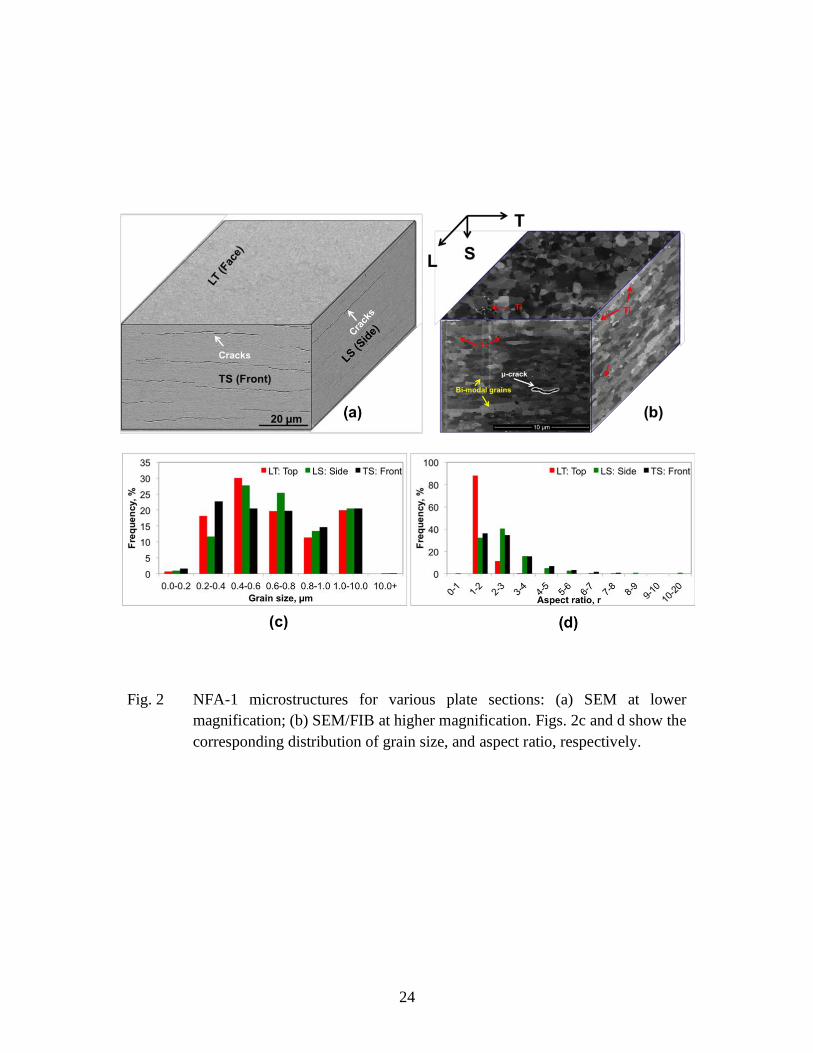
The dimensions of the grains and their distribution from different sections (i.e. LT - face,
LS - side and TS - front) of the extruded and cross-rolled NFA-1 plate are shown in Tables
1 and 2 and Fig. 2. Figures 2a and b show the low magnification SEM, and high
magnification SEM/FIB images, respectively, of the as-fabricated and pre-test NFA-1 for

7
different planes. The plate faces (LT) are crack-free, with nearly uniform, equiaxed,
ultrafine grains (see Table 1). In contrast, the side (LS), and front (TS) sections reveal a
large number of microcracks on planes parallel to the plate faces and normal to the short
thickness direction. The corresponding grains are pancake-shaped and elongated in the
extrusion (LS) and cross-rolling (TS) directions. A bimodal grain size distribution (most
are in sub-micron range, others are in micron size range with a small number of grains
larger than 10 µm) is also observed (see Table 2 and Fig. 2c). The pancake-shaped grain
aspect ratio (GAR) varies from ≈ 2 to 16; the GAR distribution is shown in Fig. 2d. The
fraction of submicron grains is ≈ 80%, representing ≈ 60% area fraction (see Table 2). A
through-thickness grain size variation is also observed, with thinner grains found near plate
faces and relatively thicker grains in the middle. Most as-fabricated NFAs exhibit bimodal
grain size distributions, especially at higher processing temperatures. In some cases large
grains can indicate a low number density of NOs. In this alloy, however, the Y is uniformly
distributed, likely due to inclusion during the atomization step, and high number densities
of NOs are observed in both the nano- and micron-sized grains. The precursor alloys to
NFA-1 have also shown this behavior and large grains with NOs have also been observed
by other research groups [25].
Coarse Ti- and Y-rich oxides stringers are also observed (Fig. 2b). Examination of
150 to 270 oxides showed that they ranged in size from ≈ 10 nm to 260 nm, averaging ≈
60 nm. These coarser oxides are predominantly located at or near prior particle grain
boundaries (Fig. 2b). Such features are common in NFA/ODS alloys [26]. Fig. 2 also
shows the presence of microcracks running normal to the plate thickness direction in both
the side (LS) and front (TS) plate views. The average opening, at the presumed initiation

8
point roughly at the crack center, is ≈ 250 nm. The crack separation distance in the short
thickness direction is ≈ 16µm. The crack lengths range from 2 to 105 µm averaging ≈
10µm (side section) to 15µm (front section). Detailed descriptions of the statistics of the
coarser precipitates and cracks are reported elsewhere [21].
Figure 3a shows an EBSD inverse pole figure (IPF) map for a section of the LS (side)
surface. The map is color-coded to show the grain orientation texturing in the extrusion
direction. As expected, most of the grains have a near <110>-fiber texture in the
extrusion direction. This texturing is also shown in the IPF intensity projection in the
bottom right insert of Fig. 3a. The EBSD map also shows one large and one small crack
parallel to the extrusion direction, although they may be linked below the surface.
The texturing is accompanied by the development of {001} planes normal to the
thickness direction. Notably, the resulting {100}<011> texture component represents the
most brittle cleavage system in BCC Fe. The {001}<001> sessile dislocations are formed
by the reaction of <111> type dislocations and produce sessile low-angle subgrain
boundaries on {100} planes. Further deformation results in dislocation pile-ups at the
subgrain boundaries, creating local stress concentrations and opening displacements that
form microcracks for the brittle {100}<110> cleavage system (Fig. 3b). The bright field
(BF) TEM image of a FIB lift-out lamella (Fig. 3b), prepared perpendicular to the crack
initiation front (top-left insert of Fig. 3b), shows dislocation tangles around the crack and
a microcrack running along a subgrain boundary on a {001} plane in a<110> direction.
Microcrack propagation is also driven further by residual stresses that develop during
deformation. The detailed mechanisms of texturing and microcrack formation in the
NFA-1 plate are discussed elsewhere [20].

9
3.2 14YWT Strength
Vickers microhardness (Hv) data for NFA-1 is summarized in Table 1. The Hv
averages 376 ± 18, 368 ± 25 and 352 ± 39 (kg/mm2) on the plate face, side and front,
respectively. The differences, of up to ~6%, are probably not statistically significant.
However, the higher standard deviation and lower value of Hv for the plate front and side
is likely due to delamination, which is discussed below.
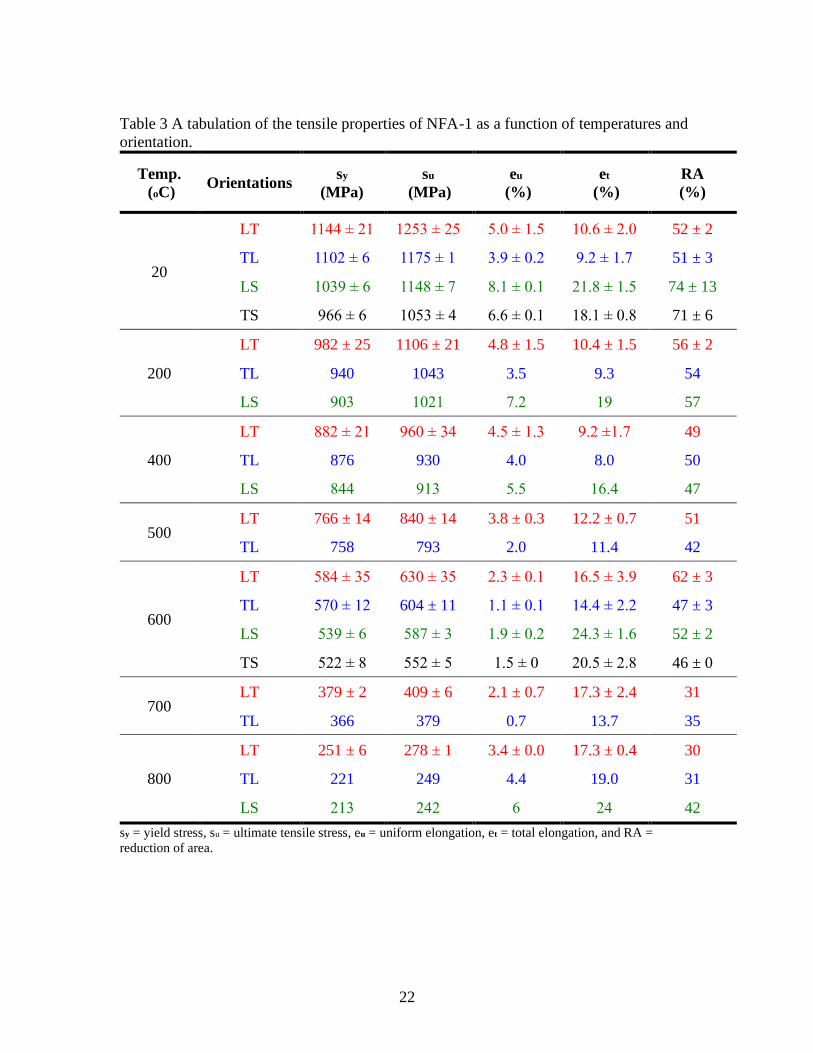
Engineering stress-strain or s(e) curves for the various orientations over a wide range
of temperatures are shown in Fig. 4. The average values of the engineering yield (sy) and
ultimate (su) stresses are plotted in Figs. 5a and b, respectively, while the corresponding
uniform (eu) and total (et) elongations are shown in Figs. 5c and d, respectively. Table 3
summarizes the average and standard deviations of the tensile properties as a function of
temperature and orientation. Note sy was determined at the standard nominal 0.2% offset.
Note the differences in s(e) in the elastic regime are due to temperature-dependent
compliance of the specimen and fixture coupling and the initial low load displacements.
Figure 6 plots the true stress () versus true plastic strain () curves starting at the
nominal 0.2% offset.
The LT orientation at ambient temperature (AT) exhibits the highest sy ≈ 1144 ± 21
MPa and su ≈1253 ± 25 MPa, accompanied by eu ≈ 5.0 ± 1.5 % and et ≈ 10.6 ± 2.0 %,
respectively. The TL orientation generally showed similar strength and ductility.
However, the sy and su in the LS and TS orientations are slightly lower (≈10%), while
their corresponding et values are much larger. These differences arise from a combination
of texturing, varying grain dimensions and the presence of microcracks and delamination.

10
As illustrated in Fig. 7a, the LT and TL orientations delaminate, forming splits in the
dog bone coupon specimen thickness dimension, propagating parallel to the gauge
section width. In the case of the LS and TS orientations multiple delaminations split the
width of the gauge section, propagating parallel to the thickness dimension as seen in
Figs. 7b and d. One effect of the 90o delamination LT/TL and LS/TS rotation is to lower
the lateral stresses, perhaps reducing slightly any triaxial constraint effects. Indeed the
s(e) curves in Fig. 4b show possible reductions in the necking constraint in the width
direction. Figs. 7e and f show a schematic of the microcracks in the two cases. The higher
magnification SEM images of fracture surface in the plate face orientation (LT or TL)
show large flat-bottomed features, separated by shear lips (Fig. 7g). In contrast, Fig. 7h
shows more classical, fine scale ductile-dimple fracture surfaces. The scale of the damage
is related to the geometry of the microcracks and specimen width versus thickness. When
the microcrack planes are parallel to the gauge section width (LT – broad faces) the scale
of damage appears coarser, while the corresponding scale appears finer when the
microcracks are parallel to the gauge section thickness (LS or TS - thin faces).
Thus, while the s(e) curves are primarily controlled by the actual intrinsic material
properties of NFA-1, pre-existing microcrack damage and extrinsic factors, like the dog
bone coupon tensile specimen geometry, also play a role. Better understanding of how
the mix of texturing, damage and extrinsic factors govern tensile deformation of NFA-1
will be investigated in future studies. These studies will be based on finite element
simulations, which we routinely use to extract post-necking true () constitutive laws [9,
27] from tensile test s(e) data. The future simulations will treat all of the extrinsic factors

11
noted above. However, further discussion of this complex topic is beyond the scope of
this paper.
As is common with NFAs and other steels, the sy and su decrease relatively slowly
between ambient temperature and ≈ 400°C. This is primarily due to the corresponding
decrease in the shear modulus [1, 28, 29]. The strength of NFA-1 is controlled by
contributions from: (a) Hall-Petch grain boundary strengthening; (b) dislocation pinning
by NOs; (c) network dislocation and subgrain structures; and, (d) solid solution matrix
hardening [1, 5, 26, 30]. The sy and su decrease more rapidly above 500ºC due to a variety
of thermally activated processes, including dislocation bypass mechanisms associated
with de-pinning from the NOs. Above 600°C deformation is dominated by viscoplastic
creep, even at relatively high strain rates [1, 29-31]. Creep is indicated by the almost
constant true seen in the post-transient () curves in Fig. 6. In the creep regime, the
stress at an imposed strain rate () and given temperature is governed by a threshold
stress (t) power law dislocation mechanisms as [5, 32]
= Cexp(-Qc/RT)( - t)n.
Here Qc is the creep activation energy. The t is a significant fraction of the dislocation
obstacle-strengthening component of the static y. A more detailed discussions of NFA
creep properties and processes can be found elsewhere [1, 5, 33] and will be described for
NFA-1 in future publications. Again this paper focuses on nominal strain rate (≈ 10-3)
quasi-static tensile properties.
In spite of the strength decrease above 400ºC, NFA-1 remains strong at higher
temperatures, with sy and su of 584 ± 35 MPa and 630 ± 35 MPa at 600ºC and 251 ± 6
and 278 ± 1 MPa at 800ºC, respectively (Table 3 and Fig. 5). Notably, NFA-1 retains ≈
12
22% of its ambient temperature strength up to ~ 2/3 Tm, hence qualifies as a ferritic
superalloy [1].
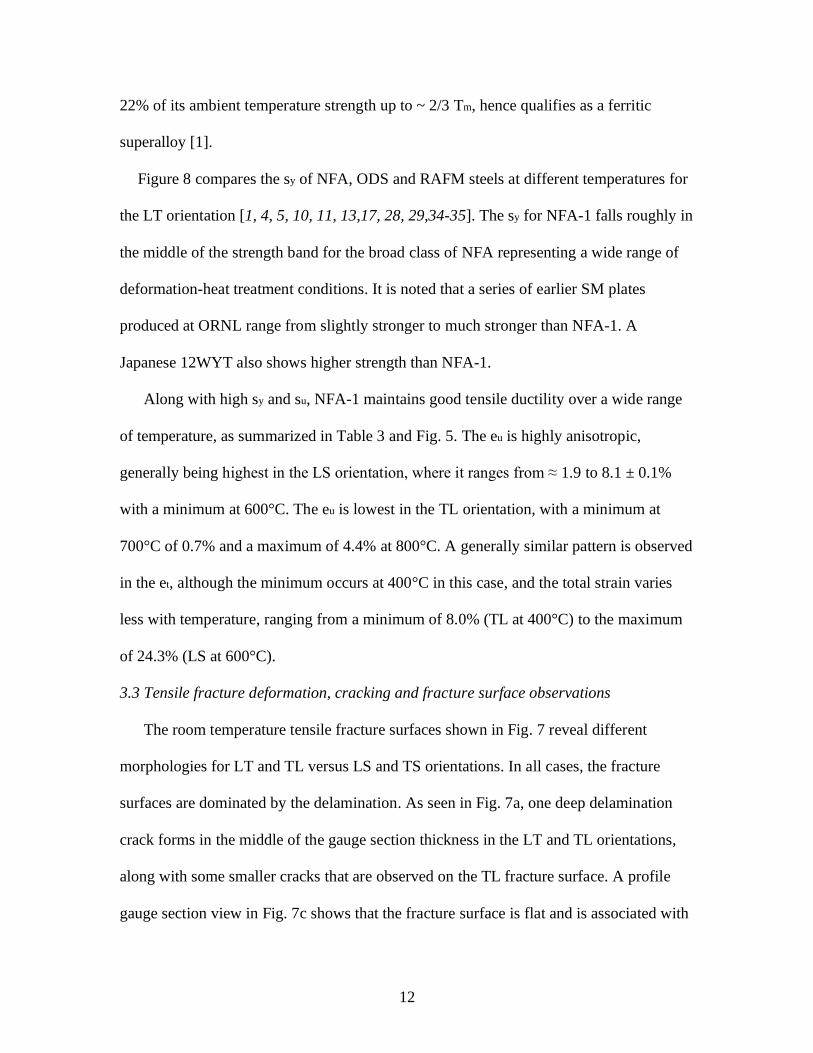
Figure 8 compares the sy of NFA, ODS and RAFM steels at different temperatures for
the LT orientation [1, 4, 5, 10, 11, 13,17, 28, 29,34-35]. The sy for NFA-1 falls roughly in
the middle of the strength band for the broad class of NFA representing a wide range of
deformation-heat treatment conditions. It is noted that a series of earlier SM plates
produced at ORNL range from slightly stronger to much stronger than NFA-1. A
Japanese 12WYT also shows higher strength than NFA-1.
Along with high sy and su, NFA-1 maintains good tensile ductility over a wide range
of temperature, as summarized in Table 3 and Fig. 5. The eu is highly anisotropic,
generally being highest in the LS orientation, where it ranges from ≈ 1.9 to 8.1 ± 0.1%
with a minimum at 600°C. The eu is lowest in the TL orientation, with a minimum at
700°C of 0.7% and a maximum of 4.4% at 800°C. A generally similar pattern is observed
in the et, although the minimum occurs at 400°C in this case, and the total strain varies
less with temperature, ranging from a minimum of 8.0% (TL at 400°C) to the maximum
of 24.3% (LS at 600°C).
3.3 Tensile fracture deformation, cracking and fracture surface observations
The room temperature tensile fracture surfaces shown in Fig. 7 reveal different
morphologies for LT and TL versus LS and TS orientations. In all cases, the fracture
surfaces are dominated by the delamination. As seen in Fig. 7a, one deep delamination
crack forms in the middle of the gauge section thickness in the LT and TL orientations,
along with some smaller cracks that are observed on the TL fracture surface. A profile
gauge section view in Fig. 7c shows that the fracture surface is flat and is associated with

13
only a modest reduction in width. However, both the LT and TL orientations thin
extensively in the thickness direction forming two approximately knife-edge-type
features surrounding the mid-section out-of-plane delamination. Together these
deformation patterns yield a significant reduction in area (RA) of ≈ 52 ± 2%. In contrast,
as seen in Figs. 7b and d, multiple delamination cracks are observed that split the width
of the LS and TS specimens. In this case, necking occurs in both the thickness and width
directions, leading to a larger RA of 74 ± 13%. Qualitatively, the reduction in strength
and increase in ductility correlates with the number and orientation of the delaminations.
This correlation could be due to relaxation of a multi-axial stress state, although it is
difficult to understand in the context of a uniaxial loading prior to necking. Thus, as
noted previously, more detailed finite element simulations of the tensile test are needed.
Further discussion of deformation and fracture mechanisms will focus on LT and LS
since they show similar behavior to their respective TL and TS counterparts. Fig. 9 shows
the fracture surfaces and profiles for tests at 200 ºC. The results are generally very similar
to those at ambient temperature, except for the notable absence of major delamination.
The absence of delamination is due to a brittle-to-ductile transition for microcrack
cleavage fracture toughness that occurs in the 23 to 200ºC temperature interval. This
transition will be addressed in future publications, including the short orientation tests
[36]. Both eu and et decrease when increasing from ambient temperature to 200°C, with a
RA of ≈ 56 ± 2 % for LT and 57 % for LS. Note, the RA at 200ºC in all the orientations
are quite similar in the absence of delamination.
Fig. 10 shows the fracture characteristics of LT and LS at 400 ºC. The LT orientation
again behaves in a very similar manner to that at lower temperatures, and again with no

14
sign of any delamination. Fracture in the LS orientation occurs by double shear, as shown
in the profile view, along with a single shallow out-of-plane arrested crack. Necking
occurs in both the thickness and width directions, resulting in ≈ 47% RA. The fracture
surfaces are similar to those at lower temperature in both cases. The et is minimum at
400°C, and again higher in the LS orientation. In contrast eu is minimum at ≈ 700°C. The
observed temperature trend marks the transition to viscoplastic creep, starting above
400°C. There is a generally similar eu and et in both orientations, and the differences are
smaller for eu.
Figure 11 shows the fractography results for tests at 600ºC. No delamination is
observed and necking occurs in both directions, with up to ≈ 62% RA. The fracture
surfaces again appear to be similar to those at lower temperatures. Side surface cracking
normal to the loading direction near the fracture surface is still observed especially in the
LS orientation. Note the side surface cracking evolves from being parallel to the loading
direction at RT, a mix of 45° and normal cracks at 200-400ºC, and normal at or above
600°C. The eu is near minimum at 600°C.
The specimens are too oxidized to clearly observe the fracture surfaces in detail at
800°C. However, overall observations show that there is little necking in the tertiary
creep regime, but the substantial eu and et ductility is due to the extensive plastic strain in
the minimum creep regime. The oxidized fracture surface appears to show a mix of
smaller and larger dimple features. The sidewalls of the larger features are filled with
smaller dimples (Fig. 12e and f inserts).

15
4. Summary and Conclusions
A summary of the conclusions that can be drawn from our tensile test deformation and
fracture study of 14YWT NFA-1 is the following:
1. Deformation processing produces a bimodal distribution of pancake-shaped grains that
are nearly equiaxed when observed on the plate surface and flattened and elongated as
seen in the side sections. Small sub-µm grains are dominant, but represent only ≈ 60% of
the grain area fraction.
2. A large population of microcracks form on planes parallel to the broad plate surfaces
during extrusion and cross rolling. A more detailed description of the micro cracks and
their formation mechanisms are reported elsewhere [20].
3. The microcracks lead to extensive, geometrically mediated delamination during tensile
testing at lower temperatures.
4. The absence of delamination at 200ºC and above is due to a brittle-to-ductile transition
for microcrack cleavage fracture toughness.
5. NFA-1 is a very strong alloy. The average ambient temperature NFA-1 microhardness
ranges from 352 to 376 kg/mm2 on the various plate faces. The ambient temperature sy
and su range from 966 to 1144 MPa and 1053 to 1253 MPa, respectfully. The absolute
strength difference decreases with increasing temperature.
6. The tensile ductility parameters (eu, et and RA) are much more anisotropic and
temperature dependent with a minimum in eu at ≈ 700°C and in et at ≈ 400°C. However,
there is substantial RA in all cases except at 800°C.

16
7. Delamination, and some extrinsic factors, play a moderate role in NFA-1 strength, and
a somewhat stronger role in tensile ductility. The ductile fracture patterns are strongly
affected by delamination cracking , but this decreases with increasing temperature.
Acknowledgments
The authors gratefully acknowledge the support received for this research work by the
U.S. Department of Energy Office of Fusion Energy Sciences (DE-FG03-94ER54275)
and the Office of Nuclear Energy university programs administered by INL (IDNL
Award #00119430 8-442520-59048).

17
References
[1] G. R, Odette, “Recent progress in developing and qualifying nanostructured
ferritic alloys for advanced fission and fusion applications”, JOM, 66 (2014)
2427-2441.
[2] Ch. Ch. Eiselt, M. Klimenkov, R. Lindau, A. Moslang, G. R. Odette, T.
Yamamoto and D. Gragg, “Tensile and fracture toughness properties of the
nanostructured oxide dispersion strengthened ferritic alloy 13Cr-1W-0.3Ti-
0.3Y2O3”, Journal of Nuclear Materials, 417 (2011) 193-196.
[3]
N. J. Cunningham, Y. Wu, A. Etienne, E. M. Haney, G. R. Odette. E. Stergar, D.
T. Hoelzer, Y. D. Kim, B. D. Worth and S. A. Maloy, “Effect of bulk oxygen on
14YWT nanostructured ferritic alloys”, Journal of Nuclear Materials, 444 (2014)
35-38.
[4] I. S. Kim, B. Y. Choi, C. Y. Kang, T. Okuda, P. J. Maziasz and K. Miyahara,
“Effect of Ti and W on the mechanical properties and microstructure of 12%Cr
base mechanical alloyed nano-sized ODS ferritic alloys”, ISIJ International, 43
(2003) 1640-1646.
[5] G. R. Odette, M. J. Alinger and B. D. Wirth, “Recent developments in
irradiation-resistant steels”, The Annual Review of Materials Research, 38
(2008) 471-503.
[6] G. R. Odette and D. T. Hoelzer, “Irradiation-tolerant nanostructured ferritic
alloys: transforming helium from a liability to an asset”, JOM, 62 (2010) 84-92.
[7] Y. Dai, G. R. Odette and T. Yamamoto, “The effects of helium in irradiated
structural alloys." Comprehensive nuclear materials, 1 (2012) 141-193.
[8] M. J. Alinger, G. R. Odette, and G. E. Lucas, “Tensile and fracture toughness
properties of MA957: implications to the development of nanocomposited
ferritic alloys”, Journal of Nuclear Materials, 307-311 (2002) 484-489.
[9] S. A. Maloy, T. A. Saleh, O. Anderoglu, T. J. Romero, G. R. Odette, T.
Yamamoto, J. I. Cole and R. Fielding, “Characterization and comparative
analysis of the tensile properties of five tempered martensitic steels and an oxide
dispersion strengthened ferritic alloy irradiated at ≈ 295ºC to ≈ 6.5 dpa”, Journal
of Nuclear Materials, 468 (2016) 232-239.
[10] D. T. Hoelzer, K. A. Unocic, E. T. Manneschmidt and M. A. Sokolov,
“Reference characterization of the advanced ODS 14YWT-SM12 heat used in
HFIR JP30/31 neutron irradiation experiment”, Fusion Materials Semiannual
Progress Report for Period Ending June 30, 2012, DOE/ER-0313/52, U. S.
Department of Energy, 52 (2012) 33-46.

18
[11] D. A. McClintock, D. T. Hoelzer, M. A. Sokolov, R. K. Nanstad, “ Mechanical
properties of neutron irradiated nanostructured ferritic alloy 14WYT”, Journal of
Nuclear Materials, 386-388 (2009) 307-311.
[12] T. S. Byun, J. H. Yoon, S. H. Wee, D. T. Hoelzer, and S. A. Maloy, “Fracture
behavior of 9Cr nanostructured ferritic alloy with improved fracture toughness”,
Journal of Nuclear Materials, 449 (2014) 39-48.
[13] D. T. Hoelzer, J. Bentley, M. A. Sokolov, M. K. Miller, G. R. Odette, M. J.
Alinger, “Influence of particle dispersions on the high-temperature strength of
ferritic alloys”, Journal of Nuclear Materials, 367-370 (2007) 166-172.
[14] M. J. Alinger, G. R. Odette and D. T. Hoelzer, “On the role of alloy composition
and processing parameters in nanocluster formation and dispersion strengthening
in nanostructured ferritic alloys”, Acta Materialia, 57 (2009) 392-406.
[15] J. H. Kim, K. M. Kim, T. S. Byun, D. W. Lee, and C. H. Park, “High-
temperature oxidation behavior of nanostructured ferritic oxided dispersion-
strengthened alloys”, Thermochimical Acta, 579 (2014) 1-8.
[16] P. Miao, G. R. Odette, T. Yamamoto, M. Alinger, D. Hoelzer and D. Gragg,
“Effects of consolidation temperature, strength and microstructure on fracture
toughness of nanostructured ferritic alloys”, Journal of Nuclear Materials, 367-
370 (2007) 208-212.
[17] N.J. Cunningham, Y. Wu, G.R. Odette, D. Gragg, K. Field, D.T. Hoelzer, S.A.
Maloy, “Characterization of the final precursor alloy to a larger best practice
heat of 14YWT,” Fusion Materials Semiannual Progress Report for Period
Ending December 31, 2012, DOE/ER-0313/53, U. S. Department of Energy, 53
(2012) 20-33.
[18] N. J. Cunningham, Y. Wu, G. R. Odette, D. T. Hoelzer, S. A. Maloy,
“Characterization of a larger best practice heat of 14YWT in annealed powder,
HIP consolidated and extruded forms”, Fusion Materials Semiannual Progress
Report for Period Ending June 30, 2013, DOE/ER-0313/54, U. S. Department of
Energy, 54 (2013) 15-26.
[19] M. E. Alam, N. J Cunningham, D. Gragg, K. Fields, G. R. Odette, D. T. Hoelzer
and S. A. Maloy, “Mechanical Properties Characterization of a Larger Best
Practice Heat of 14YWT NFA1”, Fusion Materials Semiannual Progress Report
for Period Ending June 30, 2014, DOE/ER-0313/56, U. S. Department of
Energy, 56 (2014) 63-69.
[20] S. Pal, M. E. Alam, G. R. Odette, D. Hoelzer and S. Maloy, “ Microstructure,
texturing, microcracking and delamination behavior of NFA-1”, Fusion
Materials Semiannual Progress Report for Period Ending June 30, 2015,
DOE/ER-0313/58, U. S. Department of Energy, 58 (2015) 66-82.

19
[21] M. E. Alam, S. Pal, D. Gragg, G. R. Odette, D. T. Hoelzer and S. A. Maloy,
“Microstructural and Mechanical Behavior of as-fabricated and Annealed
14YWT NFA-1 Alloy”, Fusion Materials Semiannual Progress Report for Period
Ending December 31, 2015, DOE/ER-0313/59, U. S. Department of Energy, 59
(2015) 35-46.
[22] ASTM E384-11e1, Standard test method for Knoop and Vickers hardness of
materials, ASTM International, West Conshohocken, PA, 2011.
[23] H. Je, “Stress corrosion cracking behavior of oxide dispersion strengthened
ferritic steel in supercritical pressurized water”, PhD thesis, Kyoto University
(2013), p-109.
[24] ASTM E8/E8M-13, Standard test methods for tension testing of metallic
materials”, ASTM International, West Conshohocken, PA, 2013.
[25] Ch. Ch. Eiselt, M. Klimenkov, R. Lindau and A. Moslang, “Characteristics
results and prospects of the 13Cr-1W-0.3Ti-0.3Y2O3 ODS steel”, Journal of
Nuclear Materials, 386-388 (2009) 525-528.
[26] N. J. Cunningham, “Study of the structure, composition, and stability of Y-Ti-O
nm-scale features in nanostructured ferritic alloys”, Ph.D thesis, UCSB, 2012.
[27] T. Yamamoto, G. R. Odette and M. A. Sokolov, “On the fracture toughness of
irradiated F82H: Effects of loss of constraint and strain hardening capacity”,
Journal of Nuclear Materials, 417 (2011) 115-119.
[28] R. L. Klueh, J. P. Shingledecker, R. W. Swindeman, and D. T. Hoelzer, “Oxide
dispersion-strengthened steels: A comparison of some commercial and
experimental alloys”, Journal of Nuclear Materials, 341 (2005) 103-114.
[29] J. H. Kim, T. S. Byun, D. T. Hoelzer, S. W. Kim and B. H. Lee, “Temperature
dependence of strengthening mechanisms in the nanostructured ferritic alloy
14YWT: Part I-Mechanical and microstructural observations”, Materials Science
and Engineering A, 559 (2013) 101-110.
[30] J. H. Kim, T. S. Byun, D. T. Hoelzer, C. H. Park, J. T. Yeom and J. K. Hong,
“Temperature dependence of strengthening mechanisms in the nanostructured
ferritic alloy 14YWT: Part II-Mechanistic models and predictions”, Materials
Science and Engineering A, 559 (2013) 111-118.
[31] A. Steckmeyer, M. Praud, B. Fournier, J. Malaplate, J. Garnier, J.L. Béchade, I.
Tournié, A. Tancray, A. Bougault, and P. Bonnaillie, “Tensile properties and
deformation mechanisms of a 14Cr ODS ferritic steel”, Journal of Nuclear
Materials, 405 (2010) 95-100.

20
[32] D. J. Srolovitz, R. A. Petkovic-Luton, and M. J. Luton, “Diffusion relaxation of
the dislocation-inclusion repulsion”, Philosophical Magazine A, 48 (1983) 795-
809.
[33] S. Ukai, T. Okuda, M. Fujwara, T. Kobayashi, S. Mizuta and H. Nakashima,
“Characterization of high temperature creep properties in recrystallized 12Cr-
ODS ferritic steel claddings”, Journal of Nuclear Science and technology, 39
(2002) 872-879.
[34] T. S. Byun, D. T. Hoelzer, G. R. Romanosky, and D. A. McClintock,
“Thermochemical behavior of nanostructured ODS alloys”, ICFRM-14
Conference (2009) Sapporo, Japan.
[35] G. Zhang, Z. Zhou, M. Wang, S. Li, L. Zou and L. Zhang, “Tensile and Charpy
impact properties of an ODS ferritic/martensitic steel 9Cr-1.8W-0.5Ti-
0.35Y2O3”, Fusion Engineering and Design, 89 (2014) 280-283.
[36] M. E. Alam, K. Fields, G. R. Odette, D. T. Hoelzer and S. A. Maloy, “Tensile
Property Characterization of 14YWT Nanostructured Ferritic Alloy NFA1”,
Fusion Materials Semiannual Progress Report for Period Ending December 31,
2014, DOE/ER-0313/57, U. S. Department of Energy, 57 (2014) 39-47.
21
Table 1 Grain morphology and microhardness of FCRD NFA-1 for the different plate
sections.
Planes Long, l
(µm)
Short, s
(µm)
Av, d=
(l+s)/2
(µm)
Aspect
ratio
Microhardness,
Hv, (Kg/mm2)
LT
(Face)
0.767 ±
0.566
0.517 ±
0.355
0.642 ±
0.450 1.5 ± 0.4 376 ± 18
LS (Side) 0.792 ±
0.638
0.301 ±
0.108
0.546 ±
0.343 2.7 ± 1.6 368 ± 25
TS
(Front)
0.799 ±
0.833
0.296 ±
0.180
0.548 ±
0.482 2.7 ± 1.3 352 ± 39
Table 2 The average size, grain aspect ratio, number and area fractions of grains for
different section views of the NFA-1 plate.
Planes Range
(µm)
Length, l
(µm)
Aspect
ratio, r
No. freq. of
grains, (%)
Area
fraction,
(%)
LT (Face)
0-1 0.57 ± 0.20 1.5 ± 0.4 80 60
1-10 1.57 ± 0.80 1.6 ± 0.4 20 40
10+ - - - -
LS (Side)
0-1 0.60 ± 0.19 2.2 ± 0.7 79.3 64.6
1-10 1.42 ± 0.50 4.5 ± 2.0 20.5 33.2
10+ 11.3 15.8 0.2 2.2
TS (Front)
0-1 0.56 ± 0.22 2.2 ± 0.9 79.3 59.5
1-10 1.59 ± 0.94 4.1 ± 1.5 20.5 37.9
10+ 12.94 10.0 0.2 2.6
22
Table 3 A tabulation of the tensile properties of NFA-1 as a function of temperatures and
orientation.
Temp.
(oC) Orientations
sy
(MPa)
su
(MPa)
eu
(%)
et
(%)
RA
(%)
20
LT 1144 ± 21 1253 ± 25 5.0 ± 1.5 10.6 ± 2.0 52 ± 2
TL 1102 ± 6 1175 ± 1 3.9 ± 0.2 9.2 ± 1.7 51 ± 3
LS 1039 ± 6 1148 ± 7 8.1 ± 0.1 21.8 ± 1.5 74 ± 13
TS 966 ± 6 1053 ± 4 6.6 ± 0.1 18.1 ± 0.8 71 ± 6
200
LT 982 ± 25 1106 ± 21 4.8 ± 1.5 10.4 ± 1.5 56 ± 2
TL 940 1043 3.5 9.3 54
LS 903 1021 7.2 19 57
400
LT 882 ± 21 960 ± 34 4.5 ± 1.3 9.2 ±1.7 49
TL 876 930 4.0 8.0 50
LS 844 913 5.5 16.4 47
500 LT 766 ± 14 840 ± 14 3.8 ± 0.3 12.2 ± 0.7 51
TL 758 793 2.0 11.4 42
600
LT 584 ± 35 630 ± 35 2.3 ± 0.1 16.5 ± 3.9 62 ± 3
TL 570 ± 12 604 ± 11 1.1 ± 0.1 14.4 ± 2.2 47 ± 3
LS 539 ± 6 587 ± 3 1.9 ± 0.2 24.3 ± 1.6 52 ± 2
TS 522 ± 8 552 ± 5 1.5 ± 0 20.5 ± 2.8 46 ± 0
700 LT 379 ± 2 409 ± 6 2.1 ± 0.7 17.3 ± 2.4 31
TL 366 379 0.7 13.7 35
800
LT 251 ± 6 278 ± 1 3.4 ± 0.0 17.3 ± 0.4 30
TL 221 249 4.4 19.0 31
LS 213 242 6 24 42
sy = yield stress, su = ultimate tensile stress, eu = uniform elongation, et = total elongation, and RA =
reduction of area.
23
Fig. 1 (a) NFA-1 plate section views and tensile specimen orientations with respect
to the extrusion, cross rolling and thickness directions; and, (b) the
dimensions of the SSJ2 dogbone tensile specimen.
24
Fig. 2 NFA-1 microstructures for various plate sections: (a) SEM at lower
magnification; (b) SEM/FIB at higher magnification. Figs. 2c and d show the
corresponding distribution of grain size, and aspect ratio, respectively.

25
Fig. 3 (a) EBSD IPF map and intensity projection (bottom right insert) for the plate
side section (LS) show a strong <110> fiber texture in the extrusion direction;
and, (b) FIB lift-out bright field TEM image of a crack initiation region (top-
left insert) shows a microcrack running along a subgrain boundary in a {001}
plane and on a<110> direction. Top-right insert is the selected area diffraction
(SAD) pattern using the (002) reflection.

26
Fig. 4 Engineering stress-strain curves as a function of temperature and orientation
for: (a) LT and TL; and, (b) LS and TS.

27
Fig. 5 NFA-1 strength and ductility as a function of temperature for: (a) the 0.2%
yield stress, sy; (b) the ultimate tensile stress, su; (c) uniform elongation, eu;
and, (d) total elongation, et. Red square: LT, blue square: TL, green triangle:
LS, and black triangle: TS orientations, respectively.

28
Fig. 6 True stress-true plastic strain curves as a function of temperature and
orientation for: (a) LT and TL; and (b) LS and TS.

29
Fig. 7 Images of NFA-1 tensile specimens tested at ambient temperature: (a-b)
macro-views of a fracture surface; (c-d) macro (insert) and higher
magnification view of a tensile specimen side surface, marked as boxed; (e-
f) schematic of the microcracks in the two orientations; and (g-h) high
magnification images of ductile fracture surfaces for LT and TL as well as
LS and TS. Note that all the inserted macro-views show the length
(horizontal direction), and width (vertical direction), as well as the fractured
edge, of the tensile specimen.

30
Fig. 8 The 0.2% yield strength of various NFA steels as a function of temperature
along with NFA-1 [1, 4, 5, 10, 11, 13,17, 28, 29, 34-35].

31
Fig. 9 Images of NFA-1 LT (left) and LS (right) tensile specimens tested at 200ºC
showing: (a-b) macro-views of a fracture surface; (c-d) macro (insert) and
higher magnification view of a tensile specimen side surface; and (e-f) high
magnification images of ductile fracture surfaces. See text for a discussion.

32
Fig. 10 Images of NFA-1 LT (left) and LS (right) tensile specimens tested at 400ºC
showing: (a-b) macro-views of a fracture surface; (c-d) macro (insert) and
higher magnification view of a tensile specimen side surface; and (e-f) high
magnification images of ductile fracture surfaces. See text for a discussion.

33
Fig. 11 Images of NFA-1 LT and TL (left), and LS and TS (right) tensile specimens
tested at 600ºC showing: (a-b) macro-views of a fracture surface; (c-d) macro
(insert) and higher magnification view of a tensile specimen side surface; and
(e-f) high magnification images of ductile fracture surfaces. See text for a
discussion.

34
Fig. 12 Images of NFA-1 LT (left) and LS (right) tensile specimens tested at 800ºC
showing: (a-b) macro-views of a fracture surface; (c-d) macro (insert) and
higher magnification view of a tensile specimen side surface; and (e-f) high
magnification images of ductile fracture surfaces. See text for a discussion.
Copyright © 2022 FDOKUMEN