STUDY ON MIX DESIGN \u0026 HARDENED PROPERTIES OF SELF-COMPACTING CONCRETE
Upload
khangminh22Category
view
3download
0
FLEXURAL BEHAVIOUR OF SELF-COMPACTING
CONCRETE WITH PARTIAL REPLACEMENT OF
CEMENT BY RICE HUSK ASH
A dissertation submitted in the partial fulfillment of the requirement for the
award of the degree of
MASTER OF TECHNOLOGY
in
STRUCTURAL ENGINEERING
by
SANKET R. JAGTAP
(Reg. No. 2016PGCESE05)
Under the guidance
of
Dr. S. R. PANDEY Associate Professor
Department of Civil Engineering
DEPARTMENT OF CIVIL ENGINEERING
NATIONAL INSTITUTE OF TECHNOLOGY
JAMSHEDPUR-831014, JHARKHAND (INDIA)
JUNE, 2018
NATIONAL INSTITUTE OF TECHNOLOGY
JAMSHEDPUR
CANDIDATE’S DECLARATION
I hereby certify that this work is being proposed in the thesis entitled “Flexural
Behaviour of Self-Compacting Concrete with Partial Replacement of cement by Rice
Husk Ash ” in partial fulfilment for the award of degree of Master of Technology and
submitted in Department of Civil Engineering, National Institute of Technology
Jamshedpur is an authentic record of my own work carried out during a period from
August 2017 to June 2018 under the supervision of Dr. Shashi Ranjan Pandey, Associate
Professor, Department of Civil Engineering, National Institute of Technology,
Jamshedpur.
The matter embodied in this thesis has not been submitted by me for the award of any
other degree.
(SANKET RAMCHANDRA JAGTAP)
Reg. No.: 2016PGCESE05
This is to certify that the above statement made by the candidate is true and correct to the
best of my/our knowledge and belief.
Dr. Shashi Ranjan Pandey
Associate Professor
Department of Civil Engineering
NIT Jamshedpur
The viva-voice examination of Mr. SANKET RAMCHANDRA JAGTAP, Master of
Technology, has been held on __________
Signature of supervisor External Examiner
Head of the Department
Department of Civil Engineering
NIT Jamshedpur

ii
DEDICATED
TO
FAMILY
iii
ACKNOWLEDGEMENT
I would like to express my sincere gratitude to my guide Dr. Shashi Ranjan
Pandey, Associate Professor, Department of Civil Engineering, NIT Jamshedpur, for
giving me the opportunity to work with him and also providing excellent guidance
and continuous assistance throughout the project. The guidance and support from Dr.
Braj Kishor Prasad, Ex HOD, Civil Engineering, NIT Jamshedpur has been a key in
my academics and personal development during this two year.
Further, I want to thank Dr. Rakesh Pratap Singh, Head of the Department,
Civil Engineering, NIT Jamshedpur for giving me an opportunity to complete this
project. I would also like to thank all the faculty members of Civil Engineering
Department, NIT Jamshedpur for their assistance during this tenure.
I would like to give a special mention to the Research Scholars Mr. Amit
Kumar, Mr. Prince Singh and Mr. Jeeva Chithambaram for helping me throughout in
my entire M.Tech programme.
My acknowledgement would be incomplete without expressing my heartfelt
gratitude towards my best friends Manish Kumar, Chetak Kumar and Basundhara
Basumatary. Last but not the least, I owe my gratitude to my Classmates, my Family
and the Almighty, for providing me all the strength and love to make this dream true.
Thanking one and all
Sanket Jagtap
iv
ABSTRACT
Cement is one of the most important construction materials, and it is most likely that
the demand and importance of cement will continue to thrive for a long time in future
until some revolutionary alternative is introduced in the market. However cement
happens to be one of the most expensive materials in the exponentially growing
construction industry. Self-compacting concrete (SCC) is a modified product that,
without any additional compaction energy, flows and consolidates under the influence
of its own weight SCC can be produced using standard cements and additives. The
use of mineral admixture in concrete may bring lots of benefits like increased flow
and strength, decreased shrinkage, reduced water demand etc. In this project work,
RHA is being used as a partial replacement of ordinary Portland cement. The rice
husk ash is highly siliceous material that can be used as an admixture in concrete if
the rice husk is burnt in a specific manner. In this project, at first literature study on
the workability parameters, test methods for workability of SCC, flexural behaviour
of concrete and partial replacement of cement with different mineral admixtures is
presented. Subsequently, the feasibility of the materials to be used for mix design is
investigated, and then mix designing of M-30 grade concrete using rice husk ash as a
partial replacement of Ordinary Portland Cement is carried out by Nan-Su Method.
The evaluation of the fresh and hardened state properties of the mix is further
performed. The experimental investigation used to determine the level of self-
compacting ability was mainly based on Slump Flow test, L-box test, V-funnel test, J-
ring test and T50 cm as per EFNARC standards. For the experimental investigation of
hardened properties, the compressive strength, the flexural strength and the split
tensile strength were used. After the targeted design strength of Self Compacting
Concrete using Rice Husk Ash in percent of 5, 10, 15, 20, 25 and 30 as partial
replacement of Ordinary Portland Cement is achieved, a study of the flexural behavior
of the designed Reinforced Self Compacting Concrete beam specimens of size
150mm x 200mm x 1500 mm using rice husk ash as partial replacement of Ordinary
Portland Cement by 10%, 20% and 30% is done. The thesis further includes lucid and
rationalized discussions of the experimental results.
v
CONTENTS
Chapter No. Title Page No.
DECLARATION i
DEDICATION ii
ACKNOWLEDGEMENT iii
ABSTRACT iv
CONTENTS v
LIST OF FIGURES x
LIST OF TABLES xiii
NOMENCLATURE xvi
LIST OF ABBREVIATIONS xvii
Chapter 1 Introduction 1-9
1.1 Introduction 1
1.2 History behind development of SCC 2
1.3 Construction incorporating SCC 3
1.4 Mineral Admixture 4
1.4.1 Use of rice husk ash as filler material 5
1.5 Research Objectives 7
1.6 Research Methodology 7
1.7 Structure of the Thesis 8
Chapter 2 Literature Survey 10-19
2.1 Introduction 10
2.2 Literature Review 10
2.3 Recent Related Works 13
vi
2.4 Identified Background Problem 18
2.5 Motivation & Research Objectives 18
Chapter 3 Investigation on Materials Used 20-45
3.1 Introduction 20
3.2 Material Supplied 20
3.2.1 Cement 20
3.2.2 Aggregate 21
3.2.3 Mineral admixture (Rice Husk Ash) 23
3.2.4 Chemical Admixtures 24
3.2.5 Water 24
3.3 Methodology for Testing of Materials 25
3.3.1 Tests on Cement 25
3.3.1.1 Fineness of cement 25
3.3.1.2 Consistency of cement 26
3.3.1.3 Setting time of cement 27
3.3.1.4 Specific gravity of cement 28
3.3.2 Tests on Aggregates 28
3.3.2.1 Sieve analysis 29
3.3.2.2 Specific gravity & Water absorption test 30
3.3.2.3 Bulk density 32
3.3.2.4 Bulking of sand 32
3.3.3 Tests on Rice Husk Ash 34
vii
3.4 Test Results of Materials 34
3.4.1 Results for Cement 34
3.4.2 Results for Fine aggregate 36
3.4.3 Results for Coarse aggregates 39
3.4.4 Results for Rice Husk Ash 42
3.5 Result Discussion & Summary 43
3.5.1 Cement 43
3.5.2 Aggregates 43
3.5.3 Rice Husk Ash 45
3.5.4 Summary 45
Chapter 4 Experimental Program on SCC 46-74
4.1 Introduction 46
4.2 Methodology for Mix Design 46
4.3 Concrete Mix Design Data 48
4.3.1 Mix design by Nan-Su Method 48
4.3.2 Mix proportion for different mix 49
4.4 Experimental program for testing SCC 50
4.4.1 Tests on fresh state of concrete 50
4.4.2 Tests on hardened state of concrete 57
4.5 Results of the Properties of Concrete 61
4.5.1 Results for Fresh state properties 62
4.5.2 Results for Hardened state properties 67
4.6 Summary 74
viii
Chapter 5 Flexural Behaviour of Reinforced SCC beam 75-88
5.1 Introduction 75
5.2 Theoretical Load Carrying Capacity of Beam 75
5.3 Experimental programs for Reinforced SCC Beam 77
5.3.1 Preparation of Specimens 77
5.3.2 Testing procedure 78
5.3.3 Observations during testing 78
5.4 Experimental Results for Reinforced SCC Beam 80
5.4.1 Load carrying Capacity 80
5.4.2 Load-Deflection behavior 83
5.4.3 Comparison 87
5.5 Summary 87
Chapter 6 Inference & Analysis 89-96
6.1 Introduction 89
6.2 Results and Analysis of Fresh state properties of SCC 89
6.3 Results and Analysis of Hardened state properties of SCC 90
6.3.1 Compressive strength 91
6.3.2 Split tensile strength 92
6.3.3 Flexural strength 93
6.4 Flexural Behaviour of Reinforced SCC Beams 94
6.5 Summary 96
Chapter 7 Conclusion & Future Scope 97-99
7.1 Conclusion 97
7.2 Future Scope 99

ix
References 100-106
List of Publications 107
x
LIST OF FIGURES
Figure No. Figure Caption Page No.
Figure 3.1 OPC 53-grade, Coromandal King Brand 20
Figure 3.2 Fine aggregate 22
Figure 3.3 Coarse Aggregate 22
Figure 3.4 Rice Husk Ash 23
Figure 3.5 Super Plasticizer (Master Glenium Sky 8567) 24
Figure 3.6 Sieve Analysis 29
Figure 3.7 Testing of Bulk Density 33
Figure 3.8 Grain Size Distribution Curve of Fine Aggregates 36
Figure 3.9 Grain Size Distribution Curve of Coarse Aggregate 40
Figure 4.1 General Mix design procedure 46
Figure 4.2 Manual mixing of concrete adopted 50
Figure 4.3 V-Funnel 52
Figure 4.4 L-Box 54
Figure 4.5 J-Ring with Slump Cone 55
Figure 4.6 Specimens for test of Hardened state properties shown in (a) and (b) 57
Figure 4.7 (a) and (b) shows arrangement for compression testing of cubes 58
Figure 4.8 Cylinder specimen during Split Tensile Strength test 59
Figure 4.9 (a) and (b) shows a typical scenario of Flexural Strength Test 60
Figure 4.10 Slump Flow test result 62
Figure 4.11 V-Funnel test result 63
Figure 4.12 L-Box test result 64
Figure 4.13 J-Ring test result 65
xi
Figure No. Figure Caption Page No.
Figure 4.14 T50 cm test result 66
Figure 4.15 Compressive Strength for 3 days 67
Figure 4.16 Compressive Strength for 7 days 67
Figure 4.17 Compressive Strength for 28 days 68
Figure 4.18 Compressive Strength for 90 days 68
Figure 4.19 Compressive strength at different ages with progressive replacement
of cement with RHA 69
Figure 4.20 Split Tensile Strength for 3 days 69
Figure 4.21 Split Tensile Strength for 7 days 70
Figure 4.22 Split Tensile Strength for 28 days 70
Figure 4.23 Split Tensile Strength for 90 days 70
Figure 4.24 Split Tensile Strength at different ages with progressive replacement
of cement with RHA 71
Figure 4.25 Flexural Strength for 3 days 72
Figure 4.26 Flexural Strength for 7 days 72
Figure 4.27 Flexural Strength for 28 days 72
Figure 4.28 Flexural Strength for 90 days 73
Figure 4.29 Flexural Strength test at different ages with progressive replacement
of cement with RHA 74
Figure 5.1 Reinforcement details 77
Figure 5.2 Flexural Testing setup for Reinforced SCC beam 78
Figure 5.3 Beam of M30 grade with 10% RHA before testing 79
Figure 5.4 Cracks developed on beam of M30 grade with 10% RHA after
testing 79
xii
Figure No. Figure Caption Page No.
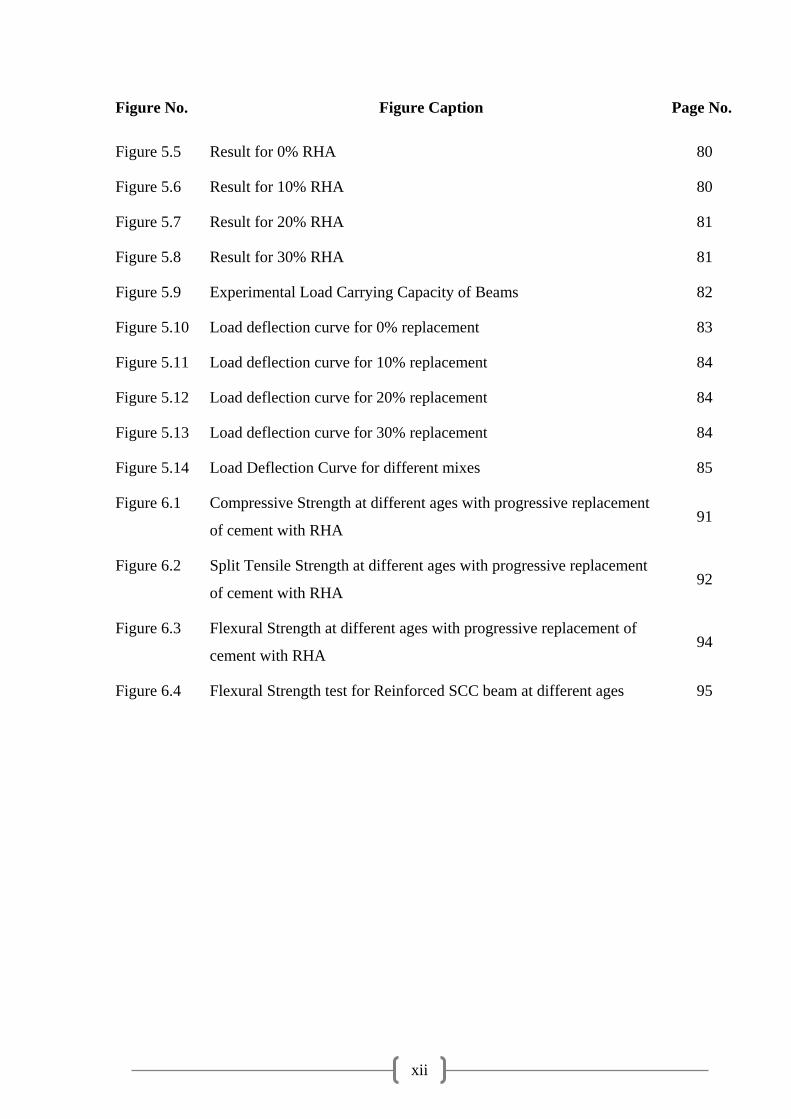
Figure 5.5 Result for 0% RHA 80
Figure 5.6 Result for 10% RHA 80
Figure 5.7 Result for 20% RHA 81
Figure 5.8 Result for 30% RHA 81
Figure 5.9 Experimental Load Carrying Capacity of Beams 82
Figure 5.10 Load deflection curve for 0% replacement 83
Figure 5.11 Load deflection curve for 10% replacement 84
Figure 5.12 Load deflection curve for 20% replacement 84
Figure 5.13 Load deflection curve for 30% replacement 84
Figure 5.14 Load Deflection Curve for different mixes 85
Figure 6.1 Compressive Strength at different ages with progressive replacement
of cement with RHA 91
Figure 6.2 Split Tensile Strength at different ages with progressive replacement
of cement with RHA 92
Figure 6.3 Flexural Strength at different ages with progressive replacement of
cement with RHA 94
Figure 6.4 Flexural Strength test for Reinforced SCC beam at different ages 95
xiii
LIST OF TABLES
Table No. Table Caption Page No.
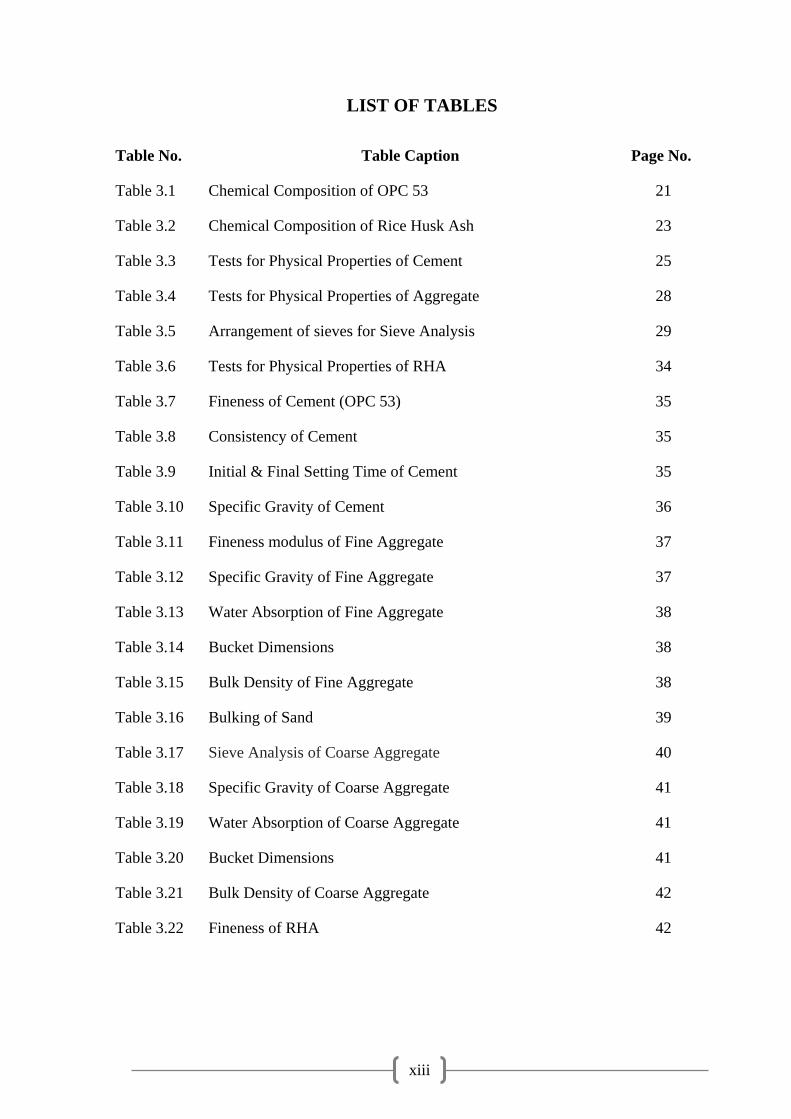
Table 3.1 Chemical Composition of OPC 53 21
Table 3.2 Chemical Composition of Rice Husk Ash 23
Table 3.3 Tests for Physical Properties of Cement 25
Table 3.4 Tests for Physical Properties of Aggregate 28
Table 3.5 Arrangement of sieves for Sieve Analysis 29
Table 3.6 Tests for Physical Properties of RHA 34
Table 3.7 Fineness of Cement (OPC 53) 35
Table 3.8 Consistency of Cement 35
Table 3.9 Initial & Final Setting Time of Cement 35
Table 3.10 Specific Gravity of Cement 36
Table 3.11 Fineness modulus of Fine Aggregate 37
Table 3.12 Specific Gravity of Fine Aggregate 37
Table 3.13 Water Absorption of Fine Aggregate 38
Table 3.14 Bucket Dimensions 38
Table 3.15 Bulk Density of Fine Aggregate 38
Table 3.16 Bulking of Sand 39
Table 3.17 Sieve Analysis of Coarse Aggregate 40
Table 3.18 Specific Gravity of Coarse Aggregate 41
Table 3.19 Water Absorption of Coarse Aggregate 41
Table 3.20 Bucket Dimensions 41
Table 3.21 Bulk Density of Coarse Aggregate 42
Table 3.22 Fineness of RHA 42
xiv
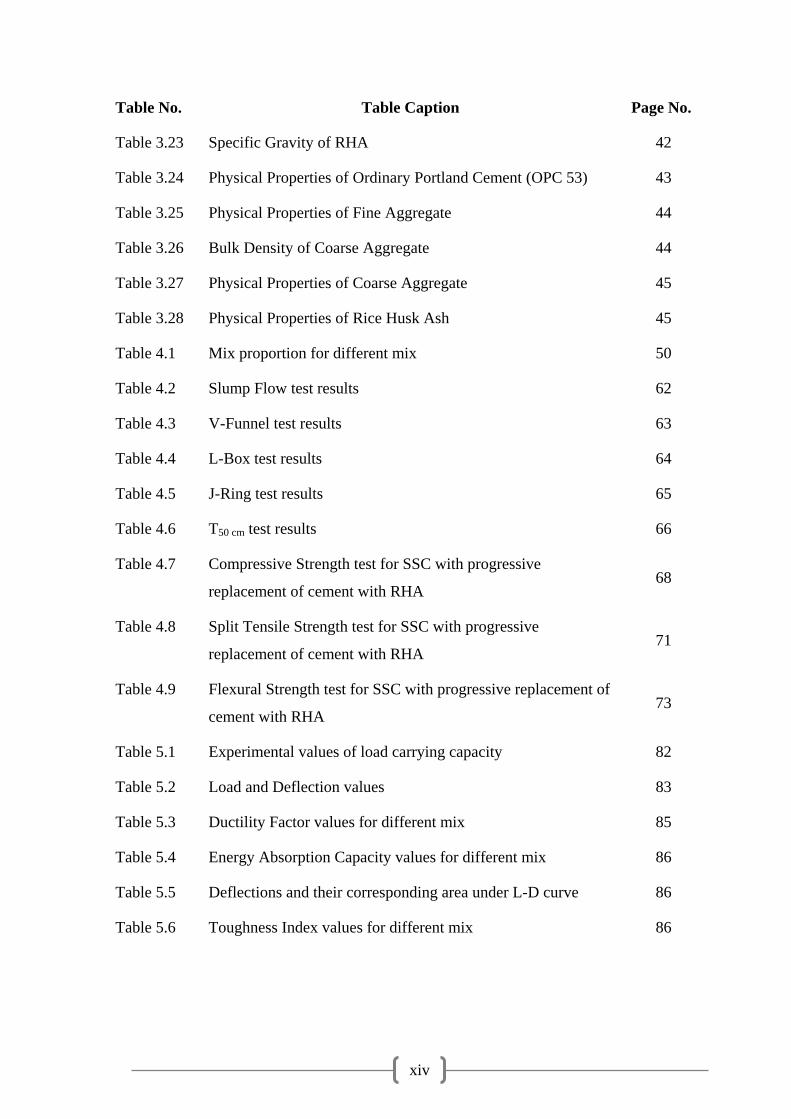
Table No. Table Caption Page No.
Table 3.23 Specific Gravity of RHA 42
Table 3.24 Physical Properties of Ordinary Portland Cement (OPC 53) 43
Table 3.25 Physical Properties of Fine Aggregate 44
Table 3.26 Bulk Density of Coarse Aggregate 44
Table 3.27 Physical Properties of Coarse Aggregate 45
Table 3.28 Physical Properties of Rice Husk Ash 45
Table 4.1 Mix proportion for different mix 50
Table 4.2 Slump Flow test results 62
Table 4.3 V-Funnel test results 63
Table 4.4 L-Box test results 64
Table 4.5 J-Ring test results 65
Table 4.6 T50 cm test results 66
Table 4.7 Compressive Strength test for SSC with progressive
replacement of cement with RHA 68
Table 4.8 Split Tensile Strength test for SSC with progressive
replacement of cement with RHA 71
Table 4.9 Flexural Strength test for SSC with progressive replacement of
cement with RHA 73
Table 5.1 Experimental values of load carrying capacity 82
Table 5.2 Load and Deflection values 83
Table 5.3 Ductility Factor values for different mix 85
Table 5.4 Energy Absorption Capacity values for different mix 86
Table 5.5 Deflections and their corresponding area under L-D curve 86
Table 5.6 Toughness Index values for different mix 86

xv
Table No. Table Caption Page No.
Table 5.7 Experimental vs. Theoretical load carrying capacity for R/f
SCC Beam 87
Table 6.1 Results of Fresh properties of SCC for different mix 89
Table 6.2 Compressive Strength test results 91
Table 6.3 Split Tensile Strength test results 92
Table 6.4 Flexural Strength test results 93
Table 6.5 Comparison of test results of RCC Beam 95
xvi
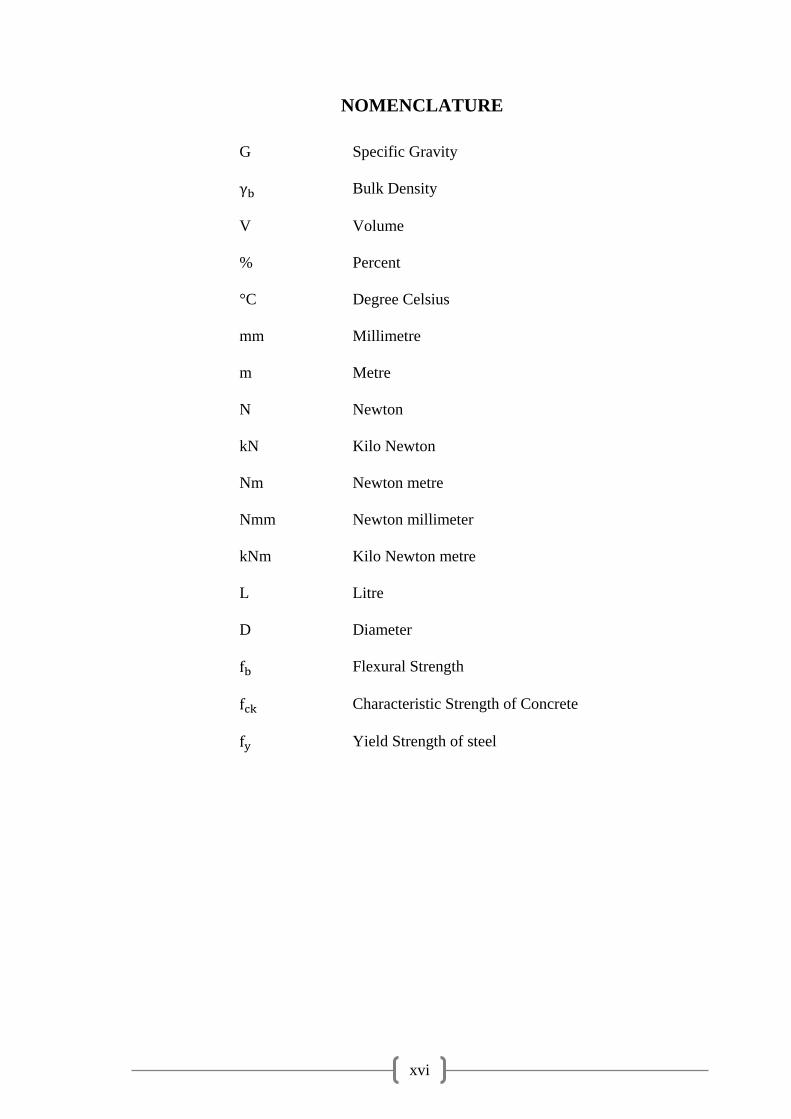
NOMENCLATURE
G Specific Gravity
Bulk Density
V Volume
% Percent
°C Degree Celsius
mm Millimetre
m Metre
N Newton
kN Kilo Newton
Nm Newton metre
Nmm Newton millimeter
kNm Kilo Newton metre
L Litre
D Diameter
Flexural Strength
Characteristic Strength of Concrete
Yield Strength of steel

xvii
ABBREVIATIONS
SSC Self-Compacting Concrete
RSCC Reinforced Self-Compacting Concrete
IS Indian Standards
BIS Bureau of Indian Standards
EFNARC European Federation of National Associations
Representing for Concrete
VMA Viscosity-Modifying Agent
HRWRA High Range Water Reducing Agent
NVC Non-Vibrated Concrete
SQC Super Quality Concrete
FA Fine Aggregates
Coarse Aggregates
SF Silica Fumes
RHA Rice Husk Ash
CCA Combined Coarse Aggregate
GGBFS Ground Granulated Blast Furnace Slag
LVDT Linear Variable Differential Transducers
SSD Saturated Surface Dry
ITZ Interfacial Transition Zone
HPC High Performance Concrete
LSP Limestone Powder
1
Chapter 1 Introduction
1.1 Introduction
At present, cement happens to be one of the most expensive materials in the
construction industry. On the other hand, Cement-based materials are the most abundant
of all manmade materials. This in turn makes cement one of the most important
construction materials, and it is most likely that the demand and importance of cement
will continue to thrive for a long time in future until some revolutionary alternative is
introduced in the market. However, these construction and engineering materials must
meet new and higher demands of the exponentially growing construction industry.
However, there exists contemporary construction materials such as plastic, steel and
wood with which cement has to compete in terms of productivity, economy, quality and
environment. One direction in this evolution is towards Self-Compacting Concrete
(SSC). SCC is a modified product that, without any additional compaction energy, flows
and consolidates under the influence of its own weight.
Self-compacting concrete, also known as self-consolidating concrete (SCC) is a
fluid mixture, which is suitable for placing in difficult conditions and also in congested
reinforcement, without vibration. SCC can be produced using standard cements and
additives. It consists mainly of cement, coarse and fine aggregates, and filler, such as
rice husk ash or Super pozzolana, water, super plasticizer. The composition of SCC is
similar to that of normal concrete but to attain self-flow ability admixtures, such as fly
ash, glass filler, limestone powder, silica fume, Rice husk ash, Super pozzolana etc.;
with some super plasticizer is mixed.
Development of self-compacting concrete (SCC) is itself is a priceless
achievement in the construction industry as it helps to deal with issues pertaining to
cast-in-place concrete. Self-compacting concrete is neither affected by the skills of
workers nor by the shape and amount of reinforcing bars or arrangement of a structure.
Nevertheless, due to high-fluidity and resistance to segregation, SCC can be pumped to
longer distances.

2
1.2 History behind development of SCC
The self-compacting concrete (SCC) was first introduced in Japan around 1983, when
the Japanese researchers were heading ahead in the pursuit of a better quality concrete.
The normal concrete witnessed the lack of uniform and complete compaction. This
factor was identified as the primary factor responsible for poor performance of concrete
structures. It was believed that there were no practical means by which full compaction
of concrete on a site was ever to be fully guaranteed, the focus therefore turned in to the
elimination of the need to compact, by vibration or any other means. This led to the
development of the first practicable SSC by researchers Okamura and Ozawa (1986) [1]
at the University of Tokyo and the large Japanese contractors quickly took up the idea.
The contractors used their large in-house research and development facilities to develop
their own SCC technologies. Each company developed their own mix designs and
trained their own staff to act as technicians for testing on sites their SCC mixes. A very
important aspect was that each of the large contractors also developed their own testing
devices and test methods.
In the early 1990‘s there was only a limited public knowledge about SCC,
mainly in the large corporations to maintain commercial advantage. The SCCs were
used under trades‘ names, such as the NVC (Non-vibrated concrete) of Kajima Co.,
SQC (Super quality concrete) of Maeda Co. or the Biocrete (Taisei Co.). With the
Japanese developments in the SCC area, concurrent research and development
continued, in University of Paisley / Scotland and University of Sherbrook/Canada, for
producing SCC mixes that matched the performance of the Japanese SCC concrete.
SCC is now widely used in construction technology as researchers and practitioners has
applauded its worthiness in terms of economy and sustenance because of a number of
factors such as faster construction, reduction in site manpower, easier placing, uniform
and complete consolidation, better surface finishes, improved durability, increased bond
strength, greater freedom in design, reduced noise levels, due to absence of vibration,
and safer working environment.
3
1.3 Construction incorporating SCC
The foremost issues pertaining to construction industry can be summarised into three
aspects: firstly issue pertains to the elimination of noise associated to vibration, second
issue pertains to the proper compaction in structures especially those confined in zones
where vibrating compaction is difficult, and third issue pertains to shortening of the
construction period. These issues pave the path for incorporation of SCC in the
construction field.
The employment of SCC can greatly improve the construction systems; it
witnesses a significant improvement in comparison to the circumstances that prevailed
due to the use of conventional concrete that required vibrating compaction. Vibrating
compaction has been as obstacle to the ideal realization of construction work due to
segregation caused by it. Once this obstacle has been eliminated, concrete construction
could be rationalized and a new construction system, including formwork,
reinforcement, support and structural design, could be developed. Moreover, by the
incorporating SCC, the cost of chemical and mineral admixtures is compensated by the
elimination of two steps found in traditional concrete construction: vibrating compaction
and work done to level the surface of the normal concrete. Nonetheless, the total cost for
a certain construction cannot always be reduced, because conventional concrete is used
in a greater percentage than self-compacting concrete. Besides, there exists some
concern for SCC. Due to the lower content of coarse aggregate, the SCC may have a
lower modulus of elasticity, which may affect deformation characteristics of pre-
stressed concrete members. There also lies another concern that the Creep and shrinkage
will be higher, affecting pre-stress loss and long-term deflection.
The method for achieving self Compactability involves not only high deformability
of paste or mortar, but also resistance to segregation between coarse aggregate and
mortar when the concrete flows through the confined zone reinforcing bars (Okamura
and Ouchi, 2003)[1]
. Okamura and Ozawa[1]
have employed the following three methods
to achieve self-compactability: Limited aggregate content, Low water-powder ratio and
Use of super plasticizer. Because of the addiction of a high quantity of fine particles, the
internal material structure of SCC shows some resemblance with high performance
concrete having self compactability in fresh stage, no initial defects in early stage and
protection against external factors after hardening.
4
Three basic characteristics of SCC are High deformability, Restrained Flowability
and Resistance to segregation. High deformability is related to the capacity of the
concrete to deform and spread freely in order to fill all the space in the formwork. It is
usually a function of the form, size and quantity of the aggregates, and the friction
between the solid particles, which can be reduced by adding a high range water reducing
admixture (HRWR) to the mixture. Restrained Flowability represents how easily the
concrete can flow around the obstacles, such as reinforcement, and is related to the
member geometry and the shape of the formwork. Resistance to segregation is related to
the cohesiveness of the fresh concrete, which can be enhanced by increasing the volume
of paste, by reducing the free-water content, by adding a viscosity-modifying admixture
(VMA) along with HRWRA, or by some combination of these constituents (Khayat H
1999)[2]
.
1.4 Mineral Admixture
Mineral admixtures are less energy intensive, industrial by-products that require less or
no processing. Mineral admixtures are basically supplementary cementitious materials,
fillers, powders depending upon their role in fresh and hardened state. These materials
possess little or no cementitious value but will in finally divided form and in presence of
moisture reacts with cement at ordinary temperature to form compounds possessing
cementitious properties. Mineral admixtures help in advancement of hydration and
especially in improving the hydration product. Mineral admixtures basically include
limestone powder (LSP), fly ash (FA), ground granulated blast furnace slag (GGBS),
silica fumes (SF) and rice husk ash (RHA). These mineral admixtures also contribute
towards properties of hardened concrete through physical and chemical properties
including hydraulic or pozzolanic activity. These materials react chemically with
Calcium hydroxide released from hydration of Portland cement to form cement
compounds. These materials often added to concrete to make concrete mixtures more
economical, reduce permeability, increase strength or influence other concrete
properties.
The use of supplementary cementing materials can significantly improve
durability properties. However different dosages and combinations of supplementary
materials yield dramatically different results. The use of mineral admixture in concrete
5
may bring lots of benefits like increased flow and strength, decreased shrinkage,
reduced water demand etc. but some problems may also be caused. A careful decision
has to be made regarding the selection of amount and the type of mineral admixture for
particular application. In general, mineral admixture has both negative as well as
positive effect on water demand, temperature rise, strength development, freeze-thaw
resistance, chemical attack resistance etc. They also have effect on volume stability and
microstructure. With continuously graded aggregates, the use of mineral admixture in
the presence of Super-plasticizers usually result in minimizing the voids, paste and
hence the cement requirement. They also add to stability of the system. This could result
in increased economy, high performance and increased durability. In this project work,
RHA is being used as a partial replacement of ordinary Portland cement.
1.4.1 Use of rice husk ash as filler material
Pozzolans from agricultural waste are receiving more attention now since their uses
generally improve the properties of the blended cement concrete, and reduce the
environmental problems. Palm oil fuel ash and rice husk ash are two promising
pozzolans and are available in many parts of the world (Chindaprasirt et al, 2008)[3]
.
Rice husk ash (RHA) has been used as a highly reactive pozzolanic material to improve
the microstructure of the interfacial transition zone (ITZ) between the cement paste and
the aggregate in self-compacting concrete. Mechanical experiments of RHA blended
Portland cement concretes revealed that in addition to the pozzolanic reactivity of RHA
(chemical aspect), the particle grading (physical aspect) of cement and RHA mixtures
also exerted significant influences on the blending efficiency.
The rice husk ash is highly siliceous material that can be used as an admixture in
concrete if the rice husk is burnt in a specific manner. The characteristics of the ash are
dependent on the components, temperature and time of burning (Hwang, 1992) [4]
.
Rice husk is also abundant in many parts of the world. When properly burnt at
temperature more than 700°C, reactive amorphous silica is obtained (Chindaprasirt et
al, 2008). The silica content in rice husk ash is high at approximately 90%. Silica in
amorphous form is suitable for use as a pozzolans. With proper burning and grinding,
ground rice husk ash (RHA) can be produced and used as a pozzolans. Even for higher
6
burning temperature with some crystalline formation of silica, good RHA can still be
obtained by fine grinding (Chindaprasirt et al, 2008). The reactive RHA is used to
produce good quality concrete with reduced and higher resistance to sulphate
attack, (Chindaprasirt et al, 2008). Rice husk is an agricultural residue obtained from
the outer covering of rice grains during the milling process. It constitutes 20% of the
600 million tons of paddy produced in the world. Initially rice husk was converted into
ash by open heap village burning method at a temperature, ranging from 300°C to
450°C. When the husk was converted to ash by uncontrolled burning below 500°C the
ignition was not completed and considerable amount of unburned carbon was found in
the resulting ash. Carbon content in excess of 30% was expected to have an adverse
effect upon the pozzolanic activity of RHA. The ash produced by controlled burning of
the rice husk between and incinerating temperature for 10 -12 hours,
transforms the silica content of the ash into amorphous phase. The reactivity of
amorphous silica is directly proportional to the specific surface area of ash. The ash so
produced is pulverized or ground to required fineness and mixed with cement to
produce blended cement. Approximately, 600 million tons of rice was produced all over
the world per year out of which an estimated 110.15 thousand metric tons of milled rice
was produced in India alone in the year 2016-2017. Huge amounts of RHA obtained
after burning of risk husk, probably has no use at all and getting rid of it is also a
problem. The following properties of the concrete are altered with the addition of rice
husk:
1. The heat of hydration is reduced. This itself help in drying shrinkage and
facilitate durability of the concrete mix.
2. The reduction in the permeability of concrete structure. This will not help in
penetration of chloride ions, thus avoiding the disintegration of the concrete
structure.
3. There is a higher increase in the chloride and sulphate attack resistance.
4. The rice husk ashes in the concrete react with Calcium hydroxide to bring more
desirable hydration products. The consumption of Calcium hydroxide will
enable lesser reactivity of chemicals from the external environment.
7
1.5 Research Objectives
1. To impart effective replacement of Ordinary Portland Cement by Rice Husk
Ash in Self Compacting Concrete (SCC).
2. To achieve effective workable Self Compacting Concrete with and without
partial replacement of Ordinary Portland Cement by Rice Husk Ash.
3. To study the workability of manufactured Self Compacting Concrete using rice
husk ash as partial replacement of Ordinary Portland Cement as per EFNARC
standards.
4. To achieve targeted design strength of design Self Compacting Concrete using
Rice Husk Ash in percent of 5, 10, 15, 20, 25 and 30 as partial replacement of
Ordinary Portland Cement.
5. To study the flexural behavior of Reinforced Self Compacting Concrete beam
specimens of size 150mm x 200mm x 1500 mm using rice husk ash as partial
replacement of Ordinary Portland Cement by 10%, 20%, 30%.
1.6 Research Methodology
1. Literature study on the workability parameters, test methods for workability of
SCC, flexural behaviour of concrete and partial replacement of cement with
different mineral admixtures.
2. Feasibility test of materials to be used in mix design.
3. Mix Design of SCC by Nan-Su Method.
4. Workability of SCC using RHA as partial replacement of cement according to
EFNARC guidelines for Slump Flow test, L-box test, V-funnel test, J-ring test.
5. Hardened properties of SCC using RHA as partial replacement of cement are tested
by Compressive Strength of cube specimens of size 150mm x 150mm x 150mm,
Split-Tensile Strength of cylinder specimens of size 150mm in dia. x 300mm in
height, and Flexural Strength of beam specimens of size 150mm x 150mm x
150mm at 3, 7, 28, and 90 days of maturity in normal water curing.
6. Study of the Flexural Behaviour of the Reinforced SCC beams with partial
replacement of cement with RHA for 0%, 10%, 20% and 30%.
8
1.7 Structure of the Thesis
This thesis work is split into seven chapters. Chapter I of this project work deals with
the introduction to the topic, i.e. flexural behaviour of self-compacting concrete using
rice husk ash as partial replacement of cement. Chapter II of this project work deals with
the study of various literatures pertaining to the thesis work. Chapter III deals with the
materials used in the experimental program of the project work. Chapter IV deals with
the designing and study of SCC mix design with partial replacement of cement with
RHA. Chapter V includes the study of Flexural Behaviour of the designed Reinforced
SCC beams. Chapter VI deals with the Inference and Analysis of the results obtained
from the various tests performed in Chapter III, IV and V. Chapter VII deals with the
conclusion and Future Scope of this project Work.
Chapter I – Introduction
This Chapter deals with the Introduction to the topic, Flexural Behaviour of Self-
Compacting Concrete using Rice Husk Ash as partial replacement of cement, a brief
introduction to the topics and concepts related to the thesis work, the research objective,
the research methodology and the organisation of this thesis work.
Chapter II – Literature Study
This chapter deals with study of Literature used in the project work along with the
mention of latest related works. In this part of the thesis, various literatures from the
development of SCC in Japan in 1980‘s till date were collected and studied. The chapter
further includes the motivation and objectives of this project work.
Chapter III – Investigation on Materials Used
This chapter deals with the materials used in the project work and the various sets of
tests performed for investigating the physical properties of these materials in order to
confirm the feasibility of these materials in Concrete mix design.
Chapter IV – Experimental Program on SCC
This chapter deal with the experimental set up required for the design and testing of the
SCC with partial replacement of cement with RHA. It also includes the experimental
results of the tests performed.

9
Chapter V – Flexural Behaviour of Reinforced SCC Beam
This chapter deals with the study of Flexural Behaviour of Reinforced SCC beams, and
shows the comparison between the theoretical and experimental capacity of the
Reinforced SCC beams.
Chapter VI – Inference & Analysis
This chapter deals with the discussion of the results obtained from the tests discussed in
IV and V.
Chapter VII – Conclusion & Future Scope
This project work deals with the conclusion and the future scope of this thesis work.
Based on the experimental results obtained and its rational discussion, conclusions were
made which will specify the future perspective of the project work done.

10
Chapter 2 Literature Study
2.1 Introduction
This chapter discussed about the literature study on the body of works based on
replacement of cement with Rice Husk Ash (RHA) in concrete design to pave the path
for practical realization of this concept in the construction industry. The limited study
available on self-compacting and ordinary concrete with RHA is enclosed herein. This
chapter deals with the review of literatures used in the project work and discusses about
the different investigation for effective use of RHA as replacement in general so far. In
this part of the thesis, the various literatures that have been studied are presented in a
chronological order dating back to 1980‘s when the development of SCC took place in
Japan to the present times. Various research works done by the researchers of different
parts of the world available in the form of literatures available on the use of rice husk
ash as partial replacement of cement is mentioned in the following Literature Review.
The chapter also includes the motivation and objective of this research work.
2.2 Literature Review
M.A. Ahmadi [5]
studied the Mechanical properties up to 180 days of self-
compacting and ordinary concrete with rice-husk ash (RHA). Two different replacement
percentages of cement by RHA, 10% and 20%, and two different water/cementetious
material ratio (0.40 and 0.35), were used for both of self-compacting and normal
concrete specimens. The results are compared with those of the self-compacting
concrete without RHA, with compressive, flexural strength and modulus of elasticity. It
is concluded that RHA provides a positive effect on the Mechanical properties at age
after 60 days. Also specimens with 20% replacement of cement by RHA have the best
performance.
Strength of concrete containing 25 percent of RHA is not affected appreciably
but the cost is reduced considerably. It is also found that the resistance to chemical
attack of RHA concrete is much better than ordinary Portland cement concrete. Syed
Mehdi Abbas [6]
.
11
Shriram, H. Mahure [7]
obtained the fresh properties of concrete within the limit
as specified by EFNARC up to replacement of 20% cement by RHA. The SCC mixes
with replacement of 20% cement by RHA gave optimum results. Flexural and Split
tensile strength was much better than target strength for M30 grade of concrete. RHA
being pozzolanic material shown much better performance after 90 days curing as
compared with the same at 28 days. It was observed that the water absorption within
acceptable limit. Hence the concrete will be impermeable.
Sumrerng Rukzon, Prinya Chindaprasirt [8]
. Test results reveal that the resistance
to chloride penetration of concrete improves substantially with partial replacement of
cement with a blend of GRHBA. This work suggests that the GRHBA is effective for
producing SCC with 30% of GRHBA replacement level.
Due to fine insulating properties of rice husk like low thermal conductivity, high
melting point, low bulk density high porosity, it is used for production of high quality
steel. It is also used as a coating over the molten metal in the tarnish and in ladle which
acts as a very good insulator and does not allow quick cooling of metal, results revealed
by Er Mehran Ali, Kshipra Kapoor [9]
.
Vikas V. Karjinni, Shrishail B. Anadinni, Dada S. Patil [3]
, presented a comparative
evaluation of fresh and hardened properties of SCC using different mineral admixture
with Nan Su and Modified Nan-Su mix design method.
Invesigation of Silvio Delvasto[10]
, revealed that the particular rice husk ash
(RHA) consists of 99% of Silica, highly amorphous, white in colour and of greater
pozzolanic activity than the Silica fume and another rice husk ash prepared with only by
a thermal treatment.
Chatveera B, Lertwattanaruk P[11]
, investigated that RHA provides a positive
effect on the autogenous shrinkage and weight loss of concretes exposed to hydrochloric
and sulphuric acid attatcks. Results show that ground BRHA can be applied as a
pozzolanic material and also improve the durability of concrete.
A.E. Abalaka [12]
, results show that the optimum OPC replacement with RHA
was dependent on the w/b ratio of the concrete mix. The results show that low w/b
12
mixes tends to lower the optimum RHA replacement levels. The RHA used has been
shown to have improved the tensile strength of the concrete. The results of this study
have further shown that , the low specific surface RHA used could replace 15% of OPC
at w/b ratio of 0.50 without reduction in both compressive and tensile strength of
concrete.
30% of RHA could be advantageously blended with cement without adversely
affecting the strength and permeability properties of concrete, V. Kannan and K.
Ganseana et[13]
.
S. Kanakambara Rao[14]
, conducted a review on Experimental behavior of Self
Compaction Concrete blended with Rice Husk As. He studied on experimental behavior
of SCC with RHA as a partial replacement of cement. RHA has been used as a highly
reactive pozzolanic material to improve the microstructure of the interfacial transition
zone (ITZ) between the cement paste and the aggregate in self-compacting concrete.
Bui, Le Anh-Tuan, Chen [15]
, revealed that the strength and durability properties
of concrete with or without three types of rice husk ash (RHA), namely, amorphous,
partial crystalline, and crystalline RHA, were investigates. The three types of RHA were
added into concrete at a 20% replacement level. Consequently, the pozzolanic reactivity
of amorphous RHA was higher than that of partial crystalline and crystalline RHA.
Concrete added with amorphous RHA showed excellent characteristics in its mechanical
and durability properties.
Five different replacement levels namely 5%, 7.5%, 10%, 12.5%, and 15% are
chosen. Curing periods starting from 3, 7, 28 and 56 days are considered in this
investigation. At all the cement replacement levels of rice husk ash; there is gradual
increase in compressive strength from 3 days to 7 days. However there is significant
increase in compressive strength from 7 days to 28 days followed by gradual increase
from 28 days to 56 days, test results revealed by P. Padma Rao[16]
.
13
2.3 Recent Related Works
The specific literature is concerned with the recent works, from 2013 up to 2018, on
structural engineering application that is in a way similar or co-related to this project
work.
Amitkumar D. Raval, Dr.Indrajit N. Patel, Prof. Jayeshkumar Pitroda[17]
studied the experimental investigation on strength of concrete and optimum percentage
of the partial replacement by replacing cement via 0%, 10%, 20%, 30%, 40% and 50%
of ceramic waste to study the behaviour of concrete while replacing the ceramic waste
with different proportions in concrete.
B.H.V. Pai, M. Nandy, A. Krishnamoorthy, P.K.Sarkar, Philip George[18]
investigates the preliminary results of producing and comparing SCCs incorporating Fly
ash (FA) and Rice husk ash (RHA) as supplementary cementing materials in terms of
their properties like compressive strength, split tensile strength and flexural strength.
Sonali K. Gadpalliwar, R. S. Deotale, Abhijeet R. Narde[19]
studied the partial
replacement of natural sand (NS) with Quarry sand and partial replacement of cement
with GGBS and RHA. This research showed that the composition of 22.5% GGBS +
7.5% RHA with 60% of quarry sand gives good strength results.
Vinod Goud, Niraj Soni, Goutam Varma, Kapil Kushwah, Sharad Chaurasia,
Vishwajeet Sharma[20]
studies about the partial replacement of cement with fly ash in
concrete.
Swapnil Samrit, Piyush Shrikhande, M.V.Mohod[21]
investigated the behavior of
concrete pavement while replacing fly ash in different proportions. The cement has been
replaced accordingly in the range of 0%, 10%, 15%, & 20% by weight of M- 30 grade
concrete. Concrete mixtures were produced, tested as an alternative to traditional
concrete to evaluate the mechanical properties for 7, 14 & 28 days. To study the
maximum stress coming onto the pavement, models with different thicknesses were
generated in ANSYS software & analysis was carried out.
14
Savita Devi, Nitish Gandhi, Mahipal, Nimisha Marmat, Balveer Manda,Mahesh
Vaishnav[22]
studies various suitable replacements of cement so as to reduce problems of
global warming and to create sustainable environment.
N Kaarthik Krishna, S Sandeep, K M Mini[23]
reviews on Rice Husk Ash being
used as an admixture to cement in concrete and its properties. Four different
replacement levels namely 5%, 10%, 15% and 20% were selected and studied with
respect to the replacement method.
K Sampath Kumar, U M Praveen, A Prathyusha, V Akhila, P Sasidhar[24]
studied
the use of Industrial wastes, such fly ash and silica fume as supplementary cement
replacement materials.
V. Subbamma, Dr. K. Chandrasekhar Reddy[25]
examines the compressive
strength of M40 grade concrete with partial replacement of cement by Flyash and
Metakaοlin. The cement replaced with 5%, 10%, 15%, 20%,25% & 30% of Flyash and
5%, 10%, 15%& 20% of Metakaοlin, so as to determine the best proportion. It is found
that compressive strength of concrete is high at 12% and 10% replacement of cement by
Flyash and Metakaοlin respectively.
V. Suresh, M. Suresh Babu, M. Achyutha Kumar Reddy[26]
investigated cement
replacement with sodium polyacrylate (SPA). The use of SPA in M20 grade concrete at
varies percentages in 0.1 to 0.9 in the interval of 0.3. SPA mixes showed good results
against NaCl and MgSO4 , very poor results against H2SO4.
B. Preethiwini[27]
presents the production of High strength self compacting
concrete by replacing plastic scraps from waste plastic material. The fine aggregate is
substituted with the plastic scrap at dosages 0%, 5%, 10%, 15%, and 20% by weight of
the fine aggregate. The optimum percentage for the self compacting concrete was
evaluated by testing the specimen for its compressive and tensile strength.
Abin Thomas C A, Jayalakshmi S, Jerin K Antony, Kavya S Kumar, Sreepriya K
V[28]
presents the results on an experimental program carried to explore the possibility of
use of iron ore fines as partial replacement of fine aggregate (M-sand) in self-
compacting concrete (SCC). SCC mixes were designed and fine aggregates were
15
replaced with 0, 10, 20, 30, 40, 50, 60, 70, 80, 90 and 100% iron ore fines. The optimum
percentage of replacement was found to be 40%. Tests conducted on fresh SCC
indicated that use of iron ore fines made the microstructure of SCC denser and less
workable.
D.Gowsika, S.Sarankokila, K.Sargunan[29]
reports the results of experiments
evaluating the use of egg shell powder from egg production industry as partial
replacement for ordinary Portland cement in cement mortar. In this direction, an
experimental investigation of compressive strength, split tensile strength, and Flexural
strength was undertaken to use egg shell powder and admixtures as partial replacement
for cement in concrete. The admixtures used are Saw Dust ash, Fly Ash and Micro silica
to enhance the strength of the concrete mix with 5% egg shell powder as partial
replacement for cement.
M. S. Al-Lami[30]
studies the flow properties of SCC with different ratios of
water to cement, viscocrete to cement and silica fume to cement were determined by
experimental investigation. (SCC) may be used in buildings subjected to high
temperatures during operation or in case of an accidental fire. This paper studies the
effect of elevated temperature on compressive strength of SCC specimens heated from
25ºC to 700ºC. The reductions in the compressive strength of SCC specimens at
elevated temperature were found to be varying according to the proportions of mixing
materials.
T. Shanmuga Priya, A.Punitha Kumarstudy[31]
examines the strength of High
Performance Concrete using Crushed Sand (Manufactured sand). The natural sand was
replaced by Crushed Sand in the proportion of 0%, 20%, 40%, 60%, 80% and 100% and
a series of experiments were conducted in M60 grade HPC concrete to study the
compressive strength, flexural strength, splitting tensile and modulus of elasticity. The
replacement by 60% Crushed Sand exhibited the highest compressive strength.
Amir Shafi Batt, Anshul Garg[32]
studies the incorporation of wood ash in
combination with ordinary Portland cement while using it for various structural works.
wood ash added to OPC will produce significant results to emphasize the detailed study
process. Uncontrolled burning of saw dust to form wood ash is used as a partial
16
replacement of cement, thereby changing its physical and chemical properties. In this
paper, a research work is conducted for the concrete mixes are replaced with the
amorphous wood ash as an admixture of cement having grain size less than 75 microns
in proportions of 5%, 10%, 15%, 20%, 25% and 30% by weight of cement.
G. M. Sadiqul Islam, M. H. Rahman, Nayem Kazi[33]
investigates the use of
milled (ground) waste glass (composed of silica) in concrete as partial replacement of
cement could be an important step toward development of sustainable (environmentally
friendly, energy-efficient and economical) infrastructure systems. When waste glass is
milled down to micro size particles, it is expected to undergo pozzolanic reactions with
cement hydrates, forming secondary Calcium Silicate Hydrate (C–S–H). In this research
chemical properties of both clear and colored glass were evaluated. Chemical analysis
of glass and cement samples was determined using Xray fluorescence (XRF) technique
and found minor differences in composition between clear and colored glasses. A 20%
replacement of cement with waste glass was found convincing considering cost and the
environment.
MD Azharuddin, S. Manivel, S. Thiagua[34]
comprehensively studies the current
scenario of pond ash generation and its utilization. Behavior of the beams with partial
replacement of cement by pond ash and steel fibre in flexure is studied. The result
shows the comparative advantages between cyclic behaviour of conventional beam and
pond ash with steel fibre modified beam. Ductility of fibre-reinforced concrete and the
concrete strength are found to be considerably improved by steel fibre content, and
aspect ratio.
Ratandeep Kumar, Ashfaq Malik,Vivek Kumar Kashyap[35]
studies the
replacement of sand by Coconut shell powder as well as replacement of cement with
RHA. In this paper, both materials are replaced. Partial replacement done with the 10%
cement with RHA is constant and for sand replaced with coconut shell powder at 0%,
5%, 10%, 15%, 20%, 25% in this project .The test result says the 20% replacement of
sand and 10% replacement of cement gives maximum compressive strength.
Boeini Sampurna, D.S.V.S.M.R.K.Chekravarty[36]
Glass Fiber Reinforced
Concrete is a recent introduction in the countryside of concrete technology. Efforts are
17
life form made in the ground of concrete knowledge to expand high performance
concretes by means of fibers and other admixtures in concrete awake to certain size. To
improve the concrete properties, the system be name alkali resistant glass fiber
reinforced concrete inside the present sight the alkali resistance glass fiber have been
used.
Dr. Ch. Kannam Naidu, Dr. Ch. Vasudeva Rao, Dr. G. Venkata Rao,A.Y.D.T.
Akhilesh[37]
studied M30 grade concrete after partial replacement of cement with Egg
Shell Powder (ESP), has been done to reduce the cost of concrete without affecting its
compressive strength. The study reveals that the use of ESP, which has been collected
from poultry industries, as a good replacement for Ordinary Portland Cement (OPC) in
M30 Grade concrete as it has been given good results. The results reveal that at 10%
ESP replacement the strength is higher than conventional concrete and indicates that
10% ESP is an optimum content for maximum strength. Among the products like Rice
Husk Ash, Fly Ash, Silica Fumes etc. the Egg Shells are also known to have good
prospects in minimizing the usage of cement.
Ifrah Mushtaq, Sandeep Nasier[38]
investigates the workability and Strength
characteristics of Self-Compacting Concrete (SCC) prepared by partially replacing
cement (ordinary Portland cement) with fly ash at different replacement levels (10%,
15%, 20%, 25% and 30%). The Guidelines of European Federation of National
Associations Representing for Concrete (EFNARC) was followed for mix designing
purpose. The experiments were carried out by adopting a water-powder ratio of 0.43.
B Mahendra , T Abhiram Reddy , P Raj Kumar, T Harish[39]
showed the
replacement of cement with metakaolin by 0%, 5%, 10% and 20%. The optimum result
was revealed to be HPC at 15% metakaoline replacement of cement.
B. A. Alabadan, M. A. Olutoye, M. S. Abolarin And M. Zakariya[40]
examines
Ordinary Portland Cement (OPC) and Bambara Groundnut Shell Ash (BGSA) concrete.
The ash contained 10.91% CaO, 2.16% Fe2O3, 4.72% MgO, 33.36% SiO2, 1.75%
Al2O3, 16.18% K2O, 9.30% Na2O, 6.40% SO3, 6.02% CO3 and 9.20% HCO3. 10%,
20%, 30%, 40% 50% and 0% ash was used in the mix to replace cement. Substitution of
cement with ash in concrete formation was relatively possible not exceeding 10%.

18
2.4 Identified Background Problem
Concrete is a multipurpose material widely used as a principle element for structures
and for other applications in Civil Engineering. The demand for concrete in the
construction industry is escalating with each passing day due to the increasing
population that claims housing, transportation and other amenities as its by-product.
Cement happens to be the most expensive material in concrete making. The naturally
available compounds of lime mixed with silica and alumina required for cement
preparation has been inconsiderately depleted to meet the demands of the exponentially
booming construction industry. The lime is obtained from a calcareous (lime-
containing) raw material, and the other oxides are derived from an argillaceous (clayey)
material. Therefore, in order to prevent the impending scarcity of natural resources, I
applaud the choice of use of organic waste such as rice husk ash as a partial replacement
to conventional cement in concrete.
2.5 Motivation & Research Objectives
Very limited efforts have been made worldwide to use rice husk ash as an alternate civil
engineering material. The utilization of rice husk ash as a substitute to cement is not
widely acknowledged industrially. This motivates me to carry out an effort to realize the
utilization of the rice husk ash as an effective and potential partial replacement of
cement in the Indian construction industry. This is the real intent of my work.
The ash generated from Rice Husk is an inorganic waste material that would be
cost effective and bountiful in terms of its regeneration from rice husk. From
economical point of view, the use of RHA as a partial replacement of cement becomes a
good news for Indian industrial economy as India proudly bags the second position for
the leading rice production countries based on the statistics of 2016/2017 that showed
110.15 thousand metric tons of milled rice produced by India. Hence, utilization of
agricultural bi-products in construction industries seems to be an appealing option in
recent days by fulfilling the demands of cement.
1. To impart effective replacement of Ordinary Portland Cement by Rice Husk Ash
in Self Compacting Concrete (SCC).
19
2. To achieve effective workable Self Compacting Concrete with and without
partial replacement of Ordinary Portland Cement by Rice Husk Ash.
3. To study the workability of manufactured Self Compacting Concrete using rice
husk ash as partial replacement of Ordinary Portland Cement as per EFNARC
standards.
4. To achieve the targeted design strength by the Self Compacting Concrete using
Rice Husk Ash in percentage of 5, 10, 15, 20, 25 and 30 as a partial replacement
of Ordinary Portland Cement.
5. To study the flexural behavior of Reinforced Self Compacting Concrete beam
specimens of size 150mm x 200mm x 1500 mm using rice husk ash as partial
replacement of Ordinary Portland Cement by 10%, 20%, 30%.
The scope of the my project work consists of (a) the laboratory tests for finding
out physical property of the material used in the concrete design such as specific
gravity, fineness modulus, water absorption, and particle size distribution for fine
aggregate, fine aggregate (sand) and coarse aggregate. The tests were conducted as per
Indian Standards for aggregate. (b) Assessment of the fresh properties of concrete such
as workability test for each replacement of cement with Rice Husk Ash (RHA). (c)
Assessment of the hardened properties of concrete such as compressive strength, split
tensile strength, flexural strength for M30 grade of concrete for partial replacement of
cement with RHA starting from 0% to 30% for different ages, (d) study of the load
carrying capacity a structural member i.e. the designed reinforced SCC beam. The
findings and the reports in this project have been based on the limited laboratory tests
done in NIT Jamshedpur Structures Lab on the basic material properties, physical
properties and mechanical properties w.r.t the strength parameters required in terms of
the SCC concrete using rice husk ash.
20
Chapter 3 Investigation on Materials Used
3.1 Introduction
This chapter includes a brief introduction of the materials used in the project work, lists
the various tests performed to investigate the physical properties of these materials
along with the results of those tests. In addition to that, the chapter also includes the
methodologies of those tests performed on the materials as per the requirement of this
project work.
3.2 Material Supplied
The materials used in the project work are cement (OPC 53 grade), Fine aggregates
(Sand), Coarse aggregates, mineral admixture (Rice Husk Ash) and Super-plastisizer
(HRWRA). These materials are briefly discussed in this section.
3.2.1 Cement
There is wide variety of cements that are used to some extent in the construction and
building industries. The chemical composition of these cements can be quite diverse. In
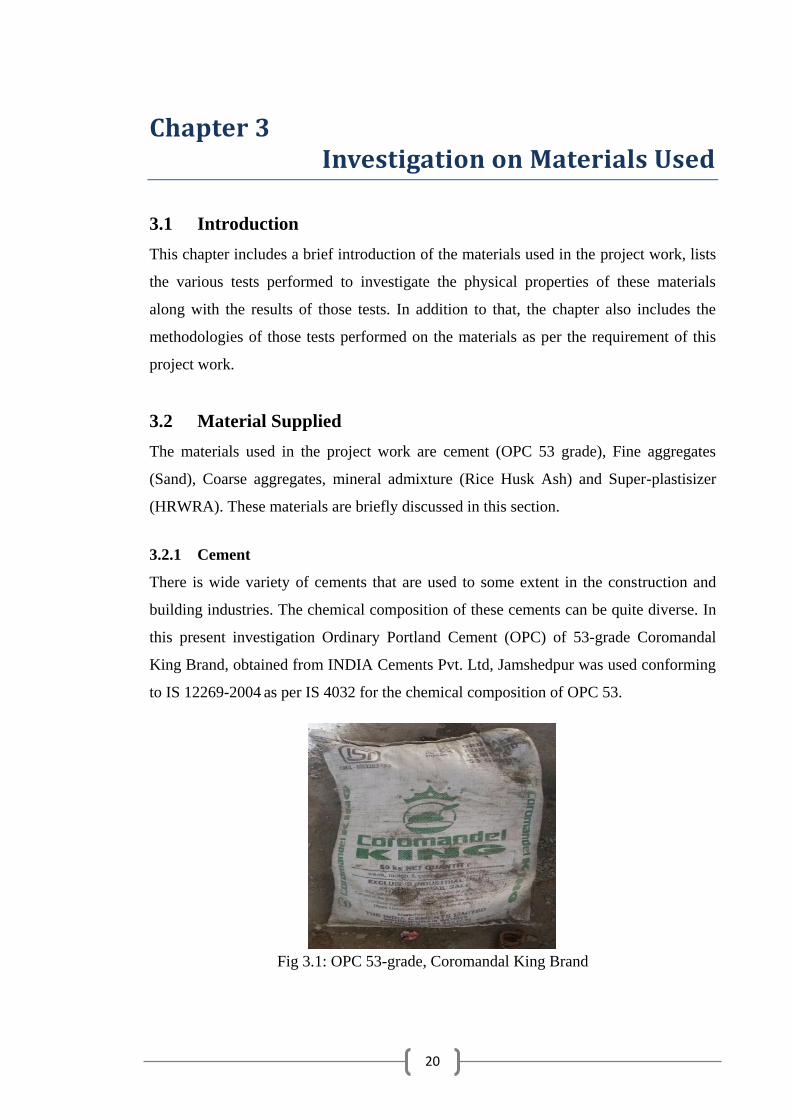
this present investigation Ordinary Portland Cement (OPC) of 53-grade Coromandal
King Brand, obtained from INDIA Cements Pvt. Ltd, Jamshedpur was used conforming
to IS 12269-2004 as per IS 4032 for the chemical composition of OPC 53.
Fig 3.1: OPC 53-grade, Coromandal King Brand
21
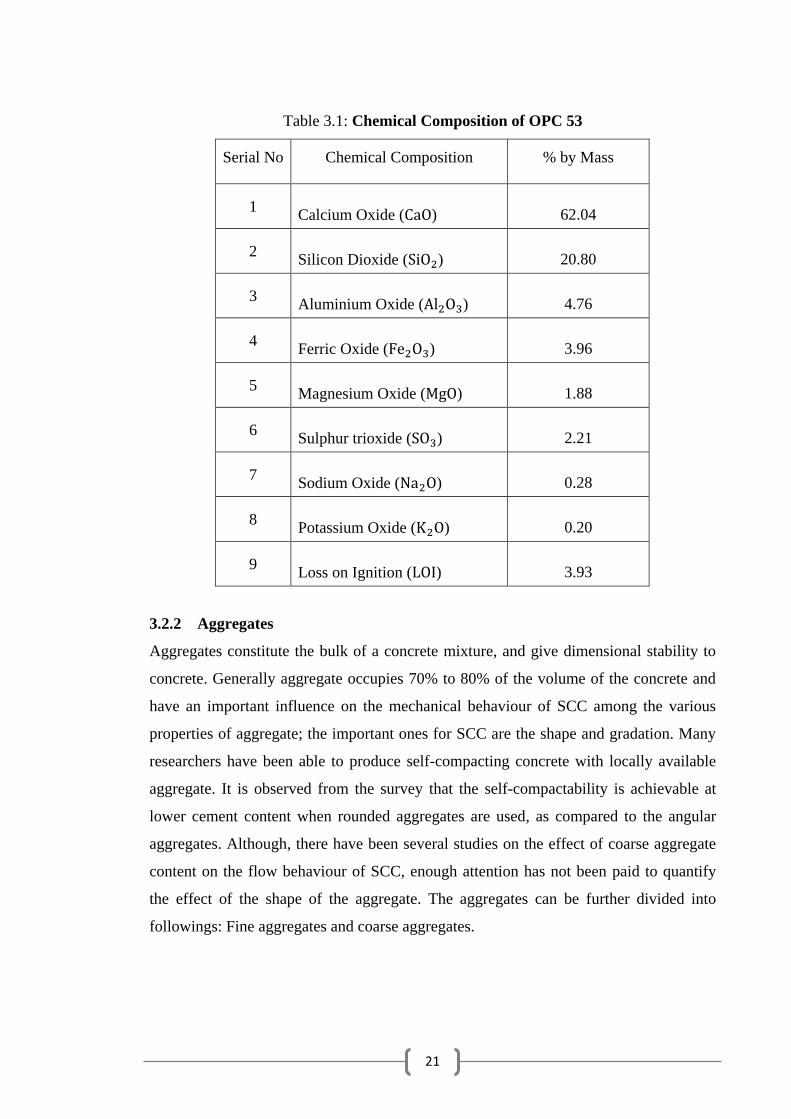
Table 3.1: Chemical Composition of OPC 53
Serial No Chemical Composition % by Mass
1 Calcium Oxide ( ) 62.04
2 Silicon Dioxide ( ) 20.80
3 Aluminium Oxide ( ) 4.76
4 Ferric Oxide ( ) 3.96
5 Magnesium Oxide ( ) 1.88
6 Sulphur trioxide ( ) 2.21
7 Sodium Oxide ( ) 0.28
8 Potassium Oxide ( ) 0.20
9 Loss on Ignition ( ) 3.93
3.2.2 Aggregates
Aggregates constitute the bulk of a concrete mixture, and give dimensional stability to
concrete. Generally aggregate occupies 70% to 80% of the volume of the concrete and
have an important influence on the mechanical behaviour of SCC among the various
properties of aggregate; the important ones for SCC are the shape and gradation. Many
researchers have been able to produce self-compacting concrete with locally available
aggregate. It is observed from the survey that the self-compactability is achievable at
lower cement content when rounded aggregates are used, as compared to the angular
aggregates. Although, there have been several studies on the effect of coarse aggregate
content on the flow behaviour of SCC, enough attention has not been paid to quantify
the effect of the shape of the aggregate. The aggregates can be further divided into
followings: Fine aggregates and coarse aggregates.
22
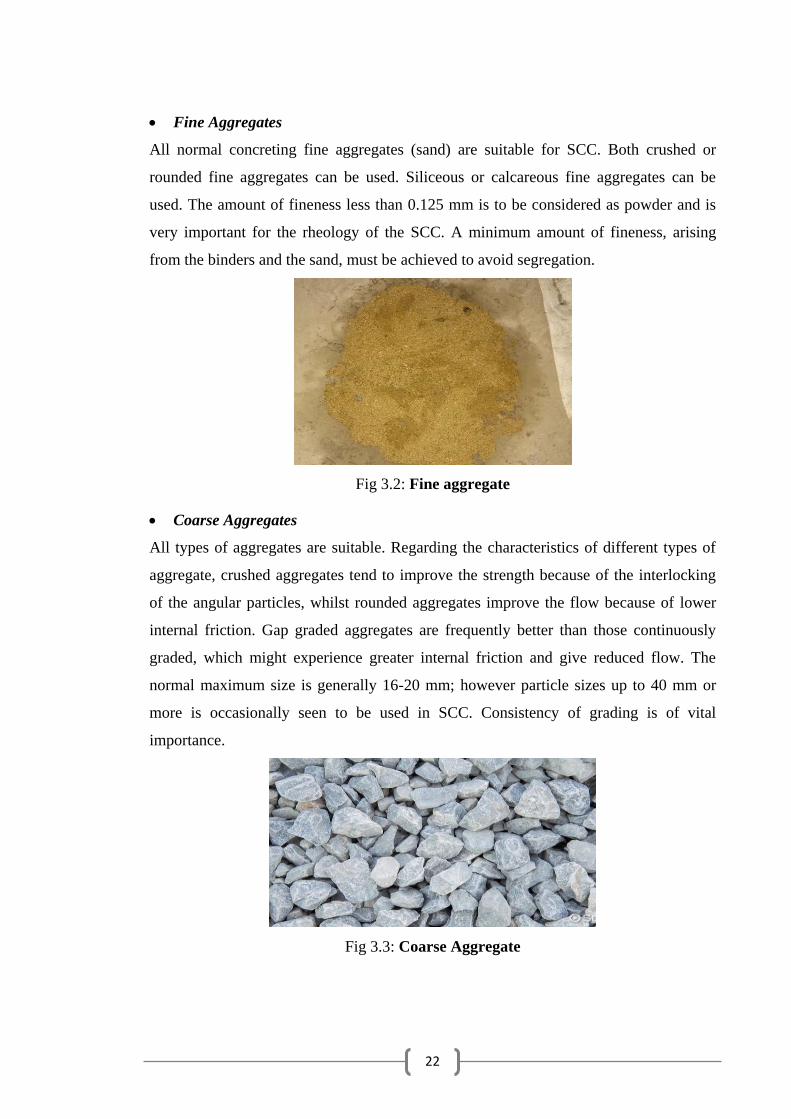
Fine Aggregates
All normal concreting fine aggregates (sand) are suitable for SCC. Both crushed or
rounded fine aggregates can be used. Siliceous or calcareous fine aggregates can be
used. The amount of fineness less than 0.125 mm is to be considered as powder and is
very important for the rheology of the SCC. A minimum amount of fineness, arising
from the binders and the sand, must be achieved to avoid segregation.
Fig 3.2: Fine aggregate
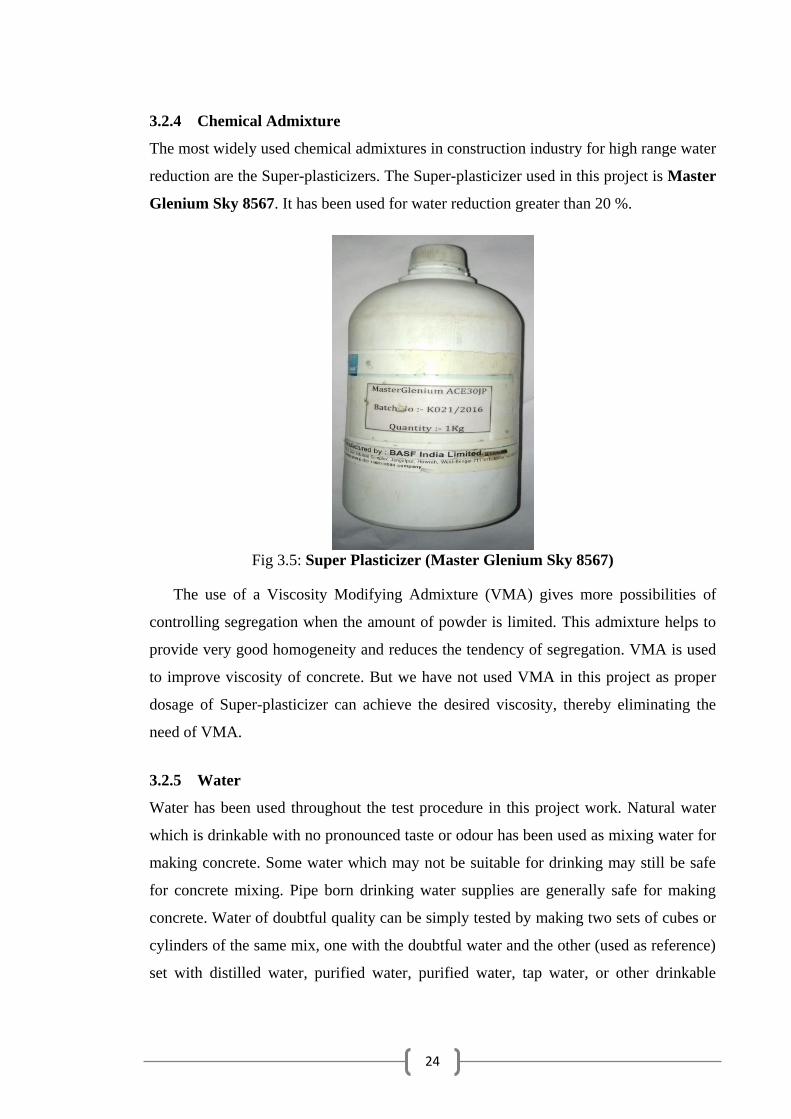
Coarse Aggregates
All types of aggregates are suitable. Regarding the characteristics of different types of
aggregate, crushed aggregates tend to improve the strength because of the interlocking
of the angular particles, whilst rounded aggregates improve the flow because of lower
internal friction. Gap graded aggregates are frequently better than those continuously
graded, which might experience greater internal friction and give reduced flow. The
normal maximum size is generally 16-20 mm; however particle sizes up to 40 mm or
more is occasionally seen to be used in SCC. Consistency of grading is of vital
importance.
Fig 3.3: Coarse Aggregate

23
3.2.3 Mineral admixture (Rice Husk Ash)
The mineral admixture used in this project work is the Rice Husk Ash. The mineral
admixtures with pozzolanic properties such as rice-hush ash (RHA), fly ash (FA), silica
fume (SF), ground blast-furnace slag (GGBS) and Meta-Kaolin (MK) are commonly
used as a partial substitution of Portland cement during construction. These admixtures
are often added to modify the physical and chemical properties of cementitious mixes.
The mineral admixture used in this project work is the Rice Husk Ash. Rice husk is an
agricultural residue obtained from the outer covering of rice grains during the milling
process. The ash produced by controlled burning of the rice husk between and
incinerating temperature for 10 -12 hours, transforms the silica content of the ash
into amorphous phase. The reactivity of amorphous silica is directly proportional to the
specific surface area of ash. The ash so produced is pulverized or ground to required
fineness and mixed with cement to produce blended cement.
Fig 3.4: Rice Husk Ash
Table 3.2: Chemical Composition of Rice Husk Ash
Sr. no. Constituents Composition (%)
1 Calcium Oxide ( ) 0.3 - 2.25
2 Silicon Dioxide ( ) 86.94
3 Aluminium Oxide ( ) 0.2
4 Ferric Oxide ( ) 0.1
5 Magnesium Oxide ( ) 0.2 - 0.6
6 Sodium Oxide ( ) 0.1 – 0.8
24
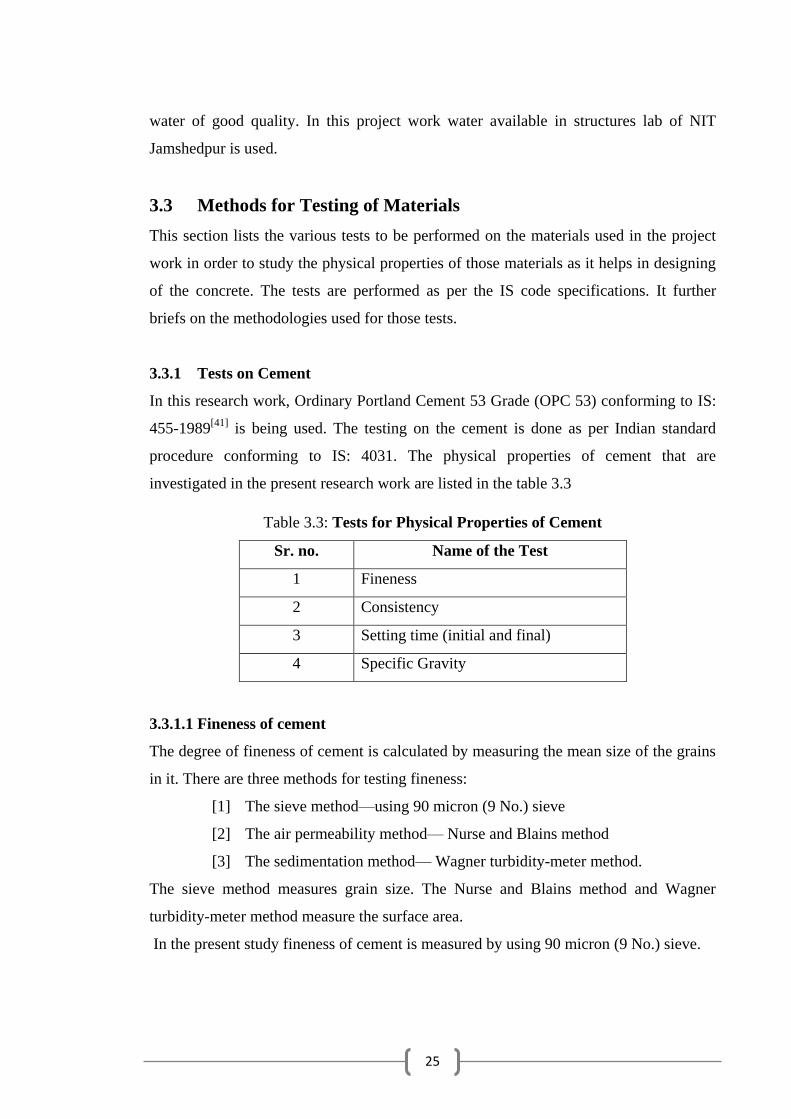
3.2.4 Chemical Admixture
The most widely used chemical admixtures in construction industry for high range water
reduction are the Super-plasticizers. The Super-plasticizer used in this project is Master
Glenium Sky 8567. It has been used for water reduction greater than 20 %.
Fig 3.5: Super Plasticizer (Master Glenium Sky 8567)
The use of a Viscosity Modifying Admixture (VMA) gives more possibilities of
controlling segregation when the amount of powder is limited. This admixture helps to
provide very good homogeneity and reduces the tendency of segregation. VMA is used
to improve viscosity of concrete. But we have not used VMA in this project as proper
dosage of Super-plasticizer can achieve the desired viscosity, thereby eliminating the
need of VMA.
3.2.5 Water
Water has been used throughout the test procedure in this project work. Natural water
which is drinkable with no pronounced taste or odour has been used as mixing water for
making concrete. Some water which may not be suitable for drinking may still be safe
for concrete mixing. Pipe born drinking water supplies are generally safe for making
concrete. Water of doubtful quality can be simply tested by making two sets of cubes or
cylinders of the same mix, one with the doubtful water and the other (used as reference)
set with distilled water, purified water, purified water, tap water, or other drinkable
25
water of good quality. In this project work water available in structures lab of NIT
Jamshedpur is used.
3.3 Methods for Testing of Materials
This section lists the various tests to be performed on the materials used in the project
work in order to study the physical properties of those materials as it helps in designing
of the concrete. The tests are performed as per the IS code specifications. It further
briefs on the methodologies used for those tests.
3.3.1 Tests on Cement
In this research work, Ordinary Portland Cement 53 Grade (OPC 53) conforming to IS:
455-1989[41]
is being used. The testing on the cement is done as per Indian standard
procedure conforming to IS: 4031. The physical properties of cement that are
investigated in the present research work are listed in the table 3.3
Table 3.3: Tests for Physical Properties of Cement
Sr. no. Name of the Test
1 Fineness
2 Consistency
3 Setting time (initial and final)
4 Specific Gravity
3.3.1.1 Fineness of cement
The degree of fineness of cement is calculated by measuring the mean size of the grains
in it. There are three methods for testing fineness:
[1] The sieve method—using 90 micron (9 No.) sieve
[2] The air permeability method— Nurse and Blains method
[3] The sedimentation method— Wagner turbidity-meter method.
The sieve method measures grain size. The Nurse and Blains method and Wagner
turbidity-meter method measure the surface area.
In the present study fineness of cement is measured by using 90 micron (9 No.) sieve.
26
Procedure:
1. Take 100 g of cement sample.
2. Air-set lumps, if present in the sample, are crushed with fingers.
3. The sample is placed on a 90 micron sieve and continuously sieved for 15
minutes.
4. Measure the residue weight of cement on the sieve.
Calculation:
Fineness =
3.3.1.2 Consistency of cement
Normal consistency of cement is the percentage of water required for the cement paste,
such that the viscosity of which will allow the Vicat plunger to penetrate up to a point 5
to 7 mm from the bottom of the mould of the Vicat Apparatus. Consistency test is
performed to estimate the amount of water to be mixed to form paste of cement in an
optimum way confirming to IS: 4031 (Part 4) 1988.The apparatus used in consistency
test of cement sample are Vicat Apparatus Conforming to IS: 5513-1976, Balance of
capacity 1Kg and sensitivity to 1gram, Gauging trowel conforming to IS: 10086-198.
Procedure:
1. 300 gm of cement is taken.
2. An amount of water measuring 25 % of cement by weight is mixed with the
cement sample.
3. The paste is poured in the mould of Vicat apparatus and the surface of the filled
paste is smoothened and levelled.
4. A circular needle of 10 mm diameter, attached to the plunger, is then lowered
gently over the cement paste surface and is released quickly. The plunger pierces
the cement paste.
5. The reading on the attached scale is recorded.
When the reading is 5-7 mm from the bottom of the mould, the amount of water added
is considered to be the correct percentage of water for normal consistency.
27
3.3.1.3 Setting time of cement
When water is added to cement, the resulting paste starts to stiffen and gain strength and
lose the consistency simultaneously. The term setting implies solidification of the plastic
cement paste. Initial and final setting times may be regarded as the two stiffening states
of the cement. The beginning of solidification, called the initial set, marks the point in
time when the paste has become unworkable. The time taken to solidify completely
marks the final set, which should not be too long in order to resume construction activity
within a reasonable time after the placement of concrete.
The initial setting time may be defined as the time taken by the paste to stiffen to
such an extent that the Vicat‘s needle is not permitted to move down through the paste
to within 5 ± 0.5 mm measured from the bottom of the mould. The final setting time is
the time after which the paste becomes so hard that the angular attachment to the needle,
under standard weight, fails to leave any mark on the hardened concrete. Initial and final
setting times are the rheological properties of cement.
Procedure:
1. A neat cement paste is prepared by gauging cement with 0.85 times the water
required to give a paste of standard consistency.
2. The stop watch is started at that instant when the water is added to the cement.
3. The mould resting on a nonporous plate is filled completely with cement paste
and the surface of filled paste is levelled smooth with the top of the mould. The
test is conducted at room temperature of 27± 2°C.
4. The mould with the cement paste is placed in the Vicat‘s apparatus and the
needle is lowered gently in contact with the test block and is then quickly
released.
5. The needle thus penetrates the test block and the reading on the VI cat‘s
apparatus graduated scale is recorded.
6. The procedure is repeated until the needle fails to pierce the block by about 5
mm measured from the bottom of the mould. The stop watch is pushed off and
the time is recorded which gives the initial setting time.
7. The cement is considered to be finally set when upon applying the needle gently
to the surface of test block, the needle makes an impression, but the attachment
fails to do so.
28
3.3.1.4 Specific gravity of cement
The specific gravity of OPC-53 is obtained by using Le-Chatelier flask as shown below.
Procedure:
1. The flask is filled with kerosene free of water to a point on the stem between
zero and 1-ml mark. The flask is immersed in a constant temperature water-bath
and the reading is recorded.
2. A weighed quantity of cement (about 64 gm) is then introduced in small
amounts at the same temperature as that of the liquid.
3. After pouring all the cement, the stopper is placed in the flask and the flask is
rolled in an inclined position, or gently whirled in a horizontal circle, so as to
free the cement from air until no further air bubbles left in the apparatus.
4. The flask is again immersed in the water-bath and the final reading is recorded.
5. The difference between the initial and the final reading represents the volume of
liquid displaced by the weight of the cement used in the test.
Calculation:
3.3.2 Tests on Aggregates
The test for aggregate is done as per IS: 2386[42]
.The specification for coarse aggregate
and fine aggregate is done as per IS: 383-1970[43]
. The physical properties of aggregate
that have been investigated in the present research work are listed in the table 3.4.
Table 3.4: Tests for Physical Properties of Aggregate
Name of the Test Fine Aggregate (sand) Coarse Aggregate
Sieve Analysis
Specific Gravity
Bulk Density
Water Absorption
Bulking X
29
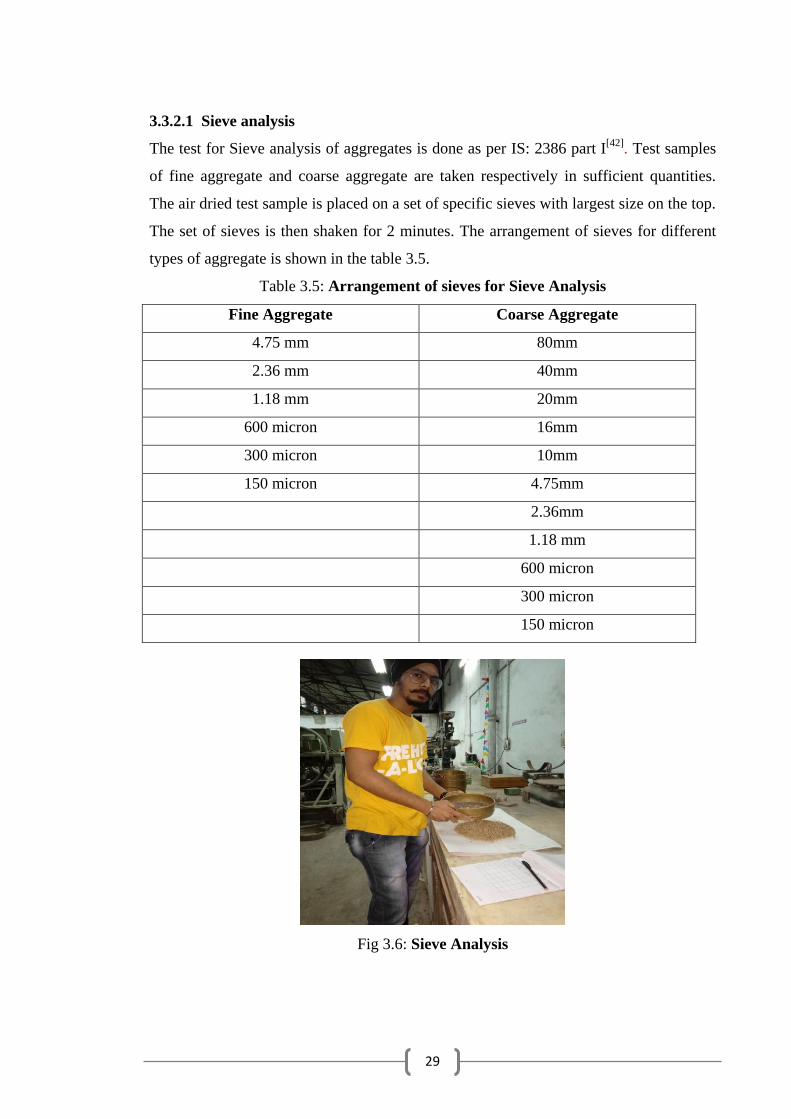
3.3.2.1 Sieve analysis
The test for Sieve analysis of aggregates is done as per IS: 2386 part I[42]
. Test samples
of fine aggregate and coarse aggregate are taken respectively in sufficient quantities.
The air dried test sample is placed on a set of specific sieves with largest size on the top.
The set of sieves is then shaken for 2 minutes. The arrangement of sieves for different
types of aggregate is shown in the table 3.5.
Table 3.5: Arrangement of sieves for Sieve Analysis
Fine Aggregate Coarse Aggregate
4.75 mm 80mm
2.36 mm 40mm
1.18 mm 20mm
600 micron 16mm
300 micron 10mm
150 micron 4.75mm
2.36mm
1.18 mm
600 micron
300 micron
150 micron
Fig 3.6: Sieve Analysis
30
Procedure:
1. The test sample is dried to a constant weight at a temperature of 110 + 5oC and
weighed.
2. The test sample is sieved through a set of IS Sieves.
3. On completion of sieving, the material on each sieve is weighed.
4. Cumulative weight passing through each sieve is calculated as a percentage of
the total sample weight.
5. Fineness modulus is obtained by adding cumulative percentage of aggregates
retained on each sieve and dividing the sum by 100.
3.3.2.2 Specific gravity & Water absorption test
The tests on Aggregates for Specific gravity and Water absorption have been performed
as per IS: 2386 part III.
The Specific Gravity of solid particles of a material is calculated as the weight
per unit mass of a given volume of solids to the weight per unit mass of an equal volume
of water at 4°C. The Specific Gravity of an aggregate is considered to be a measure of
strength or quality of the material. Stones having low specific gravity are generally
weaker than those with higher specific gravity values.
Water Absorption is defined as the ability of the material to absorb and retain
water. It is expressed as percentage in weight or of the volume of dry material.
Test procedure for Coarse Aggregate:
1. Approximately 2kg of the aggregate sample is washed thoroughly to remove
fines, drained and then placed in a wire basket and then immersed in the distilled
water at a temperature between 22 to 320C with a cover of at least 50 mm of
water above the top of the basket
2. Immediately after the immersion, the entrapped air is removed from the sample
by lifting the basket that holds it 25 mm above the base of the tank and allowing
it to drop 25 times at the rate of about one drop per second. The basket and the
aggregate should remain completely immersed in water for a period of 24±0.5
hours afterwards.
31
3. The basket and the sample are then weighed while suspended in water at a
temperature of 22 to 320C. The weight is noted while suspended in water (W1)
gm
4. The basket and the aggregate are then removed from water and allowed to drain
for a few minutes, after which the aggregates are transferred to one of the dry
absorbent clothes.
5. The empty basket is then returned to the tank of water, jolted 25 times and
weighed in water (W2) gm
6. The aggregates placed in the dry absorbent cloth are surface dried till no further
moisture could be removed by that cloth.
7. Then the aggregate is transferred to the second dry cloth spread in a single layer,
covered and allowed to dry for at least 10 minutes until the aggregates are
completely surface dry. 10 to 60 minutes drying may be needed. The surface
dried aggregate is then weighed W3 gm
8. The aggregate is placed in a shallow tray and kept in an oven maintained at a
temperature of 1100C for 24 hours. It is then removed from the oven, cooled in
air tight container and weighed W4 gm
Calculation:
Weight of saturated aggregate suspended in water with basket = W1 gm
Weight of basket suspended in water = W2 gm
Weight of saturated aggregate in water = (W1-W2) g m.
Weight of saturated surface dry aggregate in air = W4 gm
Weight of water equal to the volume of the aggregate = (W3- (W1-W2)) gm
Specific Gravity =
Water Absorption =
Test procedure for Fine aggregate:
1. Specific Gravity for fine aggregate is determined using pycnometer method.
2. Consider 500g of sample in saturated surface dry (SSD) condition and place it in
the pycnometer and weigh it (W1).
3. Pour distilled water into it until it is full.
32
4. Eliminate the entrapped air by rotating the pycnometer on its side, while
covering the hole in the apex of the cone with the help of a finger.
5. Wipe out the outer surface of pycnometer and weigh it (W2).
6. Transfer the contents of the pycnometer into a tray. It should be ensured that all
the aggregate is transferred.
7. Refill the pycnometer with distilled water to the same level.
8. Find out the weight (W3).
9. Drain water from the sample through a filter paper.
10. Place the sample in oven in a tray at a temperature of 100ºC to 110º C for 24±0.5
hours, during which period, it is stirred occasionally to facilitate drying.
11. Cool the sample and weigh it (W4).
Calculation:
Specific Gravity =
Water Absorption =
3.3.2.3 Bulk density
The test for Bulk density of both Fine and Coarse aggregates is performed as per (IS:
2386 part III). Bulk density is the mass of a unit volume of material in its natural state
along with pores and voids.
Calculation:
Bulk density =
kg/m
3
Where,
M = mass of specimen (kg)
V = volume of specimen in its natural state (m3)
3.3.2.4 Bulking of sand
Bulking is defined as the increased volume of fine aggregate due to the existence of
moisture content in it. Bulking of aggregate is dependent upon two factors:
a) Percentage of moisture content in the fine aggregate.
b) Particle size of fine aggregate.
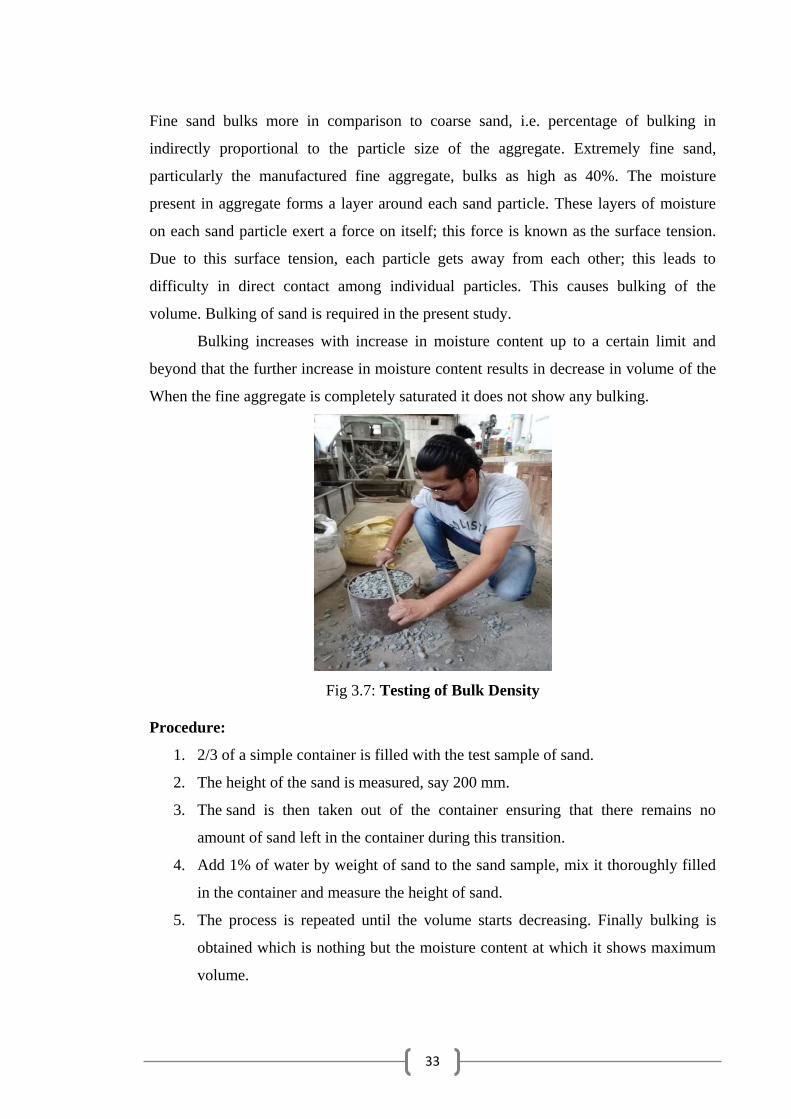
33
Fine sand bulks more in comparison to coarse sand, i.e. percentage of bulking in
indirectly proportional to the particle size of the aggregate. Extremely fine sand,
particularly the manufactured fine aggregate, bulks as high as 40%. The moisture
present in aggregate forms a layer around each sand particle. These layers of moisture
on each sand particle exert a force on itself; this force is known as the surface tension.
Due to this surface tension, each particle gets away from each other; this leads to
difficulty in direct contact among individual particles. This causes bulking of the
volume. Bulking of sand is required in the present study.
Bulking increases with increase in moisture content up to a certain limit and
beyond that the further increase in moisture content results in decrease in volume of the
When the fine aggregate is completely saturated it does not show any bulking.
Fig 3.7: Testing of Bulk Density
Procedure:
1. 2/3 of a simple container is filled with the test sample of sand.
2. The height of the sand is measured, say 200 mm.
3. The sand is then taken out of the container ensuring that there remains no
amount of sand left in the container during this transition.
4. Add 1% of water by weight of sand to the sand sample, mix it thoroughly filled
in the container and measure the height of sand.
5. The process is repeated until the volume starts decreasing. Finally bulking is
obtained which is nothing but the moisture content at which it shows maximum
volume.
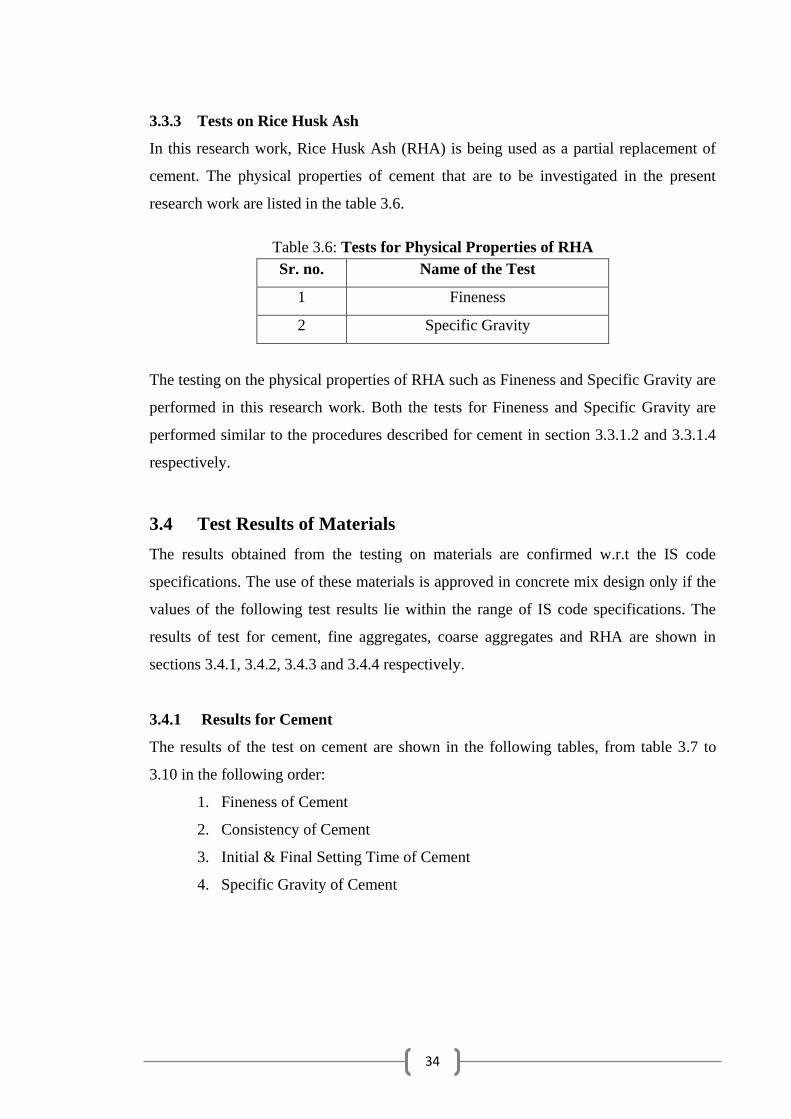
34
3.3.3 Tests on Rice Husk Ash
In this research work, Rice Husk Ash (RHA) is being used as a partial replacement of
cement. The physical properties of cement that are to be investigated in the present
research work are listed in the table 3.6.
Table 3.6: Tests for Physical Properties of RHA
Sr. no. Name of the Test
1 Fineness
2 Specific Gravity
The testing on the physical properties of RHA such as Fineness and Specific Gravity are
performed in this research work. Both the tests for Fineness and Specific Gravity are
performed similar to the procedures described for cement in section 3.3.1.2 and 3.3.1.4
respectively.
3.4 Test Results of Materials
The results obtained from the testing on materials are confirmed w.r.t the IS code
specifications. The use of these materials is approved in concrete mix design only if the
values of the following test results lie within the range of IS code specifications. The
results of test for cement, fine aggregates, coarse aggregates and RHA are shown in
sections 3.4.1, 3.4.2, 3.4.3 and 3.4.4 respectively.
3.4.1 Results for Cement
The results of the test on cement are shown in the following tables, from table 3.7 to
3.10 in the following order:
1. Fineness of Cement
2. Consistency of Cement
3. Initial & Final Setting Time of Cement
4. Specific Gravity of Cement
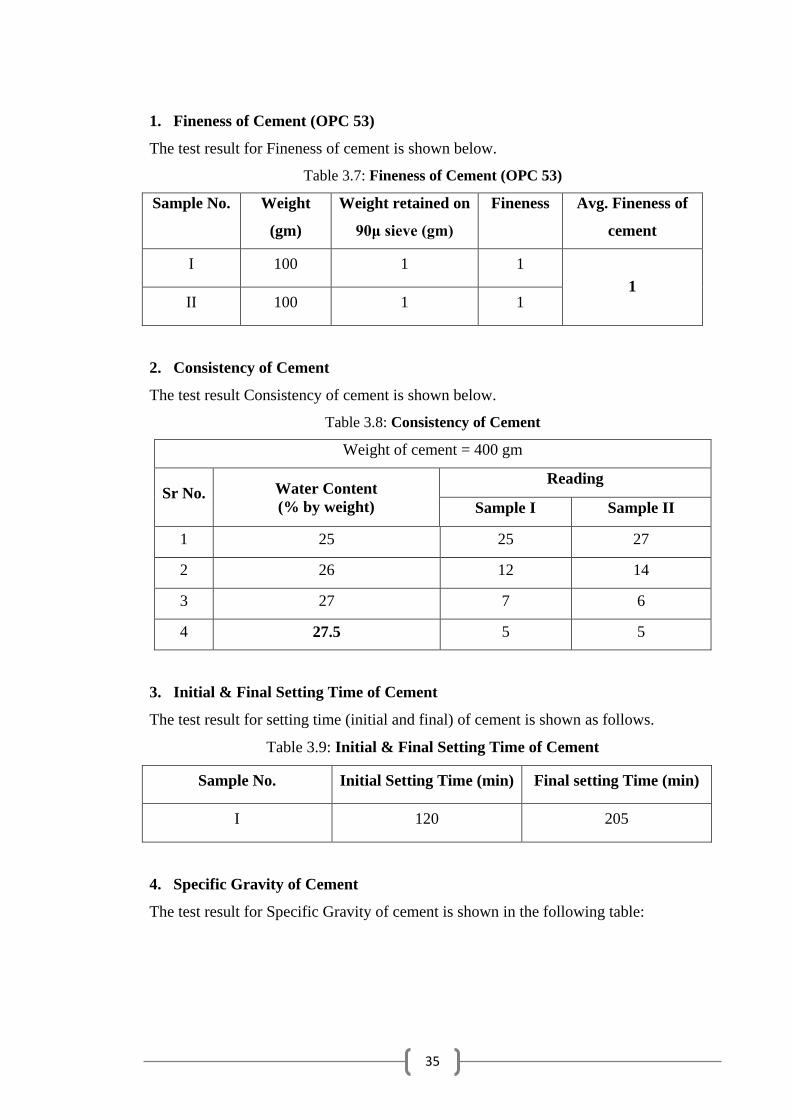
35
1. Fineness of Cement (OPC 53)
The test result for Fineness of cement is shown below.
Table 3.7: Fineness of Cement (OPC 53)
Sample No. Weight
(gm)
Weight retained on
90μ sieve (gm)
Fineness Avg. Fineness of
cement
I 100 1 1
1 II 100 1 1
2. Consistency of Cement
The test result Consistency of cement is shown below.
Table 3.8: Consistency of Cement
Weight of cement = 400 gm
Sr No. Water Content
(% by weight)
Reading
Sample I Sample II
1 25 25 27
2 26 12 14
3 27 7 6
4 27.5 5 5
3. Initial & Final Setting Time of Cement
The test result for setting time (initial and final) of cement is shown as follows.
Table 3.9: Initial & Final Setting Time of Cement
Sample No. Initial Setting Time (min) Final setting Time (min)
I 120 205
4. Specific Gravity of Cement
The test result for Specific Gravity of cement is shown in the following table:
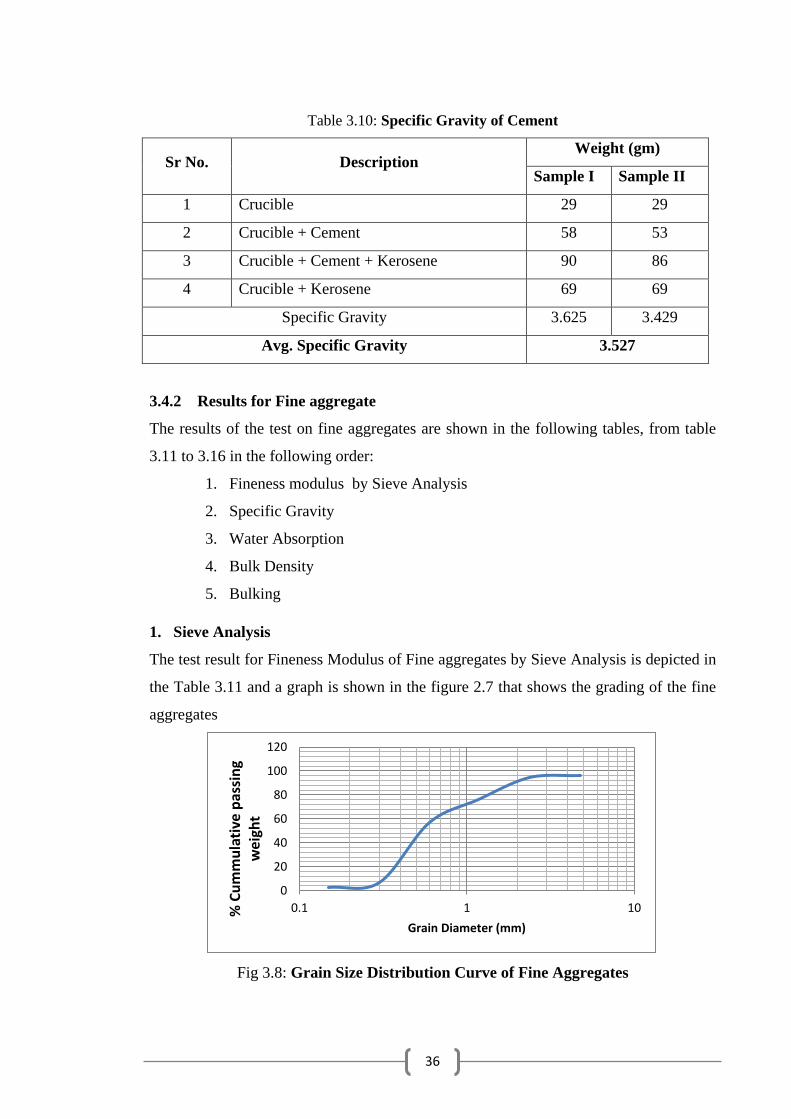
36
Table 3.10: Specific Gravity of Cement
Sr No. Description Weight (gm)
Sample I Sample II
1 Crucible 29 29
2 Crucible + Cement 58 53
3 Crucible + Cement + Kerosene 90 86
4 Crucible + Kerosene 69 69
Specific Gravity 3.625 3.429
Avg. Specific Gravity 3.527
3.4.2 Results for Fine aggregate
The results of the test on fine aggregates are shown in the following tables, from table
3.11 to 3.16 in the following order:
1. Fineness modulus by Sieve Analysis
2. Specific Gravity
3. Water Absorption
4. Bulk Density
5. Bulking
1. Sieve Analysis
The test result for Fineness Modulus of Fine aggregates by Sieve Analysis is depicted in
the Table 3.11 and a graph is shown in the figure 2.7 that shows the grading of the fine
aggregates
Fig 3.8: Grain Size Distribution Curve of Fine Aggregates
0
20
40
60
80
100
120
0.1 1 10% C
um
mu
lati
ve p
assi
ng
w
eig
ht
Grain Diameter (mm)

37
Table 3.11: Fineness modulus of Fine Aggregate
Sieve Analysis of Fine Aggregate
Weight of Sample = 1000 gm
Sr
No.
Size of
Sieve
(mm)
Weight
retained
on sieve
(gm)
%
weight
retained
Cumulative
% weight
retained
Cumulative
% passed
though
Ʃ
cum
%
F.M.
1 4.75 34 3.4 3.4 96.6
335.3
3.3
53
2 2.36 20 2 5.4 94.6
3 1.18 183 18.3 23.7 76.3
4 0.6 196 19.6 43.3 56.7
5 0.3 495 49.5 92.8 7.2
6 0.15 48 4.8 97.6 2.4
7 Pan 9 0.9 98.5 1.5
2. Specific Gravity
The test result for Specific Gravity of Fine aggregates is shown below.
Table 3.12: Specific Gravity of Fine Aggregate
Sr No. Description Weight (gm)
Sample I Sample II
1 Empty Pycnometer 618 626
2 Pycno. + Sand 1394 1418
3 Pycno. + Sand + Water 1947 1968
4 Pycno. + Water 1468 1472
Specific Gravity 2.613 2.676
Avg. Specific Gravity 2.644
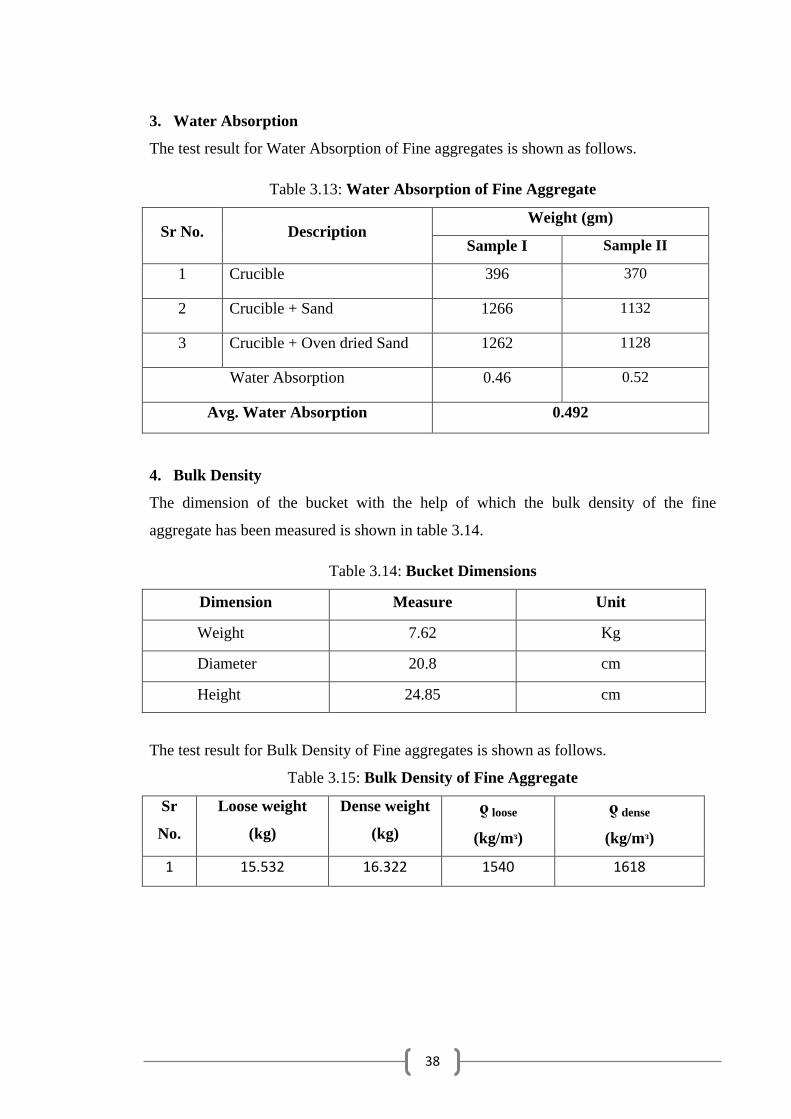
38
3. Water Absorption
The test result for Water Absorption of Fine aggregates is shown as follows.
Table 3.13: Water Absorption of Fine Aggregate
Sr No. Description Weight (gm)
Sample I Sample II
1 Crucible 396 370
2 Crucible + Sand 1266 1132
3 Crucible + Oven dried Sand 1262 1128
Water Absorption 0.46 0.52
Avg. Water Absorption 0.492
4. Bulk Density
The dimension of the bucket with the help of which the bulk density of the fine
aggregate has been measured is shown in table 3.14.
Table 3.14: Bucket Dimensions
Dimension Measure Unit
Weight 7.62 Kg
Diameter 20.8 cm
Height 24.85 cm
The test result for Bulk Density of Fine aggregates is shown as follows.
Table 3.15: Bulk Density of Fine Aggregate
Sr
No.
Loose weight
(kg)
Dense weight
(kg)
ƍ loose
(kg/mᶟ)
ƍ dense
(kg/mᶟ)
1 15.532 16.322 1540 1618
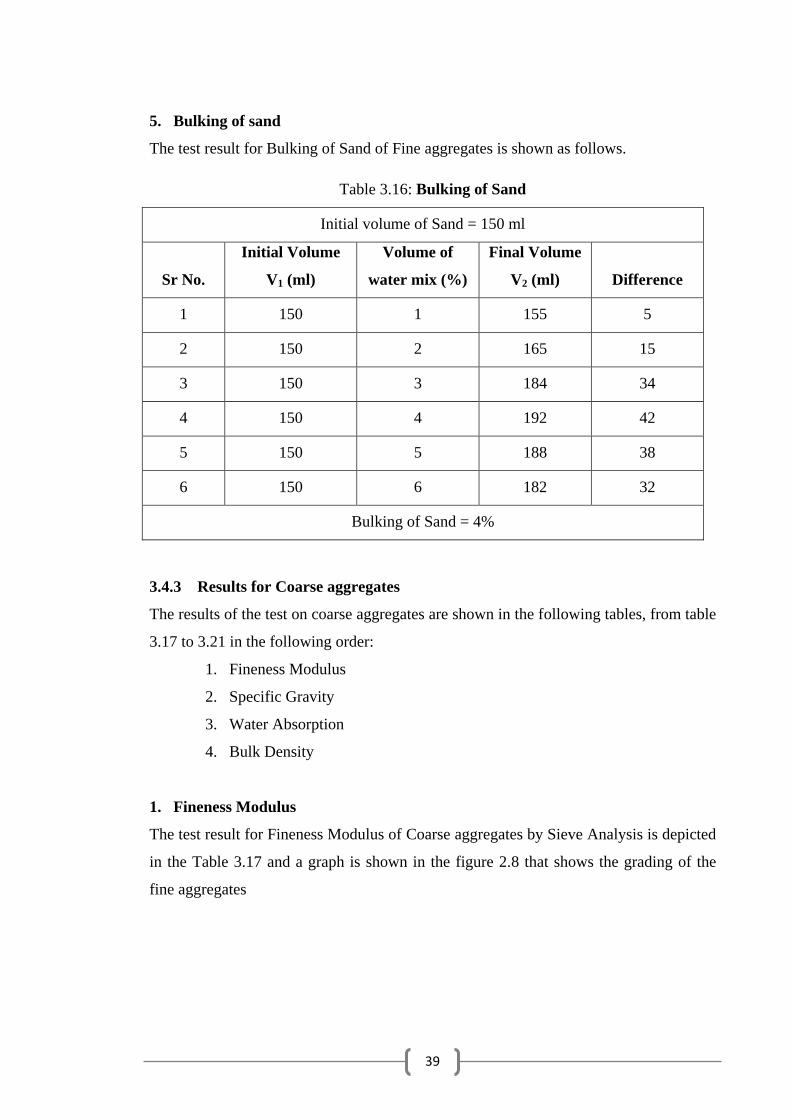
39
5. Bulking of sand
The test result for Bulking of Sand of Fine aggregates is shown as follows.
Table 3.16: Bulking of Sand
Initial volume of Sand = 150 ml
Sr No.
Initial Volume
V1 (ml)
Volume of
water mix (%)
Final Volume
V2 (ml)
Difference
1 150 1 155 5
2 150 2 165 15
3 150 3 184 34
4 150 4 192 42
5 150 5 188 38
6 150 6 182 32
Bulking of Sand = 4%
3.4.3 Results for Coarse aggregates
The results of the test on coarse aggregates are shown in the following tables, from table
3.17 to 3.21 in the following order:
1. Fineness Modulus
2. Specific Gravity
3. Water Absorption
4. Bulk Density
1. Fineness Modulus
The test result for Fineness Modulus of Coarse aggregates by Sieve Analysis is depicted
in the Table 3.17 and a graph is shown in the figure 2.8 that shows the grading of the
fine aggregates

40
Fig 3.9: Grain Size Distribution Curve of Coarse Aggregate
Table 3.17: Sieve Analysis of Coarse Aggregate
Fineness modulus of Coarse Aggregate
Weight of Sample = 10 kg
Size of
Sieve
(mm)
Weight
retained on
sieve (gm)
%
weight
retained
cumulative
% weight
retained
Cumulative
% passed
though
Ʃcum%
∑
(F.M)
80 0 0 0 100
766.82
7.668
40 0 0 0 100
20 1160 11.6 11.6 88.4
10 5676 56.76 68.36 31.64
4.75 2844 28.44 96.8 3.2
2.36 126 1.26 98.06 1.94
1.18 23 0.23 98.29 1.71
0.6 2 0.02 98.31 1.69
0.3 2 0.02 98.33 1.67
0.15 2 0.02 98.35 1.65
Pan 37 0.37 98.72 1.28
0
20
40
60
80
100
0.1 1 10 100
% C
uh
mm
ula
tive
pas
sin
g w
eig
ht
Grain Diameter (mm)
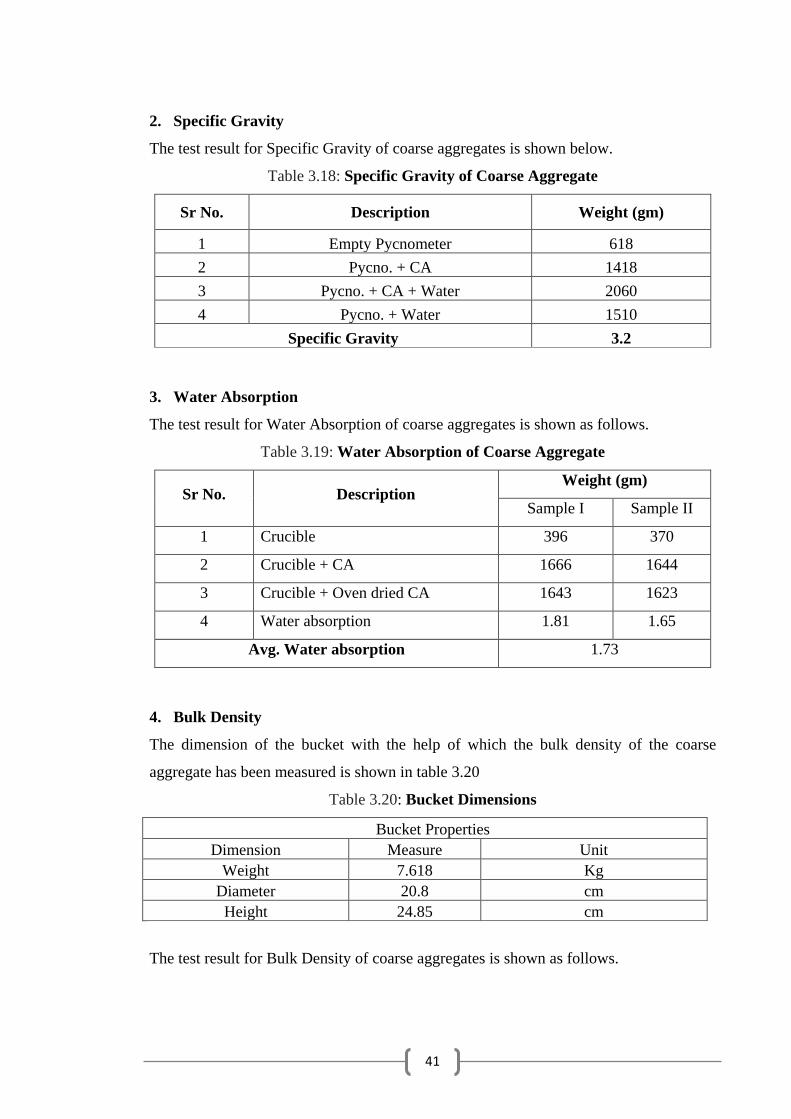
41
2. Specific Gravity
The test result for Specific Gravity of coarse aggregates is shown below.
Table 3.18: Specific Gravity of Coarse Aggregate
Sr No. Description Weight (gm)
1 Empty Pycnometer 618
2 Pycno. + CA 1418
3 Pycno. + CA + Water 2060
4 Pycno. + Water 1510
Specific Gravity 3.2
3. Water Absorption
The test result for Water Absorption of coarse aggregates is shown as follows.
Table 3.19: Water Absorption of Coarse Aggregate
Sr No. Description Weight (gm)
Sample I Sample II
1 Crucible 396 370
2 Crucible + CA 1666 1644
3 Crucible + Oven dried CA 1643 1623
4 Water absorption 1.81 1.65
Avg. Water absorption 1.73
4. Bulk Density
The dimension of the bucket with the help of which the bulk density of the coarse
aggregate has been measured is shown in table 3.20
Table 3.20: Bucket Dimensions
Bucket Properties Dimension Measure Unit
Weight 7.618 Kg Diameter 20.8 cm Height 24.85 cm
The test result for Bulk Density of coarse aggregates is shown as follows.
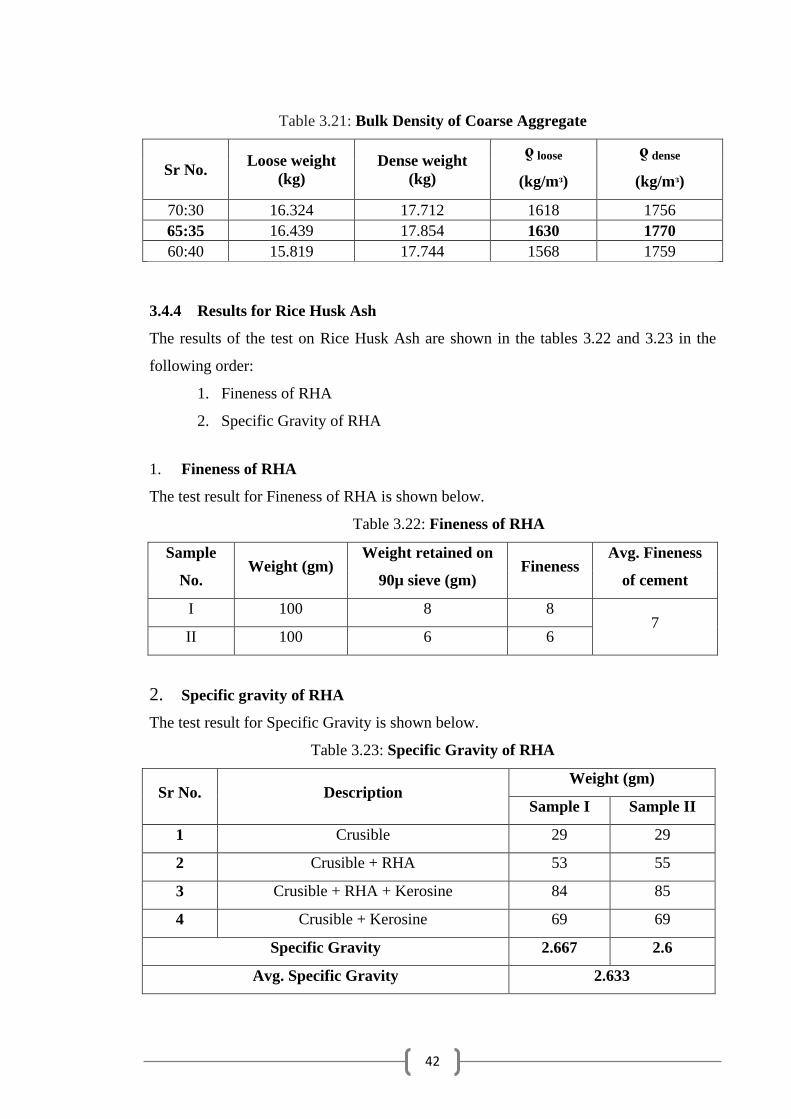
42
Table 3.21: Bulk Density of Coarse Aggregate
Sr No. Loose weight
(kg)
Dense weight
(kg)
ƍ loose
(kg/mᶟ)
ƍ dense
(kg/mᶟ)
70:30 16.324 17.712 1618 1756
65:35 16.439 17.854 1630 1770
60:40 15.819 17.744 1568 1759
3.4.4 Results for Rice Husk Ash
The results of the test on Rice Husk Ash are shown in the tables 3.22 and 3.23 in the
following order:
1. Fineness of RHA
2. Specific Gravity of RHA
1. Fineness of RHA
The test result for Fineness of RHA is shown below.
Table 3.22: Fineness of RHA
Sample
No. Weight (gm)
Weight retained on
90µ sieve (gm) Fineness
Avg. Fineness
of cement
I 100 8 8 7
II 100 6 6
2. Specific gravity of RHA
The test result for Specific Gravity is shown below.
Table 3.23: Specific Gravity of RHA
Sr No. Description Weight (gm)
Sample I Sample II
1 Crusible 29 29
2 Crusible + RHA 53 55
3 Crusible + RHA + Kerosine 84 85
4 Crusible + Kerosine 69 69
Specific Gravity 2.667 2.6
Avg. Specific Gravity 2.633

43
3.5 Result Discussion &Summary
The results of the particular sets of tests performed for the investigation of the physical
properties of the materials supplied namely OPC 53 grade cement, fine aggregate,
coarse aggregate and Rice Husk Ash, for the experimental work in this project, are
depicted in Table 3.24, 3.25, 3.26 and 3.27 respectively. A brief summary is provided
on the physical properties of the material supplied.
3.5.1 Cement
Different physical tests for the purpose of Mix Design on the supplied cement
Conforming: to IS 455-1989 specifications were conducted and the test results are
reported in Table: 3.24. The results here have been obtained by calculating the average
of the results from the trial samples.
Table 3.24: Physical Properties of Ordinary Portland Cement (OPC 53)
Sr No. Particulars of Test Result
1 Consistency 27.5 %
2 Fineness 1.00 %
3 Specific Gravity 2.954
4
Set
ting
Tim
e
Initial Setting time 120 minutes
Final Setting time 205 minutes
3.5.2 Aggregates
Fine aggregates: Locally available sand from river Kharkai, Jamshedpur with 4.75 mm
maximum size has been used as fine aggregate. The corresponding specific gravity and
bulk density of fine aggregate used were calculated as 2.644 and 1618 kg/m3
respectively, both confirming to IS 383–1987[55](51). The water absorption capacity
and the fineness modulus of fine aggregate have been found to be 0.492 % and 3.647of
Zone II respectively.
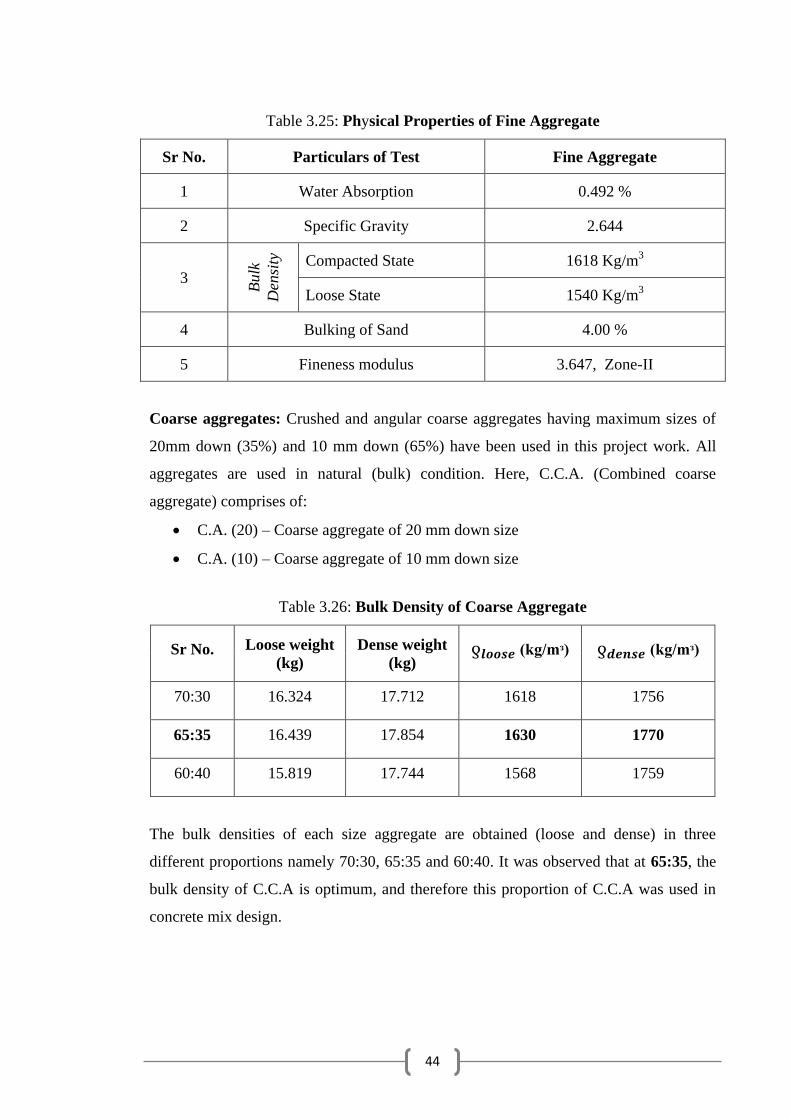
44
Table 3.25: Physical Properties of Fine Aggregate
Sr No. Particulars of Test Fine Aggregate
1 Water Absorption 0.492 %
2 Specific Gravity 2.644
3
Bulk
Den
sity
Compacted State 1618 Kg/m
3
Loose State 1540 Kg/m3
4 Bulking of Sand 4.00 %
5 Fineness modulus 3.647, Zone-II
Coarse aggregates: Crushed and angular coarse aggregates having maximum sizes of
20mm down (35%) and 10 mm down (65%) have been used in this project work. All
aggregates are used in natural (bulk) condition. Here, C.C.A. (Combined coarse
aggregate) comprises of:
C.A. (20) – Coarse aggregate of 20 mm down size
C.A. (10) – Coarse aggregate of 10 mm down size
Table 3.26: Bulk Density of Coarse Aggregate
Sr No. Loose weight
(kg)
Dense weight
(kg) (kg/mᶟ) (kg/mᶟ)
70:30 16.324 17.712 1618 1756
65:35 16.439 17.854 1630 1770
60:40 15.819 17.744 1568 1759
The bulk densities of each size aggregate are obtained (loose and dense) in three
different proportions namely 70:30, 65:35 and 60:40. It was observed that at 65:35, the
bulk density of C.C.A is optimum, and therefore this proportion of C.C.A was used in
concrete mix design.
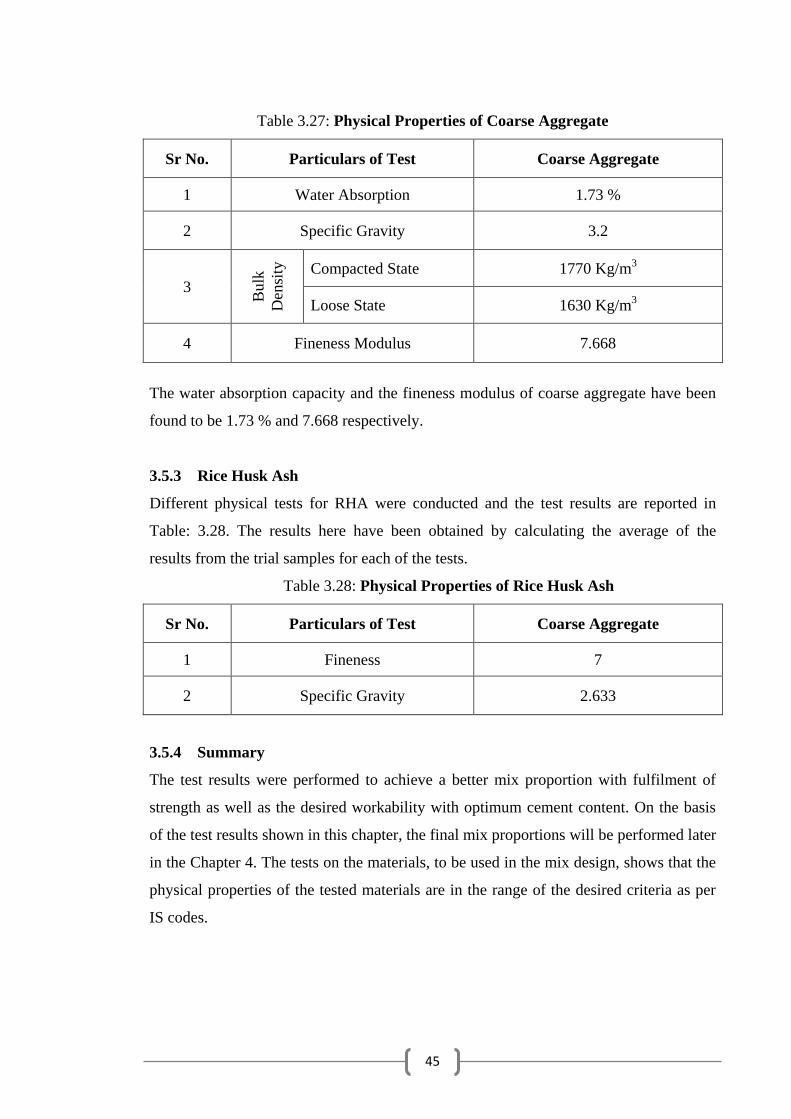
45
Table 3.27: Physical Properties of Coarse Aggregate
Sr No. Particulars of Test Coarse Aggregate
1 Water Absorption 1.73 %
2 Specific Gravity 3.2
3
Bulk
Den
sity
Compacted State 1770 Kg/m
3
Loose State 1630 Kg/m3
4 Fineness Modulus 7.668
The water absorption capacity and the fineness modulus of coarse aggregate have been
found to be 1.73 % and 7.668 respectively.
3.5.3 Rice Husk Ash
Different physical tests for RHA were conducted and the test results are reported in
Table: 3.28. The results here have been obtained by calculating the average of the
results from the trial samples for each of the tests.
Table 3.28: Physical Properties of Rice Husk Ash
Sr No. Particulars of Test Coarse Aggregate
1 Fineness 7
2 Specific Gravity 2.633
3.5.4 Summary
The test results were performed to achieve a better mix proportion with fulfilment of
strength as well as the desired workability with optimum cement content. On the basis
of the test results shown in this chapter, the final mix proportions will be performed later
in the Chapter 4. The tests on the materials, to be used in the mix design, shows that the
physical properties of the tested materials are in the range of the desired criteria as per
IS codes.

46
Chapter 4 Experimental Program on SCC
4.1 Introduction
This chapter discusses about the methodology for Mix Design by Nan-Su Method,
provides a report on Concrete MIX Design data, includes the experimental program for
testing the designed SCC for fresh state as well as hardened state and later shows the
result of these sets of tests.
In general, for efficient designing of SCC mixes, the sequential procedure of
designing is: Designation of desired air content, Determination of coarse aggregate
volume, Determination of sand content, Design of paste composition, Determination of
optimum water:powder ratio and superplasticizer dosage in mortar. Finally the concrete
properties are assessed by standard tests.
Fig 4.1: General Mix design procedure
4.2 Methodology for Mix Design
The method used for the mix designing of the concrete in this project is the Nan-Su
Method (2001) [44]
. The various calculations to be performed using the Nan-Su Method
has been listed as follows:
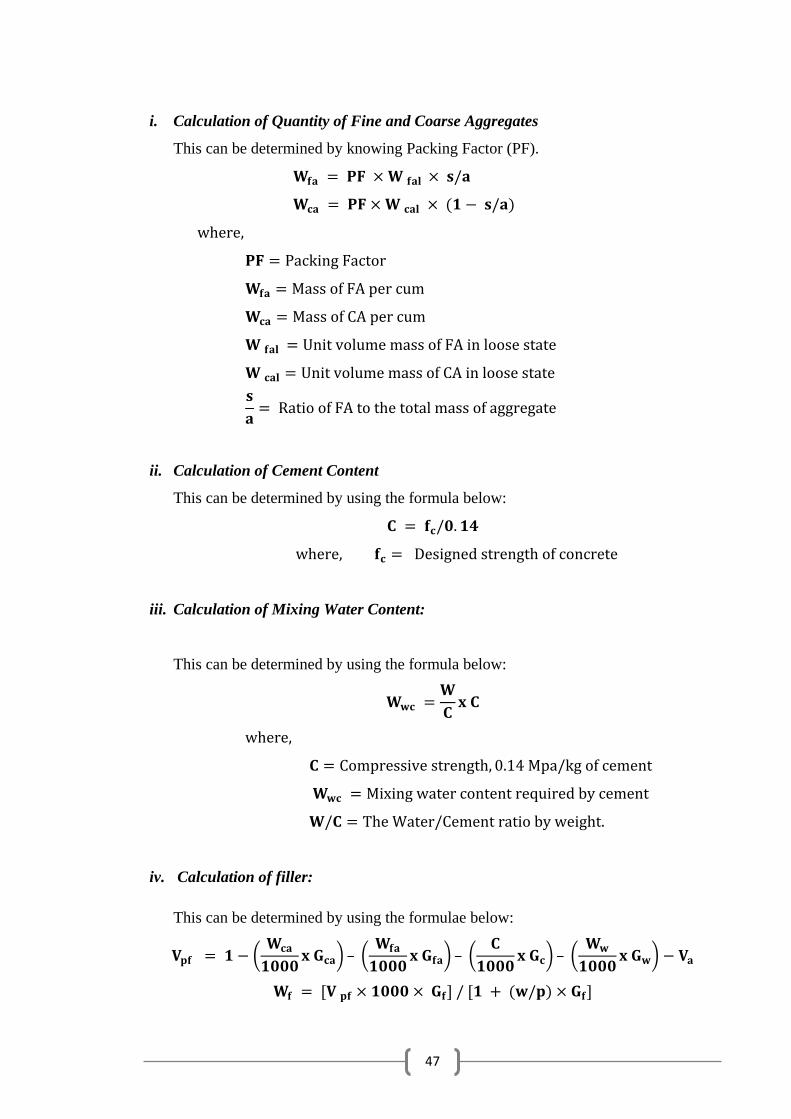
47
i. Calculation of Quantity of Fine and Coarse Aggregates
This can be determined by knowing Packing Factor (PF).
ii. Calculation of Cement Content
This can be determined by using the formula below:
iii. Calculation of Mixing Water Content:
This can be determined by using the formula below:
iv. Calculation of filler:
This can be determined by using the formulae below:
(
) (
) (
) (
)
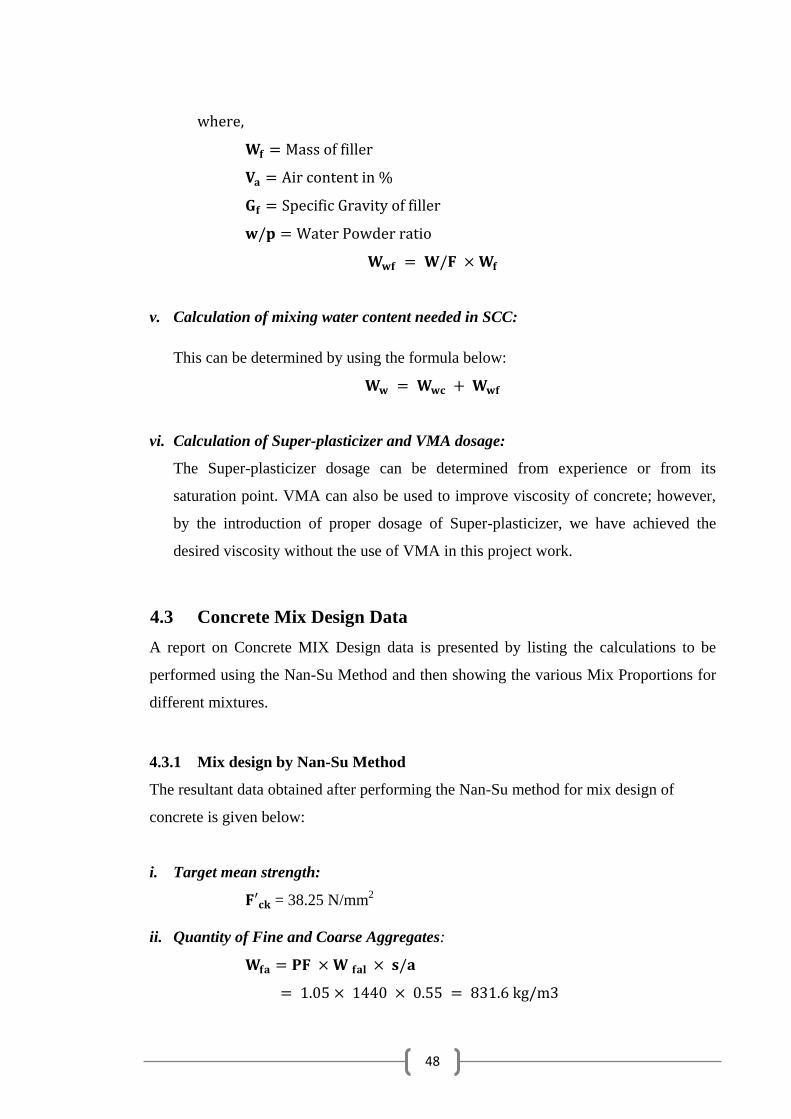
48
v. Calculation of mixing water content needed in SCC:
This can be determined by using the formula below:
vi. Calculation of Super-plasticizer and VMA dosage:
The Super-plasticizer dosage can be determined from experience or from its
saturation point. VMA can also be used to improve viscosity of concrete; however,
by the introduction of proper dosage of Super-plasticizer, we have achieved the
desired viscosity without the use of VMA in this project work.
4.3 Concrete Mix Design Data
A report on Concrete MIX Design data is presented by listing the calculations to be
performed using the Nan-Su Method and then showing the various Mix Proportions for
different mixtures.
4.3.1 Mix design by Nan-Su Method
The resultant data obtained after performing the Nan-Su method for mix design of
concrete is given below:
i. Target mean strength:
= 38.25 N/mm2
ii. Quantity of Fine and Coarse Aggregates:
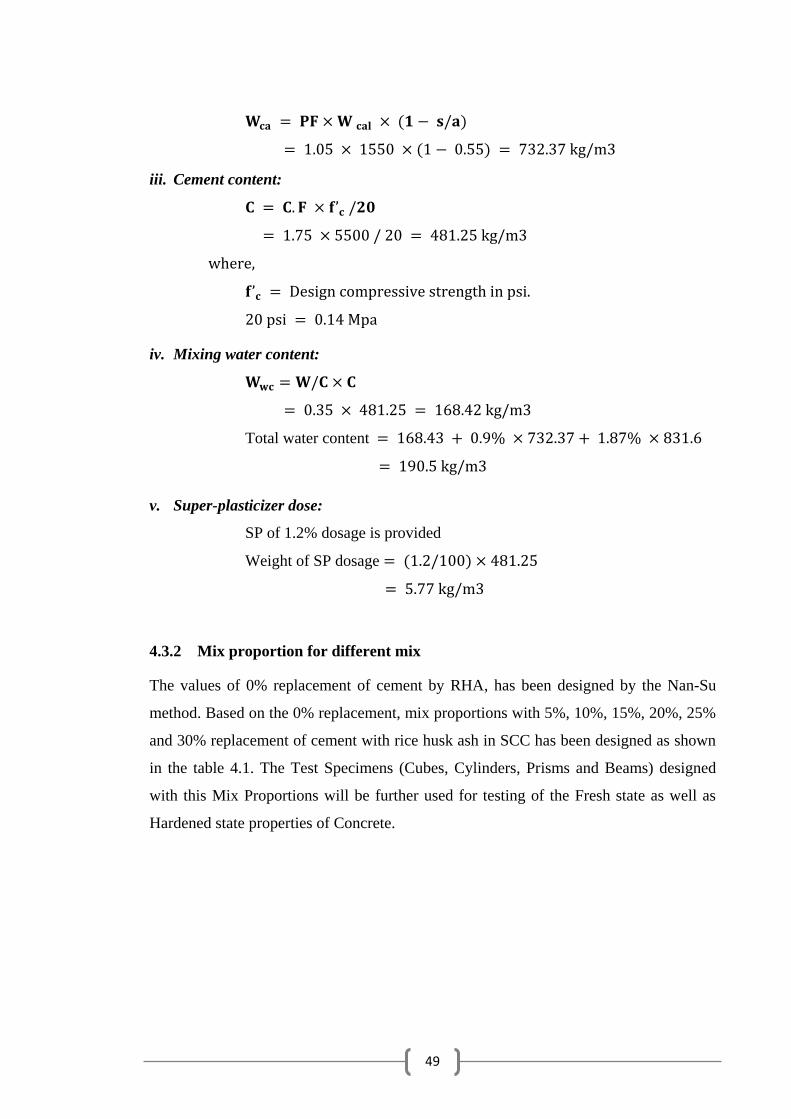
49
iii. Cement content:
iv. Mixing water content:
Total water content
v. Super-plasticizer dose:
SP of 1.2% dosage is provided
Weight of SP dosage
4.3.2 Mix proportion for different mix
The values of 0% replacement of cement by RHA, has been designed by the Nan-Su
method. Based on the 0% replacement, mix proportions with 5%, 10%, 15%, 20%, 25%
and 30% replacement of cement with rice husk ash in SCC has been designed as shown
in the table 4.1. The Test Specimens (Cubes, Cylinders, Prisms and Beams) designed
with this Mix Proportions will be further used for testing of the Fresh state as well as
Hardened state properties of Concrete.
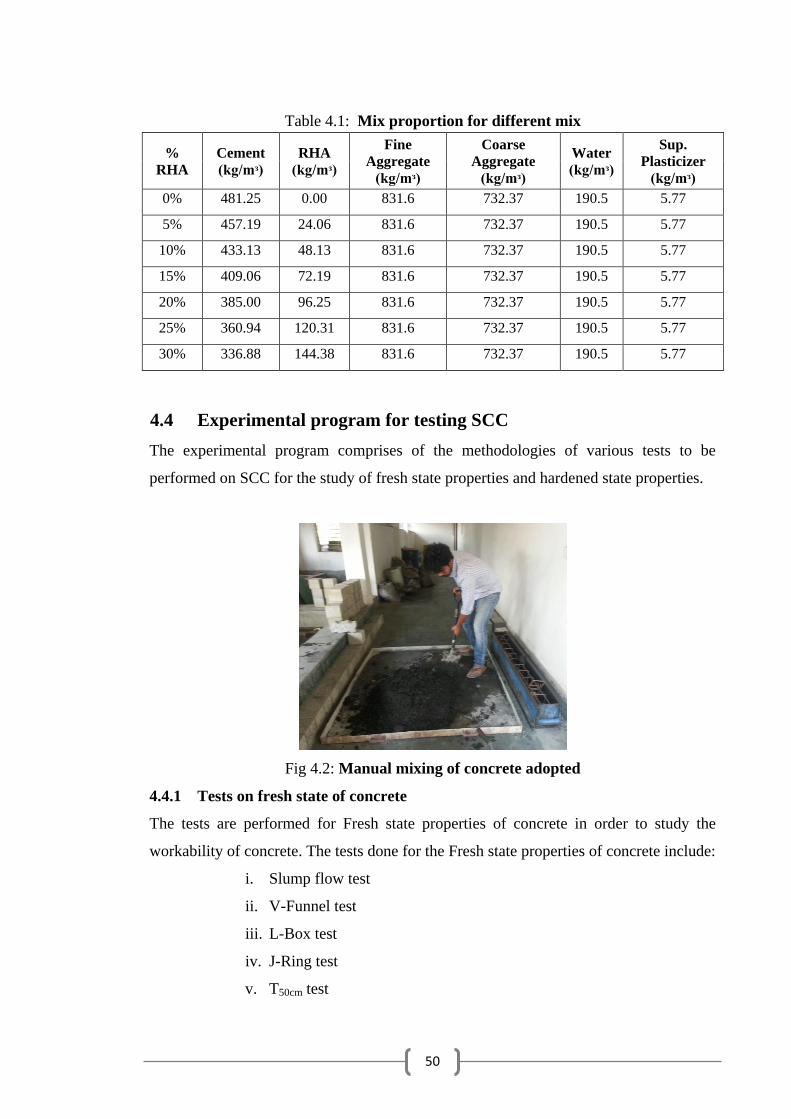
50
Table 4.1: Mix proportion for different mix
%
RHA
Cement
(kg/mᶟ)
RHA
(kg/mᶟ)
Fine
Aggregate
(kg/mᶟ)
Coarse
Aggregate
(kg/mᶟ)
Water
(kg/mᶟ)
Sup.
Plasticizer
(kg/mᶟ)
0% 481.25 0.00 831.6 732.37 190.5 5.77
5% 457.19 24.06 831.6 732.37 190.5 5.77
10% 433.13 48.13 831.6 732.37 190.5 5.77
15% 409.06 72.19 831.6 732.37 190.5 5.77
20% 385.00 96.25 831.6 732.37 190.5 5.77
25% 360.94 120.31 831.6 732.37 190.5 5.77
30% 336.88 144.38 831.6 732.37 190.5 5.77
4.4 Experimental program for testing SCC
The experimental program comprises of the methodologies of various tests to be
performed on SCC for the study of fresh state properties and hardened state properties.
Fig 4.2: Manual mixing of concrete adopted
4.4.1 Tests on fresh state of concrete
The tests are performed for Fresh state properties of concrete in order to study the
workability of concrete. The tests done for the Fresh state properties of concrete include:
i. Slump flow test
ii. V-Funnel test
iii. L-Box test
iv. J-Ring test
v. T50cm test
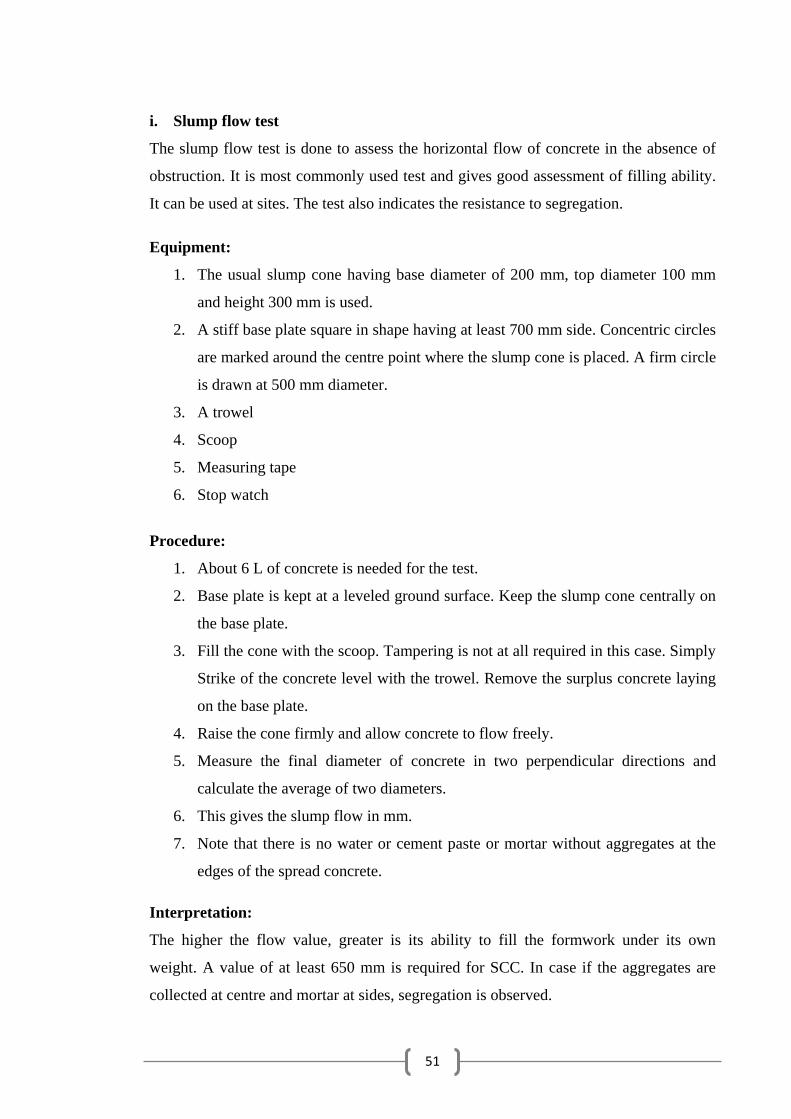
51
i. Slump flow test
The slump flow test is done to assess the horizontal flow of concrete in the absence of
obstruction. It is most commonly used test and gives good assessment of filling ability.
It can be used at sites. The test also indicates the resistance to segregation.
Equipment:
1. The usual slump cone having base diameter of 200 mm, top diameter 100 mm
and height 300 mm is used.
2. A stiff base plate square in shape having at least 700 mm side. Concentric circles
are marked around the centre point where the slump cone is placed. A firm circle
is drawn at 500 mm diameter.
3. A trowel
4. Scoop
5. Measuring tape
6. Stop watch
Procedure:
1. About 6 L of concrete is needed for the test.
2. Base plate is kept at a leveled ground surface. Keep the slump cone centrally on
the base plate.
3. Fill the cone with the scoop. Tampering is not at all required in this case. Simply
Strike of the concrete level with the trowel. Remove the surplus concrete laying
on the base plate.
4. Raise the cone firmly and allow concrete to flow freely.
5. Measure the final diameter of concrete in two perpendicular directions and
calculate the average of two diameters.
6. This gives the slump flow in mm.
7. Note that there is no water or cement paste or mortar without aggregates at the
edges of the spread concrete.
Interpretation:
The higher the flow value, greater is its ability to fill the formwork under its own
weight. A value of at least 650 mm is required for SCC. In case if the aggregates are
collected at centre and mortar at sides, segregation is observed.
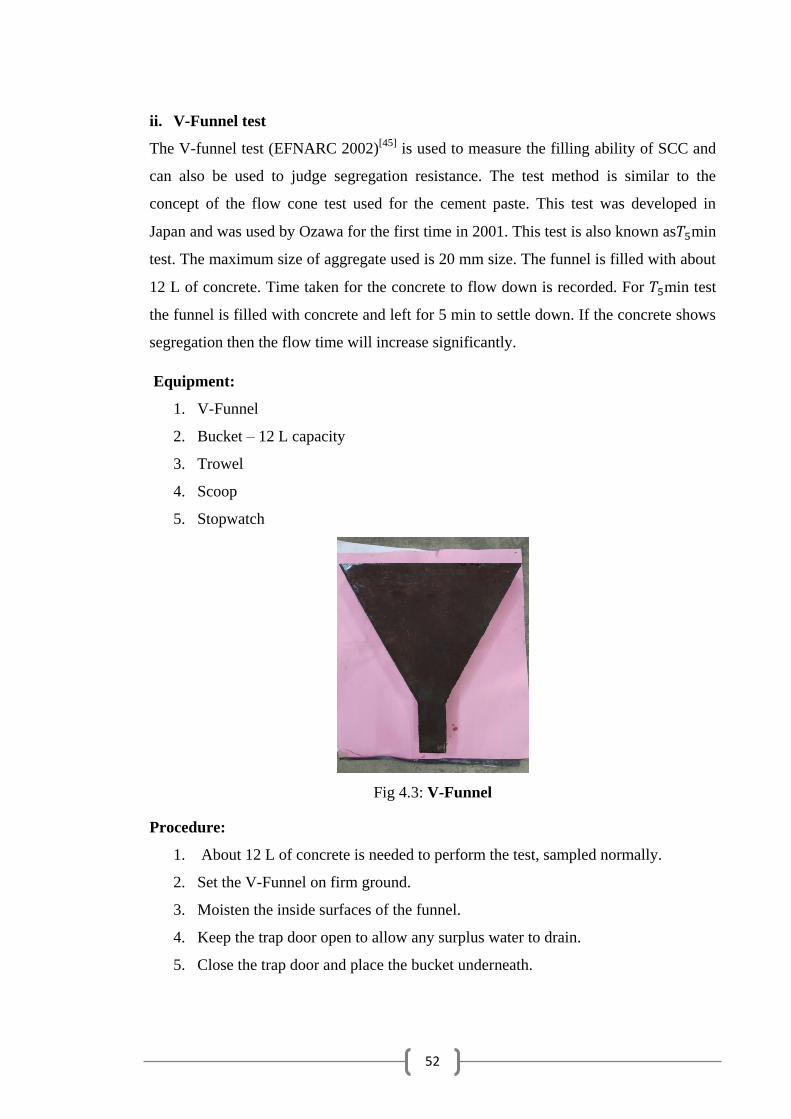
52
ii. V-Funnel test
The V-funnel test (EFNARC 2002)[45]
is used to measure the filling ability of SCC and
can also be used to judge segregation resistance. The test method is similar to the
concept of the flow cone test used for the cement paste. This test was developed in
Japan and was used by Ozawa for the first time in 2001. This test is also known as min
test. The maximum size of aggregate used is 20 mm size. The funnel is filled with about
12 L of concrete. Time taken for the concrete to flow down is recorded. For min test
the funnel is filled with concrete and left for 5 min to settle down. If the concrete shows
segregation then the flow time will increase significantly.
Equipment:
1. V-Funnel
2. Bucket – 12 L capacity
3. Trowel
4. Scoop
5. Stopwatch
Fig 4.3: V-Funnel
Procedure:
1. About 12 L of concrete is needed to perform the test, sampled normally.
2. Set the V-Funnel on firm ground.
3. Moisten the inside surfaces of the funnel.
4. Keep the trap door open to allow any surplus water to drain.
5. Close the trap door and place the bucket underneath.
53
6. Fill the apparatus completely with concrete without compacting or tamping
simply strike off the concrete level with the top with the trowel.
7. Open within 10 sec after filling the trap door and allow the concrete to flow out
under gravity.
8. Start the stopwatch when the trap door is opened, and record the time for the
discharge to complete (the flow time). This taken to be when light is seen from
above through the funnel.
9. The whole test has to be performed within 5 min.
Interpretation:
This test measures the ease of flow of the concrete; shorter flow times indicate greater
flow ability. For SCC a flow time of 8-12 sec is considered appropriate. The inverted
cone shape restricts flow, and prolonged flow times may give some indication of the
susceptibility of the mix to blocking. After 5 min of settling, segregation of concrete
will show a less continuous flow with an increase in flow time.
iii. L-Box test
This test is based on Japanese design for under water concrete. The test assesses the
flow of the concrete, and also the extent to which it is subject to blocking by
reinforcement. The apparatus consist of rectangular section box in the shape of an ‗L‘,
with a vertical and horizontal section, separated by a movable gate, in front of which
vertical length of reinforcement bar are fitted. The vertical section is filled with
concrete, and then the gate lifted to let the concrete flowing to the horizontal section.
When the flow has stopped, the height of the concrete at the end of the horizontal
section is expressed as a proportion of that remaining in the vertical section. It indicates
the slope of the concrete when at rest. This is an indication passing ability, or the degree
to which the passage of concrete through the bars is restricted. The horizontal section of
the box can be marked at 200 mm and 400 mm from the gate and the time taken to reach
these points is measured. These are known as the and times and are an
indication for the filling ability.

54
Fig 4.4: L-Box
Equipment:
1. L-Box of a still non absorbing material
2. Trowel
3. Scoop
4. Stopwatch
Procedure:
1. About 14 L of concrete is needed to perform the test, sampled normally.
2. Set the apparatus level on firm ground, ensure that the sliding gate can open
freely and then close it.
3. Moisten the inside surfaces of the apparatus, remove any surplus water.
4. Fill the vertical section of the apparatus with the concrete sample.
5. Leave it to stand for 1 min.
6. Lift the sliding gate and allow the concrete to flow out into the horizontal
section. Simultaneously, start the stopwatch and record the times taken for the
concrete to reach 200 and 400 mm marks.
7. When the concrete stops flowing, the distances and are measured.
Interpretation:
If the concrete flows as freely as water, at rest it will be horizontal therefore / will
be equal to 1. Therefore nearer the test value to unity, better the flow of concrete.
Minimum acceptable value is 0.8 (EFNARC 2002). and time can give some
indication of ease of flow. No suitable values have been suggested in this case. Obvious
blocking of coarse aggregate behind the reinforcing bars can be detected visually.
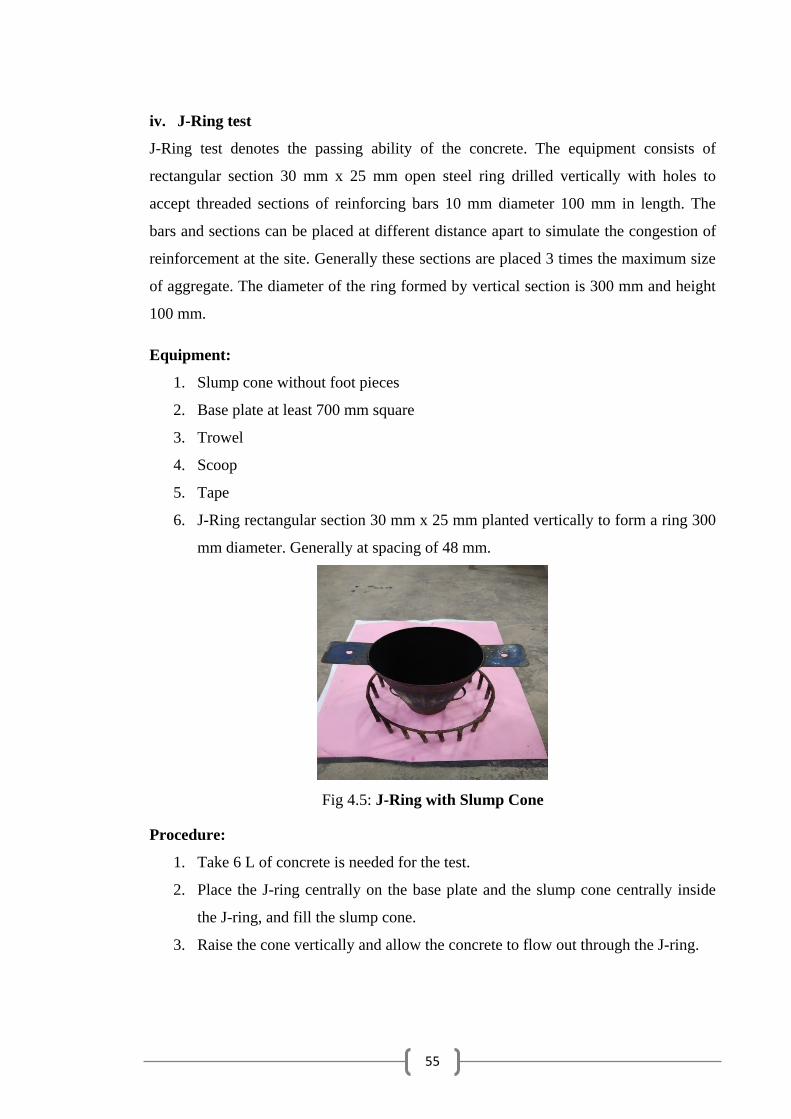
55
iv. J-Ring test
J-Ring test denotes the passing ability of the concrete. The equipment consists of
rectangular section 30 mm x 25 mm open steel ring drilled vertically with holes to
accept threaded sections of reinforcing bars 10 mm diameter 100 mm in length. The
bars and sections can be placed at different distance apart to simulate the congestion of
reinforcement at the site. Generally these sections are placed 3 times the maximum size
of aggregate. The diameter of the ring formed by vertical section is 300 mm and height
100 mm.
Equipment:
1. Slump cone without foot pieces
2. Base plate at least 700 mm square
3. Trowel
4. Scoop
5. Tape
6. J-Ring rectangular section 30 mm x 25 mm planted vertically to form a ring 300
mm diameter. Generally at spacing of 48 mm.
Fig 4.5: J-Ring with Slump Cone
Procedure:
1. Take 6 L of concrete is needed for the test.
2. Place the J-ring centrally on the base plate and the slump cone centrally inside
the J-ring, and fill the slump cone.
3. Raise the cone vertically and allow the concrete to flow out through the J-ring.

56
4. Measure the final diameter in two perpendicular directions and calculate the
average diameter.
5. Measure the difference in height between the concrete just inside the J- ring bars
and just outside the J-ring bars.
6. Calculate the average of the difference in height at four locations in mm.
Interpretation:
The measures of the passing ability and filling ability are not independent. To
characterize filling ability and passing ability, the horizontal spread of the concrete
sample is measured after the concrete passes through the gaps in the bars of the J-ring
and comes to rest. Also, the difference in height of the concrete just inside the bars and
the just outside bars is measured at four locations. Smaller the difference in heights,
greater will be the passing ability of the concrete.
v. T50cm test
The T50cm time is a secondary indication of flow.
Equipment:
1. Mould in the shape of a truncated cone with the internal dimensions 200 mm
diameter at the base
2. 100 mm diameter at the top and a height of 300 mm, conforming to EN 12350-2
3. Base plate of a stiff non absorbing material, at least 700mm square, marked with
a circle marking the central location for the slump cone, and a further concentric
circle of 500mm diameter
4. Trowel
5. Scoop
6. Ruler
7. Stopwatch (Optional)
Procedure:
1. About 6 L of concrete is needed to perform the test, sampled normally.
2. Moisten the base plate and inside of slump cone.
3. Place baseplate on level stable ground and the slump cone centrally on the base
plate and hold down firmly.
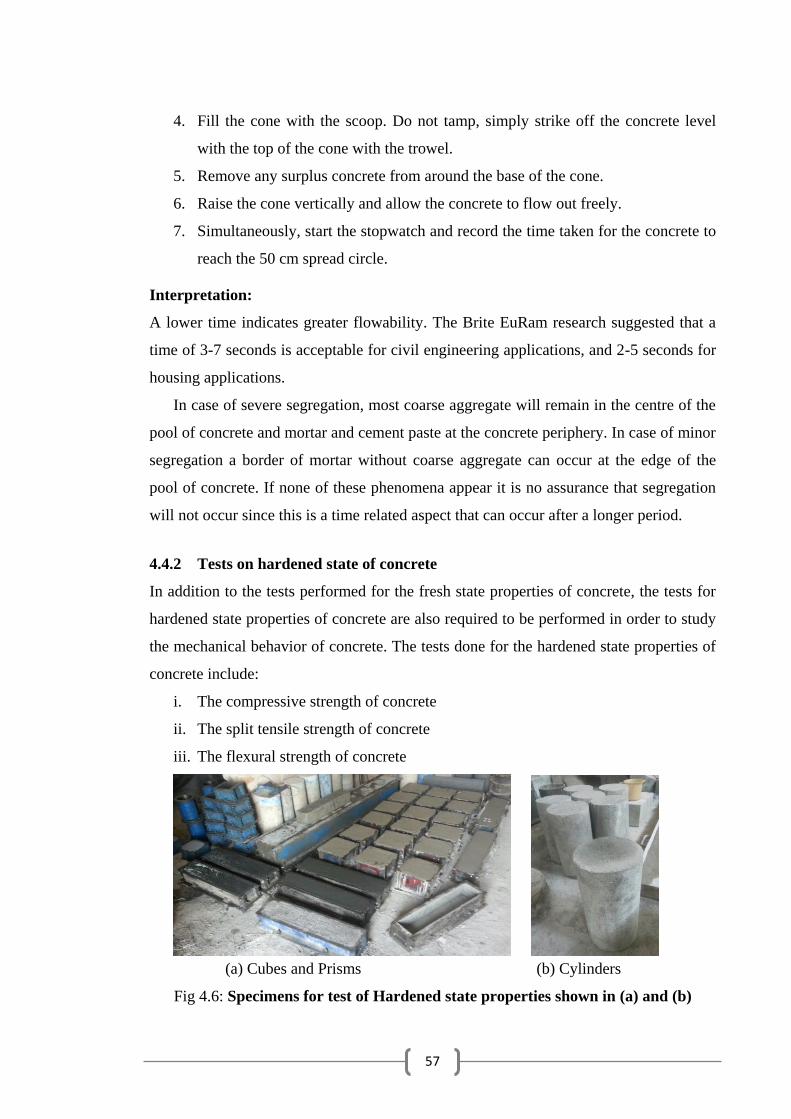
57
4. Fill the cone with the scoop. Do not tamp, simply strike off the concrete level
with the top of the cone with the trowel.
5. Remove any surplus concrete from around the base of the cone.
6. Raise the cone vertically and allow the concrete to flow out freely.
7. Simultaneously, start the stopwatch and record the time taken for the concrete to
reach the 50 cm spread circle.
Interpretation:
A lower time indicates greater flowability. The Brite EuRam research suggested that a
time of 3-7 seconds is acceptable for civil engineering applications, and 2-5 seconds for
housing applications.
In case of severe segregation, most coarse aggregate will remain in the centre of the
pool of concrete and mortar and cement paste at the concrete periphery. In case of minor
segregation a border of mortar without coarse aggregate can occur at the edge of the
pool of concrete. If none of these phenomena appear it is no assurance that segregation
will not occur since this is a time related aspect that can occur after a longer period.
4.4.2 Tests on hardened state of concrete
In addition to the tests performed for the fresh state properties of concrete, the tests for
hardened state properties of concrete are also required to be performed in order to study
the mechanical behavior of concrete. The tests done for the hardened state properties of
concrete include:
i. The compressive strength of concrete
ii. The split tensile strength of concrete
iii. The flexural strength of concrete
(a) Cubes and Prisms (b) Cylinders
Fig 4.6: Specimens for test of Hardened state properties shown in (a) and (b)
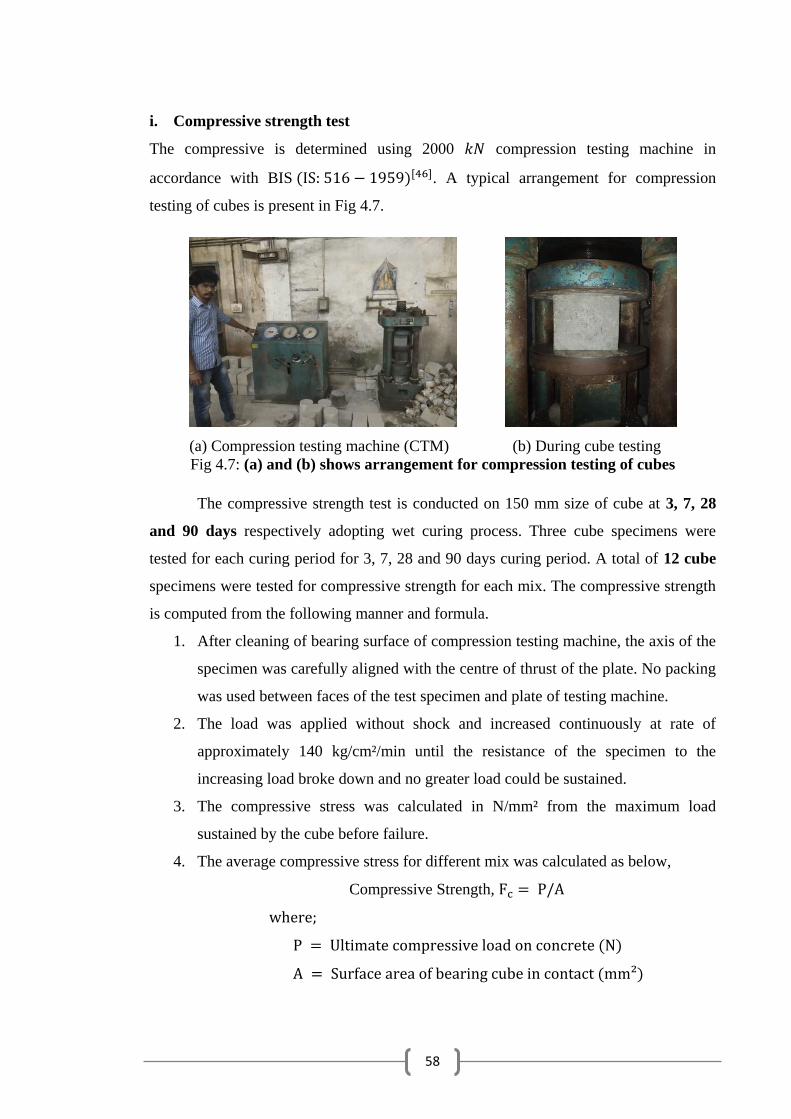
58
i. Compressive strength test
The compressive is determined using 2000 compression testing machine in
accordance with BIS . A typical arrangement for compression
testing of cubes is present in Fig 4.7.
(a) Compression testing machine (CTM) (b) During cube testing
Fig 4.7: (a) and (b) shows arrangement for compression testing of cubes
The compressive strength test is conducted on 150 mm size of cube at 3, 7, 28
and 90 days respectively adopting wet curing process. Three cube specimens were
tested for each curing period for 3, 7, 28 and 90 days curing period. A total of 12 cube
specimens were tested for compressive strength for each mix. The compressive strength
is computed from the following manner and formula.
1. After cleaning of bearing surface of compression testing machine, the axis of the
specimen was carefully aligned with the centre of thrust of the plate. No packing
was used between faces of the test specimen and plate of testing machine.
2. The load was applied without shock and increased continuously at rate of
approximately 140 kg/cm²/min until the resistance of the specimen to the
increasing load broke down and no greater load could be sustained.
3. The compressive stress was calculated in N/mm² from the maximum load
sustained by the cube before failure.
4. The average compressive stress for different mix was calculated as below,
Compressive Strength,
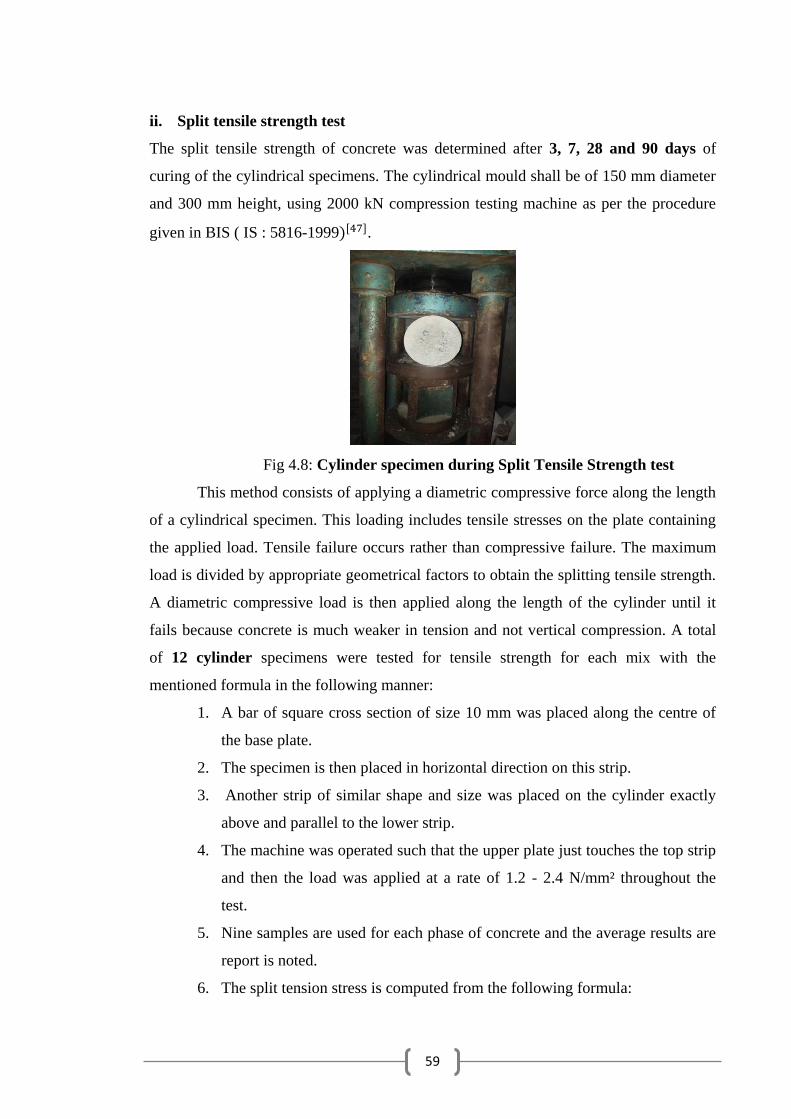
59
ii. Split tensile strength test
The split tensile strength of concrete was determined after 3, 7, 28 and 90 days of
curing of the cylindrical specimens. The cylindrical mould shall be of 150 mm diameter
and 300 mm height, using 2000 kN compression testing machine as per the procedure
given in BIS ( IS : 5816-1999 .
Fig 4.8: Cylinder specimen during Split Tensile Strength test
This method consists of applying a diametric compressive force along the length
of a cylindrical specimen. This loading includes tensile stresses on the plate containing
the applied load. Tensile failure occurs rather than compressive failure. The maximum
load is divided by appropriate geometrical factors to obtain the splitting tensile strength.
A diametric compressive load is then applied along the length of the cylinder until it
fails because concrete is much weaker in tension and not vertical compression. A total
of 12 cylinder specimens were tested for tensile strength for each mix with the
mentioned formula in the following manner:
1. A bar of square cross section of size 10 mm was placed along the centre of
the base plate.
2. The specimen is then placed in horizontal direction on this strip.
3. Another strip of similar shape and size was placed on the cylinder exactly
above and parallel to the lower strip.
4. The machine was operated such that the upper plate just touches the top strip
and then the load was applied at a rate of 1.2 - 2.4 N/mm² throughout the
test.
5. Nine samples are used for each phase of concrete and the average results are
report is noted.
6. The split tension stress is computed from the following formula:

60
T =
;
iii. Flexural strength test
This test was performed in accordance with BIS (IS: 516-1959) on prisms of size 100 x
100 x 500 mm after 3,7, 28 and 90 days of water curing. For finding flexural strength,
the specimen was supported on two roller support spaced at 400 mm centre to centre.
The load was then applied at the rate of 0.7 N/mm2/min through two similar rollers
mounted at third point of the span (133.33 mm c/c) till the failure occurred. The flexural
strength is expressed as modulus of rupture and it is calculated based on the appropriate
expression in code. Concrete as we know is relatively strong in compression and weak
in tension. In reinforced concrete members, little dependence is placed on the tensile
strength of the concrete since steel reinforcing bars are provided to resist all tensile
forces. However, tensile stresses are likely to develop in concrete due to drying
shrinkage, rusting of steel, temperature gradient and many other reasons. Therefore, the
knowledge of tensile strength of concrete is of importance. A beam test is found
dependable to measure the flexural strength properties of concrete.
(a) Prism specimen during FTM (b) Flexural crack observed after test
Fig 4.9: (a) and (b) shows a typical scenario of Flexural Strength Test
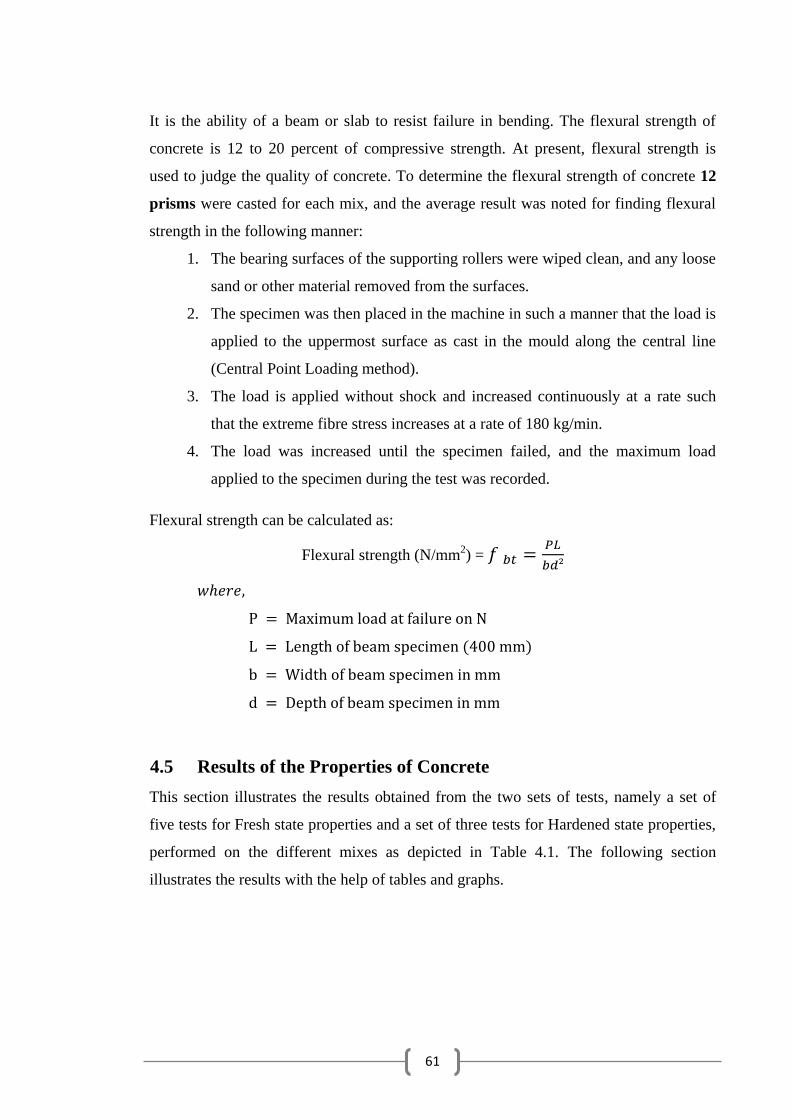
61
It is the ability of a beam or slab to resist failure in bending. The flexural strength of
concrete is 12 to 20 percent of compressive strength. At present, flexural strength is
used to judge the quality of concrete. To determine the flexural strength of concrete 12
prisms were casted for each mix, and the average result was noted for finding flexural
strength in the following manner:
1. The bearing surfaces of the supporting rollers were wiped clean, and any loose
sand or other material removed from the surfaces.
2. The specimen was then placed in the machine in such a manner that the load is
applied to the uppermost surface as cast in the mould along the central line
(Central Point Loading method).
3. The load is applied without shock and increased continuously at a rate such
that the extreme fibre stress increases at a rate of 180 kg/min.
4. The load was increased until the specimen failed, and the maximum load
applied to the specimen during the test was recorded.
Flexural strength can be calculated as:
Flexural strength (N/mm2) =
4.5 Results of the Properties of Concrete
This section illustrates the results obtained from the two sets of tests, namely a set of
five tests for Fresh state properties and a set of three tests for Hardened state properties,
performed on the different mixes as depicted in Table 4.1. The following section
illustrates the results with the help of tables and graphs.
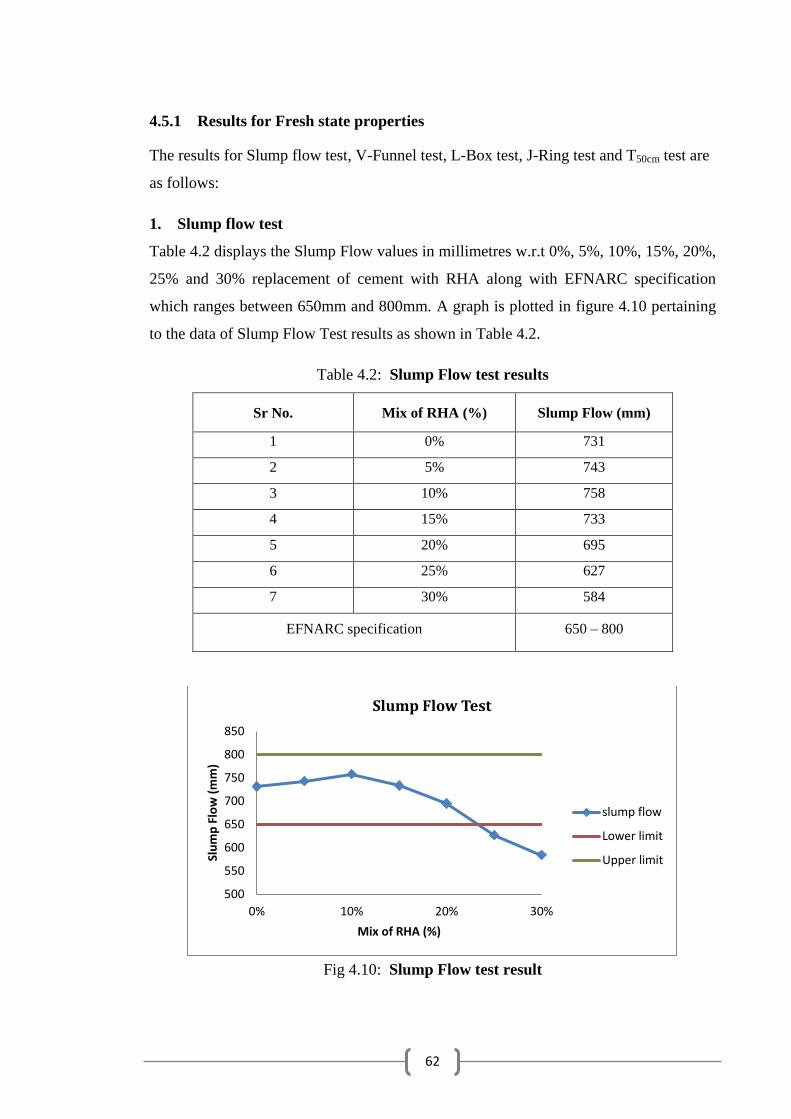
62
4.5.1 Results for Fresh state properties
The results for Slump flow test, V-Funnel test, L-Box test, J-Ring test and T50cm test are
as follows:
1. Slump flow test
Table 4.2 displays the Slump Flow values in millimetres w.r.t 0%, 5%, 10%, 15%, 20%,
25% and 30% replacement of cement with RHA along with EFNARC specification
which ranges between 650mm and 800mm. A graph is plotted in figure 4.10 pertaining
to the data of Slump Flow Test results as shown in Table 4.2.
Table 4.2: Slump Flow test results
Sr No. Mix of RHA (%) Slump Flow (mm)
1 0% 731
2 5% 743
3 10% 758
4 15% 733
5 20% 695
6 25% 627
7 30% 584
EFNARC specification 650 – 800
Fig 4.10: Slump Flow test result
500
550
600
650
700
750
800
850
0% 10% 20% 30%
Slu
mp
Flo
w (
mm
)
Mix of RHA (%)
Slump Flow Test
slump flow
Lower limit
Upper limit
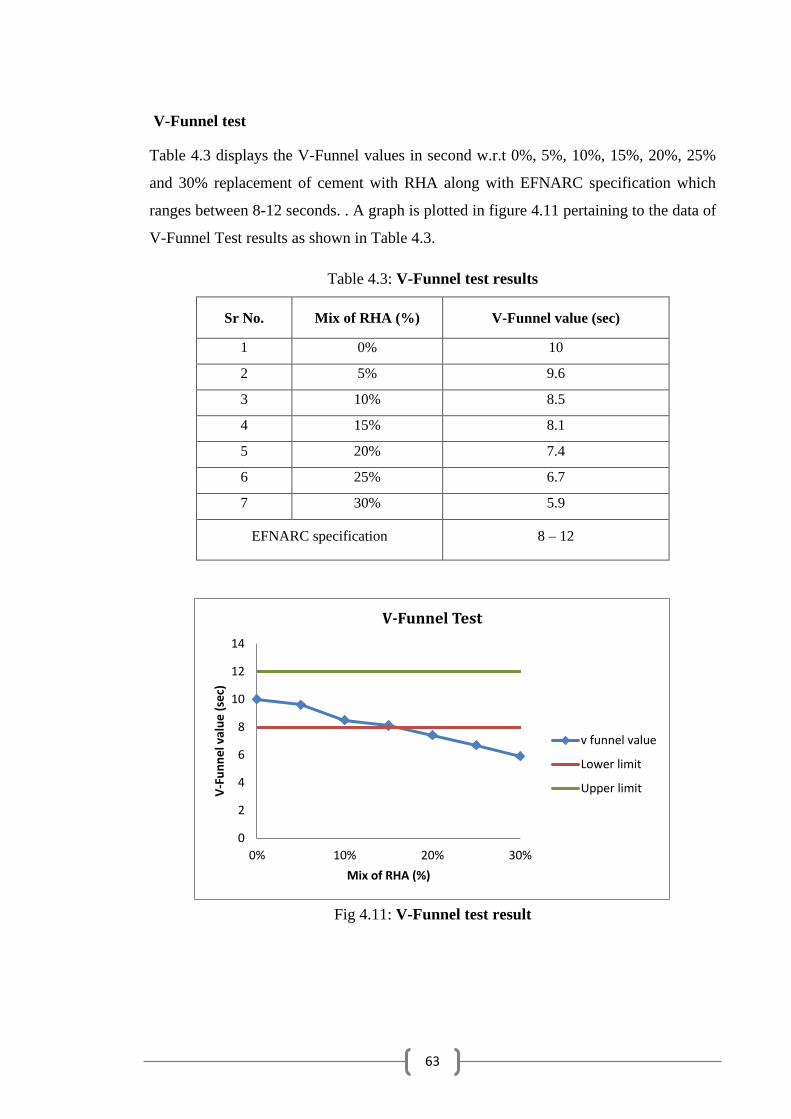
63
V-Funnel test
Table 4.3 displays the V-Funnel values in second w.r.t 0%, 5%, 10%, 15%, 20%, 25%
and 30% replacement of cement with RHA along with EFNARC specification which
ranges between 8-12 seconds. . A graph is plotted in figure 4.11 pertaining to the data of
V-Funnel Test results as shown in Table 4.3.
Table 4.3: V-Funnel test results
Sr No. Mix of RHA (%) V-Funnel value (sec)
1 0% 10
2 5% 9.6
3 10% 8.5
4 15% 8.1
5 20% 7.4
6 25% 6.7
7 30% 5.9
EFNARC specification 8 – 12
Fig 4.11: V-Funnel test result
0
2
4
6
8
10
12
14
0% 10% 20% 30%
V-F
un
ne
l val
ue
(se
c)
Mix of RHA (%)
V-Funnel Test
v funnel value
Lower limit
Upper limit

64
L-Box test
Table 4.4 displays the L-Box values in millimetres w.r.t 0%, 5%, 10%, 15%, 20%, 25%
and 30% replacement of cement with RHA along with EFNARC specification which
ranges between 0.8-1.0 mm. A graph is plotted in figure 4.12 pertaining to the data of L-
Box Test results as shown in Table 4.4.
Table 4.4: L-Box test results
Sr No. Mix of RHA (%) L-Box value (mm)
1 0% 0.93
2 5% 0.91
3 10% 0.89
4 15% 0.9
5 20% 0.8
6 25% 0.7
7 30% 0.5
EFNARC specification 0.8 - 1.0
Fig 4.12: L-Box test result
0
0.2
0.4
0.6
0.8
1
1.2
0% 10% 20% 30%
L-B
ox
valu
e (
mm
)
Mix of RHA (%)
L-Box Test
L-Box value
Lower limit
Upper limit
65
J-Ring test
Table 4.5 displays the J-Ring values in millimetres w.r.t 0%, 5%, 10%, 15%, 20%, 25%
and 30% replacement of cement with RHA along with EFNARC specification which
ranges between 0-10 mm. A graph is plotted in figure 4.13 pertaining to the data of J-
Ring Test results as shown in Table 4.5.
Table 4.5: J-Ring test results
Sr No. Mix of RHA (%) H1 H2 J-Ring test Value
H₁-H₂ (mm)
1 0% 17 14 3
2 5% 18 14 4
3 10% 21 15 6
4 15% 24 18 6
5 20% 26 19 7
6 25% 27 16 11
7 30% 31 18 13
EFNARC specification (0-10) mm
Fig 4.13: J-Ring test result
0
2
4
6
8
10
12
14
0% 10% 20% 30%
J-R
ing
valu
e (
mm
)
Mix of RHA (%)
J-Ring Test
J-Ring value
Lower limit
Upper limit
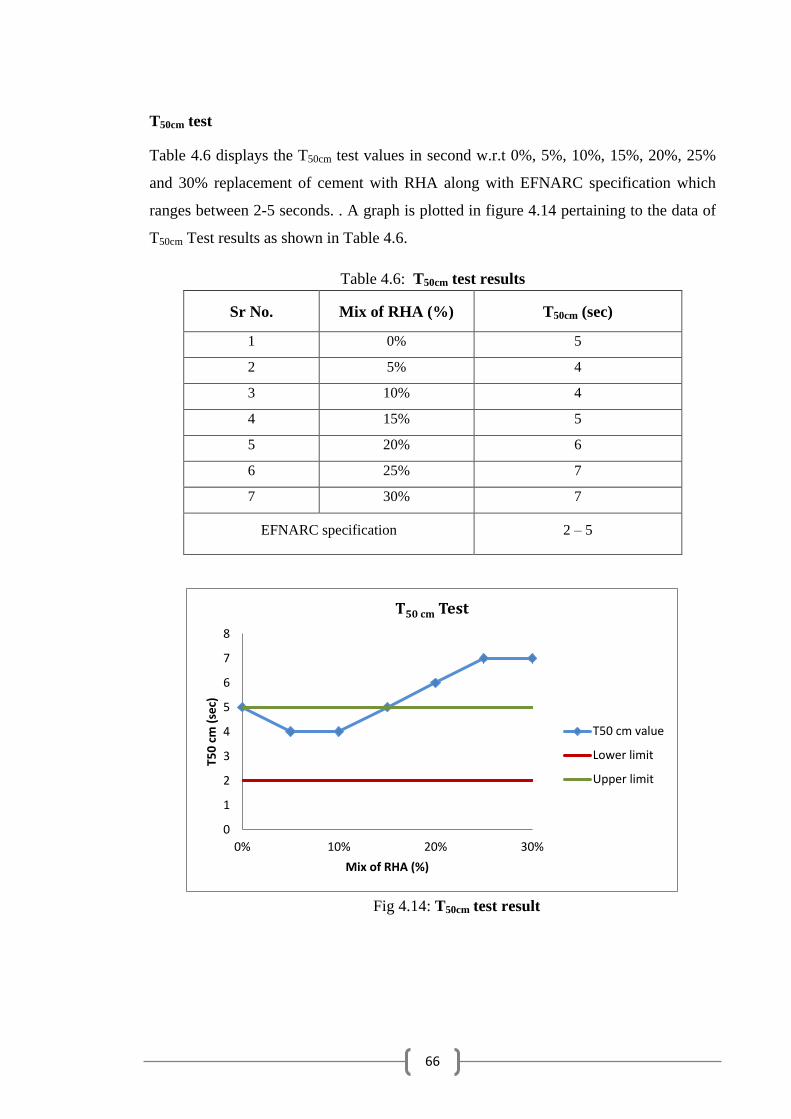
66
T50cm test
Table 4.6 displays the T50cm test values in second w.r.t 0%, 5%, 10%, 15%, 20%, 25%
and 30% replacement of cement with RHA along with EFNARC specification which
ranges between 2-5 seconds. . A graph is plotted in figure 4.14 pertaining to the data of
T50cm Test results as shown in Table 4.6.
Table 4.6: T50cm test results
Sr No. Mix of RHA (%) T50cm (sec)
1 0% 5
2 5% 4
3 10% 4
4 15% 5
5 20% 6
6 25% 7
7 30% 7
EFNARC specification 2 – 5
Fig 4.14: T50cm test result
0
1
2
3
4
5
6
7
8
0% 10% 20% 30%
T50
cm
(se
c)
Mix of RHA (%)
T50 cm Test
T50 cm value
Lower limit
Upper limit
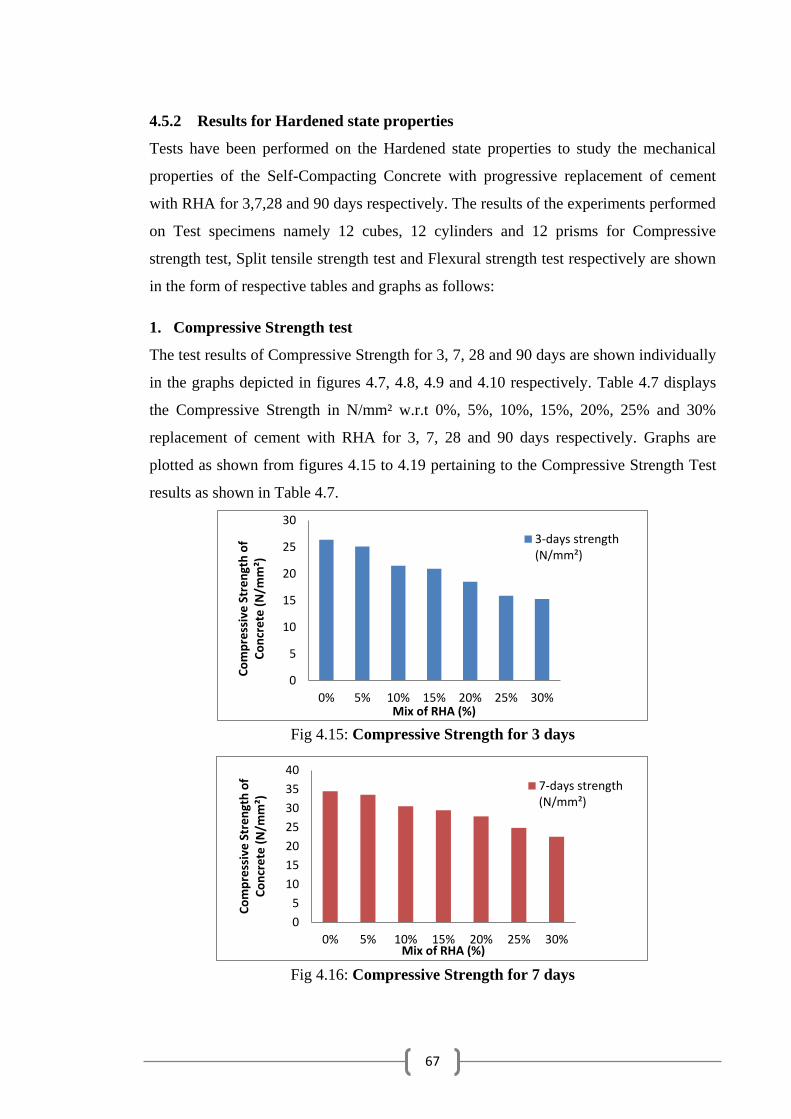
67
4.5.2 Results for Hardened state properties
Tests have been performed on the Hardened state properties to study the mechanical
properties of the Self-Compacting Concrete with progressive replacement of cement
with RHA for 3,7,28 and 90 days respectively. The results of the experiments performed
on Test specimens namely 12 cubes, 12 cylinders and 12 prisms for Compressive
strength test, Split tensile strength test and Flexural strength test respectively are shown
in the form of respective tables and graphs as follows:
1. Compressive Strength test
The test results of Compressive Strength for 3, 7, 28 and 90 days are shown individually
in the graphs depicted in figures 4.7, 4.8, 4.9 and 4.10 respectively. Table 4.7 displays
the Compressive Strength in N/mm² w.r.t 0%, 5%, 10%, 15%, 20%, 25% and 30%
replacement of cement with RHA for 3, 7, 28 and 90 days respectively. Graphs are
plotted as shown from figures 4.15 to 4.19 pertaining to the Compressive Strength Test
results as shown in Table 4.7.
Fig 4.15: Compressive Strength for 3 days
Fig 4.16: Compressive Strength for 7 days
0
5
10
15
20
25
30
0% 5% 10% 15% 20% 25% 30%
Co
mp
ress
ive
Str
en
gth
of
Co
ncr
ete
(N
/mm
²)
Mix of RHA (%)
3-days strength(N/mm²)
0
5
10
15
20
25
30
35
40
0% 5% 10% 15% 20% 25% 30%
Co
mp
ress
ive
Str
en
gth
of
Co
ncr
ete
(N
/mm
²)
Mix of RHA (%)
7-days strength(N/mm²)
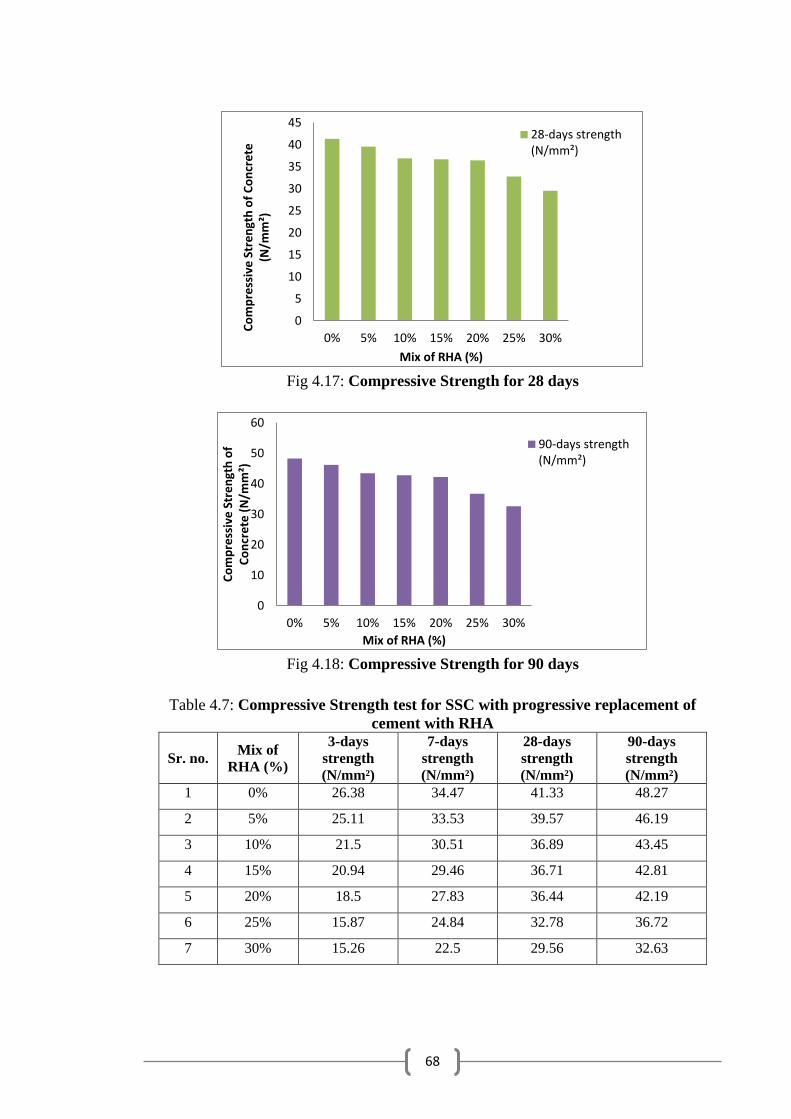
68
Fig 4.17: Compressive Strength for 28 days
Fig 4.18: Compressive Strength for 90 days
Table 4.7: Compressive Strength test for SSC with progressive replacement of
cement with RHA
Sr. no. Mix of
RHA (%)
3-days
strength
(N/mm²)
7-days
strength
(N/mm²)
28-days
strength
(N/mm²)
90-days
strength
(N/mm²)
1 0% 26.38 34.47 41.33 48.27
2 5% 25.11 33.53 39.57 46.19
3 10% 21.5 30.51 36.89 43.45
4 15% 20.94 29.46 36.71 42.81
5 20% 18.5 27.83 36.44 42.19
6 25% 15.87 24.84 32.78 36.72
7 30% 15.26 22.5 29.56 32.63
0
5
10
15
20
25
30
35
40
45
0% 5% 10% 15% 20% 25% 30%
Co
mp
ress
ive
Str
en
gth
of
Co
ncr
ete
(N
/mm
²)
Mix of RHA (%)
28-days strength(N/mm²)
0
10
20
30
40
50
60
0% 5% 10% 15% 20% 25% 30%
Co
mp
ress
ive
Str
en
gth
of
Co
ncr
ete
(N
/mm
²)
Mix of RHA (%)
90-days strength(N/mm²)

69
Fig 4.19: Compressive strength at different ages with progressive replacement of
cement with RHA
2. Split Tensile Strength test
The test results of Split Tensile Strength for 3, 7, 28 and 90 days are shown individually
in the graphs depicted in figures 4.12, 4.13, 4.14 and 4.15 respectively. Table 4.8
displays the Split Tensile Strength in N/mm² w.r.t 0%, 5%, 10%, 15%, 20%, 25% and
30% replacement of cement with RHA for 3, 7, 28 and 90 days respectively. Graphs are
plotted as shown from figures 4.20 to 4.24 pertaining to the Split Tensile Strength Test
results as shown in Table 4.8.
Fig 4.20: Split Tensile Strength for 3 days
0
10
20
30
40
50
60
0% 10% 20% 30%
Co
mp
ress
ive
Str
en
gth
of
Co
ncr
ete
(N
/mm
²)
Mix of RHA (%)
3-days strength (N/mm²)
7-days strength (N/mm²)
28-days strength (N/mm²)
90-days strength (N/mm²)
0
0.5
1
1.5
2
2.5
3
0 5 10 15 20 25 30
Split
Te
nsi
le S
tre
ngt
h (
N/m
m²)
Mix of RHA (%)
3-days strength (N/mm²)

70
Fig 4.21: Split Tensile Strength for 7 days
Fig 4.22: Split Tensile Strength for 28 days
Fig 4.23: Split Tensile Strength for 90 days
0
0.5
1
1.5
2
2.5
3
3.5
4
0 5 10 15 20 25 30
Split
Te
nsi
le S
tre
ngt
h (
N/m
m²)
Mix of RHA (%)
7-days strength(N/mm²)
0
0.5
1
1.5
2
2.5
3
3.5
4
4.5
0 5 10 15 20 25 30
Split
Te
nsi
le S
tre
ngt
h (
N/m
m²)
Mix of RHA (%)
28-days strength(N/mm²)
00.5
11.5
22.5
33.5
44.5
5
0 5 10 15 20 25 30
Split
Te
nsi
le S
tre
ngt
h (
N/m
m²)
Mix of RHA (%)
90-days strength(N/mm²)
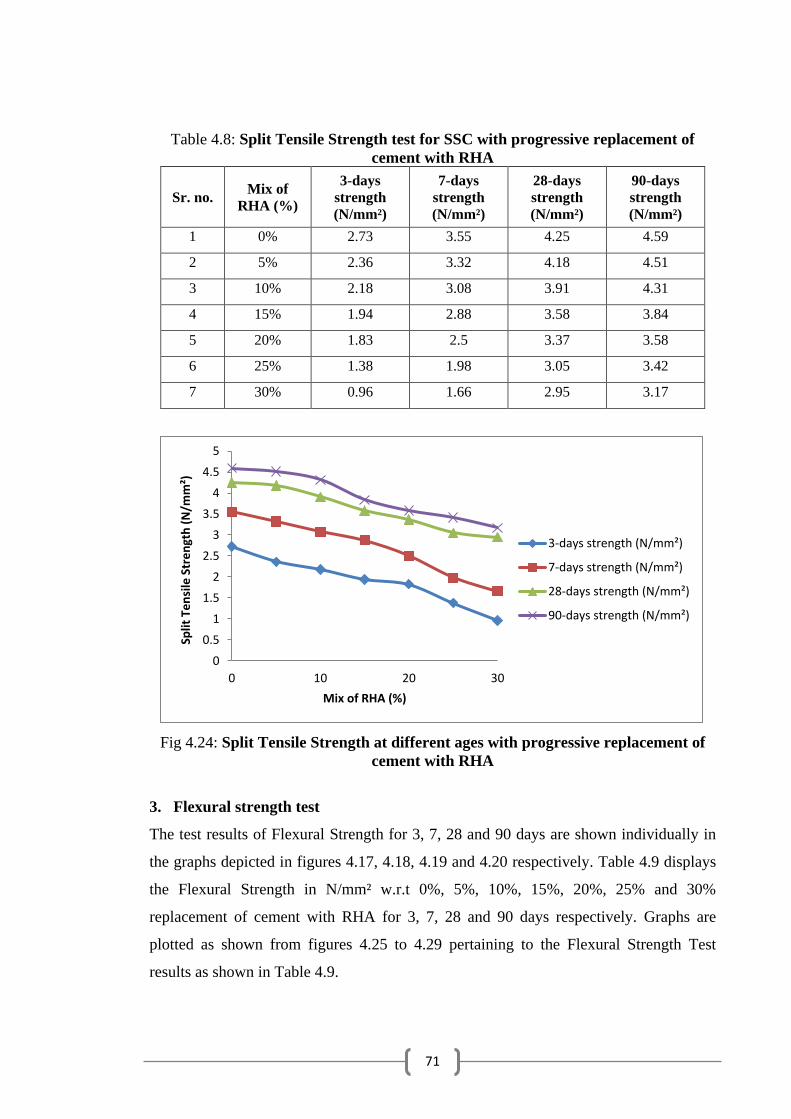
71
Table 4.8: Split Tensile Strength test for SSC with progressive replacement of
cement with RHA
Sr. no. Mix of
RHA (%)
3-days
strength
(N/mm²)
7-days
strength
(N/mm²)
28-days
strength
(N/mm²)
90-days
strength
(N/mm²)
1 0% 2.73 3.55 4.25 4.59
2 5% 2.36 3.32 4.18 4.51
3 10% 2.18 3.08 3.91 4.31
4 15% 1.94 2.88 3.58 3.84
5 20% 1.83 2.5 3.37 3.58
6 25% 1.38 1.98 3.05 3.42
7 30% 0.96 1.66 2.95 3.17
Fig 4.24: Split Tensile Strength at different ages with progressive replacement of
cement with RHA
3. Flexural strength test
The test results of Flexural Strength for 3, 7, 28 and 90 days are shown individually in
the graphs depicted in figures 4.17, 4.18, 4.19 and 4.20 respectively. Table 4.9 displays
the Flexural Strength in N/mm² w.r.t 0%, 5%, 10%, 15%, 20%, 25% and 30%
replacement of cement with RHA for 3, 7, 28 and 90 days respectively. Graphs are
plotted as shown from figures 4.25 to 4.29 pertaining to the Flexural Strength Test
results as shown in Table 4.9.
0
0.5
1
1.5
2
2.5
3
3.5
4
4.5
5
0 10 20 30
Split
Te
nsi
le S
tre
ngt
h (
N/m
m²)
Mix of RHA (%)
3-days strength (N/mm²)
7-days strength (N/mm²)
28-days strength (N/mm²)
90-days strength (N/mm²)
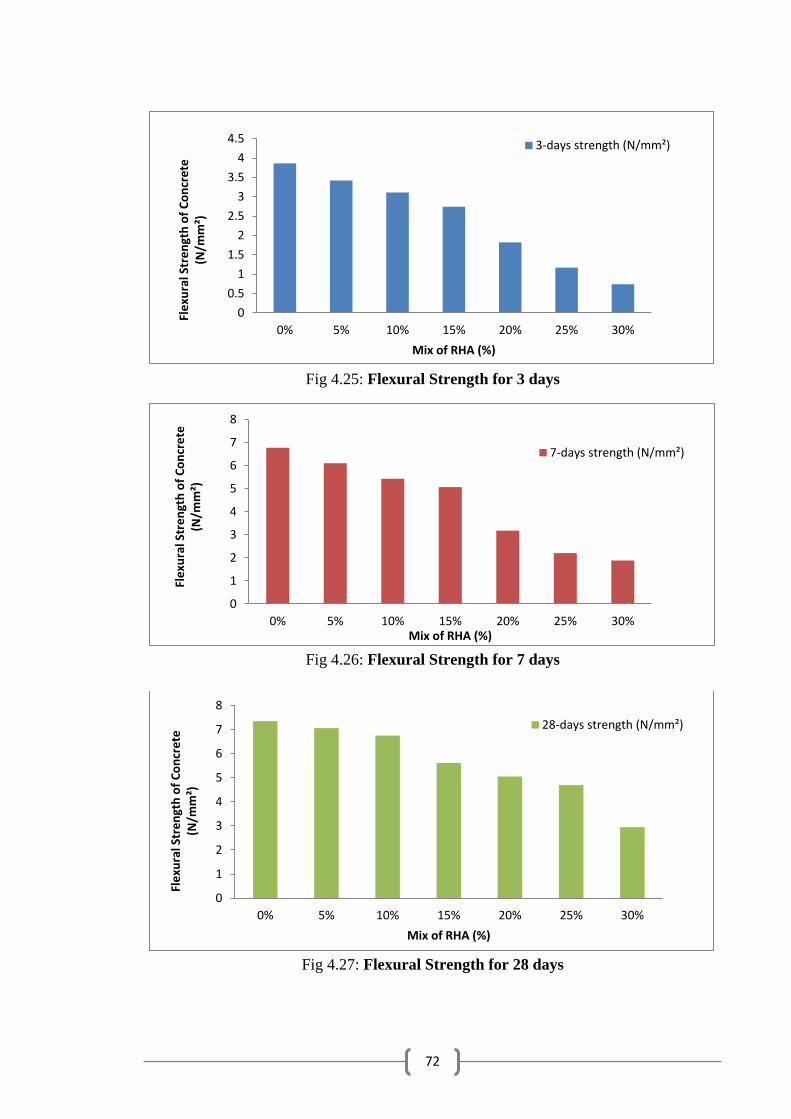
72
Fig 4.25: Flexural Strength for 3 days
Fig 4.26: Flexural Strength for 7 days
Fig 4.27: Flexural Strength for 28 days
0
0.5
1
1.5
2
2.5
3
3.5
4
4.5
0% 5% 10% 15% 20% 25% 30%
Fle
xura
l Str
en
gth
of
Co
ncr
ete
(N
/mm
²)
Mix of RHA (%)
3-days strength (N/mm²)
0
1
2
3
4
5
6
7
8
0% 5% 10% 15% 20% 25% 30%
Fle
xura
l Str
en
gth
of
Co
ncr
ete
(N
/mm
²)
Mix of RHA (%)
7-days strength (N/mm²)
0
1
2
3
4
5
6
7
8
0% 5% 10% 15% 20% 25% 30%
Fle
xura
l Str
en
gth
of
Co
ncr
ete
(N
/mm
²)
Mix of RHA (%)
28-days strength (N/mm²)
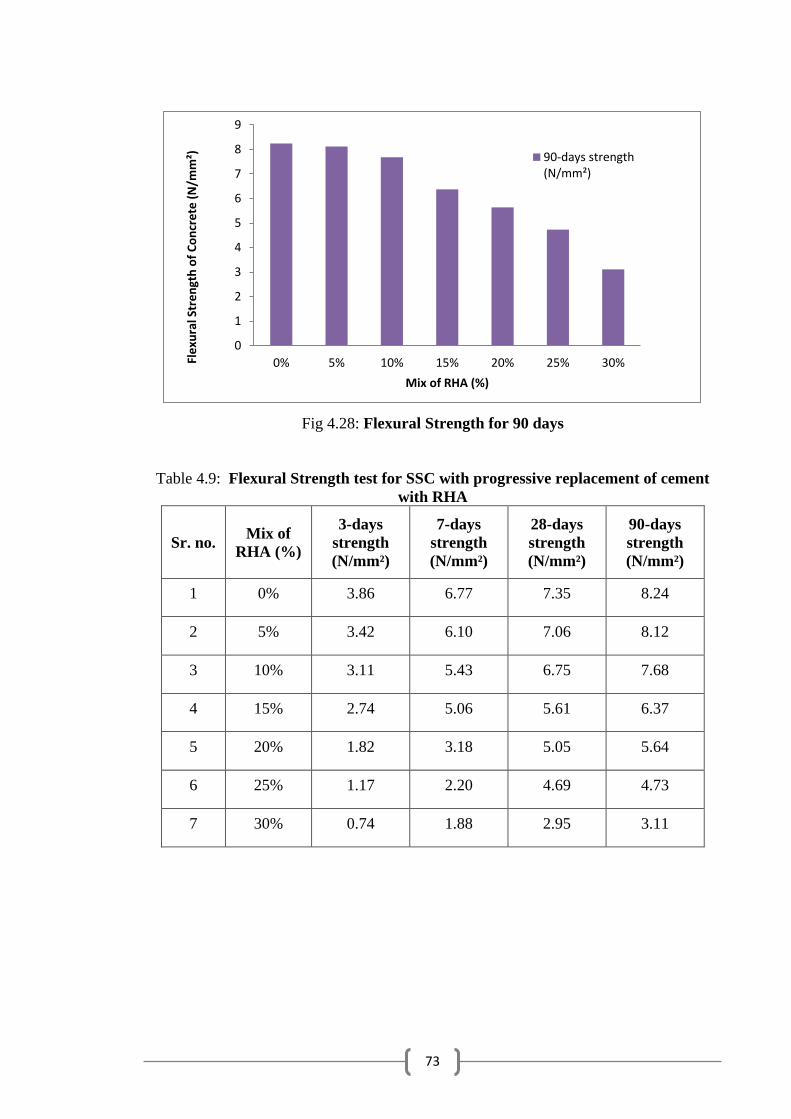
73
Fig 4.28: Flexural Strength for 90 days
Table 4.9: Flexural Strength test for SSC with progressive replacement of cement
with RHA
Sr. no. Mix of
RHA (%)
3-days
strength
(N/mm²)
7-days
strength
(N/mm²)
28-days
strength
(N/mm²)
90-days
strength
(N/mm²)
1 0% 3.86 6.77 7.35 8.24
2 5% 3.42 6.10 7.06 8.12
3 10% 3.11 5.43 6.75 7.68
4 15% 2.74 5.06 5.61 6.37
5 20% 1.82 3.18 5.05 5.64
6 25% 1.17 2.20 4.69 4.73
7 30% 0.74 1.88 2.95 3.11
0
1
2
3
4
5
6
7
8
9
0% 5% 10% 15% 20% 25% 30%Fle
xura
l Str
en
gth
of
Co
ncr
ete
(N
/mm
²)
Mix of RHA (%)
90-days strength(N/mm²)

74
Fig 4.29: Flexural Strength test at different ages with progressive replacement of
cement with RHA
4.6 Summary
This chapter can be summarised as the report on the experimental program of mix
concrete design pertaining to the preparation of test specimens namely 12 cubes, 12
cylinders and 12 prisms. In addition to that, the chapter includes the methodologies and
results of various tests performed upon these test specimens. These tests have been for
the fresh state and hardened state properties of designed concrete to study the
workability and mechanical properties of the designed concrete. This chapter further
includes the assessment results of the aforesaid tests along with test parameters. The
progressive replacement of cement with RHA at different ages has been studied.
0
1
2
3
4
5
6
7
8
9
0% 5% 10% 15% 20% 25% 30%
Fle
xura
l Str
en
gth
of
Co
ncr
ete
(N
/mm
²)
Mix of RHA (%)
3-days strength (N/mm²)
7-days strength (N/mm²)
28-days strength (N/mm²)
90-days strength (N/mm²)

75
Chapter 5
Flexural Behaviour of Reinforced SCC Beam
5.1 Introduction
For studying the flexural behaviour of the designed structural member i.e. the
Reinforced SCC beams with partial replacement of cement with RHA, the Load
carrying capacity of the designed beam was experimentally investigated to the realize
the ultimate load and deformations upon these structures. In this chapter, the Reinforced
SCC beams are designed as per IS 456 – 2000. Flexural behaviour of reinforced
concrete beams has been analysed by performing flexural strength test on beams of size
150mm x 200mm x 1500mm. SCC beams have been casted with replacement of cement
by RHA as 0%, 10%, 20%, and 30%. These beam specimens have been later submitted
to Flexural testing in servo controlled Compression-cum-Flexural testing machine and
experimentally investigated.
5.2 Theoretical Load Carrying Capacity of Beam
Calculation of Theoretical Capacity
Actual depth of neutral axis,
Eq
n (5.1)
Therefore,
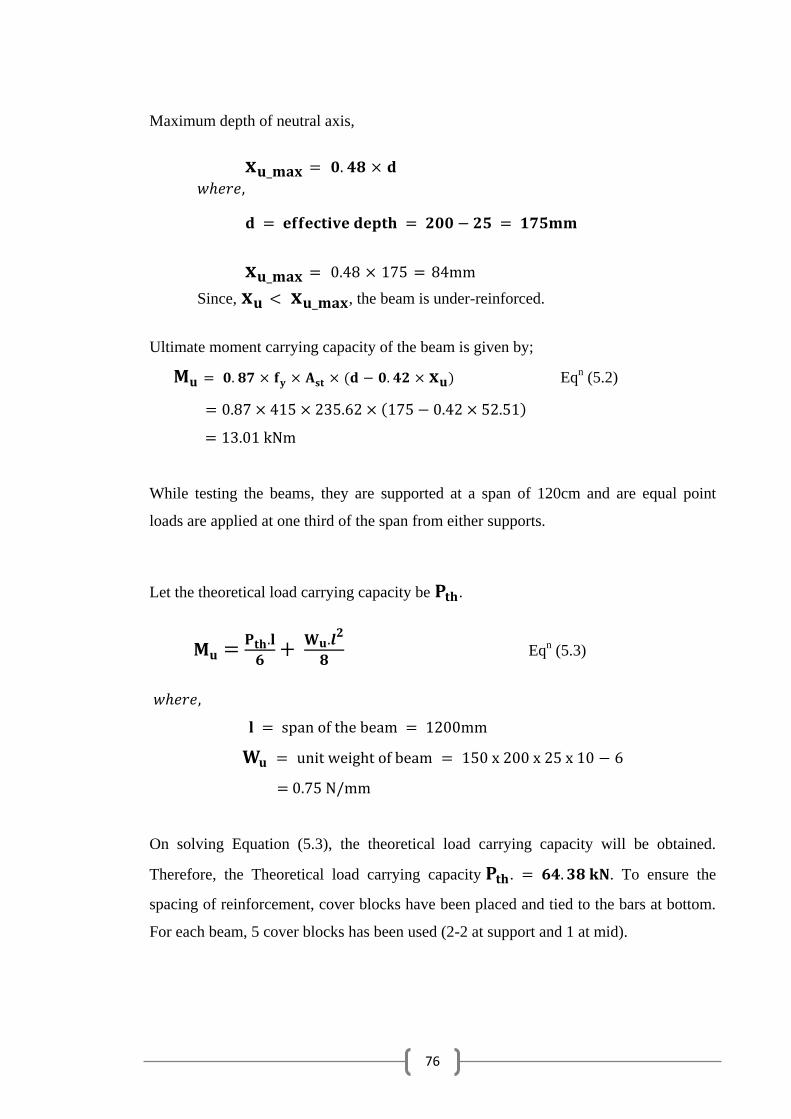
76
Maximum depth of neutral axis,
Since, , the beam is under-reinforced.
Ultimate moment carrying capacity of the beam is given by;
Eqn (5.2)
While testing the beams, they are supported at a span of 120cm and are equal point
loads are applied at one third of the span from either supports.
Let the theoretical load carrying capacity be .
Eq
n (5.3)
= 0.75 N/mm
On solving Equation (5.3), the theoretical load carrying capacity will be obtained.
Therefore, the Theoretical load carrying capacity . . To ensure the
spacing of reinforcement, cover blocks have been placed and tied to the bars at bottom.
For each beam, 5 cover blocks has been used (2-2 at support and 1 at mid).
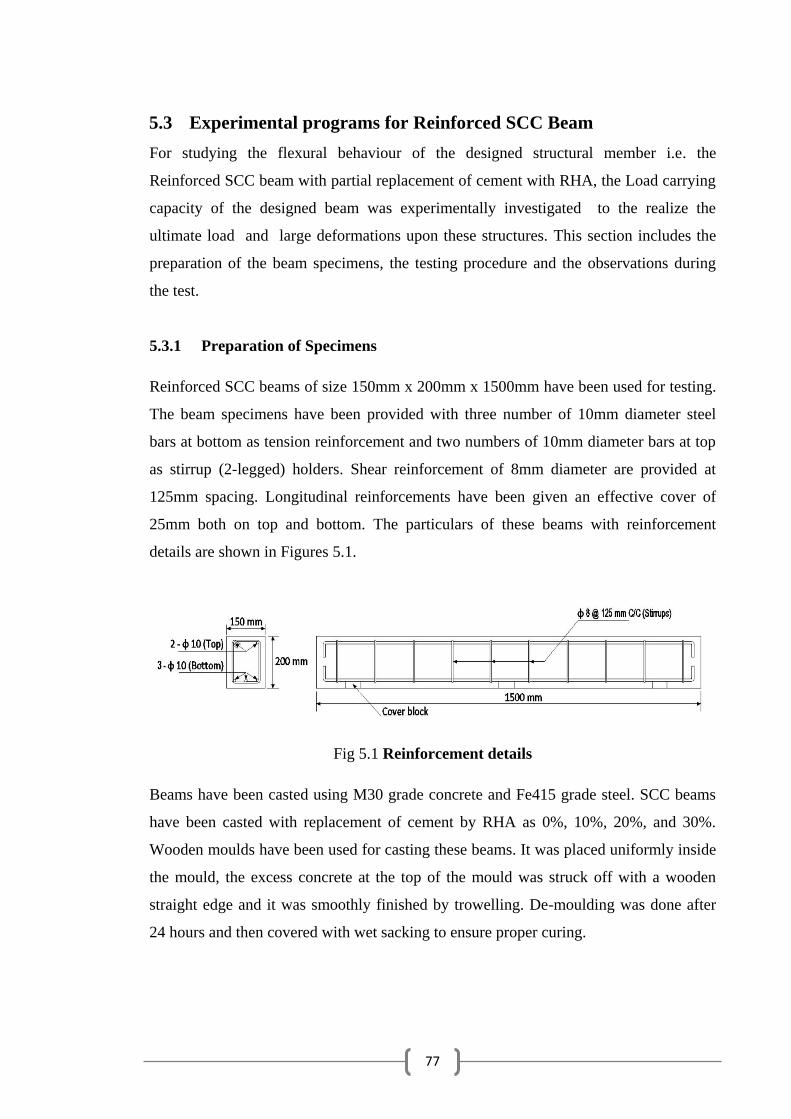
77
5.3 Experimental programs for Reinforced SCC Beam
For studying the flexural behaviour of the designed structural member i.e. the
Reinforced SCC beam with partial replacement of cement with RHA, the Load carrying
capacity of the designed beam was experimentally investigated to the realize the
ultimate load and large deformations upon these structures. This section includes the
preparation of the beam specimens, the testing procedure and the observations during
the test.
5.3.1 Preparation of Specimens
Reinforced SCC beams of size 150mm x 200mm x 1500mm have been used for testing.
The beam specimens have been provided with three number of 10mm diameter steel
bars at bottom as tension reinforcement and two numbers of 10mm diameter bars at top
as stirrup (2-legged) holders. Shear reinforcement of 8mm diameter are provided at
125mm spacing. Longitudinal reinforcements have been given an effective cover of
25mm both on top and bottom. The particulars of these beams with reinforcement
details are shown in Figures 5.1.
Fig 5.1 Reinforcement details
Beams have been casted using M30 grade concrete and Fe415 grade steel. SCC beams
have been casted with replacement of cement by RHA as 0%, 10%, 20%, and 30%.
Wooden moulds have been used for casting these beams. It was placed uniformly inside
the mould, the excess concrete at the top of the mould was struck off with a wooden
straight edge and it was smoothly finished by trowelling. De-moulding was done after
24 hours and then covered with wet sacking to ensure proper curing.
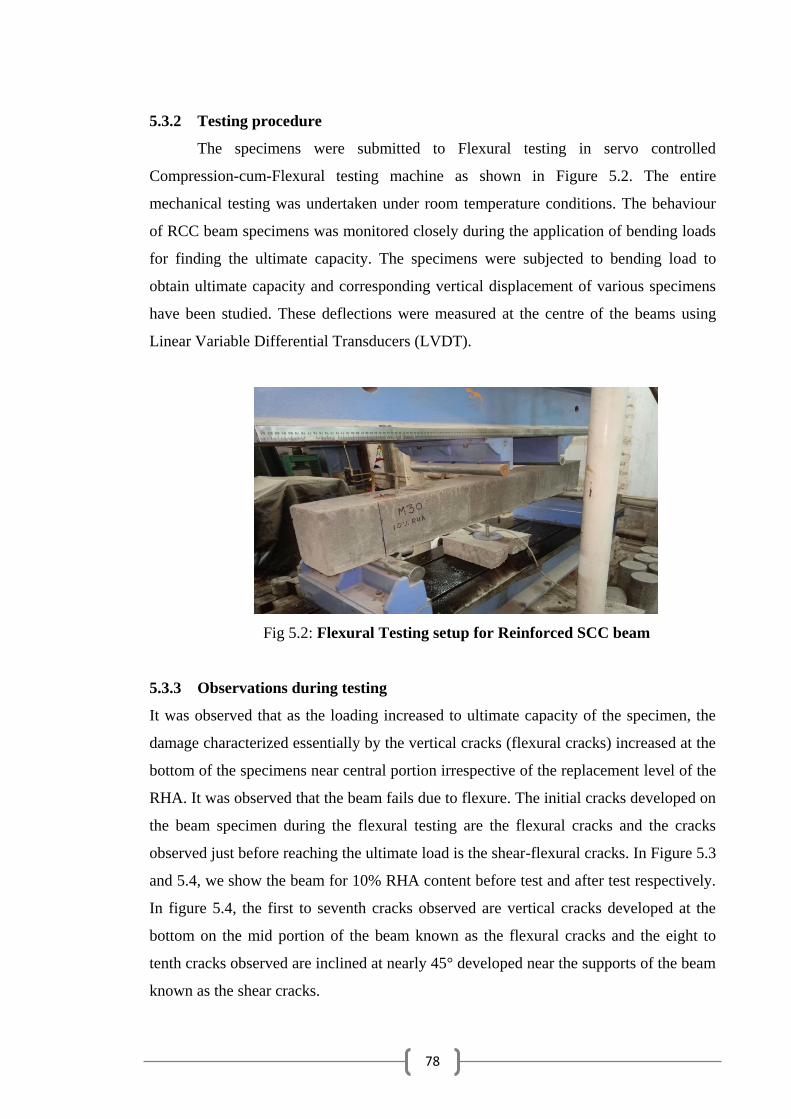
78
5.3.2 Testing procedure
The specimens were submitted to Flexural testing in servo controlled
Compression-cum-Flexural testing machine as shown in Figure 5.2. The entire
mechanical testing was undertaken under room temperature conditions. The behaviour
of RCC beam specimens was monitored closely during the application of bending loads
for finding the ultimate capacity. The specimens were subjected to bending load to
obtain ultimate capacity and corresponding vertical displacement of various specimens
have been studied. These deflections were measured at the centre of the beams using
Linear Variable Differential Transducers (LVDT).
Fig 5.2: Flexural Testing setup for Reinforced SCC beam
5.3.3 Observations during testing
It was observed that as the loading increased to ultimate capacity of the specimen, the
damage characterized essentially by the vertical cracks (flexural cracks) increased at the
bottom of the specimens near central portion irrespective of the replacement level of the
RHA. It was observed that the beam fails due to flexure. The initial cracks developed on
the beam specimen during the flexural testing are the flexural cracks and the cracks
observed just before reaching the ultimate load is the shear-flexural cracks. In Figure 5.3
and 5.4, we show the beam for 10% RHA content before test and after test respectively.
In figure 5.4, the first to seventh cracks observed are vertical cracks developed at the
bottom on the mid portion of the beam known as the flexural cracks and the eight to
tenth cracks observed are inclined at nearly 45° developed near the supports of the beam
known as the shear cracks.
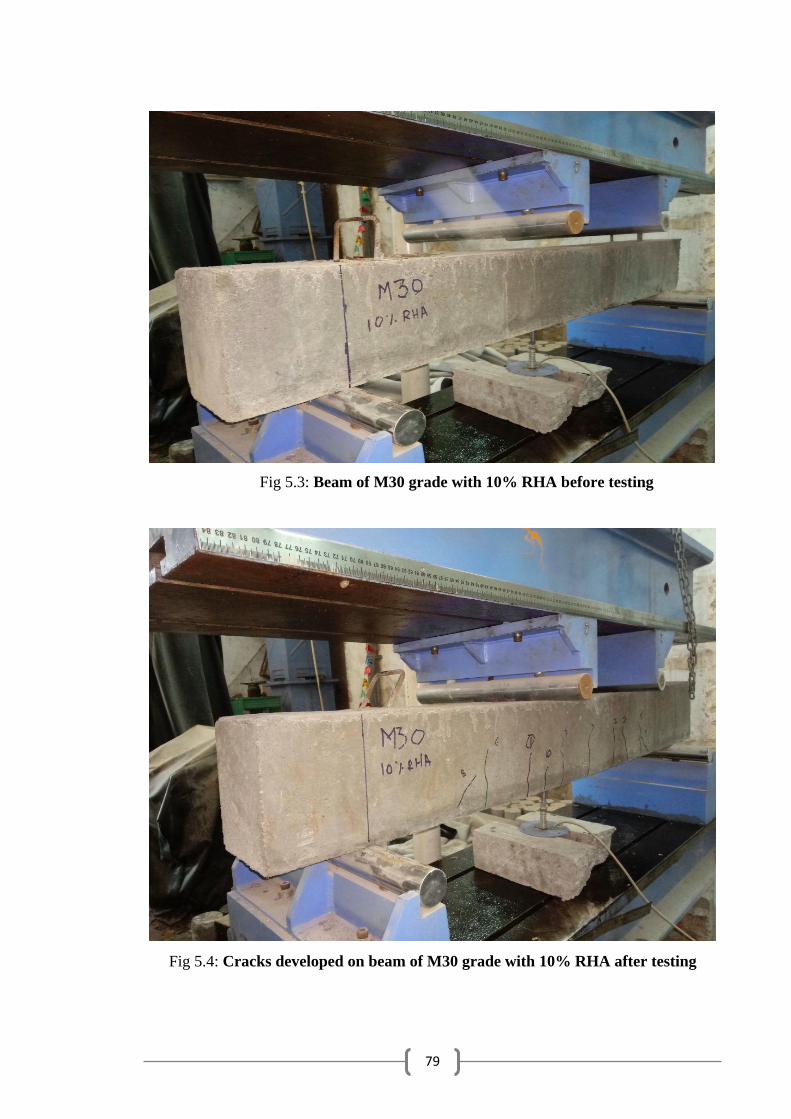
79
Fig 5.3: Beam of M30 grade with 10% RHA before testing
Fig 5.4: Cracks developed on beam of M30 grade with 10% RHA after testing

80
5.4 Experimental Results for Reinforced SCC Beam
5.4.1 Load carrying Capacity
The results obtained from SERVO software machine for the flexural tests performed on
beam specimens for 0%, 10%, 20% and 30% are shown in Figure 5.5, 5.6, 5.7 and 5.8
respectively. These figures show the readings for Load vs. Displacement, Displacement
vs. Time and Load vs. Time which finally gives ultimate Load Carrying Capacity and
Maximum Deflection of Beam.
Fig 5.5: Result for 0% RHA
Fig 5.6: Result for 10% RHA
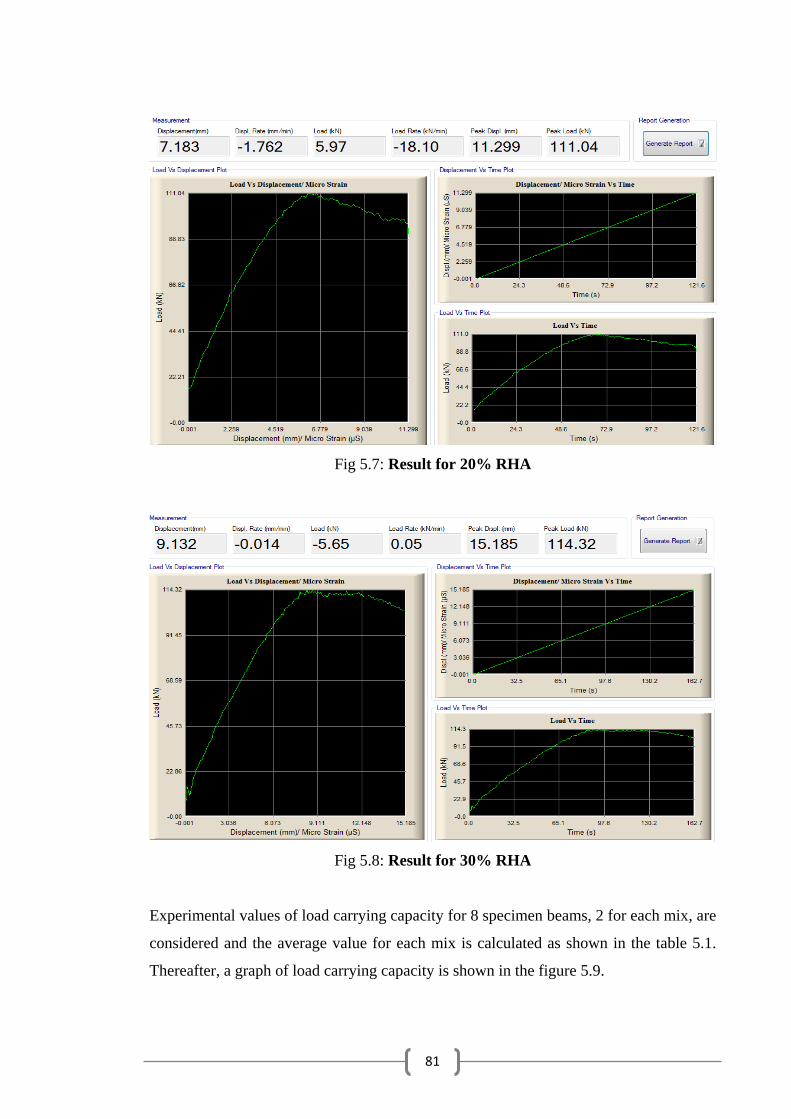
81
Fig 5.7: Result for 20% RHA
Fig 5.8: Result for 30% RHA
Experimental values of load carrying capacity for 8 specimen beams, 2 for each mix, are
considered and the average value for each mix is calculated as shown in the table 5.1.
Thereafter, a graph of load carrying capacity is shown in the figure 5.9.

82
Table 5.1: Experimental values of load carrying capacity
Sr No. Mix of RHA
(%)
Experimental Beam capacity
(kN)
Avg.
Experimental
Beam capacity
(kN) Beam I Beam II
1 0% 129.23 122.13 125.68
2 10% 121.17 119.2 120.185
3 20% 122.39 114.32 118.355
4 30% 111.04 111.66 111.35
Fig 5.9: Experimental Load Carrying Capacity of Beams
From the figures 5.5 to 5.8, Load carrying capacity of beams for M30 grade concrete is
noticed. The first crack appears at a load of 70.84 kN for 0% RHA, 76.89 kN for 10%
RHA, 70.14 kN for 20% RHA and 62.71 kN for 30% RHA and the corresponding
deflections for the first crack are 2.764 mm, 4.524 mm, 3.931 mm and 3.205 mm
respectively. The ultimate Load carrying capacity of beams for 0% RHA, 10% RHA,
20% RHA and 30% RHA are 122.13 kN, 119.35 kN, 114.32 kN and 111.04 kN
respectively; and the corresponding ultimate deflections are 15.724 mm, 18.064 mm,
15.185 mm and 11.299 mm respectively. These observations can be summarised into
the following table 5.2.
100
105
110
115
120
125
130
0% 10% 20% 30%Exp
eri
me
nta
l Lo
ad C
arry
ng
Cap
acit
y
Mix of RHA (%)
Experimental LoadCarrying Capacity
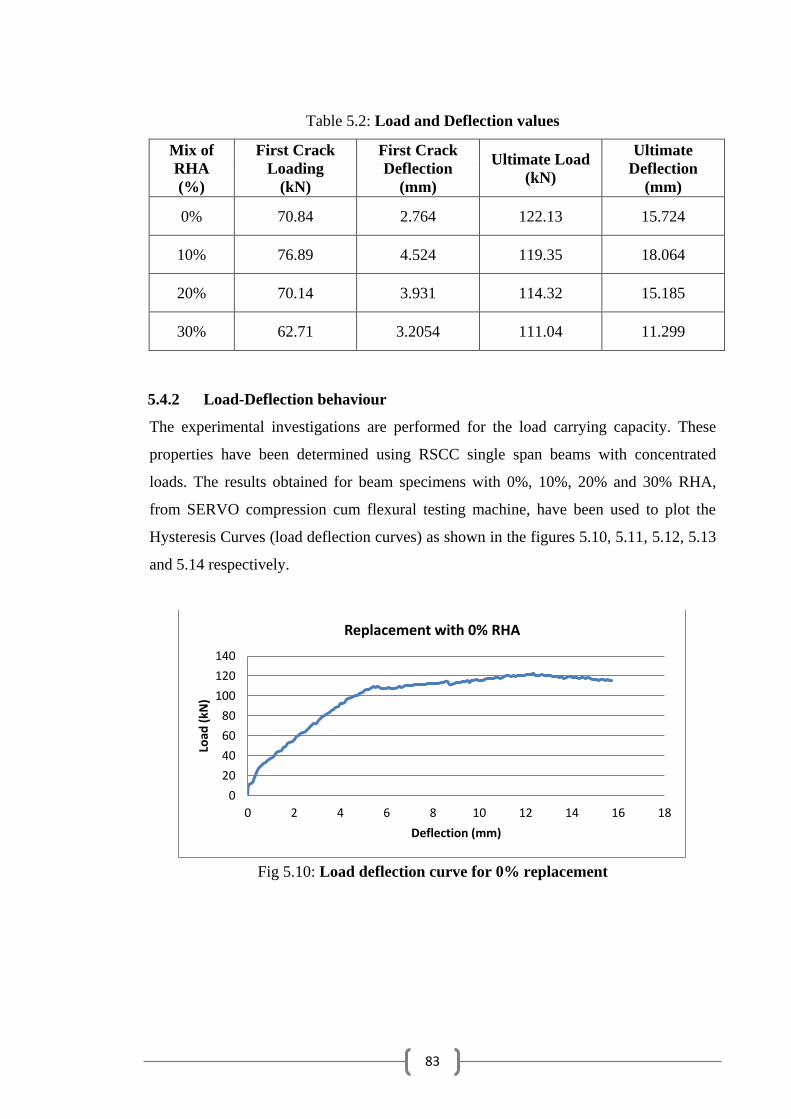
83
Table 5.2: Load and Deflection values
Mix of
RHA
(%)
First Crack
Loading
(kN)
First Crack
Deflection
(mm)
Ultimate Load
(kN)
Ultimate
Deflection
(mm)
0% 70.84 2.764 122.13 15.724
10% 76.89 4.524 119.35 18.064
20% 70.14 3.931 114.32 15.185
30% 62.71 3.2054 111.04 11.299
5.4.2 Load-Deflection behaviour
The experimental investigations are performed for the load carrying capacity. These
properties have been determined using RSCC single span beams with concentrated
loads. The results obtained for beam specimens with 0%, 10%, 20% and 30% RHA,
from SERVO compression cum flexural testing machine, have been used to plot the
Hysteresis Curves (load deflection curves) as shown in the figures 5.10, 5.11, 5.12, 5.13
and 5.14 respectively.
Fig 5.10: Load deflection curve for 0% replacement
0
20
40
60
80
100
120
140
0 2 4 6 8 10 12 14 16 18
Load
(kN
)
Deflection (mm)
Replacement with 0% RHA

84
Fig 5.11: Load deflection curve for 10% replacement
Fig 5.12: Load deflection curve for 20% replacement
Fig 5.13: Load deflection curve for 30% replacement
0
20
40
60
80
100
120
140
0 5 10 15 20
Load
(kN
)
Deflection (mm)
Replacement with 10% RHA
0
20
40
60
80
100
120
140
0 2 4 6 8 10 12 14 16
Load
(kN
)
Deflection (mm)
Replacement with 20% RHA
0
20
40
60
80
100
120
0 2 4 6 8 10 12
Load
(kN
)
Deflection (mm)
Replacement with 30% RHA
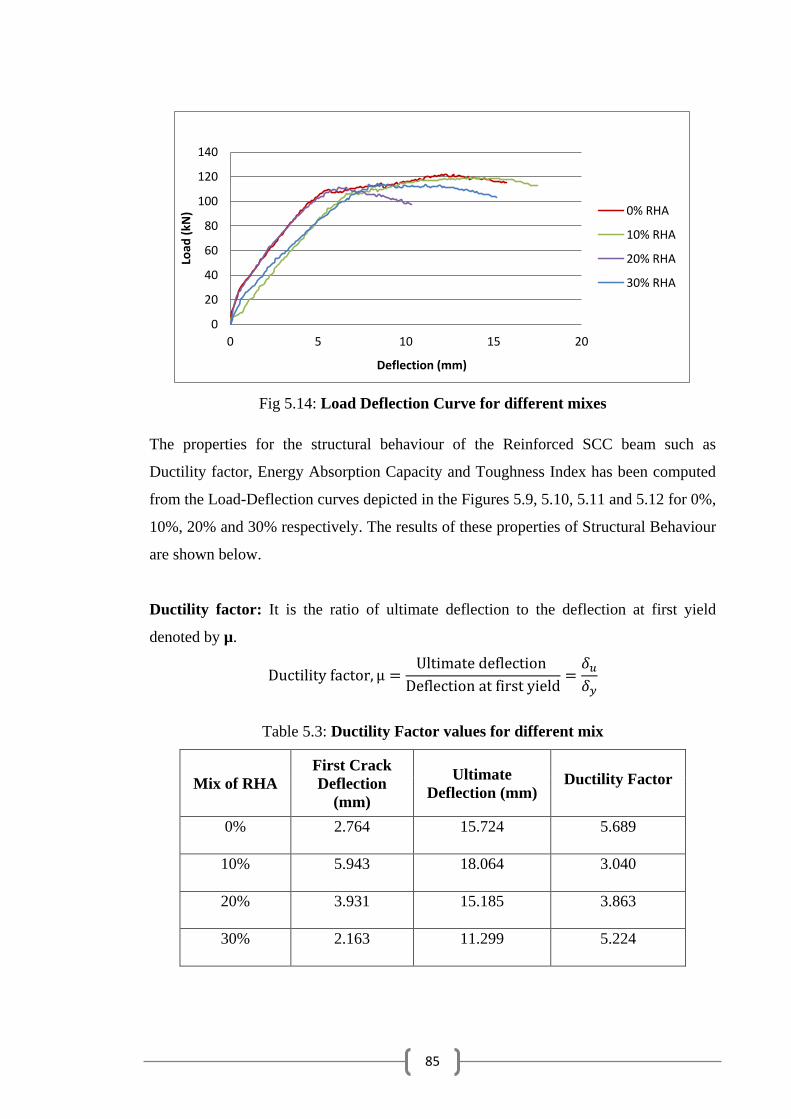
85
Fig 5.14: Load Deflection Curve for different mixes
The properties for the structural behaviour of the Reinforced SCC beam such as
Ductility factor, Energy Absorption Capacity and Toughness Index has been computed
from the Load-Deflection curves depicted in the Figures 5.9, 5.10, 5.11 and 5.12 for 0%,
10%, 20% and 30% respectively. The results of these properties of Structural Behaviour
are shown below.
Ductility factor: It is the ratio of ultimate deflection to the deflection at first yield
denoted by µ.
Table 5.3: Ductility Factor values for different mix
Mix of RHA
First Crack
Deflection
(mm)
Ultimate
Deflection (mm) Ductility Factor
0% 2.764 15.724 5.689
10% 5.943 18.064 3.040
20% 3.931 15.185 3.863
30% 2.163 11.299 5.224
0
20
40
60
80
100
120
140
0 5 10 15 20
Load
(kN
)
Deflection (mm)
0% RHA
10% RHA
20% RHA
30% RHA
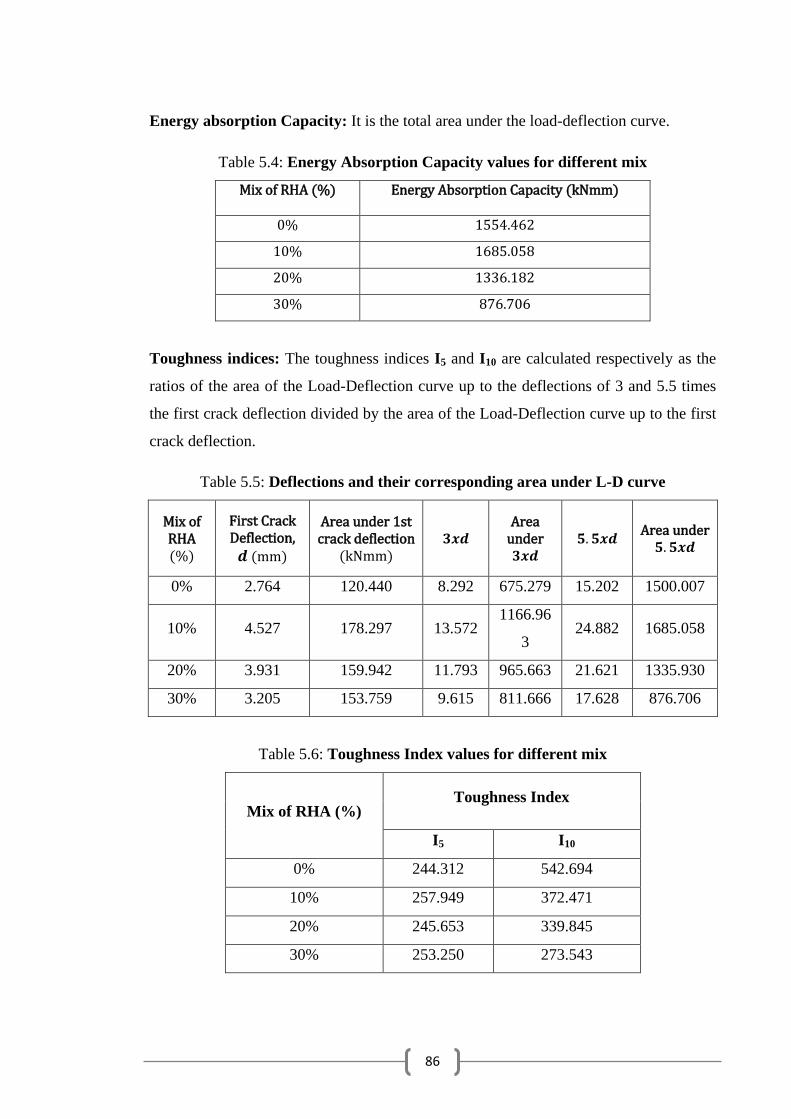
86
Energy absorption Capacity: It is the total area under the load-deflection curve.
Table 5.4: Energy Absorption Capacity values for different mix
Mix of RHA (%) Energy Absorption Capacity (kNmm)
0% 1554.462
10% 1685.058
20% 1336.182
30% 876.706
Toughness indices: The toughness indices I5 and I10 are calculated respectively as the
ratios of the area of the Load-Deflection curve up to the deflections of 3 and 5.5 times
the first crack deflection divided by the area of the Load-Deflection curve up to the first
crack deflection.
Table 5.5: Deflections and their corresponding area under L-D curve
Mix of RHA (%)
First Crack Deflection,
(mm)
Area under 1st crack deflection
(kNmm)
Area under
Area under
0% 2.764 120.440 8.292 675.279 15.202 1500.007
10% 4.527 178.297 13.572 1166.96
3 24.882 1685.058
20% 3.931 159.942 11.793 965.663 21.621 1335.930
30% 3.205 153.759 9.615 811.666 17.628 876.706
Table 5.6: Toughness Index values for different mix
Mix of RHA (%) Toughness Index
I5 I10
0% 244.312 542.694
10% 257.949 372.471
20% 245.653 339.845
30% 253.250 273.543

87
5.4.3 Comparison
The ideal theoretical value of the load carrying capacity of the Reinforced Concrete
Beam calculated in section 5.2 and then compared to the experimental results further
obtained shown in the Table 5.1. Comparison of test results for RCC beam with
Theoretical value and the Experimental value of load carrying capacity of beams are
depicted in the table 5.7.
Table 5.7: Experimental vs. Theoretical load carrying capacity for RSCC Beam
Grade of
concrete
RHA
(%)
Theoretical
capacity
Experimental
capacity
/
M30
0 64.380 125.680 1.952
10 64.380 120.185 1.867
20 64.380 118.355 1.838
30 64.380 111.350 1.730
For M30 grade Reinforced SCC beam, the flexural capacity shows higher value in all
replacement level of cement with RHA. We have calculated the Theoretical Load
Carrying Capacity for reinforced SCC beam for 0% is = 64.38 kN. It is observed
that i.e. the Experimental Load Carrying Capacity for reinforced SCC beam for
10%, 20% and 30% replacement of cement with RHA exhibits much higher value than
This implies that beam with replacement of cement with RHA up to 30% displays
desired flexural behaviour. It was also observed that with the increase in replacement of
cement with RHA, the ultimate capacity of Reinforced SCC beam decreases.
5.5 Summary
Beams have been casted using M30 grade concrete and Fe415 grade steel. SCC beams
were casted with the replacement of cement by RHA as 0%, 10%, 20%, and 30%. The
Theoretical Load Carrying Capacity of Beam was calculated. Test has been performed
to study the flexural behaviour of the reinforced SCC beams with the help of servo
controlled Compression-cum-Flexural testing machine and then the experimental value
of load carrying capacity of beam was obtained. The test results for RCC beam and
88
Theoretical load carrying capacity of beam have been compared. It has been observed
that the beam fails due to flexure. The initial cracks developed on the beam specimen
during the flexural testing are the flexural cracks and the cracks observed just before
reaching the ultimate load is the shear-flexural cracks. It is observed that with the
increase in replacement of cement with RHA, the ultimate capacity of Reinforced SCC
beam decreases. It is also found that the Experimental Load Carrying Capacity for
reinforced SCC beam for 10%, 20% and 30% replacement of cement with RHA exhibits
much higher value than the theoretical Load Carrying Capacity. The beam with
replacement of cement with RHA up to 30% displays desired flexural behaviour.
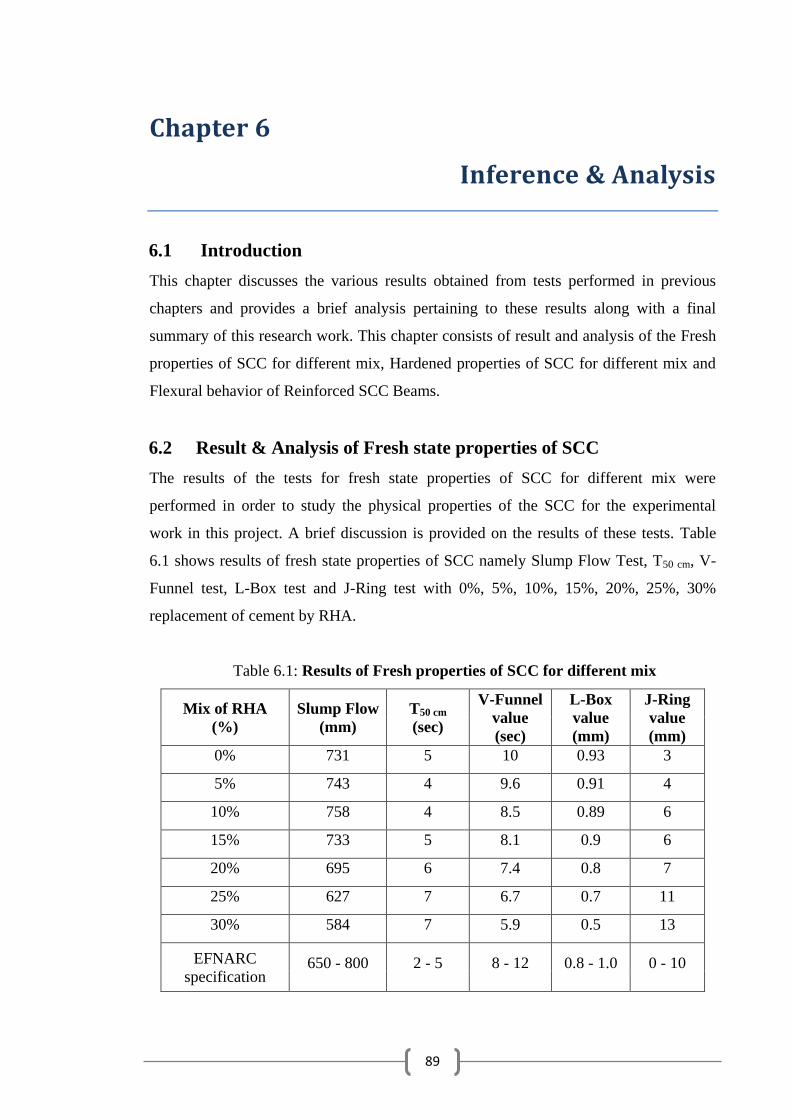
89
Chapter 6
Inference & Analysis
6.1 Introduction
This chapter discusses the various results obtained from tests performed in previous
chapters and provides a brief analysis pertaining to these results along with a final
summary of this research work. This chapter consists of result and analysis of the Fresh
properties of SCC for different mix, Hardened properties of SCC for different mix and
Flexural behavior of Reinforced SCC Beams.
6.2 Result & Analysis of Fresh state properties of SCC
The results of the tests for fresh state properties of SCC for different mix were
performed in order to study the physical properties of the SCC for the experimental
work in this project. A brief discussion is provided on the results of these tests. Table
6.1 shows results of fresh state properties of SCC namely Slump Flow Test, T50 cm, V-
Funnel test, L-Box test and J-Ring test with 0%, 5%, 10%, 15%, 20%, 25%, 30%
replacement of cement by RHA.
Table 6.1: Results of Fresh properties of SCC for different mix
Mix of RHA
(%)
Slump Flow
(mm)
T50 cm
(sec)
V-Funnel
value
(sec)
L-Box
value
(mm)
J-Ring
value
(mm)
0% 731 5 10 0.93 3
5% 743 4 9.6 0.91 4
10% 758 4 8.5 0.89 6
15% 733 5 8.1 0.9 6
20% 695 6 7.4 0.8 7
25% 627 7 6.7 0.7 11
30% 584 7 5.9 0.5 13
EFNARC
specification 650 - 800 2 - 5 8 - 12 0.8 - 1.0 0 - 10

90
The slump flow values increases from 731-758 for 0% to 10% replacement of cement.
On the other hand, the slump flow values decreases after 10 % replacement of cement
by RHA. It is observed that from 0% to 20% replacement of RHA satisfies the
EFNARC specification. However, the replacement of 25% and 30% cement by RHA
did not satisfy the requirement of fresh state properties of SCC as per EFNARC,
European Guidelines for SCC.
1. For T50 cm slump flow, the values for 0% to 15% replacement of cement by RHA
lies within the limits of EFNARC specification, and after 15%, it failed to
provide the anticipated values.
2. For V-funnel, values decreased with the increase in replacement of cement by
RHA. The resultant values up to 15% replacement lie within the range specified
by EFNARC. In this test, 20%, 25% and 30% replacement of cement by RHA
fails.
3. Similarly for L-box test, values decreased with the increase in replacement of
cement by RHA and the test values only up to 15% replacement were within the
limits of EFNARC specifications.
4. On the contrary, for J-Ring test, the value (H2-H1) increases with increase in
replacement of RHA. It can be seen that, from 0% to 20% replacement of
cement by RHA satisfies the requirement for the fresh state properties of SCC as
per EFNARC specifications.
Therefore, it can be summarized from the set of tests for Fresh state properties of
SCC that it is the designed mix is most economical and durable up to 15-20%.
6.3 Result & Analysis of Hardened state properties of SCC
The results of the three tests for hardened state properties of SCC for different mix were
performed in order to study the mechanical properties of the SCC for the experimental
work in this project. A brief discussion is provided on the results of the three tests
namely, Compressive Strength test, Split Tensile Strength Test and Flexural Strength
test in Section 6.3.1, 6.3.2, and 6.3.3 respectively.
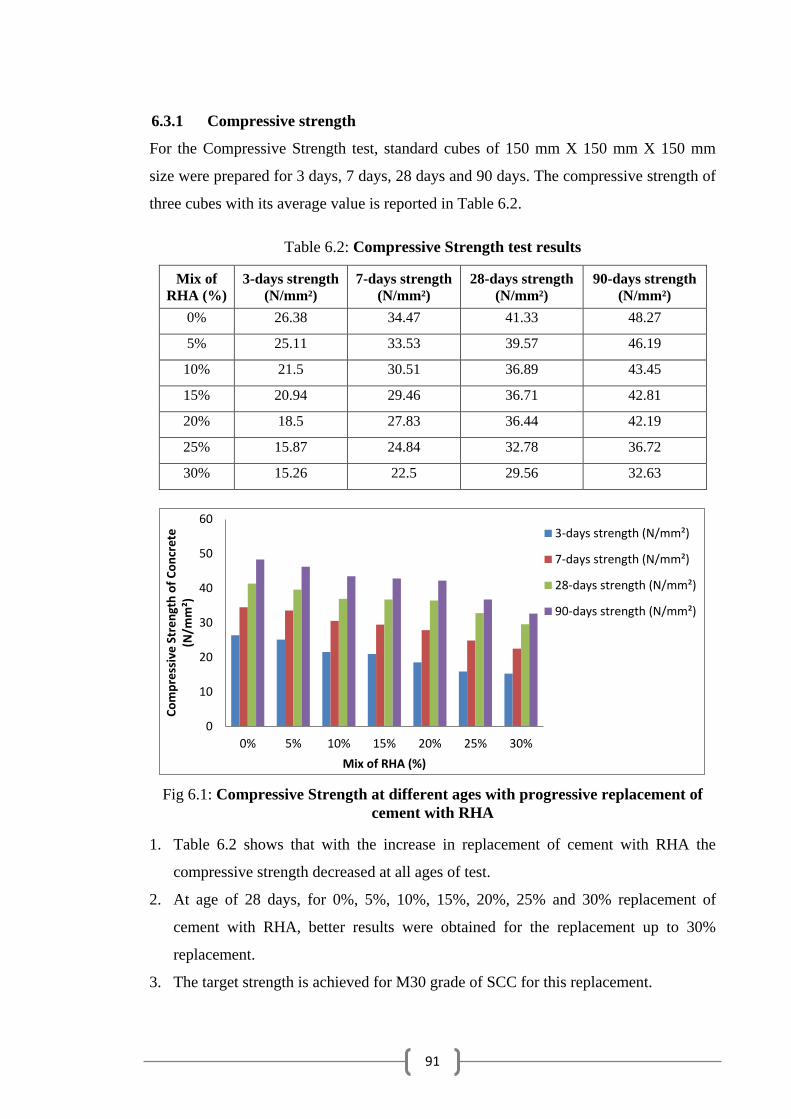
91
6.3.1 Compressive strength
For the Compressive Strength test, standard cubes of 150 mm X 150 mm X 150 mm
size were prepared for 3 days, 7 days, 28 days and 90 days. The compressive strength of
three cubes with its average value is reported in Table 6.2.
Table 6.2: Compressive Strength test results
Mix of
RHA (%)
3-days strength
(N/mm²)
7-days strength
(N/mm²)
28-days strength
(N/mm²)
90-days strength
(N/mm²)
0% 26.38 34.47 41.33 48.27
5% 25.11 33.53 39.57 46.19
10% 21.5 30.51 36.89 43.45
15% 20.94 29.46 36.71 42.81
20% 18.5 27.83 36.44 42.19
25% 15.87 24.84 32.78 36.72
30% 15.26 22.5 29.56 32.63
Fig 6.1: Compressive Strength at different ages with progressive replacement of
cement with RHA
1. Table 6.2 shows that with the increase in replacement of cement with RHA the
compressive strength decreased at all ages of test.
2. At age of 28 days, for 0%, 5%, 10%, 15%, 20%, 25% and 30% replacement of
cement with RHA, better results were obtained for the replacement up to 30%
replacement.
3. The target strength is achieved for M30 grade of SCC for this replacement.
0
10
20
30
40
50
60
0% 5% 10% 15% 20% 25% 30%
Co
mp
ress
ive
Str
en
gth
of
Co
ncr
ete
(N
/mm
²)
Mix of RHA (%)
3-days strength (N/mm²)
7-days strength (N/mm²)
28-days strength (N/mm²)
90-days strength (N/mm²)
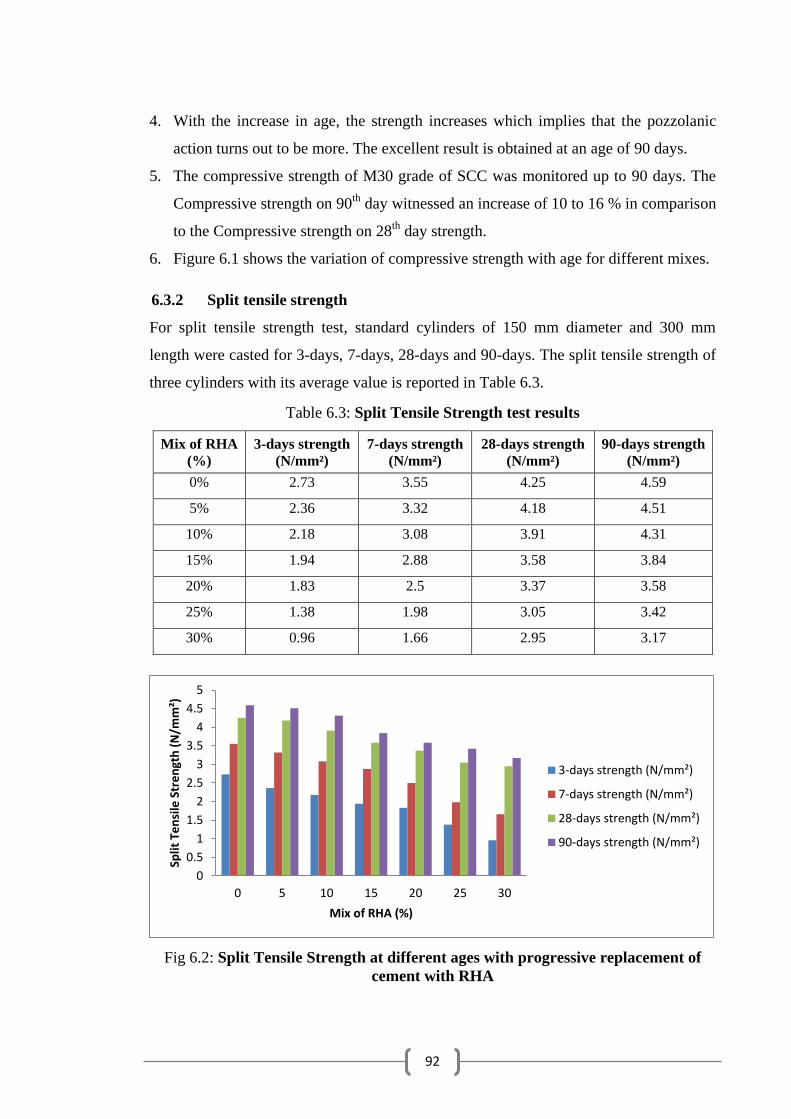
92
4. With the increase in age, the strength increases which implies that the pozzolanic
action turns out to be more. The excellent result is obtained at an age of 90 days.
5. The compressive strength of M30 grade of SCC was monitored up to 90 days. The
Compressive strength on 90th
day witnessed an increase of 10 to 16 % in comparison
to the Compressive strength on 28th
day strength.
6. Figure 6.1 shows the variation of compressive strength with age for different mixes.
6.3.2 Split tensile strength
For split tensile strength test, standard cylinders of 150 mm diameter and 300 mm
length were casted for 3-days, 7-days, 28-days and 90-days. The split tensile strength of
three cylinders with its average value is reported in Table 6.3.
Table 6.3: Split Tensile Strength test results
Mix of RHA
(%)
3-days strength
(N/mm²)
7-days strength
(N/mm²)
28-days strength
(N/mm²)
90-days strength
(N/mm²)
0% 2.73 3.55 4.25 4.59
5% 2.36 3.32 4.18 4.51
10% 2.18 3.08 3.91 4.31
15% 1.94 2.88 3.58 3.84
20% 1.83 2.5 3.37 3.58
25% 1.38 1.98 3.05 3.42
30% 0.96 1.66 2.95 3.17
Fig 6.2: Split Tensile Strength at different ages with progressive replacement of
cement with RHA
0
0.5
1
1.5
2
2.5
3
3.5
4
4.5
5
0 5 10 15 20 25 30
Split
Te
nsi
le S
tre
ngt
h (
N/m
m²)
Mix of RHA (%)
3-days strength (N/mm²)
7-days strength (N/mm²)
28-days strength (N/mm²)
90-days strength (N/mm²)
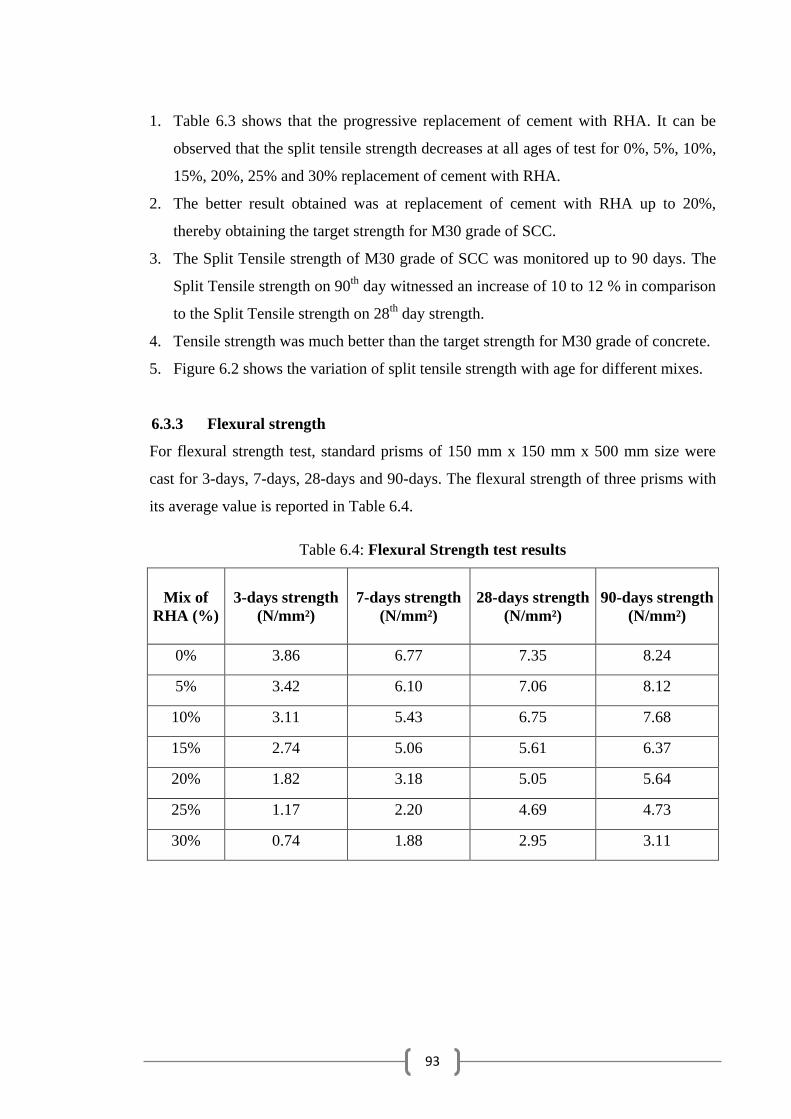
93
1. Table 6.3 shows that the progressive replacement of cement with RHA. It can be
observed that the split tensile strength decreases at all ages of test for 0%, 5%, 10%,
15%, 20%, 25% and 30% replacement of cement with RHA.
2. The better result obtained was at replacement of cement with RHA up to 20%,
thereby obtaining the target strength for M30 grade of SCC.
3. The Split Tensile strength of M30 grade of SCC was monitored up to 90 days. The
Split Tensile strength on 90th
day witnessed an increase of 10 to 12 % in comparison
to the Split Tensile strength on 28th
day strength.
4. Tensile strength was much better than the target strength for M30 grade of concrete.
5. Figure 6.2 shows the variation of split tensile strength with age for different mixes.
6.3.3 Flexural strength
For flexural strength test, standard prisms of 150 mm x 150 mm x 500 mm size were
cast for 3-days, 7-days, 28-days and 90-days. The flexural strength of three prisms with
its average value is reported in Table 6.4.
Table 6.4: Flexural Strength test results
Mix of
RHA (%)
3-days strength
(N/mm²)
7-days strength
(N/mm²)
28-days strength
(N/mm²)
90-days strength
(N/mm²)
0% 3.86 6.77 7.35 8.24
5% 3.42 6.10 7.06 8.12
10% 3.11 5.43 6.75 7.68
15% 2.74 5.06 5.61 6.37
20% 1.82 3.18 5.05 5.64
25% 1.17 2.20 4.69 4.73
30% 0.74 1.88 2.95 3.11
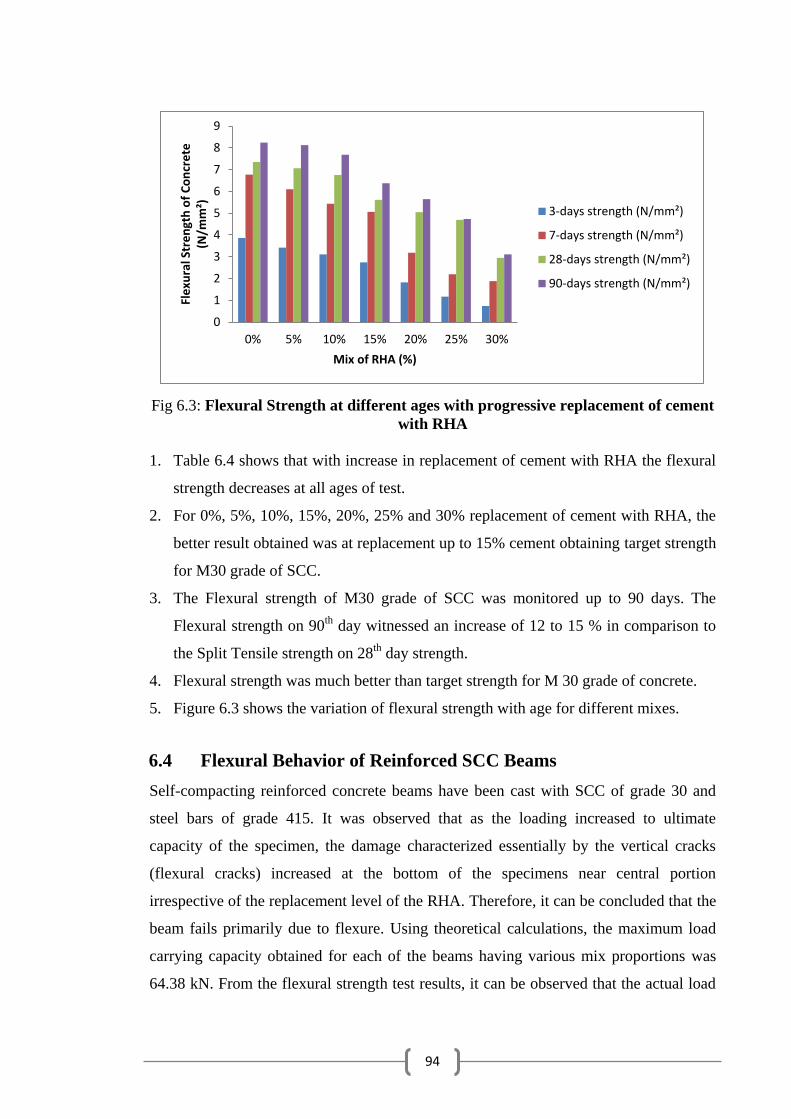
94
Fig 6.3: Flexural Strength at different ages with progressive replacement of cement
with RHA
1. Table 6.4 shows that with increase in replacement of cement with RHA the flexural
strength decreases at all ages of test.
2. For 0%, 5%, 10%, 15%, 20%, 25% and 30% replacement of cement with RHA, the
better result obtained was at replacement up to 15% cement obtaining target strength
for M30 grade of SCC.
3. The Flexural strength of M30 grade of SCC was monitored up to 90 days. The
Flexural strength on 90th
day witnessed an increase of 12 to 15 % in comparison to
the Split Tensile strength on 28th
day strength.
4. Flexural strength was much better than target strength for M 30 grade of concrete.
5. Figure 6.3 shows the variation of flexural strength with age for different mixes.
6.4 Flexural Behavior of Reinforced SCC Beams
Self-compacting reinforced concrete beams have been cast with SCC of grade 30 and
steel bars of grade 415. It was observed that as the loading increased to ultimate
capacity of the specimen, the damage characterized essentially by the vertical cracks
(flexural cracks) increased at the bottom of the specimens near central portion
irrespective of the replacement level of the RHA. Therefore, it can be concluded that the
beam fails primarily due to flexure. Using theoretical calculations, the maximum load
carrying capacity obtained for each of the beams having various mix proportions was
64.38 kN. From the flexural strength test results, it can be observed that the actual load
0
1
2
3
4
5
6
7
8
9
0% 5% 10% 15% 20% 25% 30%
Fle
xura
l Str
en
gth
of
Co
ncr
ete
(N
/mm
²)
Mix of RHA (%)
3-days strength (N/mm²)
7-days strength (N/mm²)
28-days strength (N/mm²)
90-days strength (N/mm²)
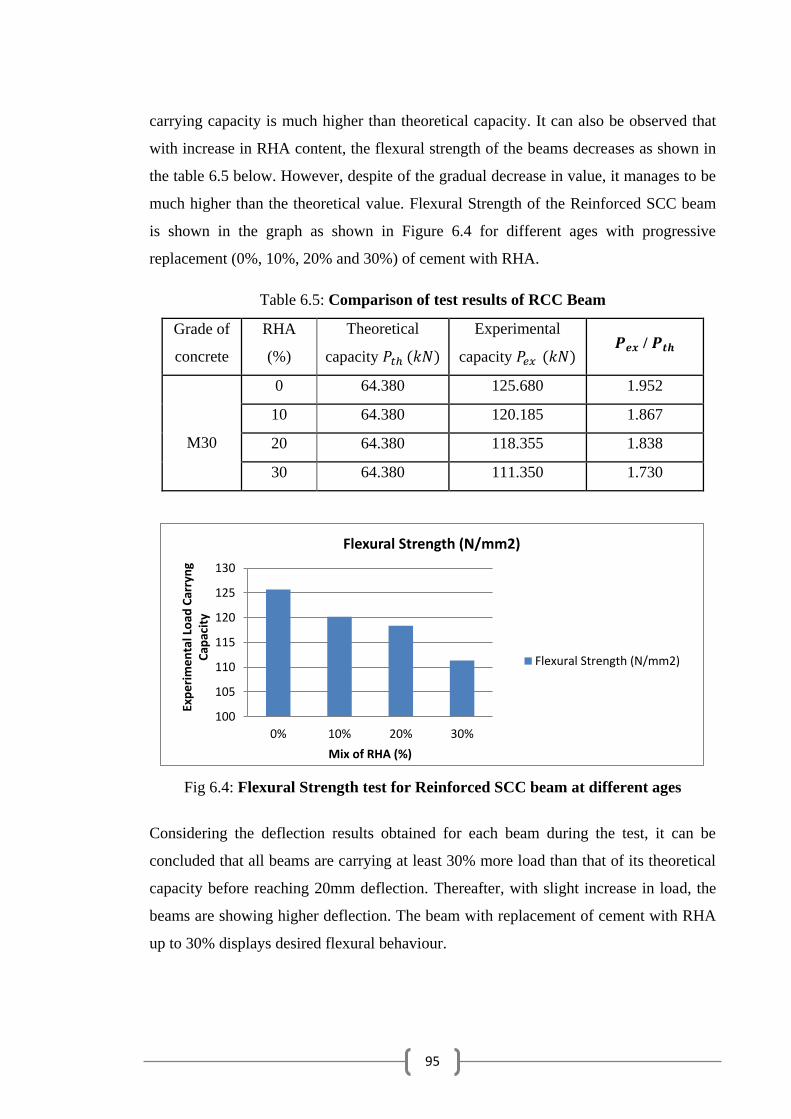
95
carrying capacity is much higher than theoretical capacity. It can also be observed that
with increase in RHA content, the flexural strength of the beams decreases as shown in
the table 6.5 below. However, despite of the gradual decrease in value, it manages to be
much higher than the theoretical value. Flexural Strength of the Reinforced SCC beam
is shown in the graph as shown in Figure 6.4 for different ages with progressive
replacement (0%, 10%, 20% and 30%) of cement with RHA.
Table 6.5: Comparison of test results of RCC Beam
Grade of
concrete
RHA
(%)
Theoretical
capacity
Experimental
capacity /
M30
0 64.380 125.680 1.952
10 64.380 120.185 1.867
20 64.380 118.355 1.838
30 64.380 111.350 1.730
Fig 6.4: Flexural Strength test for Reinforced SCC beam at different ages
Considering the deflection results obtained for each beam during the test, it can be
concluded that all beams are carrying at least 30% more load than that of its theoretical
capacity before reaching 20mm deflection. Thereafter, with slight increase in load, the
beams are showing higher deflection. The beam with replacement of cement with RHA
up to 30% displays desired flexural behaviour.
100
105
110
115
120
125
130
0% 10% 20% 30%
Exp
eri
me
nta
l Lo
ad C
arry
ng
Cap
acit
y
Mix of RHA (%)
Flexural Strength (N/mm2)
Flexural Strength (N/mm2)
96
6.5 Summary
This chapter comprises of the inferences and analysis of the results obtained from the
investigations and results shown in Chapter 4 and 5. After lucid discussion of the
results, the rational conclusions were drawn on the fresh state and hardened state
properties of the designed SCC with the partial replacement of cement with RHA at
different ages. This chapter further includes the discussion of the flexural behavior of
the reinforced SCC beams; the results obtained from the experiment in Chapter 5 are
discussed and interpreted.

97
Chapter 7
Conclusion & Future Scope
7.1 Conclusion
The project work deals with the use of Rice Husk Ash as a partial replacement of
cement in Self-Compacting Concrete. This project encompass the laboratory tests for
finding out physical property of the material used in the concrete design such as specific
gravity, fineness modulus, water absorption, and particle size distribution for fine
aggregate, fine aggregate (sand) and coarse aggregate. The tests were conducted as per
Indian Standards for aggregate. The project further includes the assessment of the fresh
properties of concrete such as workability test for each replacement of cement with Rice
Husk Ash (RHA), and assessment of the hardened properties of concrete such as
compressive strength, split tensile strength, flexural strength for M30 grade of concrete
for partial replacement of cement with RHA starting from 0% to 30% for different ages.
In addition to that, a lucid study concerning the flexural behaviour of the designed
reinforced SCC beam is presented in this project.
The final result of this thesis work showed that the inclusion of rice husk ash as
replacement of cement does not affect the strength properties negatively as the strength
remains within limits i.e. target strength can be achieved up to a replacement of 15% to
25%. In order to preserve energy and reduce carbon dioxide, RHA plays an important
role when added to Portland cement. A large volume of RHA is generated from rice
milling industries every year. The proper use of RHA in construction industry could
develop a healthy and sustainable environment. RHA is very effective in a partial
replacement of cement up to 20% to produce the target strength of self-compacting
concrete. Partial replacement of cement by RHA not only makes the SCC durable but
also makes it economical. As a result, the partial replacement of cement by RHA has
gained considerable importance because of the requirements of environmental safety
and more durable construction in the future.
98
This thesis work can be concluded in the following points:
1. RHA being a waste material obtained from the agricultural waste is being used as a
by-product in cement industry. Partial replacement of RHA with cement reduces
environmental problem which is a big concern for the whole world. The greenhouse
gas emissions can be reduced up to a major extent by replacing OPC with RHA in
concrete.
2. RHA can be used in large quantities in SCC and cement content can be reduced to as
low as 385 kg/m3 for M 30 grade of SCC. Hence by incorporating RHA as a partial
replacement of cement we can make an economical self-compacting concrete.
3. As per EFNARC specification, the slump flow value was obtained within acceptable
value up to replacement of 20% cement by RHA. As per the EFNARC specification,
the V-Funnel, L-Box & J-Ring Test showed acceptable value up to replacement of
20% cement by RHA.
4. The target strength for Compressive, Spilt tensile and Flexural Strength for M30
grade concrete was achieved up to a replacement of 20% of cement by RHA.
5. SCC required more cement content to achieve self-compactability and to satisfy
EFNARC criteria. Therefore due to hydration of cement, large amount of heat is
generated because of which thermal cracks occur during mass concrete. Partial
replacement of cement by RHA resists these thermal cracks and makes the concrete
durable.
6. Use of RHA increases the packing density of concrete which result in water-resistant
concrete. The Bulk Densities of concrete reduced as the percentage RHA
replacement increased hence reduces the dead load of structure.
7. Results indicate that pozzolanic reactions of rice husk ash in the matrix composite
were low in early ages, but by ageing the specimens to more than 90 days
considerable effect have been seen in strength.
8. RHA being a super pozzolana can easily replace silica fume which is being imported
from Norway to India and thus makes the concrete costly. So RHA can be used
instead of silica fume and thus makes the concrete economical.
99
7.2 Future scope
1. Even though many studies have been reported on the use of RHA, there is a need to
study specifically the performance of RHA prepared from uncontrolled burning of
rice husk available in rice mills. In this project, RHA is obtained by controlled
burning of rice husk at a temperature between 550-7000 C incinerating for about 10-
12 hours. However, systematic study and detailed investigation on the utilization of
RHA prepared from uncontrolled burning at a temperature lower than 5500 C needs
to be done.
2. Use of another mineral admixture or combination of admixtures as a partial
replacement of cement in SCC. Mineral admixture used for partial replacement of
cement can be Fly Ash, Ground Granulated Blast Furnace slag, Silica Fumes, Rice
Husk Ash or Meta-kaolin. They can be used in combinations too. Besides, the use of
Marble Powder, Tile powder, Saw Dust, Coconut Shell Ash, Glass Powder, etc. are
at its initial research stage (yet to be approved by Indian Standards).
3. Study of the partial replacement of cement by alternative mineral admixtures in Self
Compacting Concrete in terms of mega structures, i.e. for structural elements like
RCC Columns, RCC Beams, Single-Portal Frame (2D & 3D) and multi-storey
Portal Frame.
4. Analytical study on the structural behaviour of the Reinforced SCC beams with
partial replacement of cement by a mineral admixture using ANSYS.
100
References
[1] Okamura, H., K. Ozawa and M. Ouchi, ―Self-Compacting Concrete, Structural
Concrete‖, Vol no. 1, issue 1, pp 3-16, 2000.
[2] Khayat K.H., ―Workability, Testing and performance of self-consolidating
concrete‖, ACI Materials journal, Vol no. 96, Issue 3, pp 346-352, 1999.
[3] Vilas V. Karjinni, Shrishail B. Anadinni, ―Mixture Proportion Procedure for SCC‖,
Indian Concrete Journal, Vol no. 83, issue 6, pp 35-41, June 2009.
[4] Ozawa, K., Maekawa, K, and Okamura, Hwang, ―Development of high
performance concrete‖, Journal of Faculty of Engineering, no 3, pp 381-439.
[5] Ahmadi M.A., Alidoust O., Sadrinejad I., Nayeri, M., ―Development of Mechanical
Properties of Self Compacting Concrete Contain Rice Husk Ash‖, International
Journal of Civil and Environmental Engineering, Vol no. 1, pp 100-103., 2007.
[6] Syed Mehdi Abbas, ―Use of rice husk ash in concrete as partial cement replacement
material‖, International Journal of Scientific & Engineering Research, Vol no. 6 ,
pp 276-278, December 2015.
[7] Prof. Shriram H. Mahure, Dr. V.M. Mohitkar , ―Effect of Rice Husk Ash Fresh and
Hardened Properties of Self Compacting Concrete‖, International Journal of
Scientific & Engineering Research, Vol no. 5, issue 7, pp 833-839, July 2014.
[8] Chindaprasirt, Sumrerng Rukzon, ―Use of Rice Husk-Bark Ash in producing Self-
Compacting Concrete‖, Advances in Civil Engineering, Vol no. 2014, Article ID
429727.

101
[9] Er Mehran Ali, Kshipra Kapoor, ―A review study on use of rice husk ash as partial
replacement with cement in concrete‖, International Journal of Latest Research In
Engineering and Computing, Vol no. 4, issue 5, pp 5-8, October 2016.
[10] Silvio Delvasto, A Salas, R. Mejia, ―Developing High Performance Concrete
incorporating highly reactive rice husk ash‖, Univeridad Nacional de Colombia,
Vol no. 33, issue 2, pp 49-55, 2013.
[11] Chatveera B, Lertwattanaruk P, ―Durability of Conventional concrete containing
black rice husk ash‖, Journal of Environmental Management Vol no. 92, issue 1, pp
59-66, September 2010.
[12] E. Abalaka, ―Strength and some Durability Properties of Concrete Containing Rice
Husk Ash Produced in a Charcoal incinerator at low specific Surface‖, International
Journal of Concrete Structures and Materials, Vol no.7, issue 4, pp 287-293,
November 2013.
[13] V. Kannan and K. Ganesan, ―Chloride and Chemical resistance of self compacting
concrete containing rice husk ash and metakaolin‖, Construction and Building
Materials. Vol no. 51, pp 225-234, January 2014.
[14] S. Kanakambara Rao, ―A Review on Experimental Behaviour of Self Compaction
Concrete Incorporated with Rice Husk Ash‖, International Journal of Science and
Advanced Technology, Vol no.2, pp 75-80, March 2012.
[15] Bui, Le Anh-Tuan, Chen, Chun-Tsun, Hwang, Chao –Lung, ―Effect of Silica forms
in rice husk ash on the properties of concrete‖, International Journal of Minerals
Metallurgy and Materials, Vol no. 19, issue 3, pp 252-258, March 2012.
[16] P. Padma Rao, A. Pradhan Kumar, B. Bhasker Singh, ―A study on the use of Rice
Husk Ash in concrete‖, International Journal of Education and applied research,
Vol no. 4, Issue 2, ISSN : 2348-0033(Online) ISSN : 2249-4944 (Print), 2014.

102
[17] Amitkumar D. Raval, Dr. Indrajit N. Patel, Prof. Jayeshkumar Pitroda, ―Effective
Replacement Of Cement For Establishing Sustainable Concrete‖, International
Journal of Engineering Trends and Technology, Vol no.4, Issue 6, pp 2324-2329,
June 2013.
[18] B.H.V. Pai, M. Nandy, A. Krishnamoorthy, P. K. Sarkar, Philip George,
―Comparative Study Of Self Compacting Concrete Mixes Containing Fly Ash And
Rice Husk Ash‖, American Journal of Engineering Research, Vol no. 3, Issue-03,
pp 150-154, 2014.
[19] Sonali K. Gadpalliwar, R. S. Deotale, Abhijeet R. Narde, ―To Study the Partial
Replacement of Cement by GGBS & RHA and Natural Sand by Quarry Sand In
Concrete‖, IOSR Journal of Mechanical and Civil Engineering, Vol no. 11, Issue 2,
pp 69-77, 2014.
[20] Vinod Goud, Niraj Soni, Goutam Varma, Kapil Kushwah, Sharad Chaurasia,
Vishwajeet Sharma, ―Partial Replacement of Cement with Fly Ash In Concrete
And Its Effect‖, IOSR Journal of Engineering, Vol no. 6, Issue 10, pp 69-75,
October 2016.
[21] Swapnil Samrit, Piyush Shrikhande, M. V. Mohod, ―Use of Fly Ash as Partial
Replacement of Cement in Concrete Pavements‖, Published and distributed by:
International Conference on Science and Technology for Sustainable Development,
2016.
[22] Savita Devi, Nitish Gandhi, Mahipal, Nimisha Marmat, Balveer Manda, Mahesh
Vaishnav, ―A Review on Cement Replacement in Construction Industry‖, SSRG
International Journal of Civil Engineering, Vol no. 3, Issue 5, May 2016.
[23] N Kaarthik Krishna, S. Sandeep, K. M. Mini, ―Study On Concrete With Partial
Replacement Of Cement By Rice Husk Ash‖, IOP Conference Series: Materials
Science and Engineering, 2016.
[24] K Sampath Kumar, U. M. Praveen, A. Prathyusha, V. Akhila, P. Sasidhar, ―A
Comprehensive Study On Partial Replacement Of Cement With Sugarcane Bagasse

103
Ash, Rice Husk Ash & Stone Dust‖, International Journal of Civil Engineering and
Technology, Vol no. 7, Issue 3, pp 163–172, 2016.
[25] V. Subbamma, Dr. K. Chandrasekhar Reddy, ―Experimental Study On
Compressive Strength Of Plain Cement Concrete With Partial Replacement Of
Cement By Flyash & Metakaolin‖, International Journal of Civil Engineering and
Technology, Vol no. 7, Issue 6, pp 82–89, 2016.
[26] V. Suresh, M. Suresh Babu, M. Achyutha Kumar Reddy, ―Experimental Study On
Strength And Durability Parameters Of Concrete By Partial Replacement Of
Cement With Sodium Polyacrylate‖, International Journal of Civil Engineering and
Technology, Vol no. 8, Issue 1, pp. 498–503, January 2017.
[27] B. Preethiwini, ―Comparative Study On Durability Characteristics Of High
Strength Self Compacting Concrete‖, International Journal of Civil Engineering
and Technology, Vol no. 8, Issue 3, pp 942–949, March 2017.
[28] Abin Thomas C. A., Jayalakshmi S., Jerin K. Antony, Kavya S. Kumar, Sreepriya
K. V., ―Development Of Self Compacting Concrete Mix And Analysis Of
Compressive Strength By Replacement Of Fines With Iron Ore Fines‖,
International Journal of Civil Engineering and Technology, Vol no. 8, Issue 4, pp.
1928–1937, April 2017.
[29] D. Gowsika, S. Sarankokila, K. Sargunan, ―Experimental Investigation of Egg
Shell Powder as Partial Replacement with Cement in Concrete‖, International
Journal of Engineering Trends and Technology, Vol no. 14, Issue 2, pp 65, Aug
2014.
[30] M. S. Al-Lami, ―Effect Of Elevated Temperature On Compressive Strength Of Self
Compacting Concrete Using Viscocrete And Silica Fume, International Journal of
Civil Engineering and Technology, Vol no. 8, Issue 10, pp 405–413, October 2017.
[31] T. Shanmuga Priya, A. Punitha Kumar, ―A Study On Crushed Sand As An
Alternative For Natural Sand In High Performance Concrete‖, International Journal
of Civil Engineering and Technology, Vol no. 8, Issue 12, pp. 332-338, December
2017, International Journal of Civil Engineering and Technology (IJCIET).
104
[32] Amir Shafi Batt, Anshul Garg, ―Partial Replacement of Wood Ash with Ordinary
Portland Cement and Foundry Sand As Fine Aggregate‖, International Journal of
Civil Engineering and Technology, Vol no. 7, Issue 2, 2017.
[33] G. M. Sadiqul Islam, M. H. Rahman, Nayem Kazi, ―Waste glass powder as partial
replacement of cement for sustainable concrete practice‖, International Journal of
Sustainable Built Environment, Vol no.6, pp 37–44, 2017.
[34] MD Azharuddin, S. Manivel, S. Thiagu, ―To Study The Behaviour Of Beam Using
Partial Replacement Of Cement By Pond Ash And Steel Fibre In Flexure And
Under Cyclic Loading‖, International Journal of Civil Engineering and Technology,
Vol 9, Issue 4, pp 494–503, April 2018.
[35] Ratandeep Kumar, Ashfaq Malik, Vivek Kumar Kashyap, ―Partial Replacement Of
Cement With Rice Husk Ash And Fine Aggregates By Coconut Shell Powder In
Concrete‖, International Journal of Civil Engineering and Technology, Vol no. 9,
Issue 4, pp 544–551, April 2018.
[36] Boeini Sampurna, D. S. V. S. M. R. K. Chekravarty, ―Experimental Investigation
On M50 Grade Self Compacting Concrete Using Glass Fibre‖, International Journal
of Civil Engineering and Technology, Vol no. 9, Issue 5, pp. 61–68, May 2018.
[37] Dr. Ch. Kannam Naidu, Dr. Ch. Vasudeva Rao, Dr. G. Venkata Rao, A. Y. D. T.
Akhilesh, ―Experimental Study On M30 Grade Concrete With Partial Replacement
Of Cement With Egg Shell Powder‖, International Journal of Civil Engineering and
Technology, Vol no. 9, Issue 5, pp 575–583, May 2018.
[38] Ifrah Mushtaq, Sandeep Nasier, ―Self Compacting Concrete Design And
Performance Using Fly Ash‖, International Journal of Civil Engineering and
Technology, Vol no. 9, Issue 4, pp 436–445, April 2018.
[39] B. Mahendra , T. Abhiram Reddy , P. Raj Kumar, T. Harish, ―Partial Replacement
Of Cement And Fine Aggregate With Metakaolin And Manufactured Sand‖,
International Journal of Civil Engineering and Technology , Vol no. 9, Issue 5, pp
9–15, May 2018.
105
[40] B. A. Alabadan, M. A. Olutoye, M. S. Abolarin, M. Zakariya, ―Partial Replacement
Of Ordinary Portland Cement (OPC) With Bambara Groundnut Shell Ash (BGSA)
In Concrete‖, Federal University of Technology, Minna, Nigeria
[41] IS: 12269-2004, Specifications of Ordinary Portland cement 53 Grade, Bureau of
Indian Standards, New Delhi.
[42] IS: 2386 (Part 3) (1963) Methods of testing for aggregates for concrete, specific
Gravity, Density, Absorption and Organic Impurities. Bureau of Indian Standards,
New Delhi.
[43] IS: 383 (1970) Specification for coarse and fine aggregate from natural sources of
concrete. Bureau of Indian Standards, New Delhi.
[44] Nan su, Kung-Chung Hsu, His-wen Chai, ―A simple mix design method for self-
compacting concrete‖, Journal of Cement Concrete research. Vol no. 3, issue 2, pp
1799-1807, December 2001.
[45] EFNARC (February 2002), Specifications and Guidelines of Self-Compacting
concrete, European Federation of Natural Trade associations representing producers
and applicators of specialist building products.
[46] IS: 516 (1959) Indian Standard code practice – Methods of test for Strength of
concrete. Bureau of Indian Standards, New Delhi.
[47] IS: 5816 (1999) Methods of Test for Splitting Tensile Strength of concrete. Bureau
of Indian Standards, New Delhi.
[48] IS: 383 (1987), Indian Standard Code of practice for specification for coarse and
fine aggregates from natural sources of concrete. Bureau of Indian Standards, New
Delhi.
[49] Hardened concrete. Annual book of ASTM Standards.
[50] IS: 9103 (1999) Indian Standard code practice-Concrete Admixtures-Specification.
Bureau of Indian Standards, New Delhi.

106
[51] Obilade, I.O., ―Use of rice husk ash as partial replacement for cement in concrete‖,
International Journal of Engineering and Applied Sciences, Vol no. 5, Issue 4, pp
11-16, September 2014.
[52] Makarand Suresh Kulkarni, Paresh Govind, Mirgal, Prajyot Prakash Bodhale, S.N.
Tande, ―Effect of Rice Husk Ash on the Properties of concrete‖, Journal of Civil
Engineering and Environmental Technology, Vol no. 1, pp 26-29, August 2014.
[53] Effect of Rice Husk Ash on the Properties of concrete. Print ISSN 2349-8404,
Online ISSN 2349-879 X , Vol no 1, pp 26-29, August 2014.
[54] P. Ramanathan, I. Baskar, P. Muthupriya, and R. Venkatasubramani, ―Performance
of Self-Compacting concrete containing different Minerals Admixtures‖, KSCE
Journal of Civil Engineering, Vol no. 17, issue 2, pp 465-472, March 2013.
[55] Kartini K, ―Rice Husk Ash-Pozzolanic material for sustainability‖, International
Journal of Applied Science and Technology, Vol no. 1, issue 6, pp 169-179,
November 2011.
[56] Ha Thanh, Sang Thanh Nguyen, ―A study on high performance fine grained
concrete containing Rice Husk Ash‖, International Journal of Concrete Structures
and Materials, Vol no. 8, issue 4, pp 301-307, March 2014.
[57] Rinku Kumar, Kavita Sainin, ―Experimental study on properties of self-compacting
concrete with Rice Husk Ash and Fibre‖, International Journal for Innovative
Research in Science, Vol no. 4, issue 10, pp 98-105, October 2015. Okamura H.,
Ouchi M., ―Self Compacting concrete, development present use and future‖.
RILEM, Symposium Stockholm, RILEM publications, pp 3-14, 1999.
107
Publications
[1] Sanket R. Jagtap, Shashi Ranjan Pandey, ―Flexural Behaviour of Self-Compacting
Concrete with Partial Replacement of cement by Rice Husk Ash‖. [To be
Communicated]
Copyright © 2022 FDOKUMEN