Experimental Investigation on Self-Compacting Fiber ...
98
Experimental Investigation on Self-Compacting Fiber Reinforced Concrete Slabs Orod Zarrinkafsh Submitted to the Institute of Graduate Studies and Research in the partial fulfillment of the requirements for the Degree of Master of Science in Civil Engineering Eastern Mediterranean University February 2015 Gazimağusa, North Cyprus
-
Upload
khangminh22 -
Category
Documents
-
view
3 -
download
0
Transcript of Experimental Investigation on Self-Compacting Fiber ...
Experimental Investigation on Self-Compacting
Fiber Reinforced Concrete Slabs
Orod Zarrinkafsh
Submitted to the
Institute of Graduate Studies and Research
in the partial fulfillment of the requirements for the Degree of
Master of Science
in
Civil Engineering
Eastern Mediterranean University
February 2015
Gazimağusa, North Cyprus
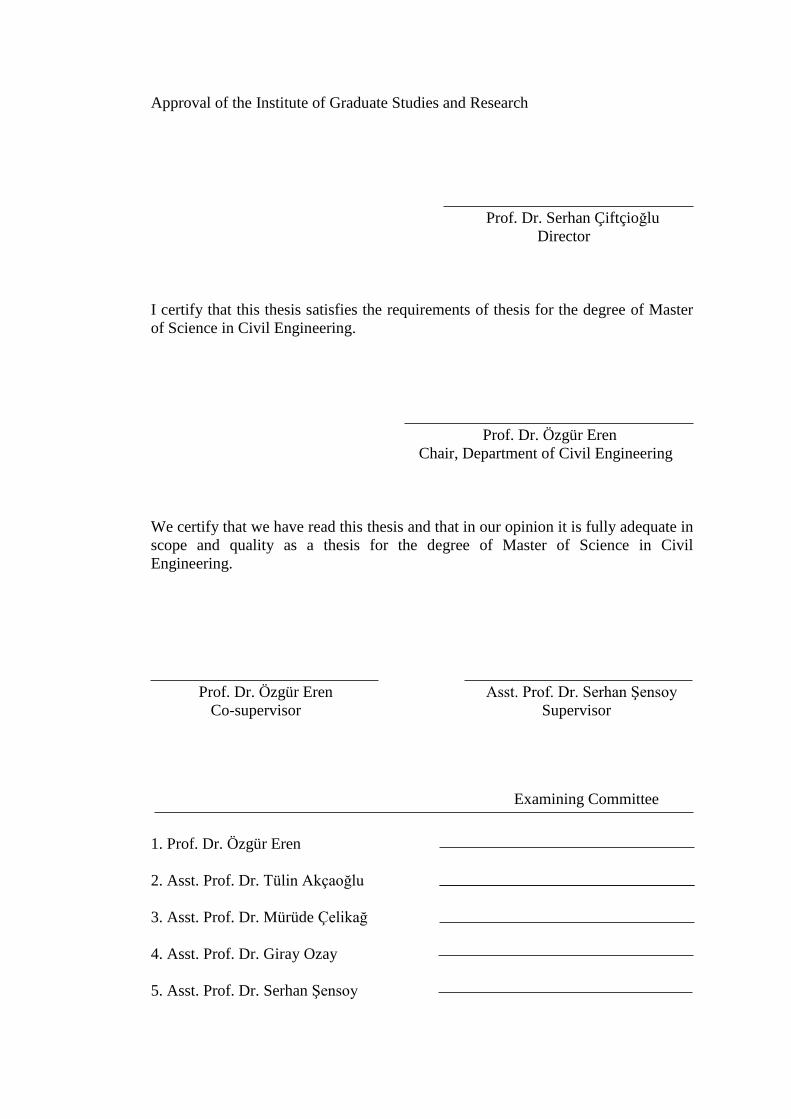
Approval of the Institute of Graduate Studies and Research
Prof. Dr. Serhan Çiftçioğlu
Director
I certify that this thesis satisfies the requirements of thesis for the degree of Master
of Science in Civil Engineering.
Prof. Dr. Özgür Eren
Chair, Department of Civil Engineering
We certify that we have read this thesis and that in our opinion it is fully adequate in
scope and quality as a thesis for the degree of Master of Science in Civil
Engineering.
Prof. Dr. Özgür Eren Asst. Prof. Dr. Serhan Şensoy
Co-supervisor Supervisor
Examining Committee
1. Prof. Dr. Özgür Eren
2. Asst. Prof. Dr. Tülin Akçaoğlu
3. Asst. Prof. Dr. Mürüde Çelikağ
4. Asst. Prof. Dr. Giray Ozay
5. Asst. Prof. Dr. Serhan Şensoy

iii
ABSTRACT
The purpose of this thesis is to determine the effect of steel fibers on mechanical
performance of traditionally reinforced self-competing concrete (SCC) slabs. The
design is based on flexural failure; subsequently the dimensions of slabs are
determined to prevent shear failure.
In this study, slabs designed for concrete classes of C20 and C40 with self-
compacting concrete in the dimensions of 2200×300×200 mm were tested. For each
type of mix, four different volume percentages of 60/30 (length/diameter) fiber
(0.0%, 1.0%, 1.5% and 2%) were used and it provided a total of 14 types of slab
models.
For these tests, an IPE 400 was used by two shafts beneath it for dividing the load in
two equal parts. Data Logger machine was used to crack the slabs by applying the
two point load in the middle of the slab. During the test, 4 strain sensors were placed
at the top and bottom of each slab and also a transducer was placed at the bottom
center of it.
According to the experimental tests which have been made in this investigation, the
result revealed that fibers can improve some properties of self-compacting concrete
such as flexural strength and enhance mechanical performance. By performing
flexural tests, slabs behavior were improved due to fiber influence on energy
absorption and flexural behavior. The results clearly showed that the use of fiber can
improve the post-cracking behavior. And also, fiber can increase the tensile strength
iv
by bridging through the cracks. Therefore, steel fibers increase the ductility and
energy absorption capacity of RC elements subjected to flexure.
Keywords: Self-Compacting Concrete, Steel Fibers, Flexural Strength, Reinforced
Concrete, Energy Absorption Capacity.

v
ÖZ
Bu çalışmanın amacı betona karıştrılan çelik liflerin kendinden yerleşen betonda
kullanılması ile üretilen kirişlerin mekanik özelliklerindeki değişikliklerin
belirlenmesidir. Kirişlerin ve plakların boyutları ise betonun eğilme dayanımı ve
kesme kuvvetleri esas alınarak tasarlanmıştır.
Tasarlanan beton sınıfı C20 ve C40 olarak düşünülmüş ve 2200x300x200 mm
boyutlarındaki plakalar üretilmiştir. Her bir karışımda 60/30 narinlik oranına sahip
tek tip ve dört değişik çelik lif hacmi (%0, %1, %1,5 ve %2) kullanılarak 14 değişik
plaka üretilmiştir. Deney düzeneği için IPE400 çelik kiriş ve yükleri iki eşit noktaya
dağıtmak amacı ile de iki Çelik silindir kullanıldı. Elde edilen yük, deplasman, birim
deformasyonlar data kayıt edici kullanıldı.
Deney sırasında, dört adet deformasyon ölçen sensor kullanılarak plakanın üzerinden
ve altından very toplanmıştır. Elde edilen sonuçlara balıkdığı zaman ise çelik liflerin
kendinden yerleşen beton ile üretilen plakaların eğilme dayanımını ve betonun
tokluk enerji emme kapasitesini iyileştirdiği görülmüştür. Bunun dışında yükleme
sırasında çatlak oluşumunun da çelik liflerin etkisi ile geciktiği açıkça görülmüştür.
Çelik lifler çatlaklar arasında köprü görevi görmekte ve çatlakların ilerlemesi
durmaktadır.
Anahta Kelimeler: kendinden yerleşen beton, çelik lif, eğilme dayanımı, betonarme
betonu, tokluk enerjisi.

vi
To My beloved Mother and Father

vii
ACKNOWLEDGMENT
Foremost, I would like to express my sincere gratitude to my supervisor Assistant
Professor Dr. Serhan Şensoy for the continuous support of my Master thesis study and
research, for his patience, enthusiasm, and immense knowledge.
Also, I had a great opportunity to get help from Professor Dr. Özgür Eren and I
acknowledge his advises for concrete mix-design. A special thanks to my dear mother
and father for their constant help throughout my education.
And thanks to my friends Hassan Moniri, Mohammad Golhashem and Mohesn
Ramezan Shirazi for their help my thesis.

viii
TABLE OF CONTENTS
ABSTRACT ................................................................................................................ iii
ÖZ ................................................................................................................................ v
ACKNOWLEDGMENT ............................................................................................ vii
LIST OF TABLES....................................................................................................... xi
LIST OF FIGURES .................................................................................................... xii
1 INTRODUCTION .................................................................................................... 1
1.1 Background ......................................................................................................... 1
1.2 Objective ............................................................................................................. 4
1.3 Scope ................................................................................................................... 4
1.4 Significance ......................................................................................................... 4
2 BACKGROUND INFORMATION AND LITERATURE REVIEW ....................... 5
2.1 Introduction ......................................................................................................... 5
2.2 Previous Studies .................................................................................................. 5
2.3 Mechanical Properties ......................................................................................... 8
2.3.1 Compressive Strength ................................................................................... 8
2.3.2 Toughness Tests ........................................................................................... 10
2.3.3 Cracking Behavior ...................................................................................... 11
2.5 Mix Design for SFRC ....................................................................................... 16
2.5.1 Workability .................................................................................................. 16
2.5.2 Test of workability/consistency ................................................................... 16
2.6 Previous Studies ................................................................................................ 20
2.6.1 SFRC Constitutive Concept in Compression .............................................. 20
2.6.2 Direct Tensile Tests ..................................................................................... 21
ix
2.7 Crack Patterns ................................................................................................... 22
2.8 Toughness .......................................................................................................... 27
3 METHODOLOGY .................................................................................................. 30
3.1 Introduction ....................................................................................................... 30
3.2 Experimental Module ........................................................................................ 30
3.2.1 Specimens Provision ................................................................................... 30
3.2.2 Evaluating of Required Load ...................................................................... 32
3.2.3 Concrete and Mix Design ............................................................................ 33
3.3 Sieve Analysis ................................................................................................... 34
3.4 Compressive Strength Test ................................................................................ 37
3.5 Testing Fresh SCC ............................................................................................. 38
3.5.1 Slump Flow and T50 Test ........................................................................... 38
3.5.2 L-box Test ................................................................................................... 39
3.5.2.1 Test Procedure .......................................................................................... 39
3.5.3 J-ring Test .................................................................................................... 40
3.5.3.1 Test Procedure .......................................................................................... 40
3.5.4 V-funnel Test ............................................................................................... 40
3.5.4.1 Test Procedure .......................................................................................... 41
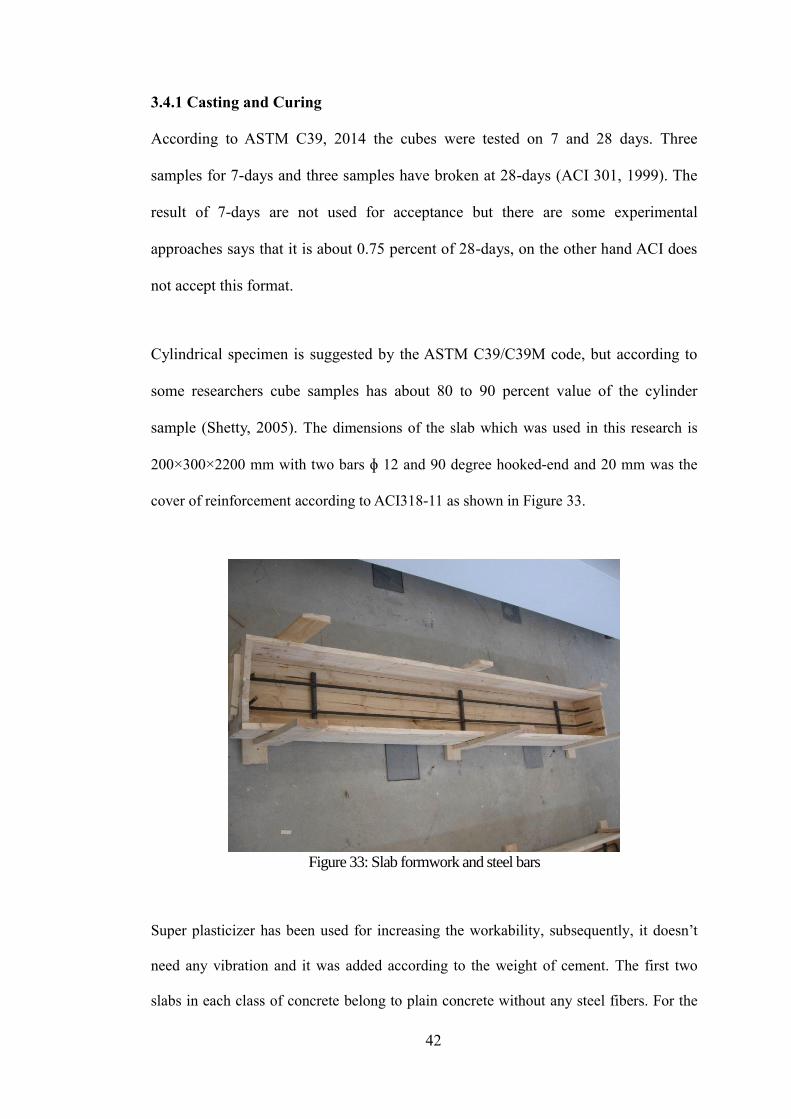
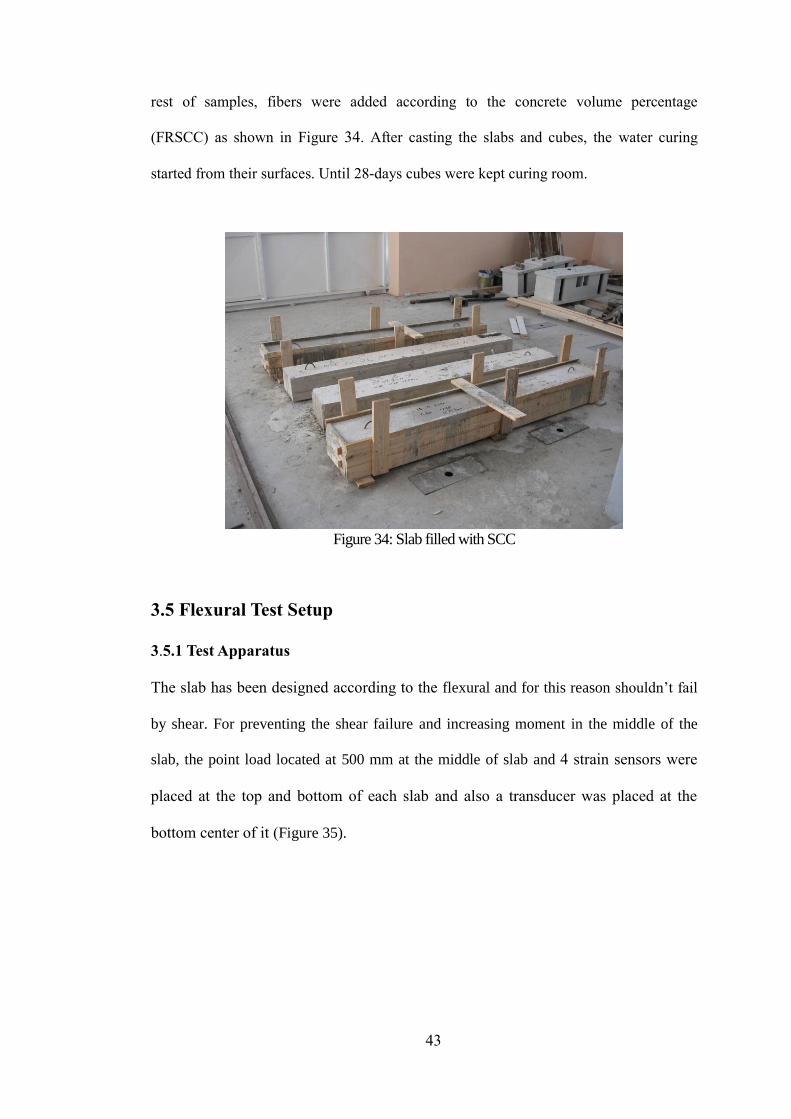
3.4.1 Casting and Curing ...................................................................................... 42
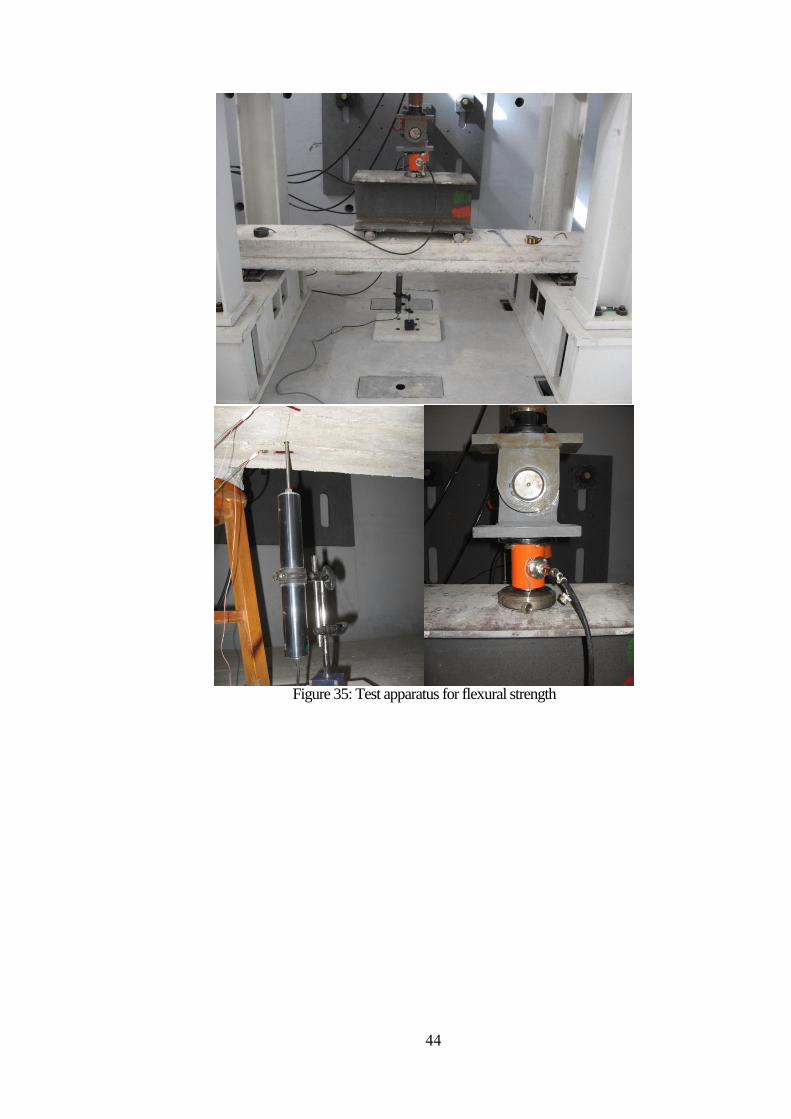
3.5 Flexural Test Setup ............................................................................................ 43
3.5.5 Test Apparatus ............................................................................................. 43
4 ANALYSIS, RESULTS AND DISCUSSION ......................................................... 45
4.1 Results of T50, Slump, L-box, V-Funnel and J-Ring ....................................... 45
4.2 Compressive Strength Test Results of Cubes .................................................... 46
4.3 Experimental Results of Flexural Test .............................................................. 46

x
4.3.1 TDS Setup ................................................................................................... 46
4.3.2 Slab with Different Percentage of Fibers for C40 Concrete .......................... 48
4.3.2.1 Mixture of 2% Super plasticizer for - 0% Fibers ..................................... 48
4.3.2.2 Mixture of 2% Super plasticizer for - 1% Fibers ..................................... 50
4.3.2.3 Mixture of 2% Super plasticizer for – 1.5% Fibers ................................. 52
4.3.2.4 Mixture of 2% Super plasticizer for – 2% Fiber ...................................... 53
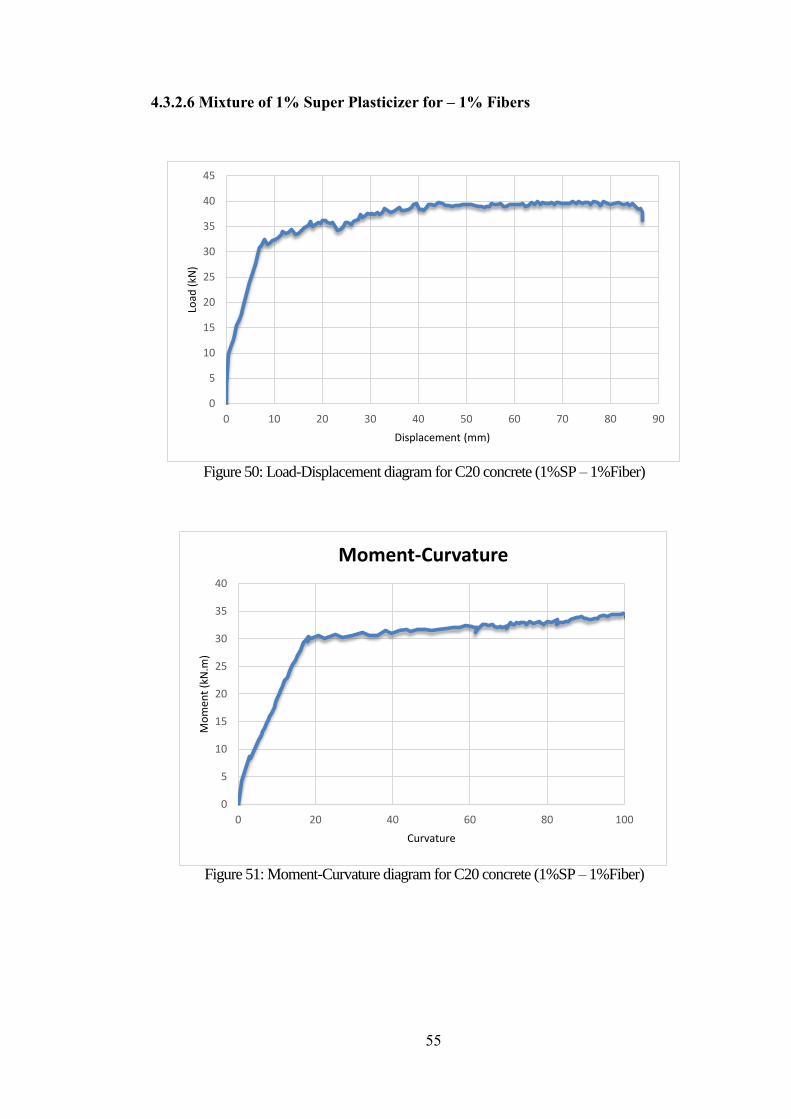
4.3.2.5 Mixture of 1% Super plasticizer for – 0% Fibers .................................... 54
4.3.2.6 Mixture of 1% Super plasticizer for – 1% Fibers .................................... 55
4.3.2.7 Mixture of 1% Super plasticizer for – 1.5% Fibers ................................. 56
4.3.2.8 Mixture of 1% Super plasticizer for – 2% Fibers .................................... 57
4.3.2.9 Moment-Curvature Comparison of C20 and C40 Concrete .................... 57
4.3.2.10 Load-Displacement Comparison of C20 and C40 Concrete .................. 59
4.3.2.11 Stress Strain Relationship ....................................................................... 60
5 CONCLUSION ....................................................................................................... 66
5.1 Conclusions ....................................................................................................... 66
5.2 Future Studies ................................................................................................... 67
REFERENCES ........................................................................................................... 68

xi
LIST OF TABLES
Table 1: SCC projects (Daczko, 2012) [16] ................................................................. 2
Table 2: Test method description (Banthia, 2012) [39] .............................................. 11
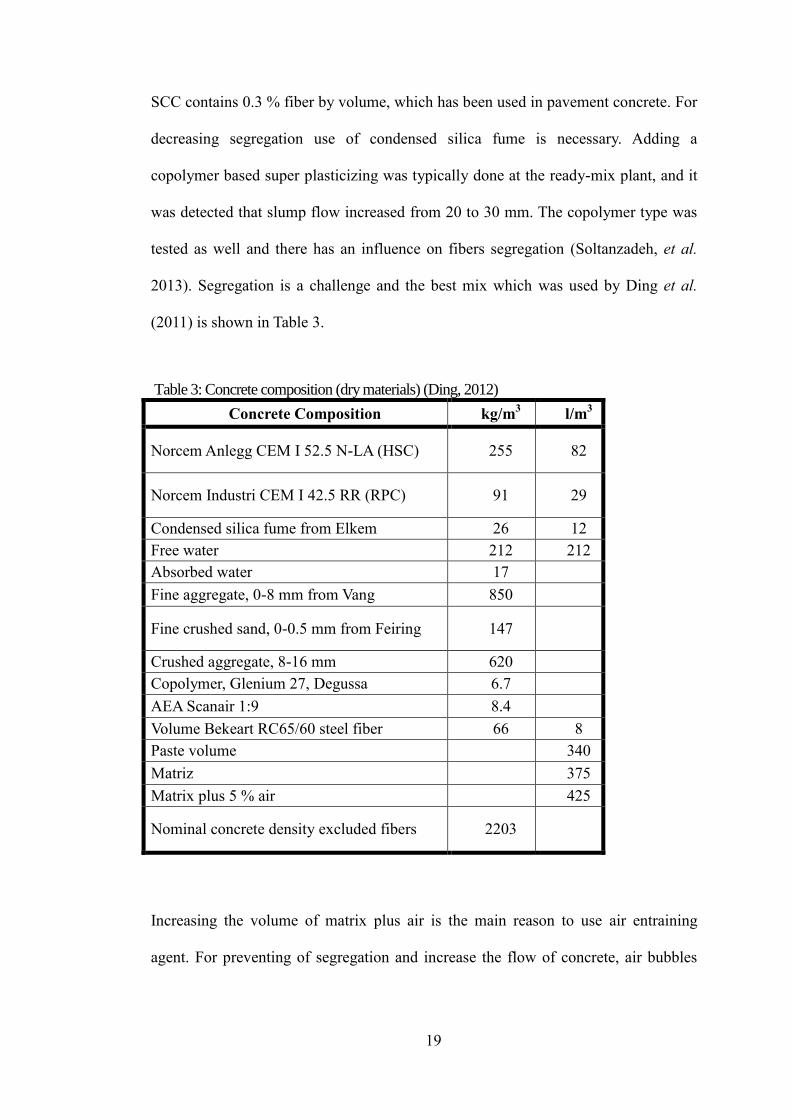
Table 3: Concrete composition (dry materials) (Ding, 2012) [82] ............................. 19
Table 4: Effect of fiber reinforcement on cracking observed at the failure level ....... 23
Table 6: Steel fibers characteristics ............................................................................ 33
Table 7: Sieve analysis for 20mm D max of aggregate ................................................ 35
Table 8: Sieve analysis for 14 mm D max of aggregate ............................................... 35
Table 9: Sieve analysis for 10 mm of aggregate ........................................................ 35
Table 10: Sieve analysis for 5 mm of fine aggregate ................................................. 36
Table 11: Sieve analysis for 5 mm of aggregate ........................................................ 36
Table 12: Mix design for C20 Concrete ..................................................................... 37
Table 13: Mix design for C40 Concrete ..................................................................... 37
Table 14: Compressive strength test results for cube samples of C20 ....................... 38
Table 15: Compressive strength test results for cube samples of C40 ....................... 38
Table 16: Workability test results of Self-Compacting Concrete ............................... 45
Table 17: Compressive strength results of cubes (MPa) ............................................ 46
Table 18: Energy absorption ...................................................................................... 60

xii
LIST OF FIGURES
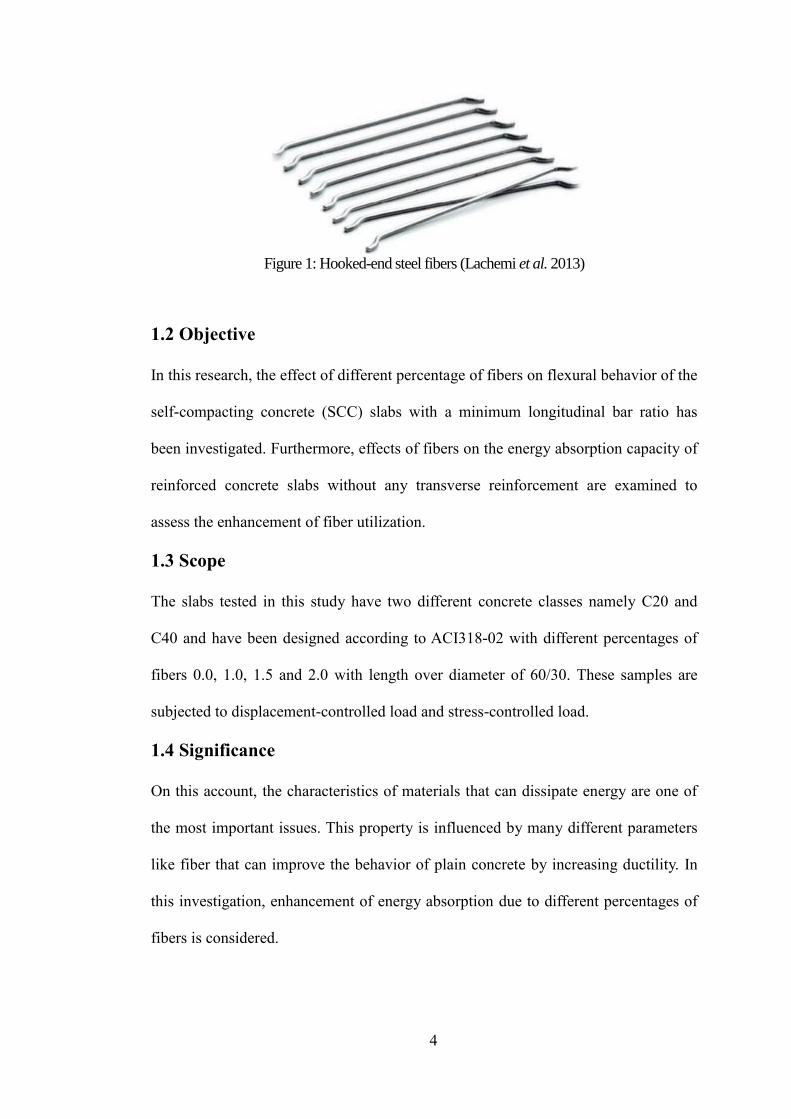
Figure 1: Hooked-end steel fibers (Lachemi et al. 2013) ............................................ 4
Figure 2: Effect of fibers and failure mechanism (Nataraja, 2011) .............................. 6
Figure 3: VeBe time vs fiber content with different sizes of aggregate (Endgington et
al. 1974) ....................................................................................................................... 7
Figure 4: Effect of aspect ratio of fiber on compacting factor (Endgington et al.
1974) ............................................................................................................................ 7
Figure 5: Stress-Strain curves in compression for SFRC (Johnston, 1997) ................. 8
Figure 6: SFRC before and after appearing of crack bridging (right) and macro crack
(left) (Banthia, 2012) .................................................................................................... 9
Figure 7: Crack of plastic shrinkage (left) and crack width (right) (Banthia, 2012) . 10
Figure 8: Crack pattern (Vandewalle, 2000) .............................................................. 12
Figure 9: Average crack spacing (Vandewalle, 2000) ................................................ 12
Figure 10: Distribution of stress in cracked section. (Vandewalle, 2000) ................. 14
Figure 11: Tensile stress calculation (Vandewalle, 2000) .......................................... 14
Figure 12: Relationship, between inverted cone time, VeBe time and slump (Nataraja,
2011)........................................................................................................................... 17
Figure 13: VeBe time vs fibers percentage (Nataraja, 2011) ..................................... 17
Figure 14: Average Load-Deflection at the mid-span (Soltanzadeh et al. 2013) ....... 18
Figure 15: Crack opening versus residual post-peak strength crack opening in a direct
tensile test on notched specimen (Fritih, 2013) ......................................................... 21
Figure 16: Crack pattern and loading levels on beams (Fritih et al. 2013) ................ 23
Figure 17: Failure and crack pattern of beams with 0.22% stirrup ratio (Ding et al.
2012) .......................................................................................................................... 25

xiii
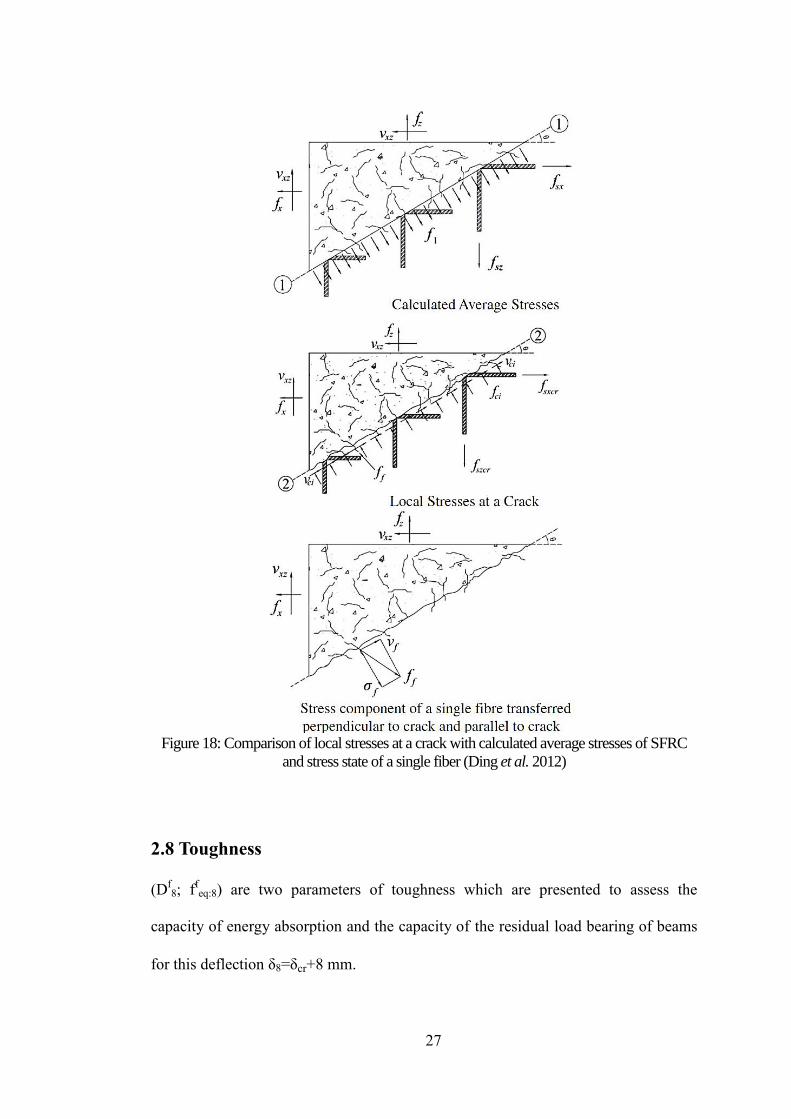
Figure 18: Comparison of local stresses at a crack with calculated average stresses of
SFRC and stress state of a single fiber (Ding et al. 2012) ......................................... 27
Figure 19: Load vs deflection responses in beams with diverse stirrup ratios (Ding et
al. 2012) ..................................................................................................................... 28
Figure 20: Increase of toughness factor for beams with various reinforcements (Ding
et al. 2012) ................................................................................................................. 29
Figure 21: IPE and slab deformation ......................................................................... 31
Figure 22: Dimensions of plate, shaft and IPE .......................................................... 31
Figure 23: Load capacity of SCC ............................................................................... 32
Figure 24: Formwork construction and bars .............................................................. 34
Figure 25: Sieve analysis ........................................................................................... 34
Figure 26: Sieve analysis for coarse aggregate .......................................................... 36
Figure 27: Sieve analysis graph fine aggregate.......................................................... 37
Figure 28: Slump and T50 tests ................................................................................. 39
Figure 29: L-box test .................................................................................................. 39
Figure 30: J-ring test .................................................................................................. 40
Figure 31: V funnel equipment .................................................................................. 41
Figure 32: V funnel test .............................................................................................. 41
Figure 33: Slab formwork and steel bars ................................................................... 42
Figure 34: Slab filled with SCC ................................................................................. 43
Figure 35: Test apparatus for flexural strength .......................................................... 44
Figure 36: Test apparatus (load cell and IPE 400) ..................................................... 47
Figure 37: Test apparatus (load cell, IPE400, and transducer) ................................... 47
Figure 38: Load-Displacement diagram for C40 concrete (2%SP-0%Fiber) ............ 48
Figure 39: Crack pattern for concrete C40 (2%SP-0%Fiber) .................................... 49

xiv
Figure 40: Moment-Curvature diagram for C40 concrete (2%SP - 0%Fiber) ........... 50
Figure 41: Load-Displacement diagram for C40 concrete (2%SP - 1%Fiber) .......... 50
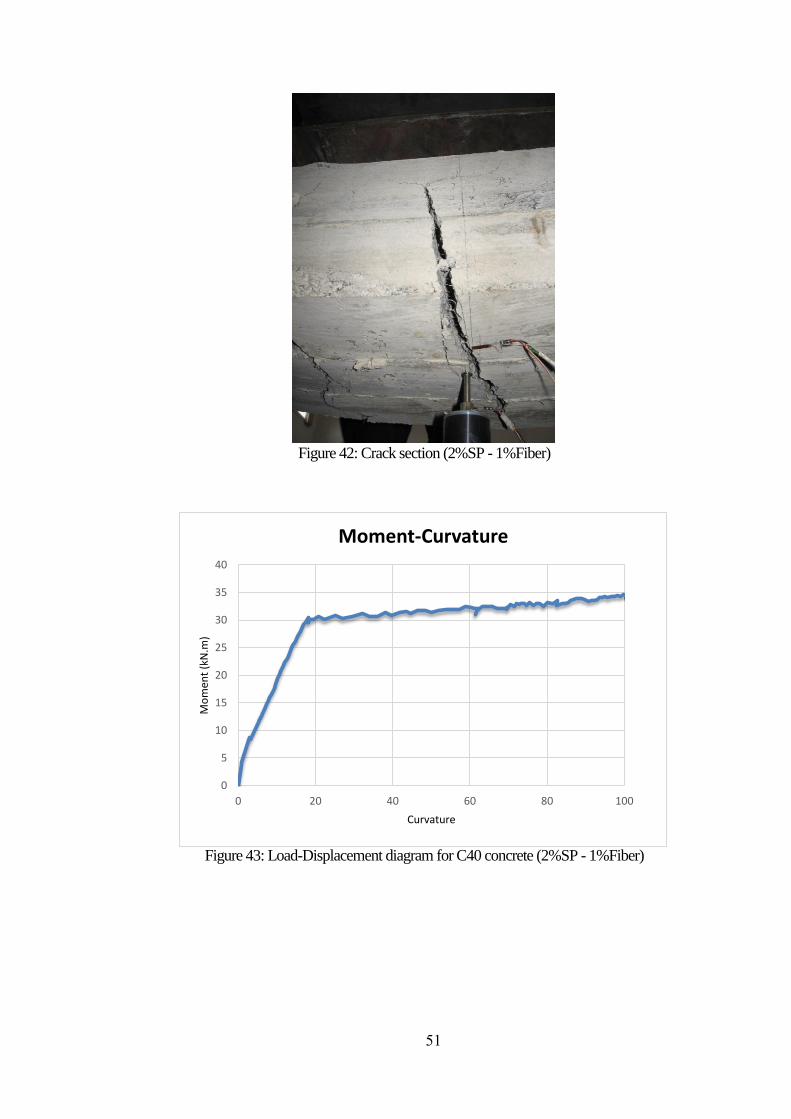
Figure 42: Crack section (2%SP - 1%Fiber) .............................................................. 51
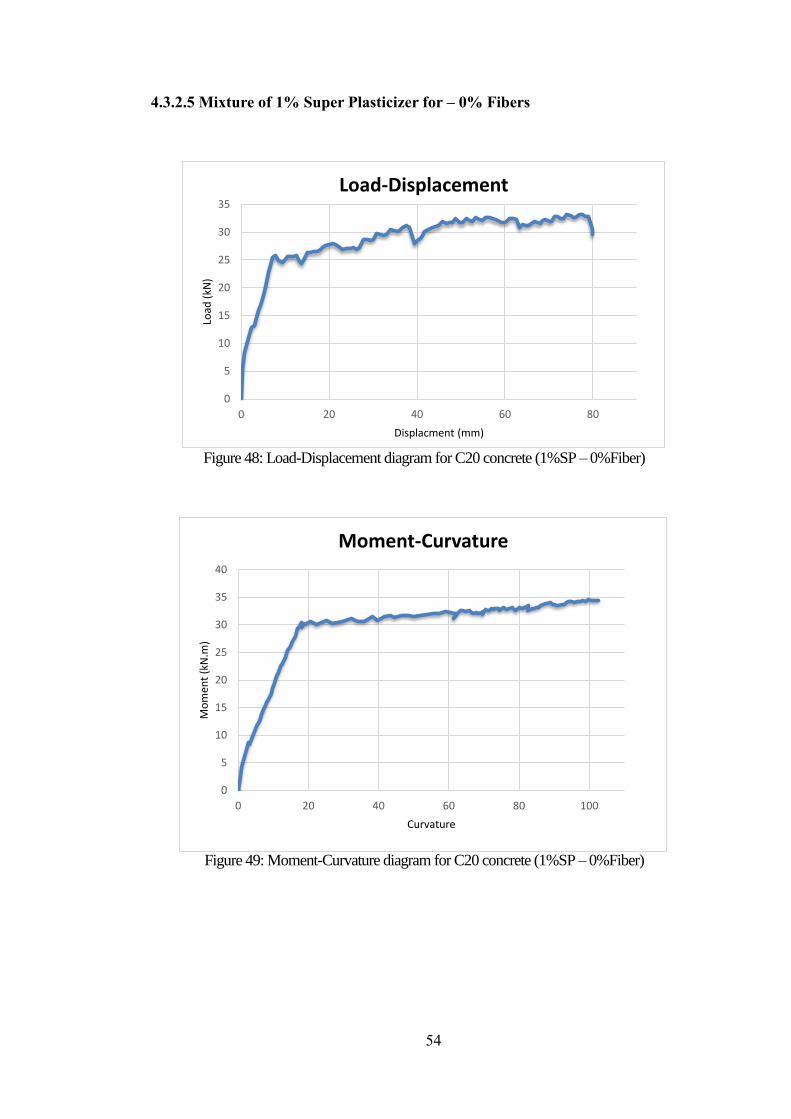
Figure 43: Load-Displacement diagram for C40 concrete (2%SP - 1%Fiber) .......... 51
Figure 44: Load-Displacement diagram for C40 concrete (2%SP – 1.5%Fiber) ....... 52
Figure 45: Load-Displacement diagram for C40 concrete (2%SP – 1.5%Fiber) ....... 52
Figure 46: Load-Displacement diagram for C40 concrete (2%SP – 2%Fiber).......... 53
Figure 47: Moment-Curvature diagram for C40 concrete (2%SP – 2%Fiber) .......... 53
Figure 48: Load-Displacement diagram for C20 concrete (1%SP – 0%Fiber).......... 54
Figure 49: Moment-Curvature diagram for C20 concrete (1%SP – 0%Fiber) .......... 54
Figure 50: Load-Displacement diagram for C20 concrete (1%SP – 1%Fiber).......... 55
Figure 51: Moment-Curvature diagram for C20 concrete (1%SP – 1%Fiber) .......... 55
Figure 52: Load-Displacement diagram for C20 concrete (1%SP – 1.5%Fiber) ....... 56
Figure 53: Moment-Curvature diagram for C20 concrete (1%SP – 1.5%Fiber) ....... 56
Figure 54: Load-Displacement diagram for C20 concrete (1%SP – 2%Fiber).......... 57
Figure 55: Moment-Curvature diagram for C20 concrete (1%SP – 2%Fiber) .......... 57
Figure 56: Moment-Curvature diagram C20.............................................................. 58
Figure 57: Moment-Curvature diagram C40.............................................................. 58
Figure 58: Load-Displacement diagram C20 ............................................................. 59
Figure 59: Load-Displacement diagram C40 ............................................................. 59
Figure 60: Load-Displacement diagram C20 and C40 0% Fiber ............................... 61
Figure 61: Load-Displacement diagram C20 and C40 1% Fiber ............................... 61
Figure 62: Load-Displacement diagram C20 and C40 1.5% Fiber ............................ 62
Figure 63: Load-Displacement diagram C20 and C40 2% Fiber ............................... 62
Figure 64: Core sample for Stress-Strain curvature ................................................... 63

xv
Figure 65: Stress-Strain curvature for C20 ................................................................ 63
Figure 66: Stress-Strain curvature C40 ...................................................................... 64
Figure 67: Fibers for bridging cracks ......................................................................... 65

xvi
LIST OF ABBREVIATIONS
FRC Fibrous Reinforced Concrete
SFRC Steel Fibrous Reinforced Concrete
SCC Self Compacting Concrete
FRSCC Fibrous Reinforced Self Compacting Concrete
HPFRC High Performance Fiber Reinforced Concrete

xvii
LIST OF SYMBOLS
ρ Tensile reinforcement ratio
ƒʹc Compressive strength of concrete
l/d Aspect ratio of fibers
vƒ Fiber amount of concrete
a/d Ratio of span-depth
ɸ Bar size
σs Tension stress in reinforcement according to a cracked section
σsr Tension stresses according to the first crack
δ Deflection in pure bending zone
K0 Corrected gauge factor
r Total resistance of load wires
L Length of load wires (m)
K Gauge factor
R Gauge resistance
Cs Strain sensor coefficient
1
Chapter 1
1 INTRODUCTION
1.1 Background
Self-compacting concrete (SCC) doesn’t need to vibrator, due to the compacting
ability by its own weight without vibration. In addition, SCC can reduce construction
time and labor cost (Hossain et al. 2013).
SCC has been developed in 1980s to overcome the steel bar congestion in active
seismic regions (Ozawa et al. 1989). Researches on SCC continues through the last
decades (Ozawa et al. 1989, Rols et al. 1999, Bui et al. 2002, Lachemi et al. 2003,
Lachemi et al. 2004). The use of fibers in SCC improves the mechanical properties
and durability of hardened concrete such as impact strength, flexural strength, and
vulnerability to cracking, resistance to fatigue, toughness and spelling (ACI 544
1990, Nehdi et al. 2004, Tlemat et al. 2003, Malhotra et al. 1994, Nanni, 1988).
Initially, the idea of SCC appeared for using in inaccessible areas and underwater
structures (Gaimster, & Dixon, 2003). Self-compacting concrete has been developed
more in recent years, but total productions are still less than the conventional
concrete (Sarmiento, 2010-2011). In Netherland, about 70% of precast concrete was
SCC in 2005; however, this proportion in Denmark was just 30% of conventional
concrete (Geiker, 2008).

2
Table 1 shows some of the projects that SCC was used. The SCC usage has varieties
such as cast-in-place or precast, complicated buildings or simple, small or big
structures, vertical or horizontal members (Yakhlaf, 2013).
In the U.S, the use of SCC is nearly 40% in precast production (Daczko, 2012).
Recently, the usage of SCC widened to repair materials in Switzerland and Canada
(ACI 237R-07 2007, EFNARC 2002).
Table 1: SCC projects (Daczko, 2012)
Location Cast –in-place or
Precast Project
Volume of
concrete
(m3)
Japan Cast –in-place LNG storage tank 12,000
Japan Cast –in-place Water purification
plant 200,000
Japan Cast –in-place MMST tunneling 8000
USA Cast –in-place National Museum of
the American Indian 23,000
Canada
Reaction Wall,
University of
Sherbrook
Korea Cast –in-place Diaphragm wall for in
ground LNG tank 32,800
Canada Cast –in-place Fill abandoned pump
station in mine
USA Cast –in-place LNG storage tank 25,000
Italy Cast –in-place Foundations and slabs
for housing 123,000
USA Cast –in-place Double tee production
New
Zealand Cast –in-place Precast beams

3
The shear resistance of fiber reinforced concrete generally depends on tensile
reinforcement ratio (ρ), compressive strength of concrete (ƒʹc), the ratio of span-depth
(a/d), the fiber amount of concrete (vƒ) and aspect ratio of fibers (l/d) (EFNARC
2002). Fibers provide further resistance against crack development by creating
bridges through cracks (Narayanan, & Darwish, 1987, Li et al. 1992, Lim, & Oh,
1999). Therefore, steel fibers in the reinforced concrete change the behavior from
brittle to ductile and increase the shear capacity (Mansur et al. 1986), (Ramakrishna,
& Sundararajan, 2005). Limiting the tensile crack to a certain location and
preventing of excessive diagonal tensile cracking are other advantages of steel fiber
(Choi, & Park, 2007).
The advantages of both SCC and SFRC are gathered in FRSCC (Fiber-reinforced
self-compacting concrete) which is a recent composite material. FRSCC can enhance
two weaknesses: the workability which is effected by fibers in SFRC and increase
the resistance against the crack in plain concrete (Aslani, & Nejadi, 2013). Fibers
made of glass, carbon, plastic, polymer, and steel (Figure 1) or rubber can be used to
produce FRC (Lachemi et al. 2013). The investigation has been leading to the
development of SCC (FRSCC), which lead to the greater ductility, durability and
mechanical features, of FRC with the workability of ordinary SCC (Ozawa et al.
1989, Khayat et al. 2000, Ding et al. 2008, Sahmaran, et al. 2005, Aydin, 2007).
4
Figure 1: Hooked-end steel fibers (Lachemi et al. 2013)
1.2 Objective
In this research, the effect of different percentage of fibers on flexural behavior of the
self-compacting concrete (SCC) slabs with a minimum longitudinal bar ratio has
been investigated. Furthermore, effects of fibers on the energy absorption capacity of
reinforced concrete slabs without any transverse reinforcement are examined to
assess the enhancement of fiber utilization.
1.3 Scope
The slabs tested in this study have two different concrete classes namely C20 and
C40 and have been designed according to ACI318-02 with different percentages of
fibers 0.0, 1.0, 1.5 and 2.0 with length over diameter of 60/30. These samples are
subjected to displacement-controlled load and stress-controlled load.
1.4 Significance
On this account, the characteristics of materials that can dissipate energy are one of
the most important issues. This property is influenced by many different parameters
like fiber that can improve the behavior of plain concrete by increasing ductility. In
this investigation, enhancement of energy absorption due to different percentages of
fibers is considered.
5
Chapter 2
2 BACKGROUND INFORMATION AND LITERATURE
REVIEW
2.1 Introduction
Researches have been done on FRSCC (Fiber Reinforcement Self-Compacting
Concrete) which can divide into two different fields, material serviceability and
mechanical investigations. The mechanical aspect of FRSCC has been studied by
several researchers to provide the constitutive models of shear and flexure capacity,
tensile or compressive zone data. In this part, major studies on FRSCC are reviewed
to prepare an adequate background of FRSCC (Pir, 2013).
2.2 Previous Studies
The fibers that are commercially used in civil engineering applications are steel
(SFRC/SFRS), aramid, carbon and glass. The propagation of steel fibers promotes
the controlling of micro-cracks. First they improve the overall resistance of the
matrix and secondly by bridging through smaller cracks, thus decrease the growth of
major cracks (Figure 2).

6
Figure 2: Effect of fibers and failure mechanism (Nataraja, 2011)
Researchers studied steel fiber self-compacting concrete (SFSCC) and fiber
reinforced concrete (FRC) to find out the characteristics of post-cracking behavior
and workability. By using SFSCC the costs and construction period reduces
significantly and its ability to place irregular section in terms of congestion of
stirrups and bars and thin section is another great aspect (Nataraja, 2011).
The consequence of this capability is to arrest cracks and, fiber in mixtures increased
tensile strength, both at ultimate and at first crack, especially under flexural loading.
The other ability of fibers is to hold a matrix after extensive cracking. The transition
failure from brittle to ductile is another ability of fibers which can absorb energy and
survive under impact loading.
The fibers types, percentage and orientation of fibers effects the workability, and the
workability can be decreased by increasing the quantity and size of aggregate
(greater than 5 mm). On the other hand, the aggregate less than 5 mm has little effect
on mix compaction (Chanh, 2007). Figure 3 illustrates the effects of aggregate size
on the VeBe time.

7
Figure 3: VeBe time vs fiber content with different sizes of aggregate (Endgington et al. 1974)
On the second stage, the aspect ratio of fibers has a key effect on the workability. The
workability is reduced by the increasing aspect ratio. Figure 4 presented the effect of
aspect ratio of fibers on the workability in terms of compacting factor.
Figure 4: Effect of aspect ratio of fiber on compacting factor (Endgington et al. 1974)
One of the main problems to produce a uniform fiber distribution is the trend for
fibers to clamp or ball together. Clamping can be initiated by the following factors:
The fibers might be clamped before adding to the mix and the normal mixing
action cannot break down its clamp.
8
Fibers might be added quickly and doesn’t allow scattering in the mixer.
The high volume of fibers can cause clamping.
It is worth to mention that, adding water is only for improving the workability with
great care. In the SFRC further water might increase the slump, without increasing its
workability.
2.3 Mechanical Properties
2.3.1 Compressive Strength
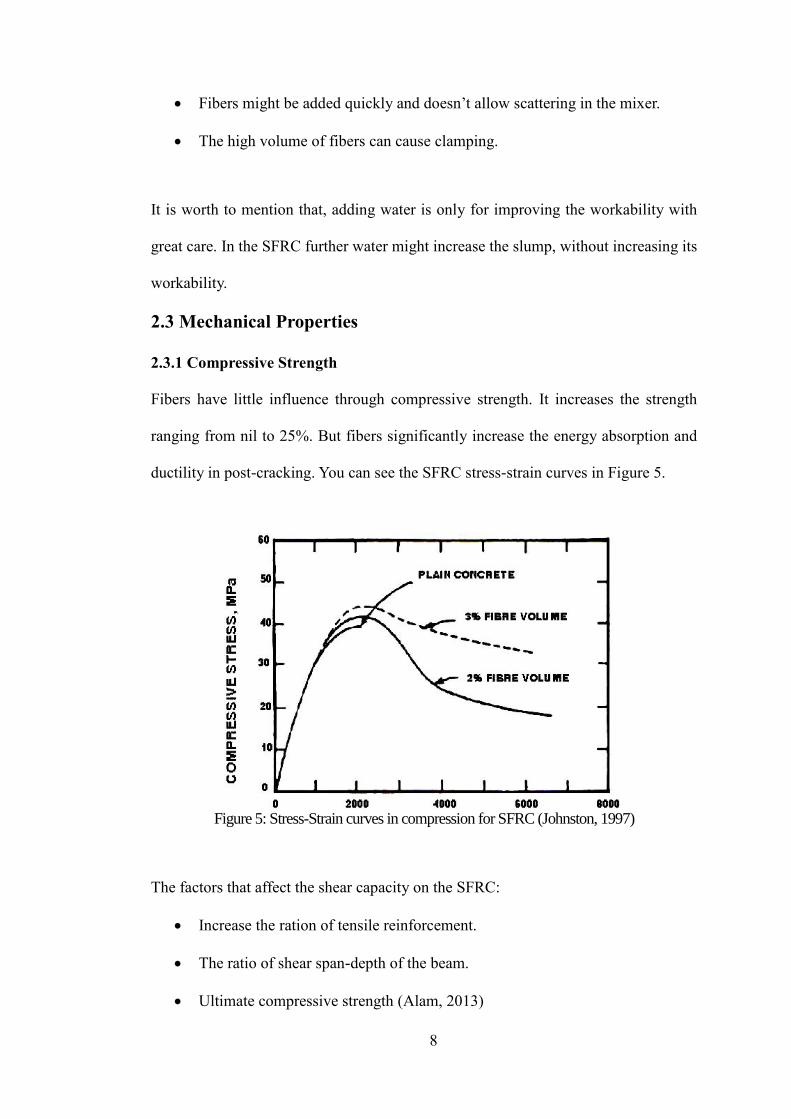
Fibers have little influence through compressive strength. It increases the strength
ranging from nil to 25%. But fibers significantly increase the energy absorption and
ductility in post-cracking. You can see the SFRC stress-strain curves in Figure 5.
Figure 5: Stress-Strain curves in compression for SFRC (Johnston, 1997)
The factors that affect the shear capacity on the SFRC:
Increase the ration of tensile reinforcement.
The ratio of shear span-depth of the beam.
Ultimate compressive strength (Alam, 2013)

9
By bonding fibers properly in hardened concrete, interact with the matrix at micro-
cracks level and successfully bridge through the cracks can transfer stress and delay
the unstable growth (Figure 6).
Figure 6: SFRC before and after appearing of crack bridging (right) and macro crack (left) (Banthia, 2012)
Quickly after placement, the evaporation of water in concrete start and the
autogenous procedure of concrete hydration cause shrinkage strains. If controlled,
this contraction could cause stresses more than those required to cause cracking.
However, plastic shrinkage cracks stay as a serious concern, mainly in a large area
like slabs, on thin surface repairs, shotcrete linings and patching (Banthia, 2012).
When combined with post-crack bridging capability of fibers, fibers reduce crack
widths and cracks, areas when concrete is restrained (Banthia, 1994) (Figure 7).
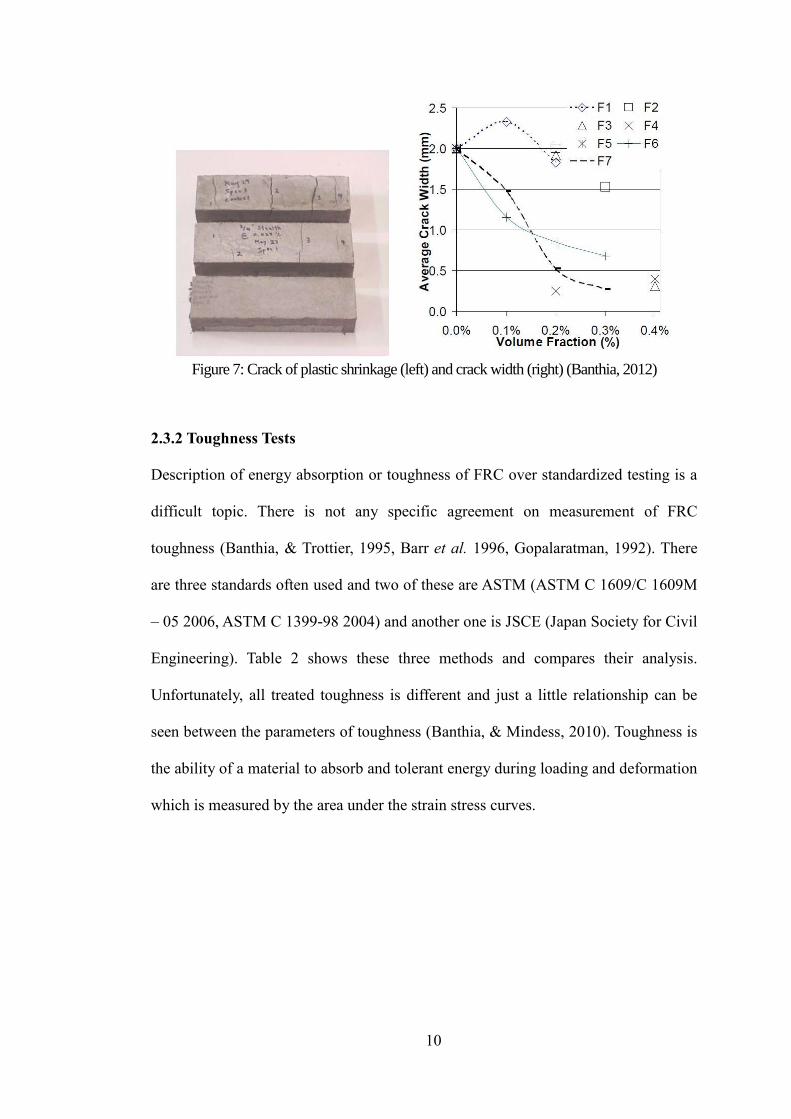
10
Figure 7: Crack of plastic shrinkage (left) and crack width (right) (Banthia, 2012)
2.3.2 Toughness Tests
Description of energy absorption or toughness of FRC over standardized testing is a
difficult topic. There is not any specific agreement on measurement of FRC
toughness (Banthia, & Trottier, 1995, Barr et al. 1996, Gopalaratman, 1992). There
are three standards often used and two of these are ASTM (ASTM C 1609/C 1609M
– 05 2006, ASTM C 1399-98 2004) and another one is JSCE (Japan Society for Civil
Engineering). Table 2 shows these three methods and compares their analysis.
Unfortunately, all treated toughness is different and just a little relationship can be
seen between the parameters of toughness (Banthia, & Mindess, 2010). Toughness is
the ability of a material to absorb and tolerant energy during loading and deformation
which is measured by the area under the strain stress curves.
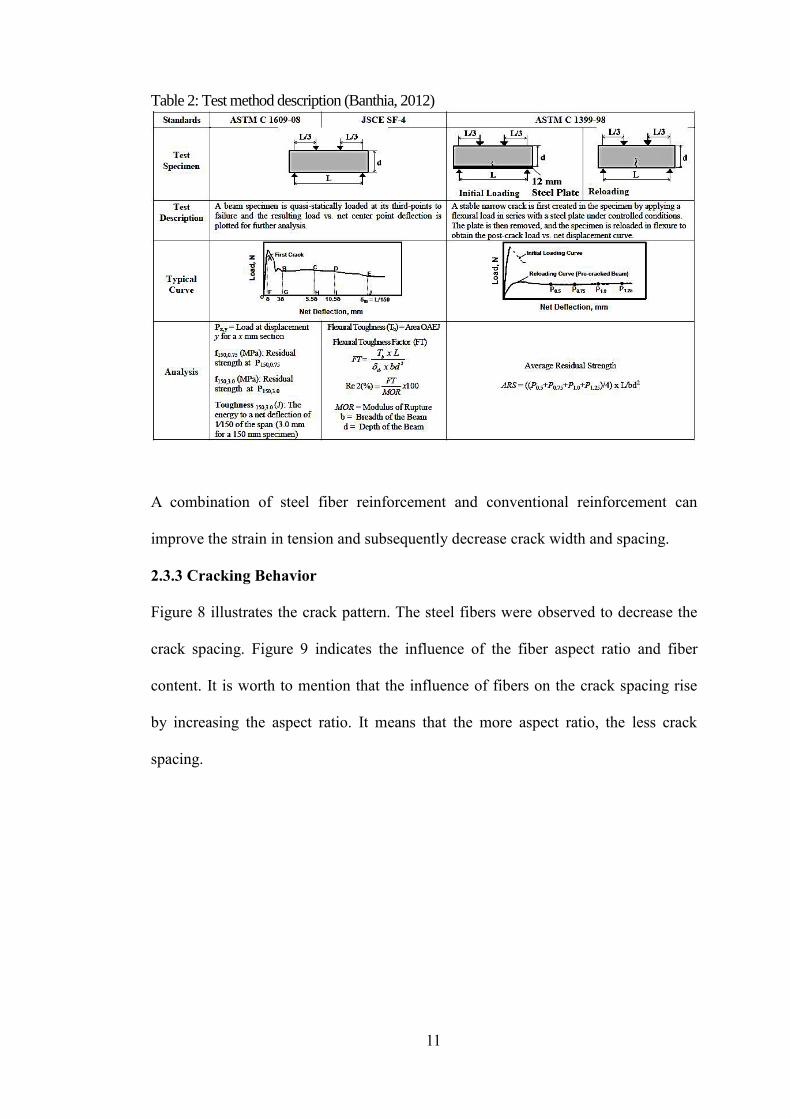
11
Table 2: Test method description (Banthia, 2012)
A combination of steel fiber reinforcement and conventional reinforcement can
improve the strain in tension and subsequently decrease crack width and spacing.
2.3.3 Cracking Behavior
Figure 8 illustrates the crack pattern. The steel fibers were observed to decrease the
crack spacing. Figure 9 indicates the influence of the fiber aspect ratio and fiber
content. It is worth to mention that the influence of fibers on the crack spacing rise
by increasing the aspect ratio. It means that the more aspect ratio, the less crack
spacing.

12
Figure 8: Crack pattern (Vandewalle, 2000)
Figure 9: Average crack spacing (Vandewalle, 2000)
13
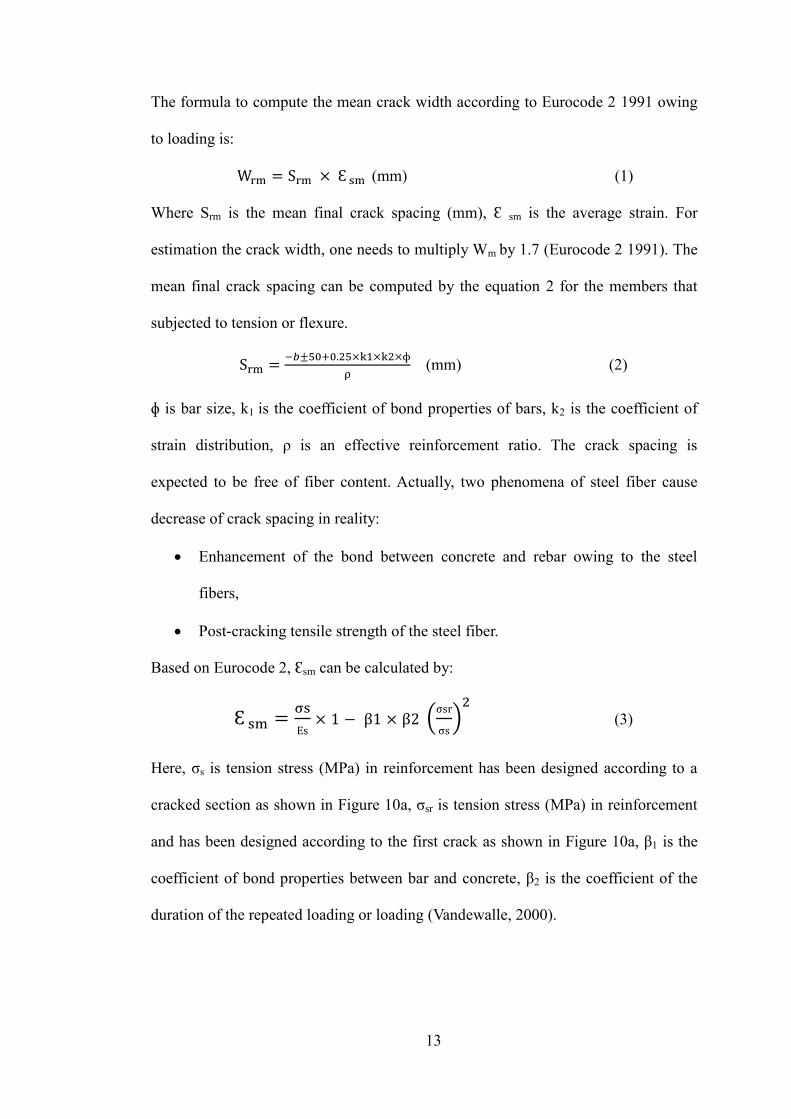
The formula to compute the mean crack width according to Eurocode 2 1991 owing
to loading is:
Wrm = Srm × Ɛ sm (mm) (1)
Where Srm is the mean final crack spacing (mm), Ɛ sm is the average strain. For
estimation the crack width, one needs to multiply Wm by 1.7 (Eurocode 2 1991). The
mean final crack spacing can be computed by the equation 2 for the members that
subjected to tension or flexure.
Srm =−𝑏±50+0.25×k1×k2×ɸ
ρ (mm) (2)
ɸ is bar size, k1 is the coefficient of bond properties of bars, k2 is the coefficient of
strain distribution, ρ is an effective reinforcement ratio. The crack spacing is
expected to be free of fiber content. Actually, two phenomena of steel fiber cause
decrease of crack spacing in reality:
Enhancement of the bond between concrete and rebar owing to the steel
fibers,
Post-cracking tensile strength of the steel fiber.
Based on Eurocode 2, Ɛsm can be calculated by:
Ɛ sm =σs
Es× 1 − β1 × β2 (
σsr
σs)
2
(3)
Here, σs is tension stress (MPa) in reinforcement has been designed according to a
cracked section as shown in Figure 10a, σsr is tension stress (MPa) in reinforcement
and has been designed according to the first crack as shown in Figure 10a, β1 is the
coefficient of bond properties between bar and concrete, β2 is the coefficient of the
duration of the repeated loading or loading (Vandewalle, 2000).

14
Figure 10a and b show the cross-section without and with fiber respectively. Due to
the less influence of fibers on pre cracking behavior, elastic behaviors in
compression for calculating Ɛsm in the cracked section has been assumed as shown in
Figure 10b (Nemegeer et al. 1995).
Figure 10: Distribution of stress in cracked section. (Vandewalle, 2000)
Figure 11: Tensile stress calculation (Vandewalle, 2000)
Figure 11 (a) shows a linear distribution of elastic stress, but actually, the distribution
of stress is different in reality. To calculate a realistic stress in the cracked region, the
next assumptions as given by Figure 11 (b):
The crack height = 0.9 h;
The tensile stress (σf) in the cracked region is constant.
15
There are some factors that can effect on the results, such as:
Fiber dosage and type
Fiber ratio to maximum aggregate size
Mixing and batching
Test size
Laboratory experience and equipment
Supposing all other things stay constant (concrete strength, dosage, fiber type,
mixing and batching etc.), the coefficient of variation in particular test method has
been directly related to the area of cracks in concrete (Ross, 2001). If the fiber
volume fraction is sufficiently high, this may result in an increase in the tensile
strength of the matrix (Banthia, 2012).
When the beam reach to its tensile capacity and the conversion has occurred from
micro-cracks to macro-cracks, fibers, according to their bonding characteristics and
aspect ratio continue to confine the crack growth and crack opening by bridging
through macro-cracks (Vikrant et al. 2012). The efficiency of all fiber reinforcement
is dependent upon achievement of a uniform distribution of the fibers in the concrete,
their interaction with the cement matrix, and the ability of the concrete to be
successfully cast or sprayed (Brown, & Atkinson, 2012).
Fundamentally, each fiber requires being covered by a cement paste to do its duty
sufficiently in the concrete. Moreover, adding of more fibers into concrete, has a
negative result on workability. Hence, using super plasticizer can solve this problem
without any harmful effect on other concrete properties. On the other hand, slump
change because of the different kind of fiber content. The more surface area and

16
content of fiber, the more cement absorb to coat fibers. (Chen, & Liu, 2000, Mansur
et al. 1986, Naaman, 2003, Campione, 2008, Campione, & Mangiavillano, 2008,
Radtke et al. 2010).
2.5 Mix Design for SFRC
In order to improve the workability, production cost and decrease heat of hydration
an appropriate replacement of cement with pozzolan would be beneficial (Gribniak et
al. 2012).
2.5.1 Workability
The workability of SFRC is influenced by the parameters given below:
The main important issue that the workability of SFRC is involved with is to receive
a suitable distribution of fibers in concrete.
This difficulty is typically handled by slowly and continuously adding fibers
into the mix.
Adding water in terms of improving workability can decrease the flexural
strength.
2.5.2 Test of Workability/Consistency
The some useful workability/consistency tests are:
Slump test
Inverted cone time
Compacting factor test
VeBe test (Figure 12-13)
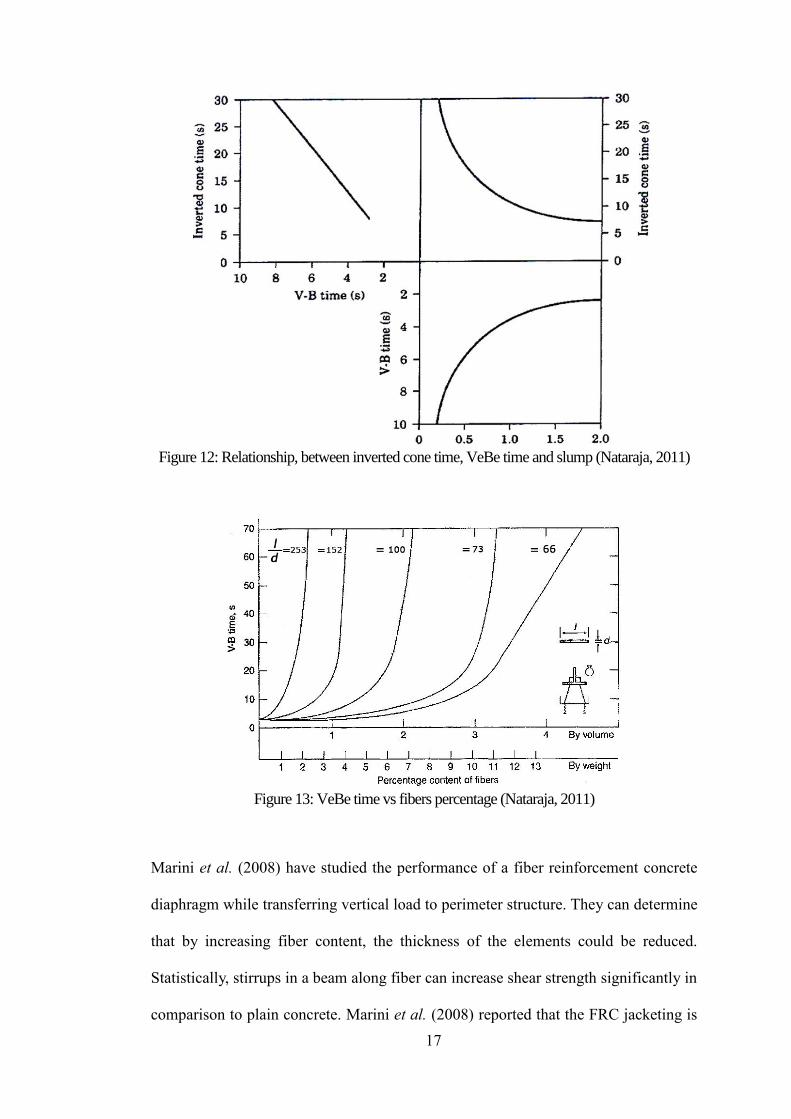
17
Figure 12: Relationship, between inverted cone time, VeBe time and slump (Nataraja, 2011)
Figure 13: VeBe time vs fibers percentage (Nataraja, 2011)
Marini et al. (2008) have studied the performance of a fiber reinforcement concrete
diaphragm while transferring vertical load to perimeter structure. They can determine
that by increasing fiber content, the thickness of the elements could be reduced.
Statistically, stirrups in a beam along fiber can increase shear strength significantly in
comparison to plain concrete. Marini et al. (2008) reported that the FRC jacketing is

18
an effective method for FRC beam with stirrups for shear strengthening. In terms of
replacing stirrups by fibers, he conducted that the failure of the beams without
stirrups occur in a large side of beams suddenly, and the crack is wider than the
ability of fibers to create bridges across it (Ruano et al. 2014).
This investigation tried to assess the shear ability of (High Performance Fiber
Reinforced Concrete) HPFRC with a passive hybrid system and pre stressed
longitudinal bars. Two beams have been tested with different pre-stressing level,
three times. The pre stressing level, which effects on shear capacity was the key
investigated parameter. The results indicated that the energy absorption and
improvement of load carrying capacity have been increased by increasing the level of
pre stress.
Figure 14 represents the average force vs mid-span deflection diagram which
conducted that by increasing the level of pre stress, the capacity of load carrying
have been increased without any significant effect on deflection at the maximum load
(Soltanzadeh et al. 2013).
Figure 14: Average Load-Deflection at the mid-span (Soltanzadeh et al. 2013)
19
SCC contains 0.3 % fiber by volume, which has been used in pavement concrete. For
decreasing segregation use of condensed silica fume is necessary. Adding a
copolymer based super plasticizing was typically done at the ready-mix plant, and it
was detected that slump flow increased from 20 to 30 mm. The copolymer type was
tested as well and there has an influence on fibers segregation (Soltanzadeh, et al.
2013). Segregation is a challenge and the best mix which was used by Ding et al.
(2011) is shown in Table 3.
Table 3: Concrete composition (dry materials) (Ding, 2012)
Concrete Composition kg/m3
l/m3
Norcem Anlegg CEM I 52.5 N-LA (HSC) 255 82
Norcem Industri CEM I 42.5 RR (RPC) 91 29
Condensed silica fume from Elkem 26 12
Free water 212 212
Absorbed water 17
Fine aggregate, 0-8 mm from Vang 850
Fine crushed sand, 0-0.5 mm from Feiring 147
Crushed aggregate, 8-16 mm 620
Copolymer, Glenium 27, Degussa 6.7
AEA Scanair 1:9 8.4
Volume Bekeart RC65/60 steel fiber 66 8
Paste volume 340
Matriz 375
Matrix plus 5 % air 425
Nominal concrete density excluded fibers 2203
Increasing the volume of matrix plus air is the main reason to use air entraining
agent. For preventing of segregation and increase the flow of concrete, air bubbles

20
are helpful. Air bubble has less influence on cement paste, however, decrease the
water content and cost (Hammer, & Johansen, 2008).
2.6 Previous Studies
2.6.1 SFRC Constitutive Concept in Compression
Fritih, et al. (2013) studied the influence of fibers through the local and global
mechanical properties of the beams. According to the results fiber can improve the
control of cracking. Fibers can’t modify load bearing capacity, yielding and ductility.
It just affects the distribution of cracks and kinetics. The stresses decrease in stirrups
with the presence of fibers, but it doesn’t mean that we are allowed to substitute
fibers instead of stirrups. On the other hand, using fibers can reduce bar
reinforcement ratio and makes the beam stiffer. They mention that for aggressive
environments, stainless steel fiber should be used.
According to the research which was conducted by Banthia, & Trottier, 1994;
Cucchiara et al. 2004; Edginton et al. 1978; Ezeldin, & Balaguru, 1989; Furlan, &
Hanai, 1997; Khuntia, & Stojadinovic, 2001, transfer stress through a crack is the
key role of fibers and therefore it can restrain the propagation and opening of cracks
and increases the mechanical properties, mostly the post-cracking performance.
Narayanan, & Darwish, 1987, Cucchiara et al. 2004 have observed that after flexural
cracking the density of crack network have been increased. Oh, 1992 remarked that
fibers in control of crack are better, and can reduce the cracks widths. Additionally,
the fibers effect on stiffness, ultimate load and shear strength increases (Frosch,
2000; Mirsayah, & Banthia, 2002; Shin et al. 1994).
21
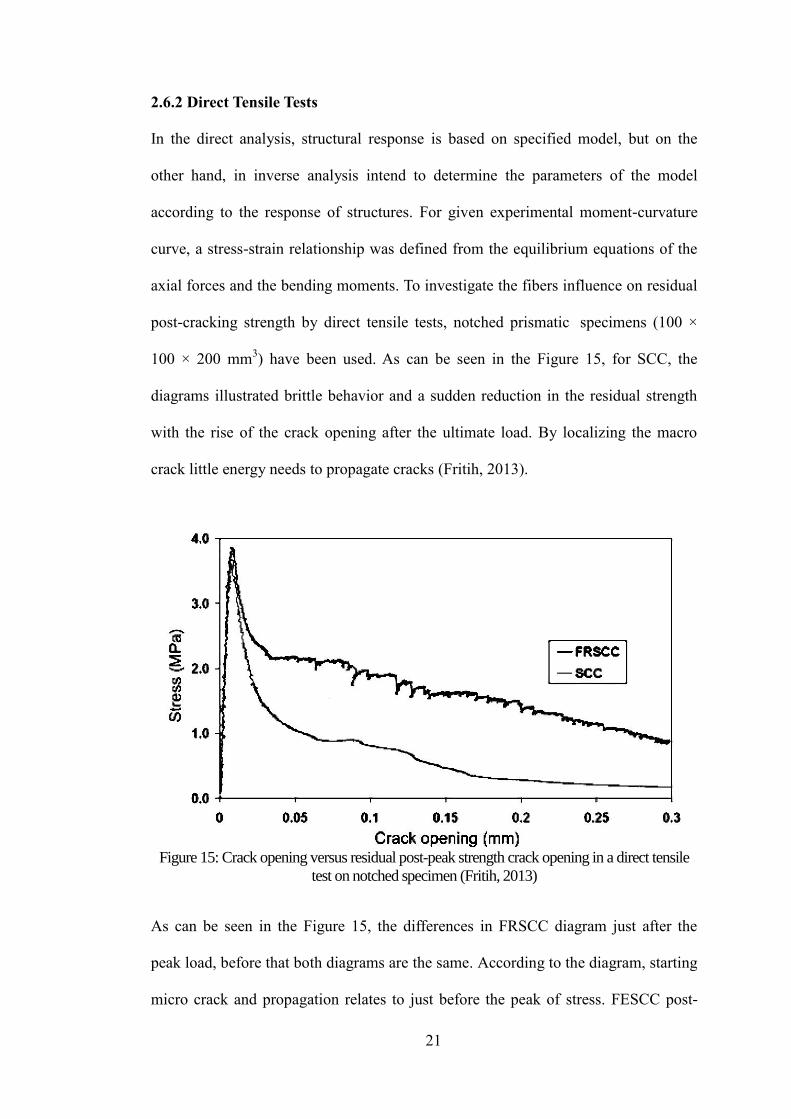
2.6.2 Direct Tensile Tests
In the direct analysis, structural response is based on specified model, but on the
other hand, in inverse analysis intend to determine the parameters of the model
according to the response of structures. For given experimental moment-curvature
curve, a stress-strain relationship was defined from the equilibrium equations of the
axial forces and the bending moments. To investigate the fibers influence on residual
post-cracking strength by direct tensile tests, notched prismatic, specimens (100 ×
100 × 200 mm3) have been used. As can be seen in the Figure 15, for SCC, the
diagrams illustrated brittle behavior and a sudden reduction in the residual strength
with the rise of the crack opening after the ultimate load. By localizing the macro
crack little energy needs to propagate cracks (Fritih, 2013).
Figure 15: Crack opening versus residual post-peak strength crack opening in a direct tensile
test on notched specimen (Fritih, 2013)
As can be seen in the Figure 15, the differences in FRSCC diagram just after the
peak load, before that both diagrams are the same. According to the diagram, starting
micro crack and propagation relates to just before the peak of stress. FESCC post-

22
peak behavior can be arranged as a three phase law. The first part relates to a stress
reduction from peak to residual strength plateau. Fibers help to increase the residual
strength and maintain crack opening where a residual strength is close to zero at
SCC. The residual strength falling in softening materials during the growth of crack
opening.
Post peak residual strength which is plateau placed in the second phase. This plateau
is fundamentally influenced by fibers properties (bond with the matrix, modulus of
elasticity) and fiber content. The fibers create a bridge in cracks and it cause stress
concentration which leads to a plateau. It is short but on the other hand, the
amplitude of the residual strength is high. The third part corresponds to the sample’s
failure. It is related to the continuous fracture of fibers. As said by Turatsinze et al
2005, the fibers can’t resist against crack openings greater than 0.2 mm.
2.7 Crack Patterns
Figure 16 shows the crack pattern for FRSCC and SCC at regular load. Table 4
indicates a global combination of the cracking type of failure, including the length
and number of cracks (the distance is between the two dangerous cracks), the normal
spacing among consecutive cracks is the maximum crack opening width. In all
samples, cracks initiate with flexural crack and situated in the middle of beam with
maximum moment (the load value is from 10 kN to 15 kN). Others flexural cracks
are in the high level of loading. The cracks which appeared near the support are for
shear cracks by 35% to 50% of ultimate load and spread to the loading points. In the
case of fiber concrete, the crack spacing is reduced, whereas the network of cracks,
becomes denser than the beam without fibers. In fiber reinforcement beams the crack
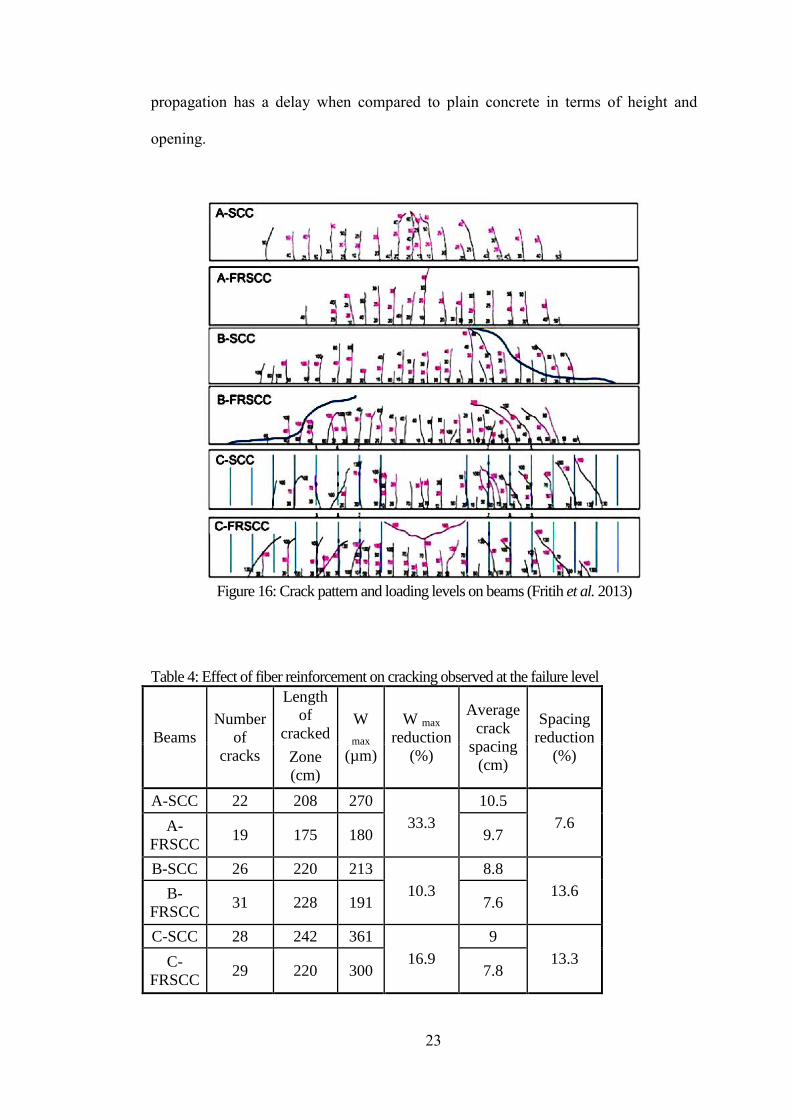
23
propagation has a delay when compared to plain concrete in terms of height and
opening.
Figure 16: Crack pattern and loading levels on beams (Fritih et al. 2013)
Table 4: Effect of fiber reinforcement on cracking observed at the failure level
Beams
Number
of
cracks
Length
of
cracked W
max
(µm)
W max
reduction
(%)
Average
crack
spacing
(cm)
Spacing
reduction
(%) Zone
(cm)
A-SCC 22 208 270
33.3
10.5
7.6 A-
FRSCC 19 175 180 9.7
B-SCC 26 220 213
10.3
8.8
13.6 B-
FRSCC 31 228 191 7.6
C-SCC 28 242 361
16.9
9
13.3 C-
FRSCC 29 220 300 7.8

24
Therefore, the tensile strength seems to be enhanced due to the influence of fibers
between two flexural cracks.
Before starting the first cracks, the FRSCC beams and plain beam (SCC) had similar
behavior according to load against deflection response. At this step, the stiffness
development did not rely on the existence of fibers. By initiating the first crack, all
specimens illustrated a nonlinear response. In the stabilized cracking stage under
service load, stiffness have got a small increase in the Figure 16 “A” beam (A-
FRSCC) only. SCC and FRSCC have similar behavior in the bending stiffness. Load
bearing capacity, ductility and yielding were not significantly improved by the fibers.
Generally, fibers improve tension stiffening and stress transfer over the cracks and
can confine crack opening.
Figure 17 (a) illustrates the failure pattern of SCC beam which doesn’t have fibers.
By developing and widening of diagonal cracks, the resistance of beam decreases
abruptly. Near the longitudinal reinforcement the dowel failure and concrete spelling
action can be observed. The following explanations have been taken by comparing
two beams (SCC and FRSCC) from Figure 17 (a) and (b).
The distributed fibers can absorb some part of shear force.
The three-dimensional fibers can resist the diagonal cracks; thus, a great
residual compressive strength in uncracked zone can be well-maintained.
Fiber bridging increase the resistance of aggregate interlocking significantly.
Fibers that are erected to the diagonal cracks, can increase the shear strength
visibly as shown in Figure 17(b).
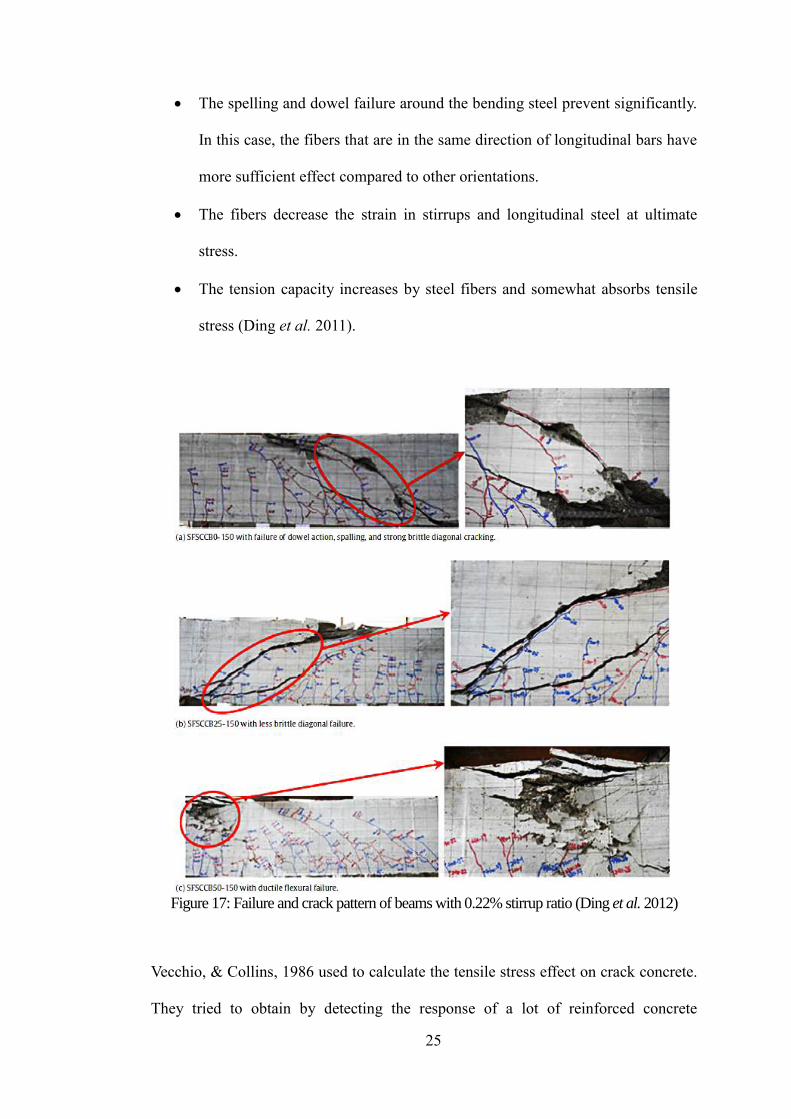
25
The spelling and dowel failure around the bending steel prevent significantly.
In this case, the fibers that are in the same direction of longitudinal bars have
more sufficient effect compared to other orientations.
The fibers decrease the strain in stirrups and longitudinal steel at ultimate
stress.
The tension capacity increases by steel fibers and somewhat absorbs tensile
stress (Ding et al. 2011).
Figure 17: Failure and crack pattern of beams with 0.22% stirrup ratio (Ding et al. 2012)
Vecchio, & Collins, 1986 used to calculate the tensile stress effect on crack concrete.
They tried to obtain by detecting the response of a lot of reinforced concrete

26
elements that subjected to shear load with axial stress together or pure shear load. It
is remarkable to note that the FRC is more appropriate than the concrete without
fibers, owing to its stress strain relationship that is flatter in the tension and in the
post peak level of compression in comparison with plain concrete (Collins, &
Mitchell, 1991).
Figure 17 (a) and Eq 4 have compared the actual local stresses by diagram of fiber
reinforcement element with calculated average stress. Through the average shear
stress by Eq 4 equal zero, therefor it could be local shear stress on Eq 5.
ρszfsz cos θ + f1 cos θ = ρszfszcr cos θ – fci cos θ + υci Sin θ + υf Sin θ + σf cos θ (4)
By increasing the loads, stirrups strain (Ɛz) will surpass yield strain of transverse
steel. At this moment, both fszcr and fsz will equal to the stirrups yield stress,
subsequently we can get:
f1=(υci + υf) tan θ + σf (5)
27
Figure 18: Comparison of local stresses at a crack with calculated average stresses of SFRC
and stress state of a single fiber (Ding et al. 2012)
2.8 Toughness
(Df8; f
feq:8) are two parameters of toughness which are presented to assess the
capacity of energy absorption and the capacity of the residual load bearing of beams
for this deflection δ8=δcr+8 mm.

28
D8 is the area below the load–deflection curve, which is the entire energy absorbed
until the δ8 (certain deflection). By using below equation, one can calculate the
equivalent strength:
f feq8 =D f8ls
6b𝑤 d 2υ (6)
The beams with stirrups exhibited low toughness. By using both fibers and stirrups
indicated a progressive hybrid effect to improve the toughness and post-peak
behavior (Figures 19 and 20) (Ding et al. 2012).
Figure 19: Load vs deflection responses in beams with diverse stirrup ratios (Ding et al. 2012)

29
Figure 20: Increase of toughness factor for beams with various reinforcements (Ding et al.
2012)

30
Chapter 3
3 METHODOLOGY
3.1 Introduction
This study has focused on two classes of concrete C20 and C40. The effect of steel
fiber quantity of fiber reinforcement self-compacting concrete slabs is assessed. In
each class of slab, four different amount of fibers have been tested namely 0%, 1%,
1.5% and 2%. For each type, two slabs were constructed.
3.2 Experimental Module
3.2.1 Specimens Provision
In this study the test requirements are 4 shafts and an IPE400. Two of the shafts
beneath the slab were used as support and the next two shafts were placed under the
IPE400.
Due to the limitation for applying two point load separately, 100 kN load should be
divided into two 50 kN by using I shape profile as can be seen in the Figure 21. For
this purpose, ANSYS software was used to model the required dimensions as shown
in Figure 22. By definition the slab size and load, it can define the appropriate size of
plats, shafts and IPE. Figure 21 shows the stress in the different part of slab, IPE and
shafts. According to that, the IPE and shat should be remind without any
deformation.

31
Figure 21: IPE and slab deformation
Figure 22: Dimensions of plate, shaft and IPE
32
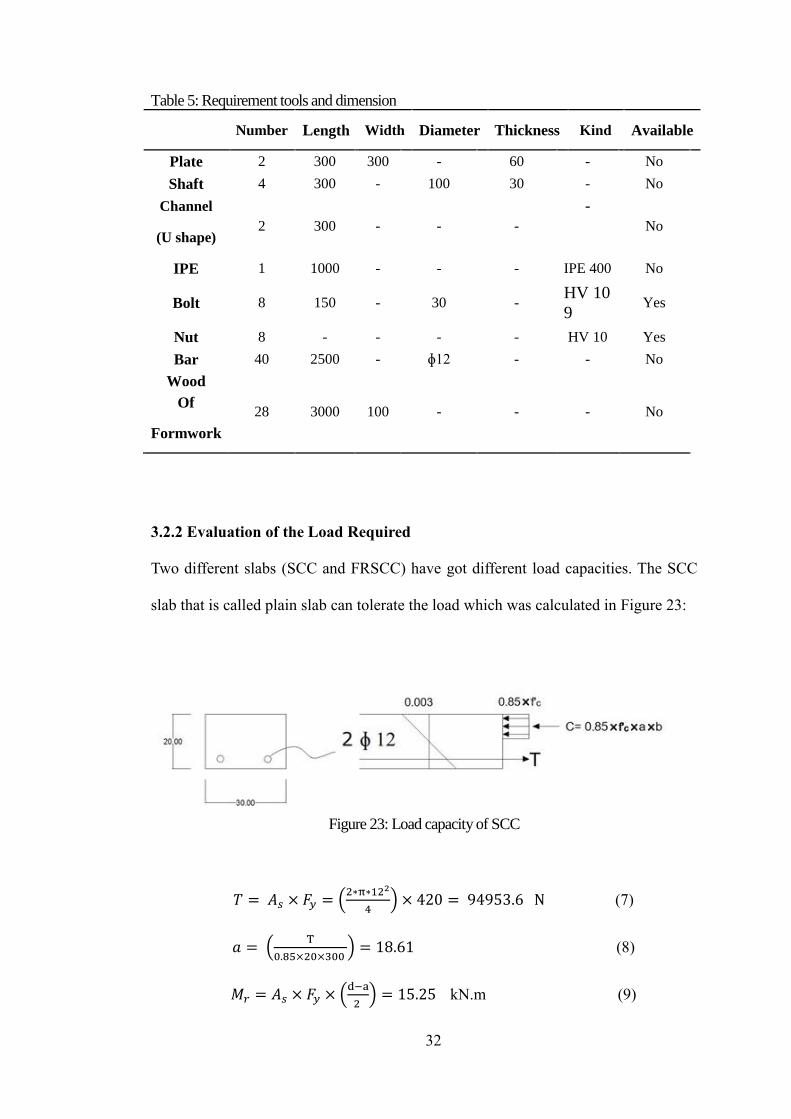
Table 5: Requirement tools and dimension
Number Length Width Diameter Thickness Kind Available
Plate 2 300 300 - 60 - No
Shaft 4 300 - 100 30 - No
Channel
2 300 - - -
-
No (U shape)
IPE 1 1000 - - - IPE 400 No
Bolt 8 150 - 30 - HV 10
9 Yes
Nut 8 - - - - HV 10 Yes
Bar 40 2500 - ɸ12 - - No
Wood
28 3000 100 - - - No Of
Formwork
3.2.2 Evaluation of the Load Required
Two different slabs (SCC and FRSCC) have got different load capacities. The SCC
slab that is called plain slab can tolerate the load which was calculated in Figure 23:
Figure 23: Load capacity of SCC
𝑇 = 𝐴𝑠 × 𝐹𝑦 = (2∗π∗122
4) × 420 = 94953.6 N (7)
𝑎 = (T
0.85×20×300 ) = 18.61 (8)
𝑀𝑟 = 𝐴𝑠 × 𝐹𝑦 × (d−a
2 ) = 15.25 kN.m (9)
33
𝑃 = (𝑀𝑟
L ) = 22.7 kN (10)
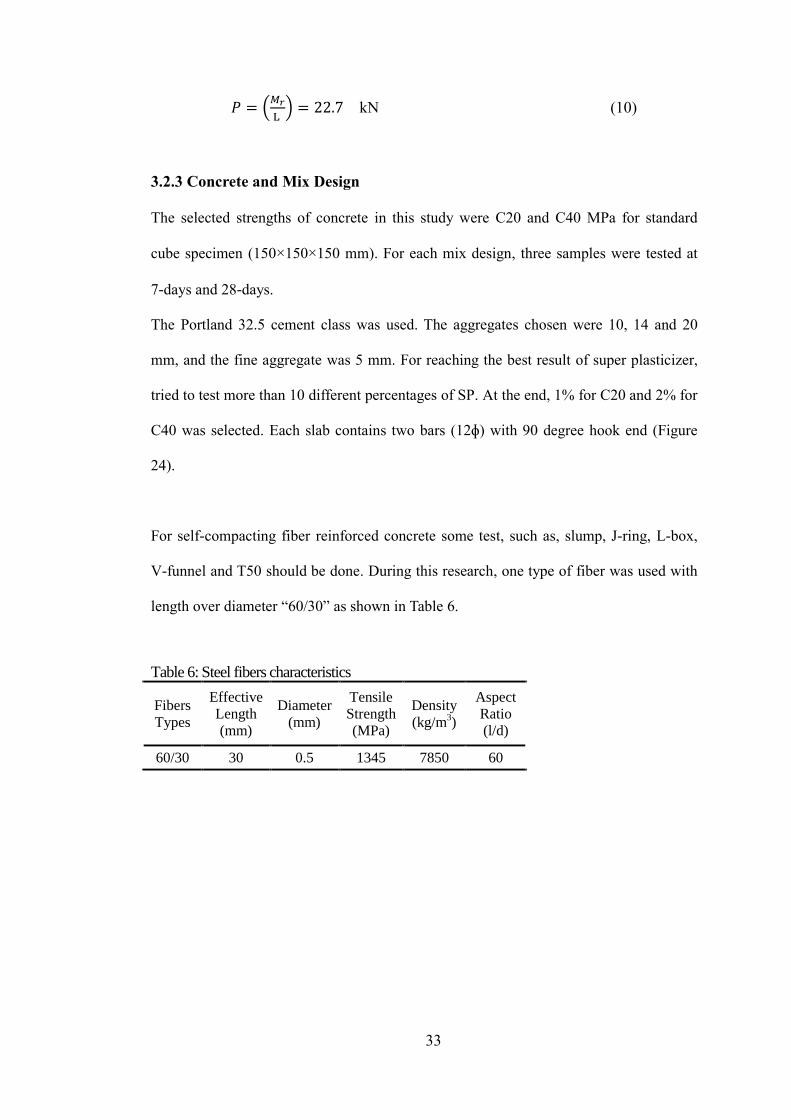
3.2.3 Concrete and Mix Design
The selected strengths of concrete in this study were C20 and C40 MPa for standard
cube specimen (150×150×150 mm). For each mix design, three samples were tested at
7-days and 28-days.
The Portland 32.5 cement class was used. The aggregates chosen were 10, 14 and 20
mm, and the fine aggregate was 5 mm. For reaching the best result of super plasticizer,
tried to test more than 10 different percentages of SP. At the end, 1% for C20 and 2% for
C40 was selected. Each slab contains two bars (12ɸ) with 90 degree hook end (Figure
24).
For self-compacting fiber reinforced concrete some test, such as, slump, J-ring, L-box,
V-funnel and T50 should be done. During this research, one type of fiber was used with
length over diameter “60/30” as shown in Table 6.
Table 6: Steel fibers characteristics
Fibers
Types
Effective
Length
(mm)
Diameter
(mm)
Tensile
Strength
(MPa)
Density
(kg/m3)
Aspect
Ratio
(l/d)
60/30 30 0.5 1345 7850 60

34
Figure 24: Formwork construction and bars
3.3 Sieve Analysis
This test is needed to determine the percentage of materials for coarse and fine
aggregate (ASTM C 136, 2006). In this research, four different aggregates sizes have
been used namely 5, 10, 14 and 20 mm based on ASTM C 136, 2006 (Tables 7-11):
Figure 25: Sieve analysis
35
Table 7: Sieve analysis for 20mm D max of aggregate
BS
sieve
size
(mm)
Weight
retained
(gr)
Percentage
retained
Cumulative
percentage
retained
(%)
Cumulative
percentage
passing
(%) (%)
28 19 1 1 99
20 546 18 19 81
14 1573 52 71 29
10 641 21 93 7
6.3 139 5 97 3
5 15 1 98 2
pan 65 2 100 0
Total
Weight
2998
Table 8: Sieve analysis for 14 mm D max of aggregate
BS
sieve
size
(mm)
Weight
retained
(gr)
Percentage
retained
Cumulative
percentage
retained
(%)
Cumulative
percentage
passing
(%) (%)
28 0 0 0 100
20 0 0 0 100
14 154 5 5 95
10 1516 51 56 44
6.3 1319 44 100 0
5 2 0 100 0
pan 4 0 100 0
Total
Weight
2995
Table 9: Sieve analysis for 10 mm of aggregate
BS
sieve
size
(mm)
Weight
retained
(gr)
Percentage
retained
Cumulative
percentage
retained
(%)
Cumulative
percentage
passing
(%) (%)
28 0 0 0 100
20 0 0 0 100
14 0 0 0 100
10 2 0 0 100
6.3 1474 49 49 51
5 797 27 76 24
pan 723 24 100 0
Total
Weight
2996

36
Figure 26: Sieve analysis for coarse aggregate
Table 10: Sieve analysis for 5 mm of fine aggregate
BS
sieve
size
(mm)
Weight
retained
(gr)
Percentage
retained
Cumulative
percentage
retained
(%)
Cumulative
percentage
passing
(%) (%)
4.75 0 0 0 100
2.38 235 12 12 88
2 232 12 23 77
1.19 381 19 42 58
0.841 200 10 52 48
0.595 226 11 64 36
0.297 255 13 77 23
0.177 102 5 82 18
0.149 62 3 85 15
0.074 129 6 91 9
pan 176 9 100 0
Total
Weight
1998
Table 11: Sieve analysis for 5 mm of aggregate
size pass-
lower size
pass-
upper
25 100 25 100
19 90 19 100
9.5 20 9.5 55
4.75 0.1 4.75 10
0
10
20
30
40
50
60
70
80
90
100
1 10
Cu
mu
lati
ve p
erce
nta
ge p
assi
ng
(%)
Sieve (mm)
Coarse 20 mm Lower Upper

37
Figure 27: Sieve analysis graph fine aggregate
3.4 Compressive Strength Test
To find out the optimum percentage of super plasticizer, concretes containing 0.30,
0.5, 0.80, 1, 1.5, 2.5 and 3 percent admixture were cast. For each percentage and
each class of concrete, 3 cubes were used in the following mix-design (Table 12)
Eren, & Alyousif :
Table 12: Mix design for C20 Concrete
Mix W/C Ratio
Cement Water
Fine
aggregate (gr)
Coarse aggregate (gr)
T5 T20 T14 T10
SCC
(control) 0.5 4808 2404 14139 2289 2289 3052
Table 13: Mix design for C40 Concrete
Mix W/C Ratio
Cement Water
Fine
aggregate (gr)
Coarse aggregate (gr)
T5 T20 T14 T10
SCC
(control) 0.66 4808 3189 14139 2289 2289 3052
0
10
20
30
40
50
60
70
80
90
100
1 10 100
Cu
mu
lati
ve p
erce
nta
ge p
assi
ng
(%)
Sieve (mm)
Coarse 20 mm Lower Upper

38
By decreasing the water to cement ratio from 0.66 to 0.5 the C40 concrete was reached.
The mix started by adding coarse aggregate, fine aggregate and cement. After mixing dry
materials in appropriate time (1 minute), water was added in two parts. The first part was
used without SP and the second part water with super plasticizer was added. Then fibers
were added slowly to avoid segregation. Table 14 shows the compressive strength test
results of the cubes (150×150×150 mm) on the 7-day and 28-day for C20 and C40.
Table 14: Compressive strength test results for cube samples of C20
SP % 0 0.3 0.5 0.8 1 1.5 2.5 3
7-day 13.51 15.7 16.3 16.6 17.9 16.5 18.6 16.3
28-day 18.55 22.2 24.5 24.65 26.65 23.3 21.9 22.1
Table 15: Compressive strength test results for cube samples of C40
SP % 1 2
7-day 32.1 32.33
28-day 43.55 40.73
3.5 Testing Fresh SCC
3.5.1 Slump Flow and T50 Test
The slump test is intended to investigate the SCC filling ability. It considers two
parameters: flow time T50 and flow spread. T50 indicates the rate of deformation in
a specific distance and slump shows unrestricted deformability (Figure 28). The T50
test is the period when the cone leaves the base plate and concrete touches the circle
(its diameter 500 mm). T50 is expressed in seconds. The slump flow spread S is the
average of diameters dmax and dperp, as shown in Equation (11). S is expressed in mm.
S= ( 𝑑𝑚𝑎𝑥 + 𝑑𝑝𝑒𝑟𝑝)
2 (11)

39
Figure 28: Slump and T50 tests
3.5.2 L-Box Test
The L-box test investigates the passing ability and it measures the height of fresh
concrete after passing over the specified openings of three smooth bars (12 mm
diameter) and flowing in a defined distance. During this test, the blocking or passing
behavior of fresh concrete can be assessed.
3.5.2.1 Test Procedure
The vertical part fill by 12.7 liters of FRSCC and after resting concrete for 1 minute,
let the concrete flow by opening the sliding gate Figure 29. After stopping the
concrete, measure the height of concrete in two part starting point h1 and ending
point h2 of the horizontal box ACI 237R-07.
L-box blocking ratio = h2
h1 (12)
Figure 29: L-box test

40
3.5.3 J-Ring Test
This test investigates both the passing and filling ability of FRSCC. The J-ring test
considers three parameters: flow time T50J, flow spread and blocking. The J-ring
flow test shows the restricted deformability of fresh concrete because of blocking
effect of ring (reinforcement bars) and the T50J shows the rate of deformation in a
defined distance (500 mm) ACI 237R-07.
3.5.3.1 Test Procedure
This test is exactly like slump test just add a ring around the cone of slump. After
filling the cone and placing the ring, the cone leaves and the time of the first touch of
concrete to the circle (500 mm) should be recorded (T50J) ACI 237R-07. After
stopping the concrete the longest diameter and the perpendicular diameter measured
Figure 30. The J-ring spread SJ is as shown below:
SJ = ( 𝑑𝑚𝑎𝑥 + 𝑑𝑝𝑒𝑟𝑝 )
2 (13)
Figure 30: J-ring test
3.5.4 V-Funnel Test
This test indicates the filling ability of concrete and its time some degree connected
to

41
plastic viscosity as shown in Figure 31.
Figure 31: V funnel equipment
3.5.4.1 Test Procedure
During the V-funnel test, fresh concrete should be filled by opening the gate and
timer should be started until the first light is seen as shown in Figure 32.
Figure 32: V funnel test
42
3.4.1 Casting and Curing
According to ASTM C39, 2014 the cubes were tested on 7 and 28 days. Three
samples for 7-days and three samples have broken at 28-days (ACI 301, 1999). The
result of 7-days are not used for acceptance but there are some experimental
approaches says that it is about 0.75 percent of 28-days, on the other hand ACI does
not accept this format.
Cylindrical specimen is suggested by the ASTM C39/C39M code, but according to
some researchers cube samples has about 80 to 90 percent value of the cylinder
sample (Shetty, 2005). The dimensions of the slab which was used in this research is
200×300×2200 mm with two bars ɸ 12 and 90 degree hooked-end and 20 mm was the
cover of reinforcement according to ACI318-11 as shown in Figure 33.
Figure 33: Slab formwork and steel bars
Super plasticizer has been used for increasing the workability, subsequently, it doesn’t
need any vibration and it was added according to the weight of cement. The first two
slabs in each class of concrete belong to plain concrete without any steel fibers. For the
43
rest of samples, fibers were added according to the concrete volume percentage
(FRSCC) as shown in Figure 34. After casting the slabs and cubes, the water curing
started from their surfaces. Until 28-days cubes were kept curing room.
Figure 34: Slab filled with SCC
3.5 Flexural Test Setup
3.5.5 Test Apparatus
The slab has been designed according to the flexural and for this reason shouldn’t fail
by shear. For preventing the shear failure and increasing moment in the middle of the
slab, the point load located at 500 mm at the middle of slab and 4 strain sensors were
placed at the top and bottom of each slab and also a transducer was placed at the
bottom center of it (Figure 35).
44
Figure 35: Test apparatus for flexural strength

45
Chapter 4
4 ANALYSIS, RESULTS AND DISCUSSIONS
In this chapter, the results of concrete test, load-deflection and moment-curvature
was discussed by focusing on the class of concrete, fiber percentage and behavior of
the slabs.
4.1 Results of T50, Slump, L-box, V-Funnel and J-Ring
The results of self-compacting concrete test were revealed in the Table 16. In both
kinds of concrete, fibers decrease the concrete passing. As can be seen in the Table
16, the time of T50, V-Funnel and J-Ring increased by increasing the percentage of
fibers and L-Box height decrease in the lower level.
Table 16: Workability test results of Self-Compacting Concrete
Fiber T50 Slump
L-
Box
V-
Funnel J-Ring
% (sec) (cm) (cm) (sec) T50J(sec) SJ(cm) BJ(cm)
C 20
(1%SP)
0 0.63 68.5 0.9 7.35 0.87 64.5 2
1 1 61.5 1 12.94 2.12 68.5 2.55
1.5 1.93 68.5 0.2 18.37 2.47 59 3.725
2 1.56 71 0.09 23.45 1.73 63.5 7.4
C 40
(2%SP)
0 0.41 92 0.29 8.95 0.45 90 8.75
1 2.01 61.5 0.22 1.00.59 0.68 69.5 6
1.5 3.5 55 0 51.31 3.5 64 2.5
2 2.48 49.5 0 48.78 2.6 58 3.75

46
4.2 Compressive Strength Test Results of Cubes
For each slab three specimens (cube of 150 mm size) have been taken for
compressive strength test. Results were shown in the following Table 17:
Table 17: Compressive strength results of cubes (MPa)
7-days 28-days
Fiber 0% 1% 1.50% 2% 0% 1% 1.50% 2%
C20 17.9 17.56 20.56 19.3 26.65 30.46 26.46 27.45
C40 32.33 31.67 30.13 31.7 40.66 42.27 41.3 42.77
4.3 Experimental Results of Flexural Test
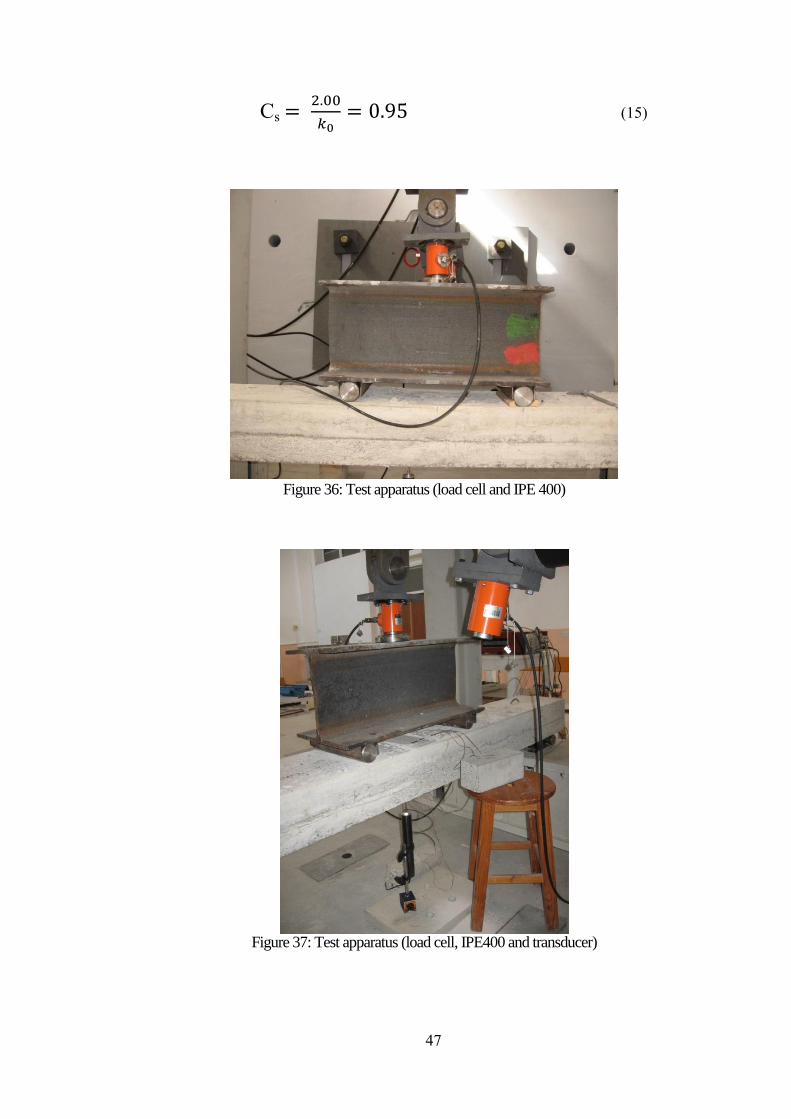
4.3.1 TDS Setup
All slabs were loaded by TDS-303 machine in the middle, with distance of 500 mm
for decreasing shear collapse as can be seen in Figure 36. A 10 mm transducer was
used for measuring displacement exactly placed at the bottom middle of the slabs as
shown in Figure 37. The data logger has 8 channels (3 channels for displacement,
one channel for vertical load and 4 channels for strain sensor). In addition, 4 sensors
(2 at the top and 2 at the bottom) were used for evaluating strain. The sensors
coefficient needed to be calculated by the following formula:
𝑘0 = 𝑅
𝑅+𝑟×𝐿
2
× k =120
120+0.44×2
2
× 2.12 = 2.11
(14)
r = total resistance of load wires
L = length of load wires (m)
K = gauge factor
K0 = Corrected gauge factor
R = gauge resistance
47
Cs = 2.00
𝑘0= 0.95 (15)
Figure 36: Test apparatus (load cell and IPE 400)
Figure 37: Test apparatus (load cell, IPE400 and transducer)

48
4.3.2 Slab with Different Percentage of Fibers for C40 Concrete
4.3.2.1 Mixture of 2% Super Plasticizer for - 0% Fibers
In this study, four slabs without fibers in two classes of concrete were tested. For
each mix design which varied in percentage of fiber and compressive strength, the
vertical load was applied and load-displacement and moment-curvature was taken.
Below diagram illustrated load-displacement for the slabs with 2% super plasticizer
and 0% fiber as shown in Figure 38.
By increasing load, the slab had a linear behavior before appearing the first crack and
continue until failure. The first crack appeared at the same place on the load due to
maximum shear and moment. Then the cracks appeared between two points of
applied load which shows flexural cracks (Figure 38-39). By increasing the load, the
slabs resistance was changed and goes into plastic mode until failure. During this
mode the neutral axis went up because of the concrete at the bottom was yielded.
Figure 38: Load-Displacement diagram for C40 concrete (2%SP-0%Fiber)
0
5
10
15
20
25
30
35
40
45
0 20 40 60 80 100 120
Load
(kN
)
Displacment (mm)
Load-Displacement

49
Figure 39: Crack pattern for concrete C40 (2%SP-0%Fiber)
Figure 40 shows moment-curvature characteristic of 2% SP and 0% fiber. According
to the diagrams, three significant zones are illustrated as elastic, crack and failure zone.
In the first area, slabs had elastic behavior and by increasing the load this behavior
changed to inelastic and tensile stress goes beyond the slab cracking stress. The cracks
appear due to degradation in the flexural stiffness of the slab. At the end of the diagrams,
loads were more than slab capacity and led to failure. In the middle area of the diagram,
the fibers helped the bars to make a bridge for increasing the tensile stress.
At the end of diagram which showed post cracking behavior, bars started to yield and
the tensile and compressive strength of slab decrease until collapsed. Normally, in
the flexural behavior investigation, tensile stress of concrete was neglected because
in the crack section, tensile forces could not transfer. On the other hand, in the
presence of fibers the crack section could transfer tensile forces by bridging the
cracks.

50
Figure 40: Moment-Curvature diagram for C40 concrete (2%SP - 0%Fiber)
4.3.2.2 Mixture of 2% Super Plasticizer for - 1% Fibers
Figure 41 indicated load displacement of 2%SP and 1%Fiber. It is clear that the
amount of absorption of energy increased by increasing the percentage of fiber. The
fiber's effect was revealed at the crack propagation. Figure 41 shows the effect of fiber
to increase the tension strength by bridging through cracks.
Figure 41: Load-Displacement diagram for C40 concrete (2%SP - 1%Fiber)
0
5
10
15
20
25
30
35
40
45
0 10 20 30 40 50 60 70 80
Mo
men
t (k
N.m
)
Curvature
Moment-Curvature
0
10
20
30
40
50
60
0 10 20 30 40 50
Load
(kN
)
Displacement (mm)
Load-Displacement
51
Figure 42: Crack section (2%SP - 1%Fiber)
Figure 43: Load-Displacement diagram for C40 concrete (2%SP - 1%Fiber)
0
5
10
15
20
25
30
35
40
0 20 40 60 80 100
Mo
men
t (k
N.m
)
Curvature
Moment-Curvature

52
4.3.2.3 Mixture of 2% Super Plasticizer for – 1.5% Fibers
Figure 44: Load-Displacement diagram for C40 concrete (2%SP – 1.5%Fiber)
Figure 45: Load-Displacement diagram for C40 concrete (2%SP – 1.5%Fiber)
0
10
20
30
40
50
60
0 20 40 60 80
Load
(kN
)
Displacement (mm)
Load-Displacement
0
5
10
15
20
25
30
35
40
0 10 20 30 40 50
Mo
men
t (k
N.m
)
Curvature
Moment - Curvature

53
4.3.2.4 Mixture of 2% Super Plasticizer for – 2% Fiber
Figure 46: Load-Displacement diagram for C40 concrete (2%SP – 2%Fiber)
Figure 47: Moment-Curvature diagram for C40 concrete (2%SP – 2%Fiber)
0
10
20
30
40
50
60
70
0 10 20 30 40
Load
(kN
)
Displacment (mm)
Load-Displacement
0
5
10
15
20
25
30
35
40
0 20 40 60 80 100
Mo
men
t (k
N.m
)
Curvature
Moment-Curvature
54
4.3.2.5 Mixture of 1% Super Plasticizer for – 0% Fibers
Figure 48: Load-Displacement diagram for C20 concrete (1%SP – 0%Fiber)
Figure 49: Moment-Curvature diagram for C20 concrete (1%SP – 0%Fiber)
0
5
10
15
20
25
30
35
0 20 40 60 80
Load
(kN
)
Displacment (mm)
Load-Displacement
0
5
10
15
20
25
30
35
40
0 20 40 60 80 100
Mo
men
t (k
N.m
)
Curvature
Moment-Curvature
55
4.3.2.6 Mixture of 1% Super Plasticizer for – 1% Fibers
Figure 50: Load-Displacement diagram for C20 concrete (1%SP – 1%Fiber)
Figure 51: Moment-Curvature diagram for C20 concrete (1%SP – 1%Fiber)
0
5
10
15
20
25
30
35
40
45
0 10 20 30 40 50 60 70 80 90
Load
(kN
)
Displacement (mm)
0
5
10
15
20
25
30
35
40
0 20 40 60 80 100
Mo
men
t (k
N.m
)
Curvature
Moment-Curvature

56
4.3.2.7 Mixture of 1% Super Plasticizer for – 1.5% Fibers
Figure 52: Load-Displacement diagram for C20 concrete (1%SP – 1.5%Fiber)
Figure 53: Moment-Curvature diagram for C20 concrete (1%SP – 1.5%Fiber)
0
10
20
30
40
50
60
0 10 20 30 40 50 60
Load
(kN
)
Displacement (mm)
Load-Displacement
0
5
10
15
20
25
30
35
40
0 10 20 30 40 50
Mo
men
t (k
N.m
)
Curvature
Moment-Curvature

57
4.3.2.8 Mixture of 1% Super Plasticizer for – 2% Fibers
Figure 54: Load-Displacement diagram for C20 concrete (1%SP – 2%Fiber)
Figure 55: Moment-Curvature diagram for C20 concrete (1%SP – 2%Fiber)
4.3.2.9 Moment-Curvature Comparison of C20 and C40 Concrete
The below graphs show all sample behavior in moment-curvature, each slab contains
two samples that represented the average. As can be seen, by increasing the
percentage of fiber the amount of energy absorption increases and slabs can tolerant
0
10
20
30
40
50
60
0 10 20 30 40 50 60 70 80
Load
(kN
)
Displacement (mm)
Load-Displacement
0
5
10
15
20
25
30
35
40
45
0 10 20 30 40 50 60 70 80 90
Mo
men
t (k
N.m
)
Curvature
Moment-Curvature

58
more moment. In other words, fibers can change the behavior of slabs and make
them more ductile. The beam with 2% fiber can tolerate more moment before
cracking and save elastic mode. As can be seen on the graph below, the plain (0%
fiber) slab can absorb less energy in comparison to the rest of the slabs.
Figure 56: Moment-Curvature diagram C20
Figure 57: Moment-Curvature diagram C40
0
5
10
15
20
25
30
35
40
45
50
0 10 20 30 40 50 60 70 80 90
Mo
men
t (K
N.m
)
Curvature
C20 Moment Curvature
1% SP 0% Fiber 1% SP 1% Fiber 1% SP 1.5% Fiber 1% SP 2% Fiber
0
5
10
15
20
25
30
35
40
0 20 40 60 80 100 120 140
Mo
men
t (k
N.m
)
Curvature
C40 Moment Curvature
2% SP 0% Fiber 2% SP 1% Fiber 2% SP 1.5% Fiber 2% SP 2% Fiber

59
4.3.2.10 Load-Displacement Comparison of C20 and C40 Concrete
The below graphs show all sample behavior in Load-Displacement. As can be seen
by increasing the percentage of fiber the amount of energy absorbing increase and
slabs can tolerant more load. In other words, fibers can change the behavior and
make slab more ductile.
Figure 58: Load-Displacement diagram C20
Figure 59: Load-Displacement diagram C40
0
10
20
30
40
50
60
0 20 40 60 80 100
Load
(kN
)
Displacement (mm)
C20 Load-Displacement
1%SP 0% Fiber 1%SP 1% Fiber 1%SP 1.5% Fiber 1%SP 2% Fiber
0
10
20
30
40
50
60
70
0 20 40 60 80 100 120 140
Load
(kN
)
Displacement (mm)
C40 Load-Displacement
2%SP 0% Fiber 2%SP 1% Fiber 2%SP 1.5% Fiber 2%SP 2% Fiber
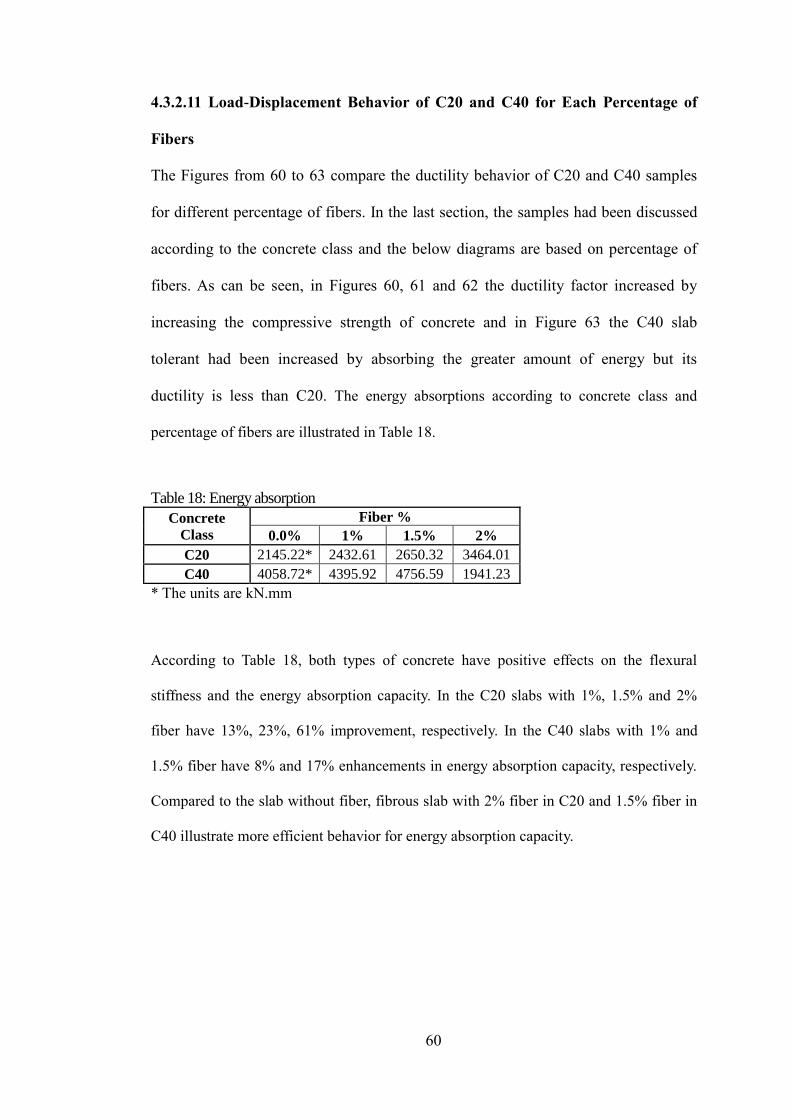
60
4.3.2.11 Load-Displacement Behavior of C20 and C40 for Each Percentage of
Fibers
The Figures from 60 to 63 compare the ductility behavior of C20 and C40 samples
for different percentage of fibers. In the last section, the samples had been discussed
according to the concrete class and the below diagrams are based on percentage of
fibers. As can be seen, in Figures 60, 61 and 62 the ductility factor increased by
increasing the compressive strength of concrete and in Figure 63 the C40 slab
tolerant had been increased by absorbing the greater amount of energy but its
ductility is less than C20. The energy absorptions according to concrete class and
percentage of fibers are illustrated in Table 18.
Table 18: Energy absorption
Concrete
Class
Fiber %
0.0% 1% 1.5% 2%
C20 2145.22* 2432.61 2650.32 3464.01
C40 4058.72* 4395.92 4756.59 1941.23
* The units are kN.mm
According to Table 18, both types of concrete have positive effects on the flexural
stiffness and the energy absorption capacity. In the C20 slabs with 1%, 1.5% and 2%
fiber have 13%, 23%, 61% improvement, respectively. In the C40 slabs with 1% and
1.5% fiber have 8% and 17% enhancements in energy absorption capacity, respectively.
Compared to the slab without fiber, fibrous slab with 2% fiber in C20 and 1.5% fiber in
C40 illustrate more efficient behavior for energy absorption capacity.

61
Figure 60: Load-Displacement diagram C20 and C40 0% Fiber
Figure 61: Load-Displacement diagram C20 and C40 1% Fiber
0
5
10
15
20
25
30
35
40
45
0 20 40 60 80 100 120
Load
(kN
)
Displacement (mm)
Load-Displacement
C20 0% Fiber C40 0% Fiber
0
10
20
30
40
50
60
0 20 40 60 80 100
Load
(kN
)
Displacement (mm)
Load-Displacement
C20 1% Fiber C40 1% Fiber
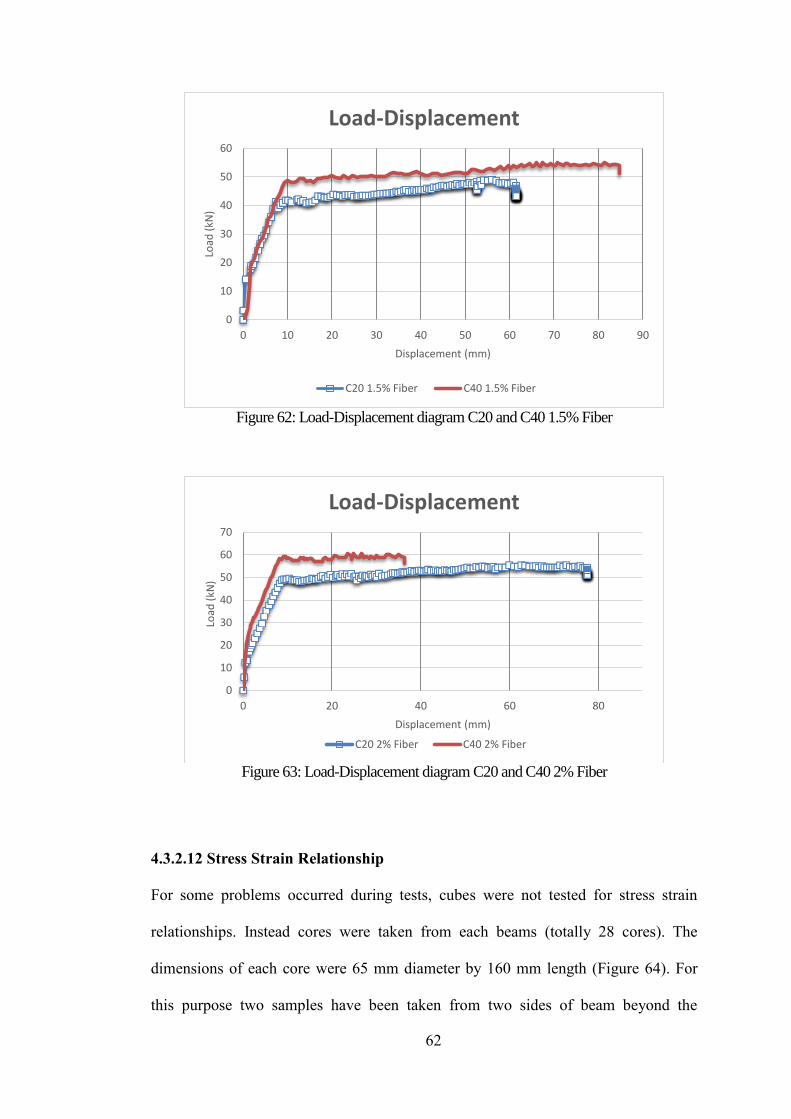
62
Figure 62: Load-Displacement diagram C20 and C40 1.5% Fiber
Figure 63: Load-Displacement diagram C20 and C40 2% Fiber
4.3.2.12 Stress Strain Relationship
For some problems occurred during tests, cubes were not tested for stress strain
relationships. Instead cores were taken from each beams (totally 28 cores). The
dimensions of each core were 65 mm diameter by 160 mm length (Figure 64). For
this purpose two samples have been taken from two sides of beam beyond the
0
10
20
30
40
50
60
0 10 20 30 40 50 60 70 80 90
Load
(kN
)
Displacement (mm)
Load-Displacement
C20 1.5% Fiber C40 1.5% Fiber
0
10
20
30
40
50
60
70
0 20 40 60 80
Load
(kN
)
Displacement (mm)
Load-Displacement
C20 2% Fiber C40 2% Fiber

63
support which was placed during testing of beam and below results have been
illustrated (Figures 65-66).
Figure 64: Core sample for Stress-Strain curvature
Figure 65: Stress-Strain curvature for C20
0
5
10
15
20
25
0 0.01 0.02 0.03 0.04
Stre
ss (
MP
a)
Strain
Stress Strain C20
0% Fiber 1% Fiber 1.5% Fiber 2% Fiber

64
Figure 66: Stress-Strain curvature C40
Compression examinations of FRSCCs are illustrated in Figures 65 and 66. According to
test results, by increasing in fiber percentage, the post-cracking compressive
performance has been enhanced with 2% fibers in C20 and 1.5% fibers in C40.
According to Figures 65 and 66, both types of mixes show an increase in strength by
increasing the percentage of fibers in comparison to the plain samples. In the second
graph (Figure 66), it is completely obvious that mix C40 has significant influence
and this effect has been increased by increasing the percentage of fibers from 1% to
2%.
Fibers can improve the post-crack behavior and also enhance the amount of energy
absorbing, as can be seen, the energy absorbing in the concrete of the classes of 40 is
more than the other one. Also, fibers can influence on the tensile strength due to the
bridging during crack Figure 67. Therefore, steel fibers in the reinforced concrete
changed the behavior from brittle to ductile.
0
5
10
15
20
25
30
35
0 0.01 0.02 0.03 0.04
Stre
ss (
MP
a)
Strain
Stress Strain C40
0% Fiber 1% Fiber 1.5% Fiber 2% Fiber
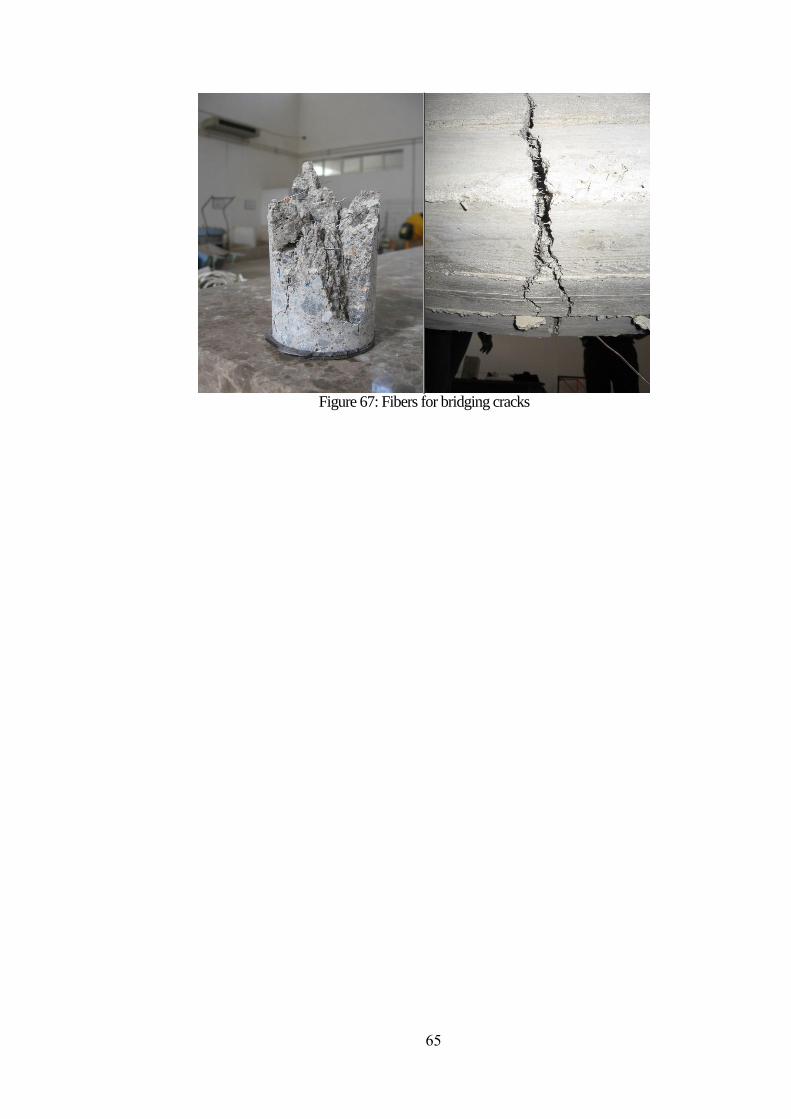
65
Figure 67: Fibers for bridging cracks
66
Chapter 5
5 CONCLUSION
5.1 Conclusions
In this chapter the significant results were reviewed and discussed briefly. The most
effective role of fiber was to carry stress throughout the crack and then arrested the
cracks opening and propagation. The ability of fiber to transform from a brittle
concrete to a ductile was significant. It increased the energy absorption and strain
capacity at peak load. Because of the interaction between fiber and concrete matrix, a
crack section transferred a great part of tensile stresses which is called residual
stresses.
According to the graphs in the last chapter, fiber affects the peak point load. By
increasing the percentage of fiber in slab, this effect becomes more obvious. The peak
point increase, related to the C20 slab with 2% fibers and the C40 slab with 2% fibers.
Results indicated that the absorption of energy increased significantly and the slabs
ductility had been affected by increasing the concrete strength. As can be seen, in the
Figures 60, 61 and 62 the ductility factor increased by increasing the compressive
strength of concrete and in the Figure 63 the C40 slab tolerant had been increased by
absorbing the greater amount of energy.
67
Figures 65 and 66 show C20 and C40 stress-strain relation which their strength was
affected by fibers. Increasing in strength by increasing the percentage of fiber led to
absorbing more energy and enhance the slabs toughness. Figure 66 shows more
elastic behavior before peak load due to C40 and fibers influence.
Fibers can improve the post-crack behavior and also enhance the amount of energy
absorbing, as can be seen, C40 can absorb the greater amount of energy. By
comparing the two classes of concrete, it is clear the ductility can change by
increasing the concrete strength.
5.2 Future Studies
This research can continue by using different type of fibers in size and compare them
to the slab, which is modeled by the FEM analysis program to evaluate the
differences between practical and theoretical.

68
REFERENCES
ACI 301-99. (1999). Specifications for Structural Concrete (ACI 301-99). American
Concrete Institute.
ACI Committee 237R-07. (2007). Self –consolidating concrete. American concrete
institute, pp. 1-30.
ACI Committee 544. (1990). State-of-the-art report on fiber reinforced concrete. ACI
manual of concrete practice, Part 5; pp. 22.
Alam, S. (2013). Principal Component and Multiple Regression Analysis for Steel
Fiber Reinforced Concrete (SFRC) Beams. International Journal of Concrete
Structures and Materials.
Aslani, F. & Nejadi, S. (2013). Self-compacting concrete incorporating steel and
polypropylene fibers: Compressive and tensile strengths, moduli of elasticity
and rupture, compressive stress–strain curve, and energy dissipated under
ASTM C 136 – 06. (2006). Standard Test Method for Sieve Analysis of Fine
and Coarse Aggregates. ASTM International.
69
ASTM C 1399-98. (2004) Test Method for Obtaining Average Residual-Strength of
Fiber-Reinforced Concrete, Annual Book of ASTM Standards. Japan Society
of Civil Engineers, Vol. 04.02.
ASTM C 1609/C 1609M – 05. (2006). Standard Test Method for Flexural
Performance of Fiber-Reinforced Concrete (Using Beam With Third-Point
Loading), ASTM International, PA, United States.
ASTM C39. (2014). Standard Test Method for Compressive Strength of Cylindrical
Concrete Specimens. ASTM International.
Aydin, AC. (2007). Self compactability of high volume hybrid fiber reinforced
concrete. Constr Build Mater; 21(6), pp. 1149–54.
Banthia, N. & Mindess, S. (2010). Toughness Characterization of Fiber Reinforced
Concrete: Which Standard to Use. ASTM, J. of Testing and Evaluation, 32(2).
Banthia, N. & Trottier, J. (1994). Concrete reinforced with deformed steel fibres, part
I: Bond-slip mechanisms. ACI Materials Journal, Vol. 91, No. 5, pp. 435-
444.
Banthia, N. & Trottier, J.F. (1995). Test Methods of Flexural Toughness
Characterization: Some Concerns and a Proposition, Concrete Int.: Design &
Construction, American Concrete Institute, Materials Journal, 92(1), pp. 48-
57.
70
Banthia, N. (2012). Fiber reinforced concrete.
Banthia, N. (2013). FRC: Milestone in international Research and development,
proceedings of FIBCON2012, ICI, Nagpur, India, pp. 48.
Banthia, N., Gupta R. & Mindess, S. (1994). Developing crack resistant FRC overlay
materials for repair applications, NSF Conference, Bergamo, Italy.
Barr, B., Gettu, R., Al-Oraimi, S.K.A. &Bryars, L.S. (1996). Toughness
Measurements-the Need to Think Again, Cement and Concrete Composites,
18, pp. 281-297.
Barragan, B., Gettu, R., Cruz, C., Bravo, M. & Zerbino, R. (2005). Development and
application of fiber-reinforced self-compacting concrete. In: Proceedings of
the international conference on young researchers’ forum, Thomas Telford
Services Ltd, Dundee, Scotland, UK, pp. 165–72.
Brown, J. & Atkinson, T. (2013). Propex Concrete Systems (International), United
Kingdom, proceedings of FIBCON2012, ICI, Nagpur, India.
Bui, V.K., Akkaya, Y. & Shah, S.P. (2002). Rheological model for self-consolidating
concrete. ACI Mater, 99(6), pp. 549–59.
Campione, G. & Mangiavillano, M.L. (2008). Fibrous reinforced concrete beams in
flexure: experimental investigation, analytical modelling and design
considerations. Eng Struct, pp. 30:2970–80.
71
Campione, G. (2008). Simplified flexural response of steel fiber-reinforced concrete
beams. ASCE J Mater Civil Eng, pp. 20:283–93.
Chanh, V. (2009). Steel fiber reinforced concrete.
Chen, B. & Liu, J. (2000). Contribution of hybrid fibers on the properties of the
control concrete hybrid fibers. Cem. Con. Comp, pp. 22(4): 343-351.
Choi, K.K. & Park, H.G. (2007). Unified shear strength model for reinforced
concrete beams-Part II: Verification and simplified method. ACI Structural
Journal, 104(2), pp. 153–168.
Collins, M.P. & Mitchell, D. (1991). Prestressed concrete structures. Englewood
compression.Composites: Part B, 53, pp. 121–133.
Cucchiara, C., Mendola, L. & Papia, M. (2004). Effectiveness of stirrups and steel
fibres as shear reinforcement. Cement and Concrete Composites, Vol. 26, No.
7, pp. 777-786.
Daczko, J. (2012). Self-consolidating concrete: hardened properties of SCC. New
York, USA, ch. 4.
Ding, Y., Liu, S., Zhang, Y. & Thomas, A. (2008). The investigation on the
workability of fibre cocktail reinforced self-compacting high performance
concrete. Constr Build Mater;22(7), pp. 1462–70.
72
Ding, Y., Youb, Z. & Jalali, S. (2011). The composite effect of steel fibres and
stirrups on the shear behaviour of beams using self-consolidating concrete.
Engineering Structures, pp. 33 107–117.
Ding, Y., Zhang, F., Torgal, F. & Zhang, Y. (2012). Shear behaviour of steel fibre
reinforced self-consolidating concrete beams based on the modified
compression field theory. Composite Structures 94, pp. 2440–2449.
Edgington, J., Hannant, D. J. & Williams, R.I.T. (1978). Steel fibre reinforced
concrete, fibre reinforced materials. Practical Studies from the Building
Research Establishment, The Construction Press, Lancaster, pp. 112-128.
EFNARC. (2002). Specification and guidelines for self-compacting concrete.
European Federation of Supplies of Specialist Construction Chemicals,
Farnham, Surrey, UK.
Endgington, J., Hannant, D.J. & Williams, R.I.T. (1974). Steel fiber reinforced
concrete. Building research establishment Garston Watford, pp CP 69/74.
ENV 1992-1- 1. (1991). Eurocode 2: Design of concrete structures - Part 1: General
rules and rules for buildings.
Eren, O. & Alyousif, A. Production of self-compaction fiber reinforcement concrete
in North Cyprus.

73
Ezeldin, A. & Balaguru, P. (1989). Bond behavior of normal and high-strength fibre
reinforced concrete. ACI Materials Journal, Vol. 86, No. 5, pp. 515-524.
Fritih, Y., Vidal, T., Turatsinze, A. & Pons, G. (2013). Flexural and Shear Behavior of
Steel Fiber Reinforced SCC Beams. KSCE Journal of Civil Engineering,
pp.17(6):1383-1393.
Frosch, R. J. (2000). Behavior of large-scale reinforced concrete beams with
minimum shear reinforcement. ACI Structural Journal, Vol. 97, No. 6, pp.
814-820.
Furlan, S. & Hanai, J. B. (1997). Shear behavior of fibre reinforced concrete beams.
Cement and Concrete Composites, Vol. 19, No. 4, pp. 359-366.
Gaimster, R. & Dixon, N. (2003). Self-compacting concrete. In Advanced Concrete
Technology. Amsterdam: Elsevier Butterworth-Heinemann, pp. 9/1-9/21.
Geiker, M. (2008). Self-compacting concrete (SCC). In Developments in the
formulation and reinforcement of concrete. Cambridge: Woodhead
Publishing Limited, pp. 187-207.
Gopalaratman, V.S. (1991). Fracture Toughness of Fiber Reinforced Concrete‖, ACI
Materials Journal. pp. 339-353, and Johnston, C.D., Discussion of above
paper, ACI Materials Journal, pp. 304-309.

74
Gribniak, V., Kaklauskas, G., Kwok Hung Kwan, A., Bacinskas, A. & Ulbinas, D.
(2012). Deriving stress–strain relationships for steel fibre concrete in tension
from tests of beams with ordinary reinforcement. Engineering Structures, pp.
42 387–395.
Hammer, T.A. & Johansen, K. (2008). Influence of entrained air bubbles on matrix
rheology. To be presented at Nordic Concrete Research Projects 2005,
Sandefjord.
Hossain, K.M.A., Lachemi, M., Sammour, M. & Sonebi, M. (2013). Strength and
fracture energy characteristics of self-consolidating concrete incorporating
polyvinyl alcohol, steel and hybrid fibres. Construction and Building
Materials 45, pp. 20–29.
Johnston, C.D. (1974). Steel fiber reinforced mortar and concrete, A review of
mechanical properties. In fiber reinforced concrete ACI – SP 44.
Khayat, K.H. & Roussel Y. (2000). Testing and performance of fibre-reinforced self
consolidating concrete. Mater Struct; 33(230), pp.391–7.
Khuntia, M. & Stojadinovic, B. (2001). Shear strength of reinforced concrete beams
without transverse reinforcement. ACI Structural Journal, Vol. 98, No. 5, pp.
48-56.

75
Lachemi, M., Hossain, K.M.A., Lambros, V. & Bouzoubaä, N. (2003). Development
of costeffective self-consolidating concrete incorporating fly ash, slag
cement, or viscosity-modifying admixtures. ACI Mater, 100(5), pp. 419–25.
Lachemi, M., Hossain, K.M.A., Lambros, V. & Bouzoubaä, N. (2004). Self-
compacting concrete incorporating new viscosity modifying admixtures. Cem
Concr Res ,34(6), pp. 917–26.
Lachemi, M., Sammour, M. & Sonebi, M. (2013). Strength and fracture energy
characteristics of self-consolidating concrete incorporating polyvinyl alcohol,
steel and hybrid fibres. Construction and Building Materials 45, pp. 20–29.
Li, V.C., Ward, R. & Hamza, A. M. (1992). Steel and synthetic fibers as shear
reinforcement. ACI Materials Journal, 89(5), pp. 499–508.
Lim, D.H. & Oh, B.H. (1999). Experimental and theoretical investigation on the
shear of steel fiber reinforced concrete beams. Engineering Structures, 21, pp.
937–944.
Malhotra, V.M., Garette, G.G. & Bilodeau, A. (1994). Mechanical properties and
durability of polypropylene fiber reinforced high-volume fly ash concrete for
shotcrete applications. ACI Mater, 91(5), pp. 478–86.
Mansur, M. A., Ong, K.C.G. & Paramasivam, P. (1986). Shear strength of fibrous
concrete beams without stirrups. ASCE Journal of Structural Engineering,
112(9), pp. 2066–2079.
76
Marini, A., Zanotti, C. & Plizzari, G. (2008). Seismic strengthening of existing
structures by means of fibre reinforced concret floor diaphragms. BEFIB.
Mipenz, A (2001), Steel fibre reinforced concrete (SFRC) – Quality, performance
and specification. BOSFA.
Mirsayah, A. & Banthia, N. (2002). Shear strength of steel fiberreinforced concrete.
ACI Materials Journal, Vol. 99, No. 5, pp.473-479.
Mohammad, S., Islam, E. & Alam, S. (2013). Principal Component and Multiple
Regression Analysis for Steel Fiber Reinforced Concrete (SFRC) Beams.
International Journal of Concrete Structures and Materials.
Naaman, A.E.( 2003). Strain hardening and deflection hardening fiber reinforced
cement composites. In: Naaman AE, Reinhardt HW, editors. International
workshop high performance fiber reinforced cement composites. RILEM
Publications SARL, pp. 95–113.
Nanni, A. (1988). Splitting-tension test for fiber reinforced concrete. ACI Mater
,85(4), pp. 229–33.
Narayanan, R. & Darwish, I.Y.S. (1987). Use of steel fibers as shear reinforcement.
ACI Structural Journal, Vol. 84, No. 3, pp. 216- 226.
Nataraja, M.C. (2011). Fiber reinforced concrete- behaviour properties and
application. Sri Jayachamarajendra College of engineering.

77
Nehdi, M. & Ladanchuk, JD. (2004). Fiber synergy in fiber-reinforced self-
consolidating concrete. ACI Mater;101(6), pp. 508–17.
Nemegeer, D., Vandewalle, L., Nieuwenburg, D., Van Gysel, A., Vyncke, J. &
Deforche, E. (1995). Dramix guideline: Design of concrete structures - Steel
wire fibre reinforced concrete structures with or without ordinary
reinforcement, Infrastructuur in het leefmilieu 4, pp. 227-239.
Oh, B. H. (1992). Flexural analysis of reinforced concrete beams containing steel
fibres. Journal of Structural Engineering, Vol. 118, No. 10, pp. 2821-2836.
Ozawa, K., Maekawa, K., Kunishima, H. & Okamura H. (2013). Performance of
concrete based on the durability design of concrete structures. In: Proc of the
second east-Asia-pacific conference on structural engineering and
construction, Bangkok, Thailand, vol. 1. pp. 445–56.
Pir, A. (2013). Experimental and Numerical Investigation on Steel Fibrous
Reinforced Concrete Slab Strips with Traditional Longitudinal Steel Bars.
Master thesis.
Portable data logger, TDS-303. Tokyo Sokki Kenkyujo.
Radtke, F.K.F., Simone, A. & Sluys, L.J. (2010). A computational model for failure
analysis of fibre reinforced concrete with discrete treatment of fibres. Eng
Fract Mech, pp. 77:597–620.

78
Ramakrishna, G. & Sundararajan, T. (2005). Studies on the durability of natural
fibres and the effect of corroded fibres on the strength of mortar. Cement &
Concrete Composites, 27(5), pp. 575–582.
Rols, S., Ambroise, J. & Pera, J. (1999). Effects of different viscosity agents on the
properties of self-leveling concrete. Cem Concr Res, 29(2), pp. 261–6.
Ruano, G., Isla, F., Pedraza, R., Sfer, D. & Luccioni, B. (2014). Shear retrofitting of
reinforced concrete beams with steel fiber reinforced concrete. Construction
and Building Materials, pp. 54 646–658.
Sahmaran, M., Yurtseven, A. & Ozgur YI. (2005). Workability of hybrid fibre
reinforced self-compacting concrete. Build Environ; 40(12), pp. 1672–7.
Sarmiento, E. (2011). Influence of concrete flow on the mechanical properties of
ordinary and fiber reinforced concrete. Technical University of Catalonia
(UPC). MS thesis.
Shetty, M. (2005). The concrete technology, theory and practice. New Delhi: S.
Chand and Company LTD.
Shin, S. W., Oh, J. G. & Ghosh, S. K. (1994). Shear behavior of laboratory-sized
high strength concrete beams reinforced with bars and steel fibers. American
Concrete Institute, Special Publication, Vol. 142, No. 10, pp. 181-200.
79
Soltanzadeh1, F., Mazaheripour, H., Barros, J. & Sena, J. (2013). Shear Capacity of
HPFRC Beams Flexurally Reinforced with Steel and Prestressed GFRP Bars.
FRPRCS-11 Joaquim Barros & José Sena-Cruz (Eds) UM, Guimarães.
Tlemat, H., Pilakoutas, K. & Neocleous, K. (2003). Pullout behaviour of steel fibers
recycled from used tires. In: Role of concrete in sustainable development,
pros of instep on celebrating concrete: people and practice, Thomas Telford
Ltd., Dundee, pp. 175–84.
Turatsinze, A., Granju, J. L, Sabathier, V. & Farhat, H. (2005). Durability of bonded
cement-based overlays: Effect of metal fibre reinforcement. Materials and
Structures, Vol. 38, No. 3, pp. 321- 327.
Vandewalle, L. (2000). Cracking behaviour of concrete beams reinforced with a
combination of ordinary reinforcement and steel fibers. Materials and
Structures/Matriaux et Constructions, pp. 164-170.
Vecchio, F.J. & Collins MP. (1986).The modified compression field theory for
reinforced concrete elements subjected to shear. American Concrete Institute,
pp. 83(2):219–31.
Vikrant, S., Vairagade, K. & Kene, S. (2012). Introduction to Steel Fiber Reinforced
Concrete on Engineering Performance of Concrete. International Journal of
Scientific & Technology Research, Volume 1, Issue 4.

80
Yakhlaf, M. (2013). Development of Carbon Fiber Reinforced Self-Consolidating
Concrete Patch for Repair Applications. The University of Waterloo. Master
thesis.