Investigation of erbium-doped fiber laser intra-cavity absorption sensor for gas detection
7
Erratum Investigation of erbium-doped fiber laser intra-cavity absorption sensor for gas detection q,qq Y. Zhang a,b, * , M. Zhang b , W. Jin b , H.L. Ho b , M.S. Demokan b , X.H. Fang b , B. Culshaw c , G. Stewart c a Department of Physics, Capital Normal University, Xisanhuan Beilu 105, Beijing, 100037, PeopleÕs Republic of China b Department of Electrical Engineering, The Hong Kong Polytechnic University, Hong Kong, PeopleÕs Republic of China c Department of Electronic and Electrical Engineering, Strathclyde University, Glasgow G1 1XW, Scotland, UK Received 15 July 2003; received in revised form 12 December 2003; accepted 18 February 2004 Abstract Steady state theoretical analysis of an erbium-doped fiber laser intra-cavity absorption sensor shows that high sensitivity can be achieved when the laser is working near threshold but is limited by the spontaneous emission. Ex- periments are carried out using a linear cavity fiber laser. The general trends of experimental results agree with the theoretical prediction. The use of the intra-cavity sensor for gas detection is demonstrated. A sensitivity of 91 times that of a single-pass absorption sensor is achieved. Ó 2004 Elsevier B.V. All rights reserved. Keywords: Fiber optics sensors; Laser sensors; Absorption spectroscopy 1. Introduction Detection of pollutant gases such as methane, acetylene, carbon monoxide, and carbon dioxide is important in environmental and pollution moni- toring [1]. Optical fiber sensors based on the ab- sorption of light within the low loss window (1–2 lm) of silica fiber allow for remote detection of these gases with additional advantages such as immunity to electromagnetic interference, multi- plexing capability, and low cost. The absorption- based sensors that use narrowband lasers or ‘‘comb-filter’’ tuned to the characteristic absorp- tion line or lines of the gas being detected have been proved to offer excellent selectivity [1,2]. Multi-point gas detection has been demonstrated by networking a number of compact micro-optic gas cells, allowing for wide area monitoring at multiple locations and reducing the cost per sens- ing point [3]. Wavelength modulation spectros- copy and digital filtering techniques have also been applied to improve the performance of the multi- point sensor network, but the etalon effects in the micro-optic cells limit the detection resolution [4]. q PII of original article S0030-4018(04)00034-3. qq DOI of original article 10.1016/j.optcom.2004.01.013. * Corresponding author. Tel.: +86-10-68902178; fax: 0086-10- 68902178. E-mail address: [email protected] (Y. Zhang). 0030-4018/$ - see front matter Ó 2004 Elsevier B.V. All rights reserved. doi:10.1016/j.optcom.2004.02.046 Optics Communications 234 (2004) 435–441 www.elsevier.com/locate/optcom
-
Upload
independent -
Category
Documents
-
view
2 -
download
0
Transcript of Investigation of erbium-doped fiber laser intra-cavity absorption sensor for gas detection
Optics Communications 234 (2004) 435–441
www.elsevier.com/locate/optcom
Erratum
Investigation of erbium-doped fiber laserintra-cavity absorption sensor for gas detection q,qq
Y. Zhang a,b,*, M. Zhang b, W. Jin b, H.L. Ho b, M.S. Demokan b, X.H. Fang b,B. Culshaw c, G. Stewart c
a Department of Physics, Capital Normal University, Xisanhuan Beilu 105, Beijing, 100037, People�s Republic of Chinab Department of Electrical Engineering, The Hong Kong Polytechnic University, Hong Kong, People�s Republic of China
c Department of Electronic and Electrical Engineering, Strathclyde University, Glasgow G1 1XW, Scotland, UK
Received 15 July 2003; received in revised form 12 December 2003; accepted 18 February 2004
Abstract
Steady state theoretical analysis of an erbium-doped fiber laser intra-cavity absorption sensor shows that high
sensitivity can be achieved when the laser is working near threshold but is limited by the spontaneous emission. Ex-
periments are carried out using a linear cavity fiber laser. The general trends of experimental results agree with the
theoretical prediction. The use of the intra-cavity sensor for gas detection is demonstrated. A sensitivity of 91 times that
of a single-pass absorption sensor is achieved.
� 2004 Elsevier B.V. All rights reserved.
Keywords: Fiber optics sensors; Laser sensors; Absorption spectroscopy
1. Introduction
Detection of pollutant gases such as methane,
acetylene, carbon monoxide, and carbon dioxide is
important in environmental and pollution moni-
toring [1]. Optical fiber sensors based on the ab-sorption of light within the low loss window (1–2
lm) of silica fiber allow for remote detection of
these gases with additional advantages such as
qPII of original article S0030-4018(04)00034-3.qqDOI of original article 10.1016/j.optcom.2004.01.013.
* Corresponding author. Tel.: +86-10-68902178; fax: 0086-10-
68902178.
E-mail address: [email protected] (Y. Zhang).
0030-4018/$ - see front matter � 2004 Elsevier B.V. All rights reserv
doi:10.1016/j.optcom.2004.02.046
immunity to electromagnetic interference, multi-
plexing capability, and low cost. The absorption-
based sensors that use narrowband lasers or
‘‘comb-filter’’ tuned to the characteristic absorp-
tion line or lines of the gas being detected have
been proved to offer excellent selectivity [1,2].Multi-point gas detection has been demonstrated
by networking a number of compact micro-optic
gas cells, allowing for wide area monitoring at
multiple locations and reducing the cost per sens-
ing point [3]. Wavelength modulation spectros-
copy and digital filtering techniques have also been
applied to improve the performance of the multi-
point sensor network, but the etalon effects in themicro-optic cells limit the detection resolution [4].
ed.

436 Y. Zhang et al. / Optics Communications 234 (2004) 435–441
An alternative technique for high sensitivity
absorption measurement is intra-cavity laser spec-
troscopy [5]. With an absorber directly placed
within the laser cavity, the very large number of
passes through the absorber can effectively trans-
form a short absorption cell into a highly efficientmulti-pass system, and thus improves the detection
sensitivity. The implementation of an intra-cavity
spectroscopic system in a fiber optic format would
allow a detection system with the high sensitivity of
the intra-cavity spectroscopy and the advantages of
fiber sensors. Furthermore, all fiber intra-cavity
systems can use the mature fiber components al-
ready developed for communication industry [6],allowing for the realization of cost-effective sys-
tems. The broad gain bandwidths of the fiber gain
mediums, such as erbium-doped fiber amplifier
(EDFA), cover the absorption lines of a number of
pollutant gases and thus permit multi-gas detection
without needing to use individual lasers with
wavelengths designed specifically for the absorp-
tion lines of different gases. Some promising resultson fiber intra-cavity sensor have already been re-
ported [6,7]. In our previous work, we have made
preliminary investigations on the sensitivity of an
erbium-doped fiber (EDF) laser intra-cavity ab-
sorption sensor [8,9]. The effect of spontaneous
emission was however not considered. We here
examine the sensitivity enhancement of an intra-
cavity fiber laser sensor when the effect of sponta-neous emission is considered. The use of the
intra-cavity sensor for acetylene gas detection is
also presented.
2. Theoretical analysis and simulation
When pumped by 1480 nm laser, a fiber laserusing EDF as gain medium can be considered as a
two-level system [10]. The temporal behavior of
the fiber laser can be described by rate equations as
[10,11]
dN2
dt¼ WpN1 �
N2
s2� gsSsc
½NlreN2 � NlraN1�; ð1Þ
N1 ¼ N0 � N2; ð2Þ
dNl
dt¼ gsla
sc½ð1þ NlÞreN2 � raNlN1� �
dscNl; ð3Þ
where N1 and N2 are the population densities of
ground level, upper laser level, respectively. N0 is
the moderate dopant concentration of the EDF, Nl
is the photon number in cavity, Wp ¼ ðgpPprapÞ=Shmp is the pump probability, Pp is the pump powerof the pump laser, hmp is the pump photon energy,
rap is the absorption cross-section at the pump
wavelength, S is the fiber core area, gs and gp are
the proportions of the signal and pump power
within the fiber core, re and ra are the emission
and absorption cross-sections of the mode, re-
spectively. s2 is the life time of the stable level, sc isthe cavity round time, la is the length of the EDF,and d is total intra-cavity loss including the basic
cavity loss and the effect of gas absorption. The
term ðgsla=scÞreN2 represents the change of photon
number in the cavity due to spontaneous emission.
It should be noted that Eqs. (1)–(3) are developed
for the case of single longitudinal mode operation.
However, for multi-longitudinal mode operation,
as long as the bandwidth of laser gain is smallerthan that of the gas absorption line, the single
mode intra-cavity spectroscopy model is still valid
[12]. On the other hand, if the width of the ab-
sorption line is smaller than the bandwidth of the
laser gain, the spectroscopy is regarded as multi-
mode intra-cavity laser spectroscopy, which has a
much higher sensitivity than the single-mode intra-
cavity spectroscopy.If the spontaneous emission is not considered,
the steady-state photon number (N̂l) in cavity can
be obtained by setting dNi=dt ¼ 0 (i ¼ 1; 2 and l)in Eqs. (1)–(3) and expressed the
N̂l ¼A� Bd
d; ð4aÞ
A ¼ SsclaN0ðWps2re � raÞs2½ra þ re�
; ð4bÞ
B ¼ Sscð1þ Wps2Þgss2½ra þ re�
: ð4cÞ
The output power that is proportional to N̂l canbe expressed as

4 5 6 7 8 90
100
200
300
400
500
Sens
itivi
ty E
nhan
cem
ent F
acto
r
Pump Power (mW)
Fig. 1. Theoretical sensitivity as a function of pump power.
With (solid line) and without (dash line) the consideration of
spontaneous emission.
Y. Zhang et al. / Optics Communications 234 (2004) 435–441 437
I / N̂l ¼A� Bd
d: ð5Þ
In absorption sensors, the absorption signal Kis defined as [12]
K ¼ lnI0I; ð6Þ
where I and I0 are, respectively, laser outputpowers with and without absorber in the cavity.
I ¼ I0 � DI , DI is the reduction of the output
power due to the absorption induced cavity loss
variation Dd. For a small absorption, i.e., DI � I0,Eq. (6) can be approximated as
K � DII0
: ð7Þ
The sensitivity enhancement factor that is defined
as the ratio of the intra-cavity absorption signal Kover the single pass loss Dd can be obtained, using
Eqs. (5) and (7), as
KDd
¼ DIIDd
/ AdðA� BdÞ : ð8Þ
It can be seen from Eq. (8) that the sensitivity of
the intra-cavity sensor is inversely proportional to
dðA� BdÞ and can therefore be enhanced by re-ducing the value of dðA� BdÞ. As the basic cavity
loss d cannot be made too small, high sensitivity
can only be achieved when laser is running close to
the threshold, i.e., A� Bd � 0.
When the spontaneous emission is considered,
the steady-state photon number N̂l in cavity will
be:
N̂l ¼�b�
ffiffiffiffiffiffiffiffiffiffiffiffiffiffiffiffiffi
b2 � 4acp
2a; ð9aÞ
a ¼ �s2ðre þ raÞ1þ Wps2 � gsres2
Ssc
dscSla
; ð9bÞ
b ¼ WpN0s2ðre þ raÞ1þ Wps2 � gsres2
Ssc
� dscSla
s2re
1þ Wps2 � gsres2Ssc
� N0ra �d
gsla; ð9cÞ
c ¼ WpN0s2re
1þ Wps2 � gsres2Ssc
: ð9dÞ
It is difficult to obtain an analytical expression for
the sensitivity enhancement factor by using Eqs.
(9), (6) and (7). We instead evaluated numerically
the dependence of sensitivity enhancement factor
on the pump power for various intra-cavity losses.
Fig. 1 shows the typical results of K=Dd as a
function of pump power. The solid and dash linesare respectively the results with and without the
consideration of spontaneous emission. The
parameters used in the calculation are given in
Table 1. The basic loss of the cavity was taken as
d ¼ 7:0 dB and the loss change is set as Dd ¼ 0:2dB. The pump power varies with a step of 0.05
mW. At the basic loss of d ¼ 7:0 dB, the threshold
pump power calculated using above parameters is6.20 mW. As shown in Fig. 1, the sensitivity tends
to infinity when the pump power is close to the
threshold value if the spontaneous emission is not
considered. The pump power where the dash line
appears to head for infinity is about 7.08 mW. This
value corresponds to the threshold value of fiber
laser with basic loss d ¼ 7:0þ 0:2 dB. If the loss
change in cavity is made smaller, the pump powerwhere the dash line appears to head for infinity will
be more close to the 6.20 mW. The inclusion of
spontaneous emission into the laser equations
(solid line) shows that the sensitivity saturates near
the threshold. At low pump levels, the sensitivity
increases with pump power and reaches a maxi-
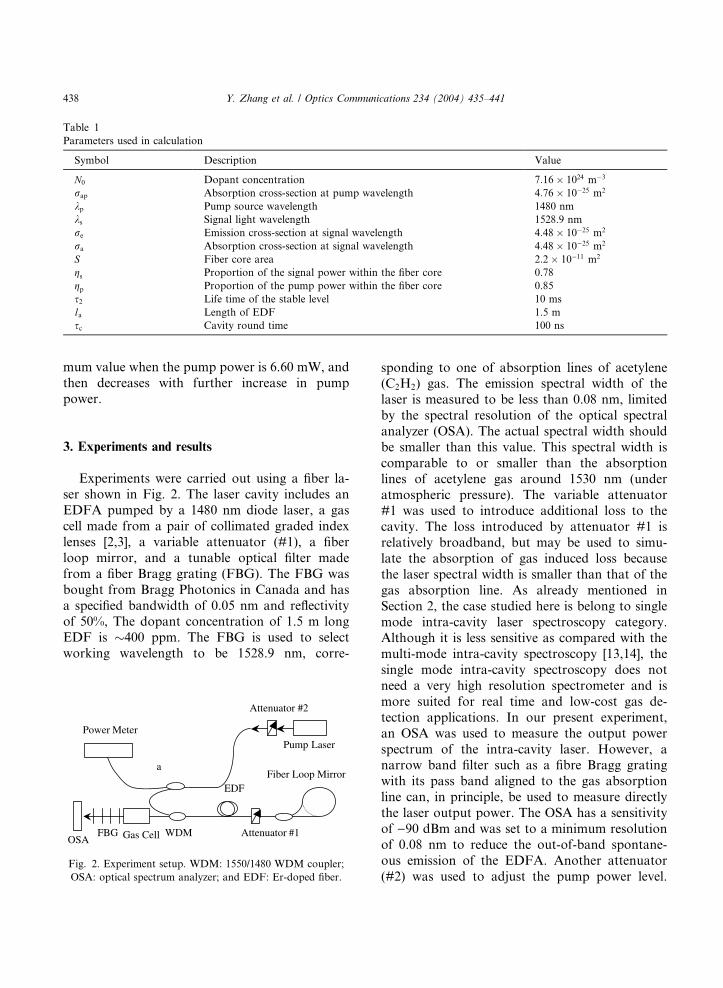
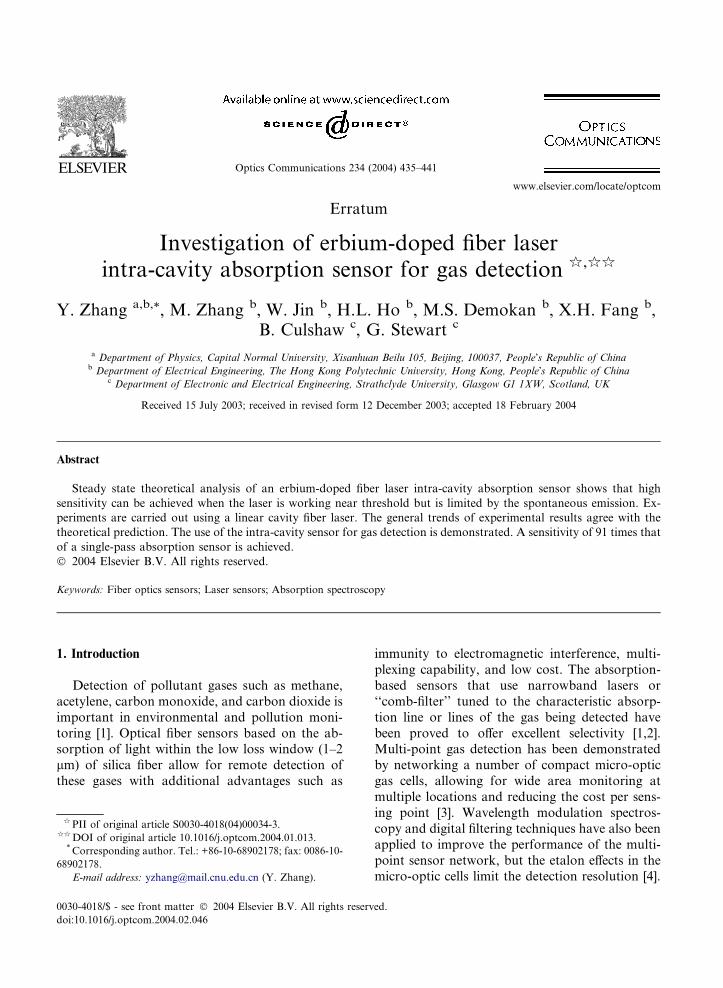
Table 1
Parameters used in calculation
Symbol Description Value
N0 Dopant concentration 7:16� 1024 m�3
rap Absorption cross-section at pump wavelength 4:76� 10�25 m2
kp Pump source wavelength 1480 nm
ks Signal light wavelength 1528.9 nm
re Emission cross-section at signal wavelength 4:48� 10�25 m2
ra Absorption cross-section at signal wavelength 4:48� 10�25 m2
S Fiber core area 2:2� 10�11 m2
gs Proportion of the signal power within the fiber core 0.78
gp Proportion of the pump power within the fiber core 0.85
s2 Life time of the stable level 10 ms
la Length of EDF 1.5 m
sc Cavity round time 100 ns
438 Y. Zhang et al. / Optics Communications 234 (2004) 435–441
mum value when the pump power is 6.60 mW, and
then decreases with further increase in pump
power.
3. Experiments and results
Experiments were carried out using a fiber la-ser shown in Fig. 2. The laser cavity includes an
EDFA pumped by a 1480 nm diode laser, a gas
cell made from a pair of collimated graded index
lenses [2,3], a variable attenuator (#1), a fiber
loop mirror, and a tunable optical filter made
from a fiber Bragg grating (FBG). The FBG was
bought from Bragg Photonics in Canada and has
a specified bandwidth of 0.05 nm and reflectivityof 50%, The dopant concentration of 1.5 m long
EDF is �400 ppm. The FBG is used to select
working wavelength to be 1528.9 nm, corre-
OSA
Fiber Loop Mirror
Pump Laser
Attenuator #2
WDM
EDF
Attenuator #1FBG
a
Power Meter
Gas Cell
Fig. 2. Experiment setup. WDM: 1550/1480 WDM coupler;
OSA: optical spectrum analyzer; and EDF: Er-doped fiber.
sponding to one of absorption lines of acetylene(C2H2) gas. The emission spectral width of the
laser is measured to be less than 0.08 nm, limited
by the spectral resolution of the optical spectral
analyzer (OSA). The actual spectral width should
be smaller than this value. This spectral width is
comparable to or smaller than the absorption
lines of acetylene gas around 1530 nm (under
atmospheric pressure). The variable attenuator#1 was used to introduce additional loss to the
cavity. The loss introduced by attenuator #1 is
relatively broadband, but may be used to simu-
late the absorption of gas induced loss because
the laser spectral width is smaller than that of the
gas absorption line. As already mentioned in
Section 2, the case studied here is belong to single
mode intra-cavity laser spectroscopy category.Although it is less sensitive as compared with the
multi-mode intra-cavity spectroscopy [13,14], the
single mode intra-cavity spectroscopy does not
need a very high resolution spectrometer and is
more suited for real time and low-cost gas de-
tection applications. In our present experiment,
an OSA was used to measure the output power
spectrum of the intra-cavity laser. However, anarrow band filter such as a fibre Bragg grating
with its pass band aligned to the gas absorption
line can, in principle, be used to measure directly
the laser output power. The OSA has a sensitivity
of )90 dBm and was set to a minimum resolution
of 0.08 nm to reduce the out-of-band spontane-
ous emission of the EDFA. Another attenuator
(#2) was used to adjust the pump power level.
Y. Zhang et al. / Optics Communications 234 (2004) 435–441 439
An1:99 coupler was used to tap a small amount
of the pump power for the purpose of pump
power monitoring. When the attenuator #1 was
set to a minimum loss of 1.61 dB, the threshold
pump power for fiber laser system was measured
to be 6.24 mW. The dependence of sensitivityenhancement factor on pump power was mea-
sured and shown in Fig. 3. The sensitivity en-
hancement factor was obtained by the following
procedure: when variable attenuator #1 was set
to 1.61 dB, and the laser output power was
measured when the pump power was varied from
5.6 to 7.0 mW at a step of 0.1 mW; the mea-
surement was repeated when the variable atten-uator was set to 1.71 dB, corresponding to a
round-trip loss variation of 2� ð1:71� 1:61ÞdB ¼ 0:2 dB. The difference between the two
measurements was then taken and divided by the
round-trip loss change Dd ¼ 0:2 dB. As expected,
the sensitivity increases when the pump power is
reduced to close to threshold value, and reaches a
maximum value of �110 when pump power was�6.5 mW. It should be pointed out that above
sensitivity enhancement factor was calculated by
using the nominal reading from the variable at-
tenuator. As specified by the manufacture, the
accuracy of the applied single pass attenuation is
�0.03 dB for the attenuator (EXPO FVA-3100)
we used. This would give a round-trip loss change
of Dd ¼ 0:2� 0:06 dB. The sensitivity enhance-ment factor could then be in the range from 85 to
157. The measurements were also limited by the
5.4 5.6 5.8 6.0 6.2 6.4 6.6 6.8 7.0 7.20
20
40
60
80
100
120
Sens
itivi
ty E
nhan
cem
ent F
acto
r
Pump Power (mW)
Fig. 3. Measured sensitivity versus pump power.
stability and the tuning accuracy of the pump
power (�0.1 mW), and the spectral resolution of
the OSA.
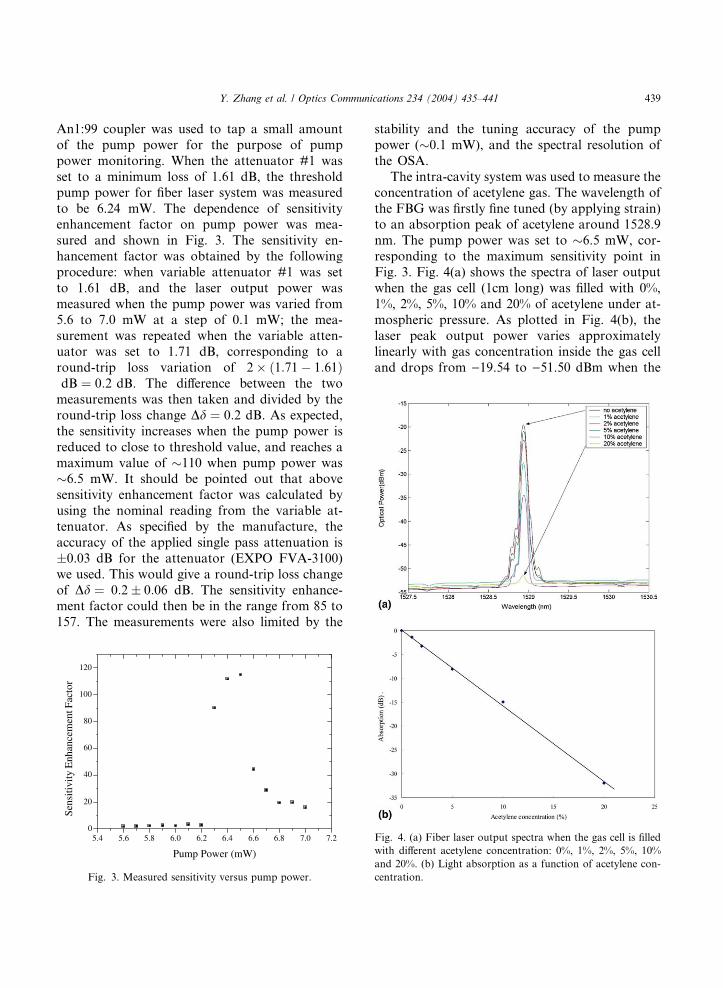
The intra-cavity system was used to measure the
concentration of acetylene gas. The wavelength of
the FBG was firstly fine tuned (by applying strain)to an absorption peak of acetylene around 1528.9
nm. The pump power was set to �6.5 mW, cor-
responding to the maximum sensitivity point in
Fig. 3. Fig. 4(a) shows the spectra of laser output
when the gas cell (1cm long) was filled with 0%,
1%, 2%, 5%, 10% and 20% of acetylene under at-
mospheric pressure. As plotted in Fig. 4(b), the
laser peak output power varies approximatelylinearly with gas concentration inside the gas cell
and drops from )19.54 to )51.50 dBm when the
Fig. 4. (a) Fiber laser output spectra when the gas cell is filled
with different acetylene concentration: 0%, 1%, 2%, 5%, 10%
and 20%. (b) Light absorption as a function of acetylene con-
centration.

Fig. 5. Laser output when the gas cell is periodically filled with
air and 20% acetylene.
440 Y. Zhang et al. / Optics Communications 234 (2004) 435–441
acetylene concentration within the gas cell wasvaried from 0% to 20%. The single pass direct
absorption loss of the same cell was also measured
by filling the cell with same concentration of
acetylene and found to be �0.35 dB. This gives a
sensitivity enhancement factor of 91 times that
of the conventional single pass absorption
measurement.
Measurements were also conducted by fillingthe gas cell periodically with air and 20%
acetylene at atmospheric pressure. Fig. 5 shows
the results for two air/acetylene filling cycles.
The samples (the horizontal axis of Fig. 5) were
taken every 2 s. The fluctuation of laser output
power was measured to be 0.36 dB (root mean
square value), corresponding to a measurement
error in terms of minimum detectable acetyleneconcentration of 2253 ppm. The measurements
were found quite reversible with repeatability of
0.37 dB over five measurement cycles. This va-
lue of repeatability would cause a measurement
error similar to that of the minimum detectable
gas concentration and may be due to the in-
stability of the pump laser, polarization effect,
thermal effect, and various environmental effects.Further work is needed to minimize these effects
and optimize the system performance.
4. Summary
In summary, we have investigated theoretically
and experimentally the relationship between the
sensitivity and the pump power level of an erbi-
um-doped fiber laser intra-cavity absorption
sensor when spontaneous emission is considered.
It was found that the sensitivity of the intra-
cavity fiber laser sensor could be improved sig-
nificantly when the laser is working close to thethreshold, but limited by the spontaneous emis-
sion noise. However, as the sensitivity varies
significantly around the threshold even with a
slight variation in the pump power, the stability
of pump source is therefore crucial to ensure
high stability and sensitive absorption measure-
ments. The power level around the threshold is
also low, meaning that highly sensitive photo-receiver, preferably with matched wavelength fil-
ter to minimize the spontaneous emission noise
of the EDFA, is also required. Our experiments
have achieved a measurement sensitivity of 91
times higher than that of the single pass ab-
sorption measurement and a minimum detectable
(acetylene) gas concentration of 2253 ppm.
Acknowledgements
This work was supported by the Hong Kong
SAR government through a CERG Grant
PolyU5116/01E.
References
[1] G. Stewart, Optical Fiber Sensor, Chapter 5, Technology,
Kluwer Academic Publishers, Dordrecht, 1999.
[2] J. Dakin, S.J. Mackenzie, Chapter 7, in: J. Dakin, B.
Culshaw (Eds.), Optical Fiber Sensors, vol. 4, 1997.
[3] B. Culshaw, G. Stewart, F. Dong, C. Tandy, D. Moodie,
Sensors Actuators B 51 (1998) 25.
[4] H.L. Ho, W. Jin, M.S. Demokan, Electron. Lett. 36 (2000)
1191.
[5] V.M. Baev, J. Eschner, R. Sch€uler, P.E. Toschek, Appl.
Phys. B 55 (1992) 463.
[6] J. Hernandez-cordero, T.F. Morse, IEICE Trans. Electron.
83 (2000) 371.
[7] G. Stewart, K. Atherton, H. Yu, B. Culshaw, Meas. Sci.
Technol. 12 (2002) 843.
[8] M. Zhang, Y. Zhang, D.N. Wang, M.S. Demokan, Int. J.
Nonlinear Sci. Numer. Simul. 3 (2002) 569.
[9] Y. Zhang, M. Zhang, Wei Jin, Sensors Actuators 104
(2003) 183.

Y. Zhang et al. / Optics Communications 234 (2004) 435–441 441
[10] C.R. Giles, J. Lightwave Technol. 9 (1991) 271.
[11] Y.T. Chieng, G.J. Cowle, R.A. Minasian, J. Lightwave
Technol. 14 (1996) 1730.
[12] V.M. Baev, T. Latz, P.E. Toschek, Appl. Phys. B 69 (1999)
171.
[13] A. Stark, L. Correia, M. Teichmann, S. Salewski, C.
Larsen, V.M. Baev, P.E. Toschek, Opt. Commun. 215
(2003) 113.
[14] J. H€unkemeier, R. B€ohm, V.M. Baev, P.E. Toschek, Opt.
Commun. 176 (2000) 417.