Tensile Behavior of Self-Compacting Steel Fiber ... - MDPI
12
crystals Article Tensile Behavior of Self-Compacting Steel Fiber Reinforced Concrete Evaluated by Different Test Methods Xinxin Ding 1, *, Changyong Li 1 , Minglei Zhao 2 , Jie Li 2, * , Haibin Geng 1 and Lei Lian 3 Citation: Ding, X.; Li, C.; Zhao, M.; Li, J.; Geng, H.; Lian, L. Tensile Behavior of Self-Compacting Steel Fiber Reinforced Concrete Evaluated by Different Test Methods. Crystals 2021, 11, 251. https://doi.org/ 10.3390/cryst11030251 Academic Editors: Slawomir J. J. Grabowski and Adam Stolarski Received: 30 January 2021 Accepted: 25 February 2021 Published: 28 February 2021 Publisher’s Note: MDPI stays neutral with regard to jurisdictional claims in published maps and institutional affil- iations. Copyright: © 2021 by the authors. Licensee MDPI, Basel, Switzerland. This article is an open access article distributed under the terms and conditions of the Creative Commons Attribution (CC BY) license (https:// creativecommons.org/licenses/by/ 4.0/). 1 International Joint Research Lab for Eco-building Materials and Engineering of Henan, School of Civil Engineering and Communications, North China University of Water Resources and Electric Power, Zhengzhou 450045, China; [email protected] (C.L.); [email protected] (H.G.) 2 School of Engineering, RMIT University, Melbourne, VIC 3001, Australia; [email protected] 3 Changjiang Yichang Waterway Bureau, No. 273 Dongshan Avenue, Yichang 443500, China; [email protected] * Correspondence: [email protected] (X.D.); [email protected] (J.L.) Abstract: Due to the mechanical properties related closely to the distribution of steel fibers in concrete matrix, the assessment of tensile strength of self-compacting steel fiber reinforced concrete (SFRC) is significant for the engineering application. In this paper, seven groups of self-compacting SFRC were produced with the mix proportion designed by using the steel fiber-aggregates skeleton packing test method. The hooked-end steel fibers with length of 25.1 mm, 29.8 mm and 34.8 mm were used, and the volume fraction varied from 0.4% to 1.4%. The axial tensile test of notched sectional prism specimen and the splitting tensile test of cube specimen were carried out. Results show that the axial tensile strength was higher than the splitting tensile strength for the same self-compacting SFRC, the axial tensile work and toughness was not related to the length of steel fiber. Finally, the equations for the prediction of tensile strength of self-compacting SFRC are proposed considering the fiber distribution and fiber factor, and the adaptability of splitting tensile test for self-compacting SFRC is discussed. Keywords: self-compacting SFRC; axial tensile strength; splitting tensile strength; notched section; axial tensile toughness; prediction 1. Introduction The enhancement of steel fiber on the mechanical properties of concrete is affected by the mix proportion, fiber geometric characteristics and distribution pattern [1–3]. This directly affects the loading behaviors of reinforced concrete components including beams and slabs with the presence of steel fibers [4–8]. Compared with vibrated steel fiber rein- forced concrete (SFRC), self-compacting SFRC is made with more contents of cementitious materials and fine aggregate, and smaller particle size of coarse aggregate [9–11]. This leads to the different fiber distribution and aggregate skeleton of self-compacting SFRC from those of vibrated SFRC, which further leads to the different tensile properties of self-compacting SFRC [1,12–14]. Splitting tensile test and axial tensile test are common test methods for the tensile strength of concrete. Meanwhile, the axial tensile stress-strain curve and the tensile tough- ness of concrete can be gotten from the axial tensile test [15]. However, restricted by the stiffness and clamping conditions of testing machine, the size and shape of axial tensile specimens are various, and the failure interface may appear in the non-tested cross- section [16–18]. Splitting tensile test is often used in research and practical engineering due to its easy operation, simple test process and low requirement for stiffness of testing machine [19]. This method is built upon the assumption that the uniform distribution of horizontal stress exists in the splitting section, except part of section closed to the splitting strips on top and bottom surfaces of the specimen. For conventional concrete close to Crystals 2021, 11, 251. https://doi.org/10.3390/cryst11030251 https://www.mdpi.com/journal/crystals
-
Upload
khangminh22 -
Category
Documents
-
view
0 -
download
0
Transcript of Tensile Behavior of Self-Compacting Steel Fiber ... - MDPI

crystals
Article
Tensile Behavior of Self-Compacting Steel Fiber ReinforcedConcrete Evaluated by Different Test Methods
Xinxin Ding 1,*, Changyong Li 1 , Minglei Zhao 2, Jie Li 2,* , Haibin Geng 1 and Lei Lian 3
�����������������
Citation: Ding, X.; Li, C.; Zhao, M.;
Li, J.; Geng, H.; Lian, L. Tensile
Behavior of Self-Compacting Steel
Fiber Reinforced Concrete Evaluated
by Different Test Methods. Crystals
2021, 11, 251. https://doi.org/
10.3390/cryst11030251
Academic Editors: Sławomir J.
J. Grabowski and Adam Stolarski
Received: 30 January 2021
Accepted: 25 February 2021
Published: 28 February 2021
Publisher’s Note: MDPI stays neutral
with regard to jurisdictional claims in
published maps and institutional affil-
iations.
Copyright: © 2021 by the authors.
Licensee MDPI, Basel, Switzerland.
This article is an open access article
distributed under the terms and
conditions of the Creative Commons
Attribution (CC BY) license (https://
creativecommons.org/licenses/by/
4.0/).
1 International Joint Research Lab for Eco-building Materials and Engineering of Henan, School of CivilEngineering and Communications, North China University of Water Resources and Electric Power,Zhengzhou 450045, China; [email protected] (C.L.); [email protected] (H.G.)
2 School of Engineering, RMIT University, Melbourne, VIC 3001, Australia; [email protected] Changjiang Yichang Waterway Bureau, No. 273 Dongshan Avenue, Yichang 443500, China;
[email protected]* Correspondence: [email protected] (X.D.); [email protected] (J.L.)
Abstract: Due to the mechanical properties related closely to the distribution of steel fibers in concretematrix, the assessment of tensile strength of self-compacting steel fiber reinforced concrete (SFRC) issignificant for the engineering application. In this paper, seven groups of self-compacting SFRC wereproduced with the mix proportion designed by using the steel fiber-aggregates skeleton packingtest method. The hooked-end steel fibers with length of 25.1 mm, 29.8 mm and 34.8 mm were used,and the volume fraction varied from 0.4% to 1.4%. The axial tensile test of notched sectional prismspecimen and the splitting tensile test of cube specimen were carried out. Results show that the axialtensile strength was higher than the splitting tensile strength for the same self-compacting SFRC, theaxial tensile work and toughness was not related to the length of steel fiber. Finally, the equationsfor the prediction of tensile strength of self-compacting SFRC are proposed considering the fiberdistribution and fiber factor, and the adaptability of splitting tensile test for self-compacting SFRCis discussed.
Keywords: self-compacting SFRC; axial tensile strength; splitting tensile strength; notched section;axial tensile toughness; prediction
1. Introduction
The enhancement of steel fiber on the mechanical properties of concrete is affectedby the mix proportion, fiber geometric characteristics and distribution pattern [1–3]. Thisdirectly affects the loading behaviors of reinforced concrete components including beamsand slabs with the presence of steel fibers [4–8]. Compared with vibrated steel fiber rein-forced concrete (SFRC), self-compacting SFRC is made with more contents of cementitiousmaterials and fine aggregate, and smaller particle size of coarse aggregate [9–11]. Thisleads to the different fiber distribution and aggregate skeleton of self-compacting SFRCfrom those of vibrated SFRC, which further leads to the different tensile properties ofself-compacting SFRC [1,12–14].
Splitting tensile test and axial tensile test are common test methods for the tensilestrength of concrete. Meanwhile, the axial tensile stress-strain curve and the tensile tough-ness of concrete can be gotten from the axial tensile test [15]. However, restricted bythe stiffness and clamping conditions of testing machine, the size and shape of axialtensile specimens are various, and the failure interface may appear in the non-tested cross-section [16–18]. Splitting tensile test is often used in research and practical engineeringdue to its easy operation, simple test process and low requirement for stiffness of testingmachine [19]. This method is built upon the assumption that the uniform distribution ofhorizontal stress exists in the splitting section, except part of section closed to the splittingstrips on top and bottom surfaces of the specimen. For conventional concrete close to
Crystals 2021, 11, 251. https://doi.org/10.3390/cryst11030251 https://www.mdpi.com/journal/crystals

Crystals 2021, 11, 251 2 of 12
brittle material, this assumption is adaptable to get a relatively accurate result of tensilestrength, which is always slightly higher than the axial tensile strength [20]. However, it isno longer fully applicable for SFRC due to the steel fibers involved in tensile work. Withthe development of a cracking section of splitting tensile specimen, the stress distributionbecomes complex with the restrained local area of steel fiber near the splitting surface. Theexperimental studies on vibrated SFRC [17,21] indicated that, the enhancing coefficient ofsteel fiber on the axial tensile strength is less than that on the splitting tensile strength, andthe ratio of axial tensile strength to splitting tensile strength decreases with the increaseof fiber factor and the concrete compressive strength. The ductile behavior of the SFRCleads to a large compressive zone under the loading strip in the splitting tensile test, whichmakes the load distributed unevenly in the load direction [21].
At present, the splitting tensile test and axial tensile test are commonly used todetermine the tensile strength of self-compacting SFRC. Ghanbarpour [13] reported thatthe ratio of splitting tensile strength to compressive strength for self-compacting SFRC islower than that of vibrated SFRC, due to the characteristic of finer raw materials in self-compacting SFRC. Akcay and Tasdemir [1] presented that both the splitting tensile strengthand flexural strength of self-compacting SFRC increased linearly with the volume fractionof steel fiber, while the increasing rate of flexural strength was higher due to the trends ofsteel fibers oriented along the bending direction; the effect of tensile strength of steel fiberon the splitting tensile strength was not obvious, but on the flexural strength was significant.Khala and Nazari [22] reported that the splitting tensile strength of self-compacting SFRCwas improved with the randomly oriented steel fibers up to volume fraction of 1.2%. Thestudy of You et al. [23] on the axial tensile strength of self-compacting SFRC by usingnotched prism specimen showed that, the axial tensile strength was enhanced obviouslywith longer fiber, and the growth tended to be stable or even decreased with the increasingvolume fraction of steel fiber. Clifford et al. [24] reported that compared to the self-compacting SFRC with single hooked-end steel fiber and microfiber, the self-compactingSFRC with double hooked-end steel fiber and microfiber had higher axial tensile strength,lower fracture energy, smaller cracking strain and ultimate strain. Cunha et al. [25] studiedthe axial tensile properties of self-compacting SFRC by using notched cylinder specimen.Results indicated that the tensile properties after-cracking correlated positively with theeffective number of bridged fibers in the failure section, pseudo strain hardening wasobserved in the descending portion of axial tensile stress-strain curve for self-compactingSFRC due to the pulling out of most bridged fibers, the residual tensile stress reducedsignificantly with the breakage of most bridged fibers. The study of Liao et al. [26] on theaxial tensile properties of self-compacting SFRC by using large-end specimens presentedthat, with the hooked-end steel fiber in volume fraction from 0.38% to 1.96%, pseudo strainhardening appeared on the tensile stress-strain curve, and the failure was accompanied bymulti-cracks.
Based on the above analyses, the comparative research is rare on splitting tensilestrength and axial tensile strength of self-compacting SFRC, the axial tensile stress-straincurves of self-compacting SFRC are also short of experimental data. These efforts needto be enriched to facilitate the engineering application of self-compacting SFRC. In thispaper, the self-compacting SFRC was produced based on the steel fiber-aggregates skeletonpacking test method, in which the amount of cementitious material and reasonable sandratio are related to the fiber factor. The axial tensile test was carried out using notched prismspecimen to control the cracking section and to eliminate the wall effect of steel fiber on thetensile properties of self-compacting SFRC [16,18]. The splitting tensile test was carried outusing cube specimen. With the comparison of test results, the influence of test methods onthe tensile strength of self-compacting SFRC is studied. Finally, the practicability of thesplitting tensile test method used for self-compacting SFRC is evaluated.

Crystals 2021, 11, 251 3 of 12
2. Materials and Methods2.1. Raw Materials
All of the raw materials are the same as the former research [27]. The cement wasgrade P.O 42.5 ordinary silicate cement with density of 3085 kg/m3, compressive strengthat 28 d of 54.7 MPa and flexural strength at 28 d of 9.43 MPa. The class-II fly ash was usedas the mineral admixture with density of 2349 kg/m3 and activity index of 80.9%.
The coarse aggregate was crushed limestone in continuous grading with the particlesizes of 5–16 mm, the apparent density of 2736 kg/m3, the bulk density of 1529 kg/m3,and the crush index of 12.2%.
The fine aggregate was manufactured sand with the fineness modulus of 2.73, theapparent density of 2740 kg/m3, the bulk density of 1620 kg/m3, and the stone-powdercontent of 7.3%.
The water reducer was high-performance polycarboxylic acid type with measuredwater-reducing rate of 30% and solid content of 35%. The mix water was tap-water ofZhengzhou, China.
The hooked-end steel fibers with three different lengths were used, and identifiedas HFa, HFb and HFc, respectively. All fibers had a diameters df of 0.5 mm and tensilestrength of 1150 MPa. The measured length lf was 25.1 mm, 29.8 mm and 34.8 mm, andthe fiber aspect ratio lf/df was 50, 60 and 70, successively. The numbers of steel fibers perkilogram were 25,861, 21,637 and 18,546.
2.2. Preparation of Self-Compacting SFRC
The mix proportion of self-compacting SFRC was designed by using the steel fiber-aggregates skeleton packing test method [28,29]. Six groups of self-compacting SFRC weredesigned with the volume fraction of steel fiber vf F 0.4%, 0.8%, 1.2%, 1.4%, 1.2% and 1.2%,and successively identified as HFb04, HFb08, HFb12, HFb14, HFa12 and HFc12. The lengthand the volume fraction of steel fiber were considered as main factors. The water to binderratio w/b is constant of 0.31, the content of fly ash was 30% of the total mass of binders, thesand ratios changed rationally with the fiber factor λf. The fiber factor is the product ofthe volume fraction and the aspect ratio of steel fiber. That is, λf = vf·lf/df. Detailed mixproportion of which, are presented in Table 1. One group of self-compacting concrete (SCC)without steel fiber was used as the reference concrete.
Table 1. Detailed mix proportion of self-compacting (steel fiber reinforced concrete) SFRC andreference (self-compacting concrete) SCC.
Concrete SCC HFb04 HFb08 HFb12 HFb14 HFa12 HFc12
w/b 0.31 0.31 0.31 0.31 0.31 0.31 0.31Sand ratio βs (%) 50 52 54 56 57 55 57
Fly ash content (%) 30 30 30 30 30 30 30
Steel fiberIdentifer - HFb HFb HFb HFb HFa HFcvf (%) 0 0.4 0.8 1.2 1.4 1.2 1.2
Water (kg/m3) 192 201 210 219 223 214 223Cement (kg/m3) 433 454 474 494 504 484 504Fly ash (kg/m3) 186 194 203 214 216 207 216
Crushed stone (kg/m3) 751 675 601 527 491 553 502Sand (kg/m3) 751 763 774 783 788 784 782
Water-reducer (kg/m3) 5.57 5.51 5.42 5.30 5.40 5.19 5.40Steel fiber (kg/m3) 0 31.4 62.8 94.2 109.9 94.2 94.2
The mixture was mixed by a horizontal shaft forced-mixer. The cement, fly ash,manufactured sand and one-third of the water were mixed firstly for 1 min, and then theresidual water mixed with water-reducer was added to mix for 3 min. After that, thecrushed limestone and the steel fiber were added successively and mixed at least for 4 min.

Crystals 2021, 11, 251 4 of 12
The workability of fresh concrete was measured in accordance with the specificationof China code JGJ/T 283 [29]. The slump flow of SCC, HFb04, HFb08, HFb12, HFb14, andHFa12 were ranged from 630 mm to 685 mm. The slump flow time T500 ranged from 4.33 sto 6.28 s, which is the time from the beginning of lifting the slump cone to the slump flowof fresh concrete reaching at 500 mm. It means that the six groups of fresh concretes arefit for constructing of the conventional reinforced concrete structures. HFc12 has slumpflow of 560 mm and the flow time T500 of 6.71 s, which is fit for constructing of the concretestructures without reinforcement or with a minor amount of reinforcement.
2.3. Test Method
The splitting tensile strength of self-compacting SFRC was in accordance with thespecification of China code GB50081 [19]. Three cube specimens with dimension of 150 mmwere used as a group in the splitting test. A total of 21 cube specimens were cured instandard curing room for 90 days. Figure 1 presents the specimen with splitting strips. Thetest was carried out by a servo hydraulic universal testing machine made by SANS Co. Ltd.with maximum load of 600 kN. The loading direction was opposite to the gravity direction,and the loading speed was 2 kN/s. The test was finished with the splitting tensile fractureof the specimen.
Crystals 2021, 11, x FOR PEER REVIEW 4 of 12
The mixture was mixed by a horizontal shaft forced-mixer. The cement, fly ash, man-ufactured sand and one-third of the water were mixed firstly for 1 min, and then the re-sidual water mixed with water-reducer was added to mix for 3 min. After that, the crushed limestone and the steel fiber were added successively and mixed at least for 4 min.
The workability of fresh concrete was measured in accordance with the specification of China code JGJ/T 283 [29]. The slump flow of SCC, HFb04, HFb08, HFb12, HFb14, and HFa12 were ranged from 630 mm to 685 mm. The slump flow time T500 ranged from 4.33 s to 6.28 s, which is the time from the beginning of lifting the slump cone to the slump flow of fresh concrete reaching at 500 mm. It means that the six groups of fresh concretes are fit for constructing of the conventional reinforced concrete structures. HFc12 has slump flow of 560 mm and the flow time T500 of 6.71 s, which is fit for constructing of the concrete structures without reinforcement or with a minor amount of reinforcement.
2.3. Test Method The splitting tensile strength of self-compacting SFRC was in accordance with the
specification of China code GB50081 [19]. Three cube specimens with dimension of 150 mm were used as a group in the splitting test. A total of 21 cube specimens were cured in standard curing room for 90 days. Figure 1 presents the specimen with splitting strips. The test was carried out by a servo hydraulic universal testing machine made by SANS Co. Ltd. with maximum load of 600 kN. The loading direction was opposite to the gravity direction, and the loading speed was 2 kN/s. The test was finished with the splitting ten-sile fracture of the specimen.
Figure 1. Specimens of splitting tensile test.
The axial tensile test was in accordance with the specification of China code CECS13 [15]. Three prism specimens as a group were used in the axial tensile test. As presented in Figure 2, the specimens were prisms with the centrally embedded tensile bars at the ends. The dimension of the prism was 150 mm × 150 mm × 550 mm. A total of 21 prism speci-mens were cured at standard curing room for 90 days. Referenced to the treatment method specified in RILEM TC-162 [30], the notch around cross-section of prism was cute before testing to eliminate the “wall effect” of steel fibers [15,31]. The notch was 25 mm deep and 10 mm wide. The notch section was square with side length of 100 mm.
The axial tensile test was carried out by a servo hydraulic universal testing machine with maximum load of 600 kN. As presented in Figure 3, the steel bars embedded in the ends of specimens were linked with the spherical universal hinge device of testing ma-chine to eliminate the eccentricity effect [15,32]. Two LVDTs with measure scope of 5 mm, identified as LVDT1, and two LVDTs with measure scope of 20 mm, identified as LVDT2, were used to ensure the measuring precision and range simultaneously. After the speci-
Figure 1. Specimens of splitting tensile test.
The axial tensile test was in accordance with the specification of China code CECS13 [15].Three prism specimens as a group were used in the axial tensile test. As presented inFigure 2, the specimens were prisms with the centrally embedded tensile bars at the ends.The dimension of the prism was 150 mm × 150 mm × 550 mm. A total of 21 prism speci-mens were cured at standard curing room for 90 days. Referenced to the treatment methodspecified in RILEM TC-162 [30], the notch around cross-section of prism was cute beforetesting to eliminate the “wall effect” of steel fibers [15,31]. The notch was 25 mm deep and10 mm wide. The notch section was square with side length of 100 mm.

Crystals 2021, 11, 251 5 of 12
Crystals 2021, 11, x FOR PEER REVIEW 5 of 12
men was fixed on the testing machine, four LVDTs were installed near the corner of spec-imen by using the fixing rings. The load and four displacements were collected synchro-nously and independently during the loading process. The average of four displacements was used as the measured deformation of the specimen. The tensile stress-strain curve was drawn based on the test results. The tensile stress was computed by the load on notch section, the tensile strain was computed with the gauge length of 150 mm. The loading speed was 0.1 mm/min, and the test was finished with the axial tensile fracture of the specimen.
(a) (b)
Figure 2. Specimens of axial tensile test: (a) notched specimen with tensile bars; (b) notch section of specimen.
Figure 3. Testing machine and device for axial tensile strength of concrete.
3. Test Results and Discussion 3.1. Splitting Tensile Test 3.1.1. Test Phenomena
The specimen of the SCC broke into two parts due to the brittle cracking, the crack passed through both aggregates and hardened cement paste to form a flat failure surface. However, the different failure pattern appeared on the self-compacting SFRC specimens and the crushed zone are emphasized with red lines in Figure 4. Local splitting cracks first turned on the specimen near the splitting strips when the load reached a certain value, and the steel fibers bridging the cracks redistributed the tensile stress of the cracked SFRC matrix. The splitting section continuously cracked under the increased load, and the split-ting failure presented a ductile feature with the development of the bond-slip of steel fiber [32]. The width of splitting crack decreased along with the direction from the passive load-ing surface to the active loading surface. With the increase of volume fraction of steel fiber,
Figure 2. Specimens of axial tensile test: (a) notched specimen with tensile bars; (b) notch sectionof specimen.
The axial tensile test was carried out by a servo hydraulic universal testing machinewith maximum load of 600 kN. As presented in Figure 3, the steel bars embedded inthe ends of specimens were linked with the spherical universal hinge device of testingmachine to eliminate the eccentricity effect [15,32]. Two LVDTs with measure scope of 5 mm,identified as LVDT1, and two LVDTs with measure scope of 20 mm, identified as LVDT2,were used to ensure the measuring precision and range simultaneously. After the specimenwas fixed on the testing machine, four LVDTs were installed near the corner of specimen byusing the fixing rings. The load and four displacements were collected synchronously andindependently during the loading process. The average of four displacements was usedas the measured deformation of the specimen. The tensile stress-strain curve was drawnbased on the test results. The tensile stress was computed by the load on notch section,the tensile strain was computed with the gauge length of 150 mm. The loading speed was0.1 mm/min, and the test was finished with the axial tensile fracture of the specimen.
Crystals 2021, 11, x FOR PEER REVIEW 5 of 12
men was fixed on the testing machine, four LVDTs were installed near the corner of spec-imen by using the fixing rings. The load and four displacements were collected synchro-nously and independently during the loading process. The average of four displacements was used as the measured deformation of the specimen. The tensile stress-strain curve was drawn based on the test results. The tensile stress was computed by the load on notch section, the tensile strain was computed with the gauge length of 150 mm. The loading speed was 0.1 mm/min, and the test was finished with the axial tensile fracture of the specimen.
(a) (b)
Figure 2. Specimens of axial tensile test: (a) notched specimen with tensile bars; (b) notch section of specimen.
Figure 3. Testing machine and device for axial tensile strength of concrete.
3. Test Results and Discussion 3.1. Splitting Tensile Test 3.1.1. Test Phenomena
The specimen of the SCC broke into two parts due to the brittle cracking, the crack passed through both aggregates and hardened cement paste to form a flat failure surface. However, the different failure pattern appeared on the self-compacting SFRC specimens and the crushed zone are emphasized with red lines in Figure 4. Local splitting cracks first turned on the specimen near the splitting strips when the load reached a certain value, and the steel fibers bridging the cracks redistributed the tensile stress of the cracked SFRC matrix. The splitting section continuously cracked under the increased load, and the split-ting failure presented a ductile feature with the development of the bond-slip of steel fiber [32]. The width of splitting crack decreased along with the direction from the passive load-ing surface to the active loading surface. With the increase of volume fraction of steel fiber,
Figure 3. Testing machine and device for axial tensile strength of concrete.
3. Test Results and Discussion3.1. Splitting Tensile Test3.1.1. Test Phenomena
The specimen of the SCC broke into two parts due to the brittle cracking, the crackpassed through both aggregates and hardened cement paste to form a flat failure surface.However, the different failure pattern appeared on the self-compacting SFRC specimensand the crushed zone are emphasized with red lines in Figure 4. Local splitting cracksfirst turned on the specimen near the splitting strips when the load reached a certain

Crystals 2021, 11, 251 6 of 12
value, and the steel fibers bridging the cracks redistributed the tensile stress of the crackedSFRC matrix. The splitting section continuously cracked under the increased load, and thesplitting failure presented a ductile feature with the development of the bond-slip of steelfiber [32]. The width of splitting crack decreased along with the direction from the passiveloading surface to the active loading surface. With the increase of volume fraction of steelfiber, the crack width and the crushed zone of the specimen on the passive loading surfacedecreased significantly. This indicates that the more complex stress distribution took placeon the splitting section of specimen of self-compacting SFRC.
Crystals 2021, 11, x FOR PEER REVIEW 6 of 12
the crack width and the crushed zone of the specimen on the passive loading surface de-creased significantly. This indicates that the more complex stress distribution took place on the splitting section of specimen of self-compacting SFRC.
HFb04 HFb08 HFb12 HFb14
Figure 4. Failure patterns of splitting tensile specimens with the crushed zone emphasized by red lines.
3.1.2. Splitting Tensile Strength The splitting tensile strength fst could increase by 3.4~15.9% with the volume fraction
of steel fiber HFb increased to be 1.2%. With the same vf = 1.2%, the fst increased by 10.9% with the fiber length increased from 25.1 mm to 34.8 mm. The changes of the splitting tensile strength fst of self-compacting SFRC with fiber factor λf is drawn in Figure 5. This indicates that a direct proportional linear relationship between fst and λf can be fitted out, and presented as equation (1) based on previous study [31],
st st,0 tb te f(1 )f f α α λ= + (1)
where, αte is a coefficient related to the fiber distribution, αte = 0.441[31]; αtb is the compre-hensive coefficient of other factors affecting the bridging effect of steel fiber in the splitting tensile test; fst,0 is the splitting tensile strength of SCC.
By fitting the test data of fst in this paper, the coefficient αtb is 0.307. Figure 5 presents the comparison of test and calculation values of fst. The average ratio is 1.008 with a dis-persion coefficient of 0.035.
0.0 0.1 0.2 0.3 0.4 0.5 0.6 0.7 0.8 0.92
3
4
5
6
Equation 1 SCC, HFb04~HFb14 HFa12 HFc12
f st (M
Pa)
λf
Figure 5. Changes of the splitting tensile strength with fiber factor.
3.2. Axial Tensile Test 3.2.1. Test Phenomena
Typical failure patterns of axial tensile specimens of self-compacting SFRC are pre-sented in Figure 6. Similar to the failure of notched cylinders [25], two failure modes were observed in this test: one mode was the breakage of bridged steel fibers, another was the
Figure 4. Failure patterns of splitting tensile specimens with the crushed zone emphasized byred lines.
3.1.2. Splitting Tensile Strength
The splitting tensile strength f st could increase by 3.4~15.9% with the volume fractionof steel fiber HFb increased to be 1.2%. With the same vf = 1.2%, the f st increased by 10.9%with the fiber length increased from 25.1 mm to 34.8 mm. The changes of the splittingtensile strength f st of self-compacting SFRC with fiber factor λf is drawn in Figure 5. Thisindicates that a direct proportional linear relationship between f st and λf can be fitted out,and presented as Equation (1) based on previous study [31],
fst = fst,0(1 + αtbαteλf) (1)
where, αte is a coefficient related to the fiber distribution, αte = 0.441 [31]; αtb is the compre-hensive coefficient of other factors affecting the bridging effect of steel fiber in the splittingtensile test; f st,0 is the splitting tensile strength of SCC.
Crystals 2021, 11, x FOR PEER REVIEW 6 of 12
the crack width and the crushed zone of the specimen on the passive loading surface de-creased significantly. This indicates that the more complex stress distribution took place on the splitting section of specimen of self-compacting SFRC.
HFb04 HFb08 HFb12 HFb14
Figure 4. Failure patterns of splitting tensile specimens with the crushed zone emphasized by red lines.
3.1.2. Splitting Tensile Strength The splitting tensile strength fst could increase by 3.4~15.9% with the volume fraction
of steel fiber HFb increased to be 1.2%. With the same vf = 1.2%, the fst increased by 10.9% with the fiber length increased from 25.1 mm to 34.8 mm. The changes of the splitting tensile strength fst of self-compacting SFRC with fiber factor λf is drawn in Figure 5. This indicates that a direct proportional linear relationship between fst and λf can be fitted out, and presented as equation (1) based on previous study [31],
st st,0 tb te f(1 )f f α α λ= + (1)
where, αte is a coefficient related to the fiber distribution, αte = 0.441[31]; αtb is the compre-hensive coefficient of other factors affecting the bridging effect of steel fiber in the splitting tensile test; fst,0 is the splitting tensile strength of SCC.
By fitting the test data of fst in this paper, the coefficient αtb is 0.307. Figure 5 presents the comparison of test and calculation values of fst. The average ratio is 1.008 with a dis-persion coefficient of 0.035.
0.0 0.1 0.2 0.3 0.4 0.5 0.6 0.7 0.8 0.92
3
4
5
6
Equation 1 SCC, HFb04~HFb14 HFa12 HFc12
f st (M
Pa)
λf
Figure 5. Changes of the splitting tensile strength with fiber factor.
3.2. Axial Tensile Test 3.2.1. Test Phenomena
Typical failure patterns of axial tensile specimens of self-compacting SFRC are pre-sented in Figure 6. Similar to the failure of notched cylinders [25], two failure modes were observed in this test: one mode was the breakage of bridged steel fibers, another was the
Figure 5. Changes of the splitting tensile strength with fiber factor.
By fitting the test data of f st in this paper, the coefficient αtb is 0.307. Figure 5 presentsthe comparison of test and calculation values of f st. The average ratio is 1.008 with adispersion coefficient of 0.035.

Crystals 2021, 11, 251 7 of 12
3.2. Axial Tensile Test3.2.1. Test Phenomena
Typical failure patterns of axial tensile specimens of self-compacting SFRC are pre-sented in Figure 6. Similar to the failure of notched cylinders [25], two failure modes wereobserved in this test: one mode was the breakage of bridged steel fibers, another was thepulling of bridged fiber out of the SFRC matrix. The former was observed in specimensof HFb04, and the latter was observed in specimens of HFb08, HFb12, HFb14, HFa12 andHFc12. This indicates that the bridged steel fibers were subjected to the tensile force whichreleased from the cracked SFRC matrix. When the bridged steel fibers were insufficient tobear the tensile force, they would be broken with the suddenly overloading. Otherwise,the bridged steel fibers could continuously bear the tension to produce the bond-slip untilpull out.
Crystals 2021, 11, x FOR PEER REVIEW 7 of 12
pulling of bridged fiber out of the SFRC matrix. The former was observed in specimens of HFb04, and the latter was observed in specimens of HFb08, HFb12, HFb14, HFa12 and HFc12. This indicates that the bridged steel fibers were subjected to the tensile force which released from the cracked SFRC matrix. When the bridged steel fibers were insufficient to bear the tensile force, they would be broken with the suddenly overloading. Otherwise, the bridged steel fibers could continuously bear the tension to produce the bond-slip until pull out.
(a) (b)
Figure 6. Typical failure patterns of axial tensile specimens: (a) fiber breakage of HFb04; (b) fiber pull-out of HFb12.
3.2.2. Axial Tensile Strength and Stress-strain Curve The axial tensile stress-strain curves of self-compacting SFRC are presented in Figure
7. Due to difficult control in the post-peak region at the axial tensile test, specimens of SCC and HFb04 had no descending portion of axial tensile stress-strain curve. For specimen HFb08 with vf = 0.8%, a sharp drop existed on the stress-strain curve once the load reached the initial cracking resistance of the notch section, of which the initial cracking strength is the axial tensile strength. For specimens of HFb12, HFb14, HFa12 and HFc12 with vf ≥ 1.2%, the descending portion of axial tensile stress-strain curves became gently with the gradually pulling out of steel fibers. Due to enough steel fibers bridged on notch section, the cracking load could be sustained or even increased slightly with the increase of tensile strain. This leads an increased axial tensile strength of self-compacting SFRC with the in-creasing volume fraction of steel fiber.
0 50 100 1500
1
2
3
4
5
6
0
1
2
3
4
5
6
Stre
ss (M
Pa)
Strain (×10−6)
Stre
ss(M
Pa)
SCC HFb04 HFb08 HFb12 HFb14 HFa12
HFc12
Strain (×10−6)0 6,000 12,000 18,000 24,000 30,000
Figure 7. The axial tensile stress-strain curves of self-compacting SFRC.
With the increase of fiber length compared with HFa, the number of steel fiber per kilogram of HFb and HFc reduced by 19.5% and 39.4%. This led a reduction of the pres-ence of steel fiber on notch section. As a result, the loading capacity of bridged steel fiber on notch section reduced after cracking. HFa has higher loading capacity with the same strain compared with HFb and HFc. This indicates the initial descending of the stress-
Figure 6. Typical failure patterns of axial tensile specimens: (a) fiber breakage of HFb04; (b) fiberpull-out of HFb12.
3.2.2. Axial Tensile Strength and Stress-strain Curve
The axial tensile stress-strain curves of self-compacting SFRC are presented in Figure 7.Due to difficult control in the post-peak region at the axial tensile test, specimens of SCCand HFb04 had no descending portion of axial tensile stress-strain curve. For specimenHFb08 with vf = 0.8%, a sharp drop existed on the stress-strain curve once the load reachedthe initial cracking resistance of the notch section, of which the initial cracking strengthis the axial tensile strength. For specimens of HFb12, HFb14, HFa12 and HFc12 withvf ≥ 1.2%, the descending portion of axial tensile stress-strain curves became gently withthe gradually pulling out of steel fibers. Due to enough steel fibers bridged on notchsection, the cracking load could be sustained or even increased slightly with the increase oftensile strain. This leads an increased axial tensile strength of self-compacting SFRC withthe increasing volume fraction of steel fiber.
Crystals 2021, 11, x FOR PEER REVIEW 7 of 12
pulling of bridged fiber out of the SFRC matrix. The former was observed in specimens ofHFb04, and the latter was observed in specimens of HFb08, HFb12, HFb14, HFa12 and HFc12. This indicates that the bridged steel fibers were subjected to the tensile force which released from the cracked SFRC matrix. When the bridged steel fibers were insufficient tobear the tensile force, they would be broken with the suddenly overloading. Otherwise,the bridged steel fibers could continuously bear the tension to produce the bond-slip until pull out.
(a) (b)
Figure 6. Typical failure patterns of axial tensile specimens: (a) fiber breakage of HFb04; (b) fiber pull-out of HFb12.
3.2.2. Axial Tensile Strength and Stress-strain CurveThe axial tensile stress-strain curves of self-compacting SFRC are presented in Figure
7. Due to difficult control in the post-peak region at the axial tensile test, specimens of SCC and HFb04 had no descending portion of axial tensile stress-strain curve. For specimen HFb08 with vf = 0.8%, a sharp drop existed on the stress-strain curve once the load reachedthe initial cracking resistance of the notch section, of which the initial cracking strength isthe axial tensile strength. For specimens of HFb12, HFb14, HFa12 and HFc12 with vf ≥ 1.2%, the descending portion of axial tensile stress-strain curves became gently with the gradually pulling out of steel fibers. Due to enough steel fibers bridged on notch section, the cracking load could be sustained or even increased slightly with the increase of tensile strain. This leads an increased axial tensile strength of self-compacting SFRC with the in-creasing volume fraction of steel fiber.
0 50 100 1500
1
2
3
4
5
6
0
1
2
3
4
5
6
Stre
ss (M
Pa)
Strain (×10−6)
Stre
ss(M
Pa)
SCC HFb04 HFb08 HFb12 HFb14 HFa12
HFc12
Strain (×10−6)0 6000 12,000 18,000 24,000 30,000
Figure 7. The axial tensile stress-strain curves of self-compacting SFRC.
With the increase of fiber length compared with HFa, the number of steel fiber per kilogram of HFb and HFc reduced by 19.5% and 39.4%. This led a reduction of the pres-ence of steel fiber on notch section. As a result, the loading capacity of bridged steel fiber on notch section reduced after cracking. HFa has higher loading capacity with the same strain compared with HFb and HFc. This indicates the initial descending of the stress-
Figure 7. The axial tensile stress-strain curves of self-compacting SFRC.

Crystals 2021, 11, 251 8 of 12
With the increase of fiber length compared with HFa, the number of steel fiber perkilogram of HFb and HFc reduced by 19.5% and 39.4%. This led a reduction of the presenceof steel fiber on notch section. As a result, the loading capacity of bridged steel fiber onnotch section reduced after cracking. HFa has higher loading capacity with the same straincompared with HFb and HFc. This indicates the initial descending of the stress-straincurve dropped sharply with the increasing length of steel fiber. The stable presentationof stress-strain curves at descending portion are related to the better bond properties ofhooked-end steel fiber in SFRC matrix [32].
The axial tensile test results of self-compacting SFRC are presented in Table 2. f fcr isthe initial cracking tensile strength of self-compacting SFRC, which is calculated with theinitial cracking load divided by the notch section area of the specimen. f fa is the peak tensilestress after the cracking of the notched specimen, which is calculated with the maximumload after cracking divided by the notch section area of the specimen. εfcr is the initialcracking tensile strain corresponding to f fcr. εfa is the tensile strain corresponding to f fa.According to China code CECS13 [15], the axial tensile strength f at is larger one of f fcr andf fa, εat is the strain corresponded to the axial tensile strength.
Table 2. Test results of axial tensile strength and strain.
Item SCC HFb04 HFb08 HFb12 HFb14 HFa12 HFc12
Strengths
f fcr (MPa) 4.59 4.77 5.08 5.55 5.65 5.69 5.52f fa (MPa) - - - 5.66 5.59 5.66 5.64f at (MPa) 4.59 4.77 5.08 5.66 5.65 5.69 5.64
Corresponding strains
εfcr (10−6) 63.3 95.3 81.4 91.7 70.3 103.4 102.6εfa (10−6) - - 101.1 73.5 133.3 160.3εat(10−6) 63.3 95.3 81.4 101.1 70.3 103.4 160.3
Due to the brittle fracture after cracking, no values of f fa were measured for thespecimens with vf ≤ 0.8%. For other specimens with vf ≥ 1.2%, the values of f fcr and f faare almost the same, while the strains εfcr and εfa increased slightly with the increasingvolume fraction of steel fiber. This provides a good tension resistance of specimen withlarger deformation.
The axial tensile strength f at keeps a linear growth with the increase of fiber factor.f at increases by 22.8–23.9% with the volume fraction of steel fiber HFb increased up to1.2%. With the same vf = 1.2%, the axial tensile strength f at decreases slightly with differentfiber length. Figure 8 exhibits the changes of the axial tensile strength of self-compactingSFRC with the fiber factor λf. This indicates that a direct proportional linear relationshipbetween f at and λf can be fitted out. Therefore, the prediction of axial tensile strength ofself-compacting SFRC considering fiber distribution can be done with Equation (2),
fat = fat,0(1 + αtaαteλf) (2)
where, αte is the influence coefficient of fiber distribution, αte = 0.441 [31]; αta is the com-prehensive coefficient of other factors affecting the bridging effect of steel fiber in the axialtensile test; f at,0 is the axial tensile strength of SCC.

Crystals 2021, 11, 251 9 of 12Crystals 2021, 11, x FOR PEER REVIEW 9 of 12
0.0 0.1 0.2 0.3 0.4 0.5 0.6 0.7 0.8 0.92
3
4
5
6
7
8SCC, HFb04~HFb14 HFa12 HFc12
Equation 2
f at (M
Pa)
λf Figure 8. Axial tensile strength as a function of the fiber content.
By fitting the test data of fat in this paper, αta is 0.631. Figure 8 presents the comparison of test and calculation values of fat. The average ratio is 0.998 with a dispersion coefficient of 0.084.
3.2.3. Axial Tensile Toughness According to the specification of China code CECS 13 [15], the tension work Wf,0.2 is
the area under the axial tensile load-deformation curve. The maximum deformation of 0.3 mm is calculated by 0.2 times of gauge length l0 = 150 mm. The axial tensile toughness ratio Rfe,0.2 is calculated by equation (3).
f,0.2fe,0.2
0 at0.2%W
Rl f A
= (3)
Where, A is the notch section area of the specimen. From the axial tensile load-deformation curves presented in Figure 9, the calculation
results of Wf,0.2 and Rfe,0.2 are shown in Figure 10. The positive correlations exist for Wf,0.2 and Rfe,0.2 with the fiber factor λf of HFb steel fiber, due to the more pull-out work needed to be exerted on the notch section of specimen with more steel fibers. However, no obvious relationships were observed in Wf,0.2 and Rfe,0.2 of self-compacting SFRC with the fiber length, as the hooked-end rather than fiber length plays a role controlling the bond per-formance in self-compacting SFRC [32].
0 1 2 3 4 5
10
20
30
40
50
60
0.01 0.02 0.030
10
20
30
40
50
60
Loa
d (k
N)
SCC HFb04 HFb08 HFb12 HFb14 HFa12
HFc12
Deformation (mm)
Load
(kN
)
Deformation (mm) Figure 9. The axial tensile load-deformation curves of self-compacting SFRC.
Figure 8. Axial tensile strength as a function of the fiber content.
By fitting the test data of f at in this paper, αta is 0.631. Figure 8 presents the comparisonof test and calculation values of f at. The average ratio is 0.998 with a dispersion coefficientof 0.084.
3.2.3. Axial Tensile Toughness
According to the specification of China code CECS 13 [15], the tension work Wf,0.2 isthe area under the axial tensile load-deformation curve. The maximum deformation of0.3 mm is calculated by 0.2 times of gauge length l0 = 150 mm. The axial tensile toughnessratio Rfe,0.2 is calculated by Equation (3).
Rfe,0.2 =Wf,0.2
0.2%l0 fat A(3)
Where, A is the notch section area of the specimen.From the axial tensile load-deformation curves presented in Figure 9, the calculation
results of Wf,0.2 and Rfe,0.2 are shown in Figure 10. The positive correlations exist forWf,0.2 and Rfe,0.2 with the fiber factor λf of HFb steel fiber, due to the more pull-out workneeded to be exerted on the notch section of specimen with more steel fibers. However, noobvious relationships were observed in Wf,0.2 and Rfe,0.2 of self-compacting SFRC with thefiber length, as the hooked-end rather than fiber length plays a role controlling the bondperformance in self-compacting SFRC [32].
Crystals 2021, 11, x FOR PEER REVIEW 9 of 12
0.0 0.1 0.2 0.3 0.4 0.5 0.6 0.7 0.8 0.92
3
4
5
6
7
8SCC, HFb04~HFb14 HFa12 HFc12
Equation 2
f at (M
Pa)
λf Figure 8. Axial tensile strength as a function of the fiber content.
By fitting the test data of fat in this paper, αta is 0.631. Figure 8 presents the comparison of test and calculation values of fat. The average ratio is 0.998 with a dispersion coefficient of 0.084.
3.2.3. Axial Tensile Toughness According to the specification of China code CECS 13 [15], the tension work Wf,0.2 is
the area under the axial tensile load-deformation curve. The maximum deformation of 0.3 mm is calculated by 0.2 times of gauge length l0 = 150 mm. The axial tensile toughness ratio Rfe,0.2 is calculated by equation (3).
f,0.2fe,0.2
0 at0.2%W
Rl f A
= (3)
Where, A is the notch section area of the specimen. From the axial tensile load-deformation curves presented in Figure 9, the calculation
results of Wf,0.2 and Rfe,0.2 are shown in Figure 10. The positive correlations exist for Wf,0.2 and Rfe,0.2 with the fiber factor λf of HFb steel fiber, due to the more pull-out work needed to be exerted on the notch section of specimen with more steel fibers. However, no obvious relationships were observed in Wf,0.2 and Rfe,0.2 of self-compacting SFRC with the fiber length, as the hooked-end rather than fiber length plays a role controlling the bond per-formance in self-compacting SFRC [32].
0 1 2 3 4 5
10
20
30
40
50
60
0.01 0.02 0.030
10
20
30
40
50
60
Loa
d (k
N)
SCC HFb04 HFb08 HFb12 HFb14 HFa12
HFc12
Deformation (mm)
Load
(kN
)
Deformation (mm) Figure 9. The axial tensile load-deformation curves of self-compacting SFRC. Figure 9. The axial tensile load-deformation curves of self-compacting SFRC.

Crystals 2021, 11, 251 10 of 12Crystals 2021, 11, x FOR PEER REVIEW 10 of 12
0.4 0.5 0.6 0.7 0.8 0.90
2
4
6
8
10 HFa HFb HFc y = 14.62x − 4.09
Wf,0
.2(×
104 N
.mm
)
λf
0.4 0.5 0.6 0.7 0.8 0.90
20
40
60
80
100
R fe,0
.2 (%
)
λf
HFa HFb HFc y = 80.30x − 19.44
(a) (b)
Figure 10. Axial tensile toughness changed with fiber factor: (a) tensile work; (b) toughness ratio.
3.3. Discussion on Tensile Strengths The axial tensile strength of self-compacting SFRC fat is higher than the splitting ten-
sile strength fst, the ratios vary from 1.09 and 1.27 with an average of 1.18. The strengthen-ing effect of steel fiber on the axial tensile strength is greater than that of splitting tensile strength. This is significantly different from that of vibrated SFRC [17,33,34]. It has been reported that for vibrated SFRC, the axial tensile strength is less than splitting tensile strength, and the strengthening effect of splitting tensile strength is greater than that of axial tensile strength [17].
This difference comes mainly down to the significantly different distribution of steel fibers in the self-compacting SFRC. Due to the flat cast of prism specimens, the steel fiber trend to orientation along the flow direction of self-compacting SFRC [1,2,31]. This direc-tion is consistent with the axial tensile direction which benefits to the axial tensile re-sistance of the self-compacting SFRC. At the same time, this orientation is perpendicular to the load direction of the splitting tensile test [2,31]. The strengthening effect of steel fiber on tensile strength could not be developed until the initiation of the first spitting cracks. In this condition, the complex stress exists in the splitting section with the coupling of shear stress and tensile stress [3,20]. This weakens the action of steel fiber along the splitting tensile direction. Therefore, the adaptability of splitting tensile test is questiona-ble to be used for the self-compacting SFRC.
4. Conclusions Based on the test results of the splitting tensile strength and axial tensile properties
of self-compacting SFRC, the main conclusions can be drawn as follows: (1) The splitting tensile strength of self-compacting SFRC is positively correlated with
fiber factor, and the prediction model considering the influences of fiber distribution and volume fraction is proposed.
(2) The axial tensile strength of self-compacting SFRC is positively correlated with fiber factor, and the prediction model of which is proposed considering the influences of fiber distribution and volume fraction. The axial tensile work and tensile toughness ratio are positively correlated with the volume fraction of steel fiber, while no obvious relation-ship with the fiber length.
(3) The strengthening effect of steel fiber on axial tensile strength is greater than that of splitting tensile strength. This reflects the real distribution of steel fiber along the flow direction of self-compacting SFRC.
(4) With the improvement of notching techniques, the forming of notched specimens become easier. The axial tensile test with notched specimen is a feasible method to evalu-ate the tensile properties of self-compacting SFRC.
Figure 10. Axial tensile toughness changed with fiber factor: (a) tensile work; (b) toughness ratio.
3.3. Discussion on Tensile Strengths
The axial tensile strength of self-compacting SFRC f at is higher than the splitting tensilestrength f st, the ratios vary from 1.09 and 1.27 with an average of 1.18. The strengtheningeffect of steel fiber on the axial tensile strength is greater than that of splitting tensilestrength. This is significantly different from that of vibrated SFRC [17,33,34]. It has beenreported that for vibrated SFRC, the axial tensile strength is less than splitting tensilestrength, and the strengthening effect of splitting tensile strength is greater than that ofaxial tensile strength [17].
This difference comes mainly down to the significantly different distribution of steelfibers in the self-compacting SFRC. Due to the flat cast of prism specimens, the steel fibertrend to orientation along the flow direction of self-compacting SFRC [1,2,31]. This directionis consistent with the axial tensile direction which benefits to the axial tensile resistanceof the self-compacting SFRC. At the same time, this orientation is perpendicular to theload direction of the splitting tensile test [2,31]. The strengthening effect of steel fiber ontensile strength could not be developed until the initiation of the first spitting cracks. Inthis condition, the complex stress exists in the splitting section with the coupling of shearstress and tensile stress [3,20]. This weakens the action of steel fiber along the splittingtensile direction. Therefore, the adaptability of splitting tensile test is questionable to beused for the self-compacting SFRC.
4. Conclusions
Based on the test results of the splitting tensile strength and axial tensile properties ofself-compacting SFRC, the main conclusions can be drawn as follows:
(1) The splitting tensile strength of self-compacting SFRC is positively correlated withfiber factor, and the prediction model considering the influences of fiber distribution andvolume fraction is proposed.
(2) The axial tensile strength of self-compacting SFRC is positively correlated withfiber factor, and the prediction model of which is proposed considering the influencesof fiber distribution and volume fraction. The axial tensile work and tensile toughnessratio are positively correlated with the volume fraction of steel fiber, while no obviousrelationship with the fiber length.
(3) The strengthening effect of steel fiber on axial tensile strength is greater than thatof splitting tensile strength. This reflects the real distribution of steel fiber along the flowdirection of self-compacting SFRC.
(4) With the improvement of notching techniques, the forming of notched specimensbecome easier. The axial tensile test with notched specimen is a feasible method to evaluatethe tensile properties of self-compacting SFRC.

Crystals 2021, 11, 251 11 of 12
Author Contributions: Conceptualization, X.D. and M.Z.; methodology, C.L.; validation, J.L.; formalanalysis, X.D.; investigation, H.G. and L.L.; data curation, X.D.; writting—original draft preparation,X.D.; writing—review and editing, M.Z. and C.L.; funding acquisition, X.D. and J.L. All authors haveread and agreed to the published version of the manuscript.
Funding: This research was funded by National Key Research and Development Plan of China,grant number “2017YFC0703904”; Attracting Foreign Talents Fund of Henan, China, grant number“YWZ2018-6-HS2”; Natural Science Foundation of Henan, China, grant number “212300410192” andthe Key Scientific and Technological Research Project of University in Henan, China, grant number“20A560015”.
Data Availability Statement: The data presented in this study are contained in this article.
Conflicts of Interest: The authors declare no conflict of interest.
References1. Akcay, B.; Tasdemir, M.A. Mechanical behaviour and fibre dispersion of hybrid steel fibre reinforced self-compacting concrete.
Constr. Build. Mater. 2012, 28, 287–293. [CrossRef]2. Zhao, M.L.; Li, J.; David, L. Effects of flowability on SFRC fibre distribution and properties. Mag. Concr. Res. 2017, 69, 1043–1054.
[CrossRef]3. Khaloo, A.; Raisi, E.M.; Hosseini, P.; Tahsiri, H. Mechanical performance of self-compacting concrete reinforced with steel fibers.
Constr. Build. Mater. 2014, 51, 179–186. [CrossRef]4. Li, C.Y.; Geng, H.B.; Deng, C.H.; Li, B.C.; Zhao, S.B. Experimental investigation on columns of steel fiber reinforced concrete with
recycled aggregates under large eccentric compression load. Materials 2019, 12, 445. [CrossRef]5. Li, X.K.; Pei, S.W.; Fan, K.P.; Geng, H.B.; Li, F.L. Bending performance of SFRC beams based on composite-recycled aggregate and
matched with 500MPa rebars. Materials 2020, 13, 930. [CrossRef]6. Zhao, M.S.; Li, C.Y.; Su, J.Z.; Shang, P.R.; Zhao, S.B. Experimental study and theoretical prediction of flexural behaviors of
reinforced SFRELC beams. Constr. Build. Mater. 2019, 208, 454–463. [CrossRef]7. Martinelli, P.; Colombo, M.; Fuente, A.; Cavalaro, S.; Pujadas, P.; Prisco, M. Characterization tests for predicting the mechanical
performance of SFRC floors: Design considerations. Mater. Struct. 2021, 54, 2. [CrossRef]8. Martinelli, P.; Colombo, M.; Pujadas, P.; Fuente, A.; Cavalaro, S.; Prisco, M. Characterization tests for predicting the mechanical
performance of SFRC floors: Identification of fibre distribution and orientation effects. Mater. Struct. 2021, 54, 3. [CrossRef]9. Pereira, E.N.B.; Barros, J.A.O.; Camões, A. Steel fiber-reinforced self-compacting concrete: Experimental research and numerical
simulation. J. Struct. Eng. 2008, 134, 1310–1321. [CrossRef]10. Ferrara, L.; Park, Y.D.; Shah, S.P. A method for mix-design of fiber-reinforced self-compacting concrete. Cem. Concr. Res. 2007,
37, 957–971. [CrossRef]11. MertYücel, Y.; Bülent, B.; Mehmet, A.S. Effect of fine to coarse aggregate ratio on the rheology and fracture energy of steel fibre
reinforced self-compacting concretes. Sadhana 2014, 39, 1447–1469.12. Silva, M.A.D.; Pepe, M.; Pfeil, M.S.; Pfeila, M.S.; Filho, R.D.T. Rheological and mechanical behavior of high strength steel
fiber-river gravel self-compacting concrete. Constr. Build. Mater. 2017, 150, 606–618. [CrossRef]13. Ghanbarpour, S. The Effect of type and volume fraction (VF) of steel fiber on the mechanical properties of self-compacting
concrete. J. Eng. Des. 2010, 8, 247–256. [CrossRef]14. Tameemi, W. Correlations Between Compressive, Flexural, and Tensile Behavior of Self-Consolidating Fiber Reinforced Concrete.
Master’s Thesis, University of Kansas, Lawrence, KS, USA, October 2015.15. China Association of Engineering Construction Standardization. Test methods for steel fiber reinforced concrete. In CECS 13:2009;
China Planning Press: Beijing, China, 2010.16. Cao, D.F.; Fu, L.Z.; Qin, X.C.; Yang, Z.W. Tensile constitutive characteristics of concrete under freeze-thaw cycles. J. Jiangsu Univ.
2011, 32, 359–363.17. Han, R.; Zhao, S.B.; Qu, F.L. Experimental study on tensile properties of steel fiber reinforced concrete. China Civ. Eng. J. 2006,
11, 67–71.18. Shen, C.M.; Cui, Y.Y. Experimental study on tensile strength of concrete with steel slag and nano-SiO2. Concrete 2016, 11, 24–27.19. Ministry of Housing and Urban-Rural Development of the People’s Republic of China. Standard for test methods of concrete
physical and mechanical properties. In GB/T 50081-2019; China Building Industry Press: Beijing, China, 2019.20. Zhao, S.B. Design Principle of Concrete Structures; Tongji University Press: Shanghai, China, 2013.21. Goaiz, H.A.; Farhan, N.A.; Sheikh, M.N.; Yu, T.; Hadi, M.N.S. Experimental evaluation of tensile strength test methods for steel
fibre-reinforced concrete. Mag. Concr. Res. 2019, 71, 385–394. [CrossRef]22. Khalaj, G.; Nazari, A. Modeling split tensile strength of high strength self compacting concrete incorporating randomly oriented
steel fibers and SiO2, Nanoparticles. Compos. B Eng. 2012, 43, 1887–1892. [CrossRef]23. You, Z.G.; Tao, Z.Q.; Xu, G.Q.; Han, Y.T.; Zhou, Y.L. Experimental study on axial tensile strength of hybrid fiber reinforced
self-compacting concrete. Struct. Eng. 2019, 35, 202–208.
Crystals 2021, 11, 251 12 of 12
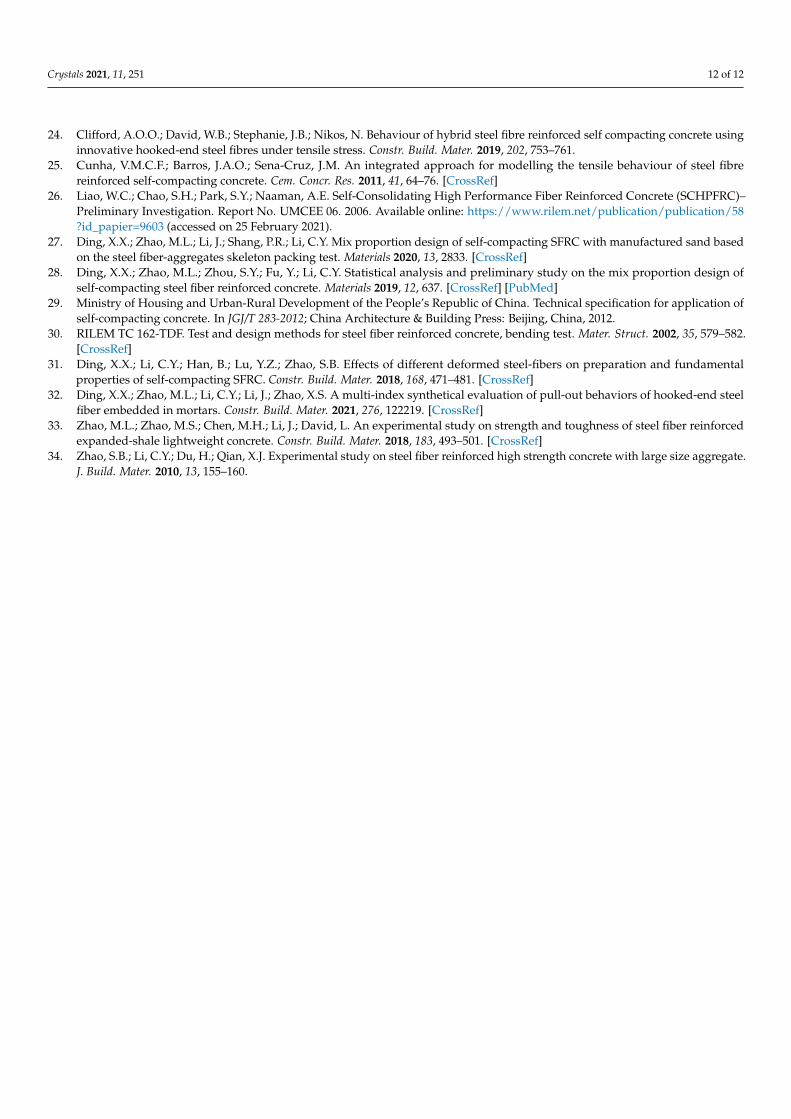
24. Clifford, A.O.O.; David, W.B.; Stephanie, J.B.; Nikos, N. Behaviour of hybrid steel fibre reinforced self compacting concrete usinginnovative hooked-end steel fibres under tensile stress. Constr. Build. Mater. 2019, 202, 753–761.
25. Cunha, V.M.C.F.; Barros, J.A.O.; Sena-Cruz, J.M. An integrated approach for modelling the tensile behaviour of steel fibrereinforced self-compacting concrete. Cem. Concr. Res. 2011, 41, 64–76. [CrossRef]
26. Liao, W.C.; Chao, S.H.; Park, S.Y.; Naaman, A.E. Self-Consolidating High Performance Fiber Reinforced Concrete (SCHPFRC)–Preliminary Investigation. Report No. UMCEE 06. 2006. Available online: https://www.rilem.net/publication/publication/58?id_papier=9603 (accessed on 25 February 2021).
27. Ding, X.X.; Zhao, M.L.; Li, J.; Shang, P.R.; Li, C.Y. Mix proportion design of self-compacting SFRC with manufactured sand basedon the steel fiber-aggregates skeleton packing test. Materials 2020, 13, 2833. [CrossRef]
28. Ding, X.X.; Zhao, M.L.; Zhou, S.Y.; Fu, Y.; Li, C.Y. Statistical analysis and preliminary study on the mix proportion design ofself-compacting steel fiber reinforced concrete. Materials 2019, 12, 637. [CrossRef] [PubMed]
29. Ministry of Housing and Urban-Rural Development of the People’s Republic of China. Technical specification for application ofself-compacting concrete. In JGJ/T 283-2012; China Architecture & Building Press: Beijing, China, 2012.
30. RILEM TC 162-TDF. Test and design methods for steel fiber reinforced concrete, bending test. Mater. Struct. 2002, 35, 579–582.[CrossRef]
31. Ding, X.X.; Li, C.Y.; Han, B.; Lu, Y.Z.; Zhao, S.B. Effects of different deformed steel-fibers on preparation and fundamentalproperties of self-compacting SFRC. Constr. Build. Mater. 2018, 168, 471–481. [CrossRef]
32. Ding, X.X.; Zhao, M.L.; Li, C.Y.; Li, J.; Zhao, X.S. A multi-index synthetical evaluation of pull-out behaviors of hooked-end steelfiber embedded in mortars. Constr. Build. Mater. 2021, 276, 122219. [CrossRef]
33. Zhao, M.L.; Zhao, M.S.; Chen, M.H.; Li, J.; David, L. An experimental study on strength and toughness of steel fiber reinforcedexpanded-shale lightweight concrete. Constr. Build. Mater. 2018, 183, 493–501. [CrossRef]
34. Zhao, S.B.; Li, C.Y.; Du, H.; Qian, X.J. Experimental study on steel fiber reinforced high strength concrete with large size aggregate.J. Build. Mater. 2010, 13, 155–160.