Flexural Behavior of Continuous Beams Made of Self ... - MDPI
20
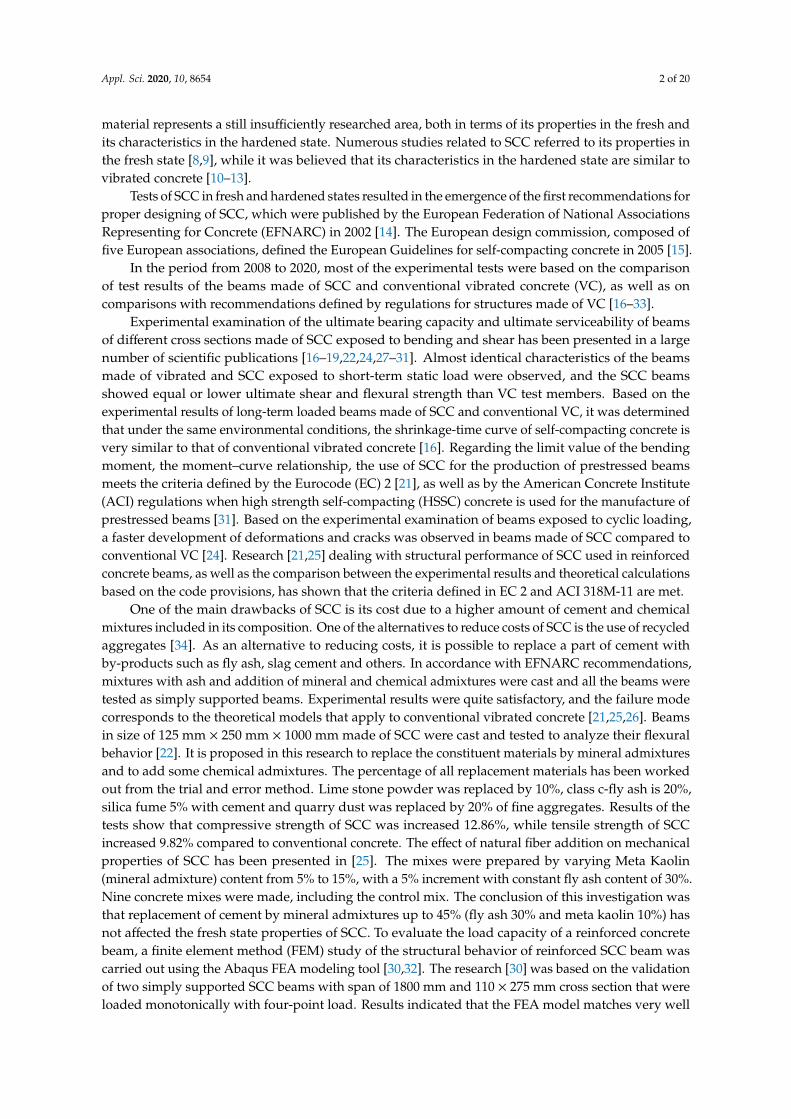
applied sciences Article Flexural Behavior of Continuous Beams Made of Self-Compacting Concrete (SCC)—Experimental and Numerical Analysis Žarko Petrovi´ c 1, *, Bojan Miloševi´ c 2 , Andrija Zori´ c 1 , Slobodan Rankovi´ c 1 , Biljana Mladenovi´ c 1 and Dragan Zlatkov 1 1 Faculty of Civil Engineering and Architecture, University of Niš, 18000 Niš, Serbia; [email protected] (A.Z.); [email protected] (S.R.); [email protected] (B.M.); [email protected] (D.Z.) 2 Faculty of Mechanical and Civil Engineering in Kraljevo, University of Kragujevac, 36000 Kraljevo, Serbia; [email protected] * Correspondence: [email protected]; Tel.: +381-645775532 Received: 14 November 2020; Accepted: 30 November 2020; Published: 3 December 2020 Abstract: Self-compacting concrete (SCC) is a type of concrete that is placed in the formwork under its own weight. Although there are many studies showing the behavior of SCC beams, most relate to the behavior of simple supported beams. Unlike those, this is a study of continuous beams made of SCC aimed to analyze their flexural performance as well as to confirm the possibility of using nonlinear finite element analysis (FEA) in the design of such structural elements. An experimental study of three two-span continuous beams of a total length of 3400 mm, with the span between supports of 1600 mm, with 150/200 mm cross section made of SCC exposed to short-term loading, was carried out. The parameter that varied is the percentage of tensile reinforcement, with values of 0.65, 0.86 and 0.94 being selected. As all analyzed beams have shown a satisfactory load-bearing capacity and stiffness, the research confirmed the possibility of using SCC in continuous beams in civil engineering practice. Using Abaqus/Standard software, a nonlinear numerical model is proposed, which is validated and verified against experimental research, as there is only a 5% difference in the numerically calculated ultimate load compared to the experimentally measured values. Keywords: self-compacting concrete; continuous beam; tensile reinforcement; experimental analysis; Abaqus/Standard 1. Introduction In the last thirty years, there has been a development of a new type of concrete material called self-compacting concrete (SCC). The emergence of self-compacting concrete has been linked to Japan and research conducted by Okamura and Ozawa et al. [1,2]. The prototype of SCC was made in 1988 from materials that were on the market at the time, and it proved to be extremely good in terms of its properties, in both fresh and hardened states. Since the advent of self-compacting concrete, the potential of using it in the construction of buildings has been investigated in many countries, such as Japan, Canada, China, the United States and many European countries [3]. The term SCC refers to a type of high-performance concrete that does not require additional vibration in the placing process but is placed only under its own weight. The key characteristics of fresh self-compacting concrete are: workability and viscosity, i.e., the ability of fresh concrete mass to pass freely between densely arranged reinforcement bars, as well as the resistance to segregation. The first research related to the emergence of SCC focused on the design of an adequate concrete mix as well as on the methods of placing and testing of placed concrete [4–7]. SCC as a relatively new Appl. Sci. 2020, 10, 8654; doi:10.3390/app10238654 www.mdpi.com/journal/applsci
-
Upload
khangminh22 -
Category
Documents
-
view
3 -
download
0
Transcript of Flexural Behavior of Continuous Beams Made of Self ... - MDPI
applied sciences
Article
Flexural Behavior of Continuous Beams Made ofSelf-Compacting Concrete (SCC)—Experimental andNumerical Analysis
Žarko Petrovic 1,*, Bojan Miloševic 2, Andrija Zoric 1 , Slobodan Rankovic 1,Biljana Mladenovic 1 and Dragan Zlatkov 1
1 Faculty of Civil Engineering and Architecture, University of Niš, 18000 Niš, Serbia;[email protected] (A.Z.); [email protected] (S.R.);[email protected] (B.M.); [email protected] (D.Z.)
2 Faculty of Mechanical and Civil Engineering in Kraljevo, University of Kragujevac, 36000 Kraljevo, Serbia;[email protected]
* Correspondence: [email protected]; Tel.: +381-645775532
Received: 14 November 2020; Accepted: 30 November 2020; Published: 3 December 2020 �����������������
Abstract: Self-compacting concrete (SCC) is a type of concrete that is placed in the formwork under itsown weight. Although there are many studies showing the behavior of SCC beams, most relate to thebehavior of simple supported beams. Unlike those, this is a study of continuous beams made of SCCaimed to analyze their flexural performance as well as to confirm the possibility of using nonlinearfinite element analysis (FEA) in the design of such structural elements. An experimental study ofthree two-span continuous beams of a total length of 3400 mm, with the span between supports of1600 mm, with 150/200 mm cross section made of SCC exposed to short-term loading, was carried out.The parameter that varied is the percentage of tensile reinforcement, with values of 0.65, 0.86 and 0.94being selected. As all analyzed beams have shown a satisfactory load-bearing capacity and stiffness,the research confirmed the possibility of using SCC in continuous beams in civil engineering practice.Using Abaqus/Standard software, a nonlinear numerical model is proposed, which is validated andverified against experimental research, as there is only a 5% difference in the numerically calculatedultimate load compared to the experimentally measured values.
Keywords: self-compacting concrete; continuous beam; tensile reinforcement; experimental analysis;Abaqus/Standard
1. Introduction
In the last thirty years, there has been a development of a new type of concrete material calledself-compacting concrete (SCC). The emergence of self-compacting concrete has been linked to Japanand research conducted by Okamura and Ozawa et al. [1,2]. The prototype of SCC was made in1988 from materials that were on the market at the time, and it proved to be extremely good in termsof its properties, in both fresh and hardened states. Since the advent of self-compacting concrete,the potential of using it in the construction of buildings has been investigated in many countries, suchas Japan, Canada, China, the United States and many European countries [3].
The term SCC refers to a type of high-performance concrete that does not require additionalvibration in the placing process but is placed only under its own weight. The key characteristics offresh self-compacting concrete are: workability and viscosity, i.e., the ability of fresh concrete mass topass freely between densely arranged reinforcement bars, as well as the resistance to segregation.
The first research related to the emergence of SCC focused on the design of an adequate concretemix as well as on the methods of placing and testing of placed concrete [4–7]. SCC as a relatively new
Appl. Sci. 2020, 10, 8654; doi:10.3390/app10238654 www.mdpi.com/journal/applsci
Appl. Sci. 2020, 10, 8654 2 of 20
material represents a still insufficiently researched area, both in terms of its properties in the fresh andits characteristics in the hardened state. Numerous studies related to SCC referred to its properties inthe fresh state [8,9], while it was believed that its characteristics in the hardened state are similar tovibrated concrete [10–13].
Tests of SCC in fresh and hardened states resulted in the emergence of the first recommendations forproper designing of SCC, which were published by the European Federation of National AssociationsRepresenting for Concrete (EFNARC) in 2002 [14]. The European design commission, composed offive European associations, defined the European Guidelines for self-compacting concrete in 2005 [15].
In the period from 2008 to 2020, most of the experimental tests were based on the comparisonof test results of the beams made of SCC and conventional vibrated concrete (VC), as well as oncomparisons with recommendations defined by regulations for structures made of VC [16–33].
Experimental examination of the ultimate bearing capacity and ultimate serviceability of beamsof different cross sections made of SCC exposed to bending and shear has been presented in a largenumber of scientific publications [16–19,22,24,27–31]. Almost identical characteristics of the beamsmade of vibrated and SCC exposed to short-term static load were observed, and the SCC beamsshowed equal or lower ultimate shear and flexural strength than VC test members. Based on theexperimental results of long-term loaded beams made of SCC and conventional VC, it was determinedthat under the same environmental conditions, the shrinkage-time curve of self-compacting concrete isvery similar to that of conventional vibrated concrete [16]. Regarding the limit value of the bendingmoment, the moment–curve relationship, the use of SCC for the production of prestressed beamsmeets the criteria defined by the Eurocode (EC) 2 [21], as well as by the American Concrete Institute(ACI) regulations when high strength self-compacting (HSSC) concrete is used for the manufacture ofprestressed beams [31]. Based on the experimental examination of beams exposed to cyclic loading,a faster development of deformations and cracks was observed in beams made of SCC compared toconventional VC [24]. Research [21,25] dealing with structural performance of SCC used in reinforcedconcrete beams, as well as the comparison between the experimental results and theoretical calculationsbased on the code provisions, has shown that the criteria defined in EC 2 and ACI 318M-11 are met.
One of the main drawbacks of SCC is its cost due to a higher amount of cement and chemicalmixtures included in its composition. One of the alternatives to reduce costs of SCC is the use of recycledaggregates [34]. As an alternative to reducing costs, it is possible to replace a part of cement withby-products such as fly ash, slag cement and others. In accordance with EFNARC recommendations,mixtures with ash and addition of mineral and chemical admixtures were cast and all the beams weretested as simply supported beams. Experimental results were quite satisfactory, and the failure modecorresponds to the theoretical models that apply to conventional vibrated concrete [21,25,26]. Beamsin size of 125 mm × 250 mm × 1000 mm made of SCC were cast and tested to analyze their flexuralbehavior [22]. It is proposed in this research to replace the constituent materials by mineral admixturesand to add some chemical admixtures. The percentage of all replacement materials has been workedout from the trial and error method. Lime stone powder was replaced by 10%, class c-fly ash is 20%,silica fume 5% with cement and quarry dust was replaced by 20% of fine aggregates. Results of thetests show that compressive strength of SCC was increased 12.86%, while tensile strength of SCCincreased 9.82% compared to conventional concrete. The effect of natural fiber addition on mechanicalproperties of SCC has been presented in [25]. The mixes were prepared by varying Meta Kaolin(mineral admixture) content from 5% to 15%, with a 5% increment with constant fly ash content of 30%.Nine concrete mixes were made, including the control mix. The conclusion of this investigation wasthat replacement of cement by mineral admixtures up to 45% (fly ash 30% and meta kaolin 10%) hasnot affected the fresh state properties of SCC. To evaluate the load capacity of a reinforced concretebeam, a finite element method (FEM) study of the structural behavior of reinforced SCC beam wascarried out using the Abaqus FEA modeling tool [30,32]. The research [30] was based on the validationof two simply supported SCC beams with span of 1800 mm and 110 × 275 mm cross section that wereloaded monotonically with four-point load. Results indicated that the FEA model matches very well
Appl. Sci. 2020, 10, 8654 3 of 20
with the experimental responses observed in terms of deformation and load capacities at first crack(difference was 2.3%) and ultimate failure (difference was 7.8%). The conclusion of this research isthat the FEA model is capable of simulating the entire loading response of a reinforced concrete beamwith reasonable accuracy. The experimental and numerical analysis using Abaqus FEA software wasperformed by testing sixteen beams made of normal, SCC and high-strength (HS) concrete underpure bending by Mabrouk and Mounir [33]. All of the beams were simply supported with of spanof 1800 mm and 150 × 250 mm cross section. They studied the behavior of RC beams with tensionlap splices confined with transverse reinforcement. A good agreement between experimental andnumerical results was obtained (difference in ultimate load capacity between experimentally andnumerically obtained results was around 20%).
Based on the analysis of the experimental studies carried out so far concerning the applicationof SCC for the construction of structural elements, it is noted that almost all tests were carried outon the simply-supported beams, except for one static system of the two-span continuous beam [27].Beams were examined both for bending and shear, and their behavior under the effect of short-termstatic loading corresponds to the behavior of the beams made of conventional VC, as well as to theconditions defined by the regulations for constructions of VC.
The main goal of this work was to analyze the flexural performance of SCC continuous beams.The experimental study of three two-span continuous beams of a total length of 3400 mm, with the spanbetween supports of 1600 mm, with 150/200 mm cross section made of SCC, was done. The parameterthat varied in this study was the percentage of tensile reinforcement, which varied in the rangefrom 0.65% to 0.94%. The influence of the percentage of reinforcement on the ultimate load capacity,as well as on the failure mode of continuous beams made of SCC was analyzed. The numerical modelusing finite element method and software package Abaqus/Standard was developed and validatedand verified with experimentally obtained results as well. Since most researches are focused on thebehavior of simply-supported beams, this research gives an insight into the flexural performance ofcontinuous beams made of SCC, which is very important taking into account that continuous beamsare one of the most present statical systems in civil engineering.
2. Experimental Program
Within the study of continuous beams made of SCC with river aggregate [35], an experimentaltest of continuous beams was conducted in order to determine their bending behavior, when exposedto short-term loading. For the purposes of this experiment, three reinforced concrete continuousbeams were made of SCC with river aggregate reinforced with different percentages of reinforcement(0.65%, 0.94%, 0.86%).
2.1. Applied Materials and Mixture Proportioning
Concrete mixtures tested within the experimental research were made using CEM I 42.5 R cement,whose characteristics are presented in Table 1.
Table 1. Physical–mechanical characteristics of cement.
Setting Time, Min Start 176, End 226
Density 3.13 g/cm3
Bulk density in loose state 930 kg/m3
Bulk density in compacted state 1515 kg/m3
Tensile strength at 2 days 6.98 N/mm2
Tensile strength at 28 days 9.30 N/mm2
Compressive strength at 2 days 31.33 N/mm2
Compressive strength at 28 days 55.15 N/mm2
Appl. Sci. 2020, 10, 8654 4 of 20
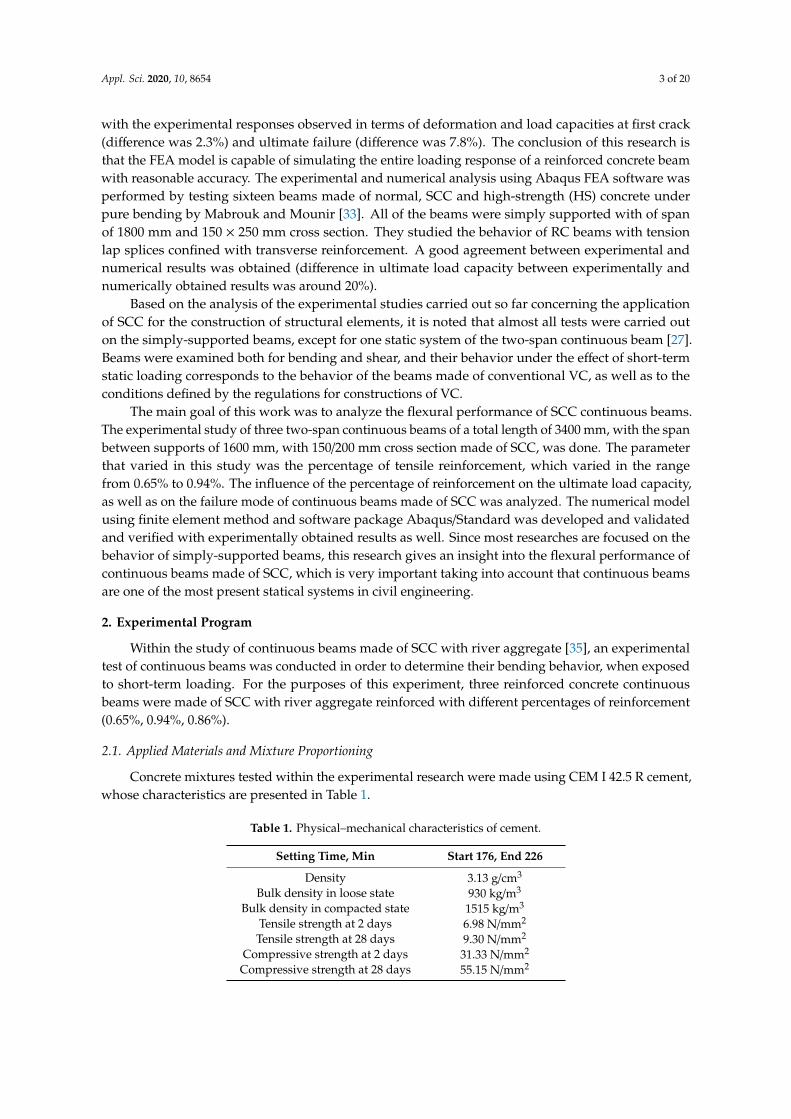
The rock flour which was used in the experiment as fine aggregate, was obtained by grounding ofthe limestone having specific mass 2.692 g/cm3 and standard deviation of cavity share according toRigden of 25.4% (suppliers data), while for making of the concrete mixture, the following 0/4, 4/8 and8/16 mm fractions of the river aggregate were used. For making of concrete mixtures, the particle sizedistribution was performed based on SRPS U. M1.057:1984, which defines the standard particle sizedistribution curves, A–D (Figure 1). These particle size distribution curves are recommended by theEuropean Committee for Concrete. The particle size distribution of the aggregate used for makingSCC is presented in Figure 1.
Appl. Sci. 2020, 10, x FOR PEER REVIEW 4 of 21
The rock flour which was used in the experiment as fine aggregate, was obtained by grounding of the limestone having specific mass 2.692 g/cm3 and standard deviation of cavity share according to Rigden of 25.4% (suppliers data), while for making of the concrete mixture, the following 0/4, 4/8 and 8/16 mm fractions of the river aggregate were used. For making of concrete mixtures, the particle size distribution was performed based on SRPS U. M1.057:1984, which defines the standard particle size distribution curves, A–D (Figure 1). These particle size distribution curves are recommended by the European Committee for Concrete. The particle size distribution of the aggregate used for making SCC is presented in Figure 1.
Figure 1. Particle size distribution of aggregates.
The composition of designed concrete mixture is presented in Table 2. The additive MC Power Flow 1102 was used in the experiment. This is a supper-plasticizer, a modified polycarboxylate with density of 1.06 kg/dm3. Additive dosage was 0.5% in relation to the mass of powdery components (cement and rock flour).
Table 2. Concrete composition.
Mass for 1 m3 (kg) limestone filler 100.0
cement 430.0 water absorption (%) fraction 0–4 mm 807.5 0.80 fraction 4–8 mm 380.0 0.50
fraction 8–16 mm 553.0 0.40 water 210.0
MC Power Flow 1102 additive 2.2
2.2. Examination of the SCC Characteristics
The experimental examination of the characteristics of SCC was carried out in two phases: (1) examination of the characteristics of fresh concrete mass, (2) examination of the mechanical characteristics of hardened SCC.
One of the primary methods used for testing self-compacting concrete in the fresh state is the Slump-flow test, EN 206-9: 2010 [36] which tests the consistency of fresh concrete and checks one of the key properties of SCC: workability, i.e., fluidity. Based on the recommendations of EFNARC [15] and regulations EN 206-9: 2010 [36], the minimum diameter of fresh concrete mass of SCC is 550 mm, and the maximum permissible diameter is 850 mm. The lower spread time of the t500 indicates better workability. For engineering practice, it has been suggested that the spread time be in the range of 3 to 7 s. The results obtained by testing fresh concrete are shown in Table 3.
Figure 1. Particle size distribution of aggregates.
The composition of designed concrete mixture is presented in Table 2. The additive MC PowerFlow 1102 was used in the experiment. This is a supper-plasticizer, a modified polycarboxylate withdensity of 1.06 kg/dm3. Additive dosage was 0.5% in relation to the mass of powdery components(cement and rock flour).
Table 2. Concrete composition.
Mass for 1 m3 (kg)
limestone filler 100.0cement 430.0 water absorption (%)
fraction 0–4 mm 807.5 0.80fraction 4–8 mm 380.0 0.50fraction 8–16 mm 553.0 0.40
water 210.0MC Power Flow 1102 additive 2.2
2.2. Examination of the SCC Characteristics
The experimental examination of the characteristics of SCC was carried out in two phases:(1) examination of the characteristics of fresh concrete mass, (2) examination of the mechanicalcharacteristics of hardened SCC.
One of the primary methods used for testing self-compacting concrete in the fresh state is theSlump-flow test, EN 206-9: 2010 [36] which tests the consistency of fresh concrete and checks one ofthe key properties of SCC: workability, i.e., fluidity. Based on the recommendations of EFNARC [15]and regulations EN 206-9: 2010 [36], the minimum diameter of fresh concrete mass of SCC is 550 mm,and the maximum permissible diameter is 850 mm. The lower spread time of the t500 indicates betterworkability. For engineering practice, it has been suggested that the spread time be in the range of 3 to7 s. The results obtained by testing fresh concrete are shown in Table 3.

Appl. Sci. 2020, 10, 8654 5 of 20
Table 3. The test results obtained on fresh concrete.
Density (kg/m3) Slump-Flow Test D (mm) t500 (s) ωc(Water Cement Ratio)
2305 605 4.8 0.49
Based on the recommendations defined in EFNARC [15] and EN 206-9:2010 [36], the designedmixture is classified as SF1. On the basis of the measured slump time of the designed mix, it isconcluded that it belongs to class VS2.
The following tests were performed on hardened concrete: compressive strength, tensile splittingstrength and the determination of the tangent and secant modulus of elasticity was performed.To determine the characteristic of the hardened concrete twelve 150 mm cubes and nine 150 mmdiameter cylinders of 300 mm length were cast simultaneously with the beams.
Determination of compressive strength of concrete was carried out on cubes having sides of150 mm, after 2, 7, 14 and 28 days in accordance with EN 206-1. The tensile splitting strength of concretewas tested on cylinders measuring ∅150/300 mm, and it was determined after 28 days, in accordancewith EN 12390-6. The determination of the tangent and secant modulus of elasticity was performed inaccordance with the standard EC 2 [37].
The test results of compressive strength as well as tensile splitting strength are shown in Table 4.Tensile splitting strength is an important parameter of mechanical characteristics of concrete. Weaktensile properties of concrete lead to failure of structure, therefore numerous papers investigated thepossibility of improving tensile strength. In [38], it is confirmed that adding fiber polymers into cementpaste can improve its tensile splitting strength. In addition, fiber polymers change the way of failure ofcylinder sample during the test. Namely, failure of sample without fiber polymers is due to failure ofcement paste and, on the other hand, failure of sample with fiber polymers occurs due to failure ofcement paste, fiber detachment and pull-out continuation [38].
Table 4. The test results obtained on hardened concrete.
Density (kg/m3) Compressive Strength(MPa)
Tensile Strength(MPa)
Modulus of Elasticity(GPa)
Secant Tangent
% fc,2 fc,7 fc,14 fc,28 fck fct,28 Ec Ecm2325 20.40 30.75 42.45 46.55 48.60 3.80 26.12 25.55
Standard deviation (σ) 1.07 2.07 2.36 0.92 1.41 0.21 1.91 1.87
During determining compressive strength on the cylinders, the stress–strain relation was recorded,as presented in Figure 2. Since strains are usually very small, we used microstrain instead, which isstrain times 10−6.
Appl. Sci. 2020, 10, x FOR PEER REVIEW 6 of 21
Figure 2. Stress–strain relation for concrete under compression.
2.3. Test Procedure and Instrumentation
Three continuous beams were made of self-compacting concrete with natural aggregate in accordance with the program of experimental testing in which the geometrical characteristics of the test specimens, the method of their production, arrangement and type of measuring instruments, as well as the test procedure had been defined. The dimensioning of the continuous beams was carried out in accordance with the EC2 regulation. The beams have a different percentage of longitudinal reinforcement, while the transverse reinforcement is the same for all beams. The beams labels and the methods of reinforcement are shown in Table 5 and Figure 3. Since there is a difference in the reinforcement of the tested beam, the principal reinforcement is marked with 1 while the additional reinforcement is marked with 2 in Table 5 and Figure 3.
Table 5. The reinforcement data for the tested beams.
Beam Label Principal Reinforcement (1) Additional Reinforcement (2) Reinforcement Percentage
B−1 ±2B ∅10 / 0.65 B−2 ±2B ∅12 / 0.94 B−3 ±2B ∅10 ±1B∅8 0.86
Figure 3. Reinforcing of the tested beams.
The tested beams have a rectangular cross-section, having dimensions b/h = 150/200 mm, of a total length of 3400 mm, beam span 1600 mm, reinforced with B500B reinforcement of a C30/37 designed class of self-compacting concrete [37]. The reinforcing steel B500B has a modulus of elasticity of 200 GPa, while its yield and ultimate strength are fy = 500 MPa and fu = 560 MPa, respectively.
Figure 2. Stress–strain relation for concrete under compression.

Appl. Sci. 2020, 10, 8654 6 of 20
2.3. Test Procedure and Instrumentation
Three continuous beams were made of self-compacting concrete with natural aggregate inaccordance with the program of experimental testing in which the geometrical characteristics of thetest specimens, the method of their production, arrangement and type of measuring instruments,as well as the test procedure had been defined. The dimensioning of the continuous beams was carriedout in accordance with the EC2 regulation. The beams have a different percentage of longitudinalreinforcement, while the transverse reinforcement is the same for all beams. The beams labels andthe methods of reinforcement are shown in Table 5 and Figure 3. Since there is a difference in thereinforcement of the tested beam, the principal reinforcement is marked with 1 while the additionalreinforcement is marked with 2 in Table 5 and Figure 3.
Table 5. The reinforcement data for the tested beams.
Beam Label Principal Reinforcement (1) Additional Reinforcement (2) Reinforcement Percentage
B−1 ±2B ∅10 / 0.65B−2 ±2B ∅12 / 0.94B−3 ±2B ∅10 ±1B∅8 0.86
Appl. Sci. 2020, 10, x FOR PEER REVIEW 6 of 21
Figure 2. Stress–strain relation for concrete under compression.
2.3. Test Procedure and Instrumentation
Three continuous beams were made of self-compacting concrete with natural aggregate in
accordance with the program of experimental testing in which the geometrical characteristics of the
test specimens, the method of their production, arrangement and type of measuring instruments, as
well as the test procedure had been defined. The dimensioning of the continuous beams was carried
out in accordance with the EC2 regulation. The beams have a different percentage of longitudinal
reinforcement, while the transverse reinforcement is the same for all beams. The beams labels and
the methods of reinforcement are shown in Table 5 and Figure 3. Since there is a difference in the
reinforcement of the tested beam, the principal reinforcement is marked with 1 while the additional
reinforcement is marked with 2 in Table 5 and Figure 3.
Table 5. The reinforcement data for the tested beams.
Beam Label Principal Reinforcement (1) Additional Reinforcement (2) Reinforcement
Percentage
B−1 2B 10 / 0.65
B−2 2B 12 / 0.94
B−3 2B 10 1B8 0.86
Figure 3. Reinforcing of the tested beams.
The tested beams have a rectangular cross-section, having dimensions b/h = 150/200 mm, of a
total length of 3400 mm, beam span 1600 mm, reinforced with B500B reinforcement of a C30/37
designed class of self-compacting concrete [37]. The reinforcing steel B500B has a modulus of
elasticity of 200 GPa, while its yield and ultimate strength are fy = 500 MPa and fu = 560 MPa,
respectively.
Figure 3. Reinforcing of the tested beams.
The tested beams have a rectangular cross-section, having dimensions b/h = 150/200 mm, of a totallength of 3400 mm, beam span 1600 mm, reinforced with B500B reinforcement of a C30/37 designedclass of self-compacting concrete [37]. The reinforcing steel B500B has a modulus of elasticity of200 GPa, while its yield and ultimate strength are fy = 500 MPa and fu = 560 MPa, respectively.
On the occasion of testing of continuous beams, the load was applied using a hydraulic device,whereby the force from the test machine piston was transmitted to the beam in the form of twoconcentrated forces at the middle of both spans of the continuous beam, Figure 3. The load was appliedin the controlled, so called “time mode”, with a constant increase of deflection in the function of timeuntil failure, with the deflection increment rate of 0.02 mm/s (1.2 mm/min).
During the testing, global deformations of beams (deflections), dilatations-strains in concreteand tensioned steel reinforcement, as well as the emergence and development of cracks as a functionof load increment were monitored. The strains in concrete were registered with the strain gaugestapes SG1–SG3 (compressed concrete) and linear variable displacement transducers LVDT3-LVDT4(tensioned concrete). The strains in tensioned reinforcing steel bars were registered with straingauges tapes SG4–SG9. The development of cracks, i.e., their sum along the length of the base ofthe instrument (where, as a rule, one crack appeared), was registered continuously with the linearvariable displacement transducers (LVDT) dilatometer. The position of strain gauges tapes and LVDTdilatometer in Sections I, II and II is presented in Table 6.

Appl. Sci. 2020, 10, 8654 7 of 20
Table 6. Position of strain gauge tapes (SG) and linear variable displacement transducers (LVDT)dilatometers in Sections I, II and III of the tested beams.
BeamLabel
TensionedSteel
Reinforcement
CompressedConcrete
TensionedConcrete Deflection
B−1 SG4 SG1 LVDT3 LVDT1Section I B−2 SG4 SG1 LVDT3 LVDT1
B−3 SG4, SG5 SG1 LVDT3 LVDT1
B−1 SG6 SG3 - -Section III B−2 SG6 SG3 - -
B−3 SG8, SG9 SG3 - -
B−1 SG5 SG2 LVDT4 LVDT2Section II B−2 SG5 SG2 LVDT4 LVDT2
B−3 SG6, SG7 SG2 LVDT4 LVDT2
3. Results and Discussion
The analysis of experimentally obtained results was carried out based on the dependence ofrecorded quantities on the percentage of reinforcement of continuous beams.
3.1. Analysis of Results of Recorded Deflections
The analysis of deflection, as the most obvious indicator of the structure behavior under theinfluence of load, is paid special attention in this research. A comparative analysis of experimentallydetermined deflections of continuous beams depending on the percentage of beam reinforcement forSections I and II in the middle of the span of continuous beams was performed (Figure 4).Appl. Sci. 2020, 10, x FOR PEER REVIEW 8 of 21
Figure 4. Load vs. deflection curves in Section I—left span and Section II—right span for tested Beams B−1, B−2 and B−3.
Comparative representation of the measured deflections of Sections I and II of continuous beams, reinforced with different percentages of reinforcement for different load intensities is shown in Figure 4. Based on the results, the flexural stiffness of the beams can be defined as the ratio of force and deflection. The stiffness of non-cracked concrete section is approximately 105 kN/mm, 115 kN/mm and 125 kN/mm for the Beams B−1, B−2 and B−3, respectively. After the crack propagation the flexural stiffness decreases to approximately 50 kN/mm, 60 kN/mm and 70 kN/mm for the Beams B−1, B−2 and B−3, respectively. The yielding of tensioned reinforcement leads to excessive decrease of the flexural stiffness up to the failure of the beams.
3.2. Analysis of Dilatations in the Middle of the Beams Span and above the Middle Support
The analysis of dilatation in concrete and tensioned reinforcement in Sections I and II in the middle of the beams span was performed for the tested beams depending on the percentage of reinforcement. The shape of the curves defining the load–strain dependence for continuous beams with different percentages of reinforcement does not differ significantly, whereby the nominal values are different, which can be seen in Figure 5.
(a)
Figure 4. Load vs. deflection curves in Section I—left span and Section II—right span for tested BeamsB−1, B−2 and B−3.
In the curves that define the relationship between load and deflection, one can observe thecharacteristic phases through which the beam passes during the application of the test load: (1) until theonset of the first cracks, (2) from the onset of the first cracks to the onset of yielding in tensioned steelreinforcement and (3) from the onset of yielding to the failure of the beam. For all beams, an almostidentical behavior at low load levels is observed in the elastic phase, before the formation of thefirst crack. With the emergence of the first crack, the relation between the load and the deflectionbecomes nonlinear.
Comparative representation of the measured deflections of Sections I and II of continuous beams,reinforced with different percentages of reinforcement for different load intensities is shown in Figure 4.Based on the results, the flexural stiffness of the beams can be defined as the ratio of force and deflection.

Appl. Sci. 2020, 10, 8654 8 of 20
The stiffness of non-cracked concrete section is approximately 105 kN/mm, 115 kN/mm and 125 kN/mmfor the Beams B−1, B−2 and B−3, respectively. After the crack propagation the flexural stiffnessdecreases to approximately 50 kN/mm, 60 kN/mm and 70 kN/mm for the Beams B−1, B−2 and B−3,respectively. The yielding of tensioned reinforcement leads to excessive decrease of the flexural stiffnessup to the failure of the beams.
3.2. Analysis of Dilatations in the Middle of the Beams Span and above the Middle Support
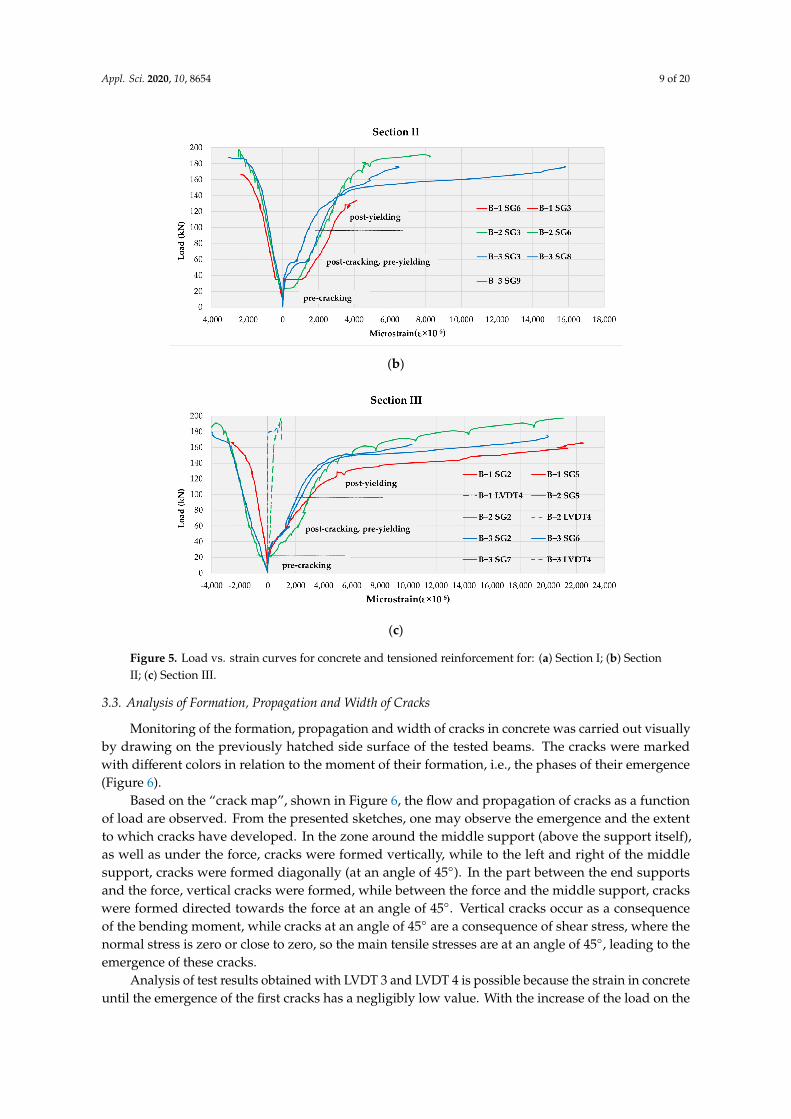
The analysis of dilatation in concrete and tensioned reinforcement in Sections I and II in the middleof the beams span was performed for the tested beams depending on the percentage of reinforcement.The shape of the curves defining the load–strain dependence for continuous beams with differentpercentages of reinforcement does not differ significantly, whereby the nominal values are different,which can be seen in Figure 5.
Dilatation in the tensile zone of the cross-section is the result of onset of cracks (about 98%) anddilatation of concrete (about 2%), and therefore dilatation of the concrete can be neglected. Hence,it can be adopted that recorded dilatation represents the sum of the crack’s width along the length ofthe measurement base (100 mm). As only one crack usually appears at that length, it is possible toanalyze its width as a function of load, very precisely and continuously. On the other hand, having inmind that the tensile stresses are assumed by the reinforcement at the point where the crack emerged,it can be considered that the measured dilatation correspond to that in the reinforcement.
Based on the diagrams shown in Figure 5, three parts of the diagram are observed. The firstpart of the diagram is linear until the emergence of the first crack in the observed cross-section.With the formation of cracks, the stiffness of the beam decreases when the dilatations increase abruptlynonlinearly until the onset of yielding in the steel reinforcement, when the cracks stabilize. The thirdpart of the diagram is from the moment of reinforcement yielding until the failure and it has an evenmore pronounced nonlinearity. This kind of a behavior is characteristic for concrete structures andcan be find in literature [39]. With the emergence of cracks and the loss of adhesion between theconcrete and the reinforcement, the stress is redistributed from the concrete part of the cross-section tothe reinforcement.
The cross-sectional behavior above the middle support (Figure 5c) is similar to the cross-sectionalbehavior in the beam span (Figure 5a,b). The diagram of strains in the compressed part of concreteSection III shown in Figure 5c, in qualitative terms is similar to the diagrams in the compressed partsof Sections I and II shown in Figure 5a,b. When strains in the tensioned reinforcement reach the limitof 2500 micro-strains, the intensity of load leading to flow in the tensioned reinforcement is defined.
Appl. Sci. 2020, 10, x FOR PEER REVIEW 8 of 21
Figure 4. Load vs. deflection curves in Section I—left span and Section II—right span for tested Beams B−1, B−2 and B−3.
Comparative representation of the measured deflections of Sections I and II of continuous beams, reinforced with different percentages of reinforcement for different load intensities is shown in Figure 4. Based on the results, the flexural stiffness of the beams can be defined as the ratio of force and deflection. The stiffness of non-cracked concrete section is approximately 105 kN/mm, 115 kN/mm and 125 kN/mm for the Beams B−1, B−2 and B−3, respectively. After the crack propagation the flexural stiffness decreases to approximately 50 kN/mm, 60 kN/mm and 70 kN/mm for the Beams B−1, B−2 and B−3, respectively. The yielding of tensioned reinforcement leads to excessive decrease of the flexural stiffness up to the failure of the beams.
3.2. Analysis of Dilatations in the Middle of the Beams Span and above the Middle Support
The analysis of dilatation in concrete and tensioned reinforcement in Sections I and II in the middle of the beams span was performed for the tested beams depending on the percentage of reinforcement. The shape of the curves defining the load–strain dependence for continuous beams with different percentages of reinforcement does not differ significantly, whereby the nominal values are different, which can be seen in Figure 5.
(a)
Figure 5. Cont.
Appl. Sci. 2020, 10, 8654 9 of 20Appl. Sci. 2020, 10, x FOR PEER REVIEW 9 of 21
(b)
(c)
Figure 5. Load vs. strain curves for concrete and tensioned reinforcement for: (a) Section I; (b) Section II; (c) Section III.
Dilatation in the tensile zone of the cross-section is the result of onset of cracks (about 98%) and dilatation of concrete (about 2%), and therefore dilatation of the concrete can be neglected. Hence, it can be adopted that recorded dilatation represents the sum of the crack’s width along the length of the measurement base (100 mm). As only one crack usually appears at that length, it is possible to analyze its width as a function of load, very precisely and continuously. On the other hand, having in mind that the tensile stresses are assumed by the reinforcement at the point where the crack emerged, it can be considered that the measured dilatation correspond to that in the reinforcement.
Based on the diagrams shown in Figure 5, three parts of the diagram are observed. The first part of the diagram is linear until the emergence of the first crack in the observed cross-section. With the formation of cracks, the stiffness of the beam decreases when the dilatations increase abruptly nonlinearly until the onset of yielding in the steel reinforcement, when the cracks stabilize. The third part of the diagram is from the moment of reinforcement yielding until the failure and it has an even more pronounced nonlinearity. This kind of a behavior is characteristic for concrete structures and can be find in literature [39]. With the emergence of cracks and the loss of adhesion between the concrete and the reinforcement, the stress is redistributed from the concrete part of the cross-section to the reinforcement.
The cross-sectional behavior above the middle support (Figure 5c) is similar to the cross-sectional behavior in the beam span (Figure 5a,b). The diagram of strains in the compressed part of concrete Section III shown in Figure 5c, in qualitative terms is similar to the diagrams in the
Figure 5. Load vs. strain curves for concrete and tensioned reinforcement for: (a) Section I; (b) SectionII; (c) Section III.
3.3. Analysis of Formation, Propagation and Width of Cracks
Monitoring of the formation, propagation and width of cracks in concrete was carried out visuallyby drawing on the previously hatched side surface of the tested beams. The cracks were markedwith different colors in relation to the moment of their formation, i.e., the phases of their emergence(Figure 6).
Based on the “crack map”, shown in Figure 6, the flow and propagation of cracks as a functionof load are observed. From the presented sketches, one may observe the emergence and the extentto which cracks have developed. In the zone around the middle support (above the support itself),as well as under the force, cracks were formed vertically, while to the left and right of the middlesupport, cracks were formed diagonally (at an angle of 45◦). In the part between the end supportsand the force, vertical cracks were formed, while between the force and the middle support, crackswere formed directed towards the force at an angle of 45◦. Vertical cracks occur as a consequenceof the bending moment, while cracks at an angle of 45◦ are a consequence of shear stress, where thenormal stress is zero or close to zero, so the main tensile stresses are at an angle of 45◦, leading to theemergence of these cracks.
Analysis of test results obtained with LVDT 3 and LVDT 4 is possible because the strain in concreteuntil the emergence of the first cracks has a negligibly low value. With the increase of the load on the

Appl. Sci. 2020, 10, 8654 10 of 20
beam, new cracks are formed, while with the onset of yielding in the reinforcement, new cracks areformed, while the existing ones suddenly expand in the zones of reinforcement plasticization.
Appl. Sci. 2020, 10, x FOR PEER REVIEW 10 of 21
compressed parts of Sections I and II shown in Figure 5a,b. When strains in the tensioned reinforcement reach the limit of 2500 micro-strains, the intensity of load leading to flow in the tensioned reinforcement is defined.
3.3. Analysis of Formation, Propagation and Width of Cracks
Monitoring of the formation, propagation and width of cracks in concrete was carried out visually by drawing on the previously hatched side surface of the tested beams. The cracks were marked with different colors in relation to the moment of their formation, i.e., the phases of their emergence (Figure 6).
Figure 6. Map of cracks of B−1, B−2 and B−3 beams.
Based on the “crack map”, shown in Figure 6, the flow and propagation of cracks as a function of load are observed. From the presented sketches, one may observe the emergence and the extent to which cracks have developed. In the zone around the middle support (above the support itself), as well as under the force, cracks were formed vertically, while to the left and right of the middle support, cracks were formed diagonally (at an angle of 45°). In the part between the end supports and the force, vertical cracks were formed, while between the force and the middle support, cracks were formed directed towards the force at an angle of 45°. Vertical cracks occur as a consequence of the bending moment, while cracks at an angle of 45° are a consequence of shear stress, where the normal stress is zero or close to zero, so the main tensile stresses are at an angle of 45°, leading to the emergence of these cracks.
In addition to the visual method, the crack width as a function of load was measured continuously (every second), by means of a displacement transducer (LVDT), with a measurement base of 100 mm, in Section I, in the middle of the first beam span (LVDT 3), and in Section III above the middle support (LVDT 4). Comparative load–crack width diagrams obtained using LVDT 3 and LVDT 4 are shown in Figure 7.
Figure 6. Map of cracks of B−1, B−2 and B−3 beams.
In addition to the visual method, the crack width as a function of load was measured continuously(every second), by means of a displacement transducer (LVDT), with a measurement base of 100 mm,in Section I, in the middle of the first beam span (LVDT 3), and in Section III above the middle support(LVDT 4). Comparative load–crack width diagrams obtained using LVDT 3 and LVDT 4 are shown inFigure 7.Appl. Sci. 2020, 10, x FOR PEER REVIEW 11 of 21
Figure 7. Comparative load vs. crack width diagrams obtained using LVDT 3 in Section I and LVDT 4 in Section III.
Analysis of test results obtained with LVDT 3 and LVDT 4 is possible because the strain in concrete until the emergence of the first cracks has a negligibly low value. With the increase of the load on the beam, new cracks are formed, while with the onset of yielding in the reinforcement, new cracks are formed, while the existing ones suddenly expand in the zones of reinforcement plasticization.
4. Numerical Analysis
Based on the experimental model, a 3D design model was developed in the Abaqus/Standard software package.
4.1. Model Geometry, Material Models and Finite Element Mesh
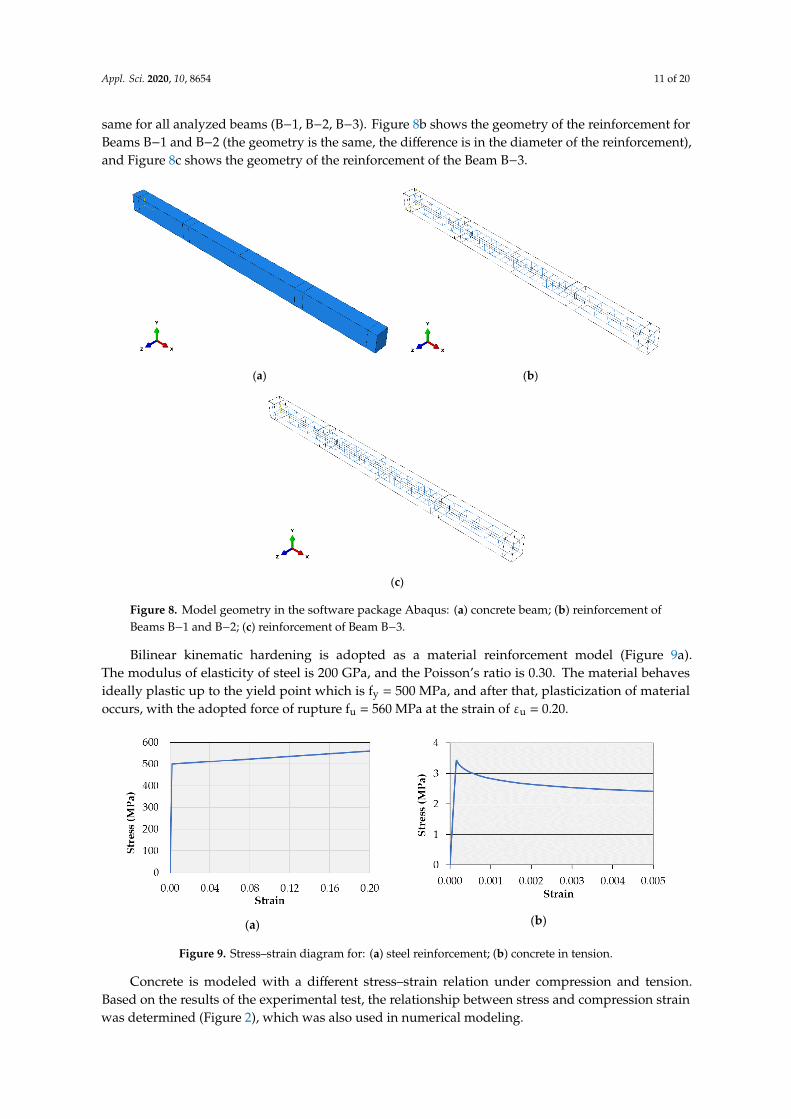
Models for numerical analysis were formed in accordance with experimentally tested models of continuous beams (Figure 8). Figure 8a shows the geometry of the concrete beam which is the same for all analyzed beams (B−1, B−2, B−3). Figure 8b shows the geometry of the reinforcement for Beams B−1 and B−2 (the geometry is the same, the difference is in the diameter of the reinforcement), and Figure 8c shows the geometry of the reinforcement of the Beam B−3.
(a) (b)
Figure 7. Comparative load vs. crack width diagrams obtained using LVDT 3 in Section I and LVDT 4in Section III.
4. Numerical Analysis
Based on the experimental model, a 3D design model was developed in the Abaqus/Standardsoftware package.
4.1. Model Geometry, Material Models and Finite Element Mesh
Models for numerical analysis were formed in accordance with experimentally tested modelsof continuous beams (Figure 8). Figure 8a shows the geometry of the concrete beam which is the
Appl. Sci. 2020, 10, 8654 11 of 20
same for all analyzed beams (B−1, B−2, B−3). Figure 8b shows the geometry of the reinforcement forBeams B−1 and B−2 (the geometry is the same, the difference is in the diameter of the reinforcement),and Figure 8c shows the geometry of the reinforcement of the Beam B−3.
Appl. Sci. 2020, 10, x FOR PEER REVIEW 11 of 21
Figure 7. Comparative load vs. crack width diagrams obtained using LVDT 3 in Section I and LVDT 4 in Section III.
Analysis of test results obtained with LVDT 3 and LVDT 4 is possible because the strain in concrete until the emergence of the first cracks has a negligibly low value. With the increase of the load on the beam, new cracks are formed, while with the onset of yielding in the reinforcement, new cracks are formed, while the existing ones suddenly expand in the zones of reinforcement plasticization.
4. Numerical Analysis
Based on the experimental model, a 3D design model was developed in the Abaqus/Standard software package.
4.1. Model Geometry, Material Models and Finite Element Mesh
Models for numerical analysis were formed in accordance with experimentally tested models of continuous beams (Figure 8). Figure 8a shows the geometry of the concrete beam which is the same for all analyzed beams (B−1, B−2, B−3). Figure 8b shows the geometry of the reinforcement for Beams B−1 and B−2 (the geometry is the same, the difference is in the diameter of the reinforcement), and Figure 8c shows the geometry of the reinforcement of the Beam B−3.
(a) (b)
Appl. Sci. 2020, 10, x FOR PEER REVIEW 12 of 21
(c)
Figure 8. Model geometry in the software package Abaqus: (a) concrete beam; (b) reinforcement of Beams B−1 and B−2; (c) reinforcement of Beam B−3.
Bilinear kinematic hardening is adopted as a material reinforcement model (Figure 9a). The modulus of elasticity of steel is 200 GPa, and the Poisson’s ratio is 0.30. The material behaves ideally plastic up to the yield point which is fy = 500 MPa, and after that, plasticization of material occurs, with the adopted force of rupture fu = 560 MPa at the strain of εu = 0.20.
(a)
(b)
Figure 9. Stress–strain diagram for: (a) steel reinforcement; (b) concrete in tension.
Concrete is modeled with a different stress–strain relation under compression and tension. Based on the results of the experimental test, the relationship between stress and compression strain was determined (Figure 2), which was also used in numerical modeling.
Based on the results of experimental tests, the compressive strength of concrete was defined as 50.13 MPa, while the modulus of elasticity was calculated as the ratio of stress and strain at 40% of the value of concrete compressive strength. It has been adopted that concrete behaves linearly elastic up to a compressive stress corresponding to 40% of the value of compressive strength, which is in accordance with European regulations [37].
The relationship between stress and strain during concrete tension has a great influence on the results of the analysis due to the sensitivity of the model to the development of cracks in concrete. After the analysis of different models, and due to the lack of experimental testing of tensile strength of concrete, the stress–strain relationship was chosen, which was proposed by Wang, T, Hsu, T. T [40]. According to this model, the relationship of stress and strain (Figure 9b) is linear up to the tensile strength of concrete ft with the corresponding strain εcr, and with the increase of stress, the relation has a form:
Figure 8. Model geometry in the software package Abaqus: (a) concrete beam; (b) reinforcement ofBeams B−1 and B−2; (c) reinforcement of Beam B−3.
Bilinear kinematic hardening is adopted as a material reinforcement model (Figure 9a).The modulus of elasticity of steel is 200 GPa, and the Poisson’s ratio is 0.30. The material behavesideally plastic up to the yield point which is fy = 500 MPa, and after that, plasticization of materialoccurs, with the adopted force of rupture fu = 560 MPa at the strain of εu = 0.20.
Appl. Sci. 2020, 10, x FOR PEER REVIEW 12 of 21
(c)
Figure 8. Model geometry in the software package Abaqus: (a) concrete beam; (b) reinforcement of Beams B−1 and B−2; (c) reinforcement of Beam B−3.
Bilinear kinematic hardening is adopted as a material reinforcement model (Figure 9a). The modulus of elasticity of steel is 200 GPa, and the Poisson’s ratio is 0.30. The material behaves ideally plastic up to the yield point which is fy = 500 MPa, and after that, plasticization of material occurs, with the adopted force of rupture fu = 560 MPa at the strain of εu = 0.20.
(a)
(b)
Figure 9. Stress–strain diagram for: (a) steel reinforcement; (b) concrete in tension.
Concrete is modeled with a different stress–strain relation under compression and tension. Based on the results of the experimental test, the relationship between stress and compression strain was determined (Figure 2), which was also used in numerical modeling.
Based on the results of experimental tests, the compressive strength of concrete was defined as 50.13 MPa, while the modulus of elasticity was calculated as the ratio of stress and strain at 40% of the value of concrete compressive strength. It has been adopted that concrete behaves linearly elastic up to a compressive stress corresponding to 40% of the value of compressive strength, which is in accordance with European regulations [37].
The relationship between stress and strain during concrete tension has a great influence on the results of the analysis due to the sensitivity of the model to the development of cracks in concrete. After the analysis of different models, and due to the lack of experimental testing of tensile strength of concrete, the stress–strain relationship was chosen, which was proposed by Wang, T, Hsu, T. T [40]. According to this model, the relationship of stress and strain (Figure 9b) is linear up to the tensile strength of concrete ft with the corresponding strain εcr, and with the increase of stress, the relation has a form:
Figure 9. Stress–strain diagram for: (a) steel reinforcement; (b) concrete in tension.
Concrete is modeled with a different stress–strain relation under compression and tension.Based on the results of the experimental test, the relationship between stress and compression strainwas determined (Figure 2), which was also used in numerical modeling.

Appl. Sci. 2020, 10, 8654 12 of 20
Based on the results of experimental tests, the compressive strength of concrete was defined as50.13 MPa, while the modulus of elasticity was calculated as the ratio of stress and strain at 40% ofthe value of concrete compressive strength. It has been adopted that concrete behaves linearly elasticup to a compressive stress corresponding to 40% of the value of compressive strength, which is inaccordance with European regulations [37].
The relationship between stress and strain during concrete tension has a great influence on theresults of the analysis due to the sensitivity of the model to the development of cracks in concrete.After the analysis of different models, and due to the lack of experimental testing of tensile strength ofconcrete, the stress–strain relationship was chosen, which was proposed by Wang, T., Hsu, T.T. [40].According to this model, the relationship of stress and strain (Figure 9b) is linear up to the tensilestrength of concrete ft with the corresponding strain εcr, and with the increase of stress, the relation hasa form:
σt = ft
(εcr
εt
)c; c = 0.1; εt > εcr (1)
The concrete damaged plasticity (CDP) material model was used to define the plastic behavior ofconcrete. The CDP model introduces concrete damage due to compression and tension in the analysis.It is based on models of fracture mechanics (Drucker–Prager hyperbolic plastic flow potential function)and is adequate for modeling quasi-brittle materials [41]. A more detailed analysis of the CDP materialmodel can be found in the literature [42–45]. For adequate application of the CDP model, it is necessaryto define the following parameters:
• Dilation angle ψ (10◦ ≤ ψ ≤ 40◦), whereby the adopted value in the paper is ψ = 35◦. The analysesindicated that satisfactory results are obtained when the dilation angle is between 30◦ and 40◦,as well as the differences are minimal for the different values of dilation angle in the mentionedrange [43,45];
• eccentricity of the plastic potential flow ε, whereby the adopted value in the paper is ε = 0.1(default value). It was confirmed that the default value provides satisfactory results [42,45];
• ratio of biaxial and uniaxial compression flow stress of σb0/σc0, whereby the adopted value inthe paper is σb0/σc0 = 1.16 (default value). It was confirmed that the default value providessatisfactory results [43,45];
• ratio of the magnitude of deviation stress in tension and compression K, whereby the adoptedvalue in the paper is K = 0.666 (default value). It was confirmed that the default value providessatisfactory results [43,45]. In [43] the impact of this parameter was analyzed and it wasdemonstrated that its impact on the results is small, and that a higher K provides a stiffer model;
• viscosity parameter µ, which is implemented for the purpose of achieving a solution convergence,whereby the adopted value in the paper is µ = 0.0002. This parameter should be around 15% ofthe time increment [43].
Concrete damage plasticity model is characterized by the possible inclusion of the reduction ofthe modulus of elasticity due to the materials damage, with the aid of damage parameters dc for thecompression and dt for the tension. Damage parameters, dc and dt, can be defined by the relation [41]:
dc = 1−σc
E0(εc − ε
plc
) ; dt = 1−σt
E0(εt − ε
plt
) (2)
Variation of damage parameters in the function of strains in concrete for the analyzed model ispresented in Figure 10. It should be mentioned that in the software, the parameters are defined inrelation to the inelastic strain, whereby the limit of elastic behavior of the analyzed concrete undercompression is 0.4·fc = 20.11 MPa (corresponding strain 0.0009), and the limit of elastic behavior intension is ft = 3.42 MPa (corresponding strain 0.000153). The experimentally determined splittingtensile strength of concrete is fct,sp = 3.80 MPa (Table 4). The bearing capacity to axial tension was
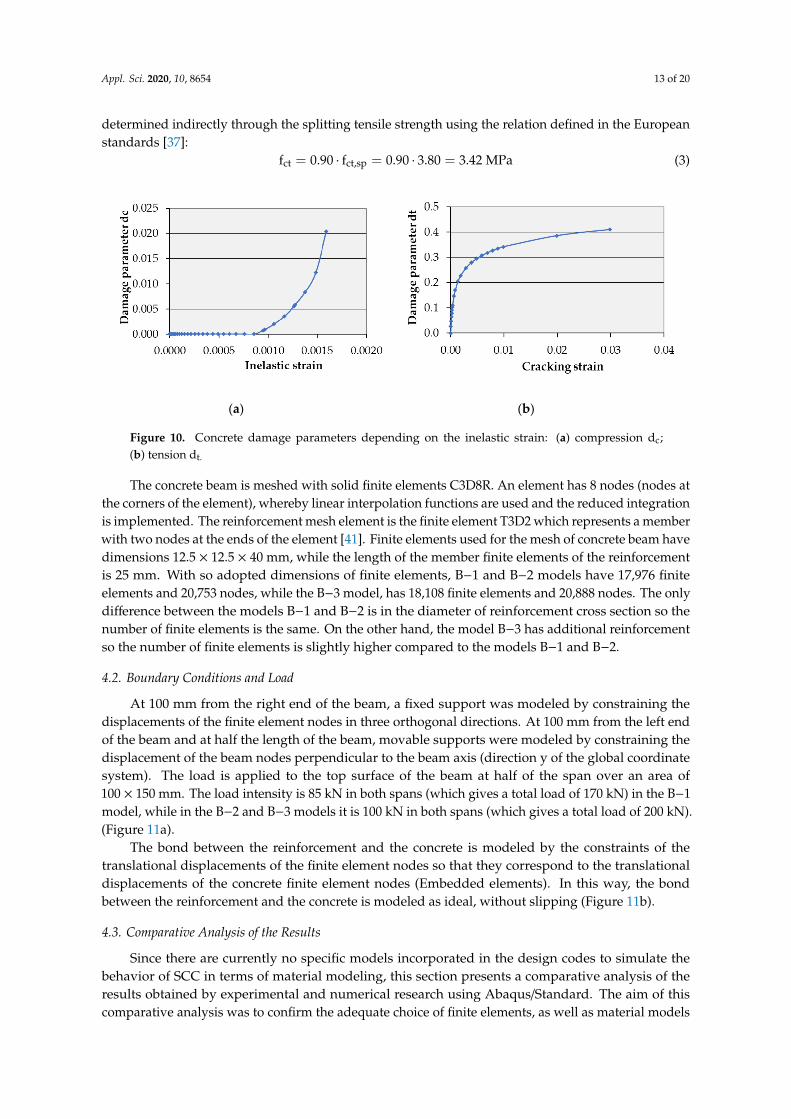
Appl. Sci. 2020, 10, 8654 13 of 20
determined indirectly through the splitting tensile strength using the relation defined in the Europeanstandards [37]:
fct = 0.90 · fct,sp = 0.90 · 3.80 = 3.42 MPa (3)Appl. Sci. 2020, 10, x FOR PEER REVIEW 14 of 21
(a) (b)
Figure 10. Concrete damage parameters depending on the inelastic strain: (a) compression dc; (b) tension dt.
The concrete beam is meshed with solid finite elements C3D8R. An element has 8 nodes (nodes at the corners of the element), whereby linear interpolation functions are used and the reduced integration is implemented. The reinforcement mesh element is the finite element T3D2 which represents a member with two nodes at the ends of the element [41]. Finite elements used for the mesh of concrete beam have dimensions 12.5 × 12.5 × 40 mm, while the length of the member finite elements of the reinforcement is 25 mm. With so adopted dimensions of finite elements, B−1 and B−2 models have 17,976 finite elements and 20,753 nodes, while the B−3 model, has 18,108 finite elements and 20,888 nodes. The only difference between the models B−1 and B−2 is in the diameter of reinforcement cross section so the number of finite elements is the same. On the other hand, the model B−3 has additional reinforcement so the number of finite elements is slightly higher compared to the models B−1 and B−2.
4.2. Boundary Conditions and Load
At 100 mm from the right end of the beam, a fixed support was modeled by constraining the displacements of the finite element nodes in three orthogonal directions. At 100 mm from the left end of the beam and at half the length of the beam, movable supports were modeled by constraining the displacement of the beam nodes perpendicular to the beam axis (direction y of the global coordinate system). The load is applied to the top surface of the beam at half of the span over an area of 100 × 150 mm. The load intensity is 85 kN in both spans (which gives a total load of 170 kN) in the B−1 model, while in the B−2 and B−3 models it is 100 kN in both spans (which gives a total load of 200 kN). (Figure 11a).
(a)
(b)
Figure 10. Concrete damage parameters depending on the inelastic strain: (a) compression dc;(b) tension dt.
The concrete beam is meshed with solid finite elements C3D8R. An element has 8 nodes (nodes atthe corners of the element), whereby linear interpolation functions are used and the reduced integrationis implemented. The reinforcement mesh element is the finite element T3D2 which represents a memberwith two nodes at the ends of the element [41]. Finite elements used for the mesh of concrete beam havedimensions 12.5 × 12.5 × 40 mm, while the length of the member finite elements of the reinforcementis 25 mm. With so adopted dimensions of finite elements, B−1 and B−2 models have 17,976 finiteelements and 20,753 nodes, while the B−3 model, has 18,108 finite elements and 20,888 nodes. The onlydifference between the models B−1 and B−2 is in the diameter of reinforcement cross section so thenumber of finite elements is the same. On the other hand, the model B−3 has additional reinforcementso the number of finite elements is slightly higher compared to the models B−1 and B−2.
4.2. Boundary Conditions and Load
At 100 mm from the right end of the beam, a fixed support was modeled by constraining thedisplacements of the finite element nodes in three orthogonal directions. At 100 mm from the left endof the beam and at half the length of the beam, movable supports were modeled by constraining thedisplacement of the beam nodes perpendicular to the beam axis (direction y of the global coordinatesystem). The load is applied to the top surface of the beam at half of the span over an area of100 × 150 mm. The load intensity is 85 kN in both spans (which gives a total load of 170 kN) in the B−1model, while in the B−2 and B−3 models it is 100 kN in both spans (which gives a total load of 200 kN).(Figure 11a).
The bond between the reinforcement and the concrete is modeled by the constraints of thetranslational displacements of the finite element nodes so that they correspond to the translationaldisplacements of the concrete finite element nodes (Embedded elements). In this way, the bondbetween the reinforcement and the concrete is modeled as ideal, without slipping (Figure 11b).
4.3. Comparative Analysis of the Results
Since there are currently no specific models incorporated in the design codes to simulate thebehavior of SCC in terms of material modeling, this section presents a comparative analysis of theresults obtained by experimental and numerical research using Abaqus/Standard. The aim of thiscomparative analysis was to confirm the adequate choice of finite elements, as well as material models
Appl. Sci. 2020, 10, 8654 14 of 20
of concrete and steel for modeling the behavior of continuous beams. In this way, a valid and verifiednumerical model is proposed that can be applied for further parametric analysis of the examinedproblem without expensive experimental tests.
Appl. Sci. 2020, 10, x FOR PEER REVIEW 14 of 21
(a) (b)
Figure 10. Concrete damage parameters depending on the inelastic strain: (a) compression dc; (b) tension dt.
The concrete beam is meshed with solid finite elements C3D8R. An element has 8 nodes (nodes at the corners of the element), whereby linear interpolation functions are used and the reduced integration is implemented. The reinforcement mesh element is the finite element T3D2 which represents a member with two nodes at the ends of the element [41]. Finite elements used for the mesh of concrete beam have dimensions 12.5 × 12.5 × 40 mm, while the length of the member finite elements of the reinforcement is 25 mm. With so adopted dimensions of finite elements, B−1 and B−2 models have 17,976 finite elements and 20,753 nodes, while the B−3 model, has 18,108 finite elements and 20,888 nodes. The only difference between the models B−1 and B−2 is in the diameter of reinforcement cross section so the number of finite elements is the same. On the other hand, the model B−3 has additional reinforcement so the number of finite elements is slightly higher compared to the models B−1 and B−2.
4.2. Boundary Conditions and Load
At 100 mm from the right end of the beam, a fixed support was modeled by constraining the displacements of the finite element nodes in three orthogonal directions. At 100 mm from the left end of the beam and at half the length of the beam, movable supports were modeled by constraining the displacement of the beam nodes perpendicular to the beam axis (direction y of the global coordinate system). The load is applied to the top surface of the beam at half of the span over an area of 100 × 150 mm. The load intensity is 85 kN in both spans (which gives a total load of 170 kN) in the B−1 model, while in the B−2 and B−3 models it is 100 kN in both spans (which gives a total load of 200 kN). (Figure 11a).
(a)
(b)
Figure 11. (a) Limit conditions and load; (b) bond of concrete and reinforcement.
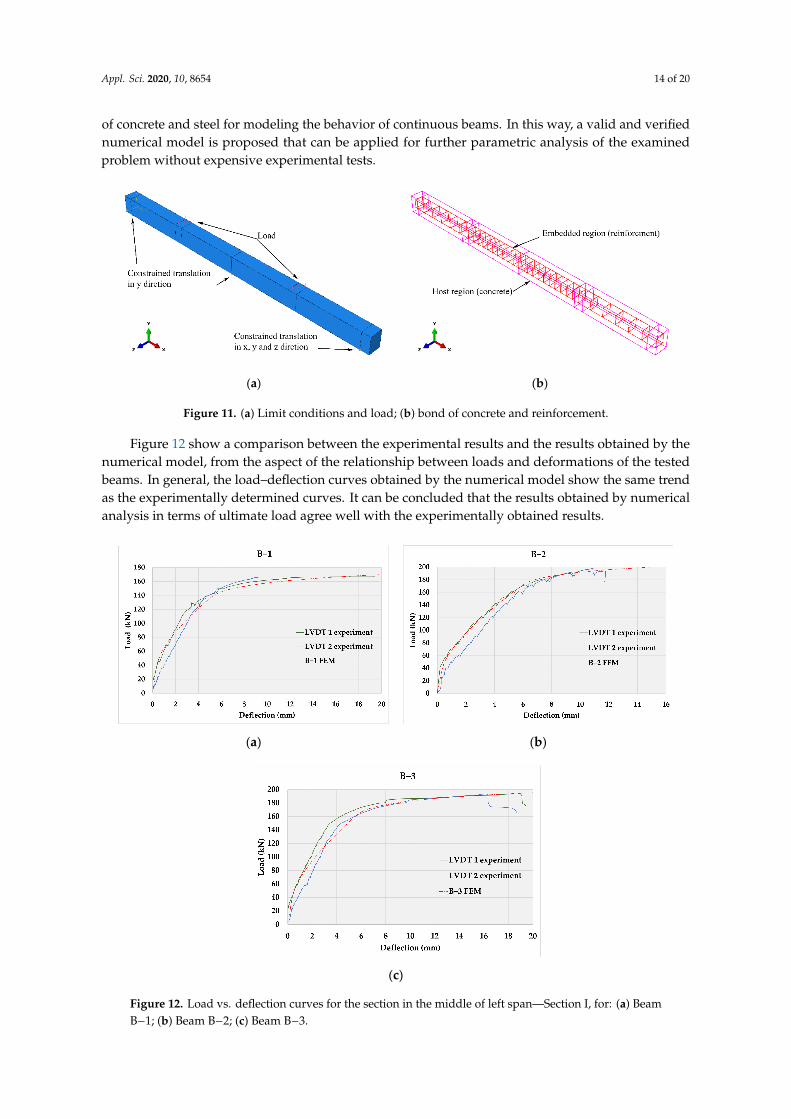
Figure 12 show a comparison between the experimental results and the results obtained by thenumerical model, from the aspect of the relationship between loads and deformations of the testedbeams. In general, the load–deflection curves obtained by the numerical model show the same trendas the experimentally determined curves. It can be concluded that the results obtained by numericalanalysis in terms of ultimate load agree well with the experimentally obtained results.
Appl. Sci. 2020, 10, x FOR PEER REVIEW 15 of 21
Figure 11. (a) Limit conditions and load; (b) bond of concrete and reinforcement.
The bond between the reinforcement and the concrete is modeled by the constraints of the translational displacements of the finite element nodes so that they correspond to the translational displacements of the concrete finite element nodes (Embedded elements). In this way, the bond between the reinforcement and the concrete is modeled as ideal, without slipping (Figure 11b).
4.3. Comparative Analysis of the Results
Since there are currently no specific models incorporated in the design codes to simulate the behavior of SCC in terms of material modeling, this section presents a comparative analysis of the results obtained by experimental and numerical research using Abaqus/Standard. The aim of this comparative analysis was to confirm the adequate choice of finite elements, as well as material models of concrete and steel for modeling the behavior of continuous beams. In this way, a valid and verified numerical model is proposed that can be applied for further parametric analysis of the examined problem without expensive experimental tests.
Figure 12 show a comparison between the experimental results and the results obtained by the numerical model, from the aspect of the relationship between loads and deformations of the tested beams. In general, the load–deflection curves obtained by the numerical model show the same trend as the experimentally determined curves. It can be concluded that the results obtained by numerical analysis in terms of ultimate load agree well with the experimentally obtained results.
(a) (b)
(c)
Figure 12. Load vs. deflection curves for the section in the middle of left span—Section I, for: (a) Beam B−1; (b) Beam B−2; (c) Beam B−3.
Figures 13 and 14 show diagrams of the dependence between loads and strains in tensioned steel reinforcement and strains in compressed concrete in Section I (section in the middle of the span) and Section III (section above the middle support). It can be noticed that there is a discrepancy between the values obtained experimentally and those obtained numerically. One reason for this is
Figure 12. Load vs. deflection curves for the section in the middle of left span—Section I, for: (a) BeamB−1; (b) Beam B−2; (c) Beam B−3.

Appl. Sci. 2020, 10, 8654 15 of 20
Figures 13 and 14 show diagrams of the dependence between loads and strains in tensioned steelreinforcement and strains in compressed concrete in Section I (section in the middle of the span) andSection III (section above the middle support). It can be noticed that there is a discrepancy between thevalues obtained experimentally and those obtained numerically. One reason for this is the differentstiffness of the experimental and numerical model after the emergence of cracks, which indicates theneed for further research.
Appl. Sci. 2020, 10, x FOR PEER REVIEW 16 of 21
the different stiffness of the experimental and numerical model after the emergence of cracks, which indicates the need for further research.
(a) (b)
(c)
Figure 13 Load vs. microstrain curves in tensioned reinforcement in Section I for: (a) Beam B−1; (b) Beam B−2; (c) Beam B−3.
(a) (b)
Figure 13. Load vs. microstrain curves in tensioned reinforcement in Section I for: (a) Beam B−1;(b) Beam B−2; (c) Beam B−3.
During the testing of reinforced SCC, the load–displacement curve is linear and the beam is in theelastic region up to the load that causes the emergence of the first crack. The load at which the firstcrack occurs can be read from the curve as the load at which there is a significant change in the slope ofthe curve. The initial crack occurs when the stress occurring in the beam exceeds the rupture modulusof the beam. This occurs at the point of maximum moment, which in the case of the tested beams isthe cross section above the central support. The linear response of the beam to the appearance of thefirst crack is followed by a nonlinear response. It can be said that concrete now “flows”, i.e., exhibitsinelastic properties. Cracks propagate along the height of the beam. Eventually the beam fails. In thenumerical model, the failure load manifests itself as the convergence failure of the model, while in theexperimental model the failure of the beam occurs.
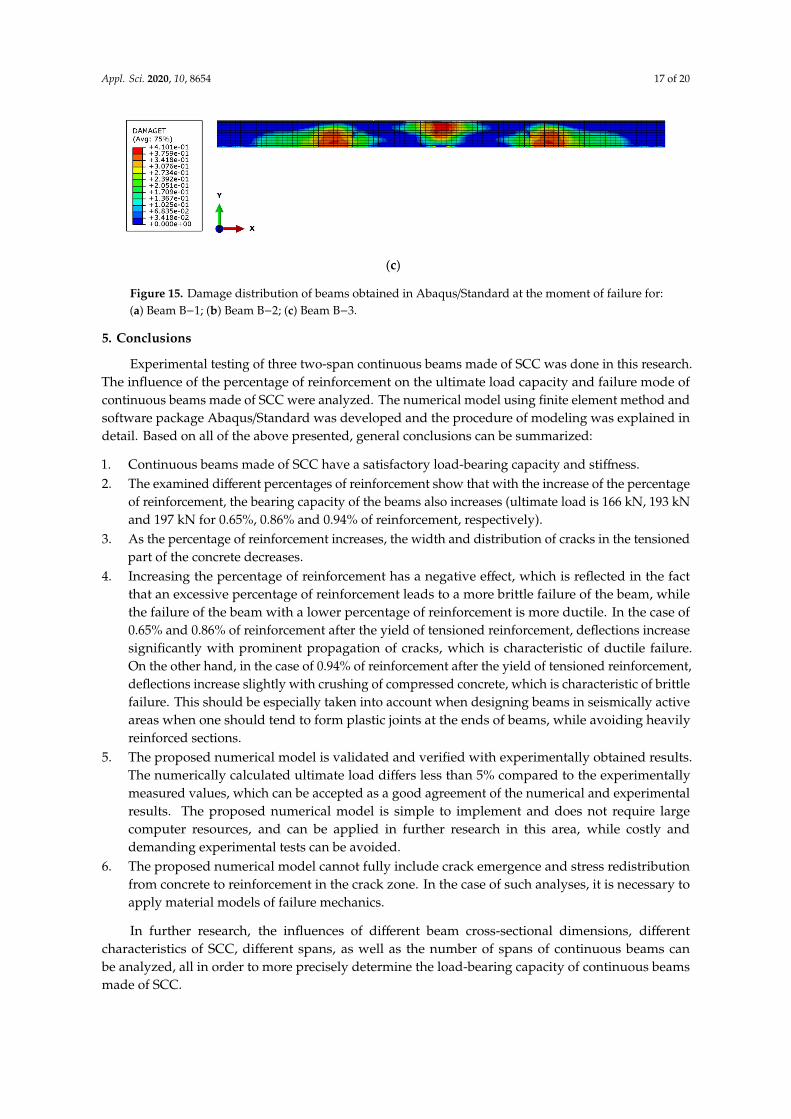
Using proposed model, it is not possible to plot cracks in the Abaqus/Standard software, but itis possible to display the damage distribution in both tensioned and compressed zones using theDAMAGET and DAMAGEC functions. The obtained distribution of damage indicates the appearanceof cracks in the beams. Figure 15 shows the distribution of damage of the beams at the time of failure.

Appl. Sci. 2020, 10, 8654 16 of 20
Concrete damage in the numerical model agrees satisfactorily with the map of cracks obtained byexperimental testing (Figure 6).
Appl. Sci. 2020, 10, x FOR PEER REVIEW 16 of 21
the different stiffness of the experimental and numerical model after the emergence of cracks, which indicates the need for further research.
(a) (b)
(c)
Figure 13 Load vs. microstrain curves in tensioned reinforcement in Section I for: (a) Beam B−1; (b) Beam B−2; (c) Beam B−3.
(a) (b) Appl. Sci. 2020, 10, x FOR PEER REVIEW 17 of 21
(c)
Figure 14. Load vs. microstrain curves in tensioned reinforcement in Section III for: (a) Beam B−1; (b) Beam B−2; (c) Beam B−3.
During the testing of reinforced SCC, the load–displacement curve is linear and the beam is in the elastic region up to the load that causes the emergence of the first crack. The load at which the first crack occurs can be read from the curve as the load at which there is a significant change in the slope of the curve. The initial crack occurs when the stress occurring in the beam exceeds the rupture modulus of the beam. This occurs at the point of maximum moment, which in the case of the tested beams is the cross section above the central support. The linear response of the beam to the appearance of the first crack is followed by a nonlinear response. It can be said that concrete now “flows”, i.e., exhibits inelastic properties. Cracks propagate along the height of the beam. Eventually the beam fails. In the numerical model, the failure load manifests itself as the convergence failure of the model, while in the experimental model the failure of the beam occurs.
Using proposed model, it is not possible to plot cracks in the Abaqus/Standard software, but it is possible to display the damage distribution in both tensioned and compressed zones using the DAMAGET and DAMAGEC functions. The obtained distribution of damage indicates the appearance of cracks in the beams. Figure 15 shows the distribution of damage of the beams at the time of failure. Concrete damage in the numerical model agrees satisfactorily with the map of cracks obtained by experimental testing (Figure 6).
(a)
(b)
Figure 14. Load vs. microstrain curves in tensioned reinforcement in Section III for: (a) Beam B−1;(b) Beam B−2; (c) Beam B−3.
Appl. Sci. 2020, 10, x FOR PEER REVIEW 17 of 21
(c)
Figure 14. Load vs. microstrain curves in tensioned reinforcement in Section III for: (a) Beam B−1; (b) Beam B−2; (c) Beam B−3.
During the testing of reinforced SCC, the load–displacement curve is linear and the beam is in the elastic region up to the load that causes the emergence of the first crack. The load at which the first crack occurs can be read from the curve as the load at which there is a significant change in the slope of the curve. The initial crack occurs when the stress occurring in the beam exceeds the rupture modulus of the beam. This occurs at the point of maximum moment, which in the case of the tested beams is the cross section above the central support. The linear response of the beam to the appearance of the first crack is followed by a nonlinear response. It can be said that concrete now “flows”, i.e., exhibits inelastic properties. Cracks propagate along the height of the beam. Eventually the beam fails. In the numerical model, the failure load manifests itself as the convergence failure of the model, while in the experimental model the failure of the beam occurs.
Using proposed model, it is not possible to plot cracks in the Abaqus/Standard software, but it is possible to display the damage distribution in both tensioned and compressed zones using the DAMAGET and DAMAGEC functions. The obtained distribution of damage indicates the appearance of cracks in the beams. Figure 15 shows the distribution of damage of the beams at the time of failure. Concrete damage in the numerical model agrees satisfactorily with the map of cracks obtained by experimental testing (Figure 6).
(a)
(b)
Figure 15. Cont.
Appl. Sci. 2020, 10, 8654 17 of 20Appl. Sci. 2020, 10, x FOR PEER REVIEW 18 of 21
(c)
Figure 15. Damage distribution of beams obtained in Abaqus/Standard at the moment of failure for: (a) Beam B−1; (b) Beam B−2; (c) Beam B−3.
5. Conclusions
Experimental testing of three two-span continuous beams made of SCC was done in this research. The influence of the percentage of reinforcement on the ultimate load capacity and failure mode of continuous beams made of SCC were analyzed. The numerical model using finite element method and software package Abaqus/Standard was developed and the procedure of modeling was explained in detail. Based on all of the above presented, general conclusions can be summarized:
1. Continuous beams made of SCC have a satisfactory load-bearing capacity and stiffness. 2. The examined different percentages of reinforcement show that with the increase of the
percentage of reinforcement, the bearing capacity of the beams also increases (ultimate load is 166 kN, 193 kN and 197 kN for 0.65%, 0.86% and 0.94% of reinforcement, respectively).
3. As the percentage of reinforcement increases, the width and distribution of cracks in the tensioned part of the concrete decreases.
4. Increasing the percentage of reinforcement has a negative effect, which is reflected in the fact that an excessive percentage of reinforcement leads to a more brittle failure of the beam, while the failure of the beam with a lower percentage of reinforcement is more ductile. In the case of 0.65% and 0.86% of reinforcement after the yield of tensioned reinforcement, deflections increase significantly with prominent propagation of cracks, which is characteristic of ductile failure. On the other hand, in the case of 0.94% of reinforcement after the yield of tensioned reinforcement, deflections increase slightly with crushing of compressed concrete, which is characteristic of brittle failure. This should be especially taken into account when designing beams in seismically active areas when one should tend to form plastic joints at the ends of beams, while avoiding heavily reinforced sections.
5. The proposed numerical model is validated and verified with experimentally obtained results. The numerically calculated ultimate load differs less than 5% compared to the experimentally measured values, which can be accepted as a good agreement of the numerical and experimental results. The proposed numerical model is simple to implement and does not require large computer resources, and can be applied in further research in this area, while costly and demanding experimental tests can be avoided.
6. The proposed numerical model cannot fully include crack emergence and stress redistribution from concrete to reinforcement in the crack zone. In the case of such analyses, it is necessary to apply material models of failure mechanics.
In further research, the influences of different beam cross-sectional dimensions, different characteristics of SCC, different spans, as well as the number of spans of continuous beams can be analyzed, all in order to more precisely determine the load-bearing capacity of continuous beams made of SCC.
Author Contributions: Conceptualization, Ž.P. and B.M. (Bojan Milošević); methodology, B.M. (Bojan Milošević) and S.R.; software, A.Z. and Ž.P.; validation, Ž.P., B.M. (Bojan Milošević) and A.Z.; formal analysis,
Figure 15. Damage distribution of beams obtained in Abaqus/Standard at the moment of failure for:(a) Beam B−1; (b) Beam B−2; (c) Beam B−3.
5. Conclusions
Experimental testing of three two-span continuous beams made of SCC was done in this research.The influence of the percentage of reinforcement on the ultimate load capacity and failure mode ofcontinuous beams made of SCC were analyzed. The numerical model using finite element method andsoftware package Abaqus/Standard was developed and the procedure of modeling was explained indetail. Based on all of the above presented, general conclusions can be summarized:
1. Continuous beams made of SCC have a satisfactory load-bearing capacity and stiffness.2. The examined different percentages of reinforcement show that with the increase of the percentage
of reinforcement, the bearing capacity of the beams also increases (ultimate load is 166 kN, 193 kNand 197 kN for 0.65%, 0.86% and 0.94% of reinforcement, respectively).
3. As the percentage of reinforcement increases, the width and distribution of cracks in the tensionedpart of the concrete decreases.
4. Increasing the percentage of reinforcement has a negative effect, which is reflected in the factthat an excessive percentage of reinforcement leads to a more brittle failure of the beam, whilethe failure of the beam with a lower percentage of reinforcement is more ductile. In the case of0.65% and 0.86% of reinforcement after the yield of tensioned reinforcement, deflections increasesignificantly with prominent propagation of cracks, which is characteristic of ductile failure.On the other hand, in the case of 0.94% of reinforcement after the yield of tensioned reinforcement,deflections increase slightly with crushing of compressed concrete, which is characteristic of brittlefailure. This should be especially taken into account when designing beams in seismically activeareas when one should tend to form plastic joints at the ends of beams, while avoiding heavilyreinforced sections.
5. The proposed numerical model is validated and verified with experimentally obtained results.The numerically calculated ultimate load differs less than 5% compared to the experimentallymeasured values, which can be accepted as a good agreement of the numerical and experimentalresults. The proposed numerical model is simple to implement and does not require largecomputer resources, and can be applied in further research in this area, while costly anddemanding experimental tests can be avoided.
6. The proposed numerical model cannot fully include crack emergence and stress redistributionfrom concrete to reinforcement in the crack zone. In the case of such analyses, it is necessary toapply material models of failure mechanics.
In further research, the influences of different beam cross-sectional dimensions, differentcharacteristics of SCC, different spans, as well as the number of spans of continuous beams canbe analyzed, all in order to more precisely determine the load-bearing capacity of continuous beamsmade of SCC.

Appl. Sci. 2020, 10, 8654 18 of 20
Author Contributions: Conceptualization, Ž.P. and B.M. (Bojan Miloševic); methodology, B.M. (Bojan Miloševic)and S.R.; software, A.Z. and Ž.P.; validation, Ž.P., B.M. (Bojan Miloševic) and A.Z.; formal analysis, Ž.P., A.Z.and D.Z.; investigation, S.R. and D.Z.; resources, S.R. and A.Z.; data curation, B.M. (Biljana Mladenovic);writing—original draft preparation, Ž.P. and B.M. (Bojan Miloševic); writing—review and editing, D.Z. andB.M. (Biljana Mladenovic); visualization, B.M. (Biljana Mladenovic); supervision, S.R.; project administration, Ž.P.All authors have read and agreed to the published version of the manuscript.
Funding: This research received no external funding.
Conflicts of Interest: The authors declare no conflict of interest.
References
1. Okamura, H.; Ozawa, K. Mix Design for Self-Compacting Concrete, Concrete. Libr. Jpn. Soc. Civ. Eng. 1995,25, 107–120.
2. Okamura, H.; Ouchi, M. Self-Compacting Concrete. J. Adv. Concr. Technol. 2003, 5, 5–15. [CrossRef]3. Oucho, M.; Nakamura, S.; Osterberg, T.; Hallberg, S.-E.; Lwin, M. Applications of Self-Compacting Concrete
in Japan, Europe and the United States; Transportation Research Board: Washington, DC, USA, 2003; p. 20.4. Brouwers, H.J.H.; Radix, H.J. Self-Compacting Concrete: Theoretical and experimental study. Cem. Concr.
Res. 2005, 35, 2116–2136. [CrossRef]5. Su, N.; Hsu, K.-C.; Chai, H.-W. A simple mix design method for self-compacting concrete. Cem. Concr. Res.
2001, 31, 1799–1807. [CrossRef]6. Aggarwal, P.; Siddique, R.; Aggarwal, Y.; Gupta, S.M. Self-Compacting Concrete-Procedure for Mix Design.
Leonardo Electron. J. Pract. Technol. 2008, 12, 15–24.7. Shi, C.; Wu, Z.; Wu, K.L.L. A review on mixture design methods for self-compacting concrete. Constr. Build.
Mater. 2015, 84, 387–398. [CrossRef]8. Nanthagopalan, P.; Santhanam, M. Fresh and hardened properties of self-compacting concrete produced
with manufactured sand. Cem. Concr. Compos. 2011, 33, 353–358. [CrossRef]9. Felekoglu, B.; Turkel, S.; Baradan, B. Effect of water/cement ratio on the fresh and hardened properties of
self-compacting concrete. Build. Environ. 2007, 42, 1795–1802. [CrossRef]10. Persson, B. A comparison between mechanical properties of self-compacting concrete and the corresponding
properties of normal concrete. Cem. Concr. Res. 2001, 31, 193–198. [CrossRef]11. Domone, P.L. A review of the hardened mechanical properties of self-compacting concrete. Cem. Concr.
Compos. 2007, 29, 1–12. [CrossRef]12. Vilanova, A.; Fernandez-Gomez, J.; Landsberge, A.G. Evaluation of the mechanical properties of self
compacting concrete using current estimating models Estimating the modulus of elasticity, tensile strength,and modulus of rupture of self compacting concrete. Constr. Build. Mater. 2011, 25, 3417–3426. [CrossRef]
13. Aslani, F.; Nejadi, S. Mechanical properties of conventional and self-compacting concrete: An analyticalstudy. Constr. Build. Mater. 2012, 36, 330–347. [CrossRef]
14. EFNARC. Specification and Guidelines for Self-Compacting Concrete; EFNARC: Farnham, UK, 2002; p. 32.15. EFNARC. The European Guidelines for Self-Compacting Concrete Specification; Production and Use; EFNARC:
Farnham, UK, 2005; p. 66.16. Liu, X.-J.; Yu, Z.-W.; Jiang, L.-Z. Long term behavior of self-compacting reinforced concrete beams. J. Cent.
South Univ. Technol. 2008, 15, 423–428. [CrossRef]17. Kumar, R.; Kumar, R.; Kumar, N. In Situ Performance of Self-Compacting Concrete in T-Beams. J. Mater. Civ.
Eng. 2009, 21, 103–109. [CrossRef]18. Hassan, A.A.A.; Hossain, K.M.A.; Kachemi, M. Strength, cracking and deflection performance of large-scale
self-conolidating concrete beams subjected to shear failure. Eng. Struct. 2010, 32, 1262–1271. [CrossRef]19. Sharifi, Y. Structural Performance of Self-consolidating Concrete Used in Reinforced Concrete Beams. KSCE
J. Civ. Eng. 2012, 16, 618–626. [CrossRef]20. Cattaneo, S.; Giussani, F.; Mola, F. Flexural behaviour of reinforced, prestressed and composite
self-consolidating concrete beams. Constr. Build. Mater. 2012, 36, 826–837. [CrossRef]
Appl. Sci. 2020, 10, 8654 19 of 20
21. Vidivelli, B.; Kathiravan, T.; Gobi, T. Flexural Behaviour of Self Compacting and Self Curing Concrete Beams.Asian Rev. Civ. Eng. 2013, 2, 1–9.
22. Helincks, P.; Boel, V.; Corte, W.; Schutter, G.; Desnerck, P. Structural behaviour of powder-type self-compactingconcrete: Bond performance and shear capacity. Eng. Struct. 2013, 48, 121–132. [CrossRef]
23. Korte, S.; Boel, V.; Corte, W.; Schutter, G. Behaviour of fatigue loaded self-compacting concrete compared tovibrated concrete. Struct. Concr. 2014, 15, 575–589. [CrossRef]
24. Biolzi, L.; Cattaneo, S.; Mola, F. Bending-shear response of self-consolidating and high-performance reinforcedconcrete beams. Eng. Struct. 2014, 59, 399–410. [CrossRef]
25. Aderhya, S.V.; Vennila, A.; Venkatasubramani, R.; Vidya, S.V. Flexural Behaviour of Reinforced Beam usingSelf-compacting Concrete. Int. J. Earth Sci. Eng. 2016, 9, 533–548.
26. Dharmaraj, R.; Malathy, R. Flexural behaviour of reinforced self compacting concrete containing corrosioninhibitors. Int. J. Adv. Eng. Technol. 2016, 8, 532–535.
27. Khatab, T.A.M.; Ashour, F.A.; Sheehan, T.; Lam, D. Experimental investigation on continuous reinforced SCCdeep beams and Comparisons with Code provisions and models. Eng. Struct. 2017, 131, 264–274. [CrossRef]
28. Gohar, S.; Afefy, M.H.; Kassem, M.N.; Taher FEl-Din, S. Flexural performance of self-compacting concretebeams under repeated loading. J. Eng. Struct. 2017, 143, 441–454. [CrossRef]
29. Imran Sharik, M.; Joshua Daniel, A. To study the flexural behaviour of non-prismatic beams using selfcompacting concrete. Pak. J. Biotechnol. 2017, 14, 377–381.
30. Yaw, L.T.; Osei, J.B.; Adom-Asamoah, M. On The Non-Linear Finite Element Modelling of Self-CompactingConcrete Beams. J. Struct. Transp. Stud. 2017, 2, 1–18.
31. Dolatabad, Y.A.; Maghsoudi, A.L. Ultimate stress increase in unbonded tendons in post-tensionedindeterminate I-beams cast with high strength normal and self compacting concrete. Eng. Sci. Technol. Int. J.2018, 21, 495–506. [CrossRef]
32. Akinpelu, M.A.; Adedeji, A.A. Structural Response of Reinforced Self-Compacting Concrete Deep Beamusing Finite Element Method. J. Soft Comput. Civ. Eng. 2018, 2, 36–61.
33. Mabrouk, T.S.; Rasha, M.A. Behavior of RC beams with tension lap splices confined with transversereinforcement using different types of concrete under pure bending. Alex. Eng. J. 2018, 57, 1727–1740.[CrossRef]
34. Grdic, Z.; Toplicic-Curcic, G.; Despotovic, I.; Ristic, N. Properties of self-compacting concrete prepared withcoarse recycled concrete aggregate. Constr. Build. Mater. 2010, 24, 1129. [CrossRef]
35. Miloševic, B. Experimental-Theoretical Analysis of Limit States of Linear Beams Made of Self-CompactingConcrete with Recycled Aggregate. Ph.D. Thesis, University of Niš, Niš, Serbia, 2016.
36. EN 206-9:2010. Additional Rules for Self-Compacting Concrete (SCC); European Commitee for Standardization:Brussels, Belgium, 2010; p. 27.
37. Eurocode 2: Design of Concrete Structures—Part 1-1: General Rules and Rules for Buildings; European Commiteefor Standardization: Brussels, Belgium, 2004.
38. Askarinejad, S.; Rahbar, N. Effects of cement-polymer interface properties on mechanical response offiber-reinforced cement composites. J. Nanomech. Micromech. 2017, 7, 04017002. [CrossRef]
39. Rankovic, S.; Folic, R.; Mijalkovic, M. Behavior at bending stress of reinforced concrete beams reinforced byNSM method with CFRP and GFRP bars-theoretical and experimental studies. Rom. J. Mater. 2013, 43, 4.
40. Wang, T.; Hsu, T.T.C. Nonlinear finite element analysis of concrete structures using new constitutive models.Comput. Struct. 2001, 79, 2781–2791. [CrossRef]
41. Hibbitt, D.; Karlsson, B.; Sorensen, P. Abaqus Analysis User’s Guide; Dassault Systemes: Vélizy-Villacoublay,France, 2013.
42. Alfarah, B.; López-Almansa, F.; Oller, S. New Methodology for Calculating Damage Variables Evolution inPlastic Damage Model for RC Structures. Eng. Struct. 2017, 132, 70–86. [CrossRef]
43. Genikomsou, S.A.; Polak, A.M. Finite Element Analysis of Punching Shear of Concrete Slabs Using DamagedPlasticity Model in ABAQUS. Eng. Struct. 2015, 98, 38–48. [CrossRef]

Appl. Sci. 2020, 10, 8654 20 of 20
44. Earij, A.; Alfano, G.; Cashell, K.; Zhou, X. Nonlinear three-dimensional finite-element modelling of reinforced-concrete beams: Computational challenges and experimental validation. Eng. Fail. Anal. 2017, 82, 92–115.[CrossRef]
45. Eriksson, D.; Gasch, T. FEM-Modeling of Reinforced Concrete and Verification of the Concrete Material ModelsAvailable in ABAQUS; Royal Institute of Technology, Department of Mechanics: Stockholm, Sweden, 2010.
Publisher’s Note: MDPI stays neutral with regard to jurisdictional claims in published maps and institutionalaffiliations.
© 2020 by the authors. Licensee MDPI, Basel, Switzerland. This article is an open accessarticle distributed under the terms and conditions of the Creative Commons Attribution(CC BY) license (http://creativecommons.org/licenses/by/4.0/).