Iron-Based Nanomaterials/Graphene Composites for ... - IRIS Unime
Upload
beirutarabCategory
view
0download
0


Table of Contents
Table of Contents List of FiguresList of TablesList of Abbreviations 0.0 Introduction
0.1 Definitions 0.2 Preface
0.3 Outline 0.4 Research Structure Chart 0.5 Main Research Questions 0.6 Main Objective 0.7 Scope of Thesis 0.8 Methodology
Part One: Global Warming
Introduction
Chapter One: literature Review of Global Warming
1.1 Theoretical Background of Global Warming.
1.1.1 What is Global Warming?
1.1.2 Why Global Warming?
1.1.3 Reasons of Global Warming.
1.1.4 Impact effect of Global Warming. (Negative effect on human andenvironment).
1.1.5 Relationship between Global Warming and Globalization.
Chapter Two: Damage arising from Construction Sectionleading to Emergence of Global Warming
2.1 Pollution.

2.1.1 Energy Pollution.
2.1.2 Material Pollution.
2.1.3 Climate emissions from Building sectors.
2.1.4 Carbon processes in Building Materials.
2.2 Zero Carbon or Less Problems Inflicted by BuiltEnvironment.
2.2.1 Modern Architecture.
2.2.2 Modernism.
2.2.3 Urban Heat.
Part One Conclusion.
Part Two: Contemporary Trends Environment Conscious
Introduction
Chapter Three: Contemporary Environmental ArchitectureTrends and Methods of Measurement.
3.1 Contemporary Trends.
3.1.1 Sustainable Architecture.
3.1.2 Eco-Architecture.
3.1.3 Bio-Architecture.
3.1.4 Nanoarchitecture.
3.1.5 Swarm architecture.
3.2 Measurement System of Performance Building
3.2.1 LEED (America)
3.2.2 BREEAM (Britain)

3.2.3 CASBEE (Japan)
3.2.4 The Green Pyramid Rating System (GPRS) (Egypt)
Chapter Four: Climatic Strategies
4.1 Climatic Design
4.1.1 Renewable Resources.
4.1.1.A Clean Energy.
4.1.1.B Solar Power.
4.1.1.C Green Power.
4.1.2 The Contemporary design Context.
4.1.3 Smart System (ventilation, daylight, etc...).
4.1.4 Media of Smart System.
4.2 Smart Materials
4.2.1 Materials and architecture.
4.2.2 Characteristics of smart materials.
4.2.3 Examples of Smart Materials.
Part Two Conclusion.
Part Three: Nanoarchitecture and Global Warming Solution.
Introduction
Chapter Five: Nanotechnology Solution
5.1 Nanotechnology and Nanoscience as future Solution
5.1.1 Environmental Benefits and Impacts.
5.1.2. Reduction of pollution in the production of materials.

5.1.3. Reduction of pollution in construction, use and demolition.
5.2 Futures Solutions
5.2.1. Materials for Global Warming.
5.2.2. Sensors and Smart Electronic.
5.2.3. How Recycling can help stop Global Warming .
5.2.4. Nanotechnology centers in the Arab world.
Chapter Six: Futuristic Thinking
6.1 Architecture Applications
6.1.1. Nano House.
6.1.2. Nano Studio.
6.1.3. Carbon Tower.
6.1.4 Bahrain World Trade Center.
6.2 Futuristic thinking of zero carbon urban settlement 6.2.1. Masder city.
6.2.2. Energy Island.
6.3 Futuristic thinking Nano zero carbon settlement 6.3.1. Nano-city India.
6.3.2. Nano-Polis China.
Part Three Conclusion.
Part Four: Application.
Introduction
Chapter Seven: Application (Bibliotheca Alexandrina)
7.1 Case Study (Reading Area in Bibliotheca Alexandrina)

7.1.1. Background of Case Study.
7.1.2. Concept & Analysis of Case Study
7.1.3. Recommendtions.
Part Four Conclusion.
Overall Conclusions and Recommendations
References.

List of Figures
List of Figures
Part One: Global Warming
Figure 1.1: The Shape of Globalization. Source: [http://www.onlinemarketing, Retrieved September, 2011-09-01]
Figure 1.2: Global Warming Definition. Source:[http://www.greenscroll.org, Retrieved September, 2011-09-01]
Figure 1.3: Lobbyists on Climate Change by Sector 2003, 2008. Source:[http://www.publicintegrity.org,Retrieved September, 2011-09-01]
Figure 1.4: Greenhouse Effect. Source:[http://www.publicintegrity.org,Retrieved September, 2011-09-01]
Figure 1.5: Nanotechnology Scale. Source:[ Nonmaterial’s, Nanotechnology And Design, Michael F.Ashby. (2009).]
Figure 1.6: Renewable Resources. Source:[ http://www.tutorvista.com/biology/environmental-resources RetrievedSeptember, 2011-09-01]
Figure 1.7: Cyber Society. Source:[http://beccysoc.webs.com/Retrieved September, 2011-09-01]
Figure 1.8: Cyber Space. Source:[http://beccysoc.webs.com/Retrieved September, 2011-09-01]
Figure 1.9: Nanoarchitecture, Springtecture, Public Lavatories by Singu-Cho, Japan. Source:[http://www.publicintegrity.org,Retrieved September, 2011-09-01]
Figure 1.10: Green Nanoarchitecture. Source:[ Nonmaterial’s, Nanotechnology And Design, Michael F.Ashby. (2009).]
Figure 1.11: Ecological Architecture Source:[http://beccysoc.webs.com/Retrieved September, 2011-09-01]
Figure 1.12: Sustainability. Figure 1.13: Zero Carbon Architecture. Figure 1.14: Nanocity India ( Zero carbon City )Figure 1.15: Nanosolar Energy. Figure 1.16: Globalization " World is Small Village”Source:[http://flatclassroomproject2008.wikispaces.com/Globalization+and+Outsourcing, Retrieved September, 2011-09-01]
Figure 1.17: Climate Change Diagram Source: [ Prevent Air Pollution, Dr.Mohamed El-Ray. (2009).]
Figure 1.18: The Main Greenhouse Gases. Source: [ Prevent Air Pollution, Dr.Mohamed El-Ray. (2009).]
Figure 1.19: Global Energy Balance. Source: [http://www.bom.gov.au, Retrieved September, 2011-09-01]
Figure 1.20: Global anthropogenic. Source: [http://www.bom.gov.au, Retrieved September, 2011-09-01]
Figure 1.21: Atmospheric absorption and scattering at different electromagneticwavelengths. Source:[http://en.wikipedia.org/wiki/Greenhouse_gas, Retrieved September, 2011-09-01]
Figure 1.22: Carbon monoxide. Source:[http://beccysoc.webs.com/Retrieved September, 2011-09-01]
Figure 1.23: Carbon Store. Source:[http://beccysoc.webs.com/Retrieved September, 2011-09-01] Figure 1.24: Research structure chart.Figure 1.25: Advanced Technologies Source: [ http://claypeck.com/2011/01/03/a-digital-fast/, Retrieved Sep, 2011-09-06]
Figure 1.26: Green Building Source: [http://saungdesign.blogspot.com, Retrieved September, 2011-09-06]
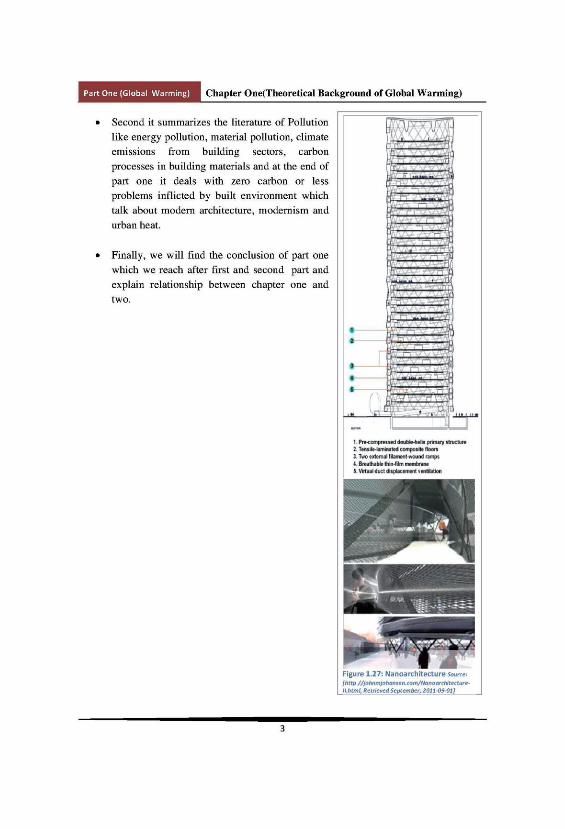
Figure 1.27: Nanoarchitecture. Source: [http //johnmjohansen.com/Nanoarchitecture-II.html, Retrieved September, 2011-09-06]
Figure 1.28: A greenhouse has a similar effect to the atmosphere on the incoming solarradiation and the emitted thermal Source: [Global warming. John Houghton, Hadley Centre, Meteorological Office, Exeter EX1 3PB, UK (2002), Retrieved June 1s, 2011-09-01]
Figure 1.29: Greenhouse Effect Source: [Source: [http://www.suratclimatechange.org/page/2/greenhouse-effect.html, Retrieved June 1s, 2011-09-01]
Figure 1.30: Greenhouse Gasses. Source: [http://www.tutorvista.com/content/biology/biology-iv/environmental-changes/green-house-gases.php,Retrieved June 1s, 2011-09-01]

Figure 1.31: The global energy balance the amount of energy the Earth receives from theSun is balanced by the amount it loses back to space.Source:[http://en.wikipedia.org/wiki/Global_warming,Retrieved Sept., 2011-09-09]
Figure 1.32: Major components needed to understand the climate system and climatechange. Source:[http://en.wikipedia.org/wiki/Global_warming,Retrieved Sept., 2011-09-09]
Figure 1.33: The Debate (Kyoto Protocol). Source:[ http://global-warming articles.org/? p=173,Retrieved Sept., 2011-09-09]
Figure 1.34: Global Emissions of CO2 from Fossil Fuels, 1900-2004. Source [The InternationalEnergy Agency (IEA), 2009]
Figure 1.35: CO2emissions per capita for the year 2006 by list of Countries. Source [TheInternational Energy Agency (IEA), 2009]
Figure 1.36: CO2 from Building Use. Figure 1.37: U.S Energy Consumption by Sector. Figure 1.38: World Greenhouse gas emissions by sector. Source: World Resources Institute, ClimateAnalysis Indicator Tool (CAIT)
Figure 1.39: shown GHG emissions by country for the year 2000. Source: World Resources Institute, 2005, using data from 2000.
Figure 1.40: Copenhagen Summit. Figure 1.41: Reasons of Global Warming Source:[ vizu.typepad.com Retrieved March 2011-03-26].
Figure 1.42: US Electricity Consumption and Greenhouse Effect.Figure 1.43: The Greenhouse Effect. Source:[http://www.greenscroll.org, Retrieved March 2011-03-26].
Figure 1.44: Greenhouse Gases. Source:[http://www.greenscroll.org, Retrieved March 2011-03-26].
Figure 1.45: Carbon Dioxide Carve. Source:[ http://jcmooreonline.com/tag/global-warming, Retrieved September, 2011-09-10]
Figure 1.46: The Energy Pyramid. Source: [http://nwcommunityenergy.org/biogeo/efficiency, Retrieved September, 2011-09-10]
Figure 1.47: Extent of summer ice melt in Greenland in 1992 (left) and in 2002 (right).Source:[ http://earth habitat.blogspot.com/Retrieved March 2011-03-26]
Figure 1.48: Montana Regions. Source:[ http://www.greenscroll.org, Retrieved September, 2011-09-10]
Figure 1.49: Current Sea Level. Source:[http://www.greenscroll.org, Retrieved March 2011-03-26].
Figure 1.50: The Keeling Curve shows a pattern of steadily increasing carbon dioxide in theatmosphere. Source:[http://imagesofglobalwarming.org/?p=232 Retrieved March 2011-03-26]
Figure 1.51: Glaciers Grow. Source:[http://www.greenscroll.org, Retrieved March 2011-03-26].
Figure 1.52: O Zone Hole. Source:[http://imagesofglobalwarming.org/?p=232 Retrieved March 2011-03-26].
Figure 1.53: Other Effects of Global Warming.Source:[http://www.oceanchampions.org/GlobalWarming/globalwarming.htm Retrieved September, 2011-09-15] Figure 1.54: Globalization. Source:[https://www.llnl.gov/str/December02/December50th.html, Retrieved September, 2011-09-15]
Figure 1.55: Effects of Globalization. Source:[http://globalenglishblog.com/2011/08/30/is-there-a-globalization-penalty/, Retrieved September, 2011-09-15]
Figure 1.56: Globalization and Social. Source:[https://www.llnl.gov/str/December02/December50th.html, RetrievedSeptember, 2011-09-15]
Figure 1.57: Measuring Globalization. Source:[ http://www.greenscroll.org, Retrieved September, 2011-09-10]
Figure 1.58: View of Globalization. Figure 1.59: FIFA World Cup. Source [http://www.worldpublicopinion.org/pipa/articles/btglobalizationtradera, Retrieved September, 2011-09-15]
Figure 1.60: Facebook. Figure 1.61: Globalization. Source:[ https://www.llnl.gov/str/December02/December50th.html, Retrieved September, 2011-
09-15] Figure 1.62: Examples of Globalization. Source:[ http://www.greenscroll.org, Retrieved September, 2011-09-10]
Figure 1.63: Globalization is a combination between Politics, Economy, Socioculture andTechnological forces. Source:[ http://www.greenscroll.org, Retrieved September, 2011-09-10]
Figure 1.64: A hundred years ago only 10% of the planet lived in cities; by 2050 up to 75%of the world’s population of 8 billion will be living in urban areas. Source:[ http://www.greenscroll.org, Retrieved September, 2011-09-10]
Figure 1.65: Chart 1 shows how globalization has developed over time measured by theaverage of the individual country. Source:[ https://www.llnl.gov/str/December02/December50th.html, Retrieved
September, 2011-09-15]
Figure 1.66: Pollution. Source:[ http://www.stormfax.com/airwatch.htm, Retrieved September, 2011-09-17]
Figure 1.67: US Energy Consumption. Source:[ http://www.stormfax.com/airwatch.htm, Retrieved September, 2011-
09-17]
Figure 1.68: Pollution from Building, Transportation and Industry Sections. Figure 1.69: Electricity and Climate. Source:[ http://worldnuclear.org/education/ueg.htm, Retrieved September, 2011-
09-17]
Figure 1.70: GHGs from Energy. Source:[ http://worldnuclear.org/education/ueg.htm, Retrieved September, 2011-09-
17]
Figure 1.71: World Electricity Consumption by Region. Figure 1.72: Materials Pollution. Source:[ http://www.stormfax.com/airwatch.htm, Retrieved September, 2011-09-17]
Figure 1.73: Materials Pollution from building sector. Source:[ http://www.stormfax.com/airwatch.htm,
Retrieved September, 2011-09-17]
Figure 1.74: Sources of Emissions of Air Pollutants. Figure 1.75: Global Climate Change. Source: [ http://world-nuclear.org/education/ueg.htm, Retrieved September, 2011-09-17]
Figure 1.76: Pollutions Source. Figure 1.77: CO2 Emissions by sectors. Source: [http://www.epa.gov/climatechange/emissions/co2_human.html, Retrieved September, 2011-09-18]
Figure 1.78: United Nations Environment Programmed. Source: [http://www.unep.org, Retrieved September, 2011-09-18]
Figure 1.79: Climate emissions from Production. Source: [http://planetgreen.discovery.com/work-connect/combat-climate-change-auction.html, Retrieved September, 2011-09-18]
Figure 1.80: Projected surface temperature changes for the late 21st century (2090–2099). Temperatures are relative to the period 1980–1999 (IPCC, 2007). Figure 1.81: Carbon Processes in building materials. Source: [http://www.recovery-insulation.co.uk/energy.html,, Retrieved September, 2011-09-17]
Figure 1.82: Cumulative Energy. Source: [http://www.recoveryinsulation.co.uk/energy.html,, Retrieved September, 2011-09-17]
Figure 1.83: CO2 emissions depending on the energy used for heating and hot water for a100 square meter dwelling. Figure 1.84: Energy cost of various construction materials. Figure 1.85: Designed by Sir Norman Foster HSBC World Headquarters and One CanadaSquare, from the western end of West India Quay. Figure 1.86: The skyline of Dubai of United Arab Emirates shows how many skyscrapersare scattered along the city as a result of the welfare and revolutionary economic states inthe region. Figure 1.87: The Beijing National Stadium, or the Bird Nest, designed by the AustriansHerzog and DeMeuron. Completed in 2008, to host the Beijing Olympic Games 2008; aninternational event that China has lingered for more than 7 years to host it. In a marvelousappearance and organization incorporating the latest technologies; the Olympic Games
promotes the capital city of China as one of the most contemporary and globalized cities inthe world. Figure 1.88: The Roman use of the arch and their improvements in the use of concretefacilitated the building of the many aqueducts throughout the empire, such as themagnificent Aqueduct of Segovia and the eleven aqueducts in Rome itself.
Figure 1.89: the Wainwright Building in St. Louis, designed by Louis Sullivan.Figure 1.90: Europe's Gate, Madrid; the first intentionally inclined buildings in the worlddesigned by Philip Johnson and John Burgee and commission in 1996. Source:[http://www.recoveryinsulation.co.uk/energy.html,, Retrieved September, 2011-09-17]
Figure 1.91: A hundred years ago only 10% of the planet lived in cities; by 2050 up to 75%the planet lived in cities; by 2050 up to 75% of the world’s population of 8 billion will beliving in urban areas., Tokyo © Francesco Jodice.Figure 1.92: View of Manhattan Island in New Work, the proclaimed center of the worldwhere culture diversity meets the fastest growing business hub in the world in the pastdecades. In contrast, the rise of other Asian cities has almost eliminated the term “center ofthe world”. Figure 1.93: The London Millennium Footbridge by Norman Foster (2000), is a pedestrian-only steel suspension bridge crossing the River Thames in London, England, linking Bankside with the City. Figure 1.94: Tokyo, an example of an urban heat island. Normal temperatures of Tokyo goup more than those of the surrounding area. Source: [http://www.recoveryinsulation.co.uk/energy.html, RetrievedSeptember, 2011-09-18]
Figure 1.95: Thermal (top) and vegetation (bottom) locations around New York City viainfrared satellite imagery. A comparison of the images shows that where vegetation isdense, temperatures are cooler. Source: [http://en.wikipedia.org/wiki/Urban_heat_island, Retrieved September, 2011-09-18]
Figure 1.96: Image of Atlanta, Georgia, showing temperature distribution, with blueshowing cool temperatures, red warm and hot areas appear white. Source:[http://en.wikipedia.org/wiki/Urban_heat_island, Retrieved September, 2011-09-18]
Figure 1.97: Images of Salt Lake City, Utah, show positive correlation between whitereflective roofs and cooler temperatures. Image A depicts an aerial view of Salt Lake City, Utah, site of 865,000-square-foot (80,400 m2) white reflective roof. Image B is a thermal.Source: http://en.wikipedia.org/wiki/Urban_heat_island, Retrieved September, 2011-09-18]
Figure 1.98: A depiction of the varying degree of the urban heat island effect as a functionof land use. Gill et al. 2007found that an additional 10%green space can mitigate UHI byup to 4 °C (7 °F). Source: [ http://world-nuclear.org/education/ueg.htm, Retrieved September, 2011-09-17]
Figure 1.99: Energy balance of the urban area. Source: [http://en.wikipedia.org/wiki/Urban_heat_island, Retrieved September, 2011-09-18]
Figure 1.100: Input - output model of energy and material flows of a city.Figure 1.101: Urban heat island and ecological foot print.Figure 1.102: Ecological Footprints.Figure 1.103: Smart System.
Part Two: Contemporary Trends Environment Conscious
Figure 2.1: Global Architecture.Source: [http://directorioarco.blogspot.com/2009/04/support-global-architecture.html, Retrieved September, 2011-09-18]

Figure 2.2: Green Architecture.Figure 2.3: Smart Materials. Source: [http://placeni.blogspot.com/2011/03/riba-smart-materials-event-at-uu-wed.html, Retrieved September, 2011-09-18]
Figure 2.4: Nanoarchitecture. Source: [http://placeni.blogspot.com/2011/03/riba-smart-materials-event-at-uu-wed.html, Retrieved September, 2011-09-18]
Figure 2.5: Nano House. Source: [http://www.qrbiz.com/buy_5-1ch-home-theater-system-hong-kong, Retrieved Sep., 2011-09-18]
Figure 2.6: Using carbon nanotubes in a multistory building ( Image courtesy of imageAdam Buente + Elizabeth Boone/nanoSTUDIO).. Source: [http://directorioarco.blogspot.com/2009/04/support-global-architecture.html, Retrieved September, 2011-09-18]
Figure 2.7: Menara-Mesiniaga. Source: [http://ecofuture.net/design/kenyeang/menara-mesiniaga/, Retrieved October 14, 2011]
Figure 2.8: Dragonfly, a metabolic. Source: [http://ecofuture.net/design/kenyeang/dragonfly a metabolic/, RetrievedOctober 14, 2011]
Figure 2.9: Sustainable Design and Building. Source: [http://www.buildingdesignideas.com/2011/07/21/green-building-and-design//, Retrieved October 14, 2011]
Figure 2.10: Green Systems. Source: [http://blog.ggreendesign.com/2011/08/sustainable-design-from-builders.html/, Retrieved October 14, 2011]
Figure 2.11: Mumbai Recidence - Natural 3D Concept. Source: [http://www.efficient.ws/3d-masterplan-of-mumbai-green-architecture-by-bdp/2009/12/10/, Retrieved October 14, 2011]
Figure 2.12: Mumbai Recidence - Green Architecture. Source: [http://www.efficient.ws/3d-masterplan-of-mumbai-green-architecture-by-bdp/2009/12/10/, Retrieved October 14, 2011]
Figure 2.13: CR Land Guanganmen Green Technology Showroom. Source:[http://hosting999.net/images/, Retrieved October 1s, 2011-10-01]
Figure 2.14: The Editt Tower.Figure 2.15: Lilypad, a Floating Ecopolis designed by Vincent Callebaut Architect, style isContemporary eco-design.Figure 2.16: Lilyupad the floating building.Figure 2.17: green skin structure.Figure 2.18: BIO Architecture house-snail.Figure 2.19: house-snail Designed by Javier Senosiain. Source:[ http://hosting999.net/images/, RetrievedOctober 1s, 2011-10-01]
Figure 2.20: Model of rose campion (Lychnis coronaria).Figure 2.21: Spiral System.Figure 2.22: Plans for the future of our built environment.Figure 2.23: Microscopic image of a hair with inscription taken using a scanning electronmicroscope (SEM).Figure 2.24: “Fakes” – laminates that simulate real materials. Real wood exhibits otherhaptic, acoustic and sensory properties than wood imitations. Figure 2.25: Minute detail with great effect: gold nanoparticle are responsible for the gold-ruby effect seen in medieval church windows. The atomic structure is clearly visible.Figure 2.26: The diagram illustrates the order of magnitudes by comparing different scales, from the meter to the nanometer.Figure 2.27: Microcraters and nanosurfaces. A rougher terrain engineered on the nanoscale(top) promoted bone adhesion and inhibited bacterial growth much better than the smoothersurface engineered on the microscale (bottom). Units are in microns. Figure 2.28: Cairo Tower by Urban A&O.Figure 2.29: Parametric modeling tools in CATIA.Figure 2.30: Swarm Matter in different scales (Micro, Field). Source: [Contemporary Digital ArchitectureDesign & Techniques, Jacobo Krauel. (2011)]

Figure 2.31: leed-leadership-in-energy-and-environmental-design-green-building.Figure 2.32: LEED-bubbles of concept.Figure 2.33: LEED Certification Scorecard Breakdown.Figure 2.34: Exterior Envelope Diagram.Figure 2.35: Average Savings of Green Buildings. Source: [http://nevillebarrettjr.com/2010/08/surprising-leed-certified-restaurants/, Retrieved October 14, 2011]
Figure 2.36: Energy & Atmosphere and Indoor Environmental Quality. Source:[http://nevillebarrettjr.com/2010/08/surprising-leed-certified-restaurants/, Retrieved October 14, 2011]
Figure 2.37: LEED for New Construction Building Distribution by Building Type. Source:[http://www.masoncontractors.org/aboutmasonry/greenbuildingsystem/greenbuildingfacts.php, Retrieved October 14, 2011]
Figure 2.38: BREEAM (Building Research Establishment Environmental AssessmentMethod) logo. Source: [http://londonoffices.com/news/tag/breeam-status-awarded-to-charles-darwin-house, Retrieved October14, 2011]
Figure 2.39: credit weightings. Source: [http://www.thegreenworkplace.com/2008/08/breeam-uk-equivalent-to-leed-toughens.html, Retrieved October 14, 2011]
Figure 2.40: BREEAM Diagram.Figure 2.41: Rating systems. Source: [http://www.carboun.com/sustainable-development/sustainable-design/comparing-estidama%E2%80%99s-pearls-rating-method-to-leed-and-breeam/, Retrieved October 16, 2011]
Figure 2.42: Certification Processes of BREEAM and LEED. Source:[http://www.carboun.com/sustainable-development/sustainable-design/comparing-estidama%E2%80%99s-pearls-rating-method-to-leed-and-breeam/, Retrieved October 16, 2011]
Figure 2.43: (CASBEE) Comprehensive Assessment System for Building EnvironmentalEfficiency Logo.Figure 2.44: Assessment Stages of CASBEE for New Construction. Source:[http://www.carboun.com/sustainable-development/sustainable-design/comparing-estidama%E2%80%99s-pearls-rating-method-to-leed-and-breeam/, Retrieved October 17, 2011]
Figure 2.45: Positioning of Climate Change and Other Assessment Items within LR.Figure 2.46: Structure of the CASBEE family. Source: [http://www.carboun.com/sustainable-development/sustainable-design/comparing-estidama%E2%80%99s-pearls-rating-method-to-leed-and-breeam/, Retrieved October 17, 2011]
Figure 2.47: Concept of assessment subjects for CASBEE for Urban Development. Source:[http://www.ibec.or.jp/CASBEE/english/download.htm, Retrieved October 17, 2011]
Figure 2.48: Environmental efficiency (BEE ranks) under Urban Area + Buildings. Source:[http://www.ibec.or.jp/CASBEE/english/download.htm, Retrieved October 17, 2011]
Figure 2.49: Reorganization of Medium-level Items under LR3 Off-site Environment. Source:[http://www.ibec.or.jp/CASBEE/english/download.htm, Retrieved October 17, 2011]
Figure 2.50: CASBEE sets a virtual boundary around the assessment site that is defined bythe boundary of the site. Based on this concept, BEEH (building Environmental EfficiencyHome) is an indicator for assessing the environmental efficiency of a home in terms of theenvironmental quality (Q) and environmental (L). Source:[http://www.ibec.or.jp/CASBEE/english/download.htm, Retrieved October 17, 2011]
Figure 2.51: Building outline Case Study Building type: Office (Laboratory) Location:Shiojiri city, Nagano Pref. Site area: 29,525 m2 Total floor area: 53,372 m2 Floors: +7Completion: Feb. 2006. Source: [http://www.ibec.or.jp/CASBEE/english/download.htm, Retrieved October 17, 2011]
Figure 2.52: Green Pyramid Rating System (GPRS) (Egypt) logo. Source:[http://www.hbrc.edu.eg/files/GPRS-202011.pdf, Retrieved October 20, 2011]
Figure 2.53: The Housing and Building National Research Center. Source:[http://www.hbrc.edu.eg/files/GPRS-202011.pdf, Retrieved October 20, 2011]
Figure 2.54: assessment and rating process. Source: [http://www.hbrc.edu.eg/files/GPRS-202011.pdf, RetrievedOctober 20, 2011]
Figure 2.55: assessment and rating Outline. Source: [http://www.hbrc.edu.eg/files/GPRS-202011.pdf, RetrievedOctober 20, 2011]

Figure 2.56: Renewable Energy. Source: [http://www.ryancanderson.com/naturalresources-infographic.php, RetrievedOctober 20, 2011]
Figure 2.57: Natural Resources. Source: [http://www.ryancanderson.com/naturalresources-infographic.php, RetrievedOctober 20, 2011]
Figure 2.58: Elements of Clean Energy. Source: [http://onlinescienceallthetime.blogspot.com/2010/08/types-of-natural-resources.html, Retrieved October 20, 2011]
Figure 2.59: Visualizing Natural Resources Solar Panels. Source:[http://www.repreverenewables.com/about-biomass.html, Retrieved October 23, 2011]
Figure 2.60: Greenhouse Gas Emissions from different forms of Transport. Source:[http://www.deakin.edu.au/travelsmart/benefits.php, Retrieved October 23, 2011]
Figure 2.61: World Potential Renewable Energy. Source: [http://www.deakin.edu.au/travelsmart/benefits.php, Retrieved October 23, 2011]
Figure 2.62: Role of Renewable Energy in the Nation’s Energy Supply 2008. Source:[http://www.repreverenewables.com/about-biomass.html, Retrieved October 23, 2011]
Figure 2.63: Clean Energy. Source: [http://www.secondstreet.com/PortfolioCleanEnergy.html, Retrieved October 23, 2011]
Figure 2.64: Solar, Wind and Biomass types of Clean Energy. Source:[http://www.secondstreet.com/PortfolioCleanEnergy.html, Retrieved October 23, 2011]
Figure 2.65: biomass-natural-production-cycle. Source: [http://www.repreverenewables.com/about-biomass.html, Retrieved October 23, 2011]
Figure 2.66: Ecosystems Design. Source: [http://diotima.infotech.monash.edu.au/~jonmc/sa/research/creative-ecosystems/, Retrieved October 23, 2011]
Figure 2.67: clean energy and global warming. Source:[http://www.ucsusa.org/global_warming/solutions/big_picture_solutions/global_warming_crossroads.html, Retrieved October 23, 2011]
Figure 2.68: energy-resources-renewable-nonrenewable. Figure 2.69: Basic Solar Power System. Source: [http://picture7412.myblog.it/archive/2011/06/25/solar-power-system.html?googleresim, Retrieved October 23, 2011]
Figure 2.70: How Photovoltaic System Works. Source: [http://www.solarexpert.com/solar-electric-how-it-works.html, Retrieved October 23, 2011]
Figure 2.71: Five Elements of Passive Solar Design. Source:[http://www.ucsusa.org/global_warming/solutions/big_picture_solutions/global_warming_crossroads.html, Retrieved October 23, 2011]
Figure 2.72: Passive Solar Design. Source: [http://scambs.jdi consult.net/ldf/readdoc.php?docid=202&chapter=13, Retrieved October 23, 2011]
Figure 2.73: Solar Water Heating. Source: [http://solarheatcool.sustainablesources.com/, Retrieved October 23, 2011]
Figure 2.74: Solar Domestic Water Heating System. Source:[http://www.solardirect.com/swh/active/open/active-open.htm, Retrieved October 23, 2011]
Figure 2.75: Solar Electric System. Source: [http://www.solar-green-wind.com/archives/tag/solar-power-systems, Retrieved October 26, 2011]
Figure 2.76: Visualizing Natural Resources. Source: [http://www.solar-green-wind.com/archives/tag/solar-power-systems, Retrieved October 26, 2011]
Figure 2.77: Solar Works on Home. Source: [http://abacusenergypartners.com/products/residential/solar-pv-electricity/how-solar-works-on-your-home/, Retrieved October 26, 2011]
Figure 2.78: The Four Times Square Building in New York City uses thin-film PV panelsto reduce the building’s power load from the utility grid. Figure 2.79: Solar Thermal Electricity. Figure 2.80: Concentrating Solar Power. Figure 2.81: Solar ORC technology has three main components: the parabolic troughs, theorganic Rankine cycle (ORC) engine, and the electrical control system.Figure 2.82: California Utility Agrees to Buy 553 Megawatts of Solar Power. Source:[http://apps1.eere.energy.gov/news/news_detail.cfm/news_id=11132, Retrieved October 26, 2011]
Figure 2.83: Green Power Logos. Source: [http://green-power-clean.com/, Retrieved October 26, 2011]
Figure 2.84: Renewable Resources Generation. Source: [http://solarheatcool.sustainablesources.com/, RetrievedOctober 28, 2011]

Figure 2.85: Renewable Electricity and Renewable Electricity Certificates “RECs”. Source:[http://solarheatcool.sustainablesources.com/, Retrieved October 28, 2011]
Figure 2.86: Renewable Electricity. Source: [http://solarheatcool.sustainablesources.com/, Retrieved October 28, 2011]
Figure 2.87: Energy Breakdowns. Source: [http://sunhome.mst.edu/2011/10/, Retrieved October 28, 2011]
Figure 2.88: Solar Photovoltaic Cells. Source: [http://www.greentechnolog.com/photovoltaics/, Retrieved October 28, 2011]
Figure 2.89: Wind Turbines. Source: [http://solarheatcool.sustainablesources.com/, Retrieved October 28, 2011]
Figure 2.90: Landfill and sewage methane gas. Source: [http://solarheatcool.sustainablesources.com/, RetrievedOctober 28, 2011]
Figure 2.91: Biomass Sources.Figure 2.92: Micro Fuel Cell System.Figure 2.93: Aerogel has a density only three times that of air, but it can support significantweights and is a superb insulator. Aerogels were discovered in 1931 but were not exploreduntil the 1970s. (NASA).Figure 2.94: Aerogel. Source: [http://stardust.jpl.nasa.gov/photo/posters.html, Retrieved October 28, 2011]
Figure 2.95: the ‘heat’ chair that uses thermochromic paint to provide a marker of whereand when the body rested on the surface. (Courtesy of Juergen Mayer H).Figure 2.96: Smart Home Design. Source: [http://www.deakin.edu.au/travelsmart/benefits.php, Retrieved October 28, 2011]
Figure 2.97: Intelligent Buildings Systems. Source:[http://www.automatedbuildings.com/news/dec07/articles/sinopoli/071129114606sinopoli.htm, Retrieved October 30, 2011]
Figure 2.98: the commonality of smart and green buildings. Source:[http://www.buildings.com/tabid/3334/ArticleID/5736/Default.aspx Retrieved October 30, 2011]
Figure 2.99: Smart Systems.Figure 2.100: Multiple proprietary building systems.Figure 2.101: Integrated building systems.Figure 2.102: Smart Buildings Component and energy building System.Figure 2.103: Building Management Systems (BMS).Figure 2.104: fire and smoke detection and photo optics from environment data.Figure 2.105: Daylight Controllers.Figure 2.106: Louver from Sun Controllers.Figure 2.107: Wind Turbines from Electricity generators.Figure 2.108: Double Skin.Figure 2.109: Building Information Modeling (BIM) Elements. Source: [http://www.scia-online.com/en/bim-building-information-modeling-software.html, Retrieved October 30, 2011]
Figure 2.110: BIM applications. Source: [http://www.scia-online.com/en/bim-building-information-modeling-software.html, Retrieved October 30, 2011]
Figure 2.111: BIM Components. Source: [http://www.scia-online.com/en/bim-building-information-modeling-software.html, Retrieved October 30, 2011]
Figure 2.112: Many Type of Building Information Modeling (Revit Architecture, SmartBIM).Figure 2.113: Interface of Revit Program and how it works. Source:[http://www.bluentcad.com/services/revit-bim-services.html, Retrieved October 30, 2011]
Figure 2.114: Benefits of BIM Process. Source: [http://www.cowieassociates.com/2010/heres-something-new-about-boma/, Retrieved November 04, 2011]
Figure 2.115: Autodesk Revit. Source: [http://www.cowieassociates.com/2010/heres-something-new-about-boma/, Retrieved November 04, 2011]
Figure 2.116: 3D Architectural Model and Site Logistic Planning Model. Figure 2.117: Revit Final Project. Source: [http://bimboom.blogspot.com/, Retrieved November 04, 2011]

Figure 2.118: Several examples of how nanoscale materials are currently being used. Applications include many optical films for light, color, or thermal control; light-emittingdevices (QLEDs); surfaces that are self-cleaning, antibacterial, or self-healing and that aidpollution reduction; nanofoams and nanogels for thermal insulation; solar cells; and a hostof applications related to the strength and stiffness of members. Figure 2.119: ‘Hyposurface’ installation combines position sensors with conventionalactuators to create a responsive surface. Images courtesy of Marc Goulthorpe and DeCOIArchitects.Figure 2.120: Dichroic light field from James Carpenter Design Associates. To animate ablank, brick facade, a field of 216 dichroic fins was attached perpendicularly to a largeplane of semi-reflective glass.Figure 2.121: Current smart room and intelligent room paradigms, with a glimpse into thefuture. Figure 2.122: Monsanto’s ‘House of the Future’ opened at Disneyland in 1957. The house, and all its furnishings, were fabricated of plastic.Figure 2.123: Flower Street BioReactor, Location: Department of Culture and the arts, LALos Angeles, USA, 2009 Design by: Tom Wiscombe, Bin Lu, Ryan.Figure 2.124: Design experiment: the patterns in this wall study vary with changingtemperature and with the on–off state of the LCD panel. (Yun Hsueh).Figure 2.125: Schematic representation of Mike Davies’ polyvalent wall. He proposed thatthe exterior wall could be a thin system with layers of weather skin, sensors and actuators, and photoelectric.Figure 2.126: Fiber-optics, dichroic glasses and LEDs were used by James CarpenterDesign Associates in this lobby installation for Bear Stearns in New York. The green zoneis produced with fiber-optics and dichroic glass, it serves as a soft contrast to the movingblue LED information screens. Figure 2.127: Field of Light, Bruce Munro Source:[http://plusmood.com/2008/11/field-of-light-2-bruce-munro/, Retrieved November 04, 2011]
Figure 2.128: Fiber-optic lighting. Multiple cables can be served from a single lamp. Thelamp heat and fan noise is removed from the object being illuminated. Figure 2.129: Fiber-optic. Source:[ http://encyclopedia2.thefreedictionary.com/Fiber-optic+cable, Retrieved November 04, 2011]
Figure 2.130: Schematic layout of a photovoltaic cell. Source:[http://encyclopedia2.thefreedictionary.com/Fiber-optic+cable, Retrieved November 04, 2011]
Figure 2.131: US. Department of Energy. Source:[http://www.nativelegalupdate.com/2011/04/articles/national-tribal-energy-summit-45-may-2011/, Retrieved November 04, 2011]
Figure 2.132: Photovoltaic Cell. Source:[ http://encyclopedia2.thefreedictionary.com/Fiber-optic+cable, RetrievedNovember 04, 2011]
Figure 2.133: Building Integrated Photovoltaic. Figure 2.134: BIPV System. Figure 2.135: University of Colorado Solar Decathlon complete house rendering.
Part Three: Nanoarchitecture and Global Warming Solution
Figure 3.1: Nanoscience in every where around us. Source:[]

Figure 3.2: This is how nano is represented mathematically. Ten to the negative 9th equalsone billionth or 1/1,000,000,000. Figure 3.3: Images by Dennis kunnel Microscopy, Inc. to show Nanoscale area. Figure 3.4: List of metric measures. Figure 3.5: Image of Carbon Nanotube. Figure 3.6: Image of Nanowires. Figure 3.7: Image of C 60/Fullerenes. Figure 3.8: Image of Nanoparticle.Figure 3.9: Image of geodesic domes by C 60/ fullerenes.Figure 3.10: Developing a way to store energy-rich gases can help our energy systems. Metal organic frameworks (MOFs) are highly porous organic matrix substances that canstore hydrogen or natural gas. The cubical nanostructures consist of an “organometallic”framework, whereas the interior of the cube contains numerous nanometersize pores in aninterconnected structure. The nanopores have high surface area. These structures might alsobe used for energy sources for many devices, such as laptops. Tiny fuel cells could serve asa rechargable storage medium. (Courtesy of BASF.)Figure 3.11: Typical photocatalytic air purifier.Figure 3.12: Pollutants can find their way into ground water in many ways, includingaccidental discharges, and be carried to sources of drinking water, rivers, and lakes. Figure 3.13: Experiments have been conducted with dispersing reactive nanoparticles inslurries into contaminated groundwater zones. The nanoparticles react with certainpollutants and render them benign.Figure 3.14: a) Cross-section of a porous membrane showing fouling and the effect offouling on membrane performance. (b) Effect of fouling on membrane performance.Figure 3.15: Considerations in designing spatial thermal environments. All the factorsnoted in the text affect the nature of the thermal environment as perceived by an occupant.Figure 3.16: Frank Gehry and Dancing House in Prague example for his work.Figure 3.17: Climate impacts of paving slabs made in concrete and in granite, for use inNorway. The production of granite slabs has much less impact than the production ofconcrete slabs. But when importing granite from China the emissions of carbon dioxidefrom transport will quickly offset this advantage. Today China is the dominating producerof granite slabs for the European market (Berge, 2005).Figure 3.18: Sustainability Report 2008 by include Studies and statistics for
, , , . A- Waste(in ton) B-improvement in environmental performance: Waste. c- improvement inenvironmental performance: CO2 emission, energy. D-properties of overall recycling. E-Greenhouse gas emission. F- improvement in environmental performance: primary energyand district heat.Figure 3.19: Scientists manipulate nanotubes at minute dimensions. A revolutionary classof contrast agents for magnetic resonance screening was developed in 2005. A singlegadolinium atom is placed within the cage of a buckyball. Carboxylic groups are attachedto the exterior of the buckyball, simultaneously making the material soluble and improvingits efficiency as a contrast agent.
Figure 3.20: One way in which chemists manipulate carbon nanotubes is by creatingnanotube derivative nanotubes that are decorated with extra molecules that give the tubesunique properties or act as chemical "handles" for further manipulation. Figure 3.21: Single-walled carbon nanotubes can be extruded to form macroscopic fibres. Figure 3.22: This image shows a single carbon nanotube isolated and enclosed In amolecule. Under particular conditions carbon nanotubes have been found to exhibitfluorescent properties. In the near-infrared range, light is absorbed and emitted.Figure 3.23: The largest nanotube model in the world was produced by a team at RiceUniversity in Houston, Texas.Figure 3.24: The pattern of the building shell of the Watercube, the National SwimmingCentre for the 2008 Olympic Games in Beijing, China, resembles oversized buckybails, buthas otherwise nothing in common with nanotechnology.Figure 3.25: Hydrogen storage density in physisorbed materials, metal/complex, andchemical hydrides.Figure 3.26: A common small piezoelectric speaker. It is based on the actuation capabilitiesof piezoelectric materials.Figure 3.27: This microseisometer is capable of sensing accelerations. Thus, it can be usedfor sensing vibrations. (NASA)Figure 3.28: Touch screens: two common technologies for touch screens are shown. Othertechnologies are possible as wellFigure 3.29: Applications of different sensors in manufacturing and other contexts(detection of presence, counting, etc.)Figure 3.30: Smart dust. The visions for smart dust presume that it will be relativelyundetectable by the human eye. Current research efforts have dramatically brought downthe size of the dust. (Berkeley)Figure 3.31: RFID TagsFigure 3.32: Right, Recycle Aluminum Left, Recycle Steel "Tin" Cans. Source:[
]
Figure 3.33: Recycle Paper.Figure 3.34: Recycle Plastic.Figure 3.35: Recycle Glass.Figure 3.36: Recycle Used Motor Oil.Figure 3.37: Use Recycled Paper. Source:[
]
Figure 3.38: Use a Reusable Cloth, Hemp or Mesh Shopping Bag. Source:[]
Figure 3.39: Buy Products with the Least Amount of Packaging.Figure 3.40: National Recycling Rates from 1960 to 2010. Source:[
]
Figure 3.41: Nanotechnology research brings together the basic and applied sciences. Source
is:
Figure 3.42: The National Institute of Standards and Technology (NIST) AdvancedMeasurement Laboratory was designed by HDR Architecture Inc. Gaithersburg, Maryland.Source:[ ]
Figure 3.43: The Birck Nanotechnology Center Purdue University. Source:[]
Figure 3.44: The (BNC) Nanofabrication Cleanroom. Source:[]

Figure 3.45: NIST's experimental Molecular Measuring Machine for ultraprecise twodimensional measurements in one of the AML's underground metrology wings. Theinstrument is designed to be operated by remote control from the adjoining room tominimize environmental disturbances. The instrument is used to draw lines on silicon assmall as 10 nanometers wide and 4 nanometers high. It can also measure the placement ofnanometer-scale features with subnanometer resolution. Source:[
]
Figure 3.46: Ultraprecise electrical measurements require extremely stable temperature, humidity, and vibration control. Here, a NIST physicist in one of the AML’s metrologylaboratories prepares to measure the international standard for resistance— the quantumHall Effect. Source:[ ]
Figure 3.47: Clean room cabin for Precision measuring tools. Source:[]
Figure 3.48: Humans are a major source of particles inside. Source:[]
Figure 3.49: Cleanroom furniture is designed to produce a minimum of particles and to beeasy to clean. Source:[ ]
Figure 3.50: Marquettes of the nanoHOUSE quoted by the University of TechnologySydney.Figure 3.51: The white walls of the nanoHOUSE absorbs light and harvests solar energy. Figure 3.52: Computer generated images for the proposed NanoHOUSE.Figure 3.53: Solar Decathlon complete house floor plan.Figure 3.54: Pressure contours on CU building surfaces.Figure 3.55: Using carbon nanotubes in a multistory building ( Image courtesy of imageAdam Buente + Elizabeth Boone/nanoSTUDIO).Figure 3.56: The nanoStudio website, provides lots of innovative ideas for the use ofnanotechnology in buildings made by students.Figure 3.57: Architcture students of Ball university are exploring new ways of architectureat the nanoStudio. Figure 3.58: A perceptional 3D image of the proposed carbon tower by Peter Testa.Figure 3.59: For a shop in Hollywood, Testa designed a structure using textile basedcomposites. 2 carbon-fiber frames support a woven mesh of Kevlar cables spanning 110feet. A double facade of Kevlar panels is suspended from this framework.Figure 3.60: interior computer generated perspectives of the Tower. Source:[
]
Figure 3.61: A longitudinal section of the Carbon Tower.Figure 3.62: Exterior and interior computer generated perspectives of the Tower. Source:[
]
Figure 3.63: Bahrain World Trade Center. Source:[]
Figure 3.64: The three turbines. Source:[ ]
Figure 3.65: Turbine images. Source:[ ]
Figure 3.66: Masdar City (Zero Carbon City). Source:[]
Figure 3.67: Many View of Masder City. Source:[ ]
Figure 3.68: Main Perspective of Energy Island. Source

Figure 3.69: How the Energy Islands Would Work. Source
Figure 3.70: Modeling Design. Source
Figure 3.71: Modeling Analysis. Source
Figure 3.72: Master Plan Design of NanoCity. Source
Figure 3.73: Main section in NanoCity. Source
Figure 3.74: View expert living. Source
Figure 3.75: NanCity Master Plan. Source
Figure 3.76: NanoCity Vision – Stage – Phase 1. Source
Figure 3.77: Competition-winning design for the new 'Nano-Polis Master Plan' in Suzhou, China by HENN ARCHITEKTEN. Source
Figure 3.78: Conceptual diagram 1.Figure 3.79: Conceptual diagram 2.Figure 3.80: View expert living.Figure 3.81: Master Plan.Figure 3.82: View internal.Figure 3.83: View center. Source
Figure 3.84: View Internal. Source
Figure 3.85: View Center. Source
List of Tables
Part Two: Contemporary Trends Environment Conscious
Table 2.1: Energy-related pollution in production processes based on direct use of fossilfuels and mixed domestic waste. Source: [Naturva_rdsverket, Stockholm 2007]
Table 2.2: Pollution from transport. Source: [ NTM Network for Transport and Environment, Sweden 2008]
Table 2.3: Natural occurrence of the elements in the accessible part of the Earth’s crust.Source: [H€agg, 1984. See also the Periodic, Sweden 2008]
Table 2.4: Important greenhouse gases related to the production, use and wastemanagement of building materials. Source: [ NTM Network for Transport and Environment, Sweden 2008]
Part Three: Nanoarchitecture and Global Warming Solution
Table 3.1: Energy sources and pollution Source is: [The Ecology of Building Materials Second Edition, Bjorn Berge. (2009)]
Table 3.2: Effects of pollution. (Source is: The Ecology of Building Materials Second Edition, Bjorn Berge. (2009))
Table 3.3: Comparison between Masder city and Energy city.Table 3.4: Comparison between Nanocity India and Nano-Polis China.
List of Table

List of Abbreviations:
BTU British thermal unit = 1.060 KJ (joules)CAIT Climate Analysis Indicators ToolCCS Carbon capture and sequestrationCFCs ChlorofluorocarbonsCIE The Centre for International EconomicsCSP Concentrating solar powerDOE Department of EnergyEPA US Environmental Protection AgencyEIA The US Energy Information AdministrationETC Evacuated tube collectorsFAO Food and Agriculture Organization of the United NationsGHG Greenhouse gasesGIEC Intergovernmental group on the evolution of the climateGW Global warmingGT GigatonnesIPCC The Intergovernmental Panel on Climate ChangeICIJ The International Consortium of Investigative JournalistsIR Infrared radiationUSGBC United States Green Building CouncilLEED The Leadership in Energy and Environmental DesignLRT Light Rail TransitMIT Massachusetts Institute of TechnologyMt Million tonesNT NanotechnologyNREL National Energy Renewable LaboratoryNVS Nano Vent-SkinOLED Organic light-emitting diodePRT The Personal Rapid TransitQBTU 1 QBtu = annual energy output of 40 - 1,000 MW power plantsTiO2 Titanium dioxideUNFCCC The United Nations Framework Convention on Climate ChangeZCA Zero carbon architectureZEH Zero Energy HomesCFCs ChlorofluorocarbonsUHI Urban Heat IslandSW Swarm ArchitectureSI Swarm intelligent BREEAM Building Research Establishment Environmental Assessment MethodMLIT Ministry of land, infrastructure and transportJaGBC Japan Green Build CouncilJSBC Japan Sustainable Building Consortium
List of Abbreviations

CASBEE Comprehensive Assessment System for Building Environmental EfficiencyBEE building environmental efficiency Q QualityL loadBEE numerator Q Building environmental quality and performanceBEE denominator L Reduction of building environmental loadingsBMS Building Management SystemsBIM Building information modelingVDC virtual design and construction project managerPLM Product Lifecycle ManagementCNT carbon nanotubesSWNTs Nanotubes consist of single-walledMWNTs Nanotubes consist of multi-walleCVD chemical vapour deposition
Introduction
1- The Globalization: -
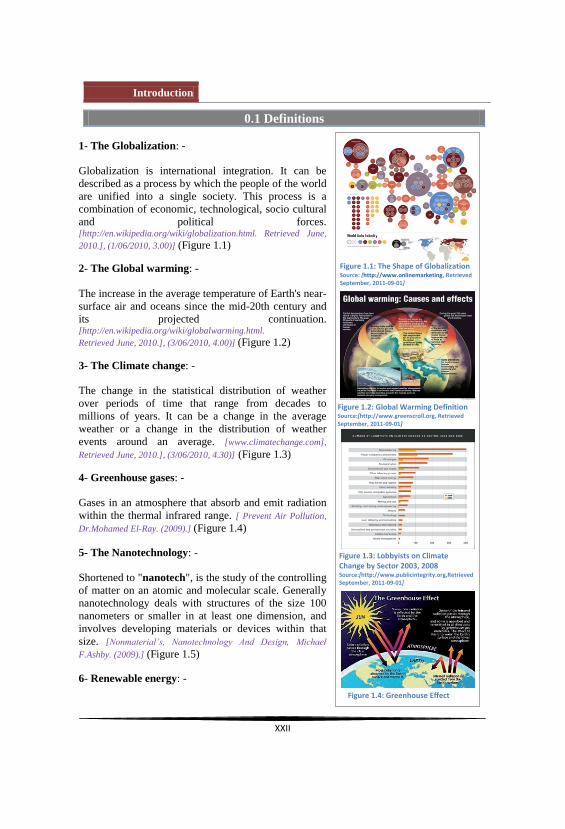
Globalization is international integration. It can bedescribed as a process by which the people of the worldare unified into a single society. This process is acombination of economic, technological, socio culturaland political forces. [http://en.wikipedia.org/wiki/globalization.html. Retrieved June,2010.], (1/06/2010, 3.00)] (Figure 1.1)
2- The Global warming: -
The increase in the average temperature of Earth's near-surface air and oceans since the mid-20th century andits projected continuation.[http://en.wikipedia.org/wiki/globalwarming.html.Retrieved June, 2010.], (3/06/2010, 4.00)] (Figure 1.2)
3- The Climate change: -
The change in the statistical distribution of weatherover periods of time that range from decades tomillions of years. It can be a change in the averageweather or a change in the distribution of weatherevents around an average. [www.climatechange.com], Retrieved June, 2010.], (3/06/2010, 4.30)] (Figure 1.3)
4- Greenhouse gases: -
Gases in an atmosphere that absorb and emit radiationwithin the thermal infrared range. [ Prevent Air Pollution, Dr.Mohamed El-Ray. (2009).] (Figure 1.4)
5- The Nanotechnology: -
Shortened to "nanotech", is the study of the controllingof matter on an atomic and molecular scale. Generallynanotechnology deals with structures of the size 100nanometers or smaller in at least one dimension, andinvolves developing materials or devices within thatsize. [F.Ashby. (2009).] (Figure 1.5)
6- Renewable energy: -
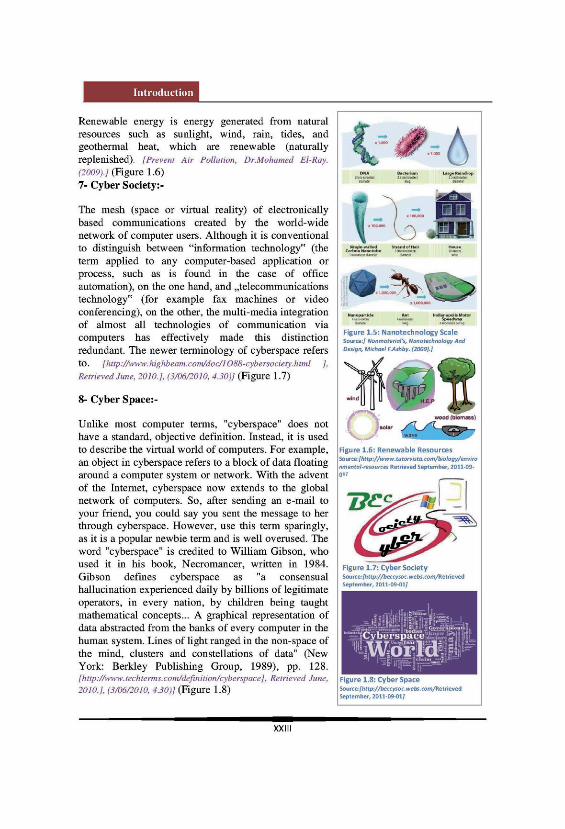
0.1 Definitions

Introduction
9- Nanoarchitecture :-
Nanoarchitecture is the conversion of architecture in thenew nano revolution in the 21st Century. The use ofnanotechnology in architecture varies from materials,equipments, to Forms and design theories. [NanoArchitecture, Nanotechnology and Architecture, ArchitectMaged Fouad El-Samny]. (Figure 1.9)
10- Green Nanoarchitecture:-
Fear of nano technology has led to taking precautionsagainst its side effects on man and the environment.Hence, the importance of the approach of and theinsistence on continuity in the employment of newtechnology in the field of architecture so as to make thegreen nano architecture a guarantee for benefiting fromnano technology and for avoiding its side- effects onsociety and the environment.[http://en.wikipedia.org/wiki/green nano architecture.html.
Retrieved June, 2010.], (3/06/2010, 4.00)] (Figure 1.10)
11- Ecological Architecture:-
Ecological architecture could also be called greenarchitecture or sustainable architecture. It would bedefined as buildings that are built with the environmentin mind, i.e. energy efficiency, earth friendly buildingmaterials, etc.[http://en.wikipedia.org/wiki/ecologicalarchitecture.html. RetrievedJune, 2010.], (3/06/2010, 4.00)] (Figure 1.11)
12- SUSTAINABILITY:-
In 1987, the World Commission on Environment andDevelopment developed a definition of sustainability that was included in its findings, which became known as theBrundtland Report. It stated that:
Sustainable development meets the needs of thepresent without compromising the ability offuture generations to meet their own needs.

Introduction
[ http://www.bathtram.org/tfb/tE04.htm ], Retrieved June, 2010.],
(3/06/2010, 4.00)] (Figure 1.12)
13- Zero Carbon Architecture :-
Architecture which are specifically engineered withGHG reduction in mind. So by definition, (ZCA) arebuildings which emit significantly less GHG than regularbuildings. [http://www.huffingtonpost.com/phillip-jones/zero-carbon-design-and-ar_b_174775.htmlRetrieved June, 2010.], (3/06/2010, 4.00)] (Figure 1.13)
14- Zero Carbon City:-
A zero-carbon city is a settlement powered exclusivelyby renewable energy sources.To become a zero carboncity, an established modern city must collectively reduceemissions of greenhouse gases to zero and all practicesthat emit greenhouse gases must cease. Also, renewableenergy must supersede other non-renewable energysources and become the sole source of energy, so a zero-carbon city is a renewable-energy-economy city. Thistransition which includes decarbonising electricity(increasing the importance of the sources of renewableelectricity) and zero-emission transport, is undertaken asa response to climate change and peak oil.[http://en.wikipedia.org/wiki/Zero-carbon_city, Retrieved June, 2010.], (3/06/2010, 4.00)] (Figure 1.14)
15- Nanosolar Energy:-
Nanosolar is a developer of solar power technology. Based in San Jose, CA, Nanosolar has developed andcommercialized a low-cost printable solar cellmanufacturing process. The company started sellingpanels mid-December 2007, and plans to sell them ataround $1 per watt. When first announced that was justone fifth the price of the silicon cells, but in 2010 brandname silicon cells sell from around $1.70 reducingNanosolar's cost advantage significantly. These solarcells successfully blend the needs for efficiency, lowcost, and longevity and will be easy to install due to theirflexibility and light weight. Estimates by Nanosolar ofthe cost of these cells fall roughly between 1/10 and 1/5the industrystandard per kilowatt. (Figure 1.15)

Introduction
As result of globalization, the world has becomelike one small village (Figure 1.13). New notion calledthe global problems has appeared such as the financialcrisis, global warming, and Climate change(Figure1.14) and biodiversity affecting the whole worldin general and the third world developing countries inparticular resulting from the developed countriesactions. It becomes necessary to address and face suchglobal problems through the collaboration between allthe world countries to reduce these impacts which willeffect directly and strongly on the third world countriesmore than the developed countries because of theirtechnological possibilities or advances enabling themfacing such threats. Therefore, we must address andface these problems by providing future solutionsminimizing their impacts. One of these solutions isusing the nanotechnology and the environmentalmaterials in architecture so as to reduce energyconsumption in the public buildings to reduce its heatemissions. Thus, using these materials in the publicbuildings will affect the architectural trends andthinking schools in the Middle East due to the differentproperties of these materials. A vast majority of climatescientists agree that global warming is happening andthat it poses a serious threat to society. They also agreethat it is being caused largely by human activities thatrelease greenhouse gases, such as burning fossil fuels inpower plants and cars and deforesting the land. Hence, reaching the main purpose of this study finding the bestways to reduce the carbon dioxide emissions harmingthe environment. Furthermore, it leads to zero carbonenvironment on the public level. Also on the private orindividual level, it leads to carbon free architecturethrough using nanotechnology, and nanoarchitecture. Nanoarchitecture contributes effectively in creatingspaces and zero carbon environment. More overdepending on a clean and renewable energy producing a
0.2 Preface

Introduction
clean reliable energy without harming the environment. [GLOBAL WARMING IS MAN-MADE, Vincent di Norcia. 2008].
The global energy balance (Figure 1.16) is thebalance between incoming energy from the Sun andoutgoing heat from the Earth. The global energy balanceregulates the state of the Earth's climate, andmodifications to it as a result of natural and man-madeclimate forcing, cause the global climate to change. [http://en.wikipedia.org/wiki/Global_warming, Retrieved Nov. 1st,2010]
The Earth atmosphere contains a number ofgreenhouse gases, which affect the Sun-Earth energybalance. The average global temperature is in fact 33°Chigher than it should be. Greenhouse gases (Figure 1.17)absorb electromagnetic radiation at some wavelengthsbut allow radiation at other wavelengths to pass throughunimpeded. The atmosphere is mostly transparent in thevisible light (which is why we can see the Sun), butsignificant blocking (through absorption) of ultravioletradiation by the ozone layer, and infrared radiation bygreenhouse gases, occurs. The absorption of infraredradiation trying to escape from the Earth back to space isparticularly important to the global energy balance. Suchenergy absorption by the greenhouse gases heats theatmosphere (Figure 1.18), and so the Earth stores moreenergy near its surface than it would if there was noatmosphere. The average surface temperature of themoon, about the same distance as the Earth from theSun, is -18°C. The moon, of course, has no atmosphere. By contrast, the average surface temperature of the Earthis 15°C. This heating effect is called the naturalgreenhouseeffect.[http://en.wikipedia.org/wiki/Global_warming,
Retrieved Nov. 1st, 2010]
Greenhouse gases are gases in an atmospherethat absorb and emit radiation within the thermalinfrared range. Greenhouse gases greatly affect thetemperature of the Earth; without them, Earth's surfacewould be on average about 33 °C (59 °F)

Introduction
Ever since the humanity existed and the man is expanding the geographic realm ofhis economic, political, social and cultural contacts. In this sense of extending connectionsto other peoples around the world, globalization is nothing new. Also, as a process ofchange that can embody both great opportunities for wealth and progress and great traumaand suffering, globalization at the beginning of the 21st century is following a wellestablished historical path. The effect of globalization on architecture is notably seen in thebuilding designs, technology, style, and the architectural thinking. The use of classicarchitectural styles has become unfamiliar since the revolution of modernization in thesecond half of the 20th century.
Nevertheless, it continues to develop and evolve forming a world style that hasnothing to do with the regions, or origins; buildings can be built using materials fromeverywhere and placed anywhere in the world, promoting its city to a higher calibrate tocope with the new world pace towards modernity and new technology.
After all, we can think in this research in three trends:-
The first trend is to study the possibilities of using the nanotechnology through theuse of nanomaterials in the public buildings, its impact on energy consumptions rates, thepossibilities of importing the nanomaterial from abroad, its economic feasibility studies (orits economic analysis), how to produce these materials in the local market, and its impacton the local architecture. Making the architects use these materials after studying itsimpacts or influences explained by a practical case study applying the impact of using thesematerial on energy consumptions.
The second trend is to study the nanotechnology impact on the architecture andthinking schools. The important of using this technology and knowledge on the differentarchitectural trends and its negative or positive impacts. Evaluating the architectureperformance in the light of using such technology. Reaching to the evaluation standardsbases, and concepts to evaluate the architecture schools and the architectural thinkingwhether it is affected by nanotechnology or not, and agreeing or rejecting it and assessingthis evaluation from the philosophical point of view.
The Third trend aims to focusing on the necessity of activating the use ofnanotechnology and knowledge in the education and updating the students nanotechnologyknowledge and this knowledge effect on their design trends illustrated by a case study ofdifferent students groups from different architecture universities explaining this knowledgeimpact on the students, their architectural or design trends, and studying the importance ofusing such technology in the educational syllabus and system in order to harmonizebetween the academic study and the international developments in intellectual trends ofcontemporary architecture.
0.3 Outline

Introduction
0.4 Research Structure Chart

Introduction
technology in Building Sector
This is the main question of the study. Also it includes other questions:
What are the possibilities of using the nanotechnology through the use ofnanomaterials in the public buildings, its impact on energy consumptions rates, thepossibilities of importing the nanomaterial from abroad, its economic feasibilitystudies (or its economic analysis)?
how to produce these materials in the local market, and its impact on the localarchitecture, Making the architects use these materials after studying its impacts orinfluences explained by a practical case study applying the impact of using thesematerial on energy consumptions?
What is Global Warming?
What cause of global warming?
How we can stop global warming?
What effects of global warming?
What is the relationship between Nanoarchitecture and Global Warming?
How Nanoarchitecture can reduce the global warming?
Why Nanomaterials is helpful than micro?
What is the techniques which can reduce global warming?
How we can reach the clean energy inside the building?
What effects of Clean Energy on ( Human Environment Building ) ?
How we can reduce green house gases?
How we can achieve Zero Carbon Architecture?
The Nanoarchitecture Role in Reducing the Global Warming and Carbon DioxideEmissions Supporting/Optimizing/Contributing the Sustainable Architecture Design.
0.5 Main Research Questions
0.6 Main Objective

Introduction
How to reach to climatic material which can provide us with clean energy insidebuildings to reduce the global warming effects especially in Egypt by reach the possibilitiesof using the nanotechnology through the use of nanomaterials in the public buildings, itsimpact on energy consumptions rates, the possibilities of importing the nanomaterial fromabroad, its economic feasibility studies (or its economic analysis), how to produce thesematerials in the local market, and its impact on the local architecture. Making the architectsuse these materials after studying its impacts or influences explained by a practical casestudy applying the impact of using these material on energy consumptions.
Four issues will be discussed:
First Issue: Global Warming.
This part covers the theoretical and analytical study of global warming, its negativeimpacts, and determining the architecture and building role in increasing the globalwarming. Literature review of Pollution like energy pollution, material pollution, climateemissions from building sectors, carbon processes in building materials and at the end ofpart one it deals with zero carbon or less problems inflicted by built environment which talkabout global architecture, globalization and urban heat.
References for this part are:
1. A Handbook on Low-Energy Buildings and District Energy Systems: Fundamentals,Techniques, and Examples by L.D. Danny Harvey.
2. Global warming by John Houghton.
Second Issue: Contemporary Trends Environment Conscious.
This part deals with new trends of architecture (swarm architecture, eco-architecture, nanoarchitecture, green architecture) in providing future solutions depending on scientificand technical bases for the developing problems suitable for the twenty-first century likeglobal warming, Measurement System of Performance Building, climatic design and smartmaterials.
References for this part are:
1. Nanomaterials,Nanotechnologies And Design An Introduction For Engineers And Architects by Michael F.Ashby.
2. Smart Materials and New Technologies for Architecture and Design Professions byMichelle Addington and Daniel schodek .
0.7 Scope of Thesis
0.8 Methodology

Introduction
3. Nano Materials in Architecture, Interior Architecture and Design by Sylvia leydecker.Third issue: Nanoscience and Nanotechnology as Future Solutions . This part discusses producing Eco-friendly nanomaterials, Developing Solutions for GlobalWarming Emissions Problem like Reduction of pollution in the production of materials.study the possibilities of using the nanotechnology through the use of nanomaterials in thepublic buildings, its impact on energy consumptions rates, the possibilities of importing thenanomaterial from abroad, its economic feasibility studies (or its economic analysis), howto produce these materials in the local market, its impact on the local architecture and theEgypt`s current situation. What we need to fix it? And what we need to improve thissituation?
References for this part are:
1. The Ecology of Building Materials Second Edition, Bjorn Berge. (2009).
Four Issue: Nanoarchitecture and Global Warming Solution.
These parts discuss/explain the architecture models, and analyzing how we can design toachieve the sustainability in the future. Making the architects use these materials (smartmaterials) after studying its impacts or influences explained by a practical case studyapplying the impact of using these material on energy consumptions. Also how we can usesmart system in the design to reduce losing energy.
References for this part are:
1. 70 Million Years of Building Thermal Envelope Experience: Building Science Lessonsfrom the Honey Bee. R. Christopher Mathis. Member ASHRAE.2007.
Conclusions: -
How nanoarchitecture provide contemporary environmental solutions to achievesustainable development in knowledge era.

Part One (Global Warming) Chapter One(Theoretical Background of Global Warming)
Part One: Global Warming
Introduction
Chapter One: literature Review of Global Warming
1.1 Theoretical Background of Global Warming.
1.1.1 What is Global Warming?
1.1.2 Why Global Warming?
1.1.3 Reasons of Global Warming.
1.1.4 Impact effect of Global Warming.
1.1.5 Relationship between Global Warming and Globalization.
Chapter Two: Damage arising from Construction Sectionleading to Emergence of Global Warming
2.1 Pollution.
2.1.1 Energy Pollution.
2.1.2 Material Pollution.
2.1.3 Climate emissions from Building sectors.
2.1.4 Carbon processes in Building Materials.
2.2 Zero Carbon or Less Problems Inflicted by BuiltEnvironment.
2.2.1 Modern Architecture.
2.2.2 Modernism.
2.2.3 Urban Heat.
Part One Conclusion.

Chapter One(Theoretical Background of Global Warming)
Part One: Global WarmingIntroduction
The research investigates the importance of theuse of new up-and-coming technologies as an outcomeof globalization. Such international integration hasgreatly influenced architecture and the way we plan it, thanks to the new technological inventions that comesup hastily, fast mobility and the ease of communication.Knowledge Society and Nanotechnology as a result ofthe global cooperation in technology has become thecutting-edge technology of the 21st century.
The progress of digital programs and hardwarehad a great impact on the discovery of new science andhighly advanced technologies (Figure1.25). This willlead to technologies and substances of great quality. Allthis contributed to reaching green and cleanenvironmental solutions (Figure1.26) andNanotechnology is one of the explored sciences.Through the Nanoscience, Nanotechnology,Nanoarchitecture, biological science and ecologicalscience was introduced and it introduced a new trend ofarchitecture which added sustainable green solutions tomaintain the environment to reduce harmful effects ofglobal warming. (Figure1.27)
This Part provides a broad review of perviouswork done in the field of Global Warming particularlyin building sector.
The work in this part consists of two chapters:
First it deals with preface of the problem andliterature review of theoretical background ofGlobal warming which trial for answeringimportant questions: What is Global Warming?And Why Global Warming? What cause ofglobal warming? What effects of globalwarming? Also we will discuss the reasons ofGlobal Warming. At the end of this part we willexplain relationship between Global Warmingand Globalization.

Chapter One(Theoretical Background of Global Warming)
Chapter One:
1.1 Theoretical Background ofGlobal Warming.
1.1.1 What is Global Warming?
Global Warming (GW) is the increase in theaverage temperature of Earth's near-surface air andoceans since the mid-20th century and its projectedcontinuation. Global surface temperature increased 0.74± 0.18 °C (1.33 ± 0.32 °F) between the start and the endof the 20th century. Global warming has becomefamiliar to many people as one of the most importantenvironmental issues of our day. This review willdescribe the basic science of global warming;impacts both on human communities and on naturalecosystems and the actions that can be taken to mitigateor to adapt to it. As commonly understood, globalwarming refers to the effect on the climate of humanactivities, in particular the burning of fossil fuels (coal,oil and gas) and large-scale deforestation-activities thathave grown enormously since the industrial revolution,and are currently leading to the release of about 7billion tons of carbon as carbon dioxide into theatmosphere each year together with substantialquantities of methane, nitrous oxide andchlorofluorocarbons (CFCs). [Global warming, JohnHoughton, Hadley Centre, Meteorological Office, Exeter EX1 3PB,UK (2002), Retrieved June 1st, 2009].
These gases are known as greenhouse gases. Thebasic principle of global warming can be understood byconsidering the radiation energy from the sun thatwarms the s surface and the thermal radiationfrom the Earth and the atmosphere that is radiated out tospace. On average, these two radiation streams mustbalance. The greenhouse effect arises because of thepresence of greenhouse gases in the atmosphere that
surfaceand, therefore, act as a blanket over the surface(Figure1.28). It is known as the greenhouse effectbecause the glass in a greenhouse possesses similarproperties to the greenhouse gases in that it absorbsinfrared radiation while being transparent to radiation inthe visible part of the spectrum. If the amounts of

Chapter One(Theoretical Background of Global Warming)
greenhouse gases (Figure1.29) increase due to humanactivities, the basic radiation balance is altered.
The balance (Figure1.30) can be restoredthrough an increase in the surface temperature. The effect was first recognized by the French scientistJean-Baptist Fourier in 1827. A British scientist, JohnTyndall around 1860 measured the absorption ofinfrared radiation by carbon dioxide and water vaporsand suggested that a cause of the ice ages might be adecrease in the greenhouse effect (Figure1.31) ofcarbon dioxide. It was a Swedish chemist, SantéArrhenius in 1896 who first calculated the effect ofincreasing concentrations of greenhouse gases; heestimated that doubling the concentration of carbondioxide would increase the global average temperatureby 5 6°C. As we shall see later this estimate is not toofar from our present understanding.
We have been familiar for a long time with problems ofair quality caused by the emissions of pollutants such asthe oxides of nitrogen or sulfur into the atmospherefrom local sources. That is local pollution. Measures toreduce such pollution especially in major cities areactively being pursued. Global warming is an exampleof global pollution. Because of the long life time in theatmosphere of many greenhouse gases such as carbondioxide, their effects impact on everyone in the world.Global pollution can only be countered by globalsolutions. [Global warming. John Houghton, Hadley Centre,Meteorological Office, Exeter EX1 3PB, UK (2002), RetrievedJune 1st, 2009].
The available options are mitigation to reducefurther emissions; adaptation to reduce the damagecaused by warming; and, more speculatively, geoengineering to reverse global warming. Most nationalgovernments have signed and ratified the KyotoProtocol aimed at reducing greenhouse gas emissions.(Figure1.32)
1.1.2 Why Global Warming?
Global warming is a phrase that refers to theeffect on the climate of human activities, in particularthe burning of fossil fuels (coal, oil and gas) and large-

Chapter One(Theoretical Background of Global Warming)
scale deforestation, which cause emissions to theatmosphere of large amounts of greenhouse gases, ofwhich the most important is carbon dioxide. Such gasesabsorb infrared radiation emitted by the surfaceand act as blankets over the surface keeping it warmerthan it would otherwise be. Associated With thiswarming are changes of climate. The basic science ofthe greenhouse effect that leads to the warming is wellunderstood. More detailed understanding relies onnumerical models of the climate that integrate the basicdynamical and physical equations describing thecomplete climate system (Figure1.33). Many of thelikely characteristics of the resulting changes in climate(such as more frequent heat waves, increases in rainfall,increase in frequency and intensity of many extremeclimate events) can be identified. Substantialuncertainties remain in knowledge of some of thefeedbacks within the climate system (Figure1.34) (thataffect the overall magnitude of change) and in much ofthe detail of likely regional change. Because of itsnegative impacts on human communities (including forinstance substantial sea-level rise) and on ecosystems,global warming is the most important environmentalproblem the world faces. Adaptation to the inevitableimpacts and mitigation to reduce their magnitude areboth necessary. International action is being taken bythe scientific and political communities.Because of the need for urgent action, the greatestchallenge is to move rapidly to much increased energyefficiency and to non-fossil-fuel energy sources. [Globalwarming. John Houghton, Hadley Centre, Meteorological Office,Exeter EX1 3PB, UK (2002), Retrieved June 1st, 2009].
Global warming is already taking place and hasbecome the biggest challenge of our time. Thechallenge is to find ways for the world to switch from apath of increasing emissions to a path of more highadvanced technologies (nanotechnologies) where themajority of the GHG emissions (Figure 1.32, 1.33) areeliminated. The concept of green buildings is mainly theidea of how to save energy consumption in buildingsand reduce carbon dioxide emissions. [Energy and ClimateDepartment of the Bellona Foundation, "How to Combat GlobalWarming", Oslo, 2008].
Buildings have a significant impact on energyuse and environment. Commercial and residential

Chapter One(Theoretical Background of Global Warming)
buildings use almost 40% of the primary energy and approximately 70% of the electricityin the United States (EIA 2005) (Figure 1.35). The energy used by the building sectorcontinues to increase, primarily because new buildings are constructed faster than old onesare retired. Electricity consumption in the commercial building sector doubled between1980 and 2000, and is expected to increase another 50% by 2025 (EIA 2005) (Figure 1.37).[P.Torcellini. "Zero Energy Buildings: A Critical Look at the Definition". National Energy RenewableLaboratory (NREL). June 2006].

Chapter One(Theoretical Background of Global Warming)
The Kyoto Protocol (2005) is a protocol to theUnited Nations Framework Convention on ClimateChange (UNFCCC), aimed at fighting warming. Theobjective of the Kyoto climate Change conference(Figure 1.37) was to establish a legally bindinginternational agreement, whereby all the Participatingnations commit themselves to tackling the issue ofglobal warming and GHG emissions. The target agreedupon was an average reduction of 5.2% from 1990levels by the year 2012. [Dr. Alois Rhiel, "Application of
nanotechnologies in the energy sector", Hessian Ministry ofEconomy, Transport, Urban & Regional Development, 2009].
The 2009 United Nations Climate ChangeConference, commonly known as the CopenhagenSummit (Figure 1.40), the document recognized thatclimate change is one of the greatest challenges of thepresent day and that actions should be taken to keep anytemperature increases to below 2°C. The document isnot legally binding and does not contain any legallybinding commitments for reducing CO2 emissions. Theimplementation of the Copenhagen Accord will bereviewed by 2015. This will take place about a year-and-a-half after the next scientific assessment of theglobal climate by the Intergovernmental Panel onClimate Change (IPCC). [Michael R.of new York city - Greenhouse gas emissions ", New York, 2007](Figure 1.36)
1.1.3 Reasons of Global Warming.
Global warming is a phenomenon that has beendiscussed widely nowadays and global warming causesare one of the most studied subjects presently in theworld. Throughout the world many governments,institutes and universities are trying to find out what arethe causes for global warming (Figure 1.41). Thecauses are split up into two groups, man-made oranthropogenic causes, and natural causes. [Source ishttp://library.thinkquest.org/J003411/causes.htm March 2011-03-26].
Natural causes are causes created by nature.One natural cause is a release of methane gas fromarctic tundra and wetlands. Methane is a greenhousegas. A greenhouse gas is a gas that traps heat in theearth's atmosphere (Figure 1.43). Another natural cause
[

Chapter One(Theoretical Background of Global Warming)
is that the earth goes through a cycle of climate change.This climate change usually lasts about 40,000 years.
Man-made causes probably do the mostdamage. As the effects of global warming is becomingmore and more evident, many of us have started torealize that steps have to be taken to control Globalwarming at the earliest and various countries and peoplehave started working towards it. The earth, the 3rdplanet of our solar system, the planet brimming with lifeand beautiful landscape, is on the verge of gettingdestroyed. The main reason is global warming. Globalwarming is the slow and steady increase in thetemperature of earth and its atmosphere (Figure 1.42).The increase in the temperature of earth has causedmany effects like the melting of ice in Polar Regions,increase in disease occurrences, drastic climatic changesincluding rainfall and dry periods. Source is:http://library.thinkquest.org/J003411/causes.htm March 2011-03-26].
The man which thinks of himself as the mostintelligent thing on earth is knowingly or unknowinglydestroying its own habitat. The activities of man haslead to an increase in the so called greenhouse gases(Figure 1.43) which include carbon dioxide, methane,nitrogen oxide etc. the gases have created an effect of
reflection of the rays from sun and thus causes theincrease in temperature (Figure 1.44). Carbon dioxideconcentration in the air has increased due to theemissions from cars, airplanes, power plants, industriesetc. another reason for it is the deforestation. Forestshave been cut down paying way for agriculture,industries and cities. The trees were natural regulatorsof carbon dioxide which used to control its level's in theatmosphere (Figure 1.45).
Another is the CFC which is used inrefrigerators, in fire extinguishers which destroys thenatural ozone layer. The ozone layer was a naturalbarrier which used to prevent the harmful ultra violetrays of the sun. Without this layer, the rays fall on theearth and cause the temperature to increase. Researchershave found an ozone hole in our atmosphere, whichthey say is the main reason for the melting of glacier's

Chapter One(Theoretical Background of Global Warming)
in the Polar Regions. Earth which mainly consists ofdeveloping or underdeveloped countries, which holds amajor population needs electricity for the day to dayactivities. The electricity supply is mainly satisfied byburning fossil fuels. The fossil fuel on burning releasescarbon dioxide which causes global warming.
The causes of the global warming have been inwork for a long time and slowly it has caused theincrease in the temperature. The satisfactory fact is thatat least now the governments of various countries andits people have started to understand that they are one ofthe causes for the global warming. Therefore combinedefforts by the different countries have started to controlthe global warming and thereby prevent our habitatfrom destruction. Awareness, alternative forms ofenergy, conservation of energy, and reforestation canhelp. (Figure 1.46) [Source is: http://ezinearticles.com/?The-Prime-Reasons-and-Causes-Of-Global-Warming&id=652734,Retrieved Nov. 1st, 2009].
1.1.4 Impact effect of Global Warming.
There are many impact effect of global warminglike:
1- Greenland:
Greenland is losing mass at 3% per decade and meltingrates have accelerated. Melting in 2004 was occurring at10 times the rates observed in 2000. Pools of melt waterare visible on the surface each summer and melt wateris percolating down through crevasses to lubricate the
of large glaciers from Greenland increases (Figure1.47). [Source is: http://earth-habitat.blogspot.com/, RetrievedSep. 12, 2011].
2- Montana Regions:
In highland regions in Africa, Central and SouthAmerica, and Asia plant communities are migratingupward, glaciers are retreating and mosquitoes arebeing found at high elevations. Underlying thesechanges are higher temperatures (an upward shift of the
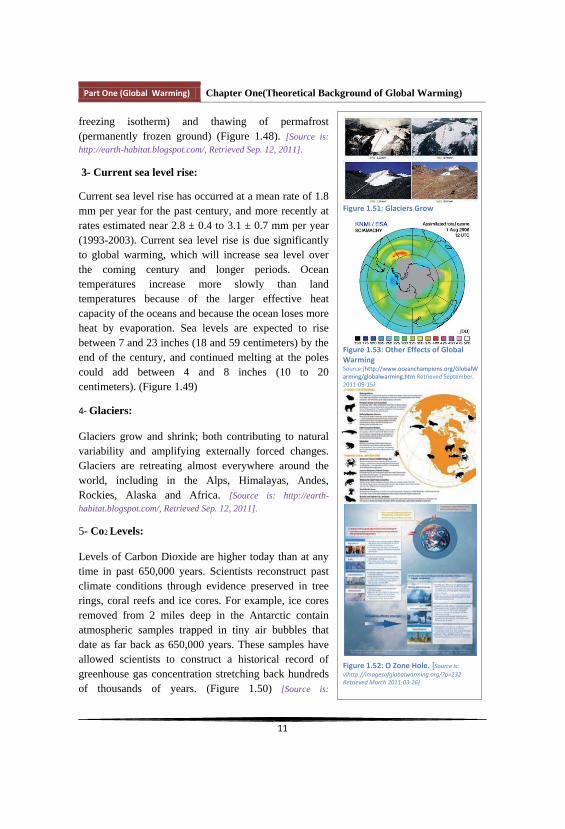
Chapter One(Theoretical Background of Global Warming)
freezing isotherm) and thawing of permafrost(permanently frozen ground) (Figure 1.48). [Source is:http://earth-habitat.blogspot.com/, Retrieved Sep. 12, 2011].
3- Current sea level rise:
Current sea level rise has occurred at a mean rate of 1.8mm per year for the past century, and more recently atrates estimated near 2.8 ± 0.4 to 3.1 ± 0.7 mm per year(1993-2003). Current sea level rise is due significantlyto global warming, which will increase sea level overthe coming century and longer periods. Oceantemperatures increase more slowly than landtemperatures because of the larger effective heatcapacity of the oceans and because the ocean loses moreheat by evaporation. Sea levels are expected to risebetween 7 and 23 inches (18 and 59 centimeters) by theend of the century, and continued melting at the polescould add between 4 and 8 inches (10 to 20centimeters). (Figure 1.49)
Glaciers:
Glaciers grow and shrink; both contributing to naturalvariability and amplifying externally forced changes. Glaciers are retreating almost everywhere around theworld, including in the Alps, Himalayas, Andes,Rockies, Alaska and Africa. [Source is: http://earth-habitat.blogspot.com/, Retrieved Sep. 12, 2011].
5- Co2 Levels:
Levels of Carbon Dioxide are higher today than at anytime in past 650,000 years. Scientists reconstruct pastclimate conditions through evidence preserved in treerings, coral reefs and ice cores. For example, ice coresremoved from 2 miles deep in the Antarctic containatmospheric samples trapped in tiny air bubbles thatdate as far back as 650,000 years. These samples haveallowed scientists to construct a historical record ofgreenhouse gas concentration stretching back hundredsof thousands of years. (Figure 1.50) [Source is:
[

Chapter One(Theoretical Background of Global Warming)
http://www.oceanchampions.org/GlobalWarming/, Retrieved Sep.12, 2011].
6- Ozone hole:
The Antarctic ozone hole is an area of the Antarcticstratosphere in which the recent ozone levels havedropped to as low as 33% of their pre-1975 values. Theozone hole occurs during the Antarctic spring, fromSeptember to early December, as strong westerly windsStart to circulate around the continent and create anatmospheric container. (Figure 1.52)
7- Other Effects of Global Warming:
Some butterflies, foxes, and alpine plants have moved farther north or to higher, cooler areas.Hurricanes and other storms are likely to become stronger.Some diseases will spread such as malariacarried by mosquitoes.Precipitation (rain and snowfall) has increasedacross the globe, on average.Less fresh water will be available. If theQuelccaya ice cap in Peru continues to melt atits current rate, it will be gone by 2100, leavingthousands of people who rely on it for drinkingWater and electricity without a source of either. Floods and droughts will become morecommon. Rainfall in Ethiopia, where droughtsare already common, could decline by 10percent over the next 50 years. (Figure 1.53) 1.1.5 Relationship between Global Warming
and Globalization.
Based on the previously mentioned definitions,and as result of globalization, the world has become likeone small village. New notion called the globalproblems has appeared such as the financial crisis,global warming, Climate change and biodiversityaffecting the whole world in general and the third worlddeveloping countries in particular resulting from thedeveloped countries actions. It becomes necessary toaddress and face such global problems through the


Chapter One(Theoretical Background of Global Warming)
6- Greater international travel and tourism.
7- Greater immigration, including illegal immigration.
8- Spread of local consumer products (e.g. food) toother countries (often adapted to their culture).
9- World-wide fads and pop culture such as Pokémon, Sudoku, Numa, Origami, Idol series, YouTube, Orkut,Facebook, and MySpace. (Figure 1.60)
10- World-wide sporting events such as FIFA WorldCup and the Olympic Games. (Figure 1.59)
11- Formation or development of a set of universalvalues.
12- Development of a global telecommunicationsinfrastructure and greater transformer data flow, usingsuch technologies as the Internet, communicationsatellites, submarine fiber optic cable, and wirelesstelephones.
13- Increase in the number of standards appliedglobally; e.g. copyright laws, patents and world tradeagreements.
14- The push by many advocates for an internationalcriminal court and international justice movements.
15- Localization: In the world of architecture, thestruggle between globalizing and anti-globalizing forceswill continue, as it has for centuries. Yet I'm bettingthat, even a hundred years from now, cities such asParis, Rome, London and St. Petersburg will still retaintheir traditional architectural allure and still be worthvisiting, regardless of which force prevails. Localizationis closely associated with the politics of identity (Figure1.61). Identity is community and place-related and theindividuality of community and place are underminedby global homogenization. Migration, instantaneouscommunication and increased travel all threaten anddislocate community identity.

Part One (Global Warming) Chapter Two ( Pollution )
Chapter Two:
2.1 Pollution.
People in every industrialized country havedaily contact with pollution problems: Climate gasemissions are already almost certainly the cause of mostextreme weather events. Between 80 and 90% of allcases of cancer are influenced by environmental factorsand the prevalence of allergies is rapidly increasing. Atthe same time, the rate of extinction of animal and plantspecies is accelerating between 1900 and 1950 onespecies each year disappeared, while in 1990 alone,between one and three species disappeared every hour.Species have always died out and new ones haveappeared, but the rate of extinction today is 100 to 1000times greater than the natural rate (Lawton and May,1995) (Figure 1.66).The building industry is directly or
environmental pollution. This can be referred to interms of energy pollution and material pollution.(Figure 1.67) [Source is: The Ecology of Building MaterialsSecond Edition, Bjorn Berge. (2009)]
2.1.1 Energy Pollution.
Energy pollution relates closely to the amountand source of energy used in the production ofmaterials. Transport both of raw materials and finishedproducts are also a decisive factor. (Figure 1.68)
Sources of energy vary a great deal from countryto country. In Scandinavia, hydropower is quitecommon, whereas in Great Britain and Europe the mainsources are still fossil fuels and nuclear power.Renewable are increasing only very slowly. The use ofnuclear power implies risks of radioactive emissions,especially in the management of waste. Fossil fuelscause the greatest emissions of climate gases includingcarbon dioxide (CO2), acids such as sulphur dioxide(SO2) and substances forming photochemical oxidation,such as nitrogen oxides (NOX) (Table 2.1). Combustionof waste can also cause serious pollution depending onits composition. Bio energy in its various forms is notunproblematic either. Apart from competition with foodsupplies, it is normally to be regarded as climate

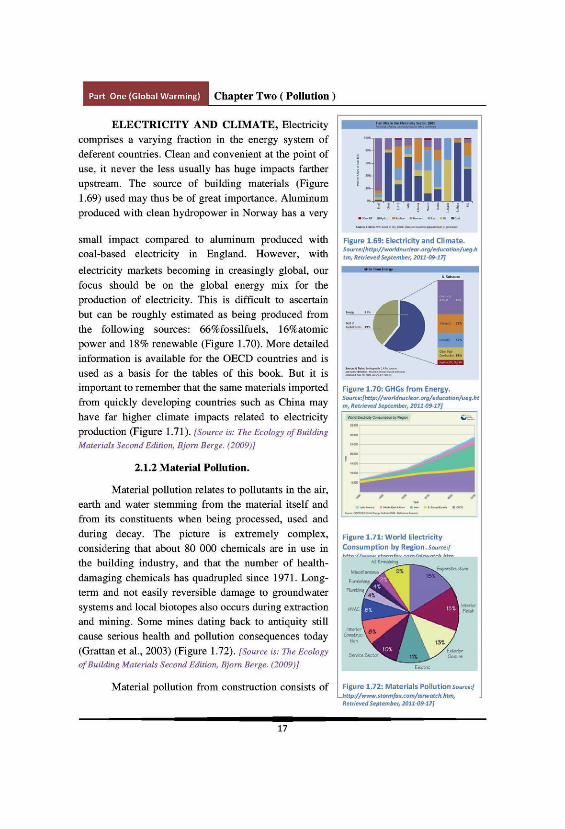

Chapter Two ( Pollution )
emissions, dust and radiation from materials that areexposed to chemical or physical activity such aswarmth, pressure or damage. Within the completedbuilding these activities are relatively small, yet there isevidence of a number of materials emitting gases ordust which can lead to health problems for theinhabitants or users; primarily allergies, skin andmucous membrane irritations. The electrostaticproperties of different materials also play a role in theinternal climate of a building. Surfaces that are heavilynegatively charged can create an electrostatic chargeand attract dust. Electrical conductors such as metalscan increase existing magnetic fields. Buildingmaterials can also contain radioactive constituents suchas radon gas that can be emitted to the indoor air.(Figure 1.73)
Waste is part of the pollution picture though, aswaste materials move beyond the scope of everydayactivity, it tends to be overlooked. The percentage byweight of environmentally hazardous materials indemolition waste is relatively small, but is still a largequantity and has a considerable negative effect on theenvironment. Whilst some materials can be burned inan ordinary incinerator, others need incinerators withhighly efficient flue gas purifiers. Few incinerators cando this efficiently many still emit damagingcompounds such as SO2, hydrogen chloride (HCl),heavy metals and dioxins. Depending on theenvironmental risk, disposal sites must ensure that thereis no seepage of the waste into the water system. Themost dangerous materials are those containing heavymetals and other poisons, and also plastics that are slowto decompose and cause problems because of theirsheer volume (Figure 1.74).
There is an evident correlation between thenatural occurrence of a material and its potential todamage the environment (Table 2.3). If the amount of asubstance in an environment (in air, earth, water or


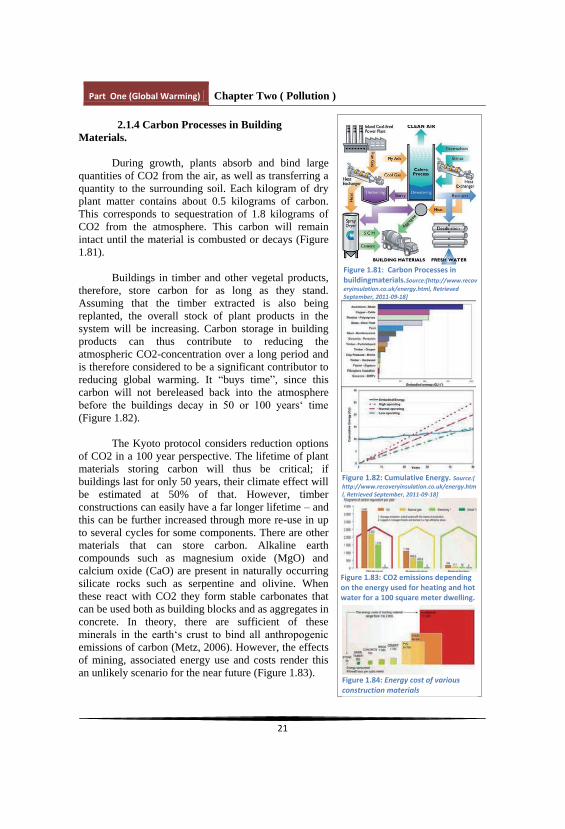
Chapter Two ( Pollution )
2.1.4 Carbon Processes in BuildingMaterials.
During growth, plants absorb and bind largequantities of CO2 from the air, as well as transferring aquantity to the surrounding soil. Each kilogram of dryplant matter contains about 0.5 kilograms of carbon.This corresponds to sequestration of 1.8 kilograms ofCO2 from the atmosphere. This carbon will remainintact until the material is combusted or decays (Figure1.81).
Buildings in timber and other vegetal products,therefore, store carbon for as long as they stand.Assuming that the timber extracted is also beingreplanted, the overall stock of plant products in thesystem will be increasing. Carbon storage in buildingproducts can thus contribute to reducing theatmospheric CO2-concentration over a long period andis therefore considered to be a significant contributor toreducing global warming. It buys time , since thiscarbon will not bereleased back into the atmosphere
(Figure 1.82).
The Kyoto protocol considers reduction optionsof CO2 in a 100 year perspective. The lifetime of plantmaterials storing carbon will thus be critical; ifbuildings last for only 50 years, their climate effect willbe estimated at 50% of that. However, timberconstructions can easily have a far longer lifetime andthis can be further increased through more re-use in upto several cycles for some components. There are othermaterials that can store carbon. Alkaline earthcompounds such as magnesium oxide (MgO) andcalcium oxide (CaO) are present in naturally occurringsilicate rocks such as serpentine and olivine. Whenthese react with CO2 they form stable carbonates thatcan be used both as building blocks and as aggregates inconcrete. In theory, there are sufficient of these
emissions of carbon (Metz, 2006). However, the effectsof mining, associated energy use and costs render thisan unlikely scenario for the near future (Figure 1.83).

Chapter Two ( Pollution )
It should be noted that, whereas the productionof cement and other calcium-bas ed building productscauses emissions of very large quantities of CO2 duringthe calcination of limestone (constituting approximatelyhalf of the emissions from the production, the restresulting from energy use), part of this is laterreabsorbed into the materials by carbonation. Thisrequires the presence of air and water and takes place
lifetime of say 50 years, of the order of 25 to 50% of thecarbon originally emitted during calcination may berecaptured. This is significant, but does not greatlyreduce the large emission impact of using thesematerials (Figure 1.84). [Source is: The Ecology of BuildingMaterials Second Edition, Bjorn Berge. (2009 )].
2.2 Zero Carbon or Less Problems
Inflicted by BuiltEnvironment.
2.2.1 Modern Architecture.
How do forces and manifestations of modernismaffect architecture and in particular the architecture ofglobal cities (Figure 1.85) Is there even such a thing
as Is Modernism of architecturea new phenomenon, or has architecture alwaysexhibited inherently globalizing tendencies? And in thisera of modernism tendencies related primarily toeconomic, social and cultural phenomena, to whatextent can and does architecture per se affect people`ssense and perception of global as opposed to localcitizenship? Recall obvious modernism phenomena,conditions and contrasting trends (Figure 1.86).
Like following affects:
Faster, data-intensive communicationbetween distant, contrasting cultures.

Chapter Two ( Pollution )
Increased sharing of cultural
Increased multinational business andindustrial activity.Increased internationalization andstandardization of technology.Increased international mobility for both business and tourism.Economic growth and, for some,rising personal incomes.Increasing desire for goods and services accompanied by unmetexpectations.
All of these directly or indirectly affectarchitecture. Whether the effect is positive or negativedepends on what you believe architecture should be(Figure 1.87). [Source is:www.journalinks.nl/Mijn%20webs/Architecture%20and%20the%20Global%20City.do c, (2002), Retrieved June 1st, 2008.]
The architectural manifestations of globalizationare ubiquitous: skyscraping company headquarters andbank buildings, chains of standardized hotels, franchiserestaurants, shopping malls, name-brand stores andboutiques, theme parks, fitness centres, and multi-screen cinemas. You would expect to find suchstructures and services in any city that calls itselfglobal When abroad, how often have you felt
especially comfortable in a hotel room similar to othersyou have stayed in, felt relieved perusing a menu withfoods you recognize, or enjoyed shopping in a storewhose merchandise and interior design are like the storeat home? Increasingly familiar global architecturereflects the market needs and functional agendas ofinternational business and industry (Figure 1.88), thecorporate worlds of finance, manufacturing, retailing,travel and hospitality, recreation, andentertainment.[Sourceis:.journalinks.nl/Mijn%20webs/Architecture%20and%20the%20Global%20City.do c, (2002), Retrieved June 1st, 2008.]
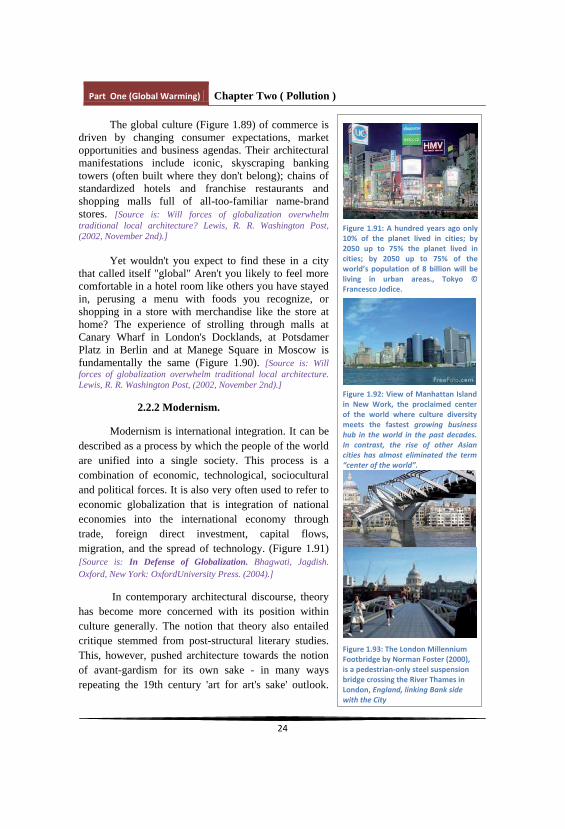
Chapter Two ( Pollution )
The global culture (Figure 1.89) of commerce isdriven by changing consumer expectations, marketopportunities and business agendas. Their architecturalmanifestations include iconic, skyscraping bankingtowers (often built where they don't belong); chains ofstandardized hotels and franchise restaurants andshopping malls full of all-too-familiar name-brandstores. [Source is: Will forces of globalization overwhelmtraditional local architecture? Lewis, R. R. Washington Post,(2002, November 2nd).]
Yet wouldn't you expect to find these in a citythat called itself "global" Aren't you likely to feel morecomfortable in a hotel room like others you have stayedin, perusing a menu with foods you recognize, orshopping in a store with merchandise like the store athome? The experience of strolling through malls atCanary Wharf in London's Docklands, at PotsdamerPlatz in Berlin and at Manege Square in Moscow isfundamentally the same (Figure 1.90). [Source is: Willforces of globalization overwhelm traditional local architecture. Lewis, R. R. Washington Post, (2002, November 2nd).]
2.2.2 Modernism.
Modernism is international integration. It can bedescribed as a process by which the people of the worldare unified into a single society. This process is acombination of economic, technological, socioculturaland political forces. It is also very often used to refer toeconomic globalization that is integration of nationaleconomies into the international economy throughtrade, foreign direct investment, capital flows,migration, and the spread of technology. (Figure 1.91)[Source is: In Defense of Globalization. Bhagwati, Jagdish.Oxford, New York: OxfordUniversity Press. (2004).]
In contemporary architectural discourse, theoryhas become more concerned with its position withinculture generally. The notion that theory also entailedcritique stemmed from post-structural literary studies.This, however, pushed architecture towards the notionof avant-gardism for its own sake - in many waysrepeating the 19th century 'art for art's sake' outlook.
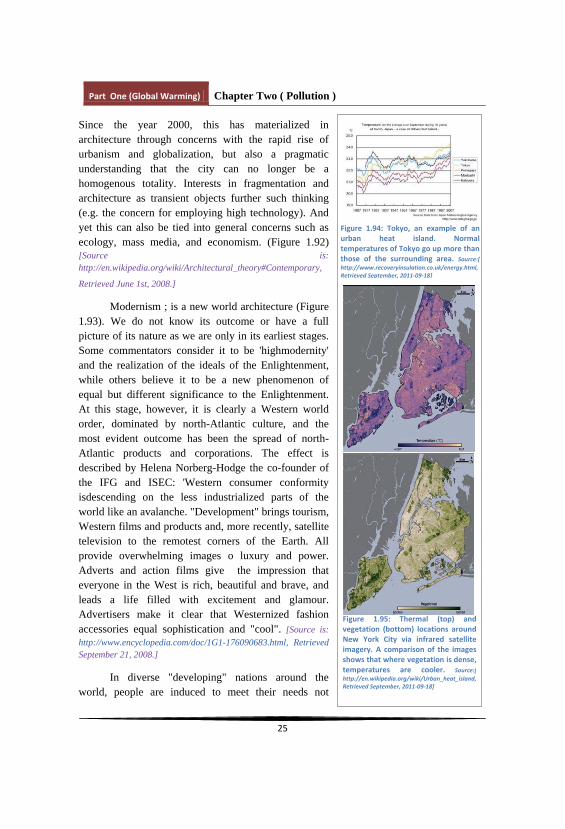
Chapter Two ( Pollution )
Since the year 2000, this has materialized inarchitecture through concerns with the rapid rise ofurbanism and globalization, but also a pragmaticunderstanding that the city can no longer be ahomogenous totality. Interests in fragmentation andarchitecture as transient objects further such thinking(e.g. the concern for employing high technology). Andyet this can also be tied into general concerns such asecology, mass media, and economism. (Figure 1.92)[Source is:http://en.wikipedia.org/wiki/Architectural_theory#Contemporary,
Retrieved June 1st, 2008.]
Modernism ; is a new world architecture (Figure1.93). We do not know its outcome or have a fullpicture of its nature as we are only in its earliest stages.Some commentators consider it to be 'highmodernity'and the realization of the ideals of the Enlightenment, while others believe it to be a new phenomenon ofequal but different significance to the Enlightenment.At this stage, however, it is clearly a Western worldorder, dominated by north-Atlantic culture, and themost evident outcome has been the spread of north-Atlantic products and corporations. The effect isdescribed by Helena Norberg-Hodge the co-founder ofthe IFG and ISEC: 'Western consumer conformityisdescending on the less industrialized parts of theworld like an avalanche. "Development" brings tourism, Western films and products and, more recently, satellitetelevision to the remotest corners of the Earth. Allprovide overwhelming images o luxury and power.Adverts and action films give the impression thateveryone in the West is rich, beautiful and brave, andleads a life filled with excitement and glamour. Advertisers make it clear that Westernized fashionaccessories equal sophistication and "cool". [Source is:http://www.encyclopedia.com/doc/1G1-176090683.html, RetrievedSeptember 21, 2008.]
In diverse "developing" nations around theworld, people are induced to meet their needs not

Chapter Two ( Pollution )
through their community or local economy, but bytrying to "buy in" to the global market.' Put moresuccinctly by the professor of Business AdministrationTheodore Levitt, 'everywhere everything gets more andmore like everything else as the world's preferencestructure is relentlessly homogenized'. [Source is:http://www.encyclopedia.com/doc/1G1-176090683.html, RetrievedSeptember 21, 2008.]
Because technology purports to be, "scientific" itmay be regarded as autonomous, not requiring referenceto or validation by local cultures. The MillenniumBridge (Figure 1.93), like Foster's proposed viaduct, may be elegant, but couldn't these high-tech structuresbe placed anywhere on the globe? [Source is:http://www.greatbuildings.com/discussion.html., RetrievedSeptember 21, 2008.]
2.2.3 Urban Heat.
An urban heat island (UHI) is a metropolitanarea which is significantly warmer than its surroundingrural areas. The phenomenon was first investigated anddescribed by Luke Howard in the 1810s, although hewas not the one to name the phenomenon.. Thetemperature difference usually is larger at night thanduring the day, and is most apparent when winds areweak. Seasonally, UHI is seen during both summer andwinter. The main cause of the urban heat island ismodification of the land surface by urban developmentwhich uses materials which effectively retain heat.Waste heat generated by energy usage is a secondarycontributor. As population centers grow they tend tomodify a greater and greater area of land and have acorresponding increase in average temperature. Thelesser-used term heat island refers to any area,populated or not, which is consistently hotter than thesurrounding area (Figure 1.95). [Source is: Glossary ofMeteorology (2009). "Urban Heat Island". AmericanMeteorological Society. Retrieved 2009-06-19]

Chapter Two ( Pollution )
Monthly rainfall is greater downwind of cities,partially due to the UHI. Increases in heat within urbancenters increases the length of growing seasons, anddecreases the occurrence of weak tornadoes. The UHIdecreases air quality by increasing the production ofpollutants such as ozone, and decreases water quality aswarmer waters flow into area streams, which stressestheir ecosystems.
Not all cities have a distinct urban heat island. Mitigation of the urban heat island effect can beaccomplished through the use of green roofs and the useof lighter-colored surfaces in urban areas, which reflectmore sunlight and absorb less heat. Despite concernsraised about its possible contribution to global warming,comparisons between urban and rural areas show thatthe urban heat island effects have little influence onglobal mean temperature trends. Recent qualitativespeculations indicate that urban thermal plumes maycontribute to variation in wind patterns that mayinfluence the melting of arctic ice packs and thereby thecycle of ocean current. [Source is:http://www.answers.com/topic/urban-heat-island, RetrievedSeptember 21, 2008.]
There are several causes of an urban heat island(UHI). The principal reason for the nighttime warmingis that buildings block surface heat from radiating intothe relatively cold night sky. Two other reasons arechanges in the thermal properties of surface materialsand lack of evapotranspiration (for example throughlack of vegetation) in urban areas (Figure 1.96). Materials commonly used in urban areas for pavementand roofs, such as concrete and asphalt, havesignificantly different thermal bulk properties(including heat capacity and thermal conductivity) andsurface radiative properties (albedo and emissivity) thanthe surrounding rural areas. This causes a change in theenergy balance of the urban area, often leading tohigher temperatures than surrounding rural areas(Figure 1.97).
Other causes of a UHI are due to geometriceffects. The tall buildings within many urban areasprovide multiple surfaces for the reflection and

Chapter Two ( Pollution )
absorption of sunlight, increasing the efficiency withwhich urban areas are heated. This is called the "urbancanyon effect". Another effect of buildings is theblocking of wind, which also inhibits cooling byconvection. Waste heat from automobiles, airconditioning, industry, and other sources alsocontributes to the UHI. High levels of pollution inurban areas can also increase the UHI, as many formsof pollution change the radiative properties of theatmosphere (Figure 1.97). [Source is:http://www.answers.com/topic/urban-heat-island, RetrievedSeptember 21, 2008.]
Some cities exhibit a heat island effect, largest atnight. Seasonally, UHI shows up both in summer andwinter. The typical temperature difference is severaldegrees between the center of the city and surroundingfields. The difference in temperature between an innercity and its surrounding suburbs is frequentlymentioned in weather reports, as in "68 °F (20 °C)downtown, 64 °F (18 °C) in the suburbs". Blacksurfaces absorb significantly more electromagneticradiation, and causes the surfaces of asphalt roads andhighways to heat (Figure 1.98).
Another consequence of urban heat islands is theincreased energy required for air conditioning andrefrigeration in cities that are in comparatively hotclimates. The Heat Island Group estimates that the heatisland effect costs Los Angeles about US$100 millionper year in energy. Conversely, those that are in coldclimates such as Moscow, Russia would have lessdemand for heating. However, through theimplementation of heat island reduction strategies,significant annual net energy savings have beencalculated for northern locations such as Chicago, SaltLake City, Huge parking, Industrial area in Vancouver,Dubai and Toronto.
Global Warming, the principal reason for thenighttime warming is that building block surace heatfrom radiating into the relatively cold night sky. Two

Chapter Two ( Pollution )
other reasons are chanes in the thermal properties of surface materials and lack ofevapotranspiration ( for example through lack of vegetation ) in urban areas. Materialscommonly used in urban areas for pavement and roofs (Figure 1.98), such as concrete andasphalt, have significantly different thermal bulk properties (including heat capacity andthermal conductivity) and surfaceradiative properties ( albedo and emissivity ) than thesurrounding rural areas. This causes a change in the energy balance of the urban area, oftenleading to higher temperatures than surrounding rural areas (Figure 1.99). [Source is:http://www.answers.com/topic/urban-heat-island, Retrieved Sep.21,2008]
Climate Change 2007, the Fourth Assessment Report from the IPCC states thefollowing:
Studies that have looked at hemispheric and global scales conclude that any urban-related trend is an order of magnitude smaller than decadal and longer time-scale trendsevident in the series (e.g., Jones et al., 1990; Peterson et al., 1999).

Chapter Two ( Pollution )
Part One Conclusion.
It is possible to construct buildings that are climate neutral throughout their entirelifecycle. This requires that we take into consideration both the materials aspects as well asoperational energy use. With the need to emphasize the seriousness of continuedgreenhouse gas emissions on the environment and humans and the economy will beachieved in terms of humanitarian and physical destruction.
First Principle: Choose Low Impact Materials and Constructions.All materials chosen must have minimal fossil energy demand in production and
transportation. Products with chemical emissions of greenhouse gases should be omitted.Using timber instead of concrete or bricks, for example, reduces emissions from thematerials production by approximately 1 kg of CO2 per kilogram of timber used. Even withfairly moderate substitution, one may reduce the climate emissions by some 20 to 30%Over 50%ispossible given less conventional materials and solutions. This also requireschoosing materials that are easy to maintain and to modify and recycle.
Second Principle: Reduce all Operational Energy, In Particular That Based on FossilFuels and Replace Them with Renewable Energies and Zero Carbon.
Operational energy includes space-heating, electricity and hot water. It is importantto remember that choice of the best strategies will often depend on very local climaticfactors. For example, in windy coastal regions improved air tightness measures will havefar more effect than extra insulation. Need to encourage the use of clean energy reductionand control energy use in buildings and high-efficiency building materials modified.
Third Principle: Maximize Storage of Carbon. Use as much construction material as possible that is of plant origin- in practice
mainly timber - and in ways that ensure long life as well as reusability. Even in Finland,where timber construction is already dominant, it has been estimated that use of timber inconstruction could well be increased by 70%. A potential of up to 550 kilograms of timberproducts per square meter of floor area is achievable in small houses. This is based on theuse of massive timber constructions in walls, floors and roofs. For larger building types, 300 to 400 kg/m2 may be realistic.
Fourth Principle: United Nations Protocols (Kyoto, Copenhagen Summit). Climate change has a negative effect on the ecosystem, biological, and therefore
architecture, human, and will eliminate the theory of sustainability and the terms of theKyoto treaty. There is interest in a global reduction of Global Warming as required by theUnited Nations treaties such as Kyoto Protocol (2005), Copenhagen Summit (2009) withPrincipals:
1. Commitments to reduce greenhouse gases that are legally binding for annex Icountries, as well as general commitments for all member countries.

Chapter Two ( Pollution )
2.Implementation to meet the Protocol objectives, to prepare policies and measureswhich reduce greenhouse gases; increasing absorption of these gases and use allmechanisms available, such as joint implementation, clean development mechanismand emissions trading; being rewarded with credits which allow more greenhousegas emissions at home.3. Minimizing impacts on developing countries by establishing an adaptation fundfor climate change. Accounting, reporting and review to ensure the integrity of theProtocol.
Fifth Principle: Architecture 2030. Architecture 2030, independent organization, was established in response to the
transform the US and global Building Sector from the major contributor of greenhouse gasemissions to a central part of the solution to the global-warming crisis. This was the firsttime architects/planners, scientists, politicians, the media and academia were broughttogether to learn about and discuIssued the 2030 °Challenge asking the global architecture and building community toadopt the following targets:
fossil fuel, GHG emitting, energy consumption performance standard of 50% of theregional (or country) average for that building type.
to meet a fossil fuel, GHG emitting, energy consumption performance standard of 50%of the regional (or country) average for that building type.
(60% in 2010), (70% in 2015), (80% in 2020), (90% in 2025). Carbon-neutral in 2030.
The first chapter of the first part, presenting the global warming as a globalproblem, its main causes, and the negative effects form construction and buildings sector. Also the relationship between globalization, and global warming, and its negative
this effect to the whole world in form of high temperature rate. In the second chapter,presenting the different types of pollution happening in the whole world as a result ofenergy misusing, also using the harmful building materials on environment whichproducing carbon dioxide rising the temperature rates highly. At the end of the secondchapter, explaining the crowded urban heat effects raising the temperature rates and itsnegative effects on the population areas.
In the second part, we will discuss the different architecture systems aiming toreduce e the negative effects of using the environment harmful materials in urban planning,and construction, and the different architecture schools aiming to use the environmentfriendly material, and targeted solutions for using the renewable energy without harmingthe environment, and depleting the natural resources. Also discussing the environmentaldesign, the different renewable energy sources.

Part Two( C.T.E.C ) Chapter Three ( Contemporary Trends )
Part Two: Contemporary Trends Environment Conscious
Introduction
Chapter Three: Contemporary Environment ArchitectureTrends and Methods of Measurement
3.1 Contemporary Trends.
3.1.1 Sustainable Architecture.
3.1.2 Eco-Architecture.
3.1.3 Bio-Architecture.
3.1.4 Nanoarchitecture.
3.1.5 Swarm architecture.
3.2 Measurement System of Performance Building
3.2.1 LEED (America)
3.2.2 BREEAM (Britain)
3.2.3 CASBEE (Japan)
3.2.4 The Green Pyramid Rating System (GPRS) (Egypt)
Chapter Four: Climatic Strategies
4.1 Climatic Design.
4.1.1 Renewable Resources.
4.1.1.A Clean Energy.
4.1.1.B Solar Power.
4.1.1.C Green Power.
4.1.2 The Contemporary design Context.

Part Two( C.T.E.C ) Chapter Three ( Contemporary Trends )
4.1.4 Media of Smart System.
4.2 Smart Materials
4.2.1 Materials and architecture.
4.2.2 Characteristics of smart materials.
4.2.3 Examples of Smart Materials
Part Two Conclusion.

Part Two( C.T.E.C ) Chapter Three ( Contemporary Trends )
Part Two: Contemporary TrendsEnvironment Conscious
Introduction
Based on the previously part mentionedaddressed the global warming as a major problemaround the world, its major causes, and also the harmfuleffects of the Building sector. This part will introduceArchitectural and urban solutions likeContemporary architecture trends to minimize thedamaging effects resulting building sector throughdifferent directions which its main purpose to reducethe causes of the global warming, its benefits for thesurrounding environment, and building emissions rates. As well as the friendly buildings measurement systemsof different environment which has strict standards tomaximize the effiency of the buildings withoutmaximize its harmful emissions. (Figure 2.1)
This Part provides a broad review of perviouswork done in the field of new trends of architectureparticularly in building sector.
The work in this part consists of two chapters:
First it deals with preface of new trends ofarchitecture like eco-architecture, bio-architecture, sustainable architecture,nanoarchitecture (Figure 2.4) and swarmarchitecture which trial for answering importantquestions: How Nanoarchitecture can reduce theglobal warming? What are the techniques whichcan reduce global warming? How we can reachthe clean energy inside the building? At the endof this part we will explain global measurementsof the quality of construction System ofPerformance Building like (LEED in America,BREEAM in Britain and CAPMAS in Japan).(Figure 2.2)
Second it summarizes the climatic design inthree points, first point is renewable resource

Part Two( C.T.E.C ) Chapter Three ( Contemporary Trends )
(clean energy, solar power, green power).Second point is Assess the climate throughrenewable energy and smart systems like(lighting system, ventilation system, plumbing
aterialswhich can use in building to reduce the carbon
dioxide. At the end of this chapter we will findexamples of smart materials (Figure 2.3) whichusing in building construction and someapplications that combine smart materials andsmart systems like (Nano Initiatives, NanoHouse, Nano Studio). (Figure 2.5) (Figure 2.6)
Finally, we will find the conclusion of part Twowhich we reach after first and second part andexplain relationship between Part Two andThree.

Part Two( C.T.E.C ) Chapter Three ( Contemporary Trends )
Chapter Three: Contemporary Environment ArchitectureTrends and Methods of Measurement
3.1 Contemporary Trends.
3.1.1 Sustainable Architecture:
Why go sustainable? The reasons are numerous.Although sustainable buildings cost about the same asconventional ones, their improved aesthetics, comfort,and performance translate into higher initial sales pricesand rents, and then to lower operating costs. Sustainablebuildings are much cheaper to heat, cool, and light.Because they consume so much less energy, theyproduce correspondingly less pollution. Lower utilitybills make them more affordable. Last but not least,they are healthier spaces in which to work or live. Theultimate goal is to reduce carbon dioxide emission andother waste for preservation and improvement of theworld`s ecosystems and for the well-being of humanity.(Figure 2.7)
Before beginning the design work, consider thesefive principles:
First, remember the importance of thoroughplanning. Sustainable design is front-loaded-thework comes at the beginning, the rewards later.Early decisions are in many ways the mostimportant, so allow enough time for conceptual
Second, sustainable design is more a philosophyof building than a building style. Most energyefficiency and other green technologies are
blended into any architectural style. While greenfeatures can be highlighted to demonstrate abuilding`s connection to the environment, theydo not have to dominate the design.

Part Two( C.T.E.C ) Chapter Three ( Contemporary Trends )
Third, sustainable buildings do not need to beinordinately expensive or complicated. Althoughenvironmental awareness or rapid paybacksfrom reduced operating expenses could justifyspending more money for a sustainable building,that`s usually not necessary.
Fourth, an integrated approach is criticallyimportant. If you design a conventionalbuilding, then throw a laundry list oftechnologies at it, you`re liable to end up with a
- onethat may cost and perform slightly better than aconventional building. On the other hand,adopting this primer`s recommendations in asystematic manner will result in a more livable,economical building. An integrated approachmay incur higher prices for some pieces in orderto achieve larger saving for the whole.
Finally, although sustainable building will bemore than just energy- efficient; minimizingenergy consumption is so central a goal that itshould serve as an organizing principle. Thus, the various design elements of a green buildingfall into three broad categories: energy-savingarchitectural features; an energy- conservingbuilding shell; and energy-efficient furnaces, airconditioners, water heaters, lights, and otherappliances. [Source is: A Primer on sustainablebuilding, Dianna Lopez. (1999)]
Europe has provided the rest of the world aparadigm for green living throughout many facets of thebuilt environment. Europe has many positive examplesof balancing social needs with economic incentivesthrough green space, biking initiatives and justiceprograms. Green skyscrapers have been no different.European cities have continued this balance throughregulation and market driven development. (Figure 2.8)
The concept of sustainable development can betraced to the energy (especially fossil oil) crisis and theenvironment pollution concern in the 1970s. Thesustainable building movement in the U.S. originatedfrom the need and desire for more energy efficient andenvironmentally friendly construction practices. There

Part Two( C.T.E.C ) Chapter Three ( Contemporary Trends )
are a number of motives to building green, includingenvironmental, economic, and social benefits. However, modern sustainability initiatives call for an integratedand synergistic design to both new construction and inthe retrofitting of an existing structure. Also known assustainable design, this approach integrates the buildinglife-cycle with each green practice employed with adesign-purpose to create a synergy amongst thepractices used.[Sourceis:http://en.wikipedia.org/wiki/Green_building#Goals_of_green_building, Retrieved October 14, 2011.]
Sustainable building brings together a vast arrayof practices and techniques to reduce and ultimatelyeliminate the impacts of buildings on the environmentand human health. It often emphasizes taking advantageof renewable resources, e.g., using sunlight throughpassive solar, active solar, and photovoltaic techniquesand using plants and trees through green roofs, raingardens, and for reduction of rainwater run-off. Manyother techniques, such as using packed gravel orpermeable concrete instead of conventional concrete orasphalt to enhance replenishment of ground water, areused as well.
While the practices, or technologies, employed ingreen building are constantly evolving and may differfrom region to region, there are fundamental principlesthat persist from which the method is derived: Sitingand Structure Design Efficiency, Energy Efficiency,Water Efficiency, Materials Efficiency, IndoorEnvironmental Quality Enhancement, Operations andMaintenance Optimization, and Waste and ToxicsReduction. The essence of sustainable building is anoptimization of one or more of these principles. Also,with the proper synergistic design, individual greenbuilding technologies may work together to produce agreater cumulative effect. (Figure 2.9)
On the aesthetic side of green architecture orsustainable design is the philosophy of designing abuilding that is in harmony with the natural features andresources surrounding the site. There are several keysteps in designing sustainable buildings: specify 'green'

Part Two( C.T.E.C ) Chapter Three ( Contemporary Trends )
building materials from local sources, reduce loads,optimize systems, and generate on-site renewableenergy.[Sourceis:http://en.wikipedia.org/wiki/Green_building#Goals_of_green_building, Retrieved October 14, 2011.] (Figure2.10)
Sustainable Architecture comprises only a tinycomponent to reducing the carbon footprint of ourcivilization. In order to truly make an impact, themotivation from these entrepreneurs, policy makers andintellectuals needs to trickle down to the remainingpublic. (Figure 2.11) (Figure 2.12)
3.1.2 Eco-Architecture:
Ecological architecture would be defined asbuildings that are built with the environment in mind,i.e. energy efficiency, earth friendly building materials,etc. we can conclude that in order to fully appreciatethe ecological implications of any design the designerwill need to analyze the built environment in terms ofits flow energy and materials throughout its life cyclefrom their source of origin to their sink. Following fromthis analysis, the designer must simultaneouslyanticipate at the design stage all the desirable impactson the ecosystems along this route. This analysis can beconveniently conceived using the concept of an opensystem, i.e., in terms of inputs to the system, functionswithin the system, outputs from the systems, and therelationship of the environment to the system. (Figure2.13) [Ecological Design Handbook, Fred A.Stitt, UK (2000),Retrieved October 1st, 2009].
The terms sustainable design and ecologicalarchitecture are firmly a part of the contemporaryculture of architecture and building. Architects areincreasingly contractually, ethically, and legallyrequired to design with respect to environmentalcriteria.
There is a sense of urgency relating to theenvironmental crisis and government energy regulationsindicate that future designs will need to be even more
be changes to current economic, social and politicalsystems to allow for a new way of building and

Part Two( C.T.E.C ) Chapter Three ( Contemporary Trends )
evaluating cities and buildings. (Figure 2.14) [Source isCEPHAD 2010 // the borderland between philosophy and designresearch // Copenhagen //January 26 29, 2010.
But this is not the first environmental crisisfacing designers in recent memory, and in fact the term
sustainable design to the forefront. There are somesimilarities between the crisis in the 1970´s and thecurrent climate crisis. Designers in the 1970´s faced aglobal energy crisis and also impending and seeminglyunprecedented technological innovation. The initial ideasof computation and interactive design were seen aspossibly helping the environmental crisis. Forty yearslater, we are trying to reduce harmful emissions andreduce energy use while still building new architecture.This will require substantial changes to the ways we makebuildings and cities.
But where will the knowledge and desire to designand building buildings and cities in a new way comefrom? Technology and education are seen as presentingpossible solutions, with Brian Edwards (2002) amongother architects arguing for new processes and analysistools, and Yeang (1999) and McDonough and Braungart(2002) seeking to bring knowledge to designers and usersto allow for informed ecological decisions. There is theassumption that if we have the right tools andinformation, people will not have to be urged, we willchoose to build ecologically and stop the ecologicaldevastation of the planet. (Figure 2.15)
Jane Jacobs (2004) looming, or more disturbingly as JGBallard 2 notes with his ideas of ecological catastrophe, are they are already upon us? It is easy to see a bleakpicture of the future, and much more rewarding asdesigners to look for solutions. Despite the fact that thebasic principles of green design are obvious to all, buildings continue to be produced without basicenvironmentally sustainable premises in mind. At presentrates of non-renewable energy resources, within the next50 years the world will likely run out of non-renewablefossil fuels (Yeang 1999). Buildings rely on fossil fuelson many levels, throughout the lifecycle of the building,

Part Two( C.T.E.C ) Chapter Three ( Contemporary Trends )
from machinery to materials to maintenance. Asdesigners, it is increasingly difficult to sift throughbuilding regulations, media reports and analysis tools inorder to design in harmony with the environment. Materials and processes that are non-damaging are notoften readily available and clients are often driven by
the majority of architects have been trained without anyserious background in ecology or environmentalbiology. Yeang (1999) suggests that what we are doingnow as a profession is not ecological, and thatecological design calls for a rapid and fundamentalreorientation of our thinking and design approach withregard to the creation of our built environment. [Sourceis: CEPHAD 2010 // the borderland between philosophy anddesign research // Copenhagen //January 26 29, 2010.]
Strategies for designing and building architecturevary for cultural, geographical, climatic and economicissues. There is no one-size-fits-all approach toarchitectural design, yet there is a need for baseguidelines as the impact of how other people acttowards the built environment has widespreadconsequences even to those who are acting ecologically.The devastation of the environment does not observenational boundaries. Legislating and regulating helps toa local extent, education and architectural criticism andpublishing encourages international debate butultimately a relatively small number of peoplecommission buildings, and a relatively small number ofdesigners build them. Architecture is a social art(Yeang) and of course everyday culture needs to changealongside architectural. (Figure 2.16)
Beyond materials, lifecycle and energy use, evenour approach to design must be ecological andsustainable. A commonly cited definition ofsustainability is as defined in the BrundtlandCommission Report (1987) relating to meeting theneeds of the present without compromising the abilityof future generations to meet their own needs. But if
into
Braungart (2002) rightly ask us to consider as users and
[Source is: CEPHAD 2010 // the borderland

Part Two( C.T.E.C ) Chapter Three ( Contemporary Trends )
between philosophy and design research // Copenhagen //January26 29, 2010.]
Ecological architecture, means building withminimal environmental impacts, and where possible,building to achieve the opposite effect; this meanscreating buildings with positive, reparative andproductive consequences for the natural environment,while at the same time integrating the built structurewith all aspects of the ecological systems (ecosystems)of the biosphere over its entire life cycle. Ecologicalarchitecture, Aims to respond to declining energyresources, e.g. using energy conservation, efficientinsulation, rainwater, solar radiation, and wind-power,and recycling as much as possible. (Figure 2.17)
3.1.3 Bio Architecture:
Bio-Architecture (Figure 2.18) is a new scienceof life force in buildings, based on the science of howbuilding makes and generates the required FractalField. The principles of biological architecture, sacredgeometry and feng shui are being used. This is a way oftaking a holistic approach to design, based on theunderstanding that everything is connected, alive andconscious. The design emerges from an expression ofnatural patterns, symmetries, shapes, universal symbolsand ratios. Spiritual geometry is a universal languageof truth, harmony, beauty, proportion, rhythm an order.Architects and designers draw upon concepts of sacredgeometry when they choos particular geometric formsto create pleasing, harmonious, and spiritually upliftingspaces. [Source is: http://www.simplyenjoy.info, RetrievedJanuary 26 29, 2010.]
Sacred Geometry is the study and practice of thepure principle set of operations that underpin all naturalexpressions and processes. In ancient times, thisknowledge was considered vital, (quite literally) if onewished to create a truly sacred life within a sustainablecommunity- health and harmony.
By studying and understanding the symmetry ofelectric fields causing health versus disease werediscover that an overwhelming simple and yetcompelling rule or pattern emerges. Applying this

Part Two( C.T.E.C ) Chapter Three ( Contemporary Trends )
beautiful algorithm to architecture - we now see exactlywhy the design of living space must be exactly that - anelectrically living space. An electrically alive space(sometimes called 'sacred') is simply the space wherecharge/chi can breathe efficiently and thus achieve themultiply connected / holographic and fractal-distributedresonance called awareness - the thrust of all livingsystems. (Figure 2.19) [Source is:http://www.simplyenjoy.info, Retrieved January 26 29, 2010.]
As nature uses shape to hold charge or life force,it makes complete sense to use nature's shapes andproportions for the shape of our spaces and buildings. Interms of architecture and design of space, I believe thatby creating spaces that are based on the pure principlesof natural design we provide a sacred environment thatcan nurture our bodies, minds and spirits. We canliterally design to raise the vibration of the inhabitants.We can use our quantum consciousness to create thespace, and to clear it of any stresses that do not servelife.
Principles of the built environment
Design of architecture and living systems, sothat space is fractal and phase conjugate andtherefore life enhancing.Working places where you reduce absenteeismto almost zero.Settings that reduce Electro-smog.Spaces that generate Life Force. Use natural geometries, shapes, forms, ratiosand growth patterns to design our spaces inorder to create life and truly sustainable systems.This is 'Full Spectrum Architecture' - not just'green architecture'!How to include patterns of paramagnetic stonesin buildings, such as Dolmens, Geometricallayouts, labyrinths.Spaces that attract and auto-organizeelectromagnetic charge fields. 'The moreharmonic inclusiveness, the more fractality. Themore fractality, the more life.'
The beehive and the pinecone are excellentexamples of sacred architecture because as biological
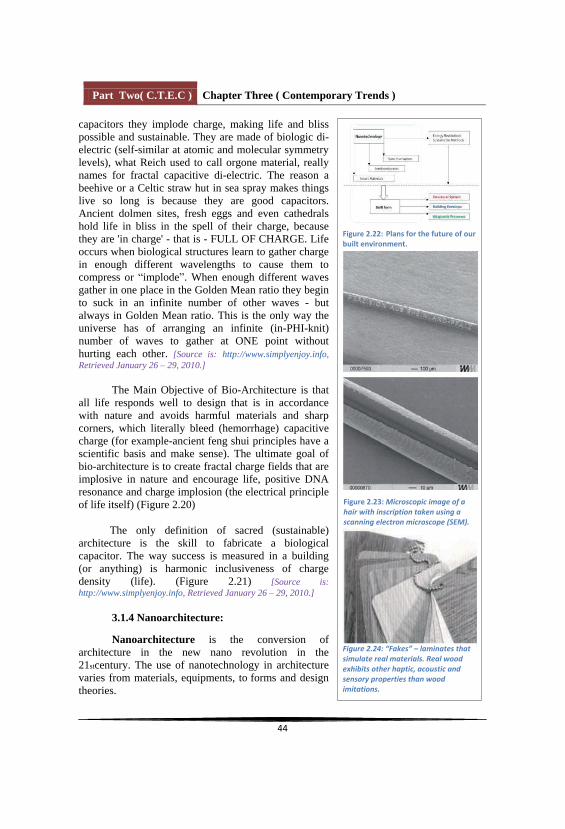
Part Two( C.T.E.C ) Chapter Three ( Contemporary Trends )
capacitors they implode charge, making life and blisspossible and sustainable. They are made of biologic di-electric (self-similar at atomic and molecular symmetrylevels), what Reich used to call orgone material, reallynames for fractal capacitive di-electric. The reason abeehive or a Celtic straw hut in sea spray makes thingslive so long is because they are good capacitors.Ancient dolmen sites, fresh eggs and even cathedralshold life in bliss in the spell of their charge, becausethey are 'in charge' - that is - FULL OF CHARGE. Lifeoccurs when biological structures learn to gather chargein enough different wavelengths to cause them tocompress or implode . When enough different wavesgather in one place in the Golden Mean ratio they beginto suck in an infinite number of other waves - butalways in Golden Mean ratio. This is the only way theuniverse has of arranging an infinite (in-PHI-knit)number of waves to gather at ONE point withouthurting each other. [Source is: http://www.simplyenjoy.info,Retrieved January 26 29, 2010.]
The Main Objective of Bio-Architecture is thatall life responds well to design that is in accordancewith nature and avoids harmful materials and sharpcorners, which literally bleed (hemorrhage) capacitivecharge (for example-ancient feng shui principles have ascientific basis and make sense). The ultimate goal ofbio-architecture is to create fractal charge fields that areimplosive in nature and encourage life, positive DNAresonance and charge implosion (the electrical principleof life itself) (Figure 2.20)
The only definition of sacred (sustainable)architecture is the skill to fabricate a biologicalcapacitor. The way success is measured in a building(or anything) is harmonic inclusiveness of chargedensity (life). (Figure 2.21) [Source is:http://www.simplyenjoy.info, Retrieved January 26 29, 2010.]
3.1.4 Nanoarchitecture:
Nanoarchitecture is the conversion ofarchitecture in the new nano revolution in the21stcentury. The use of nanotechnology in architecturevaries from materials, equipments, to forms and designtheories.

Part Two( C.T.E.C ) Chapter Three ( Contemporary Trends )
Nanotechnology + Architecture = Nanoarchitecture.
The biggest plans for the future of our builtenvironment are actually very, very small.Nanoarchitecture would be the upcoming newarchitectural trend of the contemporary time. Theimpact of such new technology will exceed those of theprecedent technologies because the intensity of theimpact of any phenomenon is positively correlated withits pervasiveness. The circumstances indicate that thepossible impacts of nanotech will exceed even those ofthe past century revolt against classicism. (Figure 2.22)
The eight billion dollar per year nanotechnologyindustry has already begun to transform our buildingsand how we use them; if its potential becomes reality, itcould transform our world in ways undreamed of.Nanotechnology has the potential to radically alter ourbuilt environment and how we live. It is potentially themost transformative technology we have ever faced,generating more research and debate than nuclearweapons, space travel, computers or any of the othertechnologies that have shaped our lives.
When introducing new technologies to a fieldsuch as the construction industry, one should alwaysfirst examine the benefits it can bring. In the case of theapplication of nanotechnology we are talking aboutadded value, additional functionality, as well as marketdemand with regard to product development. Gooddesign in principle is always based on demand, and inthis way contributes to the evolution of bothnanomaterials and the resulting nanoproducts - in thelong term the materials and products for which there isa demand will become established whereas others willdisappear from the market. The use of nanotechnologyis therefore not an end in itself but follows an ongoingdemand for innovation - as such it can also be amarketing factor. Independent of marketing factors,nanotechnology can make a concrete contribution to thefollowing areas: (Figure 2.23)
Optimization of existing products. Damage protection. Reduction in weight and/or volume.

Part Two( C.T.E.C ) Chapter Three ( Contemporary Trends )
Reduction in the number of production stages. A more efficient use of materials. Reduced need for maintenance (easy to clean,longer cleaning intervals) and/or operationalupkeep.
And as a direct result:
Reduction in the consumption of raw materialsand energy and reduced CO2 emissions.Conservation of resources.Greater economy. Comfort. [Source is: Nano Materials in Architecture,Interior Architecture and Design, Sylvia Leydecker.(2008)]
In architecture two fundamentally differentdesign approaches prevail when dealing with materialsand surfaces (Figure 2.24).
A-Honesty of Materials
This approach is favoured by those architects forwhomauthenticity is a priority and who value high-qualitymaterials such as natural stone or solid woods.
B-Fakes artificial surfaces that imitate naturalmaterials:
for cost reasons. Wood, whether in the form of veneeror synthetic wood-effect plastics, is considerablycheaper than solid wood. Even concrete or venerablewalls can be had en plastique. Artificial surfaces are
toappear exactly as desired; the color matches the sampleprecisely and does not change over the course of time.
that exhibit artificial aging: instant patinas preciselycontrollable. Certain design approaches prefer theprovocation of deliberate artificiality. (Figure 2.25)
In future, a third option will be available:
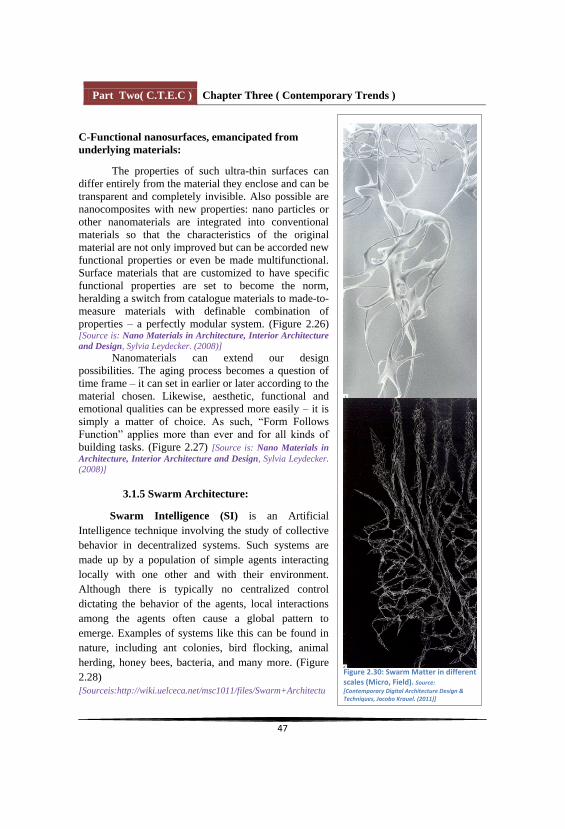
Part Two( C.T.E.C ) Chapter Three ( Contemporary Trends )
C-Functional nanosurfaces, emancipated fromunderlying materials:
The properties of such ultra-thin surfaces candiffer entirely from the material they enclose and can betransparent and completely invisible. Also possible arenanocomposites with new properties: nano particles orother nanomaterials are integrated into conventionalmaterials so that the characteristics of the originalmaterial are not only improved but can be accorded newfunctional properties or even be made multifunctional.Surface materials that are customized to have specificfunctional properties are set to become the norm, heralding a switch from catalogue materials to made-to-measure materials with definable combination ofproperties a perfectly modular system. (Figure 2.26)[Source is: Nano Materials in Architecture, Interior Architectureand Design, Sylvia Leydecker. (2008)]
Nanomaterials can extend our designpossibilities. The aging process becomes a question oftime frame it can set in earlier or later according to thematerial chosen. Likewise, aesthetic, functional andemotional qualities can be expressed more easily it issimply a matter of choice Form Follows
building tasks. (Figure 2.27) [Source is: Nano Materials inArchitecture, Interior Architecture and Design, Sylvia Leydecker.(2008)]
3.1.5 Swarm Architecture:
Swarm Intelligence (SI) is an ArtificialIntelligence technique involving the study of collectivebehavior in decentralized systems. Such systems aremade up by a population of simple agents interactinglocally with one other and with their environment.Although there is typically no centralized controldictating the behavior of the agents, local interactionsamong the agents often cause a global pattern toemerge. Examples of systems like this can be found innature, including ant colonies, bird flocking, animalherding, honey bees, bacteria, and many more. (Figure2.28)[Sourceis:http://wiki.uelceca.net/msc1011/files/Swarm+Architectu


Part Two( C.T.E.C ) Chapter Three ( Contemporary Trends )
Architecture [SA]. In the traditional design processthese kinds of relations are usually built inside thecreator's mind, but in SA they must be named, quantized and scripted. (Figure 2.30)
The truly innovative architect designs swarmarchitecture for an open source in real time. Buildingcomponents are potential senders and receivers ofinformation in real time, exchanging data, processingincoming data, and proposing new configurations forthe outcome of the process. People communicate withpeople. People communicate with buildings. Buildingscommunicate with buildings. Building componentscommunicate with other building components. All aremembers of the swarm, members of the hive. Buildingsare subject to the digital revolution, and you must workwith it. The innovative architect is not afraid of newmedia invading the built environment. The innovativearchitect naturally investigates and practicesarchitecture as a real time transaction space, as aprocess in real time. [Source is:http://wiki.uelceca.net/msc1011/files/Swarm+Architecture+and+the+personalized+city.pdf,Retrieved September 10, 2011.]
Swarm Matter is an ongoing research projectexploring the generation of ornamental geometriesthrough the agent based formation of emergenthierarchies and non-liner patterns. This research projectquestions the contemporary understanding ofcomponent logic as elements that are subservient to atopological ordering device such as surface. Instead thisexploration looks at the ability of macro order toemerge from the non-liner interaction of components ata local level. This non-liner methodology emerged fromkokkugia`s ongoing research into systems of swarmintelligence and multi-agent algorithmic design. [Sourceis: Contemporary Digital Architecture Design & Techniques,Jacobo Krauel. (2011)]
The project is concerned both with theemergence of figure from the complex order of fields aswell as the dissolution of the figure into abstraction. Ata local level a component has no base state, but instead


Part Two( C.T.E.C ) Chapter Three ( Contemporary Trends )
levels of LEED certification are possible; depending onthe number of criteria met, and indicate increasinglysustainable building practices (Figure 2.33):
1. LEED Certified 26-32 points2. LEED Silver 33-38 points3. LEED Gold 39-51 points 4. LEED Platinum 52+ points
There is a general perception that LEED isbecoming the standard for US green building design. Asthe industry magazine Health Facilities Management
imperfect and still evolving, LEED has rapidly becomethe largest and most widely recognized green buildingdesign and certification program in the US, andprobably in the world. (Figure 2.37) [Source is: The Costsand Financial Benefits of Green Buildings, Greg Kats, Capital E.(October 2003)]
LEED was first introduced through a PilotProgram, and twelve buildings received version 1.0certification in March 2000. Version 2.0 was releasedshortly thereafter for use as a design and certificationtool. At the end of 2000, about 8 million square feet ofbuildings were undergoing of December 2002, of allnew construction projects in the United States, anestimated 3% had applied for LEED certification,including 4% of schools, 16.5% of governmentbuildings and 1.1% of commercial projects (Figure2.34). In addition, many buildings use LEED as adesign tool without going through the certification
pervasive than the figures suggest. All indications arethat this explosive growth will continue. Despite itslimitations, the strength and likely future durability ofLEED and its definition of green buildings derives fromseveral factors:

Part Two( C.T.E.C ) Chapter Three ( Contemporary Trends )
LEED is broad and democratic in nature, currentlywith 3000 organizations representing all sectorsof the building industry. Membership hasroughly doubled annually over the last threeyears. (Figure 2.35)
LEED continues to change through large,professional, voluntary committees, and a staffthat is responsive to the evolving needs of itslarge and diverse membership. New products arebeing developed, including: LEED for ExistingBuildings, LEED for Commercial Interiors,LEED for Core and Shell, LEED for Homes, LEED for Neighborhood Developments, andLEED for Multiple Buildings.38 [Source is: TheCosts and Financial Benefits of Green Buildings, GregKats, Capital E. (October 2003)]
The USGBC spends millions of dollars each yearto support LEED in a number of ways,including: an extensive training program; theLEED Accredited Professional exam; aResource guide; LEED templates; an extensiveLEED website for registered projects, technicaldata and scientific committees; and a growingstaff of professionals dedicated to LEED.(Figure 2.36) [Source is: The Costs and FinancialBenefits of Green Buildings, Greg Kats, Capital E.(October 2003)]
3.2.2 BREEAM (Britain)
Concern for the environment has grown apaceover the last and yet buildings, which have very largeenvironmental effects, are not considered. Encouragingenvironmentally friendlier buildings will over timesubstantially improve the environment. In the presentclimate of concern, about global warming for instance,it is of advantage to make visible that one building isenvironmentally better than another.
BREEAM (Building Research EstablishmentEnvironmental Assessment Method) (Figure 2.38) is

Part Two( C.T.E.C ) Chapter Three ( Contemporary Trends )
currently the only established method of assessing theenvironmental quality of buildings. The first version ofthe scheme, BREEAM 1/90, was developed forassessing new offices at the design stage and waspublished in 1990. A revised version of the scheme for
new office design, BREEAM 1/93, extending the scopeof the environmental effects covered by the assessment,was published earlier in 1993. Since the publication of
the scheme in 1990 about 25% of the new office stockdesigned since its launch has been assessed. Versions ofthe scheme have also been published for three otherbuilding types: BREEAM 2/91 covers superstores andsupermarkets, BREEAM 3/91 new homes andBREEAM 4/93 existing offices. (Figure 2.41) [Source is:
Environmental handbook for building and civil engineeringprojects Design and Specification, construction industry researchand information association. (1994)]
The scheme uses independent assessors toevaluate the environmental effects of the building. Atthe completion of an independent assessment acertificate is issued which confirms the areas ofenvironmental concern and criteria the building designhas satisfied. Carrying out an assessment at the designstage allows improvements to be incorporated beforethe design is fixed. A credit on the certificate wouldindicate that the building will perform betterenvironmentally than normal practice (Figure 2.39). Asummary rating of fair, good, very good or excellent isincluded in the certificate based on a minimum numberof credits achieved overall and in each of the followingboard categories. (Figure 2.40) [Source is: Environmental
handbook for building and civil engineering projects Design andSpecification, construction industry research and informationassociation. (1994)]
The environmental issues concerned in the schemeare grouped into the global, neighborhood (or local) andindoor environments. The issues covered in eachversion of the scheme are slightly different, but broadly

Part Two( C.T.E.C ) Chapter Three ( Contemporary Trends )
follow the environmental concerns set out below:
Global issues:
Rainforest destructionResource depletionGlobal warmingOzone depletion
Neighborhood or local issues:
Limiting air pollutionLimiting noise effectsLegionnaires diseaseLocal wind effectsSite ecological value Limiting overshadowingWater economyRe- use of existing sites
Indoor issues:
Hazardous materialsLightingVentilationSafety and securityIndoor air qualityIndoor pollutants
It is intended that other issues will be included infuture versions of the scheme as more evidencebecomes available, further matters being considered forinclusion are life cycle energy costs, combined heat andpower, manageability, location, microclimate, volatilesolvents, ventilation effectiveness, thermal comfort andsick building syndrome. (Figure 2.42) [Source is:
Environmental handbook for building and civil engineeringprojects Design and Specification, construction industry researchand information association. (1994)]
3.2.3 CASBEE (Japan)

Part Two( C.T.E.C ) Chapter Three ( Contemporary Trends )
Promotion of sustainability is one of the greatchallenges facing humankind. Since the buildingindustry started to move toward the promotion ofsustainable building in the latter half of the 1980s,various techniques to evaluate the environmentalperformance of buildings have been developed.[Sourceis: http://www.ibec.or.jp/CASBEE/english/download.htm, Retrieved October 14, 2011.]
In Japan, a joint industrial/government/academicproject was initiated with the support of the HousingBureau, ministry of land, infrastructure andtransport (MLIT), in April 2001, which led to theestablishment of a new organization, the Japan GreenBuild Council (JaGBC) / Japan Sustainable BuildingConsortium (JSBC), with its secretariat administeredby the Institute for Building Environment and EnergyConservation. JSBC and a subcommittee under it aretogether working on R&D of the ComprehensiveAssessment System for Building EnvironmentalEfficiency (CASBEE) (Figure 2.43). Today, theenhancement and diffusion of CASBEE are beingpromoted under MLIT environment action plan (June2004) and the Kyoto Protocol target achievement plan(approved by the cabinet on April 28, 2005). In recentyears, several local authorities introduced CASBEE intotheir building administration. Consequentlyenvironmental performance assessment of buildings isnow carried out in many buildings in Japan. (Figure2.45)
CASBEE is a method for assessing and rating theenvironmental performance of buildings, ranked in fivegrades:
excellent (S), very good (A), good (B+), fairly poor (B-)and poor (C). The first assessment tool (Figure 2.44) ,CASBEE for office, was completed in 2002, followedby CASBEE for new construction in July 2003,CASBEE for existing building in July 2004 andCASBEE for renovation in July 2005, CASBEE is
.http://www.hbrc.edu.eg/files/GPRS-202011.pdf,
http://www.hbrc.edu.eg/files/GPRS-202011.pdf,
http://www.hbrc.edu.eg/files/GPRS-202011.pdf,
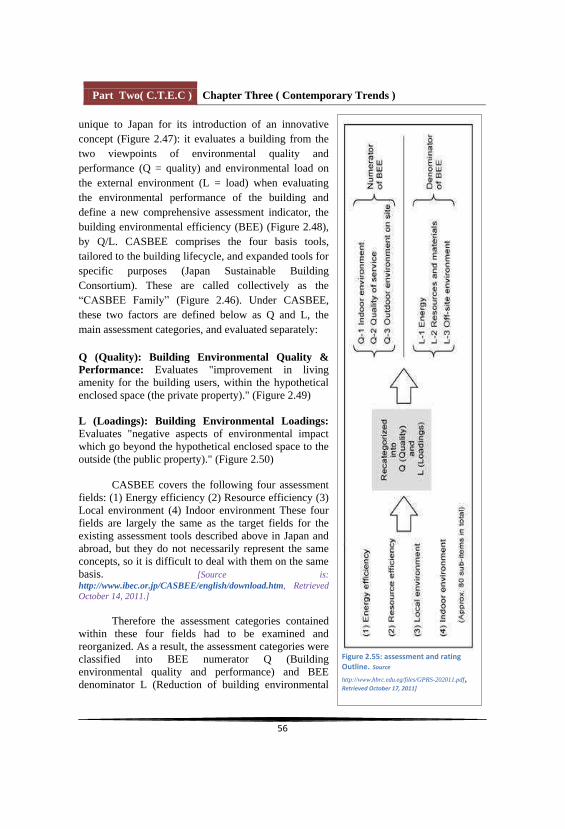
Part Two( C.T.E.C ) Chapter Three ( Contemporary Trends )
unique to Japan for its introduction of an innovativeconcept (Figure 2.47): it evaluates a building from thetwo viewpoints of environmental quality andperformance (Q = quality) and environmental load onthe external environment (L = load) when evaluatingthe environmental performance of the building anddefine a new comprehensive assessment indicator, thebuilding environmental efficiency (BEE) (Figure 2.48),by Q/L. CASBEE comprises the four basis tools,tailored to the building lifecycle, and expanded tools forspecific purposes (Japan Sustainable BuildingConsortium). These are called collectively as the
(Figure 2.46). Under CASBEE,these two factors are defined below as Q and L, themain assessment categories, and evaluated separately:
Q (Quality): Building Environmental Quality &Performance: Evaluates "improvement in livingamenity for the building users, within the hypotheticalenclosed space (the private property)." (Figure 2.49)
L (Loadings): Building Environmental Loadings:Evaluates "negative aspects of environmental impactwhich go beyond the hypothetical enclosed space to theoutside (the public property)." (Figure 2.50)
CASBEE covers the following four assessmentfields: (1) Energy efficiency (2) Resource efficiency (3)Local environment (4) Indoor environment These fourfields are largely the same as the target fields for theexisting assessment tools described above in Japan and abroad, but they do not necessarily represent the sameconcepts, so it is difficult to deal with them on the samebasis. [Source is:http://www.ibec.or.jp/CASBEE/english/download.htm, RetrievedOctober 14, 2011.]
Therefore the assessment categories containedwithin these four fields had to be examined andreorganized. As a result, the assessment categories wereclassified into BEE numerator Q (Buildingenvironmental quality and performance) and BEEdenominator L (Reduction of building environmental
http://www.hbrc.edu.eg/files/GPRS-202011.pdf,

Part Two( C.T.E.C ) Chapter Three ( Contemporary Trends )
loadings). Q is further divided into three items for assessment: Q1 Indoor environment, Q2Quality of services and Q3 Outdoor environment on site. Similarly, L is divided into L1Energy, L2 Resources & Materials and L3 Off-site Environment.
In assessment tools up to the 2006 edition of CASBEE, efforts which contribute toreducing CO2 emissions, such as those below, were evaluated individually:
Efforts to reduce operating energy, which is a contributing factor in climate changeUse of existing structural skeletons and recycled construction materials, whichcontribute to reduction of the embodied CO2 related to the manufacture ofconstruction materials.Lifespan-extension efforts to contribute to LCCO2 reduction
We have decided to replace the above efforts with LCCO2 as a quantitativeindicator for the purpose of assessment. Assessment should be performed using an emissionrate (%) relative to the LCCO2 (kg CO2/year-m2) of a hypothetical reference buildinghaving level 3 for all items other than this one. (Figure 2.51)[Source is:http://www.ibec.or.jp/CASBEE/english/download.htm, Retrieved October 14, 2011.]
3.2.4 The Green Pyramid Rating System (GPRS) (Egypt)
Climate change is possibly the greatest challenge facing humanity, and researchappears to show that the phenomenon is a result of the increased levels of greenhouse gas
greenhouse gas emissions, the Nation is considered to be one of the countries of the world
Given that around half of total carbon-related emissions come from buildings andtheir use, sustainable building development and green building, should be recognised to beof crucial importance. The government of the Arab Republic of Egypt, represented in theMinistry of Housing, Utilities and Urban Development has an interest in promoting green
should reduce pollution and enhance the efficiency of energy and water use. Furthermore,green buildings are designed and constructed in such a way that the activities of theiroccupiers and users do not endanger the environment or human health and well-being.Green building, with its use of renewable energy, recycling and reduction of pollution andwaste involves more responsible, rational and sustainable use of land, raw materials, energyand water. This in turn should lead to a healthier more comfortable environment and astronger economy.[Source is: http://www.hbrc.edu.eg/files/GPRS-202011.pdf, Retrieved October 14,2011.] (Figure 2.52)
The concept of green building observes important criteria which secure theattainment of the required quality and efficiency of buildings. It covers guidance, locationpreparation and careful study, consideration of optimal methods for water consumptionincluding recycling of used water for other industrial and agricultural purposes, studies on
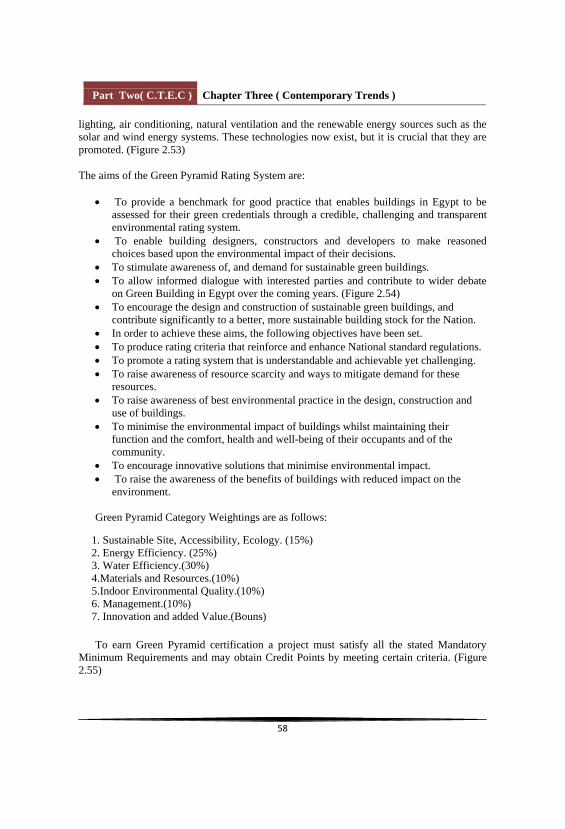
Part Two( C.T.E.C ) Chapter Three ( Contemporary Trends )
lighting, air conditioning, natural ventilation and the renewable energy sources such as thesolar and wind energy systems. These technologies now exist, but it is crucial that they arepromoted. (Figure 2.53)
The aims of the Green Pyramid Rating System are:
To provide a benchmark for good practice that enables buildings in Egypt to beassessed for their green credentials through a credible, challenging and transparentenvironmental rating system. To enable building designers, constructors and developers to make reasonedchoices based upon the environmental impact of their decisions.To stimulate awareness of, and demand for sustainable green buildings. To allow informed dialogue with interested parties and contribute to wider debateon Green Building in Egypt over the coming years. (Figure 2.54)To encourage the design and construction of sustainable green buildings, andcontribute significantly to a better, more sustainable building stock for the Nation.In order to achieve these aims, the following objectives have been set.To produce rating criteria that reinforce and enhance National standard regulations.To promote a rating system that is understandable and achievable yet challenging. To raise awareness of resource scarcity and ways to mitigate demand for theseresources.To raise awareness of best environmental practice in the design, construction and use of buildings.To minimise the environmental impact of buildings whilst maintaining theirfunction and the comfort, health and well-being of their occupants and of thecommunity.To encourage innovative solutions that minimise environmental impact. To raise the awareness of the benefits of buildings with reduced impact on theenvironment.
Green Pyramid Category Weightings are as follows:
To earn Green Pyramid certification a project must satisfy all the stated MandatoryMinimum Requirements and may obtain Credit Points by meeting certain criteria. (Figure2.55)
1. Sustainable Site, Accessibility, Ecology. (15%)2. Energy Efficiency. (25%)3. Water Efficiency.(30%)4.Materials and Resources.(10%)5.Indoor Environmental Quality.(10%)6. Management.(10%)7. Innovation and added Value.(Bouns)


Part Two ( C.T.E.C )
rain from sulfur dioxide and nitrogen oxides harmsplants and fish. Nitrogen oxides also contribute tosmog.
It is a truism that we cannot continue forever
completely by renewable energy sources.
Although the renewable energy sector is growingrapidly, the climate change imperative dictates that webegin the wholesale transformation of our energysystem now, if we are to have any possibility ofavoiding the worst of dangerous climate change bykeeping global mean temperature rise well below 2° Cabove preindustrial levels. (Figure 2.59)
support a massive uptake of renewable energy and tomove away from conventional fossil fuel and nuclearsources:
Air pollution from the transport and powersectors has made our cities hazardous to ourhealth, . (Figure2.60)A distributed system of generation from avariety of renewable sources provides a muchmore robust energy system much lesssusceptible to interruptions of supply.Relying on largely indigenous renewablesources of energy can protect local economiesfrom the massive economic disruptions causedby speculation-driven swings on globalcommodities markets.A dispersed system of renewable generatingsystems is much more physically secure fromattack.As the growing industry has demonstrated, thesector is a fast-growing supplier of high qualityjobs, much more so than the capital-intensiveconventional energy sector.
The renewable energy industry is boomingworldwide, attracting almost 40 billion USD in
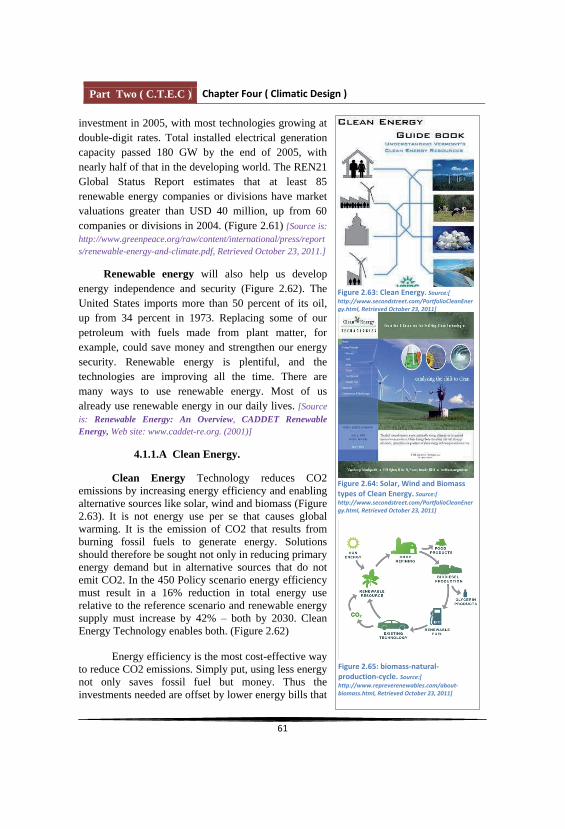
Part Two ( C.T.E.C )
investment in 2005, with most technologies growing atdouble-digit rates. Total installed electrical generationcapacity passed 180 GW by the end of 2005, withnearly half of that in the developing world. The REN21Global Status Report estimates that at least 85renewable energy companies or divisions have marketvaluations greater than USD 40 million, up from 60companies or divisions in 2004. (Figure 2.61) [Source is:http://www.greenpeace.org/raw/content/international/press/reports/renewable-energy-and-climate.pdf, Retrieved October 23, 2011.]
Renewable energy will also help us developenergy independence and security (Figure 2.62). TheUnited States imports more than 50 percent of its oil,up from 34 percent in 1973. Replacing some of ourpetroleum with fuels made from plant matter, forexample, could save money and strengthen our energysecurity. Renewable energy is plentiful, and thetechnologies are improving all the time. There aremany ways to use renewable energy. Most of usalready use renewable energy in our daily lives. [Sourceis: Renewable Energy: An Overview, CADDET RenewableEnergy, Web site: www.caddet-re.org. (2001)]
4.1.1.A Clean Energy.
Clean Energy Technology reduces CO2emissions by increasing energy efficiency and enablingalternative sources like solar, wind and biomass (Figure2.63). It is not energy use per se that causes globalwarming. It is the emission of CO2 that results fromburning fossil fuels to generate energy. Solutionsshould therefore be sought not only in reducing primaryenergy demand but in alternative sources that do notemit CO2. In the 450 Policy scenario energy efficiencymust result in a 16% reduction in total energy userelative to the reference scenario and renewable energysupply must increase by 42% both by 2030. CleanEnergy Technology enables both. (Figure 2.62)
Energy efficiency is the most cost-effective wayto reduce CO2 emissions. Simply put, using less energynot only saves fossil fuel but money. Thus theinvestments needed are offset by lower energy bills that


Part Two ( C.T.E.C )
Seek a world in which the manifest benefits ofenergy services, such as light, heat, power and transportare equitably available for all: north and south, rich andpoor. Only in this way can we create true energysecurity, as well as the conditions for true humansecurity. [Source is:http://www.greenpeace.org/raw/content/international/press/reports/renewable-energy-and-climate.pdf, Retrieved October 23, 2011.]
The technology to reverse global warmingalready exists; it just needs to be implemented. Thereare clean energy solutions that could replace coalpower, which is the number one source of carbondioxide. These clean energy solutions include suchthings as solar, wind, and hydroelectric power.However, no single form of clean energy can provide
lack sufficient wind, while others lack an adequatewater source for hydroelectric power, and so on. Cleanenergy solutions work by pairing the proper mode ofenergy production with the location where it will beused. (Figure 2.67)
There are also cleaner fuel sources on thehorizon, such as hydrogen, ethanol, and biodiesel.These sources are not only cleaner, but also renewable, meaning they come from sources that can never bedepleted, such as corn in the case of ethanol. In contrast,fossil fuels not only pollute, but they are also; when the
and gasoline isgone, it will be gone forever. This is because fossilfuels, as their name suggests, take millions of years toform underground. But these clean energy solutions willnot solve the problem of global warming overnight. Itwill also require a change in energy policy. Clean
utilized. According to the U.S. Department of Energy,85% of all the energy consumed in the United Statesstill comes from burning fossil fuels. The main obstaclefacing clean energy solutions is not a lack oftechnology, but a lack of economic feasibility.Unfortunately, most countries in the developed worlddepend largely on fossil fuels to keep their economiesrunning. The technology to stop global warming isalready here, now it must be put into action. (Figure2.68) [Source is:

Part Two ( C.T.E.C )
http://www.toowarm.org/globalwarming/cleanenergy/ , RetrievedOctober 23, 2011.]
4.1.1.B Solar Power.
A photovoltaic system is based on the ability ofcertain materials to convert the radiant energy of the sun into electrical energy. The total amount of solar energythat lights a given area is known as irradiance (G) and itis measured in watts per square meter (W/m2). Theinstantaneous values are normally averaged over aperiod of time, so it is common to talk about totalirradiance per hour, day or month. (Figure 2.69)
Solar technologies tap directly into the infinitepower of the sun and use that energy to produce heat,light, and power.
Passive Solar Lighting and Heating (Figure2.70), People have used the sun to heat and light theirhomes for centuries. Ancient Native Americans builttheir dwellings directly into south-facing cliff wallsbecause they knew the sun travels low across thesouthern sky in the Northern Hemisphere during thewinter. They also knew the massive rock of the cliffwould absorb heat in winter and protect against windand snow. At the same time, the cliff welling designblocked sunlight during the summer, when the sun ishigher in the sky, keeping their dwellings cool. Themodern version of this sun-welcoming design is calledpassive solar because no pumps, fans, or othermechanical devices are used. Its most basic featuresinclude large, south-facing windows that fill the homewith natural sunlight, and dark tile or brick floors that
release it back into the home atnight. In the summer, when the sun is higher in the sky,window overhangs block direct sunlight, which keepsthe house cool (Figure 2.71). Tile and brick floors alsoremain cool during the summer. Passive solar designcombined with energy efficiency will go even further. Energy-efficient features such as energy savingwindows and appliances, along with good insulationand weather stripping, can make a huge difference inenergy and cost savings. (Figure 2.72) [Source is:Renewable Energy: An Overview, CADDET Renewable Energy,Web site: www.caddet-re.org. (2001)]

Part Two ( C.T.E.C )
Solar Water Heating (Figure 2.73), Solarenergy can be used to heat water for your home or yourswimming pool. Most solar water-heating systemsconsist of a solar collector and a water storage tank.Solar water-heating systems use collectors, generallymounted on a south-facing roof, to heat either water or aheat-transfer fluid, such as a nontoxic antifreeze. Theheated water is then stored in a water tank similar to oneused in a conventional gas or electric water-heatingsystem. There are basically three types of solarcollectors for heating water: flat plate, evacuatedtube,and concentrating. The most common type, a flat-platecollector, is an insulated, weatherproof box containing adark absorber plate under a transparent cover. Evacuated- tube collectors are made up of rows ofparallel, transparent glass tubes. Each tube consists of aglass outer tube and an inner tube, or absorber, coveredwith a coating that absorbs solar energy but inhibits heat loss. Concentrating collectors for residentialapplications are usually parabolic-shaped mirrors (like atrough) absorbertube called a receiver that runs along the axis of themirrored trough and contains a heat-transfer fluid. Allthree types of collectors heat water by circulatinghousehold water or a heat-transfer fluid such as anontoxic antifreeze from the collector to the waterstorage tanks. Collectors do this either passively oractively. Passive solar water-heating systems usenatural convection or household water pressure tocirculate water through a solar collector to a storagetank. They have no electric components that couldbreak, a feature that generally makes them morereliable, easier to maintain, and possibly longer lastingthan active systems. An active system uses an electricpump to circulate water or nontoxic antifreeze throughthe system. Active systems are usually more expensivethan passive systems, but they are also more efficient.Active systems also can be easier to retrofit than passivesystems because their storage tanks do not need to beinstalled above or close to the collectors. Also, themoving water in the system will not freeze in coldclimates. But because these systems use electricity, theywill not function in aactive solar-electric panel to power the pump. Theamount of hot water a solar water heater produces

Part Two ( C.T.E.C )
depends on the type and size of the system, the amountof sun available at the site, proper installation, and thetilt angle and orientation of thecurrently using electric water heater, solar water heatingis a cost-effective alternative. If you own a swimmingpool, heating the water with solar collectors can alsosave you money. (Figure 2.74) [Source is: RenewableEnergy: An Overview, CADDET Renewable Energy, Web site:www.caddet-re.org. (2001)]
Solar Electricity (Figure 2.75), Solar electricityor photovoltaic (PV) technology converts sunlightdirectly into electricity. Solar electricity has been aprime source of power for space vehicles since theinception of the space program. It has also been used topower small electronics and rural and agriculturalapplications for three decades. During the last decade, astrong solar electric market has emerged for poweringurban grid-connected homes and buildings as a result ofadvances in solar technology along with global changesin electric industry restructuring (Figure 2.76).Although many types of solar electric systems areavailable today, they all consist of basically three mainitems: modules that convert sunlight into electricity;inverters that convert that electricity into alternatingcurrent so it can be used by most household appliances;and possibly or sometimes batteries that store excesselectricity produced by the system (Figure 2.77). Theremainder of the system comprises equipment such aswiring, circuit breakers, and support structures.modules can be built into glass skylights and walls.Some modules resemble traditional roof shingles, butthey generate electricity, and some come with built-ininverters. The solar modules available today are moreefficient and versatile than ever before. In over 30states, any additional power produced by a PV system,which is not being used by a home or building, can befed back to the electric grid through a process known asnet metering. Net metering allows electricity customersto pay amount ofpower consumed from their utility minus the powergenerated by their PV system. This meteringarrangement allows consumers to realize full retailvalue for 100 percent of the PV energy produced bytheir systems. Grid-connected PV systems do notrequire batteries. However, some grid connected

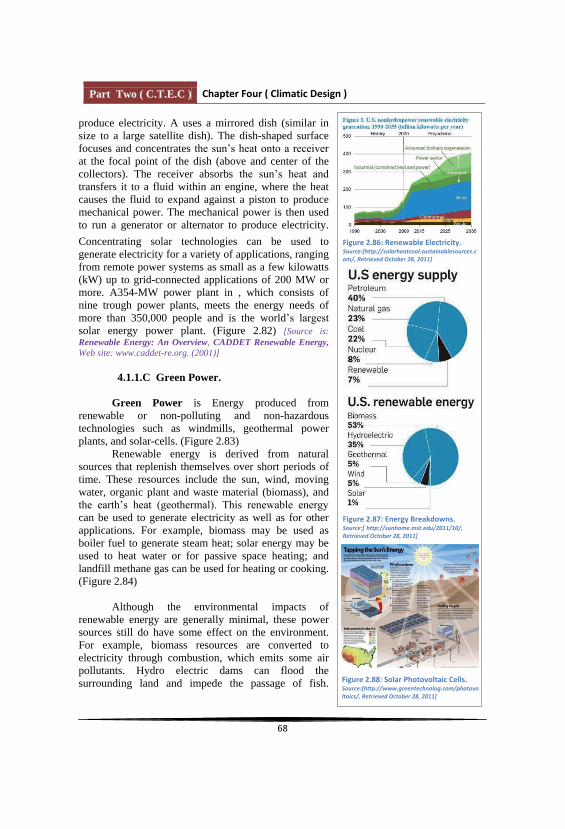
Part Two ( C.T.E.C )
produce electricity. A uses a mirrored dish (similar insize to a large satellite dish). The dish-shaped surfacefocuses and concentratesat the focal point of the dish (above and center of thecollectors). The receiver absorbstransfers it to a fluid within an engine, where the heatcauses the fluid to expand against a piston to producemechanical power. The mechanical power is then usedto run a generator or alternator to produce electricity.
Concentrating solar technologies can be used togenerate electricity for a variety of applications, rangingfrom remote power systems as small as a few kilowatts(kW) up to grid-connected applications of 200 MW ormore. A354-MW power plant in , which consists ofnine trough power plants, meets the energy needs ofmore than 350,000 people and is the worldsolar energy power plant. (Figure 2.82) [Source is:Renewable Energy: An Overview, CADDET Renewable Energy,Web site: www.caddet-re.org. (2001)]
4.1.1.C Green Power.
Green Power is Energy produced fromrenewable or non-polluting and non-hazardoustechnologies such as windmills, geothermal powerplants, and solar-cells. (Figure 2.83)
Renewable energy is derived from naturalsources that replenish themselves over short periods oftime. These resources include the sun, wind, movingwater, organic plant and waste material (biomass), and
can be used to generate electricity as well as for otherapplications. For example, biomass may be used asboiler fuel to generate steam heat; solar energy may beused to heat water or for passive space heating; andlandfill methane gas can be used for heating or cooking.(Figure 2.84)
Although the environmental impacts ofrenewable energy are generally minimal, these powersources still do have some effect on the environment.For example, biomass resources are converted toelectricity through combustion, which emits some airpollutants. Hydro electric dams can flood thesurrounding land and impede the passage of fish.

Part Two ( C.T.E.C )
Compared with conventional power, however,renewable power generally avoids, or at leastsignificantly reduces, the adverse environmentalimpacts of conventional electricity generation.
The term green power is used in a number ofdifferent ways. In the broadest sense, green powerrefers to environmentally preferable energy and energytechnologies, both electric and thermal. This definitionof green power includes many things, from solarphotovoltaic systems to wind turbines to fuel cells forautomobiles. [Source is:http://pdf.wri.org/guide_purchase_green.pdf, Retrieved October28, 2011.]
Although renewable resources do more thangenerate electricity, green power is most commonlyused in a narrower, marketing, sense to referspecifically to electricity from renewable resources?Green power includes the following three products:
renewable energy resources and is deliveredthrough the utility grid. (Figure 2.85)
represent the environmental, social, andother positive attributes of power generatedby renewable resources. (Figure 2.86)
-site renewable generation" refers toelectricity generated using renewable energyresources at the end-user's facility. (Figure2.87)
Green power can help many organizations meetenvironmental, financial, stakeholder relations,economic development, and national securityobjectives. [Source is:http://pdf.wri.org/guide_purchase_green.pdf, Retrieved October28, 2011.]
Environmental: Avoid environmentalimpacts. Green power and renewable energyavoid most of the environmental impactsassociated with traditional power generation,

Part Two ( C.T.E.C )
helping protect human health and the healthof the environment.
Financial: Fuel supply disruptions. On-siterenewable generation can reduce the risk ofdisruptions in fuel supplies resulting fromtransportation difficulties or internationalconflict.
Financial: Additional environmentalregulation. To address global climate changeand regional air quality issues, federal andstate regulations have been proposed thatwould effectively increase the price ofconventional electricity. But green powerwould be largely unaffected by theseregulations, resulting in more stable pricesover the long run.
On-site renewable energy technologies forpower generation include photovoltaic panels, windturbines, fuel cells, and biomass combustion. Largefacilities sited near a municipal landfill or sewagetreatment plant may be able to use recovered methanegas for on-site electricity and/or heat production. Thefollowing describes each of these options in moredetail:
Solar. Photovoltaic (PV) cells (Figure 2.88)and modules can be configured to almostany size from a few kilowatts up to morethan one megawatt. On-site photovoltaiccells may be situated on schools, homes,community facilities, and commercialbuildings. Photovoltaic cells can be madepart of a building, displacing other buildingmaterial costs, for example, roofing shinglesor car park shading.
Wind turbines vary in size. A typical smallunit provides fewer than 25 kW, whereaslarge turbines range from 500 kW to morethan 3 MW. On-site applications are usuallyonly possible in nonurban areas, and oftenrequire zoning permits to exceed 35-foot

Part Two ( C.T.E.C )
height restrictions (a tower for a 250 kWturbine is 130 feet high with a blade sweepof 98 feet). Such installations usually requireapproximately one acre of land per turbineand wind speeds that average 15 mph at a50-meter height. In addition, placingturbines near tall buildings is inadvisablebecause the building may create windturbulence that can disrupt the turbines'performance.[Sourceis:http://pdf.wri.org/guide_purchase_green.pdf,Retrieved October 28, 2011.] (Figure 2.89)Landfill and sewage methane gas. Methanegas derive from landfills or sewagetreatment plants may be used to generateelectricity. Methane gas also may begenerated using digesters that operate onmanure or agricultural wastes. The methanegas is then converted to electricity using aninternal combustion engine, gas turbine(depending on the quality and quantity of thegas), direct combustion boiler and steamturbine generator set, micro turbine unit, orother power conversion technology. Mostmethane gas projects produce from 0.5 to 4MW of electrical output. (Figure 2.90)
Biomass is plant material burned in a boilerto drive a steam turbine to produceelectricity. This system is good forproducing combined heat and power (CHP)at facilities with large thermal loads.Biomass projects are best suited to locationswith abundant biomass resources (oftenusing waste products from the forestindustry or agriculture). (Figure 2.91)
Fuel cells are another way of producingpower. They emit essentially no air pollutionand are more efficient than other forms ofgeneration. But they cannot be considered arenewable resource unless they operate on arenewably generated fuel, such as digestergas or hydrogen derived from PV or windpower. (Figure 2.92)
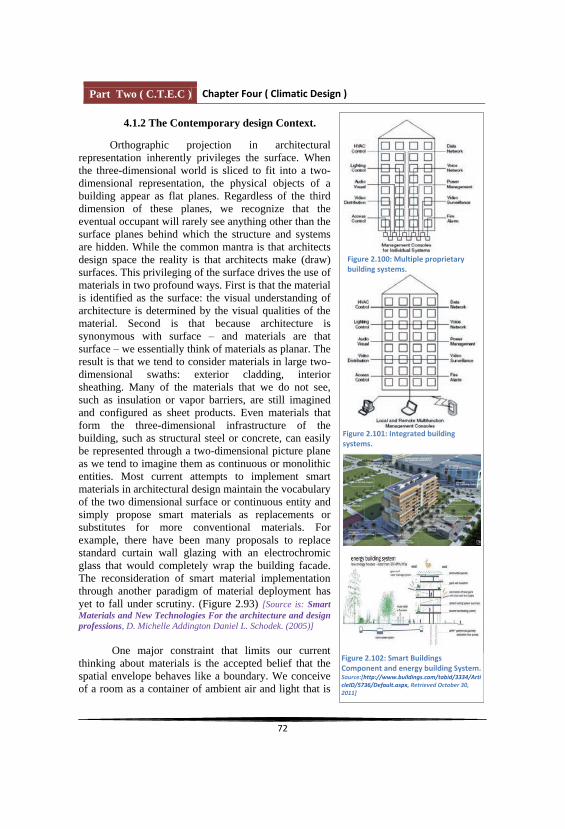
Part Two ( C.T.E.C )
4.1.2 The Contemporary design Context.
Orthographic projection in architecturalrepresentation inherently privileges the surface. Whenthe three-dimensional world is sliced to fit into a two-dimensional representation, the physical objects of abuilding appear as flat planes. Regardless of the thirddimension of these planes, we recognize that theeventual occupant will rarely see anything other than thesurface planes behind which the structure and systemsare hidden. While the common mantra is that architectsdesign space the reality is that architects make (draw)surfaces. This privileging of the surface drives the use ofmaterials in two profound ways. First is that the materialis identified as the surface: the visual understanding ofarchitecture is determined by the visual qualities of thematerial. Second is that because architecture issynonymous with surface and materials are thatsurface we essentially think of materials as planar. Theresult is that we tend to consider materials in large two-dimensional swaths: exterior cladding, interiorsheathing. Many of the materials that we do not see, such as insulation or vapor barriers, are still imaginedand configured as sheet products. Even materials thatform the three-dimensional infrastructure of thebuilding, such as structural steel or concrete, can easilybe represented through a two-dimensional picture planeas we tend to imagine them as continuous or monolithicentities. Most current attempts to implement smartmaterials in architectural design maintain the vocabularyof the two dimensional surface or continuous entity andsimply propose smart materials as replacements orsubstitutes for more conventional materials. Forexample, there have been many proposals to replacestandard curtain wall glazing with an electrochromicglass that would completely wrap the building facade.The reconsideration of smart material implementationthrough another paradigm of material deployment hasyet to fall under scrutiny. (Figure 2.93) [Source is: SmartMaterials and New Technologies For the architecture and designprofessions, D. Michelle Addington Daniel L. Schodek. (2005)]
One major constraint that limits our currentthinking about materials is the accepted belief that thespatial envelope behaves like a boundary. We conceiveof a room as a container of ambient air and light that is

Part Two ( C.T.E.C )
bounded or differentiated by its surfaces; we considerthe building envelope to demarcate and separate theexterior environment from the interior environment(Figure 2.94). The presumption that the physicalboundaries are one and the same as the spatialboundaries has led to a focus on highly integrated,multifunctional systems for facades as well as for manyinterior partitions such as ceilings and floors. In 1981,Mike Davieswhich described a facade that could protect from thesun, wind and rain, as well as provide insulation,ventilation and daylight. His image of a wall sectionsandwiching photovoltaic grids, sensor layers, radiatingsheets, micropore membranes and weather skins hasinfluenced many architects and engineers into pursuingtheof double skin systems. This pursuit has also led to a
- that can integrate togetherthe many diverse functions required by the newlycomplex facade. Aerogel (Figure 2.95) has emerged asone of these new dream materials for architects: itinsulates well yet still transmits light; it is extremelylightweight yet can maintain its shape. Many nationalenergy agencies are counting on Aerogel to be alinchpin for their future building energy conservationstrategies, notwithstanding its prohibitive cost, micro-structural brittleness and the problematic of its highinsulating value, which is only advantageous for part ofthe year and can be quite detrimental at other times.[Source is: Smart Materials and New Technologies For thearchitecture and design professions, D. Michelle AddingtonDaniel L. Schodek. (2005)]
4.1.3 Smart System.
Smart Buildings (Figure 2.96), or at leastdiscussion of the concept, originated in the early 1980s.In 1984, for instance, a New York Times articledescribed real estategeneration of buildings that almost think for themselves. . . called intelligent buildings (Figure 2.97) Such a
marriage of twotechnologies-old-fashioned building management and

Part Two ( C.T.E.C )
Smart buildings are not just about installing andoperating technology or technology advancements.Technology and the systems in buildings are simplyenablers, a means to an end. The technology allows usto operate the building more efficiently; to construct thebuildings in a more efficient way, to provide productiveand healthy spaces for the occupants and visitors, toprovide a safe environment, to provide an energy-efficient and sustainable environment (Figure 2.98), andto differentiate and improve the marketability of thebuilding. (Figure 2.99) [Source is: Smart Building Systemsfor Architects, Owners, and Builders, James Sinopoli. (2010)]
A smart building involves the installation anduse of advanced and integrated building technologysystems. These systems include building automation, life safety, telecommunications, user systems, andfacility management systems. Smart buildingsrecognize and reflect the technological advancementsand convergence of building systems, the commonelements of the systems and the additional functionalitythat integrated systems provide. Smart buildingsprovide actionable information about a building orspace within a building to allow the building owner oroccupant to manage the building or space. [Source is:Smart Building Systems for Architects, Owners, and Builders,James Sinopoli. (2010)]
Smart buildings provide the most cost effectiveapproach to the design and the deployment of buildingtechnology systems. The traditional way to design andconstruct a building is to design, install, and operateeach system separately (Figure 2.100). The smartbuilding takes a different approach to designing thesystems. Essentially, one designer designs orcoordinates the design of all the building technologysystems into a unified and consistent constructiondocument. The construction document specifies eachsystem and addresses the common system elements orintegration foundation for the systems. These includecabling, cable pathways, equipment rooms, systemdatabases, and communications protocols betweendevices. The one consolidated design is then installedby a contractor, referred to as a Technology Contractoror as a Master System Integrator.

Part Two ( C.T.E.C )
This process reduces the inefficiencies in thedesign and construction process saving time and money.During the operation of the building, the buildingtechnology systems are integrated horizontally amongall subsystems as well as vertically-that is subsystems tofacility management systems to business systems-
operation to be used by multiple individuals occupyingand managing the building. (Figure 2.101)
Smart buildings are also a critical componentregarding energy usage and sustainability of buildingsand the smart electrical grid. The building automationsystems, such as HVAC control, lighting control, powermanagement, and metering play a major role indetermining the operational energy efficiency of abuilding. The smart electrical grid is dependent onsmart buildings. (Figure 2.102) [Source is: Smart BuildingSystems for Architects, Owners, and Builders, James Sinopoli.(2010)]
In order for a building to be classified as smartbuilding, it should possess a group of features that helpsense, decide and control the different elements andareas of a building. Most of the following featuresshould be included:
Building Management Systems (BMS), it is the
receives all the information from all the sensors anddetermines the appropriate control function orprocedure to be followed in response. It should be ableto control all passive and active systems of the buildingin order to produce the best conditions for the internalenvironment. (Figure 2.103)
Learning Ability, smart system should be ableto learn and anticipate different weather conditions builton historic logging of information. It should be alsoable to learn assess the impact of control strategies andtheir final outcome on the indoor environment.
Environmental Data, real time measurementsof outdoor weather data should be available in orderinteract accordingly. This data should includetemperatures, wind speed, humidity and daylightingvalues. Indoor climate and lighting conditions should

Part Two ( C.T.E.C )
also be monitored and measured. Different kinds ofsensors are used for such systems. They include ( fireand smoke detection, photo optics, access, acceleration,shock and vibration, motion and human presence,temperature, humidity, solar radiation, pressure, light,flow of liquids and gases, air content, moisture,chemical measurement, structural system monitoring,mechanical system monitoring of HVAC system. (Figure 2.104)
Responsive Artificial Lighting, an effectivedaylighting strategy incorporates such a system in orderto dim lights automatically in order to maximize the useof natural daylight, and to compensate for the deficit innatural light by the appropriate amount of light neededit supply the required lighting level according to thetype of activity. Dimming of individual lights couldgenerate a lot more saving in energy consumption.
Daylight Controllers, the maximization of theuse of daylight- as previously mentioned is a mainobjective of smart building. Thus, mechanically andelectrically controlled light guiding, reflecting andshading devices are employed. These depend ondifferent light sensors that detect solar intensity andangle. (Figure 2.105) [Source is: Intelligent skins,Architectural press, Oxford, Michael Wigginton et al. (2003)]
Sun Controllers, sun tracking solar energycollectors and devices are employed. The unwantedeffects of the sun, such as overheating and glare, areaccounted for by controllable, louver, overhangs,internal and external blinds and shading devices. Theyhave ability to be opened, closed and tilted. (Figure2.106)
Occupant Control, it is proven that theoccupants perform better if they feel they have controlover their internal environment. Hence, occupantcontrol should be provided, yet to a limit, as it mightlead to compromising other areas of control andperformance in the building. Thus occupant controlshould be within a limited range, if exceeded, thesystem either warns them, or takes over and does notallow for manual override. [Source is: Intelligent skins,Architectural press, Oxford, Michael Wigginton et al. (2003)
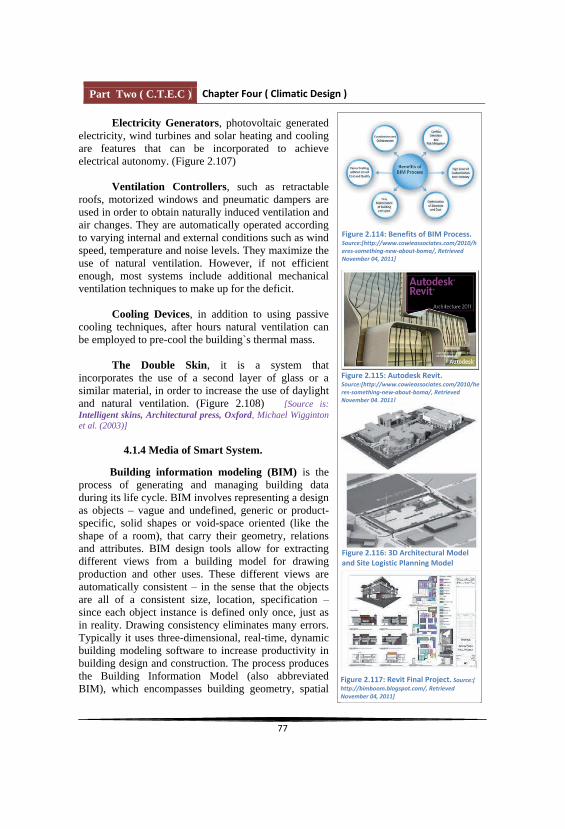
Part Two ( C.T.E.C )
Electricity Generators, photovoltaic generatedelectricity, wind turbines and solar heating and coolingare features that can be incorporated to achieveelectrical autonomy. (Figure 2.107)
Ventilation Controllers, such as retractableroofs, motorized windows and pneumatic dampers areused in order to obtain naturally induced ventilation andair changes. They are automatically operated accordingto varying internal and external conditions such as windspeed, temperature and noise levels. They maximize theuse of natural ventilation. However, if not efficientenough, most systems include additional mechanicalventilation techniques to make up for the deficit.
Cooling Devices, in addition to using passivecooling techniques, after hours natural ventilation canbe employed to pre-cool the building`s thermal mass.
The Double Skin, it is a system thatincorporates the use of a second layer of glass or asimilar material, in order to increase the use of daylightand natural ventilation. (Figure 2.108) [Source is:Intelligent skins, Architectural press, Oxford, Michael Wiggintonet al. (2003)]
4.1.4 Media of Smart System.
Building information modeling (BIM) is theprocess of generating and managing building dataduring its life cycle. BIM involves representing a designas objects vague and undefined, generic or product-specific, solid shapes or void-space oriented (like theshape of a room), that carry their geometry, relationsand attributes. BIM design tools allow for extractingdifferent views from a building model for drawingproduction and other uses. These different views areautomatically consistent in the sense that the objectsare all of a consistent size, location, specificationsince each object instance is defined only once, just asin reality. Drawing consistency eliminates many errors.Typically it uses three-dimensional, real-time, dynamicbuilding modeling software to increase productivity inbuilding design and construction. The process producesthe Building Information Model (also abbreviatedBIM), which encompasses building geometry, spatial

Part Two ( C.T.E.C )
relationships, geographic information, and quantitiesand properties of components. Pieces can carryattributes for selecting and ordering them automatically,providing cost estimates and well as material trackingand ordering. This method of management is morepractical and efficient. It eliminates many of theuncertainties found during the construction phase sincethey can be found during the design phase of the projectand fixed so they do not occur during the actualconstruction phase. Also, any changes duringconstruction will be automatically updated to BIM andthose changes will be made in the model. Modern BIMdesign tools go further. They define objectsparametrically. That is, the objects are defined asparameters and relations to other objects, so that if arelated object changes, this one will also. (Figure 2.109)[Source is: http://Building information modeling - Wikipedia, thefree encyclopedia.mht, Retrieved November 04, 2011.]
Building information modeling covers geometry,spatial relationships, light analysis, geographicinformation, quantities and properties of buildingcomponents (for example manufacturers' details). BIMcan be used to demonstrate the entire building lifecycle, including the processes of construction andfacility operation. Quantities and shared properties ofmaterials can be extracted easily. Scopes of work can beisolated and defined. Systems, assemblies andsequences can be shown in a relative scale with theentire facility or group of facilities. Dynamicinformation of the building, such as sensormeasurements and control signals from the buildingsystems, can also be incorporated within BIM tosupport analysis of building operation and maintenance. (Figure 2.110)
Under the guidance of a virtual design andconstruction project manager (VDC) BIM can beseen as a companion to Product LifecycleManagement (PLM), since it goes beyond geometryand addresses issues such as cost management,Project Management and provides a way to workconcurrently on most aspects of building life cycleprocesses. BIM goes far beyond switching to newsoftware. It requires changes to the definition oftraditional architectural phases and more data sharing
Figure 2.118: Several examplesof how nanoscale materials arecurrently being used.Applications include manyoptical films for light, color, orthermal control; light-emittingdevices (QLEDs); surfaces thatare self-cleaning, antibacterial,or self-healing and that aidpollution reduction; nanofoamsand nanogels for thermalinsulation; solar cells; and a host of applications related tothe strength and stiffness ofmembers
Part Two ( C.T.E.C )
than most architects and engineers are used to. (Figure2.111) [Source is: http://Building information modeling -Wikipedia, the free encyclopedia.mht, Retrieved November 04,2011.]
BIM is able to achieve such improvements bymodeling representations of the actual parts and piecesbeing used to build a building. This is a substantial shiftfrom the traditional computer aided drafting method ofdrawing with vector file-based lines that combine torepresent objects.
The interoperability requirements of constructiondocuments include the drawings, procurement details,environmental conditions, submittal processes and otherspecifications for building quality. It is anticipated byproponents that VDC utilizing BIM can bridge theinformation loss associated with handing a project fromdesign team, to construction team and to buildingowner/operator, by allowing each group to add to andreference back to all information they acquire duringtheir period of contribution to the BIM model. (Figure2.112) [Source is: http://Building information modeling -Wikipedia, the free encyclopedia.mht, Retrieved November 04,2011.]
The American Institute of Architects has furtherdefined BIM as "a model-based technology linked witha database of project information", and this reflects thegeneral reliance on database technology as thefoundation. In the future, structured text documentssuch as specifications may be able to be searched andlinked to regional, national, and international standards.(Figure 2.113)
A building information model can be used forthe following purposes:
Visualization: 3D renderings can be easilygenerated in-house with little additional effort. Fabrication/shop drawings: it is easy to generateshop drawings for various building systems, forexample, the sheet metal ductwork shop drawingcan be quickly produced once the model iscomplete. Code reviews: fire departments and otherofficials may use these models for their review
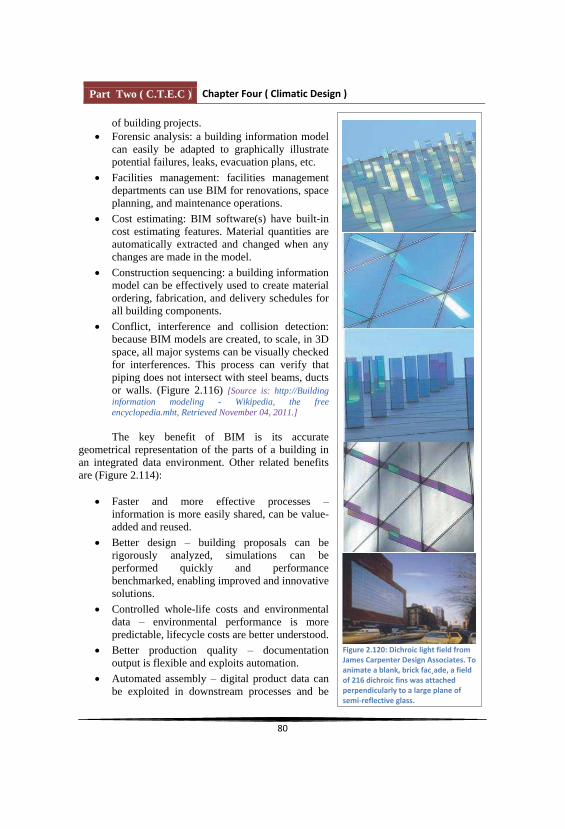
Part Two ( C.T.E.C )
of building projects. Forensic analysis: a building information modelcan easily be adapted to graphically illustratepotential failures, leaks, evacuation plans, etc.
Facilities management: facilities managementdepartments can use BIM for renovations, spaceplanning, and maintenance operations.
Cost estimating: BIM software(s) have built-incost estimating features. Material quantities areautomatically extracted and changed when anychanges are made in the model.
Construction sequencing: a building informationmodel can be effectively used to create materialordering, fabrication, and delivery schedules forall building components.
Conflict, interference and collision detection:because BIM models are created, to scale, in 3Dspace, all major systems can be visually checkedfor interferences. This process can verify thatpiping does not intersect with steel beams, ductsor walls. (Figure 2.116) [Source is: http://Buildinginformation modeling - Wikipedia, the freeencyclopedia.mht, Retrieved November 04, 2011.]
The key benefit of BIM is its accurategeometrical representation of the parts of a building inan integrated data environment. Other related benefitsare (Figure 2.114):
Faster and more effective processesinformation is more easily shared, can be value-added and reused.
Better design building proposals can berigorously analyzed, simulations can beperformed quickly and performancebenchmarked, enabling improved and innovativesolutions.
Controlled whole-life costs and environmentaldata environmental performance is morepredictable, lifecycle costs are better understood.
Better production quality documentationoutput is flexible and exploits automation.
Automated assembly digital product data canbe exploited in downstream processes and be

Part Two ( C.T.E.C )
used for manufacturing/assembling of structuralsystems.
Better customer service proposals are betterunderstood through accurate visualization.
Lifecycle data requirements, design,construction and operational information can beused in facilities management.
Autodesk Revit Architecture (Figure 2.115)often referred to as simply Revit is a BuildingInformation Modeling software developed byAutodesk. Revit Architecture, for architects andbuilding designers (formerly Revit Building). TheAutoCAD Revit Architecture Suite includes RevitArchitecture, AutoCAD, and AutoCAD Architecture.An AutoCAD Revit Architecture Visualization Suitealso adds 3ds Max Design and Navisworks Review.(Figure 2.117) [Source is: http://Building information modeling- Wikipedia, the free encyclopedia.mht, Retrieved November 04,2011.]
4.2 Smart Materials.
4.2.1 Materials and architecture
The relationship between architecture andmaterials had been fairly straightforward until theIndustrial Revolution. Materials were chosen eitherpragmatically for their utility and availability orthey were chosen formally for their appearance andornamental qualities. Locally available stone formedfoundations and walls, and high-quality marbles oftenappeared as thin veneers covering the roughconstruction. Decisions about building and architecturedetermined the material choice, and as such, we canconsider the pre-19th century use of materials in designto have been subordinate to issues in function and form.Furthermore, materials were not standardized, sobuilders and architects were forced to rely on anextrinsic understanding of their properties andperformance. In essence, knowledge of materials wasgained
those who had acquired that knowledgeand the skills necessary for working with availablematerials, often through (Figure

Part Two ( C.T.E.C )
2.118) [Source is: Smart Materials and New Technologies Forthe architecture and design professions, D. Michelle AddingtonDaniel L. Schodek. (2005)]
The role of materials changed dramatically withthe advent of the Industrial Revolution. Rather thandepending on an intuitive and empirical understandingof material properties and performance, architects beganto be confronted with engineered materials. Indeed, thehistory of modern architecture can almost be viewedthrough the lens of the history of architectural materials.Beginning in the 19th century with the widespreadintroduction of steel, leading to the emergence of long-span and high-rise building forms, materialstransitioned from their pre-modern role of beingsubordinate to architectural needs into a means toexpand functional performance and open up new formalresponses. The industrialization of glass-makingcoupled with developments in environmental systems
which a transparentarchitecture could be sited in any climate and in anycontext. The broad proliferation of curtain wall systemsallowed the disconnection of the facade material from
material choice from utilitade could become a purely formal element. Through
advancements in CAD/CAM (Computer AidedDesign/Computer Aided Manufacturing) technologies,engineering materials such as aluminum and titaniumcan now be efficiently and easily employed as buildingskins, allowing an unprecedented range
ades and forms. Materials have progressivelyemerged as providing the most immediately visible andthusrepresentation, both interior and exterior. As a result,
often think of materials as part of adesign palette from which materials can be chosen andapplied as compositional and [Source is:Smart Materials and New Technologies For the architecture anddesign professions, D. Michelle Addington Daniel L. Schodek.(2005)]
It is in this spirit that many have approached theuse of smart materials. Smart materials are oftenconsidered to be a logical extension of the trajectory inmaterials development toward more selective and

Part Two ( C.T.E.C )
specialized performance. For many centuries one had to accept and work with theproperties of a standard material such as wood or stone, designing to accommodate the
20th century one could begin to select orengineer the properties of a high performance material to meet a specifically defined need.Smart materials allow even a further specificity their properties are changeable and thusresponsive to transient needs. For example, photochromic materials change their color (theproperty of spectral transmissivity) when exposed to light: the more intense the incidentlight, the darker the surface. This ability to respond to multiple states rather than beingoptimized for a single state has rendered smart materials a seductive addition to the designpalette since buildings are always confronted with changing conditions. As a result, we arebeginning to see many proposals speculating on how smart materials could begin to replacemore conventional building materials. (Figure 2.119)
Cost and availability have, on the whole, restricted widespread replacement ofconventional building materials with smart materials, but the stages of implementation aretending been introducedinto architecture: initially through highly visible showpieces (such as thermochromic chairbacks and electrochromic toilet stall doors) and later through high
Brasserie Restaurant on the ground floor of Mies vander imagine building surfaces,walls and fac¸ades composed entirely of smart materials, perhaps automatically enhancingtheir design from a pedestrian box to an interactive arcade. Indeed, terms like interactivityand transformability have eveninsofar as the necessary materials and technologies are far beyond the economic andpractical reality of most building projects.
Rather than waiting for the cost to come down and for the material production toshift from lots weighing pounds to those weighing tons, we should step back and ask if weare ignoring some of the most important characteristics of these materials. Architects haveconceptually been trying to fit smart materials into their normative practice alongsideconventional building materials. Smart materials, however, represent a radical departurefrom the more normative building materials. Whereas standard building materials are staticin that they are intended to withstand building forces, smart materials are dynamic in thatthey behave in response to energy fields. This is an important distinction as our normalmeans of representation in architectural design privileges the static material: the plan,section and elevation drawings of orthographic projection fix in location and in view thephysical components of a building. One often designs with the intention of establishing animage or multiple sequential images. With a smart material, however, we should befocusing on what we want it do, not on how we want it to look. The understanding of smartmaterials must then reach back further than simply the understanding of material properties;one must also be cognizant of the fundamental physics aninteractions with its surrounding environment. The purpose of this book is thus two-fold:the development of a basic familiarity with the characteristics that distinguish smartmaterials from the more commonly used architectural materials, and speculation into thepotential of these characteristics when deployed in architectural design. (Figure 2.120)

Part Two ( C.T.E.C )
[Source is: Smart Materials and New Technologies For the architecture and design professions, D.Michelle Addington Daniel L. Schodek. (2005)]
4.2.2 Characteristics of smart materials
without precisely definingwhat we mean. Creating a precise definition, however, is surprisingly difficult. The term isalready in wide use, but there is no general agreement about what it actually means. Aquick review of the literaturealmost interchangeably by many in relation to materials and systems, while others drawsharp distinctions about which qualities or capabilities are implied. NASA defines smart
can conform to them whena definition that clearly gives an indication as to how NASA
intends to investigate and apply them. A more sweeping definition comes from theEncyclopedia of Chemicalthat sense environmental events, process that sensory information, and then act on the
these two definitions seem to be referring to the same type ofbehavior, they are poles apart. The first definition refers to materials as substances, and assuch, we would think of elements, alloys or even compounds, but all would be identifiableand quantifiable by their molecular structure. The second definition refers to materials as aseries of actions. Are they then composite as well as singular, or assemblies of manymaterials, or, even further removed from an identifiable molecular structure, an assembly ofmany systems? (Figure 2.121)
may find some cues to helpimplies notions of an informed or
knowledgeable response, with associated qualities of alertness and quickness. In commonusage, there is also frequently an association with shrewdness, connoting an intuitive orintrinsic response. Intelligent is the ability to acquire knowledge, demonstrate goodjudgment and possess quickness in understanding. (Figure 2.122) [Source is: Smart Materialsand New Technologies For the architecture and design professions, D. Michelle Addington Daniel L.Schodek. (2005)]
Interestingly, these descriptions are fairly suggestive of the qualities of many of thesmart materials that are of interest toindeed suggest materials that have intrinsic or embedded quick response capabilities, and,while one would not commonly think about a material as shrewd, the implied notions ofcleverness and discernment in response are not without interest. The idea of discernment,for example, leads one to thinking about the inherent power of using smart materialsselectively and strategically. Indeed, this idea of a strategic use is quite new to architecture,as materials in our field are rarely thought of as performing in a direct or local role.Furthermore, selective use hints at a discrete response a singular action but notnecessarily a singular material. Underlying, then, the concept of the intelligent anddesigned response is a seamless quickness immediate action for a specific and transientstimulus. [Source is: Smart Materials and New Technologies For the architecture and designprofessions, D. Michelle Addington Daniel L. Schodek. (2005)]
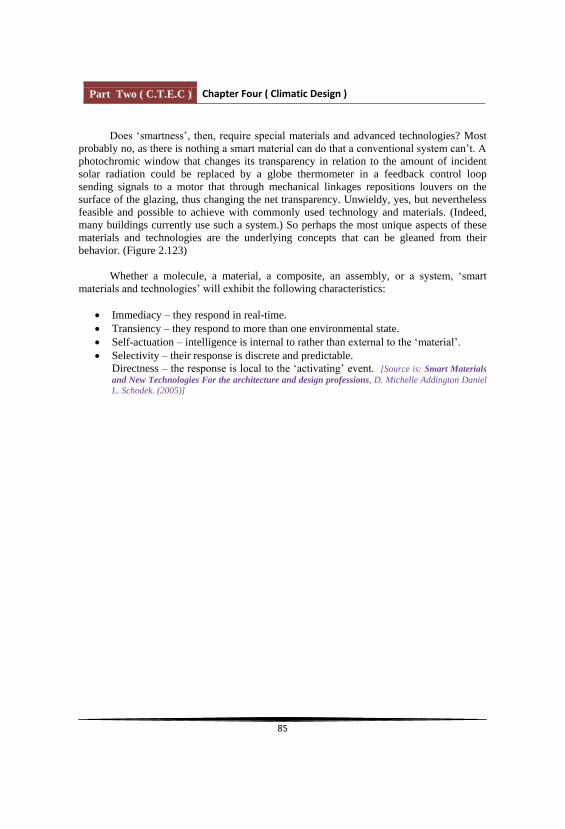
Part Two ( C.T.E.C )
advanced technologies? Mostprobably no, as there is nothingphotochromic window that changes its transparency in relation to the amount of incidentsolar radiation could be replaced by a globe thermometer in a feedback control loopsending signals to a motor that through mechanical linkages repositions louvers on thesurface of the glazing, thus changing the net transparency. Unwieldy, yes, but neverthelessfeasible and possible to achieve with commonly used technology and materials. (Indeed,many buildings currently use such a system.) So perhaps the most unique aspects of thesematerials and technologies are the underlying concepts that can be gleaned from theirbehavior. (Figure 2.123)
Whether a molecule, a material, a composite, an assembly,following characteristics:
Immediacy they respond in real-time.Transiency they respond to more than one environmental state.Self-actuation intelligence is internal to rather thanSelectivity their response is discrete and predictable.Directness [Source is: Smart Materialsand New Technologies For the architecture and design professions, D. Michelle Addington DanielL. Schodek. (2005)]

Part Two ( C.T.E.C )
4.2.3 Examples of Smart Materials
FACADE SYSTEMS
THE SMART WINDOW:
any system that purports to have an interactive orswitchable surface, regardless of whether that surface isa real or virtual window, interior or exterior. For thepurposes of this book, we will consider the virtualwindows to fall into the category of large paneldisplays, and concentrate our discussion on exteriorglazing and interior partitions. (Figure 2.124)
more of the following functions:
Control of optical transmittance. A shift in thetransparency (the optical density) of thematerial may be used to manage the incidentsolar radiation, particularly in the visual andnear ultraviolet wavelengths. The windowwould vary from high density (opaque ortranslucent) for the prevention of direct sunpenetration and its associated glare to lowdensity (transparent) as incident light losesintensity.
Control of thermal transmittance. This is asimilar function to that above, but thewavelengths of interest extend into the nearinfrared region of the spectrum. Heattransmission by radiation can be minimizedwhen appropriate (summer) and maximized forother conditions. (Figure 2.125) [Source is: SmartMaterials and New Technologies For the architectureand design professions, D. Michelle Addington Daniel L.Schodek. (2005)]
Control of thermal absorption. Transparencyand conductivity tend to correlate with eachother, but are relatively independent of theincident radiation. Whenever the insidetemperature is higher than the outsidetemperature, a bidirectional heat flow isestablished: radiant energy transfers in, while

Part Two ( C.T.E.C )
thermal energy transfers out. Altering theabsorption of the glazing will ultimately affectthe net conductivity, and thus can shift thebalance in favor of one or the other direction.
Control of view. The use of switchablematerials to control view is currently the fastestgrowing application of smart materials in abuilding. Interior panels and partitions thatswitch from transparent to translucent allowlight to transmit, but are able to moderate theview by altering the specularity of the material.Exterior store fronts can reveal merchandise inwindows selectively, perhaps only when thestore is open. A specular material will transmitintact images, whereas a diffuse material willobscure the image.
LIGHTING SYSTEMS
FIBER-OPTIC LIGHTING:
The use of fiber-optics for illumination,however, demands a radical shift in the way one thinksabout lighting. Each optical cable will emit a fraction ofthe light emitted from a more typical lamp, but the lightcan be more productive. Ambient lighting systems fallprey to inverse square losses, the intensity drops offwith the square of the distance. The light-emitting endof the fiber-optic can be placed almost anywhere, andthus can be quite close to the object or surface beingilluminated. The tiny amount of light emitted maydeliver the same lumens to the desired location as lightbeing emitted from a ceiling fixture at more than anorder of magnitude greater intensity. Contrast can alsobe locally and directly controlled. As we can see, then,fiber-optic lighting possesses two of the importantcharacteristics of smart materials they are direct andselective. (Figure 2.126) [Source is: Smart Materials andNew Technologies For the architecture and design professions,D. Michelle Addington Daniel L. Schodek. (2005)]
Fiber-optic lighting offers other advantages overconventional systems. The source of light is remote incomparison to where it is delivered. As a result, the heat
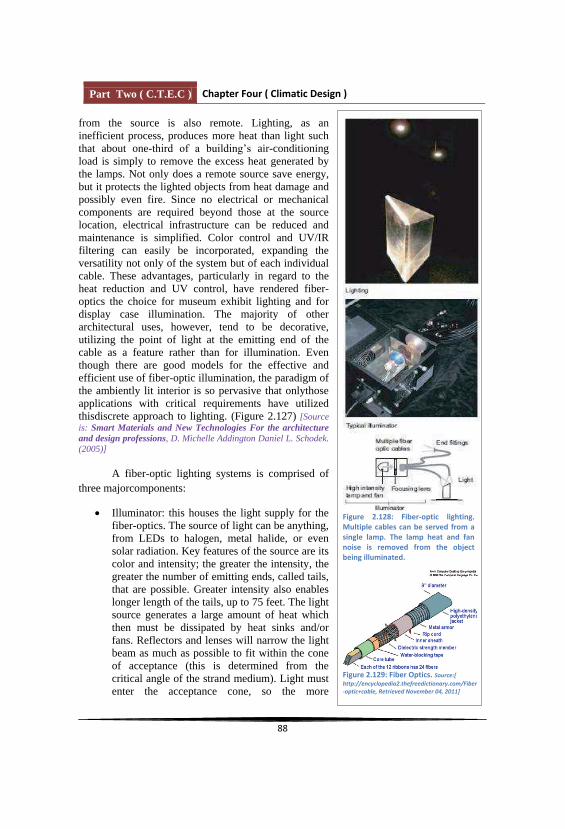
Part Two ( C.T.E.C )
from the source is also remote. Lighting, as aninefficient process, produces more heat than light suchthat about one- air-conditioningload is simply to remove the excess heat generated bythe lamps. Not only does a remote source save energy,but it protects the lighted objects from heat damage andpossibly even fire. Since no electrical or mechanicalcomponents are required beyond those at the sourcelocation, electrical infrastructure can be reduced andmaintenance is simplified. Color control and UV/IRfiltering can easily be incorporated, expanding theversatility not only of the system but of each individualcable. These advantages, particularly in regard to theheat reduction and UV control, have rendered fiber-optics the choice for museum exhibit lighting and fordisplay case illumination. The majority of otherarchitectural uses, however, tend to be decorative,utilizing the point of light at the emitting end of thecable as a feature rather than for illumination. Eventhough there are good models for the effective andefficient use of fiber-optic illumination, the paradigm ofthe ambiently lit interior is so pervasive that onlythoseapplications with critical requirements have utilizedthisdiscrete approach to lighting. (Figure 2.127) [Sourceis: Smart Materials and New Technologies For the architectureand design professions, D. Michelle Addington Daniel L. Schodek.(2005)]
A fiber-optic lighting systems is comprised ofthree majorcomponents:
Illuminator: this houses the light supply for thefiber-optics. The source of light can be anything,from LEDs to halogen, metal halide, or evensolar radiation. Key features of the source are itscolor and intensity; the greater the intensity, thegreater the number of emitting ends, called tails,that are possible. Greater intensity also enableslonger length of the tails, up to 75 feet. The lightsource generates a large amount of heat whichthen must be dissipated by heat sinks and/orfans. Reflectors and lenses will narrow the lightbeam as much as possible to fit within the coneof acceptance (this is determined from thecritical angle of the strand medium). Light mustenter the acceptance cone, so the more

Part Two ( C.T.E.C )
collimated the source, the more efficient thetransformation will be. Color wheels and otherfilters are often included in the illuminator tocreate special lighting effects or eliminateunwanted UV. Electronic controls, includingballasts and dimmers, are also housed in theilluminator. (Figure 2.128) [Source is: SmartMaterials and New Technologies For the architectureand design professions, D. Michelle Addington Daniel L. Schodek. (2005)]
Cable or harness: fiber-optics for lighting areeither solid core or stranded fiber, both of whichare bundled into cable form and sheathed with aprotective covering. (No cladding is used.) Theemitting end will most likely be split intomultiple tails, each one providing distinctillumination, while the source end will be boundas a single cable and connected into a coupler,which is then connected to the illuminator. Theentire cable assembly, including the coupler, isreferred to as a harness. (Figure 2.129)
End fittings: for end emitters, the tail ends willneed to be secured or mounted in some manner,and the primary purpose of the end fittings,which are usually threaded, is to allow this. Thefittings can also house individual lenses andfilters so that the light emitted from each tailend can be controlled separately.
ENERGY SYSTEMS
PHOTOVOLTAICS:
Photovoltaics were essentially the provenance ofNASA until about two decades ago when large-scalephotovoltaic generating facilities were first built.(Figure 2.130) The high cost and low efficiency ofthese facilities prevented their widespread adoption asit was more effective to use the solar energy to producesteam in an intermediate step rather than to produceelectricity directly. Concurrently, PVs as replacements

Part Two ( C.T.E.C )
for batteries began emerging in small products such ascalculators and watches. Although PVs were commonlyused in remote areas to power villages, houses and evenoffshore platforms without an electrical supply, theydid not gain favor in grid-connected buildings until theelectrical industry was deregulated. Through its
US Department of Energy (Figure 2.131) has beenencouraging, and rewarding (through tax credits), thewidespread privatization of grid-connected PVs.Relieving the utilities of the high investment burden ofmoving to carbonfree generation, the push for building-scale distributed PVs was also intended to speed up the
-
(Figure 2.132) [Source is: SmartMaterials and New Technologies For the architecture and designprofessions, D. Michelle Addington Daniel L. Schodek. (2005)]
Some basic understanding about PV operation isneeded before the decision is made to install a system. A typical photovoltaic cell produces about 2 watts. Thecells are connected in series to form modules, and themodules are connected in parallel to form arrays. Seriesconnection is necessary to build up to an adequateoperational voltage, but it is then vulnerable to any
weak link in the connection. If individual cells in themodules are unevenly illuminated, perhaps due toshading from trees or dirt accumulation, the unlit cellswill dissipate the power produced by the illuminatedcells. Night-time causes a problem as well, blockingdiodes are necessary to prevent PV systems fromdrawing electricity when they are not illuminated, butnot without a penalty. The penalty is an output powerloss. As a result, the efficiency of the module isapproximately 20 25% (this is before one even takesthe PV cell efficiency into account) Thin filmtechnologies are not subject to inter-cell losses as theyare manufactured directly as modules, but they stillsuffer the inverter and transformer losses. (Figure2.133) (Figure 2.134) [Source is: Smart Materials and NewTechnologies For the architecture and design professions, D.Michelle Addington Daniel L. Schodek. (2005)]

Part Two ( C.T.E.C )
Part Two Conclusion
This part provides a broad review of previous work in part two like the architecturetrends and its goals to reach to sustainability solutions serving the environment friendly. We will find out that all of these schools aim to reducing the co2 emissions which increasethe negative effects of global warming, and aim also to using clean energy in buildings andin the design methods of these schools to serve the envirnoment and substituting theelectricity; the non renewable energy; which harm the envirnoment. These new techniques
ansforming it to usableenergy so all the kind of buildings either residential, commercial or offices can depend onit. And also all other types, and the architrcture schools. This is answer one of theimportant questions which aim to answer this message:
How Can Nanoarchitecture reduce the global warming?What are the techniques that can reduce global warming?
The answer of these two important questions appears through different aspects asfollows:
First aspect: focusing on the designing and architectural aspects and new schools
primary stages of the design process so introducing new architectural trends aim toreducing the global warming effects.
Second aspect:and its different forms in the design process and relying on it as new architecturalprocessing techniquies providing substuiting solutions for the petrolum energy, andcoal energy which harm the environment. Throug using these techniquies, it will bepossible to reduce the negative effects resulting from using the petrolum energy andthe coal energy.
Third aspect: one of the common points between all of these schools and different
ligting system, artifical lighting system, water feeding system, water treatment, and
using and dependancy of clean, renewable, and carbon free energy.
Forth aspect: the role of specialist entities in assessing or evaluating the buildingperformance, effectiveness, its role in preserving the environment, its impact on thesurrounding environment, its caused damages, and its clean energy usage

Part Two ( C.T.E.C )
percentage that protect tenjoy independency and international recognitionaim to preserve the environmentand reducing the harmful gases emissions of buildings and construction sector byassessing or evaluating building performance, and the different systems in thebuilding such as the effectiveness of the natural lighting system in reducing the useof electricity lighting, converting or transforming solar lighting produced by solarcells to clean energy, building redirecting to receive the largest sunlight amount inthe interior spaces, and to store the largest sunlight amount via through the solarcells.
Fifth aspect: beside to the new technologies of the clean energy, there are also thesmart materials which have the ability to respond to different environmentalchanges. Some of these materials are for the external usage such as for externallayer for the building to prevent the transmission of the harmful environmentalchanges inside the building. Also it can absorb all the useful environmentalcharacteristics which could be helpful inside the building such as the smartwindows which works to prevent the heat transmission into the building, harmfulrays and transmit only the useful sunlight rays. All of this can be applied through itscharacteristics which resist the harmful rays and absorb the useful one. Also it cancontrol the light amount entered in the space without being glare or darkness.
The introduction of a system for green building assessment and rating is consideredto be one of the cornerstones of promoting sustainable green building development. Forexample, in 1990 the Building Research Establishment in the UK introduced the BuildingResearch Establishment Environmental Assessment Method (BREEAM) and several yearslater, the United States Green Building Council launched its LEED (Leadership in Energyand Environmental Design) system. Many other countries have followed suit. There isincreasing evidence from these countries that owners, investors and the public are startingto place a premium on certified green buildings. In response to the need for an Egyptiangreen building assessment system, and with the benefit of the experiences of early-adoptersin other countries, the Housing and Building National. The concept of green buildingobserves important criteria which secure the attainment of the required quality andefficiency of buildings. It covers guidance, location preparation and careful study, consideration of optimal methods for water consumption including recycling of used waterfor other industrial and agricultural purposes, studies on lighting, air conditioning, naturalventilation and the renewable energy sources such as the solar and wind energy systems.These technologies now exist, but it is crucial that they are promoted.

Part Two ( C.T.E.C )
The change of the material properties directs us toward nanotechnology which helpsin identifying and reaching the different properties of materialswhich serve our needs likein smart materials. Also the useful characteristics of materials help the building to achievethe highest effectiveness in the surrounding environment and in the interior spaces throughcreating internal smart environments. Also the smart material integrate with the modernsystems of clean energy to reach to the highest level of building efficiency and performancewhich happens only through using the modern systems and smart materials to achieve thefollowing equations:
Clean energy system + smart materials = high efficiency building
Hence, the role of nanotechnology in serving the nanoarchitecture becomes clearerin reaching to useful and smart properties of materials contributing in modern architecture;its main aim to reach to the highest level of efficiency of a friendly environment buildingand significathe old systems using petroleum and coal energy which harm the environment andsubstituting it with new clean techniques and systems reducing the energy consumptionenhance energy saving and carbon free.
The next part or chapter will present different forms to reduce the gas emissions andfacing the global warming using a package of different methods through usingnanotechnology and nano-science, its importance to nanoarchitecture, and nanoarchitecturerole to control this phenomenon.

Part Three ( N &G.W)Chapter Five (Nanotechnology and Nanoscience as FutureSolution )
Part Three: Nanoarchitecture and Global Warming Solution.
Introduction
Chapter Five: Nanotechnology Solution
5.1 Nanotechnology and Nanoscience as future Solution:
5.1.1 Environmental Benefits and Impacts.
5.1.2. Reduction of pollution in the production of materials.
5.1.3. Reduction of pollution in construction, use and demolition.
5.2 Futures Solutions:
5.2.1. Materials for Global Warming.
5.2.2. Sensors and Smart Electronic.
5.2.3. How Recycling can help stop Global Warming.
5.2.4. Nanotechnology centers in the Arab world.
Chapter Six: Futuristic Thinking
6.1 Architecture Applications:
6.1.1. Nano House.
6.1.2. Nano Studio.
6.1.3. Carbon Tower.
6.1.4 Bahrain World Trade Center.
6.2 Futuristic thinking of zero carbon urban settlement: ( zero carbon infrastructure and architecture )
6.2.1. Masder city.
6.2.2. Energy Island.

Part Three ( N &G.W)Chapter Five (Nanotechnology and Nanoscience as FutureSolution )
6.3 Futuristic thinking Nano zero carbon settlement:( nano zero carbon infrastructure and architecture )
6.3.1. Nano-city India.
6.3.2. Nano-Polis China.
6.4 Case Study (Reading Area in Bibliotheca Alexandrina) 6.4.1. Background of Case Study.
6.4.2. Concept of Study.
6.4.3. Analysis of Case Study
6.4.4. New Design with Nanomaterials.
Part Three Conclusion.

Part Three ( N &G.W)Chapter Five (Nanotechnology and Nanoscience as FutureSolution )
Part Three: Nanoarchitecture and Global Warming Solution.
Introduction
Based on the previously part mentionedaddressed the Contemporary architecture trends tominimize the damaging effects resulting building sectorthrough different directions which its main purpose toreduce the causes of the global warming, its benefits forthe surrounding environment, and building emissionsrates. As well as the friendly buildings measurementsystems of different environment which has strictstandards to maximize the effiency of the buildingswithout maximize its harmful emissions. This part willintroduce the nanotechnology and nanoscience solutionfor global warming. (Figure 3.1) (Figure 3.2)
The strategy of cleaner production is one of thelatest findings of the environmental thought in the lasttwo decades, extending this strategy to reduceconsumption of resources significant reduction, to avoidthe use of hazardous substances are highly toxic orharmful to the environment as possible, and raise theefficiency of product design and production methods toachieve these goals , then the reduction of greenhousegas emissions and discharges and waste during theproduction process and recycling of waste, and hascaused a Nanotech tremendous progress in cleanerproduction technology represented by the reduction ofindustrial waste and then dispose of industrialpollution.[Source is:http://drkhaledkassem.blogspot.com/2011/05/blog-post_12.html ,Retrieved 20 November, 2011.]
The work in this part consists of two chapters:
First it deals mainly with Nanotechnology andNanoscience solution for global warming byexplain Environmental Benefits and Impacts of

Part Three ( N &G.W)Chapter Five (Nanotechnology and Nanoscience as FutureSolution )
using nanomaterials in building construction, theway of Reduction of pollution in the productionof materials and Reduction of pollution inconstruction, use and demolition.3- SmartMaterials. After that we review the futuresolutions like Materials for Global Warming,Sensors and Smart Electronic. At the end of thischapter we will discuss How Recycling can helpstop Global Warming. All this trial foranswering important questions: HowNanoarchitecture can reduce the globalwarming? Why Nanomaterials is helpful thanmicro? What is the techniques which can reduceglobal warming? (Figure 3.3) (Figure 3.4) Itseems like more and more Arab countriesacknowledge the importance and potential ofnanotechnology to address the three mostfundamental development challenges facing theArab world, which include: ensuring adequatesupplies of water energy, and food Thus, thereis no wonder that that two first majorenvironmental projects applying nanotechnologyhave to do with desalination and purification ofwater. This acknowledgment of the importanceof nanotechnology to the Arab world will, mostprobably, result in more research centersestablished in all the Arab countries and in moreenvironment projects launched usingnanotechnology. In order to cover theknowledge gap with the West, jointnanotechnology research centers and projectshave been launched in collaboration withforeign companies and research centers, whichalready have the needed knowledge innanotechnology [Source is:http://translate.google.com.eg/translate,nanotechnology-and-the-environment-in-the-arab-world,Retrieved 20November, 2011.]
Second it summarizes the Nanoarchitecture andGlobal Warming Solution in three points, firstpoint is Global Warming Problem. Second pointis Problem Negative Effect on human andenvironment. Third point is Urban Society in

Part Three ( N &G.W)Chapter Five (Nanotechnology and Nanoscience as FutureSolution )
Europe. At the end of this chapter we will discuss Example of Europe Solution likeEnergy Island, Zero Carbon City, Fibro City and Tianjin Eco- City. (Figure 3.5, 3.6,3.7, 3.8, 3.9)
Finally, we will find the conclusion of part Three which we reach after first andsecond part and explain relationship between Part Three and Four.
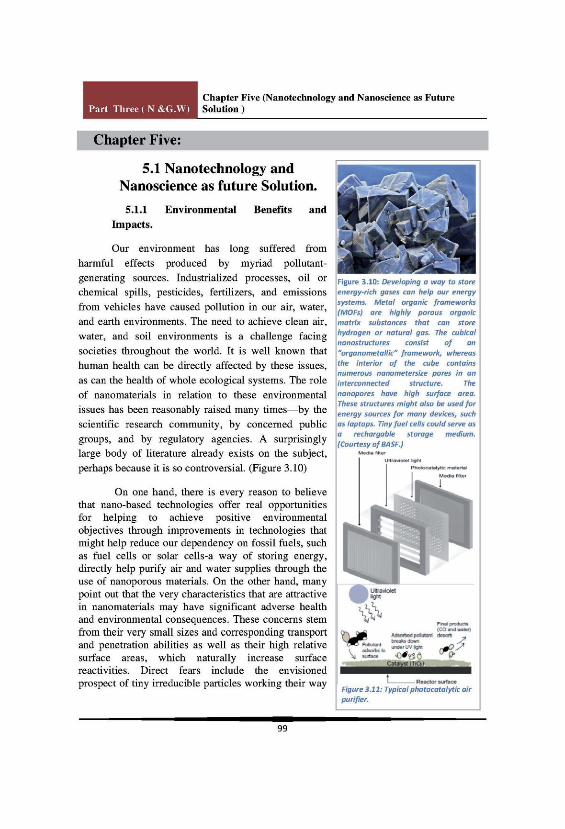

Part Three ( N &G.W)Chapter Five (Nanotechnology and Nanoscience as FutureSolution )
into not only the air environment but into water suppliesand soils as well and hence even into our foodsupplies. (Figure 3.11) [Source is: Nanomaterials, Nanotechnologies And Design, Mike Ashby, Paulo Ferreira andDaniel Schodek, (2009)]
It was observed that human health undoubtedlycan and will benefit enormously from the use ofnanomaterials in medicine and the general field oftreatment, including pharmaceutical applications, but atthe same time it was clear that if wrongly used, healthrisks can develop. Certainly it is well known that thereare problematic health effects associated with tinyparticulates in the air that are associated with airpollution, and that nanoparticulates can be even smaller.Findings of whether deleterious effects occur because ofskin penetration were noted as being less clear. Caution,careful use, and further testing were advised. [Source is:Nanomaterials, Nanotechnologies And Design, Mike Ashby,Paulo Ferreira and Daniel Schodek, (2009)]
Some Reducing Environmental Impacts:
General Source ReductionsGeneral Remediation and TreatmentEnvironmental MonitoringWater Cleaning and Purification (Figure3.12,13)Air Cleaning and PurificationSoil Remediation
The benefits of improved production processescan be very high. A case in point that has attractedconsiderable interest is the use of nanoparticles inconcrete mixes used in massive quantities inconstruction. It has been found that the production ofcement accounts for between 5% and 10% of the
total carbon dioxide emissions, a figure thatwill probably surprise most readers. A research team
durability lie inthe way that particles in concrete are organized, thus


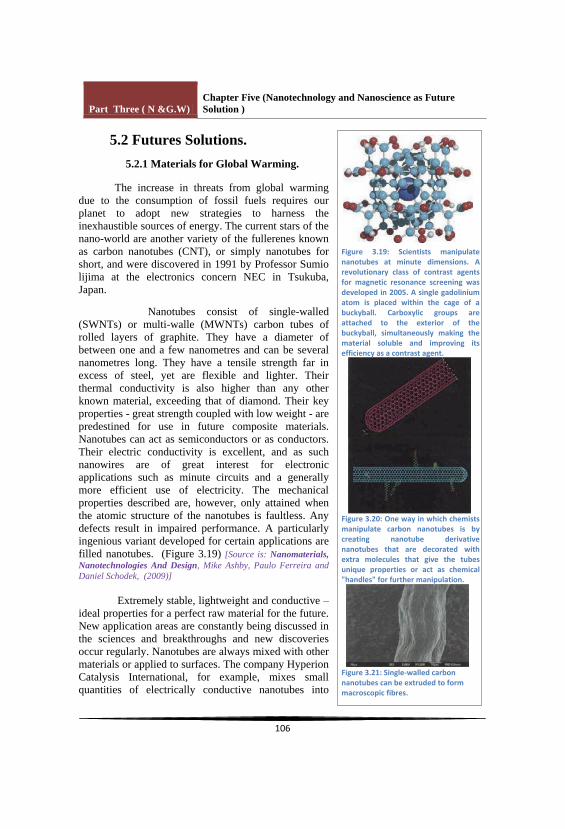
Part Three ( N &G.W)Chapter Five (Nanotechnology and Nanoscience as FutureSolution )
5.2 Futures Solutions.
5.2.1 Materials for Global Warming.
The increase in threats from global warmingdue to the consumption of fossil fuels requires ourplanet to adopt new strategies to harness theinexhaustible sources of energy. The current stars of thenano-world are another variety of the fullerenes knownas carbon nanotubes (CNT), or simply nanotubes forshort, and were discovered in 1991 by Professor Sumiolijima at the electronics concern NEC in Tsukuba,Japan.
Nanotubes consist of single-walled(SWNTs) or multi-walle (MWNTs) carbon tubes ofrolled layers of graphite. They have a diameter ofbetween one and a few nanometres and can be severalnanometres long. They have a tensile strength far inexcess of steel, yet are flexible and lighter. Theirthermal conductivity is also higher than any otherknown material, exceeding that of diamond. Their keyproperties - great strength coupled with low weight - arepredestined for use in future composite materials.Nanotubes can act as semiconductors or as conductors.Their electric conductivity is excellent, and as suchnanowires are of great interest for electronicapplications such as minute circuits and a generallymore efficient use of electricity. The mechanicalproperties described are, however, only attained whenthe atomic structure of the nanotubes is faultless. Anydefects result in impaired performance. A particularlyingenious variant developed for certain applications arefilled nanotubes. (Figure 3.19) [Source is: Nanomaterials,Nanotechnologies And Design, Mike Ashby, Paulo Ferreira andDaniel Schodek, (2009)]
Extremely stable, lightweight and conductiveideal properties for a perfect raw material for the future.New application areas are constantly being discussed inthe sciences and breakthroughs and new discoveriesoccur regularly. Nanotubes are always mixed with othermaterials or applied to surfaces. The company HyperionCatalysis International, for example, mixes smallquantities of electrically conductive nanotubes into

Part Three ( N &G.W)Chapter Five (Nanotechnology and Nanoscience as FutureSolution )
plastics to facilitate electrostatic discharge. Plastics arelikewise mixed with nanotubes to improve theirmechanical properties considerably. (Figure 3.20)(Figure 3.21)
The development of nanotubes is continuallybeing optimised. The cost for their production has fallensignificantly since the initial high cost of manufacture. The company Carbon Nanotechnologies Inc., foundedby Richard Smalley, one of the discoverers of thebuckyball, produces nanotubes in large quantities. TheFrontier Carbon Corporation FCC, founded in 2001 inTokyo, produces fullerenes including nanotubes in vastquantities (1500 t per annum). With the development ofthe so-called "Baytubes" method (developed in 2005 byBayer MaterialScience AG in cooperation with BayerTechnology Services GmbH in Germany), high-qualitynanotubes can now be produced much more cheaplyand in large quantities. Similarly, the NASA recentlydeveloped a method for the cost-effective massproduction of nanotubes. (Figure 3. 21) [Source is:Nanomaterials, Nanotechnologies And Design, Mike Ashby,Paulo Ferreira and Daniel Schodek, (2009)]
Although nanotubes can now be producedcomparatively economically, they are still too expensivefor use in large quantities, for example as additives forconcrete. In order to be practical for the mass market, itis essential that they are to be obtained not only at aconsistently high quality and secured availability butalso at a sufficiently low price. Before the production ofnanotubes can become feasible for the mass market, itmust also overcome some hurdles with regard to purity.Nevertheless, it seems as if it is only a matter of timebefore these problems will be overcome. From then on, the way is paved for highly stable materials for theconstruction of bridges (e.g. ultra-strong concrete) or ofskyscrapers (Figure 3. 24). The NASA is usingnanotubes in its research for a truly visionary project -an elevator into outer space! (Figure 3. 22)
Other nano raw materials, The chemicalindustry, which sits at the beginning of the chain as asupplier of raw materials for further processing, usesvarious raw materials. Nanoparticles can be producedfrom different substances. The most common nano raw

Part Three ( N &G.W)Chapter Five (Nanotechnology and Nanoscience as FutureSolution )
materials include polymer emulsions, aerogels andzeolites, carbon black, dendrimers, nanosilica andmetallic nanoparticles, titanium dioxide, ceroxide andaluminium oxide. The proportion of nanoparticles in acomposite material or coating is comparatively small,so typically only small quantities are required. Forexample, the nano raw material is mixed into anotherraw material and then processed further, or a coatingthat contains nanoparticles is applied usingconventional methods such as dipping or spraying usingtechniques such as CVD (chemical vapour deposition).(Figure 3.23) [Source is: Nanomaterials, NanotechnologiesAnd Design, Mike Ashby, Paulo Ferreira and Daniel Schodek, (2009)]
Hydrogen is an energy carrier which holdstremendous promise as a new renewable and cleanenergy option. Hydrogen is a convenient, safe, versatilefuel source that can be easily converted to a desiredform of energy without releasing harmful emissions.Hydrogen is the ideal fuel for the future since itsignificantly reduces the greenhouse gas emissions,reduces the global dependence on fossil fuels, andincreases the efficiency of the energy conversionprocess for both internal combustion engines and protonexchange membrane fuel cells. Hydrogen used in thefuel cell directly converts the chemical energy ofhydrogen into water, electricity, and heat as representedby
Hydrogen storage cuts across both hydrogenproduction and hydrogen applications and thus assumesa critical role in initiating a hydrogen economy. For
fuel cell cars, the onboard hydrogenstorage is inevitable and an integral part of the systemto be reengineered. The critical properties of thehydrogen storage materials to be evaluated forautomotive applications are (i) light weight, (ii) cost and availability, (iii) high volumetric and gravimetricdensity of hydrogen, (iv) fast kinetics, (v) ease ofactivation, (vi) low temperature of dissociation ordecomposition, (vii) appropriate thermodynamicproperties, (viii) long-term cycling stability, and (ix)

Part Three ( N &G.W)Chapter Five (Nanotechnology and Nanoscience as FutureSolution )
high degree of reversibility. (Figure 3. 25) [Source is:Nanomaterials for Hydrogen Storage Applications: A Review,Michael U. Niemann,1 Sesha S. Srinivasan,1 Ayala R. Phani,2Ashok Kumar,1 D. Yogi Goswami,1 and Elias K. Stefanakos1,(2008)]
5.2.2 Sensors and Smart Electronic.
Sensors and transducers are closely related toone another since both involve energy exchange. Atransducer is normally a device that converts energyfrom one form to another, e.g., mechanical energy intoelectrical energy, although a transducer can alsotransfer energy in the same form. Transducers arenormally used for the purpose of transmitting,monitoring or controlling energy. By contrast, sensorswhich also involve energy exchange interact directlywith and respond to the surrounding stimulus field.(Figure 3. 26) [Source is: Smart Materials and NewTechnologies For the architecture and design professions, D.Michelle Addington Daniel L. Schodek. (2005)]
As usually used, the term detector refers to anassembly
consisting of a sensor and the needed electronicsthat convert the basic signal from the sensor into ausable or understandable form. An instrument is adevice for measuring, recording or controllingsomething. An actuator is a device that converts inputenergy in the form of a signal into a mechanical orchemical action. This term typically refers a device thatmoves or controls something; most frequently, anactuator produces a mechanical action or movement inresponse to an input voltage. [Source is: Smart Materialsand New Technologies For the architecture and designprofessions, D. Michelle Addington Daniel L. Schodek. (2005)]
In an actuator, an external stimulus in the formof an input signal (such as a voltage) produces anaction of one type or another. In a sensor, an externalstimulus (such as a mechanical deformation) producesan output signal, often in the form of a voltage. Thesignal, in turn, can be used to control many othersystem elements or behaviors. We will see that in manycases the same device that serves as a sensor can alsobe reconfigured to serve as an actuator. This is certainly

Part Three ( N &G.W)Chapter Five (Nanotechnology and Nanoscience as FutureSolution )
the case, for example, with the piezoelectric devicesdiscussed earlier. [Source is: Smart Materials and NewTechnologies For the architecture and design professions, D.Michelle Addington Daniel L. Schodek. (2005)]
There are many different types of sensors andtransducers. A basic way of thinking about the differenttypes is via the energy form that is initially usedmechanical, thermal, electrical, magnetic, radiant orchemical. Sensors and trans- ducers can be based onany of these energy states. Another way of thinkingabout the different types that exist is based on theirexpected usage, e.g., proximity sensors or sound sensors(Figure 3. 29). Some of these basic types those areparticularly relevant to design applications:
Light sensors.Sound sensors.Thermal sensors.Humidity sensors. Touch sensors. (Figure 3. 28)Position sensors.Proximity sensors.Motion sensors. (Figure 3. 27)Chemical, magnetic and other basicsensors. Environmental sensors.Biosensors.Swarms (smart dust). (Figure 3. 30)
Object tracking and identification systems,while not really sensors in the normal meaning of theword, there are several technologies that serve sensor-like functions which are used for determining thepresence of objects, as well as identifying and trackingthem. Radio Frequency Identification (RFID) tags havebecome widespread and almost ubiquitous. These tagslisten for a radio query and respond by transmitting anidentifiable code. A typical RFID system consists of acentral transceiver connected to a computer-basedprocessing device and a transponder, or tag on theobject that is being tracked. The transponder contains asmall integrated circuit that picks up radio signals andresponds with identification data. Typically, the latter

Part Three ( N &G.W)Chapter Five (Nanotechnology and Nanoscience as FutureSolution )
need not contain batteries. High frequency RFIDsystems can transmit fairly long distances. Problemsinclude common radio technology problems such asinterference, absorption (e.g., by water or human bodiesat certain wavelengths), and available bandwidth.(Figure 3. 31)
RFID tags are inexpensive and can be placedvirtually anywhere. Hence, they find wide application in everything from inventory control applications,counting and charging (e.g., for automobile tolls),process applications (e.g., stages in manufacturing) andso forth. Since RFID tags depend on radio technologies,they obviate the need of other tracking systems, such asthe all-familiar bar coding, for line-of-sight readings.[Source is: Smart Materials and New Technologies For thearchitecture and design professions, D. Michelle AddingtonDaniel L. Schodek. (2005)]
5.2.3 How Recycling can help stop GlobalWarming.
As an avid recycler, we do our best to also takeactions in my life that will help stop global warming.Because landfills filled with our garbage produce adangerous greenhouse gas called methane, recycling isa great way to get started fighting global warming.
These simple actions can make a big differencein fighting global warming with recycling and reducingthe garbage accumulating in landfills:
Recycle Aluminum - Recycling onealuminum can saves enough energy torun a TV for three hours -- or theequivalent of a half a gallon of gasoline. Ittakes 95% less energy to recycle aluminumthan it does to make it from raw materials.(Figure 3. 32)Recycle Steel "Tin" Cans - A 60-wattlight bulb can be run for over a day on theamount of energy saved by recycling 1

Part Three ( N &G.W)Chapter Five (Nanotechnology and Nanoscience as FutureSolution )
pound of steel. In one year in the UnitedStates, the recycling of steel saves enoughenergy to heat and light 18,000,000homes! It takes 60% less energy to recyclesteel than it does to make it from rawmaterials. (Figure 3. 32)Recycle Paper - Each ton (2000pounds) of recycled paper can save 17trees, 380 gallons of oil, three cubic yardsof landfill space, 4000 kilowatts of energy,and 7000 gallons of water. This representsa 64% energy savings, a 58% watersavings, and 60 pounds less of airpollution! The 17 trees saved can absorb atotal of 250 pounds of carbon dioxide fromthe air each year. Burning that same ton ofpaper would create 1500 pounds of carbondioxide. It takes 40% less energy to recyclenewspaper than it does to make it from rawmaterials. (Figure 3. 33)Recycle Plastic - Recycling plastic savestwice as much energy as burning it in anincinerator. It takes 70% less energy torecycle plastics than it does to make it fromraw materials. (Figure 3. 34)Recycle Glass - The energy saved fromrecycling one glass bottle can run a 100-watt light bulb for four hours. It also causes20% less air pollution and 50% less waterpollution than when a new bottle is madefrom raw materials. It takes 40% lessenergy to recycle glass than it does to makeit from raw materials. (Figure 3. 35)Recycle Used Motor Oil - Two gallons ofused motor oil can generate enoughelectricity to power the average home forone day, cook 48 meals in a microwaveoven, blow-

Part Three ( N &G.W)Chapter Five (Nanotechnology and Nanoscience as FutureSolution )
times, vacuum a house for 15 months orwatch television for 7 and a half daysstraight! (Figure 3. 36)Use Recycled Paper - Using 100% post-consumer recycled paper for your printer orcopy machine keeps 5 pounds of carbondioxide out of our atmosphere per ream ofpaper. (Figure 3. 37)Reuse and/or Recycle Your GroceryBags - When 1 ton of plastic bags is reusedor recycled, the energy equivalent of 11barrels of oil are saved.Use a Reusable Cloth, Hemp or MeshShopping Bag - A sturdy, reusable bagneeds only be used 11 times to have a lowerenvironmental impact than using 11disposable plastic bags. (Figure 3. 38)Buy Products with the Least Amount ofPackaging - Reducing trash by purchasingproducts with minimal packagingsaves 1000 pounds of carbon dioxidefrom entering our atmosphere. (Figure 3.39)
In 2000, recycling resulted in an annualenergy savings equal to the amount of energy used in 6million homes (over 660 trillion BTUs).
In 2005, recycling is conservatively projected tosave the amount of energy used in 9 million homes (900trillion BTUs).
A of 30% reduces greenhouse gas emissions asmuch as removing nearly 25 million cars from the road.(Figure 3. 40) [Sourceis:http://www.help-stop-globalwarming.com/global-warming-recycling.html, Retrieved 20November, 2011.]

Part Three ( N &G.W)Chapter Five (Nanotechnology and Nanoscience as FutureSolution )
5.2.4 Nanotechnology centers in the Arabworld.
On February 20, 2010, Mohamed HA Hassan,executive director of TWAS, the academy of sciencesfor the developing world, and President of the AfricanAcademy ofaid the future of development of the Arab region Hesaid that at a panel -emergence ofScience, Technology and Education as Priorities in the
meeting in San Diegoregion, home to some 300 million people, faces a hostof daunting development challenges Three of the mostfundamental involve ensuring adequate supplies ofwater, energy and food Advances in nanotechnologycould help achieve progress by helping to address eachof these challenges [Source is:http://translate.google.com.eg/translate,nanotechnology-and-the-environment-in-the-arab-world, Retrieved 20 November, 2011.]
The development of nanotechnology researchthroughout the Arab world is a very recentphenomenon, which started to take place only two yearsago in Saudi Arabia and since then has spread to otherArab countries (Figure 3. 41)
It is not surprising that the pioneer inacknowledging the importance of nanotechnology isSaudi Arabia Indeed, as part of the six members of theGulf Cooperation Council's strategy to transform theirindustries from petroleum production to knowledge-based industries using nanotechnology andbiotechnology, research centers have been establishedrecently in Saudi Arabia as well as in the UAE in orderto provide the human resources, innovation andpioneering technology needed for its implementation.(Figure 3. 42)
The agreement on the establishment of the firstsuch research center was signed in Riyadh on February26, 2008 between the King Abdulaziz City for Science
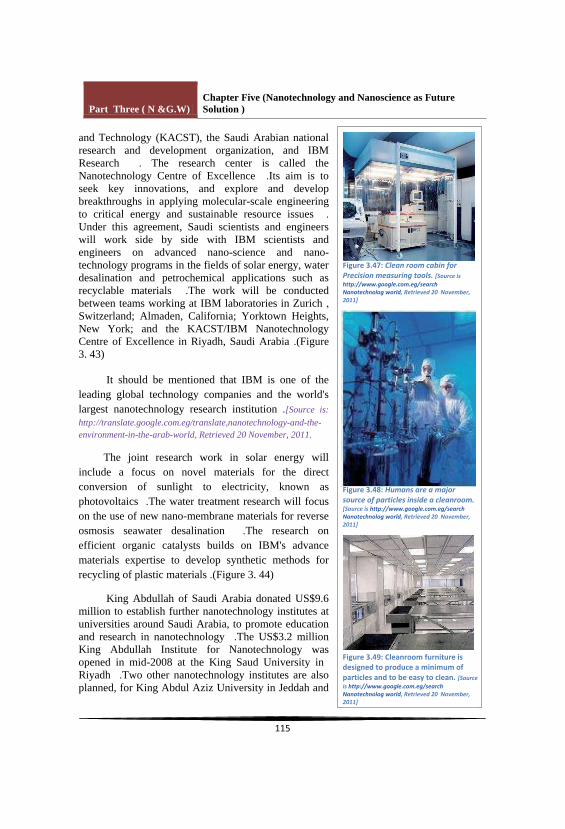
Part Three ( N &G.W)Chapter Five (Nanotechnology and Nanoscience as FutureSolution )
and Technology (KACST), the Saudi Arabian nationalresearch and development organization, and IBMResearch The research center is called theNanotechnology Centre of Excellence Its aim is toseek key innovations, and explore and developbreakthroughs in applying molecular-scale engineeringto critical energy and sustainable resource issuesUnder this agreement, Saudi scientists and engineerswill work side by side with IBM scientists andengineers on advanced nano-science and nano-technology programs in the fields of solar energy, waterdesalination and petrochemical applications such asrecyclable materials The work will be conductedbetween teams working at IBM laboratories in ZurichSwitzerland; Almaden, California; Yorktown Heights,New York; and the KACST/IBM NanotechnologyCentre of Excellence in Riyadh, Saudi Arabia (Figure3. 43)
It should be mentioned that IBM is one of theleading global technology companies and the world'slargest nanotechnology research institution [Source is:http://translate.google.com.eg/translate,nanotechnology-and-the-environment-in-the-arab-world, Retrieved 20 November, 2011.
The joint research work in solar energy willinclude a focus on novel materials for the directconversion of sunlight to electricity, known asphotovoltaics The water treatment research will focuson the use of new nano-membrane materials for reverseosmosis seawater desalination The research onefficient organic catalysts builds on IBM's advancematerials expertise to develop synthetic methods forrecycling of plastic materials (Figure 3. 44)
King Abdullah of Saudi Arabia donated US$9.6million to establish further nanotechnology institutes atuniversities around Saudi Arabia, to promote educationand research in nanotechnology The US$3.2 millionKing Abdullah Institute for Nanotechnology wasopened in mid-2008 at the King Saud University inRiyadh Two other nanotechnology institutes are alsoplanned, for King Abdul Aziz University in Jeddah and

Part Three ( N &G.W)Chapter Five (Nanotechnology and Nanoscience as FutureSolution )
the King Fahd University for Petroleum and Minerals in Riyadh, at a cost of US$3.2million each (Figure 3. 45)
On April 28, 2009, Intel and King Abdulaziz City for Science and Technology signeda collaborative research agreement to establish CENA, Center of Excellence in Nano-manufacturing Applications The focus of CENA is to conduct leading-edge research onadvanced nano-processing and fabrication technology, nano-sensors/network, nano-devices, and synthesis and deposition of nano-structures CENA will commence itsactivities in October 2010 (Figure 3. 46)
A nanotechnology research center was also established in the UAE On November16, 2008, the Khalifa University of Science, Technology and Research (KUSTAR) in AbuDhabi announced that it would set up a nanotechnology research center in collaborationwith the Asian Nano Forum The announcement was made during the Fifth Asian NanoForum Summit which started at that day in Abu Dhabi
According to its website, the aim of the KUSTAR's nanotechnology playa leading role in the establishment of nanotechnology research, development, and industryin Abu Dhabi and the UAE The centre will be dedicated to research on theoretical andexperimental nanotechnology with strong emphasis on education and training [Source is:http://translate.google.com.eg/translate,nanotechnology-and-the-environment-in-the-arab-world, Retrieved20 November, 2011.]
The interest in nanotechnology in the Arab world is not limited only to SaudiArabia and the Gulf countries Scientists in North African countries are increasinglyinterested in nanotechnology In January 2009, Egypt launched the first North Africannanotechnology and nanoscience research center in Cairo that aims to be world-class, withsupport from IBM Research Egypt's Information Technology Industry DevelopmentAgency (ITIDA) and Science and Technological Development Fund (STDF signed thethree-year partnership agreement with IBM on September 18 Joint investments willbe in the region of US$30 million Partners in the Center, Cairo University, NileUniversity and IBM will collaborate in the areas of simulation and modeling software,alternative energy sources (thin film silicon photovoltaics) and energy recovery fordesalination (Figure 3. 47)
More recently, Algeria launched several joint research projects with Iranianscientists in nanotechnology applications in environment and water management But mostof this research is yet to be applied, partly because of limited funding And, even morerecently, the Jordanian Higher Council for Science and Technology decided on August 17,2009 to establish the National Nanotechnology Centre of Jordan (NANCEJ The Centrestarted to be officially active in early Februarycapacity in the field of nanotechnology in the Kingdom through programming andcoordinating scientific research and development activities in this field nationwide, makingthe necessary financial support available for them, and networking Jordanian researchers
Part Three ( N &G.W)Chapter Five (Nanotechnology and Nanoscience as FutureSolution )
with their counterparts abroad The centre will establish an advanced specialized researchlaboratory capable of implementing the wide range of R D and production [Source is:http://translate.google.com.eg/translate,nanotechnology-and-the-environment-in-the-arab-world, Retrieved20 November, 2011.]
In Israel, the care of a lot to the development and production of nanotechnology;where he founded the "Research Institute of Nanotechnology," at a cost of $ 88 million, and"Israel Institute of Technology" in the city of Haifa, with a capital of $ 4 million, whichmobilized 200 scientists from all disciplines. Also have set up in 2003, "the researchnanostructures," spotted at the end of last year, nearly $ 90 million, in addition to support ofthis body by the United States, the equivalent of $ 250 million, was established nearly 80trap him in the entity , of the total 820 companies around the world, for the production andmarketing of nanotechnology products, and is expected to reach production of "Israel" inthis sector to a trillion dollars in 2015. (Figure 3. 48) (Figure 3. 49)
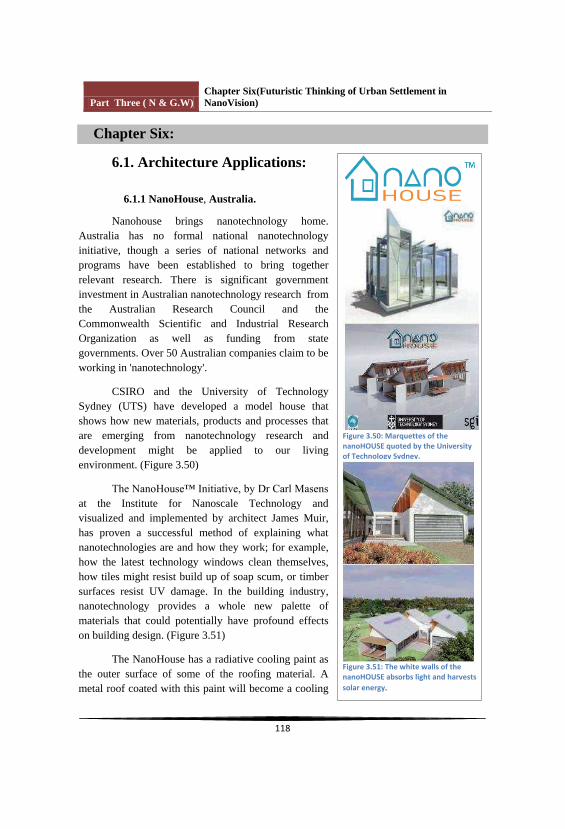
Part Three ( N & G.W)Chapter Six(Futuristic Thinking of Urban Settlement inNanoVision)
Chapter Six:
6.1. Architecture Applications:
6.1.1 NanoHouse, Australia.
Nanohouse brings nanotechnology home.Australia has no formal national nanotechnologyinitiative, though a series of national networks andprograms have been established to bring togetherrelevant research. There is significant governmentinvestment in Australian nanotechnology research fromthe Australian Research Council and theCommonwealth Scientific and Industrial ResearchOrganization as well as funding from stategovernments. Over 50 Australian companies claim to beworking in 'nanotechnology'.
CSIRO and the University of TechnologySydney (UTS) have developed a model house thatshows how new materials, products and processes thatare emerging from nanotechnology research anddevelopment might be applied to our livingenvironment. (Figure 3.50)
at the Institute for Nanoscale Technology andvisualized and implemented by architect James Muir,has proven a successful method of explaining whatnanotechnologies are and how they work; for example, how the latest technology windows clean themselves,how tiles might resist build up of soap scum, or timbersurfaces resist UV damage. In the building industry,nanotechnology provides a whole new palette ofmaterials that could potentially have profound effectson building design. (Figure 3.51)
The NanoHouse has a radiative cooling paint asthe outer surface of some of the roofing material. Ametal roof coated with this paint will become a cooling .

Part Three ( N & G.W)Chapter Six(Futuristic Thinking of Urban Settlement inNanoVision)
element in a building rather than a source of unwantedheat gain. Other features are self-cleaning glass, coldlighting systems and the dye solar cell a photovoltaiccell based on titanium dioxide rather than silicon. Forinstance, glass can be used more liberally if it isoptically tuned to block heat and UV. It would bepossible to construct a building with many more, largerwindows than is currently viable, since heat can be keptout and UV photodamage prevented. Reduction of thesolar heat gain through windows reduces the need forcooling via air conditioning, saving electricity. Incertain parts of a building, solar thermal radiation iswelcome, such as the exterior surface of a thermalmass. (Figure 3.52)
Even if it's surrounded with glass walls, theNanoHouse doesn't need any curtains. [This] glass canbe made almost opaque at the flick of a switch withSPD (suspended particle device) glass. It can be donemanually with a switch, or automatically by attaching asensing device and a controller, in much the same waystreet lights go on when it becomes overcast. Thetechnology uses particles dispersed in a liquid or indroplets encapsulated in a thin plastic film. (Figure3.53)
The particles align, allowing light to passthrough when a charge is applied to a coating ofelectrically conductive transparent material. Theparticles return to random positions and block lightwhen there is no charge. SPD glass can be used assubstitute curtain for privacy. Other glass technologiesare available to fill the insulation role of curtains.(Figure 3.54)
Some of the types of technologies underconsideration for inclusion in the house include:
UV/IR filtering and reflecting windowsfor control of unwanted solar heat gain. Pressure contours on
CU building surfaces.

Part Three ( N & G.W)Chapter Six(Futuristic Thinking of Urban Settlement inNanoVision)
Self-cleaning TiO2 coated glass.Protective coatings for furnitureoffering UV protection.Bottles, food containers etc. with tunedoptical. properties for the enhancementof shelf life of both containers andcontents . Cold lighting systems for theharvesting of daylight during the dayand use with ultra efficient bright whiteLED light sources.Water quality control systems thatremove pollutants from water, and cleaneffluent water .Light colored paints without glare anddark pigments for paints that do notretain heat.
6.1.2 Nano Studio.
How will nanotechnology affect the way wedesign, make, and inhabit buildings?
In the NanoStudio, interdisciplinary groups ofstudents from Ball University, and Illinois Institute of
impact on the built environment, as well as social,ethical and environmental issues it raises. Together theyare designing buildings using nanomaterials includingcarbon nanotubes, quantum dot displays, andnanosensors to create new kinds of environments notlimited by the constrains of traditional materials. Awarethat these radical materials fundamentally after therelationship between buildings, users, and theenvironment, we are integrating a detailed examinationof the social, ethical, and environmental side-effects ofnanotechnology into the investigation. The results theyhope, will be a proactive contribution to the socialdiscussion on this rapidly developing supertechnology.

Part Three ( N & G.W)Chapter Six(Futuristic Thinking of Urban Settlement inNanoVision)
(Figure 3.55)
nanomaterials already developed in laboratories that arenow working their way to market. These includetransparent carbon nanotubes 100 times stronger thansteel, nanosensors small enough to embed not only inbuilding components but their users as well, andquantum dot lighting able to change the color andopacity of walls and ceilings. But this was no mere"house-of-the-future" fantasy. Students also addressedthe social and environmental concerns raised bynanotechnology, from toxicity (nanoparticles are so tinythey can pass through cell membranes) to privacy (whocontrols the data gathered by embedded nanosensors?)(Figure 3.56)
6.1.3 Carbon Tower.
Architects Peter Testa and Sheila Kennedy havevery different practices, but both navigate the unchartedwaters of innovative design through collaboration withmanufacturers, multidisciplinary interaction, and theadaptation of nascent technologies. "The complexity ofcontemporary buildings is an enormous achievement, but we need to question how we cam to the point ofbuilding with such complexity. We believe we need torethink how we assemble buildings." These might seemlike strange words coming from architect Peter Testa,who, with his partner, Devyn Weiser, has designed acarbon-fiber tower, a complex undertaking thatproposes to build a high-rise tower out of compositematerials. According to Testa, whose firm, Peter TestaArchitects, is located in Santa Monica, California, thewillingness to use complex computer modeling toolswill allow the design of new buildings, materials, andproducts that just might transform the building industry.(Figure 3.58)


Part Three ( N & G.W)Chapter Six(Futuristic Thinking of Urban Settlement inNanoVision)
City, however, KVA is designing seven ferry landings along the Harlem and East Riverwaterfronts in Manhattan. The work includes intermodal passenger shelters, commuterferry boat docking facilities, site improvements, and community amenities. The technologyalso allows for rapid prototyping, which is especially useful in a multisite project. Althoughthis kind of technology is becoming more common in the construction industry, Kennedysays they have often gone outside of the construction industry to metal fabricators or setbuilders who are more familiar with it. (Figure 3.61)
In the spring of 2001, Kennedy began to work with DuPont on an initiative toincorporate solid-state technologies with translucent and transparent materials. "Internaland external market research supported the idea of integrating solid-state lighting withsurface materials where we had good brands," explains Tom O'Brien, portfolio manager forDuPont Ventures, who had heard Kennedy speak about the subject at a conference."However, it also called for a prototype that would demonstrate validity." (Figure 3.62)
The KVA and DuPont teams focused on two DuPont products: Corian andSentryGlas Plus protective glass. They developed concept demonstrations-a combination ofmaterials, solidstate lighting, and product information to stimulate discussion aboutapplications. Although he can't talk too specifically about the results, O'Brien says the goalwas to make the DuPont products smarter by integrating technology without compromisingthe integrity or features that have made them successful. O'Brien is now working with threeDuPont businesses to turn these concept demonstrations into possible offerings.The natureand methods of KVA's work involves risk, but Sheila Kennedy considers herself one of thearchitects who wouldn't enjoy her work if she couldn't affect culturalproduction

Part Three ( N & G.W)Chapter Six(Futuristic Thinking of Urban Settlement inNanoVision)
6.1.4 Bahrain World Trade Center.
Design:
Is an extension to the existing five-star SheratonHotel complex and comprises two 50-storey sail-shapedcommercial office towers, which taper to a height of240m and support three 29m diameter horizontal-axiswind turbines. The towers are integrated on top of athree-storey podium which accommodates a new9,600m² MODA shopping centre, fine restaurants, foodcourt, hotel space for the Sheraton, business centre andcar parking.
(Figure 3.63)
Environmental Features:
The two towers are linked via three sky bridges,each holding a 225KW wind turbine, totaling to 675kWof wind power production. Each of these turbinesmeasure 29 m (95 ft) in diameter, and is aligned north,which is the direction from which air from the PersianGulf blows in. The wind turbines are expected toprovide 11% to 15% of the towers' total powerconsumption, or approximately 1.1 to 1.3 GWh a year.(Generating between 1,100MWh and 1,300MWh ayear) and will operate for 50% of the time with fullpower being generated at a wind speed of 15 to 20m/s.This is equivalent to providing the lighting for about300 homes annually (Figure 3.64).The three turbineswere turned on for the first time on the 8th of April, 2008.They are expected to operate 50% of the time onan average day. (Figure 3.65.
Why Zero:
This was confirmed by wind tunnel tests, which showedthat the buildings create an S-shaped flow, ensuring thatany wind coming within a 45° angle to either side of thecentral axis will create a wind stream that remainsperpendicular to the turbines; this significantlyincreases their potential to generate electricity.

Part Three ( N & G.W)Chapter Six(Futuristic Thinking of Urban Settlement inNanoVision)
6.2 Futuristic thinking of zero carbon urban settlement: ( zero carbon infrastructure and architecture )
6.2.1. Masder City (Zero Carbon City).
Masder City
Architect Norman FosterLocation Abu Dhabi U.E.ADate 2016Type Zero Carbon City.Technologies Used Photovoltaic Farms Solar Power Pod Car -Renewable Energy. CO2 Emissions Strategy is to reach zero emission.
An extraordinary ecological city of the future is being built in the United ArabEmirates, outside of the capital Abu Dhabi. The work force will soon reach 40,000.Situated in the desert, Masdar is a small city that will be 6 square kilometers (2.3 m2). It isdesigned to house 40,000 people, 1500 businesses and accommodate up to 50,000commuters. The blazing sun, the ultimate clean power source will power the city. Masdar'ssolar farm, which is the largest in the Middle East, is already built. No skyscrapers or carswill be allowed and the streets are designed for pedestrians. Boundary walls prevent urban
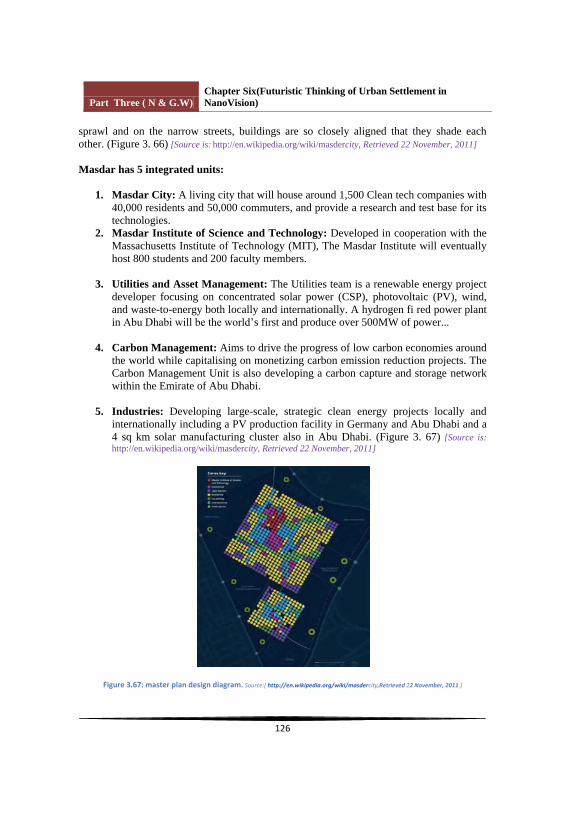
Part Three ( N & G.W)Chapter Six(Futuristic Thinking of Urban Settlement inNanoVision)
sprawl and on the narrow streets, buildings are so closely aligned that they shade eachother. (Figure 3. 66) [Source is: http://en.wikipedia.org/wiki/masdercity, Retrieved 22 November, 2011]
Masdar has 5 integrated units:
1. Masdar City: A living city that will house around 1,500 Clean tech companies with40,000 residents and 50,000 commuters, and provide a research and test base for itstechnologies.
2. Masdar Institute of Science and Technology: Developed in cooperation with theMassachusetts Institute of Technology (MIT), The Masdar Institute will eventuallyhost 800 students and 200 faculty members.
3. Utilities and Asset Management: The Utilities team is a renewable energy projectdeveloper focusing on concentrated solar power (CSP), photovoltaic (PV), wind,and waste-to-energy both locally and internationally. A hydrogen fi red power plantin s first and produce over 500MW of power...
4. Carbon Management: Aims to drive the progress of low carbon economies aroundthe world while capitalising on monetizing carbon emission reduction projects. TheCarbon Management Unit is also developing a carbon capture and storage networkwithin the Emirate of Abu Dhabi.
5. Industries: Developing large-scale, strategic clean energy projects locally andinternationally including a PV production facility in Germany and Abu Dhabi and a4 sq km solar manufacturing cluster also in Abu Dhabi. (Figure 3. 67) [Source is:http://en.wikipedia.org/wiki/masdercity, Retrieved 22 November, 2011]

Part Three ( N & G.W)Chapter Six(Futuristic Thinking of Urban Settlement inNanoVision)
Environmental Features:
Responsive to the culture and spirit of Abu Dhabi,the design of the city is inspired by the traditionalArabic architecture and urban planning of theregion and includes many examples of wheretraditional design techniques help to reduce energyConsumption and to improve the quality of theEnvironment.
Shaded walkways and narrow streets reduce glareand solar gain, and create pleasant and attractiveoutside green spaces. (Figure 3. 68)
The diagonal orientation of the streets and publicspaces makes best use of the cooling night breezesand lessens the effect of hot daytime winds, whilstfurther reducing the effects of direct sunlight.Traditional passive features such as wind towersand blinds and solar shades help to furtherimprove comfort levels. [Source is:http://en.wikipedia.org/wiki/masdercity, Retrieved 22November, 2011]
The buildings in the city are amongst the mostadvanced in the world. Intelligent design ofresidential and commercial spaces reduces theneedfor artificial lighting and air conditioning.
All buildings will surpass the highest standardscurrently set by internationally recognizedorganizations and Masdar City is a key partner in the Estidama programme which sets newbenchmarks in planning, design and buildingwithin cities.
A 40 to 60 watt solar power plant built by

Part Three ( N & G.W)Chapter Six(Futuristic Thinking of Urban Settlement inNanoVision)
German firm Conergy supplies power for constructionwork. A larger solar power plant will follow and,together with photovoltaic modules on rooftops, 130megawatts of solar power is expected to be generated.A solar powered desalination plant will generate thecity's fresh water ~80% of the water will be recycled.Water usage in Madar will be one half that typical ofcomparably sized small cities. Wind farms will bebuilt on Masdar's outskirts with a designed poweroutput of 20 megawatts. The world's largest hydrogenpower plant is planned and there are geothermalsources to be exploited.
Exceptional energy efficiency and reduction inenergy footprint at Masdar will be achieved throughthe integration of several important, almost zerofootprint, alternative energy technologies. Highfences installed around the city will reduce the impactof hot blowing winds from the desert. Building unitsuse solar glass whose composition is new materialsthat further reduce the heat burden. Buildingcomplexes have high efficiency cooling towers.Fountains and trees will be grown as an additionalcooling device. Huge umbrellas unfold during the dayand close up at night as shown in these photos. Architects and engineers are projecting that Masdar'saverage temperature will be 20 degrees lower than thesurrounding desert.
Waste can be reduced to near zero. Biologicalwaste will be used to create a nutrient rich soil (andfertilizer), and some could be burned via wasteincineration for power. Industrial wastes such asplastics will be recycled and/or reduced and reused.Final deployment of the PRT will utilize 3,000 podcars that make 130,000 trips per day on a passengernetwork that has 85 stations. A trip around MasdarCity will take about 10 minutes. The Freight RapidTransit System (FRT) will run on a dedicated guideway in the undercroft, an artificial basement that canbe created by raising the pedestrian level. The FRTsystem will make 5,000 trips/day using vehicles withtwo pallets and maximum payload of 1600 kg.(Figure 3. 69) [Source is:http://en.wikipedia.org/wiki/masdercity, Retrieved 22, 2012]

Part Three ( N & G.W)Chapter Six(Futuristic Thinking of Urban Settlement inNanoVision)
6.2.2. Energy Island.
Energy Islnd
Architect Dominic Michaelis and specialist research groups fromUniversity of Southampton
Location United KingdomDate In Future Type Single Floating StructureTechnologies Used Photovoltaic Farms - Wind Turbines - Renewable Energy.CO2 Emissions Strategy is to Maximize the Energy Production Available from
the Diverse Sources Available
The Energy Island concept is to bring together on a single floating structure avariety of renewable energy conversion systems to maximize the energy productionavailable from the diverse sources available, so that the interrelated systems can assist eachother to reach greater efficiencies of conversion. The basic island could be of hexagonalplan, so that it could readily be joined to other units to form cluster or linear plans asrequired. A hexagon made up of 6 equilateral triangles of 300 meter long sides would havea longest cross distance of 600 meters and a shortest cross distance of 520 meters. Its areawould be 234 000 m(2), or 23,4 hectares. It's size would guarantee it's stability in heavyseas. (Figure 3. 70) [Source is: http://en.wikipedia.org/wiki/energyisland, Retrieved 22 November, 2011]

Part Three ( N & G.W)Chapter Six(Futuristic Thinking of Urban Settlement inNanoVision)
The Energy Island would act as a platform to maximize collection and conversion of thediverse renewable energy sources available.
These would include :-
WIND ENERGY Wind Energy varies from site to site, but is generally moreplentiful at sea, without the interference of land features. In these conditions, tomaximise wind energy collection, aerogenerators would be mounted on heightadjustable hydraulic masts allowing collection at different heights where one millwould be in the lee of another. On a 600 meter wide platform, it is proposed to place3 low level 70 meter diameter mills and 3 high level diameter mills, each capable ofgenerating 3 MW (el). The total peak output is 18 MW peak.SEA CURRENT ENERGY Sea current Energy is very site dependent, but it isassumed that a cowled turbine assembly 500 meters across perpendicular to aconstant current flow can generate 2MW / 100 meters, or a total of 10 MW. WAVE ENERGY Although in tropical waters, the average wave energy profile isfar from the 50 kW / meter average of the North Sea, a figure of 15 kW / meter canbe expected. Since one of the problems of OTEC systems lies in the vast volumes ofwater that need to be shifted, wave energy could be used directly to induce theseflows without going through the inefficiencies of electricity generation. With a 600meter long front, a 9 MW resource is achieved, of which it is assumed that 2/3 canbe transferred to usable hydraulic power, a 6 MW contribution.SOLAR ENERGY Many different solar collector systems can be considered overthe 22 hectare platform, ranging from PV arrays to concentrating thermal systems.The hexagonal plan lends itself particularly well to "Power Tower" systems intropical latitudes. The highest collection efficiencies, around 75%, are achieved bysuch high temperature "Power Tower" type concentrators, which, at 800°C, allow asecondary conversion ratio to electricity of 40%, an overall efficiency of30%.(Figure 3. 71) [Source is: http://en.wikipedia.org/wiki/energyisland, Retrieved 22November, 2011]
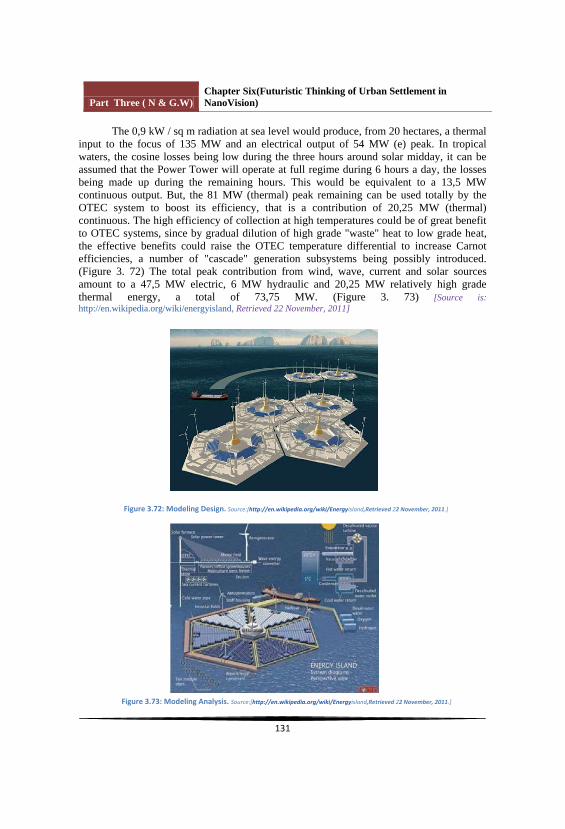
Part Three ( N & G.W)Chapter Six(Futuristic Thinking of Urban Settlement inNanoVision)
The 0,9 kW / sq m radiation at sea level would produce, from 20 hectares, a thermalinput to the focus of 135 MW and an electrical output of 54 MW (e) peak. In tropicalwaters, the cosine losses being low during the three hours around solar midday, it can beassumed that the Power Tower will operate at full regime during 6 hours a day, the lossesbeing made up during the remaining hours. This would be equivalent to a 13,5 MWcontinuous output. But, the 81 MW (thermal) peak remaining can be used totally by theOTEC system to boost its efficiency, that is a contribution of 20,25 MW (thermal)continuous. The high efficiency of collection at high temperatures could be of great benefitto OTEC systems, since by gradual dilution of high grade "waste" heat to low grade heat, the effective benefits could raise the OTEC temperature differential to increase Carnotefficiencies, a number of "cascade" generation subsystems being possibly introduced.(Figure 3. 72) The total peak contribution from wind, wave, current and solar sourcesamount to a 47,5 MW electric, 6 MW hydraulic and 20,25 MW relatively high gradethermal energy, a total of 73,75 MW. (Figure 3. 73) [Source is:http://en.wikipedia.org/wiki/energyisland, Retrieved 22 November, 2011]
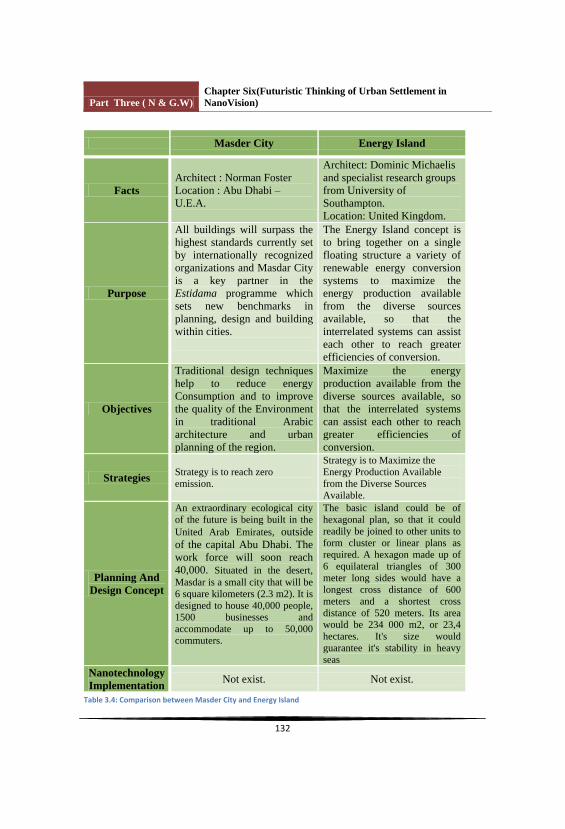
Part Three ( N & G.W)Chapter Six(Futuristic Thinking of Urban Settlement inNanoVision)
Masder City Energy Island
FactsArchitect : Norman FosterLocation : Abu Dhabi U.E.A.
Architect: Dominic Michaelisand specialist research groupsfrom University of Southampton.Location: United Kingdom.
Purpose
All buildings will surpass thehighest standards currently setby internationally recognizedorganizations and Masdar Cityis a key partner in theEstidama programme whichsets new benchmarks inplanning, design and buildingwithin cities.
The Energy Island concept isto bring together on a singlefloating structure a variety ofrenewable energy conversionsystems to maximize theenergy production availablefrom the diverse sourcesavailable, so that theinterrelated systems can assisteach other to reach greaterefficiencies of conversion.
Objectives
Traditional design techniqueshelp to reduce energyConsumption and to improvethe quality of the Environmentin traditional Arabicarchitecture and urbanplanning of the region.
Maximize the energyproduction available from thediverse sources available, sothat the interrelated systemscan assist each other to reachgreater efficiencies ofconversion.
Strategies Strategy is to reach zeroemission.
Strategy is to Maximize theEnergy Production Availablefrom the Diverse SourcesAvailable.
Planning AndDesign Concept
An extraordinary ecological cityof the future is being built in theUnited Arab Emirates, outsideof the capital Abu Dhabi. Thework force will soon reach40,000. Situated in the desert,Masdar is a small city that will be6 square kilometers (2.3 m2). It isdesigned to house 40,000 people,1500 businesses andaccommodate up to 50,000commuters.
The basic island could be ofhexagonal plan, so that it couldreadily be joined to other units toform cluster or linear plans asrequired. A hexagon made up of6 equilateral triangles of 300meter long sides would have a longest cross distance of 600meters and a shortest crossdistance of 520 meters. Its areawould be 234 000 m2, or 23,4hectares. It's size wouldguarantee it's stability in heavyseas
NanotechnologyImplementation
Not exist. Not exist.
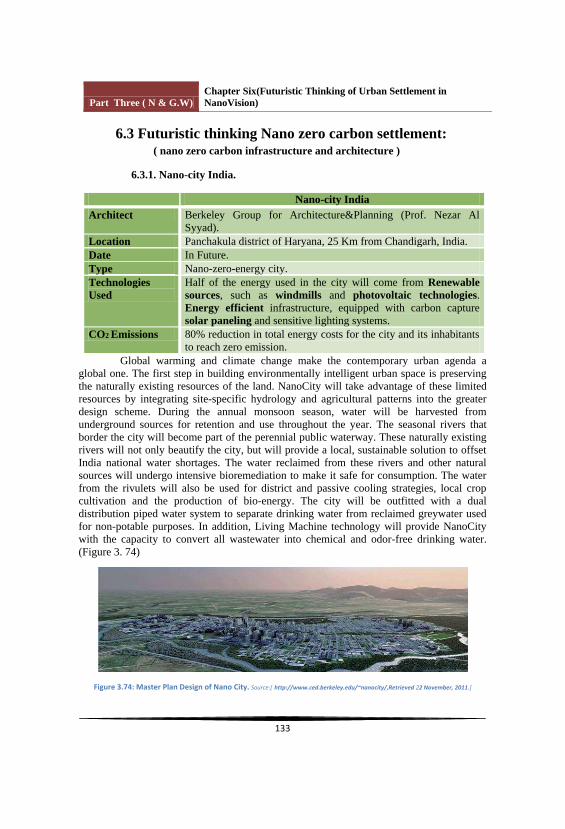
Part Three ( N & G.W)Chapter Six(Futuristic Thinking of Urban Settlement inNanoVision)
6.3 Futuristic thinking Nano zero carbon settlement:( nano zero carbon infrastructure and architecture )
6.3.1. Nano-city India.
Nano-city IndiaArchitect Berkeley Group for Architecture&Planning (Prof. Nezar Al
Syyad).Location Panchakula district of Haryana, 25 Km from Chandigarh, India. Date In Future.Type Nano-zero-energy city.TechnologiesUsed
Half of the energy used in the city will come from Renewablesources, such as windmills and photovoltaic technologies.Energy efficient infrastructure, equipped with carbon capturesolar paneling and sensitive lighting systems.
CO2 Emissions 80% reduction in total energy costs for the city and its inhabitantsto reach zero emission.
Global warming and climate change make the contemporary urban agenda aglobal one. The first step in building environmentally intelligent urban space is preservingthe naturally existing resources of the land. NanoCity will take advantage of these limitedresources by integrating site-specific hydrology and agricultural patterns into the greaterdesign scheme. During the annual monsoon season, water will be harvested fromunderground sources for retention and use throughout the year. The seasonal rivers thatborder the city will become part of the perennial public waterway. These naturally existingrivers will not only beautify the city, but will provide a local, sustainable solution to offsetIndia national water shortages. The water reclaimed from these rivers and other naturalsources will undergo intensive bioremediation to make it safe for consumption. The waterfrom the rivulets will also be used for district and passive cooling strategies, local cropcultivation and the production of bio-energy. The city will be outfitted with a dualdistribution piped water system to separate drinking water from reclaimed greywater usedfor non-potable purposes. In addition, Living Machine technology will provide NanoCitywith the capacity to convert all wastewater into chemical and odor-free drinking water. (Figure 3. 74)

Part Three ( N & G.W)Chapter Six(Futuristic Thinking of Urban Settlement inNanoVision)
Half of the energy used in the city will come from renewable sources, such aswindmills and photovoltaic technologies. Energy efficient infrastructure, equipped withcarbon capture solar paneling and sensitive lighting systems, will use half the energyrequired by conventional buildings. The result will be an 80% reduction in total energycosts for the city and its inhabitants. Buildings will also utilize climate responsive designtechniques, such as sun shading, cross ventilation and direct evaporative cooling, to reducethe need for air-conditioning. (Figure 3. 75) (Figure 3. 76) [Source is:http://www.ced.berkeley.edu/~nanocity/, Retrieved 22 November, 2011]
At least 70% of the city waste will be recycled or composted. The residents ofNanoCity are estimated to consume 20 times less resources than those living in other cities,and the city will have the smallest per capita carbon footprint in all of India. NanoCityimplementation of environmentally sustainable measures will serve as a testament to thefinancial feasibility of these efforts, and will demonstrate the broad benefits such living canhave for all of society. (Figure 3. 77) (Figure 3. 78)

Part Three ( N & G.W)Chapter Six(Futuristic Thinking of Urban Settlement inNanoVision)

Part Three ( N & G.W)Chapter Six(Futuristic Thinking of Urban Settlement inNanoVision)
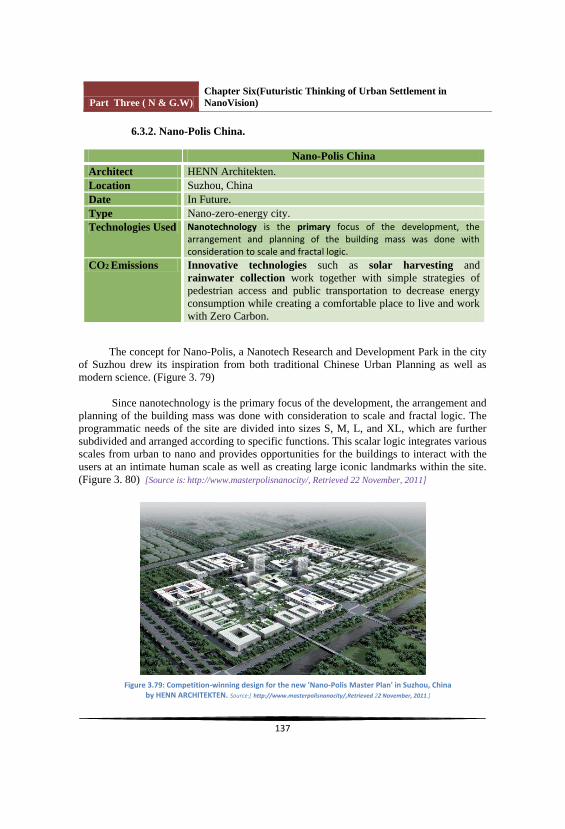
Part Three ( N & G.W)Chapter Six(Futuristic Thinking of Urban Settlement inNanoVision)
6.3.2. Nano-Polis China.
Nano-Polis ChinaArchitect HENN Architekten.Location Suzhou, ChinaDate In Future. Type Nano-zero-energy city.Technologies Used
CO2 Emissions Innovative technologies such as solar harvesting andrainwater collection work together with simple strategies ofpedestrian access and public transportation to decrease energyconsumption while creating a comfortable place to live and workwith Zero Carbon.
The concept for Nano-Polis, a Nanotech Research and Development Park in the cityof Suzhou drew its inspiration from both traditional Chinese Urban Planning as well asmodern science. (Figure 3. 79)
Since nanotechnology is the primary focus of the development, the arrangement andplanning of the building mass was done with consideration to scale and fractal logic. Theprogrammatic needs of the site are divided into sizes S, M, L, and XL, which are furthersubdivided and arranged according to specific functions. This scalar logic integrates variousscales from urban to nano and provides opportunities for the buildings to interact with theusers at an intimate human scale as well as creating large iconic landmarks within the site.(Figure 3. 80) [Source is: http://www.masterpolisnanocity/, Retrieved 22 November, 2011]

Part Three ( N & G.W)Chapter Six(Futuristic Thinking of Urban Settlement inNanoVision)
Like most traditional Chinese cities, Nano-Polis assumes a rectilinear shape with aclearly defined border and staggered internal connections. Also the Idea of the fractal canbe found in traditional Chinese cities that are assembled in recursive logic by blocks, areas, districts, quarters and boroughs, from S to XL respectively. (Figure 3. 81) (Figure 3. 82)[Source is: http://www.masterpolisnanocity/, Retrieved 22 November, 2011]

Part Three ( N & G.W)Chapter Six(Futuristic Thinking of Urban Settlement inNanoVision)

Part Three ( N & G.W)Chapter Six(Futuristic Thinking of Urban Settlement inNanoVision)
The overall development includes a cluster of high and medium-rise buildingssurrounding a central plaza. This area houses most of the administrative, exhibition, conference and public areas as well as temporary housing facilities. This iconic centre is
that Suzhou is known for. A natural river flows east to west through the site which feeds aseries of ponds, canals, and water features throughout this zone. This green buffer zoneconnects by a series of shared roof scapes, courtyards and galleries to the outer ring: Theentire complex is defined by a dense belt of research and production facilities that create adefined urban edge to the surrounding context. (Figure 3. 83)
The design of Nano-Polis employs a variety of environmentally responsible systemsinto its planning. Innovative technologies such as solar harvesting and rainwater collectionwork together with simple strategies of pedestrian access and public transportation todecrease energy consumption while creating a comfortable place to live and work. (Figure3. 84) (Figure 3. 85)
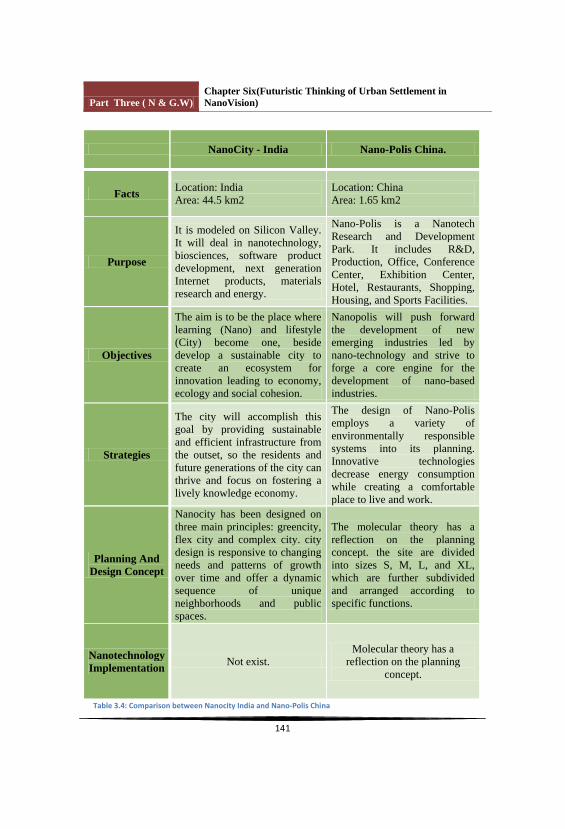
Part Three ( N & G.W)Chapter Six(Futuristic Thinking of Urban Settlement inNanoVision)
NanoCity - India Nano-Polis China.
FactsLocation: IndiaArea: 44.5 km2
Location: ChinaArea: 1.65 km2
Purpose
It is modeled on Silicon Valley.It will deal in nanotechnology,biosciences, software productdevelopment, next generationInternet products, materialsresearch and energy.
Nano-Polis is a NanotechResearch and DevelopmentPark. It includes R&D,Production, Office, ConferenceCenter, Exhibition Center, Hotel, Restaurants, Shopping,Housing, and Sports Facilities.
Objectives
The aim is to be the place wherelearning (Nano) and lifestyle(City) become one, besidedevelop a sustainable city tocreate an ecosystem forinnovation leading to economy,ecology and social cohesion.
Nanopolis will push forwardthe development of newemerging industries led bynano-technology and strive toforge a core engine for thedevelopment of nano-basedindustries.
Strategies
The city will accomplish thisgoal by providing sustainableand efficient infrastructure fromthe outset, so the residents andfuture generations of the city canthrive and focus on fostering alively knowledge economy.
The design of Nano-Polisemploys a variety ofenvironmentally responsiblesystems into its planning.Innovative technologiesdecrease energy consumptionwhile creating a comfortableplace to live and work.
Planning AndDesign Concept
Nanocity has been designed onthree main principles: greencity, flex city and complex city. citydesign is responsive to changingneeds and patterns of growthover time and offer a dynamicsequence of uniqueneighborhoods and publicspaces.
The molecular theory has areflection on the planningconcept. the site are dividedinto sizes S, M, L, and XL,which are further subdividedand arranged according tospecific functions.
NanotechnologyImplementation
Not exist.Molecular theory has a
reflection on the planningconcept.
Part Three ( N & G.W)Chapter Six(Futuristic Thinking of Urban Settlement inNanoVision)
Part Three Conclusion
We are at a time where there is, global warming and where the earth isoverwhelmed with its population which is more than 7 billion people, and where polarmountains are melting and the Ozone hole is getting bigger, and where forest areasdestroyed by man are increasing and green areas are decreasing, and where ourconsumption of electricity is increasing in addition to wasting water. Under all thesecircumstances, we should think of new ways to limit the negative mark which humanbeings have left on nature and all its components. This could be done through using newtechnologies like Nano technology, new techniques and smart materials which work onreducing the energy consumed in heating and cooling. All this should be done in a form ofa complete system to result into a clean environment free of harmful substances. This isclarified at part three where is an answer to the questions which we aim to answer throughthis thesis like these questions:
How Nanoarchitecture can reduce the global warming?Why Nanomaterials is helpful than micro?How we can reach the clean energy inside the building?
The answer to these important questions is shown through many ways mentioned in partthree:
Aspect One:
The nanomaterials and nanotechnology importance appear through discovering newmaterials working on two axes. First axis is s participation and contribution in formingdifferent clean energy systems due to their small size. It is used as important component indeveloping the solar cells, windmills turbines, and many other clean energy systems. Thesematerials aim to find new natural resources and new clean energy sources to graduallyphasing out the non renewable energy sources threatening to run out after long time ofconsumption and usage. The second axis is to entering this technology. Thenanotechnology measurement is to form and find new materials can be used in architecturaland construction aspect. The characteristics of these materials should be environmentfriendly and not harmful. Also it should be as co-factor or workable factor in nottransferring the harmful aspects of the external environment into the buildings to createhealthy, comfortable, and livable environment.
Aspect Two:
To reduce the resulted pollution from construction and buildings sector, there is animportant stage or phase to focus on when starting the construction process which is
Part Three ( N & G.W)Chapter Six(Futuristic Thinking of Urban Settlement inNanoVision)
production of materials. This stage is causing and contributing to a high portion of thepollution resulting from the construction and buildings sector. The benefit ofnanotechnology and using nanomaterials appear in the production stage whereas it is
material production phase result in producing material can be used in construction andbuilding process to construct the optimal architectural unit in the constructed building. Thisunit is environment friendly, healthy, and compatible or adapting to the surroundingenvironment.
Aspect Three:
The Smart sensors systems; which are an important component of the integratedsystem aiming to reduce the negative effects of the global warming, and reducing energyconsumption inside or within one unit. This is basic function of the smart sensors systemswhich work to reduce the wastes resulting from energy misusing such as electrical lighting
waste resulting from not closing or sealing water taps, or air conditioners used for longperiods of time even after reaching the required programmed temperature. Such systemsshould be used in houses, public buildings, and different types of buildings as it works toreduce energy consumption and energy wasting inside the building, and also storing it, andreusing. These systems are developed continuously and quickly as it is composed as resultof using nanotechnology and using smart nanomaterials which are significantlycontributing in its continuous development, and improving its performance or efficiency.
Aspect Four:
The importance of various material recycling; this process contributes in reducingthe negative effects of global warming, saving high percentage of consumed or used energyin the various materials production which is used on a daily bases and considered a hugeburden on the communities in the form of wastes must be disposed of or get rid of. Thusvarious materials recycling provide great benefits to the environment.
Aspect Five:
Mentioning many examples of the news cities beginning to appear in variouscountries which show new architecture trends aiming to reach clean environment andcarbon free through using new technologies such as nanotechnology, nanomaterials, smartmaterials, and smarts sensor systems. Also in addition to the infrastructure of these cities
continuous and smart controlling of energy consumption, and depending on clean energyproducing renewable energy such as solar energy, wind energy, tide and energy and otherforms of clean energy to replace non renewable energy . One of the Arabian examples of
Part Three ( N & G.W)Chapter Six(Futuristic Thinking of Urban Settlement inNanoVision)
this trend whereas there will be much depending on such cities in the near future. Thesecities will facilitates all the human being needs in different comfortable means includingthe basic human needs. It connects them together with different networks in these citiesinfrastructure, and transferring electricity from generators to all units and buildings. It alsoprovides different non-exhaust transportation means depending on clean energy such aselectrical cars. Also electric-powered trains, and metros, solar-power bikes, and many othertransportation means.
At the end of this part showing the different governments, and the internationalinterest in this architecture trend, and such city type such as India, china, UAE, USA,Bahrain, and Qatar that are interested in this trend that obviously appear in different citiesdesigns, this is considered real seeds of an architectural trend will benefit the human beingsand the environment alike without any harms.
Aspect Six:
It seems like more and more Arab countries acknowledge the importance andpotential of nanotechnology to address the three most fundamental development challengesfacing the Arab world, which include: ensuring adequate supplies of water, clean energy,food and renewable energy. Thus, there is no wonder that that two first majorenvironmental projects applying nanotechnology have to do with desalination andpurification of water.
This acknowledgment of the importance of nanotechnology to the Arab world will, most probably, result in more research centers established in all the Arab countries and inmore environment projects launched using nanotechnology.
In order to cover the knowledge gap with the West, joint nanotechnology researchcenters and projects have been launched in collaboration with foreign companies andresearch centers, who already have the needed knowledge in nanotechnology.
Facing the challenges of lack of water, energy, and food is a need common to all thecountries located in the Middle East and North Africa. This need might also bring the Arabcountries to collaborate with each other and even to collaborate with Israel, which has theknowhow in this field.
Part Four (Application ) Chapter Seven (Application : Bibliotheca Alexandrina )
Part Four: Application.
Introduction
Chapter Seven: Application (Bibliotheca Alexandrina)
7.1 Case Study (Reading Area in Bibliotheca Alexandrina)
7.1.1. Background of Case Study.
7.1.2. Concept & Analysis of Case Study
7.1.3. Recommendations.
Part Four Conclusion.
Overall Conclusions and Recommendations
References.
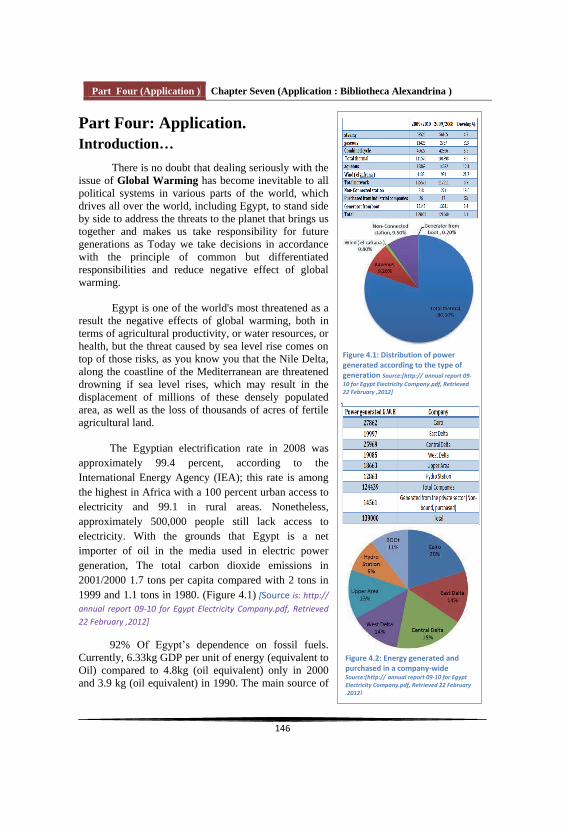
Part Four (Application ) Chapter Seven (Application : Bibliotheca Alexandrina )
Part Four: Application.Introduction
There is no doubt that dealing seriously with theissue of Global Warming has become inevitable to allpolitical systems in various parts of the world, whichdrives all over the world, including Egypt, to stand sideby side to address the threats to the planet that brings ustogether and makes us take responsibility for futuregenerations as Today we take decisions in accordancewith the principle of common but differentiatedresponsibilities and reduce negative effect of globalwarming.
Egypt is one of the world's most threatened as aresult the negative effects of global warming, both interms of agricultural productivity, or water resources, orhealth, but the threat caused by sea level rise comes ontop of those risks, as you know you that the Nile Delta,along the coastline of the Mediterranean are threateneddrowning if sea level rises, which may result in thedisplacement of millions of these densely populatedarea, as well as the loss of thousands of acres of fertileagricultural land.
The Egyptian electrification rate in 2008 wasapproximately 99.4 percent, according to theInternational Energy Agency (IEA); this rate is amongthe highest in Africa with a 100 percent urban access toelectricity and 99.1 in rural areas. Nonetheless,approximately 500,000 people still lack access toelectricity. With the grounds that Egypt is a netimporter of oil in the media used in electric powergeneration, The total carbon dioxide emissions in2001/2000 1.7 tons per capita compared with 2 tons in1999 and 1.1 tons in 1980. (Figure 4.1)
92% dependence on fossil fuels.Currently, 6.33kg GDP per unit of energy (equivalent toOil) compared to 4.8kg (oil equivalent) only in 2000and 3.9 kg (oil equivalent) in 1990. The main source of

Part Four (Application ) Chapter Seven (Application : Bibliotheca Alexandrina )
emissions of greenhouse gases in the combustion Fuelcome from the energy sector (22%), industry (21%),transport (18%) and the agricultural sector (15%).Egypt is among the countries that climate changerepresents for her a real threat because of densepopulation areas. It also will allow developmentprojects to reduce greenhouse gas Global warming anopportunity for Egypt to raise the level of energyTransport and industry so it has in cooperation withseveral friendly countries in the implementation ofprojects and programs aimed at developing the use ofnew and renewable energies, green building andcapacity development, and policy development ofenvironmental action in Egypt. (Figure 4.2)
The Egypt because of its unique geographicallocation, attaches great importance to developing newand renewable energies, such as wind, solar, andbioenergy, and we hope that we get to produce 20% ofthe total energy in Egypt by 2020. Egypt is well awareof the importance of cooperation with the internationalcommunity in addressing the dangers of climate changehas therefore taken the initiative to establish a nationalcommission for clean development mechanism, whichcommitted a number of activities since its inception in2005, has been approved for implementation of 38projects in various sectors - some port actually theground, and Avoid carbon reduction certificates, andcontribute to solving the problem of global warmingAnd government of Egypt is also promoting the use andproduction of clean energy, especially the new andrenewable energy in addition to improving energyefficiency has been the establishment of the SupremeCouncil of Energy to oversee the development andorganization of this important sector in the country.(Figure 4.3)
At the local level for the consumption of electricpower in the city of Alexandria, the total domesticconsumption of electricity is 1858 MW for the year2010 with a total production of West Delta ElectricityProduction Company, which consists of 8 stations (5steam stations, and 2 gas stations and 1 stationmorkaba) 2949 MW. (Figure 4.4)

Part Four (Application ) Chapter Seven (Application : Bibliotheca Alexandrina )
It is necessary to classification buildings as sustainable building for reducing energyconsumption and use international measurement system like (LEED, BREM, etc..) formeasure government buildings of global classification in achieving sustainability and thatits terms the economy and control maximum in energy use and therefore are consideredIndustrial buildings and public buildings of more categories of buildings consumption ofelectricity and for the continuation of work by for long hours without breaks, is BibliothecaAlexandrina that public buildings, which increases the rate of electricity consumption sincethey serve the public for more than 12 hours

Part Four (Application ) Chapter Seven (Application : Bibliotheca Alexandrina )
Chapter Seven: Application (Bibliotheca Alexandrina)
7.1 Case Study (Reading Area in Bibliotheca Alexandrina)
7.1.1. Background of Case Study.
Bibliotheca AlexandrinaArchitect Norwegian architectural firm SnohettaLocation Alexandria , EgyptDate 2002Area 80,000 m2.Client UNISCO, Arab Republic of Egypt.Cost 212,000,000 US$
Alexandria`s new library recreates the ancient repository for literature and historyfounded by Alexander the Great some 2.300 years ago, and provides one of the largest andmost impressive research and rare-book storage facilities in the world. An internationalcompetition for its design was held in1989 and won by the then little-known Norwegianarchitectural firm Snohetta. The design is grand yet deceptively simple: a huge inclinedsilver disc that appears to rise over the Mediterranean Sea covers a stepped reading roomover 14 terraces. The circular from follows in the tradition of many great reading rooms,while the stepped section and regular structural grid respond to the functional requirementsof book storage. Human scale is provided by a grove of slender concrete columns thatgrows out of the gently cascading interior landscape to hold up rectangular bays of rooflights. These clerestories face due north and are angled diagonally to reflect light indirectlyinto the space below, animating the reading room like a giant sundial as the sun crosses theheavens. A massive south-facing wall inscribed with examples of all the world`s textappears fortress-like in comparison to the shining sophistication of the roof, and enclosesthe building, protecting it from the harsh climate. (Figure 4.5)

Part Four (Application ) Chapter Seven (Application : Bibliotheca Alexandrina )
The dimensions of the project are vast: the library has shelf space for eight millionbooks, with the main reading room covering 70,000 m² on eleven cascading levels. Thecomplex also houses a conference center; specialized libraries for maps, multimedia, theblind and visually impaired, young people, and for children; four museums; four artgalleries for temporary exhibitions; 15 permanent exhibitions; a planetarium; and amanuscript restoration laboratory. The library's architecture is equally striking. The mainreading room stands beneath a 32-meter-high glass- panelled roof, tilted out toward the sealike a sundial, and measuring some 160 m in diameter. The walls are of gray Aswangranite, carved with characters from 120 different human scripts. (Figure 4.6) (Figure 4.8)(Figure 4.9)
The BA is completing its eighth year and is getting ready to approach its firstdecade of existence. This past year has seen us expand our activities: 1.4 million visitorsand over 700 events; in addition to about a million hits per day on our various websites. Wecontinue to do cutting-edge work in each of our eight research institutes, and we havesuccessfully integrated a super-computer (capable of doing 10,000,000,000,000calculations per second) into our arsenal of analytical tools. We have developed criticaltools for librarianship in Arabic, and we have been the recipient of the largest bookdonation in history: 500,000 volumes of French books donated to the BA by the Banff. (Figure 4.7)

Part Four (Application ) Chapter Seven (Application : Bibliotheca Alexandrina )

Part Four (Application ) Chapter Seven (Application : Bibliotheca Alexandrina )

Part Four (Application ) Chapter Seven (Application : Bibliotheca Alexandrina )

Part Four (Application ) Chapter Seven (Application : Bibliotheca Alexandrina )
of columns be 20 m to 30 m, which certainly affect the arrival of daylighting for the readingarea so as to distance and large reading area as the vertical glass panel (8m *4m), whichmeans that the daylighting factor is so small for public buildings which must be DF=1. (Figure 4.10) (Figure 4.11)
The composition of vertical glass roof lights is exterior 8mm toughened clear glasswith coating Sunex 66/38. 16 mm gap filled with Argon gas + the bounding material isThiokol. Interior 2*6 mm float clear glasses with inserted Trosifol protective film of 0.76mm thickness.
Light Qualities Required Reality
Light transmission index Minimum 50% 62%
Shading coefficientEven or lower
than 45%44%
Reflection Max. 10 % 9%
Total solar radiant heat transmission factor Max. 40% 38%
Colour rendition 96 91
The deviation of the planckian locus towards green not to exceed more than 0.02 on the chromaticity 7-co-ordinte.
_____ ____
UV- reduction - factor Minimum 85% 85.5%
U value for this glazing 1.35(W/m2k) 1.35
We can see that the glass andaluminum panels and gray Aswan granite be as the external finishing , but the internalfinishing is wooding in floor, double black granite, concrete in column, also the mostfurniture in reading area from wood and aluminum sheet. All that materials had itsreflection factor which affect in internal environment by absorption the energy andtransferred the heat from outside to inside which make a large heavy burden on HVACinside the reading area. (Table 4.1) (Figure 4.12) (Figure 4.13) (Figure 4.14)

Part Four (Application ) Chapter Seven (Application : Bibliotheca Alexandrina )
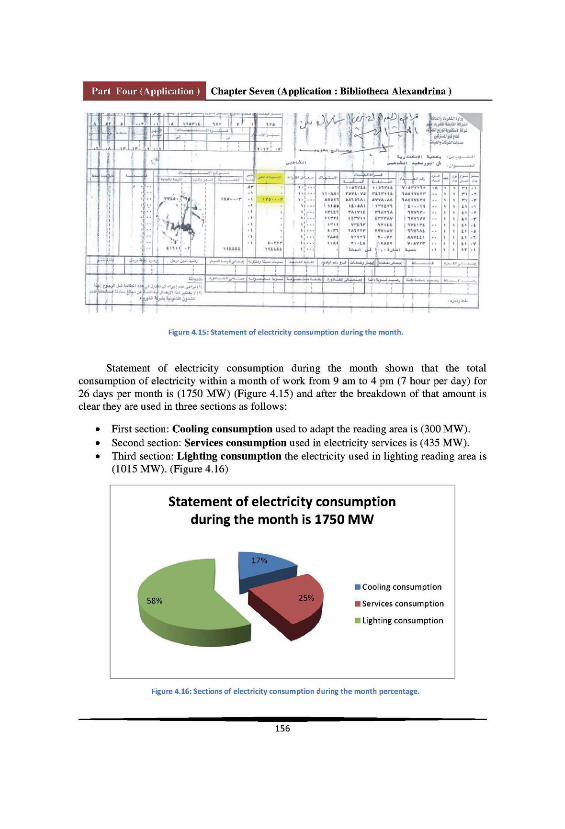

Part Four (Application ) Chapter Seven (Application : Bibliotheca Alexandrina )
7.1.2.Concept & Analysis of Case Study:
Based on all of the above-mentioned information concerning the BibliothecaAlexandrina, it is to convert the building to be environmentally friendly and based onrenewable energy and to minimize the consumption of the building for electricity generatedfrom burning of petroleum products without influence a performance of the building andthe performance of his job required him to even raise the operational efficiency andinterzaction with users in the highest as well as with the environment in which the existingbuilding so that it responds in an intelligent way to make it deals with the climatic changesof the existing environment of the highest degree of effectiveness. To achieve that goal willgo down two parallel tracks which are as follows:
First Track: Diversion energy of Bibliotheca Alexandrina from electric power torenewable energy gradually.
Through the study of the climate of Alexandria in particular and knowledge ofclimatic conditions experienced by Bibliotheca Alexandrina, we find that the averagebrightness of the sun (rate exposure Bibliotheca Alexandrina to the sun) is from 7-12 hoursper day and the following presentation of the characteristics of climate of Alexandria andthe surrounding Bibliotheca Alexandrina:
Alexandria, Egypt latitude & longitude; 31°12'N 29°57'E.
Altitude; -2 m (-7 ft).
The average temperature in Alexandria, Egypt is 21.3 °C (70 °F).
The range of average monthly temperatures is 12 °C.
The warmest average max/ high temperature are 30 °C (86 °F) in July, August &September.
The coolest average min/ low temperature are 11 °C (52 °F) in January & February.
Alexandria receives on average 190 mm (7.5 in) of precipitation annually or 16 mm(0.6 in) each month.
On balance there are 41 days annually on which greater than 0.1 mm (0.004 in) ofprecipitation (rain, sleet, snow or hail) occurs or 3 days on an average month.
The driest weather is from June to September when on balance 0 mm (0.0 in) ofrainfall (precipitation) occurs.
The month with the wettest weather is December when on balance 59 mm (2.3 in)of rain, sleet, hail or snow falls across 10 days.

Part Four (Application ) Chapter Seven (Application : Bibliotheca Alexandrina )
Mean relative humidity for an average year is recorded as 69.3% and on a monthlybasis it ranges from 66% in March & April to 73% in July. (Figure 4.17)
There is an average range of hours of sunshine in Alexandria of between 7.0 hoursper day in January & December and 12.0 hours per day in June, July & August.(Figure 4.18)
On balance there are 3594 sunshine hours annually and approximately 9.8 sunlighthours for each day. (Figure 4.19)
On balance there are 0 days annually registering frost in Alexandria and in Januarythere are on average 0 days with frost. (Table 4.2)

Part Four (Application ) Chapter Seven (Application : Bibliotheca Alexandrina )
AverageMinimumTemperatures in Alexandria,Egypt(°C)
AverageMaximumTemperature inAlexandria, Egypt(°C)
AlexandriaAverageTemperature(°C)
AverageSeaTemp(°C)
AverageRainfall/Precipitation(mm)
WetDays(>0.1mm)
AverageSunlightHours/Day
RelativeHumidity(%)
AverageWindSpeedinAlexandria(Beaufort)
AverageNumberofDayswithFrost
Weather inAlexandriainJanuary
11 19 15 17 44 10 7.0 70 3 0 AverageTemperature inAlexandria inJanuary
Weather inAlexandriainFebruary
11 19 15 16 24 7 8.0 68 3 0 AverageTemperature inAlexandria inFebruary
Weather inAlexandriainMarch
13 21 17 16 15 4 9.0 66.0 3 0 AverageTemperature inAlexandria inMarch
Weather inAlexandriainApril
15 24 20 17 2 1 11.0 66 3 0 AverageTemperature inAlexandria inApril
Weather inAlexandriainMay
18 26 22 20 1 1 11.0 68 3 0 AverageTemperature inAlexandria inMay
Weather inAlexandriainJune
21 28 25 23 0 0 12.0 71 3 0 AverageTemperature inAlexandria inJune
Weather inAlexandriainJuly
23 30 27 25 0 0 12.0 73 3 0 AverageTemperature inAlexandria inJuly
Weat 24 30 27 26 0 0 12.0 72 3 0 Averag

Part Four (Application ) Chapter Seven (Application : Bibliotheca Alexandrina )
her inAlexandriainAugust
eTemperature inAlexandria inAugust
Weather inAlexandriainSeptember
23 30 27 26 0 0 11.0 68 2 0 AverageTemperature inAlexandria inSeptember
Weather inAlexandriainOctober
20 28 24 24 10 2 10.0 68 2 0 AverageTemperature inAlexandria inOctober
Weather inAlexandriainNovember
17 25 21 22 35 6 8.0 69 2 0 AverageTemperature inAlexandria inNovember
Weather inAlexandriainDecember
13 21 17 19 59 10 7.0 72 2 0 AverageTemperature inAlexandria inDecember
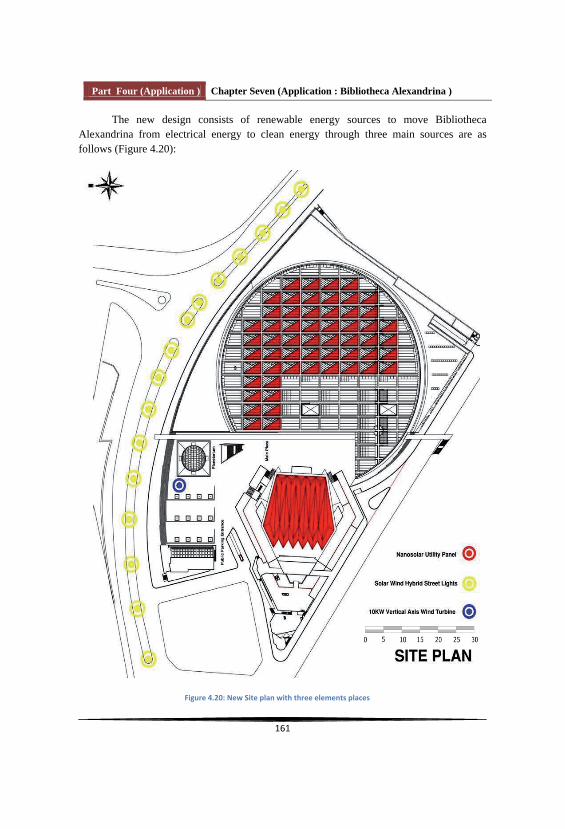
Part Four (Application ) Chapter Seven (Application : Bibliotheca Alexandrina )
The new design consists of renewable energy sources to move BibliothecaAlexandrina from electrical energy to clean energy through three main sources are asfollows (Figure 4.20):

Part Four (Application ) Chapter Seven (Application : Bibliotheca Alexandrina )
1- Nanosolar Utility Panel:
The direction of slope the roof of bibliotheca Alexandrina is far from the rightdirection of sunrise and sunset at 16 degree and reach the highest performance of Nanosolarcells must be those cells facing the direction of sunrise at an angle of inclination of 30 to 35degree and hence the development of Nanosolar cells on the roof of BibliothecaAlexandrina will lose 3 to 4 hours of the actual shine of the sun per day and that will putNanosolar cells on the roof of conference hall and appropriate to the direction of sunriseand sunset. (Figure 4.21)
The dimensions of triangle Panel is (7.8 x 12.6 x 0.5 = 50 m2), and the number ofavailable triangle on the roof of Bibliotheca Alexandria are (57 triangle) so the total areaavailable on roof is (57 x 50 m2 = 2800 m2). From mechanical drawing of Nanosolarpanels dimensions is (1.937 x 1.03 = 2 m2), so the number of available panels will put onthe roof of Bibliotheca Alexandrina is (2800 / 2= 1400 Nanosolar panels). Also the totalarea of Conference hall is (2200m2) and the number of available panels will put on the roofof Conference hall is (2200 / 2 = 1100 Nanosolar panels). (Figure 4.22)
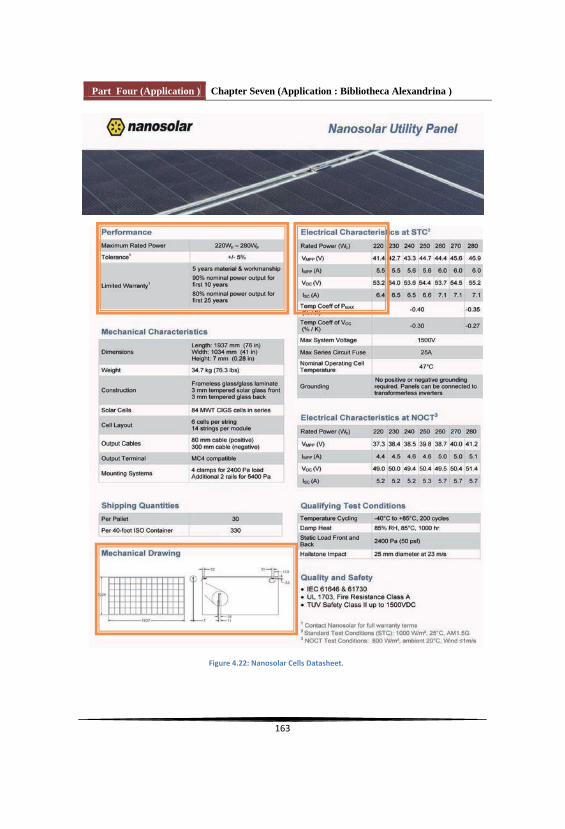
Part Four (Application ) Chapter Seven (Application : Bibliotheca Alexandrina )

Part Four (Application ) Chapter Seven (Application : Bibliotheca Alexandrina )
From previous Datasheet of Nanosolar panels:
(41.4 x 5.5) / (53.2 x 6.4) = 0.66 , (1400 x 0.66 x 220 ) / 1000 = 203 KW.
(220 x 0.66 x 110) / 1000 = 159.72 kw
Shine hours per day from 6 am until 5 pm = 12 hours per day but because that thedirection of slope the roof of bibliotheca Alexandrina is far from the right direction ofsunrise and sunset at 16 degree so we will calculate as 7 hours because we lose 4 hoursfrom 6 am to 10 am.
(203 kw x 7 hours = 1423 kwh = 1.423 mwh/day), (1.423 x 30 day = 44.69 mwh/month)for Bibliotheca Alexandrina roof.
(12 hours x 159.72 kw =1916.64 kwh / day) (30 days x 1.916 mwh = 57.48 mwh/ month)for Conference hall roof.
Total energy produced from the use of Nanosolar cells is 102.17 mwh/month.
2- 10KW Vertical Axis Wind Turbine:
The whole unite consists of pillar, wind generator, storage batteries and inverter /controller. The Mill is pushed by wind at speed from 4m/s to 25m/s to rotate to make thegenerator produced power in AC form. Then the power will be changed into DC form bythe charging controller to be saved in storage batteries. As last, DC power is changed intostandard AC power through the inverter. The average wind speed all over the years is8m/s, from the power curve of the 10 kw VAWT we found that the power corresponding to8 m/s is 4 kw. The average wind blowing time over the year is calculated to be around 12hours / day. (Figure 4.23)
Total energy is (4kw x12 hours x 30 days = 1440 kwh / month = 1.44 Mwh / month)

Part Four (Application ) Chapter Seven (Application : Bibliotheca Alexandrina )
3. Solar Wind Hybrid Street Lights:

Part Four (Application ) Chapter Seven (Application : Bibliotheca Alexandrina )
Two lighting systems are designed into one combined system, if some days there issunlight but no wind energy, the solar panel charges the battery. Similarly if some daysthere is wind energy but no sunlight, the wind turbine can power the battery. If both wind &solar energy is enough, both can charge the battery. The wind turbine continues to workaround the clock supplying energy for the system. The lamp has been designed tomaximize efficient use of the energy generated using a energy-saving luminaries which isswitched automatically by a light sensor. It is intended for permanent installations and canbe located in the remotest of sites since no mains services are required saving oninstallation costs, inconvenience and time. Whole system is virtually maintenance free andthere are NO daily running costs the power is completely free and clean. (Figure 4.25)
Data Sheet:a. Wind power: 300wb. Solar panel: 90W. Solar panels conversion efficiency >15% and average life is at least20years.c. Light source: 30W low pressure sodium lamp.d. Battery: Sealed colloid lead-acid battery. Battery capacity: 120AH/12V e. Applied temperature: -40Deg C to +60Deg C.f. Micro computer controller: With protection of over-charging, over-discharging, over-loading..g. Pole: Steel plate, plastic coating after zinc-plate.h: Pole height: 6 meteri: Distance from ground to lamp: 4-5meterj: Lighting time per day: 6-8 hoursk: Continuously work with 4 cloudy/rainy days. (Table 4.3)
Parts Spec.
Pole height 6M
material high quality steel plate
thick 4mm
suface treating plastic coating after zinc-plate
fitting arm single arm 1.5M
anchor screw under soil
Light Source power 30W

Part Four (Application ) Chapter Seven (Application : Bibliotheca Alexandrina )
type Ultra-bright LED
voltage 12V
lampshade Die cast aluminum housing,Toughened safety glass, paintingcoating.
warranty 1 year
PV and WindController
work voltage 12V/24V auto switch
work type A/B individual controll,programable
Photosensitive 9 level programable
PWM Arithmetic yes
warranty 1 year
Solar Panel type Monocrystal silicon
power 90W
warranty 1 year
Battery type valve regulated sealed lead-acidbattery maintance free
capacity 120ah
voltage 12V
warranty 1 year
battery box up on the pole
Accessories restrictive coating wire
stainless steel fastening piece
WindTurbine 300w 12V

Part Four (Application ) Chapter Seven (Application : Bibliotheca Alexandrina )
4- Other specifications:
As part of Bibliotheca Alexandrina to reduce the consumption of the internallighting in the reading area can replace (the halogen lamps150 watt,fluorescent 26 watt, fluorescent 21 watt and metal halide 150 watt) by highpressure sodium and LED`S lamps for saving up to 89% of the power whenusing LED tubes instead of fluorescent, save same when using LED panels.
Halogen Lamps consumption: (150 x 500 x 7) / 1000 = 525 kwh per day x 30 = 15.750 MWH / Month.Fluorescent 26 watt consumption: (26 x 500 x 7) / 1000 = 91 kwh per day x 30 = 2.730 MWH / Month.Fluorescent 21 watt consumption: (21 x 15000 x 7) / 1000 = 2205 kwh per day x 30 = 66.150 MWH / Month.Metal halide 150 watt consumption: (150 x 1000 x 7) / 1000 = 1050 kwh per day x 30 = 31.50 MWH / Month.
Total Consumption of lighting in reading area is: 116.13 MWH/Month.
Replace (the halogen lamps50 watt) for saving up to 89% of the power whenusing LED tubes(Figure 4.26)
.Chillers should be switched from ordinary cooling towers to Marine Chillertype which using sea water for cooling to saving up to 30% of the power ofcooling consumption. (Figure 4.26)
After what has been presented of the elements on this track, it is necessary to alertthat those elements are not affected negatively on the front of elevation of Bibliotheca
Alexandrina where they merge with the void of plaza and this is what appears in the
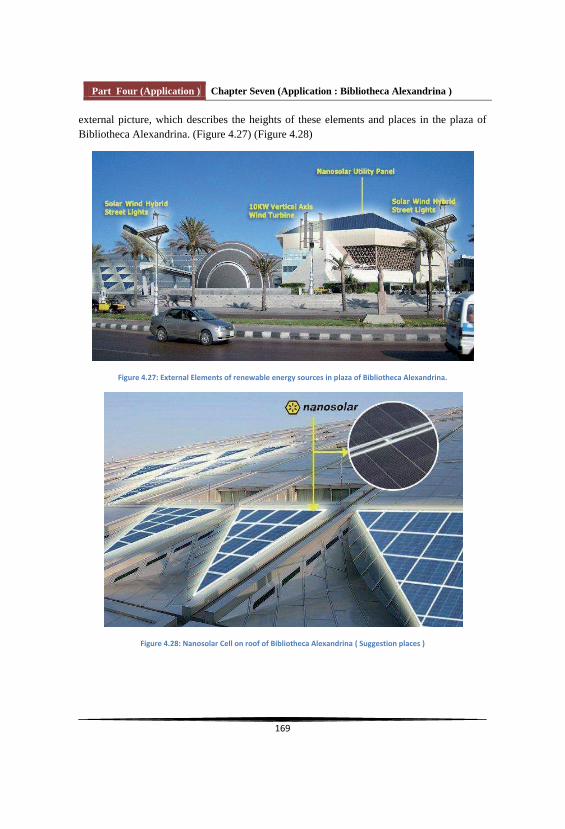
Part Four (Application ) Chapter Seven (Application : Bibliotheca Alexandrina )
external picture, which describes the heights of these elements and places in the plaza ofBibliotheca Alexandrina. (Figure 4.27) (Figure 4.28)

Part Four (Application ) Chapter Seven (Application : Bibliotheca Alexandrina )
Second Track: Changing materials used in construction, internally and externally toNanomaterials,
In this track we will change materials from bad chooses which had bad propertiesto Nanomaterial`s which works to raise the efficiency of building and create smart internalenvironment to interact with users. Like below suggestions:
1- Thermal insulation: Vacuum insulation panels (VIPs)
Vacuum insulation panels (VIPs) are ideally suited for providing very goodthermal insulation with a much thinner insulation thickness than usual. In comparison toconventional insulation materials such as polystyrene, the thermal conductivity is up toten times lower. This results either in much higher levels of thermal resistance at the sameinsulation thickness or means that thinner insulation layers are required to achieve the samelevel of insulation. In other words, maximum thermal resistance can be achieved withminimum insulation thickness. At only 0.005 W/mK, the thermal conductivity of VIPs isextremely low. (Figure 4.29)
The historical precursor to vacuum insulators is the thermos flask, whichfunctions according to the same basic principle: low thermal conductivity is achieved not,as usual, by enclosing pockets of air but by evacuating the air entirely, i.e. the creation of avacuum. In thermos flasks the air between a twin-walled glass vessels is evacuated, whilstthe cylindrical form withstands the high pressure created by the vacuum. This approach ismore difficult for flat insulation layers as they are unable to withstand the pressure. Thesolution to the problem is the use of an extremely fine fill material with a nanoscalarporosity of around 100 nm. A comparatively low pressure is then sufficient to evacuatethe air making it possible to construct panels that can be used in building construction. Thethickness of these VIPs ranges from 2 mm to 40 mm. Vacuum insulation panels can be

Part Four (Application ) Chapter Seven (Application : Bibliotheca Alexandrina )
used both for new building constructions as well as in conversion and renovation work andcan be applied to walls as well as floors. In all cases, vacuum insulation panels offer greatpotential in the general context of improving energy efficiency through better insulationand accordingly contribute to reducing the amount of CO2 emissions. In future,improvements in the production of VIPs can be expected, facilitating a more widespreadapplication of highly efficient insulation materials. In the context of the ongoing debate onglobal warming, their worldwide potential is vast. The lifetime of modern panels isgenerally estimated at between 30 and 50 years, with some products exceeding 50 years. Anumber of factors contribute to this, including the integrity of the skin, the degree ofvacuum within, the seal and last but not least the correct installation of the product. Humidenvironments reduce the overall lifetime of the product. The panels can be recycled.(Figure 4.30, 31) (Table 4.4)

Part Four (Application ) Chapter Seven (Application : Bibliotheca Alexandrina )
Properties Old materials ( Rock wool ) New Material ( VIPs)
ThermalConductivity
0.04 W/(mK) at an averagetemperature of 22,5°C.
0,004 W/(mK) at an averagetemperature of 22,5°C , thethermal conductivity is up toten times lower
ThicknessThe thickness of these Rock woolranges from 15 mm to 50 mm.
The thickness of these VIPsranges from 2 mm to 40 mm.
Benefits
Highly durable insulationproductAble to be used at highertemperaturesPerformance is notadversely affected fromcontact with water. Non combustible
Performance is notadversely affectedfrom contact withwater. Non combustible. More thermalconductivity up to 10 times lower.Non combustible. The thickness is smallthan Rock wool.Able to be used athigher temperatures
2- Solar protection: (
SOLAR PROTECTION: NO blinds necessary. Glass darkens automatically or is switchable without the need for a constant electric current (memory effect).
Solar protection against heat gain from solar radiation is offered by two kinds ofself-darkening glass. Electrochromatic switchable glazing was previously available on themarket, but has since largely disappeared due to two main disadvantages: a constant electriccurrent was necessary to maintain a darkened state and larger glass surfaces often exhibitedoptical irregularities. The advent of nanotechnology has provided a new means ofintegrating electrochromatic glass in buildings. The primary difference to the earlierproduct is that a constant electric current is no longer necessary. A single switch is all thatis required to change the degree of light transmission from one state to another, i.e. (Figure4.32)
One switch to change from transparent to darken and a second switch to changeback. Different levels of light transmission with various darkening effects are also possible,
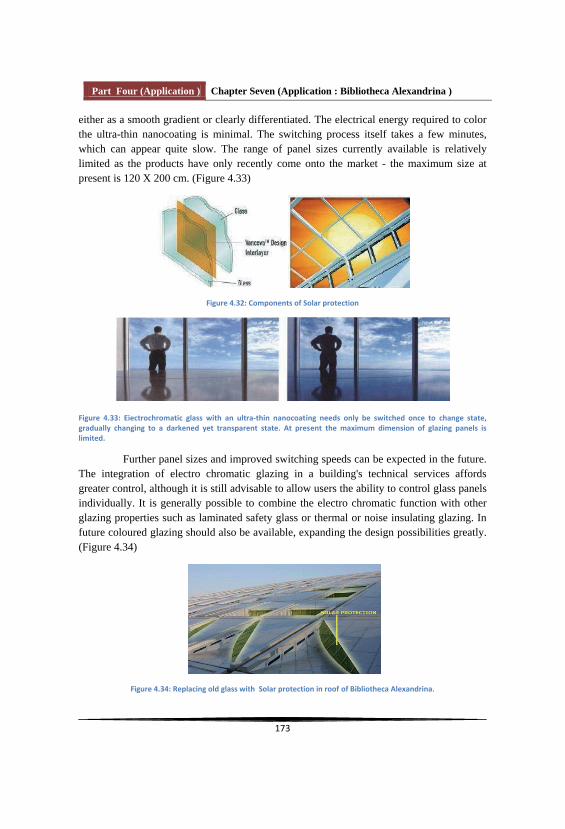
Part Four (Application ) Chapter Seven (Application : Bibliotheca Alexandrina )
either as a smooth gradient or clearly differentiated. The electrical energy required to colorthe ultra-thin nanocoating is minimal. The switching process itself takes a few minutes, which can appear quite slow. The range of panel sizes currently available is relativelylimited as the products have only recently come onto the market - the maximum size atpresent is 120 X 200 cm. (Figure 4.33)
Further panel sizes and improved switching speeds can be expected in the future.The integration of electro chromatic glazing in a building's technical services affordsgreater control, although it is still advisable to allow users the ability to control glass panelsindividually. It is generally possible to combine the electro chromatic function with otherglazing properties such as laminated safety glass or thermal or noise insulating glazing. Infuture coloured glazing should also be available, expanding the design possibilities greatly.(Figure 4.34)

Part Four (Application ) Chapter Seven (Application : Bibliotheca Alexandrina )
Photo chromatic glass is another solution for darkening glass panels. Here thesunlight itself causes the glass to darken automatically without any switching. In both casesblinds or curtains may no longer be necessary. Glare-free light and shading is particularlyimportant for office interiors with computer workstations. Both variants also provide partialshading rather than complete closure so that a degree of visual contact to the world outsidealways remains. Nanotechnology has made it possible to provide an energy-efficient meansof solar protection that can also be combined with other glass functions. (Table 4.5)
Properties Old materials (GT.1)New Material (solar
protection)KALWALL + NANOGEL
Lighttransmissionindex
Minimum 50% 9-12%
Shadingcoefficient
Even or lower than 45% Even or lower than 45%
Reflection Max. 10 % Max.10%
Total solarradiant heattransmissionfactor
Max. 40% 0.08-0.11%
Color rendition 96 95
UV- reduction -factor
Minimum 85% Minimum 95%
U value for this glazing
1.35(W/m2k) 0.28 (W/M2K)
3- Self-cleaning: Lotus-Effect:
Many other material forms use self-cleaning technologies. Paints that are relativelythick in comparison to the thin coatings on glass are also touted as having self-cleaningproperties and are based on similar technical principles. Titanium dioxide, zinc oxide, andother kinds of nanoparticles are used in paints to provide the photocatalytic action thatloosens foreign particles to be carried away by water runoff. Titanium dioxide has longbeen used as a pigment in paints, but nano sized particles show greater photocatalyticactions than do the normal pigment-sized particles because of their greater relative surfacearea. The subsequent runoff process can be enhanced using either hydrophilic effect. Artificial "lotus surfaces", created with the help of nanotechnology, do not as yet have any

Part Four (Application ) Chapter Seven (Application : Bibliotheca Alexandrina )
self-healing capabilities, but they can offer an effective means of self cleaning whenproperly applied. The Lotus-Effect is most well suited for surfaces that are regularlyexposed to sufficient quantities of water, e.g. rainwater, and where this can run off. Smallquantities of water often lead to water droplet "runways" forming or drying stains, whichmay leave a surface looking dirtier rather than cleaner without the presence of water, theuse of such surfaces makes little sense. (Figure 4.35)
These kinds of paints can be applied to many kinds of base materials, includingmetals. Applications that occur in a factory circumstance, as is common in metal panelsused in vehicles, façade elements in buildings, and other products, are invariably better thansimple hand painting or spraying. As with self-cleaning glasses, the self-cleaning processesare slow and do not work equally effectively with all kinds of surface deposits, but they doreduce the effort needed to clean the surfaces when necessary. Self-cleaning paints arebeing widely explored for use in automobile finishes. In all these cases, research needsconcerning long-term efficacies noted previously are relevant. (Figure 4.36)

Part Four (Application ) Chapter Seven (Application : Bibliotheca Alexandrina )
To summarise, in all areas not subject to mechanical wear and tear, the Lotus-Effectdrastically reduces the cleaning requirement and surfaces that are regularly exposed towater remain clean. The advantages are self-evident: a cleaner appearance and considerablyreduced maintenance demands.

Part Four (Application ) Chapter Seven (Application : Bibliotheca Alexandrina )
7.1.3. Recommendations:
In the end of this thesis, we recommend a number of recommendations which webelieve that serves the interest of the environment by nanoarchitecture and renewableresources and their role in minimizing the negative effects of global warming, and thoserecommendations follows:
1- The need to guide governments for clean energy in the hunt for new sources ofenergy in the part near the entry into force of the world`s reserves of oil and the negativeeffects resulting from the burning of harmful gases to the environment.
2- The role of nanotechnology in the production of new materials with smalldimensions, area and features a highly efficient and functional help to raise the operationalefficiency of the building through the improvement of the environment internal to thevacuum and make it more interactive with the user through smart materials and sensorequipment that intervention in the manufacture of nanotechnology.
3- the need to enact laws, architecture and environmental requirements, whichworks to assess the building in stages of design the primary before the actualimplementation, giving an area of change for the materials used and design that work on the optimal utilization of space available to be done in the framework of an environmentalorganizations, local and international so that all buildings are under the laws of thoseorganizations.
4- To spread awareness among the architects of the impotence of nanotechnologyand renewable resources and how annexation of teaching curricula for inclusion in theprocess design and implementation process as a prelude to creating clean environment andnon-pollution cities.
5- Coordination between all institutions of society from government institutions,educational and business to increase public awareness of the importance of the trendtowards nanoarchitecture because of their active role in protecting the environment andraising the standard of living of the human through the techniques and devices that enter the industry.
6- The role of housing and building national research center to focus onnanomaterials that serve the building products used in building construction, both finishingmaterials outside or finishing materials inside which is working to provide those materialsin the local market, which will change the shape of local architecture and contribute greatlyin finding nanoarchitecture into reality to address the problem of Egypt with globalwarming.
7- The change of construction material must be in two key sectors, namely the firstpart is the construction of treatment of existing buildings effectively by replacing thematerials and techniques of ancient articles of modern and the second part is the

Part Four (Application ) Chapter Seven (Application : Bibliotheca Alexandrina )
construction of new building, through the introduction os such materials and newtechniques in the initial stages of process design.
8- The contribution of nanotechnology in solving the problem of global warming isnot limited to its contribution in the field of architecture, but extends to the field ofenvironmental studies and various fields.

Part Four (Application ) Chapter Seven (Application : Bibliotheca Alexandrina )
Part Four Conclusion
Through what has been presented in Part Four of the role of power plants in theproduction of energy by fuel and meet the needs of Alexandria and the required facilitiesand government departments and the different categories of buildings, and we pointed outto him by the increase in the rate of private consumption to public buildings because of thebad habits of those who made it and design the bad lighting internal and external What ledto wasting a large amount of energy produced from power plants, and called by thegovernment of the rationalization of electricity consumption and reduce consumption bynot lighting the place in times of the morning as well as air conditioning in is need for it,and what resulted from it all of the increased emissions gases, affecting the general climateof Alexandria and also increase the burning of petroleum derivatives to increase theproduction of electricity. All of this led to the worsening problem of global warming andcalled on the government to speed about to go to alternative energy new renewable andclean does not depend on burning petroleum derivatives in the framework of governmentsupport for the new direction toward clean energy as we mentioned in the door and supportintroduced gradually so that the aims that the Government relies on 25 % -30% of cleanenergy by 2020 through the allocation of land for private companies and encouragesentrepreneurs and investors in that area through the creation of fields of solar energy,windmills and convert that energy into electrical energy is provided to cover the wholevillages and buildings in particular.
And after all that we can answer the most important questions in that thesis is:
What is the role of clean energy to global warming?What is relationship between Nanoarchitecture and global warming, how itcan be dealt with?How can integration of clean energy and Nanoarchitecture to reduce globalwarming?
The answer to these important questions is shown through many ways mentioned in partfour:
First Aspect:
Shows the key role of clean energy and of solar cells and windmills to reduce theconsumption of energy produced from burning petroleum and reliance on clean energy, which provide a rich source of energy as it is the Egypt of the climate allows to build fieldsof solar energy in the desert as well as the fields of windmills, which produces enormousenergy and reliable in different parts of Egypt, such as Zafarana and Dabaa, etc., with thedraw of it, though the cost of those fields above, it is given the amounts that will beprovided over the years, those costs are minimal compared to what is spent now to coverthe needs growing in the Arab world in general and Egypt in particular and the relationshipof that energy to provide the needs of the public buildings of electricity.

Part Four (Application ) Chapter Seven (Application : Bibliotheca Alexandrina )
Second Aspect:
The contribution of nanomaterials in raising the efficiency of the building and itsoperational and conservation of energy waste by insulating the building from the outsideenvironment and to offer those articles of the solutions a healthy and environmentallyfriendly working on rationalizing electricity consumption and raise the performance of thebuilding and through smart features and positive and which are produced especially for oftheir high qualities. Entry of nanomaterials in the manufacture of solar cells and cleanenergy solutions, providing the space because of their small size and increases its efficiencybecause of its qualities of high quality.
Third Aspect:
The role of governments and the country in support of investments in the directionof the markets to serve the country in terms of economic and environmental terms ofcreating a healthy environment and help in solving the global problem of global warming, which was attended by all industrialized countries, which must also be involved in solvingthem together. With the need for the alarm to be that support for clean energy andnanomaterials gradually so as to rely on and draw up plans for five years to rely on thatenergy and support the emergence of nanomaterials, including the advantages of a largeserving architecture to solve the part responsible for global warming.
Four Aspect:
Through the study on Bibliotheca Alexandrina proved the close relationshipbetween the sources of clean energy from solar cells and wind mills and between thenanomaterials parties of the equation and one up the outcome of important a conversion ofexisting buildings for energy electricity to the premises of sustainable clean renewableenvironmentally friendly and their respective roles in providing constructive solutions tosolve the problem global warming and its relationship to architecture.
Five Aspect:
In the framework of the existing building converted from electric power torenewable energy should be taken in consideration the cultural interface of BibliothecaAlexandrina and the introduction of any external components must be smoothly, harmonyand consistently with the external elevation so as not to affect the value of buildingarchitecture.

Overall Conclusions and Recommendations.
Overall Conclusions And
Recommendations

Overall Conclusions and Recommendations.
Many information and studies have been presented and examined to cover all aspectof the addressed problem throughout this
and on Arab world and Egypt in particular. Also the construction and buildings sectoreffects, and role in increasing the negative effects of the global warming problem. Afteraddressing the problem, its main causes, and its negatives impacts on the individual level,and environmental level, demonstrating different detailed studies of modern architecturaltrends interested in decreasing this negative impacts of this sector. This could be achievedthrough the architectural and philosophical trends in the design process in the unit level andurban planning of modern cities. Nanotechnology role in solving the global warmingproblem through providing practical solutions, and modern technologies in the presenttime, and in the future, it contribute significantly in minimizing damages, finding outarchitectural processors via depending on the nanotechnology to reduce global warming, and to create new clean, carbon free, and healthy environment.
This summary review all the findings answering many questions addressedthroughout the thesis presented in nano-architecture and nanotechnology role in reducingthe negative effects of global warming, and finding out architectural and theoreticalstandards can be assembled or collected into new architectural, philosophical, andintellectual trend to maintain human health, and environment as well.
Principle One:
The global warming problem emerged in the industry revolution which invaded all ofworld factories, and depended on petroleum, and burning energy for a long period of timeand in different fields. This non renewable energy resulted in large amounts of oil wastes,harmful gas emissions causing ozone layer hole, black clouds, and many other damages. The major countries racing toward evolution caused significantly accelerating thesenegative effects harming the human beings and environment. Also the construction andbuildings sector is affected through using non-friendly environment, and harmful materials
the lighting systems also boosted by big jump in energy consumption rates whichnegatively affect cities energy reserves, increasing gases wastes such as harmful gasesemissions, and harmful non-recycled substances. Thus, solving these architecturalproblems, and finding new alternatives to reduce such gases emissions, and harmfulresiduals is a important necessity.
Principle Two:
An emphasis on intellectual trends and different architectural schools such as nano-architecture That provides different architectural solutions and treatments contributing

Overall Conclusions and Recommendations.
significantly in finding clear solutions helping in reducing the harmful effects of non-recycled and non- renewable materials and using clean and environment friendly substitutesto produce new architecture aiming mainly to provide healthy, comfortable, and livableenvironment. It is important to strengthening these intellectual trends which turned toviable and applicable trends through using nanotechnology to introduce smart and carbon-free materials in order to promote and develop the architectural environment, and the usedmaterials in building and construction via using new renewable energy systems, andmerging with it to reach to the efficient performance level of the building.
Principle Three:
The necessity of activating the government institutions role in monitoring the urbanplanning, and construction trends to support the intellectual trends, and the architecturalschools that mentioned earlier. As it supports protecting the natural resources and the urbanplanning trend creating clean environment, the monitoring role consist of two trends as thefollowings:
First trend: raising awareness of next generation of young engineers about thearchitectural schools maintaining the sustainability concept, and the clean environmentconcept, and many other concepts. There should be commitment to these concepts withoutany deviation because of its values contributing in maintaining the urban environment, and
Second trend: the role of the government institutions presented in control authorizesmonitoring the design process, enforcing necessary restrictions to maintain the designingidentity and concept inside and outside the urban communities in order to continuouslypreserving the environment. Also enacting powerful laws to punish any violators andissuing construction permissions only after the evaluation of designs and its role in
understanding of the designing standards during the designing and implementing processes.These laws should include building performance evaluation methods in pre-building stagewith detailed description of building components, how to implement the design, propersupervision of the country control and monitoring authorities on implementation stage,issuing building permissions based on these authorities reports.
Principle Four:
The decreasing of petroleum reserves all over the world turns most of government towardfinding new energy sources. These energy sources should have two basic conditions, to beclean energy, and to be renewable. It starts to appear in the developed countries aiming toreplace the petroleum energy with new clean energy such as solar energy, wind energy, and

Overall Conclusions and Recommendations.
water turbines energy and to gradually depending on it until full dependence throughsatisfying all the needs of energy on the building units level and new cities level. Thus theEgyptian government role is appears to be very important in this trend, many studies haveproved that through producing clean and renewable energy from wind energy in differentplaces across Egypt. Also the solar energy, storing the produced energy and converting it toa usable energy networked to the cities much in need.
Principle Five:
The nanotechnology contributes in improving the architectural product from newmaterials usable in the construction and building process. It directly contributes inimproving the building performance, and ensure new clean architecture environment freefrom harms resulting from different surrounding industrial complexes. Nanotechonlogy isvery important in emerging the smart sensor systems monitoring internal systemperformance inside the building, thermal emissions and different gases emissions high rateswarnings so the user can reduce these emissions by an assisting of new useful andenvironment friendly materials. Beside it also updating and finding new techniques in cleanenergy systems used in the infrastructure of manufacturing solar cells, windmills, and manyother systems contributing significantly in meeting the needs of different urbancommunities. Thus, the role of nanotechonolgy is an architectural environmental friendlytrend using all of the capabilities to serve the environment.
Principle Six:
Reference to the key role of this study and the role of nano-technology to speed upsolving the problem of global warming and that by controlling the material specificationsre-installed and that intervention in the construction of modern buildings as well as all thetechniques used in clean energy and materials free of carbon and characterized by its lowweight and strength in terms of hardness and small size in terms of dimensions andsurfaces, and higher performance in terms of use all this increased the value ofnanotechnology as an important factor and the accelerator to solve the problem of globalwarming.

References
References:
Textbooks:
(1) ArchiLab, Migayrou Frederic, Marie-Ange Brayer. Thames & Hudson. 2001.(2) Nano Materials in architecture, Interior architecture and Design. Leydecker, Sylvia. 2008.(3) Nanoarchitecture: A New Species of Architecture. Johansen John M. PrincetonArchitectural Press New York. 2002.(4) The Ecology of Building Materials Second Edition. Bjorn Berge. Elsevier Ltd. 2009.
(5) In Defense of Globalization. Bhagwati, Jagdish. Oxford, New York: OxfordUniversity Press. 2004.
(6) Ecological Design Handbook. Fred A.Stitt. UK Press.2000
(7) Contemporary Digital Architecture Design & Techniques. Jacobo Krauel. LinksPress. 2011.
(8) Smart Materials and New Technologies For the architecture and design professions. D. Michelle Addington Daniel L. Schodek. Architectural Press. 2005.(9) Smart Building Systems for Architects, Owners, and Builders. James Sinopoli.Butterworth-Heinemann is an imprint of Elsevier. 2010.(10) Nanomaterials,Nanotechnologies And Design. Michael F.Ashby, Paulo J.Ferreiraand Daniel L.Schodek. Butterworth-Heinemann is an imprint of Elsevier. 2009.(11) Digital Architecture Now: A Global Survey of Emerging Talent. Neil Spiller. UKPress.2008
Web articles:
(1) What s nanotechnology. http://www.nano.org.uk/whatis.htm. Retrieved September, 2011.(2) What s nanotechnology. http://www.nano.org.uk/whatis.htm. Retrieved May, 2011.(3) Why the future of architecture does not need us: What becomes of Louis Khanwhen buildings actually know what they want to be?. Hosey, Lance.http://archrecord.construction.com/inTheCause/0602ArchiFuture/archiFuture.asp.Retrieved March, 2011. (4) Nanomachines. http://whatis.techtarget.com/definition/0,,sid9_gci514355,00.html.Retrieved September, 2008.(5)Nanostudio explores architecture and nanotechnology.http://www.nanotechbuzz.com/50226711/nanostudio_explores_architecture_and_nanotechnology.php. Retrieved September, 2011.(6) Nanotechnology,http://www.referenceworld.com/mosgroup/globalization/nanotechnology.html. RetrievedMay, 2011.(7) Nanotechnology.

References
http://www.referenceworld.com/mosgroup/globalization/nanotechnology.html.June, 2011.(8) Globalization. http://en.wikipedia.org/wiki/globalization.html. Retrieved December,2010.(9) Globalization. http://www.globalpolicy.org:80/globaliz/define/index.htm. RetrievedApril, 2010.
Websites:
(1) http://aarambula.iweb.bsu.edu/arch302/foundation.pdf. Retrieved September, 2010.(2) http://www.freefoto.com/preview/1210-14-23?ffid=1210-14-23. (3) http://www.greatbuildings.com. Retrieved December, 2010.(4) http://www.primidi.com/2004/09/12.html. Retrieved April, 2010.(5) http://www.sciencemuseum.org.uk/antenna/nano/lifestyle/131.asp. Retrieved April,2010.(6) Igloo. http://en.wikipedia.org/wiki/Igloo. Retrieved May, 2010.(7) Map of Egypt. http://www.google.com/maps. Retrieved March, 2010. (8) Nanohouse. http://www.csiro.au/files/mediaRelease/mr2003/Prnanohouse.htm.Retrieved March, 2010.(9) Nanohouse. http://www.nano.uts.edu.au/about/australia.html. Retrieved March, 2011.(10) Nanopedia. http://nanopedia.case.edu. Retrieved April, 2011.(11) http://www.nanoscience-europe.org/page.php?optim=What-is-nanoscience--RetrievedJune, 2010.(12) Nanostudio. http://daheadley.iweb.bsu.edu/NanoStudio2/. Retrieved September, 2011.(13) Nanotechnology. http://www.phys.ufl.edu/~teresa/nano/index.html. RetrievedJuly,2011. (14)Nanotechnology. . Retrieved September, 2011.(15) http://library.thinkquest.org/J003411/causes.htm Retrieved March, 2011.(16) http://ezinearticles.com/?The-Prime-Reasons-and-Causes-Of-Global-Warming&id=652734 Retrieved November, 2011.(17) http://earth-habitat.blogspot.com/ Retrieved September, 2011. (18) http://www.oceanchampions.org/GlobalWarming/ Retrieved September, 2011.(19) https://www.llnl.gov/str/December02/December50th.html. Retrieved September, 2011.(20) http://en.wikipedia.org/wiki/Architectural_theory#Contemporary. Retrieved June,2008.(21) http://www.greatbuildings.com/discussion.html Retrieved September, 2008.(22) http://www.answers.com/topic/urban-heat-island. Retrieved September, 2008.(23) www.progress.org/ What We Use and What We Have: Ecological Footprint and Ecological Capacity. Retrieved September, 2008.(24) http://www.simplyenjoy.info Retrieved January, 2011.(25) http://en.wikipedia.org/wiki/Green_building#Goals_of_green_building. RetrievedOctober, 2011.(26) http://en.wikipedia.org/wiki/Green_building#Goals_of_green_building RetrievedOctober, 2011.

References
(27)http://wiki.uelceca.net/msc1011/files/Swarm+Architecture+and+the+personalized+city.pdf. Retrieved September, 2011.(28) http://www.ibec.or.jp/CASBEE/english/download.htm. Retrieved September, 2011.(29) http://www.greenpeace.org/raw/content/international/press/reports/renewable-energy-and-climate.pdf. Retrieved October, 2011.(30) http://www.second-street.com/PortfolioCleanEnergy.html. Retrieved October, 2011.(31) http://www.greendimensions.wikidot.com/nanotechnology-in-architecture. RetrievedOctober, 2011.
Periodical:
(1) EPA And Nanotechnology: Oversight for the 21st Century, J.Clarence Davies PEN9. May 2007 http://www.nanotechproject/filedownload/files/nano&EPA PEN9.pdf. Retrieved September2011(2) Nanotechnology and Developing Countries Part 2: What Realities?http://www.azonano.com/details.asp?ArticleID=1429


Buy your books fast and straightforward online - at one of world’s
fastest growing online book stores! Environmentally sound due to
Print-on-Demand technologies.
Buy your books online at
www.get-morebooks.com
Kaufen Sie Ihre Bücher schnell und unkompliziert online – auf einer
der am schnellsten wachsenden Buchhandelsplattformen weltweit!
Dank Print-On-Demand umwelt- und ressourcenschonend produzi-
ert.
Bücher schneller online kaufen
www.morebooks.deVDM Verlagsservicegesellschaft mbH
Heinrich-Böcking-Str. 6-8 Telefon: +49 681 3720 174 [email protected] - 66121 Saarbrücken Telefax: +49 681 3720 1749 www.vdm-vsg.de


Copyright © 2022 FDOKUMEN