synthesis of carbon nanomaterials on - UM Students' Repository
291
SYNTHESIS OF CARBON NANOMATERIALS ON IMPREGNATED POWDERED ACTIVATED CARBON FOR REMOVAL OF ORGANIC COMPOUNDS FROM WATER HAIYAM MOHAMMED ABDALRAHEEM ALAYAN FACULTY OF ENGINEERING UNIVERSITY OF MALAYA KUALA LUMPUR 2018 University of Malaya
-
Upload
khangminh22 -
Category
Documents
-
view
1 -
download
0
Transcript of synthesis of carbon nanomaterials on - UM Students' Repository

SYNTHESIS OF CARBON NANOMATERIALS ON IMPREGNATED POWDERED ACTIVATED CARBON FOR REMOVAL OF ORGANIC COMPOUNDS FROM WATER
HAIYAM MOHAMMED ABDALRAHEEM ALAYAN
FACULTY OF ENGINEERING
UNIVERSITY OF MALAYA KUALA LUMPUR
2018
Univers
ity of
Mala
ya

SYNTHESIS OF CARBON NANOMATERIALS ON
IMPREGNATED POWDERED ACTIVATED CARBON FOR
REMOVAL OF ORGANIC COMPOUNDS FROM WATER
HAIYAM MOHAMMED ABDALRAHEEM ALAYAN
THESIS SUBMITTED IN FULFILMENT OF THE
REQUIREMENTS FOR THE DEGREE OF DOCTOR OF
PHILOSOPHY
FACULTY OF ENGINEERING
UNIVERSITY OF MALAYA
KUALA LUMPUR
2018
Univers
ity of
Mala
ya

ii
UNIVERSITY OF MALAYA
ORIGINAL LITERARY WORK DECLARATION
Name of Candidate: Haiyam Mohammed Alayan
Matric No: KHA14
Name of Degree: Doctor of Philosophy
Title of Project Paper/Research Report/Dissertation/Thesis (“this Work”): Synthesis
of carbon nanomaterials on impregnated powdered activated carbon for removal of
organic compounds from water
Field of Study: Advanced Materials & Technology
I do solemnly and sincerely declare that:
(1) I am the sole author/writer of this Work;
(2) This Work is original;
(3) Any use of any work in which copyright exists was done by way of fair dealing
and for permitted purposes and any excerpt or extract from, or reference to or
reproduction of any copyright work has been disclosed expressly and sufficiently and the
title of the Work and its authorship have been acknowledged in this Work;
(4) I do not have any actual knowledge nor do I ought reasonably to know that the
making of this work constitutes an infringement of any copyright work;
(5) I hereby assign all and every rights in the copyright to this Work to the University
of Malaya (“UM”), who henceforth shall be owner of the copyright in this Work and that
any reproduction or use in any form or by any means whatsoever is prohibited without
the written consent of UM having been first had and obtained;
(6) I am fully aware that if in the course of making this Work I have infringed any
copyright whether intentionally or otherwise, I may be subject to legal action or any other
action as may be determined by UM.
Candidate’s Signature Date:
Subscribed and solemnly declared before,
Witness’s Signature Date:
Name:
Designation:
Univers
ity of
Mala
ya

iii
SYNTHESIS OF CARBON NANOMATERIALS ON IMPREGNATED
POWDERED ACTIVATED CARBON FOR REMOVAL OF ORGANIC
COMPOUNDS FROM WATER
ABSTRACT
Carbon nanomaterials (CNMs) are known to be superior to many other existing
materials in terms of their remarkable properties. Despite of their strong adsorption
affinity, they are limited in practical water treatment application for their difficulties
involved in dispersion and separation. Moreover, wastewater contamination by toxic
organic compounds has become a world-wide environmental concern because of the
undesirable effects of these contaminants. Therefore, this research has been undertaken
to explore the potential of directly growing CNMs on microscale support such as the
powder activated carbon (PAC) to develop a novel CNM hybrid adsorbent for the
removal of bisphenol A (BPA) and methylene blue (MB) from water. In this regard,
chemical vapor deposition reactor (CVD) was used to synthesize CNMs on nickel
impregnated powdered activated carbon from the decomposition of methane and
acetylene. The Design of experiment (DOE) based on the response surface methodology
(RSM) with the central composite design (CCD) was used to optimize the reaction
temperature, reaction time and gases flowrates to obtain the maximum adsorption along
with the maximum possible yield for CNM. The results demonstrated that the optimum
conditions were different depending on the characteristics of the carbon precursor and the
adsorbate under investigation. The optimized growth conditions for methane
decomposition were found at 933 ºC, 20 min, and (H2/CH4) of 1.0. The produced CNM-
PAC had multi-structures with groove-like features. Meanwhile, dense carbon nanotubes
(CNTs) with tubular structures were dominant in the product obtained from the pyrolysis
of acetylene at the optimum growth conditions of a reaction temperature of 550 ºC, a
Univers
ity of
Mala
ya

iv
reaction time of 37.3 min, and a gas ratio (H2/C2H2) of 1.0. The physiochemical, and
morphological properties of CNM-PAC samples at the optimal conditions were
investigated using FESEM, TEM, EDX, BET, Raman spectroscopy, TGA, FTIR, and
zeta potential. Adsorption studies for BPA and MB were carried out to evaluate the
optimum removal conditions, kinetic, and isotherms. RSM-CCD experimental design
was used to conduct the optimization studies and to determine the optimal conditions for
the removal of BPA and MB by each selected adsorbent individually. The proposed
models were optimized with respect to the operating pH, adsorbent mass and contact time
as controlling parameters to correlate their effects on the removal efficiency of the
pollutants and the adsorption capacity of the adsorbent. The optimization study showed
that the maximum adsorption capacity for the removal of BPA and MB onto the CNM-
PAC produced from methane was about 182 and 250 mg/g, respectively. The surface
properties of CNT-PAC obtained from the pyrolysis of acetylene were modified by
oxidative functionalization using two different methods: sonication with KMnO4, and
with KMnO4/ H2SO4, however, the best removal of MB was obtained with the as-
prepared CNT-PAC sample. The adsorption behaviors showed that the adsorption
kinetics and isotherms were in good agreement with the pseudo second-order equation
and the Langmuir isotherm model, respectively with a maximum adsorption capacity of
about 175 mg/g.
Keywords: carbon nanomaterials, chemical vapor deposition, bisphenol A, methylene
blue, response surface methodology.
Univers
ity of
Mala
ya

v
SYNTHESIS OF CARBON NANOMATERIALS ON IMPREGNATED
POWDERED ACTIVATED CARBON FOR REMOVAL OF ORGANIC
COMPOUNDS FROM WATER
ABSTRAK
Bahan nanomaterial karbon (CNMs) umumnya dipandang tinggi atau hebat
berbanding daripada bahan-bahan lain dari segi sifat-sifat luar biasa yang dimilikinya.
Walaupun mempunyai kadar penyerapan yang kuat, penggunaan CNMs dalam aplikasi
rawatan air terutama bagi proses penyebaran dan pemisahan adalah terhad. Oleh itu,
kajian ini telah dijalankan bagi meneroka potensi penghasilan CNM secara langsung
terhadap sokongan berskala mikro seperti matriks karbon aktif untuk membangunkan
penjerap hibrid berasaskan CNM yang baru, bagi proses penyingkiran bisphenol A (BPA)
dan metilena biru (MB) daripada air. Dalam hal ini, reaktor pemendapan wap kimia
(CVD) telah digunakan untuk menghasilkan CNMs daripada karbon aktif serbuk (PAC)
melalui penguraian metana dan asetilena. Perisian Design of experiment (DOE) melalui
metodologi response surface methodology (RSM) dengan central composite design
(CCD) telah digunakan bagi melihat kesan tindak balas suhu, tindak balas masa dan kadar
aliran gas pada prestasi penjerapan bersama-sama penghasilan maksimum CNM. Hasil
kajian ini menunjukkan bahawa keadaan optimum untuk mendapatkan peratusan
penyingkiran tertinggi dan juga penghasilan CNM tertinggi adalah berbeza bergantung
kepada ciri-ciri karbon dan penyerap yang dikaji. Keadaan pertumbuhan optimum untuk
penguraian metana didapati pada 933 ºC, 20 min, dan (H2 / CH4) sebanyak 1.0. CNM-
PAC yang dihasilkan mempunyai pelbagai struktur dengan ciri-ciri seperti alur, dan
serupa dengan keadaan permukaan sokongan PAC. Sementara itu, nanotiub karbon
(CNTs) yang padat dengan struktur-struktur tiub, telah mendominasi produk yang
diperolehi hasil proses pirolisis daripada asetilena. Hasil tertinggi didapati pada keadaan
pertumbuhan optimum pada suhu tindak balas 550 ºC, masa tindak balas 37.3 minit, dan
Univers
ity of
Mala
ya

vi
nisbah gas (H2 / C2H2) sebanyak 1.0. Berdasarkan ujian pengoptimuman, sifat fisio-kimia,
dan morfologi sampel CNM-PAC yang disediakan pada keadaan optimum telah disiasat
menggunakan potensi spektrum FESEM, TEM, EDX, BET, Raman spektroskopi, TGA,
dan FTIR. Kajian penyerapan untuk BPA dan MB telah dijalankan untuk menilai keadaan
optimum bagi penyingkiran, kinetik dan juga isoterm. Design eksperimen RSM-CCD
telah digunakan bagi kajian pengoptimuman dan juga untuk menentukan keadaan
optimum bagi penyingkiran BPA dan MB oleh setiap penjerap yang terpilih. Model yang
dicadangkan dioptimumkan berdasarkan pH operasi, jisim penjerap dan masa hubungan
sebagai parameter kawalan untuk mengaitkan kesannya ke atas kecekapan penyingkiran
bahan pencemar dan keupayaan penjerap penyerap. Kajian pengoptimuman
menunjukkan bahawa kapasiti penyerapan maksimum untuk penyingkiran BPA dan MB
ke atas CNM-PAC yang dihasilkan daripada metana adalah masing-masing sekitar 182
dan 250 mg/g. Sifat permukaan CNT-PAC yang diperoleh hasil daripada pirolisis
asetilena yang telah diubahsuai oleh fungsian oksidatif menggunakan dua kaedah yang
berbeza: proses sonication dengan KMnO4, dan dengan KMnO4/ H2SO4. Proses
penyaringan telah dilakukan bagi penyingkiran MB daripada air menggunakan CNT-
PAC yang telah disediakan dan sampel yang telah diubahsuai untuk memilih penyerap
yang terbaik dengan kecekapan penyingkiran tertinggi. Dengan membandingkan
keputusan yang diperolehi, penyingkiran terbaik oleh MB telah diperolehi dengan
menggunakan sampel CNT-PAC. Data ekuilibrium telah dianalisis bagi sistem penyerap
- penjerap yang menghasilkan kapasiti penjerapan maksimum sekitar 175 mg/g. Ciri-ciri
penjerapan untuk semua jenis penjerap menunjukkan bahawa penjerapan kinetik dan
isoterm mematuhi prinsip persamaan urutan pseudo kedua dan model Langmuir isoterm.
Keywords: carbon nanomaterials, chemical vapor deposition, bisphenol A, methylene
blue, response surface methodology.
Univers
ity of
Mala
ya

vii
ACKNOWLEDGEMENTS
In the name of Allah, the Most Gracious and the Most Merciful.
First and foremost, all the praises and deep gratitude towards almighty Allah who has
given me the ability to pursue my studies at doctorate level.
I would like to extend my sincere appreciation to my main supervisor, Prof. Dr. Mohd
Ali bin Hashim for his continued support and encouragement. I am grateful to Prof. Ali
for allowing me to join the University of Malaya Centre for Ionic Liquids (UMCiL)
group, and for his kindness and valuable advice during my academic endeavors despite
his hectic schedule and growing responsibilities.
I would like to express my sincere gratitude to my co-supervisor Dr. Mohammed
Abdulhakim AlSaadi for giving me the opportunity to work on this project as well as for
his helpful supervision, generous support and persistent tolerance.
I would also extend my earnest gratitude to University of Malaya for making this study
possible by providing funds and facilities. I owe gratitude to the support provided by all
staff of the Department of Chemical Engineering during my research. Special thanks and
warmest gratitude to my friends and colleagues who have given their time, know-how,
technical assistance and kind consideration during my research.
Most importantly, none of this would have been possible without all sacrifices of my
husband and my children. I am indebted to them for their diligent support with special
care and love. Words cannot express my deepest and most heart-felt gratitude to my
beloved mother and all my family members for their unwavering encouragement and
prayers throughout my ups and downs. Last but definitely not least, I would like to
dedicate this achievement to the memory of my beloved father who was constantly
inspiring me to thrive for the betterment.
Univers
ity of
Mala
ya
viii
TABLE OF CONTENTS
Abstract ............................................................................................................................ iii
Abstrak .............................................................................................................................. v
Acknowledgements ......................................................................................................... vii
Table of Contents ........................................................................................................... viii
List of Figures ................................................................................................................. xv
List of Tables ................................................................................................................. xix
List of Symbols and Abbreviations .............................................................................. xxiii
CHAPTER 1: INTRODUCTION .................................................................................. 1
1.1 Overview ................................................................................................................. 1
1.2 Problem statement ................................................................................................... 3
1.3 Research objectives ................................................................................................. 6
1.4 Research scope ........................................................................................................ 7
1.5 Research methodology ............................................................................................ 7
1.6 Outline of the thesis ................................................................................................. 8
CHAPTER 2: LITERATURE REVIEW .................................................................... 10
2.1 Introduction ........................................................................................................... 10
2.2 Carbon nanotubes .................................................................................................. 11
2.2.1 Structure of carbon nanotubes .................................................................. 11
2.2.2 Properties and uses of carbon nanotubes .................................................. 13
2.2.2.1 Electrical properties .................................................................. 13
2.2.2.2 Mechanical properties ............................................................... 14
2.2.2.3 Thermal properties .................................................................... 15
2.2.2.4 Chemical properties .................................................................. 15
Univers
ity of
Mala
ya

ix
2.2.2.5 Adsorption properties ................................................................ 16
2.2.3 Multi-scale/ hybridized carbon structure .................................................. 23
2.2.4 Powder Activated carbon catalyzing the synthesis of carbon nanotubes . 25
2.2.5 Synthesis of carbon nanotubes ................................................................. 26
2.2.5.1 Arc discharge ............................................................................ 26
2.2.5.2 Laser ablation ............................................................................ 27
2.2.5.3 Chemical vapor deposition (CVD) ............................................ 29
2.2.5.4 CVD support catalyst method ................................................... 35
2.2.6 Mechanism of nanotube growth in CVD ................................................. 37
2.2.7 Functionalization of carbon nanotubes .................................................... 41
2.3 Organic pollutants ................................................................................................. 45
2.3.1 Bisphenol A .............................................................................................. 45
2.3.1.1 Structure and physicochemical properties of bisphenol A ........ 45
2.3.1.2 Production and application ........................................................ 46
2.3.1.3 Exposure of BPA to the environment ....................................... 47
2.3.1.4 Hazardous potential of BPA ...................................................... 49
2.3.1.5 Treatment methods .................................................................... 51
2.3.1.6 BPA removal by miscellaneous adsorbents .............................. 52
2.3.2 Organic dyes ............................................................................................. 60
2.3.2.1 Structure and physicochemical properties of methylene blue ... 60
2.3.2.2 MB removal techniques ............................................................ 62
2.3.2.3 MB removal by miscellaneous adsorbents ................................ 64
2.4 Mechanism of adsorption on CNMs ...................................................................... 69
2.4.1 Mechanism of adsorption of Bisphenol A onto CNMs ............................ 73
2.4.2 Mechanism of adsorption of methylene blue onto CNMs ....................... 76
2.5 Summary of literature review ................................................................................ 78
Univers
ity of
Mala
ya

x
CHAPTER 3: METHODOLOGY ............................................................................... 80
3.1 Introduction ........................................................................................................... 80
3.2 Materials ................................................................................................................ 80
3.3 Instruments and measurements .............................................................................. 82
3.3.1 Chemical vapor deposition reactor (CVD) ............................................... 82
3.3.2 Instruments and equipment for characterization ...................................... 85
3.3.3 Additional instruments ............................................................................. 85
3.4 Methods ................................................................................................................. 86
3.4.1 Experimental Approach for carbon nanomaterials synthesis ................... 86
3.4.1.1 Catalyst and support preparation ............................................... 86
3.4.1.2 Growth of carbon nanomaterials on powdered activated
carbon ........................................................................................ 87
3.4.1.3 Optimization of operating conditions for CNM-PAC growth .. 88
3.4.2 Design of experiment (DOE) for synthesis CNM-PAC ........................... 88
3.4.3 Functionalization of CNM-PAC for comparison ..................................... 91
3.4.4 Adsorption studies .................................................................................... 92
3.4.4.1 Batch adsorption experiments ................................................... 92
3.4.4.2 Optimization of adsorption conditions ...................................... 93
3.4.4.3 Kinetic studies ........................................................................... 95
3.4.4.4 Adsorption isotherms ................................................................ 98
3.4.4.5 Screening and optimization of functionalized CNM-PAC ..... 102
3.4.5 Characterization ..................................................................................... 103
3.4.6 General research plan flow chart ............................................................ 104
CHAPTER 4: SYNTHESIZING AND ADSORPTION STUDIES FOR CNM-PAC
FROM METHANE DECOMPOSITION ................................................................. 105
Univers
ity of
Mala
ya

xi
4.1 Screening of CNM-PAC synthesis conditions .................................................... 105
4.1.1 Design of Experiment (DOE) for Production of CNM-PAC from methane
decomposition ........................................................................................ 105
4.1.2 Adsorption of BPA for DOE Screening ................................................. 106
4.2 Statistical Analysis for the CNM-PAC growth ................................................... 107
4.2.1 Analysis of variance (ANOVA) for the yield of CNM-PAC ................. 107
4.2.2 Analysis of variance (ANOVA) for the removal of BPA onto CNM-PAC
110
4.2.3 The interactive effects of selected parameters on the CNM-PAC growth
and BPA adsorption ............................................................................... 112
4.2.4 Summary of the optimization conditions for CNM-PAC synthesis from
methane decomposition .......................................................................... 116
4.3 Adsorption of bisphenol A (BPA) ....................................................................... 117
4.3.1 Design of experiment (DOE) for BPA adsorption ................................. 117
4.3.2 Analysis of variance (ANOVA) ............................................................. 118
4.3.3 The interactive effects of selected parameters on BPA adsorption ........ 123
4.3.4 Adsorption Kinetics ................................................................................ 125
4.3.5 Adsorption isotherms ............................................................................. 128
4.3.6 Mechanisms ............................................................................................ 132
4.3.7 Summary of the adsorption of BPA onto CNM-PAC ............................ 133
4.4 Adsorption of methylene blue (MB) ................................................................... 133
4.4.1 Design of experiment (DOE) for MB adsorption ................................... 133
4.4.2 Analysis of variance (ANOVA) ............................................................. 134
4.4.3 The interactive effects of selected parameters on MB adsorption ......... 138
4.4.4 Adsorption kinetics ................................................................................ 141
4.4.5 Adsorption isotherms ............................................................................. 145
Univers
ity of
Mala
ya

xii
4.4.6 Mechanisms ............................................................................................ 148
4.4.7 Summary of the adsorption of MB onto CNM-PAC ............................. 148
CHAPTER 5: CHARACTERIZATION OF CNM-PAC SYNTHESIZED FROM
METHANE DECOMPOSITION .............................................................................. 150
5.1.1 Morphology and surface elemental analysis .......................................... 150
5.1.2 Raman spectroscopy ............................................................................... 154
5.1.3 Thermogravimetric analysis (TGA) ....................................................... 156
5.1.4 Surface chemistry analysis (FTIR) for BPA adsorption ........................ 158
5.1.5 Surface chemistry analysis (FTIR) for MB adsorption .......................... 159
5.1.6 BET Surface area ................................................................................... 162
5.1.7 Point of zero of charge (PZC) ................................................................ 163
5.1.8 Zeta potential .......................................................................................... 164
5.1.9 Summary of characterization ................................................................. 166
CHAPTER 6: SYNTHESIZING AND ADSORPTION STUDIES FOR CNM-PAC
FROM ACETYLENE DECOMPOSITION ............................................................. 167
6.1 Screening of CNM-PAC synthesis conditions .................................................... 167
6.1.1 DOE for production of CNM-PAC from acetylene decomposition ....... 167
6.1.2 Adsorption of MB for DOE Screening .................................................. 168
6.2 Statistical Analysis for the CNM-PAC growth ................................................... 169
6.2.1 Analysis of variance (ANOVA) for the yield of CNM-PAC ................. 169
6.2.2 Analysis of variance (ANOVA) for the removal of MB onto CNM-PAC
171
6.2.3 Effects of reaction temperature, reaction time and gas Ratio................. 174
Univers
ity of
Mala
ya

xiii
6.2.4 Optimization of the selected parameters and study their interactive effects
on the CNM-PAC growth ...................................................................... 177
6.2.5 Summary of optimization the conditions of CNM-PAC synthesis from
acetylene decomposition ........................................................................ 181
6.3 Adsorption of Methylene blue (MB) ................................................................... 182
6.3.1 Primary screening ................................................................................... 182
6.3.2 Design of experiment (DOE) for MB adsorption ................................... 184
6.3.3 Analysis of variance (ANOVA) ............................................................. 185
6.3.4 The interactive effects of selected parameters on the adsorption of MB on
O-CNT .................................................................................................... 188
6.3.5 Adsorption Kinetics ................................................................................ 192
6.3.6 Adsorption isotherms ............................................................................. 194
6.3.7 Mechanisms ............................................................................................ 197
6.3.8 Summary of the adsorption of MB onto O-CNT ................................... 199
CHAPTER 7: CHARACTERIZATION OF CNM-PAC SYNTHESIZED FROM
ACETYLENE DECOMPOSITION .......................................................................... 200
7.1 FESEM and TEM analyses.................................................................................. 200
7.2 Raman spectroscopy ............................................................................................ 202
7.3 Thermogravimetric analysis (TGA) .................................................................... 203
7.4 Surface chemistry analysis (FTIR) ...................................................................... 205
7.5 BET Surface area ................................................................................................. 206
7.6 Zeta potential ....................................................................................................... 207
7.7 Summary of characterization ............................................................................... 209
CHAPTER 8: CONCLUSIONS AND RECOMMENDATIONS ........................... 210
Univers
ity of
Mala
ya

xiv
8.1 Conclusion ........................................................................................................... 210
8.1.1 Synthesizing of carbon nanomaterials on powder activated substrate from
methane decomposition .......................................................................... 210
8.1.2 Synthesizing of carbon nanomaterials on powder activated substrate from
acetylene decomposition ........................................................................ 213
8.2 Recommendations ............................................................................................... 215
REFERENCES….. ...................................................................................................... 217
LIST OF PUBLICATIONS ....................................................................................... 265
Univers
ity of
Mala
ya

xv
LIST OF FIGURES
Figure 2.1: Graphite carbon sp2 hybridization. ............................................................... 12
Figure 2.2: Schematic models describing single-walled and multi-walled carbon
nanotubes conceptually obtained from single graphene sheets (Mubarak,
Sahu, et al., 2014). ....................................................................................... 13
Figure 2.3: Schematic diagram of arc-discharge apparatus. .......................................... 27
Figure 2.4: Schematic drawings of a laser ablation. ....................................................... 28
Figure 2.5: Schematic diagram of a CVD setup in its simplest form (Atchudan et al.,
2015). ........................................................................................................... 31
Figure 2.6: Schematic diagram of thermal CVD apparatus. ........................................... 37
Figure 2.7: Widely-accepted growth mechanisms for CNTs: (a) tip-growth model, (b)
base-growth model (Kumar & Ando, 2010). ............................................... 39
Figure 2.8: Strategies for chemical and physical functionalization of CNTs: a) covalent
sidewall functionalization, b) covalent defect sidewall functionalization, c)
non-covalent adsorption of surfactants, d) wrapping of polymers, and e)
endohedral functionalization (Hussain & Mitra, 2011). .............................. 42
Figure 2.9: BPA molecular structure (Pullket, 2015). ................................................... 45
Figure 2.10: Chemical production of BPA. .................................................................... 46
Figure 2.11: Different adsorption sites on a homogeneous bundle of partially open-ended
SWCNTs: (1) internal, (2) interstitial channel, (3) external groove site, and
(4) external surface (Agnihotri et al., 2006). ............................................... 71
Figure 2.12: Schematic diagrams for adsorption of BPA on SWCNT. The letters I, II, III,
and IV indicate the possible adsorption areas of surface, groove, interstitial
spaces, and inner pores, respectively. SWCNT is presented as an example.
BPA 1 is adsorbed on CNT with two benzene rings in the direction of tube
axis. BPA 2 show the adsorption on the surface, whereas BPA 3 illustrate the
wedging of this molecule in the groove area. The interstitial space is too small
for the molecules to fit (Pan et al., 2008). ................................................... 75
Figure 2.13: Schematic illustration of the possible interaction between MWCNTs and
methylene blue: (a) electrostatic attraction and (b) π–π stacking (Ai, Zhang,
Liao, et al., 2011). ........................................................................................ 76
Univers
ity of
Mala
ya

xvi
Figure 3.1: Photograph of the in-situ CVD reactor. ........................................................ 84
Figure 3.2: The experimental activities of this research. ................................................ 86
Figure 3.3: First-order kinetic model illustration. ........................................................... 96
Figure 3.4: Second-order kinetic model illustration. ...................................................... 97
Figure 3.5: Intraparticle diffusion kinetic model. ........................................................... 98
Figure 3.6: Langmuir isotherm model. ........................................................................... 99
Figure 3.7: Freundlich isotherm model. ........................................................................ 101
Figure 3.8: Temkin isotherm model. ............................................................................. 102
Figure 3.9: Schematic diagram of the methodology adopted. ...................................... 104
Figure 4.1: Predicted values vs. actual values CNM-PAC growth response. ............... 109
Figure 4.2: Predicted values vs. actual values BPA removal response. ....................... 112
Figure 4.3: Three-dimensional response surface representation for: CNM-PAC growth
yield (Y), and BPA removal efficiency (RV %); (a, b) interaction with growth
temperature and time, (c, d) interaction with growth temperature and gas ratio
and (e, f) interaction with time and gas ratio. ............................................ 115
Figure 4.4: Predicted values vs. actual values for (a) BPA removal efficiency (RV1 %)
and (b) adsorption capacity (Q1) on CNM-PAC. ...................................... 121
Figure 4.5: RSM plots of (a) BPA removal efficiency (RV1 %), and (b) adsorbent
capacity (Q1) considering the effect of pH and dosage. ........................... 123
Figure 4.6: RSM plots of (a) BPA removal efficiency (RV1 %), and (b) adsorbent
capacity (Q1) considering the effect of pH and contact time. ................... 124
Figure 4.7: Pseudo-first order kinetic model for BPA adsorption. ............................... 127
Figure 4.8: Pseudo-second order kinetic model for BPA adsorption. .......................... 127
Figure 4.9: Intraparticle diffusion kinetic model for BPA adsorption. ......................... 128
Figure 4.10: Langmuir isotherm model for BPA adsorption. ....................................... 129
Figure 4.11: Freundlich isotherm model for BPA adsorption. ..................................... 130
Figure 4.12: Temkin isotherm model for BPA adsorption. .......................................... 130
Univers
ity of
Mala
ya

xvii
Figure 4.13: Predicted values versus actual values for (a) removal response and (b)
adsorption capacity response. .................................................................... 137
Figure 4.14: RSM plots of MB removal efficiency and adsorbent capacity considering the
effect of (a) pH and dose, (b) pH and contact time and (c) dose and contact
time. ........................................................................................................... 139
Figure 4.15: RSM plots of the adsorption capacity considering the effect of (a) pH and
dose, (b) pH and contact time and (c) dose and contact time. ................... 140
Figure 4.16: Fittings of different kinetics models for MB adsorption on the synthesized
CNM-PAC; (a) Pseudo-first order, (b) Pseudo-second order and (c)
Intraparticle diffusion at optimum conditions. .......................................... 144
Figure 4.17: The isotherm plots for MB adsorption on CNM-PAC following (a)
Langmuir, (b) Freundlich, and (c) Temkin model. .................................... 146
Figure 5.1: (a) FESEM and (b) TEM images for Ni-PAC before growth reaction. ..... 151
Figure 5.2: (a) FESEM and (b) TEM images of CNM-PAC obtained at optimal
conditions. ................................................................................................. 152
Figure 5.3: EDX analyses for (a) PAC, (b) Ni-PAC and (c) CNM-PAC synthesized at
optimal conditions. .................................................................................... 154
Figure 5.4: Raman spectra of Ni-PAC and CNM-PAC. ............................................... 155
Figure 5.5: TGA curves for PAC, Ni-PAC and CNM-PAC. ........................................ 157
Figure 5.6: FTIR spectra of BPA, CNM-PAC before, and after BPA adsorption. ....... 159
Figure 5.7: FTIR spectrums for free MB and CNM-PAC before and after adsorption.
................................................................................................................... 161
Figure 5.8: Determination of the point of zero charge of the CNM-PAC by the pH drift
analysis. ..................................................................................................... 164
Figure 6.1: Predicted vs. actual values for CNM-PAC yield (YC2H2 %). ..................... 171
Figure 6.2: Predicted values vs. actual values MB removal response. ......................... 173
Figure 6.3: Response surface plots for the effects of reaction temperature and reaction
time on CNM-PAC (YC2H2); at fixed gas ratio 1.0 (a) and 4.0 (b), effects of
deposition temperature and gas ratio at fixed reaction time 20 (c) and 60 min
(d), and effects reaction time and gas ratio at fixed growth temperature 550oC
(e) and 750oC (f). ....................................................................................... 176
Univers
ity of
Mala
ya

xviii
Figure 6.4: Three-dimensional response surface representation for: MB removal
efficiency (RVc2H2 %) on CNM-PAC; (a) interaction with growth
temperature and time, (b) interaction with growth temperature and gas ratio
and (c) interaction with time and gas ratio. ............................................... 180
Figure 6.5: Primary screening study for all adsorbents. ............................................... 182
Figure 6.6: Effect of contact time on the removal efficiency of MB for all adsorbents.
................................................................................................................... 184
Figure 6.7: Predicted values vs. actual data for MB adsorption on O-CNT adsorbent (a)
removal (%) and (b) adsorbent capacity (mg /g). ...................................... 187
Figure 6.8: Surface response representation of the interaction of removal efficiency of
MB onto O-CNTs with (a) pH and dose, (b) pH and contact time and (c) dose
and contact time. ........................................................................................ 190
Figure 6.9: Surface response representation of the interaction of adsorption capacity of
MB onto O-CNTs with (a) pH and dose, (b) pH and contact time and (c) dose
and contact time. ........................................................................................ 191
Figure 6.10: Fittings of different kinetics models for MB adsorption on O-CNT; (a)
Pseudo-first order, (b) Pseudo-second order and (c) Intraparticle diffusion at
optimum conditions. .................................................................................. 193
Figure 6.11: The isotherm plots for MB adsorption on CNM-PAC; (a) Langmuir, (b)
Freundlich, and (c) Temkin model. ........................................................... 195
Figure 7.1: FESEM and TEM images of O-CNT. ........................................................ 201
Figure 7.2: FESEM image of CNT, CNF, CS and helix cum produced at 750 ºC. ...... 201
Figure 7.3: Raman spectrum of O-CNT and KS-CNT. ................................................ 203
Figure 7.4: TGA curves for O-CNTs, O-CNTs-MB, and KS-CNTs. ........................... 204
Figure 7.5: FTIR spectrum for O-CNTs, MB and O -CNTs-MB. ................................ 206
Figure 7.6: Determination of the point of zero charge of the O-CNTs by the pH drift.
................................................................................................................... 208
Univers
ity of
Mala
ya

xix
LIST OF TABLES
Table 2.1: Carbon nanotubes as organic compounds adsorbent. .................................... 18
Table 2.2: Comparison of arc-discharge, laser ablation and CVD methods. .................. 32
Table 2.3: Summary of synthesis of CNTs using CVD techniques. ............................... 34
Table 2.4: Physicochemical properties of bisphenol A. ................................................. 45
Table 2.5: Available quality standards for BPA in the aquatic matrices. ....................... 48
Table 2.6: Concentrations of BPA in aquatic environment in different countries. ......... 48
Table 2.7: Effects of low-dose of BPA exposure in animals. ......................................... 50
Table 2.8: Characteristics of some of different adsorbents used for BPA removal. ....... 54
Table 2.9: Properties and structure of methylene blue.................................................... 62
Table 2.10: Advantages and disadvantages of dyes removal methods (Robinson et al.,
2001). ............................................................................................................. 63
Table 2.11: Reported results of batch adsorption studies on the removal of MB from water
by different adsorbents. .................................................................................. 66
Table 3.1: List of reagents, chemicals and gases utilized in this research. ..................... 81
Table 3.2: General properties and chemical structure of bisphenol A. ........................... 81
Table 3.3: General properties and chemical structure of methylene blue. ...................... 82
Table 3.4: Technical specifications of CVD utilized in this research. ............................ 83
Table 3.5: Independent variables and their coded and actual levels in the CCD for CNM-
PAC synthesis from CH4 decomposition. ...................................................... 90
Table 3.6: Independent variables and their coded and actual levels in the CCD for CNM-
PAC synthesis from C2H2 decomposition. ..................................................... 90
Table 3.7: Experimental CCD data for the synthesis parameters of CNM-PAC using CH4
decomposition. ............................................................................................... 90
Table 3.8: Experimental CCD data for the synthesis parameters of CNM-PAC using C2H2
decomposition. ............................................................................................... 91
Table 3.9: List of design of experiments runs for BPA adsorption using CNM-PAC
obtained from CH4 decomposition. ................................................................ 94
Univers
ity of
Mala
ya

xx
Table 3.10: List of design of experiments runs for MB adsorption using CNM-PAC
obtained from CH4 decomposition. ................................................................ 94
Table 3.11: List of design of experiments runs for MB adsorption. ............................. 103
Table 4.1: Experimental CCD data for synthesis parameters from CH4 decomposition.
...................................................................................................................... 106
Table 4.2: ANOVA results for the yield of CNM-PAC growth. .................................. 108
Table 4.3: List of the actual and predicted values of the CNM-PAC yield. ................. 109
Table 4.4: ANOVA results for BPA removal % for CNM-PAC growth optimization 111
Table 4.5: List of the actual and predicted values of the BPA removal efficiency. ..... 111
Table 4.6: Constraints for optimization of production conditions for CNM-PAC for BPA
removal. ........................................................................................................ 116
Table 4.7: Solutions for the optimum conditions suggested by DOE software for CNM-
PAC growth. ................................................................................................. 116
Table 4.8: Summary of CCD for parameters of BPA adsorption on CNM-PAC. ........ 117
Table 4.9: CCD of experimental parameters for BPA removal by CNM-PAC. ........... 118
Table 4.10: ANOVA results for BPA Removal % (RV1) by CNM-PAC. ................... 119
Table 4.11: ANOVA results for BPA adsorption capacity (Q1) on CNM-PAC. ......... 120
Table 4.12: List of the actual and predicted values for BPA removal (RV1) and adsorption
capacity responses (Q1). ............................................................................ 120
Table 4.13: Constraints for optimization process based on CCD for BPA adsorption. 122
Table 4.14: Potential optimization conditions based on CCD for BPA removal. ....... 122
Table 4.15: Linearized equations of studied kinetic models for BPA adsorption on CNM-
PAC. ........................................................................................................... 126
Table 4.16: Linearized equations of studied isotherm models for BPA adsorption on
CNM-PAC. ................................................................................................ 131
Table 4.17: Previously reported maximum adsorption capacities of various adsorbents for
Bisphenol A removal. ................................................................................ 131
Table 4.18: Summary of CCD for MB adsorption variables on CNM-PAC. ............... 134
Univers
ity of
Mala
ya

xxi
Table 4.19: CCD of experimental variables for MB removal by CNM-PAC. ............. 134
Table 4.20: ANOVA results for MB Removal % (RV2) by CNM-PAC. .................... 136
Table 4.21: ANOVA results for MB adsorption capacity (Q2) by CNM-PAC. ........... 136
Table 4.22: List of the actual and predicted values for MB removal (RV2) and adsorption
capacity responses (Q2). ............................................................................ 137
Table 4.23: Constraints for optimization process based on CCD for MB adsorption. . 141
Table 4.24: Potential optimization conditions based on CCD for MB removal. ......... 141
Table 4.25: Linearized equations of studied kinetic models for MB adsorption on CNM-
PAC. ........................................................................................................... 143
Table 4.26: Linearized equations of studied isotherm models for MB adsorption on CNM-
PAC. ........................................................................................................... 147
Table 4.27: Comparison between the maximum adsorption capacity (qm) of CNM-PAC
and other reported adsorbents for MB removal. ........................................ 147
Table 5.1: Some of the predicted functional groups on the surface of synthesized CNM-
PAC before and after adsorption of organic pollutants. ............................... 162
Table 5.2: Summery of BET results for PAC, Ni-PAC and CNM-PAC. ..................... 163
Table 5.3: Zeta potential results for PAC and the different carbon structures produced
...................................................................................................................... 166
Table 6.1: Experimental CCD data for the synthesis parameters from C2H2
decomposition. ............................................................................................. 168
Table 6.2: ANOVA results for the yield of CNM-PAC growth from C2H2 decomposition.
...................................................................................................................... 169
Table 6.3: List of the actual and predicted values of the CNM-PAC yield from C2H2
decomposition. ............................................................................................. 170
Table 6.4: ANOVA results for MB removal % for CNM-PAC growth optimization. . 172
Table 6.5: List of the actual and predicted values of the MB removal efficiency. ....... 173
Table 6.6: Optimization constraints for CNM-PAC production. .................................. 178
Table 6.7: The optimum conditions suggested by DOE for CNM-PAC growth. ......... 178
Univers
ity of
Mala
ya

xxii
Table 6.8: CCD of experimental parameters for MB removal by O-CNT. .................. 185
Table 6.9: ANOVA results for MB Removal % (RV3) by O-CNT. ............................ 186
Table 6.10: ANOVA results for the adsorption capacity of O-CNT (Q3). ................... 186
Table 6.11: Constraints for optimization process based on CCD for MB adsorption. . 188
Table 6.12: Potential optimization conditions based on CCD for MB removal onto O-
CNT. .......................................................................................................... 188
Table 6.13: Experimental values of constants of adsorption kinetics models. ............. 192
Table 6.14: Linearized equations of studied isotherm models for MB adsorption on O-
CNT. .......................................................................................................... 196
Table 6.15: Comparison between the maximum adsorption capacity (qm) of O-CNT and
other reported adsorbents for MB removal. ............................................... 196
Table 7.1: Summary of BET results for PAC, Ni-PAC, O-CNTs, and KS-CNTs. ...... 207
Table 7.2: Zeta potential results for PAC and the different carbon structures produced.
...................................................................................................................... 208
Univers
ity of
Mala
ya

xxiii
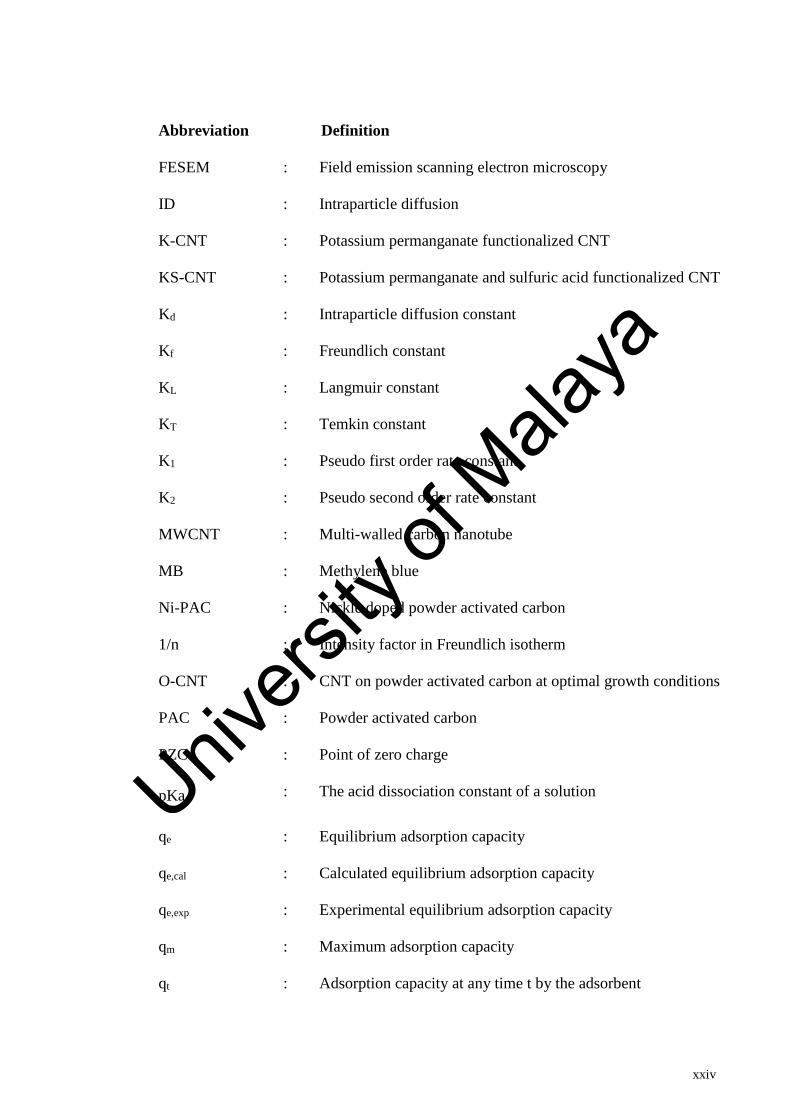
LIST OF SYMBOLS AND ABBREVIATIONS
Abbreviation Definition
AC
: Activated carbon
ANOVA : Analysis of variance
BPA : Bisphenol A
BET : Brunauer-Emmett- Teller
Cο : Initial adsorbate concentration
Ct : Concentration at any time t in liquid phase
Ce : Equilibrium concentration in liquid phase
CCD : Central composite design
CV : Coefficient of variation
CVD : Chemical vapor deposition
CCVD : Catalytic chemical vapor deposition
CNM : Carbon nanomaterial
CNF : Carbon nanofiber
CNT : Carbon nanotube
CNM-PAC : Carbon nanomaterial grown on powdered activated carbon
CNT-PAC : Carbon nanotube grown on powdered activated carbon
CNP : Carbon nano-particle
CH4 : Methane
C2H2 : Acetylene
DOE : Design of experiment
DWNT : Double-walled carbon nanotube
EDX : Energy-dispersive X-ray spectrometer
EDC : Endocrine disrupter compound
FTIR : Fourier transform infrared spectroscopy
Univers
ity of
Mala
ya
xxiv
Abbreviation Definition
FESEM : Field emission scanning electron microscopy
ID : Intraparticle diffusion
K-CNT : Potassium permanganate functionalized CNT
KS-CNT : Potassium permanganate and sulfuric acid functionalized CNT
Kd : Intraparticle diffusion constant
Kf : Freundlich constant
KL : Langmuir constant
KT : Temkin constant
K1 : Pseudo first order rate constant
K2 : Pseudo second order rate constant
MWCNT : Multi-walled carbon nanotube
MB : Methylene blue
Ni-PAC : Nickle doped powder activated carbon
1/n : Intensity factor in Freundlich isotherm
O-CNT : CNT on powder activated carbon at optimal growth conditions
PAC : Powder activated carbon
PZC : Point of zero charge
pKa : The acid dissociation constant of a solution
qe : Equilibrium adsorption capacity
qe,cal : Calculated equilibrium adsorption capacity
qe,exp : Experimental equilibrium adsorption capacity
qm : Maximum adsorption capacity
qt : Adsorption capacity at any time t by the adsorbent
Univers
ity of
Mala
ya

xxv
Abbreviation Definition
RSM : Response surface methodology
R2 : Correlation coefficient
RL : Separation factor
RV : Removal efficiency
SWCNT : Single-walled carbon nanotube
S.D. : Standard deviation
TEM : Transmission electron microscopy
TGA : Thermo-gravimetric analyzer
UV-vis : Ultraviolet visible
VLS : Vapor–liquid–solid model
VSS : Vapor–solid–solid model
X2 : Chi-square
Y : Predicted responses
Univ
ersity
of M
alaya

1
CHAPTER 1: INTRODUCTION
1.1 Overview
Nanotechnology has been identified as utmost promising technology that opened
new horizons of extreme engineering on the nanometer scale to create and utilize
materials, devices and systems with new properties and functions. Nanotechnology
encompasses the potential utilization of the of novel nanomaterials unique properties in
many fields, e.g., energy (Hussein, 2015; Liu, Jin, & Ding, 2016), medicine (Mishra,
2016) , electrical industries (Contreras, Rodriguez, & Taha-Tijerina, 2017), food
industry (Chellaram et al., 2014) and pollution treatment (Adeleye et al., 2016; Bashir
& Chisti, 2014; De La Cueva Bueno et al., 2017). Not to mention, the global
momentum of nanotechnology is dramatically participating in addressing, resolving and
improving potential remediation prospects and provide remarkable advances in
diminishing the adverse impact of the environmental pollutants (Shunin et al., 2018).
The exceptional merits of nanomaterials such as thermal, electrical, mechanical, optical
structural and morphological properties promoted their features for many applications
where they can be functioned as nano-sensors, nanomembranes, nanorods, nanowires,
disinfectant and nano-adsorbents (Murty et al., 2013). A variety of efficient materials
have been developed in wastewater treatment including activated carbon, metal oxides,
clay, silica and modified composites. However, nano-adsorbents with their high specific
surface area, short intraparticle diffusion distance and tunable surface chemistry offer
many possibilities for novel applications in water treatment (Sadegh, Shahryari-
ghoshekandi, & Kazemi, 2014). Nano-adsorbent can be produced by chemical vapor
deposition (CVD), sol-gel, chemical solution deposition (CSD), photocatalytic
deposition (PD), deposition-precipitation (DP), ultrasonic irradiation, thermal and
hydrothermal processes, etc. (Khajeh, Laurent, & Dastafkan, 2013).
Univers
ity of
Mala
ya

2
Regarding to the conspicuous physiochemical properties of carbon nanomaterials
(CNMs) and the lack of efficiency and selectivity of conventional adsorbents, carbon
CNMs such as single walled carbon nanotubes (SWCNTs), multiwalled carbon
nanotubes (MWCNTs), and graphene have been in the spotlight of scientific and
industrial community as a promising alternative to traditional adsorbents, from the
environmental and technological perspectives. The emergence of carbon nanostructures
including carbon nanotubes (CNTs), carbon nano-particles (CNPs) and carbon
nanosheets have enlightened the opportunities of their exploitation as appealing
alternative sorpents for different pollutants in water (O’connell, 2012). Carbon nanotubes
(CNTs), since their discovery by Wiles and Abrahamson (Wiles & Abrahamson, 1978)
and re-discovery by Iijima in 1991 (Iijima, 1991), have been highlighted as outstanding
materials due to their exceptional characteristics such as large surface area, well defined
cylindrical hollow structure, as well as their unique electrical, mechanical, optical,
physical and chemical properties (Khan, Kausar, & Ullah, 2016). Accordingly, CNTs
have shown remarkable potential as competent adsorbents and suitable candidates for
removal of a wide range of organic and inorganic contaminants from large volumes of
wastewater due to their highly porous structure, large specific surface area, light mass
density and strong interaction with the pollutants (Kim & Choi, 2017). However, some
shortcomings hinder the application of CNTs and lower their ability to remove certain
compounds, such as agglomeration, their poor dispersion in aqueous media and the
successful recovery from the aqueous phase are troublesome and pose a significant
challenge (Liu et al., 2013). Therefore, there is an exigent demand for extensive
investigations to fabricate new hybrids materials to manipulate special properties of the
nanomaterials seeking for versatile, effective utilization of CNMs for highly selective
removal of pollutants (Kyzas & Matis, 2015; Santhosh et al., 2016).
Univers
ity of
Mala
ya
3
The recent uncontrolled discharge of hazardous substances is leading to the
development of a wide array of wastewater treatment techniques to meet the stringent
environmental rules and regulations. Thus, there is great concern for improving efficient,
sustainable and low-cost technologies to screen and adequately treat toxic environmental
pollutants (Mohmood et al., 2013). Adsorption has been considered as one of the most
effective techniques to wide range of contaminants from aqueous solution by virtue of
low energy cost, ease of operation and environmental friendliness (Kyzas & Matis, 2015).
1.2 Problem statement
CNMs have strong interactions with emerged contaminants due to their high aspect
ratio, fibrous mesoporous structure, and large specific surface area. They have shown
great potential as competent adsorbents for removal wide range of pollutants (Abkenar,
Malek, & Mazaheri, 2015; Ren et al., 2011; Yu et al., 2013). Despite their strong
adsorption affinity, the successful recovery of dispersed CNMs from aqueous phase, the
sharp decrease in the surface area due to agglomeration and poor dispersion pose a
significant challenge and hinder their practical application in water treatment (Al-
Hamadani et al., 2015). Quite similarly to graphene and most of CNMs, CNTs suffer from
bundling phenomena because of π-π adhesion and van der Waals interactions between
tubes which is generally responsible for the agglomeration tendency. Accordingly, the
ineffective dispersion and recovery of nanostructures are considered serious limitations
of CNT and all isolated nanomaterials which will restrain their application in any
adsorption process. Not to mention, the most promising method for non-biodegradable
organic pollutants is “adsorption” due to its simple process design, low cost, its ability to
remove multiple components simultaneously, easy mode of operation without producing
a large amount of toxic sludge and can be coupled with other mechanisms (Gupta, Ali, et
al., 2012). Nevertheless, the utilization of inappropriate adsorbents will deprive the
achievement of such extraordinary advantages. Therefore, it is necessary to emphasis on
Univers
ity of
Mala
ya
4
developing innovative adsorbents that can overcome the current drawbacks and maximize
the above characteristics. (Ravi & Vadukumpully, 2016; Smith & Rodrigues, 2015b).
Possible approaches was suggested to address these limitations include centrifugation
and attachment of magnetic iron nanoparticles (Fan et al., 2012; Tang & Lo, 2013).
However, both options will reduce significantly the cost-effectiveness and add
complexity to the adsorption process. In view of the notable advances in nanotechnology
and the imperative demand to develop innovative adsorbents for environmental
remediation, this study enlightens an auspicious class of hybrid solid by directly growing
carbon nanostructures on micro-scaled carbon support (Ansari; Laurila, Sainio, & Caro,
2017; Mleczko & Lolli, 2013). It is believed that the combination of nanocarbon material
with non-carbon support structures would lead to deterioration of the overall compound
properties and chemical stability because of the discontinuities in transport and in
chemical properties (Meshot et al., 2017; Rajbhandari et al., 2013). Therefore, fabricating
hybridized carbon materials with good performance has motivated the growing research
interest towards production of potential alternatives to the conventional adsorbents (Liu,
Sun, & Huang, 2010).
Recently, the introduction of powder activated carbon (PAC) as analogues of non-
carbon supports was found worthy to be exploited especially in producing new type of
CNM and such unique incorporation is expected to be an excellent adsorbent. Activated
carbon (AC) acts as a stable carbon matrix, and the appearance of CNMs on carbon
substrates not only provides additional active sites but also shifts the pore size distribution
and reduces the effect of pore blocking on microporous channels (Sing, 2014).
Furthermore, using AC substrate for growing CNM prevents their agglomeration due to
the porous structure of the substrate. Carbon has fascinating physical and chemical
characteristics and the area of nanocarbon‐carbon hybrids has become encouraging in a
wide variety of electronic and electrochemical applications (Ampelli, Perathoner, &
Univers
ity of
Mala
ya

5
Centi, 2014; Zhao et al., 2012), however, their potential use as catalyst support to prepare
these hybrids has not yet been fully investigated (Titirici et al., 2015). Still there are not
many examples of utilizing this concept in water treatment and purification. Among the
studied systems (Diring et al., 2010; Song et al., 2016; Yu, Goh, et al., 2014), activated
carbon appeared to be very promising candidate for the growth of CNMs, moreover, the
impact of the Ni/powder activated carbon (Ni‒PAC) substrate on producing CNMs with
multi-scale-porous structure was not explored in detail especially in monitoring their
adsorptive performance for the removal of organic contaminants from aqueous solution.
The growing number of contaminants entering water supplies due to human activity is
an important environmental problem worldwide, especially for those toxic and
nonbiodegradable contaminants that raise public health concerns (Speltini et al., 2016;
Yu, Zhao, et al., 2014b). During recent decades, research scientists and governmental
authorities have become increasingly concerned about the exposure of humans and
wildlife to a class of chemicals known as endocrine disruptor compounds (EDCs). These
substances have the potential to interfere with the hormonal system, producing adverse
developmental and reproductive effects even at very low levels. Among the EDCs,
bisphenol A (BPA) is found to be acutely toxic to the living organisms between 1000-
10,000 μg/L for both fresh water and marine species (Kabir, Rahman, & Rahman, 2015;
Locatelli et al., 2016). Another example of organic based industrial pollutants is
methylene blue (MB) dye which is an issue of critical importance in various industries,
such as textile, paper, plastic, leather, food, cosmetic, etc. MB is a cationic dye which is
known to be very stable, difficult to biodegraded and widely disposed into water bodies.
The improper disposal of MB significantly causes serious problems to the photosynthetic
activity in aquatic life as well as the danger effects on human body. MB is toxic if inhaled
or ingested, it can cause irritation, allergy difficulties in breathing, vomiting, diarrhea and
nausea (Ezzeddine et al., 2016). BPA and MB are persistent organic pollutants that are
Univers
ity of
Mala
ya
6
stable toward biological and chemical treatments, which can not only cause esthetic
problems, but also exhibit high biotoxicity and potential mutagenic and carcinogenic
effects. Therefore, it is important to treat and control the discharge of these hazardous
substances to protect and preserve the natural water systems (Bhatnagar & Anastopoulos,
2017; Fu et al., 2015).
Finally, this research is an attempt to reduce the cost of isolation, and enhance the
adsorbent capacity through synthesizing new type of hybrid carbon nanomaterials
(CNMs) on powder activated carbon (PAC) substrate to end up with multi-structure
materials from nano to micro scale. The prepared hybrid material is chemically
homogeneous as it consists basically of carbon but poses a heterogeneous structure of
multiscale scale particles at different shapes. The hybrid structures were evaluated for
removal of a model organic contaminants; bisphenol A (BPA) and methylene blue (MB)
from water. Furthermore, as compared with previous studies which concern only about
high yields, the present investigation optimized the growth conditions of CNMs in
conjunction with the pollutant removal efficiency. This distinctive procedure allows
preparing the best material structure with the highest possible adsorption capacity.
1.3 Research objectives
The objectives of this research are:
1- To synthesize a new type of multi-scale carbon nanomaterials onto powder activated
carbon substrate from methane and acetylene pyrolysis using chemical vapor deposition
reactor.
2- To determine the optimum growth conditions of CNMs such as (reaction
temperature, reaction time and feed stock gas ratio) to produce the maximum yield
together with the maximum removal efficiency of bisphenol A and methylene blue by
using Design of Experiment (DOE), and to identify the physical and chemical changes
on the carbon surface after CNMs growth at the optimal conditions.
Univers
ity of
Mala
ya

7
3- To determine and optimize the effects of pH, adsorbent dose and contact time on
the adsorption performance of organic pollutants by predicting adequate mathematical
model. The kinetics and isotherm parameters of different adsorbate-adsorbent systems
under study were also investigated.
4- To compare the adsorption performance of the functionalized and as-prepared
carbon nanomaterials.
1.4 Research scope
The main motivation to conduct this research is to introduce hybrid CNM structures
with improved capabilities for the removal of model organic contaminants. The
synergistic effect of hybrid materials could offer remarkable adsorptive performance
respect to those from the concomitant individual components. This research is an attempt
to benefit from physicochemical properties of CNMs and PAC in developing new
adsorbents to be utilized in multipurpose platforms specifically water treatment.
Therefore, these easy prepared hybrid structures could open a new opportunity for
developing a qualified adsorbent in remediation of contaminated water.
1.5 Research methodology
This research is constructed from the following stages:
1- Synthesizing CNMs on the surface of PAC.
2- Optimizing the growth parameters to obtain high yield of the CNMs along with
maximum removal percentage for BPA and MB.
3- Characterization of CNMs produced at the optimal growth conditions using
FESEM, TEM, EDX, Raman, TGA, FTIR, BET surface area and zeta potential.
4- Utilizing the synthesized CNMs as adsorbents for BPA and MB removal from
water.
Univers
ity of
Mala
ya

8
5- Modifying the produced CNMs with potassium permanganate (KMno4 and
H2SO4) and compare their adsorption performance with the as-obtained CNMs.
6- Applying an estimated regression model using response surface methodology
(RSM) to optimize the experimental conditions for growth process and removal of
organic pollutants from water.
7- Investigating the adsorption kinetics and isotherm models along with their
perspective parameters.
1.6 Outline of the thesis
This research is constructed from eight chapters as follows:
Chapter 1 (Introduction) is an introductory chapter includes a brief background about
CNMs including CNTs and carbon-based nano-adsorbents along with problems
encountered during their application in adsorption system. The aims and objectives of the
research work were mentioned followed by the methodology and finally, the scope of the
study.
Chapter 2 (Literature Review) presents a review of the relevant scientific literature on
CNMs and hierarchical carbon nanostructures. It focuses on their fabrication and
functionalization methods. This chapter also demonstrates the history of different types
of CNMs, as well as the most common processes applied to remove BPA and MB dye
from water.
Chapter 3 (Materials and Methods) discusses the detailed research methodology
including CNMs synthesis, characterization and modification as well as the methods of
batch adsorption work and response surface methodology (RSM) studies. All materials,
equipment and analytical instruments involved in this research are described in this
chapter as well.
Chapter 4 (Results and Discussion) comprises the obtained research results and
discussion from RSM method to synthesize and optimize the growth of CNM-PAC
Univers
ity of
Mala
ya

9
hybrid from methane decomposition in conjunction with ANOVA analysis for each
adsorption system.
Chapter 5 (Results and Discussion) provides the results and discussion gained from
the surface characterization of the synthesized CNM-PAC from the decomposition of
methane which is requisite to understand the adsorption mechanisms.
Chapter 6 and Chapter 7 (Results and Discussion) present results and discussion found
from the optimization of the growth of CNM-PAC using acetylene, RSM, ANOVA and
regression models of the adsorbate-adsorbent system together with full characterization
of the prepared material at the optimal growth conditions.
Chapter 8 (conclusion) summarizes the overall findings of this study and the last
section of this chapter includes some recommendations for future work.
Univers
ity of
Mala
ya
10
CHAPTER 2: LITERATURE REVIEW
2.1 Introduction
In view of the importance of water quality and emerging nanotechnology momentum,
attempts have been made to present the opportunities for leapfrogging scenarios in the
development and alteration of various aspects of water treatment by adsorption using
nanomaterials. In this regard, nanomaterials/nano-adsorbents were suggested as efficient
cost-effective and practical solution for potential removal of various pollutants using their
unrivaled features (Kunduru et al., 2017). The unique properties of carbonaceous
nanomaterials most commonly cited as a potential adsorbent for water and wastewater
are size, shape, and surface area; molecular interactions and sorption properties (Weiss et
al., 2012).
The search for new supports that will impart stability to the metallic nanoparticles has
led to a new type of hybrid material that consists of metallic nanoparticles attached to the
surface of carbon structures (Guerra & Herrero, 2010; Karousis et al., 2016). In many
cases, the combination of two materials can create properties superior to those of either
building constituents. One growing area of interest is the fabrication of multi-scale hybrid
carbon structures that have been developed by growing carbon nanomaterials (CNMs) on
high surface area substrates having open, interconnected porosity. CNMs grown onto
porous substrates have been mostly limited to oxide or metallic foams. However, the
unique physical and chemical properties of activated carbon such as large specific surface
area, pore size control, large pore volume, and tuning of the hydrophobicity boosted their
utilization to catalyze the growth of carbon nanostructures. The obtained nano-hybrids
with their rigorous control of the pore size enabled the adsorption of even large pollutants
(Libbrecht et al., 2017). In the view of the outstanding advances in nanotechnology and
the urgent need to develop new approaches for environmental remediation, this study
Univers
ity of
Mala
ya

11
demonstrates the potential of using multi-scale carbon structures as robust, reusable solids
suitable for removal of aqueous pollutants from wastewater.
2.2 Carbon nanotubes
Carbonaceous nanomaterials are the most-studied emerging nanomaterials in recent
years. They can be classified as nano-diamonds, fullerene, carbon onions, graphene,
multiwalled carbon nanotubes (MWNTs), and single-walled carbon nanotubes (SWNTs).
Carbon nanotubes (CNTs), a new form of the carbon family, is considered as a revolution
in nanotechnology development have lately drawn significant attention because of their
physical, chemical, mechanical, electrical, and optical properties (Mallakpour &
Khadem, 2016). Carbon nanotube represents the simplest chemical composition,
however, shows the most extreme diversity among nanomaterials in structures and
structure-property relations (Saha, Jiang, & Martí, 2014).
2.2.1 Structure of carbon nanotubes
Carbon nanotubes are novel nanomaterials consisting of one or more graphite sheets
wrapped around itself into a seamless cylinder of nanoscale radius of less than 100
nanometer (nm) and a length up to 20 cm with both ends usually "capped" with half of a
fullerene-like molecule. Bonding in the hexagonal graphite sheet of carbon atoms is
essentially in a sp2 hybridization state (De Volder et al., 2013). The hexagonal lattice
structure is stacked on top of one another to form a 3D crystal which is kept together by
the relatively weak van der Waals forces between these layers. The 1s and 2p orbitals can
produce σ bonds and the third p orbital builds a π bond with an identical p orbital on
another carbon atom. In graphite, three σ bonds are formed in-plane with an π bond out-
of-plane (Kang et al., 2016). However, the circular curvature of CNTs will cause σ-π
rehybridization in which the three bonds are partly out of the plane; the π orbital is more
Univers
ity of
Mala
ya

12
delocalized outside the tube, thus makes CNTs mechanically stronger and chemically
more active than graphite (Figure 2.1) (Nessim, 2010).
Figure 2.1: Graphite carbon sp2 hybridization.
There are two major classes of carbon nanotubes: single–walled and multi–walled
tubes based on the number of graphite layers. As shown in Figure 2.2, a single graphitic
sheet rolled–up would give one circumferential layer is described as a single-walled
carbon nanotube, while several sheets that are possible to roll–up around a concentric axis
would give a multi–walled nanotube. Diameter less than 2 nm is usually found for
SWNTs and MWNTs have much wider but are usually less than 100 nm in diameter
(Allaedini, Aminayi, & Tasirin, 2015). CNTs are extremely hydrophobic and the physical
structure of CNTs is further complicated by the large van der Waals forces and π–stacking
which tend nanotubes to form bundles or ropes and, thus inhibit their dispersion in water
(Li, Liu, et al., 2015).
Univers
ity of
Mala
ya

13
Figure 2.2: Schematic models describing single-walled and multi-walled carbon
nanotubes conceptually obtained from single graphene sheets (Mubarak, Sahu, et
al., 2014).
2.2.2 Properties and uses of carbon nanotubes
2.2.2.1 Electrical properties
Electrical properties is one of the most significant features of CNTs because of their
unique one dimensional nano-structures, electrons can be conducted in nanotubes without
being scattered (Meunier et al., 2016). The CNTs are very polarizable and allowed to
conduct due to the electrons in the π- system. The absence of scattering of the electrons
during conduction and remaining coherent in a straight line is known as ballistic transport.
Univers
ity of
Mala
ya

14
This mechanism for electron transport allows the nanotube to conduct without dissipating
energy. Another interesting electronic aspect of CNTs is that they can be metallic or
semiconducting depending on their diameter and chirality. The band gap of
semiconducting tubes has been seen to be inversely proportional to the diameter of the
tube, as they start resembling graphite, which is a zero band–gap material (semi–metal)
(Helal, 2015). There has been much interest in utilizing carbon nanotubes in electronic
devices such as transistors, electrodes in electrochemical reactions and sensors due to
their high electrical conductivity and relative inertness. Furthermore, they are potential
candidates to produce electronic appliances that will consume less energy and produce
less heat too (Rao, Gopalakrishnan, & Maitra, 2015; Soma, Radhakrishnan, & Sarat
Chandra Babu, 2017).
2.2.2.2 Mechanical properties
CNTs exhibit extraordinary mechanical properties; they are remarkable strong, robust
and have very high Youngs modulus. They are as stiff as diamond, with tensile strength
~ 200 GPa. Under all mechanical stresses, they have a nondestructive failure mechanism
such as buckling or flattening (Liang, Han, & Xin, 2013). They are five times stronger
than stainless steel, although, they are very light weight relative to it. These exceptional
mechanical properties of CNTs make their application in composite materials is very
promising. Thus, they can enhance the stiffness of a polymer, add multifunctionality
(such as electrical conductivity) to polymer based composite systems. Efforts are made
to obtain tougher ceramics by fabricating the CNT containing ceramic-composites
(Ahmad, Yazdani, & Zhu, 2015). Also, under electric stimulation, nanotubes can
mechanically deflect and this opens applications such as actuators or cantilevers.
Nanotubes has also been suggested to be used as anode for lithium ion batteries,
membrane material for batteries and fuel cells, and chemical filters (Park, Vosguerichian,
& Bao, 2013).
Univers
ity of
Mala
ya
15
2.2.2.3 Thermal properties
The intrinsic characteristic of the strong sp2 lattice dominates the thermal transport in
CNTs, rather than by phonon scattering on boundaries, producing very high thermal
conductivity (K) values. Single walled carbon nanotubes (SWCNTs) are expected show
remarkably high thermal conductivity and converge to graphene at high temperature.
Inter-shell coupling in MWCNTs result in a low-temperature specific heat that matches
that of three-dimensional graphite (Balandin, 2011). Pop et al. (2006), measured a thermal
conductivity of almost 3500 Wm-1 K-1 at room temperature for a 2.6 mm long SWCNT
with a diameter of 1.7 nm (Pop et al., 2006), similarly, Kim et al. measured a thermal
conductivity above 3000 Wm-1K-1 at room temperature for multi-wall CNTs (Kim et al.,
2001). Thermal management and dissipation have become a very significant issue and
these high values for thermal conductivity of CNTs will contribute another useful
property for electrical applications such as future microprocessors (Balandin, 2011; Sun,
Meany, & Wang, 2014).
2.2.2.4 Chemical properties
As-produced carbon nanotubes are insoluble in organic solvents and aqueous
solutions which has imposed great limitations to the use of CNTs (Cheng et al., 2010).
Although, sonication of the CNTs can enhance their dispersion in some solvents, but the
precipitation immediately occurs when this process is interrupted. On the other hand, it
has been demonstrated that CNT can interact with different classes of compounds (Smith
& Rodrigues, 2015a; Yu, Zhao, et al., 2014a). CNT can be considered as electron donors
(alkali metals) and can act as guest–host compounds with electron acceptors (e.g., iodine,
halogens, bromine, FeCl3, HNO3). The guest species can be introduced within the
graphene shells of MCWNTs or inside the bundles of SWNTs in the open inter-tubular
spaces. In addition, CNT can be more soluble by their chemical integration into inorganic,
organic, and biological systems. Not to mention, the formation of CNT supramolecular
Univers
ity of
Mala
ya

16
complexes has led to the remarkable fabrication of nano-devices (Hanelt et al., 2012;
Pochorovski et al., 2015).
2.2.2.5 Adsorption properties
Compared to the large dimensions of traditional sorbents, low sorptive efficiency and
limited active sites surface area, the nano-adsorbents and carbon-based nanomaterials
offer a substantial advancement with their good adsorption kinetics as demonstrated by
their high specific surface area, tunable pore size and surface chemistry (Sadegh et al.,
2017). Nano-adsorbents are broadly classified into metallic nanoparticles (NPs) and
carbonaceous nanomaterials (CNMs). Among the nanoscale metal oxides, the magnetic
nanoparticles have drawn a considerable concern as a more cost efficient, effective
adsorbent for water treatment. Not to mention among carbon-based nanomaterials, the
adsorption-related applications of CNTs have received considerable attention to solve
environmental pollution problems (Ghaedi et al., 2013; Ravi & Vadukumpully, 2016).
CNTs have been proposed as substitutes for activated carbon as they display outstanding
competency for gas and liquid phases, such as organic vapors, heavy metal ions and
inorganic pollutants due to the availability of binding sites, the strong solute−sorbent
interactions and their high specific surface areas stand comparison with those of activated
carbons (ACs) (Luo et al., 2013). CNTs hold interesting positions in carbon-based
adsorptive materials as they provide chemically inert surfaces for physical adsorption and
the adsorbed molecules can deal directly with various well-defined adsorption sites (Apul
& Karanfil, 2015). CNTs have been evaluated for the sorption of 1,2-dichlorobenzene
(DCB) and it was reported that they can be used with a maximum sorption capacity of
30.8 mg/g (Peng et al., 2003). Novel sorbents consisting of cerium oxide supported on
carbon nanotubes (CeO2-CNT) were effective sorbents for As (V) (Peng, Luan, Ding, et
al., 2005). Moreover, both SWCNTs and MWCNTs have been investigated for their
ability to remove trihalomethanes and ethylbenzene from aqueous solution (Bina et al.,
Univers
ity of
Mala
ya

17
2011; Lu, Chung, & Chang, 2006). CNTs have exhibited remarkable adsorption ability
and high removal efficiency for many organic pollutants (Table 2.1), including organic
dyes (e.g., Cationic, reactive, azoic, basic and acid dyes etc.) (Bazrafshan et al., 2015;
Gupta et al., 2013). Pharmaceuticals (e.g., Cephalexin, tetracycline, olaquindox,
carbamazepine, etc.) (Jafari & Aghamiri, 2011; Ji et al., 2010; Zhang, Xu, et al., 2011),
pesticides (Yu, Zhao, et al., 2014c), phenolic compounds (Abdel-Ghani, El-Chaghaby, &
Helal, 2015; Cai et al., 2003; Sheng et al., 2010; Yang et al., 2008) and other toxic
compounds (Apul & Karanfil, 2015).
Univers
ity of
Mala
ya

18
Table 2.1: Carbon nanotubes as organic compounds adsorbent.
Organic pollutant
type
Examples CNM modification Adsorption isotherm Remarks Reference
Ph
enoli
c co
mp
ou
nd
s; b
enze
ne
der
ivati
ves
an
d o
ther
toxic
org
an
ics
Pentachlorophenol
(PCP)
MWCNTs Oxidized by
H2O2, HNO3 and KMnO4
Langmuir, Freundlich
and Fritz–Schlünder
Lower PCP adsorption
by CNTs by increasing
the oxygen functional
groups (carboxylic,
phenolic and lactonic).
(Abdel Salam &
Burk, 2008)
2,4,6
trichlorophenol
(TCP)
Modified with HNO3 Polanyi–Manes The increased
hydrophilic carboxylic
groups and surface area
increased the
adsorption capacity for
TCP.
(Chen, Shan, et al.,
2009)
Benzene, toluene,
ethylbenzene and p-
xylene (BTEX)
Sodium hypochlorite
(NaOCl) oxidation
Langmuir and
Freundlich
Oxidation increased the
purity, carbon
containing defects,
carboxylic groups and
surface charge
negativity which
enhanced the BTEX
adsorption.
(Su, Lu, & Hu,
2010)
Univers
ity of
Mala
ya

19
Table 2.1 (continued) P
hen
oli
c co
mp
ou
nd
s;
ben
zen
e d
eriv
ati
ves
an
d o
ther
toxic
org
an
ics
Bisphenol A
(BPA)
MWCNT-COOH Langmuir and
Freundlich
The reduced uptake at pH is 9–11 is because
of the increased repulsion forces and a
reduction of π–π interaction between
bisphenolate anions and the sorbent.
(Bohdziewicz &
Kamińska,
2013)
Bisphenol A
(BPA)
Untreated SWCNTs
Controlled by π−π electron donor−acceptor
mechanism.
(Pan et al.,
2008)
Bisphenol A
(BPA)
MWNTs-COOH Langmuir π–π interaction between bisphenolate anions
and the sorbent.
(Bohdziewicz &
Kamińska,
2013)
Org
an
ic D
yes
Methylene
blue (MB)
MWCNTs oxidized by
HNO3
Langmuir MB removal by π–π electron donor acceptor
interaction and electrostatic attraction.
(Li, Du, et al.,
2013)
Methylene
blue (MB)
MWCNTs loaded with
magnetite
Langmuir The electrostatic attraction and π–π stacking
interactions between (M-CNTSs) and (MB)
was responsible for the high adsorption
capacity.
(Ai, Zhang,
Liao, et al.,
2011)
Univers
ity of
Mala
ya

20
Table 2.1 (continued)
Org
an
ic D
yes
Methylene
blue (MB)
Untreated cylindrical
graphene–carbon
nanotube (G–CNT)
hybrid
Freundlich The electrostatic attraction between
the negatively charged G–CNT
hybrid and the MB.
(Ai & Jiang, 2012b)
Methylene
blue, (MB)
and methyl
orange, (MO)
Alkali-activated
MWCNTs
Freundlich multiple adsorption interaction
mechanisms (hydrogen bonding,
π−π electron−donor−acceptor
interactions, electrostatic
interactions, mesopore filling).
(Ma et al., 2012)
Reactive red
M-2BE
(RRM)
Untreated MWCNTs
Liu The controlling step is the
electrostatic attraction of the
negatively charged dyes to the
positively surface charged MWCNT
adsorbent at pH 2.
(Machado et al.,
2011b)
Direct Yellow
86 (DY86)
Direct Red
224 (DR224)
Untreated MWCNTs
Freundlich The affinity between DY86 and
CNTs was less than that between
DR224 and CNTs (physio-
process).
(Kuo, Wu, & Wu,
2008)
Univers
ity of
Mala
ya

21
Table 2.1 (continued)
Ph
arm
ace
uti
cals
Tetracycline (TC) Untreated MWCNTs Langmuir The adsorption mechanism is
probably the non-electrostatic π–π
dispersion interaction and
hydrophobic interaction.
(Zhang, Song, et
al., 2011)
Ibuprofen
(IBU)
CNTs Oxidized with
HNO3, (O-CNTs)
Polanyi-
Manes
Model
Less adsorption capacity for O-
CNTs than that of pristine CNTs.
(Cho, Huang, &
Schwab, 2011)
Ciprofloxacin
(CPI)
Graphitized MWCNTs,
(MG), carboxylized
(MC), and hydroxylized
(MH).
Freundlich
and
Dubinin–
Ashtakhov
(DA).
Higher sorption on MH than MC
attributed to the π–π electron donor–
acceptor interactions.
(Li, Zhang, et al.,
2014)
Ofloxacin (OFL) Graphitized MWCNTs,
(MG), carboxylized
(MC), and hydroxylized
(MH).
Freundlich Several mechanisms including
electrostatic interactions, cationic
exchange, and hydrogen bond
enhanced the sorption of OFL.
(Peng et al.,
2012)
Sulfamethoxazole
(SMX)
Graphitized (MG),
carboxylized (MC), and
hydroxylized (MH).
Dubinin-
Ashtakhov
The adsorption sequence: MH > MG
> MC due to π-π electron donor-
acceptor interactions at low pHs
(Zhang, Pan, et
al., 2010)
Univers
ity of
Mala
ya

22
Table 2.1 (continued)
Pes
tici
des
Atrazine Untreated MWCNTs Polanyi–
Manes
reversible adsorption of atrazine at
external surface of CNTs.
(Yan et al., 2008)
Diuron and
dichlobenil
Untreated MWCNTs Polanyi–
Manes
The hydrogen bonding was the
main adsorption mechanism and
the removal was reduced by
increasing the oxygen containing
groups.
(Chen et al., 2011)
Diuron, fluridone
and norflurazon
Purified SWCNTs by
mixture of H2SO4 and
HNO3
Freundlich
and
Dubinin
Ashtakhov
(DA)
Hydrogen bonding and
hydrophobic interactions
controlled the adsorption
mechanism.
(Sun et al., 2012)
Univers
ity of
Mala
ya

23
2.2.3 Multi-scale/ hybridized carbon structure
Activated carbon, carbon fibers, aerogels, and nanostructures of carbon are well-
suited as carbon-based adsorbents. Nanostructures of carbon such as carbon nanotubes
(CNTs), graphene, and bucky-balls, have recently gained significant interest (Qu,
Alvarez, & Li, 2013; Ren et al., 2011; Tan et al., 2012). Among them, CNTs in the
isolated powder form have been reportedly exhibited high adsorption performance, but
successful recovery of nanostructures create a significant challenge and calls for
additional separation steps (Ma et al., 2012; Yao et al., 2010). Their poor dispersion in
the aqueous media because of the hydrophobicity of the graphitic surface is the main
drawback of CNTs that significantly hinders their application. Although, the strong
intermolecular van der Waals interactions between tubes create loose
bundles/aggregates that contain grooves and interstitial spaces which are recognized as
high adsorption energy sites for organic species, it was suggested that the effective
surface area of CNTs was reduced due to those aggregates (Fernandes et al., 2015). This
is a critical limitation of stand-alone CNT and all isolated nanomaterials in general,
since their dispersion in water can relate to uneconomical material loss and pose
toxicity risks to the aquatic environment, not to mention, the significant reduction in the
cost-effectiveness will be if the material cannot be reused and recovered easily (Zhu et
al., 2009). Centrifugation and attachment of magnetic iron nanoparticles are suggested
proposed approaches to address this limitation, and both options add cost and
complexity to the adsorption process (Tang et al., 2014; Tang & Lo, 2013).
The hierarchical carbon structure in synthetic multi-component systems using tubes,
foams, and particles fibers maximize the interfacial and contribute more numerous micro-
and mesoporous structures. Multiscale support systems have attracted considerable
attention in many fields ranging from energy storage to catalysis, sensing, and medical
treatments due to their unlimited possible combinations of distinct properties (Wang,
Univers
ity of
Mala
ya

24
Pandit, et al., 2017). Those effective applications indicated the great potential of CNT
based hybrid nanomaterials as novel functional agents to improve material's performance.
There is an ever-increasing demand for increasing the interfacial area by grouping
multiple functionalities into the minimum space, while maintaining the other properties
as needed. This is achieved by integrating the small attached individual components on a
larger support and the connecting channels and other auxiliary space will still be needed
for integration. Therefore, the ultimate objective will come from the overall surface area
available in a given volume to support components (Schütt et al., 2017).
Carbon nanomaterials have been grown on many flat surfaces and simple geometries
(Cong et al., 2012; Kumar & Ando, 2010). CNMs grown onto porous substrates have
been mostly limited to metallic or oxide supports (Awadallah et al., 2016). Attaching
multi-walled carbon nanotubes (MWCNTs) onto the substrate surface is one method for
creating enhanced hierarchical interfaces (Avilés, de Jesús Kú-Herrera, & Oliva-Avilés,
2017; Tang et al., 2011). The success in this approach is substantially depend on the
possibility of strongly attaching CNTs inside the pores of porous substrate. However, the
growth of the nanotubes is directly related to substrate shape and composition (Ashraf et
al., 2016). This process facilitates the growth of a dense and strongly attached CNT even
inside the pores of the larger porous substrate. Thus, the surface-interaction related
applications can be enhanced by the availability of the entire surface of the attached
nanotubes, including those inside the deeper pores. This strong hierarchical structure
offers a bimodal pore distribution combining the microporous characteristics of nanoscale
carbon elements with mesoporous structures to produce superior properties with respect
to those of the individual building blocks. These structures that can be engineered at both
micro and nanoscales has proven to be promising in many applications ranging from
thermal management, composite toughening, bio-sensing, to the catalytic grown of
Univers
ity of
Mala
ya

25
dendritic structures such as CNTs/CNFs (Mukhopadhyay & Karumuri, 2010; Tang et
al., 2010).
2.2.4 Powder Activated carbon catalyzing the synthesis of carbon nanotubes
Activated carbon (AC) has been explored extensively among the different carbon
materials due the attracting properties: the chemical inertness, the high surface area with
controllable porosity, rapid adsorption capability, the graphitic character flexibility which
is related to heat and electronic conductivity, the low cost of production, and tunable
hydro-phobicity or ‐ philicity degree induced by the surface chemistry (Li & Zhao, 2013).
The porous network of AC has relatively broad pore-size distributions and an abundant
presence of micropores (pore size<2 nm) which greatly influenced its adsorption affinity.
Thus utilizing activated carbon support will provide the dual purpose as the porous
substrate to embed the catalyst and an effective adsorbent as well. (Chuenchom,
Kraehnert, & Smarsly, 2012).
Remarkably, it is also found that porous carbon black could motivate CNM and /or
CNT formation due to its advantage of density, more growth sites, high surface areas, and
less nanoparticle aggregation during reduction process, leading to good particles
dispersion and high yield of the grown carbon nanostructures (Han et al., 2014; Lin et al.,
2016). Accordingly, the adsorption performance is boosted due to the excellent
characteristics of the large surface area of the CNTs along with abundant porous structure.
Therefore, the dual advantage of the formation of CNTs on activated carbon surface to
form the new multifunctional structure with unique physical, chemical and electronic
properties attracts much attention in the potential applications of environmental
remediation (Ravi & Vadukumpully, 2016; Sivakumar et al., 2011; Zhou et al., 2014a).
Univers
ity of
Mala
ya

26
2.2.5 Synthesis of carbon nanotubes
Different techniques can be used to produce various types of carbon nanotubes and
other types of carbon nanostructure materials. This section demonstrates different
methods for synthesizing nanotube and their status are briefly described. Arc discharge,
laser ablation and chemical vapor deposition (CVD) are the most well-known techniques
being used. However, economically convenient large-scale production and purification
methods still should be exploited.
2.2.5.1 Arc discharge
In the early stage, the carbon nanotubes were being produced by the carbon arc
discharge. Sumio Iijima accidentally observed the structures of the CNTs for the first
time during using the arc-discharge method for the production of fullerene soot (Iijima,
1991). The carbon arc easily generates the high temperatures needed to vaporize carbon
atoms into a plasma (> 3000oC). The stability of the plasma, inert gas pressure, the current
density, and cooling of chamber and electrodes influence the yield of CNTs. To produce
nanotubes, this method encloses two carbon electrodes put in the next nearness to each
other (~1 mm). The electrodes are put in environment of an inert gas like argon or helium,
and then the electrodes pass a big current (Chen, 2015). The nanotubes created from the
deposition of the vaporized carbon liberated from the first electrode into pillar-like tubes
onto the opposite electrode. The electric arc vaporizes a hollow graphite anode associated
with a mixture of a transition metal (such as Ni, Fe or Co) and graphite powder. The
operative conditions involve 2000-3000 °C, 100 amps, 20 volts and the inert gas flow is
introduced at 50-600 Torr. The Nanotubes created using this method are usually short
tubes with diameters ranging from 0.6 to 1.4 nm for single walled and 10 nm diameter
multi walled nanotubes. This method is relatively easy to implement, and will produce
yields of 30%. The nanotubes produced contain more impurities compared to other
Univers
ity of
Mala
ya

27
methods, and the consistency of the shape, wall, and lengths of the tubes are somewhat
random (Aqel et al., 2012).
Figure 2.4 shows a schematic diagram of arc-discharge apparatus for the synthesis of
carbon nanotubes. This apparatus should be connected to a vacuum line along with a
diffusion pump, and to a helium supply. The two electrodes are usually made of high
purity graphite rods. Typically, the anode is a long rod around 6 mm in diameter and the
shorter rod cathode approximately 9 mm in diameter. Effective cooling of the cathode
has been shown to be crucial factor in producing good quality nanotubes (Arora &
Sharma, 2016).
Figure 2.3: Schematic diagram of arc-discharge apparatus.
2.2.5.2 Laser ablation
Pulsed laser vaporization, or laser ablation technique, is an efficient route for
fabricating bundles of SWNTs with a narrow distribution. Similar to the carbon Arc-
discharge method, this method vaporizes the carbon and later deposits it onto a substrate
(Szabó et al., 2010). In laser ablation, a target consisting of graphite mixed with a small
amount of transition metal particles as catalyst is placed at the end of a quartz tube
Univers
ity of
Mala
ya

28
enclosed in a furnace. A laser beam is used to ablate the carbon atoms from the carbon
target. Quick condensation of the small vaporized carbon species produce larger clusters,
possibly including fullerenes (Bystrzejewski et al., 2008). The target is exposed to an
argon ion laser beam, which vaporizes graphite and nucleates carbon nanotubes in the
shockwave just in front of the target. The reaction temperature has been found to affect
the yield and quality of these products. Argon flow through the reactor heated to about
1200 °C by the furnace carries the vapor and nucleated nanotubes, which continue to
grow (Mubarak, Abdullah, et al., 2014). The nanotubes are deposited on the cooler quartz
tube downstream from the furnace. MWCNTs are produced by using a pure graphite
target, but SWCNT are synthesized from graphite target mixed with equal amounts of Co
and Ni (Figure 2.4). The laser ablation produces condensates which is contaminated with
carbon nanotubes and carbon nanoparticles. Higher yield of SWNTs with better
properties are produced by the laser vaporization than SWNTs produced by arc-
discharge. Purer nanotubes are obtained by laser ablation (up to about 90 % purity) than
those obtained by the arc discharge. The laser technique is not economically
recommended because the produced amount of CNTs per day is not as high as arc
discharge method, laser powers required are high process and involves high-purity
graphite rods (Manzano-Ramírez et al., 2013).
Figure 2.4: Schematic drawings of a laser ablation.
Univers
ity of
Mala
ya

29
2.2.5.3 Chemical vapor deposition (CVD)
Chemical vapor deposition (CVD) has emerged as one of the most promising tool for
economically producing large quantities of CNTs of various thicknesses and on various
substrates. CVD route is very different from the electric arc discharge and laser
vaporization (Varshney, 2014). Arc discharge and laser vaporization can be considered
as high temperature (>3000 K) and short time reaction (μs-ms) methods, whereas CVD
is a medium temperature (700-1473K) and long-time reaction (typically minutes to hours)
approach. The arc discharge and laser vaporization drawback is mainly attributed with
that the CNTs are produced as standalone on their own; thus, CNTs do not grow on a
patterned or conventional substrate (Qian, 2001). From 1998 onward, rapid and notable
progress has been undertaken in the development of CVD to classify it as a highly
controlled technology to produce CNTs. Today, it is possible to fabricate high quality
MWNTs and SWNTs directly onto substrates or in bulk as a raw material. CVD is a
versatile technique suitable for the manufacturing of coatings, powders, fibers,
monolithic components, corrosion applications as well as large variety of compounds
including carbides, nitrides, oxides, and many others (Shah & Tali, 2016c). A major
advantage of CVD is that the CNTs can be used directly without further purification
unless the catalyst particle is required to be removed. In this process, thermal
decomposition of the hydrocarbon precursor over a heated metal catalyst, diffusion of
carbon, nucleation and growth of carbon nanotubes. (Kumar & Ando, 2010).
In 1890, French scientists observed the formation of carbon filaments during
experiments involving the passage of cyanogens over red-hot porcelain (Schultzenberger
& Schultzenberger, 1890). By mid-twentieth century, CVD was a well-known method
for synthesizing carbon microfibers using thermal decomposition of hydrocarbons in the
presence of metal catalysts. In 1952, Radushkevich and Lukyanovich reported electron
micrographs obviously exhibiting tubular carbon filaments of 50–100 nm diameter
Univers
ity of
Mala
ya

30
obtained from thermal decomposition of carbon monoxide in the presence of iron catalyst
at 600 ºC (Khalaj, Monajjemi, & Diudea, 2016). In 1953, Davis et al. published detailed
electron micrographs and XRD spectra of carbon nanofibers grown from the reaction of
CO and Fe2O4 at 450 ºC in blast furnace brick works (Davis, Slawson, & Rigby, 1953).
In the 1970s extensive works were carried out independently by Baker and Endo to
synthesize and understand carbon fibers (Baker et al., 1972) and tubular nanofibers
(Cheng et al., 2004; Ci et al., 2000; Kim et al., 2006; Lee et al., 2002). But, there were no
indications that it could also be used for the synthesis of carbon nanotubes until Yacamán
et al., (1993) reported this method the first time for the production of nanotubes (José‐
Yacamán et al., 1993).
The simplest form of CVD apparatus is shown in Figure 2.5. Several studies have
proposed different possibilities based on the reaction conditions and post deposition
product analyses, which are often contradicting (Nessim et al., 2009). Therefore, no
single mechanism for CNT growth is well established till date. Nevertheless, the most
widely-accepted mechanism that can be is based on the catalytic decomposition of carbon
precursor gases on catalysts, in the form of thin films or as deposited nanoparticles. The
growth temperature typically varies between 700 ºC and 900 ºC as high temperature is
necessary for the catalysis to occur. Hydrocarbon vapor first decomposes into carbon
and hydrogen species after contacting the “hot” metal nanoparticles; and hydrogen flies
away. As carbon gets dissolved into the metal, the carbon precipitates out after the carbon-
solubility limit is reached in the metal and crystallizes in the form of a stable cylindrical
network (Gromov et al., 2016).
Univers
ity of
Mala
ya

31
Figure 2.5: Schematic diagram of a CVD setup in its simplest form (Atchudan
et al., 2015).
These are the basic principles of the CVD process. In the past decade, the carbon
nanotubes synthesis have been developed with different techniques of CVD, such as
plasma enhanced CVD (PCVD) (Meyyappan et al., 2003), thermal chemical CVD (Lee
& Park, 2000), and catalytic pyrolysis of hydrocarbon (Cheng et al., 1998). CVD is a
simple and economic technique for producing CNTs at low temperature and ambient
pressure, as compared to arc-discharge and laser-ablation approaches. It provides CNTs
with high yield and purity, offers utilizing plenty of hydrocarbons in any state, enables
the growth of CNT in a variety of forms on various substrates such as powder, coiled,
entangled or aligned, and thin or thick films nanotubes (Prasek et al., 2011). Based on the
summarized comparison in Table 2.2, CVD process is highly selective, very simple,
easily reproducible and can be classified as the most promising low cost scaled technique
for producing large quantities of carbon nanotubes.
Usually transition metals (Fe, Ni, Co) or alloys catalysts are required in CVD based
syntheses of CNTs (Lee et al., 2010). The main role of the catalyst in the CVD process is
to decompose the carbon source via either heat (thermal CVD) or plasma irradiation
(plasma-enhanced CVD, PECVD) which will nucleate to form CNTs. The rate of carbon
decomposition, yield, and quality of products in CNT synthesis are considerably
determined by the choice of catalyst.
Univers
ity of
Mala
ya

32
Table 2.2: Comparison of arc-discharge, laser ablation and CVD methods.
Method Temperature
(°C)
Nanotube
graphitization
Nanotube
yield
Nanotube
selectivity
Relative
nanotube
quantity
Arc
discharge
3000-4000 high < 30% low low
Laser
ablation
~ 3000 high ~ 70% low low
CVD 500-1100 middle 40-80% high high
The choice of catalyst is probably the most important variable in synthesizing CNT,
defining the yield, selectivity, rate of carbon decomposition and quality of products.
Kathyayaini et al. (2008), reported that the decomposition of acetylene shows significant
higher activity with cobalt than iron under similar reaction conditions (Kathyayini et al.,
2008). Most of research to date has investigated supported catalyst systems, where the
metal-substrate interactions play a significant role in determining the morphology of the
prepared catalyst and, thus, on the resulting mechanism for CNTs growth (Kudo, 2016).
Concerning the carbon source, methane (Palizdar et al., 2011), ethane (Tomie et al.,
2010), ethylene (Narkiewicz et al., 2010), acetylene (He et al., 2011), xylene (Shirazi et
al., 2011), their mixture (Li et al., 2010), isobutene (Santangelo et al., 2010) or ethanol
(Yong, Fang, & Zhi-Hua, 2011) are the most preferred hydrocarbons in CVD. The
efficiency of CNTs growth, in the case of gaseous carbon source strongly depends on the
concentration of the gas phase and the reactivity of intermediates produced as a result of
hydrocarbon decomposition. Thus, it can be predicted that in order to initiate CNT growth
more efficiently, these intermediates should be produced in the gas phase to have the
potential of physisorption or chemisorption on the catalyst surface (Shukla et al., 2010).
Lyu et al. (2003), simultaneously synthesized SWNTs and double-walled carbon
nanotubes (DWNTs) by catalytic decomposition of CH4 over Fe–Mo/Al2O3 catalyst.
Univers
ity of
Mala
ya

33
High-resolution transmission electron microscopy observation showed that produced
carbon materials consist of about 70% SWNTs and about 30% DWNTs. The diameters
of SWNTs are in the range of 0.8–1.5 nm while the outer and inner diameters of DWNTs
are in the range of 1.75–3.1 and 0.95–2.3 nm, respectively. Raman analysis indicates that
the synthesized SWNTs and DWNTs have high-quality graphite structure (Lyu et al.,
2003).
Kim et al. (2005), described the synthesizing of unusual multi-walled carbon
nanotubes in a large quantity through a catalytic chemical vapor deposition method
(CCVD) using a floating reactant and subsequent thermal treatment up to 2600 °C. Main
characteristics of these nanotubes are (1) relatively wide distribution of diameters ranging
from 20 to 70 nm, (2) high purity, (3) highly straight and crystalline layers, (4) very low
interlayer spacing (0.3385 nm) and low intensity ratio value (ID/IG = 0.0717) (Kim et al.,
2005).
Flahaut et al. (2005), investigated the effect of catalyst preparation conditions on the
synthesis of carbon nanotubes (CNTs) by CCVD. The combustion route was used to
prepare catalysts by using either citric acid or urea as fuel. They found that in the case of
citric acid, the milder combustion conditions obtained can either increase the CNTs yield
with fewer walls or can limit the carbon nanofibers formation, depending on the catalyst
composition. (Flahaut, Laurent, & Peigney, 2005). Table 2.3 shows the summary of some
CVD processes conditions and the resulting product. It is specified that the different
parameters have acting on the resulting product with different manner. The combination
of three major parameters namely temperature, carbon source and catalyst is the most
effective factor in the identification of the obtained carbon nanomaterial.
Univers
ity of
Mala
ya

34
Table 2.3: Summary of synthesis of CNTs using CVD techniques.
Catalyst -
substrate
Carbon
Source
Reaction Condition
Product Quality
Reference Temper
-ature
ºC
Flow rate
ml/min
Fe–Mo - Al2O3 C2H2 950 -
1200
C2H2 : 20
Ar : 300
SWNTs 70%
DWNTs 30%
(Ruoff,
Qian, & Liu,
2003)
Co/Fe - zeolite C2H2 900 C2H2 : 10
Ar : 250
DWNTs > 80%
Do ~ 3 - 6 nm
(Hiraoka et
al., 2003)
Fe(CO)5 CH4 1050 CH4 : 125
N2 : 1000
MWCNTs: 15 - 420
nm
(Kuo et al.,
2005)
Fe - Al2O3 C2H6 660 C2H6 : 60
H2 : 60
MWCNTs : 30 nm (Louis et al.,
2005)
Fe3O4 - Si toluene/
ferrocene
800-850 Ar : 1000 MWCNTs: 2-25
nm
(Pinault et
al., 2005)
Co - Kaolin
Co - ceramic
C2H2 750 C2H2 : 50
N2 : 200
CNTs: 30-40 nm
Carbon nano shpere
(CNS) : d= 50-500
nm
(Xu et al.,
2005)
Fe - CaO CO2 790 CO2 : 750
H2 : 1500
MWCNTs: 50 nm (Xu &
Huang,
2007)
Fe/Mo, Fe/Ru-
Al2O3/ SiO2
CH4 900 CH4 ~
6000
SWNTs : (~ 42
wt%)
(Cassell et
al., 1999)
Co, Fe, Cu -
SiO2, zeolite,
clay
C2H2
700 C2H2 : ~ 8
N2 : ~75
MWNTs: (71-76%)
SWNTs: (low yield)
(Fonseca et
al., 1998)
Co/Mo, Co/V,
Co/Fe -SiO2,
Zeolite
C2H2
497- 697 C2H2
N2 : 15-25
~300
MWNTs 68%
8-40 nm
(Kukovecz
et al., 2000)
Mo - Quartz
CO 1200 CO : ~1200
SWNTs: 1-5 nm (Dai et al.,
1996)
Co/Mo - SiO2
CO 700 CO : ~100 MWNTs (4%) and
SWNTs (88%)
(Alvarez et
al., 2001)
Co, Ni, Fe -
MgO
H2 - CH4 1000 H2 : ~300
CH4 : ~75
SWNTs : (70-80 %) (Colomer et
al., 2000)
Mg0.9Co0.1O
H2/CH4 1000 CH4 : ~
250
SWNTs (64 %)/
DWNTs ( > 80 %)
0.5 – 5 nm
(Flahaut et
al., 2005)
Univers
ity of
Mala
ya

35
Table 2.3 (continued)
Fe/Mo - Quartz
CH4 875 CH4 : Ar
(1:1 ratio)
DWNTs (in high
yields)
(Endo et al.,
2005)
Fe - Al2O3
CH4
900 __ DWNTs :1- 6 nm (Cumings,
Mickelson,
& Zettl,
2003)
Al/ Fe/ Mo - Si
C2H2 1000 C2H2 : ~ 50
-250
SWNTs : ~ 1.3 nm
(Lacerda et
al., 2004)
Single or multi
- Fe, Co, Ni -
Al2O3 , SiO2
C2H4 1080 C2H4 : ~30
N2 : ~80
Bundles of isolated
SWNTs : 0.2 – 0.7
nm
(Cheng et
al., 2004)
Al/ Fe/ Mo - Si
C2H2 1000 C2H2 : ~ 50
-250
SWNTs : ~ 1.3 nm
(Lacerda et
al., 2004)
M(C5H5)2
(M=Fe,Co,Ni),
Fe(CO)5
C2H2 1100 Ar : ~975
H2 : ~25
C2H2 : ~50
SWNTs : ~1 nm
(Satishkuma
r et al.,
1998;
Satishkumar
et al., 2000)
Fe/Mo - SiO2 ,
Si
CH4 900 CH4 :
~1500
H2 : ~125
SWNTs
(Franklin et
al., 2001)
2.2.5.4 CVD support catalyst method
The structure and chemical state of the substrate are more significant than that of
the metal and the same catalyst has different impact on different support materials.
Commonly used substrates in CVD are graphite (Baker et al., 1972), quartz (Andrews et
al., 1999; Kumar & Ando, 2003), silicon (Kumar et al., 2004), silicon carbide (Ding et
al., 2003; Murakami et al., 2004), silica (Mattevi et al., 2008), alumina (Cheung et al.,
2002), alumina-silicate (zeolite) (Kumar & Ando, 2005; Willems et al., 2000), CaCO3
(Couteau et al., 2003), magnesium oxide (Ago et al., 2004). Investigation of the catalyst–
substrate interaction with utmost attention should be undertaken for an efficient CNMs
growth. Thus, the catalytic behavior of the metal would be terminated because of the
metal–substrate reaction and chemical bond formation. It is confirmed that the
morphology of CNMs grown on porous supports using CVD is strongly affected by the
Univers
ity of
Mala
ya

36
porosity, the structure, and chemical composition of the support as well as the
concentration of the metal and morphology of the metal catalyst (Doustan & Pasha, 2016;
Prieto et al., 2014). Veziri et al. (2009), studied the effect of Ni metallic catalysts
supported on three different porous substrates (microporous alumino-phosphate
molecular sieves, activated carbon, and macroporous polymeric beads) on the structural
morphology of CNTs. The group observed that the Ni catalyst is sensitive to metal-
support interactions producing coiled, fibrous and belt-like structures (Veziri et al., 2009).
High yields of CNTs with a narrow diameter distribution have significantly
resulted from zeolite supports with catalysts in their nanopores (Kumar & Ando, 2005).
Alumina supports offers good metal dispersion and thus a high density of catalytic sites
and unwanted defective MWCNTs or graphite particles due to the strong metal–support
interaction. Accordingly, they are considered a better catalyst substrate than silica
supports (Nagaraju et al., 2002). Such interactions significantly minimize the aggregation
of the metal species and prevent them from forming large clusters (Ago et al., 2004).
One of the methods of supporting catalyst on the substrate is incipient wetness
impregnation. For example, Fe(NO3)3·9H2O is impregnated on alumina powder by
dissolving the salt in a solvent such as deionized water, then the substrate powder was
added to the same solvent. The two mixtures mixed together then dried and grinded
(Delzeit et al., 2002). The substrate is placed in a ceramic boat and positioned in the center
of the CVD furnace after it is washed with distilled water and diluted hydrofluoric acid
solution to remove all contaminants, as shown in Figure 2.6. After the injection of the
hydrocarbon source along with the catalyst into the chamber of the furnace tube, very thin
film of transition metal catalyst is deposited over the substrate catalyst. The organic
catalyst will decompose during the injection of the catalyst-hydrocarbon precursor
mixture into fine cluster catalyst and deposit over the substrate (Yan et al., 2015). Xu et
al. (2005), utilized the two different substrates, kaolin plate and ceramic plate in chemical
Univers
ity of
Mala
ya

37
vapor deposition to investigate the importance of substrates. The decomposition of C2H2
was carried out at 750 °C in nitrogen atmosphere. Two different types of carbon
nanostructures were produced, carbon nanotubes and carbon spheres (Xu et al., 2005).
Figure 2.6: Schematic diagram of thermal CVD apparatus.
Chen et al. (2009), attempted to prepare carbon nanomaterials on activated carbon
(AC) directly avoiding impregnation with metal catalyst. AC prepared from biomass
already contains iron that can be considered as a ‘‘natural catalyst’’ and can catalyze the
formation of CNFs (Chen, Timpe, et al., 2009b). Veziri et al. (2008), synthesized CNTs
on pellets of activated carbon using Ni as a catalyst. They found that the reaction
temperature has strong effect on nanotube growth leading to an optimal value of 750oC,
while the growth rate was continuously suppressed for a reaction duration longer than 5
min, the nanotube size distribution was broadened, and the formation of amorphous
carbon was favored (Veziri et al., 2008).
2.2.6 Mechanism of nanotube growth in CVD
Enormous investigations were published describing how to grow CNMs by varying
the carbon sources, processing gases, the catalyst materials, etc. after Iijima 1991 paper.
However, most of papers did not include significant insights on their growth mechanisms.
Univers
ity of
Mala
ya

38
As of today, publications more likely presented respectable discussion which reviewed
different aspects of the current understanding of the CNTs growth mechanism using CVD
(Acomb, Wu, & Williams, 2015; Jourdain & Bichara, 2013b).
Growth mechanism of CNTs in CVD process is not completely understood, different
models exist but some of them cannot unambiguously explain the mechanism. The vapor–
solid–solid (VSS) model is the most accepted growth model which derives from the
vapor–liquid–solid (VLS) model originally suggested by Wagner and Ellis for growth of
silicon whiskers (Wagner & Ellis, 1964). In CVD process, the growth of nanotube on
catalyst particles is similar to a conventional gas–solid interaction method such as the
deposition of thin film on substrates. Using the VSS model, the excess carbon from the
decomposition of the hydrocarbon precursor gases precipitates on the catalyst surface,
adsorption of species onto the catalyst surface followed by diffusion into the catalyst.
Finally, the surface reactions lead to film growth and nanotube nucleation at the edges of
the catalyst (Kudo et al., 2014). Figure 2.7 shows two main models for growth of CNTs
on a substrate. Tip-growth; the nanotube lifts the catalyst from the substrate because of
the weak interaction of the catalyst-substrate, and during the growth the catalyst particles
are pushed upwards, the precursor is supplied through the upper region of the catalyst
while carbon atoms are diffused downwards as the nanotube nucleates and grows below
the catalyst. CNT will grow continuously as long as the concentration gradient exists in
the metal, and the metal’s top is open to receive fresh carbon from the decomposition of
carbon precursor. Once the metal is overall covered with excess carbon, the CNT growth
is ceased due to catalyst deactivation (Romero Rodríguez, 2017). Base-growth, base
growth model proposed by Sinnott et al., in the same manner of tip growth model, with
the assistance of catalyst particles, the pyrolyzed hydrocarbon products are first adsorbed
on the particle surface and the carbon atoms are liberated (Seah, Chai, & Mohamed,
2014). When the catalyst surface was supersaturated, these liberated carbon atoms diffuse
Univers
ity of
Mala
ya

39
into a catalyst and precipitate on the upper surface to form cylindrical-shaped graphite
sheets. In this model, the interaction force between the catalyst particles and the substrate
surface is sufficiently strong, and CNT precipitation fails to push the metal particle up.
Thus, CNT grows up with the catalyst particle rooted on its base. The nanotube growth
will cease if the carbon supply is insufficient or the particle surface is contaminated.
Moreover, some research groups claim that during the growth, a combination of both
growth models might be enhanced due to the presence of more than one catalyst dot (Saha
et al., 2014).
Figure 2.7: Widely-accepted growth mechanisms for CNTs: (a) tip-growth
model, (b) base-growth model (Kumar & Ando, 2010).
b
a
Univers
ity of
Mala
ya

40
Baker et al., (1972) suggested in the model of the growth of carbon fibers that the
carbon liberated from acetylene decomposition at 600°C diffuses through the nickel
cluster due to a thermal gradient of the exothermic decomposition. Thus precipitated
carbon on the rear side of the cluster and forms the fiber (Baker et al., 1972). The observed
activation energies for the filament growth were in accordance with those for diffusion
of carbon through the corresponding metal such as Co, Fe, Cr, etc. (Wirth et al., 2012).
Whether the growth follows the tip or base growth model, is explained by a weaker or
stronger metal-support interaction respectively (Jourdain & Bichara, 2013a).
Oberlin et al., (1976) modified the Baker model. They proposed that the fiber
formation is enhanced by a catalytic process through the surface diffusion of carbon
atoms around the catalyst, rather than by bulk diffusion of carbon through the catalytic
cluster. This model suggests the diffusion of carbon atoms only occurs on the outer
surface of the metal cluster and the cluster acts as a seed for the fiber nucleation (Oberlin,
Endo, & Koyama, 1976).
Raty et al., (2005) investigated the early stages of SWCNT formation on iron
nanoparticles. Their study showed that the growth occurs from the root on Fe catalyst
after the formation of a curved sp2 cap bonded carbon sheet by rapid diffusion of carbon
atoms on the curved metal surface. They proposed that the floating of the formed
graphene on the curved surface was attributed to the weak adhesion between the cap and
iron while the border atoms of the cap remain adhered to the metal. Since more carbon
atoms join the border, the cap is pushed up and thus constituting a cylindrical wall.
Furthermore, they did not observe at the nanoscale any tendency of carbon atoms to
penetrate inside the catalyst (Raty, Gygi, & Galli, 2005).
Univers
ity of
Mala
ya

41
2.2.7 Functionalization of carbon nanotubes
The academia and industry research has been focusing on CNT modification as there
are issues regarding their solubility, hydrophobicity of their stable graphitic structure,
aggregation, and difficult manipulation that has imposed a significant limitation on their
potential applications (Karousis et al., 2016). Functionalization of CNTs is directly
affected by their chemical composition, particle size, and surface nature. Consequently,
functionalization of CNTs has gained lots of attention as an attempt to remove CNTs
impurities and to introduce different functional groups, which subsequently enhance
CNTs solubility, graphitic networks and improving their process ability (Hu et al., 2010).
CNTs can be modified through the addition of functional groups on its surface by the
formation chemical bonds between the modifier and CNTs surface or physical adsorption
of the modifying species to the surface of CNTs (Hayyan et al., 2015). CNTs exhibit
chemistry differs from other regular carbon materials because of their unique small
diameter, and structural properties. Accordingly, they shown a great affinity to interact
with different compounds and to be integrated into organic, inorganic and biological
systems (Amara et al., 2015). The main approaches for the modification of CNTs are
shown in Figure 2.8 and can be grouped into three categories: (a) the covalent attachment
of chemical groups via chemical reactions with the π-conjugated skeleton of CNT; (b) the
noncovalent adsorption or wrapping of various functional molecules; and (c) the
endohedral filling of their inner empty cavity (Karousis, Tagmatarchis, & Tasis, 2010).
Chen et al., (1998) reported the saturation of 2% of the carbon atoms in SWCNTs with
C-Cl due to the addition of chlorine (Cl) to the sidewalls SWCNTs via reaction with
soluble dichlorocarbene, which resulted in significant changes in the electronic structure
(Chen et al., 1998). Mickelson et al., (1998) reported fluorination of SWCNTs with F2
gas flow at temperatures of 250-600 °C for 5 hrs. The authors demonstrated that this type
of modification offers a starting point for a numerous side-wall chemical
Univers
ity of
Mala
ya

42
functionalization (Mickelson et al., 1998). Fluorination is one of the methods enabling an
efficient simultaneous functionalization and purification of carbon nanotubes (Adamska
& Narkiewicz, 2017). Strong inorganic acids such as sulfuric acid nitric acid and their
mixtures are the most common conventional materials used for functionalization are High
volatile organic solvents, oxidizing and reducing agents such as KMnO4, H2O2, NaClO,
KOH and NaOH have been widely used in this respect.
The acid treatment produces carboxylic and hydroxylic groups (COOH, OH, C=O and
SO3H) on the external surface of the CNTs. Basically, this technique involves refluxing
of CNTs in boiling acids including nitric acids, sulfuric acid, or a mixture of both (Kumar,
Jiang, & Tseng, 2015). Utilizing such harsh conditions of extensive ultrasonic
modification lead to the opening of the tube caps as well as the etching along the walls
and defects formation associated with the release of carbon dioxide. The final products
are fragments of nanotube with 100 to 300 nm lengths with decorated ends and sidewalls
by a high density of different oxygen containing groups mostly carboxyl groups
(Majewska, 2015; Santangelo et al., 2012).
Figure 2.8: Strategies for chemical and physical functionalization of CNTs: a)
covalent sidewall functionalization, b) covalent defect sidewall functionalization, c)
non-covalent adsorption of surfactants, d) wrapping of polymers, and e)
endohedral functionalization (Hussain & Mitra, 2011).
Univers
ity of
Mala
ya

43
Oxidized MWCNTs were used for the adsorption of lead, copper and cadmium ions
(Mubarak, Sahu, et al., 2014; Peng, Luan, Di, et al., 2005) and trihalomethanes (Lu,
Chung, & Chang, 2005) from aqueous solutions. These studies concluded that oxidized
CNTs show higher adsorption affinity for the target pollutants compared with other
adsorbents such as activated carbon. Li et al., (2007) oxidized CNTs with H2O2 and
KMnO4 for 3 h at 80 ºC, however, nitric acid was refluxed with the suspension for 1 h at
140 ºC. with and HNO3. They reported that Cadmium (II) adsorption removal for the
three kinds of oxidized CNTs was increased due to the added functional groups compared
with the as-grown CNTs. Analysis demonstrated that the KMnO4 oxidized CNTs hosted
manganese residuals, and these accordingly contributed to cadmium sorption to a yet-
undefined extent (Li et al., 2007).
The adsorption process of phenol was studied by Luz-Asunción et al., (2015) using
carbon nanomaterials (CNMs). The adsorption was achieved with as received SWCNTs,
MWCNTs and after oxidation treatment, also graphene oxide and reduced graphene oxide
were used. Hydrogen peroxide was used to modify CNTs under microwave irradiation
and the graphene oxide reduction was achieved by using ascorbic acid. The authors
reported that phenol removal occurs by 𝜋-𝜋 interactions and hydrogen bonding and not
by electrostatic interactions. Their results demonstrated that the surface area of CNMs
has promoted the adsorption of phenol and the removal efficiency was reduced due to the
presence of oxygenated groups (de la Luz-Asunción et al., 2015). CNTs modified with
hydrophilic groups have shown an improvement in their dispersion in aqueous media
which is another direct consequence of surface modification. Rosenzweig et al., (2013)
demonstrated that CNTs had higher adsorption capacity for copper after modification
with acid (COOH) and (OH) moieties. They reported that the aggregation state of CNTs
could be limited due to the formation of new accessible sites (Rosenzweig et al., 2013).
Univers
ity of
Mala
ya

44
An additional important aspect to consider is that the increasing of oxygen-containing
functional groups could be a double-edged sword. Thus, the adsorption efficiency of
CNMs might be adversely affected by surface functionalization. Wu et al., (2012)
thoroughly explored the adsorption affinity of oxidized MWCNT for organic compounds
in water. They found that the significant decreased uptake of the oxidized MWCNT was
attributed to the competition of water molecules; meanwhile, the adsorption affinity of
organic chemicals were not changed because the adsorption interactions including the
hydrophobic effect and π–π forces remained constant (Apul & Karanfil, 2015; Wu et al.,
2012). Many studies demonstrated with particular attention the magnetite modified multi-
walled carbon nanotubes (M-MWCNTs) because they can be easily removed from
aqueous solution by magnetic separation. Magnetic CNTs (M-CNTs) hybrids have
showed excellent adsorption properties for dye removal (Yu et al., 2012).
Although, the ease of processing is the goal of functionalization at the same time, their
adsorption properties with organic chemicals can be significantly altered. On one hand
increasing the hydrophilicity of CNTs via functionalization will increase their wettability
and make them suitable for the adsorption of relatively low molecular weight and polar
compounds (Piao, Liu, & Li, 2012). On the other hand, the functional groups may
increase the diffusional resistance as revealed from the kinetic studies of modified CNTs
demonstrated which will accordingly, reduce the accessibility and uptake of CNT
surfaces towards organic chemical (Gupta & Saleh, 2013; Mulzer et al., 2016).
Univers
ity of
Mala
ya

45
2.3 Organic pollutants
2.3.1 Bisphenol A
2.3.1.1 Structure and physicochemical properties of bisphenol A
Bisphenol A (BPA) is the common name for 2,2-Bis (4-hydroxyphenyl) propane, an
organic compound with two phenol moieties. It is a building block for several important
polymers and polymer additives (Huang et al., 2012). Figure 2.9 shows the tetrahedral
molecular structure of BPA. The molecular structure has surface area of 4.32 nm2 a and
volume of 0.70 nm3. The maximum distance between the hydroxide groups is 0.94 to
1.119 nm, height 0.53 nm and the benzene ring width of 0.325 to 0.43 nm. Table 2.4
summarizes the physiochemical properties of BPA (Pullket, 2015) .
Figure 2.9: BPA molecular structure (Pullket, 2015).
Table 2.4: Physicochemical properties of bisphenol A.
Properties References
Case Number 80-05-7 (Haynes, 2014)
Formula C15H16O2 (Haynes, 2014)
IUPAC name 4,4'-(propane-2,2-diyl) diphenol (Haynes, 2014)
Molecular Weight 228.287g/mol (Haynes, 2014)
Density 1.195 g/cm3 (Staples et al., 2000)
Melting point (0C) 153 ºC (Haynes, 2014)
Boiling point 220 ºC (Haynes, 2014)
Aqueous solubility 120-300 mg/L (Verschueren, 1983)
Univers
ity of
Mala
ya

46
Table 2.4 (continued)
Henry's Constant (25ºC) 1x 10⁻¹⁰ (Staples et al., 2000)
Vapor pressure
Vapor pressure @ 170 0C
5.3 x 10⁻⁶ Pa
0.2 mm Hg
(Cousins et al., 2002)
(Verschueren, 1983)
log KOW
2.20 - 3.82
3.40
(Staples et al., 2000)
(Cousins et al., 2002)
Log KOC 314 (Staples et al., 2000)
pKa 9.59 and 10.2 (Staples et al., 2000)
2.3.1.2 Production and application
BPA was first synthesized by A. P. Dianin in 1891 and later in the1930s it was
investigated during the exploration for synthetic estrogens for pharmaceutical
applications (Varandas, 2014). At that time, it was examined for its estrogenic properties
but rejected when Diethylstilbestrol (DES) was found to have better potential for
pharmaceutical use. Nevertheless, since the early 1950s until now, the majority of the
BPA produced is at most used as a monomer for polycarbonate and epoxy resins
(Suhrhoff & Scholz-Böttcher, 2016). BPA is synthesized from acetone and phenol with
a by-product of water as described in Figure 2.10.
Figure 2.10: Chemical production of BPA.
BPA is also used in the manufacturing of phenol resins, polyesters, polyacrylates,
coatings, intermediates in flame retardants, and packaging and has been widely used in
the manufacture of shampoo, sunscreen lotions, bar soaps, nail polish, and face
lotions/cleanser, besides in producing dental sealants and bonding agents. BPA is,
definitely one of the highest volume chemicals produced worldwide, > 8 billion pounds
Univers
ity of
Mala
ya

47
each year and > 100 tones released into the atmosphere by annual production (Chen et
al., 2016).
2.3.1.3 Exposure of BPA to the environment
The spread of BPA contamination in the environment comes from humans and its
manufacturing process. Thus, its exposure had seen in the surface fresh water, landfill
leachate, wastewater, air, and dust particles. About 100 tons BPA released into the
atmosphere each year from worldwide production (Makinwa & Uadia, 2015). The
leachates of BPA from household effluent and industrial effluent passed through the other
environment phases. The leaching of BPA monomer results from the hydrolysis of the
ester bond linking BPA molecules in polycarbonate and resins which are found in the
plastic food containers and bottles when it contacts with water at room temperature. The
rate of BPA leaching increases with temperature rises, and it depends on the pH of the
aqueous media. Furthermore, the leaching rate from old, worn-out products is notably
enhanced compared with new products which can reach to more than 1000-fold. When
the leachate reaches the aquatic environment even after dilution can be at levels that could
have an adverse health effect on humans (Eggen, Moeder, & Arukwe, 2010). BPA is a
challenging problem because it has a high solubility in water, reproductive toxicity, and
teratogenicity. Also, it affects the ecosystem even at levels as low as 0.1 ppb. In recent
years, BPA detected in surface water, industrial wastewater, groundwater, and even in
drinking water due to the increased production of BPA. BPA has started to become an
urgent priority not only in the drinking water industry but also in food and wastewater
sludge (Pignotti et al., 2017). Table 2.5 and Table 2.6 shows the available environmental
quality standards for BPA and the major studies reported in the literature about BPA in
aquatic matrices respectively. Studies also have indicated that human water bodies such
as serum, urine, amniotic fluid, and placental tissue have confirmed the presence of BPA
(Lee et al., 2017).
Univers
ity of
Mala
ya
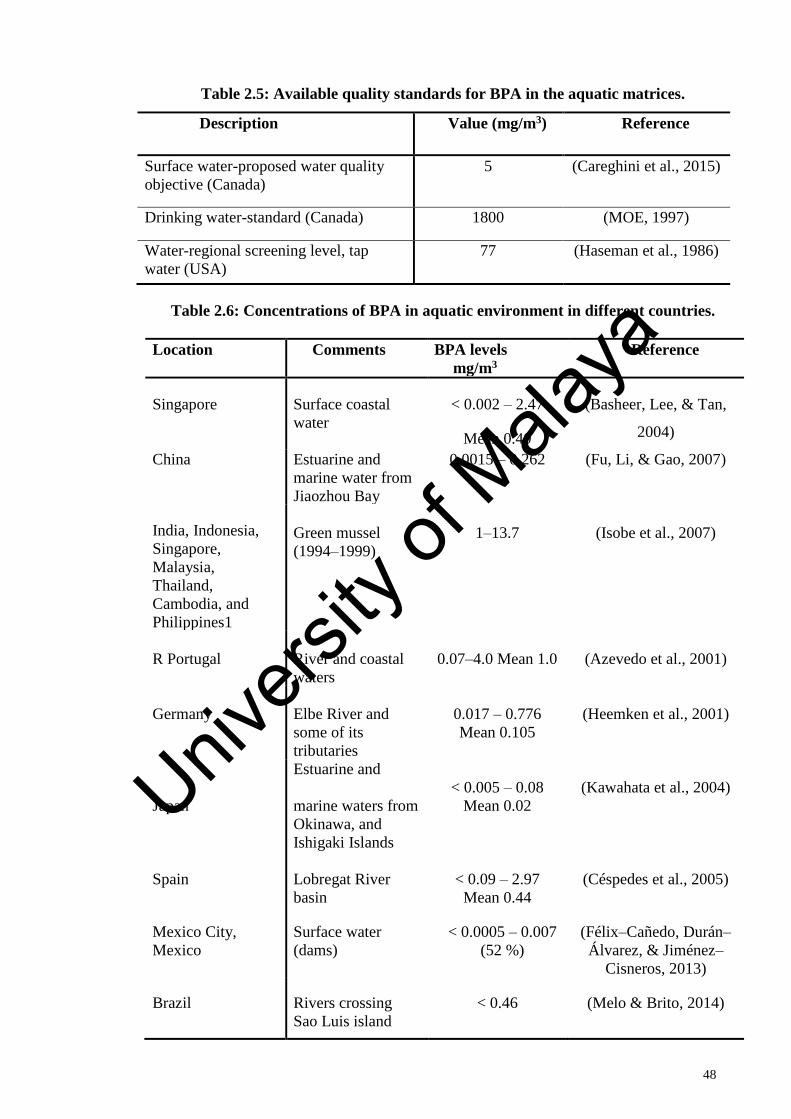
48
Table 2.5: Available quality standards for BPA in the aquatic matrices.
Description Value (mg/m3) Reference
Surface water-proposed water quality
objective (Canada)
5 (Careghini et al., 2015)
Drinking water-standard (Canada) 1800 (MOE, 1997)
Water-regional screening level, tap
water (USA)
77 (Haseman et al., 1986)
Table 2.6: Concentrations of BPA in aquatic environment in different countries.
Location Comments BPA levels
mg/m3
Reference
Singapore Surface coastal
water
< 0.002 – 2.47
Mean 0.40
(Basheer, Lee, & Tan,
2004)
China Estuarine and
marine water from
Jiaozhou Bay
0.0015 – 0.262 (Fu, Li, & Gao, 2007)
India, Indonesia,
Singapore,
Malaysia,
Thailand,
Cambodia, and
Philippines1
Green mussel
(1994–1999)
1–13.7
(Isobe et al., 2007)
R Portugal
River and coastal
waters
0.07–4.0 Mean 1.0
(Azevedo et al., 2001)
Germany
Elbe River and
some of its
tributaries
0.017 – 0.776
Mean 0.105
(Heemken et al., 2001)
Japan
Estuarine and
marine waters from
Okinawa, and
Ishigaki Islands
< 0.005 – 0.08
Mean 0.02
(Kawahata et al., 2004)
Spain
Lobregat River
basin
< 0.09 – 2.97
Mean 0.44
(Céspedes et al., 2005)
Mexico City,
Mexico
Surface water
(dams)
< 0.0005 – 0.007
(52 %)
(Félix–Cañedo, Durán–
Álvarez, & Jiménez–
Cisneros, 2013)
Brazil Rivers crossing
Sao Luis island
< 0.46 (Melo & Brito, 2014)
Univers
ity of
Mala
ya

49
2.3.1.4 Hazardous potential of BPA
Since 1930, BPA has been suspected to be hazardous to human due to the estrogenic
activity, and has recently been identified as an endocrine disrupter compound (EDCs).
EDCs are a structurally different class of emerging contaminants that have been detected
in aquatic bodies (Bhatnagar & Anastopoulos, 2017). EDCs unfavorably affect human
health and ecosystems by disrupting development, growth, and reproduction, because
they can mimic natural hormones in the endocrine systems (Anwer, Chaurasia, & Khan,
2016; Huang & Weber, 2005). EDCs include (a) natural compounds including steroid
hormones naturally produced by humans and animals and (b) anthropogenic compounds
namely, synthetic hormones or industrial and agricultural chemicals (pesticides,
bisphenol A, phthalates plasticizers, etc.). Phenolic compounds contain an important class
of endocrine disruptors; many matching the structural features of natural estrogens thus,
motivating the estrogenic toxicity via binding to estrogen receptors (Griffith, 2013). Even
Table 2.6 (continued)
UK _ 0.006 – 0.068 (Luo et al., 2014)
Greece _ 0.055 – 0.152 (Luo et al., 2014)
Korea _ 0.0075 – 0.334 (Luo et al., 2014)
Switzerland Glatt River 0.009 – 0.076 (Voutsa et al.,
2006)
Italy
Tiber River
< 0.03 – 0.14
Mean 0.07
(Patrolecco et al.,
2006)
South Korea Han River 0.0069 – 0.059 (Yoon et al., 2010)
Switzerland Glatt River 0.009 – 0.076 (Voutsa et al.,
2006)
Canada _ Mean 0.0021
Maximum 0.087
(Luo et al., 2014)
Univers
ity of
Mala
ya

50
though BPA having lower estrogenic activity than of 17β-Estradiol, the recent researches
show that BPA still can stimulate some cellular responses and induce various endocrine-
related pathways. Accordingly, it has harm impact on the environment and cause a
potential health risk to humans even at low levels (Rubin, 2011). Table 2.7 shows the
impact of low levels of BPA exposure on animals. BPA can cause disorders of the
immunological system, development of tumors in the breast and prostate, neurological
problems, anomalies in reproduction and development, even infertility.
Table 2.7: Effects of low-dose of BPA exposure in animals.
Dose (μg/kg/d)
Effects (measured in studies of animals) Reference
0.025 "Permanent changes to genital tract" (Markey et al., 2005)
0.025
"Changes in breast tissue that predispose
cells to hormones and carcinogens"
(Muñoz-de-Toro et al.,
2005)
1
"Long-term adverse reproductive and
carcinogenic effects"
(Newbold, Jefferson, &
Padilla-Banks, 2009) 2 "Increased prostate weight 30%" (Nagel et al., 1997)
2 "Lower body weight, increase of
anogenital, distance in both genders, signs
of early puberty and longer estrus."
(Honma et al., 2002)
2.4 "Decline in testicular testosterone" (Akingbemi et al., 2004)
2.5 "Breast cells predisposed to cancer" (Murray et al., 2007)
10
"Prostate cells more sensitive to hormones
and cancer"
(Ho et al., 2006)
10 "Decreased maternal behaviors" (Palanza et al., 2002)
30 "Reversed the normal sex differences in
brain structure and behavior"
(Kubo et al., 2003)
50
"Adverse neurological effects occur in
non-human primates"
(Leranth et al., 2008)
50
"Disrupts ovarian development"
(Adewale et al., 2009)
Univers
ity of
Mala
ya

51
Also, different human diseases such as recurrent miscarriage, ovarian dysfunction, and
endometrial hyperplasia associated with the levels of bisphenol A in human’s blood.
Therefore, these adverse impacts have raised concerns since reproductive toxicity could
result from the prolonged exposure to environmentally relevant concentrations of BPA
(Peretz et al., 2014). The Canadian government was the first country to classify BPA as
a dangerous substance. In this context, selling, importing, and advertising of baby bottles
that contained BPA is prohibited. In response to American Chemistry Council request,
the European Commission and Food and Drug Administration (FDA) in 2012 forbidden
the use of BPA in polycarbonate infant feeding bottles, sippy cups, and restricted the use
of BPA based resins in coatings for infant formula packaging In this context, selling
importing and advertising of baby bottles that contained BPA is prohibited (Park et al.,
2015; Qin et al., 2015; Usman & Ahmad, 2016). Kumar reported that the overall priority
for BPA was second place out of 100 chemicals as endocrine-disrupting chemicals,
pharmaceuticals, personal care products. BPA was third place for the occurrence, was 35
for ecological effect, was 29 for the health effect, and out of the EDC; BPA was the
second highest priority of concern when compare to the surface/source water (Kumar &
Xagoraraki, 2010).
2.3.1.5 Treatment methods
The recent studies demonstrated that the pharmaceuticals, personal care products
(PPCPs), and endocrine-disrupting have the ability to pass the traditional water treatment
processes (Ebele, Abdallah, & Harrad, 2017). Due to the environmental risk of BPA,
several methods have been developed to remove BPA from wastewater such as biological
treatment (Burke, Duennbier, & Massmann, 2012; Guerra et al., 2015), Coagulation,
flocculation, and sedimentation (Stackelberg et al., 2007), nanofiltration (Zielińska et al.,
2016), reverse osmosis (Yüksel, Kabay, & Yüksel, 2013), advanced oxidation processes
(Sharma, Mishra, & Kumar, 2015; Zhang & Li, 2014), ozone (Umar et al., 2013; Von
Univers
ity of
Mala
ya

52
Sonntag & Von Gunten, 2012) and membrane bioreactors (Chen, Huang, & Lee, 2008;
Yang et al., 2013) and adsorption (Bhatnagar & Anastopoulos, 2017; Fu et al., 2015;
Gupta, Mittal, & Gajbe, 2005). However, due to the high chemical stability of BPA, these
treatments did not achieve complete removal from the aqueous phase. Owing to its high
effectiveness, simple design, low cost, low energy requirements and less production of
harmful byproducts, adsorption technique has proved to more efficient and advantageous
over other reported physio-chemical methods (Feng et al., 2012; Jung et al., 2015). The
effective adsorption process could be achieved by an adsorbent with a superior adsorption
capacity for the target adsorbate. Thus, the most important adsorbent features for any
application are capacity, cost, selectivity, kinetics, regenerability, and compatibility
(Dehghani et al., 2016).
2.3.1.6 BPA removal by miscellaneous adsorbents
Various adsorbents have been reported for BPA elimination from water, for example,
Kuo (2009), utilized as-grown and modified CNTs to remove BPA from aqueous
solution. The surface of CNTs was modified by applying microwave irradiation along
with SOCl2/NH4OH. The author suggested that the modification method was effective as
established by the larger specific surface area of the modified CNTs than that of as-grown
CNTs. The maximum adsorption capacity of as-grown and modified CNTs was 60.98
and 69.93 mg/g, respectively The kinetic studies showed that the adsorption of BPA onto
CNTs associated by intraparticle diffusion (Kuo, 2009).
Zhou et al., (2012) evaluated the behavior of BPA removal from aqueous solutions
onto some bio-sorbents such as sawdust, peat, bagasse, and rice husk. The author reported
that peat showed great adsorption potential as a natural sorbent material, compared with
the other investigated materials. The study demonstrated that the modified peat surface
with hexadecyltrimethylammonium bromide (HTAB) exhibited high sorption affinity for
BPA of 1.71 mg/g. The study indicated that the hydrophobic interaction between the
Univers
ity of
Mala
ya

53
grafted HTAB groups and phenyl groups is the most removal force influencing the
adsorption process. Furthermore, the BPA removal was preferred in the binary solute
system of BPA and phenol, and the adsorption of BPA was promoted with the increase
in ionic strength and the sorbent dose in a neutral solution (Zhou, Lu, & Lu, 2012).
Koduru et al., (2016) studied the removal of BPA from aqueous solutions using
crystalline hybrid adsorbents fabricated of a goethite/activated carbon (GPAC). The study
reported the adsorption capacity of BPA was increased with an increasing in the iron
oxide concentration in GPAC. They demonstrated that the removal of BPA on GPAC
was well fitted with the pseudo-second-order kinetics and Freundlich isotherm. They
found that the maximum adsorption capacity of BPA on GPAC was 62.5 mg/g (Koduru
et al., 2016).
Table 2.8 summarizes the characteristic of various adsorbents that have been used as
adsorbents for the removal of BPA from aqueous solution such as clays (Park et al., 2014;
Rathnayake et al., 2016; Zheng et al., 2013), zeolites (Dong et al., 2010; Wang et al.,
2016), chitosan (Dehghani et al., 2016; Kimura et al., 2012), carbon and graphene based
adsorbents (Bele, Samanidou, & Deliyanni, 2016; Gong et al., 2016; Libbrecht et al.,
2015; Liu et al., 2009; Tang et al., 2016; Wang, Qin, et al., 2015; Xu, Wang, & Zhu,
2012), imprinted polymers (Liu, Zhong, et al., 2016; Pichon & Chapuis-Hugon, 2008;
Wolska & Bryjak, 2014), composite materials (Abkenar et al., 2015; Cui et al., 2016; Guo
et al., 2011; Li, Gondal, & Yamani, 2014), agricultural wastes (Chang et al., 2012; Soni
& Padmaja, 2014; Wirasnita et al., 2014), and nanomaterials (Dehghani et al., 2015;
Farmany et al., 2016; Samadi et al., 2016; Tripathi et al., 2014; Zhou, Wang, et al., 2016)
.
Univers
ity of
Mala
ya

54
Table 2.8: Characteristics of some of different adsorbents used for BPA removal.
Adsorbent Surface
area
(m2/g)
Initial adsorbate
concentration,
solid/liquid
pH,
time/min
Isotherm
models
Kinetic
models
Maximum
adsorption
Capacity
(mg/g)
Reference
Nanomaterials
MWCNTs NA 2-50 mg/L, 0.5 g/L 9, 60 Freundlich -
Langmuir
Pseudo-second-order
71.0
(Dehghani
et al.,
2015)
SWCNTs
NA 2-50 mg/L, 0.5 g/L 9, 60 Langmuir Pseudo-second-order
111.11 (Dehghani
et al.,
2015)
SWCNTs
78.2 10 mg/L,
0.125 g/L
6, 30 Langmuir Pseudo-second-order-
intraparticle diffusion
59.17 (Kuo,
2009)
Graphene 327 10 mg/L,
10 mg/100mL
6, 30 Langmuir Pseudo-second-order
182.8 (Xu et al.,
2012)
Antimony
nanoparticle/
MWCNTs
composite
110 20,60, 100 mg/L;
100,200, 400 mg/L
7, 60 Langmuir Pseudo-first-order
Removal :
93%
(Samadi et
al., 2016)
Univers
ity of
Mala
ya

55
Table 2.8 (continued)
Fe3O4-polyaniline
core-shell
nanomaterials
NA 1-20 mg/L,
20 mg/25 mL
7, 300 Freundlich Pseudo-second-order
23.09 (Zhou,
Wang, et
al., 2016)
Reduced graphene
oxide/magnetic
nanoparticles(rGr-
MNP)
NA 20 mg/L,
10 mg/50 mL
6, 120 Langmuir Pseudo-second-order
125
(Zhang et
al., 2014)
Clay
Pure Ca
montmorillonite
(Ca-MT)
75.725
NA
7.0,240
Langmuir
Pseudo-second-order
151.52
(Zheng et
al., 2013)
Montmorillonite
(organoclays)
NA
5 - 500 mg/L,
(0.2-0.3 g)/40 mL
7.0, 60 Langmuir
Pseudo-second-order
256.41 (Park et
al., 2014)
Palygorskite (MT) 104.4 0.01-10 mg/L,
3.0 g/25 mL
>10-12, 100
Langmuir
NA 77.3 (Berhane
et al.,
2016) Univers
ity of
Mala
ya

56
Table 2.8 (continued)
Zeolites
Hydrophobic
zeolite
504.5 10-90 mg/L,
0.5 g/L
7, 140 Redlich–
Peterson
Pseudo-second-order 111.11 (Tsai,
Hsu, et al.,
2006)
Cetyltrimethyl
ammonium
bromide -zeolite
9.78 50 mg/L,
1 g/L
10,210 Freundlich Pseudo-second-order 237.85 (Wang et
al., 2016)
Hexadecyltrimethyl
ammonium
(HDTMA-Zeolite)
91.5 100 mg/L
0.05 g/250 mL
5, 60 NA NA 114.9 (Dong et
al., 2010)
Chitosan
Laboratory
synthesized
chitosan
5.0 0.5 mg/L
0.06g/L
5,75 Langmuir Pseudo-second-order 27.02 (Dehghani
et al.,
2016)
Chitosan/fly-ash-
composite
NA 100 mg/L 7, 180 Langmuir Pseudo-second-order 31.92 (Suzuki et
al., 2010)
Carbon based adsorbents
Commercial
activated carbon
(F20)
996 60 mg/L,
10 mg/100 mL
7, NA NA Pseudo-second-order 317.67 (Liu et al.,
2009) Univers
ity of
Mala
ya

57
Table 2.8 (continued)
Commercial carbon
(W20) modified
thermal treatment
1760 60 mg/L,
10 mg/100 mL
7, NA NA Pseudo-second-order 430.33 (Liu et al.,
2009)
Commercial carbon
(F20) modified
with nitric acid
900 60 mg/L, 10 mg/
100 mL
7, NA NA Pseudo-second-order 115.37 (Liu et al.,
2009)
Commercial carbon
(F20) modified
thermal treatment
1000 60 mg/L,
10 mg/100 mL
7, NA NA Pseudo-second-order 223.48 (Liu et al.,
2009)
Mesoporous carbon
(soft - templated)
476 5-70 mg/L,
10 mg/ 100 mL
NA, 60 Freundlich Pseudo-second-order 156 (Libbrecht
et al.,
2015)
Graphene
Graphene
327 2-50 mg/L,
10 mg/100 mL
6, 300 Langmuir Pseudo-second-order 181.81 (Xu et al.,
2012)
Univers
ity of
Mala
ya

58
Table 2.8 (continued)
Graphene oxide
20.93 10-500 mg/L,
0.05 g/ 20 mL
3, 60 Langmuir Pseudo-
second-order
17.27 (Xu et al.,
2012)
Imprinted polymer
Molecularly
imprinted
polymer
NA 20 mg/L,
5mg/6 mL
NA Freundlich Pseudo-second -order 40.31 (Zhao, Fu,
& Zhang,
2016)
Bisphenol A
imprinted
microbeads
NA 10-150 mg/L,
10mg/10 mL
4, NA Freundlich Pseudo-second -order 82.4 (Bayramo
glu et al.,
2016)
Self-assembled
porous
microspheres-
fibers
193.27 50 mg/L 6,40 Langmuir Pseudo-second -order 327.84 (Cui et al.,
2016)
Non-imprinted
microbeads
NA 10-150 mg/L,
10 mg/ 10 mL
4, NA Freundlich Pseudo-second -order 62.9 (Bayramo
glu et al.,
2016)
Univers
ity of
Mala
ya

59
Table 2.8 (continued)
Composite materials
Self-assembled
porous
microspheres fibers
193.27 50 mg/L 6,40 Langmuir Pseudo-second-order 327.84 (Cui et al.,
2016)
Magnetic non-
template imprinted
polymers based on
kaolinite/Fe3O4
142.9 20-400 mg/L,
0.01 g/10.0 mL
7, 360 Langmuir Pseudo-second order 112.4 (Guo et
al., 2011)
Hydrophobic
magnetic
montmorillonite
NA 0-200mg/L,
50mg/50mL
7,5 Langmuir Pseudo-second-order 59.17 (Salehinia
et al.,
2016)
Agriculture waste
Activated carbon
from rice straw
agricultural waste
1, 304.8 7-55 mg/L,
10 mg/100 mL
2.35-11, 90 Langmuir Pseudo-second-order 181.81 (Chang et
al., 2012)
Palm shell based
activated carbon
143.15 NA,
10-100 mg/25 mL
7, 8 hr Langmuir Pseudo-second-order 62.5 (Soni &
Padmaja,
2014)
Activated carbon
derived from oil
palm empty fruit
bunch
86.62 20-100 mg/L,
1.0 g/L
2-9, 18 Langmuir Pseudo-second-order 41.98 (Wirasnita
et al.,
2014) Univ
ersity
of M
alaya

60
2.3.2 Organic dyes
Today, widespread applications and many processing units such as, textiles, cosmetics,
paper, printing and pharmaceutical discharge large amounts of wastewaters that contain
variety of synthetic dyes that imposes an objectional threat to the environment (Gupta et
al., 2013). Till date, more than 100,000 commercial dyes are known with an annual
production of >7 × 10⁵ tons /year (Shindy, 2017). The total dye consumption in textile
industry worldwide is more than 10,000 tons/year and approximately 100 tons/year of
dyes are discharged into waste streams. The textile industry plays a major role in the
economy of Asian and other countries. Wastewater effluents in the textile industry
contain several kinds of synthetic dyestuff that are esthetically and environmentally
unacceptable. Currently, several different types of dye are used in industries, including
basic, acid, direct, reactive and dispersive dyes. The intricate chemical structure of dyes
contributes in their resistance to light, oxidation, conventional biological and physical
oxidation treatments and boost their non-biodegradability nature (Subramani &
Thinakaran, 2017). The improper discharge of toxic dyes into open water cause prevalent
ecological risks by reducing the oxygen and sunlight penetration and consequently
affecting the photosynthesis activity in aquatic planktons. Methylene blue (basic blue 9)
is one of the most commonly used thiazine (cationic) dyes. It is known to be water-soluble
and its cationic features originating from the positively charged sulfur or nitrogen centers,
This group of dyes is considered as toxic colorants and can cause harmful effects,
therefore, the targeted removal of such compounds has attracted a growing amount of
attention (Ai, Zhang, & Chen, 2011).
2.3.2.1 Structure and physicochemical properties of methylene blue
Methylene blue (MB) is an important cationic dye and widely used for dyeing cotton,
wood and silk (Zare, Gupta, et al., 2015). It is water soluble, carries positive charge,
highly visible and produce colored cations in solution. MB is a heterocyclic aromatic
Univers
ity of
Mala
ya

61
chemical compound whose molecular formula is C16H18N3SCl. It is not inflammable and
is not an explosion hazard, the properties and structure of methylene blue are listed in
Table 2.9. One hydrated methylene blue molecule has three water molecules. At room
temperature it is solid, odorless, and dark green. Its choice in this work was guided by its
high solubility in water and its strong adsorption onto solids (Karima, Mossab, & A-
Hassen, 2010). It is intensely used as a model compound for removing organic
contaminants and colored bodies from aqueous solution. It is also used as an indicator in
oxidation-reduction reactions, a stain in bacteriology, also finds applications as antidotes
for cyanide poisonings, antiseptics for fire burns and used in the treatment of
methemoglobinemia at therapeutic doses. The excited slate of MB which is generated by
light can stimulate oxygen to yield oxidizing radicals which in turn can assist the cross-
linking of amino acid residues in proteins in biological systems (Gurr, 2012).
Dyes are commonly known as carcinogenic and mutagenic substances and has various
harmful effects on human health (Abdel-Shafy & Mansour, 2016). Acute exposure to
methylene blue may cause severe health problems to mankind including dysfunction of
brain, nervous system, kidney, liver and reproductive system (Gui et al., 2014). MB may
cause skin photosensitization on and gives a bluish color. On inhalation, it can give rise
to difficult breathing and inadvertent ingestion through the mouth produces a burning
sensation and may cause nausea, diarrhea, vomiting, and gastritis. Accidental large doses
produce severe headache, chest pain, profuse sweating, mental confusion. Consequently,
environmental concerns have focused on finding proper treatment techniques to control
this toxic dye in the industrial effluents prior to its discharge into receiving aquatic
matrices (Abou-Gamra & Ahmed, 2016).
Univers
ity of
Mala
ya

62
Table 2.9: Properties and structure of methylene blue.
Dye name Methylene Blue
IUPAC name
3,7–bis (Dimethylamino)-phenothiazin-5-ium chloride
Molecular formula
C16H18N3SCl
Molar mass
319.85 g/mol
Melting point
100-110 °C (with decomposition)
Boiling point
The lowest known value is 100°C (Decompose)
3D Conformer
2.3.2.2 MB removal techniques
The removal of dyes from waste effluent is considered an environmental challenge
because even a small quantity of dye in water can be toxic and highly visible, therefore,
there is an utmost need for versatile and effective process that can efficiently remove
these dyes to protect and preserve the natural water systems (Swati, 2017). Several
treatment methods have been reported for methylene blue removal such as biological
treatment (Gupta, Nayak, & Agarwal, 2015), advanced chemical oxidation (Gupta, Jain,
et al., 2012; Gupta et al., 2011; Saleh & Gupta, 2012), coagulation/ flocculation
(Moghaddam, Moghaddam, & Arami, 2010; Szyguła et al., 2009), electrochemical
treatment (Duman et al., 2016) and photodegradation (Gupta et al., 2011). Nevertheless,
these methods suffer from many restrictions. Table 2.10 shows the advantages and
disadvantages of different dye removal methods. Among all of these methods, adsorption
Univers
ity of
Mala
ya

63
is proved to be the most effective, simple and economic process due to its ability to purify
and capture the dye molecule without subsequent disturbing water quality or generating
toxic secondary pollutants (Seow & Lim, 2016).
Table 2.10: Advantages and disadvantages of dyes removal methods (Robinson
et al., 2001).
Methods Advantageous Disadvantageous
Chemical
treatments
Simplicity of application
Process (H2O2) agent
needs to activate by
some means
Oxidative
H2O2+Fe(II) salts
(Fentons reagent)
Fentons reagent is a suitable chemical
means
Sludge generation
Ozonation
Ozone can be applied in its gaseous
state and does not increase the
volume of wastewater and sludge
Short half-life (20 min)
Photochemical
No sludge is produced and foul odors
are greatly reduced
Formation of by-
products
Sodium
hypochlorite
(NaOCl)
Initiates and accelerates azo-bond
cleavage
Release of aromatic
amines
Electrochemical
destruction
No consumption of chemicals and no
sludge build up
Relatively high flow
rates cause a direct
decrease in dye
removal
Biological
treatments
White-rot fungi can degrade dyes
using enzymes
Enzyme production has
also been shown to be
unreliable
Decolorization by
white-rot fungi
Other microbial
cultures
(Mixed bacterial)
Decolorized in 24–30 h
Under aerobic
conditions azo dyes are
not readily metabolized
Adsorption by
living/dead
microbial biomass
Certain dyes have a particular affinity
for binding with microbial species
Not effective for all
dyes
Univers
ity of
Mala
ya

64
Table 2.10 (continued)
Anaerobic textile-
dye bioremediation
systems
Allows azo and other water- soluble
dyes to be decolorized
Anaerobic breakdown
yields methane and
hydrogen sulfide
Physical
treatments
Good removal of wide variety of dyes
Expensive
Adsorption by
activated carbon
Membrane
filtration
Removes all dye types
Concentrated sludge
production,
membrane fouling
Ion exchange
Regeneration
No adsorbent loss
Not effective for all
dyes
Irradiation
Effective oxidation at lab scale
Requires a lot of
dissolved O2
Electro kinetic
coagulation
Economically feasible
High sludge production
2.3.2.3 MB removal by miscellaneous adsorbents
Many studies have been reported for MB removal on different adsorbents from water
for example, fly ash (Keleşoğlu et al., 2012), chitin (Dotto et al., 2015) , low cost
adsorbents (Hameed, 2009; Rafatullah et al., 2010), lignin (Kushwaha, Gupta, &
Chattopadhyaya, 2014), barley straw (Oei et al., 2009), nanocomposites (Gupta & Nayak,
2012; Wang et al., 2011; Yao et al., 2012) sawdust (Garg et al., 2004), wheat bran
(Hamdaoui & Chiha, 2007), Kaolinite (Zhang, Ping, et al., 2013), zeolite (Li, Zhong, et
al., 2015), polymer (Ge et al., 2012), carbon fibers (Cherifi, Fatiha, & Salah, 2013),
carbon nanotubes graphene oxide (Bradder et al., 2010; Ramesha et al., 2011) and most
of all, activated carbon (Altıntıg et al., 2017a; Li, Du, et al., 2013; Yang & Qiu, 2010) .
Annadurai et al. (1996), used a natural biopolymer, chitin, to adsorb methylene blue. The
obtained results showed high adsorption efficiency which was increased by increasing
Univers
ity of
Mala
ya

65
the temperature, pH and adsorbent dose (Annadurai & Krishnan, 1996). In like manner,
McKay and co-workers explored the removal of two basic dyestuffs, methylene blue and
safranine from aqueous solutions by adsorption on low cost adsorbents such as hair,
cotton waste, teak wood bark, rice husk and coal. Their investigation reported the
monolayer saturation capacities for methylene blue were 914, 312, 277, 158 and 250 mg/g
for bark, rice husk, cotton waste, hair and coal, respectively (McKay, Porter, & Prasad,
1999).
Garg et al. (2004), investigated the potential use of Indian rosewood sawdust which
was pretreated with formaldehyde and sulfuric acid for the removal of methylene blue
from simulated wastewater. The group examined the effect of different system conditions,
including adsorbent dosage, initial dye concentration, pH and contact time. It was found
that the percentage of MB removal was increased by increasing the adsorbent amount.
The maximum MB was sequestered within 30 min at the optimum pH of 7.0. The group
demonstrated the adsorption of methylene blue on rosewood sawdust followed was well
fitted with a first order rate equation (Garg et al., 2004).
Gong et al. (2009), examined the adsorption efficiency of the magnetic multiwalled
carbon nanotube nanocomposite for cationic dyes; methylene blue (MB), neutral red
(NR) and brilliant cresyl blue (BCB), from aqueous solution. The results showed the
cationic dyes adsorption was increased with pH due to the electrostatic attractions. Their
study suggested that the kinetic data were well described by a pseudo second-order model
and the maximum adsorption capacity values of the magnetic nanocomposites for MB,
NR and BCB were 15.74 mg/g, 20.33 mg /g and 23.55 mg /g, respectively (Gong et al.,
2009). Table 2.11 displays the results of previous adsorption studies on the removal of
MB from water by different adsorbents.
Univers
ity of
Mala
ya

66
Table 2.11: Reported results of batch adsorption studies on the removal of MB from water by different adsorbents.
Type of adsorbent Adsorbate,
adsorbent
pH Contact
time (min)
Maximum
Adsorption
capacity
(mg/g)
Adsorption
Isotherm
Kinetic model Reference
Carbon nanotubes
MWCNT (untreated) 20mg/L,
20 mg
6 120 59.7 Langmuir,
Freundlich
Pseudo-second-order
(Wang et al., 2012)
MWCNTs (acid
washed)
5–40 mg/L,
15mg/50mL
7
90 64.7 Langmuir Pseudo-second-order
(Yao et al., 2010)
Oxidizes MWCNTs
(HNO3)
300 mg/L, NA 9 75 54.54 Langmuir NA (Rodriguez et al., 2010)
Fe3O4 – MWCNTs
(HNO3)
10–30 mg/L, 20
mg/50mL
7 120 48.06 Langmuir Pseudo-second-order
(Ai, Zhang, Liao, et al.,
2011)
MWCNTs/ γ-Fe2 O3 20 mg/L,
50mg/50mL
6 240 42.3 Freundlich NA (Qu et al., 2008)
Alkali-activated
MWCNTs
200-270 mg/L,
30 mg/ 40mL
7 180 399 Langmuir Pseudo-second-order
(Ma et al., 2012; Zare,
Gupta, et al., 2015)
MWCNTs 40–120 mg/L,
25mg/50mL
6 200 176.02 Langmuir Pseudo-second-order
(Li, Du, et al., 2013)
Univers
ity of
Mala
ya

67
Table 2.11 (continued)
Graphene
Gr (untreated) 60 mg/L,
0.02–0.17g/100
mL
10 250 153.85 Langmuir Pseudo-second-
order
(Liu, Li, et al., 2012)
GO (untreated) 188-1000
mg/L,1.5g/L
6 60 714 Freundlich NA (Yang et al., 2011)
r-GO 10–50 mg/L,
NA
10 60 17.3 Langmuir Pseudo-second-
order
(Ramesha et al., 2011)
Graphene-CNT
10-30 mg/L, 20
mg/50 mL
10 180 81.97 Freundlich Pseudo-second-
order
(Ai & Jiang, 2012b)
Carbon materials made from solid wastes and coal-based sorbents
Activated sludge
biomass
100mg/L,
10mg/90 mL
7 60 256.41 Freundlich-
Langmuir
Pseudo-second order
(Gulnaz et al., 2004)
Straw activated
carbon
600g/l,
2g/L
7.2 35 472.1 Langmuir Pseudo-second-
order, intraparticle
(Kannan & Sundaram,
2001)
Commercial AC 100 mg/L,
10 g/L
7 35 890.0 Langmuir Pseudo-first-order (Hameed, Din, &
Ahmad, 2007)
Univers
ity of
Mala
ya

68
Table 2.11 (continued)
Clay
Attapulgite-COOH 200 mg/L,
0.025 g/25 mL
5 60 208.33 Langmuir Pseudo-second-order (Zhang, Wang, &
Wang, 2015)
Modified Ball clay
(MBC)
100 mg/L,
0.2 g/250 mL
12 200 100 Redlich–
Peterson,
Freundlich
Pseudo-second-order (Auta & Hameed,
2012b)
Montmorillonite 600 mg/L,
0.1 g/50 mL
11 60 280 Langmuir Pseudo-second-order (Almeida et al., 2009)
Univers
ity of
Mala
ya

69
2.4 Mechanism of adsorption on CNMs
Understanding the molecular interactions, partitioning and sorption, properties
dominating the carbon nanomaterials is a joint effort between experimentalists and
theorists that have enhanced elucidating the sorption mechanisms and improved
optimization of sorbent properties. Adsorption is a surface phenomenon which involves
retaining atoms, molecules, or ions of a given substance in the available active sites of a
certain surface (Ghasemian & Palizban, 2016). It takes place because of the unbalance
interactions or forces. Thus, the porous adsorbent tends to accumulate a layer of adsorbate
to satisfy the residual surface forces. Adsorption of an adsorbate by adsorbents should be
described in two aspects: adsorption capacity and affinity. Adsorption capacity is
governed by the potential space of a sorbent available for adsorption of a given adsorbate,
while adsorption affinity is dependent on the strength of attractive forces between
adsorbate and adsorbent (Das et al., 2017; Yang & Xing, 2010). Molecules and atoms can
attach themselves onto the surfaces in two ways, via; physisorption and chemisorption.
In physisorption, there is a weak Van der Waal’s attraction of the adsorbate to the
surface (Thines et al., 2017). During the process of physisorption, no breakage of the
covalent structure of the adsorbate takes place, so the physisorbed molecule retains its
identity. However, in chemisorption, the interaction is much stronger than physisorption
and the adsorbate sticks to the solid by the formation of a chemical bond with the surface
(Gao et al., 2017). Different possible interactions including hydrophobic effect, π-π
bonds, π–π electron-donor-acceptor (EDA) interaction, hydrogen bonds, and
electrostatic interactions have been proposed and are responsible for the adsorption of
organic chemicals on CNMs surface. These interactions, their strengths, and contribution
to the overall sorption are dependent on the properties of both organic chemicals and the
Univers
ity of
Mala
ya

70
CNMs. In addition, properties of the compound of interest or reorganization after
adsorption, alteration of adsorbent structure has been reported (Zhang et al., 2016).
Among CNMs, CNTs are considered very strong adsorbents for hydrophobic organic
compounds. There are four possible sites (Figure 2.11) in CNT bundles for the adsorption
of different pollutants. 1) the curved outside surface of individual nanotubes bundles; 2)
grooves formed at the contact between adjacent tubes on the outside of the bundle; 3)
internal sites within an interior pore of an individual tube (accessible only if the caps are
removed and the open ends are unblocked); and 4) inside an interstitial channel formed
at the contact of three or more tubes in the bundle interior (Pignatello, Mitch, & Xu, 2017;
Sigmund et al., 2016). The access of molecules to the pores of the internal tube is either
through the open ends of CNTs, or the tube walls defects. A particular molecule can be
excluded alone for size considerations of some of these sites. A consensus is that the
close-ended CNTs adsorb the molecules on the grooves, on the outer surface sites, and
on large-diameter stacking-defect induced interstitial channels (ICs). For as-produced
CNTs, both ends are generally closed, thus the adsorption starts in the grooves between
adjacent tubes on the perimeter of the bundles and the largest accessible interstitial
channels which are easily accessed for both adsorption and rapid desorption (Zhao, Liu,
et al., 2016).
Because of the strong hydrophobic nature and high surface area of carbon nanotubes,
have significant affinity to organic chemicals, especially to nonpolar organic compounds,
such as naphthalene (Gotovac et al., 2007). CNTs have an exceptionally high aspect ratio
which is also important factor that provides a special confinement effect with specific
adsorption sites. This leads to completely different physical behavior compared with most
conventional sorbents. As a result, the sorption capacity is higher than would be predicted
based on surface area measurement (Wu et al., 2016).
Univers
ity of
Mala
ya
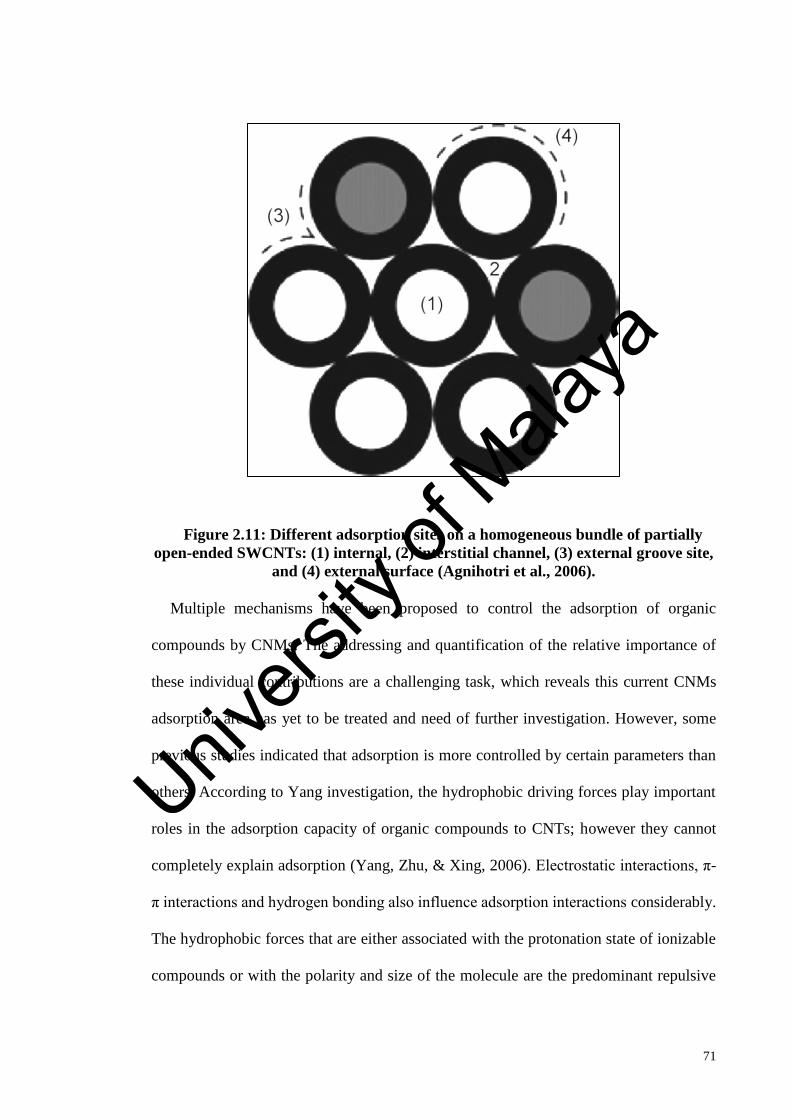
71
Figure 2.11: Different adsorption sites on a homogeneous bundle of partially
open-ended SWCNTs: (1) internal, (2) interstitial channel, (3) external groove site,
and (4) external surface (Agnihotri et al., 2006).
Multiple mechanisms have been proposed to control the adsorption of organic
compounds by CNMs. The addressing and quantification of the relative importance of
these individual contributions are a challenging task, which reveals this current CNMs
adsorption area has yet to be treated and need of further investigation. However, some
previous studies indicated that adsorption is more controlled by certain parameters than
others. According to Yang investigation, the hydrophobic driving forces play important
roles in the adsorption capacity of organic compounds to CNTs; however they cannot
completely explain adsorption (Yang, Zhu, & Xing, 2006). Electrostatic interactions, π-
π interactions and hydrogen bonding also influence adsorption interactions considerably.
The hydrophobic forces that are either associated with the protonation state of ionizable
compounds or with the polarity and size of the molecule are the predominant repulsive
Univers
ity of
Mala
ya
72
force that repels organic contaminants from water onto the CNMs surface. The molecular
size has direct impact on adsorption because the steric hindrances overcome the
hydrophobic affinity. Chen et al. (2007), finding confirmed that the molecular sieving
effect prevent bulky 1,2,4,5-tetrachlorobenzene molecules from accessing the innermost
surfaces (Chen, Duan, & Zhu, 2007). Pan et al. (2008), reported that the groove regions
of CNTs are easily wedged because of the rotating structure of bisphenol A unlike rigid
17a-ethinyl estradiol molecules (Pan & Xing, 2008).
Additionally, several of the studies indicated that the adsorption improvement of the
organic compounds to carbon nanotubes might be due to the important implication of the
electronic polarizability of the aromatic rings on the surface of carbon nanotubes (Zhao
et al., 2003). The graphitic surfaces of CNTs have regions with rich and poor π electrons,
the interaction of π electrons influence adsorption. Thus, the π electron-rich CNT surface
allows π- π interactions with organic molecules with benzene rings or C=C bonds, such
as polar aromatic compounds and poly-aromatic hydrocarbons (PAHs) (Ersan et al.,
2017a). Lin and Ren et al. (2011), stated that the non-aromatics have relatively lower
sorption affinity than aromatic compounds toward CNTs (Lin & Xing, 2008; Ren et al.,
2011). Furthermore, hydrogen bond with the graphitic surface of CNTs could also be
formed by organic compounds which have functional groups such as −COOH, −OH, and
−NH2. These groups can act as hydrogen-bonding donors and form hydrogen bonds with
graphite sheets of CNMs, where the benzene rings of graphite sheets of CNMs act as the
hydrogen-bonding acceptors (Tričković et al., 2016). However, the insignificant effects
of hydrogen-bonding interaction on adsorption of solutes without hydrogen-bonding
donor ability could be attributed to that the stronger hydrogen-bonding interaction
between functional groups of CNMs and water molecules than that would be with the
organic solutes, which results in the competitive sorption of water with organic solutes.
Univers
ity of
Mala
ya

73
Not to mention, the surface chemistry of CNTs is greatly influence their adsorption
behavior. It is worth to mention that the greater adsorption affinity of ionized species than
the unionized species was basically ascribed for the electrostatic attractions of opposite
charges between ionized compounds and CNT surfaces (Sotelo et al., 2012). The
electrostatic interaction is directly related to the nature of charge of both CNMs and
organic chemicals. Hence, electrostatic repulsion will occur between the dissociated
anions of the phenolic chemicals and the CNMs which can be negatively charged as pH
increased (Engel & Chefetz, 2016).
2.4.1 Mechanism of adsorption of Bisphenol A onto CNMs
Bisphenol A has a unique butterfly chemical structure and could wedge into the
heterogeneous surface sorption sites of CNMs. Thus, three types of adsorption sites are
available for adsorption on CNM; aggregates or bundles, groove area, and interstitial
pores (Ersan et al., 2017b). Zhao et al. (2002), reported that adsorption energy and charge
transfer of several small molecules in groove and interstitial sites of the bundles are much
higher than those on the surface area, because of the increased number of CNMs
interacting points with sorbate molecules (Zhao et al., 2002). The BPA molecule has two
benzene rings attached through a single bond to a carbon atom which facilitate its rotation
form various angles. BPA molecule could wedge into the groove region because of its
“butterfly” structure (BPA 3 in Figure 2.12). The two benzene rings in BPA molecule
could be adsorbed on CNT surface area parallel with the tube axis, around the
circumference, or in diagonal direction. If both benzene rings of BPA attach on CNTs in
the direction of tube axis, they must stay in a same flat plane (BPA 1). The flat
configuration; according to the calculation by Efremenko is unlikely the main mode of
adsorption (Efremenko & Sheintuch, 2006). However, BPA could be adsorbed with two
benzene rings around the circumference of CNTs (BPA 2 in Figure 2.12) depending on
Univers
ity of
Mala
ya

74
the tube diameter. But, for the CNTs with larger diameter, a higher steric energy must be
spent for the change of molecular conformation of BPA to provide a wider angle between
the two benzene rings of BPA. In this case, BPA would have only one benzene ring
adsorbed on CNMs as this conformational change is less favorable (Yang et al., 2008;
Yang & Xing, 2010).
The adsorption of chemicals containing benzene rings on CNMs has been shown to be
dominated by the π-π bond interaction force. The phenol group is a charge donor, and
CNMs could be either donor or acceptor. Thus, the π-π bond formed between BPA and
CNMs is a donor–acceptor system (Li, Jiang, et al., 2013). Kwon (2015), reported the use
of graphene as an adsorbent for the removal of BPA from aqueous solutions. Reduced
graphene oxide (rGO) was prepared via both a thermal exfoliation method (T-rGO) and
a chemical reduction method using hydrazine (H-rGO). The author demonstrated that T-
rGO exhibited at least 2.5 times larger adsorption selectivity toward BPA versus phenol
compared to H-rGO. The study proposed that T-rGO contains higher concentrations of
hydroxyl groups and other oxygen functional groups and both hydrogen bonds and π–π
interactions may be responsible for the selective adsorption of T-rGO toward BPA (Kwon
& Lee, 2015).
Bayramoglu et al. (2016), prepared BPA-imprinted polymer in the beaded form via
precipitation polymerization. The molecular imprinted (MIP) microbeads were used
under different experimental conditions for selective binding of BPA from aqueous
solutions. The MIP microbeads showed a maximum binding affinity for removal of BPA
at pH 4. The author reported that the adsorption of BPA on the MIP microbeads was
attributed to the π-π interaction between the phenyl groups of BPA and the phenyl group
in the polymer, in addition to the hydrogen-bonding between the hydroxyl groups of the
polymer chains and BPA molecules (Bayramoglu et al., 2016).
Univers
ity of
Mala
ya

75
Figure 2.12: Schematic diagrams for adsorption of BPA on SWCNT. The letters
I, II, III, and IV indicate the possible adsorption areas of surface, groove,
interstitial spaces, and inner pores, respectively. SWCNT is presented as an
example. BPA 1 is adsorbed on CNT with two benzene rings in the direction of
tube axis. BPA 2 show the adsorption on the surface, whereas BPA 3 illustrate the
wedging of this molecule in the groove area. The interstitial space is too small for
the molecules to fit (Pan et al., 2008).
Koduru et al. (2016), have been prepared goethite iron oxide particles impregnated
activated carbon composite (GPAC) to remove BPA in the presence of natural organic
matter (NOM). Their results indicated that the electro-chemical interaction between the
iron oxides along with the active sites of PAC and the molecular interactions between
NOM and BPA have enhanced BPA adsorption on GPAC (Koduru et al., 2016).
Li et al. (2015), investigated the adsorption of three organic chemicals including
bisphenol A (BPA), ciprofloxacin (CIP), and 2-chlorophenol (2-CP) on carbon nanofibers
(CNFs) was investigated. In this study it was assumed that the molecular size of the
pollutants, micro/mesoporous structure of CNFs, π electron and hydrophobic interaction
Univers
ity of
Mala
ya

76
play important roles on the high adsorption capacity exhibited by CNFs (Li, Chen, et al.,
2015).
2.4.2 Mechanism of adsorption of methylene blue onto CNMs
CNMs as adsorbents are suitable candidate for the pre-concentration and removal of
pollutants from large volumes of wastewater. The intensive results indicated that the main
adsorption mechanism of cationic and anionic dyes to CNMs is attributed to the π − π
electron donor acceptor interaction between the electron acceptors (aromatic molecules)
and the electron donors of carbon nanomaterials (the highly polarizable graphene sheets)
in addition to the strong surface complexation between ions and functional groups (Figure
2.13) (Liu et al., 2014; Manilo, Lebovka, & Barany, 2016).
Figure 2.13: Schematic illustration of the possible interaction between
MWCNTs and methylene blue: (a) electrostatic attraction and (b) π–π stacking
(Ai, Zhang, Liao, et al., 2011).
Univers
ity of
Mala
ya

77
The removal of MB from aqueous solution using MWNTs and CNF as adsorbents was
studied by Rodriguez et al. (2010). They reported that of the adsorption capacity CNF
was higher than for MWCNT and the untreated MWCNT exhibited high affinity for MB
than treated MWCNT-HCl. Their findings proposed that the high adsorption was
attributed to the very strong van der Waals forces and hydrophobic interactions between
the carbon nanomaterial and the dye. Furthermore, they demonstrated that the low affinity
of treated CNT was because of the existence of ionic repulsion between the MWCNT
modified and the dye, both with positive charges in water (Rodriguez et al., 2010).
Li et al. (2013), reported the adsorption performance of three acid treated
carbonaceous materials, activated carbon, graphene oxide, and multi-walled carbon
nanotubes for the removal of methylene blue dye from aqueous solution. They found that
the adsorption capacity follows an order of GO >CNTs > AC. They demonstrated that
the high removal of MB onto GO and CNTs might be attributed to π–π electron donor
acceptor interactions with graphene surfaces. MB has C-C double bonds and contains
electrons which can easily interact with the electrons of benzene rings on GO and CNT
surfaces through π–π electron coupling. Their study demonstrated the role of the
electrostatic attraction between the positively charged dye ions (MB+) and the negatively
charged adsorbents (Li, Du, et al., 2013).
In the study investigated by Ai et al.(2011), the FTIR analysis suggested the efficient
removal of MB from aqueous solution with the synthesized magnetite-loaded multi-
walled carbon nanotubes (M-MWCNTs) was mostly attributed to the electrostatic
attraction and π–π stacking interactions between MWCNTs and MB (Ai, Zhang, Liao, et
al., 2011).
The adsorption of methylene blue onto calcined titanate nanotubes (CTNTs) was
studied by Xiong et al. (2010). They reported that the adsorption mechanism was mainly
Univers
ity of
Mala
ya

78
associated with electrostatic attraction and the corresponding maximum adsorption
capacity was of 133.33 mg/g. They observed that in the whole pH range (2.5-11), the
surface of CTNTs possessed a dominant negative charge. Thus, cationic MB molecules
were easily adsorbed onto negatively charged sites of CTNTs by charge attraction (Xiong
et al., 2010).
Self-assembled cylindrical graphene–carbon nanotube (G–CNT) hybrid showed good
removal efficiency of 97% at the initial MB concentration of 10 mg/L with a maximum
adsorption capacity of 81.97 mg/g. The group demonstrated that the lower observed
performance for the removal of methylene blue (MB) at lower pH value could be ascribed
to the protons competition with the MB for the available adsorption sites on the G–CNT
hybrid surface. However, the study proposed that when the pH value increases to a certain
extent, the surface of the G–CNT hybrid may get negatively charged that would lead to
the increase in the adsorption capacity due to the electrostatic attraction between the
negatively charged G–CNT hybrid and the MB cation (Ai & Jiang, 2012b).
Alkali-activated multiwalled carbon (CNT-A) was utilized as an adsorbent material
for removal of cationic and anionic dyes in aqueous solutions. Experimental results
indicated that CNTs-A have excellent adsorption capacity for methylene blue (399 mg/g)
and methyl orange (149 mg/g). Their investigation proposed that the multiple adsorption
interaction mechanisms (π−π electron−donor−acceptor interactions, electrostatic
interactions, hydrogen bonding, mesopore filling) have to some extent their role in the
remarkable adsorption capacity of dye onto CNTs-A (Ma et al., 2012).
2.5 Summary of literature review
A detailed and updated overview was presented in this chapter covering the historical
background, structure, properties, production methods of carbon nanomaterials and their
potential use in wastewater treatment.
Univers
ity of
Mala
ya

79
Although a good number of researches have been conducted regarding fabrication
of CNMs, however some shortcomings lower their ability to remove certain compounds
and their successful recovery from the aqueous phase pose a significant challenge. So, it
would be our major focus to reduce the cost of isolation, and enhance the adsorbent
capacity through synthesizing new type of hybrid carbon nanomaterials on nickel powder
activated carbon substrate to end up with multi-structure carbon materials, optimize their
growth conditions, characterize their surface morphological features and carry out
subsequent adsorption studies for the removal of bisphenol A and methylene blue dye
from aqueous solution.
Univers
ity of
Mala
ya

80
CHAPTER 3: METHODOLOGY
3.1 Introduction
This chapter describes the method, approaches and empirical techniques applied to
accomplish the objective of the research. This chapter comprises from three sections. The
first section covers the list of chemicals and reagents along with physiochemical
properties of the organic pollutants; (BPA and MB), whereas the second section provides
the description of the structure and operational characteristics of instruments used
including the drawing of the experimental setup, and description of the characterization
systems are presented in section two also. The third section includes experimental
approach for synthesizing the adsorbent by using DOE, model development using
ANOVA analysis, optimization process, batch adsorption studies, kinetics and isotherm
investigations. In addition, the section describes the experimental uptakes of the
pollutants by batch sorption studies and analyzes the adsorption equilibrium process in
terms of kinetics and isotherm features of the adsorbent-adsorbate system. The last
section presents a schematic flow chart displaying the main experimental activities
conducted to implement the project.
3.2 Materials
The list of reagents and chemicals used to conduct in this research as well as their
corresponding suppliers, purity grade and applications are listed in the Table 3.1. Table
3.2 and Table 3.3 display the general properties of bisphenol A and methylene blue
respectively. The Material Safety Data Sheet (MSDS) of all materials used in this
research were considered and understood before starting the experimental activities.
Univers
ity of
Mala
ya

81
Table 3.1: List of reagents, chemicals and gases utilized in this research.
Material Supplier Purity
grade
Application
powder activated
carbon (PAC) – palm
shell based
Sigma Aldrich ≥ 98.0 % Used as growth
substrate
Ni (NO3)2·6H2O Sigma Aldrich ≥ 98.0 % Source of nickel
(Ni+2) ions catalyst
Bisphenol A (BPA) Merck ≥ 98.0 % Used as adsorbate
Methylene blue (MB) Sigma Aldrich ≥ 90.0 % Used as adsorbate
sodium hydroxide Sigma Aldrich 98-99 % Used to adjust pH
hydrochloric acid Sigma Aldrich 36.6-38 % Used to adjust pH
Sulfuric acid Sigma Aldrich 95-97 % Used to functionalize
CNMs
Potassium
permanganate
Sigma Aldrich Used to functionalize
CNMs
Methane AGS, Malaysia 99.99 % Used for production
CNMs
Acetylene AGS, Malaysia 99.99 % Used for production
of CNMs
Purified hydrogen AGS, Malaysia 99.99 % Used for reduction
and production of
CNMs
Purified nitrogen AGS, Malaysia 99.99 % Used for purging and
calcination
Table 3.2: General properties and chemical structure of bisphenol A.
Characteristics Values
Molecular formula C15H16O2
Molecular weight (g/mol) 228.29
Chemical class diphenylmethane derivatives
λ max nm 277
Space filling model
Chemical structure
Univers
ity of
Mala
ya
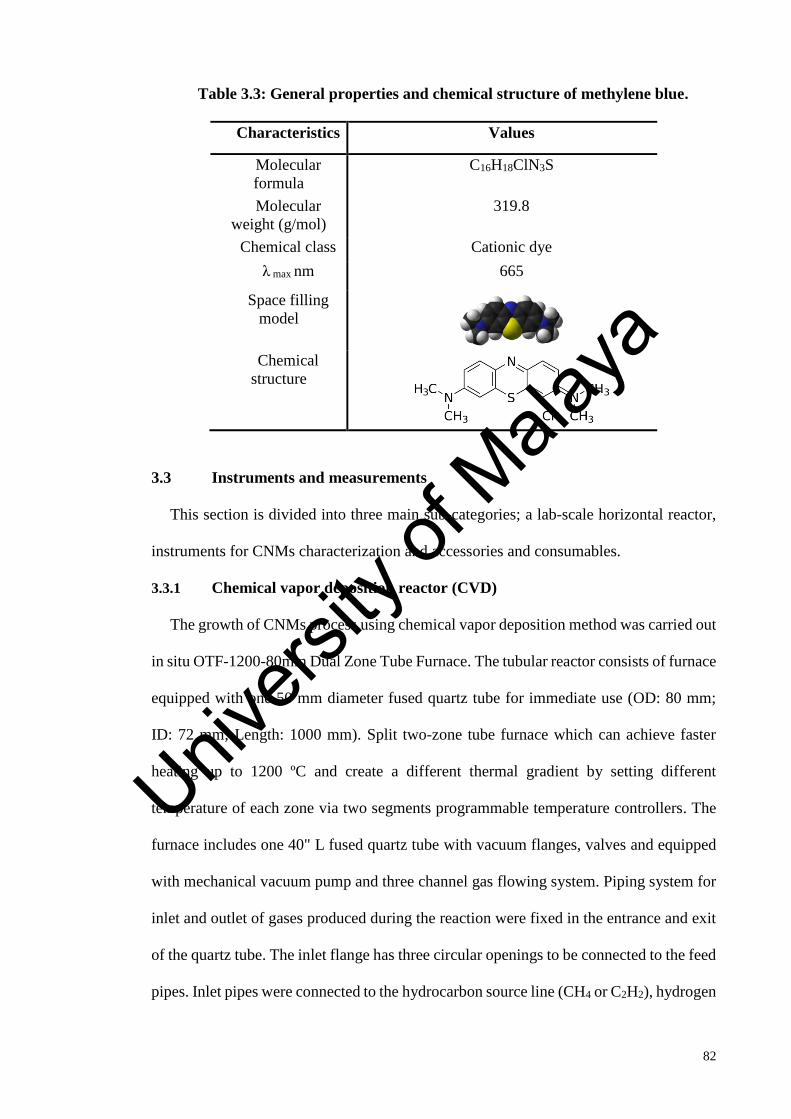
82
Table 3.3: General properties and chemical structure of methylene blue.
Characteristics Values
Molecular
formula
C16H18ClN3S
Molecular
weight (g/mol)
319.8
Chemical class Cationic dye
λ max nm 665
Space filling
model
Chemical
structure
3.3 Instruments and measurements
This section is divided into three main sub-categories; a lab-scale horizontal reactor,
instruments for CNMs characterization and accessories and consumables.
3.3.1 Chemical vapor deposition reactor (CVD)
The growth of CNMs process using chemical vapor deposition method was carried out
in situ OTF-1200-80mm Dual Zone Tube Furnace. The tubular reactor consists of furnace
equipped with one 50 mm diameter fused quartz tube for immediate use (OD: 80 mm;
ID: 72 mm; Length: 1000 mm). Split two-zone tube furnace which can achieve faster
heating up to 1200 ºC and create a different thermal gradient by setting different
temperature of each zone via two segments programmable temperature controllers. The
furnace includes one 40" L fused quartz tube with vacuum flanges, valves and equipped
with mechanical vacuum pump and three channel gas flowing system. Piping system for
inlet and outlet of gases produced during the reaction were fixed in the entrance and exit
of the quartz tube. The inlet flange has three circular openings to be connected to the feed
pipes. Inlet pipes were connected to the hydrocarbon source line (CH4 or C2H2), hydrogen
Univers
ity of
Mala
ya

83
(H2) and the inert gas (N2). The outlet flange has one opening to be connected to the flue
gasses. Table 3.4 and Figure 3.1 illustrate the CVD system utilized in this research and
its technical specification, respectively.
Table 3.4: Technical specifications of CVD utilized in this research.
Item
Parameter
Power
4KW
Voltage AC 220-240V Single Phase, 50/60 Hz
Max. Temperature 1200 ºC
Max. Heating Rate ≤ 20 ºC /min
Suggested Normal Heating Rate ≤10 ºC /min
Tube Size and Materials
OD: 80 mm; ID: 72mm; Length: 1000
mm, 4"(100 mm) Quartz tube
Heating Zone Length Each Zone Length:6" (150mm)
Temperature Controllers
PID automatic control via SCR (Silicon
Controlled Rectifier) power control, 30
steps programmable
Temperature Accuracy
±1 ºC
Heating Elements Fe-Cr-Al Alloy doped by Mo
Weight 40 Kg
Univers
ity of
Mala
ya

84
Figure 3.1: Photograph of the in-situ CVD reactor.
Heating
element
Furnace with
80 mm quartz
tube and
sealing flange
Gas mixing
system
Mechanical
Pump for
vacuuming
Gas
measuring
meter
Univers
ity of
Mala
ya

85
3.3.2 Instruments and equipment for characterization
Field-emission scanning electron microscope (FE-SEM) equipped with an energy-
dispersive X-ray spectrometer (EDX) (Quanta FEG 450, EDX-OXFORD) was used to
obtain high resolution images of the nano-sized structure to study the CNM-PAC
morphology and the surface elements. Other morphological features were observed using
a transmission electron microscope (TEM). Thermogravimetric analysis (TGA) was
obtained using Thermal Analyzer (STA-6000, PerkinElmer®) in an oxygen environment
and heating rate of 10 °C/min. Surface area analysis was performed using Gas Sorption
System (micromeritics ASAP2020, TRISTAR II 3020, USA) following Brunauer-
Emmett-Teller (BET) method. The prepared CNM-PAC was also characterized by
Raman spectroscopy (Renishaw System 2000 Raman Spectrometer). The CNM-PAC
surface chemistry before and after organic pollutant adsorption was investigated using
Fourier transform infrared (FTIR) spectroscopy (PerkinElmer® FTIR spectrometer), by
grinding the sample with KBr to form pellets and the wavenumbers range was 500–4000
cm−1. UV-Visible absorption spectroscopy (PerkinElmer® spectrophotometer) was used
in adsorption experiments and water analysis. The prepared samples were conducted for
zeta potential using a Zetasizer (Malvern, UK). Water suspensions were prepared at a
concentration of 0.01g/100 ml and left for 1 h sonication before the measurement. All pH
measurements were carried out using pH/Ion Benchtop meter (Mettler Toledo Seven
Compact).
3.3.3 Additional instruments
1- Vacuum oven (Memmert VO500)
2- Digital balance (Mettler Toledo AG204)
3- Ultrasonic bath (JAC, Korea, model JAC 2010P)
4- Orbital laboratory shaker
Univers
ity of
Mala
ya

86
5- Table – Top low speed Centrifuge (CNC-104 L550, China)
6- Vacuum pump station (model DAA-P601-LD, Germany)
7- Membrane 0.45 μm (Sartorius stedim biotech GmbH 37070, Germany)
3.4 Methods
The experimental steps followed to carry out the objectives of this study are
demonstrated in Figure 3.2.
Figure 3.2: The experimental activities of this research.
3.4.1 Experimental Approach for carbon nanomaterials synthesis
3.4.1.1 Catalyst and support preparation
PAC (2 g) was dried overnight at 120 °C and mixed with Ni (NO3)2·6H2O (5 mL; 1
wt %) and acetone. The mixture was sonicated for 1 h at 60 °C/40 kHz. Ni-doped PAC
(Ni-PAC) dispersion was dried at 100 °C and then grounded thoroughly. For the
Univers
ity of
Mala
ya

87
preparation of metal catalyst nanoparticles, a two-stage thermal treatment was performed:
calcination at 350 °C for 2 h followed by temperature programmed reduction (TPR) with
H2 gas at 600 °C for 1 h in N2 atmosphere (200 mL/min) within the CVD tubular furnace.
The final impregnated substrate (Ni-PAC) was then used for CNM-PAC production
(Onundi et al., 2011).
3.4.1.2 Growth of carbon nanomaterials on powdered activated
carbon
In total, 200 mg of the thermally treated Ni-PAC was placed in a ceramic alumina
boats and shuffled into the CVD reaction tube in the tubular quartz reactor. The
temperature programmed deposition (TPD) was set at 750 °C–1000 °C with ramping rate
of 10° C/min. To initiate the growth, we allowed a flow of H2 was mixed with CH4 at a
ratio of ranging from 1 to 4 to pass through a heated reactor from 20–60 min. After the
CNMs grew, the reactor was cooled down by using N2 flow (200 mL/min), and the
deposited CNMs were then collected from a ceramic boat. Thus, the overall CNMs
growth via CVD could proceed through carbonaceous precursors feedstock
decomposition on a Ni–PAC surface to generate small carbon fragments which were
subsequently diffused on the Ni catalysts surface to grow a graphitic tubular structure
around the particles. Finally, CNM-PAC growth was terminated when the catalytic
activity of Ni particles stopped. The deposited carbon nanomaterials produced in the
reactor were collected from the ceramic boat and the growth yield was calculated using
Equation (3.1):
𝑌𝑖𝑒𝑙𝑑 % = 𝑚𝑎𝑓𝑡𝑒𝑟
𝑐𝑎𝑡𝑎𝑙 − 𝑚𝑏𝑙𝑎𝑛𝑘𝑐𝑎𝑡𝑎𝑙
𝑚 𝑏𝑙𝑎𝑛𝑘 𝑐𝑎𝑡𝑎𝑙 × 100 (3.1)
where 𝑚𝑎𝑓𝑡𝑒𝑟𝑐𝑎𝑡𝑎𝑙 is the total mass of the product after reaction, and 𝑚𝑏𝑙𝑎𝑛𝑘
𝑐𝑎𝑡𝑎𝑙 is the weight
of the PAC substrate treated similarly as in growth reaction conditions but without
Univers
ity of
Mala
ya

88
introduced any type of carbon sources. This experiment was necessary to determine the
loss of weight in catalyst-substrate hybrid prior to CNM growth.
3.4.1.3 Optimization of operating conditions for CNM-PAC growth
The adsorption capacity of an adsorbent is the most significant property which is
highly contingent by the working variables. For preparing an efficient adsorbent, the
removal efficiency is a major concern along with its yield for economic feasibility of the
whole process. Accordingly, the growth parameters of CNM on powdered activated
carbon (CNM-PAC) were optimized to obtain active surface with maximum removal
percentage. Nevertheless, for evaluating the effect of process variables on the quality of
the final-product, an acceptable experimental design is imperative (Angulakshmi,
Sivakumar, & Karthikeyan, 2012). Several researchers have used response surface
methodology (RSM) which is a compilation of statistical techniques for reduced number
of experimental runs to assess the impact and the interactions of multiple parameters and
developing regression models. RSM comprises three stages; process experimental design
outline at different operating condition, response surface analyses using the obtained
regression model and process optimization. The central composite design (CCD) is well
appropriate in the case of standard RSM technique which is commonly used for process
optimization (Ronix et al., 2017).
3.4.2 Design of experiment (DOE) for synthesis CNM-PAC
A design of experiment (DOE) with a central composite design (CCD) was utilized
to optimize the synthesis parameters including growth temperature (A), growth time (B)
and hydrogen to hydrocarbon source flow rate ratio (H2/CH4) or (H2/C2H2) (C). Full
factorial CCD for the three numerical variables, consisting of 8 factorial points (coded
as -1 and +1), 6 axial α points (coded as -1.682 and +1.682) and 6 replicates at the
Univers
ity of
Mala
ya

89
center points (coded as 0,0) were employed. In this study the optimum conditions for
CNM-PAC growth was determined by setting the percentage of growth yield (Y) and
pollutant removal efficiency (RV %) as responding model. Production conditions was
varied according the data generated by DOE in order to obtain the optimum growth
conditions to produce the maximum yield of CNM-PAC associated with the highest
removal efficiency of the investigated pollutant. Each response was employed to
generate an empirical model that correlates the responses to the growth parameters
using the proposed regression model represented by Equations (3.2) and (3.3) (Tan,
Ahmad, & Hameed, 2008):
𝒙𝒊 = 𝑋𝑖 − 𝑋𝑖
𝑥
∆𝑋𝑖 (3.2)
Where xi is the coded value of the ith independent variable, Xi is the natural value of
the ith independent variable, Xix denotes the natural value of the ith independent variable at
the center point, and Δ Xi is the value of step change.
𝒀 = 𝑏° + ∑ 𝑏𝑖𝑥𝑖 + (∑ 𝑏𝑖𝑖𝑥𝑖
𝑛
𝑖=1
)2
𝑛
𝑖
+ ∑ ∑ 𝑏𝑖𝑗𝑥𝑖
𝑛
𝑗=𝑖+1
𝑛−1
𝑖=1
𝑥𝑗 (3.3)
where Y is the predicted response, bo the constant coefficient, bi the linear coefficients,
bij the interaction coefficients, bii the quadratic coefficients and xi, xj are the coded values
of the CNM-PAC synthesis variables. Table 3.5 and Table 3.6, present the coded and
actual levels of process parameters for CH4 and C2H2 decomposition, respectively. Also,
Table 3.7 and Table 3.8 shows the complete design matrix of the required experiments
for CH4 and C2H2, respectively.
Univers
ity of
Mala
ya

90
Table 3.5: Independent variables and their coded and actual levels in the CCD
for CNM-PAC synthesis from CH4 decomposition.
Variable name Factor Range
Low (-1) High (+1)
Temperature, ºC A 750 1000
Growth Time, min B 20 60
H2/CH4 flow rate C 1 4
Table 3.6: Independent variables and their coded and actual levels in the CCD
for CNM-PAC synthesis from C2H2 decomposition.
Variable name Factor Range
Low (-1) High (+1)
Temperature, ºC A 550 750
Growth Time, min B 20 60
H2/C2H2 flow rate C 1 4
Table 3.7: Experimental CCD data for the synthesis parameters of CNM-PAC
using CH4 decomposition.
Run
Variables
A
Temperature, ºC
B
Time, min
C
Gas Ratio
1 850 40 2.5
2 950 20 4.0
3 750 60 4.0
4 850 20 2.5
5 1000 20 1.0
6 750 20 4.0
7 750 60 1.0
8 950 60 4.0
9 750 40 2.5
10 950 20 1.0
11 850 40 4.0
12 950 60 1.0
13 850 60 2.5
14 750 20 1.0
Univers
ity of
Mala
ya

91
Table 3.8: Experimental CCD data for the synthesis parameters of CNM-PAC
using C2H2 decomposition.
Run
Variables
A
Temperature, ºC
B
Time, min
C
Gas Ratio
1 650 40 2.5
2 550 20 1.0
3 550 60 4.0
4 750 60 1.0
5 650 20 1.0
6 550 20 4.0
7 750 20 4.0
8 750 20 1.0
9 650 60 1.0
10 750 60 4.0
11 550 60 1.0
3.4.3 Functionalization of CNM-PAC for comparison
The synthesized CNM-PAC at the optimal growth conditions (O-CNTs) was dried
overnight at 100 °C to eliminate any water on carbon surface. A 1M solution of KMnO4
was prepared at 70 °C for ease of solvation. CNM-PAC was oxidized by the following
procedures: (1) 200 mg of CNM-PAC was mixed with 7 ml of the previous permanganate
solution inside a 20-ml glass vial; (2) the mixture was subjected to ultrasound waves using
an ultrasonic bath at 70 °C for 3 h; (3) CNM-PAC was collected by a filtration process
under vacuum using filter paper with a pore size of 0.45 μm; (4) the CNM-PAC was
washed several times with 0.01M HCl and distilled water until a clear, transparent and
neutral product was obtained; and (5) the collected cake was dried for 3 h at 100 °C and
dubbed K-CNTs.
In a procedure similar to the previous chemical treatment of the CNM-PAC, in a 20-
mL glass vial, 7 mL of the prepared KMnO4 solution was mixed with 200 mg of CNM-
PAC and 3 mL of 0.5 M H2SO4. The vial was sealed and subjected to ultrasound waves
in ultrasonic water bath at 70 °C for 3h. After that, the suspension was filtered under
Univers
ity of
Mala
ya

92
vacuum using 0.45 μm pore size filter paper. The collected CNM-PAC was then washed
several times with distilled water and 0.01 M HCl to eliminate oxidant traces until neutral
solution of pH = 7 was obtained. The oxidized CNM-PAC was put in closed crucible and
dried at 100 °C for 3 h and referred as KS-CNTs.
3.4.4 Adsorption studies
Batch adsorption tests were carried out to investigate the adsorption affinity of CNM-
PAC for removal of bisphenol A (BPA) and methylene blue (MB) from water. The
adsorption processes for each pollutant subjected to three studies: batch experiments,
optimization, kinetic and isotherm. The concentration of BPA and MB were determined
using a UV-visible spectrophotometer at 277 and 665 nm, respectively.
3.4.4.1 Batch adsorption experiments
Adsorption studies were undertaken using Erlenmeyer flasks (250 ml) with glass
stoppers. The freshly prepared stock solutions of adsorbate (BPA and MB) were prepared
by dissolving requisite amount of the adsorbate in a 1000 ml volumetric flask followed
by addition of deionized water to the mark. Batch adsorption experiments were conducted
on the CNM-PAC produced from the DOE growth experimental runs. A fixed dosage of
each adsorbent (10 mg) into 50 mL of the pollutant (50 mg/L) at pH = 6.0 was shaken for
120 min at a constant agitation speed (180 rpm) at room temperature. A known volume
of the solution was at the end of the adsorption time removed and centrifuged at 4000
rpm for 10 min. The sorbate concentration in the supernatant was measured by UV−vis
spectrophotometer by monitoring the maximum absorbance wavelength and the removal
efficiency percentage of was determined according to Equation (3.4), accordingly. The
obtained CNM-PAC was fully characterized and optimization study was conducted to
optimize the adsorption parameters of organic pollutant removal using the synthesized
Univers
ity of
Mala
ya

93
CNMs-PAC at the selected optimum conditions of growth. The percent removal of
adsorbate was calculated as follows:
𝑹𝒆𝒎𝒐𝒗𝒂𝒍 (%) = (𝐶𝑜 − 𝐶𝑡)
𝐶𝑜× 100 (3.4)
whereas the amount of adsorbate adsorbed at equilibrium contact time, qe (mg/g) was
calculated according to Equation 3.5:
𝒒𝒆 = (𝐶𝑜− 𝐶𝑒) 𝑉
𝑊 (3.5)
where, Co, Ct and Ce (mg/L) are the liquid-phase concentrations of adsorbate at initial
concentration, at time t (min) and equilibrium time respectively, V is the volume of the
solution (L) and w is the mass of adsorbent used (g).
3.4.4.2 Optimization of adsorption conditions
Experimental design methodology (DOE, version 7.0) was adopted in the optimization
of pollutant removal by the synthesized CNM-PAC. The removal efficiency was
mathematically described as the function of adsorption parameters and were modeled
using RSM-CCD). The optimum conditions for BPA and MB adsorption by setting a
range of the adsorption parameters including, pH (2-11), dose (5-20 mg) and contact time
(10-120 min). The removal efficiency (RV, %) and adsorption capacity (mg/g) were set
as model responding. The investigated parameters were denoted as X1 for the pH, X2 for
the dosage (mg), and X3 for contact time (min). List of design of the experimental runs
for BPA and MB adsorption is presented in Table 3.9 and Table 3.10, respectively.
Univers
ity of
Mala
ya

94
Table 3.9: List of design of experiments runs for BPA adsorption using CNM-
PAC obtained from CH4 decomposition.
Run
Variables
X1
pH
X2
Adsorbent dose, (mg)
X3
Contact time, (min)
1 2 20.0 10
2 3 5.0 120
3 7 10.0 65
4 11 20.0 120
5 7 12.5 20
6 7 10.0 40
7 2 20.0 120
8 3 5.0 10
9 11 5.0 120
10 6 12.5 40
11 7 12.5 40
12 5 15.0 65
13 7 15.0 20
14 11 20.0 10
15 10 15.0 20
Table 3.10: List of design of experiments runs for MB adsorption using CNM-
PAC obtained from CH4 decomposition.
Run
Variables
X1
pH
X2
Adsorbent dose, (mg)
X3
Contact time, (min)
1 6 10 70
2 7 10 120
3 7 10 40
4 2 5 10
5 11 15 20
6 6 15 70
7 3 20 40
8 11 15 120
9 3 15 120
10 7 10 70
11 11 5 120
12 3 5 120
13 7 15 70
14 3 10 70
15 11 5 20
Univers
ity of
Mala
ya

95
3.4.4.3 Kinetic studies
The removal of adsorbates from aqueous media by the adsorbent is a time
dependent process. However, the properties of the adsorption process will totally
depend on physiochemical features of the adsorbate, adsorbent and the operating
variables. The assessment of kinetics parameters was similar to that of batch
equilibrium experiments. The kinetics experiments were conducted at the optimum
conditions determined by DOE. The initial BPA and MB concentration was 50 mg/L.
The applicability of the studied kinetic models was examined at contact time of (5, 10,
20, 25, 30, 40, 50, 60, 70, 80, 100, 110, 120, 130, 140, 150, 160, 170 min, and 24 h).
The rate of sorption was determined by employing three kinetic models on the
experimental data, pseudo first order, pseudo second order and intraparticle diffusion.
(a) Pseudo first order
This model is defined as Lagergren and Svenska, (Lagergren, 1898) has been widely
used to predict sorption rate which is primarily based on the adsorption capacity (q)
(Lagergren, 1898). The linearized form of Lagergren equation can be described as follow:
𝒍𝒏(𝒒𝐞 − 𝒒𝒕) = l𝑛𝑞𝑒 − 𝑘1𝑡 (3.6)
where qe and qt (mg/g) are the amounts of adsorbate adsorbed at equilibrium and at
time t (min) respectively, and 𝑘1 (L/min.) is the adsorption rate constant. The plot of ln
(qe - qt) versus t (Figure 3.3) gives the slope of 𝑘1, and intercept of lnqe. This equation is
commonly does not fit well with all range of contact time, but it is generally relevant for
the initial stage of the adsorption sorption process (Wong et al., 2004). Univ
ersity
of M
alaya

96
Figure 3.3: First-order kinetic model illustration.
(b) Pseudo second order
The pseudo second order equation which was developed by Ho and McKay (1999),
predicts the sorption performance over the whole range of the adsorption system. This
model provides the best correlation of the obtained data and assumes that the chemical
adsorption mechanism can be considered as the rate controlling step (Ho & McKay,
1999). The chemical adsorption commonly involves valence forces through sharing or
exchange of electrons between adsorbent and adsorbate (Taty-Costodes et al., 2003). The
linearized form is presented as follows:
𝒕
𝒒𝒕=
1
𝑘2 𝑞𝑒2
+ 𝑡
𝑞𝑒 (3.7)
where, qe (mg/g) and 𝑘2 (g/mg min) are the amount of adsorbate adsorbed at
equilibrium and the rate constant of second order adsorption, respectively. The
constants of the model can be evaluated from the linear plot of t/q,t versus t (Figure
3.4), where values of 𝑘2 and qe were determined from the slope and the intercept of the
plot, respectively.
Univers
ity of
Mala
ya

97
Figure 3.4: Second-order kinetic model illustration.
(c) Intraparticle diffusion
intraparticle diffusion model (ID) is defined as Weber and Morris equation (1962),
which suggests that the adsorbate uptake is almost proportionally varying with the
square root of time as presented in Equation (3.8) (Weber & Morris, 1963):
𝒒𝒕 = 𝐾𝑑𝑡0.5 + 𝐶 (3.8)
where, qt (mg/g) is the amount of pollutant adsorbed at time t, Kd (mg/g. min0.5) is
the intraparticle diffusion rate constant and C represents the initial value of qt at t = 0
and it give an estimation for the effect of the of boundary layer thickness. The values of
𝐾𝑑 and C can be determined from the slope and intercept of the plot of qt against t0.5
(Figure 3.5). Intraparticle diffusion model is commonly used for most of the sorption
processes to test the role of diffusion as the rate controlling step. Thus, the intraparticle
diffusion is considered as the unique rate controlling step if the linear plot of qt versus
t0.5 passes through the origin, otherwise, the sorption process governed by other
mechanism such as film diffusion along with intraparticle diffusion (Abdel-Ghani,
Rawash, & El-Chaghaby, 2016).
Univers
ity of
Mala
ya

98
Figure 3.5: Intraparticle diffusion kinetic model.
3.4.4.4 Adsorption isotherms
Adsorption isotherms describe the equilibrium relationships between the amount of
solute adsorbed sorbent and the residual portion left in the solution at constant
temperature. To designate the adsorption process, the experimental data was fitted with
different isotherm models (e.g. Langmuir, Frenudlich and Temkin). The varied porous
structures of the adsorbent and the unlike sorbate-sorbent interactions produce different
shapes of the adsorption isotherms. Under predefined and optimized adsorption
conditions, the adsorption isotherms parameters were evaluated to estimate the suitability
of our adsorbent for the adsorption of BPA and MB. Thus, various initial concentration
of the pollutants prepared (5, 10, 20, 30, 40, 50, 60, 70, 80, and 90 mg/L) to determine
the equilibrium concentration at the equilibrium conditions. The correlation coefficient
(R2) was evaluated to demonstrate the best isotherm mode to designate the adsorption
process.
Univers
ity of
Mala
ya

99
(a) Langmuir
Known as the ideal localized monolayer model which was established essentially for
adsorption of gases onto solid adsorbent (Langmuir, 1918). The underlying assumptions
of this isotherm are:
1- Adsorption is taking place on certain sites of the sorbate.
2- One molecule only or ion of the sorbate can be adsorbed by each site.
3- All sorption sites have the same sorption energy.
The linearized form of Langmuir model is given by Equation 3.9:
𝑪𝒆
𝒒𝒆=
1
𝑞𝑚 𝐶𝑒 +
1
𝐾𝐿 𝑞𝑚 (3.9)
where Ce (mg/L) is the adsorbate equilibrium concentration, qe (mg/g) is the amount
of adsorbate adsorbed per unit mass of adsorbent. KL (L/mg) and qm, (mg/g) are Langmuir
constant related to rate of adsorption and maximum adsorption capacity, respectively.
The values of KL and qm can be calculated by plotting Ce/qe versus Ce (Figure 3.6).
Figure 3.6: Langmuir isotherm model.
The separation factor which is the essential characteristic of the Langmuir isotherm is
defined by Weber (1974) (Weber & Chakravorti, 1974) as:
Univers
ity of
Mala
ya

100
𝑹𝑳 = 1
1 + 𝐾𝐿 𝐶𝑖 (3.10)
where, KL (L/mg) is the Langmuir constant and Ci is the adsorbate initial concentration
(mg/L). The parameter RL which indicates the nature of the adsorption process:
unfavorable (RL > 1), linear (RL = 1), favorable (0< RL < 1) or irreversible (RL = 0) (Crini,
2008).
(b) Freundlich
Freundlich isotherm describes adsorption process which occurs onto heterogeneous
adsorbent surface encompasses sites of wide-ranging affinities. It is implied that after
the sorbate engaged to the stronger binding sites, the binding site force decreases with
the cumulative degree of the site occupation. Unlike Langmuir isotherm, this model
describes reversible adsorption system and not limited to the formation of monolayer
(Freundlich, 1906; Nazal et al., 2016). The linearized form of Freundlich isotherm is
given by Equation (3.11):
ln 𝒒𝒆 = ln 𝐾𝑓 + 1
𝑛ln 𝐶𝑒 (3.11)
Where, the amount of adsorbate adsorbed onto adsorbent for a unit equilibrium
concentration is presented by the distribution coefficient, Kf (L/mg) and 1/n gives an
indication of the heterogeneity of the adsorbent surface and its adsorption intensity,
thus, as the heterogeneity increases as the value of 1/n gets closer to zero (Foo &
Hameed, 2010). The plot of ln qe versus log Ce displayed in Figure 3.7 gives a straight
line with slope of 1/n and intercept of ln Kf.
Univers
ity of
Mala
ya

101
(c) Temkin
Temkin isotherm assumes that the linear decrease in the heat of adsorption of all
adsorbate molecules in the layer is mainly attributed to the adsorbent-adsorbate
interaction and the adsorption is described by atypical distribution of binding energies
(Temkin & Pyzhev, 1940). The Temkin model has generally expressed as the linearized
form in Equation (3.12):
𝒒𝒆 = 𝐵1𝑙𝑛𝐾𝑇 + 𝐵1 𝑙𝑛 𝐶𝑒 (3.12)
A linear line of qe versus Ce (Figure 3.8) yields the Temkin isotherm constants; B1 as
the slope and B1 (ln KT) as the intercept. Where, B1 = RT/b, R is the gas constant (8.314
J/mol K), K the absolute room temperature in kelvin, b represents the heat of adsorption
(J/mol) and KT is the Temkin binding constant (L/g).
Figure 3.7: Freundlich isotherm model.
Univers
ity of
Mala
ya

102
Figure 3.8: Temkin isotherm model.
3.4.4.5 Screening and optimization of functionalized CNM-PAC
Initial adsorption screening was conducted to compare the removal efficiency of all
produced adsorbents (O-CNTs, K-CNTs, and KS-CNTs). A fixed dosage of each
adsorbent (10 mg) was shaken for 30 min at room temperature into 50 ml of a MB stock
solution of 50 mg/L at a constant agitation speed of 180 rpm. The screening study was
carried out at pH 3 and pH11. The adsorbent with the highest removal percentage was
chosen for further optimization studies of MB removal from aqueous solution.
The adsorption batch experiments were performed to investigate the performance of
the adsorbent proposed by the screening study using CCD-RSM to optimize the
conditions of MB removal. For adsorption optimization study, the investigated
parameters were denoted as X1 for the pH (3-11), X2 for the adsorbent dosage (5-20 mg)
and X3 for the contact time (10-140 min). The initial concentration and agitation speed
were fixed to 50 mg/ L and 180 rpm, respectively. The optimum conditions for MB
adsorption was determined by two responding parameters; the removal percentage (RV
%) and the adsorption capacity (Q mg/g). The proposed design experiments for MB
KT
Univers
ity of
Mala
ya

103
removal for the selected adsorbent are listed in Table 3.11. The adsorption kinetics and
isotherms were conducted by employing the optimum conditions resulted from the DOE.
Table 3.11: List of design of experiments runs for MB adsorption.
Run
Variables
X1
pH
X2
Adsorbent dose, (mg)
X3
Contact time, (min)
1 7 15 140
2 8 20 90
3 11 15 10
4 9 20 90
5 11 20 140
6 5 15 90
7 10 20 60
8 8 15 40
9 11 10 20
10 10 20 60
11 11 10 60
12 11 20 135
13 11 20 60
14 3 5 140
3.4.5 Characterization
Based on the optimization study, the selected samples were characterized to identify
their morphology, surface area, surface charge and surface functional groups. FESEM
was used to observe the morphology of the concerned adsorbents. High resolution TEM
was utilized to obtain valuable information about the nanomaterials structure, presence
of amorphous material, defects and quality. The surface area for the examined samples
were determined based on BET using the fully Automated Gaz Sorption System. Raman
shift was obtained for the optimal synthesized CNM-PAC samples and their thermal
stability was analyzed using thermogravimetric analysis (TGA). FTIR was used to study
the functional group of the as prepared CNM-PAC before and after adsorption process.
Univers
ity of
Mala
ya

104
zeta potential was evaluated by using Zetasizer to determine the surface charge of the
examined samples.
3.4.6 General research plan flow chart
The overall experimental activities carried out in this study are illustrated by following
flow chart represented by Figure 3.9.
Figure 3.9: Schematic diagram of the methodology adopted.
Univers
ity of
Mala
ya
105
CHAPTER 4: SYNTHESIZING AND ADSORPTION STUDIES FOR CNM-PAC
FROM METHANE DECOMPOSITION
4.1 Screening of CNM-PAC synthesis conditions
In the first phase of this study, two sets of experimental design matrix were applied
for synthesizing CNM over PAC substrate by using response surface methodology
(RSM). The fabrication factors were varied according to the experimental runs. However,
the range of variables (growth temperature-A, growth time-B and feed stock gas ratio-C)
were preselected based on literature. The adsorption capacity property of CNM-PAC is a
prime concern along the yield percentage. Thus, the study considered the following
responses 1:
1- YCH4: CNM-PAC yield %
2- RV1: removal percentage of BPA
DOE was used to evaluate the statistical variables gained from the model regression
analysis and the surface plots constructed based on the synthesizing conditions and
responses for each adsorbent-adsorbate interaction at the optimal conditions.
4.1.1 Design of Experiment (DOE) for Production of CNM-PAC from methane
decomposition
The conditions in Table 4.1 were suggested by the DOE software covers the growth
temperature from 750 ºC to 1000 ºC, time 20 min to 60 min, and feed stock gas ratio
(H2/CH4) 1.0 to 4.0 to produce CNM on Ni-PAC using the CVD tubular reactor. The
responses for evaluation the effect of growth parameter were the yield and removal
1 Hybridizing carbon nanomaterial with powder activated carbon for an efficient removal of Bisphenol A from water: The
optimum growth and adsorption conditions. Desalination and Water Treatment Journal. 2017 (95),128-143.
Univers
ity of
Mala
ya

106
efficiency of BPA from water for each as-grown-sample. The nanostructure production
conditions were optimized using a 2-level CCD with one central point. The collected
samples after growth were weighed and the experimental yield percentage was calculated
using the following formula:
where the weight of the PAC substrate treated similarly as in growth reaction
conditions but without introducing any type of carbon sources was found 143.0 mg.
4.1.2 Adsorption of BPA for DOE Screening
The removal efficiency % of BPA (50 mg/L) from water as a second response was
adopted onto the as-grown CNM-PAC samples to evaluate the optimum growth
conditions. The batch removal experiments were conducted on the CNM-PAC samples
produced from the DOE (Table 4.1).
Table 4.1: Experimental CCD data for synthesis parameters from CH4
decomposition.
Run
Variables Response
A
Temperature
ºC
B
Time
min
C
Gas
Ratio
CNM-PAC yield
YCH4 (%)
BPA removal efficiency
RV (%)
1 850 40 2.5 10.3 70.4
2 950 20 4.0 15.9 83.5
3 750 60 4.0 11.7 85.1
4 850 20 2.5 11.6 78.4
5 1000 20 1.0 27.7 5.6
6 750 20 4.0 12.9 78.0
7 750 60 1.0 9.7 76.2
8 950 60 4.0 21.4 42.1
9 750 40 2.5 9.1 76.3
10 950.0 20.0 1.0 22.9 87.6
11 850.0 40.0 4.0 8.4 83.9
12 950.0 60.0 1.0 37.3 14.7
13 850.0 60.0 2.5 14.1 78.5
14 750.0 20.0 1.0 10.02 60.8
𝒀𝒊𝒆𝒍𝒅 % =
𝑚𝑎𝑓𝑡𝑒𝑟𝑐𝑎𝑡𝑎𝑙 − 143
143 × 100
(4.1)
Univers
ity of
Mala
ya

107
Fourteen shake flasks were prepared, each flask contains 10 mg of as grown CNM-
PAC sample and 50 mL of BPA at pH of 6.0. The flasks were placed in a mechanical
shaker system for 120 min at room temperature with a shaking speed of 180 rpm. The
experimental results of removal efficiency % presented in Table 4.1 was determined by
applying equations (3.4). It is observed that the CNM-PAC sample produced from run 10
had the best performance in terms of BPA removal (~ 88%).
4.2 Statistical Analysis for the CNM-PAC growth
4.2.1 Analysis of variance (ANOVA) for the yield of CNM-PAC
The analysis of variance (ANOVA) was applied to justify the competence of the
proposed models. The significance of the developed models was evaluated by the F-test
value which is a statistical indication of how well the suggested model represents the
variation in the data about the mean. The greater the F-value and smaller P value, the
more the model explains adequately the variation of the data and the predicted significant
terms of the growth variables are closer to the actual value (Angulakshmi et al., 2012).
The growth yield of CNM-PAC is studied through analyzing the data shown in Table 4.1.
The corresponding analysis of variance (ANOVA) for yield of CNM-PAC is listed in
Table 4.2. The F-value of 210.54 and values of "Prob > F" less than 0.05 confirmed that
the suggested model is statistically significant and there is only 0.05 % chance that the
“model F-value” can occur due to noise for the CNM-PAC yield. The value of signal to
noise ratio is presented by the “Adequate Precision” which should be greater than 4 for
desirable value. The model showed adequate signal value of 46.61.
The relationship between the independent variables and the yield of CNM-PAC is
given by Equation (4.2):
𝐥𝐧(𝒀𝑪𝑯𝟒) = 2.36 + 0.370 A + 0.0857 B − 0.27 C + 0.116 AB − 0.169 AC
− 0.0329 BC + 0.199A2 + 0.184 B2 + 0.0288 C2 + 0.212 A2C (4.2)
Univers
ity of
Mala
ya

108
where A, B, C represents growth temperature (ºC), growth time (min) and H2 /CH4
ratio, respectively.
Table 4.2: ANOVA results for the yield of CNM-PAC growth.
*Source Sum of
Squares df
Mean
Square
F
Value
p-value
Prob > F
Model 2.71 10 0.27 210.54 0.0005
A 1.18 1 1.18 914.87 < 0.0001
B 0.074 1 0.074 57.22 0.0048
C 0.068 1 0.068 52.94 0.0054
AB 0.11 1 0.11 84.02 0.0027
AC 0.23 1 0.23 178.35 0.0009
BC 8.713x10⁻³ 1 8.713x10⁻³ 6.76 0.0804
A2 0.090 1 0.009 69.48 < 0.0036
B2 0.043 1 0.043 33.05 0.0105
C2 1.144 x10⁻³ 1 1.144 x10⁻³ 0.89 0.4158
A2C 0.048 1 0.048 37.40 0.0088
R- Squared 0.998 Std.Dev. 0.0359
Adj. R-Squared 0.994 C.V. % 1.35
Pred. R-Squared 0.938 Adeq. Precesion 46.61 *A: Temperature; (ºC), B: Time; (min) and C: H2/CH4
The predicted values of the CNM-PAC yield calculated from ANOVA model equation
along with actual values are listed in Table 4.3. The correlation coefficient R2 value for
the yield of CNM-PAC growth is greater than 0.98 suggests that the obtained model
provides a good estimation of the response. Moreover, it can be seen from Figure 4.1 that
the experimental data for the examined CNM-PAC sample are close to the predicted
values suggested by the proposed model.
Univers
ity of
Mala
ya
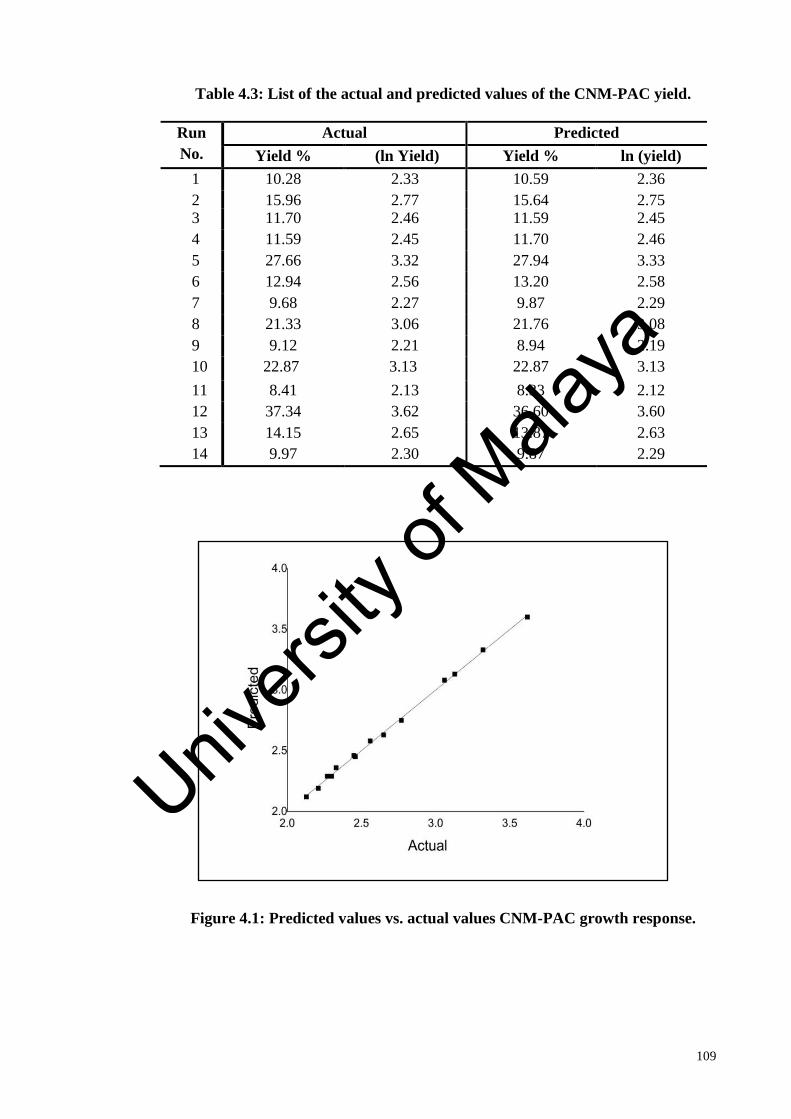
109
Table 4.3: List of the actual and predicted values of the CNM-PAC yield.
Run
No.
Actual Predicted
Yield % (ln Yield) Yield % ln (yield)
1 10.28 2.33 10.59 2.36
2 15.96 2.77 15.64 2.75 3 11.70 2.46 11.59 2.45
4 11.59 2.45 11.70 2.46
5 27.66 3.32 27.94 3.33
6 12.94 2.56 13.20 2.58
7 9.68 2.27 9.87 2.29
8 21.33 3.06 21.76 3.08
9 9.12 2.21 8.94 2.19
10 22.87
3.13
22.87 3.13
11 8.41 2.13 8.33 2.12
12 37.34 3.62 36.60 3.60
13 14.15 2.65 13.87 2.63
14 9.97 2.30 9.87 2.29
Figure 4.1: Predicted values vs. actual values CNM-PAC growth response.
Univers
ity of
Mala
ya

110
4.2.2 Analysis of variance (ANOVA) for the removal of BPA onto CNM-PAC
The second response was the removal (%) of BPA from water. Each sample of CNM-
PAC was used as an adsorbent and the results of removal % were entered the software,
as given in Table 4.1. By referring to the corresponding (ANOVA) for removal of BPA,
presented in Table 4.4, the Model F-value of 13.87 implies the model is significant. There
is only a 0.26 % chance that a "Model F-Value" this large could occur due to noise. The
desirable value of signal to noise ratio “Adeq Precesion” for this response showed a value
of 11.923.
This model can be used to navigate the design space and it is represented by the
following equation:
𝑩𝑷𝑨 𝑹𝑽 % = 76.21 + 24.55 A − 9.17 B + 6.34 C − 17.10 AB − 0.35 AC −
10.09 A2 − 33.70 A3 (4. 𝟑)
where RV % is the removal efficiency of BPA from water, A, B and C are temperature
of growth (ºC), time (min) and gas ratio (H2/CH4), respectively. Table 4.5 lists the
predicted values of removal efficiency % calculated from ANOVA model equation along
with the actual values. Furthermore, the predicted values were plotted against the
experimental data (Figure 4.2). It can be seen a good relationship between the
experimental and predicted values since the data points has good distribution near to the
straight line. The coefficient of determination (R2) of BPA removal % was 0.9418. The
high R2 values and the low coefficient of variation (CV= 5.47 %) suggest that the obtained
model provides a good estimation of the response which can be reproducible as long CV
values are not greater than 10% (Angulakshmi et al., 2012).
Univers
ity of
Mala
ya

111
Table 4.4: ANOVA results for BPA removal % for CNM-PAC growth
optimization
*Source Sum of
Squares df
Mean
Square
F
Value
p-value
Prob > F
Model 8494.09 7 1213.44 13.87 0.0025
A 510.83 1 510.83 5.84 0.0521
B 840.89 1 840.89 9.61 0.0211
C 352.03 1 352.03 4.02 0.0917
AB 2339.28 1 2339.28 26.74 0.0021
AC 0.98 1 0.98 0.011 0.9192
A2 275.25 1 275.25 3.15 0.1265
A3 1324.83 1 1324.83 14.14 0.0081
R- Squared 0.9418 Std.Dev.3.35
Adj. R-Squared 0.8379 C.V. % 5.47
Pred. R-Squared 0.7977 Adeq. Precesion 11.932 *A: Temperature; (ºC), B: Time; (min) and C: H2/CH4
Table 4.5: List of the actual and predicted values of the BPA removal efficiency.
Run No. RV%
Actual Predicted
1 70.4 76.2
2 83.5 89.2
3 85.1 89.9
4 78.4
85.4
5 5.60
5.60
6 78.0 74.0
7 76.2 76.5
8 42.1 36.7
9 76.3
75.3
10 87.6 77.3
11 83.9
82.6
12 14.7 24.7
13 78.5
67.0
14 60.8 60.7
Univers
ity of
Mala
ya

112
Figure 4.2: Predicted values vs. actual values BPA removal response.
4.2.3 The interactive effects of selected parameters on the CNM-PAC growth
and BPA adsorption
The yield % of CNM-PAC and the removal efficiency % of BPA over the independent
variables were presented by three-dimension view of response surface plot as a function
of two independent variables (Figure 4.3). Generally, if the F function is greater than 4,
the product is significantly influenced by the parameter variations (Zare, Sadegh, et al.,
2015). ANOVA Tables 4.2 and 4.4 showed that the studied parameters affect the CNM-
PAC yield and BPA removal significantly. Among these parameters, the reactor
temperature, and growth duration are the most important. It is obvious that the high F-
value for the linear terms of A (temperature) and B (time) (914.87, 57.22, respectively)
indicates their large effect on the CNM-PAC yield. Furthermore, it is noticed from their
corresponding F values that the removal of BPA increases with the increase in
temperature and time of synthesis (5.84 and 9.61). The interaction effect of growth
temperature and growth time (AB) has the greatest impact on the CNM-PAC yield and
Univers
ity of
Mala
ya

113
on BPA removal efficiency as was justified by the “Prob. > F” values which were less
than 0.0027 and 0.0021, respectively (Roosta et al., 2014).
RSM results, as displayed in Figure 4.3 (a), suggested that the yield increased
proportionally with the increase in growth time, and then dropped as the reaction
proceeds. However longer reaction times was found to cause the deposition of amorphous
carbon (Hussein et al., 2012). Figure 4.3 (b) shows the yield versus temperature and gas
ratio. Increasing the gas ratio (H2/CH4) did not provide a respected enhancement in the
yield of CNM-PAC as compared with the reaction temperature. The concentration of
carbon atoms in CVD reactor is an important factor for the rate of growth. Therefore, a
high content of hydrogen in the carbon precursor contributes, together with the H2
produced during the reaction, to move the reaction backward again towards the methane
formation reducing the number of active carbon atoms on the catalyst surface and
consequently the amount of grown CNM-PAC (Dikonimos Makris et al., 2005). Figure
4.3 (c) demonstrates that the reaction duration has notable effect than that observed by
the feed stock gas ratio (Ashik, Wan Daud, & Hayashi, 2017)
Furthermore, Figure 4.3 (d) indicates that the removal of BPA increased with
increasing the growth temperature and time. Nevertheless, high growth temperature has
more positive effect on promoting the BPA removal efficiency comparing with the impact
of growth duration parameter. Figure 4.3 (e) shows the removal of BPA versus
temperature and gas ratio. The interaction between those two parameters (AC) have more
significant effect as compared with the time- gas ratio (BC) interaction presented in
Figure 4.3 (f). From the study of interaction of different parameters of CNM-PAC
synthesis, it was noticed that the behavior of surface response of removal as function of
reaction conditions is different from that of yield. This indicated that the quality of higher
yield product is not necessary to be sufficient for removal process.
Univers
ity of
Mala
ya

114
Table 4.6 shows the main constraints and their importance levels for optimization five
goals namely; growth temperature, growth time, gas ratio, CNM-PAC yield and removal
efficiency of BPA to select the optimum conditions for CNM-PAC production. Based on
the equations (4.2) and (4.3) and the constrains presented in Table 4.6, the software
suggested ten solutions listed in Table 4.7. The more likely suggested solution by DOE
software to predict the maximum yield of CNMs-PAC and BPA removal efficiency be
feasible is was found reliable at reaction conditions: temperature 933°C, synthesis
duration 20 min, and H2 to CH4 flow ratio 1.0. The predicted optimization condition was
validated by the final run and the percentage values of carbon yield and the removal
efficiency of BPA were 22.14 and 89.33%, respectively, implying good agreement
between the predicted and the experimental values.
Univers
ity of
Mala
ya

115
Figure 4.3: Three-dimensional response surface representation for: CNM-PAC
growth yield (Y), and BPA removal efficiency (RV %); (a, b) interaction with
growth temperature and time, (c, d) interaction with growth temperature and gas
ratio and (e, f) interaction with time and gas ratio.
a d
b e
c f
Univers
ity of
Mala
ya

116
Table 4.6: Constraints for optimization of production conditions for CNM-PAC
for BPA removal.
Name Goal Lower limit Upper limit Importance
out of 5
Temperature (A) In range 750 1000 3
Time (B) In range 20 60 3
Gas ratio (C) In range 1 4 3
Yield % (Y) Maximize 8.4 37.3 3
Removal % (RV) Maximize 5.6 87.6 5
Table 4.7: Solutions for the optimum conditions suggested by DOE software for
CNM-PAC growth.
No. A B C Y % RV% Desirability
1 933.0 20.0 1.0 21.5 87.6 0.876 Selected
2 933.0 20.2 1.0 21.4 87.6 0.875
3 934.0 20.0 1.07 21.3 87.6 0.873
4 930.0 21.0 1.0 21.1 87.6 0.871
5 927.0 20.0 1.0 21.0 89.9 0.870
6 936.0 20.0 1.0 21.7 86.2 0.868
7 925.0 22.9 1.0 20.3 87.6 0.862
8 939.20 20.0 1.78 19.2 87.6 0.845
9 750.0 60.0 3.96 11.5 89.6 0.643
10 842.0 20.0 3.87 9.59 87.6 0.501
A: Temperature, B: time, C: gas ratio
4.2.4 Summary of the optimization conditions for CNM-PAC synthesis from
methane decomposition
Based on this study, the influences of the operating variables are optimized for
synthesizing CNM on powdered activated carbon substrate. In this context, different
range of growth variables were predetermined to get maximum yield of CNM-PAC and
BPA removal efficiency. The experimental design results for synthesizing CNM-PAC
revealed that all the three variables showed significant effects on the yield of CNM-PAC.
However, the growth temperature is the most important factor influencing the removal
efficiency. Thus, the variables investigated must be taken into consideration due to their
Univers
ity of
Mala
ya

117
significant impact on the production of CNM-PAC hybrid. The decomposition of
methane is an endothermic reaction. Hence, the chemical conversion improves when
increasing the temperature. Similarly, decreasing the inlet gas flow rate or the CH4 mole
fraction increases the contact time, and hence results in higher conversion.
The process optimization produced CNM-PAC hybrid with maximum adsorption
efficiency and yield within the experimental ranges studied. Consequently, this would
minimize the industrial production costs of this type of hybrid materials. The produced
CNM-PAC hybrid at the optimal synthesizing conditions (temperature 933°C, synthesis
duration 20 min, and H2 to CH4 flow ratio 1.0) was used to optimize the conditions of
BPA adsorption such as, the solution pH, adsorbent dose and contact time in the next
section.
4.3 Adsorption of bisphenol A (BPA)
4.3.1 Design of experiment (DOE) for BPA adsorption
The adsorption of BPA (50 mg/L) from aqueous solution by the optimum CNM-PAC
hybrid was studied using DOE to determine the optimum adsorption conditions. The
study considered the operating factors including pH; X1 (2-11), CNM-PAC dose; X2 (5-
20 mg) and contact time; X3 (10-120 min) (Table 4.8).
Table 4.8: Summary of CCD for parameters of BPA adsorption on CNM-PAC.
Factor Name Units Low
actual
High
actual
Low
coded
High
coded
X1 pH - 2 11 -1 +1
X2 Dose mg 5 20 -1 +1
X3 Contact time min 10 120 -1 +1
The parameters presented in Table 4.8 were selected based on literature review
(Bautista-Toledo et al., 2005; Cai et al., 2003; Dong et al., 2010; Kwon & Lee, 2015).
Two-level central composite design (CCD) was used to evaluate the adsorption
Univers
ity of
Mala
ya

118
performance of BPA by CNM-PAC for two responses, the removal efficiency % of BPA
(RV1) and adsorption capacity (Q1). The summary of CCD of experiments produced by
DOE software are summarized in Table 4.9. The removal efficiency and adsorption
capacity were found to be in the ranges of 62.4 - 97.8 % and 87.4 -323.7 mg/g,
respectively.
Table 4.9: CCD of experimental parameters for BPA removal by CNM-PAC.
Run
No.
pH Dose
(mg)
Contact
time
(min)
Response 1
(RV1)
Removal %
Response 2 (Q1)
Adsorption
capacity (mg/g)
1 2 20.0 10 89.67 112.08
2 3 5.0 120 64.74 323.68
3 7 10.0 65 62.43 156.07
4 11 20.0 120 74.42 93.02
5 7 12.5 20 67.83 135.66
6 7 10.0 40 67.04 167.61
7 2 20.0 120 97.80 122.25
8 3 5.0 10 47.91 239.54
9 11 5.0 120 44.81 224.06
10 6 12.5 40 74.14 148.29
11 7 12.5 40 72.05 144.10
12 5 15.0 65 86.31 143.86
13 7 15.0 20 84.70 141.18
14 11 20.0 10 69.93 87.41
15 10 15.0 20 73.10 121.83
4.3.2 Analysis of variance (ANOVA)
The analysis of variance was used to investigate the adequacy of models that suggested
for two responses, the removal efficiency and adsorption capacity. The responses were
studied through analyzing the data given in Table 4.9. The adopted ANOVA model for
the removal efficiency % and adsorption capacity (Q1) by CNM-PAC is presented in
Tables 4.10 and 4.11. The model F-values of 34.4 and 104.0 confirmed that the models
are statistically significant. There is only a 0.01% chance that a "Model F-Value" can
Univers
ity of
Mala
ya

119
occur due to noise for both the removal efficiency and adsorption capacity. Values of
"Prob > F" less than 0.05 indicate the model terms are significant. For the removal %
efficiency, the cases X1 (pH), X2 (dosage), X3 (contact time), X2X3, and X22 offered
significant model terms. However, the adsorption capacity showed significant terms for
X1, X2, X3, X1 X2, X2 X3 and X32
. Values greater than 0.1 indicate that the model terms
are not significant. The coefficient of variation for these two models (CV) is the error
expressed as a percentage of the mean. In the present study, the (CV) value for RV1 %
and Q1 was 5.54 % and, 5.86 % respectively. The desirable value of signal to noise ratio
presented by “Adeq Precision” should be greater than 4. The models showed a ratio of
20.4 and 36.3 which indicates an adequate signal. These models can be used to navigate
the design space and are expressed by Equations (4.4) and (4.5):
𝑹𝑽𝟏 % = 67.9 − 9.65 𝑋1 + 18.3 𝑋2 + 2.28 𝑋3 − 0.642 𝑋2𝑋3
− 5.04 𝑋22 (4.4)
𝑸𝟏 = 170.0 − 35.8 𝑋1 − 39.8 𝑋2 + 2.98 𝑋3 + 12.2 𝑋1𝑋2 − 4.54 𝑋2𝑋3
+ 2.78 𝑋32 (4.5)
Where X1, X2 and X3 represents pH, dosage (mg) and contact time (min).
Table 4.10: ANOVA results for BPA Removal % (RV1) by CNM-PAC.
*Source Sum of
Squares df
Mean
Square
F
Value
p-value
Prob > F
Model 2720.0 5 545.0 34.4 < 0.0001
X1 707.0 1 707.0 44.6 < 0.0001
X2 1550.0 1 1550.0 97.7 < 0.0001
X3 208.0 1 208.0 12.52 0.0076
X2 X3 44.2 1 44.2 2.79 0.0176
X22 320.0 1 320.0 20.2 0.00151
R- Squared 0.950 Std.Dev. 3.98
Adj. R-Squared 0.923 C.V. % 5.54
Pred. R-Squared 0.865 Adeq. Precesion 20.4
*X1: pH, X2: adsorbent dosage and X3: contact time; (min)
Univers
ity of
Mala
ya

120
Table 4.11: ANOVA results for BPA adsorption capacity (Q1) on CNM-PAC.
*Source Sum of
Squares df
Mean
Square
F
Value
p-value
Prob > F
Model 53000.0 6 8840.0 104.0 < 0.0001
X1 6420.0 1 6420.0 75.5 < 0.0001
X2 16500.0 1 16500.0 194.0 < 0.0001
X3 86.9 1 86.9 1.02 0.342
X1 X2 19500.0 1 19500.0 23.0 0.00137
X2X3 1990.0 1 1990.0 23.5 0.00128
X32 873.0 1 873.0 10.3 0.0125
R- Squared 0.987 Std.Dev.6.5
Adj. R-Squared 0.978 C.V. % 5.86
Pred. R-Squared 0.941 Adeq. Precesion 36.3 *X1: pH, X2: adsorbent dosage and X3: contact time; (min)
The predicted values of the removal efficiency % and adsorption capacity determined
from ANOVA model equations along with the variables values against the experimental
values are listed in Table 4.12.
Table 4.12: List of the actual and predicted values for BPA removal (RV1) and
adsorption capacity responses (Q1).
Run No. RV1 % Q1 (mg/g)
Actual Predicted Actual Predicted
1 89.67 92.4 112.08 118.0
2 64.74 63.5 323.68 321.0
3 62.43 68.3 156.07 169.0
4 74.42 76.2 93.02 96.6
5 67.83 71.4 135.66 145.0
6 67.04 65.5 167.61 161.0
7 97.80 95.5 122.25 119.0
8 47.91 47.4 239.54 241.0
9 44.81 44.2 224.06 225.0
10 74.14 75.8 148.29 150.0
11 72.05 73.4 144.10 143.0
12 86.31 85.6 143.86 139.0
13 84.70 77.1 141.18 129.0
14 69.93 70.7 87.41 91.9
15 73.10 69.8 121.83. 111.0
Univers
ity of
Mala
ya

121
Figure 4.4 shows the predicted values plotted versus the experimental values for BPA
removal % and adsorption capacity on CNM-PAC hybrid. It can be observed that the
experimental data are close to the predicted values suggested by the developed models.
The correlation coefficient R2 value for the removal efficiency and adsorption capacity
was 0.950 and 0.987 which confirms the good agreement between predicted and actual
values and the models proved to be successfully reliable to represent the relation between
the adsorption variables and the targeted responses.
Figure 4.4: Predicted values vs. actual values for (a) BPA removal efficiency
(RV1 %) and (b) adsorption capacity (Q1) on CNM-PAC.
The statistical analysis of CCD gave several potential solutions for optimum
conditions of BPA adsorption by CNM-PAC. Table (4.13) shows set of constrains and
different importance levels which were defined for optimization of five potential targets
namely, pH, CNM-PAC dosage, contact time, removal efficiency and adsorption capacity
to select the optimum conditions for BPA adsorption on the as-grown CNM-PAC hybrid.
The software suggested fourteen solutions based on the process constraints (Table 4.14)
Univers
ity of
Mala
ya

122
for the optimum adsorption process conditions values. In this context, the first choice
with the highest desirability was selected; pH of 3.0, adsorbent dosage of 15.6 mg and
contact time of 120 min. These conditions were further used for isotherm and kinetics
study.
Table 4.13: Constraints for optimization process based on CCD for BPA
adsorption.
Name Goal Low limit Upper limit Importance
X1 (pH) In range 2 11 3
X2 (dosage) In range 5 20 3
X3 (time) In range 10 120 3
RV1 Maximize 62.4294 97.8
5
Q1 Maximize 87.41 323.680 3
4.14: Potential optimization conditions based on CCD for BPA removal.
No. pH Dose
(mg)
Contact
time (min)
RV1 % Q1
(mg/g)
Desirability
1 3.00 15.6 120. 95.5 179. 0.964 Selected
2 3.00 15.5 120. 95.5 179. 0.963
3 3.00 15.5 120. 95.4 179. 0.963
4 3.00 15.7 120. 95.6 178. 0.963
5 3.00 15.6 120. 95.5 178. 0.963
6 3.03 15.5 120. 95.4 179. 0.962
7 3.00 15.8 120. 95.7 176. 0.962
8 3.01 15.8 120. 95.7 176. 0.961
9 3.11 15.5 120. 95.2 179. 0.959
10 3.39 15.4 120. 94.4 179. 0.946
11 3.46 15.4 120. 94.2 179. 0.943
12 3.00 14.5 96.3 92.3 172. 0.901
13 3.00 13.0 79.2 88.0 179. 0.844
14 3.00 14.2 45.9 87.5 156. 0.795
Univers
ity of
Mala
ya

123
4.3.3 The interactive effects of selected parameters on BPA adsorption
The removal efficiency % of BPA (50 mg/L) and adsorption capacity of CNM-PAC
hybrid adsorbent over different sets of independent parameters were described by three-
dimension view of response surface plot as a function of two variables (Figure 4.5 and
Figure 4.6).
Figure 4.5: RSM plots of (a) BPA removal efficiency (RV1 %), and (b)
adsorbent capacity (Q1) considering the effect of pH and dosage.
The impact of pH was noticeable on the removal efficiency and adsorption capacity as
it effects the properties of both adsorbate and adsorbent. The adsorption of BPA was
apparently weakened with increasing pH. This can be due to the deprotonation of some
adsorbent surface functional groups resulting in more negatively charged surface (Li,
Gong, et al., 2015). As well as, the reduction of BPA removal was observed in the alkaline
pH range due to the ionization of BPA molecules to mono- or divalent anions leading to
an increase in the repulsive electrostatic interactions between the bisphenolate anion and
the negatively charged surface of adsorbents (Chang et al., 2012; Dehghani et al., 2015).
Furthermore, it was obvious that the adsorption of BPA was enhanced with decreasing
a b
Univers
ity of
Mala
ya

124
pH and the removal efficiency and the adsorption capacity reached to a maximum at 3.0
and the worst removal of BPA was obtained at pH up to 11 (Figure 4.5). This can be
assigned to the presence of BPA in molecular form and to the highly protonation of
adsorbent surface at acidic pH value, leading high attraction between the adsorbent and
adsorbate (Qiu et al., 2016). Meanwhile, Figure 4.6 (a) shows the increasing in BPA
removal efficiency along with adsorbent dose was less conspicuous than that displayed
by the pH. The increase in the removal efficiency can be referred to the increase in
creation of more adsorptive sites as a result of the increase in surface area, on the other
hand, the adsorption capacity decreased as the adsorbent dosage increased. Thus, the
effect of pH is more obvious than the adsorbent dose as can be seen in Figure 4.6 (b).
These observations agree with other reported studies (Joseph, Zaib, et al., 2011; Tsai, Lai,
& Su, 2006).
Figure 4.6: RSM plots of (a) BPA removal efficiency (RV1 %), and (b)
adsorbent capacity (Q1) considering the effect of pH and contact time.
a b
Univers
ity of
Mala
ya

125
Also, the suggested ANOVA models were used to interpret and support the RSM
findings for the interaction of the adsorption parameters. A significant effect for the linear
variable terms of the removal efficiency response was observed, along with X22, as shown
in Table 4.10. The high F- values of the pH (44.68) and the adsorbent dosage (97.7)
confirmed their significant effect compared to the of contact time (12.52). The combined
effect of the pH-adsorbent amount (X2X3) on removal efficiency was respectable since
the P value of 0.0176. This can be attributed to the fact that adsorbent dosage provides a
direct reflection to the surface area, while the pH corresponds to surface charge.
Meanwhile, the most significant interaction terms for adsorbent capacity (Table 4.11)
were observed for pH-adsorbent dosage (X1X2) and adsorbent dosage-contact time
(X1X3) owing to their low “P values”; 0.00137 and 0.00128, respectively.
4.3.4 Adsorption Kinetics
The adsorption kinetic was investigated to study the adsorption equilibrium time and
analyze the uptake behavior of BPA on CNM-PAC hybrid. The kinetic studies were
conducted at the optimal conditions for BPA adsorption (initial BPA concentration 50
mg/L, adsorbent dosage 15.6 mg, and pH of 3.0). Three kinetic models, which are:
pseudo-first order, pseudo-second order and intraparticle diffusion model (Figure 4.7,
Figure 4.8 and Figure 4.9) were applied to the experimental data. As can be observed
from Table 4.15 the correlation coefficient (R2) value of Pseudo-second order model was
(0.999) which is much higher than the other models (0.825 and 0.821). Thus, the pseudo-
second order model is ideally representing the adsorption of BPA on CNM-PAC due to
the good agreement between this model and experimental data. This behavior agrees with
several previously-reported studies which used carbonaceous adsorbents for BPA
removal (Joseph, Heo, et al., 2011; Kwon & Lee, 2015; Sui et al., 2011). The well fitted
pseudo-second-order model for BPA adsorption on CNM-PAC suggests the following:
Univers
ity of
Mala
ya

126
(i) the involvement of the adsorbent and adsorbate in the adsorption process and (ii) the
adsorption process rate could be controlled by chemisorption involving valence forces
through sharing or exchange of electrons (Chowdhury & Balasubramanian, 2014).
Table 4.15: Linearized equations of studied kinetic models for BPA adsorption
on CNM-PAC.
Model Equation Parameters Values
Pseudo-First-Order
ln(𝑞𝑒 − 𝑞𝑡) = 𝑙n𝑞𝑒 − 𝐾1t R2 0.825
K1 0.0161
qe 27.107
Pseudo-Second-Order
𝑡
𝑞𝑡=
1
𝐾2𝑞𝑒2
+1
𝑞𝑒𝑡
R2 0.999
K2 0.001608
qe 144.928
Intraparticle diffusion 𝑞𝑡 = 𝐾𝑑𝑡
12 + 𝐶
R2 0.821
Kd 2.4
qe 151.98
C 113.24
qe (experimental) = 144.39 mg/g
It is worth to mention that the intraparticle diffusion model provides further description
to the adsorption mechanism (Figure 4.9). The model suggests three adsorption regions:
(i) the boundary layer diffusion where the instant adsorption takes place from the bulk
solution to the external surface of the adsorbent, (ii) the gradual adsorption through
intraparticle diffusion where the adsorbate diffuses on the sorptive sites, and (iii) the
equilibrium region accompanied by slow diffusion rate due to the diminishes of BPA
concentration in the solution (Kuo, 2009; Ocampo-Pérez et al., 2012). It is obvious from
Figure 4.9 that the linear plot is not passing through the origin which indicates that there
are other mechanisms involved in the rate limiting process along with the intraparticle
diffusion. Meanwhile, the boundary layer thickness has significant impact as can be
observed from the high value of the of the intercept (C = 113.24) which proposes that the
Univers
ity of
Mala
ya

127
boundary layer diffusion dominated the BPA removal to some point (Balarak, 2016; Qin
et al., 2015).
Figure 4.7: Pseudo-first order kinetic model for BPA adsorption.
Figure 4.8: Pseudo-second order kinetic model for BPA adsorption.
a
Univers
ity of
Mala
ya

128
Figure 4.9: Intraparticle diffusion kinetic model for BPA adsorption.
4.3.5 Adsorption isotherms
The interaction between the adsorbent and adsorbate up to the equilibrium point was
demonstrated by applying three isotherm models namely, Langmuir, Freundlich and
Temkin. The best fitted isotherm model to the experimental data was extracted from the
highest correlation coefficient R2. Figure 4.10, Figure 4.11 and Figure 4.12 show the plot
of each model as well as their correlation factors and constants are presented in Table
4.16. The validation of the adsorption favorability of BPA on CNM-PAC under working
conditions was confirmed by the values of the separation factor of Langmuir model (RL)
and the heterogeneity factor of Freundlich isotherm (n) (Zhou et al., 2011). However, the
Langmuir model produced the best fit with a high correlation coefficient R2 (0.994),
indicating a monolayer adsorption of BPA onto the CNM-PAC surface. On the other
hand, according to the Freundlich n value (n >1), the adsorptive behavior is dominated
by a physical adsorption process, implying that the adsorbent attains heterogeneous
surface associated with active sites of different adsorption affinities to the BPA molecules
Univers
ity of
Mala
ya

129
(Shen et al., 2015). Similar isotherm results were reported for the adsorption of BPA onto
activated carbon (AC) derived from rice straw agricultural waste (Chang et al., 2012).
Table 4.17 provides a comparison of the maximum adsorption capacity of BPA onto
several adsorbents. The CNM-PAC adsorbent synthesized in the present study showed a
high maximum adsorption capacity of 181.81 mg/g comparing with other types of
adsorbents, indicating a good adsorption performance for BPA removal from water.
Figure 4.10: Langmuir isotherm model for BPA adsorption.
a
Univers
ity of
Mala
ya

130
Figure 4.11: Freundlich isotherm model for BPA adsorption.
Figure 4.12: Temkin isotherm model for BPA adsorption.
b
c
Univers
ity of
Mala
ya

131
Table 4.16: Linearized equations of studied isotherm models for BPA
adsorption on CNM-PAC.
Model Equation Parameters Values
Langmuir
𝐶𝑒
𝑞𝑒=
1
𝐾𝐿 𝑞𝑚 + (
1
𝑞𝑚) 𝐶𝑒
R2 0.9941
qm 181.81
KL 0.514
RL 0.0375
Freundlich
𝑙𝑛𝑞𝑒 = 𝑙𝑛𝐾𝑓 +
1
𝑛 𝑙𝑛𝐶𝑒
R2 0.7316
Kf 56.48
n 2.63
Temkin 𝑞𝑒 = 𝐵1𝑙𝑛𝐾𝑇 + 𝐵1𝑙𝑛𝐶𝑒 R2 0.921
KT 8.667
𝐵1 31.954
Table 4.17: Previously reported maximum adsorption capacities of various
adsorbents for Bisphenol A removal.
Adsorbent qm (mg/g) Reference
CNM-PAC 181.81 Present work
CNTs/Fe3O4 43.76 (Li, Gong, et al., 2015)
SWCNTs 22.6- 44.8 (Joseph, Zaib, et al., 2011)
Powdered Activated Carbon (PAC) 129.6 (Bautista-Toledo et al.,
2005)
reduced graphene 96.2 (Kwon & Lee, 2015)
oxide graphene 58.2 (Jin et al., 2015)
molecularly imprinted polymers (MMIPs) 142.9 (Guo et al., 2011)
Chitosan 34.48 (Dehghani et al., 2016)
Fibric peat 31.40 (Zhou et al., 2011)
Hydrophobic Y type zeolite 111.11 (Tsai, Hsu, et al., 2006)
Organo-montmorillonite 151.522 (Park et al., 2014)
Univers
ity of
Mala
ya

132
4.3.6 Mechanisms
The adsorption of BPA onto the synthesized CNM-PAC adsorbent was greatly
affected by the characteristics of the adsorbent, removal conditions, as well as the
molecular properties of BPA. Thus, CNM-PAC has oxygen-functional groups, which
enhance its dispersibility in water. Moreover, –OH is an electron-donating functional
group that can increase the sorption affinity of BPA by increasing the π-donating strength
of the host aromatic ring (Yu et al., 2017). The molecular size of BPA, its pKa (pKa =
9.5 for BPA) and its rotating structure influenced its affinity towards the surface of CNM-
PAC (Apul & Karanfil, 2015). Thus, the wedging of BPA into the groove regions of the
adsorbent is allowed by the rotating structure of BPA molecule. The π−π interactions
between the benzene rings of BPA and the graphene planes includes the polar and charge
interactions that may be responsible for the adsorption of BPA onto CNM-PAC.
Moreover, the pH of the background solution is another major factor controlling the
adsorption process. BPA is a weak acid and the non-dissociated species form dominates
in acidic solutions. It is worth to mention that the highest removal efficiency of BPA was
obtained at the optimum pH (pH 3.0) value which is less than the pKa value of BPA. This
observation confirms that the adsorption mechanism was dominated by the π-π
interaction effects (Apul & Karanfil, 2015). This observation was confirmed by the value
of point of zero of charge (PZC) of the synthesized CNM-PAC, which was found at pH
9.2. This implies that our adsorbent acquires positive surface charge as long as the
working pH of solution < pHPZC. Furthermore, Lin et al., (2008) reported that decreases
in adsorption affinities for phenolic compounds over their pKa values could be attributed
to the increased electrostatic repulsion between dissociated adsorbates and negatively
charged MWCNTs (Lin & Xing, 2008). In addition, at pH3 the methyl groups on BPA
Univers
ity of
Mala
ya

133
are protonated and increase the electron density of resonating π electrons in the benzene
ring, enhancing the attraction between positive CNM-PAC surfaces.
4.3.7 Summary of the adsorption of BPA onto CNM-PAC
The synthesized CNM-PAC at the optimum growth conditions was used to perform
optimization study on removal of BPA from water using CCD experimental design. The
optimum conditions were pH 3.0, adsorbent dose 15.6 mg and contact time 120 min.
Three kinetic models, which are: Pseudo-first order, Pseudo-second order and
intraparticle diffusion. The adsorption of BPA on CNM-PAC was ideally obeying the
Pseudo-second-order model with R2 = 0.999, qe = 144.93 (mg/g) and K2 = 0.0016
(g/mg.min). Also, the Langmuir, Freundlich and Temkin adsorption isotherm models
were tested. The BPA adsorption system was best fitted with Langmuir model with R2
=0.994, qm = 181.81 mg/g, KL = 0.514 and RL = 0.0375. The highest removal efficiency
of BPA was achieved at the optimum pH (3.0) which is less than the pKa value of BPA,
leading to conclude that the adsorption mechanism of BPA was governed by the strong
π- π interaction between the electron in the aromatic rings of BPA and the graphene layer
of the synthesized CNM-PAC and it might involve polar electrostatic components, charge
transfer and dispersive force.
4.4 Adsorption of methylene blue (MB)
4.4.1 Design of experiment (DOE) for MB adsorption
The adsorption performance of the synthesized CNM-PAC hybrid was
comprehensively examined for the removal of methylene blue (MB) from water. The
adsorption experiments were conducted according to the CCD matrix selected by the
DOE software to analyze the behavior of the removal efficiency (RV2) and adsorption
capacity (Q2) under three distinct factors pH (2-11), dose (5-20), and contact time (10-
Univers
ity of
Mala
ya

134
120) (Table 4.18). The summary of CCD of experiments produced by DOE software are
summarized in Table 4.19. The removal efficiency and adsorption capacity were found
to be in the ranges of 33.3 - 97.8 % and 107.5 -323.3 mg /g, respectively.
Table 4.18: Summary of CCD for MB adsorption variables on CNM-PAC.
Factor Name Units Low
actual
High
actual
Low
coded
High
coded
X1 pH - 2 11 -1 +1
X2 Dose mg 5 20 -1 +1
X3 Contact time min 10 120 -1 +1
Table 4.19: CCD of experimental variables for MB removal by CNM-PAC.
Run
No.
pH Dose (mg) Contact
time
(min)
Response 1
(RV2)
Removal %
Response 2 (Q2)
Adsorption
capacity (mg/g)
1 6 10 70 69.2 173.1
2 7 10 120 88.6 221.6
3 7 10 40 78.4 196.1
4 2 5 20 33.3 166.4
5 11 15 20 86.4 144.0
6 6 15 70 93.2 155.3
7 3 20 40 43.1 107.5
8 11 15 120 97.8 162.9
9 3 15 120 88.8 147.9
10 7 10 70 67.9 169.8
11 11 5 120 54.0 270.2
12 3 5 120 36.6 182.9
13 7 15 70 82.6 137.7
14 3 10 70 68.9 172.4
15 11 5 20 64.7 323.3
4.4.2 Analysis of variance (ANOVA)
The optimization of MB removal parameters was conducted using RSM and the
regression of the obtained data were performed by the analysis of variance (ANOVA).
Univers
ity of
Mala
ya

135
Thus, an empirical formula relating the removal efficiency of MB (RV2 %) and the
adsorption capacity (Q2) to the three input variables were described by the following
regression Equations:
𝑹𝑽𝟐 % = 77.5 + 10.4 𝑋1 + 18.8 𝑋2 + 4.847 𝑋3 − 4.15 𝑋1𝑋3 + 6.26 𝑋2𝑋3
− 11.9 𝑋22 (4.6)
𝑸𝟐 % = 192.0 + 33.4 𝑋1 − 44.9𝑋2 + 4.02 𝑋3 − 26.9 𝑋1𝑋2 − 9.85 𝑋1𝑋3
+ 10.1𝑋2𝑋3 (4.7)
Where X1, X2 and X3 represents pH, adsorbent dosage and contact time, respectively.
The results for RV2 % and Q2 regression models were presented in Table 4.20 and Table
4.21, respectively. The F-values were 21.5 and 22.5 which implied that both responses
were significant. There is only 0.02 % and 0.01 % chance that the “Model F- value” of
the removal efficiency of MB and adsorption capacity of CNM-PAC could occur due to
noise. The adequacy of the models was also confirmed by the P-value of both responses
(0.000159 and 0.000134) which provides further confirmation that the models were
highly significant. The correlation coefficient (R2) demonstrates the model strength and
the competence of its response prediction (Dutta et al., 2011). The R2 value for the
removal efficiency and adsorption capacity was higher than 91% which indicates a good
predictability of the suggested model. Also, the reasonable agreement of the predicted R2
with the adjusted R2 supports the close relationship between the obtained experimental
values and the values predicted by the proposed model (Table 4.22 and Figure 4.13).
These observations demonstrate the sufficiency of the model to describe the performance
of the studied responses according to the defined variables. The low coefficient of
variation (CV= 8.4 and 9.01 %) suggest that the obtained model provides a good
estimation of the response which can be reproducible and can be applied for further
analysis as long the CV values are not greater than 10%.
Univers
ity of
Mala
ya

136
Table 4.20: ANOVA results for MB Removal % (RV2) by CNM-PAC.
*Source Sum of
Squares df
Mean
Square
F
Value
p-value
Prob > F
Model 5630.0 6 939.0 21.5 0.000159
X1 930.0 1 930.0 21.3 0.00173
X2 3280.0 1 3280.0 75.0 < 0.0001
X3 187.0 1 187.0 4.28 0.0723
X1 X3 118.0 1 118.0 2.69 0.14
X2 X3 284.0 1 284.0 6.5 0.0342
X22 1150.0 1 1150.0 26.4 0.00089
R- Squared 0.942 Std.Dev.6.61
Adj. R-Squared 0.90 C.V. % 8.4
Pred. R-Squared 0.87 Adeq. Precesion 15.1 *X1: pH, X2: adsorbent dosage and X3: contact time; (min)
4.21: ANOVA results for MB adsorption capacity (Q2) by CNM-PAC.
*Source Sum of
Squares df
Mean
Square
F
Value
p-value
Prob > F
Model 39000.0 6 6500.0 22.5 0.000134
X1 9850.0 1 9850.0 34.1 0.000388
X2 23000.0 1 23000.0 79.6 < 0.0001
X3 139.0 1 139.0 0.48 0.508
X1 X2 7260.0 1 7260.0 25.1 0.00103
X1 X3 704.0 1 704.0 2.44 0.157
X2 X3 823.0 1 823.0 2.85 0.130
R- Squared 0.944 Std.Dev.12.0
Adj. R-Squared 0.902 C.V. 9.01
Pred. R-Squared 0.813 Adeq. Precesion 18.2
*X1: pH, X2: adsorbent dosage and X3: contact time; (min)
Univers
ity of
Mala
ya

137
Table 4.22: List of the actual and predicted values for MB removal (RV2) and
adsorption capacity responses (Q2).
Run No. RV2 % Q2 (mg/g)
Actual Predicted Actual Predicted
1 69.2 74.9 173.1 183.0
2 88.6 82.4 221.6 196.0
3 78.4 74.6 196.1 189.0
4 33.3 33.7 166.4 173.0
5 86.4 87.9 144.0 149.0
6 93.2 81.8 155.3 145.0
7 43.1 44.2 107.5 102.0
8 97.8 98.13 162.9 158.0
9 88.8 89.3 147.9 164.0
10 67.9 77.5 169.8 192.0
11 54.0 51.7 270.2 281.0
12 36.6 39.2 182.9 180.0
13 82.6 84.4 137.7 147.0
14 68.9 67.1 172.4 158.0
15 64.7 62.9 323.3 313.0
Figure 4.13: Predicted values versus actual values for (a) removal response and
(b) adsorption capacity response.
Univers
ity of
Mala
ya

138
4.4.3 The interactive effects of selected parameters on MB adsorption
RSM was used to explore all the significant interactions in the CCD and evaluate the
relation between input parameters and the obtained response surfaces. Figure 4.14
represents the response surface plots of RV2 % and Q2 versus the selected independent
variables. The role of pH and adsorbent dose are the most influencing variables in the
adsorption process. It is notable that the pH has a significant effect on the removal
efficiency and adsorbent capacity (Figure 4.14 (a) and 4.14 (b)). The removal efficiency
improved by increasing pH value until it reached the maximum at pH 11. The solution
pH can affect the adsorbent surface charge, the degree of pollutants ionization, the
dissociation of the adsorbent functional groups besides the structure of the dye molecule
(Ge et al., 2017). Hence, the observed high MB removal at pH11 can be explained by the
deprotonation of some surface functional groups resulting in more negatively charged
adsorbents surface (pH > pHpzc) as well as, high pH leads to more dissociation of MB
molecules (pKa = 3.8 for MB), subsequently increasing the electrostatic attraction
between the negatively charged active adsorption sites of CNM-PAC adsorbent and the
cationic dye molecule (Kuppusamy et al., 2016). Furthermore, in acidic solutions, the
competitive effects of excess H+ ions and the electrostatic repulsion between the cationic
dye would result in a decrease in the removal efficiency of dye (Liu et al., 2015).
At constant pH values (Figure 4.14 c and 4.15 c), the increase in removal efficiency
% and adsorbent capacity occur by increasing the amount of adsorbent. The significant
effect of adsorbent dose on both responses is confirmed by the high F-values (98.22 and
64.36) presented in in Tables 4.20 and 4.21, respectively. The adsorption enhancement
could be due to the availability of more adsorption sites. Whereas, at low adsorbent
dosage, the removal percentage decreased significantly as longer time is required for
adsorption to reach the equilibrium due to the reduction of reactive sites with respect to
Univers
ity of
Mala
ya

139
the dye molecules (Krishni, Foo, & Hameed, 2014; Liu, Wang, & Wang, 2012). The
interaction effect of pH- adsorbent dosage (X1 X2) was also valuable for the adsorbent
capacity analysis since it represented an F-value of 19.43. However, this interaction term
was insignificant to the removal efficiency response (P ≥ 0.05).
Figure 4.14: RSM plots of MB removal efficiency and adsorbent capacity
considering the effect of (a) pH and dose, (b) pH and contact time and (c) dose and
contact time.
a b
c
Univers
ity of
Mala
ya

140
Figure 4.15: RSM plots of the adsorption capacity considering the effect of (a)
pH and dose, (b) pH and contact time and (c) dose and contact time.
The optimum variable values for MB (50 mg L-1) removal process was selected by
setting some constraints parallel with different importance levels for the independent
parameters along with the process responses (Table 4.23). The software suggested twelve
solutions based on the process constraints for the optimum adsorption process conditions
values (Table 4.24). In this context, the first choice was pH of 11.0, adsorbent dosage of
12.3 mg and contact time of 120 min. These conditions were further used for isotherm
c
a b
Univers
ity of
Mala
ya

141
and kinetics study. At these optimum values, the predicted and observed MB removal
efficiency and adsorbent capacity were 97.8, 190.0 % and 94.97, 182.22 mg/g,
respectively.
Table 4.23: Constraints for optimization process based on CCD for MB
adsorption.
Name Goal Low limit Upper limit Importance
X1 (pH) In range 2 11 3
X2 (dosage) In range 5 20 3
X3 (time) In range 20 120 3
RV2 Maximize 36.6 97.8
5
Q2 Maximize 143.9 323.3 3
4.24: Potential optimization conditions based on CCD for MB removal.
No. pH Dose
(mg)
Contact
time (min)
RV2 % Q2
(mg/g)
Desirability
1 11 12.3 120 97.8 190 0.826 Selected
2 11 12.3 120 97.6 191 0.826
3 11 12.4 119 97.8 190 0.826
4 11.0 12.4 119 97.8 190 0.825
5 11.0 12.4 119 97.8 190 0.825
6 11.0 12.4 117 97.8 190 0.824
7 11.0 12.4 117 97.7 190 0.824
8 11.0 12.4 116 97.7 190 0.823
9 10.8 12.5 120 98.1 189 0.823
10 10.9 12.6 112 97.8 188 0.820
11 10.7 12.5 120 97.8 187 0.810
12 7.10 137 120 94.5 170 0.749
4.4.4 Adsorption kinetics
Kinetic modeling estimates the sorption rate of contamination removal from aqueous
effluents and predicts the suitable rate expressions of reaction mechanisms. In this
respect, in order to investigate the adsorption process of MB dye (50 mg/L) onto CNM-
PAC adsorbent, kinetic analyses were conducted at the optimal removal conditions
Univers
ity of
Mala
ya

142
suggested by DOE using the pseudo-first-order, pseudo-second-order and the
intraparticle diffusion models (Ma et al., 2012; Zhang et al., 2015). The experiments were
conducted for 7 h to ensure adsorption system reached equilibrium. The experimental
data were fitted to the kinetic equations and the characteristic parameters of each model,
the linear coefficient of determination (R2) and non-linear Chi-square (X2) were
summarized in Table 4.25. Figure 4.16 shows the plots of studied kinetic models.
The error functions R2 and X2 were used to select the best kinetic models fitted with
the experimental data. The chi-square statistic (X2) can be expressed in Equation 4.8
(Boulinguiez, Le Cloirec, & Wolbert, 2008):
𝑿𝟐 = ∑(𝑞𝑒,𝑒𝑥𝑝 − 𝑞𝑒,𝑐𝑎𝑙 )2
𝑞𝑒,𝑐𝑎𝑙 (4.8)
where qe,exp and qe,cal are the experimental and calculated adsorption capacity of CNM-
PAC adsorbent (mg /g), respectively. The kinetic model is well fitted to the experimental
data when high R2 and low X2 values are obtained (Ho, Chiu, & Wang, 2005). It is obvious
from Table 4.25 that the adsorption of MB by CNM-PA was fitted better with the pseudo-
second order kinetic model due to the highest correlation coefficient value R2 than other
models and the smallest X2 value obtained (0.998 and 5.75). Therefore, the adsorption of
MB on CNM-PAC adsorbent is ideally obeying the Pseudo-second-order kinetic model,
and this is in agreement with some reported kinetics results for MB adsorption on
carbonaceous adsorbents (Li, Du, et al., 2013; Liu, Chung, et al., 2012). This agreement
with the Pseudo-second order model assumes the chemical sorption being rate controlling
step which involve valence forces between the dye and the adsorbent through sharing or
exchange of electrons (Bedin et al., 2016; Xiong et al., 2010). It was also observed from
Figure 4.16 (c) that a good linear plot is obtained from the regression of qt versus t0.5 (R2
= 0.914) , however the line does not pass through the origin, suggesting that the external
mass transfer might be also significant in the adsorption process as well as the
Univers
ity of
Mala
ya

143
intraparticle diffusion (Ma et al., 2012). This observation is confirmed by the large
intercepts of linear portion of the plot (C = 101.79) which indicates the more involvement
of the CNM-PAC surface in MB removal and supports the crucial effect of the boundary
layer diffusion (Salama, 2017).
Table 4.25: Linearized equations of studied kinetic models for MB adsorption
on CNM-PAC.
Model Equation Parameters Values
Pseudo-First-Order
ln(𝑞𝑒 − qt) = 𝑙n𝑞𝑒 − 𝐾1t R2
X2
0.884
16.91
K1
qe
0.012
51.79
Pseudo-Second-Order
𝑡
𝑞𝑡=
1
𝐾2𝑞𝑒2
+1
𝑞𝑒𝑡
R2
X2
0.998
5.75
K2
qe
6.34x10⁻⁴
163.93
R2 0.914
Intraparticle diffusion 𝑞𝑡 = 𝐾𝑑𝑡
12 + 𝐶
X2 7.1
Kd 4.08
C 101.79
qe (experimental) = 166.11 mg/g
Univers
ity of
Mala
ya

144
Figure 4.16: Fittings of different kinetics models for MB adsorption on the
synthesized CNM-PAC; (a) Pseudo-first order, (b) Pseudo-second order and (c)
Intraparticle diffusion at optimum conditions.
Univers
ity of
Mala
ya

145
4.4.5 Adsorption isotherms
Studying the isotherm is important to determine the adsorption equilibrium correlation
that can be helpful for designing purposes and evaluating the behavior of adsorbent
systems (Zhao et al., 2013). The equilibrium adsorption data was tested using the
Langmuir, Freundlich and Temkin models as shown in Figures 4.17 (a), (b) and (c),
respectively. Also, the linearized equations of the studied models and related parameters
are presented in Table 4.26. As can be observed from the results, Freundlich isotherm
shows respectable adsorption favorability of MB onto CNM-PAC adsorbent under
experimental conditions which is confirmed by the values of Freundlich constants ( RL=
0.031 and n = 2.8) (Feng et al., 2012). However, Langmuir isotherm produced better fit
with the highest correlation coefficient (R2 = 0.989) as compared to the other isotherms
at a significant maximum adsorption capacity of 250 mg/g. This is an indication of a
monolayer adsorption of MB onto the homogeneous surface of the prepared adsorbent.
In addition, according to n value (>1) obtained from Freundlich model the adsorptive
behavior is dominated as a physical adsorption with several adsorption energies related
to different sites (Marrakchi et al., 2017). A similar equilibrium result was obtained for
the adsorption of MB onto low cost bio-waste adsorbent (Krishni et al., 2014).
The validity of models was determined also by calculating the standard deviation (S.D.,
%) using Equation 4.9:
𝑺. 𝑫. % = √∑(𝑞𝑒𝑥𝑝−𝑞𝑐𝑎𝑙)/𝑞𝑒𝑥𝑝
𝑛−1 (4.9)
where the subscripts exp and cal refer to the experimental and the calculated data, and
n is the number of data points. The S.D. value for Langmuir model was the smallest
suggesting that the model is closely fitted with the experimental results. Thus, it can be
argued that Langmuir isotherm can preeminently describe the adsorption of MB on CNM-
Univers
ity of
Mala
ya

146
PAC. A comparison of the maximum adsorption capacity of MB on various adsorbent is
listed in Table 4.27.
Figure 4.17: The isotherm plots for MB adsorption on CNM-PAC following (a)
Langmuir, (b) Freundlich, and (c) Temkin model.
Univers
ity of
Mala
ya

147
Table 4.26: Linearized equations of studied isotherm models for MB adsorption
on CNM-PAC.
Model Equation Parameters Values
Langmuir
𝐶𝑒
𝑞𝑒=
1
𝐾𝐿 𝑞𝑚 + (
1
𝑞𝑚) 𝐶𝑒
qm 250.0
KL 0.645
R2 0.989
RL 0.031
S.D % 13.80
Freundlich
𝑙𝑛𝑞𝑒 = 𝑙𝑛𝐾𝑓 +
1
𝑛 𝑙𝑛𝐶𝑒
R2
Kf
n
S.D %
0.855
85.038
2.832
18.89
Temkin 𝑞𝑒 = 𝐵1𝑙𝑛𝐾𝑇 + 𝐵1𝑙𝑛𝐶𝑒 R2
KT
B1
S.D %
0.859
2.695
39.401
25.69
Table 4.27: Comparison between the maximum adsorption capacity (qm) of
CNM-PAC and other reported adsorbents for MB removal.
Adsorbent qm (mg/g) Reference
CNM-PAC 250 The present work
CA-APT 207.48 (Zhang et al., 2015)
MMT@C nanocomposites 194.2 (Dalaran et al., 2009)
Attapulgite / bentonite (50%) 168.63 (Liu et al., 2014)
Titanate nanotubes 133.33 (Xiong et al., 2010)
Activated carbon/NiFe2O4 182.82 (Jiang, Liang, et al., 2015)
Powdered activated carbon 91.0 (Yener et al., 2008)
Oxidized MWCNTs 188.68 (Li, Du, et al., 2013)
CNTs from acetylene cracking 35.4 - 64.7 (Yao et al., 2010)
Activated carbon/OPW 90.1 (Ahmad, Loh, & Aziz, 2007)
Luffa cylindrica fibers 49.0 (Demir et al., 2008)
Palygorskyte 50.80 (Al-Futaisi, Jamrah, & Al-Hanai, 2007)
halloysite nanotubes (HNTs) 84.32 (Zhao & Liu, 2008)
Univers
ity of
Mala
ya
148
4.4.6 Mechanisms
The mechanism for adsorption of MB involves the migration of dye from bulk of the
solution to the surface of the adsorbent CNM-PAC followed by diffusion through the
boundary layer to the surface of the adsorbent. Then the dye is adsorbed on an active site
on the surface of the adsorbent and diffused by intraparticle diffusion into the interior
pores. The molecular size (width, depth and thickness) of MB according to Pelekani and
Snoeyink, are equal to 1.43, 0.61, and 0.4 nm, respectively (Pelekani & Snoeyink, 2000).
These dimensions allow the dye to easily access within the porous structure of CNM-
PAC. In addition, the substituent groups present in CNM-PAC play an important role in
the adsorption capacity and the removal mechanism of the adsorbates.
The high adsorption of MB on CNM-PAC may be attributed to the π-π stacking
interactions between the electron of the carbon surface and the free electrons of the dye
molecule (aromatic rings and –N=N– or –N=C–C=C– bonds). Carbon based materials
has amphoteric character; thus, depending on the pH of the solution, their surfaces might
be positively or negatively charged. At the working pH11 in our study the pH > pHpzc
(PZC = 9.2), and pH > pKa (pKa = 3.8); subsequently the carbon surface becomes
negatively charged favoring the adsorption of the dominant dissociated MB cationic
species (Jung et al., 2016). Thence, the good adsorption performance of the prepared
CNM-PAC is attributed to the existence of two adsorption mechanisms involving
dispersive and electrostatic interactions. Not to mention, the results obtained from the
kinetic studies indicated to the involvement of other mechanisms in MB adsorption on
CNM-PAC adsorbent along with the intraparticle diffusion.
4.4.7 Summary of the adsorption of MB onto CNM-PAC
The CNM-PAC synthesized at the optimum growth conditions was used to perform
optimization study on removal of MB from water using CCD experimental design. The
Univers
ity of
Mala
ya

149
optimum conditions were pH 11.0, adsorbent dose 12.3 mg and contact time 120 min.
Three kinetic models, which are: Pseudo-first order, Pseudo-second order and
intraparticle diffusion were tested. The Pseudo-second-order model was ideally fitting the
experimental data of MB adsorption on CNM-PAC with R2 = 0.998, X2 = 5.75, qe =
163.93 (mg/g) and K2 = 6.34x10⁻⁴ (g/mg min). Also, the Langmuir, Freundlich and
Temkin adsorption isotherm models were studied. The MB adsorption system showed
the best agreement with Langmuir model with R2 =0.989, RL = 0.031, qm = 250.0 mg/g,
KL = 0.645 and S.D. = 13.8. It was observed lower adsorption capacity of MB at lower
pH value which could be due to the protons competition with the cationic MB for the
available adsorption sites on the CNM-PAC hybrid surface. Thus, the highest removal
efficiency of MB was achieved at the optimum pH (11) which is higher than the pKa value
of MB, leading to conclude that the adsorption mechanism of MB was governed by the
strong electrostatic interactions between the cations of the MB and the negatively charged
surface of CNM-PAC (pH > pHPZC).
Univers
ity of
Mala
ya
150
CHAPTER 5: CHARACTERIZATION OF CNM-PAC SYNTHESIZED FROM
METHANE DECOMPOSITION
The synthesis of CNM-PAC was adopted in parallel with growth optimization to
achieve the best production yield and pollutant removal efficiency. The CNM-PAC
produced under the optimal conditions, namely: reaction temperature of 933ºC, reaction
time of 20 min and H2/CH4 of 1.0. Based on the optimization study, the selected samples
were characterized to identify their morphology, surface area, surface charge and surface
functional groups.
5.1.1 Morphology and surface elemental analysis
The depicted FESEM and TEM images of the impregnated powder activated carbon
(Ni-PAC) before the growth reaction are presented in Figure 5.1 (a) and (b). The PAC
support has irregular pores and rough areas with well dispersion of Ni particles. It is
obvious that the catalyst was successfully trapped into PAC. The large surface area and
high porosity of PAC prevent the agglomeration of the catalyst particles and help to
produce good catalyst distribution. Furthermore, the low concertation of utilized catalyst
(1%), confirmed the catalyzing role of PAC in the formation of CNM (Song et al., 2010)
and produced more uniform distribution of Ni crystals. Thus, the sintering of Ni clusters
will be reduced by creating uniform bed temperature along with medium hot spots
(Allaedini, Tasirin, & Aminayi, 2015; Colomer et al., 2000).
The images of the synthesized CNM-PAC after CH4 decomposition at the optimized
growth conditions are shown in Figure 5.2 (a) and (b). The porous structure of the
resulting CNM-PAC hybrid was revealed by FESEM image. The network structure
composed of hierarchical pores: the macropores with the diameter in the range of several
micrometres are embedded in PAC matrix and their solid walls are composed of randomly
Univers
ity of
Mala
ya

151
oriented CNTs. The short intercalated CNTs are well dispersed and stabilized uniformly
in the PAC matrix.
Figure 5.1: (a) FESEM and (b) TEM images for Ni-PAC before growth
reaction.
TEM images reveals the internal structure of CNTs and CNFs attached to amorphous
carbon of the PAC surface. PAC possesses an abundant porous structure hence the
produced CNMs are liable to insert into the pores of the activated carbon. The grown
Univers
ity of
Mala
ya

152
CNMs has groove-like feature microstructures and closely related to the porous structures
and surface conditions of the PAC support (Narkiewicz et al., 2010; Shah & Tali, 2016a).
Figure 5.2: (a) FESEM and (b) TEM images of CNM-PAC obtained at optimal
conditions.
Univers
ity of
Mala
ya

153
The dark spots in the TEM images represents the metallic catalyst clusters where the
carbon atoms build up to form the CNTs and other CNMs structure around it.
Furthermore, conducting the growth of CNM on PAC at high reaction temperatures was
suitable and unlike other studies, the Ni catalyst was not deactivated at higher
temperatures (Chai et al., 2011; Villacampa et al., 2003). Thus, utilizing the PAC as a
support is proved to be effective even at high temperatures due to its role in minimizing
catalyst deactivation by creating a PAC network around Ni catalyst (Taleshi et al., 2013).
EDX analysis was performed for PAC, Ni-PAC, and the optimized CNM-PAC (Figure
5.3 (a), (b), and (c)). The elemental surface analysis of PAC substrate contains only
carbon and oxygen-content (Figure 5.3 (a)). The results demonstrate that the intensity of
carbon peak is very high, indicating that the main component of the support is carbon,
the highest percentage recorded was for carbon (91.6%). However, trace oxygen was
detected in most of the samples because of oxygen adsorption from the surrounding
environment during processing. In Ni-PAC (Figure 5.3 (b)), the nickel particles
contributed to a total content of 2.1%. The Ni content has fallen after growth to 0.9% as
seen in the synthesized CNM-PAC (Figure 5.3 (c)). The decrease in content of Ni catalyst
after the growth of CNM could be used as evidence interaction between H2/CH4 gases
and Ni catalyst, leading to the formation of carbon species on the metal surface (Bigdeli
& Fatemi, 2015). In the meanwhile, the SEM results also illustrated that most big Ni
particles disappeared and some small uniform Ni particles were dispersed on the surface
PAC support. Figure 5.3 (c)) also illustrates an increase in the carbon content after the
formation CNM-PAC hybrid. The conversion of methane which was accelerated by the
existence of the Ni catalyst contributes to the higher yield of carbon.
Univers
ity of
Mala
ya

154
Figure 5.3: EDX analyses for (a) PAC, (b) Ni-PAC and (c) CNM-PAC
synthesized at optimal conditions.
5.1.2 Raman spectroscopy
Raman spectroscopy was conducted to identify the characteristic of the carbon hybrid
based nanostructure. The Raman spectra for PAC, Ni-PAC and the synthesized CNM-
PAC at the optimum conditions is presented in Figure 5.4. The figure shows two obvious
sharp peaks with high intensity near 1360 cm−1 and 1590 cm−1 and broad peaks at
2500−3200 cm−1 wavelength. The peak at 1300-1400 cm -1 is the D band which is related
to defective nature of the obtained structure which might have originated from the
Univers
ity of
Mala
ya

155
distorted hexagonal sp3 carbon network along with the Ni particle-size effects in addition
to the effect of the presence of amorphous carbon (Dresselhaus et al., 2010; Lee et al.,
2013). While the G band which is raised from the stretching of C═C bond in graphitic
materials and related to the common tangential mode to all sp2 carbon system is detected
at 1550-1680 cm-1 (Costa et al., 2008). Moreover, the degree of carbon-containing defects
in the carbon-based nanostructure by determining the ratio of intensities of D to G band
(ID/IG).
Figure 5.4: Raman spectra of Ni-PAC and CNM-PAC.
For Ni-PAC, the doping of Ni did not obstruct the overall structure of PAC, since it
shows an ID/IG value of 0.81. The Raman shift of CNM-PAC is composed of the two
characteristic D and G peaks. The radial breathing mode (RBM) (< 400 cm-1), which is
identifying the SWCNTs was not detected, suggesting that the CNM-PAC may possessed
a multiwall structure with large diameter (Ziebro et al., 2010). It is noted the high intensity
of the G band, which can be explained by the fact that more sp2 carbons are formed. The
ID/IG ratio for the CNM-PAC obtained from methane decomposition was of 0.93,
Univers
ity of
Mala
ya

156
similarly to a previously reported study (Izadi et al., 2011). In addition, the ID/IG ratio of
CNM-PAC hybrid shifts to some higher extent in comparison with PAC and Ni-PAC,
reflecting a significant interaction between CNM and PAC and increased functionalities
on the obtained hybrid (Sui et al., 2012). The appearance of unusually shaped 2D (G΄ )
peak at 2500−3200 cm−1 is a graphitic index due to strain structure-induced effects and
the higher position corresponds to a larger crystal lateral thickness which propose a better
stacking order for the graphitic structures. (Hernandez et al., 2013; Zhou, Liu, et al.,
2016).
5.1.3 Thermogravimetric analysis (TGA)
The oxidation behavior was investigated using thermal gravimetric analysis (TGA)
under oxygen flow rate of 50 mL/min at temperature range between 25 to 800 °C with a
heating rate of 10 °C/min. It is well known that the well graphitized carbon structures
require high oxidizing activation energies. All samples PAC, Ni-PAC and CNM-PAC
exhibited single step degradation as displayed in Figure 5.5 and no weight loss was
observed for Ni-PAC or CNM-PAC at a degassing temperature range of 100 to 400oC,
suggesting the absence of oxygenated functional groups (Hruzewicz-Kołodziejczyk et al.,
2012). The oxidation temperatures of CNMs characterize thermal stability and describe
the differences in their crystalline properties. The TGA profile for each sample can be
characterized by three main regions: (i) initial gradual loss of 2 % for Ni-PAC and CNM-
PAC and ~ 8 % for PAC is observed in the first region because of the adsorbed water,
followed by constant declines of the weight to the onset combustion temperature at 430.3,
489.4 and 507.2 ºC for PAC, Ni-PAC and CNM-PAC, respectively. (ii) the feature of the
second region is presented by a steep drop due to elimination of the functional groups
(Zhang et al., 2009) and (iii) the final combustion region for oxidizing the remaining
amorphous carbon which starts at temperature higher than 500ºC (Zhou et al., 2014b).
Univers
ity of
Mala
ya
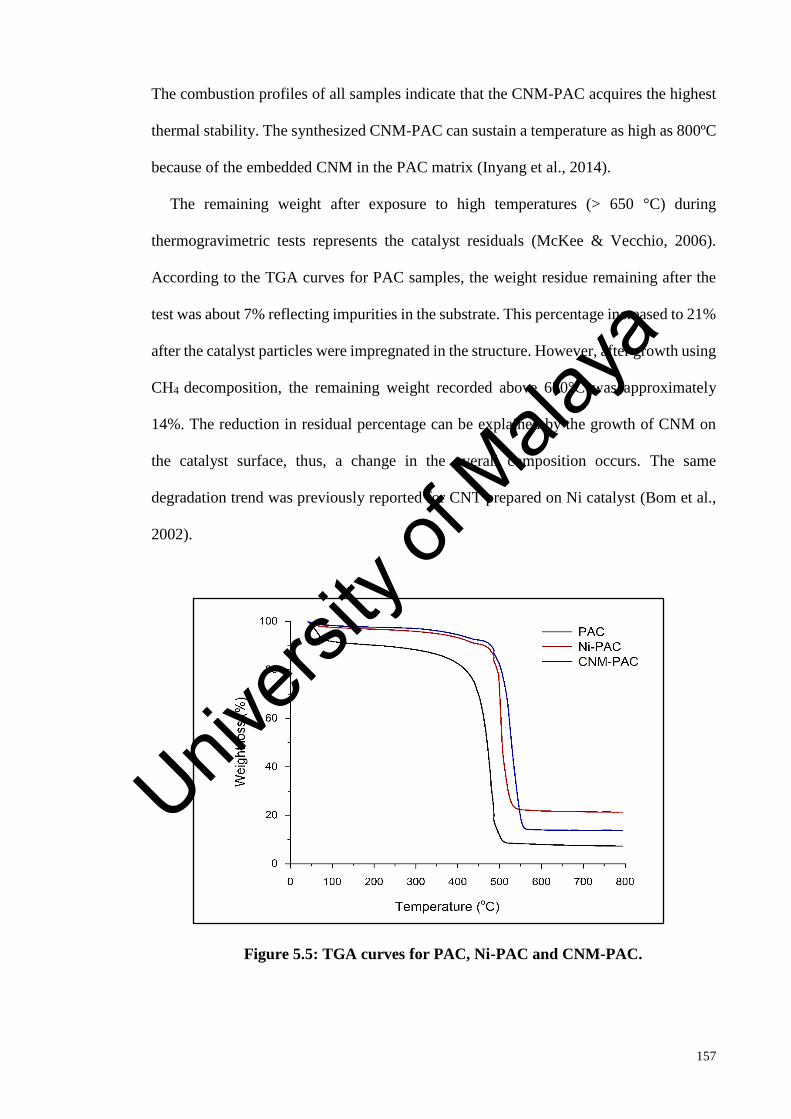
157
The combustion profiles of all samples indicate that the CNM-PAC acquires the highest
thermal stability. The synthesized CNM-PAC can sustain a temperature as high as 800ºC
because of the embedded CNM in the PAC matrix (Inyang et al., 2014).
The remaining weight after exposure to high temperatures (> 650 °C) during
thermogravimetric tests represents the catalyst residuals (McKee & Vecchio, 2006).
According to the TGA curves for PAC samples, the weight residue remaining after the
test was about 7% reflecting impurities in the substrate. This percentage increased to 21%
after the catalyst particles were impregnated in the structure. However, after growth using
CH4 decomposition, the remaining weight recorded above 650°C was approximately
14%. The reduction in residual percentage can be explained by the growth of CNM on
the catalyst surface, thus, a change in the overall composition occurs. The same
degradation trend was previously reported for CNT prepared on Ni catalyst (Bom et al.,
2002).
Figure 5.5: TGA curves for PAC, Ni-PAC and CNM-PAC.
Univers
ity of
Mala
ya

158
5.1.4 Surface chemistry analysis (FTIR) for BPA adsorption
The chemical reactivity of the adsorbent surface in term of the attached functional
groups is a requisite feature to assess its adsorption efficiency (Stobinski et al., 2010).
Figure 5.6 displays the FTIR spectra of BPA and the CNM-PAC before and after BPA
adsorption. Obvious peaks were detected on the carbon surface (CNM-PAC) before BPA
adsorption at around 2350 cm-1 and within the wavenumber range of 2800 – 2900 cm-1,
reflecting the presence of aromatic sp2 C–H stretching vibration and the asymmetric and
symmetric stretching vibrations of CH2, respectively (Koduru et al., 2016). The peak at
1515 cm-1 reflects the existence of carbon double bonds (C=C) in the graphitic structure.
The band at ~1710 cm−1 with a high intensity can be attributed to the stretching vibration
of a carboxylic group (Jung et al., 2015). The peaks at 1200 and 3450 cm-1 are associated
with O–H. Some characteristics related to BPA molecule were also detected on the
adsorbent surface, including aromatic –C=C– bonds (at 1600–1400 cm-1), benzene ring –
C–H bonds (at 900–650 cm-1), phenolic –C–O bonds (at 1250 cm-1), CH stretching
vibration (at 2990 cm−1), and –CH3 stretching vibrations at 1387 cm-1 (Jung et al., 2015).
FTIR spectra of CNM-PAC after BPA adsorption show an intense peak at 3747 cm-1
which can be attributed to the O–H stretching vibration originating from chemisorbed
phenolic groups. The wide peak at 3412 cm−1 corresponding to the stretching vibration
of O−H groups of CNM-PAC shifted to 3360 cm−1. The shift indicated that the hydroxyl
take part in the adsorption as hydrogen bonding sites. Also, the peak of carbonyl shifted
from 1719 to 1723 cm−1 after adsorption, indicating that carbonyl is a proton acceptor as
well. The peaks at 1150 cm−1 which is assigned to the stretching vibration of C−C bonds
had a small shift toward larger wavenumber (from 1160 to 1168 cm−1 for C−C bonds).
This could be believed to be the influence of hydrophobic interactions. The intensity of
the bands in the region between 500 and 850 cm-1, indicative of the C–H bending in
Univers
ity of
Mala
ya

159
substituted aromatic rings, is increased with the presence of BPA (Bautista-Toledo et al.,
2014).
Figure 5.6: FTIR spectra of BPA, CNM-PAC before, and after BPA adsorption.
5.1.5 Surface chemistry analysis (FTIR) for MB adsorption
Figure 5.7 show the FTIR spectra in the range 4000–400 cm−1 for the CNM-PAC, free-
MB and MB-loaded adsorbent (CNM-PAC-MB) sample. The bands from 1400 to 1735
cm−1 were assigned to the C=O stretch mode of carboxylic acid and carbonyl moieties.
The bands for CNM-PAC and CNM-PAC-MB at (3500 to 3700) cm−1 were due to
hydroxyl groups (Yao et al., 2010). CNM-PAC adsorption presents the existence of
symmetric stretching vibration of C=O groups band at 1420 cm−1 and the band at 1580
cm-1 is assigned to C=C skeletal stretching (Colomer et al., 2000). The two CH2 stretching
bands at 2918 and 2850 cm−1 were assigned to asymmetric and symmetric stretching of
the CH2 groups, respectively, which presented the same wavenumbers before and after
Univers
ity of
Mala
ya

160
adsorption, indicating that this group did not participate in the adsorption process. Small
bands at 1734 and 1729 cm−1, before and after absorption, respectively, were assigned to
the carbonyl groups of carboxylic acid. The band at about 1110 cm-1 represents the C-O
vibration of various oxygen-containing groups (Wang, Wang, et al., 2015). The peaks at
2922 and 2855 cm-1 in CNM-PAC are related to the symmetric alkane stretching of C−H
bond which become less strong after the adsorption of MB (Yao et al., 2010).
The spectrum of MB displays several bands in the region between 675 and 900 cm−1
corresponding to axial-deformation vibrations of the C−H bond in the aromatic rings. The
C−C axial deformation vibrations and the angular deformation bands in the C−H plane
for aromatic compounds which was observed in the CNM-PAC spectrum, also appear in
MB spectrum due to the presence of three condensed rings in the MB structure. The bands
in the regions 1020-1250 cm−1 and 1266–1342cm−1 were attributed to the axial
deformation vibrations of the C−N bond of aliphatic amines and to the axial deformation
of the C–N bond of aromatic amines, respectively (Auta & Hameed, 2012a).
The spectrum for MB adsorbed onto CNM-PAC shows new bands when compared to
the spectrum of CNM-PAC alone. It can be observed the presence of the adsorbed dye as
well as some bands previously described for CNM-PAC and MB. The bands between
3300 and 3600 cm−1, are assigned to both phenolic groups and carboxylic acid, decreases
in intensity because these groups interact with MB. For this reason, the band between
1550 and 1650 cm−1 can be attributed to the asymmetric axial deformation of the
carboxylate anion, and the weaker band at 1400 cm−1 can be attributed to the symmetrical
axial deformation of the same anion (Li, Du, et al., 2013). The vibration of aromatic ring
C-N can be clearly observed in CNM-PAC at the peak 1398 cm-1, became weaker after
its adsorption onto the CNM-PAC adsorbent. Furthermore, the band at 1454 cm−1 present
on the CNM-PAC adsorbent that was assigned to the ring mode of the aromatic ring was
Univers
ity of
Mala
ya

161
shifted to higher wavenumbers (1465 cm−1), and the relative intensity of this band was
also remarkably diminished after adsorption of the dye (Li, Du, et al., 2013; Ma et al.,
2012). The MB is a planar cationic dye molecule, therefore can be easily adsorbed by
CNM-PAC by π-π stacking interactions (Cottet et al., 2014; Jiang, Xiao, et al., 2015;
Manilo et al., 2016). Table 5.1 summarizes the main functional groups detected on the
as-synthesized CNM-PAC and after removal BPA and MB pollutants.
Figure 5.7: FTIR spectrums for free MB and CNM-PAC before and after
adsorption.
Univers
ity of
Mala
ya

162
Table 5.1: Some of the predicted functional groups on the surface of synthesized
CNM-PAC before and after adsorption of organic pollutants.
Expected functional groups Involving adsorbents
Overlapping of O−H and N−H stretching All (3187 cm-1)
C−H stretching ALL (2800-2900 cm-1)
C=O ALL (1727 cm-1)
C=C−C Aromatic ring stretch ALL (1622 cm-1)
O=C−O Carboxyl All (1383 cm-1)
O−H (phenolic) CNM-PAC-BPA (3747 cm-1)
Phenolic −C−O bonds CNM-PAC-BPA (1250 cm-1)
−CH3 stretching CNM-PAC-BPA (1387 cm-1)
NH2 group CNM-PAC-MB (1463 cm-1)
C−N CNM-PAC-MB (1490, 1394 cm-1)
Aromatic ring vibration of MB CNM-PAC-MB (1604 cm-1)
CH3 group vibrations CNM-PAC-MB (1354, 1342 cm-1)
5.1.6 BET Surface area
The surface area of the substrate, catalyst impregnated substrate and the synthesized
CNM-PAC were evaluated using the BET method. BET surface area were studied via
nitrogen adsorption-desorption experiments (Shah & Tali, 2016b). Table 5.2 lists the
surface area of various samples for PAC, Ni-PAC, and CNM-PAC. The loading of Ni
onto PAC support decreased the pore volume of the support, likely due to the blockage
of the PAC pores by the impregnated catalyst resulting in a reduced surface area.
However, the growth of CNM on Ni-PAC has enhanced the surface area to reach 164.6
m2/g due to the additional active surface added on the PAC. Song et al. results proposed
that the good activity of activated carbon to catalyze the formation of CNTs was attributed
to their porous structure which is likely similar to the catalytic effects of the CNTs
themselves (Song et al., 2010). The total pore volume of CNM-PAC reached 0.29 cm3/g
compared to PAC (0.09 cm3/g). Thus, an excellent sorption capacity is expected for our
material due to the enhancement of the surface area. Allaedini et al., (2015) reported that
the transition metals such as Fe and Ni are effective in removing organic and inorganic
Univers
ity of
Mala
ya

163
contaminants in water and are used as catalysts for promoting pollutant removal. This is
due to the small particle size of the impregnated catalyst and to their effect in enhancing
the surface area which will provide a sufficient interaction between the catalyst and the
pollutant molecules (Allaedini, Tasirin, et al., 2015).
Table 5.2: Summery of BET results for PAC, Ni-PAC and CNM-PAC.
Property PAC Ni-PAC CNM-PAC
BET surface Area (m2/g) 101.1 97.2 164.6
Total pore volume (cm3/g) 0.09 0.07 0.29
Average pore diameter (ºA) 34.89 21.29 96.19
5.1.7 Point of zero of charge (PZC)
Since carbon based materials are amphoteric in nature due to the various functional
groups on their surfaces and the presence of a π-electron system that confers them with
Lewis basic properties, it is always important to evaluate their point of zero charge at
which the zeta potential is zero. The points of zero charge (pHpzc) of CNM-PAC was
established by means of pH shift analysis by adding 20 mg of the adsorbent to several
Erlenmeyer flasks containing 20.00 mL of 0.050 mol /L NaCl. A range of initial pH (pHi)
values of the prepared solutions were adjusted from 2 to 12 by adding either HCl and
NaOH, which were securely capped immediately. The suspensions were shaken to reach
equilibrium for 48 h and centrifuged at 4000 rpm for 10 min. The final pH (pHf) values
of the supernatant liquid were recorded. The value of pHpzc is the point where the curve
of pH (pHf − pHi) versus pHi crosses the line equal to zero (Tran et al., 2017).
From Figure 5.8 the point of zero charge (pHPZC) of the CNM-PAC was calculated to
be about 9.2. This value indicated that the synthesized CNM-PAC has a basic chemical
nature with a negative charge at pH > 9.2. In this context, the decrease of the BPA
Univers
ity of
Mala
ya

164
adsorption at basic pH ranges (pH > 10) is attributed to the repulsive electrostatic
interaction between the negatively charged surface of CNM-PAC (pH > pHpzc) and the
bisphenolate anion. Therefore, it can be argued the mechanism of BPA removal could be
mainly due to the hydrophobic π-π dispersion interaction between the aromatic ring of
BPA and the aromatic structure of the graphene layers of the CNM-PAC adsorbent
(Bohdziewicz & Kamińska, 2013). However, for the removal of MB at the optimum pH
11, The negatively charged surface of the CNM-PAC (pH > pHPZC) can enhance the
adsorption properties of the positively charged MB cations by the adsorbents through
electrostatic forces of attraction (Zhang, Zhang, et al., 2010).
Figure 5.8: Determination of the point of zero charge of the CNM-PAC by the
pH drift analysis.
5.1.8 Zeta potential
Zeta potential is the potential difference between the stationary fluid layer attached to
the nanoadsorbent particles and the dispersion medium (Kyzas & Matis, 2015). The zeta
potential presented in Table 5.3 was determined by dispersing 10 mg of PAC, Ni-PAC
and CNM-PAC in 20 mL of deionized water (Li et al., 2008). Negative zeta potential
-3.5
-3
-2.5
-2
-1.5
-1
-0.5
0
0.5
1
0 2 4 6 8 10 12 14
pH
f – p
Hi
pH
Univers
ity of
Mala
ya

165
value for PAC before catalyst impregnation and thermal treatment is well understood.
Most of the PAC surface is covered by oxygen containing groups such as carboxyl,
carbonyl, alcohol and ethers, which were confirmed by the FTIR analysis, generated
during the PAC production and acid washing. Thus, the negative zeta potential can be
explained due to the dissociation of these carboxyl (COOH) and carbonyl (C=O) groups.
Nevertheless, the Ni-impregnated PAC and CNM-PAC showed a noticeable reduction in
its zeta potential along with positive values. This observation is expected due to the
thermal treatment process including calcination and reduction. Heat-treatment seems to
have removed some oxygen-containing surface groups as evidenced by the low oxygen
ratio in the elemental analysis results. Reduction of oxygen groups after heat-treatment
has also been reported by Pradhan and Mene´ndez (Menendez et al., 1996; Pradhan &
Sandle, 1999). In addition, the positive zeta potential and the CNM-PAC basicity could
be attributed to the electron-donor-acceptor (EDA) complex. Accordingly, the π-
electron-rich regions (oxygen-free carbon) located in the basal planes, can absorb H3O+
ions to produce surface with positive charge and basic properties (Li, Liu, et al., 2014;
Montes-Moran et al., 1998). The removal of oxygen not only renders an activated carbon
surface more basic but also less polar, a desirable merit when the adsorption of organic
contaminants from aqueous solution is the primary objective (Li, Quinlivan, & Knappe,
2002). Meanwhile, the adsorption of BPA on the CNM-PAC via the hydrophobic
interaction has increased the zeta potential absolute value by increasing the functionality
of the adsorbent surface through the addition of more oxygen-containing groups.
However, the enhancement in the absolute value of zeta potential was more substantial
for the interaction of CNM-PAC with MB. Besides the hydrophobic interaction, MB can
stably be adsorbed on the CNM-PAC through charge-transfer in which CNM-PAC is the
Univers
ity of
Mala
ya

166
electron donor and the polynuclear aromatic MB is the electron acceptor (Wang, Chen,
& Chen, 2014; Yan et al., 2005).
Table 5.3: Zeta potential results for PAC and the different carbon structures
produced
Sample Zeta potential
PAC - 42.6
Ni-PAC + 1.67
CNM-PAC + 9.64
CNM-PAC-BPA - 13.7
CNM-PAC-MB - 46.8
5.1.9 Summary of characterization
The synthesized CNM-PAC at the optimum growth conditions was characterized with
FESEM and TEM to verify the growth of CNM on PAC substrate and to identify surface
morphology. The synthesized multi-structure possessed a graphitic structure with high
surface area and large pore volume. The low fraction of catalyst would prevent catalyst
aggregation and produce more uniform distribution of Ni particles.
The synthesized CNM-PAC can sustain a temperature as high as 800ºC which is
attributed to the embedded CNM in the PAC matrix. The chemical reactivity of the
adsorbent surface in term of FTIR analysis displayed the characteristic functional groups
and confirmed the adsorption of BPA and MB.
The BET study for CNM-PAC showed an improvement in specific surface area when
compared with the raw PAC. In addition, the positive zeta potential of the CNM-PAC
could be attributed to the electron-donor-acceptor (EDA) complex. Univ
ersity
of M
alaya

167
CHAPTER 6: SYNTHESIZING AND ADSORPTION STUDIES FOR CNM-PAC
FROM ACETYLENE DECOMPOSITION
6.1 Screening of CNM-PAC synthesis conditions
Two sets of experimental design matrix were carried out for synthesizing CNM over
PAC substrate from acetylene pyrolysis by using response surface methodology (RSM).
The fabrication variables were changed according to the experimental runs. However, the
range of variables (growth temperature-A, growth time-B and feed stock gas ratio-C)
were preselected based on literature. The responses which were considered in this part as
follows 2:
1- YC2H2: CNM-PAC yield %
2- RVC2H2: removal percentage of MB
The DOE was used to evaluate the statistical parameters obtained from the model
regression analysis and estimate the surface contour plots constructed based on the
synthesizing conditions preparation variables and responses for each adsorbent-adsorbate
interaction at the optimal conditions.
6.1.1 DOE for production of CNM-PAC from acetylene decomposition
The CNM-PAC production conditions were optimized using a 2-level CCD with one
central point. Table 6.1 presents the experimental runs to cover the following parameter
ranges; temperature from 550 °C to 750 °C, time from 20 min to 60 min, and gas ratio
(H2/C2H2) from 1.0 to 4.0 (AlSaadi et al., 2011). The collected samples after growth
were weighed and the experimental yield (YC2H2) was calculated using equation (4.1). It
2 The formation of hybrid carbon nanomaterial by chemical vapor deposition: An efficient adsorbent for enhanced removal of
methylene blue from aqueous solution. Water Science and Technology Journal. 2018, 77 (6), 1714-1723.
Univers
ity of
Mala
ya

168
is observed that the highest yield of CNM-PAC synthesized from the decomposition of
C2H2 was (173 %).
6.1.2 Adsorption of MB for DOE Screening
The removal efficiency % of MB (50 mg/L) from water as a second response was
adopted onto the as-grown CNM-PAC samples to evaluate the optimum growth
conditions. The batch removal experiments were conducted on the CNM-PAC samples
produced from the DOE (Table 6.1) by preparing 11 shake flasks. Each flask contains 10
mg of as grown CNM-PAC sample and 50 mL of MB at pH of 6.0. The flasks were placed
in a mechanical shaker system for 120 min at room temperature with a shaking speed of
180 rpm. The experimental results of % removal efficiency was determined by applying
equations (3.4). It is observed that the CNM-PAC sample produced from run 2 had the
best performance in terms of MB removal (95.5 %).
Table 6.1: Experimental CCD data for the synthesis parameters from C2H2
decomposition.
Run
Variables Response
A
Temperature
ºC
B
Time
min
C
Gas
Ratio
CNM-PAC yield
YC2H2 (%)
MB Removal
RVC2H2(%)
1 650 40 2.5 114.0 88.6
2 550 20 1 150.0 95.5
3 550 60 4 89.8 89.3
4 750 60 1 155.0 77.5
5 650 20 1 89.4 87.2
6 550 20 4 148.0 90.4
7 750 20 4 142.0 73.3
8 750 20 1 90.3 70.6
9 650 60 1 160.0 85.6
10 750 60 4 120.0 65.7
11 550 60 1 173.0 91.7
Univers
ity of
Mala
ya

169
6.2 Statistical Analysis for the CNM-PAC growth
6.2.1 Analysis of variance (ANOVA) for the yield of CNM-PAC
Table 6.2 shows the ANOVA for the growth factors; temperature (A), duration of
synthesis (B), gases flow ratio (C), and their higher-order terms along with the CNM-
PAC yield as model response (YC2H2). The larger F value and smaller P value, the more
significant is the corresponding coefficient term (Kalavathy M et al., 2009). The F-value
for YC2H2 was 101 and the value of "Prob > F" is less than 0.05 confirming that the
model is statistically significant. The analysis of ANOVA for the YC2H2 response
displayed in Table 6.2 indicates that the effects of the linear terms of (A), (B), and (C) on
this response were significant, as their Prob > F values less than 0.05. However, the
combined effect of the growth temperature and reaction time with gas ratio (AC) and
(BC) are strongly significant (Prob > F = 0.0092 and 0.0037, respectively), thence it can
be concluded that they could be considered as major determinants of YC2H2 over the
studied range.
Table 6.2: ANOVA results for the yield of CNM-PAC growth from C2H2
decomposition.
*Source Sum of
Squares df
Mean
Square
F
Value
p-value
Prob > F
Model 0.692 8 0.0865 101 0.00986
A 0.0176 1 0.0176 20.4 0.0456
B 0.0522 1 0.0522 60.8 0.0160
C 0.0334 1 0.0334 38.9 0.0247
AB 0.0654 1 0.0654 76.1 0.0129
AC 0.0921 1 0.0921 107.0 0.00920
BC 0.231 1 0.231 269.0. 0.00370
A2 0.0197 1 0.0197 23.0 0.0409
A2 B 0.0428 1 0.0428 49.9 0.0195
R- Squared 0.998 Std.Dev.0.0293
Adj. R-Squared 0.988 C.V. % 0.604
Pred. R-Squared 0.929 Adeq. Precesion 26.4 *A: Temperature; (ºC), B: Time; (min) and C: H2/C2H2
Univers
ity of
Mala
ya

170
The final empirical model equation constructed of the actual parameters for YC2H2 (%)
is given in Equation (6.1):
𝐋𝐧 𝒀𝑪𝟐𝑯𝟐 % = 4.77 − 0.0468 A + 0.181 B − 0.0621 C + 0.0904 AB
+0.107 AC − 0.17 BC + 0.1 A2 − 0.179 A2B (6.1)
The coefficient of determination (R2) and coefficient of variation (CV) of were at
0.998 and 0.604 % respectively. The high R2 values and the low coefficient of variation
suggest that the obtained model provides a good estimation of the response YC2H2
(Angulakshmi et al., 2012). The predicted values of CNM-PAC yield % from C2H2
decomposition calculated from ANOVA model equation along with the experimental
values is listed in Table 6.3. In addition, a comparison of the experimental results with
the model values of YC2H2 is depicted in Figure 6.1. The plot demonstrates a good
convergence between the experimental and predicted values and the proposed model has
successfully created adequate correlation between the process variables.
Table 6.3: List of the actual and predicted values of the CNM-PAC yield from
C2H2 decomposition.
Run
No.
Actual Predicted
Yield % (ln Yield) Yield % ln (yield)
1 114.0 4.74 117.92 4.77
2 150.0 5.01 148.41 5.00
3 89.8 4.49 88.23 4.48
4 155.0 5.04 154.47 5.04
5 89.4 4.49 89.12 4.49
6 148.0 5.00 148.41 5.00
7 142.0 4.96 139.77 4.94
8 90.3
4.50 90.92 4.51
9 160.0 5.07 167.68 5.12
10 120.0 4.78 120.30 4.79
11 173.0 5.15 174.16 5.16
Univers
ity of
Mala
ya

171
Figure 6.1: Predicted vs. actual values for CNM-PAC yield (YC2H2 %).
6.2.2 Analysis of variance (ANOVA) for the removal of MB onto CNM-PAC
Each sample of the CNM-PAC suggested from the DOE was used as an adsorbent for
removal of MB from water and the results of the removal% were statistically analyzed
using the CCD method. By referring to the corresponding (ANOVA) results for MB
removal presented in Table 6.4, the Model F-value of 16.3 implies the model is
significant. There is only a 0.26 % chance that a "Model F-Value" this large could occur
due to noise. The desirable value of signal to noise ratio “Adeq Precision” for this
response showed a value of 10.3.
This model can be used to navigate the design space and it is represented by the
following Equation:
𝑴𝑩 𝑹𝑽𝑪𝟐𝑯𝟐 % = 86.7 − 10.0 A − 1.08 B − 1.77 C − 0.0.967 BC +
4.87 A2 (6.2)
Univers
ity of
Mala
ya

172
where RVC2H2 % is the removal percentage of MB from water while, A, B and C are
temperature of growth (ºC), time (min) and gas ratio (H2/C2H2), respectively.
Table 6.4: ANOVA results for MB removal % for CNM-PAC growth
optimization.
*Source Sum of
Squares df
Mean
Square
F
Value
p-value
Prob > F
Model 930.0 5 186.0 16.3 0.00407
A 806.0 1 806.0 70.8 0.000389
B 11.3 1 11.3 0.99 0.366
C 27.2 1 27.2 2.39 0.183
BC 8.97 1 8.97 0.788 0.415
A2 46.6 1 46.6 4.09 0.0490
R- Squared 0.942 Std.Dev.3.37
Adj. R-Squared 0.885 C.V. % 4.04
Pred. R-Squared 0.798 Adeq. Precision 10.3 *A: Temperature; (ºC), B: Time; (min) and C: H2/C2H2
Table 6.5 lists the predicted values of removal efficiency % calculated from ANOVA
model equation along with the actual values. Furthermore, the predicted values were
plotted against the experimental data (Figure 6.2). It can be seen a good relationship
between the experimental and predicted values since the data points has good distribution
near to the straight line. The coefficient of determination (R2) of MB removal % was
0.942. The high R2 values and the low coefficient of variation (CV= 4.04 %) suggest that
the obtained model provides a good estimation of the response which can be reproducible
as long CV values are not greater than 10% (Angulakshmi et al., 2012).
Univers
ity of
Mala
ya

173
Table 6.5: List of the actual and predicted values of the MB removal efficiency.
Run No. RVC2H2%
Actual Predicted
1 88.6 86.7
2 95.5 93.7
3 89.3 88.6
4 77.5 73.4
5 87.2 88.0
6 90.4 92.1
7 73.3 72.1
8 70.6 73.7
9 85.6 88.3
10 65.7 68.0
11 91.7 93.5
Figure 6.2: Predicted values vs. actual values MB removal response.
Univers
ity of
Mala
ya

174
6.2.3 Effects of reaction temperature, reaction time and gas Ratio
The effects of the process parameters on YC2H2 were investigated to determine the
conditions that favored the growth of carbon nanomaterials on the PAC substrate. The
interaction effects of the process parameters on the yield were graphically illustrated by
RSM plots as a function of two independent parameters (Figure 6.3). The effects of
reaction temperature and time on the product yield at fixed gas ratio (1.0 and 4.0) were
displayed in Figure 6.3 (a) and (b). There was a notable increase in YC2H2 with increasing
reaction temperatures from 550 to 650°C. A temperature increase from 650 to 750 ºC led
to small reduction in the yield. Furthermore, the plots showed that, the greatest amount
of CNM-PAC percentage is observed at low growth temperature. In addition to the fact
that Ni possess low melting point among other transition metals, these observations
suggest that PAC is an effective support for Ni catalyst even at higher temperature and
deactivation of Ni catalyst can be minimized by creating PAC network around the Ni
catalyst. These findings agree with those reported in previous studies (Aiello et al., 2000;
Reshetenko et al., 2003; Seidel et al., 2004).
Figure 6.3 (c) and (d) showed the effects of reaction temperature and gas ratio on
YC2H2 at fixed reaction time (20 and 60 min). The effect of gas ratio on the yield was
insignificance for growth duration 20 min, as the higher yield was seen at almost the same
at gas ratio 1.0 and 4.0. It was well known that the presence of higher H2 gas along with
C2H2 could facilitate suppression of catalyst poisoning effect which in turn results in
increased yield of the CNTs (Taleshi et al., 2013), however, the lower observed yield in
CNM-PAC at high hydrogen concentration is due to the competition between H2 and
C2H2 for the metallic surface sites. Not to mention that the high hydrogen fraction would
affect the reaction kinetics and suppress the C2H2 decomposition (Jung et al., 2001; Zhang
et al., 2017). It is worthy to point out that the present study demonstrated that using PAC
Univers
ity of
Mala
ya

175
as a support could potentially minimize the suppression of catalyst poisoning by
motivating Ni catalyst protection even at higher flow of H2/C2H2 gas. Also, a small YC2H2
was found at longer reaction time (60 min), therefore, lowering the reaction time will be
convenient for achieving the highest growth rate along with minimizing the carbonaceous
particle formation (Piao et al., 2002).
Figure 6.3 (e) and (f) show the effects of reaction time and gas ratio on YC2H2 at growth
temperature of 550 and 750 ºC. There was a steady increase in the yield with increasing
reaction time for the gas ratio of 1.0 at lower temperature (550 ºC). However, lower yield
is observed with gas ratio of 4.0 at higher temperature (750 ºC). This may be due to the
rapid reduction of metal oxides by H2 gas, thereby makes C2H2 to decompose at a faster
rate, subsequently, cause pyrolytic carbons deposition onto the active catalytic sites,
which in turn reducing the catalyst activity. Figure 6.3 (e) indicated that for growth
temperature of 550 ºC, a high reaction time was unfavorable at maximum gas ratio 4.0
that was used at ratio of 750. Typically, the rate of diffusion of carbon into the catalyst
decreases with increasing reaction time and eventually terminates to zero giving rise to
no additional increase in the yield (Chen et al., 2015; Sharma & Lakkad, 2009).
Univers
ity of
Mala
ya

176
Figure 6.3: Response surface plots for the effects of reaction temperature and
reaction time on CNM-PAC (YC2H2); at fixed gas ratio 1.0 (a) and 4.0 (b), effects of
deposition temperature and gas ratio at fixed reaction time 20 (c) and 60 min (d),
and effects reaction time and gas ratio at fixed growth temperature 550oC (e) and
750oC (f).
Univers
ity of
Mala
ya

177
6.2.4 Optimization of the selected parameters and study their interactive effects
on the CNM-PAC growth
The yield of the CNM-PAC response under the combination of the independent growth
variables was presented by RSM plots. Table 6.6 shows the optimization criteria and their
importance levels of the growth parameters along with the process response namely;
growth temperature, time, feed stock gas ratio and the yield of the CNM-PAC to select
the optimum conditions for the growth of CNM-PAC under C2H2 decomposition. The
plots showed that, the maximum growth percentage is observed when all the preparation
variables were set at low values. It is obvious from the plots (Figure 6.3 (a)) that
increasing the temperature above 560 ºC will cause the following: (i) reduction in the
yield and enhancement of the soot formation which may inhibit the growth process, (ii)
the ability to conduct the growth at low temperatures will reduce the interaction between
the catalyst and the underlayer metallic alloying as this kind of interaction hinder the
growth of the CNM and (iii) high reaction temperatures increase the decomposition rate
of acetylene, and hence the C supply rate will exceed the C diffusion rate, so as C
accumulates on the metal surface and partly deactivates the nickel catalyst, leading to the
observed yield deterioration (Wang, Yang, et al., 2017). The plots (6.3 (b)) also indicated
that short reaction times has favorable effect on the yield indicating that the catalyst is
very active at early stage. Furthermore, longer reaction times will promote the formation
of amorphous carbon (Khedr, Halim, & Soliman, 2008; Mubarak, Abdullah, et al., 2014;
Nessim et al., 2009).
Based on the specified constrains in Table 6.6, there were several sets of selected
solutions predicted to be the optimum conditions; these were listed in Table 6.7 and
ranked by the desirability. The highest yield CNM-PAC of 160 % was found at the
optimum process conditions of a reaction temperature 550ºC, a reaction time 37.3 and a
Univers
ity of
Mala
ya

178
gas ratio 1.0. Sets of experiments in which the optimum reaction condition based on the
RSM study were conducted using the procedure discussed in the experiment section. The
CNNM-PAC from the optimized reaction was calculated to be 156.56 % which were
close to the RSM analysis result with a mean error of 2%. It is believed that C2H2 is an
active compound with low thermal stability. Therefore, high reaction temperature and
long reaction time will result in rapid decomposition of C2H2, leading to the deactivation
of the catalyst. This deactivation is higher when the feedstock gases flow rate increase
due to particle absorption of too much carbon or conversion of the metal into other non-
catalytic form (Ahmad et al., 2017; Kang et al., 2015). Accordingly, the sample obtained
at the optimized growth condition is identified as O-CNT to be investigated in the MB
adsorption study.
Table 6.6: Optimization constraints for CNM-PAC production.
Name Goal Lower limit Upper limit Importance
out of 5
Temperature (A) In range 550 750 3
Time (B) In range 20 60 3
Gas ratio (C) In range 1 4 3
Yield % (YC2H2) Maximize 89.4 173 3
MB removal % (RV C2H2) Maximize 65.7 95.5 5
Table 6.7: The optimum conditions suggested by DOE for CNM-PAC growth.
No. A B C Y % RV% Desirability
1 550. 37.3 1.00 160. 93.6 0.918 Selected
2 550. 36.1 1.00 159. 93.6 0.917
3 550. 31.9 1.00 156. 93.7 0.913
4 550. 25.5 1.00 152. 93.7 0.907
5 550. 21.5 1.00 150. 93.7 0.903
6 550. 20.3 1.00 149. 93.7 0.902
7 554. 20.0 1.00 144. 93.7 0.890
8 550. 20.0 2.54 149. 92.9 0.879
9 550. 20.0 2.65 149. 92.9 0.878
A: Temperature, B: time, C: gas ratio
Univers
ity of
Mala
ya

179
Furthermore, Figure 6.4 (a) and (b) indicate that the removal of MB increased with
increasing the growth temperature. Thus, the high growth temperature has more positive
effect on promoting the MB removal efficiency comparing with the impact of growth
duration parameter and gas ratio. Figure 6.4 (c) shows that the interaction between those
the parameters (BC) has smaller effect as compared with the temperature-time (AB)
interaction. From the study of interaction of different parameters of CNM-PAC synthesis,
it was noticed that the behavior of surface response of removal as function of reaction
conditions is different from that of yield. This indicates that the quality of higher yield
product is not necessary to be sufficient for removal process (Madannejad et al., 2018).
Univers
ity of
Mala
ya

180
Figure 6.4: Three-dimensional response surface representation for: MB
removal efficiency (RVc2H2 %) on CNM-PAC; (a) interaction with growth
temperature and time, (b) interaction with growth temperature and gas ratio and
(c) interaction with time and gas ratio.
a b
c
Univers
ity of
Mala
ya
181
6.2.5 Summary of optimization the conditions of CNM-PAC synthesis from
acetylene decomposition
Based on this study, the effects of the operating variables were optimized for preparing
CNM on powdered activated substrate from acetylene cracking. In view of this, the
findings of this study are:
1- different range of process variables were preset to get maximum CNM-PAC yield.
temperature from 550 °C to 750 °C, time from 20 min to 60 min, and gas ratio
(H2/C2H2) from 1.0 to 4.0.
2- The experimental design results for synthesizing CNM-PAC revealed that all the
three variables showed significant effects on the yield of CNM-PAC. However,
the growth temperature is the most important factor influencing yield % and the
removal efficiency of MB.
3- The process optimization produced CNM-PAC hybrid with maximum possible
yield within the experimental ranges studied. The proposed model has successfully
created adequate correlation between the process variables.
4- The highest yield CNM-PAC of 160.0 % was found at the optimum process
conditions of a reaction temperature 550 ºC, a reaction time 37.3 and a gas ratio
1.0 min.
5- The produced CNM-PAC hybrid at the optimal synthesizing conditions was
identified as O-CNT in the MB adsorption study demonstrated in the next section.
Univers
ity of
Mala
ya

182
6.3 Adsorption of Methylene blue (MB)
6.3.1 Primary screening
The primary adsorption screening was conducted as prescribed in section 3.4.5.5 to
select the adsorbent with the highest removal efficiency for MB. The screening test was
carried out for three adsorbents (O-CNT, KS-CNT, and K-CNT) and the results were
described in Figure 6.5. The results demonstrated that the removal percentage was pH
dependent. The O-CNT achieved the highest removal percentage at pH 11. KS-CNT
recorded the highest removal at pH 3. O-CNT and KS-CNT were characterized by almost
the same adsorption capacity but were much higher than K-CNT 3.
Figure 6.5: Primary screening study for all adsorbents.
3 Growth and optimization of carbon nanotubes in powder activated carbon for an efficient removal of methylene blue from
aqueous solution. Environmental Technology Journal. 2018, (38).
Univers
ity of
Mala
ya

183
Figure 6.6 shows the effect of contact time on the adsorption of MB by the three
adsorbents. The initial adsorption rate for KS-CNT was higher than that of the as-grown
O-CNT suggesting that the sorption of MB onto KS-CNT was faster than that onto O-
CNT. The difference in starting removal efficiency between as-grown O-CNT and KS-
CNT might be due to the changes in the surface chemistry of CNTs after KMnO4/ H2SO4
oxidization. However, the removal efficiency of KS-CNT decreased, and the removal
performance was slightly enhanced at a prolonged contact time. The maximum removal
efficiency for O-CNT and KS-CNT after 24 h were 99.65 and 94.5 %, respectively. After
oxidization, the surface of CNTs became negatively charged because of the deprotonation
of the attached oxygen-containing groups. In this case, the attraction of water molecules
is more favorable than the sorption of MB; thus the removal process is more difficult
(Shen et al., 2009). The sorption of organic chemicals is depressed on carbon materials
because of the presence of oxygen functional groups (Franz, Arafat, & Pinto, 2000; Zhu
& Pignatello, 2005), and this depression in removal efficiency can occur via water
adsorption, dispersive/repulsive interaction and hydrogen bonding. Cho et al., (2008)
observed that the incorporation of surface oxides onto multi-walled carbon nanotubes has
reduced the surface area resulted in a decrease in the maximum adsorption capacity of
naphthalene by 70 % (Cho et al., 2008). Also, Sheng et al., (2010) reported that the low
adsorption affinity of ionizable aromatic compounds on oxidized MWCNTs due to the
produced carboxylic groups. These groups can act as electrons withdrawing groups
localizing electron from system of MWCNTs, which might be expected to interfere with
the dispersion forces between the aromatic ring of the aromatic compounds and the
graphitic structure of MWCNTs (Sheng et al., 2010). Furthermore, the lowest removal
efficiency of MB was observed for the K-CNT sample which could be due to the
extensive presence of MnO2. The MnO2 deposition, destroys the hexagonal graphite
Univers
ity of
Mala
ya

184
structure of CNTs through wrapping the CNTs into a non-stoichiometric amorphous
shape (AlOmar et al., 2017). These observations were confirmed by monitoring the
removal efficiency of MB onto all the adsorbents and by observing the changes in colour
(Figure 6.6). O-CNTs and the functionalized sample with KMnO4/H2SO4 introduced the
same adsorption capacity. Therefore, this study focused on the optimization of MB
removal onto O-CNTs for further kinetics and isotherm investigation.
Figure 6.6: Effect of contact time on the removal efficiency of MB for all
adsorbents.
6.3.2 Design of experiment (DOE) for MB adsorption
The adsorption performance of the synthesized O-CNT was evaluated for the removal
of methylene blue (MB) from water. The adsorption experiments were conducted
according to the CCD matrix selected by the DOE software to analyze the behavior of the
removal efficiency (RV3) and adsorption capacity (Q3) under three factors pH (3-11),
Univers
ity of
Mala
ya
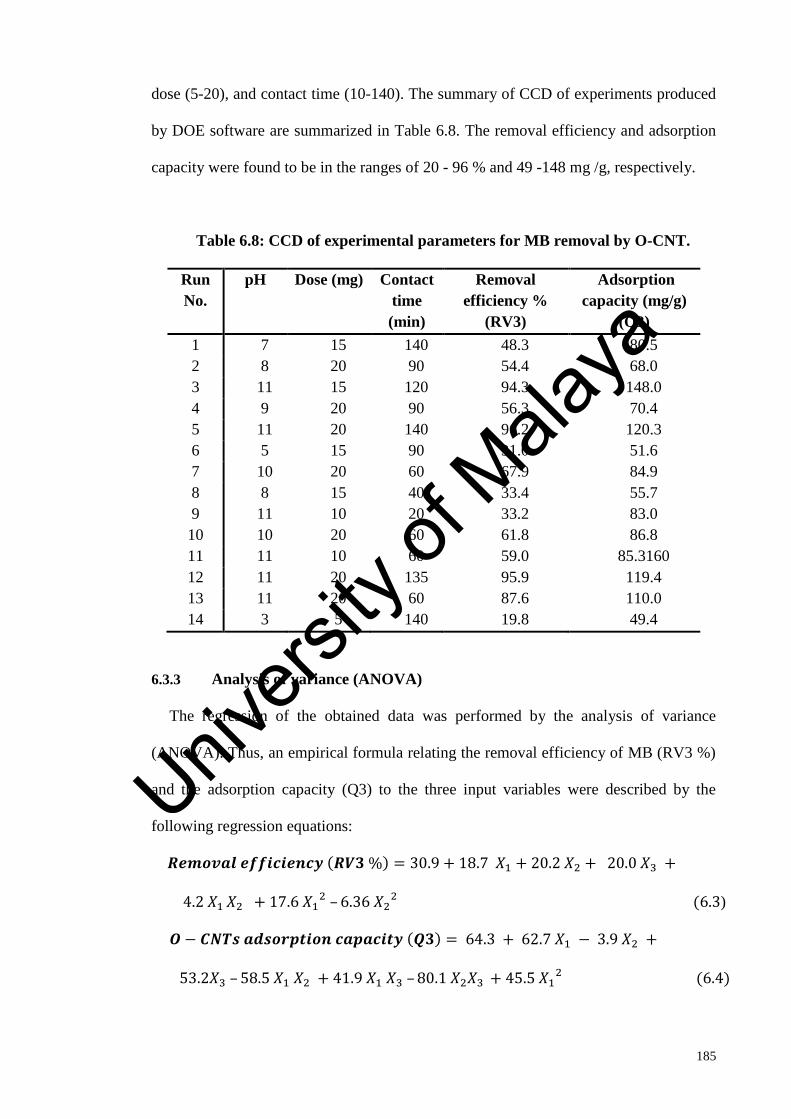
185
dose (5-20), and contact time (10-140). The summary of CCD of experiments produced
by DOE software are summarized in Table 6.8. The removal efficiency and adsorption
capacity were found to be in the ranges of 20 - 96 % and 49 -148 mg /g, respectively.
Table 6.8: CCD of experimental parameters for MB removal by O-CNT.
Run
No.
pH Dose (mg) Contact
time
(min)
Removal
efficiency %
(RV3)
Adsorption
capacity (mg/g)
(Q3)
1 7 15 140 48.3 80.5
2 8 20 90 54.4 68.0
3 11 15 120 94.3 148.0
4 9 20 90 56.3 70.4
5 11 20 140 96.2 120.3
6 5 15 90 31.0 51.6
7 10 20 60 67.9 84.9
8 8 15 40 33.4 55.7
9 11 10 20 33.2 83.0
10 10 20 60 61.8 86.8
11 11 10 60 59.0 85.3160
12 11 20 135 95.9 119.4
13 11 20 60 87.6 110.0
14 3 5 140 19.8 49.4
6.3.3 Analysis of variance (ANOVA)
The regression of the obtained data was performed by the analysis of variance
(ANOVA). Thus, an empirical formula relating the removal efficiency of MB (RV3 %)
and the adsorption capacity (Q3) to the three input variables were described by the
following regression equations:
𝑹𝒆𝒎𝒐𝒗𝒂𝒍 𝒆𝒇𝒇𝒊𝒄𝒊𝒆𝒏𝒄𝒚 (𝑹𝑽𝟑 %) = 30.9 + 18.7 𝑋1 + 20.2 𝑋2 + 20.0 𝑋3 +
4.2 𝑋1 𝑋2 + 17.6 𝑋12 – 6.36 𝑋2
2 (6.3)
𝑶 − 𝑪𝑵𝑻𝒔 𝒂𝒅𝒔𝒐𝒓𝒑𝒕𝒊𝒐𝒏 𝒄𝒂𝒑𝒂𝒄𝒊𝒕𝒚 (𝑸𝟑) = 64.3 + 62.7 𝑋1 − 3.9 𝑋2 +
53.2𝑋3 – 58.5 𝑋1 𝑋2 + 41.9 𝑋1 𝑋3 – 80.1 𝑋2𝑋3 + 45.5 𝑋12 (6.4)
Univers
ity of
Mala
ya

186
Where, the coefficients with pH (X1), adsorbent dose (X2) and contact time (X3) represent
the effect of that factor for the adsorption of MB. Coefficients with two factors show the
interaction between the two variables.
The competence of the developed models was further justified through analysis of
variance (ANOVA) and the results obtained are depicted in Tables 6.9 and 6.10 for both
RV3 and Q3, respectively.
Table 6.9: ANOVA results for MB Removal % (RV3) by O-CNT.
*Source Sum of
Squares df
Mean
Square
F
Value
p-value
Prob > F
Model 7060 6 1180 23.1 0.000278
X1 298 1 298 5.85 0.046233
X2 311 1 311 6.11 0.0428
X3 932 1 932 18.3 0.00366
X1 X2 8.97 1 8.97 0.176 0.687
X12 113 1 113 2.23 0.179
X22 24.3 1 24.3 0.478 0.511
R- Squared 0.952 Std.Dev.7.13
Adj. R-Squared 0.911 C.V. 12.5
Pred. R-Squared 0.833 Adeq. Precesion 15.5 *X1: pH, X2: adsorbent dosage and X3: contact time; (min)
Table 6.10: ANOVA results for the adsorption capacity of O-CNT (Q3).
*Source Sum of
Squares df
Mean
Square
F
Value
p-value
Prob > F
Model 10600 7 941 49.3 <0.0001
X1 2490 1 2490 81.4 0.000104
X2 8.96 1 8.96 0.293 0.08
X3 1320 1 1320 43.0 0.000602
X1 X2 1250 1 1250 40.9 0.00069
X1 X3 533 1 533 17.4 0.00586
X2X3 1400 1 1400 45.7 0.000512
X12 676 1 676 22.1 0.00332
R- Squared 0.983 Std.Dev.5.53
Adj. R-Squared 0.963 C.V. 6.37
Pred. R-Squared .839 Adeq. Precesion23.5
*X1: pH, X2: adsorbent dosage and X3: contact time; (min)
Univers
ity of
Mala
ya

187
Based on 95% confidence level, the model F-value for MB removal percentage and
adsorption capacity were 23.1, 49.3 respectively, which implied that these models were
significant. Meanwhile, their probable F values were 0.000278 and < 0.0001 confirming
that the model terms are highly significant. The correlation coefficient, R2 and standard
deviation values demonstrate the quality of the model developed. R2 describes how well
the model approximate the actual data points and it describes the ratio between sum of
squares (SSR) with total sum of squares (SST). The R2 values for Equations 6.3 and 6.4
were 0.952 and 0.983 respectively indicating adequate adjustment of the proposed
models with the experimental data. The reproducibility of the model was reflected by
the small values of the coefficient of variation (CV) and standard deviations. Also, the
"Adeq Precision" attained for all the responses suggested that the models can be applied
to navigate the design space. The diagnostic test of the performance of the model can
also be depicted by the linear plots of the predicted values versus experimental values of
the MB removal percentage and adsorption capacity data as shown in Figure 6.7.
Figure 6.7: Predicted values vs. actual data for MB adsorption on O-CNT
adsorbent (a) removal (%) and (b) adsorbent capacity (mg /g).
Univers
ity of
Mala
ya

188
6.3.4 The interactive effects of selected parameters on the adsorption of MB on
O-CNT
Table 6.11 presents the applied process criteria and their importance levels which
were defined for optimization the pH, adsorbent dosage, contact time, RV3% and Q3 to
select the optimum conditions for MB removal onto O-CNT adsorbent. Based on the
equations (6.3) and (6.4) and the constrains presented in Table 6.11, the software
suggested six solutions listed in Table 6.12. Optimal removal conditions were found to
be pH 11, adsorbent dosage around 18.1 mg, and contact time of 128 min at initial MB
concentration of 50 mg/L. At these optimum values, the predicted and observed MB
removal efficiency and adsorbent capacity were 94.7, 148.0 % and 91.63, 146.74 mg/g,
respectively.
Table 6.11: Constraints for optimization process based on CCD for MB
adsorption.
Name Goal Low limit Upper limit Importance
X1 (pH) In range 2 11 3
X2 (dosage) In range 5 20 3
X3 (time) In range 20 140 3
RV3 Maximize 19.8 96.2
5
Q3 Maximize 49.4 148.0 3
Table 6.12: Potential optimization conditions based on CCD for MB removal onto
O-CNT.
No. pH Dose (mg) Contact
time (min)
RV3 % Q3 (mg/g) Desirability
1 11.0 18.1 128 94.7 148. 0.986 Selected
2 11.0 18.1 139. 94.1 148. 0.982
3 11.0 18.2 140. 94.5 147. 0.982
4 11.0 18.0 140. 93.9 148. 0.981
5 11.0 18.0 135. 93.0 148. 0.974
6 10.9 17.8 140. 92.1 148. 0.966
Univers
ity of
Mala
ya

189
RSM was used to explore all the significant interactions in the CCD and evaluate the
relation between input parameters and the obtained response surfaces (Figure 6.8). The
enhancement in MB removal and adsorbent capacity in the solution with increasing pH
at the optimal time is shown in Figures 6.8 (a) and (b). Figure 6.8 (a) indicates that
increasing the solution pH improved the MB removal, and MB was almost completely
removed at pH 11. This observation can be attributed to the changes of the adsorbent
surface charge and the ionization of the MB dye in basic media (Ansari, Mosayebzadeh,
& Mohammad-khah, 2011). At a solution pH higher than the point of the zero charge of
the adsorbent (pHPZC = 8.0), the adsorbent surface acquired a negative charge.
Consequently, electrostatic attraction occurred between the cationic MB molecules and
the negatively charged adsorbent surface, leading to an enhanced adsorption.
Furthermore, the dye removal efficiency at acidic pH was low probably because of excess
H+ that competed with MB for the adsorption sites of the sorbents (Joseph et al., 2013).
According to the plot of pH versus agitation time at the optimal adsorbent dosage
Figure 6.8 (b), the effect of time on adsorption was almost constant (75%) within the pH
range of 3.0–8.0, whilst shifting pH to an alkali region led to an enhancement in
adsorption regardless of contact time. At pH 11.0 and 128 min of contact time, 96.3%
removal was observed. The maximum dyes removed at high pH confirmed the high
contribution of the charge and nature of the adsorbent surface during adsorption. The
response surface plots demonstrated that the agitation time achieved an enhanced contact
between the dye and the adsorbent and the increase in the dose increased the active site
concentration. Hence, high values of MB removal were obtained by simultaneously
increasing the agitation time and the adsorbent mass.
Univers
ity of
Mala
ya

190
Figure 6.8: Surface response representation of the interaction of removal efficiency
of MB onto O-CNTs with (a) pH and dose, (b) pH and contact time and (c) dose
and contact time.
Referring to Figure 6.9, also the pH has more significant effect on the absorption
capacity than the adsorbent dose. In Figure 6.9 (a) the adsorption capacity increased
within the range of 5–18.1 mg, and the capacity declined as the O-CNT dosage increased.
Similar observations were obtained in a previous literature (Wu, 2007). High adsorbent
dosage might increase the viscosity and inhibit the diffusion of MB molecules to the
surface of the CNTs (Asmaly et al., 2015). The obtained optimal removal conditions were
b a
c
Univers
ity of
Mala
ya

191
used to study the adsorption kinetics and isotherms for MB adsorption on O-CNT
adsorbent.
Figure 6.9: Surface response representation of the interaction of adsorption
capacity of MB onto O-CNTs with (a) pH and dose, (b) pH and contact time and
(c) dose and contact time.
a
c
b
Univers
ity of
Mala
ya

192
6.3.5 Adsorption Kinetics
Three well-known kinetic models were utilized at the selected optimum condition to
analyze the experimental data for better understanding of the kinetic behavior of MB
adsorption on O-CNT; pseudo-first order, pseudo-second order and intraparticle diffusion
model. The initial concentration of MB was 50 mg/L and a contact time of 7 h was used
to verify the equilibrium condition. Table 6.13 lists all the related kinetic parameters and
the correlation coefficients (R2) which were determined by linear regression of the plots
displayed in Figure 6.10.
Table 6.13: Experimental values of constants of adsorption kinetics models.
Model Equation Parameters Values
Pseudo-First-Order
ln(𝑞𝑒 − qt) = 𝑙n𝑞𝑒 − 𝐾1t
R2
K1
0.886
0.027
qe
38.86
Pseudo-Second-Order
𝑡
𝑞𝑡=
1
𝐾2𝑞𝑒2
+1
𝑞𝑒𝑡
R2
K2
0.999
1.49 x10⁻³
qe
122.69
Intraparticle diffusion
𝑞𝑡 = 𝐾𝑑𝑡12 + 𝐶
R2
Kd
0.85
1.884
C 94.736
qe (experimental) = 120.367 mg/g
For the pseudo-first-order model, large differences between the experimental and
calculated values of the equilibrium adsorption capacity indicated that the adsorption of
MB onto the O-CNT did not follow the pseudo-first-order model. By contrast, R2 of
pseudo-second-order model was 0.999, suggesting that the adsorption kinetic was ideally
consistent with the pseudo-second-order model. This observation is also in agreement
Univers
ity of
Mala
ya

193
with some reported kinetic results for MB adsorption on multi-walled CNTs (Fan et al.,
2017; Ma et al., 2012). The applicability of pseudo-second-order kinetic model to
describe the adsorption of MB implied the possibility of adsorbate and adsorbent
involvement in the adsorption mechanism and controlled by chemisorption involving
valence forces through exchange or sharing electrons (Zhang, Lan, et al., 2013).
Figure 6.10: Fittings of different kinetics models for MB adsorption on O-CNT;
(a) Pseudo-first order, (b) Pseudo-second order and (c) Intraparticle diffusion at
optimum conditions.
Univers
ity of
Mala
ya

194
The intraparticle diffusion (ID) model was also investigated for further demonstration
of the adsorption behavior of MB on O-CNT adsorbent. The interpretation of the plot of
qt against t0.5 indicated that the ID was not the only rate-limiting step as long the linear
plot did not pass through the origin (Ai & Jiang, 2012b; Altıntıg et al., 2017b; Chen &
Bai, 2013). Therefore, it can be argued that the adsorption of MB is affected by the
involvement of other mechanisms such as the boundary layer diffusion which is
confirmed by the high value of the layer thickness (C = 94.736). Accordingly, the
adsorption of MB begins with rapid diffusion of dye molecules through the bulk solution
to the exterior surface of the adsorbent. As result of the saturation of the external surface,
a gradual adsorption of the MB through the pores of the interior surface takes place
(Vijwani et al., 2015).
6.3.6 Adsorption isotherms
The adsorption isotherm describes basically the interaction between the solute and
the adsorbent at an equilibrium state. The experimental data was fitted to different types
of isotherm models namely Langmuir, Freundlich and Temkin isotherm models. The
mathematical equations in the linearized forms were applied to fit the equilibrium data
as they are simpler than the nonlinearized form and more commonly used by previous
researchers. The linearized plots of the studied isotherms are presented in Figure 6.11
and the associated parameters along with the correlation coefficients are listed in Table
6.14.
The values of Langmuir separation factor (RL) and Freundlich heterogeneity constant (n)
listed in Table 6.14 confirmed the adsorption favorability of MB for both the Langmuir
and Freundlich isotherm models under experimental conditions. This kind of duality is
common in adsorption studies (Ai & Jiang, 2012b; Asfaram et al., 2016; Yao et al., 2010).
However, the fit of Langmuir isotherm was better with a high R2 of 0.991 than that of
Univers
ity of
Mala
ya

195
Freundlich isotherm. This finding indicated the monolayer adsorption of MB onto the
homogeneous sites of the O-CNT surface with no interaction between sorbate species.
The results agreed well with previous studies which reported that the Langmuir model
gave a better fit to explain the experimental data for the adsorption of MB from aqueous
solution (Ofomaja, 2008; Rafatullah et al., 2010; Vargas et al., 2011; Zhang et al., 2015).
Table 6.15 provides a comparison of the maximum adsorption capacity of MB on several
adsorbents. Compared with those in previous studies, a significant maximum adsorption
capacity of 174.52 mg/g was observed in the as-prepared O-CNT adsorbent in this study.
Figure 6.11: The isotherm plots for MB adsorption on CNM-PAC; (a)
Langmuir, (b) Freundlich, and (c) Temkin model.
Univers
ity of
Mala
ya

196
Table 6.14: Linearized equations of studied isotherm models for MB adsorption
on O-CNT.
Model Equation Parameters Values
Langmuir
𝐶𝑒
𝑞𝑒=
1
𝐾𝐿 𝑞𝑚 + (
1
𝑞𝑚) 𝐶𝑒
R2 0.991
qm 174.52
KL 1.454
RL 0.0138
Freundlich
𝑙𝑛𝑞𝑒 = 𝑙𝑛𝐾𝑓 +
1
𝑛 𝑙𝑛𝐶𝑒
R2 0.932
Kf 83.734
n 2.8
Temkin 𝑞𝑒 = 𝐵1𝑙𝑛𝐾𝑇 + 𝐵1 𝑙𝑛𝐶𝑒 R2 0.854
KT 40.99
𝐵1 28.18
Table 6.15: Comparison between the maximum adsorption capacity (qm) of O-
CNT and other reported adsorbents for MB removal.
Adsorbent qm (mg/g) Reference
O-CNT 174.52 The present work
MWCNTs 109.31 (Zohre, Ataallah, & Mehdi, 2010)
Calcined titanate nanotubes 133.33 (Xiong et al., 2010)
MWCNTs produced by CVD
(acetylene cracking on Fe/Si)
50.25 (Liu et al., 2014)
Cotton stalk 147.06 (Deng et al., 2011)
graphene/magnetite composite 43.08 (Ai, Zhang, & Chen, 2011)
Activated carbon 123 (Suresh, Sugumar, & Maiyalagan, 2011)
ZnS:Cu nanoparticles loaded on
activated carbon
106.95 (Asfaram et al., 2015)
Sugar beet pulp 714.29 (Vučurović, Razmovski, & Tekić, 2012)
Powdered activated carbon 91.0 (Yener et al., 2008)
polydopamine microspheres 88.89 (Fu et al., 2015)
Self-assembled graphene-CNT 81.97 (Ai & Jiang, 2012a)
Oxidized-CNTs 99.83 (Norzilah et al., 2011)
Univers
ity of
Mala
ya

197
6.3.7 Mechanisms
It is important to understand the mechanism of MB adsorption that results in the
apparent behavior of the system. The afore investigations of the impact of different
parameters on the adsorption process along with the demonstration of the kinetic models
indicated that the pH factor has a remarkable influence on the removal of MB. It is worthy
to mention that fitting the experimental data with the intraparticle diffusion model (ID)
was useful technique to identify the mechanism involved in the sorption process. The
solute transfer in a solid/liquid sorption process is usually designated by either the
boundary layer diffusion (external mass transfer) or intraparticle diffusion or both. Thus,
the mechanism of MB removal from aqueous phase by adsorption is expected to consist
of four steps: (i) transfer of the MB molecules from the bulk solution to the surface of the
O-CNT adsorbent, (ii) boundary layer diffusion through the surface of the adsorbent, (iii)
adsorption of dye at an active site on the surface of O-CNT and (iv) intraparticle or pore
diffusion by which MB adsorption takes place onto the interior sites of the adsorbent
(Etim et al., 2013; Sanghi & Verma, 2013; Yagub, Sen, Afroze, et al., 2014). Figure 6.10
(c) showed that the adsorption plot was not linear over the whole-time range and can be
divided into two to three linear regions which confirm the multi-stages of adsorption. The
rapid earlier stage signified by the external mass transfer through film diffusion followed
by the slower intraparticle diffusion through the pore after the adsorbent sites are loaded
with dye ions. Moreover, from the same figure, it can be concluded that the film diffusion
and intraparticle diffusion happen concurrently as confirmed by the linear plot which did
not pass through the origin (Yagub, Sen, & Ang, 2014).
As already mentioned, poor removal efficiency of MB on O-CNT was observed at
low pH value and it enhanced as pH value increased until it reached its maximum value
at pH11. The ionization degree of the adsorbate molecule and the surface properties of
Univers
ity of
Mala
ya

198
the adsorbent are highly influenced by the variation of the pH value. Thus, the low pH
leads the surface of adsorbent to acquire to an increase positive charge by absorbing H+
and less amount of cationic dye adsorption takes place. Furthermore, the higher MB
adsorption under basic condition may be attributed to the electrostatic attraction between
the cationic species of MB with the negatively charged surfaces (pH > pHPZC).
Meanwhile, MB is a planar molecule with aromatic backbone and the O-CNT adsorbent
contains abundant aromatic rings, therefore, the π-π stacking interactions could occur
between MB molecules and O-CNT adsorbent. A similar behavior was observed for
methylene blue adsorption on Neem (Azadirachta indica) powder (Bhattacharyya &
Sharma, 2005), on sawdust and crushed brick (Hamdaoui, 2006), on cashew nut shell
(Kumar, Ramalingam, & Sathishkumar, 2011) and on carbon nanomaterials (Gong, Liu,
Chen, et al., 2015; Li, Du, et al., 2013). Furthermore, the high adsorption of MB on as-
synthesized O-CNT indicated that there were very strong van der-Waals forces and
hydrophobic interactions between the carbon nanomaterial and the dye (Tan et al., 2015).
This observation leads to the conclusion that, even though adsorption of cationic species
on KSCNT was enhanced by the presence of surface acid groups, O-CNT still present
better performances, indicating that dispersive interactions between the delocalized π
electrons on the surface of the CNTs and the free electrons of the dye molecule present
in the aromatic rings and multiple bonds play a dominant role in the adsorption
mechanism (Rajabi, Mahanpoor, & Moradi, 2017). These dispersive interactions were
improved by the thermal treatments of the Ni-PAC substrate. Fernando et al, (2003)
reported that the thermal treated samples of activated carbon exhibited higher removal
performances for the adsorption of basic dyes than the acidic treated samples (Pereira et
al., 2003). Their results showed that one of the most important adsorption mechanisms
involves the interaction between the delocalized π electron of the carbon surface and the
Univers
ity of
Mala
ya

199
free electrons of the dye molecule (aromatic rings and –N=N– or –N=C–C=C– bonds)
(Martín-Jimeno et al., 2015).
6.3.8 Summary of the adsorption of MB onto O-CNT
The key findings of this study can be summarized as following:
1- The synthesized O-CNT was used to prepare two modified adsorbents:
(a) KSCNT produced after modifying O-CNT with KMnO4/H2SO4
(b) K-CNT produced after modifying O-CNT with KMnO4
2- Three adsorbents O-CNT, KS-CNT and K-CNT were examined via a separate
primary screening study for the removal of MB. The O-CNT demonstrated the
highest removal efficiency for MB and was selected for further adsorption studies.
3- The optimum removal conditions for MB removal were detected by using RSM-
CCD experimental design. The removal efficiency and adsorption capacity were
chosen as the adsorption process responses and the ANOVA was used to establish
their empirical equations. The optimum conditions suggested by the optimization
process were found at pH 11, adsorbent dosage of 18.1 mg and contact time of 128
min.
4- The adsorption kinetics for O-CNT adsorbent was well fitted by pseudo-second
order model and the equilibrium adsorption data was best described by Langmuir
isotherm model indicating a monolayer adsorption of MB on a homogeneous
surface with a maximum adsorption capacity of 174.52 mg/g.
5- MB adsorbed on O-CNT adsorbent increased with pH values suggested that the
adsorption resulted from electrostatic attraction between the negatively charged O-
CNT adsorbent surface and the positively charged cationic dyes in addition to
dispersive interactions.
Univers
ity of
Mala
ya

200
CHAPTER 7: CHARACTERIZATION OF CNM-PAC SYNTHESIZED FROM
ACETYLENE DECOMPOSITION
7.1 FESEM and TEM analyses
The FESEM and TEM images in Figure 7.1 display the morphology of the deposited
product obtained by decomposition of C2H2 onto Ni-PAC. At the optimized growth
conditions (550 ºC, 37.3 min, and gas ratio 1.0), dense CNTs with tubular structures were
dominant in the product microscopic analyses (Figure 7.1 (a)). The TEM image presented
in Figure 7.1 (b) shows the presence of well-graphitized CNTs with an outer diameter of
10–40 nm with a closed tip tilted from the vertical direction and nucleated from Ni
particle of average diameter size of 70 nm (Atthipalli et al., 2011; Sugime et al., 2015).
However, the synthesized CNTs walls had some defects because H2 and C2H2 strongly
reduced the oxidized catalysts, and the produced oxygen might etch the carbon tube
surface into deep pits (De Greef et al., 2015). The encapsulation of catalytic particle at
the tip (Figure 7.1 (c)) suggested that the growth of CNTs followed the tip growth
mechanism induced by the weak interaction between Ni and PAC (Li et al., 2000; Vander
Wal, Ticich, & Curtis, 2001). It is noteworthy the SEM analysis showed no trace of
amorphous agglomerated carbon which is attributed to the low synthesis temperature (550
ºC) and hence significantly inhibits the spontaneous pyrolysis of gaseous hydrocarbon
into amorphous carbon (Pham-Huu et al., 2006). Meanwhile, the synthesis temperature
is also closely dependent on the nature of the gaseous carbon source which was confirmed
by different optimum growth temperature for CH4 and C2H2 in our study.
Figure 7.2 shows the produced carbon nanomaterials under the decomposition of C2H2
at 750 ºC, 20 min and gas ratio 1.0. The image confirmed the important role of the reaction
temperature on the growth of CNMs. The FESEM image displayed carbon nano-fiber
Univers
ity of
Mala
ya

201
(CNF) with an average diameter of 75-95 nm, and nano-coil fibre. These observations,
unlike those described in previous studies which yielded single type of CNF (Chen, Su,
et al., 2007; Chen, Timpe, et al., 2009a).
Figure 7.1: FESEM and TEM images of O-CNT.
Figure 7.2: FESEM image of CNT, CNF, CS and helix cum produced at 750 ºC.
a b c
Univers
ity of
Mala
ya

202
7.2 Raman spectroscopy
Raman spectroscopy technique was conducted to analyze O-CNT and KS-CNT. As
common with Raman spectra of graphene based materials (Figure 7.3), the prominent
peaks at ~ 2800 cm-1, 1580 cm-1, and 1340 cm-1 refers to G′, G and D bands (Dresselhaus
et al., 2010). As can be noticed from the figure, two obvious sharp peaks were observed:
the first at ~1340 cm-1 (D band) and the second at ~1600 cm-1 (G band). The peak at 1300-
1400 cm−1 is the D band which is a defect-induced mode caused by sp3-hybridized carbon
atoms in the sidewall of CNT and is often attributed to the disordered structure of
graphite. By comparison, the common tangential mode to all sp2 carbon systems and
graphitic layers produce a stretching C–C vibration characterised by the G band at high
ranges of Raman shift (1550–1650 cm–1) (Hernadi et al., 2000; Li et al., 1997). The strong
G peak suggested that the CNTs synthesised in activated carbon at 550 °C were highly
graphitised, and the relatively high intensity of the D band for the CNTs in PAC
confirmed the defective and curly structure of CNTs. It seems that the synthesized CNT-
PAC can be significantly influenced by the nature of the support (Pham-Huu et al., 2006).
The high degree of graphitization of the as-synthesized O-CNT could be attributed to the
nature of the support as well as the presence hydrogen in the feed. Park and Keane (Park
& Keane, 2004) reported similar findings from their study which demonstrate the
contribution of the support in the generation of CNMs by CVD. Another Raman feature
to identify the tube diameter is radial breathing mode. No peaks were detected at <400
cm–1, indicating that the concerned adsorbents possessed a large diameter (Jorio et al.,
2003). The ratio between the areas of these two bands (IG/ID) was used to quantify the
degree of purification of multi-wall CNTs. The lower intensity of D band than that of G
band in O-CNT indicated the low amount of amorphous carbon present in the structure.
IG/ID for KS-CNT increased from 1.85 to 2.59, implying that the graphitic quality of the
Univers
ity of
Mala
ya

203
modified CNTs in terms of the amorphous carbon content of the samples is enhanced
(Datsyuk et al., 2008; Gómez et al., 2016) .
Figure 7.3: Raman spectrum of O-CNT and KS-CNT.
7.3 Thermogravimetric analysis (TGA)
TGA was performed to measure the purity, defects and overall quality of CNT-PAC.
Figure 7.4 shows the TGA results of O-CNTs, KS-CNTs and after-adsorption sample
which referred to as O-CNTs-MB. TGA reflects the stability of carbonaceous compounds
at a given temperature. No weight loss was observed for O-CNTs at the degassing
temperature range from 100 to 400 °C , indicating the absence of oxygenated functional
groups (Avilés et al., 2009; Nazal et al., 2016). As reported in previous study, the drastic
weight loss in O-CNTs at above 500 °C is related to the oxidation of disordered or
amorphous carbon and other metal impurities (Dillon et al., 2000). The initial gradual
weight change was reduced by 2% and 5% for O-CNT-MB and KS-CNTs at
approximately 100 °C due to moisture evaporation, respectively. Then a steep drop in the
weight occurred as the temperature increased. The onset combustion of O-CNTs, O-
CNTs-MB and KS-CNTs were 454.97, 449.7 and 423.52 °C, respectively. The
Univers
ity of
Mala
ya

204
combustion profile of the samples suggested that the thermal stability and purity of O-
CNTs were higher than those of O-CNT-MB and KS-CNTs. Functionalization with
KMnO4/H2SO4 caused a reduction in the onset of adsorbent combustion due to the
presence of various kinds of functional groups that have low activation energy for
oxidation, as demonstrated in the FTIR section. The weight loss of KS-CNT adsorbent
was 3.21% at >690 °C, whilst the remaining weight of O-CNTs was 7.36% at the same
temperature. This finding indicated that the metal particles were successfully removed
through oxidation. After MB was adsorbed (OCNTs-MB), the residues remained almost
the same as those of O-CNTs (6.96%), thereby contributing to the metal percentage in
the CNT materials.
Figure 7.4: TGA curves for O-CNTs, O-CNTs-MB, and KS-CNTs.
Univers
ity of
Mala
ya

205
7.4 Surface chemistry analysis (FTIR)
The corresponding FTIR spectra of O-CNTs, free MB and O-CNTs -MB are shown in
Figure 7.5. The spectrum of O-CNTs shows important absorption bands at 3400–3500
cm-1 (assigned to OH stretching), 2854–2960 cm-1 (corresponding to the aliphatic C-H
stretch of CH, CH2 or CH3), 1631 cm-1 (attributed to conjugated C=C stretching), and
1097 cm-1 (assigned to C–O stretch in alcohols). The presence of these functional groups
on the untreated CNTs implied that they are introduced during manufacturing (Machado
et al., 2011a). In addition, O-CNT showed a peak centered around 550 cm-1 ascribed to
the stretching of NiO bond because most metal oxides displayed their absorption bands
at 400 - 1000 cm-1 (Makino et al., 1992). In MB, the peaks at 1088, 1312 and 1590 cm-1
corresponded to CH3−, C−N, C=S, respectively (Gong, Liu, Jiang, et al., 2015). Some
peaks shifted or appeared after MB adsorption on CNTs. The peak at 1618 cm-1shifted to
1602 cm-1 suggesting that nitrogen-containing functional groups might participate in the
adsorption. In addition, the peak of the NH2 group shifted from 1522 cm–1 in the spectrum
of O-CNT-MB to 1540 cm–1. The peaks of 1388 and 1331 cm–1 disappeared, implying
that –CH3 and aromatic nitro groups from MB were involved in the interaction between
MB and CNTs. The peaks associated with =CH (681 cm–1) and C–O (1066 cm–1) of O-
CNTs showed a significant decrease in intensity possibly attributed to the electrostatic
attraction between O-CNTs and MB. Also, the axial deformation vibrations of the C–N
bond of aliphatic amines and the axial deformation of the C–N bond of the aromatic
amines were detected at 1020-1250 cm-1 and 1266-1342 cm-1, respectively.
Univers
ity of
Mala
ya

206
Figure 7.5: FTIR spectrum for O-CNTs, MB and O -CNTs-MB.
7.5 BET Surface area
The BET surface areas for PAC, Ni-PAC, O-CNTs, and KS-CNTs were investigated.
Table 7.1 lists the BET surface area, total pore volume and average pore diameter. The
loading of Ni onto the PAC support decreased the pore volume of the support likely
because of the blockage of the PAC pores by the impregnated catalyst, resulting in a
reduced surface area. The BET surface area of the O-CNTs produced under the optimized
conditions significantly enhanced (333.83 m2/g) due to the extra active surface added
onto the PAC. Such an enhancement represented the good sorption capacity of such
materials. The total pore volume of O-CNTs reached 0.44 cm3/g compared with that of
PAC (0.09 cm3/g). The surface area and the pore volume decreased after KMnO4/H2SO4
Univers
ity of
Mala
ya

207
was functionalized. The decrease in the surface area is a result of the removal of carbon
species with a high chemical potential (Hernadi et al., 2001; Xie, Zhang, & Varadan,
2005).
Table 7.1: Summary of BET results for PAC, Ni-PAC, O-CNTs, and KS-CNTs.
Property PAC Ni-PAC O-CNTs KS-CNTs
BET surface Area (m2/g) 101.1 97.2 333.83 198.29
Total pore volume (cm3/g) 0.09 0.07 0.44 0.25
Average pore diameter (ºA) 34.89 21.29 65.09 69.27
7.6 Zeta potential
The adsorption processes are greatly affected by Several factors, including pH, particle
surface, ionic strength, conductivity and temperature, influence the measurements of zeta
potential (AlOmar et al., 2016). In this study, 10 mg of PAC, Ni–PAC, O-CNTs and KS-
CNT was dispersed in deionised water. Table 7.2 shows that high absolute values of zeta
potential were obtained at high synthesis temperatures. Subsequently, the dispersibility
of the produced material was enhanced. The results showed that the absolute values of
zeta potential increased from 34.3 to 46.0 for O-CNTs and KS-CNTs. As revealed in the
FTIR spectra, the increase in the absolute value of zeta potential could be due to the
presence of numerous oxygen-containing groups, such as carbonyl, carboxyl and
hydroxyl groups (Gao et al., 2009). Moreover, the treatment of O-CNTs with
KMnO4/H2SO4 increased the hydrophilicity of the adsorbent which enhanced the stability
of the suspension of O-CNTs in the aqueous solution (Premkumar, Mezzenga, &
Geckeler, 2012). The surface charge assessed by the point of zero charge (pHPZC) is
defined as the point where the zeta potential is zero. When pH < pHPZC, the surface charge
is positive, and when pH > pHPZC, the surface charge is negative. In this case, the pHPZC
Univers
ity of
Mala
ya

208
of O-CNTs determined by the pH drift method (Figure 7.6) is about 8.0 and the analysis
revealed a small size mode between 10-100 nm.
Table 7.2: Zeta potential results for PAC and the different carbon structures
produced.
Figure 7.6: Determination of the point of zero charge of the O-CNTs by the pH
drift.
Sample Zeta potential (mV)
PAC - 42.6
Ni-PAC +1.67
O-CNTs (550ºC) - 34.3
CNF (750ºC) - 38.7
KS-CNTs - 46.0
Univers
ity of
Mala
ya

209
7.7 Summary of characterization
The main findings of the characterization study are:
1- The metal-catalyzed CVD growth under acetylene decomposition produced dense
CNTs on the PAC substrate. The results showed the pores in PAC can load catalyst
particles which exhibit effective catalytic activity to CNTs formation. This
observation confirms that utilizing powder activated carbon as a support material
seems the most promising.
2- Growth temperature has a significant impact on the quality of the synthesized
CNMs. Different types of CNMs were observed from the pyrolysis of C2H2 at high
reaction temperature.
3- The high graphitization of O-CNT and the low formation of amorphous carbon
produced at the optimum growth conditions could be due to the low reaction
temperature and the presence of H2 in the feed flow. Hydrogen permits the
saturation of graphite edges and prevents the formation of amorphous carbon.
4- The high temperature (750 ºC) was not favorable for the growth of good quality
CNTs as the products were fibrous and twisted tubes
5- The growth of CNTs onto the carbon support contributes to the improvement on
the surface area when compared with the raw PAC, thus the enhancement of
adsorption performance is expected.
6- The point of zero charge (PZC) of O-CNT determined by the pH drift method was
8.0 and the zeta potential of the KS-CNT sample showed significant improvement
in surface double layer negative charge.
Univers
ity of
Mala
ya

210
CHAPTER 8: CONCLUSIONS AND RECOMMENDATIONS
8.1 Conclusion
In persuasion of developing an affordable technique to treat wastewater containing
organic pollutants, synthesizing carbon nanomaterials (CNMs) on the surface of Ni+2
impregnated powdered activated carbon (PAC) from two different carbon sources was
adopted for removal of organic pollutants from water. Statistical analysis of the
experimental data was evaluated using ANOVA and the adequacy of the suggested
regression models were investigated. The synthesizing conditions were optimized using
RSM-CCD method. The as-grown CNM-PAC was used for removal of bisphenol A and
methylene blue dye from aqueous solution. The synthesizing approach was conducted by
CVD reactor and the adsorption experiments were carried out in conventional shake
flasks. The characterization of the selected adsorbent synthesized at the optimal growth
conditions included FESEM, TEM, EDA, TGA, Raman spectroscopy, BET and zeta
potential. The RSM-CCD experimental design was used to optimize the adsorption
parameters including pH of the solution, adsorbent dose and contact time. The removal
efficiency and adsorption capacity were chosen as process responses and ANOVA was
used to develop the adequate empirical equations. Additionally, kinetic and adsorption
isotherm studies were investigated for the adsorption systems at the optimum removal
conditions for both pollutant.
8.1.1 Synthesizing of carbon nanomaterials on powder activated substrate from
methane decomposition
Based on the overall experimental observations discussed in Chapter 4 and 5, the
conclusions can be listed below:
Univers
ity of
Mala
ya

211
1- The RSM- CCD was utilized to optimize the synthesizing conditions of CNM-
PAC from CH4 decomposition. The yield % of the CNM-PAC and removal % of
organic pollutant were investigated for the input growth parameters (reaction
temperature, growth time and feed stock gas ratio). The optimization method
showed the optimal conditions were achieved at reaction temperature of 933ºC,
growth duration of 20 min and gas ratio of 1.0.
2- The DOE clearly revealed that the growth temperature (A), growth time (B) and
gas ratio (C) were important parameters influencing the growth of the CNM-PAC
and its adsorption performance. However, the effect of growth temperature played
the most significant role for producing CNM-PAC.
3- The regression models were appropriate and adequate in predicting the responses.
They were effectively developed to describe the correlation between the
synthesizing variables and the responses of the yield and removal percentage.
4- The selected optimum sample characterization demonstrated the following
characteristics: The FESEM and TEM images indicated that the synthesized multi-
structure possessed of short intercalated CNTs which were well dispersed and
stabilized uniformly in the PAC matrix. Raman spectroscopy has confirmed the
graphitic structure of CNM-PAC hybrid and the TGA profile proved the stability
of the synthesized CNM-PAC hybrid with onset temperature of 507 °C. The CNM-
PAC hybrid established surface area of ~165.0 m2/g and total pore volume of 0.29
cm3/g. FTIR results indicated the presence of different functional groups such as
carbonyl, hydroxyl, and carboxylate.
5- The optimum process conditions for the adsorption of BPA and MB dye with
initial concentration of 50 mg/L on CNM-PAC hybrid were performed by the
RSM-CCD approach. The optimization study revealed that the adsorption of BPA
Univers
ity of
Mala
ya

212
and MB was highly dependent on the pH of the solution and on the surface charge
of the adsorbent as well as the pKa of the adsorbate. The optimal conditions of
BPA removal were obtained at pH of 3.0, adsorbent dose of 15.6 mg and contact
time of 120 min. However, the maximum removal efficiency of MB was observed
at the optimal conditions of pH 11.0, adsorbent dosage 12.3 mg and contact time
of 120 min.
6- The BPA and MB adsorption kinetics for the synthesized CNM-PAC hybrid were
well presented by pseudo-second order model suggesting chemisorption as the
feasible mechanism for adsorption and the adsorbent-adsorbate system studied
were mainly governed by external mass transport. The equilibrium adsorption data
for BPA and MB dye was well described by Langmuir isotherm model indicating
a monolayer adsorption on a homogeneous surface with a maximum adsorption
capacity of 181.81 and 250 mg/g, respectively.
It is obvious from the results that the synthesized CNM-PAC hybrid was obtained
at the lowest growth time, while the quality of obtained material was not
compromised. This reduce the overall cost and energy use for synthesizing CNMs,
not to mention that the growth of CNM on PAC produced a multi-structure
network and unlike other CNMs prepared on metal oxides or silica substrates can
be used directly in the adsorption processes without removing the substrate from
the product.
Univers
ity of
Mala
ya

213
8.1.2 Synthesizing of carbon nanomaterials on powder activated substrate from
acetylene decomposition
Referring to the experimental observations discussed in Chapter 6 and Chapter 7, the
key findings can be summarized as following:
1- The synthesizing conditions of CNM-PAC (growth temperature, reaction time and
gas ratio) from C2H2 decomposition were optimized using the RSM-CCD method.
The yield % of the CNM-PAC and removal % of MB were investigated as growth
process responses. The optimization method showed the optimal conditions were
achieved at reaction temperature of 550, growth duration of 37.3 min and gas ratio
of 1.0. The process optimization resulted in CNM-PAC with maximum possible
yield and adsorption performance within the experimental ranges studied.
2- The experimental design results for the growth process revealed that the reaction
temperature was notably influenced the growth of CNM-PAC. However,
conducting the reaction at higher temperatures (750 ºC) was unsuitable which
could be attribute to the catalyst deactivation.
3- From the statistical results obtained (ANOVA), it is shown that the regression
models proposed were significant and adequate to predict the CNM-PAC yield and
MB removal efficiency within the experimental range of variables selected.
4- The characterization studies of the synthesized CNM-PAC at the optimal growth
conditions (O-CNT) showed that the physiochemical properties such as the surface
area, porosity, and thermal stability were enhanced by the growth of the CNTs.
TEM images of O-CNT showed the presence of tubular CNT bundles (diameter,
15–20 nm) on the PAC surface which further demonstrates the incorporation and
the growth of CNTs in the obtained hybrid. Raman spectroscopy confirmed the
high degree of graphitization of the as-synthesized O-CNT which likely
Univers
ity of
Mala
ya

214
significantly influenced by the nature of the support. The combustion profile
suggested the higher thermal stability and purity for O-CNTs and the surface areas
O-CNT was about 3 times greater than the PAC substrate and the pore volume also
increased with the growth of the CNTs. Results of the zeta potential measurement
showed that the surface of the hybrid O-CNT was negatively charged with point
of zero charge of 8.0.
5- The primary screening adsorption experiments indicated that the as-synthesized
O-CNT has the same removal efficiency of MB as the modified sample (KS-CNT).
This reduces the overall cost and thus contribute towards fulfilling the
optimization, kinetic and isotherm studies on O-CNT adsorbent.
6- The optimum MB removal conditions suggested by the RSM-CCD optimization
method were found at pH 11, adsorbent dosage of 18.1 mg and contact time of 128
min. The MB adsorption system was accurately fitted by the pseudo-second order
kinetic model and the adsorption data was perfectly described by Langmuir
isotherm with the maximum adsorption capacity (qm) of 174.52 mg/g.
7- The collected data suggests that electrostatic attraction was the dominant
mechanism for the removal of MB onto O-CNT adsorbent, but the π–π should not
be ruled out as a contributing sorption mechanism. Moreover, the intraparticle
diffusion was also likely to control the rate at which MB was adsorbed on O-CNT
hybrid.
Our findings contribute towards successful developing of hybrid carbon nanomaterial
by simple, optimized and inexpensive procedure to be used as an efficient adsorbent for
BPA and MB dye from aqueous solution. Furthermore, the utilization of PAC as support
provided significantly increases the activity toward the production of carbon
nanostructures by enhancing the electronic interaction with the deposited gaseous
Univers
ity of
Mala
ya

215
reactant mixture. The nanoscopic structure covering the surface of the PAC host is
expected to provide a highly accessible surface for reactants, which could significantly
increase the catalytic activity. Not to mention, the high reactivity of the prismatic planes
of the PAC allowed better dispersion of the metal particles, contributing to the overall
improvement in active site density.
8.2 Recommendations
Although the synthesizing of carbon nanomaterials with the aid of powder activated
carbon substrate for adsorption Bisphenol A and methylene blue dye was very effective
and efficient, there remain scope of further study in this field. Hence, the following are
recommendations that can proposed to boost the research:
1- The scaling up of the CVD reactor by comprising a continuous reaction to produce
substantial quantity of the CNM-PAC hybrid should be considered to meet the
requirement of the industry.
2- Other metals such as Co, Mo and Fe can be used individually or as mixtures to
investigate the effect of catalyst on the morphology of the produced CNM-PAC.
3- Different dyes, hazardous organic pollutants and bio-pollutants other than
bisphenol A and methylene blue required to be tested on the CNM-PAC.
4- It is expected that the growth of such nanostructured material will open
opportunities for its use as a catalyst support compared with what is usually
obtained on traditional catalyst supports. It is suggested to further investigate the
impact of the synthesized CNM-PAC in heterogeneous catalysis.
5- The adsorption process can be further augmented by: (i) Desorption study to
regenerate the spent CNM-PAC is also required for more sustainable and
environment friendly system (ii) utilizing the synthesized CNM-PAC material in
a fixed bed column to study the breakthrough conditions of the adsorption system,
Univers
ity of
Mala
ya

216
(iii) It is recommended to further evaluate the adsorption performance of the
synthesized CNM-PAC hybrid in this study for removing BPA and MB dye from
different industrial process to analyze the behavior of the synthesized adsorbent
in a competitive system.
6- Further investigation of the synthesized CNM-PAC hybrid in this study in other
applications including photocatalysis, membrane and sensing systems.
Univers
ity of
Mala
ya

217
REFERENCES
Abdel-Ghani, N., Rawash, E., & El-Chaghaby, G. (2016). Equilibrium and kinetic study
for the adsorption of p-nitrophenol from wastewater using olive cake based
activated carbon. Global Journal of Environmental Science and Management,
2(1), 11-18.
Abdel-Ghani, N. T., El-Chaghaby, G. A., & Helal, F. S. (2015). Individual and
competitive adsorption of phenol and nickel onto multiwalled carbon nanotubes.
Journal of advanced research, 6(3), 405-415.
Abdel-Shafy, H. I., & Mansour, M. S. (2016). A review on polycyclic aromatic
hydrocarbons: source, environmental impact, effect on human health and
remediation. Egyptian Journal of Petroleum, 25(1), 107-123.
Abdel Salam, M., & Burk, R. C. (2008). Thermodynamics of pentachlorophenol
adsorption from aqueous solutions by oxidized multi-walled carbon nanotubes.
Applied Surface Science, 255(5, Part 1), 1975-1981.
Abkenar, S. S., Malek, R. M. A., & Mazaheri, F. (2015). Dye adsorption of cotton
fabric grafted with PPI dendrimers: Isotherm and kinetic studies. Journal of
environmental management, 163, 53-61.
Abou-Gamra, Z., & Ahmed, M. (2016). Synthesis of mesoporous TiO 2–curcumin
nanoparticles for photocatalytic degradation of methylene blue dye. Journal of
Photochemistry and Photobiology B: Biology, 160, 134-141.
Acomb, J. C., Wu, C., & Williams, P. T. (2015). Effect of growth temperature and
feedstock:catalyst ratio on the production of carbon nanotubes and hydrogen
from the pyrolysis of waste plastics. Journal of Analytical and Applied
Pyrolysis, 113(Supplement C), 231-238.
Adamska, M., & Narkiewicz, U. (2017). Fluorination of Carbon Nanotubes− A Review.
Journal of Fluorine Chemistry, 200, 179-189.
Adeleye, A. S., Conway, J. R., Garner, K., Huang, Y., Su, Y., & Keller, A. A. (2016).
Engineered nanomaterials for water treatment and remediation: Costs, benefits,
and applicability. Chemical Engineering Journal, 286(Supplement C), 640-662.
Adewale, H. B., Jefferson, W. N., Newbold, R. R., & Patisaul, H. B. (2009). Neonatal
Bisphenol-A Exposure Alters Rat Reproductive Development and Ovarian
Morphology Without Impairing Activation of Gonadotropin-Releasing Hormone
Neurons 1. Biology of reproduction, 81(4), 690-699.
Agnihotri, S., Mota, J. P., Rostam-Abadi, M., & Rood, M. J. (2006). Theoretical and
experimental investigation of morphology and temperature effects on adsorption
of organic vapors in single-walled carbon nanotubes. The Journal of Physical
Chemistry B, 110(15), 7640-7647.
Ago, H., Nakamura, K., Uehara, N., & Tsuji, M. (2004). Roles of metal− support
interaction in growth of single-and double-walled carbon nanotubes studied with
Univers
ity of
Mala
ya
218
diameter-controlled iron particles supported on MgO. The Journal of Physical
Chemistry B, 108(49), 18908-18915.
Ahmad, A., Loh, M., & Aziz, J. (2007). Preparation and characterization of activated
carbon from oil palm wood and its evaluation on methylene blue adsorption.
Dyes and pigments, 75(2), 263-272.
Ahmad, A., Razali, M. H., Kassim, K., & Amin, K. A. M. (2017). Synthesis of
multiwalled carbon nanotubes supported on M/MCM-41 (M= Ni, Co and Fe)
mesoporous catalyst by chemical vapour deposition method. Journal of Porous
Materials, 1-9.
Ahmad, I., Yazdani, B., & Zhu, Y. (2015). Recent advances on carbon nanotubes and
graphene reinforced ceramics nanocomposites. Nanomaterials, 5(1), 90-114.
Ai, L., & Jiang, J. (2012a). Removal of methylene blue from aqueous solution with self-
assembled cylindrical graphene–carbon nanotube hybrid. Chemical Engineering
Journal, 192(Supplement C), 156-163.
Ai, L., & Jiang, J. (2012b). Removal of methylene blue from aqueous solution with self-
assembled cylindrical graphene–carbon nanotube hybrid. Chemical Engineering
Journal, 192, 156-163.
Ai, L., Zhang, C., & Chen, Z. (2011). Removal of methylene blue from aqueous
solution by a solvothermal-synthesized graphene/magnetite composite. Journal
of hazardous materials, 192(3), 1515-1524.
Ai, L., Zhang, C., Liao, F., Wang, Y., Li, M., Meng, L., & Jiang, J. (2011). Removal of
methylene blue from aqueous solution with magnetite loaded multi-wall carbon
nanotube: kinetic, isotherm and mechanism analysis. Journal of hazardous
materials, 198, 282-290.
Aiello, R., Fiscus, J. E., zur Loye, H.-C., & Amiridis, M. D. (2000). Hydrogen
production via the direct cracking of methane over Ni/SiO 2: catalyst
deactivation and regeneration. Applied Catalysis A: General, 192(2), 227-234.
Akingbemi, B. T., Sottas, C. M., Koulova, A. I., Klinefelter, G. R., & Hardy, M. P.
(2004). Inhibition of testicular steroidogenesis by the xenoestrogen bisphenol A
is associated with reduced pituitary luteinizing hormone secretion and decreased
steroidogenic enzyme gene expression in rat Leydig cells. Endocrinology,
145(2), 592-603.
Al-Futaisi, A., Jamrah, A., & Al-Hanai, R. (2007). Aspects of cationic dye molecule
adsorption to palygorskite. Desalination, 214(1-3), 327-342.
Al-Hamadani, Y. A. J., Chu, K. H., Son, A., Heo, J., Her, N., Jang, M., . . . Yoon, Y.
(2015). Stabilization and dispersion of carbon nanomaterials in aqueous
solutions: A review. Separation and Purification Technology, 156, Part 2, 861-
874.
Allaedini, G., Aminayi, P., & Tasirin, S. M. (2015). The effect of alumina and magnesia
supported germanium nanoparticles on the growth of carbon nanotubes in the
chemical vapor deposition method. Journal of Nanomaterials, 2015, 5.
Univers
ity of
Mala
ya
219
Allaedini, G., Tasirin, S. M., & Aminayi, P. (2015). Synthesis of Fe–Ni–Ce trimetallic
catalyst nanoparticles via impregnation and co-precipitation and their
application to dye degradation. Chemical Papers, 70(2), 231-242.
Almeida, C. A. P., Debacher, N. A., Downs, A. J., Cottet, L., & Mello, C. A. D. (2009).
Removal of methylene blue from colored effluents by adsorption on
montmorillonite clay. Journal of colloid and interface science, 332(1), 46-53.
AlOmar, M. K., Alsaadi, M. A., Hayyan, M., Akib, S., Ibrahim, M., & Hashim, M. A.
(2017). Allyl triphenyl phosphonium bromide based DES-functionalized carbon
nanotubes for the removal of mercury from water. Chemosphere, 167, 44-52.
AlOmar, M. K., Alsaadi, M. A., Hayyan, M., Akib, S., Ibrahim, R. K., & Hashim, M.
A. (2016). Lead removal from water by choline chloride based deep eutectic
solvents functionalized carbon nanotubes. Journal of Molecular Liquids, 222,
883-894.
AlSaadi, M. A., Al-Mamun, A., Muyibi, S. A., Alam, M. Z., Sopyan, I., Atieh, M. A., &
Ahmed, Y. M. (2011). Synthesis of various carbon nanomaterials (CNMs) on
powdered activated carbon. African Journal of Biotechnology, 10(81), 18892-
18905.
Altıntıg, E., Altundag, H., Tuzen, M., & Sarı, A. (2017a). Effective removal of
methylene blue from aqueous solutions using magnetic loaded activated carbon
as novel adsorbent. Chemical Engineering Research and Design,
122(Supplement C), 151-163.
Altıntıg, E., Altundag, H., Tuzen, M., & Sarı, A. (2017b). Effective removal of
methylene blue from aqueous solutions using magnetic loaded activated carbon
as novel adsorbent. Chemical Engineering Research and Design, 122, 151-163.
Alvarez, W., Kitiyanan, B., Borgna, A., & Resasco, D. (2001). Synergism of Co and
Mo in the catalytic production of single-wall carbon nanotubes by
decomposition of CO. Carbon, 39(4), 547-558.
Amara, M. S., Paineau, E., Rouziere, S. p., Guiose, B. a., Krapf, M.-E. M., Taché, O., . .
. Thill, A. (2015). Hybrid, tunable-diameter, metal oxide nanotubes for trapping
of organic molecules. Chemistry of Materials, 27(5), 1488-1494.
Ampelli, C., Perathoner, S., & Centi, G. (2014). Carbon-based catalysts: Opening new
scenario to develop next-generation nano-engineered catalytic materials.
Chinese Journal of Catalysis, 35(6), 783-791.
Andrews, R., Jacques, D., Rao, A., Derbyshire, F., Qian, D., Fan, X., . . . Chen, J.
(1999). Continuous production of aligned carbon nanotubes: a step closer to
commercial realization. Chemical Physics Letters, 303(5), 467-474.
Angulakshmi, V., Sivakumar, N., & Karthikeyan, S. (2012). Response surface
methodology for optimizing process parameters for synthesis of carbon
nanotubes. J. Environ. Nanotechnol, 1(1), 40-45.
Annadurai, G., & Krishnan, M. (1996). Adsorption of basic dye using chitin. Indian J.
Environ. Protec, 16(6), 444-449.
Univers
ity of
Mala
ya

220
Ansari, R., Mosayebzadeh, Z., & Mohammad-khah, A. (2011). Adsorption of cationic
dyes from aqueous solutions using polyaniline conducting polymer as a novel
adsorbent. Journal of Advanced Scientific Research, 1(2), 27-34.
Ansari, S. Combination of molecularly imprinted polymers and carbon nanomaterials as
a versatile biosensing tool in sample analysis: Recent applications and
challenges. TrAC Trends in Analytical Chemistry.
Anwer, F., Chaurasia, S., & Khan, A. A. (2016). Hormonally active agents in the
environment: a state-of-the-art review. Reviews on environmental health, 31(4),
415-433.
Apul, O. G., & Karanfil, T. (2015). Adsorption of synthetic organic contaminants by
carbon nanotubes: a critical review. Water research, 68, 34-55.
Aqel, A., El-Nour, K. M. A., Ammar, R. A., & Al-Warthan, A. (2012). Carbon
nanotubes, science and technology part (I) structure, synthesis and
characterisation. Arabian Journal of Chemistry, 5(1), 1-23.
Arora, N., & Sharma, N. (2016). Synthesis of multiwalled carbon nanotube from
different grades of carbon black using arc discharge method. Paper presented at
the AIP Conference Proceedings.
Asfaram, A., Ghaedi, M., Hajati, S., Rezaeinejad, M., Goudarzi, A., & Purkait, M. K.
(2015). Rapid removal of Auramine-O and Methylene blue by ZnS:Cu
nanoparticles loaded on activated carbon: A response surface methodology
approach. Journal of the Taiwan Institute of Chemical Engineers,
53(Supplement C), 80-91.
Asfaram, A., Ghaedi, M., Yousefi, F., & Dastkhoon, M. (2016). Experimental design
and modeling of ultrasound assisted simultaneous adsorption of cationic dyes
onto ZnS: Mn-NPs-AC from binary mixture. Ultrasonics sonochemistry, 33, 77-
89.
Ashik, U. P. M., Wan Daud, W. M. A., & Hayashi, J.-i. (2017). A review on methane
transformation to hydrogen and nanocarbon: Relevance of catalyst
characteristics and experimental parameters on yield. Renewable and
Sustainable Energy Reviews, 76, 743-767.
Ashraf, A., Salih, H., Nam, S., & Dastgheib, S. A. (2016). Robust carbon nanotube
membranes directly grown on Hastelloy substrates and their potential
application for membrane distillation. Carbon, 106, 243-251.
Asmaly, H. A., Abussaud, B., Saleh, T. A., Gupta, V. K., & Atieh, M. A. (2015). Ferric
oxide nanoparticles decorated carbon nanotubes and carbon nanofibers: from
synthesis to enhanced removal of phenol. Journal of Saudi Chemical Society,
19(5), 511-520.
Atchudan, R., Perumal, S., Edison, T. N. J. I., & Lee, Y. R. (2015). Highly graphitic
carbon nanosheets synthesized over tailored mesoporous molecular sieves using
acetylene by chemical vapor deposition method. RSC Advances, 5(113), 93364-
93373.
Univers
ity of
Mala
ya

221
Atthipalli, G., Epur, R., Kumta, P. N., Yang, M., Lee, J.-K., & Gray, J. L. (2011).
Nickel catalyst-assisted vertical growth of dense carbon nanotube forests on
bulk copper. The Journal of Physical Chemistry C, 115(9), 3534-3538.
Auta, M., & Hameed, B. (2012a). Modified mesoporous clay adsorbent for adsorption
isotherm and kinetics of methylene blue. Chemical Engineering Journal, 198,
219-227.
Auta, M., & Hameed, B. H. (2012b). Modified mesoporous clay adsorbent for
adsorption isotherm and kinetics of methylene blue. Chemical Engineering
Journal, 198(Supplement C), 219-227.
Avilés, F., Cauich-Rodríguez, J., Moo-Tah, L., May-Pat, A., & Vargas-Coronado, R.
(2009). Evaluation of mild acid oxidation treatments for MWCNT
functionalization. Carbon, 47(13), 2970-2975.
Avilés, F., de Jesús Kú-Herrera, J., & Oliva-Avilés, A. I. (2017). Deposition of Carbon
Nanotubes on Fibers. Carbon Nanotube-Reinforced Polymers: From Nanoscale
to Macroscale, 117.
Awadallah, A. E., El-Desouki, D. S., Aboul-Gheit, N. A., Ibrahim, A. H., & Aboul-
Gheit, A. K. (2016). Effect of crystalline structure and pore geometry of silica
based supported materials on the catalytic behavior of metallic nickel particles
during methane decomposition to COx-free hydrogen and carbon nanomaterials.
International Journal of Hydrogen Energy, 41(38), 16890-16902.
Azevedo, D. d. A., Lacorte, S., Viana, P., & Barceló, D. (2001). Occurrence of
nonylphenol and bisphenol-A in surface waters from Portugal. Journal of the
Brazilian Chemical Society, 12(4), 532-537.
Baker, R., Barber, M., Harris, P., Feates, F., & Waite, R. (1972). Nucleation and growth
of carbon deposits from the nickel catalyzed decomposition of acetylene.
Journal of catalysis, 26(1), 51-62.
Balandin, A. A. (2011). Thermal properties of graphene and nanostructured carbon
materials. Nature materials, 10(8), 569-581.
Balarak, D. (2016). Kinetics, isotherm and thermodynamics studies on bisphenol A
adsorption using barley husk. International Journal of ChemTech Research,
9(5), 681-690.
Basheer, C., Lee, H. K., & Tan, K. S. (2004). Endocrine disrupting alkylphenols and
bisphenol-A in coastal waters and supermarket seafood from Singapore. Marine
pollution bulletin, 48(11), 1161-1167.
Bashir, R., & Chisti, H. (2014). Nanotechnology for Environmental Control and
Remediation. Nanotechnology Applications for Improvements in Energy
Efficiency and Environmental Management, 156.
Bautista-Toledo, I., Ferro-Garcia, M., Rivera-Utrilla, J., Moreno-Castilla, C., & Vegas
Fernandez, F. (2005). Bisphenol A removal from water by activated carbon.
Effects of carbon characteristics and solution chemistry. Environmental science
& technology, 39(16), 6246-6250.
Univers
ity of
Mala
ya
222
Bautista-Toledo, M. I., Rivera-Utrilla, J., Ocampo-Pérez, R., Carrasco-Marín, F., &
Sánchez-Polo, M. (2014). Cooperative adsorption of bisphenol-A and
chromium(III) ions from water on activated carbons prepared from olive-mill
waste. Carbon, 73(Supplement C), 338-350.
Bayramoglu, G., Arica, M. Y., Liman, G., Celikbicak, O., & Salih, B. (2016). Removal
of bisphenol A from aqueous medium using molecularly surface imprinted
microbeads. Chemosphere, 150, 275-284.
Bazrafshan, E., Kord Mostafapour, F., Rahdar, S., & Mahvi, A. H. (2015). Equilibrium
and thermodynamics studies for decolorization of Reactive Black 5 (RB5) by
adsorption onto MWCNTs. Desalination and Water Treatment, 54(8), 2241-
2251.
Bedin, K. C., Martins, A. C., Cazetta, A. L., Pezoti, O., & Almeida, V. C. (2016). KOH-
activated carbon prepared from sucrose spherical carbon: Adsorption
equilibrium, kinetic and thermodynamic studies for Methylene Blue removal.
Chemical Engineering Journal, 286, 476-484.
Bele, S., Samanidou, V., & Deliyanni, E. (2016). Effect of the reduction degree of
graphene oxide on the adsorption of Bisphenol A. Chemical Engineering
Research and Design, 109, 573-585.
Berhane, T. M., Levy, J., Krekeler, M. P., & Danielson, N. D. (2016). Adsorption of
bisphenol A and ciprofloxacin by palygorskite-montmorillonite: Effect of
granule size, solution chemistry and temperature. Applied Clay Science, 132,
518-527.
Bhatnagar, A., & Anastopoulos, I. (2017). Adsorptive removal of bisphenol A (BPA)
from aqueous solution: A review. Chemosphere, 168, 885-902.
Bhattacharyya, K. G., & Sharma, A. (2005). Kinetics and thermodynamics of
Methylene Blue adsorption on Neem (Azadirachta indica) leaf powder. Dyes
and pigments, 65(1), 51-59.
Bigdeli, S., & Fatemi, S. (2015). Fast carbon nanofiber growth on the surface of
activated carbon by microwave irradiation: A modified nano-adsorbent for deep
desulfurization of liquid fuels. Chemical Engineering Journal, 269(Supplement
C), 306-315.
Bina, B., Pourzamani, H., Rashidi, A., & Amin, M. M. (2011). Ethylbenzene removal
by carbon nanotubes from aqueous solution. Journal of environmental and
public health, 2012.
Bohdziewicz, J., & Kamińska, G. (2013). Kinetics and equilibrium of the sorption of
bisphenol A by carbon nanotubes from wastewater. Water Science and
Technology, 68(6), 1306-1314.
Bom, D., Andrews, R., Jacques, D., Anthony, J., Chen, B., Meier, M. S., & Selegue, J.
P. (2002). Thermogravimetric analysis of the oxidation of multiwalled carbon
nanotubes: evidence for the role of defect sites in carbon nanotube chemistry.
Nano letters, 2(6), 615-619.
Univers
ity of
Mala
ya

223
Boulinguiez, B., Le Cloirec, P., & Wolbert, D. (2008). Revisiting the Determination of
Langmuir Parameters Application to Tetrahydrothiophene Adsorption onto
Activated Carbon. Langmuir, 24(13), 6420-6424.
Bradder, P., Ling, S. K., Wang, S., & Liu, S. (2010). Dye adsorption on layered graphite
oxide. Journal of Chemical & Engineering Data, 56(1), 138-141.
Burke, V., Duennbier, U., & Massmann, G. (2012). The effect of aeration on the
removal of wastewater-derived pharmaceutical residues from groundwater–A
laboratory study. Water Science and Technology, 67(3), 658-666.
Bystrzejewski, M., Rümmeli, M., Lange, H., Huczko, A., Baranowski, P., Gemming,
T., & Pichler, T. (2008). Single-walled carbon nanotubes synthesis: a direct
comparison of laser ablation and carbon arc routes. Journal of nanoscience and
nanotechnology, 8(11), 6178-6186.
Cai, Y., Jiang, G., Liu, J., & Zhou, Q. (2003). Multiwalled carbon nanotubes as a solid-
phase extraction adsorbent for the determination of bisphenol A, 4-n-
nonylphenol, and 4-tert-octylphenol. Analytical Chemistry, 75(10), 2517-2521.
Careghini, A., Mastorgio, A. F., Saponaro, S., & Sezenna, E. (2015). Bisphenol A,
nonylphenols, benzophenones, and benzotriazoles in soils, groundwater, surface
water, sediments, and food: a review. Environmental science and pollution
Research, 22(8), 5711-5741.
Cassell, A. M., Raymakers, J. A., Kong, J., & Dai, H. (1999). Large scale CVD
synthesis of single-walled carbon nanotubes. The Journal of Physical Chemistry
B, 103(31), 6484-6492.
Céspedes, R., Lacorte, S., Raldúa, D., Ginebreda, A., Barceló, D., & Piña, B. (2005).
Distribution of endocrine disruptors in the Llobregat River basin (Catalonia, NE
Spain). Chemosphere, 61(11), 1710-1719.
Chai, S.-P., Lee, K.-Y., Ichikawa, S., & Mohamed, A. R. (2011). Synthesis of carbon
nanotubes by methane decomposition over Co–Mo/Al 2 O 3: Process study and
optimization using response surface methodology. Applied Catalysis A:
General, 396(1), 52-58.
Chang, K.-L., Hsieh, J.-F., Ou, B.-M., Chang, M.-H., Hseih, W.-Y., Lin, J.-H., . . .
Chen, S.-T. (2012). Adsorption studies on the removal of an endocrine-
disrupting compound (Bisphenol A) using activated carbon from rice straw
agricultural waste. Separation Science and Technology, 47(10), 1514-1521.
Chellaram, C., Murugaboopathi, G., John, A. A., Sivakumar, R., Ganesan, S., Krithika,
S., & Priya, G. (2014). Significance of Nanotechnology in Food Industry.
APCBEE Procedia, 8(Supplement C), 109-113.
Chen, C.-C., Kuo, C.-J., Liao, C.-D., Chang, C.-F., Tseng, C.-A., Liu, C.-R., & Chen,
Y.-T. (2015). Growth of large-area graphene single crystals in confined reaction
space with diffusion-driven chemical vapor deposition. Chemistry of Materials,
27(18), 6249-6258.
Univers
ity of
Mala
ya

224
Chen, D., Kannan, K., Tan, H., Zheng, Z., Feng, Y.-L., Wu, Y., & Widelka, M. (2016).
Bisphenol Analogues Other Than BPA: Environmental Occurrence, Human
Exposure, and Toxicity A Review. Environmental science & technology,
50(11), 5438-5453.
Chen, G.-C., Shan, X.-Q., Pei, Z.-G., Wang, H., Zheng, L.-R., Zhang, J., & Xie, Y.-N.
(2011). Adsorption of diuron and dichlobenil on multiwalled carbon nanotubes
as affected by lead. Journal of Hazardous Materials, 188(1–3), 156-163.
Chen, G.-C., Shan, X.-Q., Wang, Y.-S., Wen, B., Pei, Z.-G., Xie, Y.-N., . . . Pignatello,
J. J. (2009). Adsorption of 2,4,6-trichlorophenol by multi-walled carbon
nanotubes as affected by Cu(II). Water Research, 43(9), 2409-2418.
Chen, J., Hamon, M. A., Hu, H., Chen, Y., Rao, A. M., Eklund, P. C., & Haddon, R. C.
(1998). Solution properties of single-walled carbon nanotubes. science,
282(5386), 95-98.
Chen, J., Huang, X., & Lee, D. (2008). Bisphenol A removal by a membrane bioreactor.
Process Biochemistry, 43(4), 451-456.
Chen, J. S. (2015). Selective growth of carbon nanotubes via photo-thermal chemical
vapour deposition. University of Surrey (United Kingdom).
Chen, L., & Bai, B. (2013). Equilibrium, kinetic, thermodynamic, and in situ
regeneration studies about methylene blue adsorption by the raspberry-like
TiO2@ yeast microspheres. Industrial & engineering chemistry research,
52(44), 15568-15577.
Chen, W., Duan, L., & Zhu, D. (2007). Adsorption of polar and nonpolar organic
chemicals to carbon nanotubes. Environmental science & technology, 41(24),
8295-8300.
Chen, X.-W., Su, D. S., Hamid, S. B., & Schlögl, R. (2007). The morphology, porosity
and productivity control of carbon nanofibers or nanotubes on modified
activated carbon. Carbon, 45(4), 895-898.
Chen, X.-W., Timpe, O., Hamid, S. B., Schlögl, R., & Su, D. S. (2009a). Direct
synthesis of carbon nanofibers on modified biomass-derived activated carbon.
Carbon, 47(1), 340-343.
Chen, X.-W., Timpe, O., Hamid, S. B. A., Schlögl, R., & Su, D. S. (2009b). Direct
synthesis of carbon nanofibers on modified biomass-derived activated carbon.
Carbon, 47(1), 340-343.
Cheng, H., Li, F., Su, G., Pan, H., He, L., Sun, X., & Dresselhaus, M. (1998). Large-
scale and low-cost synthesis of single-walled carbon nanotubes by the catalytic
pyrolysis of hydrocarbons. Applied physics letters, 72(25), 3282-3284.
Cheng, J., Zhang, X., Liu, F., Tu, J., Lu, H., Sun, Y., & Chen, F. (2004). Long bundles
of aligned carbon nanofibers obtained by vertical floating catalyst method.
Materials Chemistry and Physics, 87(2), 241-245.
Univers
ity of
Mala
ya
225
Cheng, Q., Debnath, S., Gregan, E., & Byrne, H. J. (2010). Ultrasound-assisted SWNTs
dispersion: effects of sonication parameters and solvent properties. The Journal
of Physical Chemistry C, 114(19), 8821-8827.
Cherifi, H., Fatiha, B., & Salah, H. (2013). Kinetic studies on the adsorption of
methylene blue onto vegetal fiber activated carbons. Applied surface science,
282, 52-59.
Cheung, C. L., Kurtz, A., Park, H., & Lieber, C. M. (2002). Diameter-controlled
synthesis of carbon nanotubes. The Journal of Physical Chemistry B, 106(10),
2429-2433.
Cho, H.-H., Huang, H., & Schwab, K. (2011). Effects of Solution Chemistry on the
Adsorption of Ibuprofen and Triclosan onto Carbon Nanotubes. Langmuir,
27(21), 12960-12967.
Cho, H.-H., Smith, B. A., Wnuk, J. D., Fairbrother, D. H., & Ball, W. P. (2008).
Influence of surface oxides on the adsorption of naphthalene onto multiwalled
carbon nanotubes. Environmental science & technology, 42(8), 2899-2905.
Chowdhury, S., & Balasubramanian, R. (2014). Recent advances in the use of
graphene-family nanoadsorbents for removal of toxic pollutants from
wastewater. Advances in colloid and interface science, 204(Supplement C), 35-
56.
Chuenchom, L., Kraehnert, R., & Smarsly, B. M. (2012). Recent progress in soft-
templating of porous carbon materials. Soft Matter, 8(42), 10801-10812.
Ci, L., Zhu, H., Wei, B., Xu, C., Liang, J., & Wu, D. (2000). Graphitization behavior of
carbon nanofibers prepared by the floating catalyst method. Materials Letters,
43(5), 291-294.
Colomer, J.-F., Stephan, C., Lefrant, S., Van Tendeloo, G., Willems, I., Konya, Z., . . .
Nagy, J. B. (2000). Large-scale synthesis of single-wall carbon nanotubes by
catalytic chemical vapor deposition (CCVD) method. Chemical Physics Letters,
317(1), 83-89.
Cong, H.-P., Ren, X.-C., Wang, P., & Yu, S.-H. (2012). Macroscopic multifunctional
graphene-based hydrogels and aerogels by a metal ion induced self-assembly
process. ACS nano, 6(3), 2693-2703.
Contreras, J. E., Rodriguez, E. A., & Taha-Tijerina, J. (2017). Nanotechnology
applications for electrical transformers—A review. Electric Power Systems
Research, 143(Supplement C), 573-584.
Costa, S., Borowiak-Palen, E., Kruszynska, M., Bachmatiuk, A., & Kalenczuk, R.
(2008). Characterization of carbon nanotubes by Raman spectroscopy. Materials
Science-Poland, 26(2), 433-441.
Cottet, L., Almeida, C., Naidek, N., Viante, M., Lopes, M., & Debacher, N. (2014).
Adsorption characteristics of montmorillonite clay modified with iron oxide
with respect to methylene blue in aqueous media. Applied Clay Science, 95, 25-
31.
Univers
ity of
Mala
ya

226
Cousins, I., Staples, C., Kleĉka, G., & Mackay, D. (2002). A multimedia assessment of
the environmental fate of bisphenol A. Human and Ecological Risk Assessment,
8(5), 1107-1135.
Couteau, E., Hernadi, K., Seo, J. W., Thien-Nga, L., Mikó, C., Gaal, R., & Forro, L.
(2003). CVD synthesis of high-purity multiwalled carbon nanotubes using
CaCO 3 catalyst support for large-scale production. Chemical Physics Letters,
378(1), 9-17.
Crini, G. (2008). Kinetic and equilibrium studies on the removal of cationic dyes from
aqueous solution by adsorption onto a cyclodextrin polymer. Dyes and pigments,
77(2), 415-426.
Cui, L., Wei, J., Du, X., & Zhou, X. (2016). Preparation and Evaluation of Self-
Assembled Porous Microspheres–Fibers for Removal of Bisphenol A from
Aqueous Solution. Industrial & engineering chemistry research, 55(6), 1566-
1574.
Cumings, J., Mickelson, W., & Zettl, A. (2003). Simplified synthesis of double-wall
carbon nanotubes. Solid State Communications, 126(6), 359-362.
Dai, H., Hafner, J. H., Rinzler, A. G., Colbert, D. T., & Smalley, R. E. (1996).
Nanotubes as nanoprobes in scanning probe microscopy. nature, 384(6605),
147.
Dalaran, M., Emik, S., Güçlü, G., İyim, T. B., & Özgümüş, S. (2009). Removal of
acidic dye from aqueous solutions using poly (DMAEMA–AMPS–HEMA)
terpolymer/MMT nanocomposite hydrogels. Polymer Bulletin, 63(2), 159-171.
Das, R., Vecitis, C. D., Schulze, A., Cao, B., Ismail, A. F., Lu, X., . . . Ramakrishna, S.
(2017). Recent advances in nanomaterials for water protection and monitoring.
Chemical Society Reviews.
Datsyuk, V., Kalyva, M., Papagelis, K., Parthenios, J., Tasis, D., Siokou, A., . . .
Galiotis, C. (2008). Chemical oxidation of multiwalled carbon nanotubes.
Carbon, 46(6), 833-840.
Davis, W., Slawson, R., & Rigby, G. (1953). An unusual form of carbon. nature,
171(4356), 756-756.
De Greef, N., Zhang, L., Magrez, A., Forró, L., Locquet, J.-P., Verpoest, I., & Seo, J.
W. (2015). Direct growth of carbon nanotubes on carbon fibers: Effect of the
CVD parameters on the degradation of mechanical properties of carbon fibers.
Diamond and Related Materials, 51, 39-48.
De La Cueva Bueno, P., Gillerman, L., Gehr, R., & Oron, G. (2017). Nanotechnology
for sustainable wastewater treatment and use for agricultural production: A
comparative long-term study. Water research, 110(Supplement C), 66-73.
de la Luz-Asunción, M., Sánchez-Mendieta, V., Martínez-Hernández, A., Castaño, V.,
& Velasco-Santos, C. (2015). Adsorption of phenol from aqueous solutions by
carbon nanomaterials of one and two dimensions: kinetic and equilibrium
studies. Journal of Nanomaterials, 16(1), 422.
Univers
ity of
Mala
ya

227
De Volder, M. F. L., Tawfick, S. H., Baughman, R. H., & Hart, A. J. (2013). Carbon
Nanotubes: Present and Future Commercial Applications. science, 339(6119),
535-539.
Dehghani, M. H., Ghadermazi, M., Bhatnagar, A., Sadighara, P., Jahed-Khaniki, G.,
Heibati, B., & McKay, G. (2016). Adsorptive removal of endocrine disrupting
bisphenol A from aqueous solution using chitosan. Journal of Environmental
Chemical Engineering, 4(3), 2647-2655.
Dehghani, M. H., Mahvi, A. H., Rastkari, N., Saeedi, R., Nazmara, S., & Iravani, E.
(2015). Adsorption of bisphenol A (BPA) from aqueous solutions by carbon
nanotubes: kinetic and equilibrium studies. Desalination and Water Treatment,
54(1), 84-92.
Delzeit, L., McAninch, I., Cruden, B. A., Hash, D., Chen, B., Han, J., & Meyyappan,
M. (2002). Growth of multiwall carbon nanotubes in an inductively coupled
plasma reactor. Journal of Applied Physics, 91(9), 6027-6033.
Demir, H., Top, A., Balköse, D., & Ülkü, S. (2008). Dye adsorption behavior of Luffa
cylindrica fibers. Journal of hazardous materials, 153(1–2), 389-394.
Deng, H., Lu, J., Li, G., Zhang, G., & Wang, X. (2011). Adsorption of methylene blue
on adsorbent materials produced from cotton stalk. Chemical Engineering
Journal, 172(1), 326-334.
Dikonimos Makris, T., Giorgi, L., Giorgi, R., Lisi, N., & Salernitano, E. (2005). CNT
growth on alumina supported nickel catalyst by thermal CVD. Diamond and
Related Materials, 14(3), 815-819.
Dillon, A., Gennett, T., Parilla, P., Alleman, J., Jones, K., & Heben, M. (2000).
Evaluating the purity of single-wall nanotube materials. Paper presented at the
MRS Proceedings.
Ding, D., Wang, J., Cao, Z., & Dai, J. (2003). Synthesis of carbon nanostructures on
nanocrystalline Ni–Ni 3 P catalyst supported by SiC whiskers. Carbon, 41(3),
579-582.
Diring, S., Furukawa, S., Takashima, Y., Tsuruoka, T., & Kitagawa, S. (2010).
Controlled multiscale synthesis of porous coordination polymer in nano/micro
regimes. Chemistry of Materials, 22(16), 4531-4538.
Dong, Y., Wu, D., Chen, X., & Lin, Y. (2010). Adsorption of bisphenol A from water
by surfactant-modified zeolite. Journal of colloid and interface science, 348(2),
585-590.
Dotto, G., Santos, J., Rodrigues, I., Rosa, R., Pavan, F., & Lima, E. (2015). Adsorption
of Methylene Blue by ultrasonic surface modified chitin. Journal of colloid and
interface science, 446, 133-140.
Doustan, F., & Pasha, M. A. (2016). Growth of carbon nanotubes over Fe-Co and Ni-
Co catalysts supported on different phases of TiO2 substrate by thermal CVD.
Fullerenes, Nanotubes and Carbon Nanostructures, 24(1), 25-33.
Univers
ity of
Mala
ya

228
Dresselhaus, M. S., Jorio, A., Hofmann, M., Dresselhaus, G., & Saito, R. (2010).
Perspectives on carbon nanotubes and graphene Raman spectroscopy. Nano
letters, 10(3), 751-758.
Duman, O., Tunç, S., Polat, T. G., & Bozoğlan, B. K. (2016). Synthesis of magnetic
oxidized multiwalled carbon nanotube-κ-carrageenan-Fe3O4 nanocomposite
adsorbent and its application in cationic Methylene Blue dye adsorption.
Carbohydrate Polymers, 147, 79-88.
Dutta, S., Bhattacharyya, A., Ganguly, A., Gupta, S., & Basu, S. (2011). Application of
Response Surface Methodology for preparation of low-cost adsorbent from
citrus fruit peel and for removal of Methylene Blue. Desalination, 275(1), 26-
36.
Ebele, A. J., Abdallah, M. A.-E., & Harrad, S. (2017). Pharmaceuticals and personal
care products (PPCPs) in the freshwater aquatic environment. Emerging
Contaminants.
Efremenko, I., & Sheintuch, M. (2006). Predicting solute adsorption on activated
carbon: phenol. Langmuir, 22(8), 3614-3621.
Eggen, T., Moeder, M., & Arukwe, A. (2010). Municipal landfill leachates: a
significant source for new and emerging pollutants. Science of the Total
Environment, 408(21), 5147-5157.
Endo, M., Muramatsu, H., Hayashi, T., Kim, Y., Terrones, M., & Dresselhaus, M.
(2005). Nanotechnology:‘Buckypaper’from coaxial nanotubes. nature,
433(7025), 476-476.
Engel, M., & Chefetz, B. (2016). Adsorption and desorption of dissolved organic matter
by carbon nanotubes: Effects of solution chemistry. Environmental Pollution,
213(Supplement C), 90-98.
Ersan, G., Apul, O. G., Perreault, F., & Karanfil, T. (2017a). Adsorption of organic
contaminants by graphene nanosheets: A review. Water research,
126(Supplement C), 385-398.
Ersan, G., Apul, O. G., Perreault, F., & Karanfil, T. (2017b). Adsorption of organic
contaminants by graphene nanosheets: A review. Water research.
Etim, U., Inam, E., Umoren, S., & Eduok, U. (2013). Dye removal from aqueous
solution using coconut coir dust extract-modified polyvinyl alcohol: a novel
adsorbent. International Journal of Environment and Bioenergy, 5(2), 62-79.
Ezzeddine, Z., Batonneau-Gener, I., Pouilloux, Y., & Hamad, H. (2016). Removal of
methylene blue by mesoporous CMK-3: Kinetics, isotherms and
thermodynamics. Journal of Molecular Liquids, 223(Supplement C), 763-770.
Fan, S., Wang, Y., Wang, Z., Tang, J., Tang, J., & Li, X. (2017). Removal of methylene
blue from aqueous solution by sewage sludge-derived biochar: adsorption
kinetics, equilibrium, thermodynamics and mechanism. Journal of
Environmental Chemical Engineering, 5(1), 601-611.
Univers
ity of
Mala
ya

229
Fan, W., Gao, W., Zhang, C., Tjiu, W. W., Pan, J., & Liu, T. (2012). Hybridization of
graphene sheets and carbon-coated Fe 3 O 4 nanoparticles as a synergistic
adsorbent of organic dyes. Journal of Materials Chemistry, 22(48), 25108-
25115.
Farmany, A., Shirmohammadi, M., Kazemi, S., Hatami, M., & Mortazavi, S. (2016).
Aminopropyl functionalization of superparamagnetic iron oxide/SiO2
nanocrystals for adsorption of bisphenol A from water. Desalination and Water
Treatment, 57(56), 27355-27362.
Félix–Cañedo, T. E., Durán–Álvarez, J. C., & Jiménez–Cisneros, B. (2013). The
occurrence and distribution of a group of organic micropollutants in Mexico
City's water sources. Science of the Total Environment, 454, 109-118.
Feng, Y., Zhou, H., Liu, G., Qiao, J., Wang, J., Lu, H., . . . Wu, Y. (2012). Methylene
blue adsorption onto swede rape straw (Brassica napus L.) modified by tartaric
acid: equilibrium, kinetic and adsorption mechanisms. Bioresource technology,
125, 138-144.
Fernandes, R. M., Buzaglo, M., Regev, O., Marques, E. F., & Furo, I. n. (2015). Surface
coverage and competitive adsorption on carbon nanotubes. The Journal of
Physical Chemistry C, 119(38), 22190-22197.
Flahaut, E., Laurent, C., & Peigney, A. (2005). Catalytic CVD synthesis of double and
triple-walled carbon nanotubes by the control of the catalyst preparation.
Carbon, 43(2), 375-383.
Fonseca, A., Hernadi, K., Piedigrosso, P., Colomer, J.-F., Mukhopadhyay, K., Doome,
R., . . . Thiry, P. (1998). Synthesis of single-and multi-wall carbon nanotubes
over supported catalysts. Applied Physics A, 67(1), 11-22.
Foo, K., & Hameed, B. (2010). Insights into the modeling of adsorption isotherm
systems. Chemical Engineering Journal, 156(1), 2-10.
Franklin, N. R., Li, Y., Chen, R. J., Javey, A., & Dai, H. (2001). Patterned growth of
single-walled carbon nanotubes on full 4-inch wafers. Applied physics letters,
79(27), 4571-4573.
Franz, M., Arafat, H. A., & Pinto, N. G. (2000). Effect of chemical surface
heterogeneity on the adsorption mechanism of dissolved aromatics on activated
carbon. Carbon, 38(13), 1807-1819.
Freundlich, H. (1906). Over the adsorption in solution. J. Phys. Chem, 57(385471),
1100-1107.
Fu, J., Chen, Z., Wang, M., Liu, S., Zhang, J., Zhang, J., . . . Xu, Q. (2015). Adsorption
of methylene blue by a high-efficiency adsorbent (polydopamine microspheres):
kinetics, isotherm, thermodynamics and mechanism analysis. Chemical
Engineering Journal, 259, 53-61.
Fu, M., Li, Z., & Gao, H. (2007). Distribution characteristics of nonylphenol in
Jiaozhou Bay of Qingdao and its adjacent rivers. Chemosphere, 69(7), 1009-
1016.
Univers
ity of
Mala
ya

230
Gao, B., Zhou, H., Chen, D., & Yang, J. (2017). Porous carbon with small mesoporesas
an ultra-high capacity adsorption medium. Applied surface science,
420(Supplement C), 535-541.
Gao, Z., Bandosz, T. J., Zhao, Z., Han, M., & Qiu, J. (2009). Investigation of factors
affecting adsorption of transition metals on oxidized carbon nanotubes. Journal
of hazardous materials, 167(1), 357-365.
Garg, V. K., Amita, M., Kumar, R., & Gupta, R. (2004). Basic dye (methylene blue)
removal from simulated wastewater by adsorption using Indian Rosewood
sawdust: a timber industry waste. Dyes and pigments, 63(3), 243-250.
Ge, F., Ye, H., Li, M.-M., & Zhao, B.-X. (2012). Efficient removal of cationic dyes
from aqueous solution by polymer-modified magnetic nanoparticles. Chemical
Engineering Journal, 198, 11-17.
Ge, M., Du, M., Zheng, L., Wang, B., Zhou, X., Jia, Z., . . . Jahangir Alam, S. M.
(2017). A maleic anhydride grafted sugarcane bagasse adsorbent and its
performance on the removal of methylene blue from related wastewater.
Materials Chemistry and Physics, 192(Supplement C), 147-155.
Ghaedi, M., Ghayedi, M., Kokhdan, S. N., Sahraei, R., & Daneshfar, A. (2013).
Palladium, silver, and zinc oxide nanoparticles loaded on activated carbon as
adsorbent for removal of bromophenol red from aqueous solution. Journal of
Industrial and Engineering Chemistry, 19(4), 1209-1217.
Ghasemian, E., & Palizban, Z. (2016). Comparisons of azo dye adsorptions onto
activated carbon and silicon carbide nanoparticles loaded on activated carbon.
International Journal of Environmental Science and Technology, 13(2), 501-
512.
Gómez, S., Rendtorff, N. M., Aglietti, E. F., Sakka, Y., & Suárez, G. (2016). Surface
modification of multiwall carbon nanotubes by sulfonitric treatment. Applied
surface science, 379(Supplement C), 264-269.
Gong, J.-L., Wang, B., Zeng, G.-M., Yang, C.-P., Niu, C.-G., Niu, Q.-Y., . . . Liang, Y.
(2009). Removal of cationic dyes from aqueous solution using magnetic multi-
wall carbon nanotube nanocomposite as adsorbent. Journal of hazardous
materials, 164(2), 1517-1522.
Gong, J., Liu, J., Chen, X., Jiang, Z., Wen, X., Mijowska, E., & Tang, T. (2015).
Converting real-world mixed waste plastics into porous carbon nanosheets with
excellent performance in the adsorption of an organic dye from wastewater.
Journal of Materials Chemistry A, 3(1), 341-351.
Gong, J., Liu, J., Jiang, Z., Wen, X., Mijowska, E., Tang, T., & Chen, X. (2015). A
facile approach to prepare porous cup-stacked carbon nanotube with high
performance in adsorption of methylene blue. Journal of colloid and interface
science, 445, 195-204.
Gong, Z., Li, S., Ma, J., & Zhang, X. (2016). Synthesis of recyclable powdered
activated carbon with temperature responsive polymer for bisphenol A removal.
Separation and Purification Technology, 157, 131-140.
Univers
ity of
Mala
ya

231
Gotovac, S., Song, L., Kanoh, H., & Kaneko, K. (2007). Assembly structure control of
single wall carbon nanotubes with liquid phase naphthalene adsorption. Colloids
and Surfaces A: Physicochemical and Engineering Aspects, 300(1), 117-121.
Griffith, D. R. (2013). Natural and synthetic estrogens in wastewater treatment plant
effluent and the coastal ocean. Massachusetts Institute of Technology and
Woods Hole Oceanographic Institution.
Gromov, D. G., Bulyarskii, S., Pavlov, A., Scorik, S., Shulyat'ev, A., & Trifonov, A. Y.
(2016). Catalytic CVD-growth of array of multiwall carbon nanotubes on
initially amorphous film Co–Zr–N–O. Diamond and Related Materials,
64(Supplement C), 97-102.
Guerra, J., & Herrero, M. A. (2010). Hybrid materials based on Pd nanoparticles on
carbon nanostructures for environmentally benign C–C coupling chemistry.
Nanoscale, 2(8), 1390-1400.
Guerra, P., Kim, M., Teslic, S., Alaee, M., & Smyth, S. A. (2015). Bisphenol-A
removal in various wastewater treatment processes: Operational conditions,
mass balance, and optimization. Journal of environmental management, 152,
192-200.
Gui, C.-X., Wang, Q.-Q., Hao, S.-M., Qu, J., Huang, P.-P., Cao, C.-Y., . . . Yu, Z.-Z.
(2014). Sandwichlike magnesium silicate/reduced graphene oxide
nanocomposite for enhanced Pb2+ and methylene blue adsorption. ACS applied
materials & interfaces, 6(16), 14653-14659.
Gulnaz, O., Kaya, A., Matyar, F., & Arikan, B. (2004). Sorption of basic dyes from
aqueous solution by activated sludge. Journal of hazardous materials, 108(3),
183-188.
Guo, W., Hu, W., Pan, J., Zhou, H., Guan, W., Wang, X., . . . Xu, L. (2011). Selective
adsorption and separation of BPA from aqueous solution using novel
molecularly imprinted polymers based on kaolinite/Fe 3 O 4 composites.
Chemical Engineering Journal, 171(2), 603-611.
Gupta, V., & Nayak, A. (2012). Cadmium removal and recovery from aqueous
solutions by novel adsorbents prepared from orange peel and Fe 2 O 3
nanoparticles. Chemical Engineering Journal, 180, 81-90.
Gupta, V. K., Ali, I., Saleh, T. A., Nayak, A., & Agarwal, S. (2012). Chemical
treatment technologies for waste-water recycling—an overview. RSC Advances,
2(16), 6380-6388.
Gupta, V. K., Jain, R., Mittal, A., Saleh, T. A., Nayak, A., Agarwal, S., & Sikarwar, S.
(2012). Photo-catalytic degradation of toxic dye amaranth on TiO 2/UV in
aqueous suspensions. Materials Science and Engineering: C, 32(1), 12-17.
Gupta, V. K., Jain, R., Nayak, A., Agarwal, S., & Shrivastava, M. (2011). Removal of
the hazardous dye—tartrazine by photodegradation on titanium dioxide surface.
Materials Science and Engineering: C, 31(5), 1062-1067.
Univers
ity of
Mala
ya

232
Gupta, V. K., Kumar, R., Nayak, A., Saleh, T. A., & Barakat, M. (2013). Adsorptive
removal of dyes from aqueous solution onto carbon nanotubes: a review.
Advances in colloid and interface science, 193, 24-34.
Gupta, V. K., Mittal, A., & Gajbe, V. (2005). Adsorption and desorption studies of a
water soluble dye, Quinoline Yellow, using waste materials. Journal of colloid
and interface science, 284(1), 89-98.
Gupta, V. K., Nayak, A., & Agarwal, S. (2015). Bioadsorbents for remediation of heavy
metals: current status and their future prospects. Environmental Engineering
Research, 20(1), 1-18.
Gupta, V. K., & Saleh, T. A. (2013). Sorption of pollutants by porous carbon, carbon
nanotubes and fullerene- An overview. Environmental science and pollution
Research, 20(5), 2828-2843.
Gurr, E. (2012). Synthetic dyes in biology, medicine and chemistry: Elsevier.
Hamdaoui, O. (2006). Batch study of liquid-phase adsorption of methylene blue using
cedar sawdust and crushed brick. Journal of hazardous materials, 135(1), 264-
273.
Hamdaoui, Q., & Chiha, M. (2007). Removal of methylene blue from aqueous solutions
by wheat bran. Acta Chimica Slovenica, 54(2), 407.
Hameed, B., Din, A. M., & Ahmad, A. (2007). Adsorption of methylene blue onto
bamboo-based activated carbon: kinetics and equilibrium studies. Journal of
hazardous materials, 141(3), 819-825.
Hameed, B. H. (2009). Spent tea leaves: a new non-conventional and low-cost
adsorbent for removal of basic dye from aqueous solutions. Journal of
hazardous materials, 161(2), 753-759.
Han, S., Wu, D., Li, S., Zhang, F., & Feng, X. (2014). Porous graphene materials for
advanced electrochemical energy storage and conversion devices. Advanced
Materials, 26(6), 849-864.
Hanelt, S., Friedrich, J. F., Orts-Gil, G., & Meyer-Plath, A. (2012). Study of Lewis acid
catalyzed chemical bromination and bromoalkylation of multi-walled carbon
nanotubes. Carbon, 50(3), 1373-1385.
Haseman, J., Tharrington, E., Huff, J., & McConnell, E. (1986). Comparison of site-
specific and overall tumor incidence analyses for 81 recent National Toxicology
Program carcinogenicity studies. Regulatory toxicology and pharmacology,
6(2), 155-170.
Haynes, W. M. (2014). CRC handbook of chemistry and physics: CRC press.
Hayyan, M., Abo-Hamad, A., AlSaadi, M., & Hashim, M. (2015). Functionalization of
graphene using deep eutectic solvents. Nanoscale research letters, 10(1), 1-26.
He, D., Li, H., Li, W., Haghi-Ashtiani, P., Lejay, P., & Bai, J. (2011). Growth of carbon
nanotubes in six orthogonal directions on spherical alumina microparticles.
Carbon, 49(7), 2273-2286.
Univers
ity of
Mala
ya

233
Heemken, O., Reincke, H., Stachel, B., & Theobald, N. (2001). The occurrence of
xenoestrogens in the Elbe river and the North Sea. Chemosphere, 45(3), 245-
259.
Helal, H. O. (2015). Design of an electrical sensor for scale deposition detection using
Carbon Nanotubes. The Petroleum Institute (United Arab Emirates).
Hernadi, K., Fonseca, A., Nagy, J. B., Siska, A., & Kiricsi, I. (2000). Production of
nanotubes by the catalytic decomposition of different carbon-containing
compounds. Applied Catalysis A: General, 199(2), 245-255.
Hernadi, K., Siska, A., Thien-Nga, L., Forro, L., & Kiricsi, I. (2001). Reactivity of
different kinds of carbon during oxidative purification of catalytically prepared
carbon nanotubes. Solid State Ionics, 141, 203-209.
Hernandez, J. M. M., San German, C. M. R., Arceo, L. D. B., Villalobos, L. Z., &
Flores, M. E. (2013). Synthesis and characterization of carbon nanospheres
obtained by microwave radiation. Carbon, 54, 168-174.
Hiraoka, T., Kawakubo, T., Kimura, J., Taniguchi, R., Okamoto, A., Okazaki, T., . . .
Shinohara, H. (2003). Selective synthesis of double-wall carbon nanotubes by
CCVD of acetylene using zeolite supports. Chemical Physics Letters, 382(5),
679-685.
Ho, S.-M., Tang, W.-Y., De Frausto, J. B., & Prins, G. S. (2006). Developmental
exposure to estradiol and bisphenol A increases susceptibility to prostate
carcinogenesis and epigenetically regulates phosphodiesterase type 4 variant 4.
Cancer research, 66(11), 5624-5632.
Ho, Y.-S., Chiu, W.-T., & Wang, C.-C. (2005). Regression analysis for the sorption
isotherms of basic dyes on sugarcane dust. Bioresource technology, 96(11),
1285-1291.
Ho, Y.-S., & McKay, G. (1999). Pseudo-second order model for sorption processes.
Process Biochemistry, 34(5), 451-465.
Honma, S., Suzuki, A., Buchanan, D. L., Katsu, Y., Watanabe, H., & Iguchi, T. (2002).
Low dose effect of in utero exposure to bisphenol A and diethylstilbestrol on
female mouse reproduction. Reproductive toxicology, 16(2), 117-122.
Hruzewicz-Kołodziejczyk, A., Ting, V. P., Bimbo, N., & Mays, T. J. (2012). Improving
comparability of hydrogen storage capacities of nanoporous materials.
International Journal of Hydrogen Energy, 37(3), 2728-2736.
Hu, H., Yu, B., Ye, Q., Gu, Y., & Zhou, F. (2010). Modification of carbon nanotubes
with a nanothin polydopamine layer and polydimethylamino-ethyl methacrylate
brushes. Carbon, 48(8), 2347-2353.
Huang, Q., & Weber, W. J. (2005). Transformation and removal of bisphenol A from
aqueous phase via peroxidase-mediated oxidative coupling reactions: efficacy,
products, and pathways. Environmental science & technology, 39(16), 6029-
6036.
Univers
ity of
Mala
ya

234
Huang, Y., Wong, C., Zheng, J., Bouwman, H., Barra, R., Wahlström, B., . . . Wong, M.
(2012). Bisphenol A (BPA) in China: a review of sources, environmental levels,
and potential human health impacts. Environment international, 42, 91-99.
Hussain, C. M., & Mitra, S. (2011). Micropreconcentration units based on carbon
nanotubes (CNT). Analytical and bioanalytical chemistry, 399(1), 75-89.
Hussein, A. K. (2015). Applications of nanotechnology in renewable energies—A
comprehensive overview and understanding. Renewable and Sustainable Energy
Reviews, 42(Supplement C), 460-476.
Hussein, M., Zakarya, S., Sarijo, S., & Zainal, Z. (2012). Parameter optimisation of
carbon nanotubes synthesis via hexane decomposition over minerals generated
from Anadara granosa shells as the catalyst support. Journal of Nanomaterials,
2012, 90.
Iijima, S. (1991). Helical microtubules of graphitic carbon. nature, 354(6348), 56-58.
Inyang, M., Gao, B., Zimmerman, A., Zhang, M., & Chen, H. (2014). Synthesis,
characterization, and dye sorption ability of carbon nanotube–biochar
nanocomposites. Chemical Engineering Journal, 236, 39-46.
Isobe, T., Takada, H., Kanai, M., Tsutsumi, S., Isobe, K. O., Boonyatumanond, R., &
Zakaria, M. P. (2007). Distribution of polycyclic aromatic hydrocarbons (PAHs)
and phenolic endocrine disrupting chemicals in South and Southeast Asian
mussels. Environmental Monitoring and Assessment, 135(1), 423-440.
Izadi, N., Rashidi, A. M., Horri, B. A., Mosoudi, M. R., Bozorgzadeh, H. R., &
Zeraatkar, A. (2011). Growth of single-walled carbon nanotubes on a Co–Mo–
MgO supported catalyst by the CVD of methane in a fixed bed reactor: Model
setting and parameter estimation. Solid State Sciences, 13(6), 1242-1250.
Jafari, M., & Aghamiri, S. (2011). Evaluation of carbon nanotubes as solid-phase
extraction sorbent for the removal of cephalexin from aqueous solution.
Desalination and Water Treatment, 28(1-3), 55-58.
Ji, L., Chen, W., Bi, J., Zheng, S., Xu, Z., Zhu, D., & Alvarez, P. J. (2010). Adsorption
of tetracycline on single‐walled and multi‐walled carbon nanotubes as affected
by aqueous solution chemistry. Environmental Toxicology and Chemistry,
29(12), 2713-2719.
Jiang, T., Liang, Y.-d., He, Y.-j., & Wang, Q. (2015). Activated carbon/NiFe2O4
magnetic composite: A magnetic adsorbent for the adsorption of methyl orange.
Journal of Environmental Chemical Engineering, 3(3), 1740-1751.
Jiang, W., Xiao, F., Wang, D., Wang, Z., & Cai, Y. (2015). Removal of emerging
contaminants by pre-mixed PACl and carbonaceous materials. RSC Adv., 5(45),
35461-35468.
Jin, Z., Wang, X., Sun, Y., Ai, Y., & Wang, X. (2015). Adsorption of 4-n-nonylphenol
and bisphenol-A on magnetic reduced graphene oxides: a combined
experimental and theoretical studies. Environmental science & technology,
49(15), 9168-9175.
Univers
ity of
Mala
ya

235
Jorio, A., Pimenta, M. A., Souza Filho, A. G., Saito, R., Dresselhaus, G., &
Dresselhaus, M. S. (2003). Characterizing carbon nanotube samples with
resonance Raman scattering. New Journal of Physics, 5(1), 139.
José‐Yacamán, M., Miki‐Yoshida, M., Rendon, L., & Santiesteban, J. (1993). Catalytic
growth of carbon microtubules with fullerene structure. Applied physics letters,
62(6), 657-659.
Joseph, L., Boateng, L. K., Flora, J. R. V., Park, Y.-G., Son, A., Badawy, M., & Yoon,
Y. (2013). Removal of bisphenol A and 17α-ethinyl estradiol by combined
coagulation and adsorption using carbon nanomaterials and powdered activated
carbon. Separation and Purification Technology, 107, 37-47.
Joseph, L., Heo, J., Park, Y.-G., Flora, J. R. V., & Yoon, Y. (2011). Adsorption of
bisphenol A and 17α-ethinyl estradiol on single walled carbon nanotubes from
seawater and brackish water. Desalination, 281, 68-74.
Joseph, L., Zaib, Q., Khan, I. A., Berge, N. D., Park, Y.-G., Saleh, N. B., & Yoon, Y.
(2011). Removal of bisphenol A and 17α-ethinyl estradiol from landfill leachate
using single-walled carbon nanotubes. Water research, 45(13), 4056-4068.
Jourdain, V., & Bichara, C. (2013a). Current understanding of the growth of carbon
nanotubes in catalytic chemical vapour deposition. Carbon, 58, 2-39.
Jourdain, V., & Bichara, C. (2013b). Current understanding of the growth of carbon
nanotubes in catalytic chemical vapour deposition. Carbon, 58(Supplement C),
2-39.
Jung, C., Son, A., Her, N., Zoh, K.-D., Cho, J., & Yoon, Y. (2015). Removal of
endocrine disrupting compounds, pharmaceuticals, and personal care products in
water using carbon nanotubes: A review. Journal of Industrial and Engineering
Chemistry, 27, 1-11.
Jung, K.-W., Choi, B. H., Hwang, M.-J., Jeong, T.-U., & Ahn, K.-H. (2016).
Fabrication of granular activated carbons derived from spent coffee grounds by
entrapment in calcium alginate beads for adsorption of acid orange 7 and
methylene blue. Bioresource technology, 219(Supplement C), 185-195.
Jung, M., Eun, K. Y., Lee, J.-K., Baik, Y.-J., Lee, K.-R., & Park, J. W. (2001). Growth
of carbon nanotubes by chemical vapor deposition. Diamond and Related
Materials, 10(3), 1235-1240.
Kabir, E. R., Rahman, M. S., & Rahman, I. (2015). A review on endocrine disruptors
and their possible impacts on human health. Environmental toxicology and
pharmacology, 40(1), 241-258.
Kalavathy M, H., Regupathi, I., Pillai, M. G., & Miranda, L. R. (2009). Modelling,
analysis and optimization of adsorption parameters for H3PO4 activated rubber
wood sawdust using response surface methodology (RSM). Colloids and
Surfaces B: Biointerfaces, 70(1), 35-45.
Kang, C.-S., Fujisawa, K., Ko, Y.-I., Muramatsu, H., Hayashi, T., Endo, M., . . . Kim,
Y. A. (2016). Linear carbon chains inside multi-walled carbon nanotubes:
Univers
ity of
Mala
ya

236
Growth mechanism, thermal stability and electrical properties. Carbon,
107(Supplement C), 217-224.
Kang, J., Han, R., Wang, J., Yang, L., Fan, G., & Li, F. (2015). In situ synthesis of
nickel carbide-promoted nickel/carbon nanofibers nanocomposite catalysts for
catalytic applications. Chemical Engineering Journal, 275(Supplement C), 36-
44.
Kannan, N., & Sundaram, M. M. (2001). Kinetics and mechanism of removal of
methylene blue by adsorption on various carbons—a comparative study. Dyes
and pigments, 51(1), 25-40.
Karima, B., Mossab, B. L., & A-Hassen, M. (2010). Removal of methylene blue from
aqueous solutions using an acid activated algerian bentonite: Equilibrium and
kinetic studies. Paper presented at the International renewable energy congress.
Karousis, N., Suarez-Martinez, I., Ewels, C. P., & Tagmatarchis, N. (2016). Structure,
properties, functionalization, and applications of carbon nanohorns. Chemical
Reviews, 116(8), 4850-4883.
Karousis, N., Tagmatarchis, N., & Tasis, D. (2010). Current Progress on the Chemical
Modification of Carbon Nanotubes. Chemical Reviews, 110(9), 5366-5397.
Kathyayini, H., Reddy, K. V., Nagy, J., & Nagaraju, N. (2008). Synthesis of carbon
nanotubes over transition metal ions supported on Al (OH) ₃.
Kawahata, H., Ohta, H., Inoue, M., & Suzuki, A. (2004). Endocrine disrupter
nonylphenol and bisphenol A contamination in Okinawa and Ishigaki Islands,
Japan––within coral reefs and adjacent river mouths. Chemosphere, 55(11),
1519-1527.
Keleşoğlu, S., Kes, M., Sütçü, L., & Polat, H. (2012). Adsorption of methylene blue
from aqueous solution on high lime fly ash: Kinetic, equilibrium, and
thermodynamic studies. Journal of Dispersion Science and Technology, 33(1),
15-23.
Khajeh, M., Laurent, S., & Dastafkan, K. (2013). Nanoadsorbents: classification,
preparation, and applications (with emphasis on aqueous media). Chemical
Reviews, 113(10), 7728-7768.
Khalaj, Z., Monajjemi, M., & Diudea, M. V. (2016). Main Allotropes of Carbon: A
Brief Review. Sustainable Nanosystems Development, Properties, and
Applications, 185.
Khan, Z. U., Kausar, A., & Ullah, H. (2016). A review on composite papers of graphene
oxide, carbon nanotube, polymer/GO, and polymer/CNT: Processing strategies,
properties, and relevance. Polymer-Plastics Technology and Engineering, 55(6),
559-581.
Khedr, M., Halim, K. A., & Soliman, N. (2008). Effect of temperature on the kinetics of
acetylene decomposition over reduced iron oxide catalyst for the production of
carbon nanotubes. Applied surface science, 255(5), 2375-2381.
Univers
ity of
Mala
ya

237
Kim, C.-H., & Choi, J.-H. (2017). Effects of dispersion methods and surface treatment
of carbon nano-tubes on defect detectability and static strengths of adhesive
joints. Composite Structures, 176, 684-691.
Kim, C., Yang, K. S., Kojima, M., Yoshida, K., Kim, Y. J., Kim, Y. A., & Endo, M.
(2006). Fabrication of Electrospinning‐Derived Carbon Nanofiber Webs for the
Anode Material of Lithium‐Ion Secondary Batteries. Advanced functional
materials, 16(18), 2393-2397.
Kim, P., Shi, L., Majumdar, A., & McEuen, P. (2001). Thermal transport measurements
of individual multiwalled nanotubes. Physical Review Letters, 87(21), 215502.
Kim, Y., Hayashi, T., Endo, M., Kaburagi, Y., Tsukada, T., Shan, J., . . . Tsuruoka, S.
(2005). Synthesis and structural characterization of thin multi-walled carbon
nanotubes with a partially facetted cross section by a floating reactant method.
Carbon, 43(11), 2243-2250.
Kimura, Y., Yamamoto, M., Shimazaki, R., Kashiwada, A., Matsuda, K., & Yamada,
K. (2012). Use of chitosan for removal of bisphenol a from aqueous solutions
through quinone oxidation by polyphenol oxidase. Journal of Applied Polymer
Science, 124(1), 796-804.
Koduru, J. R., Lingamdinne, L. P., Singh, J., & Choo, K.-H. (2016). Effective removal
of bisphenol A (BPA) from water using a goethite/activated carbon composite.
Process Safety and Environmental Protection, 103, 87-96.
Krishni, R., Foo, K., & Hameed, B. (2014). Adsorption of cationic dye using a low-cost
biowaste adsorbent: equilibrium, kinetic, and thermodynamic study.
Desalination and Water Treatment, 52(31-33), 6088-6095.
Kubo, K., Arai, O., Omura, M., Watanabe, R., Ogata, R., & Aou, S. (2003). Low dose
effects of bisphenol A on sexual differentiation of the brain and behavior in rats.
Neuroscience research, 45(3), 345-356.
Kudo, A. (2016). Growth Mechanisms of Carbon Nano-fibers,-tubes, and Graphene on
Metal Oxide Nano-particles and-wires. Massachusetts Institute of Technology.
Kudo, A., Steiner III, S. A., Bayer, B. C., Kidambi, P. R., Hofmann, S., Strano, M. S.,
& Wardle, B. L. (2014). CVD growth of carbon nanostructures from zirconia:
mechanisms and a method for enhancing yield. Journal of the American
Chemical Society, 136(51), 17808-17817.
Kukovecz, A., Konya, Z., Nagaraju, N., Willems, I., Tamasi, A., Fonseca, A., . . .
Kiricsi, I. (2000). Catalytic synthesis of carbon nanotubes over Co, Fe and Ni
containing conventional and sol–gel silica–aluminas. Physical Chemistry
Chemical Physics, 2(13), 3071-3076.
Kumar, A., & Xagoraraki, I. (2010). Pharmaceuticals, personal care products and
endocrine-disrupting chemicals in US surface and finished drinking waters: a
proposed ranking system. Science of the Total Environment, 408(23), 5972-
5989.
Univers
ity of
Mala
ya

238
Kumar, A. S. K., Jiang, S.-J., & Tseng, W.-L. (2015). Effective adsorption of chromium
(VI)/Cr (III) from aqueous solution using ionic liquid functionalized multiwalled
carbon nanotubes as a super sorbent. Journal of Materials Chemistry A, 3(13),
7044-7057.
Kumar, M., & Ando, Y. (2003). A simple method of producing aligned carbon
nanotubes from an unconventional precursor–Camphor. Chemical Physics
Letters, 374(5), 521-526.
Kumar, M., & Ando, Y. (2005). Controlling the diameter distribution of carbon
nanotubes grown from camphor on a zeolite support. Carbon, 43(3), 533-540.
Kumar, M., & Ando, Y. (2010). Chemical vapor deposition of carbon nanotubes: a
review on growth mechanism and mass production. Journal of nanoscience and
nanotechnology, 10(6), 3739-3758.
Kumar, M., Kakamu, K., Okazaki, T., & Ando, Y. (2004). Field emission from
camphor–pyrolyzed carbon nanotubes. Chemical Physics Letters, 385(3), 161-
165.
Kumar, P. S., Ramalingam, S., & Sathishkumar, K. (2011). Removal of methylene blue
dye from aqueous solution by activated carbon prepared from cashew nut shell
as a new low-cost adsorbent. Korean Journal of Chemical Engineering, 28(1),
149-155.
Kunduru, K. R., Nazarkovsky, M., Farah, S., Pawar, R. P., Basu, A., & Domb, A. J.
(2017). 2 - Nanotechnology for water purification: applications of
nanotechnology methods in wastewater treatment A2 - Grumezescu, Alexandru
Mihai Water Purification (pp. 33-74): Academic Press.
Kuo, C.-S., Bai, A., Huang, C.-M., Li, Y.-Y., Hu, C.-C., & Chen, C.-C. (2005).
Diameter control of multiwalled carbon nanotubes using experimental strategies.
Carbon, 43(13), 2760-2768.
Kuo, C.-Y. (2009). Comparison with as-grown and microwave modified carbon
nanotubes to removal aqueous bisphenol A. Desalination, 249(3), 976-982.
Kuo, C.-Y., Wu, C.-H., & Wu, J.-Y. (2008). Adsorption of direct dyes from aqueous
solutions by carbon nanotubes: Determination of equilibrium, kinetics and
thermodynamics parameters. Journal of colloid and interface science, 327(2),
308-315.
Kuppusamy, S., Thavamani, P., Megharaj, M., Venkateswarlu, K., Lee, Y. B., & Naidu,
R. (2016). Potential of Melaleuca diosmifolia as a novel, non-conventional and
low-cost coagulating adsorbent for removing both cationic and anionic dyes.
Journal of Industrial and Engineering Chemistry, 37(Supplement C), 198-207.
Kushwaha, A. K., Gupta, N., & Chattopadhyaya, M. (2014). Removal of cationic
methylene blue and malachite green dyes from aqueous solution by waste
materials of Daucus carota. Journal of Saudi Chemical Society, 18(3), 200-207.
Univers
ity of
Mala
ya

239
Kwon, J., & Lee, B. (2015). Bisphenol A adsorption using reduced graphene oxide
prepared by physical and chemical reduction methods. Chemical Engineering
Research and Design, 104, 519-529.
Kyzas, G. Z., & Matis, K. A. (2015). Nanoadsorbents for pollutants removal: A review.
Journal of Molecular Liquids, 203, 159-168.
Lacerda, R., Teo, K., Teh, A., Yang, M., Dalal, S., Jefferson, D., . . . Amaratunga, G.
(2004). Thin-film metal catalyst for the production of multi-wall and single-wall
carbon nanotubes. Journal of Applied Physics, 96(8), 4456-4462.
Lagergren, S. (1898). About the theory of so-called adsorption of soluble substances.
Langmuir, I. (1918). The adsorption of gases on plane surfaces of glass, mica and
platinum. Journal of the American Chemical Society, 40(9), 1361-1403.
Laurila, T., Sainio, S., & Caro, M. A. (2017). Hybrid carbon based nanomaterials for
electrochemical detection of biomolecules. Progress in Materials Science, 88,
499-594.
Lee, C. J., Lyu, S. C., Kim, H.-W., Park, C.-Y., & Yang, C.-W. (2002). Large-scale
production of aligned carbon nanotubes by the vapor phase growth method.
Chemical Physics Letters, 359(1–2), 109-114.
Lee, C. J., & Park, J. (2000). Growth model of bamboo-shaped carbon nanotubes by
thermal chemical vapor deposition. Applied physics letters, 77(21), 3397-3399.
Lee, J., Choi, K., Park, J., Moon, H.-B., Choi, G., Lee, J. J., . . . Kim, S. (2017).
Bisphenol A distribution in serum, urine, placenta, breast milk, and umbilical
cord serum in a birth panel of mother–neonate pairs. Science of the Total
Environment.
Lee, O., Jung, J., Doo, S., Kim, S.-S., Noh, T.-H., Kim, K.-I., & Lim, Y.-S. (2010).
Effects of temperature and catalysts on the synthesis of carbon nanotubes by
chemical vapor deposition. Metals and Materials International, 16(4), 663-667.
Lee, S., Hong, J., Koo, J. H., Lee, H., Lee, S., Choi, T., . . . Kim, H. (2013). Synthesis
of few-layered graphene nanoballs with copper cores using solid carbon source.
ACS applied materials & interfaces, 5(7), 2432-2437.
Leranth, C., Hajszan, T., Szigeti-Buck, K., Bober, J., & MacLusky, N. J. (2008).
Bisphenol A prevents the synaptogenic response to estradiol in hippocampus
and prefrontal cortex of ovariectomized nonhuman primates. Proceedings of the
National Academy of Sciences, 105(37), 14187-14191.
Li, C., Zhong, H., Wang, S., Xue, J., & Zhang, Z. (2015). Removal of basic dye
(methylene blue) from aqueous solution using zeolite synthesized from
electrolytic manganese residue. Journal of Industrial and Engineering
Chemistry, 23, 344-352.
Li, D.-C., Dai, L., Huang, S., Mau, A. W., & Wang, Z. L. (2000). Structure and growth
of aligned carbon nanotube films by pyrolysis. Chemical Physics Letters,
316(5), 349-355.
Univers
ity of
Mala
ya

240
Li, D., Mueller, M. B., Gilje, S., Kaner, R. B., & Wallace, G. G. (2008). Processable
aqueous dispersions of graphene nanosheets. Nature nanotechnology, 3(2), 101-
105.
Li, H., He, D., Li, T., Genestoux, M., & Bai, J. (2010). Chemical kinetics of catalytic
chemical vapor deposition of an acetylene/xylene mixture for improved carbon
nanotube production. Carbon, 48(15), 4330-4342.
Li, H., Zhang, D., Han, X., & Xing, B. (2014). Adsorption of antibiotic ciprofloxacin on
carbon nanotubes: pH dependence and thermodynamics. Chemosphere, 95, 150-
155.
Li, J., Jiang, L., Xiang, X., Xu, S., Wen, R., & Liu, X. (2013). Competitive sorption
between 17α-ethinyl estradiol and bisphenol A/4-n-nonylphenol by soils.
Journal of Environmental Sciences, 25(6), 1154-1163.
Li, L., Quinlivan, P. A., & Knappe, D. R. U. (2002). Effects of activated carbon surface
chemistry and pore structure on the adsorption of organic contaminants from
aqueous solution. Carbon, 40(12), 2085-2100.
Li, M., Liu, Q., Lou, Z., Wang, Y., Zhang, Y., & Qian, G. (2014). Method to
characterize acid–base behavior of biochar: site modeling and theoretical
simulation. ACS Sustainable Chemistry & Engineering, 2(11), 2501-2509.
Li, S., Gong, Y., Yang, Y., He, C., Hu, L., Zhu, L., . . . Shu, D. (2015). Recyclable
CNTs/Fe 3 O 4 magnetic nanocomposites as adsorbents to remove bisphenol A
from water and their regeneration. Chemical Engineering Journal, 260, 231-
239.
Li, W., Zhang, H., Wang, C., Zhang, Y., Xu, L., Zhu, K., & Xie, S. (1997). Raman
characterization of aligned carbon nanotubes produced by thermal
decomposition of hydrocarbon vapor. Applied Physics Letters, 70(20), 2684-
2686.
Li, W., & Zhao, D. (2013). An overview of the synthesis of ordered mesoporous
materials. Chemical Communications, 49(10), 943-946.
Li, X., Chen, S., Fan, X., Quan, X., Tan, F., Zhang, Y., & Gao, J. (2015). Adsorption of
ciprofloxacin, bisphenol and 2-chlorophenol on electrospun carbon nanofibers:
In comparison with powder activated carbon. Journal of colloid and interface
science, 447, 120-127.
Li, Y., Du, Q., Liu, T., Peng, X., Wang, J., Sun, J., . . . Xia, L. (2013). Comparative
study of methylene blue dye adsorption onto activated carbon, graphene oxide,
and carbon nanotubes. Chemical Engineering Research and Design, 91(2), 361-
368.
Li, Y., Zhao, Y., Hu, W., Ahmad, I., Zhu, Y., Peng, X., & Luan, Z. (2007). Carbon
nanotubes-the promising adsorbent in wastewater treatment. Paper presented at
the Journal of physics: conference series.
Univers
ity of
Mala
ya

241
Li, Z., Gondal, M. A., & Yamani, Z. H. (2014). Preparation of magnetic separable CoFe
2 O 4/PAC composite and the adsorption of bisphenol A from aqueous solution.
Journal of Saudi Chemical Society, 18(3), 208-213.
Li, Z., Liu, Z., Sun, H., & Gao, C. (2015). Superstructured assembly of nanocarbons:
fullerenes, nanotubes, and graphene. Chemical Reviews, 115(15), 7046-7117.
Liang, Y., Han, Q., & Xin, H. (2013). Elastic properties of carbon nanotubes. Journal of
Computational and Theoretical Nanoscience, 10(5), 1061-1071.
Libbrecht, W., Vandaele, K., De Buysser, K., Verberckmoes, A., Thybaut, J. W.,
Poelman, H., . . . Van Der Voort, P. (2015). Tuning the pore geometry of
ordered mesoporous carbons for enhanced adsorption of bisphenol-A. Materials,
8(4), 1652-1665.
Libbrecht, W., Verberckmoes, A., Thybaut, J. W., Van Der Voort, P., & De Clercq, J.
(2017). Soft templated mesoporous carbons: Tuning the porosity for the
adsorption of large organic pollutants. Carbon, 116, 528-546.
Lin, D., & Xing, B. (2008). Adsorption of phenolic compounds by carbon nanotubes:
role of aromaticity and substitution of hydroxyl groups. Environmental science
& technology, 42(19), 7254-7259.
Lin, Z., Zeng, Z., Gui, X., Tang, Z., Zou, M., & Cao, A. (2016). Carbon nanotube
sponges, aerogels, and hierarchical composites: Synthesis, properties, and
energy applications. Advanced Energy Materials, 6(17).
Liu, F., Chung, S., Oh, G., & Seo, T. S. (2012). Three-dimensional graphene oxide
nanostructure for fast and efficient water-soluble dye removal. ACS applied
materials & interfaces, 4(2), 922-927.
Liu, G., Ma, J., Li, X., & Qin, Q. (2009). Adsorption of bisphenol A from aqueous
solution onto activated carbons with different modification treatments. Journal
of hazardous materials, 164(2), 1275-1280.
Liu, H., Jin, X., & Ding, B. (2016). Application of nanotechnology in petroleum
exploration and development. Petroleum Exploration and Development, 43(6),
1107-1115.
Liu, L., Gao, Z. Y., Su, X. P., Chen, X., Jiang, L., & Yao, J. M. (2015). Adsorption
removal of dyes from single and binary solutions using a cellulose-based
bioadsorbent. ACS Sustainable Chemistry & Engineering, 3(3), 432-442.
Liu, S., Sun, J., & Huang, Z. (2010). Carbon spheres/activated carbon composite
materials with high Cr (VI) adsorption capacity prepared by a hydrothermal
method. Journal of hazardous materials, 173(1), 377-383.
Liu, T., Li, Y., Du, Q., Sun, J., Jiao, Y., Yang, G., . . . Wang, K. (2012). Adsorption of
methylene blue from aqueous solution by graphene. Colloids and Surfaces B:
Biointerfaces, 90, 197-203.
Liu, X., Wang, M., Zhang, S., & Pan, B. (2013). Application potential of carbon
nanotubes in water treatment: A review. Journal of Environmental Sciences,
25(7), 1263-1280.
Univers
ity of
Mala
ya

242
Liu, Y., Kang, Y., Mu, B., & Wang, A. (2014). Attapulgite/bentonite interactions for
methylene blue adsorption characteristics from aqueous solution. Chemical
Engineering Journal, 237, 403-410.
Liu, Y., Wang, W., & Wang, A. (2012). Effect of dry grinding on the microstructure of
palygorskite and adsorption efficiency for methylene blue. Powder technology,
225, 124-129.
Liu, Y., Zhong, G., Liu, Z., Meng, M., Liu, F., & Ni, L. (2016). Facile synthesis of
novel photoresponsive mesoporous molecularly imprinted polymers for photo-
regulated selective separation of bisphenol A. Chemical Engineering Journal,
296, 437-446.
Locatelli, M., Sciascia, F., Cifelli, R., Malatesta, L., Bruni, P., & Croce, F. (2016).
Analytical methods for the endocrine disruptor compounds determination in
environmental water samples. Journal of Chromatography A, 1434, 1-18.
Louis, B., Gulino, G., Vieira, R., Amadou, J., Dintzer, T., Galvagno, S., . . . Pham-Huu,
C. (2005). High yield synthesis of multi-walled carbon nanotubes by catalytic
decomposition of ethane over iron supported on alumina catalyst. Catalysis
Today, 102, 23-28.
Lu, C., Chung, Y.-L., & Chang, K.-F. (2005). Adsorption of trihalomethanes from
water with carbon nanotubes. Water research, 39(6), 1183-1189.
Lu, C., Chung, Y.-L., & Chang, K.-F. (2006). Adsorption thermodynamic and kinetic
studies of trihalomethanes on multiwalled carbon nanotubes. Journal of
hazardous materials, 138(2), 304-310.
Luo, X., Wang, C., Wang, L., Deng, F., Luo, S., Tu, X., & Au, C. (2013).
Nanocomposites of graphene oxide-hydrated zirconium oxide for simultaneous
removal of As (III) and As (V) from water. Chemical Engineering Journal, 220,
98-106.
Luo, Y., Guo, W., Ngo, H. H., Nghiem, L. D., Hai, F. I., Zhang, J., . . . Wang, X. C.
(2014). A review on the occurrence of micropollutants in the aquatic
environment and their fate and removal during wastewater treatment. Science of
the Total Environment, 473, 619-641.
Lyu, S. C., Liu, B. C., Lee, C. J., Kang, H. K., Yang, C.-W., & Park, C. Y. (2003).
High-quality double-walled carbon nanotubes produced by catalytic
decomposition of benzene. Chemistry of Materials, 15(20), 3951-3954.
Ma, J., Yu, F., Zhou, L., Jin, L., Yang, M., Luan, J., . . . Chen, J. (2012). Enhanced
adsorptive removal of methyl orange and methylene blue from aqueous solution
by alkali-activated multiwalled carbon nanotubes. ACS applied materials &
interfaces, 4(11), 5749-5760.
Machado, F. M., Bergmann, C. P., Fernandes, T. H., Lima, E. C., Royer, B., Calvete,
T., & Fagan, S. B. (2011a). Adsorption of Reactive Red M-2BE dye from water
solutions by multi-walled carbon nanotubes and activated carbon. Journal of
hazardous materials, 192(3), 1122-1131.
Univers
ity of
Mala
ya

243
Machado, F. M., Bergmann, C. P., Fernandes, T. H. M., Lima, E. C., Royer, B.,
Calvete, T., & Fagan, S. B. (2011b). Adsorption of Reactive Red M-2BE dye
from water solutions by multi-walled carbon nanotubes and activated carbon.
Journal of Hazardous Materials, 192(3), 1122-1131.
Madannejad, S., Rashidi, A., Sadeghhassani, S., Shemirani, F., & Ghasemy, E. (2018).
Removal of 4-chlorophenol from water using different carbon nanostructures: A
comparison study. Journal of Molecular Liquids, 249(Supplement C), 877-885.
Majewska, M. M. (2015). Functionalizing carbon nanotubes for crosslinking and
properties control: Yale University.
Makino, T., Edamura, M., Kato, A., & Yoshida, A. (1992). Thermal radiation properties
of molten salt (properties of alkali metal carbonates). Heat transfer. Japanese
research, 21(4), 331-339.
Makinwa, T., & Uadia, P. (2015). A Survey of the Level of Bisphenol A (BPA) in
Effluents, Soil Leachates, Food Samples, Drinking Water and Consumer
Products in South-Western Nigeria. World Environment, 5(4), 135-139.
Mallakpour, S., & Khadem, E. (2016). Carbon nanotube–metal oxide nanocomposites:
Fabrication, properties and applications. Chemical Engineering Journal,
302(Supplement C), 344-367.
Manilo, M., Lebovka, N., & Barany, S. (2016). Mechanism of Methylene Blue
adsorption on hybrid laponite-multi-walled carbon nanotube particles. Journal
of Environmental Sciences, 42, 134-141.
Manzano-Ramírez, A., Moreno-Barcenas, A., Apatiga-Castro, M., Mauricio Rivera-
Munoz, E., Nava-Mendoza, R., & Velázquez-Castillo, R. (2013). An overview
of carbon nanotubes: synthesis, purification and characterization. Current
Organic Chemistry, 17(17), 1858-1866.
Markey, C. M., Wadia, P. R., Rubin, B. S., Sonnenschein, C., & Soto, A. M. (2005).
Long-Term Effects of Fetal Exposure to Low Doses of the Xenoestrogen
Bisphenol-A in the Female Mouse Genital Tract 1. Biology of reproduction,
72(6), 1344-1351.
Marrakchi, F., Ahmed, M. J., Khanday, W. A., Asif, M., & Hameed, B. H. (2017).
Mesoporous-activated carbon prepared from chitosan flakes via single-step
sodium hydroxide activation for the adsorption of methylene blue. International
Journal of Biological Macromolecules, 98(Supplement C), 233-239.
Martín-Jimeno, F., Suárez-García, F., Paredes, J., Martínez-Alonso, A., & Tascón, J.
(2015). Activated carbon xerogels with a cellular morphology derived from
hydrothermally carbonized glucose-graphene oxide hybrids and their
performance towards CO2 and dye adsorption. Carbon, 81, 137-147.
Mattevi, C., Wirth, C. T., Hofmann, S., Blume, R., Cantoro, M., Ducati, C., . . .
Castellarin-Cudia, C. (2008). In-situ X-ray photoelectron spectroscopy study of
catalyst− support interactions and growth of carbon nanotube forests. The
Journal of Physical Chemistry C, 112(32), 12207-12213.
Univers
ity of
Mala
ya

244
McKay, G., Porter, J., & Prasad, G. (1999). The removal of dye colours from aqueous
solutions by adsorption on low-cost materials. Water, Air, & Soil Pollution,
114(3), 423-438.
McKee, G. S., & Vecchio, K. S. (2006). Thermogravimetric analysis of synthesis
variation effects on CVD generated multiwalled carbon nanotubes. The Journal
of Physical Chemistry B, 110(3), 1179-1186.
Melo, S. M., & Brito, N. M. (2014). Analysis and occurrence of endocrine disruptors in
Brazilian water by HPLC-fluorescence detection. Water, Air, & Soil Pollution,
225(1), 1783.
Menendez, J. A., Radovic, L. R., Xia, B., & Phillips, J. (1996). Low-temperature
generation of basic carbon surfaces by hydrogen spillover. The Journal of
Physical Chemistry, 100(43), 17243-17248.
Meshot, E. R., Zwissler, D. W., Bui, N., Kuykendall, T. R., Wang, C., Hexemer, A., . . .
Fornasiero, F. (2017). Quantifying the Hierarchical Order in Self-Aligned
Carbon Nanotubes from Atomic to Micrometer Scale. ACS nano.
Meunier, V., Souza Filho, A., Barros, E., & Dresselhaus, M. (2016). Physical properties
of low-dimensional s p 2-based carbon nanostructures. Reviews of Modern
Physics, 88(2), 025005.
Meyyappan, M., Delzeit, L., Cassell, A., & Hash, D. (2003). Carbon nanotube growth
by PECVD: a review. Plasma Sources Science and Technology, 12(2), 205.
Mickelson, E., Huffman, C., Rinzler, A., Smalley, R., Hauge, R., & Margrave, J.
(1998). Fluorination of single-wall carbon nanotubes. Chemical Physics Letters,
296(1), 188-194.
Mishra, S. (2016). Nanotechnology in medicine. Indian Heart Journal, 68(3), 437-439.
Mleczko, L., & Lolli, G. (2013). Carbon nanotubes: an example of multiscale
development—a mechanistic view from the subnanometer to the meter scale.
Angewandte Chemie International Edition, 52(36), 9372-9387.
MOE, B. (1997). Environmental Management Act, Contaminated Sites Regulation. BC
Reg, 375, 96.
Moghaddam, S. S., Moghaddam, M. A., & Arami, M. (2010). Coagulation/flocculation
process for dye removal using sludge from water treatment plant: optimization
through response surface methodology. Journal of hazardous materials, 175(1),
651-657.
Mohmood, I., Lopes, C. B., Lopes, I., Ahmad, I., Duarte, A. C., & Pereira, E. (2013).
Nanoscale materials and their use in water contaminants removal—a review.
Environmental science and pollution Research, 20(3), 1239-1260.
Montes-Moran, M. A., Menéndez, J. A., Fuente, E., & Suarez, D. (1998). Contribution
of the basal planes to carbon basicity: An ab Initio study of the H3O+− π
interaction in cluster models. The Journal of Physical Chemistry B, 102(29),
5595-5601.
Univers
ity of
Mala
ya

245
Mubarak, N., Sahu, J., Abdullah, E., & Jayakumar, N. (2014). Removal of heavy metals
from wastewater using carbon nanotubes. Separation & Purification Reviews,
43(4), 311-338.
Mubarak, N. M., Abdullah, E. C., Jayakumar, N. S., & Sahu, J. N. (2014). An overview
on methods for the production of carbon nanotubes. Journal of Industrial and
Engineering Chemistry, 20(4), 1186-1197.
Mukhopadhyay, S. M., & Karumuri, A. K. (2010). Nanotube attachment for prevention
of interfacial delamination. Journal of Physics D: Applied Physics, 43(36),
365301.
Mulzer, C. R., Shen, L., Bisbey, R. P., McKone, J. R., Zhang, N., Abruña, H. D., &
Dichtel, W. R. (2016). Superior charge storage and power density of a
conducting polymer-modified covalent organic framework. ACS central science,
2(9), 667-673.
Muñoz-de-Toro, M., Markey, C. M., Wadia, P. R., Luque, E. H., Rubin, B. S.,
Sonnenschein, C., & Soto, A. M. (2005). Perinatal exposure to bisphenol-A
alters peripubertal mammary gland development in mice. Endocrinology,
146(9), 4138-4147.
Murakami, T., Sako, T., Harima, H., Kisoda, K., Mitikami, K., & Isshiki, T. (2004).
Raman study of SWNTs grown by CCVD method on SiC. Thin solid films, 464,
319-322.
Murray, T. J., Maffini, M. V., Ucci, A. A., Sonnenschein, C., & Soto, A. M. (2007).
Induction of mammary gland ductal hyperplasias and carcinoma in situ
following fetal bisphenol A exposure. Reproductive toxicology, 23(3), 383-390.
Murty, B., Shankar, P., Raj, B., Rath, B., & Murday, J. (2013). Applications of
nanomaterials Textbook of nanoscience and nanotechnology (pp. 107-148):
Springer.
Nagaraju, N., Fonseca, A., Konya, Z., & Nagy, J. (2002). Alumina and silica supported
metal catalysts for the production of carbon nanotubes. Journal of molecular
catalysis A: Chemical, 181(1), 57-62.
Nagel, S. C., vom Saal, F. S., Thayer, K. A., Dhar, M. G., Boechler, M., & Welshons,
W. V. (1997). Relative binding affinity-serum modified access (RBA-SMA)
assay predicts the relative in vivo bioactivity of the xenoestrogens bisphenol A
and octylphenol. Environmental health perspectives, 105(1), 70.
Narkiewicz, U., Podsiadły, M., Jędrzejewski, R., & Pełech, I. (2010). Catalytic
decomposition of hydrocarbons on cobalt, nickel and iron catalysts to obtain
carbon nanomaterials. Applied Catalysis A: General, 384(1), 27-35.
Nazal, M. K., Oweimreen, G. A., Khaled, M., Atieh, M. A., Aljundi, I. H., &
Abulkibash, A. M. (2016). Adsorption isotherms and kinetics for
dibenzothiophene on activated carbon and carbon nanotube doped with nickel
oxide nanoparticles. Bulletin of Materials Science, 39(2), 437-450.
Univers
ity of
Mala
ya

246
Nessim, G. D. (2010). Properties, synthesis, and growth mechanisms of carbon
nanotubes with special focus on thermal chemical vapor deposition. Nanoscale,
2(8), 1306-1323.
Nessim, G. D., Seita, M., O’brien, K. P., Hart, A. J., Bonaparte, R. K., Mitchell, R. R.,
& Thompson, C. V. (2009). Low temperature synthesis of vertically aligned
carbon nanotubes with electrical contact to metallic substrates enabled by
thermal decomposition of the carbon feedstock. Nano letters, 9(10), 3398-3405.
Newbold, R. R., Jefferson, W. N., & Padilla-Banks, E. (2009). Prenatal exposure to
bisphenol a at environmentally relevant doses adversely affects the murine
female reproductive tract later in life. Environmental health perspectives,
117(6), 879.
Norzilah, A., Fakhru'l-Razi, A., Choong, T. S., & Chuah, A. L. (2011). Surface
modification effects on CNTs adsorption of methylene blue and phenol. Journal
of Nanomaterials, 2011, 55.
O’connell, M. J. (2012). Carbon nanotubes: properties and applications: CRC press.
Oberlin, A., Endo, M., & Koyama, T. (1976). Filamentous growth of carbon through
benzene decomposition. Journal of crystal growth, 32(3), 335-349.
Ocampo-Pérez, R., Rivera-Utrilla, J., Méndez-Díaz, J. D., & Sánchez-Polo, M. (2012).
Modeling adsorption rate of organic micropollutants present in landfill leachates
onto granular activated carbon. Journal of colloid and interface science, 385(1),
174-182.
Oei, B. C., Ibrahim, S., Wang, S., & Ang, H. M. (2009). Surfactant modified barley
straw for removal of acid and reactive dyes from aqueous solution. Bioresource
technology, 100(18), 4292-4295.
Ofomaja, A. E. (2008). Sorptive removal of Methylene blue from aqueous solution
using palm kernel fibre: Effect of fibre dose. Biochemical Engineering Journal,
40(1), 8-18.
Onundi, Y. B., Mamun, A., Al Khatib, M., Al Saadi, M., & Suleyman, A. (2011).
Heavy metals removal from synthetic wastewater by a novel nano-size
composite adsorbent. International Journal of Environmental Science and
Technology:(IJEST), 8(4), 799.
Palanza, P. L., Howdeshell, K. L., Parmigiani, S., & vom Saal, F. S. (2002). Exposure
to a low dose of bisphenol A during fetal life or in adulthood alters maternal
behavior in mice. Environmental health perspectives, 110(Suppl 3), 415.
Palizdar, M., Ahgababazadeh, R., Mirhabibi, A., Brydson, R., & Pilehvari, S. (2011).
Investigation of Fe/MgO catalyst support precursors for the chemical vapour
deposition growth of carbon nanotubes. Journal of nanoscience and
nanotechnology, 11(6), 5345-5351.
Pan, B., Lin, D., Mashayekhi, H., & Xing, B. (2008). Adsorption and hysteresis of
bisphenol A and 17α-ethinyl estradiol on carbon nanomaterials. Environmental
science & technology, 42(15), 5480-5485.
Univers
ity of
Mala
ya
247
Pan, B., & Xing, B. (2008). Adsorption mechanisms of organic chemicals on carbon
nanotubes. Environmental science & technology, 42(24), 9005-9013.
Park, C., & Keane, M. A. (2004). Catalyst support effects in the growth of structured
carbon from the decomposition of ethylene over nickel. Journal of catalysis,
221(2), 386-399.
Park, H.-S., Koduru, J. R., Choo, K.-H., & Lee, B. (2015). Activated carbons
impregnated with iron oxide nanoparticles for enhanced removal of bisphenol A
and natural organic matter. Journal of hazardous materials, 286, 315-324.
Park, S., Vosguerichian, M., & Bao, Z. (2013). A review of fabrication and applications
of carbon nanotube film-based flexible electronics. Nanoscale, 5(5), 1727-1752.
Park, Y., Sun, Z., Ayoko, G. A., & Frost, R. L. (2014). Bisphenol A sorption by organo-
montmorillonite: implications for the removal of organic contaminants from
water. Chemosphere, 107, 249-256.
Patrolecco, L., Capri, S., Angelis, S. D., Pagnotta, R., Polesello, S., & Valsecchi, S.
(2006). Partition of nonylphenol and related compounds among different aquatic
compartments in Tiber River (Central Italy). Water, Air, & Soil Pollution,
172(1), 151-166.
Pelekani, C., & Snoeyink, V. L. (2000). Competitive adsorption between atrazine and
methylene blue on activated carbon: the importance of pore size distribution.
Carbon, 38(10), 1423-1436.
Peng, H., Pan, B., Wu, M., Liu, R., Zhang, D., Wu, D., & Xing, B. (2012). Adsorption
of ofloxacin on carbon nanotubes: Solubility, pH and cosolvent effects. Journal
of Hazardous Materials, 211–212(0), 342-348.
Peng, X., Li, Y., Luan, Z., Di, Z., Wang, H., Tian, B., & Jia, Z. (2003). Adsorption of 1,
2-dichlorobenzene from water to carbon nanotubes. Chemical Physics Letters,
376(1), 154-158.
Peng, X., Luan, Z., Di, Z., Zhang, Z., & Zhu, C. (2005). Carbon nanotubes-iron oxides
magnetic composites as adsorbent for removal of Pb (II) and Cu (II) from water.
Carbon, 43(4), 880-883.
Peng, X., Luan, Z., Ding, J., Di, Z., Li, Y., & Tian, B. (2005). Ceria nanoparticles
supported on carbon nanotubes for the removal of arsenate from water.
Materials Letters, 59(4), 399-403.
Pereira, M. F. R., Soares, S. F., Órfão, J. J., & Figueiredo, J. L. (2003). Adsorption of
dyes on activated carbons: influence of surface chemical groups. Carbon, 41(4),
811-821.
Peretz, J., Vrooman, L., Ricke, W. A., Hunt, P. A., Ehrlich, S., Hauser, R., . . .
VandeVoort, C. A. (2014). Bisphenol A and reproductive health: update of
experimental and human evidence, 2007–2013. Environmental health
perspectives, 122(8), 775.
Univers
ity of
Mala
ya

248
Pham-Huu, C., Vieira, R., Louis, B., Carvalho, A., Amadou, J., Dintzer, T., & Ledoux,
M. J. (2006). About the octopus-like growth mechanism of carbon nanofibers
over graphite supported nickel catalyst. Journal of catalysis, 240(2), 194-202.
Piao, L., Li, Y., Chen, J., Chang, L., & Lin, J. Y. (2002). Methane decomposition to
carbon nanotubes and hydrogen on an alumina supported nickel aerogel catalyst.
Catalysis Today, 74(1), 145-155.
Piao, L., Liu, Q., & Li, Y. (2012). Interaction of amino acids and single-wall carbon
nanotubes. The Journal of Physical Chemistry C, 116(2), 1724-1731.
Pichon, V., & Chapuis-Hugon, F. (2008). Role of molecularly imprinted polymers for
selective determination of environmental pollutants—a review. Analytica
chimica acta, 622(1), 48-61.
Pignatello, J., Mitch, W. A., & Xu, W. (2017). Activity and reactivity of pyrogenic
carbonaceous matter toward organic compounds. Environmental science &
technology, 51(16), 8893-8908.
Pignotti, E., Farré, M., Barceló, D., & Dinelli, E. (2017). Occurrence and distribution of
six selected endocrine disrupting compounds in surface-and groundwaters of the
Romagna area (North Italy). Environmental science and pollution Research,
24(26), 21153-21167.
Pinault, M., Mayne-L’Hermite, M., Reynaud, C., Pichot, V., Launois, P., & Ballutaud,
D. (2005). Growth of multiwalled carbon nanotubes during the initial stages of
aerosol-assisted CCVD. Carbon, 43(14), 2968-2976.
Pochorovski, I., Wang, H., Feldblyum, J. I., Zhang, X., Antaris, A. L., & Bao, Z.
(2015). H-bonded supramolecular polymer for the selective dispersion and
subsequent release of large-diameter semiconducting single-walled carbon
nanotubes. Journal of the American Chemical Society, 137(13), 4328-4331.
Pop, E., Mann, D., Wang, Q., Goodson, K., & Dai, H. (2006). Thermal conductance of
an individual single-wall carbon nanotube above room temperature. Nano
letters, 6(1), 96-100.
Pradhan, B. K., & Sandle, N. (1999). Effect of different oxidizing agent treatments on
the surface properties of activated carbons. Carbon, 37(8), 1323-1332.
Prasek, J., Drbohlavova, J., Chomoucka, J., Hubalek, J., Jasek, O., Adam, V., & Kizek,
R. (2011). Methods for carbon nanotubes synthesis—review. Journal of
Materials Chemistry, 21(40), 15872-15884.
Premkumar, T., Mezzenga, R., & Geckeler, K. E. (2012). Carbon nanotubes in the
liquid phase: addressing the issue of dispersion. Small, 8(9), 1299-1313.
Prieto, G., Shakeri, M., De Jong, K. P., & De Jongh, P. E. (2014). Quantitative
relationship between support porosity and the stability of pore-confined metal
nanoparticles studied on CuZnO/SiO2 methanol synthesis catalysts. ACS nano,
8(3), 2522-2531.
Pullket, S. (2015). Sewage sludge as source of activated carbon for the removal of
endocrine disrupting chemical in wastewater.
Univers
ity of
Mala
ya

249
Qian, D. (2001). Multiwalled carbon nanotube CVD synthesis, modification, and
composite applications.
Qin, F.-X., Jia, S.-Y., Liu, Y., Li, H.-Y., & Wu, S.-H. (2015). Adsorptive removal of
bisphenol A from aqueous solution using metal-organic frameworks.
Desalination and Water Treatment, 54(1), 93-102.
Qiu, F., Peng, M., Wei, Z., Wang, X., & Yang, J. (2016). Preparation of
polyethersulfone/sulfonated polyethersulfonephenylethane microspheres and its
application for the adsorption of bisphenol A. Journal of Applied Polymer
Science, 133(9).
Qu, S., Huang, F., Yu, S., Chen, G., & Kong, J. (2008). Magnetic removal of dyes from
aqueous solution using multi-walled carbon nanotubes filled with Fe 2 O 3
particles. Journal of hazardous materials, 160(2), 643-647.
Qu, X., Alvarez, P. J., & Li, Q. (2013). Applications of nanotechnology in water and
wastewater treatment. Water research, 47(12), 3931-3946.
Rafatullah, M., Sulaiman, O., Hashim, R., & Ahmad, A. (2010). Adsorption of
methylene blue on low-cost adsorbents: a review. Journal of hazardous
materials, 177(1), 70-80.
Rajabi, M., Mahanpoor, K., & Moradi, O. (2017). Removal of dye molecules from
aqueous solution by carbon nanotubes and carbon nanotube functional groups:
critical review. RSC Advances, 7(74), 47083-47090.
Rajbhandari, R., Shrestha, L. K., Pokharel, B. P., & Pradhananga, R. R. (2013).
Development of Nanoporous Structure in Carbons by Chemical Activation with
Zinc Chloride. Journal of nanoscience and nanotechnology, 13(4), 2613-2623.
Ramesha, G., Kumara, A. V., Muralidhara, H., & Sampath, S. (2011). Graphene and
graphene oxide as effective adsorbents toward anionic and cationic dyes.
Journal of colloid and interface science, 361(1), 270-277.
Rao, C., Gopalakrishnan, K., & Maitra, U. (2015). Comparative study of potential
applications of graphene, MoS2, and other two-dimensional materials in energy
devices, sensors, and related areas. ACS applied materials & interfaces, 7(15),
7809-7832.
Rathnayake, S. I., Xi, Y., Frost, R. L., & Ayoko, G. A. (2016). Environmental
applications of inorganic–organic clays for recalcitrant organic pollutants
removal: Bisphenol A. Journal of colloid and interface science, 470, 183-195.
Raty, J.-Y., Gygi, F., & Galli, G. (2005). Growth of carbon nanotubes on metal
nanoparticles: a microscopic mechanism from ab initio molecular dynamics
simulations. Physical Review Letters, 95(9), 096103.
Ravi, S., & Vadukumpully, S. (2016). Sustainable carbon nanomaterials: Recent
advances and its applications in energy and environmental remediation. Journal
of Environmental Chemical Engineering, 4(1), 835-856.
Univers
ity of
Mala
ya

250
Ren, X., Chen, C., Nagatsu, M., & Wang, X. (2011). Carbon nanotubes as adsorbents in
environmental pollution management: A review. Chemical Engineering Journal,
170(2–3), 395-410.
Reshetenko, T. V., Avdeeva, L. B., Ismagilov, Z. R., Chuvilin, A. L., & Ushakov, V. A.
(2003). Carbon capacious Ni-Cu-Al 2 O 3 catalysts for high-temperature
methane decomposition. Applied Catalysis A: General, 247(1), 51-63.
Robinson, T., McMullan, G., Marchant, R., & Nigam, P. (2001). Remediation of dyes
in textile effluent: a critical review on current treatment technologies with a
proposed alternative. Bioresource technology, 77(3), 247-255.
Rodriguez, A., Ovejero, G., Sotelo, J., Mestanza, M., & García, J. (2010). Adsorption of
dyes on carbon nanomaterials from aqueous solutions. Journal of Environmental
Science and Health Part A, 45(12), 1642-1653.
Romero Rodríguez, P. (2017). Synthesis of carbon nanomaterials by catalytic chemical
vapor deposition: growth mechanisms on metal powders and foils.
Ronix, A., Pezoti, O., Souza, L. S., Souza, I. P., Bedin, K. C., Souza, P. S., . . . Almeida,
V. C. (2017). Hydrothermal carbonization of coffee husk: Optimization of
experimental parameters and adsorption of methylene blue dye. Journal of
Environmental Chemical Engineering, 5(5), 4841-4849.
Roosta, M., Ghaedi, M., Daneshfar, A., Sahraei, R., & Asghari, A. (2014). Optimization
of the ultrasonic assisted removal of methylene blue by gold nanoparticles
loaded on activated carbon using experimental design methodology. Ultrasonics
Sonochemistry, 21(1), 242-252.
Rosenzweig, S., Sorial, G. A., Sahle-Demessie, E., & Mack, J. (2013). Effect of acid
and alcohol network forces within functionalized multiwall carbon nanotubes
bundles on adsorption of copper (II) species. Chemosphere, 90(2), 395-402.
Rubin, B. S. (2011). Bisphenol A: an endocrine disruptor with widespread exposure and
multiple effects. The Journal of steroid biochemistry and molecular biology,
127(1), 27-34.
Ruoff, R. S., Qian, D., & Liu, W. K. (2003). Mechanical properties of carbon
nanotubes: theoretical predictions and experimental measurements. Comptes
Rendus Physique, 4(9), 993-1008.
Sadegh, H., Ali, G. A., Gupta, V. K., Makhlouf, A. S. H., Shahryari-ghoshekandi, R.,
Nadagouda, M. N., . . . Megiel, E. (2017). The role of nanomaterials as effective
adsorbents and their applications in wastewater treatment. Journal of
Nanostructure in Chemistry, 7(1), 1-14.
Sadegh, H., Shahryari-ghoshekandi, R., & Kazemi, M. (2014). Study in synthesis and
characterization of carbon nanotubes decorated by magnetic iron oxide
nanoparticles. International Nano Letters, 4(4), 129-135.
Saha, A., Jiang, C., & Martí, A. A. (2014). Carbon nanotube networks on different
platforms. Carbon, 79, 1-18.
Univers
ity of
Mala
ya

251
Salama, A. (2017). New sustainable hybrid material as adsorbent for dye removal from
aqueous solutions. Journal of colloid and interface science, 487(Supplement C),
348-353.
Saleh, T. A., & Gupta, V. K. (2012). Photo-catalyzed degradation of hazardous dye
methyl orange by use of a composite catalyst consisting of multi-walled carbon
nanotubes and titanium dioxide. Journal of colloid and interface science,
371(1), 101-106.
Salehinia, S., Ghoreishi, S. M., Maya, F., & Cerdà, V. (2016). Hydrophobic magnetic
montmorillonite composite material for the efficient adsorption and
microextraction of bisphenol A from water samples. Journal of Environmental
Chemical Engineering, 4(4), 4062-4071.
Samadi, M. T., Shokoohi, R., Poormohammadi, A., Azarian, G., Harati, M., &
Shanesaz, S. (2016). Removal of Bisphenol A using Antimony Nanoparticle
Multi-walled Carbon Nanotubes composite from aqueous solutions. Oriental
Journal of Chemistry, 32(2), 1015-1024.
Sanghi, R., & Verma, P. (2013). Decolorisation of aqueous dye solutions by low‐cost
adsorbents: a review. Coloration Technology, 129(2), 85-108.
Santangelo, S., Messina, G., Faggio, G., Abdul Rahim, S., & Milone, C. (2012). Effect
of sulphuric–nitric acid mixture composition on surface chemistry and structural
evolution of liquid‐phase oxidised carbon nanotubes. Journal of Raman
Spectroscopy, 43(10), 1432-1442.
Santangelo, S., Messina, G., Faggio, G., Lanza, M., Pistone, A., & Milone, C. (2010).
Calibration of reaction parameters for the improvement of thermal stability and
crystalline quality of multi-walled carbon nanotubes. Journal of Materials
Science, 45(3), 783.
Santhosh, C., Velmurugan, V., Jacob, G., Jeong, S. K., Grace, A. N., & Bhatnagar, A.
(2016). Role of nanomaterials in water treatment applications: A review.
Chemical Engineering Journal, 306, 1116-1137.
Satishkumar, B., Govindaraj, A., Sen, R., & Rao, C. (1998). Single-walled nanotubes by
the pyrolysis of acetylene-organometallic mixtures. Chemical Physics Letters,
293(1), 47-52.
Satishkumar, B., Thomas, P. J., Govindaraj, A., & Rao, C. (2000). Y-junction carbon
nanotubes. Applied physics letters, 77(16), 2530-2532.
Schultzenberger, P., & Schultzenberger, L. (1890). Sur quelques faits relatifs a l’histoire
du carbon. CR Acad Sci Paris, 111, 774.
Schütt, F., Signetti, S., Krüger, H., Röder, S., Smazna, D., Kaps, S., . . . Adelung, R.
(2017). Hierarchical self-entangled carbon nanotube tube networks. Nature
communications, 8(1), 1215.
Seah, C.-M., Chai, S.-P., & Mohamed, A. R. (2014). Mechanisms of graphene growth
by chemical vapour deposition on transition metals. Carbon, 70(Supplement C),
1-21.
Univers
ity of
Mala
ya

252
Seidel, R., Duesberg, G. S., Unger, E., Graham, A. P., Liebau, M., & Kreupl, F. (2004).
Chemical vapor deposition growth of single-walled carbon nanotubes at 600 C
and a simple growth model. The Journal of Physical Chemistry B, 108(6), 1888-
1893.
Seow, T. W., & Lim, C. K. (2016). Removal of dye by adsorption: a review.
International Journal of Applied Engineering Research, 11(4), 2675-2679.
Shah, K. A., & Tali, B. A. (2016a). Synthesis of carbon nanotubes by catalytic chemical
vapour deposition: A review on carbon sources, catalysts and substrates.
Materials Science in Semiconductor Processing, 41, 67-82.
Shah, K. A., & Tali, B. A. (2016b). Synthesis of carbon nanotubes by catalytic chemical
vapour deposition: A review on carbon sources, catalysts and substrates.
Materials Science in Semiconductor Processing(41), 67-82.
Shah, K. A., & Tali, B. A. (2016c). Synthesis of carbon nanotubes by catalytic chemical
vapour deposition: A review on carbon sources, catalysts and substrates.
Materials Science in Semiconductor Processing, 41(Supplement C), 67-82.
Sharma, J., Mishra, I., & Kumar, V. (2015). Degradation and mineralization of
Bisphenol A (BPA) in aqueous solution using advanced oxidation processes:
UV/H 2 O 2 and oxidation systems. Journal of environmental management, 156,
266-275.
Sharma, S., & Lakkad, S. (2009). Morphology study of carbon nanospecies grown on
carbon fibers by thermal CVD technique. Surface and Coatings Technology,
203(10), 1329-1335.
Shen, X.-E., Shan, X.-Q., Dong, D.-M., Hua, X.-Y., & Owens, G. (2009). Kinetics and
thermodynamics of sorption of nitroaromatic compounds to as-grown and
oxidized multiwalled carbon nanotubes. Journal of colloid and interface
science, 330(1), 1-8.
Shen, X., Guo, X., Zhang, M., Tao, S., & Wang, X. (2015). Sorption mechanisms of
organic compounds by carbonaceous materials: site energy distribution
consideration. Environmental science & technology, 49(8), 4894-4902.
Sheng, G., Shao, D., Ren, X., Wang, X., Li, J., Chen, Y., & Wang, X. (2010). Kinetics
and thermodynamics of adsorption of ionizable aromatic compounds from
aqueous solutions by as-prepared and oxidized multiwalled carbon nanotubes.
Journal of hazardous materials, 178(1), 505-516.
Shindy, A. (2017). Problems and solutions in colors, dyes and pigments chemistry: a
review. Chem. Int., 3, 97-105.
Shirazi, Y., Tofighy, M. A., Mohammadi, T., & Pak, A. (2011). Effects of different
carbon precursors on synthesis of multiwall carbon nanotubes: Purification and
Functionalization. Applied surface science, 257(16), 7359-7367.
Shukla, B., Saito, T., Ohmori, S., Koshi, M., Yumura, M., & Iijima, S. (2010).
Interdependency of gas phase intermediates and chemical vapor deposition
Univers
ity of
Mala
ya

253
growth of single wall carbon nanotubes. Chemistry of Materials, 22(22), 6035-
6043.
Shunin, Y., Bellucci, S., Gruodis, A., & Lobanova-Shunina, T. (2018). Nanotechnology
Application Challenges: Nanomanagement, Nanorisks and Consumer Behaviour
Nonregular Nanosystems (pp. 337-395): Springer.
Sigmund, G., Sun, H., Hofmann, T., & Kah, M. (2016). Predicting the sorption of
aromatic acids to noncarbonized and carbonized sorbents. Environmental
science & technology, 50(7), 3641-3648.
Sing, K. S. (2014). Adsorption by active carbons In: Adsorption by Powders and
Porous solids–Principles, Methodology and Applications (pp. 321-391):
Academic Press Massachusetts, US.
Sivakumar, V., Abdullah, A., Mohamed, A., & Chai, S. (2011). Optimized parameters
for carbon nanotubes synthesis over Fe and Ni catalysts VIA methane CVD.
Rev. Adv. Mater. Sci, 27, 25-30.
Smith, S. C., & Rodrigues, D. F. (2015a). Carbon-based nanomaterials for removal of
chemical and biological contaminants from water: A review of mechanisms and
applications. Carbon, 91(Supplement C), 122-143.
Smith, S. C., & Rodrigues, D. F. (2015b). Carbon-based nanomaterials for removal of
chemical and biological contaminants from water: A review of mechanisms and
applications. Carbon, 91, 122-143.
Soma, K., Radhakrishnan, T., & Sarat Chandra Babu, J. (2017). Carbon nanotubes:
Their role in engineering applications and challenges ahead. Inorganic and
Nano-Metal Chemistry, 47(2), 188-196.
Song, J., Feng, S., Zhao, J., Zheng, J., & Zhu, Z. (2010). Activated carbon catalyzing
the formation of carbon nanotubes. Materials Research Bulletin, 45(9), 1234-
1239.
Song, M., Tang, X., Xu, J., Yu, L., & Wei, Y. (2016). The formation of novel
carbon/carbon composite by chemical vapor deposition: An efficient adsorbent
for enhanced desulfurization performance. Journal of Analytical and Applied
Pyrolysis, 118, 34-41.
Soni, H., & Padmaja, P. (2014). Palm shell based activated carbon for removal of
bisphenol A: an equilibrium, kinetic and thermodynamic study. Journal of
Porous Materials, 21(3), 275-284.
Sotelo, J. L., Rodríguez, A. R., Mateos, M. M., Hernández, S. D., Torrellas, S. A., &
Rodríguez, J. G. (2012). Adsorption of pharmaceutical compounds and an
endocrine disruptor from aqueous solutions by carbon materials. Journal of
Environmental Science and Health, Part B, 47(7), 640-652.
Speltini, A., Sturini, M., Maraschi, F., & Profumo, A. (2016). Recent trends in the
application of the newest carbonaceous materials for magnetic solid-phase
extraction of environmental pollutants. Trends in Environmental Analytical
Chemistry, 10, 11-23.
Univers
ity of
Mala
ya

254
Stackelberg, P. E., Gibs, J., Furlong, E. T., Meyer, M. T., Zaugg, S. D., & Lippincott, R.
L. (2007). Efficiency of conventional drinking-water-treatment processes in
removal of pharmaceuticals and other organic compounds. Science of the Total
Environment, 377(2), 255-272.
Staples, C. A., Dorn, P. B., Klecka, G. M., Sondra, T., Branson, D. R., & Harris, L. R.
(2000). Bisphenol A concentrations in receiving waters near US manufacturing
and processing facilities. Chemosphere, 40(5), 521-525.
Stobinski, L., Lesiak, B., Kövér, L., Tóth, J., Biniak, S., Trykowski, G., & Judek, J.
(2010). Multiwall carbon nanotubes purification and oxidation by nitric acid
studied by the FTIR and electron spectroscopy methods. Journal of Alloys and
Compounds, 501(1), 77-84.
Su, F., Lu, C., & Hu, S. (2010). Adsorption of benzene, toluene, ethylbenzene and p-
xylene by NaOCl-oxidized carbon nanotubes. Colloids and Surfaces A:
Physicochemical and Engineering Aspects, 353(1), 83-91.
Subramani, S., & Thinakaran, N. (2017). Isotherm, kinetic and thermodynamic studies
on the adsorption behaviour of textile dyes onto chitosan. Process Safety and
Environmental Protection, 106, 1-10.
Sugime, H., Esconjauregui, S., D’Arsié, L., Yang, J., Robertson, A. W., Oliver, R. A., .
. . Robertson, J. (2015). Low-temperature growth of carbon nanotube forests
consisting of tubes with narrow inner spacing using Co/Al/Mo catalyst on
conductive supports. ACS applied materials & interfaces, 7(30), 16819-16827.
Suhrhoff, T. J., & Scholz-Böttcher, B. M. (2016). Qualitative impact of salinity, UV
radiation and turbulence on leaching of organic plastic additives from four
common plastics—A lab experiment. Marine pollution bulletin, 102(1), 84-94.
Sui, Q., Huang, J., Liu, Y., Chang, X., Ji, G., Deng, S., . . . Yu, G. (2011). Rapid
removal of bisphenol A on highly ordered mesoporous carbon. Journal of
Environmental Sciences, 23(2), 177-182.
Sui, Z., Meng, Q., Zhang, X., Ma, R., & Cao, B. (2012). Green synthesis of carbon
nanotube–graphene hybrid aerogels and their use as versatile agents for water
purification. Journal of Materials Chemistry, 22(18), 8767-8771.
Sun, C.-F., Meany, B., & Wang, Y. (2014). Characteristics and applications of carbon
nanotubes with different numbers of walls. Carbon Nanotubes and Graphene,
313-339.
Sun, K., Zhang, Z., Gao, B., Wang, Z., Xu, D., Jin, J., & Liu, X. (2012). Adsorption of
diuron, fluridone and norflurazon on single-walled and multi-walled carbon
nanotubes. Science of The Total Environment, 439(0), 1-7.
Suresh, S., Sugumar, R. W., & Maiyalagan, T. (2011). Equilibrium and Kinetic studies
on the adsorption of Methylene blue from aqueous solution onto activated
carbon prepared from Murraya koenigii (curry tree) stems. Asian Journal of
Chemistry, 23(10), 4486.
Univers
ity of
Mala
ya
255
Suzuki, M., Sugiyama, T., Musashi, E., Kobiyama, Y., Kashiwada, A., Matsuda, K., &
Yamada, K. (2010). Use of chitosan for removal of bisphenol A and bisphenol
derivatives through tyrosinase‐catalyzed quinone oxidation. Journal of Applied
Polymer Science, 118(2), 721-732.
Swati, S. S. (2017). STUDY OF ENVIRONMENTAL PARAMETERS OF WASTE
WATER GENERATED AFTER DYEING WITH REACTIVE DYES. Daffodil
International university.
Szabó, A., Perri, C., Csató, A., Giordano, G., Vuono, D., & Nagy, J. B. (2010).
Synthesis methods of carbon nanotubes and related materials. Materials, 3(5),
3092-3140.
Szyguła, A., Guibal, E., Palacín, M. A., Ruiz, M., & Sastre, A. M. (2009). Removal of
an anionic dye (Acid Blue 92) by coagulation–flocculation using chitosan.
Journal of environmental management, 90(10), 2979-2986.
Taleshi, F., Hosseini, A., Mohammadi, M., & Pashaee, M. (2013). Effect of
hydrocarbon gas on synthesis and diameter of carbon nanotubes. Indian Journal
of Physics, 87(9), 873-877.
Tan, C. W., Tan, K. H., Ong, Y. T., Mohamed, A. R., Zein, S. H. S., & Tan, S. H.
(2012). Energy and environmental applications of carbon nanotubes.
Environmental chemistry letters, 10(3), 265-273.
Tan, I., Ahmad, A., & Hameed, B. (2008). Optimization of preparation conditions for
activated carbons from coconut husk using response surface methodology.
Chemical Engineering Journal, 137(3), 462-470.
Tan, K. B., Vakili, M., Horri, B. A., Poh, P. E., Abdullah, A. Z., & Salamatinia, B.
(2015). Adsorption of dyes by nanomaterials: Recent developments and
adsorption mechanisms. Separation and Purification Technology,
150(Supplement C), 229-242.
Tang, J., Jin, G.-Q., Wang, Y.-Y., & Guo, X.-Y. (2010). Tree-like carbon grown from
camphor. Carbon, 48(5), 1545-1551.
Tang, L., Cai, Y., Yang, G., Liu, Y., Zeng, G., Zhou, Y., . . . Fang, Y. (2014). Cobalt
nanoparticles-embedded magnetic ordered mesoporous carbon for highly
effective adsorption of rhodamine B. Applied surface science, 314, 746-753.
Tang, L., Xie, Z., Zeng, G., Dong, H., Fan, C., Zhou, Y., . . . Wei, X. (2016). Removal
of bisphenol A by iron nanoparticle-doped magnetic ordered mesoporous
carbon. RSC Advances, 6(31), 25724-25732.
Tang, S. C., & Lo, I. M. (2013). Magnetic nanoparticles: essential factors for
sustainable environmental applications. Water research, 47(8), 2613-2632.
Tang, Z., Poh, C. K., Tian, Z., Lin, J., Ng, H. Y., & Chua, D. H. (2011). In situ grown
carbon nanotubes on carbon paper as integrated gas diffusion and catalyst layer
for proton exchange membrane fuel cells. Electrochimica Acta, 56(11), 4327-
4334.
Univers
ity of
Mala
ya

256
Taty-Costodes, V. C., Fauduet, H., Porte, C., & Delacroix, A. (2003). Removal of Cd
(II) and Pb (II) ions, from aqueous solutions, by adsorption onto sawdust of
Pinus sylvestris. Journal of hazardous materials, 105(1), 121-142.
Temkin, M., & Pyzhev, V. (1940). Recent modifications to Langmuir isotherms.
Thines, R. K., Mubarak, N. M., Nizamuddin, S., Sahu, J. N., Abdullah, E. C., &
Ganesan, P. (2017). Application potential of carbon nanomaterials in water and
wastewater treatment: A review. Journal of the Taiwan Institute of Chemical
Engineers, 72(Supplement C), 116-133.
Titirici, M.-M., White, R. J., Brun, N., Budarin, V. L., Su, D. S., del Monte, F., . . .
MacLachlan, M. J. (2015). Sustainable carbon materials. Chemical Society
Reviews, 44(1), 250-290.
Tomie, T., Inoue, S., Kohno, M., & Matsumura, Y. (2010). Prospective growth region
for chemical vapor deposition synthesis of carbon nanotube on C–H–O ternary
diagram. Diamond and Related Materials, 19(11), 1401-1404.
Tran, H. N., Wang, Y.-F., You, S.-J., & Chao, H.-P. (2017). Insights into the
mechanism of cationic dye adsorption on activated charcoal: The importance of
π–π interactions. Process Safety and Environmental Protection, 107(Supplement
C), 168-180.
Tričković, J., Isakovski, M. K., Watson, M., Maletić, S., Rončević, S., Dalmacija, B., . .
. Kukovecz, Á. (2016). Sorption behaviour of trichlorobenzenes and polycyclic
aromatic hydrocarbons in the absence or presence of carbon nanotubes in the
aquatic environment. Water, Air, & Soil Pollution, 227(10), 374.
Tripathi, P. K., Gan, L., Liu, M., Ma, X., Zhao, Y., Zhu, D., . . . Rao, N. N. (2014).
One-pot assembly of silica@ two polymeric shells for synthesis of hollow
carbon porous nanospheres: Adsorption of bisphenol A. Materials Letters, 120,
108-110.
Tsai, W.-T., Hsu, H.-C., Su, T.-Y., Lin, K.-Y., & Lin, C.-M. (2006). Adsorption
characteristics of bisphenol-A in aqueous solutions onto hydrophobic zeolite.
Journal of colloid and interface science, 299(2), 513-519.
Tsai, W.-T., Lai, C.-W., & Su, T.-Y. (2006). Adsorption of bisphenol-A from aqueous
solution onto minerals and carbon adsorbents. Journal of hazardous materials,
134(1), 169-175.
Umar, M., Roddick, F., Fan, L., & Aziz, H. A. (2013). Application of ozone for the
removal of bisphenol A from water and wastewater–a review. Chemosphere,
90(8), 2197-2207.
Usman, A., & Ahmad, M. (2016). From BPA to its analogues: Is it a safe journey?
Chemosphere, 158, 131-142.
Vander Wal, R. L., Ticich, T. M., & Curtis, V. E. (2001). Substrate–support interactions
in metal-catalyzed carbon nanofiber growth. Carbon, 39(15), 2277-2289.
Varandas, E. S. G. R. V. (2014). Low-dose effects of Bisphenol A on human primary
vascular endothelial cells and colon cancer cells.
Univers
ity of
Mala
ya

257
Vargas, A. M. M., Cazetta, A. L., Kunita, M. H., Silva, T. L., & Almeida, V. C. (2011).
Adsorption of methylene blue on activated carbon produced from flamboyant
pods (Delonix regia): Study of adsorption isotherms and kinetic models.
Chemical Engineering Journal, 168(2), 722-730.
Varshney, K. (2014). Carbon nanotubes: a review on synthesis, properties and
applications. International Journal of Engineering Research, 2(4), 660-677.
Verschueren, K. (1983). Handbook of environmental data on organic chemicals.
Veziri, C. M., Karanikolos, G., Pilatos, G., Vermisoglou, E., Giannakopoulos, K.,
Stogios, C., & Kanellopoulos, N. (2009). Growth and morphology manipulation
of carbon nanostructures on porous supports. Carbon, 47(9), 2161-2173.
Veziri, C. M., Pilatos, G., Karanikolos, G., Labropoulos, A., Kordatos, K., Kasselouri-
Rigopoulou, V., & Kanellopoulos, N. (2008). Growth and optimization of
carbon nanotubes in activated carbon by catalytic chemical vapor deposition.
Microporous and Mesoporous Materials, 110(1), 41-50.
Vijwani, H., Nadagouda, M. N., Namboodiri, V., & Mukhopadhyay, S. M. (2015).
Hierarchical hybrid carbon nano-structures as robust and reusable adsorbents:
Kinetic studies with model dye compound. Chemical Engineering Journal, 268,
197-207.
Villacampa, J. I., Royo, C., Romeo, E., Montoya, J. A., Del Angel, P., & Monzon, A.
(2003). Catalytic decomposition of methane over Ni-Al 2 O 3 coprecipitated
catalysts: reaction and regeneration studies. Applied Catalysis A: General,
252(2), 363-383.
Von Sonntag, C., & Von Gunten, U. (2012). Chemistry of ozone in water and
wastewater treatment: IWA publishing.
Voutsa, D., Hartmann, P., Schaffner, C., & Giger, W. (2006). Benzotriazoles,
alkylphenols and bisphenol A in municipal wastewaters and in the Glatt River,
Switzerland. Environmental science and pollution Research, 13(5), 333-341.
Vučurović, V. M., Razmovski, R. N., & Tekić, M. N. (2012). Methylene blue (cationic
dye) adsorption onto sugar beet pulp: Equilibrium isotherm and kinetic studies.
Journal of the Taiwan Institute of Chemical Engineers, 43(1), 108-111.
Wagner, R., & Ellis, W. (1964). Vapor‐liquid‐solid mechanism of single crystal growth.
Applied physics letters, 4(5), 89-90.
Wang, C., Feng, C., Gao, Y., Ma, X., Wu, Q., & Wang, Z. (2011). Preparation of a
graphene-based magnetic nanocomposite for the removal of an organic dye from
aqueous solution. Chemical Engineering Journal, 173(1), 92-97.
Wang, C., Yang, S., Ma, Q., Jia, X., & Ma, P.-C. (2017). Preparation of carbon
nanotubes/graphene hybrid aerogel and its application for the adsorption of
organic compounds. Carbon, 118(Supplement C), 765-771.
Wang, H., Zhang, H., Jiang, J.-Q., & Ma, X. (2016). Adsorption of bisphenol A onto
cationic-modified zeolite. Desalination and Water Treatment, 57(54), 26299-
26306.
Univers
ity of
Mala
ya
258
Wang, J., Chen, Z., & Chen, B. (2014). Adsorption of polycyclic aromatic
hydrocarbons by graphene and graphene oxide nanosheets. Environmental
science & technology, 48(9), 4817-4825.
Wang, N., Pandit, S., Ye, L., Edwards, M., Mokkapati, V. R. S. S., Murugesan, M., . . .
Liu, J. (2017). Efficient surface modification of carbon nanotubes for fabricating
high performance CNT based hybrid nanostructures. Carbon, 111(Supplement
C), 402-410.
Wang, S., Ng, C. W., Wang, W., Li, Q., & Hao, Z. (2012). Synergistic and competitive
adsorption of organic dyes on multiwalled carbon nanotubes. Chemical
Engineering Journal, 197, 34-40.
Wang, W., Wang, F., Kang, Y., & Wang, A. (2015). Enhanced adsorptive removal of
methylene blue from aqueous solution by alkali-activated palygorskite. Water,
Air, & Soil Pollution, 226(3), 1-13.
Wang, X., Qin, Y., Zhu, L., & Tang, H. (2015). Nitrogen-doped reduced graphene
oxide as a bifunctional material for removing bisphenols: synergistic effect
between adsorption and catalysis. Environmental science & technology, 49(11),
6855-6864.
Weber, T. W., & Chakravorti, R. K. (1974). Pore and solid diffusion models for fixed‐
bed adsorbers. AIChE Journal, 20(2), 228-238.
Weber, W. J., & Morris, J. C. (1963). Kinetics of adsorption on carbon from solution.
Journal of the Sanitary Engineering Division, 89(2), 31-60.
Weiss, N. O., Zhou, H., Liao, L., Liu, Y., Jiang, S., Huang, Y., & Duan, X. (2012).
Graphene: An Emerging Electronic Material. Advanced Materials, 24(43),
5782-5825.
Wiles, P., & Abrahamson, J. (1978). Carbon fibre layers on arc electrodes—I: their
properties and cool-down behaviour. Carbon, 16(5), 341-349.
Willems, I., Konya, Z., Colomer, J.-F., Van Tendeloo, G., Nagaraju, N., Fonseca, A., &
Nagy, J. (2000). Control of the outer diameter of thin carbon nanotubes
synthesized by catalytic decomposition of hydrocarbons. Chemical Physics
Letters, 317(1), 71-76.
Wirasnita, R., Hadibarata, T., Yusoff, A. R. M., & Yusop, Z. (2014). Removal of
bisphenol A from aqueous solution by activated carbon derived from oil palm
empty fruit bunch. Water, Air, & Soil Pollution, 225(10), 2148.
Wirth, C. T., Bayer, B. C., Gamalski, A. D., Esconjauregui, S., Weatherup, R. S.,
Ducati, C., . . . Hofmann, S. (2012). The phase of iron catalyst nanoparticles
during carbon nanotube growth. Chemistry of Materials, 24(24), 4633-4640.
Wolska, J., & Bryjak, M. (2014). Removal of bisphenol A from aqueous solution by
molecularly imprinted polymers. Separation Science and Technology, 49(11),
1643-1653.
Univers
ity of
Mala
ya

259
Wong, Y., Szeto, Y., Cheung, W., & McKay, G. (2004). Pseudo‐first‐order kinetic
studies of the sorption of acid dyes onto chitosan. Journal of Applied Polymer
Science, 92(3), 1633-1645.
Wu, C.-H. (2007). Adsorption of reactive dye onto carbon nanotubes: equilibrium,
kinetics and thermodynamics. Journal of hazardous materials, 144(1), 93-100.
Wu, W., Chen, W., Lin, D., & Yang, K. (2012). Influence of surface oxidation of
multiwalled carbon nanotubes on the adsorption affinity and capacity of polar
and nonpolar organic compounds in aqueous phase. Environmental science &
technology, 46(10), 5446-5454.
Wu, W., Yang, K., Chen, W., Wang, W., Zhang, J., Lin, D., & Xing, B. (2016).
Correlation and prediction of adsorption capacity and affinity of aromatic
compounds on carbon nanotubes. Water research, 88, 492-501.
Xie, J., Zhang, N., & Varadan, V. K. (2005). Functionalized carbon nanotubes in
platinum decoration. Smart materials and structures, 15(1), S5.
Xiong, L., Yang, Y., Mai, J., Sun, W., Zhang, C., Wei, D., . . . Ni, J. (2010). Adsorption
behavior of methylene blue onto titanate nanotubes. Chemical Engineering
Journal, 156(2), 313-320.
Xu, J., Wang, L., & Zhu, Y. (2012). Decontamination of bisphenol A from aqueous
solution by graphene adsorption. Langmuir, 28(22), 8418-8425.
Xu, X.-j., & Huang, S.-m. (2007). Carbon dioxide as a carbon source for synthesis of
carbon nanotubes by chemical vapor deposition. Materials Letters, 61(21),
4235-4237.
Xu, Z.-X., Lin, J.-D., Roy, V., Ou, Y., & Liao, D.-W. (2005). Catalytic synthesis of
carbon nanotubes and carbon spheres using Kaolin supported catalyst. Materials
Science and Engineering: B, 123(2), 102-106.
Yagub, M. T., Sen, T. K., Afroze, S., & Ang, H. M. (2014). Dye and its removal from
aqueous solution by adsorption: a review. Advances in colloid and interface
science, 209, 172-184.
Yagub, M. T., Sen, T. K., & Ang, M. (2014). Removal of cationic dye methylene blue
(MB) from aqueous solution by ground raw and base modified pine cone
powder. Environmental earth sciences, 71(4), 1507-1519.
Yan, X. M., Shi, B. Y., Lu, J. J., Feng, C. H., Wang, D. S., & Tang, H. X. (2008).
Adsorption and desorption of atrazine on carbon nanotubes. Journal of Colloid
and Interface Science, 321(1), 30-38.
Yan, Y., Miao, J., Yang, Z., Xiao, F.-X., Yang, H. B., Liu, B., & Yang, Y. (2015).
Carbon nanotube catalysts: recent advances in synthesis, characterization and
applications. Chemical Society Reviews, 44(10), 3295-3346.
Yan, Y., Zhang, M., Gong, K., Su, L., Guo, Z., & Mao, L. (2005). Adsorption of
methylene blue dye onto carbon nanotubes: a route to an electrochemically
functional nanostructure and its layer-by-layer assembled nanocomposite.
Chemistry of Materials, 17(13), 3457-3463.
Univers
ity of
Mala
ya

260
Yang, J., & Qiu, K. (2010). Preparation of activated carbons from walnut shells via
vacuum chemical activation and their application for methylene blue removal.
Chemical Engineering Journal, 165(1), 209-217.
Yang, K., Wu, W., Jing, Q., & Zhu, L. (2008). Aqueous adsorption of aniline, phenol,
and their substitutes by multi-walled carbon nanotubes. Environmental science
& technology, 42(21), 7931-7936.
Yang, K., & Xing, B. (2010). Adsorption of organic compounds by carbon
nanomaterials in aqueous phase: Polanyi theory and its application. Chemical
Reviews, 110(10), 5989-6008.
Yang, K., Zhu, L., & Xing, B. (2006). Adsorption of polycyclic aromatic hydrocarbons
by carbon nanomaterials. Environmental science & technology, 40(6), 1855-
1861.
Yang, S.-T., Chen, S., Chang, Y., Cao, A., Liu, Y., & Wang, H. (2011). Removal of
methylene blue from aqueous solution by graphene oxide. Journal of colloid and
interface science, 359(1), 24-29.
Yang, S., Hai, F. I., Nghiem, L. D., Nguyen, L. N., Roddick, F., & Price, W. E. (2013).
Removal of bisphenol A and diclofenac by a novel fungal membrane bioreactor
operated under non-sterile conditions. International Biodeterioration &
Biodegradation, 85, 483-490.
Yao, Y., Miao, S., Liu, S., Ma, L. P., Sun, H., & Wang, S. (2012). Synthesis,
characterization, and adsorption properties of magnetic Fe 3 O 4@ graphene
nanocomposite. Chemical Engineering Journal, 184, 326-332.
Yao, Y., Xu, F., Chen, M., Xu, Z., & Zhu, Z. (2010). Adsorption behavior of methylene
blue on carbon nanotubes. Bioresource technology, 101(9), 3040-3046.
Yener, J., Kopac, T., Dogu, G., & Dogu, T. (2008). Dynamic analysis of sorption of
Methylene Blue dye on granular and powdered activated carbon. Chemical
Engineering Journal, 144(3), 400-406.
Yong, Z., Fang, L., & Zhi-Hua, Z. (2011). Synthesis of heterostructured helical carbon
nanotubes by iron-catalyzed ethanol decomposition. Micron, 42(6), 547-552.
Yoon, Y., Ryu, J., Oh, J., Choi, B.-G., & Snyder, S. A. (2010). Occurrence of endocrine
disrupting compounds, pharmaceuticals, and personal care products in the Han
River (Seoul, South Korea). Science of the Total Environment, 408(3), 636-643.
Yu, D., Goh, K., Wang, H., Wei, L., Jiang, W., Zhang, Q., . . . Chen, Y. (2014).
Scalable synthesis of hierarchically structured carbon nanotube-graphene fibres
for capacitive energy storage. Nature nanotechnology, 9(7), 555-562.
Yu, F., Chen, J., Yang, M., Zhou, L., Jin, L., Su, C., . . . Yu, L. (2012). A facile one-pot
method for synthesis of low-cost magnetic carbon nanotubes and their
applications for dye removal. New Journal of Chemistry, 36(10), 1940-1943.
Yu, F., Wu, Y., Ma, J., & Zhang, C. (2013). Adsorption of lead on multi-walled carbon
nanotubes with different outer diameters and oxygen contents: Kinetics,
Univers
ity of
Mala
ya

261
isotherms and thermodynamics. Journal of Environmental Sciences, 25(1), 195-
203.
Yu, J.-G., Zhao, X.-H., Yang, H., Chen, X.-H., Yang, Q., Yu, L.-Y., . . . Chen, X.-Q.
(2014a). Aqueous adsorption and removal of organic contaminants by carbon
nanotubes. Science of the Total Environment, 482-483(Supplement C), 241-251.
Yu, J.-G., Zhao, X.-H., Yang, H., Chen, X.-H., Yang, Q., Yu, L.-Y., . . . Chen, X.-Q.
(2014b). Aqueous adsorption and removal of organic contaminants by carbon
nanotubes. Science of the Total Environment, 482–483, 241-251.
Yu, J.-G., Zhao, X.-H., Yang, H., Chen, X.-H., Yang, Q., Yu, L.-Y., . . . Chen, X.-Q.
(2014c). Aqueous adsorption and removal of organic contaminants by carbon
nanotubes. Science of the Total Environment, 482, 241-251.
Yu, S., Wang, X., Yao, W., Wang, J., Ji, Y., Ai, Y., . . . Wang, X. (2017). Macroscopic,
spectroscopic, and theoretical investigation for the interaction of phenol and
naphthol on reduced graphene oxide. Environmental science & technology,
51(6), 3278-3286.
Yüksel, S., Kabay, N., & Yüksel, M. (2013). Removal of bisphenol A (BPA) from
water by various nanofiltration (NF) and reverse osmosis (RO) membranes.
Journal of hazardous materials, 263, 307-310.
Zare, K., Gupta, V. K., Moradi, O., Makhlouf, A. S. H., Sillanpää, M., Nadagouda, M.
N., . . . Wang, Z.-j. (2015). A comparative study on the basis of adsorption
capacity between CNTs and activated carbon as adsorbents for removal of
noxious synthetic dyes: a review. Journal of Nanostructure in Chemistry, 5(2),
227-236.
Zare, K., Sadegh, H., Shahryari-ghoshekandi, R., Maazinejad, B., Ali, V., Tyagi, I., . . .
Gupta, V. K. (2015). Enhanced removal of toxic Congo red dye using multi
walled carbon nanotubes: Kinetic, equilibrium studies and its comparison with
other adsorbents. Journal of Molecular Liquids, 212, 266-271.
Zhang, A., & Li, Y. (2014). Removal of phenolic endocrine disrupting compounds from
waste activated sludge using UV, H 2 O 2, and UV/H 2 O 2 oxidation processes:
effects of reaction conditions and sludge matrix. Science of the Total
Environment, 493, 307-323.
Zhang, D., Pan, B., Zhang, H., Ning, P., & Xing, B. (2010). Contribution of Different
Sulfamethoxazole Species to Their Overall Adsorption on Functionalized
Carbon Nanotubes. Environmental Science & Technology, 44(10), 3806-3811.
Zhang, F., Lan, J., Yang, Y., Wei, T., Tan, R., & Song, W. (2013). Adsorption behavior
and mechanism of methyl blue on zinc oxide nanoparticles. Journal of
Nanoparticle Research, 15(11), 2034.
Zhang, J., Li, X., Chen, H., Qi, M., Zhang, G., Hu, H., & Ma, X. (2017). Hydrogen
production by catalytic methane decomposition: Carbon materials as catalysts or
catalyst supports. International Journal of Hydrogen Energy, 42(31), 19755-
19775.
Univers
ity of
Mala
ya

262
Zhang, J., Ping, Q., Niu, M., Shi, H., & Li, N. (2013). Kinetics and equilibrium studies
from the methylene blue adsorption on diatomite treated with sodium hydroxide.
Applied Clay Science, 83, 12-16.
Zhang, L., Song, X., Liu, X., Yang, L., Pan, F., & Lv, J. (2011). Studies on the removal
of tetracycline by multi-walled carbon nanotubes. Chemical Engineering
Journal, 178, 26-33.
Zhang, L., Xu, T., Liu, X., Zhang, Y., & Jin, H. (2011). Adsorption behavior of multi-
walled carbon nanotubes for the removal of olaquindox from aqueous solutions.
Journal of hazardous materials, 197, 389-396.
Zhang, X., Huang, Y., Wang, Y., Ma, Y., Liu, Z., & Chen, Y. (2009). Synthesis and
characterization of a graphene–C 60 hybrid material. Carbon, 47(1), 334-337.
Zhang, X., Shen, J., Zhuo, N., Tian, Z., Xu, P., Yang, Z., & Yang, W. (2016).
Interactions between Antibiotics and Graphene-Based Materials in Water: A
Comparative Experimental and Theoretical Investigation. ACS applied materials
& interfaces, 8(36), 24273-24280.
Zhang, Y., Cheng, Y., Chen, N., Zhou, Y., Li, B., Gu, W., . . . Xian, Y. (2014).
Recyclable removal of bisphenol A from aqueous solution by reduced graphene
oxide–magnetic nanoparticles: Adsorption and desorption. Journal of colloid
and interface science, 421(Supplement C), 85-92.
Zhang, Z., Wang, W., & Wang, A. (2015). Highly effective removal of methylene blue
using functionalized attapulgite via hydrothermal process. Journal of
Environmental Sciences, 33, 106-115.
Zhang, Z., Zhang, Z., Fernández, Y., Menéndez, J., Niu, H., Peng, J., . . . Guo, S.
(2010). Adsorption isotherms and kinetics of methylene blue on a low-cost
adsorbent recovered from a spent catalyst of vinyl acetate synthesis. Applied
surface science, 256(8), 2569-2576.
Zhao, D., Zhang, W., Chen, C., & Wang, X. (2013). Adsorption of Methyl Orange Dye
Onto Multiwalled Carbon Nanotubes. Procedia Environmental Sciences, 18,
890-895.
Zhao, H., Liu, X., Cao, Z., Zhan, Y., Shi, X., Yang, Y., . . . Xu, J. (2016). Adsorption
behavior and mechanism of chloramphenicols, sulfonamides, and non-antibiotic
pharmaceuticals on multi-walled carbon nanotubes. Journal of hazardous
materials, 310(Supplement C), 235-245.
Zhao, J., Buldum, A., Han, J., & Lu, J. P. (2002). Gas molecule adsorption in carbon
nanotubes and nanotube bundles. Nanotechnology, 13(2), 195.
Zhao, J., Lu, J. P., Han, J., & Yang, C.-K. (2003). Noncovalent functionalization of
carbon nanotubes by aromatic organic molecules. Applied physics letters,
82(21), 3746-3748.
Zhao, M., & Liu, P. (2008). Adsorption behavior of methylene blue on halloysite
nanotubes. Microporous and Mesoporous Materials, 112(1), 419-424.
Univers
ity of
Mala
ya

263
Zhao, X., Zhang, L., Murali, S., Stoller, M. D., Zhang, Q., Zhu, Y., & Ruoff, R. S.
(2012). Incorporation of manganese dioxide within ultraporous activated
graphene for high-performance electrochemical capacitors. ACS nano, 6(6),
5404-5412.
Zhao, Z., Fu, D., & Zhang, B. (2016). Novel molecularly imprinted polymer prepared
by palygorskite as support for selective adsorption of bisphenol A in aqueous
solution. Desalination and Water Treatment, 57(27), 12433-12442.
Zheng, S., Sun, Z., Park, Y., Ayoko, G. A., & Frost, R. L. (2013). Removal of bisphenol
A from wastewater by Ca-montmorillonite modified with selected surfactants.
Chemical Engineering Journal, 234, 416-422.
Zhou, L., Ji, L., Ma, P.-C., Shao, Y., Zhang, H., Gao, W., & Li, Y. (2014a).
Development of carbon nanotubes/CoFe2O4 magnetic hybrid material for
removal of tetrabromobisphenol A and Pb(II). Journal of hazardous materials,
265, 104-114.
Zhou, L., Ji, L., Ma, P.-C., Shao, Y., Zhang, H., Gao, W., & Li, Y. (2014b).
Development of carbon nanotubes/CoFe 2 O 4 magnetic hybrid material for
removal of tetrabromobisphenol A and Pb (II). Journal of hazardous materials,
265, 104-114.
Zhou, Q., Wang, Y., Xiao, J., & Fan, H. (2016). Adsorption and removal of bisphenol
A, α-naphthol and β-naphthol from aqueous solution by Fe 3 O 4@ polyaniline
core–shell nanomaterials. Synthetic Metals, 212, 113-122.
Zhou, Y., Chen, L., Lu, P., Tang, X., & Lu, J. (2011). Removal of bisphenol A from
aqueous solution using modified fibric peat as a novel biosorbent. Separation
and Purification Technology, 81(2), 184-190.
Zhou, Y., Lu, P., & Lu, J. (2012). Application of natural biosorbent and modified peat
for bisphenol a removal from aqueous solutions. Carbohydrate Polymers, 88(2),
502-508.
Zhou, Z.-W., Liu, Y.-T., Xie, X.-M., & Ye, X.-Y. (2016). Constructing novel Si@
SnO2 core–shell heterostructures by facile self-assembly of SnO2 nanowires on
silicon hollow nanospheres for large, reversible lithium storage. ACS applied
materials & interfaces, 8(11), 7092-7100.
Zhu, D., & Pignatello, J. J. (2005). Characterization of aromatic compound sorptive
interactions with black carbon (charcoal) assisted by graphite as a model.
Environmental science & technology, 39(7), 2033-2041.
Zhu, X., Zhu, L., Chen, Y., & Tian, S. (2009). Acute toxicities of six manufactured
nanomaterial suspensions to Daphnia magna. Journal of Nanoparticle Research,
11(1), 67-75.
Ziebro, J., Łukasiewicz, I., Borowiak-Palen, E., & Michalkiewicz, B. (2010). Low
temperature growth of carbon nanotubes from methane catalytic decomposition
over nickel supported on a zeolite. Nanotechnology, 21(14), 145308.
Univers
ity of
Mala
ya

264
Zielińska, M., Bułkowska, K., Cydzik-Kwiatkowska, A., Bernat, K., & Wojnowska-
Baryła, I. (2016). Removal of bisphenol A (BPA) from biologically treated
wastewater by microfiltration and nanofiltration. International Journal of
Environmental Science and Technology, 13(9), 2239-2248.
Zohre, S., Ataallah, S. G., & Mehdi, A. (2010). Experimental study of methylene blue
adsorption from aqueous solutions onto carbon nano tubes. International
Journal of Water Resources and Environmental Engineering, 2(2), 016-028.
Univers
ity of
Mala
ya

265
LIST OF PUBLICATIONS
1- Alayan, H.M; AlSaadi, M.A.; Abo-Hamad, A.; AlOmar, M.K.; Aljumaily, M.M;
Das, R.; Hashim, M.A, Hybridizing carbon nanomaterial with powder activated
carbon for an efficient removal of Bisphenol A from water: The optimum growth
and adsorption conditions. Desalination and Water Treatment Journal. 2017
(95),128-143.
2- Alayan, H.M; AlSaadi, M.A.; Das, R.; Abo-Hamad; A., AlOmar, M.K; Hashim,
M.A, The formation of hybrid carbon nanomaterial by chemical vapor deposition:
An efficient adsorbent for enhanced removal of methylene blue from aqueous
solution. Water Science and Technology Journal. 2018, 77 (6), 1714-1723.
3- Alayan, H.M; AlSaadi, M.A.; AlOmar, M.K.; Hashim, M.A, Growth and
optimization of carbon nanotubes in powder activated carbon for an efficient
removal of methylene blue from aqueous solution. Environmental Technology
Journal. 2018, (38).
Conference Papers (Presenter)
- Alayan, H.M, AlSaadi, M.A., & Hashim, M. A. (2015). Study the activity of
platinum and palladium zeolite supported catalysts for hydrocarbon reactions.
Utility Reaction and Environmental Research-PURE2015. Univers
ity of
Malaya