
Radial Growth of Qilian Juniper on the Northeast Tibetan Plateau and Potential Climate Associations
15
Radial Growth of Qilian Juniper on the Northeast Tibetan Plateau and Potential Climate Associations Chun Qin 1 , Bao Yang 1 *, Thomas M. Melvin 2 , Zexin Fan 3 , Yan Zhao 4 , Keith R. Briffa 2 1 Key Laboratory of Desert and Desertification, Cold and Arid Regions Environmental and Engineering Research Institute, Chinese Academy of Sciences, Lanzhou, China, 2 Climatic Research Unit, School of Environmental Sciences, University of East Anglia, Norwich, United Kingdom, 3 Key Laboratory of Tropical Forest Ecology, Xishuangbanna Tropical Botanical Garden, Chinese Academy of Sciences, Kunming, China, 4 Institute of Geographic Sciences and Natural Resources Research, Chinese Academy of Sciences, Beijing, China Abstract There is controversy regarding the limiting climatic factor for tree radial growth at the alpine treeline on the northeastern Tibetan Plateau. In this study, we collected 594 increment cores from 331 trees, grouped within four altitude belts spanning the range 3550 to 4020 m.a.s.l. on a single hillside. We have developed four equivalent ring-width chronologies and shown that there are no significant differences in their growth-climate responses during 1956 to 2011 or in their longer-term growth patterns during the period AD 1110–2011. The main climate influence on radial growth is shown to be precipitation variability. Missing ring analysis shows that tree radial growth at the uppermost treeline location is more sensitive to climate variation than that at other elevations, and poor tree radial growth is particularly linked to the occurrence of serious drought events. Hence water limitation, rather than temperature stress, plays the pivotal role in controlling the radial growth of Sabina przewalskii Kom. at the treeline in this region. This finding contradicts any generalisation that tree-ring chronologies from high-elevation treeline environments are mostly indicators of temperature changes. Citation: Qin C, Yang B, Melvin TM, Fan Z, Zhao Y, et al. (2013) Radial Growth of Qilian Juniper on the Northeast Tibetan Plateau and Potential Climate Associations. PLoS ONE 8(11): e79362. doi:10.1371/journal.pone.0079362 Editor: Paulo Cavalcanti Gomes Ferreira, Universidade Federal do Rio de Janeiro, Brazil Received May 16, 2013; Accepted September 20, 2013; Published November 14, 2013 Copyright: ß 2013 Qin et al. This is an open-access article distributed under the terms of the Creative Commons Attribution License, which permits unrestricted use, distribution, and reproduction in any medium, provided the original author and source are credited. Funding: The study was jointly funded by the NSFC (Grant No. 41002050, 41071130), and Interdisciplinary Innovation Team project of the Chinese Academy of Sciences (29Y329B91). KRB and TMM acknowledge support from NERC (NE/G018863/1). Bao Yang gratefully acknowledges the support of K.C. Wong Education Foundation, Hong Kong. The funders had no role in study design, data collection and analysis, decision to publish, or preparation of the manuscript. Competing Interests: The authors have declared that no competing interests exist. * E-mail: [email protected] Introduction Due to its exposure to extremely harsh environmental conditions, such as low air temperatures and severe water shortage, tree growth near the alpine treeline is potentially extremely sensitive to climate change [1]. Consequently, such environments have received increasing attention from dendrocli- matologists. Based on the principle of limiting factors in dendroclimatology, many dendroclimatologists consider that the variability of annual tree growth at the lower treeline is likely controlled by variability in precipitation, while at the upper treeline it is more closely controlled by the variability of temperature, especially at high latitudes, or at high elevations in the generally humid Alps and in some semi-arid areas [2–6]. However, uniform growth pattern (where the tree growth is controlled by a common climate signal at upper and lower treelines) has also been found in the arid regions of western central Asia [7], in the northeastern region of the arid central Tianshan Mountains [8], in a subtropical monsoonal region of South America [9] and in a low latitude humid region of North America [10,11]. Therefore, further researches are required to clarify the association between elevation and climate influences on tree growth in the regions of various climate types. The Northeast Tibetan Plateau, located at the convergence of the westerly and easterly summer monsoons, is highly sensitive to climate change. The altitude of the terrain in this region varies from 2000 m to 5050 m above sea level (a.s.l.). Qilian juniper and Qinghai spruce (Picea crassifolia Kom.) are endemic and widespread dominant species, on south-facing slopes and north-facing slopes, respectively, in the alpine forest of the northeast Tibetan Plateau. Both species are generally considered as good candidates for obtaining effective paleoclimate proxies [12–19]. There are a number of previous studies of tree growth and climate variability in the treeline ecotone in this area [20–29]. Some researchers consider that temperature is the main growth-limiting factor in the upper treeline ecotone: for example in the eastern Qilian Mountains [27], in the eastern mountainous regions of the Qaidam Basin [23,28], in the semi-humid climates of the southeastern [20] and eastern [21] of the Tibetan Plateau. Other researchers have found that the growth responses of tree-line forests to climate variability show different patterns, associated with different climate conditions in the Anyemaqen Mountains [24] and the southern Tibetan Plateau [29], and have shown that short-term growth-climate relationships are unstable in the Qilian Mountains [26]. In summary, the effect of climate change on the alpine treeline in our study area remains complex and a matter of debate. The focus of attention in this study concerns the main limiting factor for tree growth in the treeline ecotone: is it temperature, precipitation, or both? Thus, we start from the plant physiological/ecological viewpoint, exploring altitude and age- dependent characteristics of tree growth in this species, and combine this with dendroclimatology, exploring the statistical association between tree radial growth time series and climate data records to establish a case study on the northeastern Tibetan PLOS ONE | www.plosone.org 1 November 2013 | Volume 8 | Issue 11 | e79362
Transcript of Radial Growth of Qilian Juniper on the Northeast Tibetan Plateau and Potential Climate Associations

Radial Growth of Qilian Juniper on the Northeast TibetanPlateau and Potential Climate AssociationsChun Qin1, Bao Yang1*, Thomas M. Melvin2, Zexin Fan3, Yan Zhao4, Keith R. Briffa2
1 Key Laboratory of Desert and Desertification, Cold and Arid Regions Environmental and Engineering Research Institute, Chinese Academy of Sciences, Lanzhou, China,
2 Climatic Research Unit, School of Environmental Sciences, University of East Anglia, Norwich, United Kingdom, 3 Key Laboratory of Tropical Forest Ecology,
Xishuangbanna Tropical Botanical Garden, Chinese Academy of Sciences, Kunming, China, 4 Institute of Geographic Sciences and Natural Resources Research, Chinese
Academy of Sciences, Beijing, China
Abstract
There is controversy regarding the limiting climatic factor for tree radial growth at the alpine treeline on the northeasternTibetan Plateau. In this study, we collected 594 increment cores from 331 trees, grouped within four altitude belts spanningthe range 3550 to 4020 m.a.s.l. on a single hillside. We have developed four equivalent ring-width chronologies and shownthat there are no significant differences in their growth-climate responses during 1956 to 2011 or in their longer-termgrowth patterns during the period AD 1110–2011. The main climate influence on radial growth is shown to be precipitationvariability. Missing ring analysis shows that tree radial growth at the uppermost treeline location is more sensitive to climatevariation than that at other elevations, and poor tree radial growth is particularly linked to the occurrence of serious droughtevents. Hence water limitation, rather than temperature stress, plays the pivotal role in controlling the radial growth ofSabina przewalskii Kom. at the treeline in this region. This finding contradicts any generalisation that tree-ring chronologiesfrom high-elevation treeline environments are mostly indicators of temperature changes.
Citation: Qin C, Yang B, Melvin TM, Fan Z, Zhao Y, et al. (2013) Radial Growth of Qilian Juniper on the Northeast Tibetan Plateau and Potential ClimateAssociations. PLoS ONE 8(11): e79362. doi:10.1371/journal.pone.0079362
Editor: Paulo Cavalcanti Gomes Ferreira, Universidade Federal do Rio de Janeiro, Brazil
Received May 16, 2013; Accepted September 20, 2013; Published November 14, 2013
Copyright: � 2013 Qin et al. This is an open-access article distributed under the terms of the Creative Commons Attribution License, which permits unrestricteduse, distribution, and reproduction in any medium, provided the original author and source are credited.
Funding: The study was jointly funded by the NSFC (Grant No. 41002050, 41071130), and Interdisciplinary Innovation Team project of the Chinese Academy ofSciences (29Y329B91). KRB and TMM acknowledge support from NERC (NE/G018863/1). Bao Yang gratefully acknowledges the support of K.C. Wong EducationFoundation, Hong Kong. The funders had no role in study design, data collection and analysis, decision to publish, or preparation of the manuscript.
Competing Interests: The authors have declared that no competing interests exist.
* E-mail: [email protected]
Introduction
Due to its exposure to extremely harsh environmental
conditions, such as low air temperatures and severe water
shortage, tree growth near the alpine treeline is potentially
extremely sensitive to climate change [1]. Consequently, such
environments have received increasing attention from dendrocli-
matologists. Based on the principle of limiting factors in
dendroclimatology, many dendroclimatologists consider that the
variability of annual tree growth at the lower treeline is likely
controlled by variability in precipitation, while at the upper
treeline it is more closely controlled by the variability of
temperature, especially at high latitudes, or at high elevations in
the generally humid Alps and in some semi-arid areas [2–6].
However, uniform growth pattern (where the tree growth is
controlled by a common climate signal at upper and lower
treelines) has also been found in the arid regions of western central
Asia [7], in the northeastern region of the arid central Tianshan
Mountains [8], in a subtropical monsoonal region of South
America [9] and in a low latitude humid region of North America
[10,11]. Therefore, further researches are required to clarify the
association between elevation and climate influences on tree
growth in the regions of various climate types.
The Northeast Tibetan Plateau, located at the convergence of
the westerly and easterly summer monsoons, is highly sensitive to
climate change. The altitude of the terrain in this region varies
from 2000 m to 5050 m above sea level (a.s.l.). Qilian juniper and
Qinghai spruce (Picea crassifolia Kom.) are endemic and widespread
dominant species, on south-facing slopes and north-facing slopes,
respectively, in the alpine forest of the northeast Tibetan Plateau.
Both species are generally considered as good candidates for
obtaining effective paleoclimate proxies [12–19]. There are a
number of previous studies of tree growth and climate variability
in the treeline ecotone in this area [20–29]. Some researchers
consider that temperature is the main growth-limiting factor in the
upper treeline ecotone: for example in the eastern Qilian
Mountains [27], in the eastern mountainous regions of the
Qaidam Basin [23,28], in the semi-humid climates of the
southeastern [20] and eastern [21] of the Tibetan Plateau. Other
researchers have found that the growth responses of tree-line
forests to climate variability show different patterns, associated
with different climate conditions in the Anyemaqen Mountains
[24] and the southern Tibetan Plateau [29], and have shown that
short-term growth-climate relationships are unstable in the Qilian
Mountains [26]. In summary, the effect of climate change on the
alpine treeline in our study area remains complex and a matter of
debate. The focus of attention in this study concerns the main
limiting factor for tree growth in the treeline ecotone: is it
temperature, precipitation, or both? Thus, we start from the plant
physiological/ecological viewpoint, exploring altitude and age-
dependent characteristics of tree growth in this species, and
combine this with dendroclimatology, exploring the statistical
association between tree radial growth time series and climate data
records to establish a case study on the northeastern Tibetan
PLOS ONE | www.plosone.org 1 November 2013 | Volume 8 | Issue 11 | e79362

plateau, China. This information will hopefully provide new
insights that will improve our understanding of the influence of
climate variability on the radial growth of Qilian juniper (Sabina
przewalskii Kom.) at the alpine treeline in the semiarid region.
Materials and Methods
All necessary permits were obtained for the described field
studies from the Administration of Delingha Forestry.
Study areaThe study area is located in the Zongwulong Mountains, on the
northeast Tibetan Plateau. The altitude of the study area varies
between 3200 m and 5030 m a.s.l, with an average altitude of
4000 m. There is perennial snow cover above 4500 m.a.s.l. Qilian
juniper (on south-facing slopes), Qinghai spruce (on north-facing
slopes) and more prostrate shrub growth are found below 4100
m.a.s.l.. Qilian juniper is mostly distributed in the upper regions of
the mountains, while the tops are mostly characterized by rock
debris and rocky outcrops. The mountains are mainly composed
of middle-Jurassic sandstone, conglomerate and limestone. Alpine
forest gray–brown soils, subalpine shrub meadow soils, alpine
meadow soils, and alpine chestnut soils are typical in this area.
The individual sampling sites are located in a sampling region
called Manitu (MNT, 97.68uE, 37.46uN, Figure 1), on a south-
facing (sunny) slope in the middle of the Zongwulong Mountains.
The slope angle ranges from 15u to 65u. The alpine forest is pure
Qilian juniper forest. The closest available meteorological records
are from Delingha national weather station (37.37uN, 97.37uE,
2982.4 m.a.s.l.), which is 41 kilometers from MNT and between
500 m and 1000 m below the study sites. The mean, maximum
and minimum annual temperatures at Delingha were 3.84uC,
11.38uC and 22.55uC in the period 1956–2011, respectively.
Mean winter (from previous December to current January) and
summer (from June to July) temperatures were 29.4uC and
15.7uC. The average annual precipitation was 173 mm, with
73.7% of the annual precipitation falling between May and
August. The average relative humidity was 38.8%. In summary,
our study area represents a typical mid-latitude arid to semi-arid
alpine region (Figure 2).
Tree-ring width dataAll the tree-ring width (TRW) samples were collected at breast
height with an increment borer, on a single hillside. After air
drying, the core surfaces were prepared with razor blades and the
Figure 1. Locations of the tree-ring sampling sites and the meteorological station on the northeast Tibetan Plateau (black flag:Delingha meteorological station; red tree, olive green tree, green tree and blue tree indicates the ring-width collection areas atdifferent elevations: H (3900 m–4015 m), MH (3790 m–3899 m), ML (3701 m–3789 m), and L (3550 m–3700 m); two photographswere taken of the upper treeline and the whole hillside, respectively).doi:10.1371/journal.pone.0079362.g001
Figure 2. Climate diagrams of temperature and precipitation atDelingha meteorological station for the 1956–2011.doi:10.1371/journal.pone.0079362.g002
Qilian Juniper and Climate Change in NE TP
PLOS ONE | www.plosone.org 2 November 2013 | Volume 8 | Issue 11 | e79362

Table 1. Characteristics of raw (measured) tree-ring data and of the standard chronologies for each of four (High, Middle High,Middle Low and Low) elevations and for the overall composite chronology.
Site code Altitude (m) Slope(6) Core/Tree Time span(AD) ML Max/Mean/Min TRW (mm)
H 3900–4015/3965 40–65 165/93(45) 955–2011 452 0.667/0.331/0.127
MH 3790–3899/3818 40–65 147/85(37) 1005–2011 447 0.671/0.352/0.131
ML 3701–3789/3760 35–60 165/91(54) 940–2011 436 0.874/0.394/0.205
L 3550–3700/3603 15–45 117/62(31) 1110–2011 369 1.331/0.513/0.169
ALL - - 594/331(167) 940–2011 430 1.331/0.39/0.127
Site code MS AC(1) R/R1/R2* PC1*(%) SNR* EPS*
H 0.33/0.22 0.70/0.33 0.57/0.89/0.57 44.9/59.4 26/50 0.98
MH 0.36/0.27 0.70/0.50 0.57/0.92/0.56 44.9/61.1 17/36 0.97
ML 0.32/0.25 0.73/0.54 0.4/0.78/0.39 30.8/42.5 14/28 0.96
L 0.34/0.25 0.74/0.62 0.52/0.87/0.49 43.4/56.8 6/11.8 0.92
ALL 0.34/0.25 0.72/0.49 0.48/0.85/0.47 37.8/66.5 42/54 0.99
Altitude: elevation range/median elevation; Slope: topographic slope angle; Core/Tree: number of cores and trees collected at this elevation, the value in round bracketsis the number of trees for which pith offsets are available; Time span: the period when the EPS value is greater than 0.85,which means the time series is robust. ML:mean segment length; Max/Mean/Min TRW: maximum, mean and minimum tree-ring width; MS: mean sensitivity of raw ring data and standard chronology; AC1: first-order autocorrelation of raw ring data and standard chronology; R/R1/R2: mean inter-series/within-tree/between-tree correlation coefficient; PC1: percent varianceexplained by the first principal component of raw ring data and standard chronology; SNR: signal-to-noise ratio of raw ring data and standard chronology; EPS:expressed population signal, calculated for ARSTAN standard chronologies for 30-year intervals with 15-year overlaps.*Calculated for the common period 1750–2000 (1700–2000 for the composite chronology).doi:10.1371/journal.pone.0079362.t001
Figure 3. Trend surface for cambial age, elevation (m), tree-ring width (mm/100) (a) and radial ring-width growth trends (mm/100)(b) at MNT, Delingha, China. The surface is interpolated from four original unsmoothed curves of radial ring width (see Figure 5) using inversedistance weighting.doi:10.1371/journal.pone.0079362.g003
Qilian Juniper and Climate Change in NE TP
PLOS ONE | www.plosone.org 3 November 2013 | Volume 8 | Issue 11 | e79362

surface contrast was enhanced with chalk. Ring widths were
recorded with a LINTAB II measuring system at a resolution of
0.01 mm, and all cores were cross-dated by visual growth pattern
matching, skeleton plotting and statistical tests available in the
software package TSAP [30,31]. Cores displaying poor correlation
with the master series were removed. Finally, 594 increment cores
from 331 trees were retained. Detailed information on sampling
sites and the TRW data at different elevations are listed in Table 1.
Based on the elevation range and the characteristics of the sample
distribution, we separated the data into four different altitude belts
stretching from the lower tree line to the upper tree line, while
ensuring that sufficient samples were available in each altitude
belt. These four ranges were as follows: High (H: 3900–4015
m.a.s.l.), Middle High (MH: 3790–3899 m.a.s.l.), Middle Low
(ML: 3701–3789 m.a.s.l.), and Low (L: 3550–3700 m.a.s.l.).
Climate dataMonthly mean/maximum/minimum temperature, total pre-
cipitation and mean relatively humidity data were computed from
daily records for Delingha station obtained from the China
Meteorological Data Sharing Service System (http://cdc.cma.gov.
cn/). The instrumental records cover 1956–2011. The nearest
Palmer Drought Severity Index (PDSI) gridpoint data (1850–2010,
for a 2.5u62.5u grid, centered on 36.25uN, 98.75uE) were
extracted from the self-calibrated PDSI data set, in this case
calculated using Penman-Monteith Potential Evapotranspiration
(updated to 2010) [32]. For consistency with other climate data, we
used the PDSI data for the period 1956 to 2010.
Radial tree growth analysisMeasured tree-ring radial growth series comprise age-related
trends, climate-related growth variations, the effects of disturbance
from within and outside the forest community, and residual
variability associated with random disturbance effects [33,34].
Because the canopy density of Qilian juniper is less than 0.3, we
adopted the simplifying assumption that trees were growing in a
relatively competition-free, open-canopy forest. We assumed a
situation where an idealized series of radial growth increment
measurements contains only age-related effects manifested as a
long-term radial growth trend with climate-related variations
superimposed. We also note that ‘‘elevation is a site factor affecting
mean annual precipitation and temperature regimes’’ [3]. Tree-
ring width (TRW) variability is therefore attributable to a
combination of altitude-related variability (including climate) and
age-related trends, specifically:
TRW~EzA,
where E is the elevation-related variability, and A represent the
age-related trends.
Chronology analysisTo investigate the climate-related variability, ‘growth trends’
were firstly removed from the series of ring width measurements.
All processing was carried out using the ARSTAN program [34].
The raw TRW series were ‘standardized’ to remove biological
growth trends and other low-frequency variations considered
attributable to stand dynamics. Before standardization, the
variance of each series was stabilized using a data-adaptive power
transformation based on the local mean and standard deviation
[35]. In order to remove age-related biological trends, a modified
negative exponential curve was fitted to each raw series. The tree-
ring indices were obtained by calculating residuals between raw
measurements and fitted values. All detrended index series were
then averaged using the biweight robust mean (rather than the
Figure 4. Comparison of sample depths over time for the fourelevation zones.doi:10.1371/journal.pone.0079362.g004
Figure 5. Characteristics of the radial tree-ring biologicalgrowth trends at different elevations: (a) H (3900 m–4015 m),(b) MH (3790 m–3899 m), (c) ML (3701 m–3789 m), and (d) L(3550 m–3700 m), based on Hugershoff functions fitted to themeans measurement data. The thin line is a mean curve for radialtree-ring biological growth at different elevations. The thick line is acurve fitted to the Hugershoff function. The 95% confidence interval isshown by light yellow shading.doi:10.1371/journal.pone.0079362.g005
Qilian Juniper and Climate Change in NE TP
PLOS ONE | www.plosone.org 4 November 2013 | Volume 8 | Issue 11 | e79362

arithmetic mean) in order to reduce the influence of outliers [36].
Four TRW chronologies were developed in this way, each
representing tree growth over time, on relatively short-to-medium
timescales (years to centuries) in each of the four altitude belts.
Standard (STD) and residual (RES) are two types of tree
chronology produced by ARSTAN, each representing compli-
mentary information useful for climate reconstruction. However,
there are essential differences in terms of trend persistence. Due to
the removal of low-order persistence, the RES chronology only
represents relatively ‘high-frequency’ information, while STD
contains more low-frequency information originating from persis-
tent variance in single trees. To investigate growth-climate
relationships, we employed both types of TRW chronology. The
relevant data will be deposited in PANGAEA (http://www.
pangaea.de/).
Growth-climate response analysisDue to the biological persistence in TRW series, TRW series
often represent an effectively smoothed response to climate
variability registered on a year-to-year basis. To explore the
statistical associations between different monthly-mean climate
factors and ring-width indices, we selected the period encompass-
ing the previous May to the current October as the ‘‘potential
effective climatic window’’. Individual monthly climate–growth
relationships were analyzed using the software DENDROCLIM
2002 [37]. Based on the results, the optimum seasonal assemblies
were selected for the growth-climate response analysis.
Unfortunately, there are only 56 years of instrumental climate
records available, which is too short to identify the natural
relationships between tree radial growth and climate change
trends with strong confidence. Meanwhile, TRW index data show
1956–2011 to be a period of relatively high growth (mean value
1.11) relative to the long-term index average (the mean value is
0.99 from 1110 to 2011), limiting our ability to assess whether
there are existing significant altitude-related impacts of climate on
radial growth in our study area. We also note that the chronology
construction approaches used here (i.e. the STD and RES
chronologies from ARSTAN – see earlier) may not retain all of
the long-timescale climate-related information. We selected six
‘typical’ 50-year periods (comprising three high-growth periods
and three relatively low-growth periods): 1204–1253 (high); 1254–
1303 (low), 1435–1484 (low), 1550–1599 (high), 1684–1733 (low),
and 1961–2010 (high). We treated each TRW index series as a 50-
dimensional vector and computed the Euclidean distance between
each individual vector and the mean 50-dimensional vector (the
mean value of each series on each year), using cluster analysis, to
measure the difference between each single TRW index at
different elevations.
The equation for Euclidean distance is
D(Xi,xi0)~ffiffiffiffiffiffiffiffiffiffiffiffiffiffiffiffiffiffiffiffiffiffiffiffiffiffiffiffiffiffiffiffiffiffiffiffiffiffiffiffiffiffiffiffiffiffiffiffiffiffiffiffiffiffiPn
1 ((Xi{Xi0) � (Xi{Xi0))p
, where Xi is the ith-
dimension value of each vector and Xi0 is the mean value of all the
ith-dimension values. Here, n = 50 years.
Extreme climate events analysisMissing rings are an excellent indicator of likely extreme climate
events when the meteorological conditions are assumed to be
beyond the physiological limit for tree growth. In general, we
would expect the frequency of missing rings to be associated
Figure 6. Scatter diagram showing relationships between the elevation and mean ring width after Z score transformation using 265trees. The Pearson’s correlation coefficient is 20.29, which is significant at the p = 0.01 level.doi:10.1371/journal.pone.0079362.g006
Qilian Juniper and Climate Change in NE TP
PLOS ONE | www.plosone.org 5 November 2013 | Volume 8 | Issue 11 | e79362

mostly with the occurrence of extreme drought-related events in
this semi-arid area. We wished to investigate the nature of the
relationship between missing ring and climate variability and
whether there is evidence of significant altitude-related effects on
this relationship. In order to answer these questions, we computed
the temporal variability of the relative missing ring ratio in each
altitude belt. To reduce sample depth-related effects (i.e. differing
replication), homogenization of sample depth was applied prior to
computing the relative missing ring ratio. The Kruskal-Wallis H
test, a type of K independent samples nonparametric test, was
applied to test the difference.
Results
Characteristics of radial growthIn order to establish a robust picture of the physiological-
ecological trend curve, we examined tree cambial age only up to
500 years, when the sample depths were 19 trees (for the high
elevation group: H), 14 trees (MH), 22 trees (ML), and 13 trees (L),
respectively. Figure 3 clearly shows that radial growth of Qilian
juniper has a distinct age-related trend, regardless of whether the
trees grow at high or low altitude, starting with a very rapid initial
growth rate peaking at ages 25–45. Subsequently, the growth rate
gradually decreases with increasing age. This pattern is consistent
with our previous research on the same species [38] in the
upstream Heihe river region (38u099N, 99u579E).
Meanwhile, altitude-related variations are evident during the
different lifestages of Qilian juniper. Due to the similar distribution
of young and old trees within each altitude belt (Figure 4), the four
Figure 7. Four standardized chronologies (a), four residual chronologies (b) and the composite chronology (All) and their sampledepth at different elevations from MNT. The regional chronology is derived by using all available ring-width series from the four sub-chronologies. The thick line is the 11-year Fast Fourier Transform (FFT) smoothed series. To the right of the vertical dotted line the chronology EPSvalue is above 0.85, which indicates a statistical reliable series. The light yellow shaded area shows the number of series. The numbers in the upperleft corner of all subfigures are the elevation ranges of each zone.doi:10.1371/journal.pone.0079362.g007
Table 2. Correlation coefficient matrix between the four STD(upper right corner) and RES (lower left corner) chronologiesand the composite chronology during 1956–2011 and 1110–2011.
R H MH ML L All
H 1 0.91/0.92 0.88/0.87 0.88/0.81 0.96/0.95
MH 0.95/0.94 1 0.94/0.92 0.89/0.88 0.97/0.98
ML 0.92/0.91 0.92/0.95 1 0.89/0.90 0.96/0.96
L 0.93/0.87 0.93/0.93 0.9/0.93 1 0.95/0.92
All 0.98/0.97 0.98/0.99 0.95/0.97 0.97/0.95 1
All the values are significant at the p = 0.01 level.doi:10.1371/journal.pone.0079362.t002
Qilian Juniper and Climate Change in NE TP
PLOS ONE | www.plosone.org 6 November 2013 | Volume 8 | Issue 11 | e79362

Figure 8. Comparison of low-frequency variability in four STD chronologies at different elevations and the composite chronologyduring 1110–2011.doi:10.1371/journal.pone.0079362.g008
Table 3. Comparisons of the three optimum seasonal assemblies of various climate elements for each of the STD chronologies.
Temperature Min.Tem. Max.Tem. Precipitation PDSI
SA R SA R SA R SA R SA R
P9-C3 0.24 P9-C3 0.19 P9-C3 0.26 P7-C6 0.6 C3-C6 0.5
H P1-P12 0.23 P1-P12 0.19 P1-P12 0.21 P12-C6 0.56 P9-C8 0.46
P12-C2 0.24 P12-C2 0.2 P12-C2 0.26 P3-C6 0.56 P9-C2 0.33
P9-C3 0.51 P9-C3 0.48 P9-C3 0.38 P7-C6 0.74 C3-C6 0.57
MH P1-P12 0.49 P1-P12 0.48 P1-P12 0.3 P12-C6 0.67 P9-C8 0.48
P12-C2 0.46 P12-C2 0.45 P12-C2 0.37 P3-C6 0.65 P9-C2 0.31
P9-C3 0.46 P9-C3 0.45 P9-C3 0.28 P7-C6 0.68 C3-C6 0.61
ML P1-P12 0.45 P1-P12 0.45 P1-P12 0.25 P12-C6 0.66 P9-C8 0.51
P12-C2 0.41 P12-C2 0.43 P12-C2 0.25 P3-C6 0.65 P9-C2 0.34
P9-C3 0.28 P9-C3 0.29 P9-C3 0.11 P7-C6 0.61 C3-C6 0.46
L P1-P12 0.28 P1-P12 0.3 P1-P12 0.09 P12-C6 0.58 P9-C8 0.4
P12-C2 0.25 P12-C2 0.27 P12-C2 0.13 P3-C6 0.58 P9-C2 0.27
P9-C3 0.39 P9-C3 0.37 P9-C3 0.26 P7-C6 0.69 C3-C6 0.55
PC1 P1-P12 0.38 P1-P12 0.37 P1-P12 0.22 P12-C6 0.65 P9-C8 0.48
P12-C2 0.35 P12-C2 0.35 P12-C2 0.26 P3-C6 0.64 P9-C2 0.32
P9-C3 0.38 P9-C3 0.36 P9-C3 0.26 P7-C6 0.68 C3-C6 0.56
All P1-P12 0.37 P1-P12 0.36 P1-P12 0.21 P12-C6 0.64 P9-C8 0.48
P12-C2 0.34 P12-C2 0.34 P12-C2 0.26 P3-C6 0.63 P9-C2 0.32
Min. Tem.: monthly minimum temperature; Max. Tem.: monthly maximum temperature; PDSI: Palmer Drought Severity Index; SA: optimum seasonal assembly; R:correlation coefficient; H/MH/ML/L: the site code of the four different elevations (see Table 1); PC1: first principal component of the four chronologies; All: the compositechronology; P9-C3: previous September to Current March; 0.24/0.11: correlation coefficient with STD and RES chronologies, respectively.doi:10.1371/journal.pone.0079362.t003
Qilian Juniper and Climate Change in NE TP
PLOS ONE | www.plosone.org 7 November 2013 | Volume 8 | Issue 11 | e79362

ring-width groups display similar age-related ‘‘disturbances’’ in the
age-related expectation of ring-width as a function of tree age [39].
In general, TRW decreases with increasing elevation (Figure 3,
Table 1), regardless of whether a tree is old or young. However,
the amplitude of the average ‘cycle’ of changing ring width
throughout the lifespan of trees is markedly lower (from 0.29 mm
to 0.16 mm in the beginning 50 years, and from 0.42 mm to
0.30 mm over the whole 500 years) with increasing altitude
(Figure 5). By 500 years the annual growth rate has reduced from
0.33 mm to 0.21 mm. The age of maximum ring width
attainment is similar at each of the four elevations (specifically,
H: 41, MH: 37, ML: 31, L: 39; years of age). The radial ring-width
decline with age after trees reach about 50 years old is steeper at
lower elevation sites. This physiological phenomenon is directly
related to the tree growth rate (i.e. increase of diameter with age):
lower elevation trees exhibit a faster growth rate. Such differences
in radial growth rates at the same biological age are the result of
local environmental effects of temperature and precipitation due to
different elevations.
Mean series length (i.e. the age of sample trees) increases with
increasing elevation, which likely reflects more human disturbance
(e.g., logging, grazing, man-made fire) at the lower boundary and
less disturbance at the upper treeline. It is worth noting that the
confidence associated with fitting trend surfaces in the 350–500
years range is low, because the minimum of the mean series length
in four elevations (Table 1) is nearly 350 years; this necessarily
restricts our discussion of the biological age 350–500 due to the
effective ‘‘high-pass-filtering effect’’ on the variance spectra of tree
indices and on the chronology series imposed by the standardi-
zation methods used here. This is the so-called ‘‘segment length
effect’’ described in Cook et al. [40] and Esper et al. [41].
In order to quantify the relationships between TRW and
elevation, we removed the fast growth period (about 300 years) at
the beginning of each series for each tree and computed the Z-
Score of TRW and elevation of 265 trees, and plotted a scatter
diagram (Figure 6). The results show that TRW and elevation
have a significant negative correlation (R = 20.28, N = 265) at the
0.01 level. Therefore, elevation significantly affects radial (phys-
iological) tree growth of Qilian juniper species. These results
provide a basis for the priority of growth rate classification or
altitude classification pretreatment of TRW over the tree-ring
growth trend removal when exploring the use of Regional Curve
Standardisation.
Characteristics of the tree ring indexFour STD and RES chronologies were established at four
elevations (Figure 7). The mean sensitivity and first-order
autocorrelation of the tree ring indices are considerably reduced
relative to the values for ring width data. However, the percent
variance explained by the first principal component of the index
data is increased by comparison. The high correlation coefficients
between all the chronologies (listed in Table 2) show that there are
no significant statistical differences between standardized tree ring
chronologies at different altitudes for the periods 1110–2011
(R.0.81, N = 902, p = 0.01) and 1956–2011 (R.0.88, N = 56,
p = 0.01). It is worth noting that RES showed better correlation
than STD at the four elevations, due to removal of more of the
lower order trends. That is to say, there is greater consistency in
the high-frequency variability than in medium or lower-frequency
trends, though there were no statistically significant differences
apparent in the lower-frequency trends in the chronologies. The
consistency between the STD chronologies is shown by Fast
Fourier Transform (FFT) filter smoothing of the chronologies at
different time scales during the last 902 years (Figure 8). Principal
components analysis of these data shows that the first component
(PC1) explains 91.3% variance, with very similar loadings of 0.97/
0.97/0.94/0.94 corresponding to the H/MH/ML/L chronologies
respectively. Therefore, all four chronologies from different
elevations exhibit a very strong common pattern of variability
during the past 902 years. Finally, STD and RES chronologies
Table 4. Pearson correlation coefficients (1956–2011)between STD chronologies and optimal seasonal precipitaitonand temperature and the same correlations using first-orderdifferential series.
Precipitation(P7-C6) Temperature (P12-C2)
R Rac1 R Rac1
H 0.6 0.62 0.24 0.04
MH 0.74 0.69 0.46 0.02
ML 0.68 0.62 0.41 20.03
L 0.61 0.66 0.25 20.06
All 0.68 0.66 0.34 20.01
R: correlation coefficient; Rac1: correlation coefficient of the first-orderdifferential series. H, MH, ML, L, All are site codes for different elevations (seeTable 1). Precipitation (P7-C6) is the accumulated precipitation from previousJuly to current June. Temperature (P12-C2) is the mean temperature fromprevious December to current February.doi:10.1371/journal.pone.0079362.t004
Table 5. Response surface regression results and their F values at the four different elevations and the composite site.
Site A00 A01 A02 A10 A11 A20 F F0.01(5,49)/F0.01(5,48)
H 0.142/20.1 20.264/0.163 20.216/0.149 0.866/0.6 0.573/0.022 20.259/20.047 8.8/7.4** 3.42/3.43
MH 0.116/20.081 0.025/0.189 20.12/0.129 0.863/0.67 0.496/0.022 20.284/20.046 19.1/10.7** 3.42/3.43
ML 0.128/20.025 0.018/0.156 20.121/0.097 0.761/0.608 0.315/0.004 20.19/20.071 10.2/7.3** 3.42/3.43
L 0.328/20.115 20.278/0.12 20.227/0.163 0.917/0.626 0.351/0.081 20.309/20.045 8.9/9.3** 3.42/3.43
All 0.199/20.09 20.148/0.16 20.181/0.141 0.901/0.638 0.461/0.037 20.287/20.049 11.8/9.2** 3.42/3.43
The response surface was defined by a quadratic surface function: Z(X ,Y )~A00zA01YzA02Y 2zA10XzA11XYzA20X 2 .Here, Z = Z score value of standardized tree ring index at different elevations and the whole site; X = Z score value of mean precipitation (previous July to current June);Y = Z score value of mean temperature (previous September to current March). The F value is calculated by F~
SSR=pSSD=(n{p{1)
, with notation as follows. SSR : regressionsum of squares, SSD : residual sum of squares, p: degrees of freedom of the regression function, here p = 5, n: number of active data, here n = 55. If FwFa , the responsesurface regression is significant at the a level.**F value is significant at p = 0.01 level.doi:10.1371/journal.pone.0079362.t005
Qilian Juniper and Climate Change in NE TP
PLOS ONE | www.plosone.org 8 November 2013 | Volume 8 | Issue 11 | e79362
were developed using all increment cores collected from the four
altitude belts, and is referred to here as ‘‘All’’ chronology (Tabs. 1–
5, 8; Figure 8).
A common period analysis for the regional chronology was
carried out for the period 1750–2000, and some descriptive
statistics are shown in Table 1. Signal strength of the standard
chronology was assessed by the mean inter-series correlation
(rbar), and the associated expressed population signal (EPS). The
Rbar (.0.4), and EPS (.0.90) during 1750–2000 indicate that
signal strength was sufficient for climate reconstruction of the
medium to high-frequency climate variability.
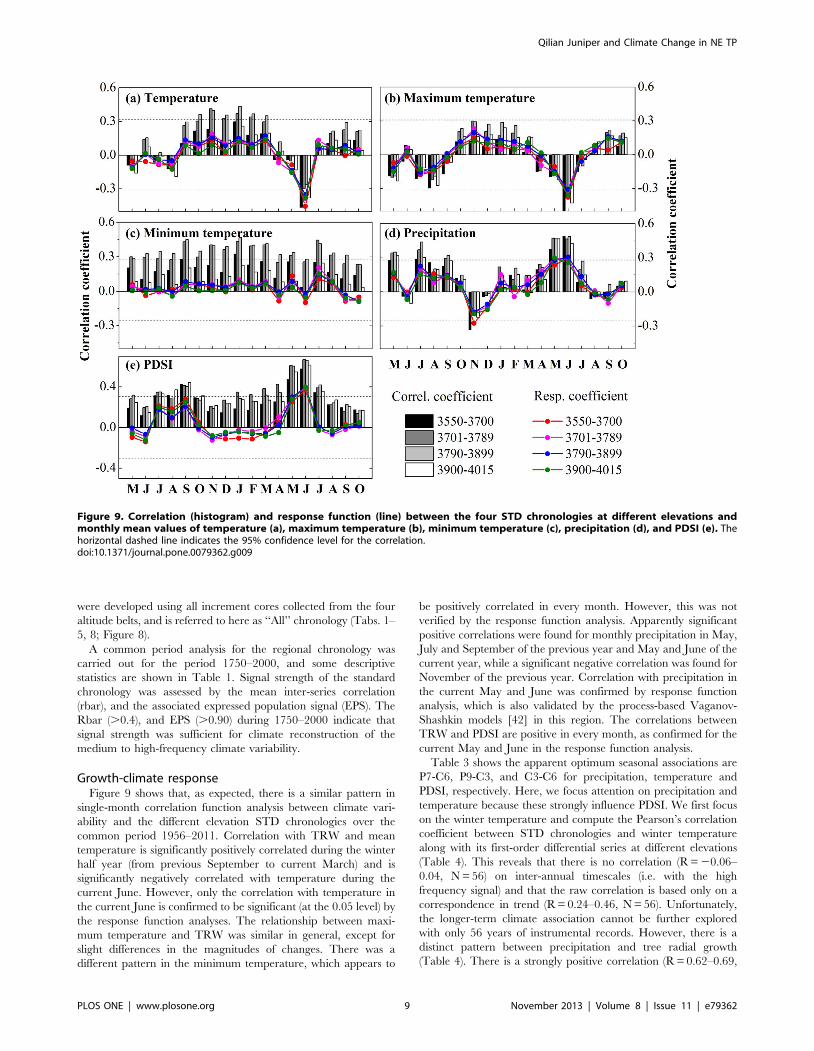
Growth-climate responseFigure 9 shows that, as expected, there is a similar pattern in
single-month correlation function analysis between climate vari-
ability and the different elevation STD chronologies over the
common period 1956–2011. Correlation with TRW and mean
temperature is significantly positively correlated during the winter
half year (from previous September to current March) and is
significantly negatively correlated with temperature during the
current June. However, only the correlation with temperature in
the current June is confirmed to be significant (at the 0.05 level) by
the response function analyses. The relationship between maxi-
mum temperature and TRW was similar in general, except for
slight differences in the magnitudes of changes. There was a
different pattern in the minimum temperature, which appears to
be positively correlated in every month. However, this was not
verified by the response function analysis. Apparently significant
positive correlations were found for monthly precipitation in May,
July and September of the previous year and May and June of the
current year, while a significant negative correlation was found for
November of the previous year. Correlation with precipitation in
the current May and June was confirmed by response function
analysis, which is also validated by the process-based Vaganov-
Shashkin models [42] in this region. The correlations between
TRW and PDSI are positive in every month, as confirmed for the
current May and June in the response function analysis.
Table 3 shows the apparent optimum seasonal associations are
P7-C6, P9-C3, and C3-C6 for precipitation, temperature and
PDSI, respectively. Here, we focus attention on precipitation and
temperature because these strongly influence PDSI. We first focus
on the winter temperature and compute the Pearson’s correlation
coefficient between STD chronologies and winter temperature
along with its first-order differential series at different elevations
(Table 4). This reveals that there is no correlation (R = 20.06–
0.04, N = 56) on inter-annual timescales (i.e. with the high
frequency signal) and that the raw correlation is based only on a
correspondence in trend (R = 0.24–0.46, N = 56). Unfortunately,
the longer-term climate association cannot be further explored
with only 56 years of instrumental records. However, there is a
distinct pattern between precipitation and tree radial growth
(Table 4). There is a strongly positive correlation (R = 0.62–0.69,
Figure 9. Correlation (histogram) and response function (line) between the four STD chronologies at different elevations andmonthly mean values of temperature (a), maximum temperature (b), minimum temperature (c), precipitation (d), and PDSI (e). Thehorizontal dashed line indicates the 95% confidence level for the correlation.doi:10.1371/journal.pone.0079362.g009
Qilian Juniper and Climate Change in NE TP
PLOS ONE | www.plosone.org 9 November 2013 | Volume 8 | Issue 11 | e79362

Figure 10. Response surfaces for standardized tree ring index (a) and first-order differential series of standardized tree ring index(b) for four different elevations: H, MH, ML, L. The height of each surface represents the magnitude of growth response to a given combinationof annual (previous July to current June) precipitation and winter (previous September to current March) temperature. All data (includingprecipitation, temperature, and standardized tree ring index) are Z score transformed in order to eliminate the impact of different dimensional units.doi:10.1371/journal.pone.0079362.g010
Qilian Juniper and Climate Change in NE TP
PLOS ONE | www.plosone.org 10 November 2013 | Volume 8 | Issue 11 | e79362

N = 56) between precipitation and tree growth on inter-annual
time scales. This is more evident for the climate response surfaces
calculated using the STD tree ring index (Figure 10a, Table 5) and
its first-order differential series (Figure 10b, Table 5) in the four
different elevations. These results lead us to conclude that any
temperature-related inference based on these chronologies relies
solely on a statistical association manifested only at low-frequency
and it cannot be considered more than a coincident association in
recent decades at these sites. Tree rings best represent precipita-
tion variability, as might be expected given the severe lack of water
at these sites.
Elevation effects on the chronology variabilityTo examine the natural role of altitude-related effects on
chronology variability during different ‘typical’ periods (Table 6) in
the last 902 years, we calculated the Euclidean distance for each of
the tree-ring index series (i.e. for each single tree) in both the STD
and residual data sets during each period. We first examined the
altitude-related characteristics for both the mean tree biological
age and sample size (Table 6) in order to assess whether a
heterogeneous sample distribution might contribute to the tree
biological age curve, or whether different sample sizes occur at
different elevations. Most of the six periods have a relative even
altitude distribution with respect to both the mean tree biological
age and sample size, except for 1254–1303 and 1961–2010. So we
considered the remaining four periods would most likely indicate
any true altitude-related effect. Significant negative correlations
ranging from 20.29 to 20.16 (with p values ranging from about 0
to 0.04, Figure 11a) were obtained for the relationships between
elevation and standardized tree-ring series during most periods
(the exception was 1254–1303: correlation r = 0.02, p = 0.85),
which is anomalous with respect to the analysis results for the four
chronologies at different elevations. Various ‘‘individual respons-
es’’ of TRW index [26,43] are the most likely potential causes of
such contradictory conclusions. However, there were no signifi-
cant negative correlations with altitude in the residual tree ring
series for any of the periods (Figure 11b) (correlation range
r = 20.05 to 0.06, p = 0.40 to 0.82) with the exception of 1961–
2010 (r = 20.20, P = 0.05). Therefore, there is an apparent
altitude-related effect on standard tree ring index series, and no
statistically discernable effect in the residual tree ring series. This
suggests some systematic tendancy for greater growth at lower
elevation associated with the greater low-frequency variability
presented in the indices produced for standard chronologies. This
finding is also confirmed using other methods for growth trend
removal (e.g. Hugershoff; not shown in this article). It should be
noted that while such effects are statistically significant on the scale
of a single TRW index series level, they cannot be diagnosed using
the four STD chronologies (i.e. after averaging individual trees
index series). From the inter-annual, decadal, centennial to multi-
centennial scale, there are no notable differences in the STD
chronologies for the four elevations from 1110 to 2011 (Figure 12,
Table 7). This finding is confirmed by the tree-ring study
conducted at Qifeng site (,235 km far away) in the northeast
Tibetan Plateau [13]. However, this situation contrasts with the
view that climate responses are frequency dependent: e.g. where
low-frequency variations from the upper forest border chronolo-
gies are likely related to warm-season temperature fluctuations,
whereas high-frequency variations are related to precipitation,
such as in the semiarid mountainous area of North America at
similar latitudes [44,45]. Such differences in the frequency-
dependent climate signal are due to different climate responses
for the upper (temperature) and lower (precipitation) border
chronologies, and may not be applicable to a region such as this or
where the climate responses at the upper and lower forest borders
are unknown.
Extreme climate events and their potential as climaticcontrols on tree growth
Relative missing ring ratios, at four altitude belts and for the
whole hillside in MNT during 1200–2011 are plotted in Figure 13.
In order to learn more about whether there are significant
differences in missing ring responses to extreme climate variability
at different altitudes, we used the Kruskal-Wallis H test. The
results (Table 8) show that significant differences exist between
high (.10%, n = 13, p = 0.05) and low (,2%, n = 105,
p = 0.015,0.05) missing ring ratio events, although there was no
significant difference (n = 149, p = 0.397.0.05) between the
complete distributions of all the missing ring ratio events across
the four altitude belts. As seen from Table 8, the trees near the
upper treeline (mean rank H: 208.6, MH: 236.82) are more
sensitive to climate change than those in the other altitude belts
(mean rank ML: 202.18, L: 194.4), based on a frequency of
relative missing ring ratio events of less than 2%. A similar
Table 6. Comparisons of altitude-related characteristics for the mean tree biological age and corresponding sample size in sixtypical periods.
Elevation/m 1204–1253/AD 1254–1303/AD 1435–1484/AD 1550–1599/AD 1684–1733/AD 1961–2010/AD
3551–3600 63/6 104/9 229/10 338/11 284/15 265/12
3601–3650 69/1 119/1 51/3 155/4 73/15 355/3
3651–3700 176/9 217/10 369/11 490/10 582/4 183/4
3701–3750 108/10 156/11 146/13 232/14 305/15 576/8
3751–3800 108/36 155/41 236/43 270/43 249/51 351/27
3801–3850 284/11 245/13 186/10 274/12 351/11 417/5
3851–3900 55/12 93/16 241/19 260/25 215/14 517/7
3901–3950 78/14 121/16 254/19 303/24 199/16 407/8
3951–4000 113/12 111/16 233/21 284/25 153/33 380/16
4001–4050 149/6 199/6 274/7 288/8 312/5 589/3
.4050 150/1 150/1 150/1 150/1 150/1
doi:10.1371/journal.pone.0079362.t006
Qilian Juniper and Climate Change in NE TP
PLOS ONE | www.plosone.org 11 November 2013 | Volume 8 | Issue 11 | e79362

Figure 11. Comparison of altitude-related effects on standardized tree ring series (a) and residual tree ring series (b), whichseparately constitute the STD and RES chronologies during six typical periods (three high-value periods and three low-valueperiods). Euclidean distance is defined as the distance between each TRW series (50-dimensional vectors) and the mean TRW series (50-dimensionalvector) of all the TRW series in the given periods. Both the elevation (m) and Euclidean distance are transformed to Z scores. R(1204–1253): highprecipitation during 1204–1254; P(1254–1303):low precipitation during 1254–1303; SE: standard error; RSS: residual sum of squares; Prob.F: theprobability that the null hypothesis for the full model is true (i.e., that all of the regression coefficients are zero).doi:10.1371/journal.pone.0079362.g011
Qilian Juniper and Climate Change in NE TP
PLOS ONE | www.plosone.org 12 November 2013 | Volume 8 | Issue 11 | e79362
interpretation applies to the data on extreme climate events
(relative missing ring ratio greater than 10%, mean rank H: 34.77,
L: 24.77). Our analysis suggests that researchers can reduce field
work while still gaining valuable insights into the occurrence of
past extreme climate events by focusing sample collection at the
upper treeline.
What is the climatic cause of such missing ring events?
Comparing their occurrence (i.e. years with more than 10%
missing rings) with reconstructed PDSI data (Cook et al. [46], data
for grid location 36.25uN, 98.75uE), reveals a mean PDSI value of
23.3 i.e. extreme dry years (Figure 13). This is confirmed by
primary instrumental records during 1956–2011. Compared with
temperature, precipitation displays a more robust and consistent
relationship with missing ring events (Figure 14). Therefore, the
missing ring events, especially those years with a relative missing
ring ratio more than 10%, very likely indicate serious drought
events. Figure 15 illustrates the composited climate pattern for the
9 missing ring event years that occurred within 1956–2011.
Temperatures are ‘‘normal’’ for the year preceding the missing-
ring year. There was some water shortage in the prior August
(216.15 mm), but this is likely not a key factor. However, serious
water shortage in May (217.19 mm) and June (223.07 mm) in
the tree growth year, which corresponds to the start period of
radial growth are very likely the major cause. Simultaneously, high
temperature (+1.32uC) in June probably reinforces the water stress.
Extremely low precipitation, accompanied by abnormally high
temperatures at the beginning of the radial growth season, is the
likely cause of missing ring events.
Conclusions
Using samples collected from 331 trees at four elevations
(3550 m–4020 m) on one single hillside, including 164 trees with
exact pith offset information, we analyzed the characteristics of
age-related effects and altitude-related effects on TRW in Qilian
juniper on the northeastern Tibetan Plateau. Altitude impacts
significantly on radial ring width: growth rates were lower at
higher altitudes, regardless of age. Tree-ring width reaches a
maximum between the ages 25–45.
There is a strong and significant correlation between the ring-
width chronologies at four different altitudes. The chronology-
climate associations at different elevations, as would be expected
on this basis, show no significant differences, whether expressed as
single-month correlations or by the use of response function
analysis. Standardised tree growth is associated primarily with
precipitation variability during previous July to current June.
Despite coincident trends, winter temperatures prior to the
growing season, have no influence on the high frequency tree
growth signal. In the similarity analysis of standardized and
residual tree ring series, some significant altitude-related effects
were apparent but only on the scale of individual standardized tree
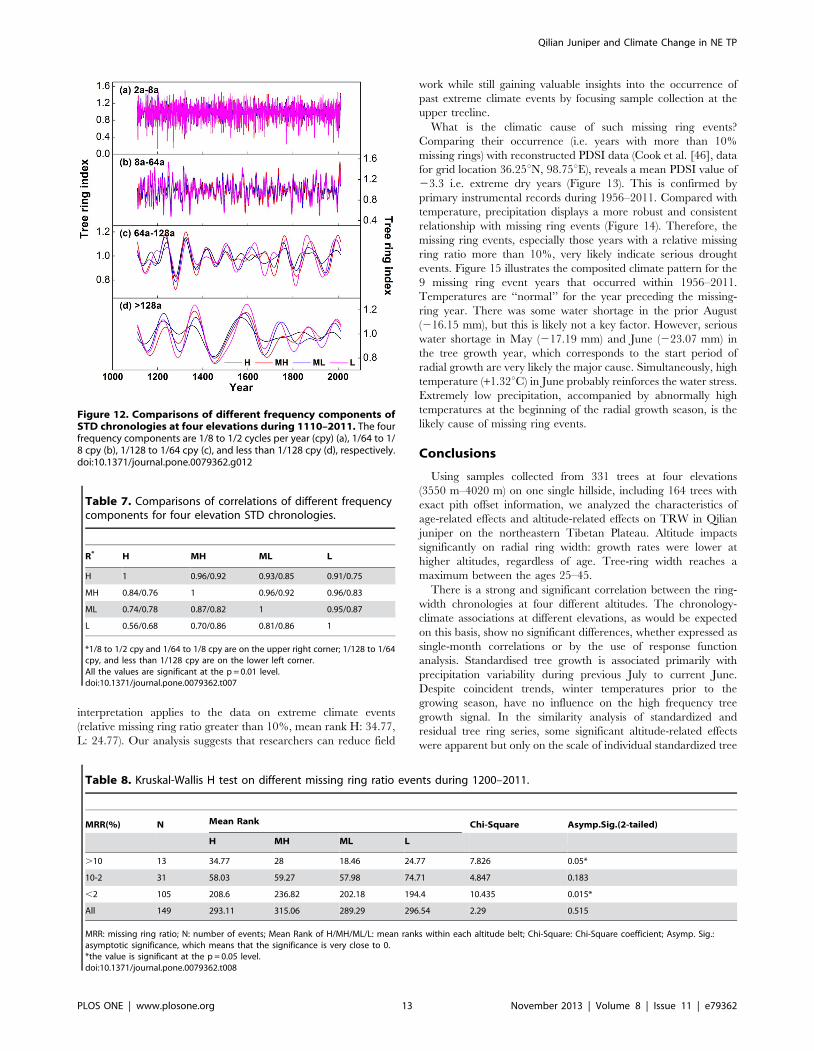
Figure 12. Comparisons of different frequency components ofSTD chronologies at four elevations during 1110–2011. The fourfrequency components are 1/8 to 1/2 cycles per year (cpy) (a), 1/64 to 1/8 cpy (b), 1/128 to 1/64 cpy (c), and less than 1/128 cpy (d), respectively.doi:10.1371/journal.pone.0079362.g012
Table 7. Comparisons of correlations of different frequencycomponents for four elevation STD chronologies.
R* H MH ML L
H 1 0.96/0.92 0.93/0.85 0.91/0.75
MH 0.84/0.76 1 0.96/0.92 0.96/0.83
ML 0.74/0.78 0.87/0.82 1 0.95/0.87
L 0.56/0.68 0.70/0.86 0.81/0.86 1
*1/8 to 1/2 cpy and 1/64 to 1/8 cpy are on the upper right corner; 1/128 to 1/64cpy, and less than 1/128 cpy are on the lower left corner.All the values are significant at the p = 0.01 level.doi:10.1371/journal.pone.0079362.t007
Table 8. Kruskal-Wallis H test on different missing ring ratio events during 1200–2011.
MRR(%) N Mean Rank Chi-Square Asymp.Sig.(2-tailed)
H MH ML L
.10 13 34.77 28 18.46 24.77 7.826 0.05*
10-2 31 58.03 59.27 57.98 74.71 4.847 0.183
,2 105 208.6 236.82 202.18 194.4 10.435 0.015*
All 149 293.11 315.06 289.29 296.54 2.29 0.515
MRR: missing ring ratio; N: number of events; Mean Rank of H/MH/ML/L: mean ranks within each altitude belt; Chi-Square: Chi-Square coefficient; Asymp. Sig.:asymptotic significance, which means that the significance is very close to 0.*the value is significant at the p = 0.05 level.doi:10.1371/journal.pone.0079362.t008
Qilian Juniper and Climate Change in NE TP
PLOS ONE | www.plosone.org 13 November 2013 | Volume 8 | Issue 11 | e79362

ring series, regardless of whether precipitation was relatively high
or low. Elevation showed no significant influence on the variability
of mean chronologies during the last 902 years or during any of
the selected 50-year periods. Missing ring events are related to
drought, and the uppermost treeline is more sensitive to climate
change than that of low altitude forest. Serious water shortage in
May and June of the growth year, which is strengthened by the
high temperature in June of the growth year, are the main
conditions needed to initiate missing ring events. There is no
doubt that our interpretation of tree-growth/climate relationship
in the cold and arid region could be helped by a better mechanistic
understanding of tree-growth physiology. A constructive way
forward may be to link small scale physiological tree growth
models, driven by localised meteorological variables, with large-
scale climate models and compare the results with radial growth
data in this region.
Figure 13. Comparison of relative missing ring ratios at four altitude belts and for the whole hillside in MNT, Delingha, northeastTibetan Plateau during 1200-2011. Sample depth homogenization was applied to reduce sample-depth-related disturbance prior to computingthe relative missing ring ratio. Bar heights indicate missing ring ratios for all samples each year, as visualized by different colored bars (the length ofeach bar corresponds to the relative missing ring ratio at each elevation). The light yellow shadow is the sample depth. The two dotted linescorrespond to the relative missing ring ratios of 10% and 2%, respectively. The values on each bar are the corresponding year and PDSI value (insquare brackets, Cook et al., 2010) for those years when the relative missing ring ratio exceeds 10%.doi:10.1371/journal.pone.0079362.g013
Figure 14. Comparison between missing ring ratio and thetemperature (a) and precipitation (b) instrumental records atDelingha during 1956–2011. Temperature is the mean fromprevious September to current March. Precipitation is the total fromprevious July to current June.doi:10.1371/journal.pone.0079362.g014
Figure 15. Average (a) and mean deviations (b) of precipitationand temperature from their long-term (1956–2011) meanvalues for all the missing ring events of the compositechronology.doi:10.1371/journal.pone.0079362.g015
Qilian Juniper and Climate Change in NE TP
PLOS ONE | www.plosone.org 14 November 2013 | Volume 8 | Issue 11 | e79362
Author Contributions
Conceived and designed the experiments: BY. Performed the experiments:
CQ BY TM YZ KB. Analyzed the data: CQ BY. Contributed reagents/
materials/analysis tools: CQ BY TM YZ KB ZF. Wrote the paper: CQ BY
TM YZ KB ZF.
References
1. Carrer M, Nola P, Eduard JL, Motta R, Urbinati C (2007) Regional variability
of climate-growth relationships in Pinus cembra high elevation forests in theAlps. Journal of Ecology, 95, 1072–1083.
2. LaMarche VC (1974) Paleoclimatic inferences from long tree-ring records.Science, 183, 1043–1048.
3. Fritts HC (1976) Tree Rings and Climate. Academic Press, London.
4. Splechtna BE, Dobry J, Klinka K (2000) Tree-ring characteristics of subalpine fir(Abies lasiocarpa (Hook.) Nutt.) in relation to elevation and climatic fluctuations.
Ann For Sci 57:89–100.5. Salzer MW, Hughes MK, Bunn AG, Kipfmueller KF (2009) Recent
unprecedented tree-ring growth in bristlecone pine at the highest elevations
and possible causes. Proc Natl Acad Sci 106 (48): 20348–20353.6. Babst F, Poulter B, Trouet V, Tan K, Neuwirth B, et al. (2012) Site- and species-
specific responses of forest growth to climate across the European continent.Global Ecol Biogeogr 22(6): 706–717.
7. Esper J, Frank DC, Wilson RJS, Buntgen U, Treydte K (2007) Uniform growthtrends among central Asian low- and high-elevation juniper tree sites. Trees
21:141–150.
8. Wang T, Ren HB, Ma KP (2005) Climatic signals in tree ring of Piceaschrenkiana along an altitudinal gradient in the central Tianshan Mountains,
northwestern China. Trees 19: 735–741.9. Morales MS, Villalba R, Grau HR, Paolini L (2004) Rainfall-controlled tree
growth in high-elevation subtropical treelines. Ecology 85 (11): 3080–3089.
10. Biondi F (2001) A 400-year tree-ring chronology from the tropical treeline ofNorth America. Ambio 30:162–166.
11. Biondi F (2002) Treeline dendroclimatology in the North American tropics.PAGES News 10:1.
12. Shao X, Xu Y, Yin ZY, Liang E, Zhu H, et al. (2010) Climatic implications of a
3585–year tree-ring width chronology from the northeastern Qinghai-TibetanPlateau. Quaternary Science Reviews, 29, 2111–2122.
13. Yang B, Qin C, Huang K, Fan ZX, Liu JJ (2010) Spatial and temporal patternsof variations in tree growth over the northeastern Tibetan Plateau during the
period 1450–2006. The Holocene, 20, 1235–1245.14. Yang B, Qin C, Brauning A, Burchardt I, Liu JJ (2011) Rainfall history for the
Hexi Corridor in the arid northwest China during the past 620 years derived
from tree rings. International Journal of Climatology, 31, 1166–1176.15. Qin C, Yang B, Burchardt I, Hu XL, Kang XC (2010) Intensified pluvial
conditions during the twentieth century in the inland Heihe River Basin in aridnorthwestern China over the past millennium. Global and Planetary Change,
72, 192–200.
16. Qin C, Yang B, Brauning A, Sonechkin DM, Huang K (2011) Regional extremeclimate events on the northeastern Tibetan Plateau since AD 1450 inferred from
tree rings. Global and Planetary Change, 75, 143–154.17. Kang SY, Yang B, Qin C, Wang JL, Shi F, et al. (2012) Extreme drought events
in the years 1877e1878, and 1928, in the southeast Qilian Mountains and theair-sea coupling system. Quaternary International. doi:10.1016/j.quaint.
2012.03.011.
18. Kang SY, Yang B, Qin C (2012) Recent tree-growth reduction in north centralChina as a combined result of a weakened monsoon and atmospheric
oscillations. Climatic Change. DOI 10.1007/s10584-012-0440-619. Liang EY, Shao XM, Eckstein D, Huang L, Liu XH (2006) Topography- and
species-dependent growth responses of Sabina przewalskii and Picea crassifolia
to climate on the northeast Tibetan Plateau. Forest Ecology and Management,236, 268–277.
20. Liang EY, Wang YF, Xu Y, Liu B, Shao XM (2010) Growth variation in Abiesgeorgei var. smithii along altitudinal gradients in the Sygera Mountains,
southeastern Tibetan Plateau. Trees 24: 363–373.21. Li ZS, Liu GH, Fu BJ, Hu CJ, Luo SZ, et al. (2012) Anomalous temperature–
growth response of Abies faxoniana to sustained freezing stress along elevational
gradients in China’s Western Sichuan Province. Trees (26): 1373–1388.22. Yang B, He M, Melvin TM, Zhao Y, Briffa KR (2013) Climate Control on Tree
Growth at the Upper and Lower Treelines: A Case Study in the QilianMountains, Tibetan Plateau. PLoS ONE 8(7): e69065. doi:10.1371/journal.-
pone.0069065
23. Zheng YH, Zhu HF, Zhang YX, Shao XM (2009) Relationships betweenSabina przewalskii radial growth and climatic factors at upper timberlines in
eastern mountainous region of Qaidam Basin. Chinese Journal of AppliedEcology, 20, 507–512.
24. Fang KY, Gou XH, Chen FH, Peng JF, D’Arrigo R, et al. (2009) Response of
regional tree-line forests to climate change: evidence from the northeasternTibetan Plateau. Trees, 23, 1321–1329.
25. Peng JF, Gou XH, Chen FH, Li JB, Liu PX, et al. (2008) Altitudinal variability
of climate-tree growth relationships along a consistent slope of AnyemaqenMountains, northeastern Tibetan Plateau. Dendrochronologia, 26, 87–96.
26. Zhang YX, Shao XM, Wilmking M (2011) Dynamic relationships between Picea
crassifolia growth and climate at upper treeline in the Qilian Mts., NortheastTibetan Plateau, China. Dendrochronologia, 29, 185–199. doi:10.1016/
j.dendro.2010.11.001.
27. Gou XH, Zhang F, Deng Y, Ettl GJ, Yang MX, et al. (2012) Patterns anddynamics of tree-line response to climate change in the eastern Qilian
Mountains, northwestern China. Dendrochronologia, 30, 121–126.
28. Zhu HF, Zheng YH, Shao XM, Liu XH, Xu Y, et al. (2008) Millennialtemperature reconstruction based on tree-ring widths of Qilian juniper from
Wulan, Qinghai Province, China. Chinese Science Bulletin, 53(24), 3914–3920.
29. He MH, Yang B, Brauning A (2013) Tree growth-climate relationships ofJuniperus tibetica along an altitudinal gradient on the southern Tibetan Plateau.
Trees 27:429–439.
30. Stokes MA, Smiley TL (1996) An Introduction to Tree-Ring Dating, pp. 1–73.The University of Chicago Press: Chicago, London.
31. Rinn F (2003) TSAP-Win: Time Series Analysis and Presentation for
Dendrochronology and Related Applications. Version 0.55 User reference.Heidelberg, Germany (http://www.rimatech.com).
32. Dai A (2011) Characteristics and trends in various forms of the Palmer Drought
Severity Index (PDSI) during 1900–2008. Journal of Geophysical Research, 116,D12115, doi:10.1029/2010JD015541.
33. Fritts HC, Mosimann JE, Bottorff CP (1969) A revised computer program for
standardizing tree-ring series. Tree-Ring Bulletin, 29, 15–20.
34. Cook ER (1985) A time-series analysis approach to tree-ring standardization.PhD Thesis. The University of Arizona Press, Tucson.
35. Cook ER, Peters K (1997) Calculating unbiased tree-ring indices for the study of
climatic and environmental change. The Holocene, 7, 361–370.
36. Cook ER, Kairiukstis A (Eds.) (1990) Methods of Dendrochronology:
Applications in the Environmental Sciences. Kluwer Academic Publishers,
Dordrecht.
37. Biondi F, Waikul K (2004) DENDROCLIM2002: a C++ program for statistical
calibration of climate signals in tree-ring chronologies. Computers and
Geosciences 30(3): 303–311.
38. Yang B, Qin C, Shi F, Sonechkin M (2012) Tree ring-based annual streamflow
reconstruction for the heihe river in arid northwestern china from ad 575 and its
implications for water resource management. The Holocene, DOI: 10.1177/0959683611430411.
39. Esper J, Niederer R, Bebi P, Frank D (2008) Climate signal age effects—
Evidence from young and old trees in the Swiss Engadin. Forest Ecology andManagement, 255, 3783–3789.
40. Cook ER, Briffa KR, Meko DM, Graybill DA, Funkhouser G (1995) The
‘segment length curse’ in long tree-ring chronology development for palaeocli-matic studies. The Holocene, 5, 229–237.
41. Esper J, Cook ER, Krusic PJ, Peters K, Schweingruber FH (2003) Tests of the
RCS method for preserving low-frequency variability in long tree-ringchronologies. Tree-Ring Research, 59, 81–98.
42. Zhang YX, Shao XM, Xu Y, Wilmking M (2011) Process-based modeling
analyses of Sabina przewalskii growth response to climate factors around thenortheastern Qaidam Basin. Chinese Science Bulletin, 56, 1518–1525, doi:
10.1007/s11434-011-4456-5.
43. Carrer M (2011) Individualistic and time-varying tree-ring growth to climatesensitivity. PLoS ONE 6, e22813. doi:10.1371/journal.pone.0022813.
44. LaMarche VC (1974) Frequency-Dependent Relationships between Tree-Ring
Series along an Ecological Gradient and Some Dendroclimatic Implications.Tree-Ring Bull, 34, 1–20.
45. Hughes MK, Funkhouser G (2003) Frequency-dependent climate signal in
upper and lower forest border tree rings in the mountains of the great basin.Climatic Change 59, 233–244.
46. Cook ER, Anchukaitis KJ, Buckley BM, D’Arrigo RD, Jacoby GC, et al. (2010)
Asian Monsoon Failure and Megadrought During the Last Millennium. Science,328, 486–489.
Qilian Juniper and Climate Change in NE TP
PLOS ONE | www.plosone.org 15 November 2013 | Volume 8 | Issue 11 | e79362