A mitochondrial revelation of early human migrations to the Tibetan Plateau before and after the...
15
A Mitochondrial Revelation of Early Human Migrations to the Tibetan Plateau Before and After the Last Glacial Maximum Zhendong Qin, 1 Yajun Yang, 1,2 Longli Kang, 1,3 Shi Yan, 4 Kelly Cho, 5 Xiaoyun Cai, 1 Yan Lu, 1 Hongxiang Zheng, 1 Dongchen Zhu, 1 Dongmei Fei, 1 Shilin Li, 1 Li Jin, 1,2,4 * Hui Li 1 *, and The Genographic Consortium 1 State Key Laboratory of Genetic Engineering and Ministry of Education Key Laboratory of Contemporary Anthropology, School of Life Sciences and Institutes of Biomedical Sciences, Fudan University, Shanghai 200433, China 2 China Medical City Institute of Health Sciences, Taizhou, Jiangsu 225300, China 3 Department of Medicine, Tibet Nationality College, Xianyang, Shaanxi 712082, China 4 Chinese Academy of Sciences and Max Planck Society Partner Institute for Computational Biology, Shanghai Institutes for Biological Sciences, Chinese Academy of Sciences, Shanghai 200031, China 5 Department of Genetics, Yale School of Medicine, New Haven, CT 06520 KEY WORDS mitochondrial DNA; complete sequence; the Tibetan Plateau; last glacial maximum ABSTRACT As the highest plateau surrounded by tow- ering mountain ranges, the Tibetan Plateau was once con- sidered to be one of the last populated areas of modern humans. However, this view has been tremendously changed by archeological, linguistic, and genetic findings in the past 60 years. Nevertheless, the timing and routes of entry of modern humans into the Tibetan Plateau is still unclear. To make these problems clear, we carried out high- resolution mitochondrial-DNA (mtDNA) analyses on 562 Tibeto-Burman inhabitants from nine different regions across the plateau. By examining the mtDNA haplogroup distributions and their principal components, we demon- strated that maternal diversity on the plateau reflects mostly a northern East Asian ancestry. Furthermore, phy- logeographic analysis of plateau-specific sublineages based on 31 complete mtDNA sequences revealed two primary components: pre-last glacial maximum (LGM) inhabitants and post-LGM immigrants. Also, the analysis of one major pre-LGM sublineage A10 showed a strong signal of post- LGM population expansion (about 15,000 years ago) and greater diversity in the southern part of the Tibetan Pla- teau, indicating the southern plateau as a refuge place when climate dramatically changed during LGM. Am J Phys Anthropol 143:555–569, 2010. V V C 2010 Wiley-Liss, Inc. The Tibetan Plateau, the ‘‘Roof of the World,’’ is the highest plateau on the earth with an average elevation of more than 4,000 m, covers more than 2,500,000 km 2 of plateaus and mountains in central Asia and is sur- rounded by towering mountain ranges (Himalayas on the south, Karakoram on the west, Kunlun on the north- Additional Supporting Information may be found in the online version of this article. The Genographic Consortium includes: Janet S. Ziegle (Applied Biosystems, Foster City, California, United States); Pandikumar Swamikrishnan (IBM, Somers, New York, United States); Asif Javed, Laxmi Parida, Daniel E. Platt, and Ajay K. Royyuru (IBM, Yorktown Heights, New York, United States); Lluis Quintana-Murci (Institut Pasteur, Paris, France); R. John Mitchell (La Trobe Univer- sity, Melbourne, Victoria, Australia); Danielle A. Badro, Marc Haber, and Pierre A. Zalloua (Lebanese American University, Chouran, Beirut, Lebanon); Syama Adhikarla, Arun Kumar Ganesh Prasad, Ramasamy Pitchappan, Kavitha Valampuri John, and Arun Vara- tharajan Santhakumari (Madurai Kamaraj University, Madurai, Tamil Nadu, India); Christoff J. Erasmus, Angela Hobbs, and Himla Soodyall (National Health Laboratory Service, Johannesburg, South Africa); Elena Balanovska and Oleg Balanovsky (Research Centre for Medical Genetics, Russian Academy of Medical Sciences, Mos- cow, Russia); Chris Tyler-Smith (The Wellcome Trust Sanger Insti- tute, Hinxton, United Kingdom); Daniela R. Lacerda and Fabrı ´cio R. Santos (Universidade Federal de Minas Gerais, Belo Horizonte, Minas Gerais, Brazil); Pedro Paulo Vieira (Universidade Federal do Rio de Janeiro, Rio de Janeiro, Brazil); Jaume Bertranpetit, David Comas, Begon ˜ a Martı ´nez-Cruz, and Marta Mele ´ (Universitat Pom- peu Fabra, Barcelona, Spain); Christina J. Adler, Alan Cooper, Clio S. I. Der Sarkissian, and Wolfgang Haak (University of Adelaide, South Australia, Australia); Matthew E. Kaplan and Nirav C. Mer- chant (University of Arizona, Tucson, Arizona, United States); Colin Renfrew (University of Cambridge, Cambridge, United Kingdom); Andrew C. Clarke and Elizabeth A. Matisoo-Smith (University of Otago, Dunedin, New Zealand); Matthew C. Dulik, Jill B. Gaieski, Amanda C. Owings, and Theodore G. Schurr (University of Pennsyl- vania, Philadelphia, Pennsylvania, United States); David F. Soria Hernanz and R. Spencer Wells (National Geographic Society, Wash- ington, District of Columbia, United States). Grant sponsor: National Geographic Society; Grant sponsor: IBM; Grant sponsor: The Waitt Family Foundation; Grant sponsor: National Outstanding Youth Science Foundation of China; Grant number: 30625016; Grant sponsor: National Science Foundation of China; Grant numbers: 30760097, 30771180, 30890034; Grant sponsor: 863 Program; Grant number: 2007AA02Z312; Grant spon- sor: Natural Science Foundation of Shanghai; Grant number: 10ZR1402200; Grant sponsor: Shanghai Leading Academic Disci- pline Project; Grant number: B111; Grant sponsor: China Postdoc- toral Science Foundation; Grant number: 200902208. *Correspondence to: Li Jin or Hui Li, School of Life Sciences, Fudan University, Shanghai 200433, China. E-mail: [email protected] or [email protected] Received 21 February 2010; accepted 3 May 2010 DOI 10.1002/ajpa.21350 Published online 7 July 2010 in Wiley Online Library (wileyonlinelibrary.com). V V C 2010 WILEY-LISS, INC. AMERICAN JOURNAL OF PHYSICAL ANTHROPOLOGY 143:555–569 (2010)
-
Upload
independent -
Category
Documents
-
view
0 -
download
0
Transcript of A mitochondrial revelation of early human migrations to the Tibetan Plateau before and after the...
A Mitochondrial Revelation of Early Human Migrationsto the Tibetan Plateau Before and After theLast Glacial Maximum
Zhendong Qin,1 Yajun Yang,1,2 Longli Kang,1,3 Shi Yan,4 Kelly Cho,5 Xiaoyun Cai,1 Yan Lu,1
Hongxiang Zheng,1 Dongchen Zhu,1 Dongmei Fei,1 Shilin Li,1 Li Jin,1,2,4*Hui Li1*, and The Genographic Consortium
1State Key Laboratory of Genetic Engineering and Ministry of Education Key Laboratory of ContemporaryAnthropology, School of Life Sciences and Institutes of Biomedical Sciences, Fudan University, Shanghai 200433, China2China Medical City Institute of Health Sciences, Taizhou, Jiangsu 225300, China3Department of Medicine, Tibet Nationality College, Xianyang, Shaanxi 712082, China4Chinese Academy of Sciences and Max Planck Society Partner Institute for Computational Biology,Shanghai Institutes for Biological Sciences, Chinese Academy of Sciences, Shanghai 200031, China5Department of Genetics, Yale School of Medicine, New Haven, CT 06520
KEY WORDS mitochondrial DNA; complete sequence; the Tibetan Plateau; last glacial maximum
ABSTRACT As the highest plateau surrounded by tow-ering mountain ranges, the Tibetan Plateau was once con-sidered to be one of the last populated areas of modernhumans. However, this view has been tremendouslychanged by archeological, linguistic, and genetic findings inthe past 60 years. Nevertheless, the timing and routes ofentry of modern humans into the Tibetan Plateau is stillunclear. To make these problems clear, we carried out high-resolution mitochondrial-DNA (mtDNA) analyses on 562Tibeto-Burman inhabitants from nine different regionsacross the plateau. By examining the mtDNA haplogroupdistributions and their principal components, we demon-
strated that maternal diversity on the plateau reflectsmostly a northern East Asian ancestry. Furthermore, phy-logeographic analysis of plateau-specific sublineages basedon 31 complete mtDNA sequences revealed two primarycomponents: pre-last glacial maximum (LGM) inhabitantsand post-LGM immigrants. Also, the analysis of one majorpre-LGM sublineage A10 showed a strong signal of post-LGM population expansion (about 15,000 years ago) andgreater diversity in the southern part of the Tibetan Pla-teau, indicating the southern plateau as a refuge placewhen climate dramatically changed during LGM. Am JPhys Anthropol 143:555–569, 2010. VVC 2010Wiley-Liss, Inc.
The Tibetan Plateau, the ‘‘Roof of the World,’’ is thehighest plateau on the earth with an average elevationof more than 4,000 m, covers more than 2,500,000 km2
of plateaus and mountains in central Asia and is sur-rounded by towering mountain ranges (Himalayas onthe south, Karakoram on the west, Kunlun on the north-
Additional Supporting Information may be found in the onlineversion of this article.
The Genographic Consortium includes: Janet S. Ziegle (AppliedBiosystems, Foster City, California, United States); PandikumarSwamikrishnan (IBM, Somers, New York, United States); AsifJaved, Laxmi Parida, Daniel E. Platt, and Ajay K. Royyuru (IBM,Yorktown Heights, New York, United States); Lluis Quintana-Murci(Institut Pasteur, Paris, France); R. John Mitchell (La Trobe Univer-sity, Melbourne, Victoria, Australia); Danielle A. Badro, Marc Haber,and Pierre A. Zalloua (Lebanese American University, Chouran,Beirut, Lebanon); Syama Adhikarla, Arun Kumar Ganesh Prasad,Ramasamy Pitchappan, Kavitha Valampuri John, and Arun Vara-tharajan Santhakumari (Madurai Kamaraj University, Madurai,Tamil Nadu, India); Christoff J. Erasmus, Angela Hobbs, and HimlaSoodyall (National Health Laboratory Service, Johannesburg, SouthAfrica); Elena Balanovska and Oleg Balanovsky (Research Centrefor Medical Genetics, Russian Academy of Medical Sciences, Mos-cow, Russia); Chris Tyler-Smith (The Wellcome Trust Sanger Insti-tute, Hinxton, United Kingdom); Daniela R. Lacerda and FabrıcioR. Santos (Universidade Federal de Minas Gerais, Belo Horizonte,Minas Gerais, Brazil); Pedro Paulo Vieira (Universidade Federal doRio de Janeiro, Rio de Janeiro, Brazil); Jaume Bertranpetit, DavidComas, Begona Martınez-Cruz, and Marta Mele (Universitat Pom-peu Fabra, Barcelona, Spain); Christina J. Adler, Alan Cooper, ClioS. I. Der Sarkissian, and Wolfgang Haak (University of Adelaide,South Australia, Australia); Matthew E. Kaplan and Nirav C. Mer-chant (University of Arizona, Tucson, Arizona, United States); Colin
Renfrew (University of Cambridge, Cambridge, United Kingdom);Andrew C. Clarke and Elizabeth A. Matisoo-Smith (University ofOtago, Dunedin, New Zealand); Matthew C. Dulik, Jill B. Gaieski,Amanda C. Owings, and Theodore G. Schurr (University of Pennsyl-vania, Philadelphia, Pennsylvania, United States); David F. SoriaHernanz and R. Spencer Wells (National Geographic Society, Wash-ington, District of Columbia, United States).
Grant sponsor: National Geographic Society; Grant sponsor: IBM;Grant sponsor: The Waitt Family Foundation; Grant sponsor:National Outstanding Youth Science Foundation of China; Grantnumber: 30625016; Grant sponsor: National Science Foundationof China; Grant numbers: 30760097, 30771180, 30890034; Grantsponsor: 863 Program; Grant number: 2007AA02Z312; Grant spon-sor: Natural Science Foundation of Shanghai; Grant number:10ZR1402200; Grant sponsor: Shanghai Leading Academic Disci-pline Project; Grant number: B111; Grant sponsor: China Postdoc-toral Science Foundation; Grant number: 200902208.
*Correspondence to: Li Jin or Hui Li, School of Life Sciences,Fudan University, Shanghai 200433, China.E-mail: [email protected] or [email protected]
Received 21 February 2010; accepted 3 May 2010
DOI 10.1002/ajpa.21350Published online 7 July 2010 in Wiley Online Library
(wileyonlinelibrary.com).
VVC 2010 WILEY-LISS, INC.
AMERICAN JOURNAL OF PHYSICAL ANTHROPOLOGY 143:555–569 (2010)

west, and Qilian on the northeast). Despite its inhospita-ble environment, the Tibetan Plateau is now occupied byover seven million people (2000 census), mostly indige-nous Tibetans. When and how modern human conqueredthe Tibetan Plateau is one of the most interesting ques-tions of human evolution, however, little was knownabout the peopling of Tibet.Some efforts have been made to estimate the age of
the peopling of Tibet in the fields of archeology and lin-guistics. Archeological records of Late Paleolithic agedated the human presence on the plateau back to about20–30 thousand years ago (KYA) (Aldenderfer andYinong, 2004). However, the sparseness and discontinu-ity of archeological findings on this plateau have led toambiguous explanations of the demographic history ofindigenous Tibetans. In contrast to the old history of theTibetans suggested by archeology, linguistic studies (VanDriem, 1998, 2001, 2002, 2005) postulated complex mod-els and favored a much more recent Neolithic peopling ofthe plateau. To clarify the inconsistency of the timing bydifferent disciplines, more solid evidences are required,such as genetic diversity in Tibet.During the past two decades, genetic markers (espe-
cially mitochondrial and Y chromosomal markers) wereproved extremely useful in tracing population history inEast Asia (Ding et al., 2000; Jin and Su, 2000; Zhang etal., 2007). However, previous genetic studies on the Tibe-tans also issued inconsistent results. Some studies usingclassical genetic traits (Du et al., 1997), autosomalmicrosatellite markers (Gayden et al., 2009; Kang et al.,2010) and mitochondrial DNA (mtDNA) (Torroni et al.,1994) suggested a north Asian origin of Tibetans. Whileevidences from the Y chromosomal Alu insertion (YAP)marker revealed much more intricate stories for the ori-gin of Tibetan peoples (Hammer et al., 1997; Qian et al.,2000; Su et al., 2000; Shi et al., 2008). The YAP polymor-phism was enriched on the Tibetan Plateau, Japan, andAndaman islands, but almost absent in other regions.This contradiction has been attributed to different demo-graphic histories between patrilineal and matrilinealgenetic pools, but it is still highly debated concerningthe resolution of the limited markers used and theincomplete sampling in each study. More detailed worksabout Tibetan populations both on mitochondrial DNAand Y chromosome DNA are definitely required.Maternally inherited mtDNA plays an important role
in studying modern human migrations (Wallace et al.,1999; Pakendorf and Stoneking, 2005) and probableselection effects (Ruiz-Pesini et al., 2004; Ingman andGyllensten, 2007). Over the past few years, genetic stud-ies about mtDNA of populations residing on and aroundthe Tibetan Plateau have been conducted (Qian et al.,2001; Torroni et al., 1994; Wen et al., 2004b; Yao andZhang, 2002), which led to a number of importantinsights into the genetic history of Tibetans and theiradaptive process. However, most of these studies focusedon the short sequence of mitochondrial control region,lacking power to distinguish detailed population histor-ies. The recent development of mtDNA analysis based oncomplete sequencing made it possible to reconstructmaternal phylogeny of Tibetan populations thus mayshed light on their genetic structure and population his-tory. Gu et al. (2008, 2009) first used this analysis incomparing mtDNA genomes of Tibetans and Han Chi-nese and proposed possible selective effects in Tibetanpopulations. However, they did not have enough Tibetanpopulation samples and therefore did not draw any con-
clusions on the origin of the Tibetans. Actually, thoseprevious studies all suffered from insufficient populationsample coverage of the plateau (a maximum of threepopulation samples), lacking power of detecting sub-structure among Tibetan populations.A recent article about mtDNA genome variation
within six regional Tibetan populations has revealed suc-cessful Late Paleolithic settlement on the Tibetan Pla-teau (Zhao et al., 2009). In this study, we furthersampled eleven Tibeto-Burman populations from ninedifferent geographic regions of the Tibetan Plateau. Onthe basis of our increased population coverage and com-prehensive mtDNA information with complete mtDNAsequences, we traced the origin and the expansion of Ti-betan populations on the plateau. Our findings indicatethat Tibetan maternal gene pool consists of both pre-and post-LGM components. In addition, we found a sig-nal of post-LGM population expansion on the plateau.
MATERIALS AND METHODS
Population samples and DNA extraction
Samples were collected by buccal swab from 562 anon-ymous and unrelated volunteers living on in the TibetanPlateau with appropriate informed consent under proto-cols approved by the relevant institutional reviewboards. These population samples included nine Tibetanpopulations (46 individuals from Ngari, 58 from Nagqu,59 from Shigatse, 59 from Lhasa, 61 from Chamdo, 56from Shannan, 53 from Nyingchi, 44 from Yushu ofQinghai, 55 from Garze of western Sichuan), one Monbapopulation (51 from Nyingchi), and one Lhoba popula-tion (20 from Shannan). The sampling locations wereillustrated in Figure 1A. Genomic DNA was extractedusing Silica/GuSCN method (Supprting Information S1).
Sequencing the control region and typingSNPs in the coding regions
The hypervariable segment I (HVS-I) of the controlregion was amplified by primers L15974 and H16488(Yao et al., 2002). Purified PCR products were sequencedusing the BigDye terminator cycle sequencing kit and anABI 3130XL genetic analyzer (Applied Biosystems).Samples with a poly-cytosine (poly-C) tract caused bythe transition at nucleic position (np) 16189 weresequenced in both directions. Overall, 562 HVS-I sequen-ces have been submitted to GenBank. A SNaPshot assaywas used for typing SNPs in the coding regions toresolve haplogroup determination. This assay wasdesigned as a multiplex panel including 21 coding regionSNPs and one length variation marker (for informationof markers and primers see Supprting Information TableS2). All haplogroup F (10310G) samples were screenedat np 12406 using enzyme HpaI digesting. Some newlydefined haplogroup diagnostic SNPs were checked bydirectly sequencing of appropriate fragments. ThemtDNA haplogroup nomenclature used here was follow-ing with PhyloTree.org mtDNA tree Build 6 (28 Septem-ber, 2009) (van Oven and Kayser, 2009) and previousstudies (Tanaka et al., 2004; Kong et al., 2003, 2006;Derenko et al., 2007; Soares et al., 2008).
Sequencing whole mtDNA genome
Whole mtDNA genome sequencing was performed fora selection of 31 samples following methods described by
556 Z. QIN ET AL.
American Journal of Physical Anthropology
Torroni et al. (2001). Sequencing trace files were editedand aligned with the DNASTAR software (DNASTAR,Inc.). Mutations were scored relative to the revised Cam-bridge Reference Sequence (rCRS) (Andrews et al.,1999).
Data analysis
For HVS-I sequence data; median joining networks(Bandelt et al., 1995) were constructed using the freesoftware package Network 4.1 (Fluxus-engineering.com).Descriptive statistical indexes, the Tajima’s D (Tajima,1989) and Fu’s Fs (Fu, 1997) neutrality tests, pairwisedistances between populations (FST), mismatch distribu-tion, and analysis of molecular variance (AMOVA)(Excoffier et al., 1992) were calculated using Arlequinsoftware (version 3.11) (Excoffier et al., 2005). The muta-tion model used here was Kimura two-parameter modelwith a Gamma shape parameter (alpha) of 0.26.For complete sequences, we first constructed ML phy-
logenetic trees with PhyML3.0 (Ronquist and Huelsen-beck, 2003) under HKY1G mutation model with analpha parameter of 0.12 (Macaulay et al., 2005) for 100boostrap runs. A consensus tree was obtained throughthese 100 bootstap trees by CONSENSUS implementedin PHYLIP package (version 3.69) (Felsenstein, 1989).Then the assumption of a molecular clock was testedwith the PAML package (Yang, 1997) under the sameevolutionary model. The null hypothesis of a molecularclock cannot be rejected (P 5 0.797). The completemtDNA phylogeny was constructed and verified withseveral runs using Network (version 4.5) (Fluxus-engi-neering.com). The highly variable site 16519 and thelength variation in the poly-C stretches between np16180–16193 and 309–315 were discarded for phylogenyconstruction. The coalescence times were estimated withthe q statistics (Forster et al., 1996), and standard errorswere calculated following Saillard et al. (2000). For esti-mating the time to the most recent common ancestor(TMRCA) of each cluster, we used Mishmar rate (Sail-lard et al., 2000) and modified Mishmar rate (Perego etal., 2009) for coding region sequences (from np 577 to16023); modified Kivisild rate (Perego et al., 2009) andSoares synonymous rate for synonymous mutations; andSoares rate (Soares et al., 2009) for complete mitochon-drial genomes (all the substitutions excluding the 16519mutations and the 16182C, 16183C, and 16194C). One
hundred and forty-nine additional complete sequencesfrom the literature were employed for tree reconstruc-tion and age estimation (Ingman et al., 2000; Mishmaret al., 2003; Tanaka et al., 2004; Macaulay et al., 2005;Starikovskaya et al., 2005; Kong et al., 2003, 2006; Der-enko et al., 2007; Ingman and Gyllensten, 2007; Tammet al., 2007; Bilal et al., 2008; Hartmann et al., 2008;Soares et al., 2008; Chandrasekar et al., 2009; Zhaoet al., 2009).
Principal-component analysis andmultidimensional scaling plot
Principal-component (PC) analysis was performedusing mtDNA haplogroup frequencies as input vectorsby SPSS15.0 software (SPSS). Nonparametric multidi-mensional scaling (MDS) analysis based on FST statisticscalculated from HVS-I sequences was also performedusing SPSS15.0 software (SPSS) to visualize relation-ships among Tibetan populations and other Asian popu-lations around. Population data of mtDNA diversity inEast (Qian et al., 2001; Yao et al., 2002; Yao and Zhang,2002; Wen et al., 2004a,b, 2005; Li et al., 2007), North(Horai et al., 1996; Kong et al., 2003; Derenko et al.,2007; Volodko et al., 2008), Central (Yao et al., 2000,2004; Comas et al., 2004; Quintana-Murci et al., 2004;Heyer et al., 2009), South (Cordaux et al., 2003; Fornar-ino et al., 2009), and Southeast (Fucharoen et al., 2001;Hill et al., 2006, 2007) Asia were retrieved from the liter-ature and included in our comparative analysis.
RESULTS
MtDNA haplogroup profiles
Detailed sequence variations and haplogroup assign-ments of 562 mtDNAs from 11 populations in this studyare presented in Supporting Information Table S3. Atotal of 48 haplogroups or paragroups (unclassified line-ages within a clade marked with an asterisk [*]) wereobserved in our samples, all within the three principalnon-African macrohaplogroups: M, N, and R (under N).Table 1 presents the haplogroup frequencies of the stud-ied populations. The majority of the mtDNA lineagesbelong to eastern Eurasian groups. Only 2.4% mtDNAscan be traced for their origins to western or southernEurasia, including one haplogroup J1b1 sample, one U2,
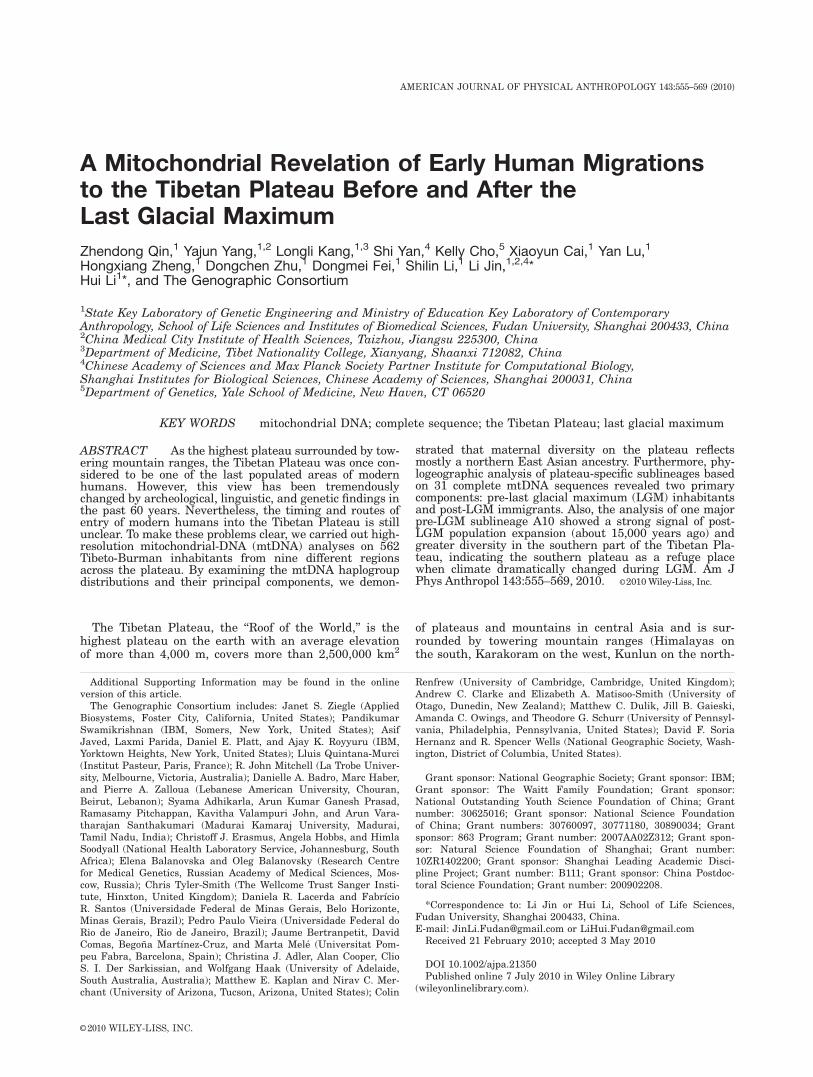
Fig. 1. A good correlation between the geographic locations and mtDNA HVS-I region diversities of the Tibetan samples. (A) Ge-ographic locations of the 11 indigenous populations in the Tibetan plateau. (B) Two-dimensional MDS plot based on an Fst distancematrix calculated from 440-bp-length sequences of mtDNA HVS-I region.
557MITOCHONDRIAL DIVERSITY IN TIBET
American Journal of Physical Anthropology
one U5, six U7, and four T1 samples. This pattern isconsistent with the notion that Himalayas served as abarrier to gene flow (Gayden et al., 2007, 2009). Amongthe eastern Eurasian component, 67.6% belongs to mac-rohaplogroup M and its derived haplogroups (such as C,D4, D5, G, M*, M7, M8, M9, M10, M11, M13, and Z),and 30.1% belongs to macrohaplogroup N and its nestedhaplogroups (A, B, F, N9a, R9b, N*, and R*). Withinmacrohaplogroup M, haplogroup D and M9 are the mostcommon lineages, accounting for 20.3% and 13.6% of allsamples, respectively. The most prevalent haplogroupswithin macrohaplogroup N, haplogroup A and F repre-sented 8.6% and 11.5% of the studied lineages. Althoughthe Tibetan Plateau is located in southwestern part ofChina, the majority of maternal gene pool on the plateaushowed a strong similarity with north Asian populations,
which was evident by the high proportion of northAsian-prevalent haplogroups (Tanaka et al., 2004; Der-enko et al., 2003, 2007), such as haplogroups A, C, D4,D5, F1b, M9, and G. It is also worth noting that hap-logroup B, which is one of the most common lineages insouthern and eastern Asian populations, exhibited lowfrequency at the southern part of the plateau, account-ing for only 5.4% in Shannan Tibetans, 4.0% in Monba,and it was not found in Nyingchi, Shigatse, and LhasaTibetans, nor in Lhoba.
Population summary statistics
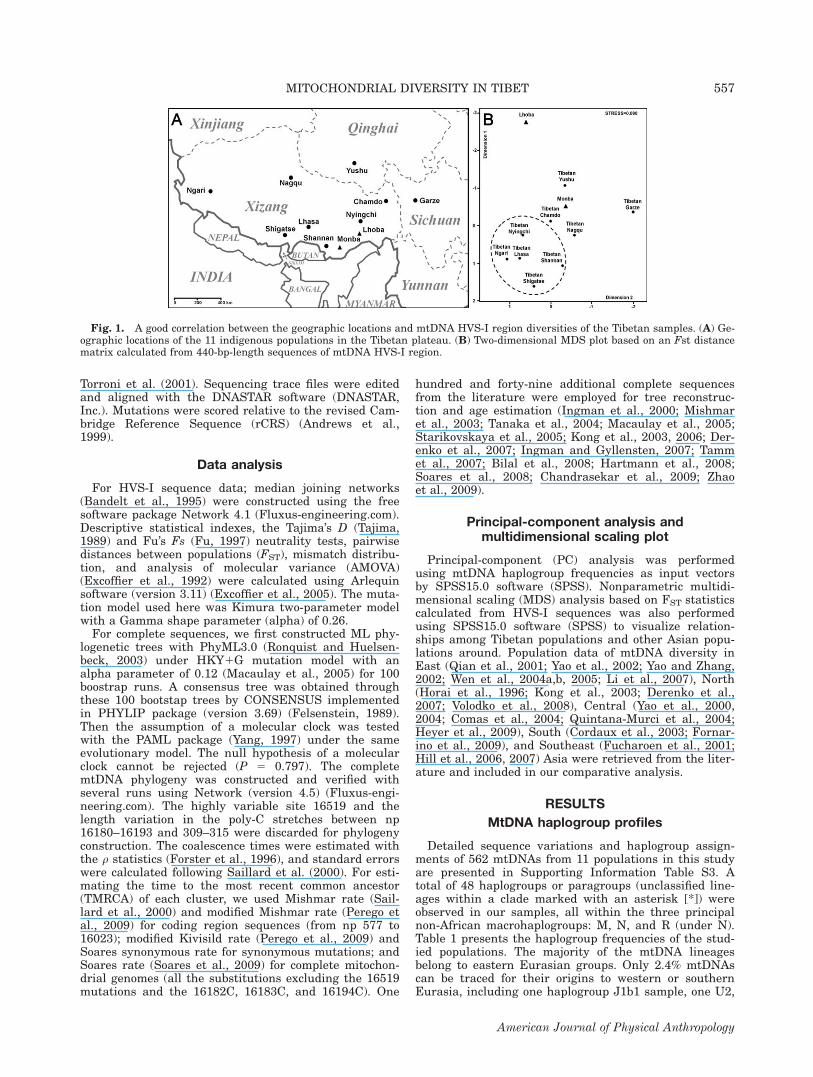
Internal population diversity indices and results ofTajima’s D and Fu’s Fs neutrality tests are presented inTable 2. All the studied populations exhibited high and
TABLE 1. Haplogroup frequencies of mtDNA of the 11 indigenous populations on the Tibetan plateau
Haplogroup
Tibetan
Yushu(44)
Nagqu(58)
Chamdo(61)
Ngari(46)
Nyingchi(53)
Shannan(56)
Shigatse(59)
Lhasa(59)
Garze(55)
Monba(51)
Lhoba(20)
A4 13.6 6.9 1.6 8.7 9.4 5.4 5.1 3.4 10.9 23.5 5.0A7 . . . . . . . . . . . . . . . . . . . . . . . . . . . . . . 10.0A10 4.5 1.7 1.6 10.9 3.8 16.1 13.6 5.1 1.8 . . . . . .B* . . . . . . 1.6 . . . . . . . . . . . . . . . . . . . . . . . .B4* 4.5 . . . 3.3 . . . . . . 3.6 . . . . . . 3.6 2.0 . . .B4a 4.5 1.7 . . . 2.2 . . . . . . . . . . . . . . . 2.0 . . .B5b . . . . . . 1.6 . . . . . . 1.8 . . . . . . 3.6 . . . . . .C* . . . . . . . . . . . . . . . . . . . . . . . . . . . 3.9 . . .C4 4.5 . . . 1.6 2.2 3.8 7.1 6.8 . . . . . . . . . . . .C4d 2.3 3.4 1.6 2.2 1.9 1.8 . . . . . . 5.5 . . . 5.0C5 . . . . . . 1.6 . . . . . . . . . . . . . . . . . . . . . . . .D2b . . . . . . 1.6 . . . 1.9 . . . . . . . . . . . . . . . . . .D4 15.9 6.90 6.56 4.35 15.09 14.29 6.78 10.17 12.73 1.96 15D4j1 . . . 3.45 1.64 4.35 3.77 3.57 1.69 . . . 3.64 1.96 . . .D5 . . . 3.4 3.3 . . . . . . 3.6 . . . 1.7 . . . 2.0 . . .D5a2 4.5 3.4 1.6 4.3 3.8 . . . . . . 1.7 . . . 3.9 15.0F* 2.3 . . . . . . . . . . . . . . . . . . . . . . . . . . . . . .F1 . . . 1.7 1.6 2.2 1.9 . . . . . . 1.7 . . . 3.9 . . .F1a 2.3 . . . . . . . . . . . . . . . . . . . . . . . . . . . . . .F1b . . . 8.6 8.2 2.2 7.5 3.6 13.6 15.3 7.3 13.7 5.0F2a . . . . . . 4.9 . . . . . . . . . 1.7 . . . 1.8 . . . . . .G* 2.3 6.9 3.3 . . . 3.8 . . . 1.7 1.7 1.8 . . . 5.0G1a1 . . . . . . . . . . . . . . . . . . 1.7 1.7 . . . . . . . . .G2 2.3 1.7 3.3 4.3 . . . 1.8 1.7 6.8 5.5 5.9 . . .G3 2.3 6.9 4.9 2.2 1.9 . . . . . . 3.4 9.1 5.9 10.0J1b1 . . . . . . . . . . . . . . . . . . 1.7 . . . . . . . . . . . .M* 6.8 . . . . . . . . . 1.9 . . . 1.7 1.7 1.8 5.9 10.0M7b2 2.3 . . . . . . . . . . . . . . . . . . . . . . . . . . . . . .M7c . . . . . . . . . . . . . . . . . . . . . . . . 1.8 . . . . . .M10 2.3 . . . 1.6 2.2 1.9 . . . . . . . . . . . . . . . . . .M11a . . . . . . 1.6 . . . 1.9 . . . . . . . . . . . . . . . . . .M13* . . . 1.7 . . . . . . . . . . . . . . . . . . 1.8 2.0 . . .M13a 12.3 1.7 1.6 . . . . . . . . . . . . . . . 7.3 . . . . . .M13b . . . 3.4 1.6 4.3 3.8 1.8 1.7 . . . 3.6 3.9 5.0M62 . . . 5.2 1.6 . . . 1.9 5.4 1.7 3.4 . . . . . . . . .M8a . . . . . . 1.6 . . . . . . . . . . . . 1.7 3.6 . . . . . .M9a 2.3 6.9 13.1 23.9 13.2 8.9 25.4 25.4 1.8 11.8 . . .M9d 6.8 6.9 13.1 10.9 13.2 16.1 6.8 8.5 1.8 3.9 10.0M9e . . . 8.6 . . . . . . . . . . . . . . . . . . . . . . . . . . .N* . . . 1.7 . . . . . . . . . 1.8 . . . . . . . . . . . . . . .N9a . . . . . . . . . . . . 1.9 . . . . . . . . . . . . . . . . . .R* 6.8 . . . . . . 2.2 1.9 . . . . . . . . . . . . . . . . . .R9b . . . 1.7 . . . . . . . . . . . . . . . . . . . . . . . . . . .T1 . . . . . . . . . 4.3 . . . . . . . . .. . . 3.6 . . . . . .U2 . . . . . . 1.6 . . . . . . . . . . . . . . . . . . . . . . . .U7 . . . 3.4 . . . . . . . . . . . . 3.4 1.7 . . . 2.0 . . .U5 2.3 . . . . . . . . . . . . . . . . . . . . . . . . . . . . . .Z . . . 1.7 3.3 . . . . . . 3.6 1.7 5.1 1.8 . . . . . .
558 Z. QIN ET AL.
American Journal of Physical Anthropology
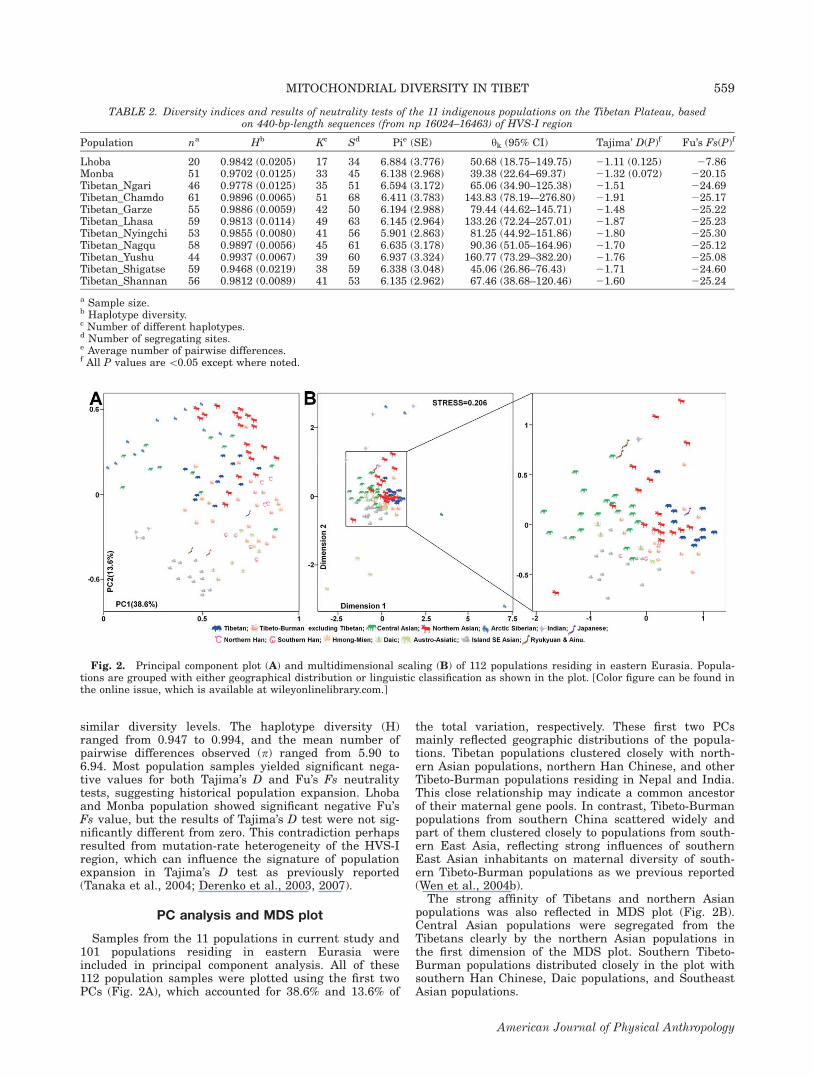
similar diversity levels. The haplotype diversity (H)ranged from 0.947 to 0.994, and the mean number ofpairwise differences observed (p) ranged from 5.90 to6.94. Most population samples yielded significant nega-tive values for both Tajima’s D and Fu’s Fs neutralitytests, suggesting historical population expansion. Lhobaand Monba population showed significant negative Fu’sFs value, but the results of Tajima’s D test were not sig-nificantly different from zero. This contradiction perhapsresulted from mutation-rate heterogeneity of the HVS-Iregion, which can influence the signature of populationexpansion in Tajima’s D test as previously reported(Tanaka et al., 2004; Derenko et al., 2003, 2007).
PC analysis and MDS plot
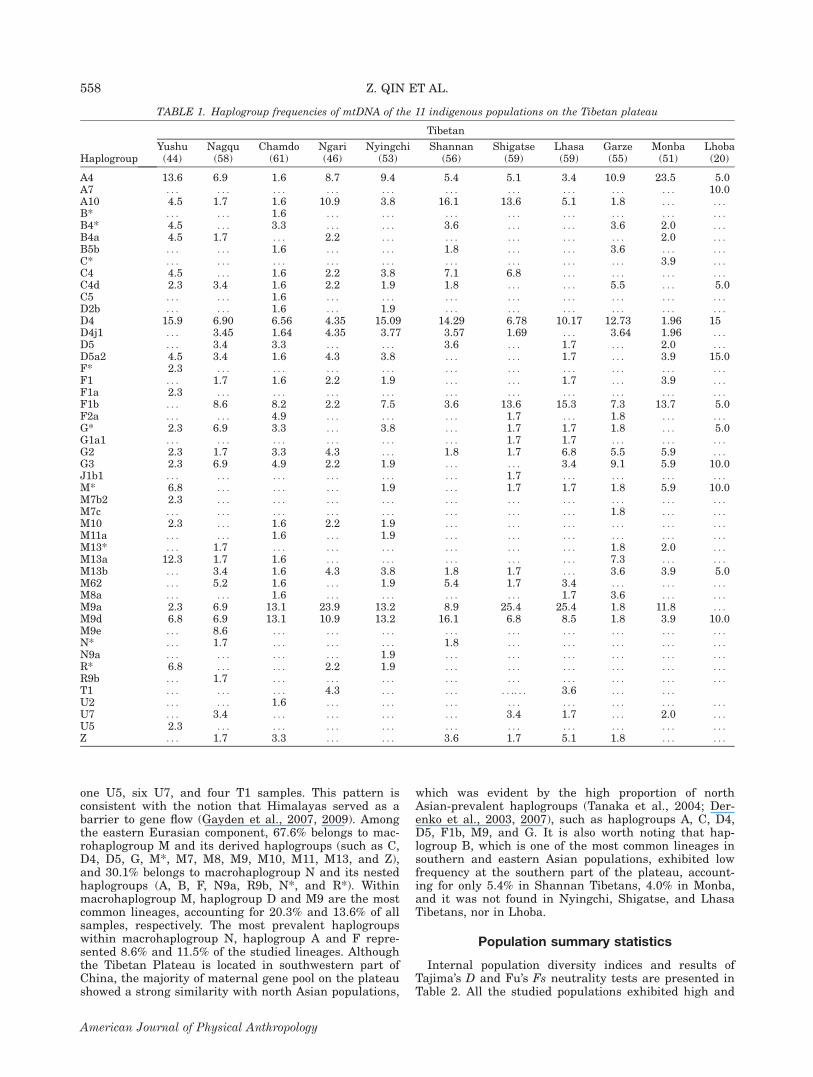
Samples from the 11 populations in current study and101 populations residing in eastern Eurasia wereincluded in principal component analysis. All of these112 population samples were plotted using the first twoPCs (Fig. 2A), which accounted for 38.6% and 13.6% of
the total variation, respectively. These first two PCsmainly reflected geographic distributions of the popula-tions. Tibetan populations clustered closely with north-ern Asian populations, northern Han Chinese, and otherTibeto-Burman populations residing in Nepal and India.This close relationship may indicate a common ancestorof their maternal gene pools. In contrast, Tibeto-Burmanpopulations from southern China scattered widely andpart of them clustered closely to populations from south-ern East Asia, reflecting strong influences of southernEast Asian inhabitants on maternal diversity of south-ern Tibeto-Burman populations as we previous reported(Wen et al., 2004b).The strong affinity of Tibetans and northern Asian
populations was also reflected in MDS plot (Fig. 2B).Central Asian populations were segregated from theTibetans clearly by the northern Asian populations inthe first dimension of the MDS plot. Southern Tibeto-Burman populations distributed closely in the plot withsouthern Han Chinese, Daic populations, and SoutheastAsian populations.
Fig. 2. Principal component plot (A) and multidimensional scaling (B) of 112 populations residing in eastern Eurasia. Popula-tions are grouped with either geographical distribution or linguistic classification as shown in the plot. [Color figure can be found inthe online issue, which is available at wileyonlinelibrary.com.]
TABLE 2. Diversity indices and results of neutrality tests of the 11 indigenous populations on the Tibetan Plateau, basedon 440-bp-length sequences (from np 16024–16463) of HVS-I region
Population na Hb Kc Sd Pie (SE) yk (95% CI) Tajima’ D(P)f Fu’s Fs(P)f
Lhoba 20 0.9842 (0.0205) 17 34 6.884 (3.776) 50.68 (18.75–149.75) 21.11 (0.125) 27.86Monba 51 0.9702 (0.0125) 33 45 6.138 (2.968) 39.38 (22.64–69.37) 21.32 (0.072) 220.15Tibetan_Ngari 46 0.9778 (0.0125) 35 51 6.594 (3.172) 65.06 (34.90–125.38) 21.51 224.69Tibetan_Chamdo 61 0.9896 (0.0065) 51 68 6.411 (3.783) 143.83 (78.19-–276.80) 21.91 225.17Tibetan_Garze 55 0.9886 (0.0059) 42 50 6.194 (2.988) 79.44 (44.62–145.71) 21.48 225.22Tibetan_Lhasa 59 0.9813 (0.0114) 49 63 6.145 (2.964) 133.26 (72.24–257.01) 21.87 225.23Tibetan_Nyingchi 53 0.9855 (0.0080) 41 56 5.901 (2.863) 81.25 (44.92–151.86) 21.80 225.30Tibetan_Nagqu 58 0.9897 (0.0056) 45 61 6.635 (3.178) 90.36 (51.05–164.96) 21.70 225.12Tibetan_Yushu 44 0.9937 (0.0067) 39 60 6.937 (3.324) 160.77 (73.29–382.20) 21.76 225.08Tibetan_Shigatse 59 0.9468 (0.0219) 38 59 6.338 (3.048) 45.06 (26.86–76.43) 21.71 224.60Tibetan_Shannan 56 0.9812 (0.0089) 41 53 6.135 (2.962) 67.46 (38.68–120.46) 21.60 225.24
a Sample size.b Haplotype diversity.c Number of different haplotypes.d Number of segregating sites.e Average number of pairwise differences.f All P values are\0.05 except where noted.
559MITOCHONDRIAL DIVERSITY IN TIBET
American Journal of Physical Anthropology

The MDS plot of the populations on the plateau (Fig.1B) showed a south-north pattern in terms of geographiclocation. Most of the Tibetan populations residing at thesouthern part of the plateau were grouped to the rightupper quadrant. AMOVA showed that the differencebetween the southern and northern groups is small(0.80%) but significant (P 5 0.004). Lhoba was separatedfrom other populations in the first dimension. Consider-ing that Adi, which shares common ancestry with Lhobaindicated by both ethnologic and linguistic information(Lewis, 2009), was composed of almost 100% of the Ychromosome haplogroup O3a3c-M134, while Tibetan andMonba populations retained a high proportion of hap-logroup D-YAP1 (Su et al., 2000; Cordaux et al., 2004),it may not be surprising to observe such a great distancebetween Lhoba and the other Tibetan populations.
Tibeto-Burman associated mtDNA lineages
One of the most significant results of this study isrevealing of the Tibeto-Burman associated mtDNA line-ages. These lineages include our redefined subha-plogroups A10, C4d, and M13b, as well as the recentlyidentified haplogroup M62 (Chandrasekar et al., 2009).
Subhaplogroup A10
Haplogroup A is one of the most common haplogroupsin northern and eastern Asia with a moderate frequencyfrom 5 to 10% (Derenko et al., 2007), nesting eight sub-
haplogroups (A2–A9) (van Oven and Kayser, 2009). Thishaplogroup was found at 14.4% on average in ourTibetan population samples, with the highest frequencyin Monba (20.8%) and the lowest in Tibetans fromChamdo (3.3%). Only two previously proposed subclades(A4 and A7) were detected, where A7 was only found intwo individuals of Lhoba with identical HVS-I motifs.On the other hand, a distinguishing HVS-I motif (16290-16293C-16319) was presented at a high frequency(39.5%) of all haplogroup A samples (ranging from 0% inMonba and Lhoba to 72.7% in Tibetans from Shigatse).Our database search for similar HVS-I led to 27 mtDNAsequences (Horai et al., 1996; Wen et al., 2004a,b; Yaoet al., 2002, 2004). Half of these samples belonged toTibeto-Burman populations, indicating their strong eth-nic association. We assigned this sub-haplogroup as A10.To further investigate haplogroup A on the plateau, com-plete genome sequencing was performed in sevenTibetan mtDNAs of haplogroup A. Five of these selectedsamples (two from Lhasa Tibetans, three from ShannanTibetans) represented our newly identified A10 subclade,and the other two belonged to A4 sublineage. All thesenew sequences and selected sequences taken from litera-ture (Ingman et al., 2000; Starikovskaya et al., 2005;Derenko et al., 2007) were used to reconstruct a hap-logroup A phylogeny, illustrated in Figure 3. The phylo-genetic analysis demonstrated that A10 subclade splitfrom the root of haplogroup A very early and formed adistinct lineage by one coding-region transition at np9650. Four of our A10 samples harbored three additional
Fig. 3. The phylogenetic tree of haplogroup A complete mtDNA sequences. The tree is rooted in macrohaplogroup N. Mutationsare scored relative to the rCRS (Andrews et al., 1999). Transitions are presented as mutation positions, and only transversions arespecified. Deletions are indicated by a ‘‘d,’’ and insertions are indicated by a ‘‘1’’ followed with the inserted nucleotides. All therecurrent mutations are underlined. TMRCAs are also shown beside nodes. For sequences taken from the literature, accession num-bers are indicated followed with their geographic locations. New sequences generated through this study are in bold.
560 Z. QIN ET AL.
American Journal of Physical Anthropology
mutations (at np 1005, 6755, 8843), named as A10a; onesequence from Shannan Tibetans and the only one pub-lished A10 full sequence from the Naxi population(neighboring the Tibetans) living in Yunnan China(Hartmann et al., 2008) had a control-region substitutionat site 16234, assigned as A10b. It is noteworthy thatsublineage A10b has been found outside the Tibetan Pla-teau (mostly in Tibeto-Burman speaking populationsresiding in Yunnan China), suggesting that these peoplemigrated southward from the plateau. This observationis concordant with our previous conclusion about thegenetic structure of Tibeto-Burman populations (Wen etal., 2004b). The Tibetan A4 sequences represented asnovel haplotypes within the subhaplogroup A4 shared nocoding-region mutation with any previously publishedA4 sequences (16362 is the only marker defining A4).Network analysis of HVS-I sequences of lineage A10
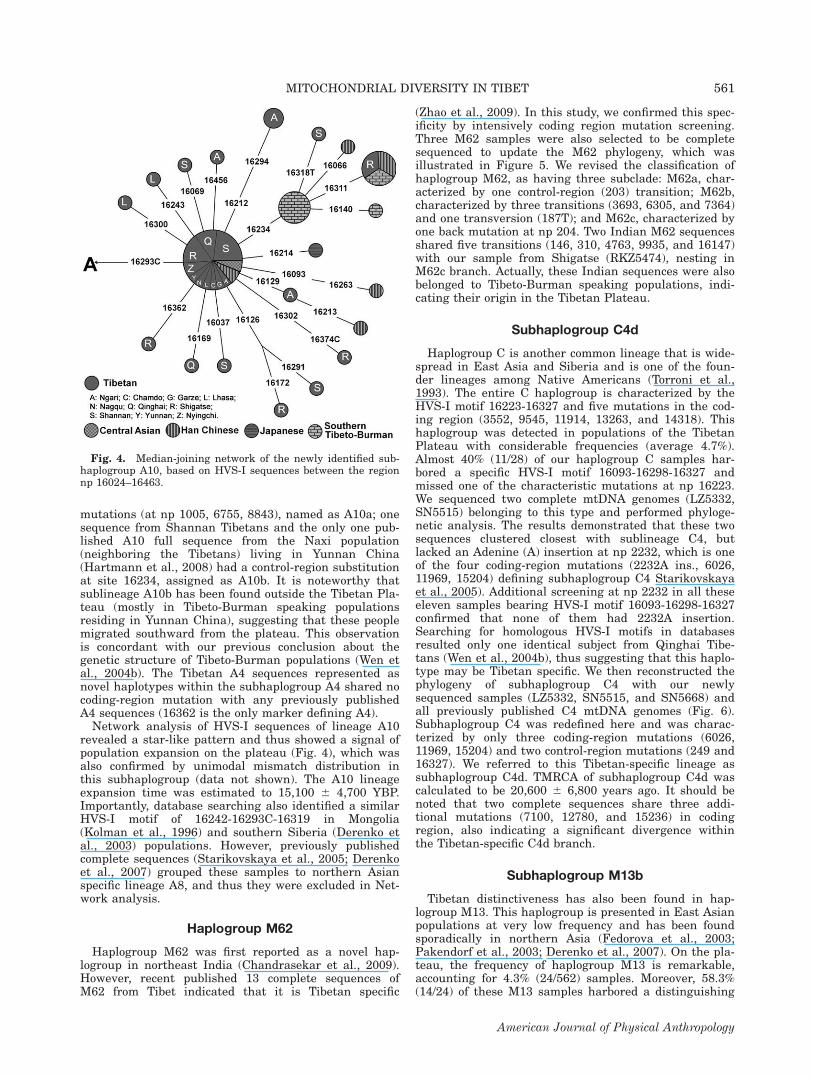
revealed a star-like pattern and thus showed a signal ofpopulation expansion on the plateau (Fig. 4), which wasalso confirmed by unimodal mismatch distribution inthis subhaplogroup (data not shown). The A10 lineageexpansion time was estimated to 15,100 6 4,700 YBP.Importantly, database searching also identified a similarHVS-I motif of 16242-16293C-16319 in Mongolia(Kolman et al., 1996) and southern Siberia (Derenko etal., 2003) populations. However, previously publishedcomplete sequences (Starikovskaya et al., 2005; Derenkoet al., 2007) grouped these samples to northern Asianspecific lineage A8, and thus they were excluded in Net-work analysis.
Haplogroup M62
Haplogroup M62 was first reported as a novel hap-logroup in northeast India (Chandrasekar et al., 2009).However, recent published 13 complete sequences ofM62 from Tibet indicated that it is Tibetan specific
(Zhao et al., 2009). In this study, we confirmed this spec-ificity by intensively coding region mutation screening.Three M62 samples were also selected to be completesequenced to update the M62 phylogeny, which wasillustrated in Figure 5. We revised the classification ofhaplogroup M62, as having three subclade: M62a, char-acterized by one control-region (203) transition; M62b,characterized by three transitions (3693, 6305, and 7364)and one transversion (187T); and M62c, characterized byone back mutation at np 204. Two Indian M62 sequencesshared five transitions (146, 310, 4763, 9935, and 16147)with our sample from Shigatse (RKZ5474), nesting inM62c branch. Actually, these Indian sequences were alsobelonged to Tibeto-Burman speaking populations, indi-cating their origin in the Tibetan Plateau.
Subhaplogroup C4d
Haplogroup C is another common lineage that is wide-spread in East Asia and Siberia and is one of the foun-der lineages among Native Americans (Torroni et al.,1993). The entire C haplogroup is characterized by theHVS-I motif 16223-16327 and five mutations in the cod-ing region (3552, 9545, 11914, 13263, and 14318). Thishaplogroup was detected in populations of the TibetanPlateau with considerable frequencies (average 4.7%).Almost 40% (11/28) of our haplogroup C samples har-bored a specific HVS-I motif 16093-16298-16327 andmissed one of the characteristic mutations at np 16223.We sequenced two complete mtDNA genomes (LZ5332,SN5515) belonging to this type and performed phyloge-netic analysis. The results demonstrated that these twosequences clustered closest with sublineage C4, butlacked an Adenine (A) insertion at np 2232, which is oneof the four coding-region mutations (2232A ins., 6026,11969, 15204) defining subhaplogroup C4 Starikovskayaet al., 2005). Additional screening at np 2232 in all theseeleven samples bearing HVS-I motif 16093-16298-16327confirmed that none of them had 2232A insertion.Searching for homologous HVS-I motifs in databasesresulted only one identical subject from Qinghai Tibe-tans (Wen et al., 2004b), thus suggesting that this haplo-type may be Tibetan specific. We then reconstructed thephylogeny of subhaplogroup C4 with our newlysequenced samples (LZ5332, SN5515, and SN5668) andall previously published C4 mtDNA genomes (Fig. 6).Subhaplogroup C4 was redefined here and was charac-terized by only three coding-region mutations (6026,11969, 15204) and two control-region mutations (249 and16327). We referred to this Tibetan-specific lineage assubhaplogroup C4d. TMRCA of subhaplogroup C4d wascalculated to be 20,600 6 6,800 years ago. It should benoted that two complete sequences share three addi-tional mutations (7100, 12780, and 15236) in codingregion, also indicating a significant divergence withinthe Tibetan-specific C4d branch.
Subhaplogroup M13b
Tibetan distinctiveness has also been found in hap-logroup M13. This haplogroup is presented in East Asianpopulations at very low frequency and has been foundsporadically in northern Asia (Fedorova et al., 2003;Pakendorf et al., 2003; Derenko et al., 2007). On the pla-teau, the frequency of haplogroup M13 is remarkable,accounting for 4.3% (24/562) samples. Moreover, 58.3%(14/24) of these M13 samples harbored a distinguishing
Fig. 4. Median-joining network of the newly identified sub-haplogroup A10, based on HVS-I sequences between the regionnp 16024–16463.
561MITOCHONDRIAL DIVERSITY IN TIBET
American Journal of Physical Anthropology

HVS-I motif: 16145-16168-16223-16257-16311. Extensiveliterature search revealed that this specific lineage wasonly observed in populations of Tibeto-Burman linguisticbranch residing closely to Tibetan Plateau, e.g., oneTibetan (Yao and Zhang, 2002), one Bai and two Pumi(Wen et al., 2004b) from Yunnan of China, one Lisu andone White Karen individual from northern Thailand (Ootaet al., 2001) (Supprting Information Table S4). Thus wedefined this special mtDNA as M13b. We sequenced fourcomplete Tibetan mtDNA genomes and compared themwith all published M13 complete sequences (Fig. 5). AMongolian sample (MG50) (Kong et al., 2006) nested withtwo Tibetan samples (CD5626, NQ5004) and formed a sub-clade, M13a1, characterized by control-region mutation atnp 16148. The Japanese mtDNAs clustered into anotherbranch, M13a2, characterized by two coding-region muta-tions (7673 and 11959). It was noteworthy that the twoTibetan M13b mtDNAs (SN5140, SN5571) differed fromthe rest of haplogroup M13 by six coding-region and fourcontrol-region transitions. The divergence time of M13aand M13b was calculated as 21,100 6 6,100 years. Withthe exclusive distribution of subhaplogroup M13b inTibeto-Burman populations, this deep divergence timemay indicate the late Pleistocene modern human settle-ment and long-time isolation.
Other MtDNA lineages presented onthe Tibetan plateau
Haplogroup M9
One major component of mtDNA pool on the plateau isrepresented by haplogroup M9, which distinguished theTibetans from other East Asian populations. As previ-ously reported (Kivisild et al., 2002; Yao et al., 2002;Soares et al., 2008), haplogroup M9 encompassed twosubclades: E and M9a. While subhaplogroup E isrestrictedly distributed in Island Southeast Asia (ISEA)and Taiwan (Trejaut et al., 2005; Hill et al., 2007; Soareset al., 2008), lineage M9a was widely presented in main-land East Asia and reached its greatest frequency anddiversity in Tibet (Torroni et al., 1994; Tanaka et al.,2004). In this study, the average frequency of haplogroupM9a on the Tibetan Plateau was 21.6% with the highestfrequencies in the ethnic Tibetans from Ngari (34.8%),Shigatse (32.2%), and Lhasa (32.8%). Sublineage M9ahas been detected in central (Yao et al., 2004), northern(Derenko et al., 2007), and eastern (Tanaka et al., 2004;Soares et al., 2008) Asian populations, but all in low fre-quencies (\5%). In addition, it has been reported thatthe deepest branches of haplogroup M9 (pre-M9a) werefound in Indochina, Mainland China, Taiwan, and the
Fig. 5. The phylogenetic tree of complete mtDNA sequences of haplogroup M11, M13, and M62. The tree is rooted in macroha-plogroup M. For additional information, see the Figure 3 legend.
562 Z. QIN ET AL.
American Journal of Physical Anthropology

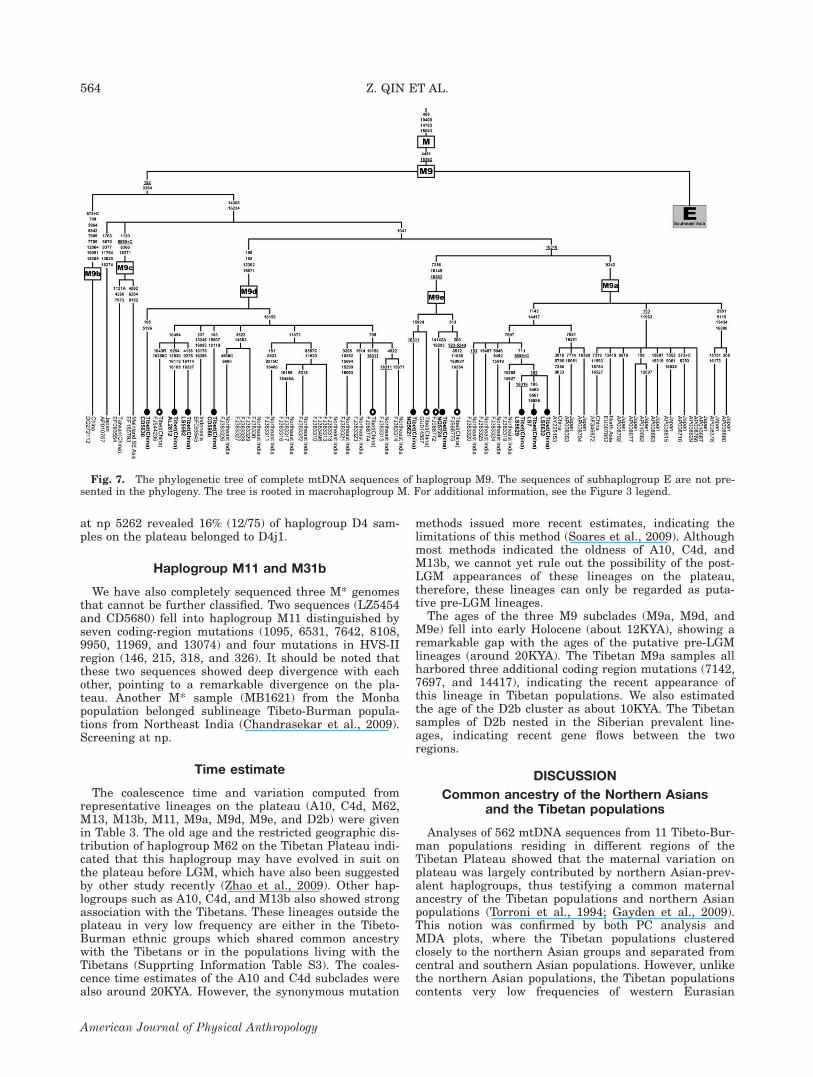
next deepest in ISEA (Soares et al., 2008). On the pla-teau, M9 haplogroup is represented as four distinctHVS-I motif types: 16223-16234-16362 (pre-M9a), 16223-16234-16316-16362 (M9a), 16158-16223-16234-16362(M9d), and 16145-16223-16234. To further assess the lin-eage M9 variations found in mitochondrial gene pool ofthe Tibetan Plateau, we selected 10 samples of all theabove four different motifs and sequenced their completemtDNA genomes. Combining all published haplogroupM9 (excluding sublineage E) mtDNA genomes (Tanakaet al., 2004; Kong et al., 2006; Bilal et al., 2008; Soareset al., 2008; Chandrasekar et al., 2009), and our ninenewly collected samples, we reconstructed a tree of 56complete sequences (Fig. 7). According to this updatedphylogenetic tree, we defined one new M9 subclade andits diagnostic coding SNPs as: M9e (7256C). Interest-ingly, two sequences (CD5630, LS5629) harboring 16223-16234-16362 HVS-I motif, which have been designatedas pre-M9a previously, fall into subclades M9d and M9a,respectively. Additional screening of mutations at np9242, 12362, and 7256 in these pre-M9a samplesrevealed that they all belong to either M9a or M9d sub-clades. Notably we found that the only published M9dsequence (EF093545) from Southeast Asia nested inTibeto-Burman samples, and the M9d frequency wasmuch higher on the Tibetan Plateau (8.9%) than in
Southeast Asia. Thus this M9d sequence may indicate arecent gene flow from Tibet to Southeast Asia.
Haplogroup D2b and D4j
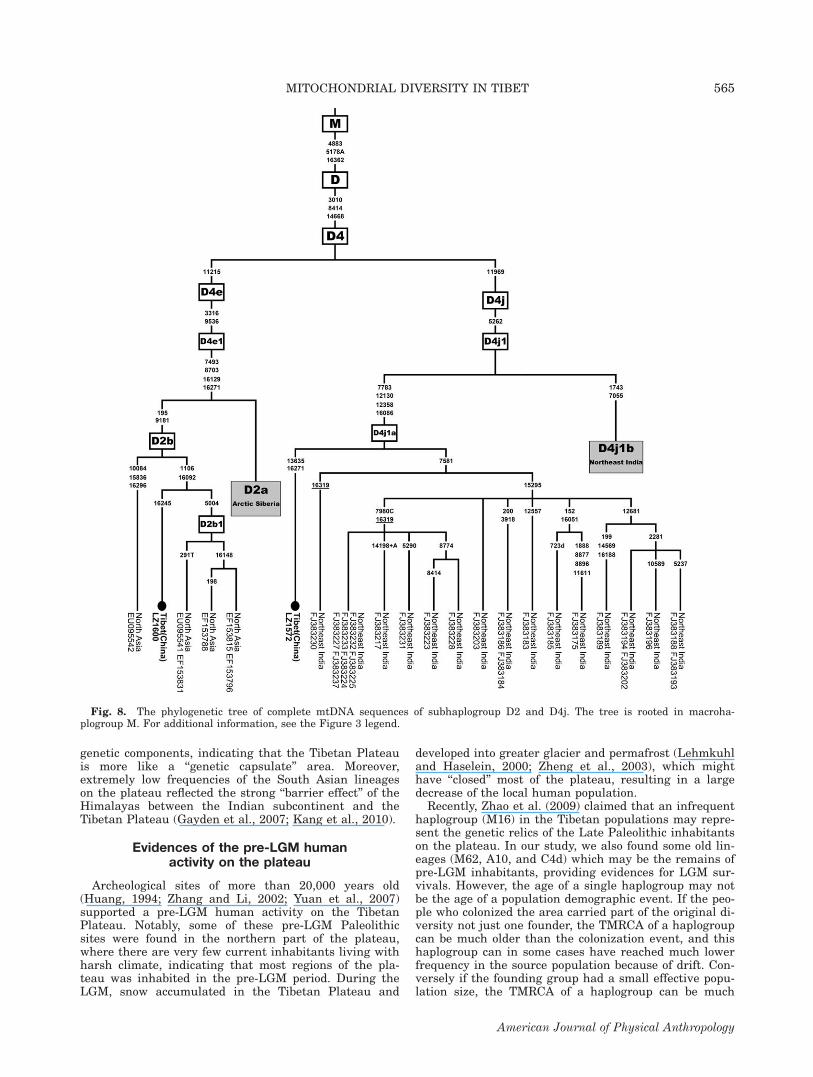
The distribution of subhaplogroup D2b (‘‘D2a’’ in (Der-enko et al., 2007)) in Asian populations indicated asouthern Siberian rather than Beringian origin of hap-logroup D2 lineages. In our samples from the TibetanPlateau, we found three mtDNA sequences (LZ1572,LZ1600, and CD5479) bearing similar haplogroup D2HVS-I motif (16129-16223-16271-16362). Moreover, ourresults from complete mtDNA sequencing and selectedvariation checking revealed that two of these sequences(LZ1600 and CD5479) were similar to the southern Sibe-rian-specific D2b sublineage but lacked the substitutionat np 5004, which is one of the four mutations (at np195, 5004, 9181, and 16092) defining subhaplogroup D2bas previously reported (Derenko et al., 2007). Theupdated phylogeny of D2b was illustrated in Figure 8.These two Tibetan sequences showed strong affinity withthe southern Siberian D2b sequences. The othersequence (LZ1572), bearing transitions at np 5262 and11969, grouped into D4j1 cluster (Fig. 8), which wasnewly identified in Tibeto-Burman populations fromNortheast India (Chandrasekar et al., 2009). Screening
Fig. 6. The phylogenetic tree of complete mtDNA sequences of subhaplogroup C4. The tree is rooted in macrohaplogroup M. Foradditional information, see the Figure 3 legend.
563MITOCHONDRIAL DIVERSITY IN TIBET
American Journal of Physical Anthropology
at np 5262 revealed 16% (12/75) of haplogroup D4 sam-ples on the plateau belonged to D4j1.
Haplogroup M11 and M31b
We have also completely sequenced three M* genomesthat cannot be further classified. Two sequences (LZ5454and CD5680) fell into haplogroup M11 distinguished byseven coding-region mutations (1095, 6531, 7642, 8108,9950, 11969, and 13074) and four mutations in HVS-IIregion (146, 215, 318, and 326). It should be noted thatthese two sequences showed deep divergence with eachother, pointing to a remarkable divergence on the pla-teau. Another M* sample (MB1621) from the Monbapopulation belonged sublineage Tibeto-Burman popula-tions from Northeast India (Chandrasekar et al., 2009).Screening at np.
Time estimate
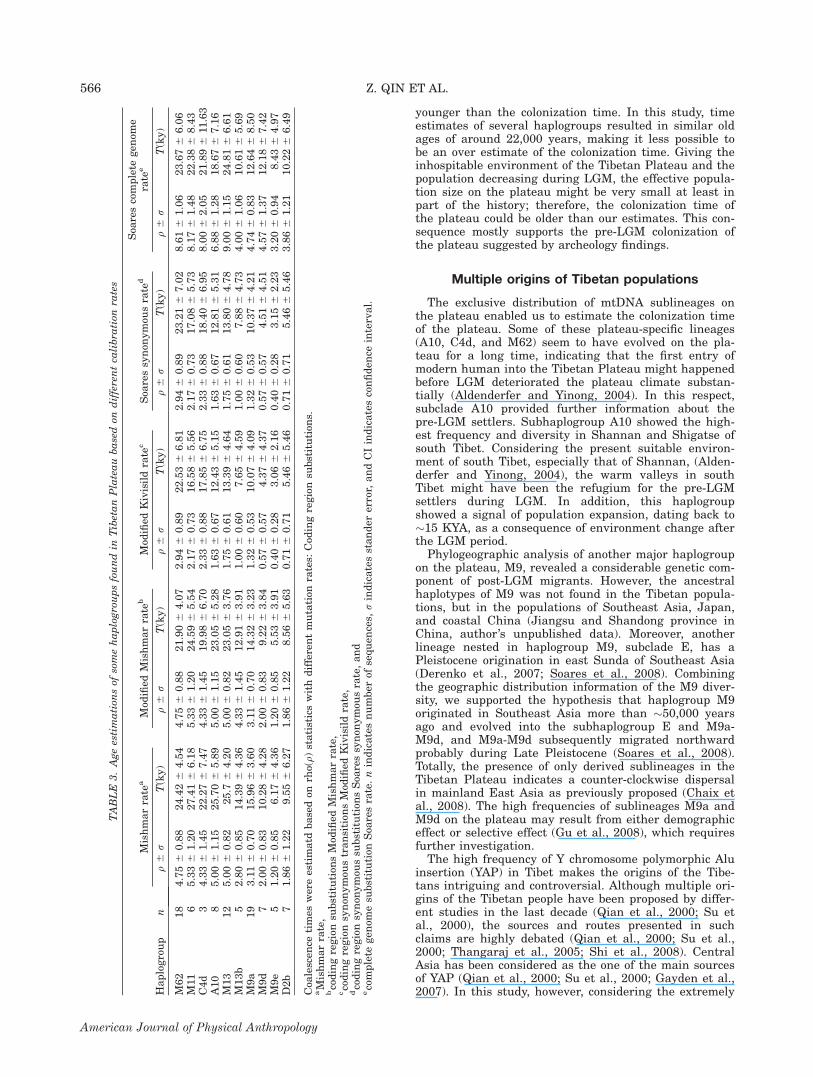
The coalescence time and variation computed fromrepresentative lineages on the plateau (A10, C4d, M62,M13, M13b, M11, M9a, M9d, M9e, and D2b) were givenin Table 3. The old age and the restricted geographic dis-tribution of haplogroup M62 on the Tibetan Plateau indi-cated that this haplogroup may have evolved in suit onthe plateau before LGM, which have also been suggestedby other study recently (Zhao et al., 2009). Other hap-logroups such as A10, C4d, and M13b also showed strongassociation with the Tibetans. These lineages outside theplateau in very low frequency are either in the Tibeto-Burman ethnic groups which shared common ancestrywith the Tibetans or in the populations living with theTibetans (Supprting Information Table S3). The coales-cence time estimates of the A10 and C4d subclades werealso around 20KYA. However, the synonymous mutation
methods issued more recent estimates, indicating thelimitations of this method (Soares et al., 2009). Althoughmost methods indicated the oldness of A10, C4d, andM13b, we cannot yet rule out the possibility of the post-LGM appearances of these lineages on the plateau,therefore, these lineages can only be regarded as puta-tive pre-LGM lineages.The ages of the three M9 subclades (M9a, M9d, and
M9e) fell into early Holocene (about 12KYA), showing aremarkable gap with the ages of the putative pre-LGMlineages (around 20KYA). The Tibetan M9a samples allharbored three additional coding region mutations (7142,7697, and 14417), indicating the recent appearance ofthis lineage in Tibetan populations. We also estimatedthe age of the D2b cluster as about 10KYA. The Tibetansamples of D2b nested in the Siberian prevalent line-ages, indicating recent gene flows between the tworegions.
DISCUSSION
Common ancestry of the Northern Asiansand the Tibetan populations
Analyses of 562 mtDNA sequences from 11 Tibeto-Bur-man populations residing in different regions of theTibetan Plateau showed that the maternal variation onplateau was largely contributed by northern Asian-prev-alent haplogroups, thus testifying a common maternalancestry of the Tibetan populations and northern Asianpopulations (Torroni et al., 1994; Gayden et al., 2009).This notion was confirmed by both PC analysis andMDA plots, where the Tibetan populations clusteredclosely to the northern Asian groups and separated fromcentral and southern Asian populations. However, unlikethe northern Asian populations, the Tibetan populationscontents very low frequencies of western Eurasian
Fig. 7. The phylogenetic tree of complete mtDNA sequences of haplogroup M9. The sequences of subhaplogroup E are not pre-sented in the phylogeny. The tree is rooted in macrohaplogroup M. For additional information, see the Figure 3 legend.
564 Z. QIN ET AL.
American Journal of Physical Anthropology
genetic components, indicating that the Tibetan Plateauis more like a ‘‘genetic capsulate’’ area. Moreover,extremely low frequencies of the South Asian lineageson the plateau reflected the strong ‘‘barrier effect’’ of theHimalayas between the Indian subcontinent and theTibetan Plateau (Gayden et al., 2007; Kang et al., 2010).
Evidences of the pre-LGM humanactivity on the plateau
Archeological sites of more than 20,000 years old(Huang, 1994; Zhang and Li, 2002; Yuan et al., 2007)supported a pre-LGM human activity on the TibetanPlateau. Notably, some of these pre-LGM Paleolithicsites were found in the northern part of the plateau,where there are very few current inhabitants living withharsh climate, indicating that most regions of the pla-teau was inhabited in the pre-LGM period. During theLGM, snow accumulated in the Tibetan Plateau and
developed into greater glacier and permafrost (Lehmkuhland Haselein, 2000; Zheng et al., 2003), which mighthave ‘‘closed’’ most of the plateau, resulting in a largedecrease of the local human population.Recently, Zhao et al. (2009) claimed that an infrequent
haplogroup (M16) in the Tibetan populations may repre-sent the genetic relics of the Late Paleolithic inhabitantson the plateau. In our study, we also found some old lin-eages (M62, A10, and C4d) which may be the remains ofpre-LGM inhabitants, providing evidences for LGM sur-vivals. However, the age of a single haplogroup may notbe the age of a population demographic event. If the peo-ple who colonized the area carried part of the original di-versity not just one founder, the TMRCA of a haplogroupcan be much older than the colonization event, and thishaplogroup can in some cases have reached much lowerfrequency in the source population because of drift. Con-versely if the founding group had a small effective popu-lation size, the TMRCA of a haplogroup can be much
Fig. 8. The phylogenetic tree of complete mtDNA sequences of subhaplogroup D2 and D4j. The tree is rooted in macroha-plogroup M. For additional information, see the Figure 3 legend.
565MITOCHONDRIAL DIVERSITY IN TIBET
American Journal of Physical Anthropology
younger than the colonization time. In this study, timeestimates of several haplogroups resulted in similar oldages of around 22,000 years, making it less possible tobe an over estimate of the colonization time. Giving theinhospitable environment of the Tibetan Plateau and thepopulation decreasing during LGM, the effective popula-tion size on the plateau might be very small at least inpart of the history; therefore, the colonization time ofthe plateau could be older than our estimates. This con-sequence mostly supports the pre-LGM colonization ofthe plateau suggested by archeology findings.
Multiple origins of Tibetan populations
The exclusive distribution of mtDNA sublineages onthe plateau enabled us to estimate the colonization timeof the plateau. Some of these plateau-specific lineages(A10, C4d, and M62) seem to have evolved on the pla-teau for a long time, indicating that the first entry ofmodern human into the Tibetan Plateau might happenedbefore LGM deteriorated the plateau climate substan-tially (Aldenderfer and Yinong, 2004). In this respect,subclade A10 provided further information about thepre-LGM settlers. Subhaplogroup A10 showed the high-est frequency and diversity in Shannan and Shigatse ofsouth Tibet. Considering the present suitable environ-ment of south Tibet, especially that of Shannan, (Alden-derfer and Yinong, 2004), the warm valleys in southTibet might have been the refugium for the pre-LGMsettlers during LGM. In addition, this haplogroupshowed a signal of population expansion, dating back to�15 KYA, as a consequence of environment change afterthe LGM period.Phylogeographic analysis of another major haplogroup
on the plateau, M9, revealed a considerable genetic com-ponent of post-LGM migrants. However, the ancestralhaplotypes of M9 was not found in the Tibetan popula-tions, but in the populations of Southeast Asia, Japan,and coastal China (Jiangsu and Shandong province inChina, author’s unpublished data). Moreover, anotherlineage nested in haplogroup M9, subclade E, has aPleistocene origination in east Sunda of Southeast Asia(Derenko et al., 2007; Soares et al., 2008). Combiningthe geographic distribution information of the M9 diver-sity, we supported the hypothesis that haplogroup M9originated in Southeast Asia more than �50,000 yearsago and evolved into the subhaplogroup E and M9a-M9d, and M9a-M9d subsequently migrated northwardprobably during Late Pleistocene (Soares et al., 2008).Totally, the presence of only derived sublineages in theTibetan Plateau indicates a counter-clockwise dispersalin mainland East Asia as previously proposed (Chaix etal., 2008). The high frequencies of sublineages M9a andM9d on the plateau may result from either demographiceffect or selective effect (Gu et al., 2008), which requiresfurther investigation.The high frequency of Y chromosome polymorphic Alu
insertion (YAP) in Tibet makes the origins of the Tibe-tans intriguing and controversial. Although multiple ori-gins of the Tibetan people have been proposed by differ-ent studies in the last decade (Qian et al., 2000; Su etal., 2000), the sources and routes presented in suchclaims are highly debated (Qian et al., 2000; Su et al.,2000; Thangaraj et al., 2005; Shi et al., 2008). CentralAsia has been considered as the one of the main sourcesof YAP (Qian et al., 2000; Su et al., 2000; Gayden et al.,2007). In this study, however, considering the extremely
TABLE
3.Ageestimation
sof
somehaplogroupsfoundin
TibetanPlateaubasedon
differentca
libra
tion
rates
Haplogroup
n
Mishmarrate
aMod
ified
Mishmarrate
bMod
ified
Kivisildrate
cSoa
ressynon
ymou
srate
dSoa
rescomplete
gen
ome
rate
e
q6
rT(ky)
q6
rT(ky)
q6
rT(ky)
q6
rT(ky)
q6
rT(ky)
M62
18
4.756
0.88
24.426
4.54
4.756
0.88
21.906
4.07
2.946
0.89
22.536
6.81
2.946
0.89
23.216
7.02
8.616
1.06
23.676
6.06
M11
65.336
1.20
27.416
6.18
5.336
1.20
24.596
5.54
2.176
0.73
16.586
5.56
2.176
0.73
17.086
5.73
8.176
1.48
22.386
8.43
C4d
34.336
1.45
22.276
7.47
4.336
1.45
19.986
6.70
2.336
0.88
17.856
6.75
2.336
0.88
18.406
6.95
8.006
2.05
21.896
11.63
A10
85.006
1.15
25.706
5.89
5.006
1.15
23.056
5.28
1.636
0.67
12.436
5.15
1.636
0.67
12.816
5.31
6.886
1.28
18.676
7.16
M13
12
5.006
0.82
25.7
64.20
5.006
0.82
23.056
3.76
1.756
0.61
13.396
4.64
1.756
0.61
13.806
4.78
9.006
1.15
24.816
6.61
M13b
52.806
0.85
14.396
4.36
4.336
1.45
12.916
3.91
1.006
0.60
7.656
4.59
1.006
0.60
7.886
4.73
4.006
1.06
10.616
5.69
M9a
19
3.116
0.70
15.966
3.60
3.116
0.70
14.326
3.23
1.326
0.53
10.076
4.09
1.326
0.53
10.376
4.21
4.746
0.83
12.646
8.50
M9d
72.006
0.83
10.286
4.28
2.006
0.83
9.226
3.84
0.576
0.57
4.376
4.37
0.576
0.57
4.516
4.51
4.576
1.37
12.186
7.42
M9e
51.206
0.85
6.176
4.36
1.206
0.85
5.536
3.91
0.406
0.28
3.066
2.16
0.406
0.28
3.156
2.23
3.206
0.94
8.436
4.97
D2b
71.866
1.22
9.556
6.27
1.866
1.22
8.566
5.63
0.716
0.71
5.466
5.46
0.716
0.71
5.466
5.46
3.866
1.21
10.226
6.49
Coa
lescen
cetimes
wereestimatd
basedon
rho(q)statisticswithdifferentmutation
rates:
Cod
ingregionsu
bstitution
s.aMishmarrate,
bcodingregionsu
bstitution
sMod
ified
Mishmarrate,
ccodingregionsynon
ymou
stransition
sMod
ified
Kivisildrate,
dcodingregionsynon
ymou
ssu
bstitution
sSoa
ressynon
ymou
srate,and
ecomplete
gen
omesu
bstitution
Soa
resrate.nindicatesnumber
ofsequen
ces,
rindicatesstander
error,andCIindicatesconfiden
ceinterval.
566 Z. QIN ET AL.
American Journal of Physical Anthropology
low frequency of western or central Asian mtDNA hap-logroups (2.3%), it is less likely that Central Asian is amajor contributor, at least in the maternal aspect.Recently, Shi et al. (2008) demonstrated two independentPaleolithic dispersal events of modern human into EastAsia of �50 KYA (marked by Y haplogroup D-M174) and�30 KYA (marked by Y haplogroup O-M175 and itsderivatives) (Shi et al., 2005, 2008). Haplogroup D and Oare both dominant Y haplogroups in Tibet, indicatingmultiple migrations into Tibet. The routes Shi et al. pro-posed of the two ancient human dispersals are consistentwith our findings of pre- and post-LGM migrations tothe Tibetan Plateau. This concurrence, however, needsto be investigated in our further study.
Possible bias in time estimates
The genetic time estimates may be affected by severalfactors. The current statistic method for time estimate isstill developing. A recent study showed that moleculardating with the rho statistic could produce biased resultswith large asymmetrical variances (Cox, 2008). Also de-mographic histories (such as bottlenecks, founder eventsand changes in effective population size) can particularlydistort date estimates with the rho statistic (Cox, 2008;Endicott et al., 2009). Therefore, our conclusion may berevised in case that bias in time estimate exists, and Ti-betan populations may have demographic histories dif-ferent from our hypothesis. Furthermore, mutation ratesto be used in mtDNA dating are yet to be determined.Researchers have demonstrated that Mishimar mutationrate always gave much older dates for East Asian popu-lations (Endicott et al., 2009). However, we used multiplemutation rates to eliminate the bias, and the results arefairly consistent. Thus, we interpreted our data as pre-and post-LGM Tibetan plateau inhabitants with cau-tions. To make more solid conclusion, we need to gener-ate sufficient Tibetan mtDNA complete sequences andanalyze data with several different methods (Endicottand Ho, 2008; Ho and Endicott, 2008; Sores et al., 2009).
ACKNOWLEDGMENTS
We thank all of the sample donors and those whohelped with sample collection for making this work pos-sible.
LITERATURE CITED
Aldenderfer M, Yinong Z. 2004. The prehistory of the TibetanPlateau to the seventh century A.D.: perspectives andresearch from China and the West since 1950. J World Pre-hist 18:1–55.
Andrews RM, Kubacka I, Chinnery PF, Lightowlers RN, Turn-bull DM, Howell N. 1999. Reanalysis and revision of the Cam-bridge reference sequence for human mitochondrial DNA. NatGenet 23:147.
Aris-Brosou S, Excoffier L. 1996. The impact of populationexpansion and mutation rate heterogeneity on DNA sequencepolymorphism. Mol Biol Evol 13:494–504.
Bandelt HJ, Forster P, Sykes BC, Richards MB. 1995. Mitochon-drial portraits of human populations using median networks.Genetics 141:743–753.
Bilal E, Rabadan R, Alexe G, Fuku N, Ueno H, Nishigaki Y,Fujita Y, Ito M, Arai Y, Hirose N, Ruckenstein A, Bhanot G,Tanaka M. 2008. Mitochondrial DNA haplogroup D4a is amarker for extreme longevity in Japan. PLoS One 3:e2421.
Chaix R, Austerlitz F, Hegay T, Quintana-Murci L, Heyer E.2008. Genetic traces of east-to-west human expansion wavesin Eurasia. Am J Phys Anthropol 136:309–317.
Chandrasekar A, Kumar S, Sreenath J, Sarkar BN, Urade BP,Mallick S, Bandopadhyay SS, Barua P, Barik SS, Basu D,Kiran U, Gangopadhyay P, Sahani R, Prasad BV, Gangopad-hyay S, Lakshmi GR, Ravuri R R, Padmaja K, Venugopal PN,Sharma MB, Rao VR. 2009. Updating phylogeny of mitochon-drial DNA macrohaplogroup M in India: dispersal of modernhuman in South Asian Corridor. PLoS One 4:e7447.
Comas D, Plaza S, Wells RS, Yuldaseva N, Lao O, Calafell F,Bertranpetit J. 2004. Admixture, migrations, and dispersalsin Central Asia: evidence from maternal DNA lineages. Eur JHum Genet 12:495–504.
Cordaux R, Saha N, Bentley GR, Aunger R, Sirajuddin SM,Stoneking M. 2003. Mitochondrial DNA analysis revealsdiverse histories of tribal populations from India. Eur J HumGenet 11:253–264.
Cordaux R, Weiss G, Saha N, Stoneking M. 2004. The NortheastIndian Passageway: a barrier or corridor for human migra-tions? Mol Biol Evol 21:1525–1533.
Cox M. 2009. Accuracy of molecular dating with the Rho Statis-tic: deviations from coalescent expectations under a range ofdemographic models. Hum Biol 80:335–357.
Derenko M, Malyarchuk B, Grzybowski T, Denisova G, Dam-bueva I, Perkova M, Dorzhu C, Luzina F, Lee HK, Vanecek T,Villems R, Zakharov I. 2007. Phylogeographic analysis of mi-tochondrial DNA in northern Asian populations. Am J HumGenet 81:1025–1041.
Derenko MV, Grzybowski T, Malyarchuk BA, Dambueva IK,Denisova GA, Czarny J, Dorzhu CM, Kakpakov VT, Miscicka-Sliwka D, Wozniak M, Zakharov IA. 2003. Diversity of mito-chondrial DNA lineages in South Siberia. Ann Hum Genet67:391–411.
Ding YC, Wooding S, Harpending HC, Chi HC, Li HP, Fu YX,Pang JF, Yao YG, Yu JG, Moyzis R, Zhang Y. 2000. Populationstructure and history in East Asia. Proc Natl Acad Sci USA97:14003–14006.
Du R, Xiao C, Cavalli-Sforza LL. 1997. Genetic distancesbetween Chinese populations calculated on gene frequenciesof 38 loci. Sci China C Life Sci 40:613–621.
Endicott P, Ho SYW. 2008. A Bayesian evaluation of humanmitochondrial substitution rates. Am J Hum Genet 82:895–902.
Endicott P, Ho SYW, Metspalu M, Stringer C. 2009. Evaluatingthe mitochondrial timescale of human evolution. Trends EcolEvol 24:515–521.
Excoffier L, Laval G, Schneider S. 2005. Arlequin (version 3.0):an integrated software package for population genetics dataanalysis. Evol Bioinform Online 1:47–50.
Excoffier L, Smouse PE, Quattro JM. 1992. Analysis of molecu-lar variance inferred from metric distances among DNA hap-lotypes: application to human mitochondrial DNA restrictiondata. Genetics 131:479–491.
Fedorova SA, Bermisheva MA, Villems R, Maksimova NR,Khusnutdinova EK. 2003. [Analysis of mitochondrial DNAhaplotypes in yakut population]. Mol Biol (Mosk) 37:643–653.
Fornarino S, Pala M, Battaglia V, Maranta R, Achilli A, ModianoG, Torroni A, Semino O, Santachiara-Benerecetti SA. 2009. Mi-tochondrial and Y-chromosome diversity of the Tharus (Nepal):a reservoir of genetic variation. BMC Evol Biol 9:154.
Forster P, Harding R, Torroni A, Bandelt HJ. 1996. Origin andevolution of Native American mtDNA variation: a reappraisal.Am J Hum Genet 59:935–945.
Fu YX. 1997. Statistical tests of neutrality of mutations againstpopulation growth, hitchhiking and background selection.Genetics 147:915–925.
Fucharoen G, Fucharoen S, Horai S. 2001. Mitochondrial DNApolymorphisms in Thailand. J Hum Genet 46:115–125.
Gayden T, Cadenas AM, Regueiro M, Singh NB, ZhivotovskyLA, Underhill PA, Cavalli-Sforza LL, Herrera RJ. 2007. TheHimalayas as a directional barrier to gene flow. Am J HumGenet 80:884–894.
Gayden T, Mirabal S, Cadenas AM, Lacau H, Simms TM, Mor-lote D, Chennakrishnaiah S, Herrera RJ. 2009. Geneticinsights into the origins of Tibeto-Burman populations in theHimalayas. J Hum Genet 54:216–223.
567MITOCHONDRIAL DIVERSITY IN TIBET
American Journal of Physical Anthropology

Gu ML, Wang YJ, Shi L, Jiang F, Qiu MJ, Lin KQ, Tao YF,Huang XQ, Liu B, Chu JY. 2008. [Comparative analysis of thecomplete mitochondrial genome between Tibetan and Hanpopulation]. Zhonghua Yi Xue Yi Chuan Xue Za Zhi 25:382–386.
Gu ML, Wang YJ, Shi L, Zhang YB, Chu JY. 2009. [Comparisonon mitochondrial ATP6. ATP8 and Cyt b genes between Chi-nese Tibetans in three different zones: detecting the signatureof natural selection on mitochondrial genome]. Yi Chuan31:147–152.
Hammer MF, Spurdle AB, Karafet T, Bonner MR, Wood ET,Novelletto A, Malaspina P, Mitchell RJ, Horai S, Jenkins T,Zegura SL. 1997. The geographic distribution of human Ychromosome variation. Genetics 145:787–805.
Hartmann A, Thieme M, Nanduri LK, Stempfl T, Moehle C,Kivisild T, Oefner PJ. 2009. Validation of microarray-basedresequencing of 93 worldwide mitochondrial genomes. HumMutat 30:115–122.
Heyer E, Balaresque P, Jobling M, Quintana-Murci L, Chaix R,Segurel L, Aldashev A, Hegay T. 2009. Genetic diversity andthe emergence of ethnic groups in Central Asia. BMC Genet10:49.
Hill C, Soares P, Mormina M, Macaulay V, Clarke D, BlumbachPB, Vizuete-Forster M, Forster P, Bulbeck D, Oppenheimer S,Richards M. 2007. A mitochondrial stratigraphy for islandsoutheast Asia. Am J Hum Genet 80:29–43.
Hill C, Soares P, Mormina M, Macaulay V, Meehan W, Black-burn J, Clarke D, Raja JM, Ismail P, Bulbeck D, Oppen-heimer S, Richards M. 2006. Phylogeography and ethnogene-sis of aboriginal Southeast Asians. Mol Biol Evol 23:2480–2491.
Ho SYW, Endicott P. 2008. The crucial role of calibration in mo-lecular date estimates for the peopling of the Americas. Am JHum Genet 83:142–146.
Horai S, Murayama K, Hayasaka K, Matsubayashi S, Hattori Y,Fucharoen G, Harihara S, Park KS, Omoto K, Pan IH. 1996.mtDNA polymorphism in East Asian populations, with specialreference to the peopling of Japan. Am J Hum Genet 59:579–590.
Huang W. 1994. The prehistoric human occupation of the Qing-hai-Xizang plateau. Gottinger Geographische Abhandlungen95:201–219.
Ingman M, Gyllensten U. 2007. Rate variation between mito-chondrial domains and adaptive evolution in humans. HumMol Genet 16:2281–2287.
Ingman M, Kaessmann H, Paabo S, Gyllensten U. 2000. Mito-chondrial genome variation and the origin of modern humans.Nature 408:708–713.
Jin L, Su B. 2000. Natives or immigrants: modern human originin east Asia. Nat Rev Genet 1:126–133.
Kang LL, Li SL, Gupta S, Zhang YG, Liu K, Zhao JM, Jin L, LiH. 2010. Genetic structures of the Tibetans and the Deng peo-ple in the Himalayas viewed from autosomal STRs. J HumGenet 55:270–277.
Kivisild T, Tolk HV, Parik J, Wang Y, Papiha SS, Bandelt HJ,Villems R. 2002. The emerging limbs and twigs of the EastAsian mtDNA tree. Mol Biol Evol 19:1737–1751.
Kolman CJ, Sambuughin N, Bermingham E. 1996. Mitochon-drial DNA analysis of Mongolian populations and implicationsfor the origin of New World founders. Genetics 142:1321–1334.
Kong QP, Bandelt HJ, Sun C, Yao YG, Salas A, Achilli A, WangCY, Zhong L, Zhu CL, Wu SF, Torroni A, Zhang YP. 2006.Updating the East Asian mtDNA phylogeny: a prerequisitefor the identification of pathogenic mutations. Hum MolGenet 15:2076–2086.
Kong QP, Yao YG, Liu M, Shen SP, Chen C, Zhu CL, Palanich-amy MG, Zhang YP. 2003a. Mitochondrial DNA sequencepolymorphisms of five ethnic populations from northernChina. Hum Genet 113:391–405.
Kong QP, Yao YG, Sun C, Bandelt HJ, Zhu CL, Zhang YP.2003b. Phylogeny of East Asian mitochondrial DNA lineagesinferred from complete sequences. Am J Hum Genet 73:671–676.
Lehmkuhl F, Haselein F. 2000. Quaternary paleoenvironmentalchange on the Tibetan Plateau and adjacent areas (WesternChina and Western Mongolia). Quat Int 65:121–145.
Lewis MP, editor. 2009. Ethnologue: languages of the world,16th ed. Dallas: SIL International. Online version: http://www.ethnologue.com/.
Li H, Cai X, Winograd-Cort ER, Wen B, Cheng X, Qin Z, Liu W,Liu Y, Pan S, Qian J, Tan CC, Jin L. 2007. MitochondrialDNA diversity and population differentiation in southernEast Asia. Am J Phys Anthropol 134:481–488.
Macaulay V, Hill C, Achilli A, Rengo C, Clarke D, Meehan W,Blackburn J, Semino O, Scozzari R, Cruciani F, Taha A,Shaari NK, Raja JM, Ismail P, Zainuddin Z, Goodwin W,Bulbeck D, Bandelt HJ, Oppenheimer S, Torroni A, RichardsM. 2005. Single, rapid coastal settlement of Asia revealed byanalysis of complete mitochondrial genomes. Science 308:1034–1036.
Mishmar D, Ruiz-Pesini E, Golik P, Macaulay V, Clark AG, Hos-seini S, Brandon M, Easley K, Chen E, Brown MD, SukernikRI, Olckers A, Wallace DC. 2003. Natural selection shaped re-gional mtDNA variation in humans. Proc Natl Acad Sci USA100:171–176.
Oota H, Settheetham-Ishida W, Tiwawech D, and StonekingTIM. 2001. Human mtDNA and Y-chromosome variation iscorrelated with matrilocal versus patrilocal residence. NatureGenet 29(Brief Communication):20–21.
Pakendorf B, Stoneking M. 2005. Mitochondrial DNA andhuman evolution. Annu Rev Genomics Hum Genet 6:165–183.
Pakendorf B, Wiebe V, Tarskaia LA, Spitsyn VA, Soodyall H,Rodewald A, Stoneking M. 2003. Mitochondrial DNA evidencefor admixed origins of central Siberian populations. Am JPhys Anthropol 120:211–224.
Perego UA, Achilli A, Angerhofer N, Accetturo M, Pala M, Oli-vieri A, Kashani BH, Ritchie KH, Scozzari R, Kong QP, MyresNM, Salas A, Semino O, Bandelt HJ, Woodward SR, TorroniA. 2009. Distinctive Paleo-Indian migration routes fromBeringia marked by two rare mtDNA haplogroups. Curr Biol19:1–8.
Qian Y, Qian B, Su B, Yu J, Ke Y, Chu Z, Shi L, Lu D, Chu J,Jin L. 2000. Multiple origins of Tibetan Y chromosomes. HumGenet 106:453–454.
Qian YP, Chu ZT, Dai Q, Wei CD, Chu JY, Tajima A, Horai S.2001. Mitochondrial DNA polymorphisms in Yunnan national-ities in China. J Hum Genet 46:211–220.
Quintana-Murci L, Chaix R, Wells RS, Behar DM, Sayar H,Scozzari R, Rengo C, Al-Zahery N, Semino O, Santachiara-Benerecetti AS, Coppa A, Ayub Q, Mohyuddin A, Tyler-SmithC, Qasim Mehdi S, Torroni A, McElreavey K. 2004. Wherewest meets east: the complex mtDNA landscape of the south-west and Central Asian corridor. Am J Hum Genet 74:827–845.
Ronquist F, Huelsenbeck JP. 2003. MrBayes 3: Bayesian phylo-genetic inference under mixed models. Bioinformatics 19:1572–1574.
Ruiz-Pesini E, Mishmar D, Brandon M, Procaccio V, WallaceDC. 2004. Effects of purifying and adaptive selection on re-gional variation in human mtDNA. Science 303:223–226.
Saillard J, Forster P, Lynnerup N, Bandelt HJ, Norby S. 2000.mtDNA variation among Greenland Eskimos: the edge of theBeringian expansion. Am J Hum Genet 67:718–726.
Shi H, Dong YL, Wen B, Xiao CJ, Underhill PA, Shen PD,Chakraborty R, Jin L, Su B. 2005. Y-chromosome evidence ofsouthern origin of the East Asian-specific haplogroup O3-M122. Am J Hum Genet 77:408–419.
Shi H, Zhong H, Peng Y, Dong YL, Qi XB, Zhang F, Liu LF, TanSJ, Ma RL, Xiao CJ, Wells RS, Jin L, Su B. 2008. Y chromo-some evidence of earliest modern human settlement in EastAsia and multiple origins of Tibetan and Japanese popula-tions. BMC Biol 6:45.
Soares P, Ermini L, Thomson N, Mormina M, Rito T, Rohl A,Salas A, Oppenheimer S, Macaulay V, Richards MB. 2009.Correcting for purifying selection: an improved human mito-chondrial molecular clock. Am J Hum Genet 84:740–759.
568 Z. QIN ET AL.
American Journal of Physical Anthropology
Soares P, Trejaut JA, Loo JH, Hill C, Mormina M, Lee CL,Chen YM, Hudjashov G, Forster P, Macaulay V, Bulbeck D,Oppenheimer S, Lin M, Richards MB. 2008. Climate changeand postglacial human dispersals in southeast Asia. Mol BiolEvol 25:1209–1218.
Starikovskaya EB, Sukernik RI, Derbeneva OA, Volodko NV, Ruiz-Pesini E, Torroni A, Brown MD, Lott MT, Hosseini SH, Huopo-nen K, Wallace DC. 2005. Mitochondrial DNA diversity in indige-nous populations of the southern extent of Siberia, and the ori-gins of Native American haplogroups. Ann HumGenet 69:67–89.
Starikovskaya YB, Sukernik RI, Schurr TG, Kogelnik AM, Wal-lace DC. 1998. mtDNA diversity in Chukchi and Siberian Es-kimos: implications for the genetic history of Ancient Beringiaand the peopling of the New World. Am J Hum Genet63:1473–1491.
Su B, Xiao C, Deka R, Seielstad MT, Kangwanpong D, Xiao J,Lu D, Underhill P, Cavalli-Sforza L, Chakraborty R, Jin L.2000. Y chromosome haplotypes reveal prehistorical migra-tions to the Himalayas. Hum Genet 107:582–590.
Tajima F. 1989. Statistical method for testing the neutral muta-tion hypothesis by DNA polymorphism. Genetics 123:585–595.
Tamm E, Kivisild T, Reidla M, Metspalu M, Smith DG, Mulli-gan CJ, Bravi CM, Rickards O, Martinez-Labarga C, Khus-nutdinova EK, Fedorova SA, Golubenko MV, Stepanov VA,Gubina MA, Zhadanov SI, Ossipova LP, Damba L, VoevodaMI, Dipierri JE, Villems R, Malhi RS. 2007. Beringian stand-still and spread of Native American founders. PLoS One2:e829.
Tanaka M, Cabrera VM, Gonzalez AM, Larruga JM, TakeyasuT, Fuku N, Guo LJ, Hirose R, Fujita Y, Kurata M, Shinoda K,Umetsu K, Yamada Y, Oshida Y, Sato Y, Hattori N, Mizuno Y,Arai Y, Hirose N, Ohta S, Ogawa O, Tanaka Y, Kawamori R,Shamoto-Nagai M, Maruyama W, Shimokata H, Suzuki R,Shimodaira H. 2004. Mitochondrial genome variation in east-ern Asia and the peopling of Japan. Genome Res 14:1832–1850.
Thangaraj K, Chaubey G, Kivisild T, Reddy AG, Singh VK,Rasalkar AA, Singh L. 2005. Reconstructing the origin of An-daman Islanders. Science 308:996.
Torroni A, Miller JA, Moore LG, Zamudio S, Zhuang J, DromaT, Wallace DC. 1994. Mitochondrial DNA analysis in Tibet:implications for the origin of the Tibetan population and itsadaptation to high altitude. Am J Phys Anthropol 93:189–199.
Torroni A, Rengo C, Guida V, Cruciani F, Sellitto D, Coppa A,Calderon FL, Simionati B, Valle G, Richards M, Macaulay V,Scozzari R. 2001. Do the four clades of the mtDNA hap-logroup L2 evolve at different rates? Am J Hum Genet69:1348–1356.
Torroni A, Schurr TG, Cabell MF, Brown MD, Neel JV, LarsenM, Smith DG, Vullo CM, Wallace DC. 1993. Asian affinitiesand continental radiation of the four founding Native Ameri-can mtDNAs. Am J Hum Genet 53:563–590.
Trejaut JA, Kivisild T, Loo JH, Lee CL, He CL, Hsu CJ, Lee ZY,Lin M. 2005. Traces of archaic mitochondrial lineages persistin Austronesian-speaking Formosan populations. PLoS Biol3:e247.
Van Driem G. 1998. Neolithic correlates of ancient Tibeto-Bur-man migrations. In: Blench R, Spriggs M, editors. Archaeol-ogy and language II. London: Routledge. p 67–102.
Van Driem G. 2001. Languages of the Himalayas: an ethnolin-guistic handbook of the Greater Himalayan Region, 2 vols.Leiden, The Netherlands: Brill.
Van Driem G. 2002. Tibeto-Burman phylogeny and prehistory:languages, material culture, and genes. In: Bellwood P, Ren-frew C, editors. Examining the farming/language dispersalhypothesis. Oxford: McDonald Institute for ArchaeologicalResearch, University of Cambridge. p 233–249.
Van Driem G. 2005. Tibeto-Burman vs Indo-Chinese: implica-tions for population geneticists, archeologists and prehistor-ians. In: Sagart L, Blench R, Sanches-Mazas A, editors. Thepeopling of East Asia: putting together archaeology, linguis-tics and genetics. London: Routledge Curzon. p 81–106.
van Oven M, Kayser M. 2009. Updated comprehensive phyloge-netic tree of global human mitochondrial DNA variation. HumMutat 30:e386–e394.
Volodko NV, Starikovskaya EB, Mazunin IO, Eltsov NP, Nai-denko PV, Wallace DC, Sukernik RI. 2008. Mitochondrial ge-nome diversity in arctic Siberians, with particular referenceto the evolutionary history of Beringia and Pleistocenic peo-pling of the Americas. Am J Hum Genet 82:1084–1100.
Wallace DC, Brown MD, Lott MT. 1999. Mitochondrial DNAvariation in human evolution and disease. Gene 238:211–230.
Wen B, Li H, Gao S, Mao X, Gao Y, Li F, Zhang F, He Y, DongY, Zhang Y, Huang W, Jin J, Xiao C, Lu D, Chakraborty R,Su B, Deka R, Jin L. 2005. Genetic structure of Hmong-Mienspeaking populations in East Asia as revealed by mtDNA lin-eages. Mol Biol Evol 22:725–734.
Wen B, Li H, Lu D, Song X, Zhang F, He Y, Li F, Gao Y, Mao X,Zhang L, Qian J, Tan J, Jin J, Huang W, Deka R, Su B,Chakraborty R, Jin L. 2004a. Genetic evidence supportsdemic diffusion of Han culture. Nature 431:302–305.
Wen B, Xie X, Gao S, Li H, Shi H, Song X, Qian T, Xiao C, JinJ, Su B, Lu D, Chakraborty R, Jin L. 2004b. Analyses ofgenetic structure of Tibeto-Burman populations reveals sex-bi-ased admixture in southern Tibeto-Burmans. Am J HumGenet 74:856–865.
Yang Z. 1997. PAML: a program package for phylogenetic analy-sis by maximum likelihood. Comput Appl Biosci 13:555–556.
Yao YG, Kong QP, Bandelt HJ, Kivisild T, Zhang YP. 2002a.Phylogeographic differentiation of mitochondrial DNA in HanChinese. Am J Hum Genet 70:635–651.
Yao YG, Kong QP, Wang CY, Zhu CL, Zhang YP. 2004. Differentmatrilineal contributions to genetic structure of ethnic groupsin the silk road region in china. Mol Biol Evol 21:2265–2280.
Yao YG, Lu XM, Luo HR, Li WH, Zhang YP. 2000. Gene admix-ture in the silk road region of China: evidence from mtDNAand melanocortin 1 receptor polymorphism. Genes Genet Syst75:173–178.
Yao YG, Nie L, Harpending H, Fu YX, Yuan ZG, Zhang YP.2002b. Genetic relationship of Chinese ethnic populationsrevealed by mtDNA sequence diversity. Am J Phys Anthropol118:63–76.
Yao YG, Zhang YP. 2002. Phylogeographic analysis of mtDNAvariation in four ethnic populations from Yunnan Province:new data and a reappraisal. J Hum Genet 47:311–318.
Yuan B, Huang W, Zhang D. 2007. New evidence for humanoccupation of the northern Tibetan Plateau. China during theLate Pleistocene. Chin Sci Bull 52:2675–2679.
Zhang D, Li S. 2002. Optical dating of Tibetan human hand-and footprints: an implication for the palaeoenvironment ofthe last glaciation of the Tibetan plateau. Geophys Res Lett29:1609.
Zhang F, Su B, Zhang YP, Jin L. 2007. Genetic studies ofhuman diversity in East Asia. Philos Trans R Soc Lond B BiolSci 362:987–995.
Zhao M, Kong QP, Wang HW, Peng MS, Xie XD, Wang WZ,Jiayang Duan JG, Cai MC, Zhao SN, Cidanpingcuo, Tu YQ,Wu SF, Yao YG, Bandelt HJ, Zhang YP. 2009. Mitochondrialgenome evidence reveals successful Late Paleolithic settle-ment on the Tibetan Plateau. Proc Natl Acad Sci USA106:21230–21235.
Zheng Y, Gao S, Wang S, Xue B, Liu H, Zeng X. 2003. Simula-tions of LGM climate of East Asia by regional climate model.Sci China Ser D Earth Sci 46:753–764.
569MITOCHONDRIAL DIVERSITY IN TIBET
American Journal of Physical Anthropology