Atmospheric brown clouds reach the Tibetan Plateau by crossing the Himalayas
15
Atmos. Chem. Phys., 15, 6007–6021, 2015 www.atmos-chem-phys.net/15/6007/2015/ doi:10.5194/acp-15-6007-2015 © Author(s) 2015. CC Attribution 3.0 License. Atmospheric brown clouds reach the Tibetan Plateau by crossing the Himalayas Z. L. Lüthi 1 , B. Škerlak 2 , S.-W. Kim 3 , A. Lauer 4 , A. Mues 4 , M. Rupakheti 4 , and S. Kang 5,1 1 Key Laboratory of Tibetan Environment Changes and Land Surface Processes, Institute of Tibetan Plateau Research and CAS Center for Excellence in Tibetan Plateau Earth Sciences, Chinese Academy of Sciences (CAS), Beijing, China 2 ETH Zurich, Institute for Atmospheric and Climate Science, Zürich, Switzerland 3 School of Earth and Environmental Sciences, Seoul National University, Seoul, Republic of Korea 4 IASS Institute for Advanced Sustainability Studies, Potsdam, Germany 5 State Key Laboratory of Cryospheric Science, Cold and Arid Regions Environmental and Engineering Research Institute, Chinese Academy of Sciences (CAS), Lanzhou, China Correspondence to: Z. L. Lüthi ([email protected]) and S. Kang ([email protected]) Received: 20 August 2014 – Published in Atmos. Chem. Phys. Discuss.: 13 November 2014 Revised: 9 March 2015 – Accepted: 12 April 2015 – Published: 1 June 2015 Abstract. The Himalayas and the Tibetan Plateau region (HTP), despite being a remote and sparsely populated area, is regularly exposed to polluted air masses with significant amounts of aerosols including black carbon. These dark, light-absorbing particles are known to exert a great melting potential on mountain cryospheric reservoirs through albedo reduction and radiative forcing. This study combines ground- based and satellite remote sensing data to identify a severe aerosol pollution episode observed simultaneously in central Tibet and on the southern side of the Himalayas during 13– 19 March 2009 (pre-monsoon). Trajectory calculations based on the high-resolution numerical weather prediction model COSMO are used to locate the source regions and study the mechanisms of pollution transport in the complex topogra- phy of the HTP. We detail how polluted air masses from an atmospheric brown cloud (ABC) over South Asia reach the Tibetan Plateau within a few days. Lifting and advection of polluted air masses over the great mountain range is enabled by a combination of synoptic-scale and local meteorologi- cal processes. During the days prior to the event, winds over the Indo-Gangetic Plain (IGP) are generally weak at lower levels, allowing for accumulation of pollutants and thus the formation of ABCs. The subsequent passing of synoptic- scale troughs leads to southwesterly flow in the middle tropo- sphere over northern and central India, carrying the polluted air masses across the Himalayas. As the IGP is known to be a hotspot of ABCs, the cross-Himalayan transport of polluted air masses may have serious implications for the cryosphere in the HTP and impact climate on regional to global scales. Since the current study focuses on one particularly strong pollution episode, quantifying the frequency and magnitude of similar events in a climatological study is required to as- sess the total impact. 1 Introduction The Himalayas and Tibetan Plateau region (HTP), some- times called the “third pole”, contains the largest volume of ice outside the polar regions and impacts radiative bud- gets and climate (Ye and Wu, 1998; Ma et al., 2009). Re- cently, a growing body of research has demonstrated that the atmosphere and cryosphere in the HTP are undergoing ex- traordinary changes, including atmospheric warming (Gau- tam et al., 2010; Thompson et al., 2000; Kang et al., 2010) and in many parts rapid glacier melting (Bolch et al., 2012; Yao et al., 2012). Consequently, the seasonal water avail- ability of important Asian river systems are very likely to be affected (Immerzeel et al., 2010; Kehrwald et al., 2008). In addition to greenhouse gases, increasing ambient concen- trations of black carbon (BC) appear to be an anthropogenic driving force of the observed changes in these remote regions (Lau et al., 2010; Ramanathan and Carmichael, 2008). Light- absorbing aerosol particles such as mineral dust and BC con- Published by Copernicus Publications on behalf of the European Geosciences Union.
-
Upload
iass-potsdam -
Category
Documents
-
view
5 -
download
0
Transcript of Atmospheric brown clouds reach the Tibetan Plateau by crossing the Himalayas

Atmos. Chem. Phys., 15, 6007–6021, 2015
www.atmos-chem-phys.net/15/6007/2015/
doi:10.5194/acp-15-6007-2015
© Author(s) 2015. CC Attribution 3.0 License.
Atmospheric brown clouds reach the Tibetan Plateau by crossing
the Himalayas
Z. L. Lüthi1, B. Škerlak2, S.-W. Kim3, A. Lauer4, A. Mues4, M. Rupakheti4, and S. Kang5,1
1Key Laboratory of Tibetan Environment Changes and Land Surface Processes, Institute of Tibetan Plateau Research and
CAS Center for Excellence in Tibetan Plateau Earth Sciences, Chinese Academy of Sciences (CAS), Beijing, China2ETH Zurich, Institute for Atmospheric and Climate Science, Zürich, Switzerland3School of Earth and Environmental Sciences, Seoul National University, Seoul, Republic of Korea4IASS Institute for Advanced Sustainability Studies, Potsdam, Germany5State Key Laboratory of Cryospheric Science, Cold and Arid Regions Environmental and Engineering Research Institute,
Chinese Academy of Sciences (CAS), Lanzhou, China
Correspondence to: Z. L. Lüthi ([email protected]) and S. Kang ([email protected])
Received: 20 August 2014 – Published in Atmos. Chem. Phys. Discuss.: 13 November 2014
Revised: 9 March 2015 – Accepted: 12 April 2015 – Published: 1 June 2015
Abstract. The Himalayas and the Tibetan Plateau region
(HTP), despite being a remote and sparsely populated area,
is regularly exposed to polluted air masses with significant
amounts of aerosols including black carbon. These dark,
light-absorbing particles are known to exert a great melting
potential on mountain cryospheric reservoirs through albedo
reduction and radiative forcing. This study combines ground-
based and satellite remote sensing data to identify a severe
aerosol pollution episode observed simultaneously in central
Tibet and on the southern side of the Himalayas during 13–
19 March 2009 (pre-monsoon). Trajectory calculations based
on the high-resolution numerical weather prediction model
COSMO are used to locate the source regions and study the
mechanisms of pollution transport in the complex topogra-
phy of the HTP. We detail how polluted air masses from an
atmospheric brown cloud (ABC) over South Asia reach the
Tibetan Plateau within a few days. Lifting and advection of
polluted air masses over the great mountain range is enabled
by a combination of synoptic-scale and local meteorologi-
cal processes. During the days prior to the event, winds over
the Indo-Gangetic Plain (IGP) are generally weak at lower
levels, allowing for accumulation of pollutants and thus the
formation of ABCs. The subsequent passing of synoptic-
scale troughs leads to southwesterly flow in the middle tropo-
sphere over northern and central India, carrying the polluted
air masses across the Himalayas. As the IGP is known to be a
hotspot of ABCs, the cross-Himalayan transport of polluted
air masses may have serious implications for the cryosphere
in the HTP and impact climate on regional to global scales.
Since the current study focuses on one particularly strong
pollution episode, quantifying the frequency and magnitude
of similar events in a climatological study is required to as-
sess the total impact.
1 Introduction
The Himalayas and Tibetan Plateau region (HTP), some-
times called the “third pole”, contains the largest volume
of ice outside the polar regions and impacts radiative bud-
gets and climate (Ye and Wu, 1998; Ma et al., 2009). Re-
cently, a growing body of research has demonstrated that the
atmosphere and cryosphere in the HTP are undergoing ex-
traordinary changes, including atmospheric warming (Gau-
tam et al., 2010; Thompson et al., 2000; Kang et al., 2010)
and in many parts rapid glacier melting (Bolch et al., 2012;
Yao et al., 2012). Consequently, the seasonal water avail-
ability of important Asian river systems are very likely to
be affected (Immerzeel et al., 2010; Kehrwald et al., 2008).
In addition to greenhouse gases, increasing ambient concen-
trations of black carbon (BC) appear to be an anthropogenic
driving force of the observed changes in these remote regions
(Lau et al., 2010; Ramanathan and Carmichael, 2008). Light-
absorbing aerosol particles such as mineral dust and BC con-
Published by Copernicus Publications on behalf of the European Geosciences Union.
6008 Z. L. Lüthi et al.: Atmospheric brown clouds reach the Tibetan Plateau by crossing the Himalayas
tribute to the atmospheric heating and the albedo reduction
once deposited on glaciers. Albeit only contributing a few
percent to the total aerosol mass, BC exerts major radiative
effects (Bond et al., 2013; Jacobson, 2001), especially over
the HTP during pre-monsoon seasons when the solar radia-
tive flux at the surface is very high (Flanner et al., 2007).
Even though background air pollution levels in the HTP
are very low, recurring pre-monsoonal BC peaks have been
documented at high altitudes of the south-facing Himalayan
slopes (e.g., Marinoni et al., 2010, 2013; Decesari et al.,
2010) which are sometimes directly exposed to atmospheric
brown clouds (ABC) (Ramanathan et al., 2007b; Bonasoni
et al., 2010). Brown clouds have been defined as “huge
blankets or layers of haze generally composed of light-
absorbing submicrometer-sized carbonaceous aerosol parti-
cles” (Engling and Gelencser, 2010). Areas that are partic-
ularly affected by brown clouds, so-called ABC hotspots,
are characterized by an anthropogenic aerosol optical depth
(AOD) larger than 0.3 and an absorbing aerosol optical
depth (AAOD) greater than 0.03 for at least one season (Ra-
manathan et al., 2007a). Such conditions are frequently ob-
served on the southern side of the Himalayas, especially
over the Indo-Gangetic Plain (IGP) during the dry months
(November to May). BC transported from this regional
hotspot might thus contribute to the retreat of Himalayan
glaciers (Engling and Gelencser, 2010). Furthermore, recent
studies show BC observations on snow and in ice even fur-
ther north on the Tibetan Plateau (TP) (e.g., Xu et al., 2009;
Qian et al., 2011; Ming et al., 2013; Kaspari et al., 2011)
and springtime episodes with large amounts of pollutants ob-
served on the TP have been reported (Engling et al., 2011;
Xia et al., 2011). As a consequence of such episodes, BC
concentrations on glaciers could significantly increase on the
TP and affect the surface albedo (Zhao et al., 2013).
Recent GEOS-Chem and HYSPLIT model calculations of
BC advection to the TP suggest that the dominant source
regions depend on season and receptor location, but South
and East Asia show the highest overall contribution (Kopacz
et al., 2011; Lu et al., 2012). However, to date, the mecha-
nisms of pollutant transport from the ABC hotspot in the IGP
and from the foothills of the Himalayas to the TP have not
been investigated in detail. One reason for the limited knowl-
edge about aerosol pollution on the HTP is the small number
of long-term in situ observations. In addition, the results from
chemistry transport models still have large uncertainties due
to the complex terrain and the specific meteorological con-
ditions, as do the emission data sets that are used for mod-
eling (Fleming et al., 2012). A widespread hypothesis (see
e.g., Cao et al., 2011) suggests that the high altitude of the
Himalayas acts as a physical barrier inhibiting the transport
of BC across the mountains onto the TP with the exception
of deep river valleys that cut across the mountain range and
provide a pathway for pollutant transport.
The present work addresses the mechanisms and path-
ways of cross-Himalayan pollution transport that occurs over
large areas under specific meteorological conditions. We
base the analysis on a pollution event in March 2009 that
can be identified from ground-based and space-borne remote
sensing data (Sect. 3.1). We present trajectory calculations
and an analysis of the meteorological situation using a re-
gional high-resolution numerical weather prediction model
(Sect. 3.2). The goals of this study are (1) to investigate
whether major pollution episodes identified on the TP set
in synchronously with pollution episodes measured at the
southern face of the Himalayas, (2) to determine if “plumes”
of air pollution observed on the TP originate at the south-
ern side of the Himalayas, (3) to determine whether ABCs
measured at the southern side of the Himalayas can traverse
the high mountain range not only through the major north–
south river valleys but also by being lifted and advected over
the Greater Himalayas and (4) to understand which local and
synoptic-scale meteorological phenomena enable the trans-
port across the Himalayas.
Overall, this study seeks to improve the understanding of
the intensely discussed cross-Himalayan pollution transport
and its effect on cryosphere and climate in the context of rais-
ing anthropogenic emissions in Asia.
2 Methods and data
We describe the data obtained from ground-based and satel-
lite remote sensing measurements in Sect. 2.1 and 2.2, re-
spectively. In Sect. 2.3 we elaborate on the setup of the nu-
merical weather prediction model used for the trajectory cal-
culations.
2.1 Ground-based data
The identification of aerosol pollution events in the HTP is
based on quality-assured data from the Aerosol Robotic Net-
work (AERONET) (Holben et al., 1998). AERONET pro-
vides globally distributed observations of spectral AOD, in-
version products and the amount of precipitable water. Com-
plete descriptions of the sun–sky scanning spectral radiome-
ter instruments, measurement sequences, uncertainties and
cloud screening procedures can be found in the literature
(e.g., Eck et al., 1999; Dubovik and King, 2000; Smirnov
et al., 2000). In this study, only data sets that have the low-
est possible uncertainties in unpolluted regions are used.
We therefore do not include spectral refractive indices and
single-scattering albedo from almucantar scans with AOD
(440 nm) < 0.4 to ensure sufficient sensitivity to aerosol
absorption (Dubovik et al., 2000). The Spectral Deconvo-
lution Algorithm (SDA) version 2, level 2.0, which is ap-
plied in this study, uses optical principles to distinguish
the sub-micron fine-mode AOD (hereafter FMF) from the
super-micron coarse-mode AOD at a standard wavelength of
500 nm (O’Neill, 2003; O’Neill et al., 2008).
Atmos. Chem. Phys., 15, 6007–6021, 2015 www.atmos-chem-phys.net/15/6007/2015/

Z. L. Lüthi et al.: Atmospheric brown clouds reach the Tibetan Plateau by crossing the Himalayas 6009
Figure 1. Topography of the Indian subcontinent and the Tibetan
Plateau in COSMO. Blue triangles indicate the AERONET stations
used in this study and the blue square shows the observed location
of a pollution plume.
Here, FMF is taken as a proxy for polluted air since an-
thropogenic aerosol optical thickness is dominated by fine
aerosols, while natural aerosols contain a substantial fraction
of coarse aerosols. Typically, the radius of these coarse par-
ticles such as mineral dust and sea salt is > 1 µm as they are
being generated mechanically, while combustion-produced
particles including open burning, biofuel use and industrial
pollution are predominately fine-mode particles with a radius
of < 1 µm (Eck et al., 2010).
The two main HTP reference stations used in this study
are Nam Co Monitoring and Research Station for Mul-
tisphere Interactions (Nam Co), situated in central Tibet
(30.77◦ N, 90.96◦ E, 4730 ma.s.l.), and EvK2-CNR Nepal
Climate Observatory-Pyramid (EvK2) located at the south-
ern face of the Greater Himalayas (27.95◦ N, 86.81◦ E,
5050 ma.s.l.). Both stations are shown in Fig. 1. At Nam
Co, over 680 days of level 2 SDA data were available at
the time of this study, covering the years 2006–2012. This
site is a representative background station and currently the
only AERONET site with long-term L2 data sets in cen-
tral Tibet. Nam Co is thus well suited to assess the extent
and effect of long-range transport of pollution to inland Ti-
bet (Xia et al., 2011; Cong, 2009). Data sets from additional
AERONET sites (see Fig. 1) with level 2 SDA data avail-
able for the time period of the most severe pollution event
are used in order to examine the spatial extent of the pol-
luted air mass. We define pollution events as periods with at
least five days showing high FMF (i.e., daily means that lie
above the 75th percentile) simultaneously at Nam Co and at
EvK2. Details about the AERONET stations are presented at
http://aeronet.gsfc.nasa.gov, from which all quality assured
data have been downloaded.
2.2 Satellite data
Cloud-Aerosol Lidar with Orthogonal Polarization
(CALIOP) is a two-wavelength polarization-sensitive
lidar on board the Cloud-Aerosol Lidar and Infrared
Pathfinder Satellite Observation (CALIPSO) satellite. Its
data sets provide high-resolution vertical profiles of aerosols
and clouds at a 16-day revisiting time. Nighttime profiles
show lower background noise, which is an advantage when
analyzing pollution aerosols in remote areas such as the
HTP; as for most lidars, daylight acts as a disturbance to the
signal returns and hence reduces the signal-to-noise ratio,
with the consequence that CALIPSO’s nighttime data have a
superior quality to the daytime data (Marenco et al., 2014).
Detailed information about the instrument, data resolution,
measurement techniques and final products are given by
Winker et al. (2009). For this study, we selected nighttime
profiles upwind of the HTP AERONET stations during the
pollution event in order to analyze the vertical extension of
polluted air masses that are transported towards the HTP.
The products used in this study include the following data
sets: level 1B total (parallel and perpendicular) attenuated
backscatter (km−1 sr−1) shown in color-modulated, altitude–
time images at 532 nm; lidar level 2 Vertical Feature Mask
which distinguishes between clouds and aerosols based on
the Cloud Aerosol Discrimination function; and an aerosol
subtype identification based on the Scene Classification
Algorithm, which is also a level 2 product (Winker et al.,
2009).
AAOD is calculated with the near-UV OMAERUV algo-
rithm for measurements by the Ozone Monitoring Instrument
(OMI) aboard the Aura satellite (Torres et al., 2007). This
AAOD 500 nm data set is used in this study to compare the
light-absorbing aerosol distribution over southern Asia dur-
ing the analyzed pollution event and during a “cleaner” pe-
riod over the HTP and over the IGP.
2.3 Model setup and trajectory calculations
Due to the complex topography of the HTP, a detailed
analysis of the history of polluted air masses requires
high-resolution meteorological fields. To this end, we per-
formed a 7-day simulation with the non-hydrostatic nu-
merical weather prediction model COSMO (Baldauf et al.,
2011) from 00:00 UTC on 10 March 2009 to 00:00 UTC on
17 March 2009. The model was run at a horizontal resolution
of 7 km (0.0625◦, rotated grid) and with 79 vertical levels
from the surface up to 15 hPa. The internal model time step is
40 s and meteorological fields are written to disk every hour.
COSMO is driven by operational analyses from the European
Centre for Medium-Range Weather Forecasts (ECMWF, 0.5◦
horizontal resolution and 91 vertical levels) which are used
to update the boundary conditions every 6 h.
Kinematic backward and forward trajectories were cal-
culated using the Lagrangian Analysis Tool LAGRANTO
www.atmos-chem-phys.net/15/6007/2015/ Atmos. Chem. Phys., 15, 6007–6021, 2015

6010 Z. L. Lüthi et al.: Atmospheric brown clouds reach the Tibetan Plateau by crossing the Himalayas
Figure 2. AERONET AOD time series. Red bars indicate the fine-mode fraction (FMF) of the total aerosol optical depth (AOD) at 500 nm
(black columns). Gray circles indicate black carbon measurements from Multi-Angle Absorption Photometer (MAAP) at EvK2. The pollu-
tion event analyzed in this study (13–19 March 2009) is highlighted in gray and the cleaner period (30 March–5 April 2009) is highlighted
in blue. Blank dates indicate missing data.
(Wernli and Davies, 1997), which applies an iterative Eule-
rian integration scheme (three steps) to the hourly wind fields
from COSMO. Two ensembles of trajectories were started
in this study: the first one (48 h backward and forward) at
21:00 UTC on 13 March 2009 over an aerosol-rich air mass
in Tibet and the second one (72 h backward at 03:00 UTC
on 16 March 2009) over Nam Co station. In both cases, we
started trajectories from a regular grid in longitude and lati-
tude (11 grid points in both directions) at height levels from
the surface to 2000 m above ground in steps of 100 m (121
trajectories for every level). All trajectories are started at
a horizontal distance of less than 60 km from the region of
interest. This ensemble of trajectories is used to quantify the
relative contributions of different pathways and allows to as-
sess the sensitivity to trajectory starting location and height.
Meteorological parameters such as temperature and water va-
por mixing ratio from COSMO output are temporally and
spatially interpolated to the trajectory location.
In addition to the ECMWF analyses, we use the reanalysis
data set ERA-Interim (Dee et al., 2011) for the averages pre-
sented in Sect. 3.1.2. The meteorological fields from ERA-
Interim are interpolated from a spectral resolution of T255 to
a regular grid with 1◦ horizontal resolution and 60 vertical
levels.
3 Results and discussion
In this section, detailed analysis is presented for the pollu-
tion episode during 13–19 March 2009, which was identified
as the most severe event in the data set, showing the high-
est amounts of anthropogenic aerosol at Nam Co in 2009
and simultaneously very high pollution levels at EvK2. This
episode has been identified by analyzing AERONET time se-
ries and comparing them to BC observational data from sites
in the HTP (Sect. 3.1.1) and to OMI AAOD data in the IGP
(Sect. 3.1.2), which allows the assessment of the ABC ex-
tension. A particular pollution feature (“plume”) is identified
from a CALIOP vertical cross section from the IGP to in-
land Tibet (Sect. 3.1.3). The meteorological conditions that
favor the formation of severe air pollution and the long-range
transport onto the HTP are then analyzed in Sect. 3.2. Using
COSMO, 48 h backward and forward trajectories are calcu-
lated to determine whether this plume originated south of the
Himalayas and was carried towards Nam Co (Sect. 3.2.1).
Furthermore, 72 h back-trajectories started near Nam Co on
the day with greatest observed FMF demonstrate how ABCs
can cross the Himalayas (Sect. 3.2.2).
3.1 Case study selection
3.1.1 Measurements in the HTP
Complete 24 months of AERONET L2 measurements at
Nam Co (cf. Fig. 1) are only available for the years 2009
and 2010. These measurements show episodes of significant
fine-mode aerosol contribution to total AOD 500 nm during
the pre-monsoon months. Interestingly, the most remarkable
episodes are found to occur synchronously with high FMF
observations at EvK2. The FMF AOD 500 nm is typically as-
sociated with pollution aerosols that mainly consist of parti-
cles in the sub-micron fraction (cf. Sect. 2.1). Over the course
Atmos. Chem. Phys., 15, 6007–6021, 2015 www.atmos-chem-phys.net/15/6007/2015/

Z. L. Lüthi et al.: Atmospheric brown clouds reach the Tibetan Plateau by crossing the Himalayas 6011
Figure 3. As Fig. 2 but for AERONET stations in the IGP and Thai-
land.
of 2009 and 2010, eight cross-Himalayan pollution events
were identified during the months of March, April and May.
Here, we present details of the most severe pollution episode
that occurred during 13–19 March 2009. This event shows
an average FMF at Nam Co of 0.22 while the means of the
remaining seven events range from 0.03 to 0.07 (see Fig. 2).
The AERONET fine-mode AOD (500 nm) and the total
AOD (500 nm) for Nam Co and EvK2 during March and
April 2009 (Fig. 2) suggest an increase of FMF in mid-March
(gray bar) and a subsequent cleaner period in the end of
March (blue bar). A sudden rise in FMF occurred at EvK2
on 13 March 2009 and 1 day later at Nam Co. The pollu-
tion levels at the two HTP stations stayed elevated until 19
March 2009. No AERONET aerosol data were available for
15 March 2009, which was an overcast day.
The maximum FMF (500 nm) at Nam Co peaked at 0.38
on 16 March 2009. This is consistent with the findings of
Xia et al. (2011) who reported that the total AOD 500 nm
at Nam Co was at its maximum on this day with a value of
0.42, 1 order of magnitude above average conditions at this
station (annual baseline= 0.029). In Sect. 3.2, we present
details of the involved pollution transport pathways based
on high-resolution trajectory calculations started on the days
with very high FMF at Nam Co, i.e., 14 and 16 March 2009.
In order to further support the association of FMF with
pollution aerosols and in particular with absorbing aerosols,
we compare the AERONET data with available in situ BC
concentrations. The BC data were retrieved from Multi-
Angle Absorption Photometer measurements and from filter
analyses at EvK2 and Nam Co, respectively. The circles in
Fig. 2 show a high temporal correlation of BC concentra-
tions with the FMF at EvK2. Elevated concentrations of BC
and FMF at EvK2 were retrieved during the 13–19 March
event and also during the second half of April 2009. It is in-
teresting to note that the BC-to-FMF ratios differ between
these events, possibly caused by varying aerosol type con-
tributions to the polluted air masses reaching the measure-
ment site. Continuous BC measurements at Nam Co sta-
tion are only available since late 2010 (M. Jing, personal
communication, 20 November 2013) but a recent study on
total suspended particulate matter by Zhao et al. (2013)
points out that a sudden increase of carbonaceous aerosols,
i.e., organic carbon and black carbon, also occurred in mid-
March 2009 (not shown). These in situ data suggest that this
pre-monsoon aerosol event consisted of significant pollution
which reached central Tibet not only at elevated levels but
also at the surface.
3.1.2 Measurements in the IGP
A significant build-up of air pollution during the 13–
19 March 2009 event was also observed at stations in the
IGP and in northern Thailand. Measurements of AERONET
sites with available L2 data during the case study are shown
in Fig. 3 (see Fig. 1 for the location of the stations). Inter-
estingly, compared to data from EvK2 shown in Fig. 2, the
AERONET measurements from the IGP show a relatively
large contribution of coarse-mode particles to the total AOD
500 nm, which is mostly associated with wind-blown dust.
This is in line with the results of Prabha et al. (2012), Gau-
tam et al. (2011) and Dey and Di Girolamo (2010), who
have recently reported a larger contribution of dust aerosols
to total AOD over the IGP compared to the southern slope
of the Himalayas, where fine-mode anthropogenic pollution
aerosols play a dominant role during pre-monsoon. Yet, it is
important to bear in mind that a significantly increasing trend
of anthropogenic aerosols has been identified in data of the
AERONET Ångström exponent over India, especially dur-
ing December to March (Babu et al., 2013). This implies an
increase in air pollution over the IGP during the past years.
Overall, the AERONET data sets in Figs. 2 and 3 suggest
the occurrence of an ABC over South Asia that extends as far
as the HTP. This is supported by the significant (nearly total)
FMF contribution to the total AOD 500 nm at EvK2 station.
A direct exposure of the station to ABCs has recently been
analyzed in numerous studies based on comprehensive data
sets from this high-altitude atmospheric monitoring site (e.g.,
www.atmos-chem-phys.net/15/6007/2015/ Atmos. Chem. Phys., 15, 6007–6021, 2015
6012 Z. L. Lüthi et al.: Atmospheric brown clouds reach the Tibetan Plateau by crossing the Himalayas
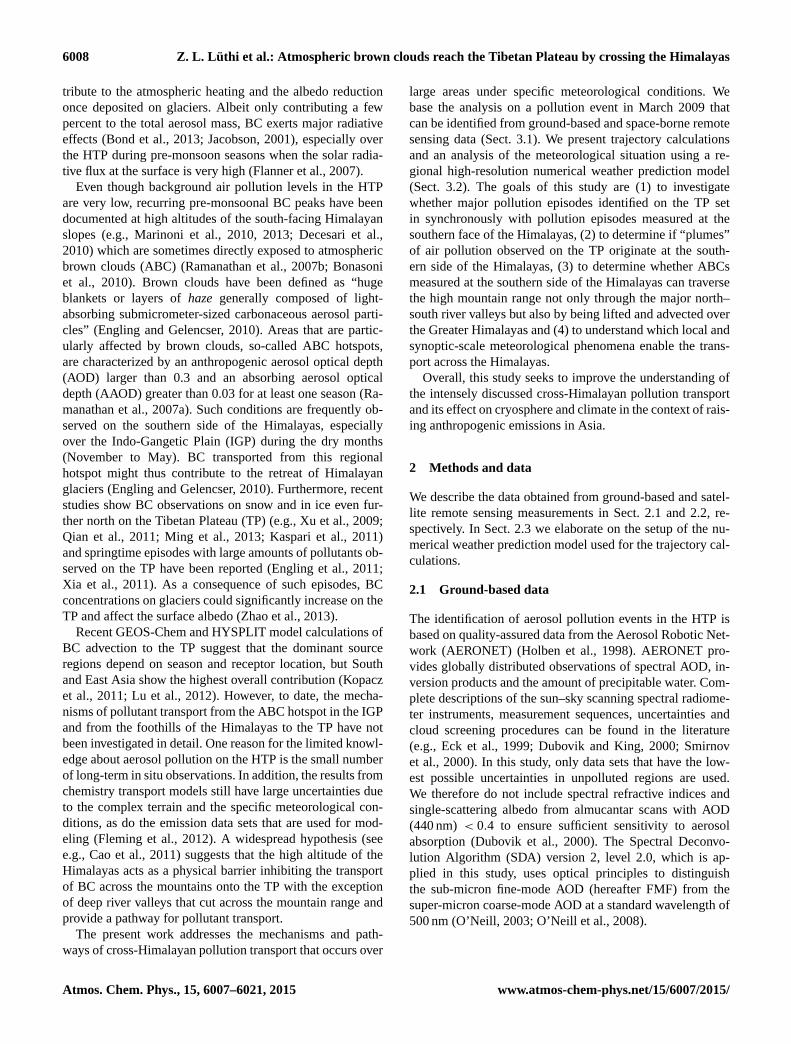
Figure 4. OMI AAOD (500 nm, colored), geopotential height (contours, 250 m spacing) and horizontal wind (reference arrow, 20 ms−1) at
500 hPa from ERA-Interim averaged over (a) the pollution event 13–19 March 2009 and (b) a cleaner 7-day period between 30 March and
5 April 2009 (cf. Fig. 2).
Bonasoni et al., 2010; Decesari et al., 2010; Marinoni et al.,
2013).
The high contribution of absorbing aerosols to the total
AOD during the 13–19 March 2009 pollution event is shown
in Fig. 4a (OMI AAOD 500 nm). For comparison, Fig. 4b
depicts the spatial distribution of AAOD during a “cleaner”
7-day period (30 March to 5 April 2009, cf. Figs. 2 and 3)
in the region surrounding the HTP. The dense haze extend-
ing southwest of the HTP displayed in Fig. 4a suggests the
occurrence of an ABC with a significant amount of absorb-
ing aerosols along the foothills of the Himalayas. The HTP
region, however, appears as a blank area in Fig. 4. This is
due to the fact that the satellite-derived AAOD data are very
limited for the HTP as a consequence of its high surface re-
flectance.
The combination of ground- and space-based remote sens-
ing data suggests the presence of an ABC with AERONET
AOD> 0.3 and OMI AAOD> 0.03 that were observed not
only south of the great mountains or in the Himalayan valleys
but also on the TP.
3.1.3 Air pollution feature on the TP
Several CALIOP transects that were retrieved over the past
years were found to show significant extensions of pollution
plumes “coating” the HTP. This indicates that the polluted
air masses do not only accumulate in the valleys but can also
cover large areas in this usually pristine region.
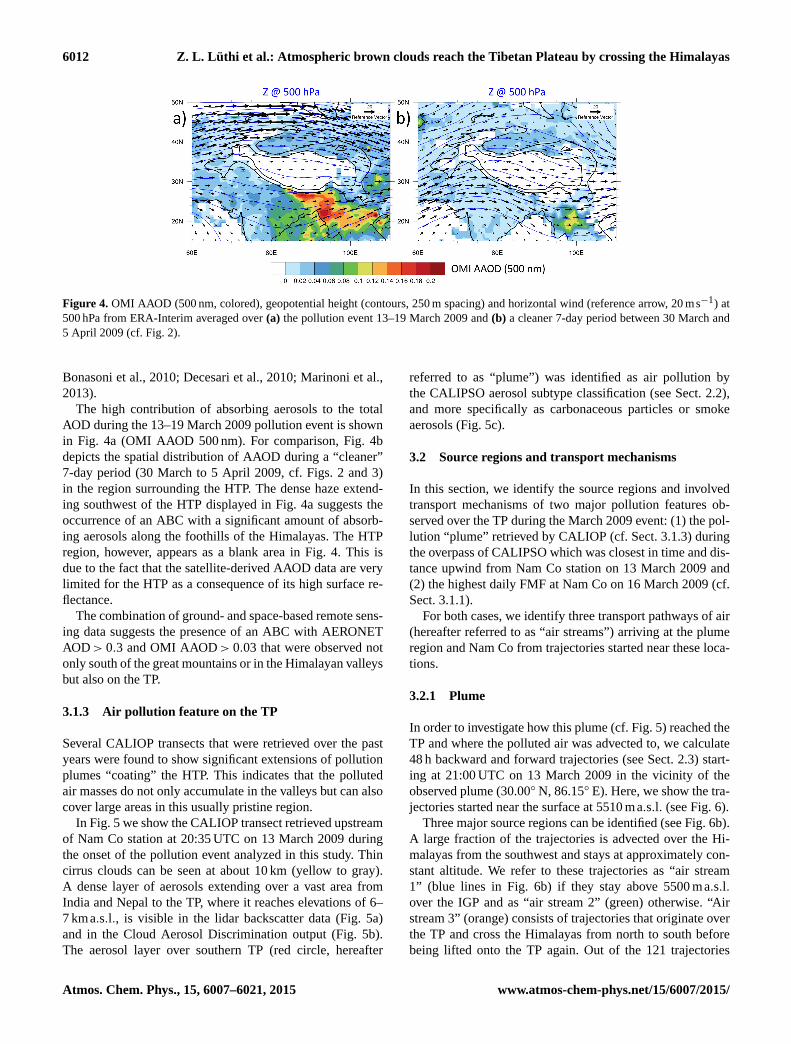
In Fig. 5 we show the CALIOP transect retrieved upstream
of Nam Co station at 20:35 UTC on 13 March 2009 during
the onset of the pollution event analyzed in this study. Thin
cirrus clouds can be seen at about 10 km (yellow to gray).
A dense layer of aerosols extending over a vast area from
India and Nepal to the TP, where it reaches elevations of 6–
7 kma.s.l., is visible in the lidar backscatter data (Fig. 5a)
and in the Cloud Aerosol Discrimination output (Fig. 5b).
The aerosol layer over southern TP (red circle, hereafter
referred to as “plume”) was identified as air pollution by
the CALIPSO aerosol subtype classification (see Sect. 2.2),
and more specifically as carbonaceous particles or smoke
aerosols (Fig. 5c).
3.2 Source regions and transport mechanisms
In this section, we identify the source regions and involved
transport mechanisms of two major pollution features ob-
served over the TP during the March 2009 event: (1) the pol-
lution “plume” retrieved by CALIOP (cf. Sect. 3.1.3) during
the overpass of CALIPSO which was closest in time and dis-
tance upwind from Nam Co station on 13 March 2009 and
(2) the highest daily FMF at Nam Co on 16 March 2009 (cf.
Sect. 3.1.1).
For both cases, we identify three transport pathways of air
(hereafter referred to as “air streams”) arriving at the plume
region and Nam Co from trajectories started near these loca-
tions.
3.2.1 Plume
In order to investigate how this plume (cf. Fig. 5) reached the
TP and where the polluted air was advected to, we calculate
48 h backward and forward trajectories (see Sect. 2.3) start-
ing at 21:00 UTC on 13 March 2009 in the vicinity of the
observed plume (30.00◦ N, 86.15◦ E). Here, we show the tra-
jectories started near the surface at 5510 ma.s.l. (see Fig. 6).
Three major source regions can be identified (see Fig. 6b).
A large fraction of the trajectories is advected over the Hi-
malayas from the southwest and stays at approximately con-
stant altitude. We refer to these trajectories as “air stream
1” (blue lines in Fig. 6b) if they stay above 5500 ma.s.l.
over the IGP and as “air stream 2” (green) otherwise. “Air
stream 3” (orange) consists of trajectories that originate over
the TP and cross the Himalayas from north to south before
being lifted onto the TP again. Out of the 121 trajectories
Atmos. Chem. Phys., 15, 6007–6021, 2015 www.atmos-chem-phys.net/15/6007/2015/
Z. L. Lüthi et al.: Atmospheric brown clouds reach the Tibetan Plateau by crossing the Himalayas 6013
Figure 5. (a) CALIOP vertical profile at 20:30 UTC on
13 March 2009 showing the color-coded total attenuated backscatter
lidar return signal at 532 nm with green, yellow and red indicating
aerosols at low, medium and high concentrations, respectively; (b)
cloud-aerosol output, with 1 clear air, 2 cloud, 3 aerosol, 4 strato-
spheric layer, 5 surface, 6 subsurface and 7 totally attenuated; (c)
aerosol subtype profiles with 1 clean marine, 2 dust, 3 polluted con-
tinental, 4 clean continental, 5 polluted dust and 6 smoke. Red cir-
cles mark the plume over the TP.
started at 5510 ma.s.l., 117 (97 %) fall into one of these three
categories. The three air streams contribute approximately
equally to the air in the vicinity of the observed aerosol plume
with 36, 43 and 38 trajectories in air streams 1, 2 and 3, re-
spectively. Air stream 3 was found to only contribute to near-
surface air at the plume location whereas air streams 1 and 2
also appear in all backward trajectory calculations started at
higher levels (not shown).
The temporal evolution of height, water vapor (Qv), po-
tential temperature (θ ) and equivalent potential temperature
(θe) along the trajectories is shown in Fig. 7. The trajectories
show that air streams 1 and 2 stay roughly at constant alti-
tude (around 5500 ma.s.l.) throughout 12 March. Therefore,
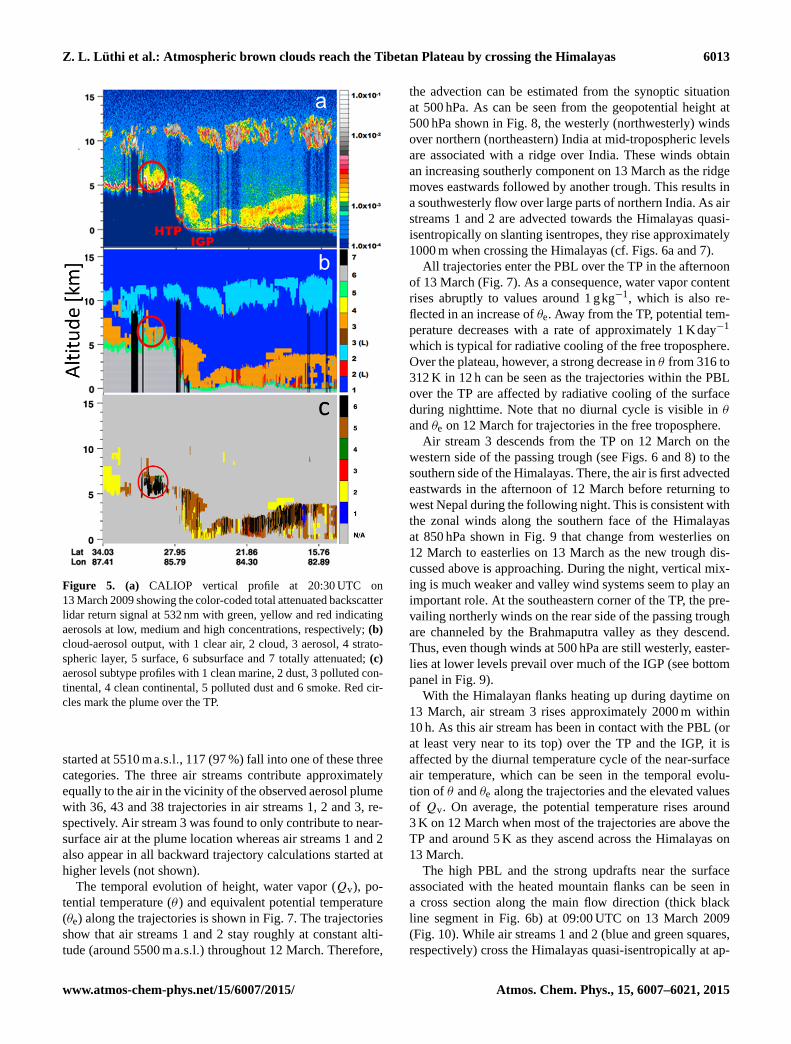
the advection can be estimated from the synoptic situation
at 500 hPa. As can be seen from the geopotential height at
500 hPa shown in Fig. 8, the westerly (northwesterly) winds
over northern (northeastern) India at mid-tropospheric levels
are associated with a ridge over India. These winds obtain
an increasing southerly component on 13 March as the ridge
moves eastwards followed by another trough. This results in
a southwesterly flow over large parts of northern India. As air
streams 1 and 2 are advected towards the Himalayas quasi-
isentropically on slanting isentropes, they rise approximately
1000 m when crossing the Himalayas (cf. Figs. 6a and 7).
All trajectories enter the PBL over the TP in the afternoon
of 13 March (Fig. 7). As a consequence, water vapor content
rises abruptly to values around 1 gkg−1, which is also re-
flected in an increase of θe. Away from the TP, potential tem-
perature decreases with a rate of approximately 1 Kday−1
which is typical for radiative cooling of the free troposphere.
Over the plateau, however, a strong decrease in θ from 316 to
312 K in 12 h can be seen as the trajectories within the PBL
over the TP are affected by radiative cooling of the surface
during nighttime. Note that no diurnal cycle is visible in θ
and θe on 12 March for trajectories in the free troposphere.
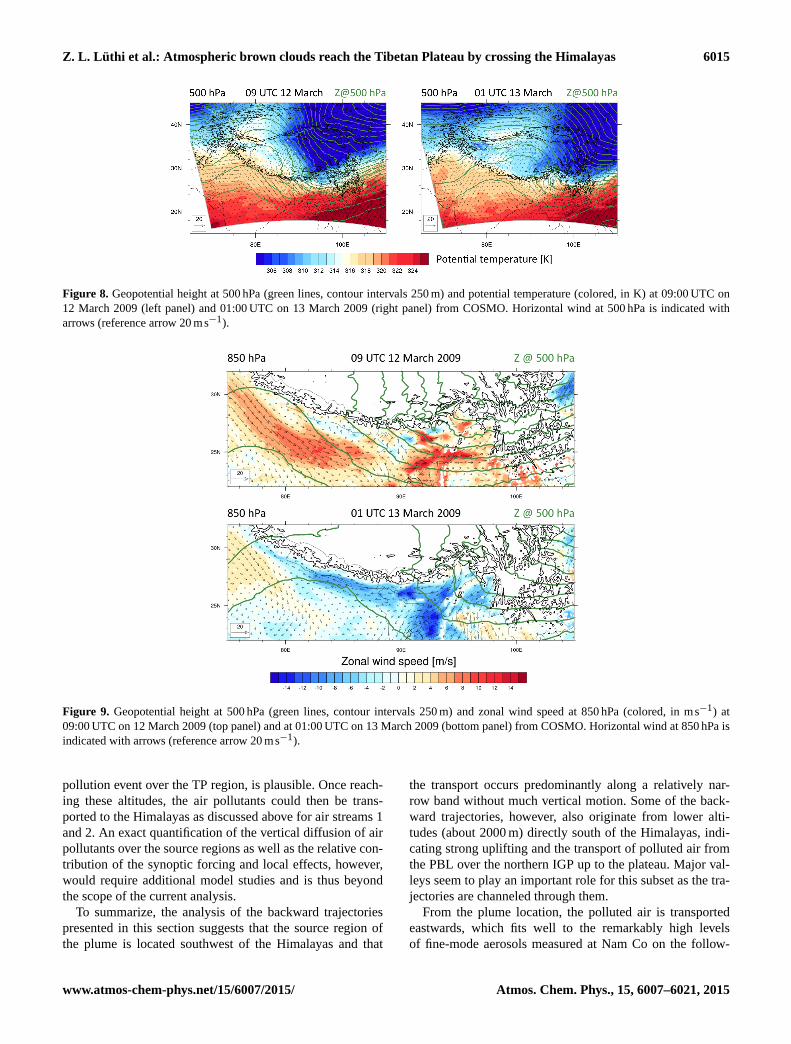
Air stream 3 descends from the TP on 12 March on the
western side of the passing trough (see Figs. 6 and 8) to the
southern side of the Himalayas. There, the air is first advected
eastwards in the afternoon of 12 March before returning to
west Nepal during the following night. This is consistent with
the zonal winds along the southern face of the Himalayas
at 850 hPa shown in Fig. 9 that change from westerlies on
12 March to easterlies on 13 March as the new trough dis-
cussed above is approaching. During the night, vertical mix-
ing is much weaker and valley wind systems seem to play an
important role. At the southeastern corner of the TP, the pre-
vailing northerly winds on the rear side of the passing trough
are channeled by the Brahmaputra valley as they descend.
Thus, even though winds at 500 hPa are still westerly, easter-
lies at lower levels prevail over much of the IGP (see bottom
panel in Fig. 9).
With the Himalayan flanks heating up during daytime on
13 March, air stream 3 rises approximately 2000 m within
10 h. As this air stream has been in contact with the PBL (or
at least very near to its top) over the TP and the IGP, it is
affected by the diurnal temperature cycle of the near-surface
air temperature, which can be seen in the temporal evolu-
tion of θ and θe along the trajectories and the elevated values
of Qv. On average, the potential temperature rises around
3 K on 12 March when most of the trajectories are above the
TP and around 5 K as they ascend across the Himalayas on
13 March.
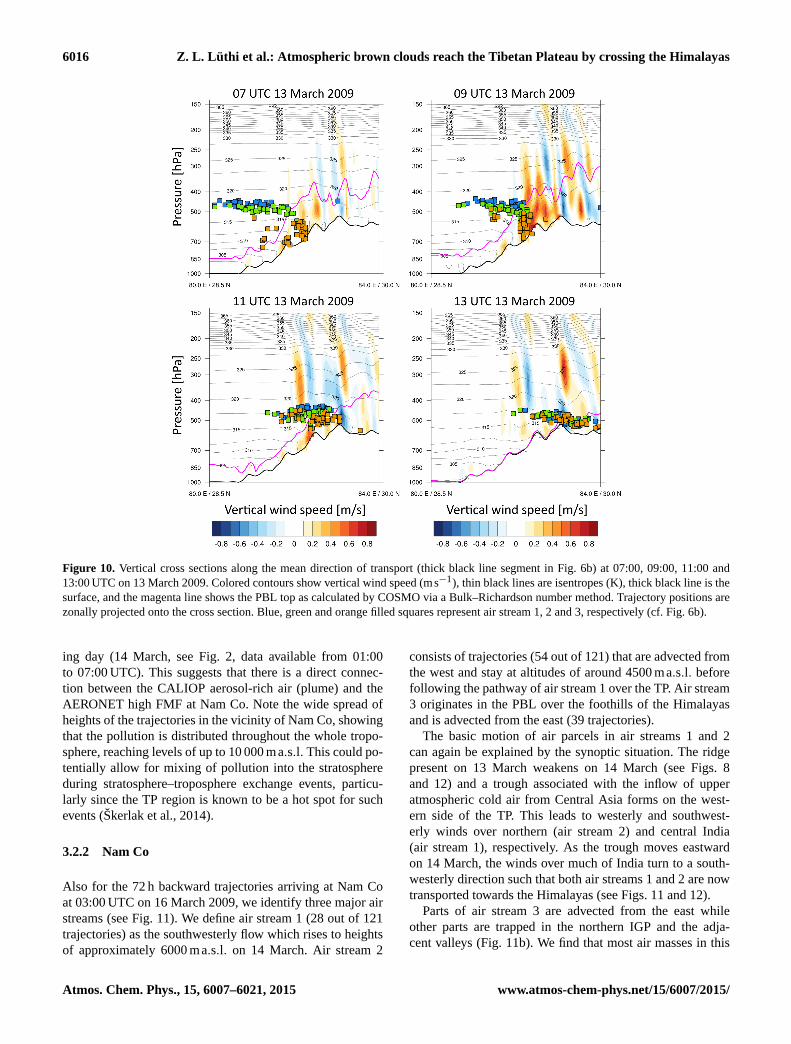
The high PBL and the strong updrafts near the surface
associated with the heated mountain flanks can be seen in
a cross section along the main flow direction (thick black
line segment in Fig. 6b) at 09:00 UTC on 13 March 2009
(Fig. 10). While air streams 1 and 2 (blue and green squares,
respectively) cross the Himalayas quasi-isentropically at ap-
www.atmos-chem-phys.net/15/6007/2015/ Atmos. Chem. Phys., 15, 6007–6021, 2015

6014 Z. L. Lüthi et al.: Atmospheric brown clouds reach the Tibetan Plateau by crossing the Himalayas
Figure 6. Trajectories (48 h backward and forward) started near the observed high aerosol concentrations (“Plume”, square) at 21:00 UTC
on 13 March 2009 from an altitude of 5510 ma.s.l. Black lines show the orography (2000 and 4000 ma.s.l. contour lines), the blue triangle is
Nam Co station and the thick solid black line shows the CALIOP transect. (a) Height along the trajectories, color coded (in ma.s.l.); (b) back-
trajectories classified into three air streams: (1) trajectories above 5500 ma.s.l. over the IGP, (2) below this height and (3) originating over
the TP. The approximate location of air stream 3 is indicated for 12, 24 and 36 h prior to reaching the plume location. The black line segment
indicates the cross section shown in Fig. 10.
Figure 7. Temporal evolution of height, water vapor (Qv), potential temperature (θ ) and equivalent potential temperature (θe) for the 48 h
backward trajectories started at 21:00 UTC on 13 March 2009 near the plume location at 5510 ma.s.l. Blue, green and orange colors show
air streams 1, 2 and 3, respectively (cf. Fig. 6b). Black lines show median values at every time step and the shading indicates 10, 25, 75 and
90 percentiles (total of 121 trajectories). The thin vertical lines indicate 06:00 and 18:00 LT as an approximation for day- and nighttime. The
dashed line in the top left panel shows the median height of the PBL top along air stream 3 (orange).
proximately 500 hPa (approx. 318 K), air stream 3 is lifted
from the PBL before joining the pathway of air streams 1
and 2. The advection (air streams 1 and 2) and lifting (air
stream 3) of air masses from the IGP to the TP is enabled
by the large-scale forcing, i.e., the winds at 500 hPa turning
from northwesterly to southwesterly on 13 March (Fig. 8)
and by local effects such as valley wind systems and updrafts
due to heated mountain flanks.
We further analyzed the mean atmospheric stability calcu-
lated as the vertical gradient in equivalent potential temper-
ature θe in the presumed source region of air streams 1 and
2 in northern India from ERA-Interim reanalysis data (not
shown). This analysis shows that the inflow of warm and
dry air on 11 March associated with the above-mentioned
ridge over northern India resulted in a strong decrease of the
PBL height from about 3 to about 1 km. Furthermore, this
resulted in a relatively low stability above the PBL up to
about 500 hPa. This suggests that vertical spreading of air
pollutants up to heights of 5–6 km particularly on and after
11 March, 2 to 3 days before the beginning of the observed
Atmos. Chem. Phys., 15, 6007–6021, 2015 www.atmos-chem-phys.net/15/6007/2015/
Z. L. Lüthi et al.: Atmospheric brown clouds reach the Tibetan Plateau by crossing the Himalayas 6015
Figure 8. Geopotential height at 500 hPa (green lines, contour intervals 250 m) and potential temperature (colored, in K) at 09:00 UTC on
12 March 2009 (left panel) and 01:00 UTC on 13 March 2009 (right panel) from COSMO. Horizontal wind at 500 hPa is indicated with
arrows (reference arrow 20 ms−1).
Figure 9. Geopotential height at 500 hPa (green lines, contour intervals 250 m) and zonal wind speed at 850 hPa (colored, in ms−1) at
09:00 UTC on 12 March 2009 (top panel) and at 01:00 UTC on 13 March 2009 (bottom panel) from COSMO. Horizontal wind at 850 hPa is
indicated with arrows (reference arrow 20 ms−1).
pollution event over the TP region, is plausible. Once reach-
ing these altitudes, the air pollutants could then be trans-
ported to the Himalayas as discussed above for air streams 1
and 2. An exact quantification of the vertical diffusion of air
pollutants over the source regions as well as the relative con-
tribution of the synoptic forcing and local effects, however,
would require additional model studies and is thus beyond
the scope of the current analysis.
To summarize, the analysis of the backward trajectories
presented in this section suggests that the source region of
the plume is located southwest of the Himalayas and that
the transport occurs predominantly along a relatively nar-
row band without much vertical motion. Some of the back-
ward trajectories, however, also originate from lower alti-
tudes (about 2000 m) directly south of the Himalayas, indi-
cating strong uplifting and the transport of polluted air from
the PBL over the northern IGP up to the plateau. Major val-
leys seem to play an important role for this subset as the tra-
jectories are channeled through them.
From the plume location, the polluted air is transported
eastwards, which fits well to the remarkably high levels
of fine-mode aerosols measured at Nam Co on the follow-
www.atmos-chem-phys.net/15/6007/2015/ Atmos. Chem. Phys., 15, 6007–6021, 2015
6016 Z. L. Lüthi et al.: Atmospheric brown clouds reach the Tibetan Plateau by crossing the Himalayas
Figure 10. Vertical cross sections along the mean direction of transport (thick black line segment in Fig. 6b) at 07:00, 09:00, 11:00 and
13:00 UTC on 13 March 2009. Colored contours show vertical wind speed (ms−1), thin black lines are isentropes (K), thick black line is the
surface, and the magenta line shows the PBL top as calculated by COSMO via a Bulk–Richardson number method. Trajectory positions are
zonally projected onto the cross section. Blue, green and orange filled squares represent air stream 1, 2 and 3, respectively (cf. Fig. 6b).
ing day (14 March, see Fig. 2, data available from 01:00
to 07:00 UTC). This suggests that there is a direct connec-
tion between the CALIOP aerosol-rich air (plume) and the
AERONET high FMF at Nam Co. Note the wide spread of
heights of the trajectories in the vicinity of Nam Co, showing
that the pollution is distributed throughout the whole tropo-
sphere, reaching levels of up to 10 000 ma.s.l. This could po-
tentially allow for mixing of pollution into the stratosphere
during stratosphere–troposphere exchange events, particu-
larly since the TP region is known to be a hot spot for such
events (Škerlak et al., 2014).
3.2.2 Nam Co
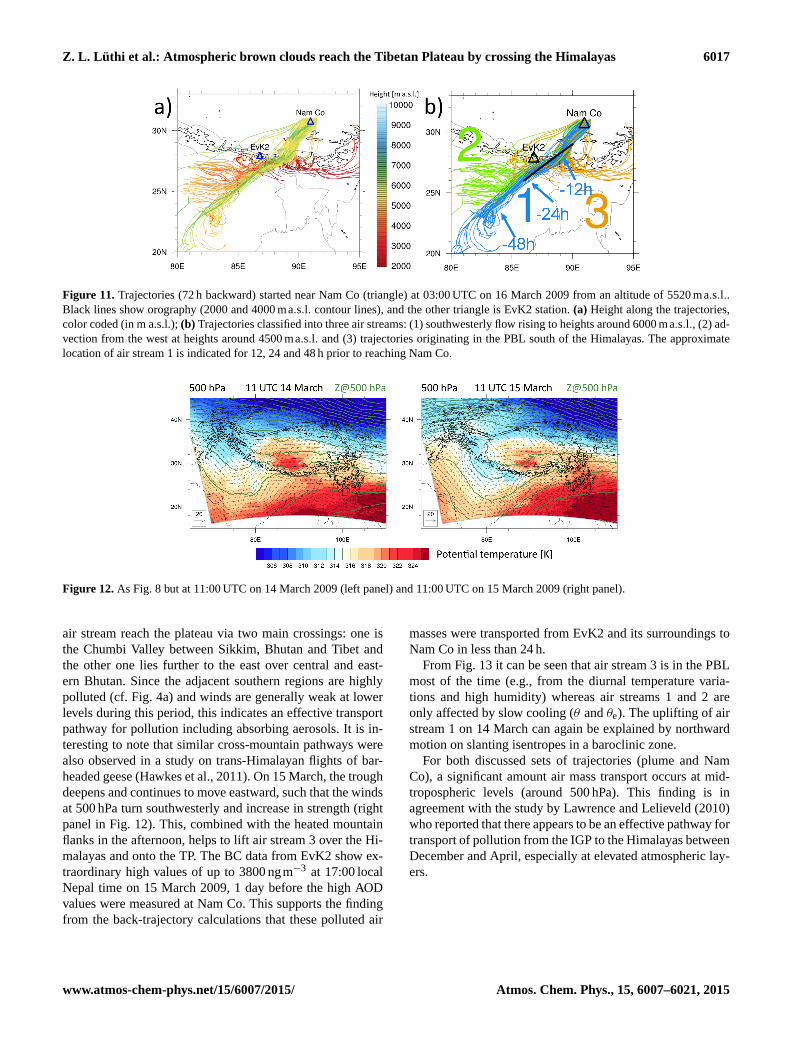
Also for the 72 h backward trajectories arriving at Nam Co
at 03:00 UTC on 16 March 2009, we identify three major air
streams (see Fig. 11). We define air stream 1 (28 out of 121
trajectories) as the southwesterly flow which rises to heights
of approximately 6000 ma.s.l. on 14 March. Air stream 2
consists of trajectories (54 out of 121) that are advected from
the west and stay at altitudes of around 4500 ma.s.l. before
following the pathway of air stream 1 over the TP. Air stream
3 originates in the PBL over the foothills of the Himalayas
and is advected from the east (39 trajectories).
The basic motion of air parcels in air streams 1 and 2
can again be explained by the synoptic situation. The ridge
present on 13 March weakens on 14 March (see Figs. 8
and 12) and a trough associated with the inflow of upper
atmospheric cold air from Central Asia forms on the west-
ern side of the TP. This leads to westerly and southwest-
erly winds over northern (air stream 2) and central India
(air stream 1), respectively. As the trough moves eastward
on 14 March, the winds over much of India turn to a south-
westerly direction such that both air streams 1 and 2 are now
transported towards the Himalayas (see Figs. 11 and 12).
Parts of air stream 3 are advected from the east while
other parts are trapped in the northern IGP and the adja-
cent valleys (Fig. 11b). We find that most air masses in this
Atmos. Chem. Phys., 15, 6007–6021, 2015 www.atmos-chem-phys.net/15/6007/2015/
Z. L. Lüthi et al.: Atmospheric brown clouds reach the Tibetan Plateau by crossing the Himalayas 6017
Figure 11. Trajectories (72 h backward) started near Nam Co (triangle) at 03:00 UTC on 16 March 2009 from an altitude of 5520 ma.s.l..
Black lines show orography (2000 and 4000 ma.s.l. contour lines), and the other triangle is EvK2 station. (a) Height along the trajectories,
color coded (in m a.s.l.); (b) Trajectories classified into three air streams: (1) southwesterly flow rising to heights around 6000 ma.s.l., (2) ad-
vection from the west at heights around 4500 ma.s.l. and (3) trajectories originating in the PBL south of the Himalayas. The approximate
location of air stream 1 is indicated for 12, 24 and 48 h prior to reaching Nam Co.
Figure 12. As Fig. 8 but at 11:00 UTC on 14 March 2009 (left panel) and 11:00 UTC on 15 March 2009 (right panel).
air stream reach the plateau via two main crossings: one is
the Chumbi Valley between Sikkim, Bhutan and Tibet and
the other one lies further to the east over central and east-
ern Bhutan. Since the adjacent southern regions are highly
polluted (cf. Fig. 4a) and winds are generally weak at lower
levels during this period, this indicates an effective transport
pathway for pollution including absorbing aerosols. It is in-
teresting to note that similar cross-mountain pathways were
also observed in a study on trans-Himalayan flights of bar-
headed geese (Hawkes et al., 2011). On 15 March, the trough
deepens and continues to move eastward, such that the winds
at 500 hPa turn southwesterly and increase in strength (right
panel in Fig. 12). This, combined with the heated mountain
flanks in the afternoon, helps to lift air stream 3 over the Hi-
malayas and onto the TP. The BC data from EvK2 show ex-
traordinary high values of up to 3800 ngm−3 at 17:00 local
Nepal time on 15 March 2009, 1 day before the high AOD
values were measured at Nam Co. This supports the finding
from the back-trajectory calculations that these polluted air
masses were transported from EvK2 and its surroundings to
Nam Co in less than 24 h.
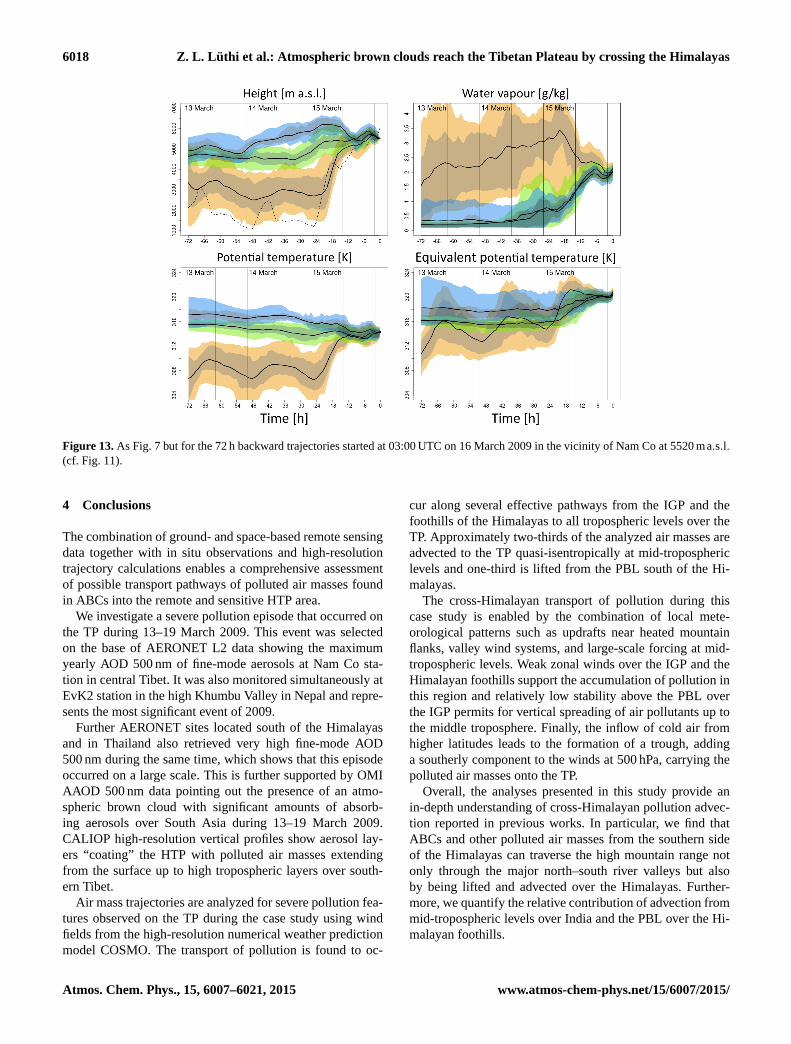
From Fig. 13 it can be seen that air stream 3 is in the PBL
most of the time (e.g., from the diurnal temperature varia-
tions and high humidity) whereas air streams 1 and 2 are
only affected by slow cooling (θ and θe). The uplifting of air
stream 1 on 14 March can again be explained by northward
motion on slanting isentropes in a baroclinic zone.
For both discussed sets of trajectories (plume and Nam
Co), a significant amount air mass transport occurs at mid-
tropospheric levels (around 500 hPa). This finding is in
agreement with the study by Lawrence and Lelieveld (2010)
who reported that there appears to be an effective pathway for
transport of pollution from the IGP to the Himalayas between
December and April, especially at elevated atmospheric lay-
ers.
www.atmos-chem-phys.net/15/6007/2015/ Atmos. Chem. Phys., 15, 6007–6021, 2015
6018 Z. L. Lüthi et al.: Atmospheric brown clouds reach the Tibetan Plateau by crossing the Himalayas
Figure 13. As Fig. 7 but for the 72 h backward trajectories started at 03:00 UTC on 16 March 2009 in the vicinity of Nam Co at 5520 ma.s.l.
(cf. Fig. 11).
4 Conclusions
The combination of ground- and space-based remote sensing
data together with in situ observations and high-resolution
trajectory calculations enables a comprehensive assessment
of possible transport pathways of polluted air masses found
in ABCs into the remote and sensitive HTP area.
We investigate a severe pollution episode that occurred on
the TP during 13–19 March 2009. This event was selected
on the base of AERONET L2 data showing the maximum
yearly AOD 500 nm of fine-mode aerosols at Nam Co sta-
tion in central Tibet. It was also monitored simultaneously at
EvK2 station in the high Khumbu Valley in Nepal and repre-
sents the most significant event of 2009.
Further AERONET sites located south of the Himalayas
and in Thailand also retrieved very high fine-mode AOD
500 nm during the same time, which shows that this episode
occurred on a large scale. This is further supported by OMI
AAOD 500 nm data pointing out the presence of an atmo-
spheric brown cloud with significant amounts of absorb-
ing aerosols over South Asia during 13–19 March 2009.
CALIOP high-resolution vertical profiles show aerosol lay-
ers “coating” the HTP with polluted air masses extending
from the surface up to high tropospheric layers over south-
ern Tibet.
Air mass trajectories are analyzed for severe pollution fea-
tures observed on the TP during the case study using wind
fields from the high-resolution numerical weather prediction
model COSMO. The transport of pollution is found to oc-
cur along several effective pathways from the IGP and the
foothills of the Himalayas to all tropospheric levels over the
TP. Approximately two-thirds of the analyzed air masses are
advected to the TP quasi-isentropically at mid-tropospheric
levels and one-third is lifted from the PBL south of the Hi-
malayas.
The cross-Himalayan transport of pollution during this
case study is enabled by the combination of local mete-
orological patterns such as updrafts near heated mountain
flanks, valley wind systems, and large-scale forcing at mid-
tropospheric levels. Weak zonal winds over the IGP and the
Himalayan foothills support the accumulation of pollution in
this region and relatively low stability above the PBL over
the IGP permits for vertical spreading of air pollutants up to
the middle troposphere. Finally, the inflow of cold air from
higher latitudes leads to the formation of a trough, adding
a southerly component to the winds at 500 hPa, carrying the
polluted air masses onto the TP.
Overall, the analyses presented in this study provide an
in-depth understanding of cross-Himalayan pollution advec-
tion reported in previous works. In particular, we find that
ABCs and other polluted air masses from the southern side
of the Himalayas can traverse the high mountain range not
only through the major north–south river valleys but also
by being lifted and advected over the Himalayas. Further-
more, we quantify the relative contribution of advection from
mid-tropospheric levels over India and the PBL over the Hi-
malayan foothills.
Atmos. Chem. Phys., 15, 6007–6021, 2015 www.atmos-chem-phys.net/15/6007/2015/
Z. L. Lüthi et al.: Atmospheric brown clouds reach the Tibetan Plateau by crossing the Himalayas 6019
The findings from the meteorological analysis could be
used to put the presented case study into a climatological per-
spective, i.e., to quantify the frequency of such events, which
is required to quantify the total impact of cross-Himalayan
pollution transport on the HTP. Such an analysis could in-
clude the quantification of periods with the following char-
acteristics: weak zonal winds at the southern side of the
Himalayas and low stability above the PBL (up to about
500 hPa) over the IGP, as well as the passing of synoptic scale
troughs over the TP followed by a southerly component of
the 500 hPa winds over the IGP.
Moreover, chemical transport models could be used to de-
termine the contribution of specific sources to polluted air
masses that cross the Himalayas. Further observational and
modeling studies are thus urgently needed to identify the
chemical speciation and the spatiotemporal distribution of
pollutants in the HTP in order to investigate their climatic
and environmental implications.
Because of the rapid and effective transport pathway onto
the HTP, a reduction in anthropogenic aerosols such as BC
would not only be beneficial for human health near the emis-
sion sources but it would also help to protect the sensitive
environments on the Tibetan Plateau.
The Supplement related to this article is available online
at doi:10.5194/acp-15-6007-2015-supplement.
Acknowledgements. This study was supported by the National
Natural Science Foundation of China (41121001, 41225002), the
Strategic Priority Research Program (B) of the Chinese Academy
of Sciences (XDB03030504) and the project “A Sustainable
Atmosphere for the Kathmandu Valley” SusKat at the Institute for
Advanced Sustainability Studies (IASS), Germany. Our apprecia-
tion goes to the many colleagues who have shared their interest and
constructive comments for this study, with our special thanks to
A. Miltenberger. We thank B. Holben, G. P Gobbi, S. N. Tripathi,
G. Leeuw, S. Verma, S. Janjai and their staff for establishing and
maintaining the AERONET sites (Nam Co, EVK2-CNR, Kanpur,
Pantnagar, Gual_Pahari, Kolkata and Chiang_Mai_Met_Sta). The
CALIOP and OMI data were available from the Atmospheric
Science Data Center. BC data from the Ev-K2-CNR SHARE
station were generously provided by A. Marinoni. S.-W. Kim was
supported by KMA R&D (CATER 2012–3020) and by the Korean
Ministry of Environment as “Climate Change Correspondence”.
Edited by: Y. Cheng
References
Babu, S. S., Manoj, M., Moorthy, K. K., Gogoi, M. M., Nair, V. S.,
Kompalli, S. K., Satheesh, S., Niranjan, K., Ramagopal, K., and
Bhuyan, P.: Trends in aerosol optical depth over Indian region:
Potential causes and impact indicators, J. Geophys. Res.-Atmos.,
118, 11794–11806, doi:10.1002/2013JD020507, 2013.
Baldauf, M., Seifert, A., Förstner, J., Majewski, D., Raschendor-
fer, M., and Reinhardt, T.: Operational convective-scale nu-
merical weather prediction with the COSMO Model: Descrip-
tion and sensitivities, Mon. Weather Rev., 139, 3887–3905,
doi:10.1175/MWR-D-10-05013.1, 2011.
Bolch, T., Kulkarni, A., Kaab, A., Huggel, C., Paul, F., Cogley, J. G.,
Frey, H., Kargel, J. S., Fujita, K., Scheel, M., Bajracharya, S., and
Stoffel, M.: The state and fate of Himalayan glaciers, Science,
336, 310–314, doi:10.1126/science.1215828, 2012.
Bonasoni, P., Laj, P., Marinoni, A., Sprenger, M., Angelini, F., Ar-
duini, J., Bonafè, U., Calzolari, F., Colombo, T., Decesari, S.,
Di Biagio, C., di Sarra, A. G., Evangelisti, F., Duchi, R., Fac-
chini, MC., Fuzzi, S., Gobbi, G. P., Maione, M., Panday, A., Roc-
cato, F., Sellegri, K., Venzac, H., Verza, GP., Villani, P., Vuiller-
moz, E., and Cristofanelli, P.: Atmospheric Brown Clouds in the
Himalayas: First two years of continuous observations at the
Nepal Climate Observatory-Pyramid (5079 m), Atmos. Chem.
Phys., 10, 7515–7531, doi:10.5194/acp-10-7515-2010, 2010.
Bond, T., Doherty, S., Fahey, D., Forster, P., Berntsen, T., DeAn-
gelo, B., Flanner, M., Ghan, S., Kärcher, B., and Koch, D.:
Bounding the role of black carbon in the climate system: A sci-
entific assessment, J. Geophys. Res.-Atmos., 118, 5380–5552,
doi:10.1002/jgrd.50171, 2013.
Cao, J., Tie, X., Xu, B., Zhao, Z., Zhu, C., Li, G., and Liu, S.:
Measuring and modeling black carbon (BC) contamination
in the SE Tibetan Plateau, J. Atmos. Chem., 67, 45–60,
doi:10.1007/s10874-011-9202-5, 2011.
Cong, Z.: Individual particle analysis of atmospheric aerosols at
Nam Co, Tibetan Plateau, Aerosol Air Qual. Res., 9, 323–331,
doi:10.4209/aaqr.2008.12.0064, 2009.
Decesari, S., Facchini, M. C., Carbone, C., Giulianelli, L., Ri-
naldi, M., Finessi, E., Fuzzi, S., Marinoni, A., Cristofanelli, P.,
Duchi, R., Bonasoni, P., Vuillermoz, E., Cozic, J., Jaffrezo, J. L.,
and Laj, P.: Chemical composition of PM10 and PM1 at the high-
altitude Himalayan station Nepal Climate Observatory-Pyramid
(NCO-P) (5079 m a.s.l.), Atmos. Chem. Phys., 10, 4583–4596,
doi:10.5194/acp-10-4583-2010, 2010.
Dee, D. P., Uppala, S. M., Simmons, A. J., Berrisford, P., Poli, P.,
Kobayashi, S., Andrae, U., Balmaseda, M. A., Balsamo, G.,
Bauer, P., Bechtold, P., Beljaars, A. C. M., van de Berg, L.,
Bidlot, J., Bormann, N., Delsol, C., Dragani, R., Fuentes, M.,
Geer, A. J., Haimberger, L., Healy, S. B., Hersbach, H.,
Holm, E. V., Isaksen, L., Kallberg, P., Köhler, M., Matricardi, M.,
McNally, A. P., Monge-Sanz, B. M., Morcette, J.-J., Park, B.-K.,
Peubey, C., de Rosnay, P., Tavolato, C., Thepaut, J.-N. and Vi-
tart, F.: The ERA-Interim reanalysis: Configuration and perfor-
mance of the data assimilation system, Q. J. Roy. Meteorol. Soc.,
137, 553–597, doi:10.1002/qj.828, 2011.
Dey, S. and Di Girolamo, L.: A climatology of aerosol op-
tical and microphysical properties over the Indian subconti-
nent from 9 years (2000–2008) of Multiangle Imaging Spec-
troradiometer (MISR) data, J. Geophys. Res., 115, D15204,
doi:10.1029/2009jd013395, 2010.
Dubovik, O. and King, M. D.: A flexible inversion algorithm for re-
trieval of aerosol optical properties from Sun and sky radiance
measurements, J. Geophys. Res.-Atmos., 105, 20673–20696,
doi:10.1029/2000JD900282, 2000.
www.atmos-chem-phys.net/15/6007/2015/ Atmos. Chem. Phys., 15, 6007–6021, 2015
6020 Z. L. Lüthi et al.: Atmospheric brown clouds reach the Tibetan Plateau by crossing the Himalayas
Dubovik, O., Smirnov, A., Holben, B., King, M., Kaufman, Y.,
Eck, T., and Slutsker, I.: Accuracy assessments of aerosol optical
properties retrieved from Aerosol Robotic Network (AERONET)
Sun and sky radiance measurements, J. Geophys. Res.-Atmos.,
105, 9791–9806, doi:10.1029/2000JD900040, 2000.
Eck, T. F., Holben, B. N., Reid, J. S., Dubovik, O., Smirnov, A.,
O’Neill, N. T., Slutsker, I., and Kinne, S.: Wavelength depen-
dence of the optical depth of biomass burning, urban, and desert
dust aerosols, J. Geophys. Res.-Atmos., 104, 31333–31349,
doi:10.1029/1999jd900923, 1999.
Eck, T., Holben, B., Sinyuk, A., Pinker, R., Goloub, P., Chen, H.,
Chatenet, B., Li, Z., Singh, R., and Tripathi, S.: Climato-
logical aspects of the optical properties of fine/coarse mode
aerosol mixtures, J. Geophys. Res.-Atmos., 115, D19205,
doi:10.1029/2010JD014002, 2010.
Engling, G. and Gelencser, A.: Atmospheric brown clouds: From
local air pollution to climate change, Elements, 6, 223–228,
doi:10.2113/gselements.6.4.223, 2010.
Engling, G., Zhang, Y.-N., Chan, C.-Y., Sang, X.-F., Lin, M.,
Ho, K.-F., Li, Y.-S., Lin, C.-Y., and Lee, J. J.: Characteriza-
tion and sources of aerosol particles over the southeastern Ti-
betan Plateau during the Southeast Asia biomass-burning season,
Tellus B, 63, 117–128, doi:10.1111/j.1600-0889.2010.00512.x,
2011.
Flanner, M. G., Zender, C. S., Randerson, J. T., and
Rasch, P. J.: Present-day climate forcing and response from
black carbon in snow, J. Geophys. Res., 112, D11202,
doi:10.1029/2006JD008003, 2007.
Fleming, Z. L., Monks, P. S., and Manning, A. J.: Review:
Untangling the influence of air-mass history in interpreting
observed atmospheric composition, Atmos. Res., 104, 1–39,
doi:10.1016/j.atmosres.2011.09.009, 2012.
Gautam, R., Hsu, N. C., and Lau, K. M.: Premonsoon aerosol char-
acterization and radiative effects over the Indo-Gangetic Plains:
Implications for regional climate warming, J. Geophys. Res.,
115, D17208, doi:10.1029/2010jd013819, 2010.
Gautam, R., Hsu, N. C., Tsay, S. C., Lau, K. M., Holben, B., Bell, S.,
Smirnov, A., Li, C., Hansell, R., Ji, Q., Payra, S., Aryal, D.,
Kayastha, R., and Kim, K. M.: Accumulation of aerosols over
the Indo-Gangetic plains and southern slopes of the Himalayas:
Distribution, properties and radiative effects during the 2009
pre-monsoon season, Atmos. Chem. Phys., 11, 12841–12863,
doi:10.5194/acp-11-12841-2011, 2011.
Hawkes, L. A., Balachandran, S., Batbayar, N., Butler, P. J., Frap-
pell, P. B., Milsom, W. K., Tseveenmyadag, N., Newman, S. H.,
Scott, G. R., Sathiyaselvam, P., Takekawa, J. Y., Wikelski, M.,
and Bishop, C. M.: The trans-Himalayan flights of bar-headed
geese (Anser indicus), P. Natl. Acad. Sci. USA, 108, 9516–9519,
doi:10.1073/pnas.1017295108, 2011.
Holben, B., Eck, T., Slutsker, I., Tanre, D., Buis, J., Setzer, A.,
Vermote, E., Reagan, J., Kaufman, Y., and Nakajima, T.:
AERONET – A federated instrument network and data archive
for aerosol characterization, Remote Sens. Environ., 66, 1–16,
doi:10.1016/S0034-4257(98)00031-5, 1998.
Immerzeel, W. W., van Beek, L. P., and Bierkens, M. F.: Climate
change will affect the Asian water towers, Science, 328, 1382–
1385, doi:10.1126/science.1183188, 2010.
Jacobson, M. Z.: Strong radiative heating due to the mixing state
of black carbon in atmospheric aerosols, Nature, 409, 695–697,
doi:10.1038/35055518, 2001.
Kang, S., Xu, Y., You, Q., Flügel, W.-A., Pepin, N., and Yao, T.:
Review of climate and cryospheric change in the Tibetan
Plateau, Environ. Res. Lett., 5, 015101, doi:10.1088/1748-
9326/5/1/015101, 2010.
Kaspari, S. D., Schwikowski, M., Gysel, M., Flanner, M. G.,
Kang, S., Hou, S., and Mayewski, P. A.: Recent increase
in black carbon concentrations from a Mt. Everest ice core
spanning 1860–2000 AD, Geophys. Res. Lett., 38, L04703,
doi:10.1029/2010gl046096, 2011.
Kehrwald, N. M., Thompson, L. G., Tandong, Y., Mosley-
Thompson, E., Schotterer, U., Alfimov, V., Beer, J., Eiken-
berg, J., and Davis, M. E.: Mass loss on Himalayan glacier
endangers water resources, Geophys. Res. Lett., 35, L22503,
doi:10.1029/2008GL035556, 2008.
Kopacz, M., Mauzerall, D. L., Wang, J., Leibensperger, E. M.,
Henze, D. K., and Singh, K.: Origin and radiative forcing of
black carbon transported to the Himalayas and Tibetan Plateau,
Atmos. Chem. Phys., 11, 2837–2852, doi:10.5194/acp-11-2837-
2011, 2011.
Lau, W. K. M., Kim, M.-K., Kim, K.-M., and Lee, W.-S.: Enhanced
surface warming and accelerated snow melt in the Himalayas
and Tibetan Plateau induced by absorbing aerosols, Environ. Res.
Lett., 5, 025204, doi:10.1088/1748-9326/5/2/025204, 2010.
Lawrence, M. G. and Lelieveld, J.: Atmospheric pollutant outflow
from southern Asia: A review, Atmos. Chem. Phys., 10, 11017–
11096, doi:10.5194/acp-10-11017-2010, 2010.
Lu, Z., Streets, D. G., Zhang, Q., and Wang, S.: A novel back-
trajectory analysis of the origin of black carbon transported to
the Himalayas and Tibetan Plateau during 1996–2010, Geophys.
Res. Lett., 39, L01809, doi:10.1029/2011gl049903, 2012.
Ma, Y., Wang, Y., Wu, R., Hu, Z., Yang, K., Li, M., Ma, W.,
Zhong, L., Sun, F., Chen, X., Zhu, Z., Wang, S., and Ishikawa, H.:
Recent advances on the study of atmosphere-land interaction ob-
servations on the Tibetan Plateau, Hydrol. Earth Syst. Sci., 13,
1103–1111, doi:10.5194/hess-13-1103-2009, 2009.
Marenco, F., Amiridis, V., Marinou, E., Tsekeri, A., and Pelon, J.:
Airborne verification of CALIPSO products over the Amazon:
a case study of daytime observations in a complex atmospheric
scene, Atmos. Chem. Phys., 14, 11871–11881, doi:10.5194/acp-
14-11871-2014, 2014.
Marinoni, A., Cristofanelli, P., Laj, P., Duchi, R., Calzolari, F.,
Decesari, S., Sellegri, K., Vuillermoz, E., Verza, G. P., Villani, P.,
and Bonasoni, P.: Aerosol mass and black carbon concentrations,
a two year record at NCO-P (5079 m, Southern Himalayas), At-
mos. Chem. Phys., 10, 8551–8562, doi:10.5194/acp-10-8551-
2010, 2010.
Marinoni, A., Cristofanelli, P., Laj, P., Duchi, R., Putero, D., Cal-
zolari, F., Landi, T. C., Vuillermoz, E., Maione, M., and Bona-
soni, P.: High black carbon and ozone concentrations during pol-
lution transport in the Himalayas: Five years of continuous ob-
servations at NCO-P global GAW station, J. Environ. Sci.-China,
25, 1618–1625, doi:10.1016/S1001-0742(12)60242-3, 2013.
Ming, J., Wang, P., Zhao, S., and Chen, P.: Disturbance of
light-absorbing aerosols on the albedo in a winter snow-
pack of Central Tibet, J. Environ. Sci.-China, 25, 1601–1607,
doi:10.1016/s1001-0742(12)60220-4, 2013.
Atmos. Chem. Phys., 15, 6007–6021, 2015 www.atmos-chem-phys.net/15/6007/2015/
Z. L. Lüthi et al.: Atmospheric brown clouds reach the Tibetan Plateau by crossing the Himalayas 6021
O’Neill, N. T.: Spectral discrimination of coarse and
fine mode optical depth, J. Geophys. Res., 108, 4559,
doi:10.1029/2002jd002975, 2003.
O’Neill, N. T., Pancrati, O., Baibakov, K., Eloranta, E., Batche-
lor, R. L., Freemantle, J., McArthur, L. J. B., Strong, K., and
Lindenmaier, R.: Occurrence of weak, submicron, tropospheric
aerosol events at high Arctic latitudes, Geophys. Res. Lett., 35,
L14814, doi:10.1029/2008GL033733, 2008.
Prabha, T. V., Karipot, A., Axisa, D., Kumari, B. P., Mahesku-
mar, R. S., Konwar, M., Kulkarni, J. R., and Goswami, B. N.:
Scale interactions near the foothills of Himalayas dur-
ing CAIPEEX, J. Geophys. Res.-Atmos., 117, D10203,
doi:10.1029/2011jd016754, 2012.
Qian, Y., Flanner, M. G., Leung, L. R., and Wang, W.: Sensitiv-
ity studies on the impacts of Tibetan Plateau snowpack pollu-
tion on the Asian hydrological cycle and monsoon climate, At-
mos. Chem. Phys., 11, 1929–1948, doi:10.5194/acp-11-1929-
2011, 2011.
Ramanathan, V. and Carmichael, G.: Global and regional cli-
mate changes due to black carbon, Nat. Geosci., 1, 221–227,
doi:10.1038/ngeo156, 2008.
Ramanathan, V., Li, F., Ramana, M. V., Praveen, P. S., Kim, D.,
Corrigan, C. E., Nguyen, H., Stone, E. A., Schauer, J. J.,
Carmichael, G. R., Adhikary, B., and Yoon, S. C.: Atmospheric
brown clouds: Hemispherical and regional variations in long-
range transport, absorption, and radiative forcing, J. Geophys.
Res., 112, D22S21, doi:10.1029/2006jd008124, 2007a.
Ramanathan, V., Ramana, M. V., Roberts, G., Kim, D., Corri-
gan, C., Chung, C., and Winker, D.: Warming trends in Asia am-
plified by brown cloud solar absorption, Nature, 448, 575–578,
doi:10.1038/nature06019, 2007b.
Škerlak, B., Sprenger, M., and Wernli, H.: A global climatology
of stratosphere–troposphere exchange using the ERA-Interim
data set from 1979 to 2011, Atmos. Chem. Phys., 14, 913–937,
doi:10.5194/acp-14-913-2014, 2014.
Smirnov, A., Holben, B., Eck, T., Dubovik, O., and Slutsker, I.:
Cloud-screening and quality control algorithms for the
AERONET database, Remote Sens. Environ., 73, 337–349,
doi:10.1016/S0034-4257(00)00109-7, 2000.
Thompson, L. G., Yao, T., Mosley-Thompson, E., Davis, M., Hen-
derson, K., and Lin, P.-N.: A high-resolution millennial record
of the South Asian monsoon from Himalayan ice cores, Science,
289, 1916–1919, doi:10.1126/science.289.5486.1916, 2000.
Torres, O., Tanskanen, A., Veihelmann, B., Ahn, C., Braak, R.,
Bhartia, P. K., Veefkind, P., and Levelt, P.: Aerosols and sur-
face UV products from Ozone Monitoring Instrument obser-
vations: An overview, J. Geophys. Res.-Atmos., 112, D24S47,
doi:10.1029/2007JD008809, 2007.
Wernli, B. H. and Davies, H. C.: A Lagrangian-based anal-
ysis of extratropical cyclones, I: The method and some
applications, Q. J. Roy. Meteorol. Soc., 123, 467–489,
doi:10.1002/qj.49712353811, 1997.
Winker, D. M., Vaughan, M. A., Omar, A., Hu, Y., Pow-
ell, K. A., Liu, Z., Hunt, W. H., and Young, S. A.:
Overview of the CALIPSO mission and CALIOP data pro-
cessing algorithms, J. Atmos. Ocean. Tech., 26, 2310–2323,
doi:10.1175/2009JTECHA1281.1, 2009.
Xia, X., Zong, X., Cong, Z., Chen, H., Kang, S., and Wang, P.:
Baseline continental aerosol over the central Tibetan plateau and
a case study of aerosol transport from South Asia, Atmos. Envi-
ron., 45, 7370–7378, doi:10.1016/j.atmosenv.2011.07.067, 2011.
Xu, B., Cao, J., Hansen, J., Yao, T., Joswia, D. R., Wang, N., Wu, G.,
Wang, M., Zhao, H., Yang, W., Liu, X., and He, J.: Black soot
and the survival of Tibetan glaciers, P. Natl. Acad. Sci. USA,
106, 22114–22118, doi:10.1073/pnas.0910444106, 2009.
Yao, T., Thompson, L., Yang, W., Yu, W., Gao, Y., Guo, X.,
Yang, X., Duan, K., Zhao, H., and Xu, B.: Different glacier status
with atmospheric circulations in Tibetan Plateau and surround-
ings, Nat. Clim. Change, 2, 663–667, doi:10.1038/nclimate1580,
2012.
Ye, D.-Z. and Wu, G.-X.: The role of the heat source of the Tibetan
Plateau in the general circulation, Meteorol. Atmos. Phys., 67,
181–198, 1998.
Zhao, S., Ming, J., Sun, J., and Xiao, C.: Observation of carbona-
ceous aerosols during 2006–2009 in Nyainqentanglha Mountains
and the implications for glaciers, Environ. Sci. Pollut. Res. Int.,
20, 5827–5838, doi:10.1007/s11356-013-1548-6, 2013.
www.atmos-chem-phys.net/15/6007/2015/ Atmos. Chem. Phys., 15, 6007–6021, 2015