Recent Advances and Applications of External Cavity-QCLs ...
15
photonics hv Article Recent Advances and Applications of External Cavity-QCLs towards Hyperspectral Imaging for Standoff Detection and Real-Time Spectroscopic Sensing of Chemicals Ralf Ostendorf 1, *, Lorenz Butschek 1 , Stefan Hugger 1 , Frank Fuchs 1 , Quankui Yang 1 , Jan Jarvis 1 , Christian Schilling 1 , Marcel Rattunde 1 , André Merten 2 , Jan Grahmann 2 , Dusan Boskovic 3 , Thorsten Tybussek 4 , Klaus Rieblinger 4 and Joachim Wagner 1 1 Fraunhofer Institute for Applied Solid State Physics IAF, Tullastrasse 72, 79108 Freiburg, Germany; [email protected] (L.B.); [email protected] (S.H.); [email protected] (F.F.); [email protected] (Q.Y.); [email protected] (J.J.); [email protected] (C.S.); [email protected] (M.R.); [email protected] (J.W.) 2 Fraunhofer Institute for Photonic Microsystems IPMS, Maria-Reiche-Strasse 2, 01109 Dresden, Germany; [email protected] (A.M.); [email protected] (J.G.) 3 Fraunhofer Institute for Chemical Technology ICT, Joseph-von-Fraunhofer Str. 7, 76327 Pfinztal, Germany; [email protected] 4 Fraunhofer Institute for Process Engineering and Packaging IVV, Giggenhauser Straße 35, 85354 Freising, Germany; [email protected] (T.T.); [email protected] (K.R.) * Correspondence: [email protected]; Tel.: +49-761-5159-638 Received: 31 March 2016; Accepted: 30 April 2016; Published: 13 May 2016 Abstract: External-cavity quantum cascade lasers (EC-QCL) are now established as versatile wavelength-tunable light sources for analytical spectroscopy in the mid-infrared (MIR) spectral range. We report on the realization of rapid broadband spectral tuning with kHz scan rates by combining a QCL chip with a broad gain spectrum and a resonantly driven micro-opto-electro-mechanical (MOEMS) scanner with an integrated diffraction grating in Littrow configuration. The capability for real-time spectroscopic sensing based on MOEMS EC-QCLs is demonstrated by transmission measurements performed on polystyrene reference absorber sheets, as well as on hazardous substances, such as explosives. Furthermore, different applications for the EC-QCL technology in spectroscopic sensing are presented. These include the fields of process analysis with on- or even inline capability and imaging backscattering spectroscopy for contactless identification of solid and liquid contaminations on surfaces. Recent progress in trace detection of explosives and related precursors in relevant environments as well as advances in food quality monitoring by discriminating fresh and mold contaminated peanuts based on their MIR backscattering spectrum is shown. Keywords: quantum cascade lasers; external cavity quantum cascade lasers; MOEMS grating; quantum cascade laser based spectroscopy; imaging laser backscattering spectroscopy; inline spectroscopic analysis 1. Introduction In this paper we report on recent advances in external-cavity quantum cascade laser (EC-QCL) technology at our institute [1,2], focusing on real-time applications for broadband mid-infrared (MIR) spectroscopy. The MIR region is ideally suited for quantum cascade lasers (QCLs), covering a wavelength range from 3.3 μm to around 12 μm, using just a single semiconductor material combination, namely GaInAs/AlInAs-on-InP [3–5]. EC-QCLs covering the MIR spectral range have Photonics 2016, 3, 28; doi:10.3390/photonics3020028 www.mdpi.com/journal/photonics
-
Upload
khangminh22 -
Category
Documents
-
view
2 -
download
0
Transcript of Recent Advances and Applications of External Cavity-QCLs ...
photonicshv
Article
Recent Advances and Applications of ExternalCavity-QCLs towards Hyperspectral Imaging forStandoff Detection and Real-Time SpectroscopicSensing of Chemicals
Ralf Ostendorf 1,*, Lorenz Butschek 1, Stefan Hugger 1, Frank Fuchs 1, Quankui Yang 1,Jan Jarvis 1, Christian Schilling 1, Marcel Rattunde 1, André Merten 2, Jan Grahmann 2,Dusan Boskovic 3, Thorsten Tybussek 4, Klaus Rieblinger 4 and Joachim Wagner 1
1 Fraunhofer Institute for Applied Solid State Physics IAF, Tullastrasse 72, 79108 Freiburg, Germany;[email protected] (L.B.); [email protected] (S.H.);[email protected] (F.F.); [email protected] (Q.Y.);[email protected] (J.J.); [email protected] (C.S.);[email protected] (M.R.); [email protected] (J.W.)
2 Fraunhofer Institute for Photonic Microsystems IPMS, Maria-Reiche-Strasse 2, 01109 Dresden, Germany;[email protected] (A.M.); [email protected] (J.G.)
3 Fraunhofer Institute for Chemical Technology ICT, Joseph-von-Fraunhofer Str. 7, 76327 Pfinztal, Germany;[email protected]
4 Fraunhofer Institute for Process Engineering and Packaging IVV, Giggenhauser Straße 35, 85354 Freising,Germany; [email protected] (T.T.); [email protected] (K.R.)
* Correspondence: [email protected]; Tel.: +49-761-5159-638
Received: 31 March 2016; Accepted: 30 April 2016; Published: 13 May 2016
Abstract: External-cavity quantum cascade lasers (EC-QCL) are now established as versatilewavelength-tunable light sources for analytical spectroscopy in the mid-infrared (MIR) spectral range.We report on the realization of rapid broadband spectral tuning with kHz scan rates by combininga QCL chip with a broad gain spectrum and a resonantly driven micro-opto-electro-mechanical(MOEMS) scanner with an integrated diffraction grating in Littrow configuration. The capabilityfor real-time spectroscopic sensing based on MOEMS EC-QCLs is demonstrated by transmissionmeasurements performed on polystyrene reference absorber sheets, as well as on hazardoussubstances, such as explosives. Furthermore, different applications for the EC-QCL technologyin spectroscopic sensing are presented. These include the fields of process analysis with on- oreven inline capability and imaging backscattering spectroscopy for contactless identification of solidand liquid contaminations on surfaces. Recent progress in trace detection of explosives and relatedprecursors in relevant environments as well as advances in food quality monitoring by discriminatingfresh and mold contaminated peanuts based on their MIR backscattering spectrum is shown.
Keywords: quantum cascade lasers; external cavity quantum cascade lasers; MOEMS grating;quantum cascade laser based spectroscopy; imaging laser backscattering spectroscopy; inlinespectroscopic analysis
1. Introduction
In this paper we report on recent advances in external-cavity quantum cascade laser (EC-QCL)technology at our institute [1,2], focusing on real-time applications for broadband mid-infrared(MIR) spectroscopy. The MIR region is ideally suited for quantum cascade lasers (QCLs), coveringa wavelength range from 3.3 µm to around 12 µm, using just a single semiconductor materialcombination, namely GaInAs/AlInAs-on-InP [3–5]. EC-QCLs covering the MIR spectral range have
Photonics 2016, 3, 28; doi:10.3390/photonics3020028 www.mdpi.com/journal/photonics
Photonics 2016, 3, 28 2 of 15
been shown to be versatile wavelength-tunable light sources for analytical spectroscopy [6–9]. Using amultiple-stage hetero-cascading active region design, the spectral gain width of a QCL chip can beengineered to yield widely tunable EC-QCLs with a maximum wavelength coverage from, e.g., 7.6 µm(1315 cm´1) to 11.4 µm (772 cm´1) [10]. This equals a relative wavelength coverage of ∆λ/λ « 40%.An even wider wavelength span of 1000 cm´1 can be covered when several EC-QCL equipped withQCL chips of different wavelength coverage are combined into one system [11,12].
Optical spectroscopy in the MIR is a valuable tool in analytical chemistry, as the fundamentalmolecular rotational-vibrational transitions with large oscillator strength fall into this energyrange. The highly characteristic absorption patterns, especially in the so-called “fingerprint region”(~500 cm´1–1500 cm´1), are well suited for identification and quantification of analytes, including thedetection of small quantities of target substances within an unknown matrix. FTIR spectrometers withbroadband thermal radiation sources have therefore long become an indispensable laboratory tool.
Widely tunable lasers, such as EC-QCL, offer new possibilities to MIR spectroscopy.Key advantages are, e.g., high spectral resolution, very high spectral power density and the emissionof a well-defined output beam that can easily be collimated and sent over long distances or coupledefficiently into subsequent optical systems including optical fibers and waveguides. Examples ofthe use of EC-QCLs in analytical spectroscopy include the detection of contaminations in watersupplies [13], inline-monitoring of chemical reactions [14], as well as MIR laser backscatteringspectroscopy for the detection of residues of explosives on surfaces [15–18] or assessing food quality [2].The latter three application cases will be presented and discussed in more detail in this paper.
Apart from the width of the spectral tuning range, the tuning speed of an EC-QCL canbe an important factor for many applications, such as real-time monitoring and in-line processanalysis. Commercially available EC-QCL systems provide wavelength tuning speeds in the rangefrom >0.1 cm´1/ms to 25 cm´1/ms [12,19]. Tsai and Wysocki reported on a modified Littrow-typeEC-QCL incorporating a piezo-driven fast tilt mirror [20]. This mirror was inserted into the opticalbeam path between the collimating lens, collecting the emission from the anti-reflection coated QCLchip facet and the diffraction grating, the latter providing wavelength selective optical feedback.This way scan rates of up to 5 kHz were achieved with a tuning range of up to 7 cm´1 [20].Hugger et al. employed the same cavity configuration, but replaced the piezo-driven mirror bya fast scanning MOEMS mirror with large deflection angle [21]. The MOEMS mirror with a diameterof 3 mm was operated at its resonance frequency of 6 kHz (167 µs per cycle). Similar to the work byTsai and Wysocki, wavelength tuning was achieved by tilting the MOEMS mirror and thus varyingthe angle of incidence of the collimated beam on the fixed grating. This way, a full wavelength scanfrom 1070 cm´1 to 1240 cm´1 was achieved within 80 µs, which is half of the cycle time [21,22].The corresponding average scan rate is approx. 2 cm´1/µs. One limitation in this experiment wasthe diameter of the MOEMS mirror plate of just 3 mm. This limitation in mirror diameter presents achallenge for the design of the external cavity in order to avoid excessive losses due to clipping of theoptical beam. Therefore, MOEMS scanners with a larger diameter scanner plate and the optical gratingintegrated onto the scanner plate are highly desirable to realize next generation MOEMS scannerbased EC-QCL. The highest tuning speed for an external cavity quantum cascade laser so far wasreported by Lyakh et al. [23]. They used an acousto-optic modulator (AOM) to control the emissionwavelength of a long-wave EC-QCL tunable from ~8.5 µm to ~9.8 µm with a switching time betweenany two wavelengths within that range of less than 1 µs.
In this paper, we report on recent advances in fast scanning EC-QCL employing a custom designedand fabricated MOEMS scanning grating [1,14,24]. This includes also first results on the actual use ofrapid-scan EC-QCL in spectroscopic sensing experiments. Furthermore, we report recent advances inthe application of EC-QCL for spectroscopic analysis and control of chemical processes [14], as well asfor imaging stand-off detection of explosives [1,15–18].
Photonics 2016, 3, 28 3 of 15
2. EC-QCL with MOEMS Scanning Grating
2.1. Setup of the MOEMS EC-QCL
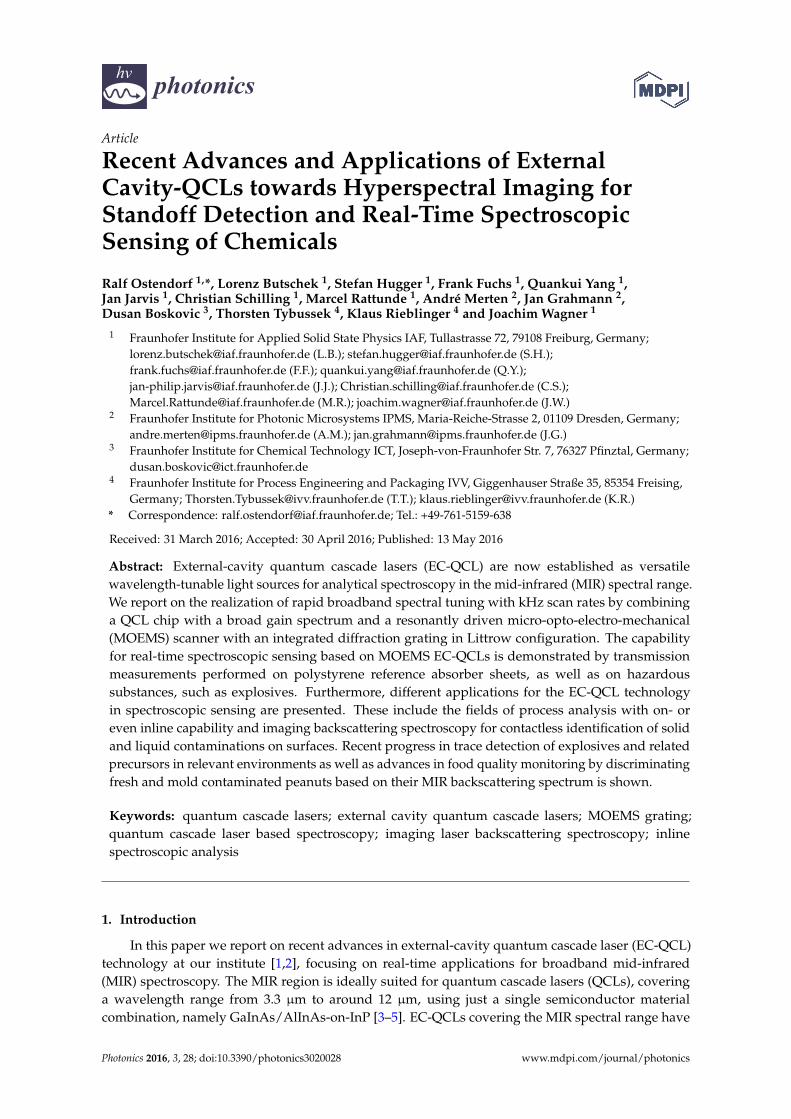
The basic setup employed in this report comprises a broadband QCL chip and a MOEMSbased diffraction grating in Littrow configuration as the wavelength-selective element in the externalresonator. A sketch of this MOEMS EC-QCL can be seen in Figure 1. The QCL chip is flanked bytwo collimation lenses (5 mm diameter, numerical aperture NA = 0.85). Internal chip modes aresuppressed by an antireflection coating on the laser facet facing the MOEMS grating. An opticallyneutral SiN passivation layer on the opposite, out-coupling facet gives a Fresnel reflectivity of R « 0.28resulting from the modal refractive index of the QCL waveguide.
Photonics 2016, 3, 28 3 of 15
2.1. Setup of the MOEMS EC-QCL
The basic setup employed in this report comprises a broadband QCL chip and a MOEMS based
diffraction grating in Littrow configuration as the wavelength-selective element in the external
resonator. A sketch of this MOEMS EC-QCL can be seen in Figure 1. The QCL chip is flanked by two
collimation lenses (5 mm diameter, numerical aperture NA = 0.85). Internal chip modes are
suppressed by an antireflection coating on the laser facet facing the MOEMS grating. An optically
neutral SiN passivation layer on the opposite, out-coupling facet gives a Fresnel reflectivity of R ≈
0.28 resulting from the modal refractive index of the QCL waveguide.
Figure 1. (a) Sketch of the EC-QCL setup with a MOEMS scanning grating in Littrow-configuration.
(b) Photograph of the MOEMS EC-QCL source.
The core of the MOEMS scanning grating is a circular scanner plate with a diameter of 5 mm,
resonantly driven by an electrostatic force. Into that scanner plate a trapezoidal diffraction grating
was etched, as shown in Figure 2. The MOEMS scanner was designed for a resonance frequency of 1
kHz and maximum mechanical deflection amplitudes of 10°. This ensured both high spectral tuning
speed and large wavelength coverage of the EC-QCL system. Torsional springs with an integrated
position sensing unit provide the suspension of the scanner plate. This sensing unit consists of four
piezo sensors connected to a Wheatstone bridge to achieve maximum sensitivity. This allows for
continuous monitoring of the MOEMS scanner trajectory in real-time and an unambiguous
determination of the wavelength of the EC-QCL while scanning, based on the phase and amplitude
of the scanning grating. Due to the non-linear behavior of the torsional spring and driving force, the
trajectory of the MOEMS scanner device is not strictly sinusoidal. Using a laser vibrometer setup a
deviation of less than 0.35 m° at scan amplitudes of 3.5° was determined. A customized, USB
controlled driving and control electronics board is used to operate the MOEMS scanning grating.
This board provides the driving voltage for actuating the scanner plate as well as a trigger signal for
each oscillation of the scanner plate which is used to synchronize the MOEMS scanner and the
pulsed current driver of the QCL chip. More details on the design and fabrication of the MOEMS
module can be found in reference [24].
(a) (b)
Figure 1. (a) Sketch of the EC-QCL setup with a MOEMS scanning grating in Littrow-configuration;(b) Photograph of the MOEMS EC-QCL source.
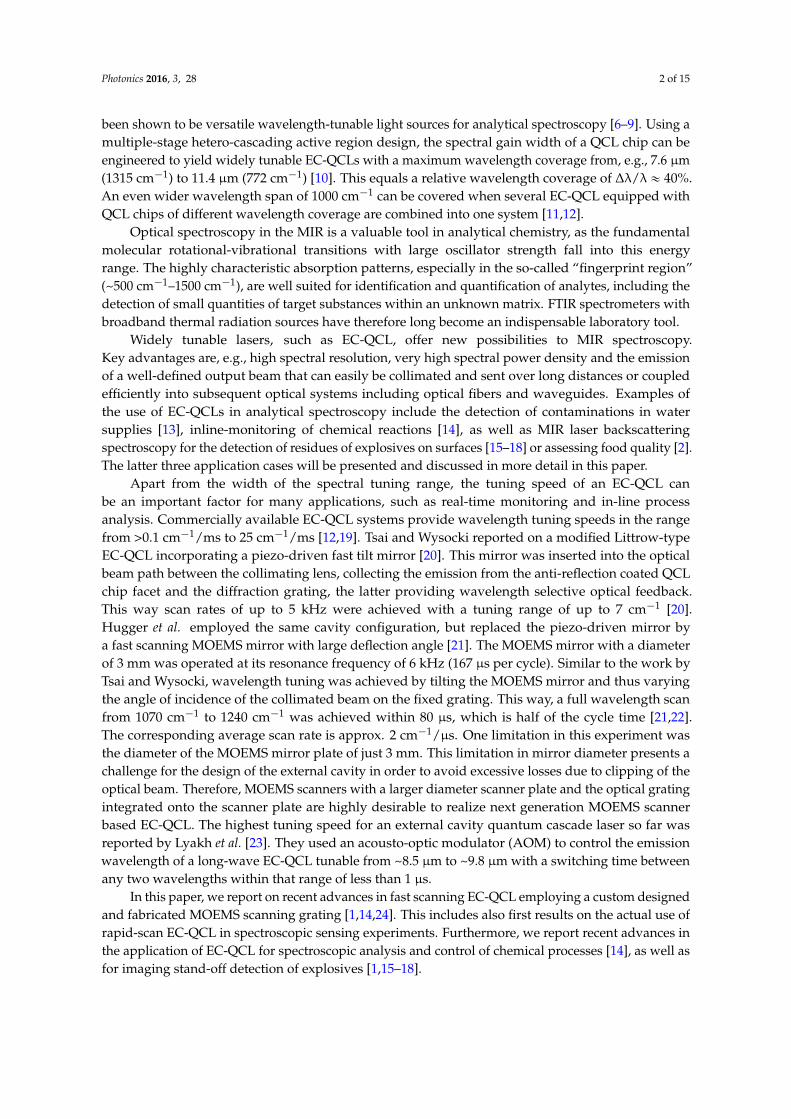
The core of the MOEMS scanning grating is a circular scanner plate with a diameter of 5 mm,resonantly driven by an electrostatic force. Into that scanner plate a trapezoidal diffraction grating wasetched, as shown in Figure 2. The MOEMS scanner was designed for a resonance frequency of 1 kHzand maximum mechanical deflection amplitudes of 10˝. This ensured both high spectral tuning speedand large wavelength coverage of the EC-QCL system. Torsional springs with an integrated positionsensing unit provide the suspension of the scanner plate. This sensing unit consists of four piezosensors connected to a Wheatstone bridge to achieve maximum sensitivity. This allows for continuousmonitoring of the MOEMS scanner trajectory in real-time and an unambiguous determination ofthe wavelength of the EC-QCL while scanning, based on the phase and amplitude of the scanninggrating. Due to the non-linear behavior of the torsional spring and driving force, the trajectory ofthe MOEMS scanner device is not strictly sinusoidal. Using a laser vibrometer setup a deviation ofless than 0.35 m˝ at scan amplitudes of 3.5˝ was determined. A customized, USB controlled drivingand control electronics board is used to operate the MOEMS scanning grating. This board providesthe driving voltage for actuating the scanner plate as well as a trigger signal for each oscillation ofthe scanner plate which is used to synchronize the MOEMS scanner and the pulsed current driverof the QCL chip. More details on the design and fabrication of the MOEMS module can be found inreference [24].
Photonics 2016, 3, 28 3 of 15
2.1. Setup of the MOEMS EC-QCL
The basic setup employed in this report comprises a broadband QCL chip and a MOEMS based
diffraction grating in Littrow configuration as the wavelength-selective element in the external
resonator. A sketch of this MOEMS EC-QCL can be seen in Figure 1. The QCL chip is flanked by two
collimation lenses (5 mm diameter, numerical aperture NA = 0.85). Internal chip modes are
suppressed by an antireflection coating on the laser facet facing the MOEMS grating. An optically
neutral SiN passivation layer on the opposite, out-coupling facet gives a Fresnel reflectivity of R ≈
0.28 resulting from the modal refractive index of the QCL waveguide.
Figure 1. (a) Sketch of the EC-QCL setup with a MOEMS scanning grating in Littrow-configuration.
(b) Photograph of the MOEMS EC-QCL source.
The core of the MOEMS scanning grating is a circular scanner plate with a diameter of 5 mm,
resonantly driven by an electrostatic force. Into that scanner plate a trapezoidal diffraction grating
was etched, as shown in Figure 2. The MOEMS scanner was designed for a resonance frequency of 1
kHz and maximum mechanical deflection amplitudes of 10°. This ensured both high spectral tuning
speed and large wavelength coverage of the EC-QCL system. Torsional springs with an integrated
position sensing unit provide the suspension of the scanner plate. This sensing unit consists of four
piezo sensors connected to a Wheatstone bridge to achieve maximum sensitivity. This allows for
continuous monitoring of the MOEMS scanner trajectory in real-time and an unambiguous
determination of the wavelength of the EC-QCL while scanning, based on the phase and amplitude
of the scanning grating. Due to the non-linear behavior of the torsional spring and driving force, the
trajectory of the MOEMS scanner device is not strictly sinusoidal. Using a laser vibrometer setup a
deviation of less than 0.35 m° at scan amplitudes of 3.5° was determined. A customized, USB
controlled driving and control electronics board is used to operate the MOEMS scanning grating.
This board provides the driving voltage for actuating the scanner plate as well as a trigger signal for
each oscillation of the scanner plate which is used to synchronize the MOEMS scanner and the
pulsed current driver of the QCL chip. More details on the design and fabrication of the MOEMS
module can be found in reference [24].
(a) (b)
Figure 2. Photograph of the MOEMS grating module used as wavelength selective element in theEC-QCL setup (left side). The right side shows details of the V-shaped grating structure etched into thecircular scanner plate.
Photonics 2016, 3, 28 4 of 15
2.2. Determination of the Spectral Linewidth and Wavelength Reproducibility
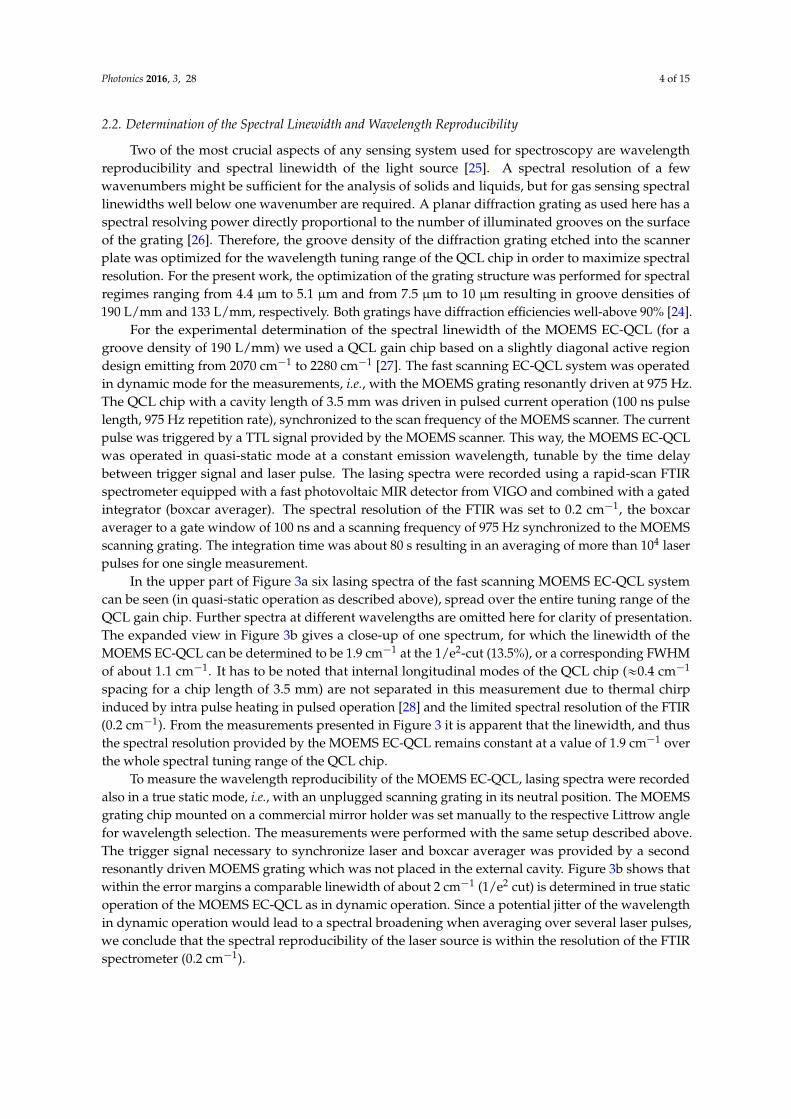
Two of the most crucial aspects of any sensing system used for spectroscopy are wavelengthreproducibility and spectral linewidth of the light source [25]. A spectral resolution of a fewwavenumbers might be sufficient for the analysis of solids and liquids, but for gas sensing spectrallinewidths well below one wavenumber are required. A planar diffraction grating as used here has aspectral resolving power directly proportional to the number of illuminated grooves on the surfaceof the grating [26]. Therefore, the groove density of the diffraction grating etched into the scannerplate was optimized for the wavelength tuning range of the QCL chip in order to maximize spectralresolution. For the present work, the optimization of the grating structure was performed for spectralregimes ranging from 4.4 µm to 5.1 µm and from 7.5 µm to 10 µm resulting in groove densities of190 L/mm and 133 L/mm, respectively. Both gratings have diffraction efficiencies well-above 90% [24].
For the experimental determination of the spectral linewidth of the MOEMS EC-QCL (for agroove density of 190 L/mm) we used a QCL gain chip based on a slightly diagonal active regiondesign emitting from 2070 cm´1 to 2280 cm´1 [27]. The fast scanning EC-QCL system was operatedin dynamic mode for the measurements, i.e., with the MOEMS grating resonantly driven at 975 Hz.The QCL chip with a cavity length of 3.5 mm was driven in pulsed current operation (100 ns pulselength, 975 Hz repetition rate), synchronized to the scan frequency of the MOEMS scanner. The currentpulse was triggered by a TTL signal provided by the MOEMS scanner. This way, the MOEMS EC-QCLwas operated in quasi-static mode at a constant emission wavelength, tunable by the time delaybetween trigger signal and laser pulse. The lasing spectra were recorded using a rapid-scan FTIRspectrometer equipped with a fast photovoltaic MIR detector from VIGO and combined with a gatedintegrator (boxcar averager). The spectral resolution of the FTIR was set to 0.2 cm´1, the boxcaraverager to a gate window of 100 ns and a scanning frequency of 975 Hz synchronized to the MOEMSscanning grating. The integration time was about 80 s resulting in an averaging of more than 104 laserpulses for one single measurement.
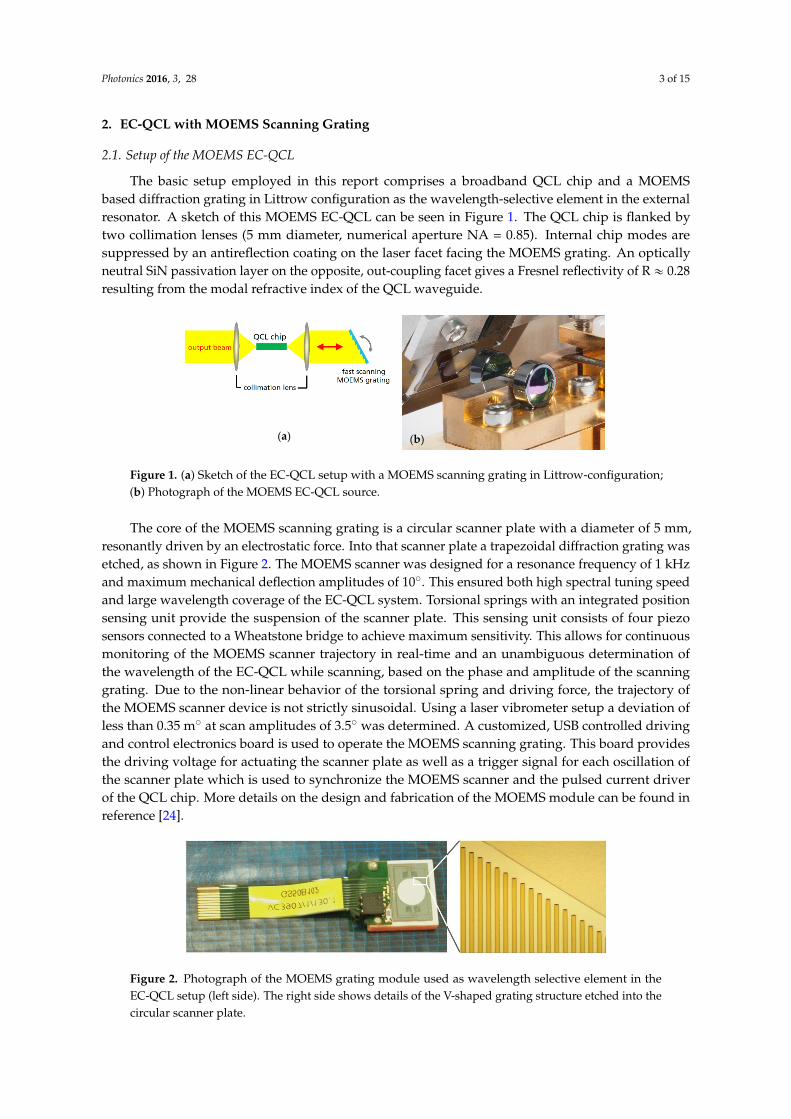
In the upper part of Figure 3a six lasing spectra of the fast scanning MOEMS EC-QCL systemcan be seen (in quasi-static operation as described above), spread over the entire tuning range of theQCL gain chip. Further spectra at different wavelengths are omitted here for clarity of presentation.The expanded view in Figure 3b gives a close-up of one spectrum, for which the linewidth of theMOEMS EC-QCL can be determined to be 1.9 cm´1 at the 1/e2-cut (13.5%), or a corresponding FWHMof about 1.1 cm´1. It has to be noted that internal longitudinal modes of the QCL chip («0.4 cm´1
spacing for a chip length of 3.5 mm) are not separated in this measurement due to thermal chirpinduced by intra pulse heating in pulsed operation [28] and the limited spectral resolution of the FTIR(0.2 cm´1). From the measurements presented in Figure 3 it is apparent that the linewidth, and thusthe spectral resolution provided by the MOEMS EC-QCL remains constant at a value of 1.9 cm´1 overthe whole spectral tuning range of the QCL chip.
To measure the wavelength reproducibility of the MOEMS EC-QCL, lasing spectra were recordedalso in a true static mode, i.e., with an unplugged scanning grating in its neutral position. The MOEMSgrating chip mounted on a commercial mirror holder was set manually to the respective Littrow anglefor wavelength selection. The measurements were performed with the same setup described above.The trigger signal necessary to synchronize laser and boxcar averager was provided by a secondresonantly driven MOEMS grating which was not placed in the external cavity. Figure 3b shows thatwithin the error margins a comparable linewidth of about 2 cm´1 (1/e2 cut) is determined in true staticoperation of the MOEMS EC-QCL as in dynamic operation. Since a potential jitter of the wavelengthin dynamic operation would lead to a spectral broadening when averaging over several laser pulses,we conclude that the spectral reproducibility of the laser source is within the resolution of the FTIRspectrometer (0.2 cm´1).

Photonics 2016, 3, 28 5 of 15Photonics 2016, 3, 28 5 of 15
norm
aliz
ed inte
nsity
dynamic
2050 2100 2150 2200 2250 2300
wavenumber [cm-1]
static
2180 2185 2190
2,0 cm-1
dynamic
norm
aliz
ed
inte
nsity
wavenumber [cm-1]
1,9 cm-1
2180 2185 2190
static
(a) (b)
Figure 3. (a) Measurement of the spectral linewidth of the MOEMS EC-QCL at different
wavenumbers. The spectral tuning range of the QCL chip is shaded in yellow. Upper graph shows
the measurements in dynamic operation (quasi-static mode), i.e., with scanning grating at 975 Hz.
The lower graph shows measurements performed with a stationary grating in its neutral position,
with the wavelength set manually by tilting the whole MOEMS chip. (b) Detailed view of the spectral
linewidth measurements shown in Figure 3. Left side shows the measurement in dynamic operation,
right side shows measurement with a static grating.
To measure the wavelength reproducibility of the MOEMS EC-QCL, lasing spectra were
recorded also in a true static mode, i.e., with an unplugged scanning grating in its neutral position.
The MOEMS grating chip mounted on a commercial mirror holder was set manually to the
respective Littrow angle for wavelength selection. The measurements were performed with the same
setup described above. The trigger signal necessary to synchronize laser and boxcar averager was
provided by a second resonantly driven MOEMS grating which was not placed in the external
cavity. Figure 3b shows that within the error margins a comparable linewidth of about 2 cm−1 (1/e2
cut) is determined in true static operation of the MOEMS EC-QCL as in dynamic operation. Since a
potential jitter of the wavelength in dynamic operation would lead to a spectral broadening when
averaging over several laser pulses, we conclude that the spectral reproducibility of the laser source
is within the resolution of the FTIR spectrometer (0.2 cm−1).
2.3. Realtime Absorption Measurements Using MOEMS EC-QCL
The MOEMS EC-QCL with a linewidth of 1.9 cm−1 as shown above provides sufficient spectral
resolution for spectroscopy of solids and liquids. An absorption measurement on polystyrene serves
as a first demonstration case to prove the capabilities of the MOEMS EC-QCL as a spectroscopic light
source. Polystyrene sheets are commonly used as calibration test samples for FTIR spectrometers. A
QCL chip with a heterogeneous-cascading active region design [10] tunable from 1000 cm−1 to 1300
cm−1 was used as gain material for the EC-QCL. The chip was driven in pulsed operation at 2% duty
cycle (100 ns pulse length, 200 kHz repetition rate), providing about 12 mW of average output power
at the center of the tuning range (1150 cm−1). The MOEMS grating with a groove density of 133 l/mm
was oscillating at a resonance frequency of 975 Hz with maximum scan amplitudes of 7.5°. MOEMS
grating and laser were driven asynchronously, i.e., the laser pulses were not synchronized to the
trigger signal provided by the scanner. Again, a VIGO detector was used, which measured the
intensity transmitted through the polystyrene sheet. Its signal was sent to a fast oscilloscope
triggered to the TTL signal from the MOEMS grating. A total of 1024 spectra were recorded and
averaged, resulting in an effective recording time of about 1 s. The conversion of the measured data
from time scale, as recorded by the oscilloscope, to wavelength scale was done post-measurement
using the grating equation for an external cavity in Littrow configuration [26] and assuming a
sinusoidal time-dependent grating angle given by scan amplitude and frequency of the MOEMS
grating.
Figure 3. (a) Measurement of the spectral linewidth of the MOEMS EC-QCL at different wavenumbers.The spectral tuning range of the QCL chip is shaded in yellow. Upper graph shows the measurementsin dynamic operation (quasi-static mode), i.e., with scanning grating at 975 Hz. The lower graph showsmeasurements performed with a stationary grating in its neutral position, with the wavelength setmanually by tilting the whole MOEMS chip; (b) Detailed view of the spectral linewidth measurementsshown in Figure 3. Left side shows the measurement in dynamic operation, right side showsmeasurement with a static grating.
2.3. Realtime Absorption Measurements Using MOEMS EC-QCL
The MOEMS EC-QCL with a linewidth of 1.9 cm´1 as shown above provides sufficient spectralresolution for spectroscopy of solids and liquids. An absorption measurement on polystyrene servesas a first demonstration case to prove the capabilities of the MOEMS EC-QCL as a spectroscopic lightsource. Polystyrene sheets are commonly used as calibration test samples for FTIR spectrometers.A QCL chip with a heterogeneous-cascading active region design [10] tunable from 1000 cm´1 to1300 cm´1 was used as gain material for the EC-QCL. The chip was driven in pulsed operation at 2%duty cycle (100 ns pulse length, 200 kHz repetition rate), providing about 12 mW of average outputpower at the center of the tuning range (1150 cm´1). The MOEMS grating with a groove density of133 L/mm was oscillating at a resonance frequency of 975 Hz with maximum scan amplitudes of 7.5˝.MOEMS grating and laser were driven asynchronously, i.e., the laser pulses were not synchronized tothe trigger signal provided by the scanner. Again, a VIGO detector was used, which measured theintensity transmitted through the polystyrene sheet. Its signal was sent to a fast oscilloscope triggeredto the TTL signal from the MOEMS grating. A total of 1024 spectra were recorded and averaged,resulting in an effective recording time of about 1 s. The conversion of the measured data fromtime scale, as recorded by the oscilloscope, to wavelength scale was done post-measurement usingthe grating equation for an external cavity in Littrow configuration [26] and assuming a sinusoidaltime-dependent grating angle given by scan amplitude and frequency of the MOEMS grating.
The red curve in Figure 4a represents the transmission spectrum of polystyrene recorded thisway using the MOEMS EC-QCL. For comparison, an FTIR transmission measurement of the samepolystyrene sheet is added in blue (measurement time ~3 min). It is apparent that the MOEMSEC-QCL can resolve the four characteristic absorption features of polystyrene in this wavelength rangevery well, and that its linewidth is easily sufficient for this measurement. Differences between thetwo spectra occur mainly at the borders of the QCL gain spectrum due to the low laser intensity atthose wavelengths. Figure 4b depicts the trajectory of the MOEMS scanner in red, while the tuningrange of the laser chip is shaded yellow. As can be seen, the scan amplitude of 7.5˝ of the MOEMSgrating was more than sufficient to cover the full gain spectrum of the QCL chip. A unidirectional scanof the whole tuning range of the chip from 1000 cm´1 to 1300 cm´1 takes about 300 µs, correspondingto an actual scan rate of the MOEMS EC-QCL of 1 cm´1/µs. Furthermore, the tuning range of theQCL chip is not symmetrically centered around the neutral position of the grating (deflection angle 0˝).

Photonics 2016, 3, 28 6 of 15
This deviation is attributed to slight misalignment of the tilt angle of the whole MOEMS chip, whichdetermines the lasing wavelength when the grating is not deflected.
Photonics 2016, 3, 28 6 of 15
The red curve in Figure 4a represents the transmission spectrum of polystyrene recorded this
way using the MOEMS EC-QCL. For comparison, an FTIR transmission measurement of the same
polystyrene sheet is added in blue (measurement time ~3 min). It is apparent that the MOEMS
EC-QCL can resolve the four characteristic absorption features of polystyrene in this wavelength
range very well, and that its linewidth is easily sufficient for this measurement. Differences between
the two spectra occur mainly at the borders of the QCL gain spectrum due to the low laser intensity
at those wavelengths. Figure 4b depicts the trajectory of the MOEMS scanner in red, while the tuning
range of the laser chip is shaded yellow. As can be seen, the scan amplitude of 7.5° of the MOEMS
grating was more than sufficient to cover the full gain spectrum of the QCL chip. A unidirectional
scan of the whole tuning range of the chip from 1000 cm−1 to 1300 cm−1 takes about 300 µs,
corresponding to an actual scan rate of the MOEMS EC-QCL of 1 cm−1/µs. Furthermore, the tuning
range of the QCL chip is not symmetrically centered around the neutral position of the grating
(deflection angle 0°). This deviation is attributed to slight misalignment of the tilt angle of the whole
MOEMS chip, which determines the lasing wavelength when the grating is not deflected.
0.0000 0.0001 0.0002 0.0003 0.0004
-6
-4
-2
0
2
4
6
8
deflection a
ngle
[°]
time [ms]
7500
8000
8500
9000
9500
10000
wavele
ngth
[nm
]
Tunin
g r
ange
QC
L c
hip
1000 1050 1100 1150 1200 1250 1300
0.0
0.1
0.2
0.3
0.4
0.5
0.6
0.7
0.8
0.9
1.0
Tra
nsm
issio
n [%
]
wavenumber [cm-1]
µEC-QCL
0.0
0.1
0.2
0.3
0.4
0.5
0.6
0.7
0.8
0.9
1.0
FTIR Reference
10000 9500 9000 8500 8000
wavelength [nm]
(a) (b)
Figure 4. (a) Transmission spectrum of a polystyrene sheet recorded using the MOEMS EC-QCL as
spectroscopic 1ight source at a scan frequency of 975 Hz (red curve). Total recording time was 1 s
while averaging over 1024 spectra. (b) Deflection angle of the MOEMS scanner (left scale) over time,
and the corresponding lasing wavelength (right scale). The tuning range of the QCL chip is shaded in
yellow.
To further evaluate the potential of the MOEMS EC-QCL for spectroscopic sensing and
analysis, reflectance spectra from different substances in solid phase were recorded. Shown below
(Figure 5) are three reflectance spectra, taken from the explosive PETN and paracetamol as a
harmless reference material, which were recorded using both a conventional EC-QCL and a MOEMS
EC-QCL. The total measurement times were 20 s and 50 ms, respectively, highlighting the speedup
in measurement time brought about by the MOEMS EC-QCL technology without sacrificing spectral
resolution and sensitivity (i.e., signal-to-noise-ratio).
Figure 4. (a) Transmission spectrum of a polystyrene sheet recorded using the MOEMS EC-QCL asspectroscopic 1ight source at a scan frequency of 975 Hz (red curve). Total recording time was 1 s whileaveraging over 1024 spectra; (b) Deflection angle of the MOEMS scanner (left scale) over time, and thecorresponding lasing wavelength (right scale). The tuning range of the QCL chip is shaded in yellow.
To further evaluate the potential of the MOEMS EC-QCL for spectroscopic sensing and analysis,reflectance spectra from different substances in solid phase were recorded. Shown below (Figure 5)are three reflectance spectra, taken from the explosive PETN and paracetamol as a harmless referencematerial, which were recorded using both a conventional EC-QCL and a MOEMS EC-QCL. The totalmeasurement times were 20 s and 50 ms, respectively, highlighting the speedup in measurementtime brought about by the MOEMS EC-QCL technology without sacrificing spectral resolution andsensitivity (i.e., signal-to-noise-ratio).Photonics 2016, 3, 28 7 of 15
1100 1200 13000.0
0.2
0.4
0.6
0.8
1.0
1.2
1.4
1.6
PETN EC-QCL
PETN MOEMS EC-QCLbackscatt
ere
d inte
nsity [
a.u
.]
wavenumbers [1/cm]
(a)
1100 1200 1300
(b) Paracetamol EC-QCL
Paracetamol MOEMS EC-QCL
wavenumbers [1/cm]
Figure 5. Reflectance spectra of different substances in solid phase – the explosive PETN (a) as well
as the medical drug paracetamol (b). Spectra recorded using a conventional EC-QCL (in blue) are
compared with those taken using the MOEMS-based EC-QCL (red curves, average of 100 individual
spectra).
The combination of a high scan rate (1 cm−1/µs) with a large tuning range (>300 cm−1) and a
spectral resolution of 1.9 cm−1 make the present MOEMS EC-QCL technology ideally suited for
real-time analysis of liquids and solids with a sub-millisecond temporal resolution. Potential
application fields include on- and in-line process monitoring, analysis of kinetics in chemical
reactions and real time MIR backscattering spectroscopy.
3. Case Studies for the Use of EC-QCL in Spectroscopic Sensing
The following section reports on three test cases for the spectroscopic application of broadband
tunable EC-QCLs in real-world scenarios. The first one is inline-monitoring of a prototypical
catalytic chemical reaction, the second one is imaging MIR laser backscattering spectroscopy for the
stand-off detection of residues of explosives or their precursor materials, and the third one the
adoption of MIR laser backscattering spectroscopy for the contactless assessment of food quality. In
all three case studies, a conventional EC-QCL module was used [18]. These modules still employ a
classical optical grating mounted on a computer-controlled rotary stage as the wavelength-selective
optical feedback-element [18], resulting in a maximum scanning speed in the range of 400 cm−1/s.
3.1. Inline-Monitoring of Chemical Reactions
This case study deals with the inline analysis of an exemplary catalytic chemical reaction, the
so-called Knoevenagel condensation [14,29,30]. This is an organic reaction that converts an aldehyde
or ketone and an activated methylene to a substituted olefin with a weakly basic amine as catalyst
[29,30]. The experimental setup used for the inline-spectroscopic analysis of this reaction consists of
an EC-QCL as wavelength-tunable light source and signal and reference detectors for the acquisition
of normalized transmission spectra of the analyte. Time-dependent MIR fingerprint spectra
(1140–1300 cm−1) recorded this way are shown in Figure 6a, taken while the Knoevenagel
condensation reaction was progressing. The spectra show that, despite a very low concentration of
the involved reactants of 40 mM, very good signal intensity and low noise were achieved, both
mostly resulting from the high energy density of the laser source. During the reaction time of about
20 minutes, a clear change in the absorption spectra could be observed. A decreasing absorption
band at 1160 cm−1 attributed to the aldehyde group of the educt (4-methoxybenzaldehyde) and a
rising absorption band at about 1180 cm−1 attributed to the emerging C=C double bond of the
product is observed. This allows for the application of chemometric quantification procedures and
determination of the product composition during the whole time of the reaction. Based on these
data, the kinetics of the chemical reaction can be characterized and optimized for yield, conversion
efficiency, and also the influence of the involved catalyst (not shown). This is an example of a slowly
progressing reaction, i.e., over a time span of around 20 min. This way the rate at which spectra
Figure 5. Reflectance spectra of different substances in solid phase – the explosive PETN (a) aswell as the medical drug paracetamol (b). Spectra recorded using a conventional EC-QCL (inblue) are compared with those taken using the MOEMS-based EC-QCL (red curves, average of100 individual spectra).
The combination of a high scan rate (1 cm´1/µs) with a large tuning range (>300 cm´1)and a spectral resolution of 1.9 cm´1 make the present MOEMS EC-QCL technology ideallysuited for real-time analysis of liquids and solids with a sub-millisecond temporal resolution.Potential application fields include on- and in-line process monitoring, analysis of kinetics in chemicalreactions and real time MIR backscattering spectroscopy.

Photonics 2016, 3, 28 7 of 15
3. Case Studies for the Use of EC-QCL in Spectroscopic Sensing
The following section reports on three test cases for the spectroscopic application of broadbandtunable EC-QCLs in real-world scenarios. The first one is inline-monitoring of a prototypical catalyticchemical reaction, the second one is imaging MIR laser backscattering spectroscopy for the stand-offdetection of residues of explosives or their precursor materials, and the third one the adoption ofMIR laser backscattering spectroscopy for the contactless assessment of food quality. In all threecase studies, a conventional EC-QCL module was used [18]. These modules still employ a classicaloptical grating mounted on a computer-controlled rotary stage as the wavelength-selective opticalfeedback-element [18], resulting in a maximum scanning speed in the range of 400 cm´1/s.
3.1. Inline-Monitoring of Chemical Reactions
This case study deals with the inline analysis of an exemplary catalytic chemical reaction, theso-called Knoevenagel condensation [14,29,30]. This is an organic reaction that converts an aldehyde orketone and an activated methylene to a substituted olefin with a weakly basic amine as catalyst [29,30].The experimental setup used for the inline-spectroscopic analysis of this reaction consists of an EC-QCLas wavelength-tunable light source and signal and reference detectors for the acquisition of normalizedtransmission spectra of the analyte. Time-dependent MIR fingerprint spectra (1140–1300 cm´1)recorded this way are shown in Figure 6a, taken while the Knoevenagel condensation reaction wasprogressing. The spectra show that, despite a very low concentration of the involved reactants of40 mM, very good signal intensity and low noise were achieved, both mostly resulting from thehigh energy density of the laser source. During the reaction time of about 20 min, a clear change inthe absorption spectra could be observed. A decreasing absorption band at 1160 cm´1 attributed tothe aldehyde group of the educt (4-methoxybenzaldehyde) and a rising absorption band at about1180 cm´1 attributed to the emerging C=C double bond of the product is observed. This allows for theapplication of chemometric quantification procedures and determination of the product compositionduring the whole time of the reaction. Based on these data, the kinetics of the chemical reaction can becharacterized and optimized for yield, conversion efficiency, and also the influence of the involvedcatalyst (not shown). This is an example of a slowly progressing reaction, i.e., over a time span ofaround 20 min. This way the rate at which spectra could be recorded when using a conventionalEC-QCL module was sufficient to follow the reaction dynamics. However, the availability of fastscanning MOEMS EC-QCLs (see above Section 2) allows monitoring and controlling chemical reactionson a sub-second time scale.
Photonics 2016, 3, 28 8 of 15
could be recorded when using a conventional EC-QCL module was sufficient to follow the reaction
dynamics. However, the availability of fast scanning MOEMS EC-QCLs (see above Section 2) allows
monitoring and controlling chemical reactions on a sub-second time scale.
(a) (b)
1150 1200 1250 13000.00
0.02
0.04
0.06
0.08
0.10
0.12
ab
so
rptio
n
wavenumber [cm-1]
1,5 min
2,1 min
3,0 min
5,1 min
7,2 min
12 min
17 min
0
2
4
6
8
10
12
c P [
mm
ol/L]
0 2 4 6 8 10 12 14 16 184
6
8
10
12
14
16
18
40 °C
50 °C
60 °C
70 °C
cE
[m
mol/L]
mean residence time [min]
(a) (b)
Figure 6. (a) MIR spectroscopic monitoring of a Knoevenagel condensation at 60 °C as an exemplary
catalytic chemical reaction. (b) Measurements of product and educt concentrations (CP, CE) over
time, at varying temperatures.
3.2. Imaging MIR Laser Backscattering Spectroscopy for the Stand-off Detection of Residues of Explosives
The imaging MIR backscattering spectroscopy system used in field trials for the detection of
explosives is shown in Figure 7. The system consists of an EC-QCL based laser illumination unit, a
large aperture optical telescope coupled to a high-performance cryogenically cooled mercury
cadmium telluride (MCT) MIR camera for collecting and detecting the diffusively backscattered MIR
laser radiation, as well as a laptop-based control and data processing unit [17,18,31]. Furthermore, it
comprises custom-made hardware for speckle reduction. Co-linear to the MIR telescope also the
visible image of the scene under investigation is recorded.
Figure 7. Stand-off detection system using a dual-chip EC-QCL module for wavelength-selective
illumination and telescope mirror optics on the receiver side. The vis-cam image is overlaid over the
MIR image for orientation purposes. The MCT MIR camera is located behind by the telescope.
Wavelength-tunable MIR laser illumination is performed using a compact laser module (see
Figure 8a), which contains two EC-QCL units equipped with broad gain QCL chips. These QCL
Figure 6. (a) MIR spectroscopic monitoring of a Knoevenagel condensation at 60 ˝C as an exemplarycatalytic chemical reaction; (b) Measurements of product and educt concentrations (CP, CE) over time,at varying temperatures.
Photonics 2016, 3, 28 8 of 15
3.2. Imaging MIR Laser Backscattering Spectroscopy for the Stand-off Detection of Residues of Explosives
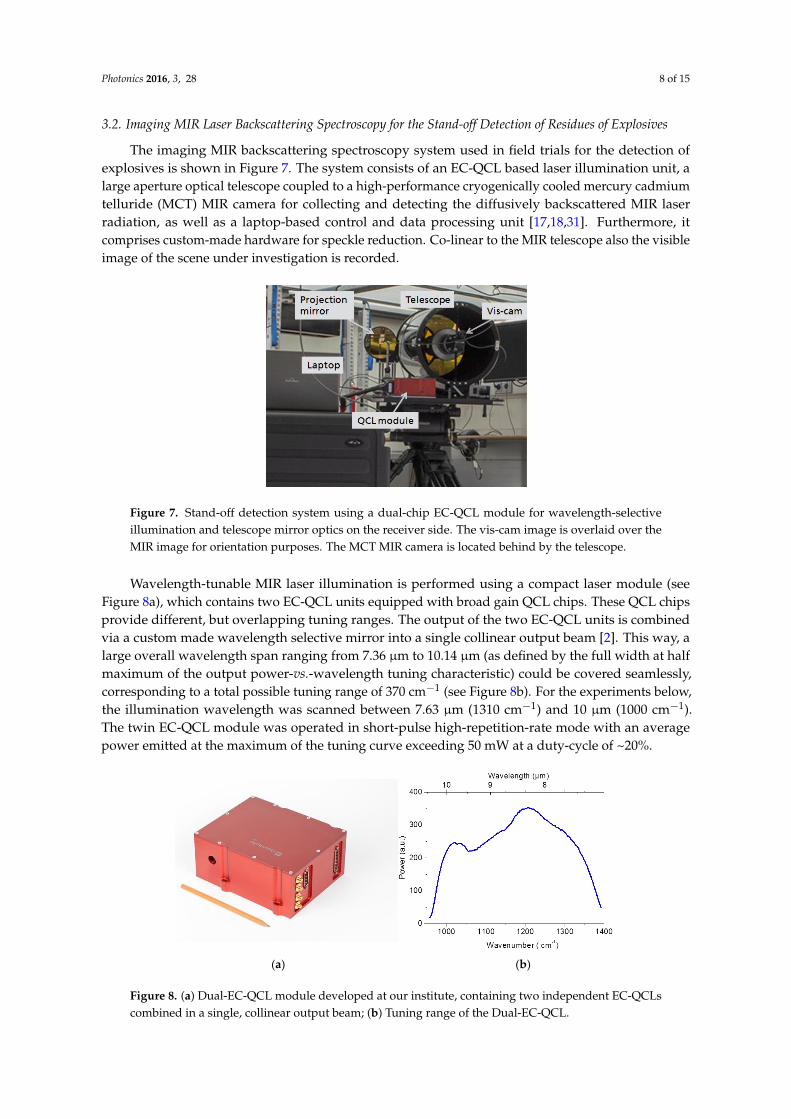
The imaging MIR backscattering spectroscopy system used in field trials for the detection ofexplosives is shown in Figure 7. The system consists of an EC-QCL based laser illumination unit, alarge aperture optical telescope coupled to a high-performance cryogenically cooled mercury cadmiumtelluride (MCT) MIR camera for collecting and detecting the diffusively backscattered MIR laserradiation, as well as a laptop-based control and data processing unit [17,18,31]. Furthermore, itcomprises custom-made hardware for speckle reduction. Co-linear to the MIR telescope also the visibleimage of the scene under investigation is recorded.
Photonics 2016, 3, 28 8 of 15
could be recorded when using a conventional EC-QCL module was sufficient to follow the reaction
dynamics. However, the availability of fast scanning MOEMS EC-QCLs (see above Section 2) allows
monitoring and controlling chemical reactions on a sub-second time scale.
(a) (b)
1150 1200 1250 13000.00
0.02
0.04
0.06
0.08
0.10
0.12
ab
so
rptio
n
wavenumber [cm-1]
1,5 min
2,1 min
3,0 min
5,1 min
7,2 min
12 min
17 min
0
2
4
6
8
10
12
c P [
mm
ol/L]
0 2 4 6 8 10 12 14 16 184
6
8
10
12
14
16
18
40 °C
50 °C
60 °C
70 °C
cE
[m
mo
l/L
]
mean residence time [min]
(a) (b)
Figure 6. (a) MIR spectroscopic monitoring of a Knoevenagel condensation at 60 °C as an exemplary
catalytic chemical reaction. (b) Measurements of product and educt concentrations (CP, CE) over
time, at varying temperatures.
3.2. Imaging MIR Laser Backscattering Spectroscopy for the Stand-off Detection of Residues of Explosives
The imaging MIR backscattering spectroscopy system used in field trials for the detection of
explosives is shown in Figure 7. The system consists of an EC-QCL based laser illumination unit, a
large aperture optical telescope coupled to a high-performance cryogenically cooled mercury
cadmium telluride (MCT) MIR camera for collecting and detecting the diffusively backscattered MIR
laser radiation, as well as a laptop-based control and data processing unit [17,18,31]. Furthermore, it
comprises custom-made hardware for speckle reduction. Co-linear to the MIR telescope also the
visible image of the scene under investigation is recorded.
Figure 7. Stand-off detection system using a dual-chip EC-QCL module for wavelength-selective
illumination and telescope mirror optics on the receiver side. The vis-cam image is overlaid over the
MIR image for orientation purposes. The MCT MIR camera is located behind by the telescope.
Wavelength-tunable MIR laser illumination is performed using a compact laser module (see
Figure 8a), which contains two EC-QCL units equipped with broad gain QCL chips. These QCL
Figure 7. Stand-off detection system using a dual-chip EC-QCL module for wavelength-selectiveillumination and telescope mirror optics on the receiver side. The vis-cam image is overlaid over theMIR image for orientation purposes. The MCT MIR camera is located behind by the telescope.
Wavelength-tunable MIR laser illumination is performed using a compact laser module (seeFigure 8a), which contains two EC-QCL units equipped with broad gain QCL chips. These QCL chipsprovide different, but overlapping tuning ranges. The output of the two EC-QCL units is combinedvia a custom made wavelength selective mirror into a single collinear output beam [2]. This way, alarge overall wavelength span ranging from 7.36 µm to 10.14 µm (as defined by the full width at halfmaximum of the output power-vs.-wavelength tuning characteristic) could be covered seamlessly,corresponding to a total possible tuning range of 370 cm´1 (see Figure 8b). For the experiments below,the illumination wavelength was scanned between 7.63 µm (1310 cm´1) and 10 µm (1000 cm´1).The twin EC-QCL module was operated in short-pulse high-repetition-rate mode with an averagepower emitted at the maximum of the tuning curve exceeding 50 mW at a duty-cycle of ~20%.
Photonics 2016, 3, 28 9 of 15
chips provide different, but overlapping tuning ranges. The output of the two EC-QCL units is
combined via a custom made wavelength selective mirror into a single collinear output beam [2].
This way, a large overall wavelength span ranging from 7.36 µm to 10.14 µm (as defined by the full
width at half maximum of the output power-vs.-wavelength tuning characteristic) could be covered
seamlessly, corresponding to a total possible tuning range of 370 cm−1 (see Figure 8b). For the
experiments below, the illumination wavelength was scanned between 7.63 µm (1310 cm−1) and 10
µm (1000 cm−1). The twin EC-QCL module was operated in short-pulse high-repetition-rate mode
with an average power emitted at the maximum of the tuning curve exceeding 50 mW at a
duty-cycle of ~20%.
(a) (b)
Figure 8. (a) Dual-EC-QCL module developed at our institute, containing two independent EC-QCLs
combined in a single, collinear output beam. (b) Tuning range of the Dual-EC-QCL.
Custom made data analysis software allows searching for a defined set of substances with
known backscattering spectra, while a-priori-knowledge of the background material is not required
[31,32]. In Figures 9 and 10 measurements of trinitrotoluol (TNT) contamination on jeans denim are
shown, visualizing the ability of our detection algorithm to suppress backgrounds with arbitrary
spectral fingerprints. Backscattering images illuminated by the EC-QCL at different wavelengths
were recorded here from a close distance of ~1 m. Comparison to other samples with known amount
of material and visual inspection suggested that the illuminated area contained a total amount of
TNT on the order of 100 µg. Previous publications showed that over distances of a few meters,
quantitates down to 10 µg are detectable [33]. The backscattering spectrum of jeans denim strongly
resembles that of TNT, so false alarms or interferences might be expected. However, TNT was
successfully detected only in the contaminated region, and the library TNT spectrum could be
recovered using linear de-mixing.
Figure 9. TNT on jeans denim detected by QCL-based MIR backscattering spectroscopy.
Chemically selective image with TNT-contaminated areas shown in light green and areas where no
TNT was detected in dark green.
Figure 8. (a) Dual-EC-QCL module developed at our institute, containing two independent EC-QCLscombined in a single, collinear output beam; (b) Tuning range of the Dual-EC-QCL.
Photonics 2016, 3, 28 9 of 15
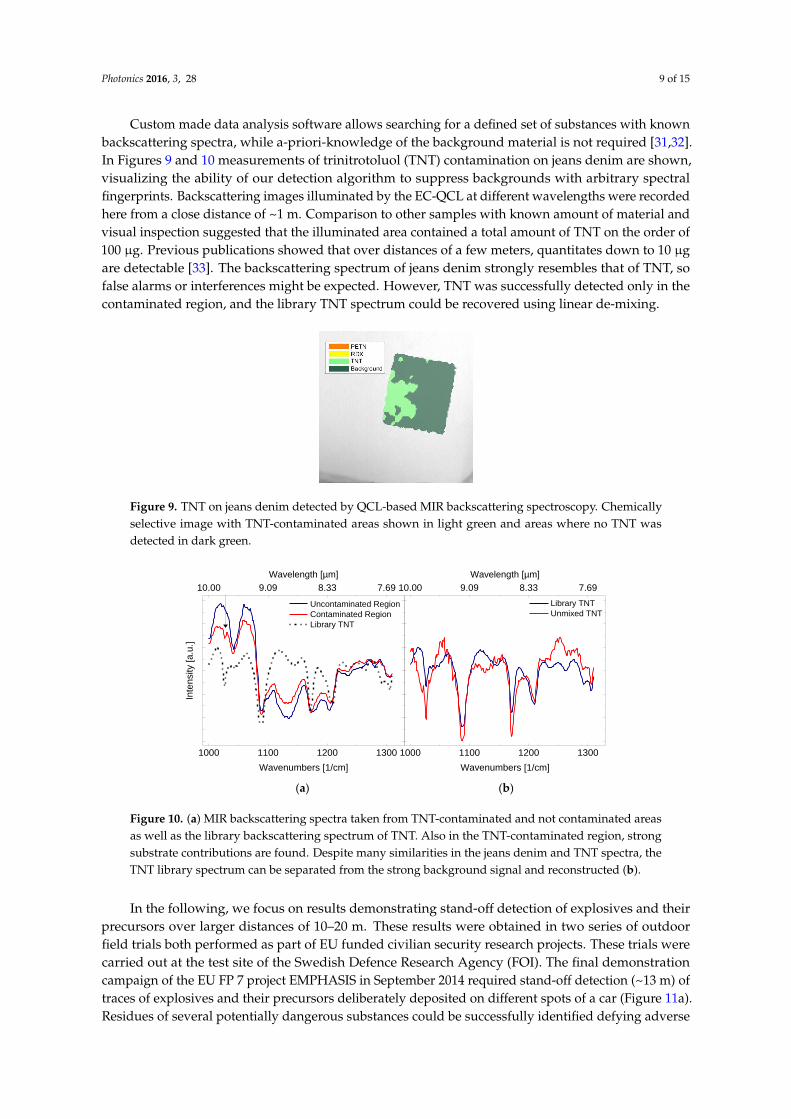
Custom made data analysis software allows searching for a defined set of substances with knownbackscattering spectra, while a-priori-knowledge of the background material is not required [31,32].In Figures 9 and 10 measurements of trinitrotoluol (TNT) contamination on jeans denim are shown,visualizing the ability of our detection algorithm to suppress backgrounds with arbitrary spectralfingerprints. Backscattering images illuminated by the EC-QCL at different wavelengths were recordedhere from a close distance of ~1 m. Comparison to other samples with known amount of material andvisual inspection suggested that the illuminated area contained a total amount of TNT on the order of100 µg. Previous publications showed that over distances of a few meters, quantitates down to 10 µgare detectable [33]. The backscattering spectrum of jeans denim strongly resembles that of TNT, sofalse alarms or interferences might be expected. However, TNT was successfully detected only in thecontaminated region, and the library TNT spectrum could be recovered using linear de-mixing.
Photonics 2016, 3, 28 9 of 15
chips provide different, but overlapping tuning ranges. The output of the two EC-QCL units is
combined via a custom made wavelength selective mirror into a single collinear output beam [2].
This way, a large overall wavelength span ranging from 7.36 µm to 10.14 µm (as defined by the full
width at half maximum of the output power-vs.-wavelength tuning characteristic) could be covered
seamlessly, corresponding to a total possible tuning range of 370 cm−1 (see Figure 8b). For the
experiments below, the illumination wavelength was scanned between 7.63 µm (1310 cm−1) and 10
µm (1000 cm−1). The twin EC-QCL module was operated in short-pulse high-repetition-rate mode
with an average power emitted at the maximum of the tuning curve exceeding 50 mW at a
duty-cycle of ~20%.
(a) (b)
Figure 8. (a) Dual-EC-QCL module developed at our institute, containing two independent EC-QCLs
combined in a single, collinear output beam. (b) Tuning range of the Dual-EC-QCL.
Custom made data analysis software allows searching for a defined set of substances with
known backscattering spectra, while a-priori-knowledge of the background material is not required
[31,32]. In Figures 9 and 10 measurements of trinitrotoluol (TNT) contamination on jeans denim are
shown, visualizing the ability of our detection algorithm to suppress backgrounds with arbitrary
spectral fingerprints. Backscattering images illuminated by the EC-QCL at different wavelengths
were recorded here from a close distance of ~1 m. Comparison to other samples with known amount
of material and visual inspection suggested that the illuminated area contained a total amount of
TNT on the order of 100 µg. Previous publications showed that over distances of a few meters,
quantitates down to 10 µg are detectable [33]. The backscattering spectrum of jeans denim strongly
resembles that of TNT, so false alarms or interferences might be expected. However, TNT was
successfully detected only in the contaminated region, and the library TNT spectrum could be
recovered using linear de-mixing.
Figure 9. TNT on jeans denim detected by QCL-based MIR backscattering spectroscopy.
Chemically selective image with TNT-contaminated areas shown in light green and areas where no
TNT was detected in dark green.
Figure 9. TNT on jeans denim detected by QCL-based MIR backscattering spectroscopy. Chemicallyselective image with TNT-contaminated areas shown in light green and areas where no TNT wasdetected in dark green.Photonics 2016, 3, 28 10 of 15
1000 1100 1200 1300
10.00 9.09 8.33 7.69
Wavelength [µm]
Uncontaminated Region
Contaminated Region
Library TNT
Inte
nsity [a.u
.]
Wavenumbers [1/cm]
1000 1100 1200 1300
10.00 9.09 8.33 7.69
Wavelength [µm]
Library TNT
Unmixed TNT
Wavenumbers [1/cm] (a) (b)
Figure 10. (a) MIR backscattering spectra taken from TNT-contaminated and not contaminated areas
as well as the library backscattering spectrum of TNT. Also in the TNT-contaminated region, strong
substrate contributions are found. Despite many similarities in the jeans denim and TNT spectra, the
TNT library spectrum can be separated from the strong background signal and reconstructed (b).
In the following, we focus on results demonstrating stand-off detection of explosives and their
precursors over larger distances of 10–20 m. These results were obtained in two series of outdoor
field trials both performed as part of EU funded civilian security research projects. These trials were
carried out at the test site of the Swedish Defence Research Agency (FOI). The final demonstration
campaign of the EU FP 7 project EMPHASIS in September 2014 required stand-off detection (~13 m)
of traces of explosives and their precursors deliberately deposited on different spots of a car (Figure
11a). Residues of several potentially dangerous substances could be successfully identified defying
adverse weather conditions of rain and high humidity. As an example, Figure 11b shows the
detection of dinitrotoluol (DNT), a precursor of TNT, on the rear tire.
(a) (b)
Figure 11. (a) Stand-off detection system based on MIR backscattering spectroscopy, inspecting
suspect car parked at a distance of 13 m. (b) Close-up of parts of the left rear tire of the car as detected
by imaging MIR backscattering spectroscopy, showing color-coded traces of DNT, a precursor of
TNT.
Another set of field trials was conducted at the FOI test site in Sweden in September 2015 within
the framework of the EU FP7 project HYPERION. An improvised explosive device (IED) was
detonated near a car, and we were required to identify the employed explosive by standoff detection
of unexploded residues spread over the scene as “fallout” of the detonation. A crucial aspect of the
scenario was the time limit of 30 min for preparation and measurement, starting from the explosion.
Therefore, the detection system was mounted on a mobile platform so that measurements could be
Figure 10. (a) MIR backscattering spectra taken from TNT-contaminated and not contaminated areasas well as the library backscattering spectrum of TNT. Also in the TNT-contaminated region, strongsubstrate contributions are found. Despite many similarities in the jeans denim and TNT spectra, theTNT library spectrum can be separated from the strong background signal and reconstructed (b).
In the following, we focus on results demonstrating stand-off detection of explosives and theirprecursors over larger distances of 10–20 m. These results were obtained in two series of outdoorfield trials both performed as part of EU funded civilian security research projects. These trials werecarried out at the test site of the Swedish Defence Research Agency (FOI). The final demonstrationcampaign of the EU FP 7 project EMPHASIS in September 2014 required stand-off detection (~13 m) oftraces of explosives and their precursors deliberately deposited on different spots of a car (Figure 11a).Residues of several potentially dangerous substances could be successfully identified defying adverse
Photonics 2016, 3, 28 10 of 15
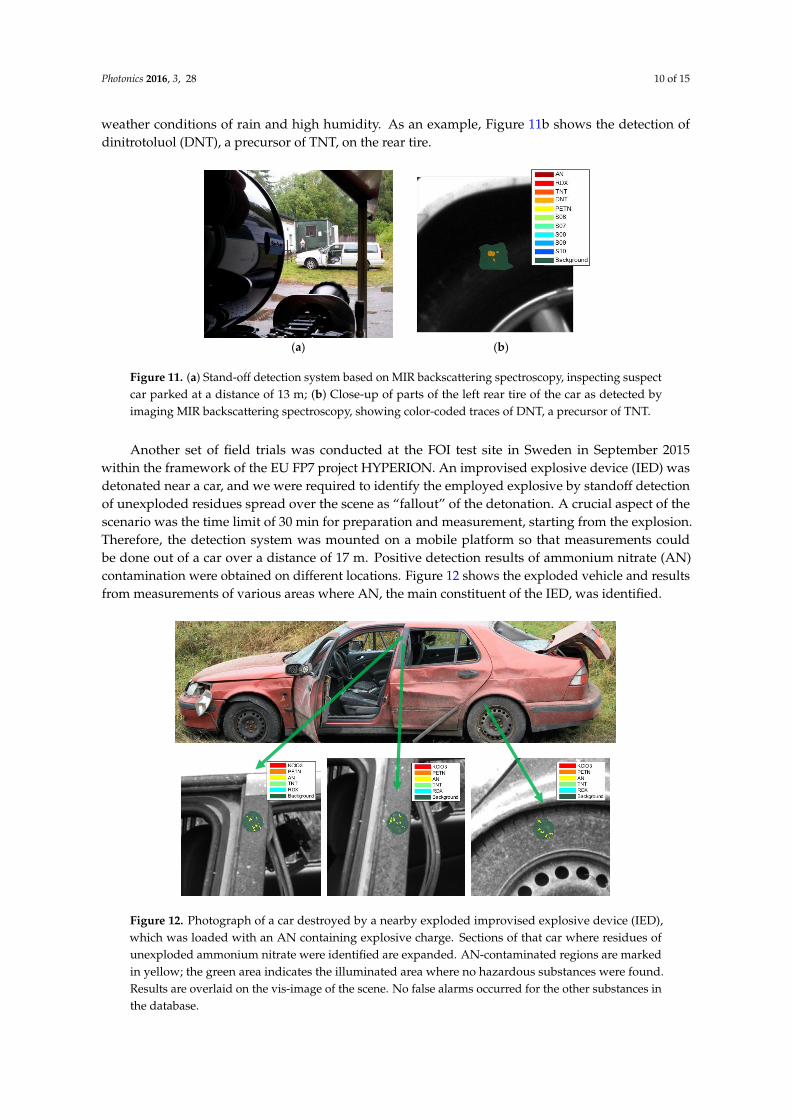
weather conditions of rain and high humidity. As an example, Figure 11b shows the detection ofdinitrotoluol (DNT), a precursor of TNT, on the rear tire.
Photonics 2016, 3, 28 10 of 15
1000 1100 1200 1300
10.00 9.09 8.33 7.69
Wavelength [µm]
Uncontaminated Region
Contaminated Region
Library TNT
Inte
nsity [a.u
.]
Wavenumbers [1/cm]
1000 1100 1200 1300
10.00 9.09 8.33 7.69
Wavelength [µm]
Library TNT
Unmixed TNT
Wavenumbers [1/cm] (a) (b)
Figure 10. (a) MIR backscattering spectra taken from TNT-contaminated and not contaminated areas
as well as the library backscattering spectrum of TNT. Also in the TNT-contaminated region, strong
substrate contributions are found. Despite many similarities in the jeans denim and TNT spectra, the
TNT library spectrum can be separated from the strong background signal and reconstructed (b).
In the following, we focus on results demonstrating stand-off detection of explosives and their
precursors over larger distances of 10–20 m. These results were obtained in two series of outdoor
field trials both performed as part of EU funded civilian security research projects. These trials were
carried out at the test site of the Swedish Defence Research Agency (FOI). The final demonstration
campaign of the EU FP 7 project EMPHASIS in September 2014 required stand-off detection (~13 m)
of traces of explosives and their precursors deliberately deposited on different spots of a car (Figure
11a). Residues of several potentially dangerous substances could be successfully identified defying
adverse weather conditions of rain and high humidity. As an example, Figure 11b shows the
detection of dinitrotoluol (DNT), a precursor of TNT, on the rear tire.
(a) (b)
Figure 11. (a) Stand-off detection system based on MIR backscattering spectroscopy, inspecting
suspect car parked at a distance of 13 m. (b) Close-up of parts of the left rear tire of the car as detected
by imaging MIR backscattering spectroscopy, showing color-coded traces of DNT, a precursor of
TNT.
Another set of field trials was conducted at the FOI test site in Sweden in September 2015 within
the framework of the EU FP7 project HYPERION. An improvised explosive device (IED) was
detonated near a car, and we were required to identify the employed explosive by standoff detection
of unexploded residues spread over the scene as “fallout” of the detonation. A crucial aspect of the
scenario was the time limit of 30 min for preparation and measurement, starting from the explosion.
Therefore, the detection system was mounted on a mobile platform so that measurements could be
Figure 11. (a) Stand-off detection system based on MIR backscattering spectroscopy, inspecting suspectcar parked at a distance of 13 m; (b) Close-up of parts of the left rear tire of the car as detected byimaging MIR backscattering spectroscopy, showing color-coded traces of DNT, a precursor of TNT.
Another set of field trials was conducted at the FOI test site in Sweden in September 2015within the framework of the EU FP7 project HYPERION. An improvised explosive device (IED) wasdetonated near a car, and we were required to identify the employed explosive by standoff detectionof unexploded residues spread over the scene as “fallout” of the detonation. A crucial aspect of thescenario was the time limit of 30 min for preparation and measurement, starting from the explosion.Therefore, the detection system was mounted on a mobile platform so that measurements couldbe done out of a car over a distance of 17 m. Positive detection results of ammonium nitrate (AN)contamination were obtained on different locations. Figure 12 shows the exploded vehicle and resultsfrom measurements of various areas where AN, the main constituent of the IED, was identified.
Photonics 2016, 3, 28 11 of 15
done out of a car over a distance of 17 m. Positive detection results of ammonium nitrate (AN)
contamination were obtained on different locations. Figure 12 shows the exploded vehicle and
results from measurements of various areas where AN, the main constituent of the IED, was
identified.
Figure 12. Photograph of a car destroyed by a nearby exploded improvised explosive device (IED),
which was loaded with an AN containing explosive charge. Sections of that car where residues of
unexploded ammonium nitrate were identified are expanded. AN-contaminated regions are marked
in yellow; the green area indicates the illuminated area where no hazardous substances were found.
Results are overlaid on the vis-image of the scene. No false alarms occurred for the other substances
in the database.
Our results were cross-checked and confirmed later by ion mobility spectrometry (IMS)
analysis on samples taken by swabbing. We note that the AN contamination appeared as a thin,
hardly visible layer on most parts of the car. While the actual surface concentration of AN is
unknown, results from the analysis of swabbing samples suggest an average coverage of some 10
µg/cm2.
3.3. Assessing Food Quality by QCL-Based MIR Backscattering Spectroscopy: Initial Results
Even though the spectral range from ~1350 cm−1 to 1800 cm−1 contains several molecular
absorption bands of interest, high atmospheric absorption (mainly by water vapor) restricts standoff
detection distance to less than a meter. However, this does not prove prohibitive for many
applications that do not require large operation distances, e.g., for security reasons. Fast process or
quality control necessitates contact-less and non-destructive identification of chemical compounds
through liquids or on surfaces at close distances. The following section shows first results of food
quality measurements using active MIR hyperspectral imaging. Fresh and molded peanuts are
examined for their MIR backscattering characteristics and classified accordingly.
It has been reported that free fatty acid (FFA) concentration can be used as indicator for
assessing food quality. High FFA concentrations in nuts and oilseed can be linked to degraded taste
and microbiological contamination [34,35], e.g., by molds. The aim of the following measurements is
to classify peanuts according to differences in surface concentration of FFA.
Figure 12. Photograph of a car destroyed by a nearby exploded improvised explosive device (IED),which was loaded with an AN containing explosive charge. Sections of that car where residues ofunexploded ammonium nitrate were identified are expanded. AN-contaminated regions are markedin yellow; the green area indicates the illuminated area where no hazardous substances were found.Results are overlaid on the vis-image of the scene. No false alarms occurred for the other substances inthe database.
Photonics 2016, 3, 28 11 of 15
Our results were cross-checked and confirmed later by ion mobility spectrometry (IMS) analysison samples taken by swabbing. We note that the AN contamination appeared as a thin, hardly visiblelayer on most parts of the car. While the actual surface concentration of AN is unknown, results fromthe analysis of swabbing samples suggest an average coverage of some 10 µg/cm2.
3.3. Assessing Food Quality by QCL-Based MIR Backscattering Spectroscopy: Initial Results
Even though the spectral range from ~1350 cm´1 to 1800 cm´1 contains several molecularabsorption bands of interest, high atmospheric absorption (mainly by water vapor) restricts standoffdetection distance to less than a meter. However, this does not prove prohibitive for many applicationsthat do not require large operation distances, e.g., for security reasons. Fast process or quality controlnecessitates contact-less and non-destructive identification of chemical compounds through liquids oron surfaces at close distances. The following section shows first results of food quality measurementsusing active MIR hyperspectral imaging. Fresh and molded peanuts are examined for their MIRbackscattering characteristics and classified accordingly.
It has been reported that free fatty acid (FFA) concentration can be used as indicator for assessingfood quality. High FFA concentrations in nuts and oilseed can be linked to degraded taste andmicrobiological contamination [34,35], e.g., by molds. The aim of the following measurements is toclassify peanuts according to differences in surface concentration of FFA.
A QCL chip tunable from 1680 cm´1–1800 cm´1 was used for the EC-QCL module for thesemeasurements. For speckle reduction, the same measures were taken as for the long-range standoffdetection system, but in this case a 1” germanium lens sufficed for the laser projection optics, whichwas about 15 cm from the sample. The beam spot had a diameter of about 5 mm. The collection lens ofthe MCT camera (f = 100 mm, f/2) was ~50 cm from the sample, and the camera had a cold filter at4 µm.
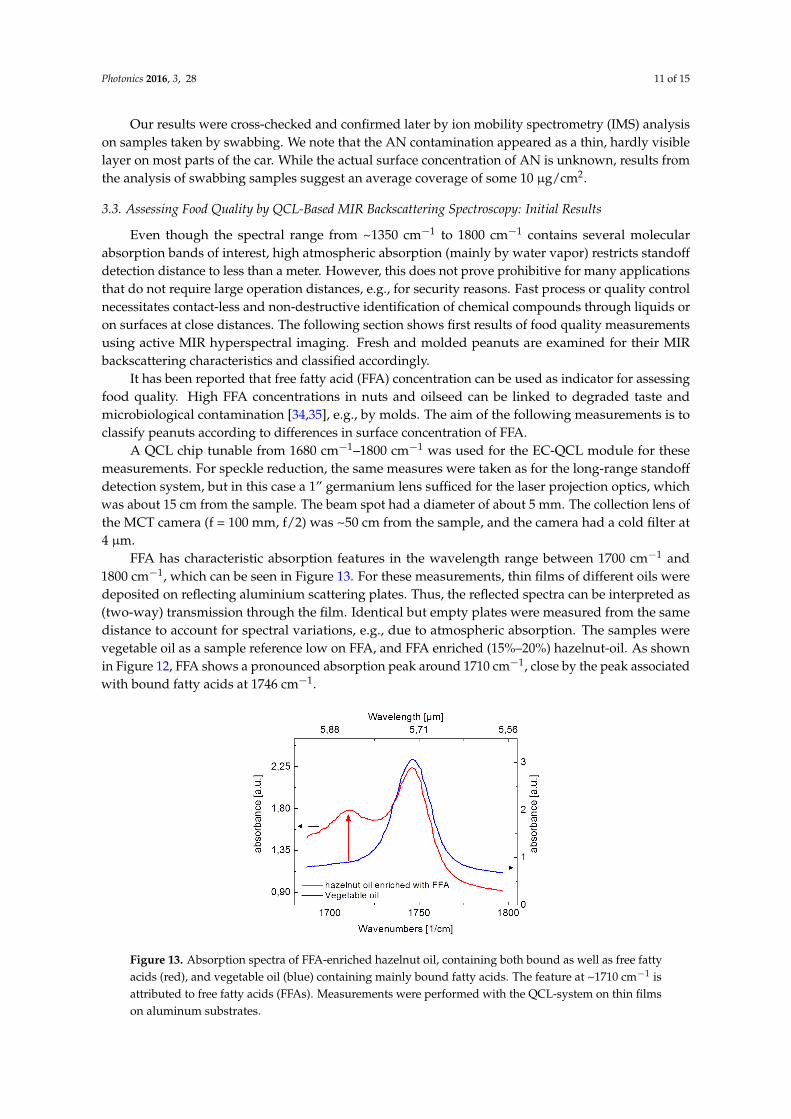
FFA has characteristic absorption features in the wavelength range between 1700 cm´1 and1800 cm´1, which can be seen in Figure 13. For these measurements, thin films of different oils weredeposited on reflecting aluminium scattering plates. Thus, the reflected spectra can be interpreted as(two-way) transmission through the film. Identical but empty plates were measured from the samedistance to account for spectral variations, e.g., due to atmospheric absorption. The samples werevegetable oil as a sample reference low on FFA, and FFA enriched (15%–20%) hazelnut-oil. As shownin Figure 12, FFA shows a pronounced absorption peak around 1710 cm´1, close by the peak associatedwith bound fatty acids at 1746 cm´1.
Photonics 2016, 3, 28 12 of 15
A QCL chip tunable from 1680 cm−1–1800 cm−1 was used for the EC-QCL module for these
measurements. For speckle reduction, the same measures were taken as for the long-range standoff
detection system, but in this case a 1” germanium lens sufficed for the laser projection optics, which
was about 15 cm from the sample. The beam spot had a diameter of about 5 mm. The collection lens
of the MCT camera (f = 100 mm, f/2) was ~50 cm from the sample, and the camera had a cold filter at
4 µm.
Figure 13. Absorption spectra of FFA-enriched hazelnut oil, containing both bound as well as free
fatty acids (red), and vegetable oil (blue) containing mainly bound fatty acids. The feature at ~1710
cm−1 is attributed to free fatty acids (FFAs). Measurements were performed with the QCL-system on
thin films on aluminum substrates.
FFA has characteristic absorption features in the wavelength range between 1700 cm−1 and 1800
cm−1, which can be seen in Figure 13. For these measurements, thin films of different oils were
deposited on reflecting aluminium scattering plates. Thus, the reflected spectra can be interpreted as
(two-way) transmission through the film. Identical but empty plates were measured from the same
distance to account for spectral variations, e.g., due to atmospheric absorption. The samples were
vegetable oil as a sample reference low on FFA, and FFA enriched (15%–20%) hazelnut-oil. As
shown in Figure 12, FFA shows a pronounced absorption peak around 1710 cm−1, close by the peak
associated with bound fatty acids at 1746 cm−1.
Afterwards, this was applied to the classification of peanuts. For this, peanuts were treated by
water immersion for 30 s, followed by 5 days at 37 °C, 90% relative humidity. A second set of fresh
peanuts provided reference spectra. The measurements can be seen in Figure 14, showing a
pronounced difference in absorption at 1710 cm−1, matching the results presented in Figure 13.
Interestingly, we find an increased intensity in the spectral region of the absorption peaks of
fatty acids. Such a behavior can be understood assuming a thin surface coverage of fatty acids, if the
reflectivity of the thin film increases in the vicinity of the absorption bands and the reflectivity of the
underlying substrate material is low [36]. While this point has to be clarified in future work, we can
conclude that the data presented in Figure 14 provide clear proof that contaminated nuts can be
identified via their MIR backscattering spectrum.
Figure 13. Absorption spectra of FFA-enriched hazelnut oil, containing both bound as well as free fattyacids (red), and vegetable oil (blue) containing mainly bound fatty acids. The feature at ~1710 cm´1 isattributed to free fatty acids (FFAs). Measurements were performed with the QCL-system on thin filmson aluminum substrates.

Photonics 2016, 3, 28 12 of 15
Afterwards, this was applied to the classification of peanuts. For this, peanuts were treatedby water immersion for 30 s, followed by 5 days at 37 ˝C, 90% relative humidity. A second set offresh peanuts provided reference spectra. The measurements can be seen in Figure 14, showing apronounced difference in absorption at 1710 cm´1, matching the results presented in Figure 13.
Photonics 2016, 3, 28 13 of 15
Figure 14. Solid lines: Backscattering spectra of fresh and mold-contaminated peanuts. The feature at
~1710 cm−1 is only present in contaminated nuts and attributed to a higher content of free fatty acids
on the nuts surface. The dotted line shows the absorbance of FFA-enriched hazelnut oil (reproduced
from Figure 13) for comparison. Right: photograph of a fresh (top) and a contaminated (bottom)
peanut. Any visible traces of mold, if present, were removed before the measurements were taken.
4. Conclusions
We reported on recent advances in rapid-scan EC-QCL, equipped with a custom-made MOEMS
scanning grating placed in Littrow configuration as wavelength-selective element. Operating this
large aperture scanning grating (5 mm in diameter) close to its mechanical resonance frequency of 1
kHz, up to 2000 spectra per second can be obtained. Analyzing the lasing spectra of the MOEMS
EC-QCL with the QCL chip driven with short-pulses and high-repetition rate both in dynamic
scanning and static mode yields a laser linewidth close to 1 cm−1 FWHM in both modes of operation.
This indicates that the wavelength jitter introduced by the fast scanning grating is well below the
spectrometer resolution (0.2 cm−1). A spectral resolution of the order of 1 cm−1 is sufficient for
spectroscopy on solids and liquids as well as for a range of applications in gas spectroscopy. To test
the rapid-scan MOEMS EC-QCL in practical spectroscopic applications, transmission spectra were
recorded from polystyrene as well as backscattering spectra from explosives and harmless reference
materials. In the latter case, the data acquisition time for recording spectra with a comparable
signal-to-noise ratio could be reduced from 20 s to 50 ms, i.e., by a factor of 400, when switching from
a conventional EC-QCL with a classical, mechanically scanned grating to the rapid-scan MOEMS
EC-QCL.
In addition we reported on case studies of EC-QCL-based MIR fingerprint spectroscopy. One
example was the use of EC-QCL in transmission measurements as an analytical tool for monitoring
chemical reactions in real time. This particular application will benefit significantly from the use of
rapid-scan MOEMS EC-QCL. Furthermore, we presented recent advances in EC-QCL based MIR
backscattering spectroscopy (a) over larger distances of 10–20 m for the detection of hazardous
materials, now tested and validated outdoors in relevant scenarios; and (b) initial tests over short
distances to assess the quality of food.
Acknowledgments: This work was financed by the European FP7 projects MIRIFISens, EMPHASIS and
HYPERION as well as by the Fraunhofer internal project KompLas.
Author Contributions: F. Fuchs, R. Ostendorf, M. Rattunde, S. Hugger and J. Wagner conceived and designed
the experiments; L. Butschek, J. Jarvis and S. Hugger performed the experiments; J. Grahmann and A. Merten
contributed the MOEMS scanners; D. Boskovic performed the measurements of the Knoevenagel condensation;
K. Rieblinger and T. Tybussek were responsible for the chemical aspect of the food quality measurements; Q.
Figure 14. Solid lines: Backscattering spectra of fresh and mold-contaminated peanuts. The feature at~1710 cm´1 is only present in contaminated nuts and attributed to a higher content of free fatty acids onthe nuts surface. The dotted line shows the absorbance of FFA-enriched hazelnut oil (reproduced fromFigure 13) for comparison. Right: photograph of a fresh (top) and a contaminated (bottom) peanut.Any visible traces of mold, if present, were removed before the measurements were taken.
Interestingly, we find an increased intensity in the spectral region of the absorption peaks of fattyacids. Such a behavior can be understood assuming a thin surface coverage of fatty acids, if thereflectivity of the thin film increases in the vicinity of the absorption bands and the reflectivity ofthe underlying substrate material is low [36]. While this point has to be clarified in future work, wecan conclude that the data presented in Figure 14 provide clear proof that contaminated nuts can beidentified via their MIR backscattering spectrum.
4. Conclusions
We reported on recent advances in rapid-scan EC-QCL, equipped with a custom-made MOEMSscanning grating placed in Littrow configuration as wavelength-selective element. Operating this largeaperture scanning grating (5 mm in diameter) close to its mechanical resonance frequency of 1 kHz,up to 2000 spectra per second can be obtained. Analyzing the lasing spectra of the MOEMS EC-QCLwith the QCL chip driven with short-pulses and high-repetition rate both in dynamic scanning andstatic mode yields a laser linewidth close to 1 cm´1 FWHM in both modes of operation. This indicatesthat the wavelength jitter introduced by the fast scanning grating is well below the spectrometerresolution (0.2 cm´1). A spectral resolution of the order of 1 cm´1 is sufficient for spectroscopy onsolids and liquids as well as for a range of applications in gas spectroscopy. To test the rapid-scanMOEMS EC-QCL in practical spectroscopic applications, transmission spectra were recorded frompolystyrene as well as backscattering spectra from explosives and harmless reference materials. In thelatter case, the data acquisition time for recording spectra with a comparable signal-to-noise ratio couldbe reduced from 20 s to 50 ms, i.e., by a factor of 400, when switching from a conventional EC-QCLwith a classical, mechanically scanned grating to the rapid-scan MOEMS EC-QCL.
In addition we reported on case studies of EC-QCL-based MIR fingerprint spectroscopy.One example was the use of EC-QCL in transmission measurements as an analytical tool for monitoringchemical reactions in real time. This particular application will benefit significantly from the use of
Photonics 2016, 3, 28 13 of 15
rapid-scan MOEMS EC-QCL. Furthermore, we presented recent advances in EC-QCL based MIRbackscattering spectroscopy (a) over larger distances of 10–20 m for the detection of hazardousmaterials, now tested and validated outdoors in relevant scenarios; and (b) initial tests over shortdistances to assess the quality of food.
Acknowledgments: This work was financed by the European FP7 projects MIRIFISens, EMPHASIS andHYPERION as well as by the Fraunhofer internal project KompLas.
Author Contributions: F. Fuchs, R. Ostendorf, M. Rattunde, S. Hugger and J. Wagner conceived and designedthe experiments; L. Butschek, J. Jarvis and S. Hugger performed the experiments; J. Grahmann and A. Mertencontributed the MOEMS scanners; D. Boskovic performed the measurements of the Knoevenagel condensation;K. Rieblinger and T. Tybussek were responsible for the chemical aspect of the food quality measurements; Q. Yangwas responsible for laser design; C. Schilling performed laser packaging and coating; R. Ostendorf, L. Butschek,S. Hugger and J. Wagner wrote the paper.
Conflicts of Interest: The authors declare no conflict of interest.
References
1. Ostendorf, R.; Butschek, L.; Merten, A.; Grahmann, J.; Jarvis, J.; Hugger, S.; Fuchs, F.; Wagner, J.Real-time spectroscopic sensing using a widely tunable external cavity-QCL with MOEMS diffractiongrating. Proc. SPIE 2016, 9755, 975507–975508.
2. Hugger, S.; Fuchs, F.; Jarvis, J.-P.; Yang, Q.; Rattunde, M.; Ostendorf, R.; Schilling, C.; Driad, R.; Bronner, W.;Aidam, R.; et al. Quantum Cascade Laser based active hyperspectral imaging for standoff detection ofchemicals on surfaces. SPIE Proc. 2016, 9755, 97550A–97550A-11.
3. Faist, J. Quantum Cascade Lasers; Oxford University Press: Oxford, UK, 2013.4. Capasso, F. High-performance midinfrared quantum cascade lasers. Opt. Eng. 2010, 49, 111102. [CrossRef]5. Razeghi, M.; Bai, Y.; Slivken, S.; Darvish, S.R. High-performance InP-based midinfrared quantum cascade
lasers at Northwestern University. Opt. Eng. 2010, 49, 111103. [CrossRef]6. Wörle, K.; Seichter, F.; Wilk, A.; Armacost, C.; Day, T.; Godejohann, M.; Wachter, U.; Vogt, J.; Radermacher, P.;
Mizaikoff, B. Breath analysis with broadly tunable quantum cascade lasers. Anal. Chem. 2013, 85, 2697–2702.[CrossRef] [PubMed]
7. Beskers, T.F.; Brandstetter, M.; Kuligowski, J.; Quintás, G.; Wilhelm, M.; Lendl, B. High performance liquidchromatography with mid-infrared detection based on a broadly tunable quantum cascade laser. Analyst2014, 139, 2057–2064. [CrossRef] [PubMed]
8. Lambrecht, A.; Pfeifer, M.; Konz, W.; Herbst, J.; Axtmann, F. Broadband spectroscopy with external cavityquantum cascade lasers beyond conventional absorption measurements. Analyst 2014, 139, 2070–2078.[CrossRef] [PubMed]
9. Phillips, M.C.; Taubman, M.S.; Bernacki, B.E.; Cannon, B.D.; Stahl, R.D.; Schiffern, J.T.; Myers, T.L.Real-time trace gas sensing of fluorocarbons using a swept-wavelength external cavity quantum cascadelaser. Analyst 2014, 139, 2047–2056. [CrossRef] [PubMed]
10. Hugi, A.; Terazzi, R.; Bonetti, Y.; Wittmann, A.; Fischer, M.; Beck, M.; Faist, J.; Gini, E. External cavityquantum cascade laser tunable from 7.6 to 11.4 µm. Appl. Phys. Lett. 2009, 95, 061103. [CrossRef]
11. Daylight Solutions. Available online: http://www.daylightsolutions.com/assets/005/5453.pdf (accessed on31 March 2016).
12. Block Engineering. Available online: http://www.blockeng.com/products/lasertune.pdf (accessed on 31March 2016).
13. Fuchs, F.; Hugger, S.; Yang, Q.; Kinzer, M.; Bronner, W.; Lösch, R.; Aidam, R.; Degreif, K.; Konz, W.;Rademacher, S.; et al. Standoff Detection of Explosives and High Sensitive Detection of Chemicals inDrinking Water with Quantum Cascade Lasers. In Lasers, Sources, and Related Photonic Devices; Optical Societyof America: Miami, FL, USA, 2012; p. LM2B.6.
14. Wagner, J.; Ostendorf, R.; Grahmann, J.; Merten, A.; Hugger, S.; Jarvis, J.-P.; Fuchs, F.; Boskovic, D.; Schenk, H.Widely tunable quantum cascade lasers for spectroscopic sensing. In SPIE OPTO; Razeghi, M., Tournié, E.,Brown, G.J., Eds.; International Society for Optics and Photonics: Baltimore, MD, USA, 2015; p. 937012.

Photonics 2016, 3, 28 14 of 15
15. Hinkov, B.; Fuchs, F.; Yang, Q.K.; Kaster, J.M.; Bronner, W.; Aidam, R.; Köhler, K.; Wagner, J.Time-resolved spectral characteristics of external-cavity quantum cascade lasers and their applicationto stand-off detection of explosives. Appl. Phys. B Lasers Opt. 2010, 100, 253–260. [CrossRef]
16. Fuchs, F.; Hugger, S.; Kinzer, M.; Aidam, R.; Bronner, W.; Lösch, R.; Yang, Q.; Degreif, K.; Schnürer, F.Imaging standoff detection of explosives using widely tunable midinfrared quantum cascade lasers. Opt. Eng.2010, 49, 111127. [CrossRef]
17. Fuchs, F.; Hugger, S.; Kinzer, M.; Yang, Q.; Bronner, W.; Aidam, R.; Degreif, K.; Rademacher, S.; Schnürer, F.;Schweikert, W. Standoff detection of explosives with broad band tunable external cavity quantum cascadelasers. SPIE Proc. 2012, 8268, 82681N–82681N-9.
18. Fuchs, F.; Hugger, S.; Yang, Q.; Jarvis, J.-P.; Kinzer, M.; Ostendorf, R.; Schilling, C.; Driad, R.; Bronner, W.;Bächle, A.; et al. The Wonder of Nanotechnology: Present and Future of Optoelectronics Quantum Devices and TheirApplications for Environment, Health, Security and Energy; SPIE Press Book: Bellingham, WA, USA, 2013.
19. Daylight Solutions. Available online: http://www.daylightsolutions.com/assets/001/5023.pdf (accessed on31 March 2016).
20. Tsai, T.; Wysocki, G. External-cavity quantum cascade lasers with fast wavelength scanning. Appl. Phys. B2010, 100, 243–251. [CrossRef]
21. Hugger, S.; Fuchs, F.; Jarvis, J.; Kinzer, M.; Yang, Q.K.; Driad, R.; Aidam, R.; Wagner, J. Broadband-tunableexternal-cavity quantum cascade lasers for spectroscopy and stand-off detection. Proc. SPIE 2013, 8631,645–672.
22. Yang, Q.; Fuchs, F.; Wagner, J. Quantum cascade lasers (QCL) for active hyperspectral imaging.Adv. Opt. Technol. 2014, 3, 141–150. [CrossRef]
23. Lyakh, A.; Barron-Jimenez, R.; Dunayevskiy, I.; Go, R.; Patel, C.K.N. External cavity quantum cascade laserswith ultra rapid acousto-optic tuning. Appl. Phys. Lett. 2015, 106, 141101. [CrossRef]
24. Grahmann, J.; Merten, A.; Ostendorf, R.; Fontenot, M.; Bleh, D.; Schenk, H.; Wagner, H.-J. Tunable ExternalCavity Quantum Cascade Lasers (EC-QCL): An application field for MOEMS based scanning gratings.Proc. SPIE 2014, 8977, 897708.
25. Alcaráz, M.R.; Schwaighofer, A.; Kristament, C.; Ramer, G.; Brandstetter, M.; Goicoechea, H.; Lendl, B.External-Cavity Quantum Cascade Laser Spectroscopy for Mid-IR Transmission Measurements of Proteinsin Aqueous Solution. Anal. Chem. 2015, 87, 6980–6987. [CrossRef] [PubMed]
26. Palmer, C.; Loewen, E. Diffraction Grating Handbook; Newport Corporation: New York, NY, USA, 2005;Volume 6.
27. Yang, Q.; Lösch, R.; Bronner, W.; Hugger, S.; Fuchs, F.; Aidam, R.; Wagner, J. High-peak-powerstrain-compensated GaInAs/AlInAs quantum cascade lasers (λ = 4.6 µm) based on a slightly diagonalactive region design. Appl. Phys. Lett. 2008, 93, 251110. [CrossRef]
28. Wysocki, G.; Lewicki, R.; Curl, R.F.; Tittel, F.K.; Diehl, L.; Capasso, F.; Troccoli, M.; Hofler, G.; Bour, D.;Corzine, S.; et al. Widely tunable mode-hop free external cavity quantum cascade lasers for high resolutionspectroscopy and chemical sensing. Appl. Phys. B 2008, 92, 305–311. [CrossRef]
29. Bula, W.P.; Verboom, W.; Reinhoudt, D.N.; Gardeniers, H.J.G.E. Multichannel quench-flow microreactor chipfor parallel reaction monitoring. Lab Chip 2007, 7, 1717–1722. [CrossRef] [PubMed]
30. Karabudak, E.; Mojet, B.L.; Schlautmann, S.; Mul, G.; Gardeniers, H.J.G.E. Attenuated TotalReflection-Infrared Nanofluidic Chip with 71 nL Detection Volume for in Situ Spectroscopic Analysisof Chemical Reaction Intermediates. Anal. Chem. 2012, 84, 3132–3137. [CrossRef] [PubMed]
31. Jarvis, J.; Fuchs, F.; Hugger, S.; Blattmann, V.; Yang, K.Q.; Ostendorf, R.; Bronner, W.; Driad, R.; Aidam, R.;Wagner, J.; et al. Trace Detection of Explosive Substances in Hyperspectral Imagery. In Proceedings of the 9thFuture Security Research Conference, Fraunhofer Verlag, Berlin, 16–18 September 2014; pp. 241–247.
32. Jarvis, J.; Fuchs, F.; Hugger, S.; Blattmann, V.; Yang, K.Q.; Ostendorf, R.; Bronner, W.; Driad, R.; Aidam, R.;Wagner, J.; et al. Hyperspectral Image Analyses for Standoff Detection of Explosives. In Proceedings of the8th Future Security Research Conference, Fraunhofer Verlag, Berlin, 17–19 September 2013; pp. 205–214.
33. Fuchs, F.; Hugger, S.; Jarvis, J.; Blattmann, V.; Kinzer, M.; Yang, Q.K.; Ostendorf, R.; Bronner, W.;Driad, R.; Aidam, R.; et al. Infrared hyperspectral standoff detection of explosives. Proc. SPIE 2013,8710, 87100I–87100I–8.
34. Angelo, A.J.; Ory, R.L. Lipid degradation during seed deterioration. Phytopathology 1983, 73, 315–317.[CrossRef]

Photonics 2016, 3, 28 15 of 15
35. Sztajer, H.; Maliszewska, I.; Wieczorek, J. Production of exogenous lipases by bacteria, fungi, andactinomycetes. Enzyme Microb. Technol. 1988, 10, 497. [CrossRef]
36. Hinkov, B.; Fuchs, F.; Kaster, J.M.; Yang, Q.; Bronner, W.; Aidam, R.; Köhler, K. Broad band tunable quantumcascade lasers for stand-off detection of explosives. Proc. SPIE 2009, 7484. [CrossRef]
© 2016 by the authors; licensee MDPI, Basel, Switzerland. This article is an open accessarticle distributed under the terms and conditions of the Creative Commons Attribution(CC-BY) license (http://creativecommons.org/licenses/by/4.0/).