Resonant and scatterometric grating-based nanophotonic structures for biosensing
Upload
independentCategory
view
1download
0
IEEE JOURNAL OF SELECTED TOPICS IN QUANTUM ELECTRONICS, VOL. 1, NO. 2, JUNE 1995 505
Small-Signal IM Response of Grating-Terminated External Cavity Semiconductor Lasers
Zaheer Ahmed, Student Member, IEEE, and Rodney S. Tucker, Fellow, IEEE
Abstruct-The small-signal intensity modulation response and the CW noise spectrum of a semiconductor laser coupled to an external cavity are known to be enhanced in narrow peaks centerd around the harmonics of the cavity resonance frequency. We have previously shown that each resonance peak of the response exhibits an amplitude discontinuity near the harmonics of cavity resonance frequency. In this paper, we show that each peak of the noise spectrum is bifurcated into a pair of closely spaced peaks of different amplitudes and bandwidths. A comprehensive analytical model is developed to investigate the discontinuity of response peaks and to study the effect of various parameters on their bandwidth and modulation efficiency. It is shown that strong optical feedback, strong gain compression and dc bias above threshold reduce the modulation efficiency but increase the modulation bandwidth.
I. INTRODUCTION HE USE of optical fibers for efficient transport of T millimeter-wave signals for applications such as phased-
array radar communications, remote synchronization of antennas and narrow-band SCM systems [ 11-[4] has been a subject of intense interest in recent years. Light modulation at millimeter-wave frequencies (>30 GHz) can be achieved by direct intensity modulation (IM) of conventional Fabry-Perot laser chips [5], [6], external modulation of CW light [7], optical heterodyning and similar techniques [8], [9] and narrow-band direct IM of external cavity lasers (ECL’s) [lo]-[12]. Direct IM and external modulation schemes are limited by the modulation bandwidth of the intrinsic laser and external modulator to the low end of the millimeter- wave band. The optical heterodyning technique requires narrow linewidth lasers whose operating wavelengths must be tightly controlled using phase locking schemes [13], [44]. A relatively simple approach for obtaining high efficiency narrow bandwidth optical modulation in the millimeter-wave or submillimeter-wave frequency range is to employ resonantly enhanced ECL’s [ 101-[12], [14]-[16]. In this technique, the small-signal modulation response of a semiconductor laser coupled to a mirror terminated external cavity is resonantly enhanced in narrow bands centerd at frequencies integer multiples of the resonance frequency of the external cavity [lo]-[ 121, [ 141-1 171. This resonant enhancement of
Manuscript received October 17, 1994; revised January 25, 1995. The authors are with the Photonics Research Laboratory, Department of
Electrical and Electronic Engineering, University of Melbourne, Parkville, VIC 3052 Australia.
IEEE Log Number 941 1152.
the modulation response enables an ordinary laser chip (with bandwidth of a few gigahertz) to be modulated at frequencies much higher than its intrinsic modulation bandwidth. Using resonantly enhanced ECL’s, several narrow band SCM systems operating at millimeter-wave frequencies have recently been demonstrated [ 171, [ 181 and frequencies approaching 100 GHz are feasible [12].
Many analytical models to characterize the small-signal IM response of ECL’s have been described in the literature [lo]-[12], [14]-[17]. The approach used by Glasser [lo] to derive an analytical relation describing the resonant enhance- ment of the IM response of an ECL, is relatively simple because it ignores losses in the cavity and does not take into account the effect of feedback strength. Lau [12], [14] has derived the IM response function for a laser chip with an integrated waveguide cavity. Lau’s model does not consider finite reflection resulting from the interface between the chip facet and the waveguide cavity. Such reflection is normally present in laser chips coupled to mirror-terminated air cavities. In ECL’s the effect of optical feedback from the mirror can be considered by including an additional term in the photon density rate equation. Using such an approach, Femera et al. [19] presented a detailed treatment of the enhancement of RIN, IM and FM response of an ECL. However, the effect of multiple reflections in the cavity and the strength of the external optical feedback on the modulation response was not considered. Extending the approach of Glasser [lo], Nagarajan et al. [ 171 developed an analytical model that considers losses in the cavity and gain compression. But like Lau, it does not take into account the effect of residual reflectivity of the AR-coated facet and strength of the optical feedback on the modulation response. Dods et al. [16] have developed a comprehensive theoretical model for a laser modulated near the cavity resonance frequency. Their analysis shows different modulation response depending on whether the light is observed from the right hand side or the left hand side of the composite cavity. Their analysis neglects gain compression and does not consider the effect of feedback strength on the amplitude of response peaks.
In [20], we reported that each resonance peak of the IM response of an ECL exhibits an amplitude discontinuity in the vicinity of the cavity resonance frequency. In this paper we present a detailed study of this behavior and relate it to the bifurcation of RIN spectrum of the laser. The effect of various parameters on the bandwidth and modulation efficiency of each resonance peak of the IM response is
1077-260X/95$04.00 0 1995 IEEE
506 IEEE JOURNAL OF SELECTED TOPICS IN QUANTUM ELECTRONICS, VOL. I , NO. 2, JUNE 1995
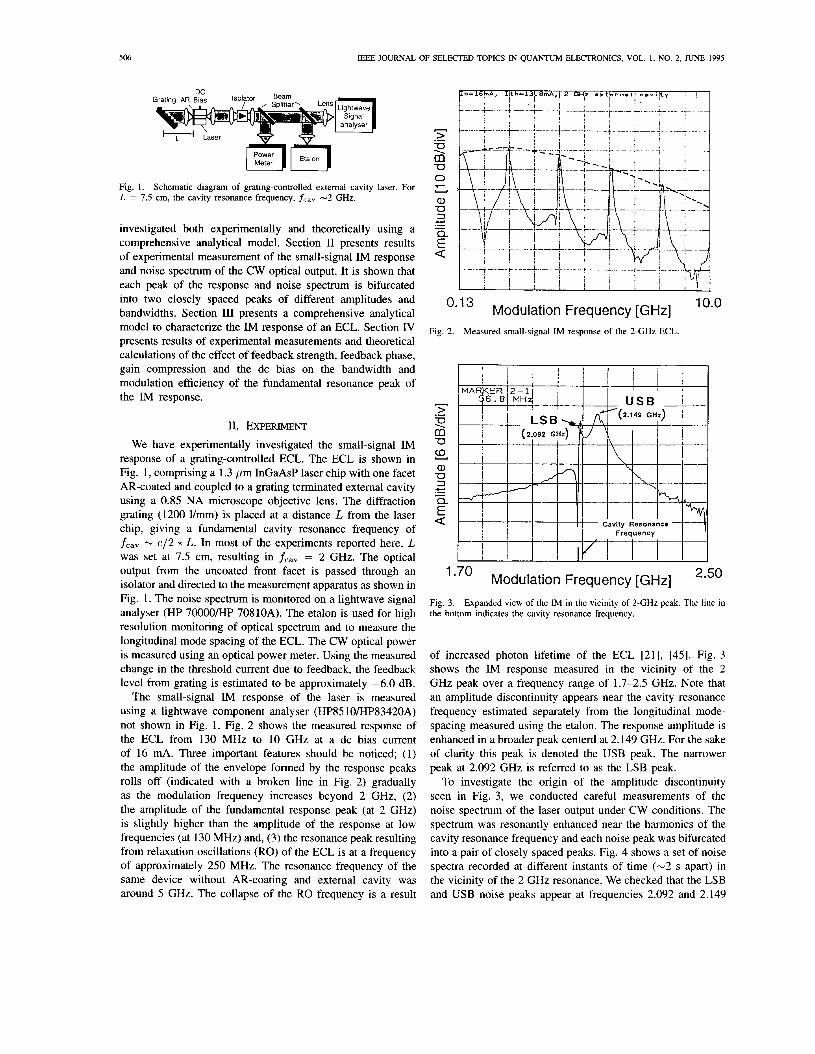
Fig. 1 . L = 7.5 cm, the cavity resonance frequency, fc,, -2 GHz.
Schematic diagram of grating-controlled external cavity laser. For
investigated both experimentally and theoretically using a comprehensive analytical model. Section I1 presents results of experimental measurement of the small-signal IM response and noise spectrum of the CW optical output. It is shown that each peak of the response and noise spectrum is bifurcated into two closely spaced peaks of different amplitudes and bandwidths. Section 111 presents a comprehensive analytical model to characterize the IM response of an ECL. Section IV presents results of experimental measurements and theoretical calculations of the effect of feedback strength, feedback phase, gain compression and the dc bias on the bandwidth and modulation efficiency of the fundamental resonance peak of the IM response.
11. EXPERIMENT We have experimentally investigated the small-signal IM
response of a grating-controlled ECL. The ECL is shown in Fig. 1, comprising a 1.3 pm InGaAsP laser chip with one facet AR-coated and coupled to a grating terminated external cavity using a 0.85 NA microscope objective lens. The diffraction grating (1 200 Y m m ) is placed at a distance L from the laser chip, giving a fundamental cavity resonance frequency of fcav - c/2 * L. In most of the experiments reported here, L was set at 7.5 cm, resulting in fcav = 2 GHz. The optical output from the uncoated front facet is passed through an isolator and directed to the measurement apparatus as shown in Fig. 1. The noise spectrum is monitored on a lightwave signal analyser (HP 70000kIP 70810A). The etalon is used for high resolution monitoring of optical spectrum and to measure the longitudinal mode spacing of the ECL. The CW optical power is measured using an optical power meter. Using the measured change in the threshold current due to feedback, the feedback level from grating is estimated to be approximately -6.0 dB.
The small-signal IM response of the laser is measured using a lightwave component analyser (HP85 10kIP83420A) not shown in Fig. 1. Fig. 2 shows the measured response of the ECL from 130 MHz to 10 GHz at a dc bias current of 16 mA. Three important features should be noticed; (1) the amplitude of the envelope formed by the response peaks rolls off (indicated with a broken line in Fig. 2) gradually as the modulation frequency increases beyond 2 GHz, (2) the amplitude of the fundamental response peak (at 2 GHz) is slightly higher than the amplitude of the response at low frequencies (at 130 MHz) and, (3) the resonance peak resulting from relaxation oscillations (RO) of the ECL is at a frequency of approximately 250 MHz. The resonance frequency of the same device without AR-coating and external cavity was around 5 GHz. The collapse of the RO frequency is a result
10.0 Modulation Frequency [GHz] Fig. 2. Measured small-signal IM response of the 2-GHz ECL
2.50 ’ -70 Modulation Frequency [GHz] Fig. 3. the bottom indicates the cavity resonance frequency.
Expanded view of the IM in the vicinity of 2-GHz peak. The line in
of increased photon lifetime of the ECL [21], [45]. Fig. 3 shows the IM response measured in the vicinity of the 2 GHz peak over a frequency range of 1.7-2.5 GHz. Note that an amplitude discontinuity appears near the cavity resonance frequency estimated separately from the longitudinal mode- spacing measured using the etalon. The response amplitude is enhanced in a broader peak centerd at 2.149 GHz. For the sake of clarity this peak is denoted the USB peak. The narrower peak at 2.092 GHz is referred to as the LSB peak.
To investigate the origin of the amplitude discontinuity seen in Fig. 3, we conducted careful measurements of the noise spectrum of the laser output under CW conditions. The spectrum was resonantly enhanced near the harmonics of the cavity resonance frequency and each noise peak was bifurcated into a pair of closely spaced peaks. Fig. 4 shows a set of noise spectra recorded at different instants of time (-2 s apart) in the vicinity of the 2 GHz resonance. We checked that the LSB and USB noise peaks appear at frequencies 2.092 and 2.149

AHMED AND TUCKER: SMALL-SIGNAL IM RESPONSE OF GRATING-TERMINATED EXTERNAL CAVITY SEMICONDUCTOR LASERS 507
cavity Resonance Frequency
1.70 Frequency, GHz 2.50
Fig. 4. video bandwidth = 10 KHz.
Time resolved noise spectrum. Resolution bandwidth = 3 MHz,
GHz respectively, similar to those observed in the IM response of Fig. 3. It can be noticed in Fig. 4 that the amplitude of the LSB peak fluctuates randomly by as much as 20 dB or more. This may be caused by spontaneous noise that is resonantly enhanced through multiple round-trips of the cavity.
We found that the amplitude and frequency of the USB peak depends sensitively on the dc-bias current above threshold, the feedback strength and the external cavity length. For constant feedback strength and external cavity length, the USB peak frequency increases linearly with the square-root of output optical power. This can be noticed from Fig. 5(a), which shows the displacement of the USB peak from the LSB peak as a function of the square-root of output optical power. The closed symbols in this figure are the measured values of the displacement of the USB peak from the LSB peak as obtained from the IM response and line is a fit to the experimental data. Also shown in Fig. 5(a) are the values of the resonance frequency of the RO of the ECL measured separately with a low frequency network analyser. Note the close correlation between the open and closed symbols. Fig. 5(b) shows the frequency of USB peak extracted from the noise data of Fig. 4. We believe that the USB noise peak at 2.149 GHz results from the translation of the low frequency modulation response to the harmonics of cavity resonance frequency. While the LSB peak, due to its close proximity with the cavity resonance frequency, probably represents noise that has been resonantly enhanced by the cavity.
The double peak spectrum similar to the one shown in Fig. 4, has been reported by Sat0 et al. [22] and Besnard et al. [23]. Sat0 attributed this to be resulting from beating of unequally spaced longitudinal modes. Besnard suggested multimode lasing to be the origin. While this might be true for an ECL oscillating in several multiple modes, it does not seem to hold for the case of ECL subject to frequency selective optical feedback from a grating. We checked that the optical spectrum of the laser at 16 mA was stable single mode. Port et al. [24] have argued that the double peak spectrum can be representative of complex relaxation oscillations of the ECL, however their experimental and theoretical results differ widely. Recently Lau et al. [25] have reported the translation of low frequency RIN to high frequencies through beating with a high frequency modulation signal. We believe that the USB
120
n N I B 80 U
* 0 c Q) 3 40 v
U. E
0 0 1 0 2 0 3 0
Square-root of Optical Power [uw]”’
(a)
21 00 n N r 5 U
2080 r 0 S a, J
2060 2 U,
Y m 2 2040
m v) 3
2020y ’ ’ ’ ’ ‘ ’ ’ .
Square-root of Optical Power [uW] 0 1 0 2 0 3 0
(b)
Fig. 5 . (a) Displacement of the USB peak frequency from the LSB peak. Open symbols are the measured values of the intrinsic resonance frequency of the laser chip in cavity. (b) Frequency of the USB peak extracted from the noise data of Fig. 4.
peak in Fig. 4 result from a similar process. However instead of beating with an externally imposed signal, the translation in ECL’s occurs due to resonant enhancement of the modulation response.
111. ANALYTICAL MODEL FOR IM RESPONSE OF AN ECL
To investigate why a discontinuity appears in the modulation response and to identify various contributing parameters we have developed an analytical model of the ECL. In the following theoretical formalism we consider losses in the external cavity, residual reflectivity of AR-coated facet, gain compression, coupling between the amplitude and phase of the optical field described by linewidth enhancement factor, the strength and the phase of optical feedback.
508 IEEE JOURNAL OF SELECTED TOPICS IN QUANTUM ELECTRONICS, VOL. 1 , NO. 2, JUNE 1995
volume V . Expressing the complex field of (2) as t - - - - - t - - L +
(3) E,(t) = E ( t ) exp (j(2,vt + 4 ( t ) ) )
where E ( t ) is the slowly varying envelope of complex field, $(t) is the time-varying phase of the complex electric field and v is the steady-state radian frequency of laser oscillations in the presence of optical feedback. Substituting (3) in ( I ) and (2), one gets
' e x r 11 [ r
.4.4;aatir% ..11,111.. "I... E&
.*M.~ 1.1.1 Clexp(-j2nLXJEofr-TJ LASER .-w - C2exp(-j4nLXJEofr-2TJ
.*(llIl.. C3exp(-j61rLXJEo(r-3TJ
Optical ,,,,...("I ....... output ". ....,, ~ .... I
..,I, (IC ......
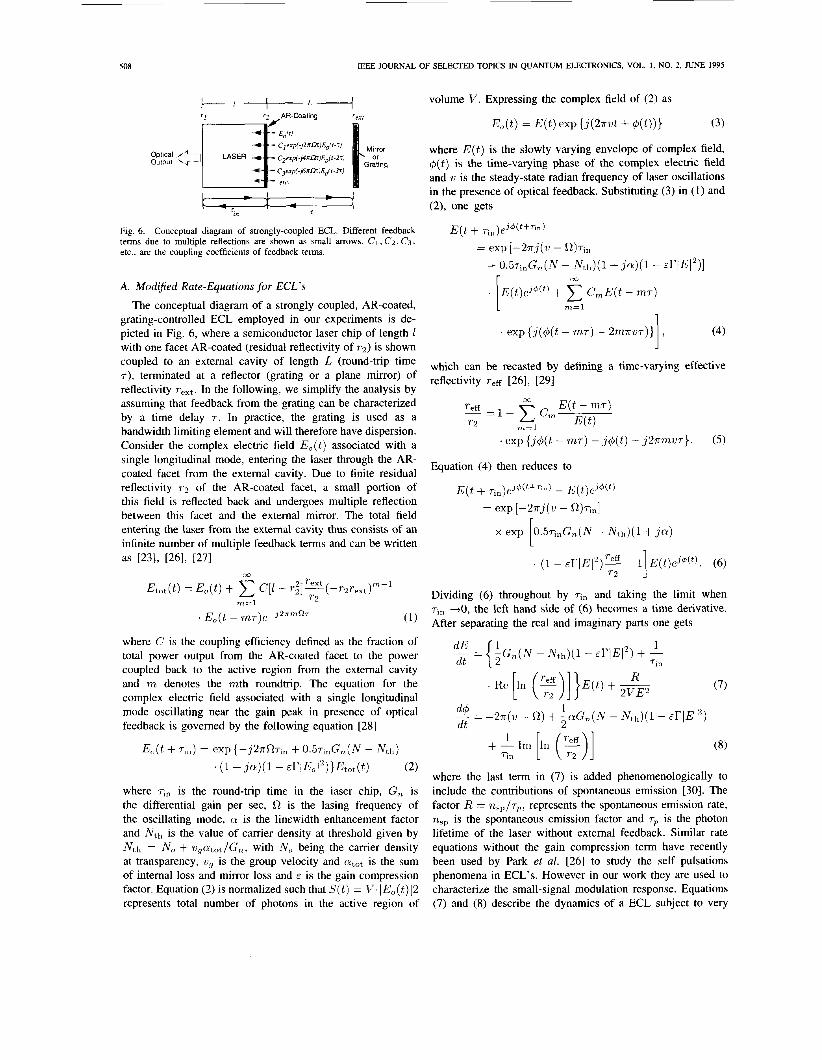
Fig. 6. Conceptual diagram of strongly-coupled ECL. Different feedback terms due to multiple reflections are shown as small arrows. Ci. C.L. C3. etc., are the coupling coefficients of feedback terms.
E( t + 7' In )e'd(t+Tin)
= exp [ - 2 ? ~ j ( v - O)qn f 0.5qnG,(N - Nth)(l +ja)( l - ErlE12)]
A. Mod$ed Rate-Equations for ECL's
The conceptual diagram of a strongly coupled, AR-coated, grating-controlled ECL employed in our experiments is de- picted in Fig. 6, where a semiconductor laser chip of length l with one facet AR-coated (residual reflectivity of 7-2) is shown coupled to an external cavity of length L (round-trip time T ) , terminated at a reflector (grating or a plane mirror) of reflectivity Text. In the following, we simplify the analysis by assuming that feedback from the grating can be characterized by a time delay 7 . In practice, the grating is used as a bandwidth limiting element and will therefore have dispersion. Consider the complex electric field E,(t) associated with a single longitudinal mode, entering the laser through the AR- coated facet from the external cavity. Due to finite residual reflectivity r2 of the AR-coated facet, a small portion of this field is reflected back and undergoes multiple reflection between this facet and the external mirror. The total field entering the laser from the external cavity thus consists of an infinite number of multiple feedback terms and can be written as [231, [261, [271
. E,(t - r r i ~ ) e - ~ ~ ~ ~ ~ ~ (1)
where C is the coupling efficiency defined as the fraction of total power output from the AR-coated facet to the power coupled back to the active region from the external cavity and m denotes the mth roundtrip. The equation for the complex electric field associated with a single longitudinal mode oscillating near the gain peak in presence of optical feedback is governed by the following equation [28]
Eo(t + Tiin) = eXp {-j2?Tflqn + 0.5~i,G,(N - N t h )
' (1 + . j N ) ( 1 - E ~ l E o 1 2 ) ) E t o t ( t ) (2)
where 7;, is the round-trip time in the iaser chip, G, is the differential gain per sec, 0 is the lasing frequency of the oscillating mode, a is the linewidth enhancement factor and Nth is the value of carrier density at threshold given by Nth = No + vgatot/G,, with No being the carrier density at transparency, vg is the group velocity and atot is the sum of internal loss and mirror loss and E is the gain compression factor. Equation ( 2 ) is normalized such that S ( t ) = V.[E,(t)12 represents total number of photons in the active region of
r 00
J
which can be recasted by defining a time-varying effective reflectivity reff [26], [291
00 T"ff=l-Ccm E(1 - WLT)
7-2 m=l E ( t ) . exp { j $ ( t - m ~ ) - j I$(t) - j 2 ~ m v ~ ) . ( 5 )
Equation (4) then reduces to
E ( t + Tin)e?d(t+'1n) - E(t)eJ+(t) = exp [-2?Tj(v - G)7;,]
O.57;,Gn(N - Nth)(l +.ja)
Dividing (6) throughout by ~i~ and taking the limit when T,, 4 0 , the left hand side of (6) becomes a time derivative. After separating the real and imaginary parts one gets
+ Tin Im [In (:)I (7)
where the last term in (7) is added phenomenologically to include the contributions of spontaneous emission [30]. The factor R = nsp / rp , represents the spontaneous emission rate, nSp is the spontaneous emission factor and rp is the photon lifetime of the laser without external feedback. Similar rate equations without the gain compression term have recently been used by Park et al. [26] to study the self pulsations phenomena in ECL's. However in our work they are used to characterize the small-signal modulation response. Equations (7) and (8) describe the dynamics of a ECL subject to very

AHMED AND TUCKER: SMALL-SIGNAL IM RESPONSE OF GRATING-TERMINATED EXTERNAL CAVITY SEMICONDUCTOR LASERS 509
strong optical feedback and are augmented by carrier density equation
- - d N - N ( t ) Gn(N - N,,)(l - ErlE(2)E( t )2 . (9) d t qv 7,
Where l ( t ) is the injection current, q is electronic charge and V is the active region volume, r, represents carrier lifetime given by r, = { A N + B N 2 + C N 3 } - l , where A , B , and C are the monomolecular, bimolecular and auger recombination constants, respectively. For sake of attaining a close form for the modulation response function we neglect the carrier dependence of rn and assume it as a constant with a value determined near threshold.
B. Linearized Rate Equations and System Determinant
To acquire the IM response function we linearize (7)-(9) around the steady state values of their parameters and use the following set of equations
I ( t ) = 7 + Aiez t , 4(t) = @ + A4ezt, N ( t ) = + AneZt
E ( t ) = E + Aeezt
g ( t ) = 9 + Agezt (10)
where z = j2nf is a imaginary number and
with
(12)
where the “bars” and “deltas” indicate steady-state and small- signal values respectively. The linearized equations are ob- tained by substituting the set (10) and (11) in (7)-(9) and neglecting all higher order terms and the products of the small-signal terms. Assuming the change in laser oscillation frequency due to optical feedback (i.e., ZI - 0) is small and setting @ = 0, linearization of (1 1) results, after simplifications
Ag = ( E f s - vfc)A4 + Av fs - E f c P 4 + ( E f c + v f s )
Using (10)-(12) in (7) and (8) one gets
where we have used -2 1 1
TP 2VE ‘Q Tn
z R - ’ =Erm $7, - = - + G , E ,
00
f c = cm cosmwr(1 - e?-), m=l
00
m=l
Equations (14)-(16) can now be solved by putting them in Matrix from and then using the Crammer’s rule. The system determinant is
D ( z ) = ( z + A) { ( z - t f c - v f s + - TP 9
This determinant reduces to the same form as in [26] when the gain compression factor E is set to zero. In [26], the determinant was used to determine the stability of ECL. However we use it here to characterize the small-signal IM response function of the ECL.
C. Modulation Response Function
The small-signal IM response function h ( f ) is the ratio of small-signal photon density As and the small-signal injection current Ai [lo], [12], [31]. The small-signal photon density can be written as As = 2FAe [31]. Using (14)-(16) and (18) and setting z = j 2 ~ f the small-signal modulation response function is obtained as
-Ae G,E2 h ( f ) =2E- = -
Ai 2qV
where
and from (9) we get
optical feedback, gain compression. The work of Nagarajan (16)
Note that (19), which describes the modulation response of an ECL, differs considerably from (13) of Glasser [lo] and (23) of Lau [12] in that it takes into account losses in the cavity, the reflectivity of the AR-coated facet, the phase of the

510 IEEE JOURNAL OF SELECTED TOPICS IN QUANTUM ELECTRONICS, VOL. 1, NO. 2, JUNE 1995
TABLE I PARAMETER VALUES FOR THEORETICAL MODEL
P a r a m e t e r D e s c r i p f i o n V a l u e U i i i f s
I Lcngth 3110 111
w Width 2 5 p 111 d TIiickiic\\ 0 2 N n1
7 r n camer itietlmc n \
Tin
4 C
"E a Linewidth enhanccinent iaclur 5 6
Gn ~ ~ i i ~ i r n t t ~ i gain 0 x5 P'
LP Bond wire inductmce 0 h ii H
CP Bond wire capacivuiice 11 2 3 PF Rsuh Substrate re\irtance I .I1 n Rin Source resistance 50.0 n Rs S e n e rcststsnce x 1) R cs Scnes can~ci1ailce 15.0 R
et al. [17] and Ferreira et al. [19] takes into account losses and gain saturation. However, [17] and [19] do not include the effect of the residual reflectivity of AR-coated facet, the phase and the strength of the optical feedback, which as we show are essential to model the discontinuity of modulation response as described in the previous section.
D. Comparison with Measurements The overall modulation response of the ECL consists of the
modulation response of the intrinsic laser, as given in (19), multiplied by the electrical response of the parasitics [32], [33]. The semiconductor laser employed in our experiment is a V- groove buried heterostructure laser chip. The high frequency parasitics current paths are identical to those described for an EMBH laser considered by Tucker et al. [33]. We employed the 5'-parameter test set of the network analyser (HP8510) to measure the reflection coefficient S11 and then this data was closely fitted by plotting the S11 parameter of the equivalent electrical circuit of chip and the parasitics of the package [33]. The values of different quantities for which a best fit is obtained are given in Table I. The circuit of the parasitic resistances, capacitances and inductance in Table I is as given in [33]. Fig. 7 shows the measured and theoretical response of the laser over a frequency range of 130 M H z 4 GHz. The closed symbols indicate the experiment data and the line is a theoretical fit using (19). The experimental data agrees reasonably well to the theoretical data. The dip observed at the anti-resonant regions of the response is not fully reproduced
10 I I
I -. . I
-50
-60 ' I I 2 3 4 5 6
Modulation Frequency [GHz]
Fig. 7. Measured (dots) and calculated (line) IM response of the 2-GHz ECL. The values of various parameters are listed in Table I.
-28 t -40 ' 1
1.7 1.86 2.02 2.18 2.34 2.5 Modulation Frequency [GHz]
Fig. 8. Calculated IM response showing the amplitude discontinuity.
by the model but is similar to the "left-hand side" case in Dods analysis [ 161. By incorporating travelling wave rate-equations in the model and following the approach used by Dods et al., this discrepancy may be removed.
E. Discontinuity in the Modulation Response
Fig. 8 shows the theoretical modulation response obtained using (19) over a frequency range of 1.7-2.5 GHz. Note that the model reproduces the form of the discontinuity as observed experimentally in Fig. 3. We studied the effect of various parameters on the amplitude of discontinuity and found that it depends on; (1) the residual reflectivity of AR-coating (7-2)
and (2) the strength of the optical feedback (C). I ) Effect of Residual Rejlectivity (7-2): To consider the ef-
fect of residual reflectivity of AR-coated facet theoretically, the value of 7-2 was increased and decreased to see its effect on the magnitude of discontinuity. The feedback strength and other parameters were kept constant. Fig. 9 shows the theoretical modulation response when 7-2 is reduced from 0.01 to 0.005. Note that the discontinuity is almost suppressed when 7-2 = 0.005. We noticed that for values of 7-2 greater than 0.005 the magnitude of discontinuity grows very rapidly. It should be noted that Glasser [lo], Lau [12] and Nagarajan [17] do not consider the residual reflectivity of the AR-coated facet. Our results show that zero value of the residual reflectivity could lead to continuous response.

AHMED AND TUCKER SMALL-SIGNAL IM RESPONSE OF GRATING-TERMINATED EXTERNAL CAVITY SEMICONDUCTOR LASERS
20
10
- 0
-10
-U)
-30
4
3 c .- - a
2o c I I I
- 7 : I .
_. - i . ----.. B \ P.rUlUC Rd19m . - -7
4 .- --+- ___-_ .
-- -.L.- L i
1 1
l o t
-40 ' I 1.7 1.86 2.02 2.18 2.34 2.5
Modulation Frequency [GHz]
Calculated response indicating the effect of AR-coating reflectivity Fig. 9. on the magnitude of discontinuity, W'T = -0.4 t and C = 0.2.
-30 -40 1.7 f 1.86 2.02 2.18 2.34 2.5
Modulation Frequency IGHz]
Calculated response indicating the effect of feedback from grating, Fig. 10. W'T = -0.4 t and T Z = 0.01.
2 ) Effect of Feedback Strength (C): Fig. 10 shows the modulation response for strong (C = 0.5) and weak (C = 0.2) optical feedback (ra = 0.01). The bias current was adjusted accordingly to obtain same output power. Note that the discontinuity has almost been suppressed for C = 0.5. Strong feedback possibly increases the damping of the USB peak causing its wings to dominate the discontinuity.
It is obvious from the above discussions that the magnitude of discontinuity in the modulation response reduces when the residual reflectivity of AR-coated facet is small and the feed- back from the grating is strong. To achieve these conditions one needs a good AR-coating on the laser, tight coupling to the external cavity and high values of the diffraction grating efficiency. High-coupling efficiency can be achieved by employing AR-coated, wide numerical aperture objective lenses and high grating efficiency requires a grating blazed for the operating wavelength of the laser.
I v . EFFECT OF VARIOUS PARAMETERS ON IM RESPONSE
The modulation response of ECL's have been theoretically characterized [lo], [12], [14]-[19] and experimentally mea- sured [ l l ] , [17], [34], [35] before. However, little has been described about the parameters that determine the amplitude
511
-20 ' 1.86 2.02 2.18 2.34
Modulation Frequency [GHz]
Effect of gain compression factor ( E ) on the amplitude of 2-GHz Fig. 12. resonance peak.
and bandwidth of each resonance peak of the response. Wider modulation bandwidth of a resonance peak can increase the maximum data rate that can be transmitted using a carrier centerd at the frequency of the USB peak [4]. The amplitude of the peaks is characterized by the modulation eficiency. We define modulation eficiency as the amount by which the ampli- tude of a resonance peak is enhanced above the low-frequency amplitude of the response. High modulation efficiency is desirable for improving the signal-to-noise ratio (SNR) at millimeter-wave and submillimeter-wave frequencies. Both these factors are important and need further clarification. In this section we will focus on identifying those parameters that influence the bandwidth and amplitude of response peaks.
A. Modulation Eficiency
Lau [ 121 has reported that the amplitude of the fundamental response peak is always lower than the response amplitude at low frequencies. In contrast, the measured response of Fig. 2 shows an enhancement of the fundamental peak amplitude by -4 dB. Experiment results similar to ours have been reported by Tucker [34], Freking [19] and Bowers et al. [35], however no explanation of this enhancement has been given in the literature. It will be shown here that the amplitude of each response peak depends on several factors, such as the feedback strength, the dc-bias current, the reflectivity of the AR-coated facet, etc.
IEEE JOURNAL OF SELECTED TOPICS IN QUANTUM ELECTRONICS, VOL. 1. NO. 2. JUNE 1995
15
10
5
0
-5
-1 0
-1 5
-20
-25 0 0.5 1 1.5 2 2.5
Modulation Frequency [GHz] (a) (b)
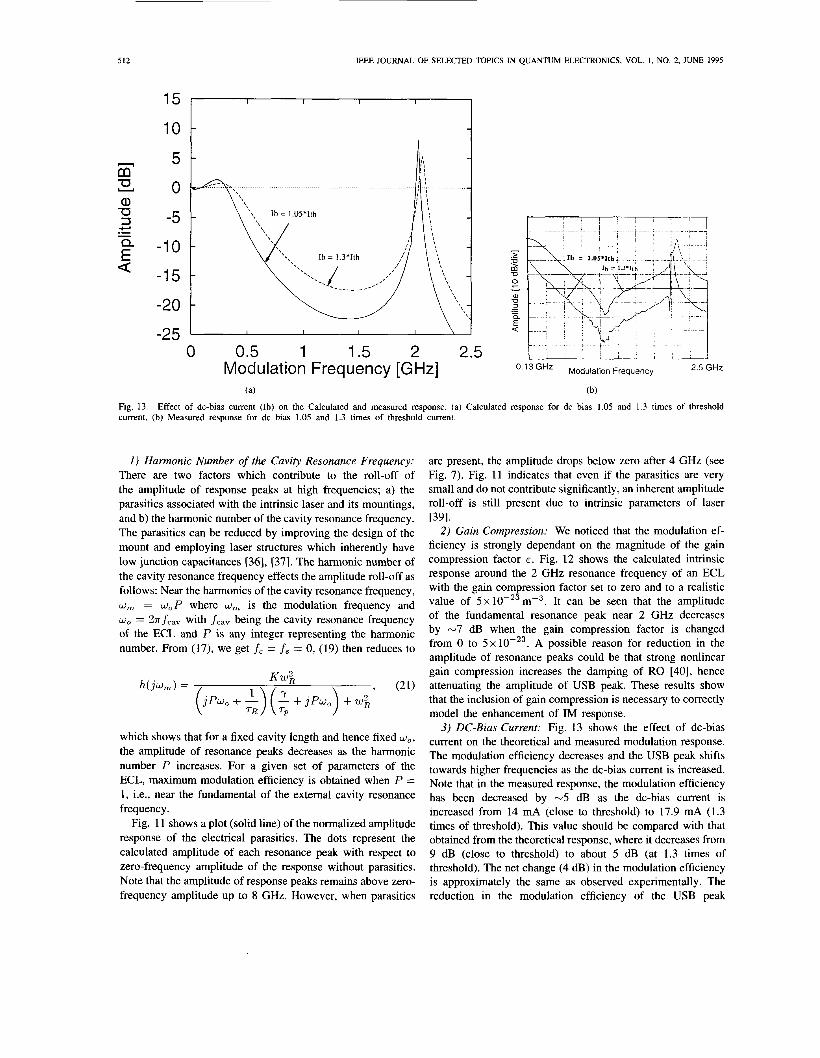
Fig. 13. current, (b) Measured response for dc bias 1.05 and 1.3 times of threshold current.
Effect of dc-bias current (Ib) on the Calculated and measured response. (a) Calculated response for dc bias 1.05 and 1.3 times of threshold
1 ) Harmonic Number of the Cavity Resonance Frequency: There are two factors which contribute to the roll-off of the amplitude of response peaks at high frequencies; a) the parasitics associated with the intrinsic laser and its mountings, and b) the harmonic number of the cavity resonance frequency. The parasitics can be reduced by improving the design of the mount and employing laser structures which inherently have low junction capacitances [36], [37]. The harmonic number of the cavity resonance frequency effects the amplitude roll-off as follows: Near the harmonics of the cavity resonance frequency, w, = w,P where w, is the modulation frequency and w, = 2nfCav with fca, being the cavity resonance frequency of the ECL and P is any integer representing the harmonic number. From (17), we get f c = f s = 0, (19) then reduces to
which shows that for a fixed cavity length and hence fixed wo. the amplitude of resonance peaks decreases as the harmonic number P increases. For a given set of parameters of the ECL, maximum modulation efficiency is obtained when P = 1, i.e., near the fundamental of the external cavity resonance frequency.
Fig. 11 shows a plot (solid line) of the normalized amplitude response of the electrical parasitics. The dots represent the calculated amplitude of each resonance peak with respect to zero-frequency amplitude of the response without parasitics. Note that the amplitude of response peaks remains above zero- frequency amplitude up to 8 GHz. However, when parasitics
are present, the amplitude drops below zero after 4 GHz (see Fig. 7). Fig. 11 indicates that even if the parasitics are very small and do not contribute significantly, an inherent amplitude roll-off is still present due to intrinsic parameters of laser 1391.
2 ) Gain Compression: We noticed that the modulation ef- ficiency is strongly dependant on the magnitude of the gain compression factor E . Fig. 12 shows the calculated intrinsic response around the 2 GHz resonance frequency of an ECL with the gain compression factor set to zero and to a realistic value of 5 ~ 1 O - ~ ~ m - ~ . It can be seen that the amplitude of the fundamental resonance peak near 2 GHz decreases by -7 dB when the gain compression factor is changed from 0 to 5 ~ 1 0 - ' ~ . A possible reason for reduction in the amplitude of resonance peaks could be that strong nonlinear gain compression increases the damping of RO [40], hence attenuating the amplitude of USB peak. These results show that the inclusion of gain compression is necessary to correctly model the enhancement of IM response.
3) DC-Bias Current: Fig. 13 shows the effect of dc-bias current on the theoretical and measured modulation response. The modulation efficiency decreases and the USB peak shifts towards higher frequencies as the dc-bias current is increased. Note that in the measured response, the modulation efficiency has been decreased by -5 dB as the dc-bias current is increased from 14 mA (close to threshold) to 17.9 mA (1.3 times of threshold). This value should be compared with that obtained from the theoretical response, where it decreases from 9 dB (close to threshold) to about 5 dB (at 1.3 times of threshold). The net change (4 dB) in the modulation efficiency is approximately the same as observed experimentally. The reduction in the modulation efficiency of the USB peak

AHMED AND TUCKER: SMALL-SIGNAL lM RESPONSE OF GRATING-TERMINATED EXTERNAL CAVITY SEMICONDUCTOR LASERS 513
100
80
- f" 70
2 60
z U
40 rn
5 .-
20
0 0 2 4 6 8 10 12
Harmonic Number
Fig. 14. operation.
Measured and calculated bandwidths of the USB peaks for harmonic
follows from increased damping of RO's due to nonlinear gain compression.
B. Modulation Bandwidth
I ) Harmonic Number of Resonance Frequency: Fig. 14 shows the theoretically and experimentally measured band- width of resonance peaks at different harmonics (squares). The bandwidth referred to here is the 3-dB bandwidth of the USB peak. Note that the modulation bandwidth increases as the harmonic number of the resonance frequency increases. The largest modulation bandwidth of 86 MHz (measured) and 67 MHz (theoretical) is obtained for a peak near 8 GHz; the 4th harmonic of the 2 GHz resonance frequency (P = 4). The smallest bandwidth of 22 MHz (measured) and 20 MHz (theoretical) is obtained at the fundamental ( P = 1). Both experimental and measured results show the same trend, i.e., the bandwidth increases as the harmonic number increases. These results lead to the important conclusion that greater bandwidth and higher modulation efficiency cannot be achieved simultaneously. Although the largest modulation efficiency can be obtained near the fundamental of the resonance frequency of an ECL, the modulation bandwidth will be small. Increased bandwidth can be obtained by applying modulation at higher harmonics of the resonance frequency, where modulation efficiency is lower.
The conflicting requirement of bandwidth and modulation efficiency poses an another important question; can the modu- lation bandwidth be increased near the fundamental resonance frequency? To check this we measured the modulation band- width of the fundamental resonance peak as the length of the ECL was decreased. The theoretically and experimentally measured bandwidth of the fundamental peaks are plotted in Fig. 15 (circles). It can be seen that the bandwidth is increasing almost as the square of the cavity resonance frequency. The largest bandwidth (230 MHz) occurs near the fundamental of 10 GHz cavity ( L -1.5 cm).
2) Gain compression factor: We calculated that the band- width is about 15 MHz when E is 0. It increases to 30 MHz when E is set to 2 ~ 1 0 - * ~ . Therefore, gain compression in
Z ' O 2 4 6 8 10 12 m
Cavity Resonance Frequency [GHz]
Fig. 15. mental operation.
Measured and calculated bandwidths of the USB peaks for funda-
c = 0.7 (U\V = 100 L111Zl 20
10
= o z?. U -10
Q -20 E a
Q)
3 L .- -
(U\V = 55 blliz) = 0.2 (U\V E 39 MHz)
30 t 40 I ' I
1.6 1.8 2 2.2 2.4 Modulation Frequency [GHz]
(a)
1.7 GHz Modulation Frequency [GHz] *.' GHz (b)
Fig. 16. Effect of optical feedback strength on the modulation bandwidth. (a) Calculated response for C = 0.2, 0.4, 0.7, (b) Measured response for strong and weak optical feedback.
the active section of an ECL enhances the bandwidth of the resonance peaks.
3) Optical Feedback Level: The amount of optical feed- back can be controlled by either misaligning the external reflector or the coupling lens with respect to each other [27], or more commonly by inserting a variable optical attenuator. In both cases the coupling co-efficient C will be affected. Fig. 16 shows the effect of the strength of optical feedback

514 IEEE JOURNAL OF SELECTED TOPICS IN QUANTUM ELECTRONICS, VOL. I , NO. 2, JUNE 1995
Measured - 60 . 0 Theoratical P 5
50 -
14 15 16 17 18 19 20
DC Bias Current [mA]
Fig. 17. Measured and calculated bandwidth of the USB peak near 2 GHz.
from grating on the bandwidth of the measured and theoretical response peaks. Note that the theoretical bandwidth increases from about 39 MHz for C = 0.2 to 100 MHz when C = 0.7. The measured response shows similar trend i.e the bandwidth increases from about 25-36 MHz as the alignment of the lens is adjusted to improve coupling. It is hard to extract C from the experimental conditions, because several factors such as lens aperture size effects, transmission through the lens and grating reflectivity cannot be determined accurately. In this respect the experimental and theoretical results agrees only qualitatively. The slight shift of the resonance peak due to
We have formulated a comprehensive and accurate ana- lytical model of the IM response of ECL’s valid for any arbitrary feedback level and including the effect of residual reflectivity of AR-coated facet, the phase and strzngth of the optical feedback. The model indicates that the discontinuity can be suppressed by improving the residual reflectivity of AR-coating and increasing the coupling efficiency.
The resonant enhancement of the IM response of an ECL in narrow frequency bands shows gradual amplitude roll- off towards high frequencies subject to device parasitics and inherent parameters such as harmonic number of the reso- nance frequency and gain compression. Operating the device at higher harmonics results in an increase in modulation bandwidth at the cost of modulation efficiency. This can be avoided by shortening the external cavity and operating the device near the fundamental of the cavity resonance frequency where modulation efficiency is the largest. The direct modulation bandwidth of each resonance peak can be increased by increasing the dc-bias current above threshold and improving the coupling efficiency. This increase in bandwidth possibly results from increased damping of RO resulting from higher bias current and strong feedback.
ACKNOWLEDGMENT strong feedback is attributed partly, to a slight‘shift in the cavity length as the position of incident beam changes on the grating by lens misalignment, and mainly to a change in the round-trip time within the laser caused by carrier induced
The Photonics Research Laboratory is a member of the Australian Photonics Cooperative Research Center. The author like to thank L. Zhai for useful comments, G. Raybon and
refractive index change. The increase in bandwidth perhaps c’ Of AT&T for providing the AR- results from increased damping of relaxation oscillation due coated laser and p. Lee for Preparing the laser to the strong optical feedback [41]-[431.
4) DC-Bias Current: It can be observed from Fig. 13 that in addition to a shift of USB peak towards higher frequencies, the modulation bandwidth also increases as the dc-bias current is increased. This increase is due to increased damping caused by nonlinear gain saturation. Fig. 17 shows the measured and theoretical bandwidth of the USB peak as a function of dc-bias current. It is clear from both measured (closed symbols) and theoretical data (open symbols) that the bandwidth increases linearly as the dc-bias current is increased. The increase in the modulation bandwidth of the USB peak with dc-bias current results from increased damping caused by nonlinear gain compression.
V. CONCLUSION We have investigated the resonant enhancement of the
intensity modulation response and CW noise spectrum of a grating-terminated external cavity laser. We have shown both theoretically and experimentally that the fundamental and harmonic resonance peaks of the small-signal intensity modu- lation response of ECL’s exhibit amplitude discontinuities near the cavity resonance frequency. This discontinuity is linked to the bifurcation of the CW noise spectrum of the laser into LSB and USB peaks. The USB peaks result from resonant translation of low frequency response and represent resonance peak due to RO.
REFERENCES
[ 11 A. Daryoush, “Optical synchronization of millimeter-wave oscillators for distributed architectures,” IEEE Trans. Microwave Theory Tech., vol. 38, pp. 467476, 1990.
[2] M. Tambumni, M. Parent, L. Goldberg, and D. Stillwell, “Optical feed for a phased array microwave antenna,” Electron. Lett., vol. 23, pp. 6 8 M 8 1 , 1987.
131 I. L. Newberg, C. M. Gee, G. D. Thurmond, and H. W. Yen, “Long mi- crowave delay fiber-optic link for radar testing,” IEEE Trans. Microwave Theor). Tech., vol. 38, pp. 664466, 1990.
[4] S. Levy, R. Nagarajan, A. Mar, P. Humphrey, and J. E. Bowers, “Fiber-optic PSK subcanier transmission at 35 GHz using a resonantly enhanced semiconductor laser,” Electron. Lett., vol. 28, pp. 2103-2104, 1993; and “Millimeter wave fiber-optic PSK subcanier transmission at 35 GHz over 6.3 km using a grating external cavity semiconductor laser,” Electron. Letr., vol. 29, pp. 6 9 M 9 1 , 1993.
[5] S. Weisser, J. D. Ralston, E. C. Larkins, I. Esquivias, P. J. Tasker, J. Fleissner, and J. Rosenzweig, “Efficient high speed direct modulation in p-doped In[,.:rs Gao.GsAs/GaAs multiquantum well lasers,” Electron.
[6] J. Lin, J . K. Gamelin, and S. Wang, “Ultrafast (up to 39 GHz) relaxation oscillation of vertical cavity surface emitting lasers,” Appl. Phys. Lett., vol. 60, pp. 15-17, 1992.
[7] D. W. Dolfi and T. R. Ranganath, “50 GHz velocity-matched broad wavelength LiNb0:r modulator with multimode active section,” Elec- tron. Lett., vol. 28, pp. 1197-1198, 1992.
[8] G. J. Simonis and K. G. Purchase, “Optical generation, distribution and control of microwaves using laser heterodyne,” IEEE Trans. Microwave Theory Tech., vol. 38, pp. 667469, 1990.
[9] D. Novak and R. S . Tucker, “Millimeter-wave signal generation using pulsed semiconductor lasers,” Electron. Lett., vol. 30, pp. 143G143 1, 1994.
[ lo] L. A. Glasser, “A linearized theory for the diode laser in an external cavity,” ZEEE J . Quantum Electron., vol. 16, pp. 525-531, 1980.
Lett., vol. 28, pp. 2141-2143, 1992.
AHMED AND TUCKER: SMALL-SIGNAL IM RESPONSE OF GRATING-TERMINATED EXTERNAL CAVITY SEMICONDUCTOR LASERS 515
K. Y. Lau and A. Yariv, “Direct modulation and active mode-locking of ultrahigh speed GaAlAs lasers at frequencies up to 18 GHz,” Appl. Phys. Lett., vol. 46, pp. 326-328, 1985. K. Y. Lau, “Narrow-Band modulation of semiconductor lasers at mil- limeter wave frequencies (>lo0 GHz) by mode-locking,” IEEE J. Quantum Electron., vol. 26, pp. 25G261, 1990. L. G. Kazovsky anf N. Jensen, “Experimental relative frequency stabal- ization of a set of lasers using optical phase-loop loops,” IEEE Photon. Technol. Lett., vol. 2, pp. 516517, 1990. K. Y. Lau and J. B. Georges, “On the characteristics of narrow- band resonant modulation of semiconductor lasers beyond relaxation oscillation frequency,” Appl. Phys. Lett., vol. 63, pp. 1459-1461, 1993. W. Freking, W. Yang, A. Ghiasi, and A. Gopinath, “External cavity semiconductor laser for modulation beyond its relaxation oscillation frequency,” in Microwave Theory Tech. Symp. Dig., Paper TUIC-3, May 1994. S. R. A. Dods, M. Ogura, and M. Watanabe, “Small-signal analysis of semiconductor lasers modulated at frequencies on the order of the beat frequency,” IEEE J. Quantum Electron., vol. 29, pp. 2631-2638, 1993. R. Nagarajan, S. Levy, A. Mar, and J. E. Bowers, “Resonantly enhanced semiconductor lasers for efficient transmission of millimeter wave modulated light,” IEEE Photon. Technol. Lett., vol. 5, pp. 4-6, 1993; “Millimeter wave narrowband optical fiber links using external cavity semiconductor lasers,” J. Lightwave Technol., vol. 12, pp. 127-136. 1994. J. B. Georges, M. H. Kiang, K. Heppell, M. Sayed, and K. Lau, “Op- tical transmission of narrow-band millimeter-wave signals by resonant modulation of monolithic semiconductor lasers,’’ IEEE Photon. Technol. Lett., vol. 6, pp. 568-570, 1994. M. F. Ferreira, J. F. Rocha, and J. L. Pinto, “Noise and modulation per- formance of Fabry-Perot and DFB semiconductor lasers with arbitrary external optical feedback,” IEE Proc., pt. J, vol. 137, pp. 361-369, 1990. Z. Ahmed, R. S. Tucker, and L. Zhai, “Discontinuous modulation response of a grating-assisted external cavity semiconductor laser,” Electron. Lett., vol. 30, pp. 305-306, 1994. K. Tatah and E. Garmire, “Low-frequency intensity noise resonance in an external cavity GaAs laser for possible laser characterization,” IEEE J. Quanrum Electron., vol. 25, pp. 1800-1807, 1989. H. Sato. T. Fujita, and K. Fujita, “Intensity fluctuation in semiconductor lasers coupled to external cavity,” IEEE J. Quantum Electron., vol. 21, pp. 4 6 5 0 , 1985. P. Besnard, B. Meziane, and G. M. Stephan, “Feedback phenomena in a semiconductor laser induced by distnat reflectors,” IEEE J. Quantum Electron., vol. 29, pp. 1271-1284, 1993. M. Port and K. J. Ebeling, “Intensity noise dependence on the injec- tion current of laser diode with optical feedback,” IEEE J. Quantum Electron.. vol. 3. nD. 449455. 1990. I r r ~ ~~.
[25] K. Y. Lau and H. Blauvelt, “Effect of low-frequency intensity noise on high frequency direct modulation of semiconductor injection lasers,” Appl. Phys. Lett., vol. 52, pp. 694-696, 1988.
[26] J. D. Park, D. S. Seo and J. G. Mcinerney, “Self-pulsations in strongly coupled asymmetric external cavity semiconductor lasers,” ZEEE J. Quantum Electron., vol. 26, pp. 1353-1362, 1990.
[27] J. Sigg, “Effects of optical feedback on the light-current characteristics of semiconductor lasers,” IEEE J. Quantum Electron., vol. 29, pp. 1262-1270, 1993.
[28] R. Lang and K. Kobayashi, “External optical feedback effects on semiconductor injection laser properties,” IEEE J. Quantum Electron., vol. 16. pp. 347-355, 1980.
[29] H. R. Qing and T. S. Ping, “Improved rate equation for external cavity semiconductor lasers,” IEEE J. Quantum Electron., vol. 25, pp. 158G1584, 1989.
[30] J. Mork, B. Tromborg, and P. L. Christiansen, “Bistability and Low- frequency fluctuations in semiconductor lasers with optical feedback A theoretical analysis,” IEEE J. Quantum Electron., vol. 24, pp. 123-133, 1988.
[31] J. Helms and K. Petermann, “Microwave modulation of laser diodes with optical feedback,” J. Lightwave Technol., vol. 9, pp. 468476, 1991.
[32] R. S. Tucker and D. J. Pope, “Circuit modelling of the effect of diffusion on damping in a narrow-strip semiconductor laser,” IEEE J. Quantum Electron., vol. 19, pp. 1179-1183, 1983.
[33] R. S. Tucker and I. P. Kaminow, “High-frequency characteristics of directly modulated InGaAsP ridge waveguide and buried heterostructure lasers,” J. Lightwave Technol., vol. 4, pp. 385-393, 1984.
[34] R. S. Tucker, U. Koren, G. Raybon, C. A. Bums, B. I. Miller, T. L. Koch, and G. Eisenstein, “40 GHz active mode-locking in 1.5 pm monolithic extended cavity laser,” Electron. Left., vol. 25, pp. 621422, 1989.
[35] J. E. Bowers, P. A. Morton, A. Mar, and S. W. Corzine, “Actively mode-locked semiconductor lasers,” IEEE J. Quantum Electron., vol.
[36] C. B. Su and V. A. Lanzisera, “Ultra-high-speed modulation of 1.3 mm InGaAsP diode lasers,’’ IEEE J. Quantum Electron., vol. 22, pp.
1371 K. Uomi and N. Chinone, “Proposal on reducing the damping constant in semiconductor lasers by using quantum well structures,” Jap. J. Appl. Phys., vol. 28, p. L1424, 1989.
[38] P. A. Morton, T. Tanbun-Ek, R. A. Logan, A. M. Sergent, P. F. Sciortino, and D. L. Coblentz, “Frequency response subtraction for simple mea- surement of intrinsic laser dynamic properties,” IEEE Photon. Technol. Lett., vol. 4, pp. 133-136, 1992.
[39] K. Y. Lau and A Yariv, “Ultra-high speed semiconductor lasers,” IEEE J. Quantum Electron., vol. QE-21, pp. 121-137, 1985.
[40] J. Manning, R. Olshansky, D. M. Fye, and W. Powazinik, “Strong influence of nonlinear gain on spectral and dynamic characteristics of InGaAsP lasers,” Electron. Lett., vol. 21, pp. 496497, 1985; M. J. Adams and M. Osinski, “Influence of spectral hole-burning on quaternary laser transients,” Electron. Lett., vol. 19, pp. 627428, 1983.
[41] N. Chinone, K. Aiki, and R. Ito, “Stabilization of semiconductor laser outputs by a mirror close to a laser facet,” Appl. Phys. Lett., vol. 33, pp. 99G992, 1978.
[42] R. Lang and K. Kobayashi, “Suppression of the relaxation oscillation in the modulated output of semiconductor lasers,” IEEE J. Quantum Electron., vol. QE-12, pp. 194-199, 1976.
[43] K. Otsuka, “ Analysis of the effects of external injection and diffusion of excited states on relaxation oscillations in laser,” IEEE J. Quantum Electron., vol. QE-13, pp. 520-525, 1977.
[44] L. G. Kazovsky and D. A. Atlas, “A 1320 nm experimental optical phase-locked loop,” IEEE Photon. Technol. Lett., vol. 1, pp. 395-397, 1989.
[45] J. S. Cohen, R. R. Drenten, and B. H. Verbeek, “The effect of optical feedback on the relaxation oscillation in semiconductor lasers,” IEEE J. Quantum Electron., vol. 24, pp. 1989-1995, 1988.
25, pp. 1425-1439, 1989.
1568-1578, 1986.
Zaheer Ahmed (S’92) was born in Lahore, Pak- istan, on October 20, 1965. He received the B.Sc degree in electncal engineenng from the University of Engineenng and Technology Lahore, Palustan, in 1989
From 1989 to 1991, he worked as a research engineer at the Camer Telephone Industnes (pvt) Ltd., Islamabad, Palustan, where his duties were to design, develop, and upgrade telecommunications equipments used by Palustan T&T department He joined the Photonics Research Laboratory at the
University of Melbourne, Australia, as a Ph.D student in 1991. He is currently working as a senior research fellow at the Photonics Research Laboratory His research interests include short pulse and millimeter-wave signal generation from semiconductor lasers.
Rodney S. Tucker (F’90), for a photograph and biography, see this issue, p. 101.
Copyright © 2022 FDOKUMEN