TT European Equity Fund (Terminated) - TT International
121
TT INTERNATIONAL FUNDS PLC (A Company incorporated with limited liability as an open ended umbrella investment company with variable capital under the laws of Ireland.) TT European Equity Fund (Terminated) TT UK Equity Fund TT Europe Ex-UK Equity Fund (Terminated) TT Asia-Pacific Equity Fund TT Emerging Markets Equity Fund TT Global Equity Fund (Terminated) TT Emerging Markets Unconstrained Fund TT China Focus Fund TT Asia Ex Japan Equity Fund TT European Opportunities Long/Short Fund TT Environmental Solutions Fund TT Euro Zone Equity Fund (inactive) Semi-Annual Report and Unaudited Condensed Financial Statements For the Six Months Ended 31 March 2022 Company Registration No. 346579
-
Upload
khangminh22 -
Category
Documents
-
view
6 -
download
0
Transcript of TT European Equity Fund (Terminated) - TT International

TT INTERNATIONAL FUNDS PLC
(A Company incorporated with limited liability as an open ended umbrella investment company with variable capital under the laws of Ireland.)
TT European Equity Fund (Terminated)TT UK Equity Fund
TT Europe Ex-UK Equity Fund (Terminated)TT Asia-Pacific Equity Fund
TT Emerging Markets Equity FundTT Global Equity Fund (Terminated)
TT Emerging Markets Unconstrained FundTT China Focus Fund
TT Asia Ex Japan Equity FundTT European Opportunities Long/Short Fund
TT Environmental Solutions FundTT Euro Zone Equity Fund (inactive)
Semi-Annual Report and Unaudited Condensed Financial StatementsFor the Six Months Ended 31 March 2022
Company Registration No. 346579

TT INTERNATIONAL FUNDS PLC
TABLE OF CONTENTS
GENERAL INFORMATION 1
INVESTMENT MANAGER’S REPORT 4
STATEMENT OF FINANCIAL POSITION 17
STATEMENT OF COMPREHENSIVE INCOME 23
STATEMENT OF CHANGES IN NET ASSETS ATTRIBUTABLE TO HOLDERS OF REDEEMABLE PARTICIPATING SHARES 27
NOTES TO THE FINANCIAL STATEMENTS 31
STATEMENT OF INVESTMENTS 53
STATEMENT OF CHANGES IN THE PORTFOLIO 89
MANAGEMENT AND ADMINISTRATION 107
APPENDIX I – TOTAL EXPENSE RATIOS 108
APPENDIX II – SECURITIES FINANCING TRANSACTIONS REGULATION 110

1
TT INTERNATIONAL FUNDS PLC
GENERAL INFORMATION
Structure
The following information is derived from and should be read in conjunction with the full text and definitions section of the Prospectus.
TT International Funds PLC (the “Company”) was incorporated in Ireland on 13 August 2001 as an open-ended investment company with variable capital and segregated liability between its sub-funds, organised under the laws of Ireland as a public limited company in accordance with the Companies Act 2014 (including amendments by the Companies (Accounting) Act 2017, hereinafter referred to as “the Companies Act 2014”) and has been authorised by the Central Bank of Ireland (the “Central Bank”) pursuant to the European Communities (Undertakings for Collective Investment in Transferable Securities) Regulations 2011, as amended, (the “UCITS Regulations”) and the Central Bank (Supervision and Enforcement) Act 2013 (Section 48(1)) (Undertakings for Collective Investment in Transferable Securities) Regulations 2019, (the “Central Bank UCITS Regulations”). A review of the principal activities is included in the Investment Manager’s Reports on pages 4 to 16.
The Company is organised in the form of an umbrella Fund with twelve sub-funds, eight of which are active namely TT UK Equity Fund, TT Asia-Pacific Equity Fund, TT Emerging Markets Equity Fund, TT Emerging Markets Unconstrained Fund, TT China Focus Fund, TT Asia Ex Japan Equity Fund, TT European Opportunities Long/Short Fund and TT Environmental Solutions Fund (each a “Fund”, collectively the “Funds”), in existence at the financial period end. As at 31 March 2022, TT Euro Zone Equity Fund remains inactive. TT European Equity Fund and TT Europe Ex-UK Equity Fund terminated on 1 September 2020. TT Global Equity Fund terminated on 21 December 2021.
On 30 September 2020, the Company appointed Carne Global Fund Managers (Ireland) Limited to act as designated Manager or the “responsible person” of the Company for the purpose of the UCITS Regulations and the Central Bank UCITS Regulations.
Funds/Share classes in issue during the period:
Launch Date Launch Price Currency TT European Equity FundClass A* 17 September 2001 €10.00 per Share EUR (€)Class B* 11 October 2006 €10.00 per Share EUR (€)Class D* 28 May 2009 €10.00 per Share EUR (€)
TT UK Equity FundClass A 1 April 2004 £10.00 per Share GBP (£)Class B** 27 May 2008 £10.00 per Share GBP (£)
TT Europe Ex-UK Equity FundClass A* 14 May 2004 £10.00 per Share GBP (£)Class C* 21 June 2012 €10.00 per Share EUR (€)Class D* 20 March 2014 €10.00 per Share EUR (€)Class H* 23 April 2014 £10.00 per Share GBP (£)
TT Asia-Pacific Equity FundClass A1 27 July 2009 US$10.00 per Share USD ($)Class A2 27 June 2018 US$10.00 per Share USD ($)Class B2 8 June 2018 US$10.00 per Share USD ($)Class D2 19 June 2018 €10.00 per Share EUR (€)Class E2 19 June 2012 £10.00 per Share GBP (£)Class G 31 May 2018 US$10.00 per Share USD ($)Class H 16 May 2017 £10.00 per Share GBP (£)Class I2 14 August 2018 €10.00 per Share EUR (€)
*Terminated during the financial year ended 30 September 2020.**Terminated during the financial year ended 30 September 2021.

2
TT INTERNATIONAL FUNDS PLC
GENERAL INFORMATION (CONTINUED)
Launch Date Launch Price Currency TT Emerging Markets Equity FundClass A1 29 March 2011 US$10.00 per Share USD ($)Class A2 29 August 2014 US$10.00 per Share USD ($)Class B1 30 May 2017 US$10.00 per Share USD ($)Class C2 10 August 2017 €10.00 per Share EUR (€)Class E1 5 September 2018 £10.00 per Share GBP (£)Class E2 8 May 2018 £10.00 per Share GBP (£)Class G 2 October 2020 US$10.00 per Share USD ($)Class H 19 April 2017 £10.00 per Share GBP (£)Class I 29 December 2016 €10.00 per Share EUR (€)Class N1 30 August 2018 kr10.00 per Share NOK (kr)
TT Global Equity FundClass A1* 6 August 2015 US$10.00 per Share USD ($)Class A2** 30 June 2014 US$10.00 per Share USD ($)Class C** 4 December 2014 £10.00 per Share GBP (£)
TT Emerging Markets Unconstrained FundClass A1 25 June 2015 US$10.00 per Share USD ($)Class A2 25 June 2015 US$10.00 per Share USD ($)Class C2 10 August 2016 £10.00 per Share GBP (£)Class D2 30 June 2021 €10.00 per Share EUR (€)Class E2 30 November 2016 €10.00 per Share EUR (€)Class G 27 September 2017 US$10.00 per Share USD ($)Class H 22 June 2017 £10.00 per Share GBP (£)Class I 10 November 2017 €10.00 per Share EUR (€)
TT China Focus FundClass A2 9 October 2017 US$10.00 per Share USD ($)Class E2 26 February 2018 £10.00 per Share GBP (£)
TT Asia Ex Japan Equity FundClass A2 1 May 2018 US$10.00 per Share USD ($)Class E2 6 December 2018 £10.00 per Share GBP (£)
TT European Opportunities Long/Short FundClass A1 27 September 2019 US$10.00 per Share USD ($)Class A2 5 August 2021 US$10.00 per Share USD ($)Class B1 7 September 2020 €10.00 per Share EUR (€)Class B2 8 September 2021 €10.00 per Share EUR (€)Class C1 30 December 2020 £10.00 per Share GBP (£)Class C2^ 23 March 2022 £10.00 per Share GBP (£)
TT Environmental Solutions FundClass A1 11 May 2020 US$10.00 per Share USD ($)Class B1 26 February 2021 £10.00 per Share GBP (£)Class B2 18 December 2020 £10.00 per Share GBP (£)Class B5^ 22 March 2022 £10.00 per Share GBP (£)Class B6^ 22 March 2022 £10.00 per Share GBP (£)Class Z 5 July 2021 AU$10.00 per Share AUD ($)
*Terminated during the financial year ended 30 September 2021. **Terminated during the financial period ended 31 March 2022.^Launched during the financial period ended 31 March 2022.
Funds/Share classes in issue during the period: (Continued)

2 3
TT INTERNATIONAL FUNDS PLC
GENERAL INFORMATION (CONTINUED)
Other Information
The Prospectus and a complete list of the portfolio changes are available free of charge at the German paying and information agent Marcard, Stein & Co AG, Ballindamm 36, 20095 Hamburg, Germany. These documents, as well as the key investor information documents (“KIIDs”), the Memorandum and Articles of Association, the annual and semi-annual reports are also available free of charge from the Swiss representative, First Independent Fund Services AG.
54
TT INTERNATIONAL FUNDS PLC
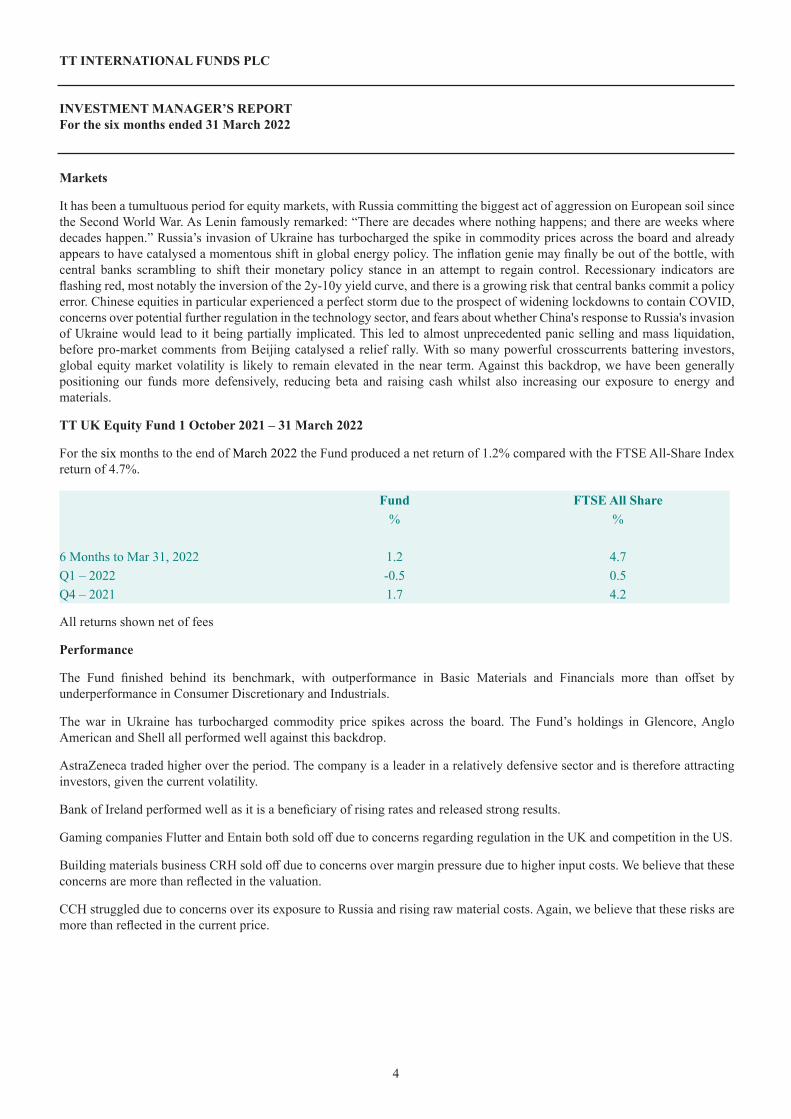
INVESTMENT MANAGER’S REPORTFor the six months ended 31 March 2022
Markets
It has been a tumultuous period for equity markets, with Russia committing the biggest act of aggression on European soil since the Second World War. As Lenin famously remarked: “There are decades where nothing happens; and there are weeks where decades happen.” Russia’s invasion of Ukraine has turbocharged the spike in commodity prices across the board and already appears to have catalysed a momentous shift in global energy policy. The inflation genie may finally be out of the bottle, with central banks scrambling to shift their monetary policy stance in an attempt to regain control. Recessionary indicators are flashing red, most notably the inversion of the 2y-10y yield curve, and there is a growing risk that central banks commit a policy error. Chinese equities in particular experienced a perfect storm due to the prospect of widening lockdowns to contain COVID, concerns over potential further regulation in the technology sector, and fears about whether China's response to Russia's invasion of Ukraine would lead to it being partially implicated. This led to almost unprecedented panic selling and mass liquidation, before pro-market comments from Beijing catalysed a relief rally. With so many powerful crosscurrents battering investors, global equity market volatility is likely to remain elevated in the near term. Against this backdrop, we have been generally positioning our funds more defensively, reducing beta and raising cash whilst also increasing our exposure to energy and materials.
TT UK Equity Fund 1 October 2021 – 31 March 2022
For the six months to the end of March 2022 the Fund produced a net return of 1.2% compared with the FTSE All-Share Index return of 4.7%.
Fund FTSE All Share% %
6 Months to Mar 31, 2022 1.2 4.7Q1 – 2022 -0.5 0.5Q4 – 2021 1.7 4.2
All returns shown net of fees
Performance
The Fund finished behind its benchmark, with outperformance in Basic Materials and Financials more than offset by underperformance in Consumer Discretionary and Industrials.
The war in Ukraine has turbocharged commodity price spikes across the board. The Fund’s holdings in Glencore, Anglo American and Shell all performed well against this backdrop.
AstraZeneca traded higher over the period. The company is a leader in a relatively defensive sector and is therefore attracting investors, given the current volatility.
Bank of Ireland performed well as it is a beneficiary of rising rates and released strong results.
Gaming companies Flutter and Entain both sold off due to concerns regarding regulation in the UK and competition in the US.
Building materials business CRH sold off due to concerns over margin pressure due to higher input costs. We believe that these concerns are more than reflected in the valuation.
CCH struggled due to concerns over its exposure to Russia and rising raw material costs. Again, we believe that these risks are more than reflected in the current price.
5
TT INTERNATIONAL FUNDS PLC
INVESTMENT MANAGER’S REPORT (CONTINUED)For the six months ended 31 March 2022
4
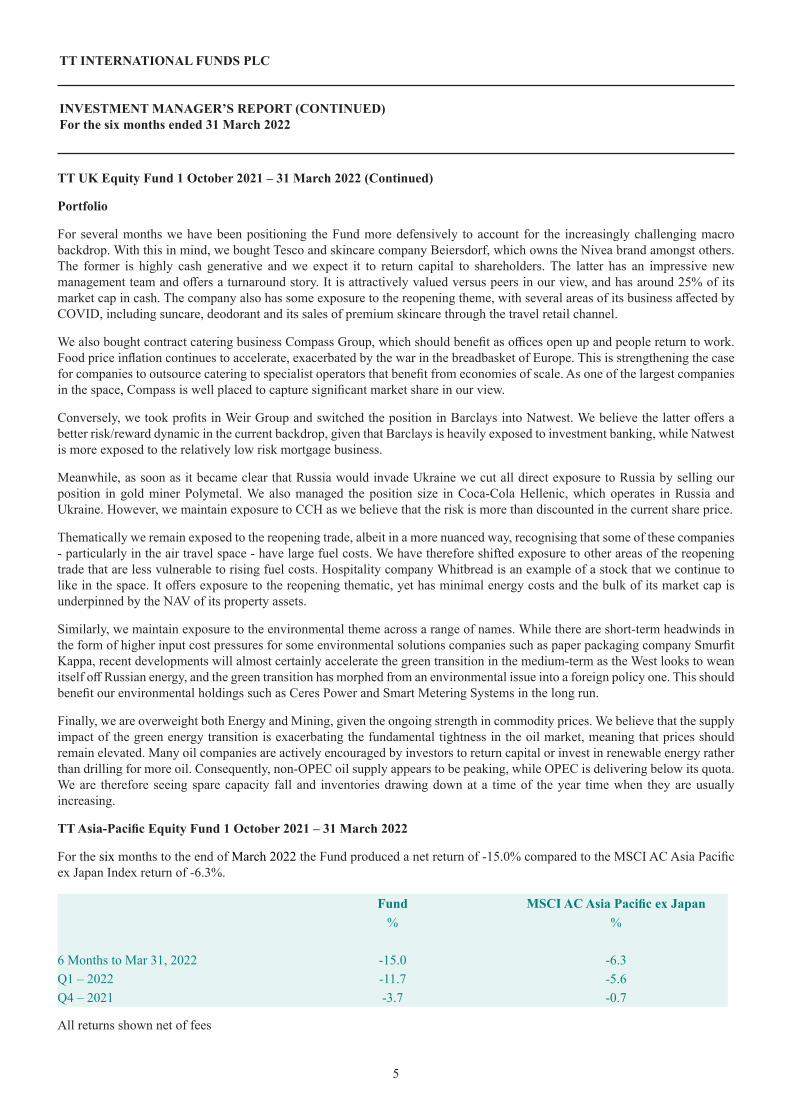
Portfolio
For several months we have been positioning the Fund more defensively to account for the increasingly challenging macro backdrop. With this in mind, we bought Tesco and skincare company Beiersdorf, which owns the Nivea brand amongst others. The former is highly cash generative and we expect it to return capital to shareholders. The latter has an impressive new management team and offers a turnaround story. It is attractively valued versus peers in our view, and has around 25% of its market cap in cash. The company also has some exposure to the reopening theme, with several areas of its business affected by COVID, including suncare, deodorant and its sales of premium skincare through the travel retail channel.
We also bought contract catering business Compass Group, which should benefit as offices open up and people return to work. Food price inflation continues to accelerate, exacerbated by the war in the breadbasket of Europe. This is strengthening the case for companies to outsource catering to specialist operators that benefit from economies of scale. As one of the largest companies in the space, Compass is well placed to capture significant market share in our view.
Conversely, we took profits in Weir Group and switched the position in Barclays into Natwest. We believe the latter offers a better risk/reward dynamic in the current backdrop, given that Barclays is heavily exposed to investment banking, while Natwest is more exposed to the relatively low risk mortgage business.
Meanwhile, as soon as it became clear that Russia would invade Ukraine we cut all direct exposure to Russia by selling our position in gold miner Polymetal. We also managed the position size in Coca-Cola Hellenic, which operates in Russia and Ukraine. However, we maintain exposure to CCH as we believe that the risk is more than discounted in the current share price.
Thematically we remain exposed to the reopening trade, albeit in a more nuanced way, recognising that some of these companies - particularly in the air travel space - have large fuel costs. We have therefore shifted exposure to other areas of the reopening trade that are less vulnerable to rising fuel costs. Hospitality company Whitbread is an example of a stock that we continue to like in the space. It offers exposure to the reopening thematic, yet has minimal energy costs and the bulk of its market cap is underpinned by the NAV of its property assets.
Similarly, we maintain exposure to the environmental theme across a range of names. While there are short-term headwinds in the form of higher input cost pressures for some environmental solutions companies such as paper packaging company Smurfit Kappa, recent developments will almost certainly accelerate the green transition in the medium-term as the West looks to wean itself off Russian energy, and the green transition has morphed from an environmental issue into a foreign policy one. This should benefit our environmental holdings such as Ceres Power and Smart Metering Systems in the long run.
Finally, we are overweight both Energy and Mining, given the ongoing strength in commodity prices. We believe that the supply impact of the green energy transition is exacerbating the fundamental tightness in the oil market, meaning that prices should remain elevated. Many oil companies are actively encouraged by investors to return capital or invest in renewable energy rather than drilling for more oil. Consequently, non-OPEC oil supply appears to be peaking, while OPEC is delivering below its quota. We are therefore seeing spare capacity fall and inventories drawing down at a time of the year time when they are usually increasing.
TT Asia-Pacific Equity Fund 1 October 2021 – 31 March 2022
For the six months to the end of March 2022 the Fund produced a net return of -15.0% compared to the MSCI AC Asia Pacific ex Japan Index return of -6.3%.
Fund MSCI AC Asia Pacific ex Japan% %
6 Months to Mar 31, 2022 -15.0 -6.3Q1 – 2022 -11.7 -5.6Q4 – 2021 -3.7 -0.7
All returns shown net of fees
TT UK Equity Fund 1 October 2021 – 31 March 2022 (Continued)
6
TT INTERNATIONAL FUNDS PLC
INVESTMENT MANAGER’S REPORT (CONTINUED)For the six months ended 31 March 2022
Performance
The Fund finished behind its benchmark, with outperformance in Taiwan, Korea and India overshadowed by underperformance in China, Australia and Hong Kong.
Unimicron performed well after it released strong results that prompted upward earnings revisions.
The ABF substrate market remains undersupplied, with favourable pricing trends.
Karoon Energy was a major winner as it is a key beneficiary of the elevated oil price.
India-based Axis Bank released positive 3Q FY22 results, demonstrating improvements in both credit growth and NIM.
Powerlong and A-Living Services struggled due to concerns around the Chinese property market.
VNET fell after it cut guidance on new cabinet additions.
The Fund lost out from being underweight Australia, which as a defensive market performed well amid the risk-off environment.
At the sector level, outperformance in Communication Services and Health Care was more than offset by underperformance in Real Estate, Financials, Materials and Industrials.
The Fund benefitted from not owning Internet companies such as Meituan Dianping and Sea. Growth stocks have generally struggled against a backdrop of rising rates. After correcting significantly, we have now bought a position in Sea.
Chinese online lender 360 Digitech struggled amid general concerns about ADRs and the Chinese economy.
Guangdong Jia Yuan and Tongling Jingda sold off due to worries about higher EV battery material costs curbing demand.
Portfolio
We have been looking to increase the portfolio’s Energy exposure, given the surge in commodity prices following Russia’s invasion of Ukraine. We believe that the supply impact of the green energy transition is exacerbating the fundamental tightness in the oil market, meaning that prices should remain elevated. Many oil companies are actively encouraged by investors to return capital or invest in renewable energy rather than drilling for more oil. Consequently, non-OPEC oil supply appears to be peaking, while OPEC is delivering below its quota. We are therefore seeing spare capacity fall and inventories drawing down at a time of the year time when they are usually increasing. Over the period we bought E&P company Santos. It offers long reserve life and significant volume growth out to 2029. Management have also committed to improving shareholder returns, which we see as a key catalyst.
We also bought Petronas Chemicals, a key beneficiary of higher oil and urea prices. It has a net cash balance sheet and a high dividend yield.
Another purchase was Larsen & Toubro, which should benefit from a turn in the capex cycle in India. Whilst higher commodity prices will likely cause margin pressure, this should be outweighed by increasing order flow from the Metals, Mining and Energy sectors.
Elsewhere we purchased Prudential, an insurer which, having divested its US business, is now directly comparable to AIA, yet significantly cheaper. We also believe it stands to benefit more when the Hong Kong border reopens, and are constructive on its higher exposure to ASEAN markets.
We also bought Sea as the stock has experienced a substantial correction, but we see a significant long-term growth opportunity in ASEAN e-commerce.
To fund our increasing exposure to Energy and Materials, we have reduced our cyclical Tech positions. We believe that pressure on consumer purchasing power from higher inflation and a slowing global economy could dent demand for electronics. Moreover, Tech margins are currently very high, but could see pressure in the second half of 2022 as new foundry capacity comes online. This has been the key bottleneck in Tech supply, and once it eases up the sector as a whole could face margin pressure, particularly those areas most closely associated with foundry-related supply constraints. Consequently, we sold ASE Technology.
TT Asia-Pacific Equity Fund 1 October 2021 – 31 March 2022 (Continued)

6 7
TT INTERNATIONAL FUNDS PLC
INVESTMENT MANAGER’S REPORT (CONTINUED)For the six months ended 31 March 2022
We also sold Delta Electronics, which we owned for its EV exposure. Many EV-related names have struggled due to concerns over rising input costs. Delta Electronics has held up relatively well, so we decided to exit the position as we felt it could soon come under pressure.
Finally, we took some profits in Axis Bank as higher oil prices will be a headwind for the Indian economy, albeit we continue to be positive on the structural growth opportunity in Indian Financials.
TT Emerging Markets Equity Fund 1 October 2021 – 31 March 2022
For the six months to the end of March 2022 the Fund produced a net return of -14.7% compared to the MSCI Emerging Markets Index return of -8.1%.
Fund MSCI Emerging Markets% %
6 Months to Mar 31, 2022 -14.7 -8.1Q1 – 2022 -12.1 -6.9Q4 – 2021 -2.9 -1.2
All returns shown net of fees
Performance
The Fund finished behind its benchmark, with outperformance in Taiwan and Korea more than offset by underperformance in China and Russia.
Unimicron performed well after it released strong results that prompted upward earnings revisions.
The ABF substrate market remains undersupplied, with favourable pricing trends.
SK Hynix performed well on expectations of firmer memory prices.
OCI traded higher as it is a key beneficiary of higher urea prices.
Chinese data centre company VNET fell after it cut guidance on new cabinet additions.
The Fund’s Russian holdings sold off sharply after Russia invaded Ukraine.
At the sector level, outperformance in Energy, Consumer Discretionary and Materials was overshadowed by underperformance in Financials, Communication Services and Industrials.
The war in Ukraine has turbocharged commodity price spikes across the board. The Fund’s holdings in Glencore, Zijin Mining and Petrobras all performed well against this backdrop.
Russia-based Yandex sold off sharply in the Communication Services sector.
Energy storage system provider Pylon struggled due to concerns around rising raw material costs pressuring margins.
Portfolio
In recent weeks we have been looking to increase the portfolio’s exposure to Energy and Materials, given the spike in commodity prices. As such we bought OCI and Glencore. The latter produces thermal coal, the price of which is up around 150% in a matter of weeks. Consequently, Glencore’s EBITDA and cashflow should rise substantially. We also have a large position in Petrobras, which should be a key beneficiary of the elevated oil price. Another related purchase was Barrick Gold, which is one of the cheapest gold producers in our universe.
TT Asia-Pacific Equity Fund 1 October 2021 – 31 March 2022 (Continued)
Portfolio (Continued)
8
TT INTERNATIONAL FUNDS PLC
INVESTMENT MANAGER’S REPORT (CONTINUED)For the six months ended 31 March 2022
We also bought Yunnan Aluminium and Korean steelmaker POSCO. As part of its drive to lower emissions, China has limited its capacity in both the aluminium and steel industries. At the same time, many smelters in Europe are struggling to operate due to high energy prices. Consequently, pricing power should remain high, particularly as aluminium is a key component in Electric Vehicles, where demand continues to grow rapidly. At just 0.4x book value, POSCO is one of the cheapest steel producers in the world.
Elsewhere we added substantially to Alibaba, Tencent and Meituan. Chinese Internet companies have been hit by a perfect storm of regulatory tightening and a slowing economy. However, recent comments from Beijing suggest that the government intends to stabilise growth and ease its regulatory stance. At the same time, many of these companies have announced measures to rationalise costs. In our view the stars are now aligning for significant outperformance from Chinese Internet companies as a stronger economy should lead to higher topline growth, the effect of which will likely be magnified in the bottom line due to cost cutting measures, while less intervention from Beijing should catalyse a re-rating from very depressed levels. Indeed, on our numbers Alibaba is trading on close to 5x core earnings.
Conversely, we looked to reduce our cyclical Tech exposure as we believe that pressure on consumer purchasing power from higher inflation and a slowing global economy could dent demand for electronics. Moreover, Tech margins are currently very high, but could see pressure in the second half of 2022 as new foundry capacity comes online. This has been the key bottleneck in Tech supply, and once it eases up the sector as a whole could face margin pressure, particularly those areas most closely associated with foundry-related supply constraints. We therefore cut SK Hynix and ASE Technology. For similar reasons we reduced Hyundai Motor, which also has a finance business that will likely see higher NPL formation as the global economy slows.
We also sold Delta Electronics, which we owned for its EV exposure. Many EV-related names have struggled due to concerns over rising input costs. Delta Electronics has held up relatively well, so we decided to exit the position as we felt it could soon come under pressure.
Finally, we looked to cut all exposure to Russia as we became increasingly concerned about the prospect of an invasion of Ukraine. This was mostly achieved, albeit we ran into issues fully exiting certain positions after trading was suspended on the Russian market and foreign investors were banned from selling Russian assets.
TT Global Equity Fund 1 October 2021 – 16 December 2021
From the end of September 2021 to when the Fund positions were liquidated at the close on 16 December 2021 the Fund produced a net return of +2.0% compared with the MSCI AC World Index return of +4.7%.
Fund MSCI AC World% %
6 Months to Mar 31, 2022 2.0 4.7
All returns shown net of fees
Performance
The Fund finished behind its benchmark as outperformance in Communication Services and Health Care was more than offset by underperformance in I.T., Real Estate and Consumer Discretionary.
Microsoft traded higher after it reported strong results.
Alphabet also performed well following the release of good results.
Installed Building Products performed well as it benefitted from strong insulation prices.
Fidelity National Information Services sold off due to lacklustre results in the payment space from companies like Visa and Fiserv.
TT Emerging Markets Equity Fund 1 October 2021 – 31 March 2022 (Continued)
Portfolio (continued)
8 9
TT INTERNATIONAL FUNDS PLC
INVESTMENT MANAGER’S REPORT (CONTINUED)For the six months ended 31 March 2022
KWG Living struggled due to concerns around the Chinese property market.
Alibaba also struggled on fears over regulation in the Chinese internet space.
Portfolio
With the global lockdowns in March 2020 and the subsequent unprecedented economic hit, there was an enormous rush into structural growth companies capable of maintaining growth in a world of very slow economic expansion at the expense of more cyclically exposed value stocks. Since the advent of the vaccines, this began to reverse, only for the whole “recovery trade” to be squashed by “peak growth” concerns and the rise of the delta variant in May 2021.
To us, this looked more like a pause/positioning washout than anything more fundamental and we believed that the strong spike in yields during the course of September 2021 was perhaps the beginning of the resurgence. Indeed, in addition to economic data remaining strong and inflation remaining high, the delta wave looked to be subsiding in most major geographies and pent-up demand (judging by factors such as the oil price) looked exceedingly strong.
Given that we were still far from a normalised environment, we continued to believe that this trade had some way to go. As such, unlike many other quality managers who maintain a strong growth bias, we remained reasonably balanced, with a portfolio overwhelmingly made up of bottom-up, stock specific ideas, some of which fell into the 'structural growth' camp, and some of which remained more geared to a reopening/reflationary environment. The net effect was that of a very high-quality portfolio, with limited balance sheet or factor risk and very modest pro-cyclicality.
TT Emerging Markets Unconstrained Fund 1 October 2021 – 31 March 2022
For the six months to the end of March 2022 the Fund produced a net return of -13.1% compared to the MSCI Emerging Markets Index return of -8.1%.
Fund MSCI Emerging Markets% %
6 Months to Mar 31, 2022 -13.1 -8.1Q1 – 2022 -11.3 -6.9Q4 – 2021 -2.0 -1.2
All returns shown net of fees
Performance
The Fund finished behind its benchmark, with outperformance in Russia, Korea and Taiwan more than offset by underperformance in China and Saudi Arabia.
The Fund benefitted from its lack of exposure to Russia.
SK Hynix performed well on expectations of firmer memory prices.
Unimicron performed well after it released strong results that prompted upward earnings revisions.
The ABF substrate market remains undersupplied, with favourable pricing trends.
OCI traded higher as it is a key beneficiary of higher urea prices.
Chinese data centre company VNET fell after it cut guidance on new cabinet additions.
The Fund lost out due to its lack of exposure to Saudi banks, which performed well against a backdrop of rising rates. We struggle to find value there as many leading Saudi banks are trading on 5x book value, which assumes substantially higher rates.
TT Global Equity Fund 1 October 2021 – 16 December 2021 (Continued)
Performance (continued)

10
TT INTERNATIONAL FUNDS PLC
INVESTMENT MANAGER’S REPORT (CONTINUED)For the six months ended 31 March 2022
At the sector level, outperformance in Energy, Consumer Discretionary and Materials was overshadowed by underperformance in Financials, Real Estate and Communication Services.
The war in Ukraine has turbocharged commodity price spikes across the board. The Fund’s holdings in Savannah Energy, Glencore, Zijin Mining and ONGC all performed well against this backdrop.
Chinese online lender 360 Digitech struggled amid general concerns about ADRs and the Chinese economy.
KWG Living and A-Living Services struggled due to concerns around the Chinese property market.
Portfolio
In recent weeks we have been looking to increase the portfolio’s exposure to Energy and Materials, given the spike in commodity prices. In the Energy sector we bought Petrobras, Thai Oil and S-Oil, which should be beneficiaries of the elevated oil price.
In the Materials sector we bought urea producer OCI, as well as Yunnan Aluminium and Korean steelmaker POSCO. As part of its drive to lower emissions, China has limited its capacity in both the aluminium and steel industries. At the same time, many smelters in Europe are struggling to operate due to high energy prices. Consequently, pricing power should remain high, particularly as aluminium is a key component in Electric Vehicles, where demand continues to grow rapidly. At just 0.4x book value, POSCO is one of the cheapest steel producers in the world. Another related purchase was Barrick Gold, which is one of the cheapest gold producers in our universe.
Elsewhere we added substantially to Alibaba, Tencent and Meituan. Chinese Internet companies have been hit by a perfect storm of regulatory tightening and a slowing economy. However, recent comments from Beijing suggest that the government intends to stabilise growth and ease its regulatory stance. At the same time, many of these companies have announced measures to rationalise costs. In our view the stars are now aligning for significant outperformance from Chinese Internet companies as a stronger economy should lead to higher topline growth, the effect of which will likely be magnified in the bottom line due to cost cutting measures, while less intervention from Beijing should catalyse a re-rating from very depressed levels. Indeed, on our numbers Alibaba is trading on close to 5x core earnings.
Conversely, we looked to reduce our cyclical Tech exposure as we believe that pressure on consumer purchasing power from higher inflation and a slowing global economy could dent demand for electronics. Moreover, Tech margins are currently very high, but could see pressure in the second half of 2022 as new foundry capacity comes online. This has been the key bottleneck in Tech supply, and once it eases up the sector as a whole could face margin pressure, particularly those areas most closely associated with foundry-related supply constraints. We therefore cut SK Hynix and ASE Technology. For similar reasons we reduced Hyundai Motor, which also has a finance business that will likely see higher NPL formation as the global economy slows.
We also sold Delta Electronics, which we owned for its EV exposure. Many EV-related names have struggled due to concerns over rising input costs. Delta Electronics has held up relatively well, so we decided to exit the position as we felt it could soon come under pressure.
Finally, we cut all exposure to Russia as we became increasingly concerned about the prospect of an invasion of Ukraine.
TT Emerging Markets Unconstrained Fund 1 October 2021 – 31 March 2022 (Continued)
Performance (continued)

10 11
TT INTERNATIONAL FUNDS PLC
INVESTMENT MANAGER’S REPORT (CONTINUED)For the six months ended 31 March 2022
TT China Focus Equity Fund 1 October 2021 – 31 March 2022
For the six months to the end of March 2022 the Fund produced a net return of -30.0% compared to the MSCI China Index return of -19.4%.
Fund MSCI China% %
6 Months to Mar 31, 2022 -30.0 -19.4Q1 – 2022 -21.2 -14.2Q4 – 2021 -11.2 -6.1
All returns shown net of fees
Performance
The Fund finished behind its benchmark, with outperformance in Materials, Health Care and Utilities overshadowed by underperformance in Real Estate and Financials.
The war in Ukraine has turbocharged commodity price spikes across the board. The Fund’s holdings in China Nonferrous Mining, Zijin Mining and Sinopec performed well against this backdrop.
Power Assets performed well in the risk-off environment as it is a net cash Utility.
Shimao Services and Shimao Group struggled due to concerns around the Chinese property market.
The Fund lost out from not owning China Construction Bank. Many of the companies which have outperformed this year have tended to be banks and stodgy SOEs. These are precisely the types of companies that the Fund typically avoids in favour of more dynamic private businesses. We are confident however that once Beijing’s market and growth friendly policies are implemented and risk appetite improves, many of our private sector holdings will lead the rally.
As a small-cap ADR without a dual listing, Kingsoft Cloud struggled over the period.
Portfolio
The key issues that have been casting a shadow over the Chinese market have been COVID, the property cycle and the regulatory backdrop. Unfortunately China’s zero-COVID policy is being severely tested by a rapidly expanding outbreak. The country is making progress with MRNA vaccine development and rollout, but this will take time. Meanwhile, although we have seen signs of easing in the property market, sales have not yet picked up. We expect further easing to stabilise the market, but the government may need to row back from its focus on price control, which is part of the “property is for living not speculation” drive. Where we have far higher conviction is in the regulatory backdrop, which we believe will now become sequentially more favourable. In this regard it is very encouraging to see efforts by Beijing to co-operate with the US and allow auditing of US-listed Chinese ADRs.
Over the period we looked to increase the portfolio’s exposure to Energy, given the spike in commodity prices. We believe that the supply impact of the green energy transition is exacerbating the fundamental tightness in the oil market, meaning that prices should remain elevated. Many oil companies are actively encouraged by investors to return capital or invest in renewable energy rather than drilling for more oil. Consequently, non-OPEC oil supply appears to be peaking, while OPEC is delivering below its quota. We are therefore seeing spare capacity fall and inventories drawing down at a time of the year time when they are usually increasing. The portfolio has oil exposure through Sinopec and Jereh Group, the former of which has an absolute dividend yield of 12-13%.
Meanwhile in the Materials sector we bought Yunnan Aluminium. As part of its drive to lower emissions, China has limited its capacity in the aluminium industry. At the same time, many smelters in Europe are struggling to operate due to high energy prices. Consequently, pricing power should remain high, particularly as aluminium is a key component in Electric Vehicles, where demand continues to grow rapidly.

12
TT INTERNATIONAL FUNDS PLC
INVESTMENT MANAGER’S REPORT (CONTINUED)For the six months ended 31 March 2022
Elsewhere we added substantially to Alibaba and bought JD.com. Chinese Internet companies have been hit by a perfect storm of regulatory tightening and a slowing economy. However, recent comments from Beijing suggest that the government intends to stabilise growth and ease its regulatory stance. At the same time, many of these companies have announced measures to rationalise costs. In our view the stars are now aligning for significant outperformance from Chinese Internet companies as a stronger economy should lead to higher topline growth, the effect of which will likely be magnified in the bottom line due to cost cutting measures, while less intervention from Beijing should catalyse a re-rating from very depressed levels. Indeed, on our numbers Alibaba is trading on close to 5x core earnings.
TT Asia Ex Japan Equity Fund 1 October 2021 – 31 March 2022
For the six months to the end of March 2022 the Fund produced a net return of -15.1% compared to the MSCI AC Asia ex Japan Index return of -9.0%.
Fund MSCI AC Asia ex Japan% %
6 Months to Mar 31, 2022 -15.1 -9.0Q1 – 2022 -11.7 -8.0Q4 – 2021 -3.9 -1.2
All returns shown net of fees
Performance
The Fund finished behind its benchmark, with outperformance in Australia, Taiwan, Korea and India overshadowed by underperformance in China and Hong Kong.
Unimicron performed well after it released strong results that prompted upward earnings revisions.
The ABF substrate market remains undersupplied, with favourable pricing trends.
Karoon Energy was a major winner as it is a key beneficiary of the elevated oil price.
India-based Axis Bank released positive 3Q FY22 results, demonstrating improvements in both credit growth and NIM.
Powerlong and A-Living Services struggled due to concerns around the Chinese property market.
VNET fell after it cut guidance on new cabinet additions.
At the sector level, outperformance in Communication Services and Health Care was more than offset by underperformance in Real Estate, Financials and Industrials.
The Fund benefitted from not owning Internet companies such as Meituan Dianping and Sea. Growth stocks have generally struggled against a backdrop of rising rates. After correcting significantly, we have now bought a position in Sea.
Chinese online lender 360 Digitech struggled amid general concerns about ADRs and the Chinese economy.
Guangdong Jia Yuan and Tongling Jingda sold off due to worries about higher EV battery material costs curbing demand.
TT China Focus Equity Fund 1 October 2021 – 31 March 2022 (Continued)
Portfolio (Continued)

12 13
TT INTERNATIONAL FUNDS PLC
INVESTMENT MANAGER’S REPORT (CONTINUED)For the six months ended 31 March 2022
Portfolio
We have been looking to increase the portfolio’s Energy exposure, given the surge in commodity prices following Russia’s invasion of Ukraine. We believe that the supply impact of the green energy transition is exacerbating the fundamental tightness in the oil market, meaning that prices should remain elevated. Many oil companies are actively encouraged by investors to return capital or invest in renewable energy rather than drilling for more oil. Consequently, non-OPEC oil supply appears to be peaking, while OPEC is delivering below its quota. We are therefore seeing spare capacity fall and inventories drawing down at a time of the year time when they are usually increasing. Over the period we bought E&P company Santos. It offers long reserve life and significant volume growth out to 2029. Management have also committed to improving shareholder returns, which we see as a key catalyst.
We also bought Petronas Chemicals, a key beneficiary of higher oil and urea prices. It has a net cash balance sheet and a high dividend yield.
Another purchase was Larsen & Toubro, which should benefit from a turn in the capex cycle in India. Whilst higher commodity prices will likely cause margin pressure, this should be outweighed by increasing order flow from the Metals, Mining and Energy sectors.
Elsewhere we purchased Prudential, an insurer which, having divested its US business, is now directly comparable to AIA, yet significantly cheaper. We also believe it stands to benefit more when the Hong Kong border reopens, and are constructive on its higher exposure to ASEAN markets.
We also bought Sea as the stock has experienced a substantial correction, but we see a significant long-term growth opportunity in ASEAN e-commerce.
To fund our increasing exposure to Energy and Materials, we have reduced our cyclical Tech positions. We believe that pressure on consumer purchasing power from higher inflation and a slowing global economy could dent demand for electronics. Moreover, Tech margins are currently very high, but could see pressure in the second half of 2022 as new foundry capacity comes online. This has been the key bottleneck in Tech supply, and once it eases up the sector as a whole could face margin pressure, particularly those areas most closely associated with foundry-related supply constraints. Consequently, we sold ASE Technology.
We also sold Delta Electronics, which we owned for its EV exposure. Many EV-related names have struggled due to concerns over rising input costs. Delta Electronics has held up relatively well, so we decided to exit the position as we felt it could soon come under pressure.
Finally, we took some profits in Axis Bank as higher oil prices will be a headwind for the Indian economy, albeit we continue to be positive on the structural growth opportunity in Indian Financials.
TT European Opportunities Long/Short Fund 1 October 2021 – 31 March 2022
For the six months to the end of March 2022 the Fund produced a net return of 0.2%.
Fund%
6 Months to Mar 31, 2022 0.2Q1 – 2022 0.6Q4 – 2021 -0.4
All returns shown net of fees
Performance
The strategy produced a small positive absolute return, with losses in the long book more than offset by gains in the short book and from market hedges.
TT Asia Ex Japan Equity Fund 1 October 2021 – 31 March 2022 (Continued)
14
TT INTERNATIONAL FUNDS PLC
INVESTMENT MANAGER’S REPORT (CONTINUED)For the six months ended 31 March 2022
Gains were led by Materials, Utilities and Financials, while Consumer Discretionary and Industrials saw losses.
OCI performed well in Materials as it is a significant beneficiary of rising fertiliser prices due to war-related supply disruption.
RWE and Veolia rallied in Utilities. The former is a key beneficiary of higher energy prices. The latter had its Suez acquisition approved by the EU.
Standard Chartered performed well in Financials due to expectations of higher interest rates.
Schibsted and Flutter struggled in Consumer Discretionary. The former announced disappointing advertising growth in its classifieds business while the latter sold off due to concerns about increased regulation.
Deutsche Post struggled in Industrials due to market concerns about the risk of higher costs.
Positioning
For many obvious reasons including inflationary pressure, supply uncertainty, high oil prices, EU gas supplies and the war itself, it is clear that the risk-reward profile for European equities remain challenging. Especially now, as indices have bounced from their lows, it is still far from clear in which direction we will see overall markets trade from here. We err on the side of caution, which is reflected in our gross and net positioning. Of course for long-short investors like us it matters less, as we seek new opportunities whichever way the market moves. However, the recent ‘ping pong’ nature of news headlines surrounding the war, more often than not proving to be untrue, is making it very hard to see consistency in sectors and share prices. Clearly there are a few exceptions such as pharma, but overall the rotational forces are still strong and often seemingly random.
The timing of any resolution to the war will be critical to how deep the wounds for Europe prove to be, and the subsequent impact to earnings. The risk of recession or stagflation is growing, but whether or not we will actually see it materialising remains open for debate. What is almost certain is that the earnings outlook for many industries will have to be revised significantly. Indeed, one of our main focus areas for the Q1 results season will be watching closely for evidence of how higher prices might be crimping demand, and how this impacts corporate guidance. As such, we believe that the upcoming reporting season will be crucial for investors and how they consider risk going forward. Equally important will be to gauge the possibility and potential timing of the market’s appetite for Growth stocks returning. Central banks will continue to tighten financial conditions, which will ultimately result in slower growth. But at some point, if rising bond yields start to level out, there may be a shift back to Growth.
In Europe much of what was ‘expensive’ Growth has now significantly de-rated. We believe this offers us increasing opportunities to slowly rebuild new Growth ideas in our long book. Finally, we expect dispersion between sectors and stocks based on how they deal with the crisis to become even more pronounced. This should bode well for our strategy and our ability to identify both new long and short ideas in the coming weeks.
TT Environmental Solutions Fund 1 October 2021 – 31 March 2022
For the six months to the end of March 2022, the Fund produced a net return of -8.1% compared to the MSCI AC World Index return of +1.2%.
Fund MSCI AC Asia ex Japan% %
6 Months to Mar 31, 2022 -8.1 1.2Q1 – 2022 -11.7 -5.3Q4 – 2021 4.1 6.8
All returns shown net of fees
TT European Opportunities Long/Short Fund 1 October 2021 – 31 March 2022 (Continued)
Performance (continued)
14 15
TT INTERNATIONAL FUNDS PLC
INVESTMENT MANAGER’S REPORT (CONTINUED)For the six months ended 31 March 2022
Performance
The Fund finished behind its benchmark, with underperformance particularly notable in Europe and Emerging Markets.
Our renewable genco positions Omega, EDPR and Terna Energy performed well as they benefit from higher power prices. More generally, stocks such as these that have visible growth that isn’t macro dependent are now being re-rated by investors.
Similarly, ‘defensive growth’ companies such as US-listed solar inverter producer SolarEdge attracted investors, given the increasingly challenging macro backdrop.
NIU Technologies struggled on general Chinese ADR concerns, as well as the announcement of results where margins slightly underwhelmed due to input cost pressures. Other names such as China Three Gorges were also caught up in the largely indiscriminate Chinese sell-off.
German rail parts supplier Knorr-Bremse fell on speculation of energy rationing for German heavy industry, which is very reliant on Russian gas.
Many of the Fund’s detractors including Pylon and Installed Building Products were companies where investors had concerns over input cost pressure.
Positioning
With so many powerful crosscurrents battering investors, equity market volatility is likely to remain elevated in the near-term. Against this backdrop, we have been positioning the Fund more defensively, reducing beta and raising cash. This is ultimately to give us dry powder to deploy when we find stocks that we believe have strong long-term growth opportunities, but which have become overly discounted in the present volatility.
Over the period we cut exposure to US housing as rising construction costs and mortgage rates may begin to crimp demand. Consequently, positions in Installed Building Products, Weyerhauser and Owens Corning were all reduced. We also sold some of the Fund’s most energy intensive companies such as Rockwool. For similar reasons, the position in Smurfit Kappa was reduced as its energy costs are rising.
We also took advantage of recent strength to exit our carbon position. Ultimately demand for carbon credits is linked to European GDP, which is likely to slow this year. Likewise, we sold or reduced positions that had held up well, despite a more challenging outlook. Examples include Yunnan Energy, Delta Electronics and ON Semi.
Some of the proceeds from the aforementioned sales were used to increase our ‘defensive growth’ positions such as Chinese grid equipment provider Nari, which was dragged down by general weakness in the Chinese equity market. Just after the end of the period we also bought a large position in Greencoat Renewables. It has a portfolio of generating assets with an attractive running yield of 5.5%, very strong downside protection and upside gearing to inflation and power prices.
Another purchase was Befesa, which processes steel dust, a hazardous byproduct of electric arc steel production, and recycles zinc contained within the steel dust. This process has strong economic and environmental value. Electric arc furnaces are far more energy efficient than making primary steel. They account for 44% and 70% of the market in Europe and the US, respectively, but just 10% in China. The latter is keen to decarbonise its steel industry and therefore aims to increase the penetration of electric arc furnaces significantly over the coming years. Befesa will be a key beneficiary of this trend, and also has positive exposure to commodities as it makes a significant proportion of its revenue from selling the recycled zinc as well as recycled aluminium.
Finally, we bought water treatment company Evoqua. The Biden administration is looking to implement more stringent regulation targeting PFAS chemicals – so called “forever chemicals” – that infiltrate water supplies. Evoqua has a high market share in PFAS treatments and should therefore be a major beneficiary.
TT Environmental Solutions Fund 1 October 2021 – 31 March 2022 (Continued)

16
TT INTERNATIONAL FUNDS PLC
INVESTMENT MANAGER’S REPORT (CONTINUED)For the six months ended 31 March 2022
With regard to themes that we are particularly excited about, in the wake of Russia’s invasion, the green transition has morphed from an environmental issue into a foreign policy one. Consequently, the conflict will likely accelerate the shift towards clean energy. This makes us more constructive on renewables – both the gencos and the supply chains – as well as energy storage. We own multiple names in these areas, including Omega, EDPR, Terna Energy, Stem and Pylon. For similar reasons we are also increasingly positive on the theme of electrification. In anticipation of higher grid investment we own Terna Group, Nari, and electric cable manufacturer Nexans.
TT International Asset Management LimitedApril 2022
TT Environmental Solutions Fund 1 October 2021 – 31 March 2022 (Continued)
Positioning (Continued)
TT INTERNATIONAL FUNDS PLC
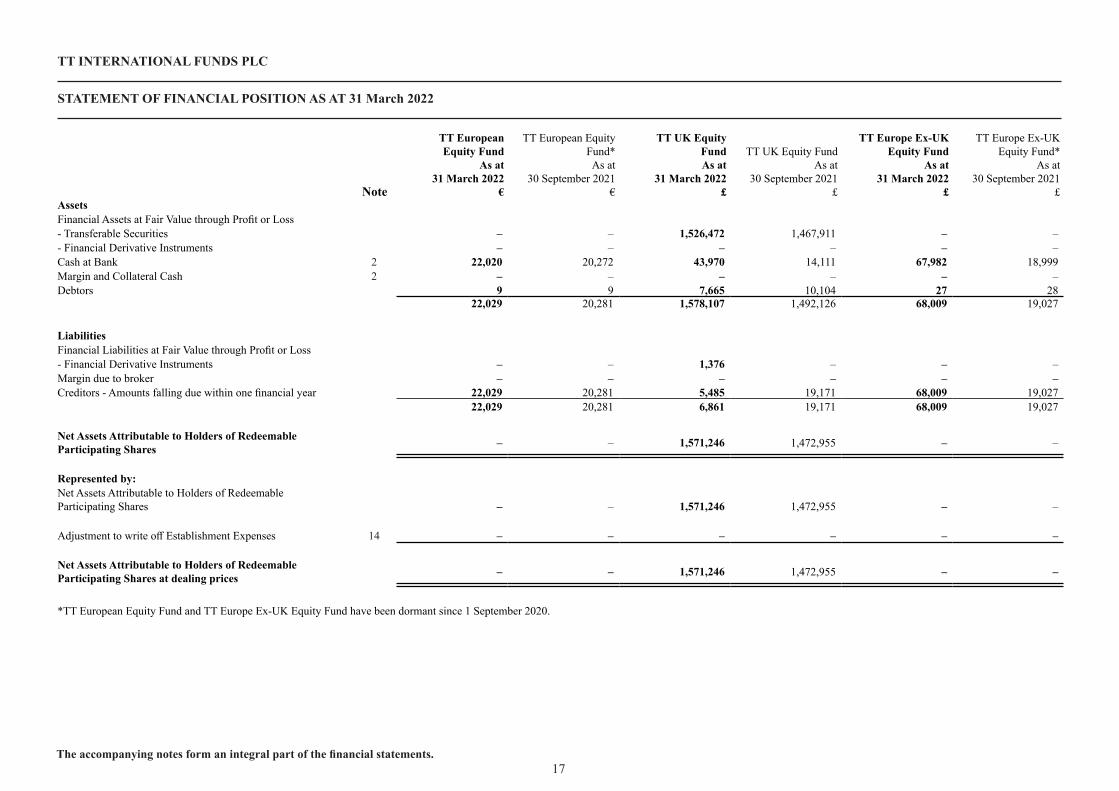
STATEMENT OF FINANCIAL POSITION AS AT 31 March 2022
17The accompanying notes form an integral part of the financial statements.
S Note
TT European Equity Fund
As at 31 March 2022
€
TT European Equity Fund* As at
30 September 2021 €
TT UK Equity Fund As at
31 March 2022 £
TT UK Equity Fund As at
30 September 2021 £
TT Europe Ex-UK Equity Fund
As at 31 March 2022
£
TT Europe Ex-UK Equity Fund*
As at 30 September 2021
£AssetsFinancial Assets at Fair Value through Profit or Loss - Transferable Securities – – 1,526,472 1,467,911 – –- Financial Derivative Instruments – – – – – –Cash at Bank 2 22,020 20,272 43,970 14,111 67,982 18,999Margin and Collateral Cash 2 – – – – – –Debtors 9 9 7,665 10,104 27 28
22,029 20,281 1,578,107 1,492,126 68,009 19,027
LiabilitiesFinancial Liabilities at Fair Value through Profit or Loss- Financial Derivative Instruments – – 1,376 – – –Margin due to broker – – – – – –Creditors - Amounts falling due within one financial year 22,029 20,281 5,485 19,171 68,009 19,027
22,029 20,281 6,861 19,171 68,009 19,027
Net Assets Attributable to Holders of Redeemable Participating Shares – – 1,571,246 1,472,955 – –
Represented by:Net Assets Attributable to Holders of Redeemable Participating Shares – – 1,571,246 1,472,955 – –
Adjustment to write off Establishment Expenses 14 – – – – – –
Net Assets Attributable to Holders of Redeemable Participating Shares at dealing prices – – 1,571,246 1,472,955 – –
*TT European Equity Fund and TT Europe Ex-UK Equity Fund have been dormant since 1 September 2020.
TT INTERNATIONAL FUNDS PLC
STATEMENT OF FINANCIAL POSITION AS AT 31 March 2022 (CONTINUED)
18 19The accompanying notes form an integral part of the financial statements.
S Note
TT Asia-Pacific Equity Fund
As at 31 March 2022
US$
TT Asia-Pacific Equity Fund
As at 30 September 2021
US$
TT Emerging Markets Equity Fund
As at 31 March 2022
US$
TT Emerging Markets Equity Fund
As at 30 September 2021
US$
TT Global Equity Fund*
As at 31 March 2022
US$
TT Global Equity Fund As at
30 September 2021 US$
AssetsFinancial Assets at Fair Value through Profit or Loss - Transferable Securities 182,372,210 218,366,558 744,254,680 933,348,571 – 889,679- Financial Derivative Instruments 41,213 3,831 – 2,069 – 1,472Cash at Bank 2 2,327,666 2,367,524 33,551,528 8,073,342 35,420 18,399Margin and Collateral Cash 2 – 260,000 784,998 580,000 – –Debtors 3,841,554 4,803,738 22,734,338 24,857,747 213 360
188,582,643 225,801,651 801,325,544 966,861,729 35,633 909,910
LiabilitiesFinancial Liabilities at Fair Value through Profit or Loss- Financial Derivative Instruments – 36,742 116,785 38,123 – 1,412Margin due to broker – – – 718,940 – –Creditors - Amounts falling due within one financial year 521,546 4,962,246 14,634,274 21,721,206 35,633 7,349
521,546 4,998,988 14,751,059 22,478,269 35,633 8,761
Net Assets Attributable to Holders of Redeemable Participating Shares 188,061,097 220,802,663 786,574,485 944,383,460 – 901,149
Represented by:Net Assets Attributable to Holders of Redeemable Participating Shares 188,061,097 220,802,663 786,574,485 944,383,460 – 901,149
Adjustment to write off Establishment Expenses 14 – – – – – –
Net Assets Attributable to Holders of Redeemable Participating Shares at dealing prices 188,061,097 220,802,663 786,574,485 944,383,460 – 901,149
*TT Global Equity Fund terminated on 21 December 2021.

TT INTERNATIONAL FUNDS PLC
STATEMENT OF FINANCIAL POSITION AS AT 31 March 2022 (CONTINUED)
19The accompanying notes form an integral part of the financial statements.
S Note
TT Emerging Markets
Unconstrained Fund As at
31 March 2022 US$
TT Emerging Markets Unconstrained
Fund As at
30 September 2021 US$
TT China Focus Fund As at
31 March 2022 US$
TT China Focus Fund As at
30 September 2021 US$
TT Asia Ex Japan Equity Fund
As at 31 March 2022
US$
TT Asia Ex Japan Equity Fund
As at 30 September 2021
US$AssetsFinancial Assets at Fair Value through Profit or Loss - Transferable Securities 658,197,341 762,941,702 4,261,417 6,134,233 60,227,112 74,481,651- Financial Derivative Instruments – 1,655 – 4,142 – 1,300Cash at Bank 2 12,099,066 2,836,134 33,445 404,846 279,570 601,965Margin and Collateral Cash 2 – 260,000 – 17,555 – –Debtors 9,336,934 10,722,110 70,429 58,309 1,005,012 2,648,330
679,633,341 776,761,601 4,365,291 6,619,085 61,511,694 77,733,246
LiabilitiesFinancial Liabilities at Fair Value through Profit or Loss- Financial Derivative Instruments 39,899 30,705 – – – –Margin due to broker – – – – – –Creditors - Amounts falling due within one financial year 13,642,824 6,342,918 12,397 78,523 121,471 3,027,694
13,682,723 6,373,623 12,397 78,523 121,471 3,027,694
Net Assets Attributable to Holders of Redeemable Participating Shares 665,950,618 770,387,978 4,352,894 6,540,562 61,390,223 74,705,552
Represented by:Net Assets Attributable to Holders of Redeemable Participating Shares 665,950,618 770,387,978 4,352,894 6,540,562 61,390,223 74,705,552
Adjustment to write off Establishment Expenses 14 – – 2,355 4,634 7,995 11,581
Net Assets Attributable to Holders of Redeemable Participating Shares at dealing prices 665,950,618 770,387,978 4,355,249 6,545,196 61,398,218 74,717,133

TT INTERNATIONAL FUNDS PLC
STATEMENT OF FINANCIAL POSITION AS AT 31 March 2022 (CONTINUED)
20 21The accompanying notes form an integral part of the financial statements.
S Note
TT European Opportunities Long/
Short Fund As at
31 March 2022 US$
TT European Opportunities Long/
Short Fund As at
30 September 2021 US$
TT Environmental Solutions Fund
As at 31 March 2022
US$
TT Environmental Solutions Fund
As at 30 September 2021
US$
TT Total As at
31 March 2022 €
TT Total As at
30 September 2021 €
AssetsFinancial Assets at Fair Value through Profit or Loss - Transferable Securities 86,562,548 108,435,585 58,278,598 61,009,997 1,614,320,115 1,870,194,329- Financial Derivative Instruments 2,160,114 4,279,084 1,945 111,077 1,980,213 3,800,315Cash at Bank 2 13,155,453 17,720,483 13,038,980 4,643,464 67,131,107 31,694,352Margin and Collateral Cash 2 27,335,975 14,523,236 – – 25,274,005 13,494,874Debtors 2,065,695 2,259,119 668,355 3,249,092 35,710,133 41,942,847
131,279,785 147,217,507 71,987,878 69,013,630 1,744,415,573 1,961,126,717
LiabilitiesFinancial Liabilities at Fair Value through Profit or Loss- Financial Derivative Instruments 2,157,199 1,822,640 105,023 5,842 2,175,644 1,669,918Margin due to broker – – – – – 620,301Creditors - Amounts falling due within one financial year 1,458,813 5,451,666 1,714,170 3,434,957 28,996,158 38,913,637
3,616,012 7,274,306 1,819,193 3,440,799 31,171,802 41,203,856
Net Assets Attributable to Holders of Redeemable Participating Shares 127,663,773 139,943,201 70,168,685 65,572,831 1,713,243,771 1,919,922,861
Represented by:Net Assets Attributable to Holders of Redeemable Participating Shares 127,663,773 139,943,201 70,168,685 65,572,831 1,713,243,771 1,919,922,861
Adjustment to write off Establishment Expenses 14 48,399 58,062 34,248 39,729 83,582 98,364
Net Assets Attributable to Holders of Redeemable Participating Shares at dealing prices 127,712,172 140,001,263 70,202,933 65,612,560 1,713,327,353 1,920,021,225
TT INTERNATIONAL FUNDS PLC
STATEMENT OF FINANCIAL POSITION AS AT 31 March 2022 (CONTINUED)
21The accompanying notes form an integral part of the financial statements.
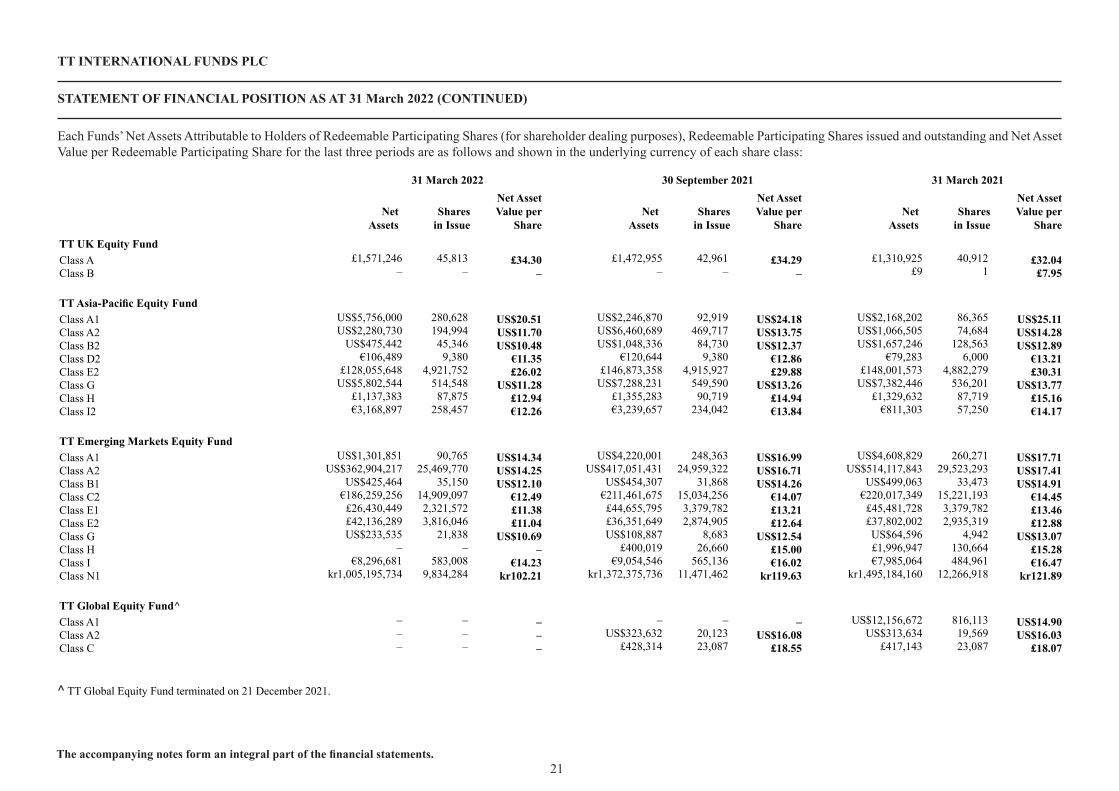
Each Funds’ Net Assets Attributable to Holders of Redeemable Participating Shares (for shareholder dealing purposes), Redeemable Participating Shares issued and outstanding and Net Asset Value per Redeemable Participating Share for the last three periods are as follows and shown in the underlying currency of each share class:
31 March 2022 30 September 2021 31 March 2021
Net Assets
Shares in Issue
Net Asset Value per
ShareNet
AssetsShares
in Issue
Net Asset Value per
ShareNet
AssetsShares
in Issue
Net Asset Value per
Share
TT UK Equity FundClass A £1,571,246 45,813 £34.30 £1,472,955 42,961 £34.29 £1,310,925 40,912 £32.04Class B – – – – – – £9 1 £7.95
TT Asia-Pacific Equity FundClass A1 US$5,756,000 280,628 US$20.51 US$2,246,870 92,919 US$24.18 US$2,168,202 86,365 US$25.11Class A2 US$2,280,730 194,994 US$11.70 US$6,460,689 469,717 US$13.75 US$1,066,505 74,684 US$14.28Class B2 US$475,442 45,346 US$10.48 US$1,048,336 84,730 US$12.37 US$1,657,246 128,563 US$12.89Class D2 €106,489 9,380 €11.35 €120,644 9,380 €12.86 €79,283 6,000 €13.21Class E2 £128,055,648 4,921,752 £26.02 £146,873,358 4,915,927 £29.88 £148,001,573 4,882,279 £30.31Class G US$5,802,544 514,548 US$11.28 US$7,288,231 549,590 US$13.26 US$7,382,446 536,201 US$13.77Class H £1,137,383 87,875 £12.94 £1,355,283 90,719 £14.94 £1,329,632 87,719 £15.16Class I2 €3,168,897 258,457 €12.26 €3,239,657 234,042 €13.84 €811,303 57,250 €14.17
TT Emerging Markets Equity FundClass A1 US$1,301,851 90,765 US$14.34 US$4,220,001 248,363 US$16.99 US$4,608,829 260,271 US$17.71Class A2 US$362,904,217 25,469,770 US$14.25 US$417,051,431 24,959,322 US$16.71 US$514,117,843 29,523,293 US$17.41Class B1 US$425,464 35,150 US$12.10 US$454,307 31,868 US$14.26 US$499,063 33,473 US$14.91Class C2 €186,259,256 14,909,097 €12.49 €211,461,675 15,034,256 €14.07 €220,017,349 15,221,193 €14.45Class E1 £26,430,449 2,321,572 £11.38 £44,655,795 3,379,782 £13.21 £45,481,728 3,379,782 £13.46Class E2 £42,136,289 3,816,046 £11.04 £36,351,649 2,874,905 £12.64 £37,802,002 2,935,319 £12.88Class G US$233,535 21,838 US$10.69 US$108,887 8,683 US$12.54 US$64,596 4,942 US$13.07Class H – – – £400,019 26,660 £15.00 £1,996,947 130,664 £15.28Class I €8,296,681 583,008 €14.23 €9,054,546 565,136 €16.02 €7,985,064 484,961 €16.47Class N1 kr1,005,195,734 9,834,284 kr102.21 kr1,372,375,736 11,471,462 kr119.63 kr1,495,184,160 12,266,918 kr121.89
TT Global Equity Fund^Class A1 – – – – – – US$12,156,672 816,113 US$14.90Class A2 – – – US$323,632 20,123 US$16.08 US$313,634 19,569 US$16.03Class C – – – £428,314 23,087 £18.55 £417,143 23,087 £18.07
^ TT Global Equity Fund terminated on 21 December 2021.
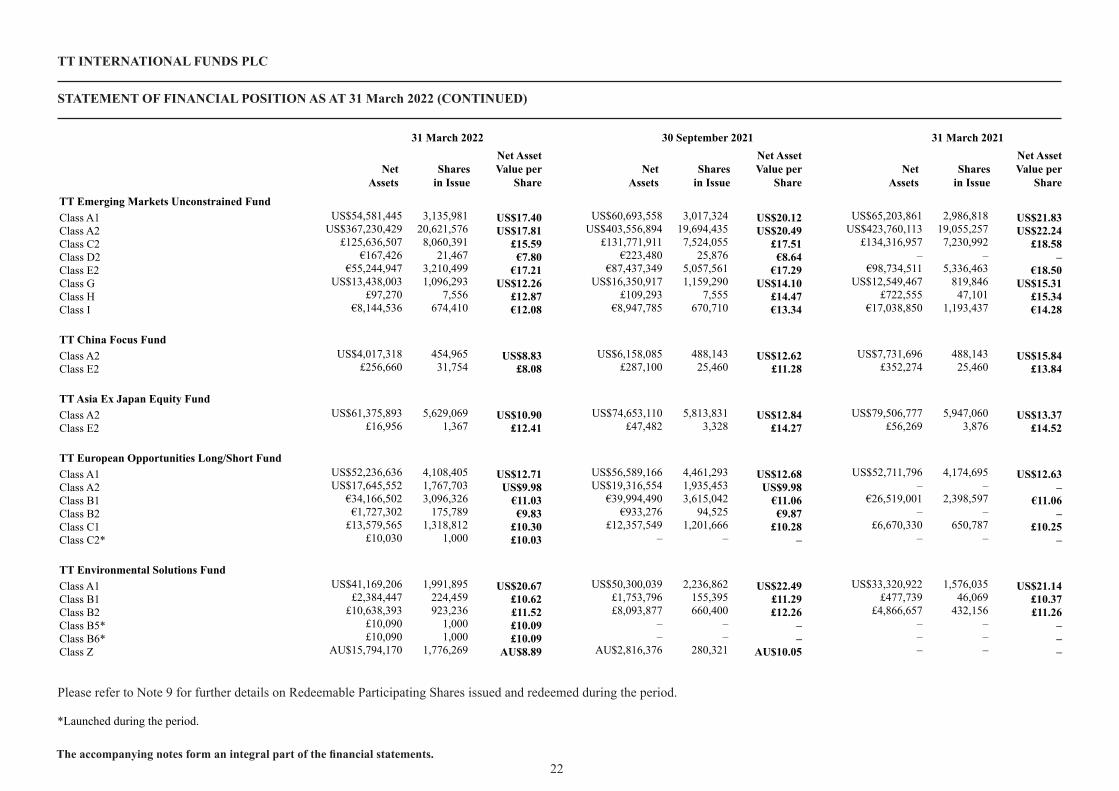
TT INTERNATIONAL FUNDS PLC
STATEMENT OF FINANCIAL POSITION AS AT 31 March 2022 (CONTINUED)
22The accompanying notes form an integral part of the financial statements.
31 March 2022 30 September 2021 31 March 2021
Net Assets
Shares in Issue
Net Asset Value per
ShareNet
AssetsShares
in Issue
Net Asset Value per
ShareNet
AssetsShares
in Issue
Net Asset Value per
Share
TT Emerging Markets Unconstrained FundClass A1 US$54,581,445 3,135,981 US$17.40 US$60,693,558 3,017,324 US$20.12 US$65,203,861 2,986,818 US$21.83Class A2 US$367,230,429 20,621,576 US$17.81 US$403,556,894 19,694,435 US$20.49 US$423,760,113 19,055,257 US$22.24Class C2 £125,636,507 8,060,391 £15.59 £131,771,911 7,524,055 £17.51 £134,316,957 7,230,992 £18.58Class D2 €167,426 21,467 €7.80 €223,480 25,876 €8.64 – – –Class E2 €55,244,947 3,210,499 €17.21 €87,437,349 5,057,561 €17.29 €98,734,511 5,336,463 €18.50Class G US$13,438,003 1,096,293 US$12.26 US$16,350,917 1,159,290 US$14.10 US$12,549,467 819,846 US$15.31Class H £97,270 7,556 £12.87 £109,293 7,555 £14.47 £722,555 47,101 £15.34Class I €8,144,536 674,410 €12.08 €8,947,785 670,710 €13.34 €17,038,850 1,193,437 €14.28
TT China Focus FundClass A2 US$4,017,318 454,965 US$8.83 US$6,158,085 488,143 US$12.62 US$7,731,696 488,143 US$15.84Class E2 £256,660 31,754 £8.08 £287,100 25,460 £11.28 £352,274 25,460 £13.84
TT Asia Ex Japan Equity FundClass A2 US$61,375,893 5,629,069 US$10.90 US$74,653,110 5,813,831 US$12.84 US$79,506,777 5,947,060 US$13.37Class E2 £16,956 1,367 £12.41 £47,482 3,328 £14.27 £56,269 3,876 £14.52
TT European Opportunities Long/Short FundClass A1 US$52,236,636 4,108,405 US$12.71 US$56,589,166 4,461,293 US$12.68 US$52,711,796 4,174,695 US$12.63Class A2 US$17,645,552 1,767,703 US$9.98 US$19,316,554 1,935,453 US$9.98 – – –Class B1 €34,166,502 3,096,326 €11.03 €39,994,490 3,615,042 €11.06 €26,519,001 2,398,597 €11.06Class B2 €1,727,302 175,789 €9.83 €933,276 94,525 €9.87 – – –Class C1 £13,579,565 1,318,812 £10.30 £12,357,549 1,201,666 £10.28 £6,670,330 650,787 £10.25Class C2* £10,030 1,000 £10.03 – – – – – –
TT Environmental Solutions FundClass A1 US$41,169,206 1,991,895 US$20.67 US$50,300,039 2,236,862 US$22.49 US$33,320,922 1,576,035 US$21.14Class B1 £2,384,447 224,459 £10.62 £1,753,796 155,395 £11.29 £477,739 46,069 £10.37Class B2 £10,638,393 923,236 £11.52 £8,093,877 660,400 £12.26 £4,866,657 432,156 £11.26Class B5* £10,090 1,000 £10.09 – – – – – –Class B6* £10,090 1,000 £10.09 – – – – – –Class Z AU$15,794,170 1,776,269 AU$8.89 AU$2,816,376 280,321 AU$10.05 – – –
Please refer to Note 9 for further details on Redeemable Participating Shares issued and redeemed during the period.
*Launched during the period.

TT INTERNATIONAL FUNDS PLC
STATEMENT OF COMPREHENSIVE INCOME FOR THE SIX MONTHS ENDED 31 MARCH 2022
23The accompanying notes form an integral part of the financial statements.
s Note
TT European Equity Fund
Period Ended 31 March 2022
€
TT European Equity Fund*
Period Ended 31 March 2021
€
TT UK Equity Fund
Period Ended 31 March 2022
£
TT UK Equity Fund Period Ended
31 March 2021 £
TT Europe Ex-UK Equity Fund
Period Ended 31 March 2022
£
TT Europe Ex-UK Equity Fund* Period Ended
31 March 2021 £
Income – – 17,067 9,589 – –Net gains on Financial Assets and Financial Liabilities at Fair Value through Profit or Loss – – 14,325 300,231 – –
Total Income – – 31,392 309,820 – –
Expenses – – (12,719) (14,048) – –
Net Profit before Finance Costs – – 18,673 295,772 – –
Finance CostsDividends Paid 19 – – (17,489) (16,150) – –Interest Expense – – (317) (575) – –
Profit for the period before taxation – – 867 279,047 – –
TaxWithholding Tax – – (716) (72) – –Capital Gains Tax – – – – – –Total Tax – – (716) (72) – –
Increase in Net Assets Attributable to Holders of Redeemable Participating Shares – – 151 278,975 – –
Adjustment to write off Establishment Expenses 14 – – – – – –
Increase in Net Assets Attributable to Holders of Redeemable Participating Shares at dealing prices – – 151 278,975 – –
*TT European Equity Fund and TT Europe Ex-UK Equity Fund have been dormant since 1 September 2020.

TT INTERNATIONAL FUNDS PLC
STATEMENT OF COMPREHENSIVE INCOME FOR THE SIX MONTHS ENDED 31 MARCH 2022 (CONTINUED)
24The accompanying notes form an integral part of the financial statements.
s Note
TT Asia-Pacific Equity Fund
Period Ended 31 March 2022
US$
TT Asia-Pacific Equity Fund
Period Ended 31 March 2021
US$
TT Emerging Markets Equity Fund
Period Ended 31 March 2022
US$
TT Emerging Markets Equity Fund
Period Ended 31 March 2021
US$
TT Global Equity Fund*
Period Ended 31 March 2022
US$
TT Global Equity Fund
Period Ended 31 March 2021
US$
Income 1,301,235 2,010,334 5,005,125 7,748,854 2,057 74,531Net (losses)/gains on Financial Assets and Financial Liabilities at Fair Value through Profit or Loss (32,541,100) 63,693,181 (135,198,756) 213,200,429 21,472 1,688,689
Total (Expense)/Income (31,239,865) 65,703,515 (130,193,631) 220,949,283 23,529 1,763,220
Expenses (1,491,374) (1,712,234) (6,628,107) (6,885,872) (33,270) (68,476)
Net (Loss)/Profit before Finance Costs (32,731,239) 63,991,281 (136,821,738) 214,063,411 (9,741) 1,694,744
Finance CostsDividends Paid 19 (20,581) (54,831) (540,182) (29,670) – (8,287)Interest Expense (317) (3,989) (261) (25,475) – (4)
(Loss)/Profit for the period before taxation (32,752,137) 63,932,461 (137,362,181) 214,008,266 (9,741) 1,686,453
TaxWithholding Tax (355,457) (263,170) (1,316,360) (1,133,016) (480) (18,811)Capital Gains Tax 423,588 (1,130,704) 747,711 (3,049,071) 299 (19,058)Total Tax 68,131 (1,393,874) (568,649) (4,182,087) (181) (37,869)
(Decrease)/Increase in Net Assets Attributable to Holders of Redeemable Participating Shares (32,684,006) 62,538,587 (137,930,830) 209,826,179 (9,922) 1,648,584
Adjustment to write off Establishment Expenses 14 – – – – – –
(Decrease)/Increase in Net Assets Attributable to Holders of Redeemable Participating Shares at dealing prices (32,684,006) 62,538,587 (137,930,830) 209,826,179 (9,922) 1,648,584
*TT Global Equity Fund terminated on 21 December 2021.
TT INTERNATIONAL FUNDS PLC
STATEMENT OF COMPREHENSIVE INCOME FOR THE SIX MONTHS ENDED 31 MARCH 2022 (CONTINUED)
25The accompanying notes form an integral part of the financial statements.
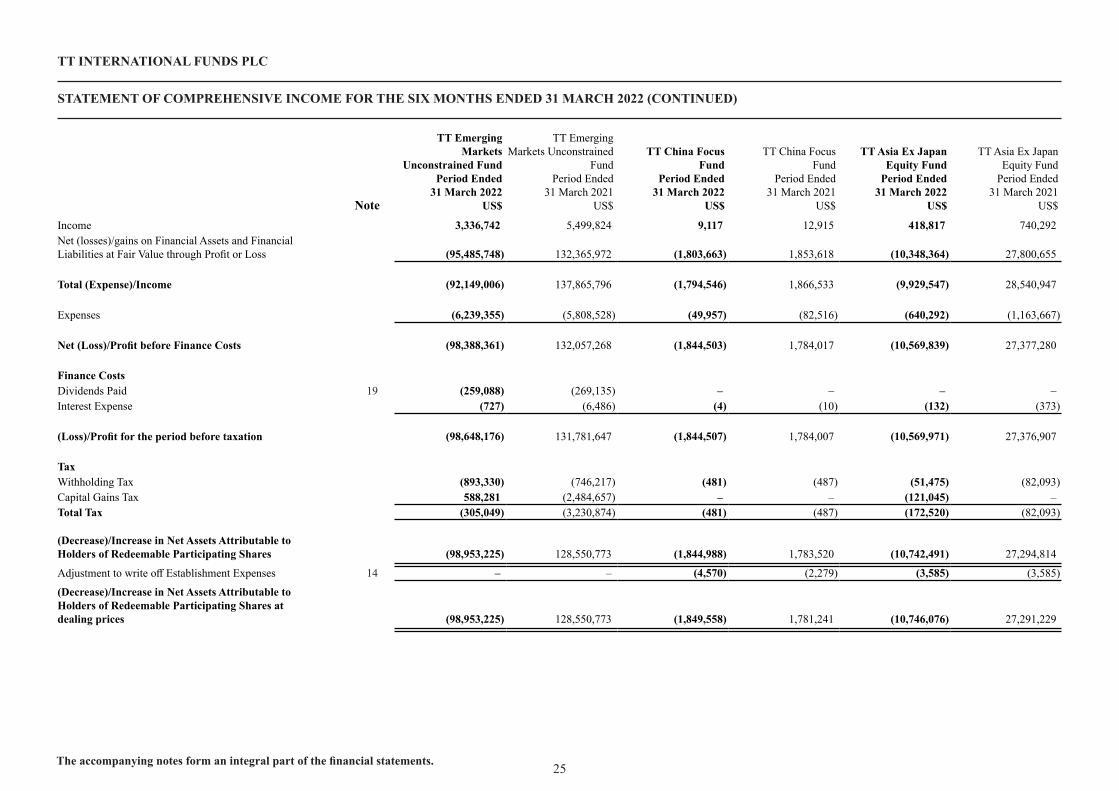
s Note
TT Emerging Markets
Unconstrained Fund Period Ended
31 March 2022 US$
TT Emerging Markets Unconstrained
Fund Period Ended
31 March 2021 US$
TT China Focus Fund
Period Ended 31 March 2022
US$
TT China Focus Fund
Period Ended 31 March 2021
US$
TT Asia Ex Japan Equity Fund
Period Ended 31 March 2022
US$
TT Asia Ex Japan Equity Fund
Period Ended 31 March 2021
US$
Income 3,336,742 5,499,824 9,117 12,915 418,817 740,292Net (losses)/gains on Financial Assets and Financial Liabilities at Fair Value through Profit or Loss (95,485,748) 132,365,972 (1,803,663) 1,853,618 (10,348,364) 27,800,655
Total (Expense)/Income (92,149,006) 137,865,796 (1,794,546) 1,866,533 (9,929,547) 28,540,947
Expenses (6,239,355) (5,808,528) (49,957) (82,516) (640,292) (1,163,667)
Net (Loss)/Profit before Finance Costs (98,388,361) 132,057,268 (1,844,503) 1,784,017 (10,569,839) 27,377,280
Finance CostsDividends Paid 19 (259,088) (269,135) – – – –Interest Expense (727) (6,486) (4) (10) (132) (373)
(Loss)/Profit for the period before taxation (98,648,176) 131,781,647 (1,844,507) 1,784,007 (10,569,971) 27,376,907
TaxWithholding Tax (893,330) (746,217) (481) (487) (51,475) (82,093)Capital Gains Tax 588,281 (2,484,657) – – (121,045) –Total Tax (305,049) (3,230,874) (481) (487) (172,520) (82,093)
(Decrease)/Increase in Net Assets Attributable to Holders of Redeemable Participating Shares (98,953,225) 128,550,773 (1,844,988) 1,783,520 (10,742,491) 27,294,814
Adjustment to write off Establishment Expenses 14 – – (4,570) (2,279) (3,585) (3,585)
(Decrease)/Increase in Net Assets Attributable to Holders of Redeemable Participating Shares at dealing prices (98,953,225) 128,550,773 (1,849,558) 1,781,241 (10,746,076) 27,291,229

TT INTERNATIONAL FUNDS PLC
STATEMENT OF COMPREHENSIVE INCOME FOR THE SIX MONTHS ENDED 31 MARCH 2022 (CONTINUED)
26The accompanying notes form an integral part of the financial statements.
s Note
TT European Opportunities Long/
Short Fund Period Ended
31 March 2022 US$
TT European Opportunities Long/
Short Fund Period Ended
31 March 2021 US$
TT Environmental Solutions Fund
Period Ended 31 March 2022
US$
TT Environmental Solutions Fund
Period Ended 31 March 2021
US$
TT Total Period Ended
31 March 2022 €
TT Total Period Ended
31 March 2021 €
Income 552,567 315,550 366,468 90,522 9,723,669 13,770,754Net (losses)/gains on Financial Assets and Financial Liabilities at Fair Value through Profit or Loss (1,839,668) 6,888,569 (6,271,288) 10,142,536 (250,216,427) 382,141,663
Total (Expense)/Income (1,287,101) 7,204,119 (5,904,820) 10,233,058 (240,492,758) 395,912,417
Expenses (858,962) (1,295,483) (444,838) (199,916) (14,480,139) (14,379,697)
Net (Loss)/Profit before Finance Costs (2,146,063) 5,908,636 (6,349,658) 10,033,142 (254,972,897) 381,532,720
Finance CostsDividends Paid 19 – – (15,249) – (757,952) (320,129)Interest Expense (147,157) (68,513) (188) (909) (131,719) (88,882)
(Loss)/Profit for the period before taxation (2,293,220) 5,840,123 (6,365,095) 10,032,233 (255,862,568) 381,123,709
TaxWithholding Tax (72,050) (23,186) (85,217) (15,857) (2,450,376) (1,904,652)Capital Gains Tax – – – (61,213) 1,446,697 (5,627,106)Total Tax (72,050) (23,186) (85,217) (77,070) (1,003,679) (7,531,758)
(Decrease)/Increase in Net Assets Attributable to Holders of Redeemable Participating Shares (2,365,270) 5,816,937 (6,450,312) 9,955,163 (256,866,247) 373,591,951
Adjustment to write off Establishment Expenses 14 (9,662) (9,662) (5,482) (5,482) (20,567) (17,527)
(Decrease)/Increase in Net Assets Attributable to Holders of Redeemable Participating Shares at dealing prices (2,374,932) 5,807,275 (6,455,794) 9,949,681 (256,886,814) 373,574,424
Income and expenses arise solely from continuing operations. There were no recognised gains and losses other than those dealt with in the Statement of Comprehensive Income.

27The accompanying notes form an integral part of the financial statements.
TT INTERNATIONAL FUNDS PLC
STATEMENT OF CHANGES IN NET ASSETS ATTRIBUTABLE TO HOLDERS OF REDEEMABLEPARTICIPATING SHARES FOR THE SIX MONTHS ENDED 31 MARCH 2022
s Note
TT European Equity Fund
Period Ended 31 March 2022
€
TT European Equity Fund*
Period Ended 31 March 2021
€
TT UK Equity Fund Period Ended
31 March 2022 £
TT UK Equity Fund Period Ended
31 March 2021 £
TT Europe Ex-UK Equity Fund
Period Ended 31 March 2022
£
TT Europe Ex-UK Equity Fund* Period Ended
31 March 2021 £
Net Assets Attributable to Holders of Redeemable Participating Shares at the beginning of the period – – 1,472,955 933,386 – –
Notional Foreign Exchange Movement 18 – – – – – –
Increase in Net Assets Attributable to Holders of Redeemable Participating Shares from operations – – 151 278,975 – –
Capital transactionsProceeds from Redeemable Participating Shares issued – – 124,636 990,961 – –Payments for Redeemable Participating Shares redeemed – – (26,496) (892,388) – –Net proceeds from capital transactions – – 98,140 98,573 – –
Net Assets Attributable to Holders of Redeemable Participating Shares at the end of the period – – 1,571,246 1,310,934 – –
Adjustment to write off Establishment Expenses 14 – – – – – –
Net Assets Attributable to Holders of Redeemable Participating Shares at dealing prices – – 1,571,246 1,310,934 – –
*TT European Equity Fund and TT Europe Ex-UK Equity Fund have been dormant since 1 September 2020.

TT INTERNATIONAL FUNDS PLC
STATEMENT OF CHANGES IN NET ASSETS ATTRIBUTABLE TO HOLDERS OF REDEEMABLEPARTICIPATING SHARES FOR THE SIX MONTHS ENDED 31 MARCH 2022 (CONTINUED)
28The accompanying notes form an integral part of the financial statements.
s Note
TT Asia-Pacific Equity Fund
Period Ended 31 March 2022
US$
TT Asia-Pacific Equity Fund
Period Ended 31 March 2021
US$
TT Emerging Markets Equity Fund
Period Ended 31 March 2022
US$
TT Emerging Markets Equity Fund
Period Ended 31 March 2021
US$
TT Global Equity Fund*
Period Ended 31 March 2022
US$
TT Global Equity Fund Period Ended
31 March 2021 US$
Net Assets Attributable to Holders of Redeemable Participating Shares at the beginning of the period 220,802,663 161,339,633 944,383,460 641,815,980 901,149 11,708,874
Notional Foreign Exchange Movement 18 – – – – – –
(Decrease)/Increase in Net Assets Attributable to Holders of Redeemable Participating Shares from operations (32,684,006) 62,538,587 (137,930,830) 209,826,179 (9,922) 1,648,584
Capital transactionsProceeds from Redeemable Participating Shares issued 11,422,039 2,058,156 75,060,816 309,415,882 – 2,341Payments for Redeemable Participating Shares redeemed (11,479,599) (6,582,993) (94,938,961) (80,979,716) (891,227) (313,961)Net (payments)/proceeds from capital transactions (57,560) (4,524,837) (19,878,145) 228,436,166 (891,227) (311,620)
Net Assets Attributable to Holders of Redeemable Participating Shares at the end of the period 188,061,097 219,353,383 786,574,485 1,080,078,325 – 13,045,838
Adjustment to write off Establishment Expenses 14 – – – – – –
Net Assets Attributable to Holders of Redeemable Participating Shares at dealing prices 188,061,097 219,353,383 786,574,485 1,080,078,325 – 13,045,838
*TT Global Equity Fund terminated on 21 December 2021.
TT INTERNATIONAL FUNDS PLC
STATEMENT OF CHANGES IN NET ASSETS ATTRIBUTABLE TO HOLDERS OF REDEEMABLEPARTICIPATING SHARES FOR THE SIX MONTHS ENDED 31 MARCH 2022 (CONTINUED)
29The accompanying notes form an integral part of the financial statements.
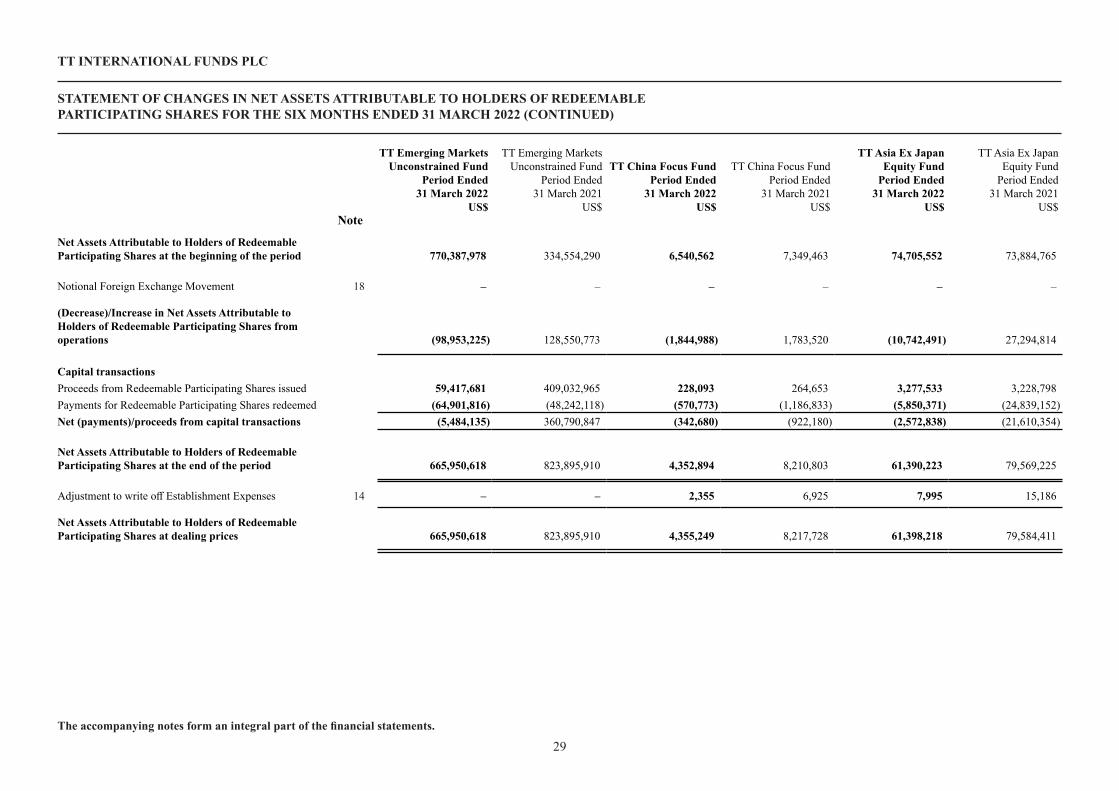
s Note
TT Emerging Markets Unconstrained Fund
Period Ended 31 March 2022
US$
TT Emerging Markets Unconstrained Fund
Period Ended 31 March 2021
US$
TT China Focus Fund Period Ended
31 March 2022 US$
TT China Focus Fund Period Ended
31 March 2021 US$
TT Asia Ex Japan Equity Fund
Period Ended 31 March 2022
US$
TT Asia Ex Japan Equity Fund
Period Ended 31 March 2021
US$
Net Assets Attributable to Holders of Redeemable Participating Shares at the beginning of the period 770,387,978 334,554,290 6,540,562 7,349,463 74,705,552 73,884,765
Notional Foreign Exchange Movement 18 – – – – – –
(Decrease)/Increase in Net Assets Attributable to Holders of Redeemable Participating Shares from operations (98,953,225) 128,550,773 (1,844,988) 1,783,520 (10,742,491) 27,294,814
Capital transactionsProceeds from Redeemable Participating Shares issued 59,417,681 409,032,965 228,093 264,653 3,277,533 3,228,798Payments for Redeemable Participating Shares redeemed (64,901,816) (48,242,118) (570,773) (1,186,833) (5,850,371) (24,839,152)Net (payments)/proceeds from capital transactions (5,484,135) 360,790,847 (342,680) (922,180) (2,572,838) (21,610,354)
Net Assets Attributable to Holders of Redeemable Participating Shares at the end of the period 665,950,618 823,895,910 4,352,894 8,210,803 61,390,223 79,569,225
Adjustment to write off Establishment Expenses 14 – – 2,355 6,925 7,995 15,186
Net Assets Attributable to Holders of Redeemable Participating Shares at dealing prices 665,950,618 823,895,910 4,355,249 8,217,728 61,398,218 79,584,411

TT INTERNATIONAL FUNDS PLC
STATEMENT OF CHANGES IN NET ASSETS ATTRIBUTABLE TO HOLDERS OF REDEEMABLEPARTICIPATING SHARES FOR THE SIX MONTHS ENDED 31 MARCH 2022 (CONTINUED)
30The accompanying notes form an integral part of the financial statements.
s Note
TT European Opportunities Long/
Short Fund Period Ended
31 March 2022 US$
TT European Opportunities Long/
Short Fund Period Ended
31 March 2021 US$
TT Environmental Solutions Fund
Period Ended 31 March 2022
US$
TT Environmental Solutions Fund
Period Ended 31 March 2021
US$
TT Total Period Ended
31 March 2022 €
TT Total Period Ended
31 March 2021 €
Net Assets Attributable to Holders of Redeemable Participating Shares at the beginning of the period 139,943,201 41,789,683 65,572,831 17,277,121 1,919,922,861 1,100,902,111
Notional Foreign Exchange Movement 18 – – – – 74,871,436 15,129,093
(Decrease)/Increase in Net Assets Attributable to Holders of Redeemable Participating Shares from operations (2,365,270) 5,816,937 (6,450,312) 9,955,163 (256,866,247) 373,591,951
Capital transactionsProceeds from Redeemable Participating Shares issued 18,259,575 51,165,749 19,301,917 15,891,359 165,195,506 661,096,604Payments for Redeemable Participating Shares redeemed (28,173,733) (5,757,511) (8,255,751) (2,474,298) (189,879,785) (143,149,565)Net (payments)/proceeds from capital transactions (9,914,158) 45,408,238 11,046,166 13,417,061 (24,684,279) 517,947,039
Net Assets Attributable to Holders of Redeemable Participating Shares at the end of the period 127,663,773 93,014,858 70,168,685 40,649,345 1,713,243,771 2,007,570,194
Adjustment to write off Establishment Expenses 14 48,399 67,777 34,248 45,241 83,582 114,968
Net Assets Attributable to Holders of Redeemable Participating Shares at dealing prices 127,712,172 93,082,635 70,202,933 40,694,586 1,713,327,353 2,007,685,162

31
TT INTERNATIONAL FUNDS PLC
NOTES TO THE FINANCIAL STATEMENTSFor the six months ended 31 March 2022
1. Accounting Policies
The significant accounting policies and estimation techniques adopted by TT International Funds PLC (the “Company”) are as follows:
Basis of Preparation of Financial Statements
These condensed interim financial statements have been prepared in accordance with Financial Reporting Standard 104 “Interim Financial Reporting” (“FRS 104”), with the Companies Act 2014 (including amendments by the Companies (Accounting) Act 2017, hereinafter referred to as “the Companies Act 2014”), in accordance with the European Communities (Undertakings for Collective Investment in Transferable Securities) Regulations 2011, as amended, and the Central Bank (Supervision and Enforcement) Act 2013 (Section 48(1)) (Undertakings for Collective Investment in Transferable Securities) Regulations 2019 (the “Central Bank UCITS Regulations”). The unaudited condensed financial statements should be read in conjunction with the audited financial statements for the financial year ended 30 September 2021 which were prepared in accordance with Financial Reporting Standard FRS 102, Irish statute comprising the Companies Act 2014 and the UCITS Regulations.
The financial statements are prepared under the historical cost convention as modified by the revaluation of financial assets and financial liabilities at fair value through profit or loss. The financial statements have been prepared on the basis of the accounting policies set out in the most recent set of annual financial statements. Valuation time is close of business (Irish time) on the relevant Dealing Day.
The Company meets all the conditions set out in FRS 102, Section 7, and consequently has availed of the exemption available to certain Funds not to prepare a Statement of Cash Flows.
Comparative Information
FRS 104 requires that Statement of Comprehensive Income and the Statement of Changes in the Net Assets Attributable to Holders of Redeemable Participating Shares for the current interim period show the comparable interim period of the immediately preceding financial year. The Statement of Financial Position as of the end of the current interim period is required, under FRS 104, to disclose a comparable Statement of Financial Position as of the end of the immediately preceding financial year.
2. Cash at Bank, Margin and Collateral Cash
All cash at bank, margin and collateral cash balances are held with Northern Trust Fiduciary Services (Ireland) Limited, or with third party institutions approved by the Company, or directly with a sub-custodian.
3. Investment Management Fees
The Investment Manager is entitled to receive from the Company an annual management fee out of the net assets of each share class, as set out overleaf, together with reasonable costs and expenses incurred by the Investment Manager in the performance of its duties. These fees accrue and are calculated on each Dealing Day and are payable monthly in arrears. The Investment Manager may rebate any proportion of the fees that it has received to any investor and may differentiate between potential investors in relation to the amount of such rebate. The Investment Manager earned a fee of €7,827,047 for the six months ended 31 March 2022 (for the six months ended 31 March 2021: €6,523,173), of which €1,207,855 (30 September 2021: €1,401,491) was outstanding at the period end. In order that the total expenses of the Funds do not exceed the rates set out overleaf of the NAV of each share class, the Investment Manager has agreed to reimburse expenses totalling €16,386 (for the six months ended 31 March 2021: €3,207), of which Nil (30 September 2021: Nil) was receivable at the period end.

32
TT INTERNATIONAL FUNDS PLC
NOTES TO THE FINANCIAL STATEMENTS (CONTINUED)For the six months ended 31 March 2022
Share Class Investment Management Fee Total Expense RatioClass A 1.00% 1.20%Class A1 0.50% - 1.00% 1.00% - 1.50%Class A2 0.60% - 1.00% 1.10% - 1.50%Class B 1.50% 1.70%Class B1 0.50% - 1.50% 1.00% - 2.00%Class B2 0.60% - 1.50% 1.10% - 2.00%Class B5 0.80% 1.30%Class B6 0.80% 1.30%Class C 0.80% 1.30%Class C1 0.50% 1.00%Class C2 0.60% - 1.00% 1.10% - 1.50%Class D2 1.50% 2.00%Class E1 0.80% - 1.50% 1.30% - 1.50%Class E2 0.80% - 1.00% 1.30% - 1.50%Class G 0.80% - 1.00% 1.30% - 1.50%Class H 0.80% - 1.00% 1.30% - 1.50%Class I 0.80% - 1.00% 1.30% - 1.50%Class I2 0.80% 1.30%Class N1 0.65% - 0.80% 1.15% - 1.30%Class Z 0.40% 0.90%
4. Administration Fees
Northern Trust International Fund Administration Services (Ireland) Limited (the “Administrator”) is entitled to receive out of the assets of the Fund an annual fee which will not exceed 0.06% of the net assets of the Fund, subject to a minimum of US $39,000 per annum (plus any applicable taxes). This fee accrues and is calculated on each Dealing Day and payable monthly in arrears. The Administrator is also entitled to charge to the Fund all agreed fees and transaction charges, at normal commercial rates, together with reasonable out-of-pocket expenses (plus any applicable taxes), it incurs on behalf of the Fund in the performance of its duties under the Administration Agreement, which shall be payable monthly in arrears.
The administration fee is accrued and calculated on each Dealing Day and is payable monthly in arrears. The Administrator earned a fee of €281,518 for the six months ended 31 March 2022 (for the six months ended 31 March 2021: €246,084), of which €136,515 (30 September 2021: €153,630) was outstanding at the period end.
5. Depositary Fees
Northern Trust Fiduciary Services (Ireland) Limited (the “Depositary”) is entitled to receive out of the assets of the Fund an annual fee which will not exceed 0.50% of the net assets of the Fund the following:
• 0.0125% of the Net Assets of the Fund on the first US$500 million;
• 0.0075% of the Net Assets of the Fund on the next US$1 billion,
• 0.0050% thereafter,
• Subject to a minimum fee per Fund per Month of US$1,000.
The Depositary is also entitled to charge to the Fund all agreed sub-custody fees and transaction charges, at normal commercial rates, together with reasonable out-of-pocket expenses (plus any applicable taxes), it incurs on behalf of that Fund in the performance of its duties under the Depositary Agreement, which shall be payable monthly in arrears.
These fees are accrued and calculated on each Dealing Day and are payable monthly in arrears. The Depositary earned a fee of €617,987 for the six months ended 31 March 2022 (for the six months ended 31 March 2021: €559,306), of which €314,173 (30 September 2021: €356,014) was outstanding at the period end.
3. Investment Management Fees (Continued)

32 33
TT INTERNATIONAL FUNDS PLC
NOTES TO THE FINANCIAL STATEMENTS (CONTINUED)For the six months ended 31 March 2022
6. Directors’ Fees and Expenses
The Directors who are not connected with the Investment Manager are entitled to remuneration for their services as Directors, provided however that the aggregate emoluments of each Director in respect of any twelve month accounting period shall not exceed €45,000 or such higher amount as may be approved by the Board. John Broughan in recognition of his role as Chairman receives a fee of €52,000 which has been approved by the Board. In addition, the Directors are also entitled to be reimbursed for their reasonable out-of-pocket expenses incurred in discharging their duties as Directors.
The aggregate emoluments of the Directors (including expenses) for the six months ended 31 March 2022 was €91,816 (for the six months ended 31 March 2021: €73,616) of which €17,879 (30 September 2021: €6,104) was outstanding at the period end.
7. Other Fees
Subscription and Repurchase Charges
The following table sets forth the subscription, repurchase and exchange charges, calculated as a percentage of the Funds’ NAV, which may, at the discretion of the Directors or Investment Manager, be applied. Any such charges will be retained by the relevant Fund and are intended to cover costs including brokerage commissions, stamp duties, transfer taxes, and other expenses incurred in converting cash or other property into investments for the Funds caused by subscriptions, repurchases and/or share exchanges.
Subscription and repurchase charges are included within capital transactions in the Statement of Changes in Net Assets Attributable to Holders of Redeemable Participating Shares. During the financial period ended 31 March 2022 there were no subscription and repurchase charges applied.
Fund Subscription Charge Repurchase Charge Exchange ChargeTT European Equity Fund* 0.40% 1.00% 0.40%TT UK Equity Fund 0.40% 1.00% 0.40%TT Europe Ex-UK Equity Fund* 0.40% 1.00% 0.40%TT Asia-Pacific Equity Fund 0.40% 1.00% 0.40%TT Emerging Markets Equity Fund 0.40% 1.00% 0.40%TT Global Equity Fund** 0.40% 1.00% 0.40%TT Emerging Markets Unconstrained Fund 0.40% 1.00% 0.40%TT China Focus Fund 0.40% 1.00% 0.40%TT Asia Ex Japan Equity Fund 0.40% 1.00% 0.40%TT European Opportunities Long/Short Fund 0.40% 1.00% 0.40%TT Environmental Solutions Fund 0.40% 1.00% 0.40%
*TT European Equity Fund and TT Europe Ex-UK Equity Fund have been dormant since 1 September 2020.**TT Global Equity Fund terminated on 21 December 2021. Other Charges
The Company also pays, out of the assets of the Funds, fees in respect of the publication and circulation of details of the NAV per redeemable participating share, stamp duties, taxes, brokerage, the fees and expenses of auditors, tax, legal and other professional advisers.
Performance Fees
The Investment Manager is entitled to Performance Fees in relation to TT European Opportunities Long Short Fund, calculated by reference to the relevant Performance Fee percentage as follows: Class A1, B1 and C1 at 12.5% and Class A2, A3, B2, B3, C2, C3, D, E and F at 15%. The Performance Fee shall be calculated and shall accrue at each Valuation Point and the accrual will be reflected in the Net Asset Value per Share of the relevant Share class. The Performance Fee (if any) will be paid annually in arrears as soon as practicable after the close of business on the Business Day following the end of the relevant Performance Period.
The Performance Fee shall be calculated in respect of each period of 12 months ending on 31 December. The first Performance Period shall begin from the end of the Initial Offer Period of the relevant Share class and shall finish on 31 December in respect of that year. Performance fees were earned on the TT European Opportunities Long/Short Fund of €3,824 for the financial period ended 31 March 2022 (30 September 2021: €765,822).

34
TT INTERNATIONAL FUNDS PLC
NOTES TO THE FINANCIAL STATEMENTS (CONTINUED)For the six months ended 31 March 2022
Manager Fees
On 30 September 2020 the Company appointed Carne Global Fund Managers (Ireland) Limited to act as the designated Manager. The Manager shall be paid a fee out of the assets of the Fund, calculated and accrued on each Dealing Day and payable monthly in arrears, of an amount up to 0.03% of the Net Asset Value of the Fund (plus VAT, if any), subject to a minimum monthly fee up to €8,000 per month (plus VAT if any) to be prorated across the Funds of the Company proportionate to each Fund’s assets under management. The Manager is also entitled to receive out of the assets of the Fund reasonable and properly vouched out-of-pocket expenses, which will be at normal commercial rates.
The Manager earned a fee of €105,955 for the six months ended 31 March 2022 (for the six months ended 31 March 2021: €72,310), of which €52,471 (30 September 2021: €12,343) was outstanding at the period end.
8. Transaction Costs
During the six months ended 31 March 2022 and 31 March 2021, the Funds incurred transaction costs in the purchase and sale of investments as follows:
Fund Currency 31 March 2022 31 March 2021TT European Equity Fund* EUR€ - -TT UK Equity Fund GBP£ 3,679 7,838TT Europe Ex-UK Equity Fund* GBP£ - -TT Asia-Pacific Equity Fund US$ 451,683 697,366TT Emerging Markets Equity Fund US$ 2,417,060 2,700,478TT Global Equity Fund** US$ 681 6,511TT Emerging Markets Unconstrained Fund US$ 2,056,251 2,266,586TT China Focus Fund US$ 16,795 33,672TT Asia Ex Japan Equity Fund US$ 289,973 742,146TT European Opportunities Long/Short Fund US$ 141,179 57,342TT Environmental Solutions Fund US$ 162,414 85,212
*TT European Equity Fund and TT Europe Ex-UK Equity Fund have been dormant since 1 September 2020.**TT Global Equity Fund terminated on 21 December 2021.
9. Share Capital
The authorised share capital of the Company is 1,000,000,000,000 shares of no par value, initially designated as unclassified shares.
Subscriber SharesThe initial share capital of the Company was €40,000 as at 13 August 2001 represented by 40,000 Shares (the “subscriber shares”) issued for the purposes of the incorporation of the Company and to obtain a certificate to commence trade at an issue price of €1 per share paid up as to one quarter of their value. The subscriber shares entitle the holders thereof to attend and vote at all meetings of the Company but do not entitle the holders to participate in the dividends or net assets of the Company except to the extent of the initial subscription and any interest accrued thereon.
Shares in issue at 1 October 2021
Shares Issued
Shares Re-invested
Shares Redeemed
Shares in issue at 31 March 2022
TT UK Equity FundClass A 42,961 3,629 – (777) 45,813
7. Other Fees (Continued)

34 35
TT INTERNATIONAL FUNDS PLC
NOTES TO THE FINANCIAL STATEMENTS (CONTINUED)For the six months ended 31 March 2022
Shares in issue at 1 October 2021
Shares Issued
Shares Re-invested
Shares Redeemed
Shares in issue at 31 March 2022
TT Asia-Pacific Equity FundClass A1 92,919 227,097 – (39,388) 280,628Class A2 469,717 411,666 – (686,389) 194,994Class B2 84,730 – – (39,384) 45,346Class D2 9,380 – – – 9,380Class E2 4,915,927 5,825 – – 4,921,752Class G 549,590 34,480 – (69,522) 514,548Class H 90,719 – – (2,844) 87,875Class I2 234,042 36,325 – (11,910) 258,457
TT Emerging Markets Equity FundClass A1 248,363 25,211 – (182,809) 90,765Class A2 24,959,322 2,405,732 – (1,895,284) 25,469,770Class B1 31,868 4,658 – (1,376) 35,150Class C2 15,034,256 749,452 – (874,611) 14,909,097Class E1 3,379,782 35,377 – (1,093,587) 2,321,572Class E2 2,874,905 1,019,653 – (78,512) 3,816,046Class G 8,683 13,303 – (148) 21,838Class H 26,660 – – (26,660) –Class I 565,136 52,502 – (34,630) 583,008Class N1 11,471,462 582,941 – (2,220,119) 9,834,284
TT Global Equity FundClass A2 20,123 – – (20,123) –Class C 23,087 – – (23,087) –
TT Emerging Markets Unconstrained FundClass A1 3,017,324 389,142 – (270,485) 3,135,981Class A2 19,694,435 1,418,484 – (491,343) 20,621,576Class C2 7,524,055 823,189 – (286,853) 8,060,391Class D2 25,876 8,499 – (12,908) 21,467Class E2 5,057,561 92,133 – (1,939,195) 3,210,499Class G 1,159,290 274,789 – (337,786) 1,096,293Class H 7,555 1 – – 7,556Class I 670,710 81,050 – (77,350) 674,410
TT China Focus FundClass A2 488,143 17,710 – (50,888) 454,965Class E2 25,460 6,294 – – 31,754
TT Asia Ex Japan Equity FundClass A2 5,813,831 261,238 – (446,000) 5,629,069Class E2 3,328 – – (1,961) 1,367
TT European Opportunities Long/Short FundClass A1 4,461,293 313,824 – (666,712) 4,108,405Class A2 1,935,453 228,001 – (395,751) 1,767,703Class B1 3,615,042 684,105 – (1,202,821) 3,096,326Class B2 94,525 88,114 – (6,850) 175,789Class C1 1,201,666 180,953 – (63,807) 1,318,812Class C2* – 1,000 – – 1,000
9. Share Capital (Continued)

36
TT INTERNATIONAL FUNDS PLC
NOTES TO THE FINANCIAL STATEMENTS (CONTINUED)For the six months ended 31 March 2022
Shares in issue at 1 October 2021
Shares Issued
Shares Re-invested
Shares Redeemed
Shares in issue at 31 March 2022
TT Environmental Solutions FundClass A1 2,236,862 125,869 – (370,836) 1,991,895Class B1 155,395 71,336 – (2,272) 224,459Class B2 660,400 268,832 – (5,996) 923,236Class B5* – 1,000 – – 1,000Class B6* – 1,000 – – 1,000Class Z 280,321 1,501,489 – (5,541) 1,776,269
*Launched during the period.
Shares in issue at 1 October 2020
Shares Issued
Shares Re-invested
Shares Redeemed
Shares in issue at 30 September 2021
TT UK Equity FundClass A 38,456 37,480 – (32,975) 42,961Class B 1 – – (1) –
TT Asia-Pacific Equity FundClass A1 116,557 12,062 – (35,700) 92,919Class A2 76,161 507,753 – (114,196) 469,717Class B2 391,702 26,676 – (333,648) 84,730Class D2 6,000 3,380 – – 9,380Class E2 4,911,162 33,665 – (28,900) 4,915,927Class G 510,695 98,428 – (59,533) 549,590Class H 87,325 10,494 – (7,100) 90,719Class I2 53,050 184,592 – (3,600) 234,042
TT Emerging Markets Equity FundClass A1 373,412 93,725 – (218,774) 248,363Class A2 29,673,514 3,365,312 – (8,079,504) 24,959,322Class B1 36,515 2,125 – (6,772) 31,868Class C2 4,148,608 12,877,290 – (1,991,642) 15,034,256Class E1 3,093,494 637,732 – (351,444) 3,379,782Class E2 40,518 3,078,025 – (243,638) 2,874,905Class G* – 9,082 – (399) 8,683Class H 673,118 25,467 – (671,925) 26,660Class I 588,422 131,452 – (154,738) 565,136Class N1 11,594,967 1,505,120 – (1,628,625) 11,471,462
TT Global Equity FundClass A1 816,113 – – (816,113) –Class A2 39,198 2,639 – (21,714) 20,123Class C 23,087 – – – 23,087
9. Share Capital (Continued)
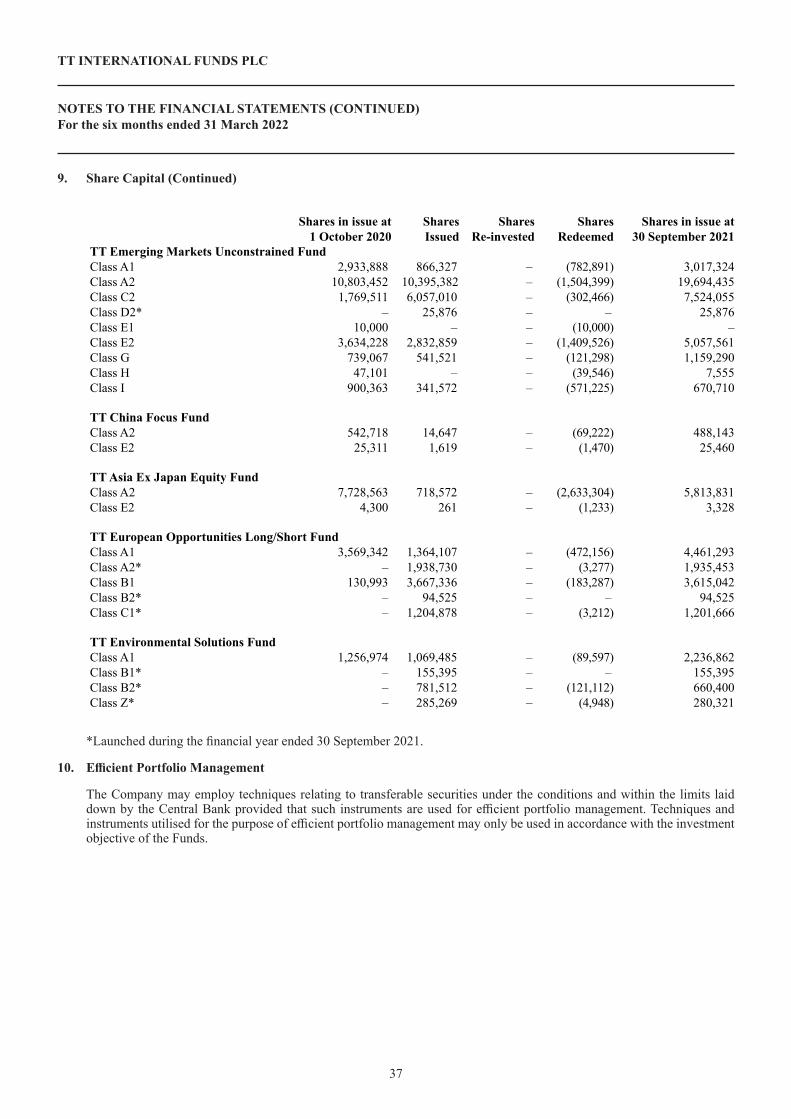
36 37
TT INTERNATIONAL FUNDS PLC
NOTES TO THE FINANCIAL STATEMENTS (CONTINUED)For the six months ended 31 March 2022
Shares in issue at 1 October 2020
Shares Issued
Shares Re-invested
Shares Redeemed
Shares in issue at 30 September 2021
TT Emerging Markets Unconstrained FundClass A1 2,933,888 866,327 – (782,891) 3,017,324Class A2 10,803,452 10,395,382 – (1,504,399) 19,694,435Class C2 1,769,511 6,057,010 – (302,466) 7,524,055Class D2* – 25,876 – – 25,876Class E1 10,000 – – (10,000) –Class E2 3,634,228 2,832,859 – (1,409,526) 5,057,561Class G 739,067 541,521 – (121,298) 1,159,290Class H 47,101 – – (39,546) 7,555Class I 900,363 341,572 – (571,225) 670,710
TT China Focus FundClass A2 542,718 14,647 – (69,222) 488,143Class E2 25,311 1,619 – (1,470) 25,460
TT Asia Ex Japan Equity FundClass A2 7,728,563 718,572 – (2,633,304) 5,813,831Class E2 4,300 261 – (1,233) 3,328
TT European Opportunities Long/Short FundClass A1 3,569,342 1,364,107 – (472,156) 4,461,293Class A2* – 1,938,730 – (3,277) 1,935,453Class B1 130,993 3,667,336 – (183,287) 3,615,042Class B2* – 94,525 – – 94,525Class C1* – 1,204,878 – (3,212) 1,201,666
TT Environmental Solutions FundClass A1 1,256,974 1,069,485 – (89,597) 2,236,862Class B1* – 155,395 – – 155,395Class B2* – 781,512 – (121,112) 660,400Class Z* – 285,269 – (4,948) 280,321
*Launched during the financial year ended 30 September 2021.
10. Efficient Portfolio Management
The Company may employ techniques relating to transferable securities under the conditions and within the limits laid down by the Central Bank provided that such instruments are used for efficient portfolio management. Techniques and instruments utilised for the purpose of efficient portfolio management may only be used in accordance with the investment objective of the Funds.
9. Share Capital (Continued)

38
TT INTERNATIONAL FUNDS PLC
NOTES TO THE FINANCIAL STATEMENTS (CONTINUED)For the six months ended 31 March 2022
Any technique or instrument must be one which is reasonably believed by the Investment Manager to be economically appropriate to the efficient portfolio management of the relevant Fund. TT UK Equity Fund futures, options (comprising options on futures, options on indices and ETFs and stock options), foreign exchange spot and forward contracts and contracts for differences (“CFDs”) for hedging and efficient portfolio management purposes subject to the relevant restrictions set out in the Prospectus. TT Global Equity Fund may use futures (comprising index futures), options (comprising options on futures, options on indices and ETFs and stock options), foreign exchange spot and forward contracts and equity swaps for hedging and efficient portfolio management purposes subject to the relevant restrictions set out in the Prospectus. TT Asia-Pacific Equity Fund may use futures, options (comprising options on futures, options on indices and ETFs and stock options), foreign exchange spot and forward contracts and swaps (including index and currency swaps) for hedging and efficient portfolio management purposes subject to the relevant restrictions set out in the Prospectus. TT Emerging Markets Equity Fund may use futures, options (comprising options on futures, options on indices and ETFs and stock options), foreign exchange spot and forward contracts and swaps for hedging and efficient portfolio management purposes subject to the relevant restrictions set out in the Prospectus. TT Emerging Markets Unconstrained Fund may use futures, options (comprising options on futures, options on indices and ETFs (that may be transferable securities or collective investment schemes) and stock options), foreign exchange spot and forward contracts and swaps for hedging and efficient portfolio management purposes subject to the relevant restrictions set out in the Prospectus. TT China Focus Fund may use futures, options (comprising options on futures, options on indices and ETFs (that may be transferable securities or collective investment schemes) and stock options), foreign exchange spot and forward currency contracts and swaps (including index and currency swaps), for investment purposes, hedging and efficient portfolio management purposes subject to the relevant restrictions set out in the Prospectus. TT Asia Ex Japan Equity Fund may use futures, options (comprising options on futures, options on indices and ETFs (that may be transferable securities or collective investment schemes) and stock options), foreign exchange spot and forward foreign exchange currency contracts and swaps (including index and currency swaps), for investment purposes, hedging, investments and efficient portfolio management purposes subject to the relevant restrictions set out in the Prospectus. TT European Opportunities Long/Short may use futures (including index futures), options (including stock options, options on futures, indices and ETFs), foreign exchange spot and forwards, CFDs and swaps for hedging and for investment purposes and subject to the relevant restrictions set out in the Prospectus. TT Environmental Solutions Fund may use futures (comprising index futures), options (comprising options on futures, options on indices and ETFs and stock options), foreign exchange spot and forward contracts and equity swaps for hedging, investments and efficient portfolio management purposes subject to the relevant restrictions set out in the Prospectus.
Futures contracts will be used primarily for hedging existing positions. In addition, in falling markets, index futures contracts may be sold instead of selling shares to facilitate the raising of cash more quickly and at a lower cost to the Fund. Forward foreign currency contracts may be used for hedging, including cross hedging the Funds’ currency exposure to any currency in which investments are otherwise permitted.
Realised gains and losses on financial instruments used for efficient portfolio management are included in the Statement of Comprehensive Income.
The Investment Manager may also, when facilities become available in the relevant markets, lend the Portfolio securities and/or purchase securities subject to repurchase agreements. Securities lending is dealt with separately in Note 15. No securities were purchased subject to repurchase agreements during the period.
11. Related Party Transactions
FRS 102 ‘Related Party Disclosures’ requires the disclosure of information relating to an entity’s transactions with parties who are deemed to be related to the reporting entity. All transactions with related parties have been carried out at arm’s length and in the best interest of shareholders.
The following are the Directors’ and their families’ interests in Class E2 Shares of TT Asia-Pacific Equity Fund:
31 March 2022 30 September 2021Name Unclassified Shares Unclassified SharesEric Mackay 9,425 9,425
The following are the Directors’ and their families’ interests in Class C2 Shares of TT Emerging Markets Unconstrained Fund:
31 March 2022 30 September 2021Name Unclassified Shares Unclassified SharesEric Mackay 15,474 15,474
10. Efficient Portfolio Management (Continued)
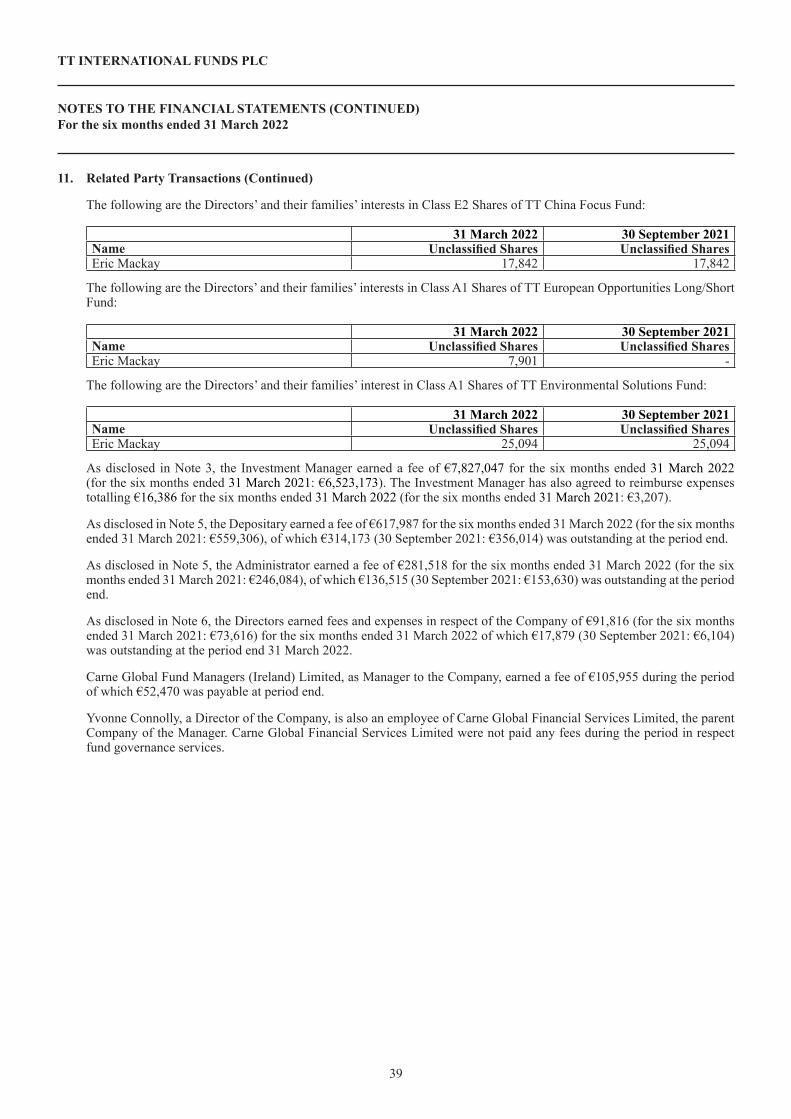
38 39
TT INTERNATIONAL FUNDS PLC
NOTES TO THE FINANCIAL STATEMENTS (CONTINUED)For the six months ended 31 March 2022
The following are the Directors’ and their families’ interests in Class E2 Shares of TT China Focus Fund:
31 March 2022 30 September 2021Name Unclassified Shares Unclassified SharesEric Mackay 17,842 17,842
The following are the Directors’ and their families’ interests in Class A1 Shares of TT European Opportunities Long/Short Fund:
31 March 2022 30 September 2021Name Unclassified Shares Unclassified SharesEric Mackay 7,901 -
The following are the Directors’ and their families’ interest in Class A1 Shares of TT Environmental Solutions Fund:
31 March 2022 30 September 2021Name Unclassified Shares Unclassified SharesEric Mackay 25,094 25,094
As disclosed in Note 3, the Investment Manager earned a fee of €7,827,047 for the six months ended 31 March 2022 (for the six months ended 31 March 2021: €6,523,173). The Investment Manager has also agreed to reimburse expenses totalling €16,386 for the six months ended 31 March 2022 (for the six months ended 31 March 2021: €3,207).
As disclosed in Note 5, the Depositary earned a fee of €617,987 for the six months ended 31 March 2022 (for the six months ended 31 March 2021: €559,306), of which €314,173 (30 September 2021: €356,014) was outstanding at the period end.
As disclosed in Note 5, the Administrator earned a fee of €281,518 for the six months ended 31 March 2022 (for the six months ended 31 March 2021: €246,084), of which €136,515 (30 September 2021: €153,630) was outstanding at the period end.
As disclosed in Note 6, the Directors earned fees and expenses in respect of the Company of €91,816 (for the six months ended 31 March 2021: €73,616) for the six months ended 31 March 2022 of which €17,879 (30 September 2021: €6,104) was outstanding at the period end 31 March 2022.
Carne Global Fund Managers (Ireland) Limited, as Manager to the Company, earned a fee of €105,955 during the period of which €52,470 was payable at period end.
Yvonne Connolly, a Director of the Company, is also an employee of Carne Global Financial Services Limited, the parent Company of the Manager. Carne Global Financial Services Limited were not paid any fees during the period in respect fund governance services.
11. Related Party Transactions (Continued)

41
40
TT INTERNATIONAL FUNDS PLC
NOTES TO THE FINANCIAL STATEMENTS (CONTINUED)For the six months ended 31 March 2022
Together with the funds managed by the Investment Manager TT International Asset Management Limited holds Nil shares in Class A1 (30 September 2021: 690 shares) of TT Emerging Markets Equity Fund, Nil shares in Class A1 (30 September 2021: 649 shares) of TT Asia-Pacific Equity Fund, Nil shares in Class A2 (30 September 2021: 9,624 shares) of TT Global Equity Fund, 61,886 shares in Class A1 (30 September 2021: 10,681 shares) of TT Emerging Markets Unconstrained Fund, 23,925 shares in Class A2 (30 September 2021: 33,602 shares) of TT China Focus Fund, Nil shares in Class A1 (30 September 2021: 3,643 shares) of TT European Opportunities Long/Short Fund, 28,853 shares in Class A2 (30 September 2021: Nil shares) of TT European Opportunities Long/Short Fund, 1,000 shares in Class C2 (30 September 2021: Nil shares) of TT European Opportunities Long/Short Fund, 9,289 shares in Class A1 (30 September 2021: 27,765 shares) of TT Environmental Solutions Fund, 1,000 shares in Class B5 (30 September 2021: Nil shares) of TT Environmental Solutions Fund, 1,000 shares in Class B6 (30 September 2021: Nil shares) of TT Environmental Solutions Fund and 5,697 shares in Class A2 (30 September 2021: Nil shares) of TT Asia Ex Japan Equity Fund. The Sub Investment Manager, TT International Investment LLP holds Nil shares in Class A1 (30 September 2021: 2,428 shares) of TT Emerging Markets Equity Fund, 90,608 shares in Class E2 (30 September 2021: Nil shares) of TT Emerging Markets Equity Fund, Nil shares in Class A1 (30 September 2021: 4,182 shares) of TT Asia-Pacific Equity Fund, 5,803 shares in Class E2 (30 September 2021: Nil shares) of TT Asia-Pacific Equity Fund, Nil shares in Class A2 (30 September 2021: 2,489 shares) of TT Global Equity Fund, 139 shares in Class A (30 September 2021: 905 shares) of TT UK Equity Fund, Nil shares in Class A1 (30 September 2021: 8,154 shares) of TT Emerging Markets Unconstrained Fund, 4,299 shares in Class C2 (30 September 2021: Nil shares) of TT Emerging Markets Unconstrained Fund, 24,043 shares in Class A2 (30 September 2021: 31,367 shares) of TT China Focus Fund, 5,759 shares in Class E2 (30 September 2021: Nil shares) of TT China Focus Fund, Nil shares in Class A1 (30 September 2021: 104,386 shares) of TT European Opportunities Long/Short Fund 76,203 shares in Class C1 (30 September 2021: Nil shares) of TT European Opportunities Long/Short Fund and 61,327 shares in Class B2 (30 September 2021: 22,733 shares) of the TT Environmental Solutions Fund.
The Board of Directors is not aware of any transactions with related parties during the six months ended 31 March 2022 other than those disclosed in these financial statements (30 September 2021: None).
12. Transactions with Connected Persons
Any transaction carried out with a UCITS by a management company or depositary to the UCITS, the delegates or sub-delegates of the UCITS or management company or depositary, and any associate or group company of such a UCITS or management company, depositary, delegate or sub-delegate (“connected persons”) must be carried out as if negotiated at arm’s length. Transactions must be in the best interests of the shareholders.
The Directors of TT International Funds PLC are satisfied that there are arrangements (evidenced by written procedures) in place, to ensure that the obligations set out in Regulation 43(1) of the Central Bank UCITS Regulations are applied to all transactions with connected persons, and are satisfied that transactions with connected Persons entered into during the financial period complied with the obligations set out in Regulation 43(1) of the Central Bank UCITS Regulations.
13. Research Charge Collection Agreements
Under Markets in Financial Instruments Directive (“MiFID II”), the investment firms need to make explicit payments for investment research in order to demonstrate that they are not being induced to trade. Historically when a buy side firm increased its trading volumes, it could pay more for receiving the same amount of research and would pass on these costs to its clients. Following new requirements buy side firms must not link the amount paid for research to the volume or value of transactions, instead they must agree a budget to be paid for research up front and pay an amount that correlates to the quality and value that it would provide to the investor. Buy side investment firms are able to make the choice of paying for investment research by:
1) Direct payments by a firm from its own resources; or
2) Direct payments from a Research Payment Account (“RPA”) that is controlled by the firm, but funded by its clients. This can be funded either directly from an agreed charge from each client or by specific fees generated from transactions involving clients’ assets.
The Investment Managers policy is to pay for all eligible research it consumes by way of an RPA that is funded from a combination of direct charges to the client and transactional research fees. Where the RPA is funded through dealing activity and the annual budgeted amount has been reached, all subsequent trading will be subject only to execution commission to ensure that clients do not make excess contributions.
11. Related Party Transactions (Continued)

41
TT INTERNATIONAL FUNDS PLC
NOTES TO THE FINANCIAL STATEMENTS (CONTINUED)For the six months ended 31 March 2022
The collection of research charges on transactions can only be carried out by brokers with whom the Investment Manager has a Research Charge Collection Agreement (“RCCA”), namely:
Banco ITAU Davy Securities Jon.Berenberg Gosseler Renaissance CapitalBarclays Exane JP Morgan Royal Bank of CanadaBOAML Goldman Sachs Macquarie Securities SMBC Nikko Capital Markets LimitedCarnegie HSBC Morgan Stanley UBS CapitalCLSA ITG NordeaCredit Suisse Jefferies Numis
In order to set a research budget, members of the Investment Managers investment team start the year by making a reasonable assessment of the investment research needs of each strategy they manage which will include the sub-funds of TT International Funds PLC. This is not linked to the volume or value of transactions executed, or to historical levels of dealing commission generated prior to the MiFID II rules coming into force. The initial research budget for each strategy will be set on a rolling one year period. However, this budget will be reassessed at least quarterly, or more often as required, and any proposed changes that require an increase in the total research spend will be notified to the Fund’s Board.
The research budgets re-assessed as at 31 March 2022 are as follows:
Fund Strategy Currency 2022 2021TT European Equity Fund* Europe EUR ‒ ‒TT UK Equity Fund UK GBP 1,500 800TT Europe Ex-UK Equity Fund* UK GBP ‒ ‒TT Asia-Pacific Equity Fund Asia USD 83,100 66,700TT Emerging Markets Equity Fund EM USD 348,600 298,300TT Global Equity Fund** Global USD ‒ 10,900TT Emerging Markets Unconstrained Fund EMU USD 282,300 235,800TT China Focus Fund China USD 2,400 2,700TT Asia Ex Japan Equity Fund Japan USD 28,800 25,200TT European Opportunities Long/Short Fund Europe USD 310,000 309,200TT Environmental Solutions Fund ESG USD 35,000 34,900
*TT European Equity Fund and TT Europe Ex-UK Equity Fund have been dormant since 1 September 2020. **TT Global Equity Fund terminated on 21 December 2021
The amount of research charge collected during the period is included in the transaction costs disclosed in Note 8.
13. Research Charge Collection Agreements (Continued)

43
42
TT INTERNATIONAL FUNDS PLC
NOTES TO THE FINANCIAL STATEMENTS (CONTINUED)For the six months ended 31 March 2022
14. Net Asset Value Per Redeemable Participating Share
The net asset value per redeemable participating share is calculated by dividing the total net assets of each Fund by the number of redeemable participating shares in issue.
Recalculation of Net Asset Value for pricing purposes
The costs of establishing the Fund, obtaining authorisation from any authority, regulatory or other body, filing fees and the preparation and printing of this Supplement, marketing costs and the fees of all professionals relating to it are paid on the set up of the Fund. As stated in the Prospectus of the Company, such expenses are amortised over the first five years of the Fund’s operation (or such shorter period as may be determined by the Directors at their discretion).
The costs of establishing TT China Focus Fund were €19,060. For financial statements purposes €4,034 of the establishment costs were amortised during period ended 31 March 2022 (31 March 2021: €1,901), with a deferred expense of €2,117 (30 September 2021: €3,998), which was held on the Statement of Financial Position at 31 March 2022.
The costs of establishing TT Asia Ex Japan Fund were €31,666. For financial statements purposes €3,165 of the establishment costs were amortised during the period ended 31 March 2022 (31 March 2021: €2,991), with a deferred expense of €7,186 (30 September 2021: €9,992), which was held on the Statement of Financial Position at 31 March 2022.
The costs of establishing TT European Opportunities Long/Short Fund are not expected to exceed €85,833. For financial statements purposes €8,529 of the establishment costs were amortised during period ended 31 March 2022 (31 March 2021: €8,061), with a deferred expense of €43,499 (30 September 2021: €50,096), which was held on the Statement of Financial Position at 31 March 2022.
The costs of establishing TT Environmental Solutions Fund, are not expected to exceed €46,904. For financial statements purposes €4,839 of the establishment costs were amortised during period ended 31 March 2022 (31 March 2021: €4,574), with a deferred expense of €30,781 (30 September 2021: €34,278), which was held on the Statement of Financial Position at 31 March 2022.
15. Securities Lending
The Funds were engaged in securities lending activities during the six months ended 31 March 2022. Securities used in securities lending activities were held at fair value and were recorded on the Global Securities System of Northern Trust Fiduciary Services (Ireland) Limited. Fees are split between the Funds and Northern Trust International Fund Administration Services (Ireland) Limited in a 75:25 split respectively.
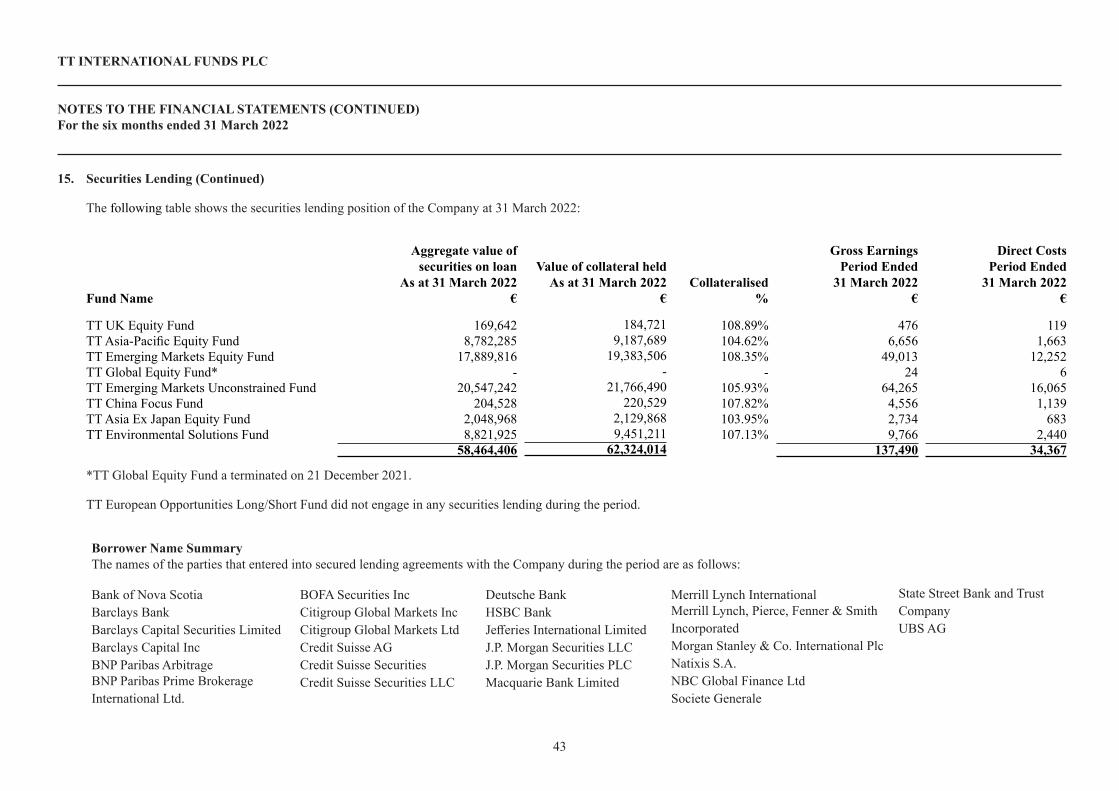
43
TT INTERNATIONAL FUNDS PLC
NOTES TO THE FINANCIAL STATEMENTS (CONTINUED)For the six months ended 31 March 2022
The following table shows the securities lending position of the Company at 31 March 2022:
Fund Name
Aggregate value of securities on loan
As at 31 March 2022 €
Value of collateral held As at 31 March 2022
€Collateralised
%
Gross Earnings Period Ended
31 March 2022 €
Direct CostsPeriod Ended
31 March 2022 €
TT UK Equity Fund 169,642 184,721 108.89% 476 119TT Asia-Pacific Equity Fund 8,782,285 9,187,689 104.62% 6,656 1,663TT Emerging Markets Equity Fund 17,889,816 19,383,506 108.35% 49,013 12,252TT Global Equity Fund* - - - 24 6TT Emerging Markets Unconstrained Fund 20,547,242 21,766,490 105.93% 64,265 16,065TT China Focus Fund 204,528 220,529 107.82% 4,556 1,139TT Asia Ex Japan Equity Fund 2,048,968 2,129,868 103.95% 2,734 683TT Environmental Solutions Fund 8,821,925 9,451,211 107.13% 9,766 2,440
58,464,406 62,324,014 137,490 34,367
*TT Global Equity Fund a terminated on 21 December 2021. TT European Opportunities Long/Short Fund did not engage in any securities lending during the period.
Borrower Name Summary The names of the parties that entered into secured lending agreements with the Company during the period are as follows:
Bank of Nova ScotiaBarclays BankBarclays Capital Securities LimitedBarclays Capital IncBNP Paribas ArbitrageBNP Paribas Prime Brokerage International Ltd.
BOFA Securities IncCitigroup Global Markets IncCitigroup Global Markets LtdCredit Suisse AGCredit Suisse Securities Credit Suisse Securities LLC
Deutsche BankHSBC BankJefferies International LimitedJ.P. Morgan Securities LLCJ.P. Morgan Securities PLCMacquarie Bank Limited
Merrill Lynch InternationalMerrill Lynch, Pierce, Fenner & Smith IncorporatedMorgan Stanley & Co. International PlcNatixis S.A.NBC Global Finance LtdSociete Generale
State Street Bank and Trust CompanyUBS AG
15. Securities Lending (Continued)
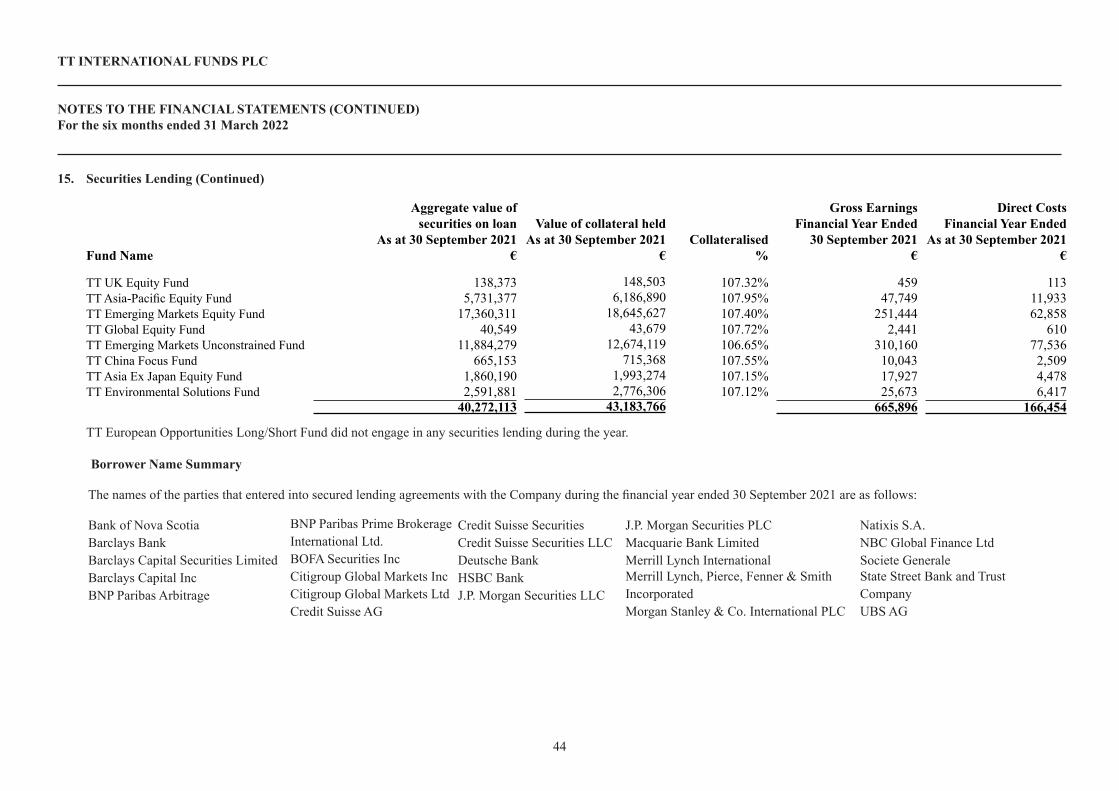
44
TT INTERNATIONAL FUNDS PLC
NOTES TO THE FINANCIAL STATEMENTS (CONTINUED)For the six months ended 31 March 2022
Fund Name
Aggregate value of securities on loan
As at 30 September 2021 €
Value of collateral held As at 30 September 2021
€Collateralised
%
Gross EarningsFinancial Year Ended
30 September 2021 €
Direct CostsFinancial Year Ended
As at 30 September 2021 €
TT UK Equity Fund 138,373 148,503 107.32% 459 113TT Asia-Pacific Equity Fund 5,731,377 6,186,890 107.95% 47,749 11,933TT Emerging Markets Equity Fund 17,360,311 18,645,627 107.40% 251,444 62,858TT Global Equity Fund 40,549 43,679 107.72% 2,441 610TT Emerging Markets Unconstrained Fund 11,884,279 12,674,119 106.65% 310,160 77,536TT China Focus Fund 665,153 715,368 107.55% 10,043 2,509TT Asia Ex Japan Equity Fund 1,860,190 1,993,274 107.15% 17,927 4,478TT Environmental Solutions Fund 2,591,881 2,776,306 107.12% 25,673 6,417
40,272,113 43,183,766 665,896 166,454
TT European Opportunities Long/Short Fund did not engage in any securities lending during the year. Borrower Name Summary
The names of the parties that entered into secured lending agreements with the Company during the financial year ended 30 September 2021 are as follows:
Bank of Nova ScotiaBarclays BankBarclays Capital Securities LimitedBarclays Capital IncBNP Paribas Arbitrage
BNP Paribas Prime Brokerage International Ltd.BOFA Securities IncCitigroup Global Markets IncCitigroup Global Markets LtdCredit Suisse AG
Credit Suisse SecuritiesCredit Suisse Securities LLCDeutsche BankHSBC BankJ.P. Morgan Securities LLC
J.P. Morgan Securities PLCMacquarie Bank LimitedMerrill Lynch InternationalMerrill Lynch, Pierce, Fenner & Smith IncorporatedMorgan Stanley & Co. International PLC
Natixis S.A.NBC Global Finance LtdSociete GeneraleState Street Bank and Trust CompanyUBS AG
15. Securities Lending (Continued)

45
TT INTERNATIONAL FUNDS PLC
NOTES TO THE FINANCIAL STATEMENTS (CONTINUED)For the six months ended 31 March 2022
16. Fair Value Hierarchy
FRS 102 requires the Company to classify financial instruments measured at fair value into the following hierarchy:
Level 1 - The unadjusted quoted price in an active market for identical assets or liabilities that the entity can access at the measurement date.
Level 2 - Inputs other than quoted prices included within Level 1 that are observable (i.e. developed using market data) for the asset or liability, either directly or indirectly.
Level 3 - Inputs are unobservable (i.e. for which market data is unavailable) for the asset or liability.
A fair value measurement is categorised in its entirety on the basis of the lowest level input that is significant to the fair value measurement in its entirety.
The inputs or methodology used for valuing investments are not necessarily an indication of the risk associated with investing in those investments.
There were no transfers between levels during the financial period 31 March 2022 and 30 September 2021.
The tables below set out the classification of the Funds’ financial instruments measured at fair value in accordance with FRS 102 as at 31 March 2022 and 30 September 2021.
As at 31 March 2022
TT UK Equity FundLevel 1
£Level 2
£Level 3
£Total
£
Financial Assets at Fair Value through Profit or LossEquities 1,525,901 – – 1,525,901Warrants – 571 – 571
Financial Liabilities at Fair Value through Profit or LossForward Foreign Currency Contracts – (1,376) – (1,376)
1,525,901 (805) – 1,525,096
TT Asia-Pacific Equity FundLevel 1
US$Level 2
US$Level 3
US$Total US$
Financial Assets at Fair Value through Profit or LossEquities 171,337,297 – – 171,337,297Participatory Notes – 11,034,913 – 11,034,913Forward Foreign Currency Contracts – 41,213 – 41,213
171,337,297 11,076,126 – 182,413,423
TT Emerging Markets Equity FundLevel 1
US$Level 2
US$Level 3
US$Total US$
Financial Assets at Fair Value through Profit or LossEquities 688,887,749 – – 688,887,749Participatory Notes – 55,366,931 – 55,366,931
Financial Liabilities at Fair Value through Profit or LossForward Foreign Currency Contracts – (116,785) – (116,785)
688,887,749 55,250,146 – 744,137,895

46
TT INTERNATIONAL FUNDS PLC
NOTES TO THE FINANCIAL STATEMENTS (CONTINUED)For the six months ended 31 March 2022
TT Emerging Markets Unconstrained FundLevel 1
US$Level 2
US$Level 3
US$Total US$
Financial Assets at Fair Value through Profit or LossEquities 621,747,584 – – 621,747,584Participatory Notes – 36,211,187 – 36,211,187Warrants – 238,570 – 238,570
Financial Liabilities at Fair Value through Profit or LossForward Foreign Currency Contracts – (39,899) – (39,899)
621,747,584 36,409,858 – 658,157,442
TT China Focus FundLevel 1
US$Level 2
US$Level 3
US$Total US$
Financial Assets at Fair Value through Profit or LossEquities 4,003,605 – – 4,003,605Participatory Notes – 245,056 – 245,056Warrants – 12,756 – 12,756
4,003,605 257,812 – 4,261,417
TT Asia Ex Japan Equity FundLevel 1
US$Level 2
US$Level 3
US$Total US$
Financial Assets at Fair Value through Profit or LossEquities 47,545,129 – – 47,545,129Participatory Notes – 12,681,983 – 12,681,983
47,545,129 12,681,983 – 60,227,112
TT European Opportunities Long/Short FundLevel 1
US$Level 2
US$Level 3
US$Total US$
Financial Assets at Fair Value through Profit or LossBonds 34,915,736 – – 34,915,736Contracts for Difference – 2,014,472 – 2,014,472Equities 40,645,194 – – 40,645,194Futures Contracts 22,392 – – 22,392Investment Funds 11,001,618 – – 11,001,618Forward Foreign Currency Contracts – 123,250 – 123,250
Financial Liabilities at Fair Value through Profit or LossContracts for Difference – (1,383,418) – (1,383,418)Futures Contracts (164,533) – – (164,533)Forward Foreign Currency Contracts – (609,249) – (609,249)
86,420,407 145,055 – 86,565,462
16. Fair Value Hierarchy (Continued)
As at 31 March 2022 (Continued)

46 47
TT INTERNATIONAL FUNDS PLC
NOTES TO THE FINANCIAL STATEMENTS (CONTINUED)For the six months ended 31 March 2022
TT Environmental Solutions FundLevel 1
US$Level 2
US$Level 3
US$Total US$
Financial Assets at Fair Value through Profit or LossEquities 48,750,872 – – 48,750,872Participatory Notes – 9,366,690 – 9,366,690Warrants – 161,036 – 161,036Forward Foreign Currency Contracts – 1,945 – 1,945
Financial Liabilities at Fair Value through Profit or LossForward Foreign Currency Contracts – (105,023) – (105,023)
48,750,872 9,424,648 – 58,175,520
As at 30 September 2021
TT UK Equity FundLevel 1
£Level 2
£Level 3
£Total
£
Financial Assets at Fair Value through Profit or LossEquities 1,466,466 – – 1,466,466Warrants – 1,445 – 1,445
1,466,466 1,445 – 1,467,911
TT Asia-Pacific Equity FundLevel 1
US$Level 2
US$Level 3
US$Total US$
Financial Assets at Fair Value through Profit or LossEquities 208,231,019 – – 208,231,019Participatory Notes – 10,135,539 – 10,135,539Forward Foreign Currency Contracts – 3,831 – 3,831
Financial Liabilities at Fair Value through Profit or LossForward Foreign Currency Contracts – (36,742) – (36,742)
208,231,019 10,102,628 – 218,333,647
TT Emerging Markets Equity FundLevel 1
US$Level 2
US$Level 3
US$Total US$
Financial Assets at Fair Value through Profit or LossEquities 891,860,057 – – 891,860,057Participatory Notes – 41,488,514 – 41,488,514Forward Foreign Currency Contracts – 2,069 – 2,069
Financial Liabilities at Fair Value through Profit or LossForward Foreign Currency Contracts – (38,123) – (38,123)
891,860,057 41,452,460 – 933,312,517
16. Fair Value Hierarchy (Continued)
As at 31 March 2022 (Continued)

48
TT INTERNATIONAL FUNDS PLC
NOTES TO THE FINANCIAL STATEMENTS (CONTINUED)For the six months ended 31 March 2022
TT Global Equity FundLevel 1
US$Level 2
US$Level 3
US$Total US$
Financial Assets at Fair Value through Profit or LossEquities 888,302 – – 888,302Participatory Notes – 1,377 – 1,377Forward Foreign Currency Contracts – 1,472 – 1,472
Financial Liabilities at Fair Value through Profit or LossForward Foreign Currency Contracts – (1,412) – (1,412)
888,302 1,437 – 889,739
TT Emerging Markets Unconstrained FundLevel 1
US$Level 2
US$Level 3
US$Total US$
Financial Assets at Fair Value through Profit or LossEquities 712,459,764 – – 712,459,764Participatory Notes – 49,657,966 – 49,657,966Warrants – 823,972 – 823,972Forward Foreign Currency Contracts – 1,655 – 1,655
Financial Liabilities at Fair Value through Profit or LossForward Foreign Currency Contracts – (30,705) – (30,705)
712,459,764 50,452,888 – 762,912,652
TT China Focus FundLevel 1
US$Level 2
US$Level 3
US$Total US$
Financial Assets at Fair Value through Profit or LossEquities 5,435,985 – – 5,435,985Futures Contracts 4,122 – – 4,122Participatory Notes – 673,758 – 673,758Warrants – 24,490 – 24,490Forward Foreign Currency Contracts – 20 – 20
5,440,107 698,268 – 6,138,375
TT Asia Ex Japan Equity FundLevel 1
US$Level 2
US$Level 3
US$Total US$
Financial Assets at Fair Value through Profit or LossEquities 60,574,058 – – 60,574,058Participatory Notes – 13,907,593 – 13,907,593Forward Foreign Currency Contracts – 1,300 – 1,300
60,574,058 13,908,893 – 74,482,951
16. Fair Value Hierarchy (Continued)
As at 30 September 2021 (Continued)
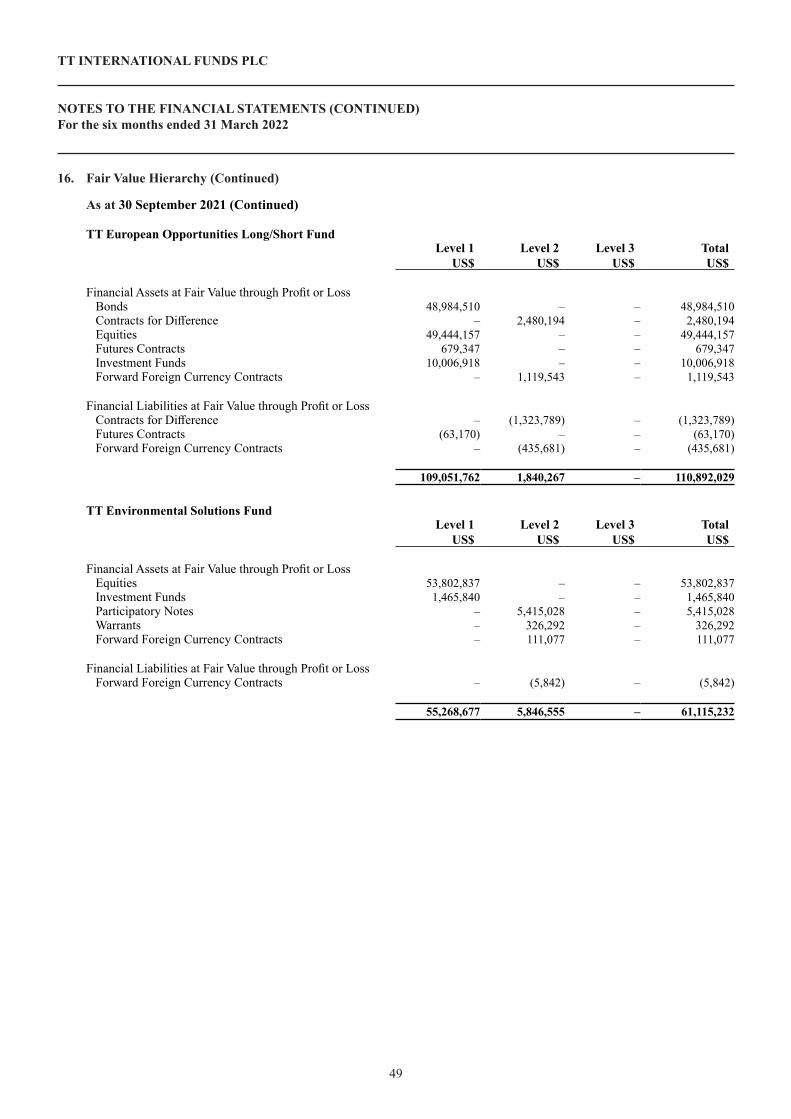
48 49
TT INTERNATIONAL FUNDS PLC
NOTES TO THE FINANCIAL STATEMENTS (CONTINUED)For the six months ended 31 March 2022
TT European Opportunities Long/Short FundLevel 1
US$Level 2
US$Level 3
US$Total US$
Financial Assets at Fair Value through Profit or LossBonds 48,984,510 – – 48,984,510Contracts for Difference – 2,480,194 – 2,480,194Equities 49,444,157 – – 49,444,157Futures Contracts 679,347 – – 679,347Investment Funds 10,006,918 – – 10,006,918Forward Foreign Currency Contracts – 1,119,543 – 1,119,543
Financial Liabilities at Fair Value through Profit or LossContracts for Difference – (1,323,789) – (1,323,789)Futures Contracts (63,170) – – (63,170)Forward Foreign Currency Contracts – (435,681) – (435,681)
109,051,762 1,840,267 – 110,892,029
TT Environmental Solutions FundLevel 1
US$Level 2
US$Level 3
US$Total US$
Financial Assets at Fair Value through Profit or LossEquities 53,802,837 – – 53,802,837Investment Funds 1,465,840 – – 1,465,840Participatory Notes – 5,415,028 – 5,415,028Warrants – 326,292 – 326,292Forward Foreign Currency Contracts – 111,077 – 111,077
Financial Liabilities at Fair Value through Profit or LossForward Foreign Currency Contracts – (5,842) – (5,842)
55,268,677 5,846,555 – 61,115,232
16. Fair Value Hierarchy (Continued)
As at 30 September 2021 (Continued)

50
TT INTERNATIONAL FUNDS PLC
NOTES TO THE FINANCIAL STATEMENTS (CONTINUED)For the six months ended 31 March 2022
17. Exchange Rates
The following exchange rates were used as at 31 March 2022:
Currency Euro British Pound United States DollarAustralian Dollar 1.4817 1.7533 1.3317Brazilian Real 5.2873 6.2567 4.7520British Pound 0.8451 1.0000 0.7595Canadian Dollar 1.3898 1.6446 1.2491Chilean Peso 875.5723 1,036.1052 786.9250Chinese Yuan 7.0577 8.3517 6.3431Chinese Yuan Renminbi 7.0632 8.3582 6.3481Colombian Peso 4,176.5609 4,942.3175 3,753.7050Czech Koruna 24.4255 28.9038 21.9525Danish Krone 7.4385 8.8023 6.6854Euro 1.0000 1.1834 0.8988Hong Kong Dollar 8.7136 10.3112 7.8314Hungarian Forint 367.2401 434.5722 330.0589Indian Rupee 84.3111 99.7692 75.7750Indonesian Rupiah 15,980.4396 18,910.3927 14,362.5000Japanese Yen 135.0479 159.8085 121.3750Kuwait Dinar 0.3380 0.4000 0.3038Malaysian Ringgit 4.6784 5.5362 4.2048Mexican Peso 22.1885 26.2566 19.9420New Zealand Dollar 1.5997 1.8930 1.4377Norwegian Krone 9.7290 11.5128 8.7440Philippine Peso 57.5741 68.1301 51.7450Polish Zloty 4.6367 5.4868 4.1673Qatari Rial 4.0520 4.7949 3.6418Romanian Leu 4.9420 5.8480 4.4416Russian Ruble 91.6268 108.4262 82.3500Singapore Dollar 1.5058 1.7819 1.3534South African Rand 16.2586 19.2396 14.6125South Korean Won 1,348.5878 1,595.8462 1,212.0500Swedish Krona 10.3692 12.2704 9.3194Swiss Franc 1.0239 1.2117 0.9203Taiwan Dollar 31.8791 37.7240 28.6515Thai Baht 36.9956 43.7786 33.2500Turkish Lira 16.3201 19.3123 14.6678UAE Dirham 4.0868 4.8361 3.6731United States Dollar 1.1127 1.3167 1.0000
]

50 51
TT INTERNATIONAL FUNDS PLC
NOTES TO THE FINANCIAL STATEMENTS (CONTINUED)For the six months ended 31 March 2022
The following exchange rates were used as at 30 September 2021:
Currency Euro British Pound United States DollarAustralian Dollar 1.6044 1.8666 1.3844Brazilian Real 6.3150 7.3470 5.4489British Pound 0.8595 1.0000 0.7416Canadian Dollar 1.4682 1.7082 1.2669Chilean Peso 941.3003 1,095.1302 812.2000Chinese Yuan 7.4893 8.7132 6.4622Chinese Yuan Renminbi 7.4799 8.7023 6.4540Colombian Peso 4,417.8414 5,139.8172 3,811.9300Czech Koruna 25.3430 29.4846 21.8672Danish Krone 7.4359 8.6512 6.4161Euro 1.0000 1.1634 0.8628Hong Kong Dollar 9.0220 10.4964 7.7847Hungarian Forint 359.2154 417.9194 309.9487Indian Rupee 86.0261 100.0847 74.2275Indonesian Rupiah 16,587.4910 19,298.2645 14,312.5000Japanese Yen 129.3100 150.4422 111.5750Kuwait Dinar 0.3495 0.4067 0.3016Malaysian Ringgit 4.8519 5.6449 4.1865Mexican Peso 23.8101 27.7012 20.5445New Zealand Dollar 1.6800 1.9546 1.4496Norwegian Krone 10.1168 11.7701 8.7293Philippine Peso 59.1181 68.7794 51.0100Polish Zloty 4.6025 5.3546 3.9713Qatari Rial 4.2197 4.9093 3.6410Romanian Leu 4.9495 5.7584 4.2707Russian Ruble 84.3543 98.1397 72.7850Singapore Dollar 1.5734 1.8305 1.3576South African Rand 17.4364 20.2859 15.0450South Korean Won 1,372.1984 1,596.4468 1,184.0000Swedish Krona 10.1391 11.7961 8.7486Swiss Franc 1.0811 1.2578 0.9329Taiwan Dollar 32.2890 37.5657 27.8605Thai Baht 39.2131 45.6214 33.8350Turkish Lira 10.2964 11.9791 8.8843UAE Dirham 4.2570 4.9527 3.6732United States Dollar 1.1590 1.3484 1.0000
18. Currency Translation Adjustment
A notional currency adjustment of €74,871,436 (31 March 2021: €15,129,093) arises from the translation of the opening net assets, the Statement of Comprehensive Income and the capital transactions for inclusion in the aggregated Company totals on page 30. The method of translation has no effect on the value of the net assets attributable to the individual Funds.
17. Exchange Rates (Continued)
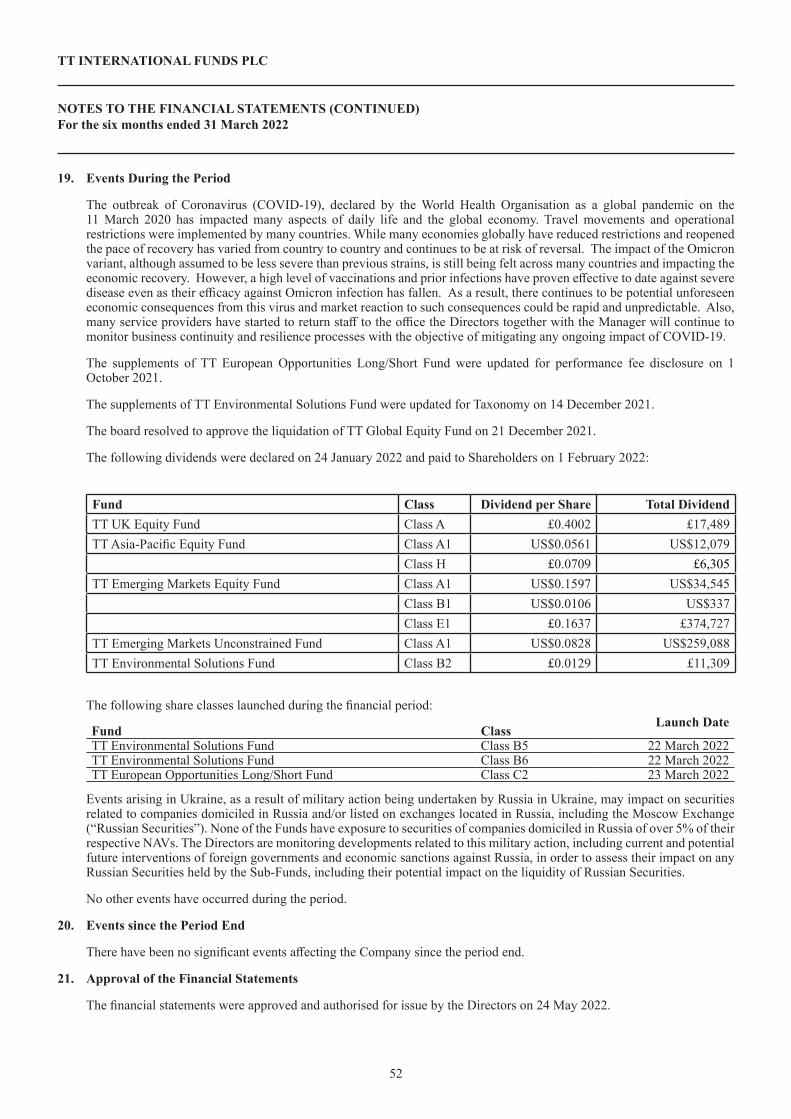
52
TT INTERNATIONAL FUNDS PLC
NOTES TO THE FINANCIAL STATEMENTS (CONTINUED)For the six months ended 31 March 2022
19. Events During the Period
The outbreak of Coronavirus (COVID-19), declared by the World Health Organisation as a global pandemic on the 11 March 2020 has impacted many aspects of daily life and the global economy. Travel movements and operational restrictions were implemented by many countries. While many economies globally have reduced restrictions and reopened the pace of recovery has varied from country to country and continues to be at risk of reversal. The impact of the Omicron variant, although assumed to be less severe than previous strains, is still being felt across many countries and impacting the economic recovery. However, a high level of vaccinations and prior infections have proven effective to date against severe disease even as their efficacy against Omicron infection has fallen. As a result, there continues to be potential unforeseen economic consequences from this virus and market reaction to such consequences could be rapid and unpredictable. Also, many service providers have started to return staff to the office the Directors together with the Manager will continue to monitor business continuity and resilience processes with the objective of mitigating any ongoing impact of COVID-19.
The supplements of TT European Opportunities Long/Short Fund were updated for performance fee disclosure on 1 October 2021.
The supplements of TT Environmental Solutions Fund were updated for Taxonomy on 14 December 2021.
The board resolved to approve the liquidation of TT Global Equity Fund on 21 December 2021.
The following dividends were declared on 24 January 2022 and paid to Shareholders on 1 February 2022:
Fund Class Dividend per Share Total Dividend TT UK Equity Fund Class A £0.4002 £17,489TT Asia-Pacific Equity Fund Class A1 US$0.0561 US$12,079
Class H £0.0709 £6,305TT Emerging Markets Equity Fund Class A1 US$0.1597 US$34,545
Class B1 US$0.0106 US$337Class E1 £0.1637 £374,727
TT Emerging Markets Unconstrained Fund Class A1 US$0.0828 US$259,088TT Environmental Solutions Fund Class B2 £0.0129 £11,309
The following share classes launched during the financial period:
Fund ClassLaunch Date
TT Environmental Solutions Fund Class B5 22 March 2022TT Environmental Solutions Fund Class B6 22 March 2022TT European Opportunities Long/Short Fund Class C2 23 March 2022
Events arising in Ukraine, as a result of military action being undertaken by Russia in Ukraine, may impact on securities related to companies domiciled in Russia and/or listed on exchanges located in Russia, including the Moscow Exchange (“Russian Securities”). None of the Funds have exposure to securities of companies domiciled in Russia of over 5% of their respective NAVs. The Directors are monitoring developments related to this military action, including current and potential future interventions of foreign governments and economic sanctions against Russia, in order to assess their impact on any Russian Securities held by the Sub-Funds, including their potential impact on the liquidity of Russian Securities.
No other events have occurred during the period.
20. Events since the Period End
There have been no significant events affecting the Company since the period end.
21. Approval of the Financial Statements
The financial statements were approved and authorised for issue by the Directors on 24 May 2022.

53
TT INTERNATIONAL FUNDS PLC
STATEMENT OF INVESTMENTS – TT UK Equity FundAs at 31 March 2022
Holdings Financial assets at fair value through profit or lossFair Value
£% of
Net Assets Equities: 97.11% (30 September 2021: 99.56%)
Basic Materials: 9.95% (30 September 2021: 14.42%)
1,440 Anglo American 57,204 3.6416,292 Glencore 81,460 5.18
519 Smurfit Kappa Group 17,714 1.13
Total Basic Materials 156,378 9.95
Communications: 2.00% (30 September 2021: 2.32%)
2,056 Moonpig Group 4,606 0.291,757 Telecom Plus 26,882 1.71
Total Communications 31,488 2.00
Consumer Discretionary: 1.89% (30 September 2021: 0.00%)
1,040 Whitbread 29,713 1.89
Total Consumer Discretionary 29,713 1.89
Consumer Staples: 2.40% (30 September 2021: 0.00%)
13,632 Tesco 37,624 2.40
Total Consumer Staples 37,624 2.40
Consumer, Cyclical: 16.37% (30 September 2021: 23.15%)
1,680 Burberry Group 28,123 1.7921,229 Cairn Homes 22,121 1.417,680 Dalata Hotel Group 25,701 1.641,168 Entain 19,196 1.22
297 Flutter Entertainment 26,374 1.6822,511 Glenveagh Properties 22,371 1.422,901 Grafton Group 28,502 1.82
10,775 Gym Group 20,946 1.331,490 JET2 17,060 1.09
757 Ryanair 8,694 0.553,337 Watches of Switzerland Group 38,042 2.42
Total Consumer, Cyclical 257,130 16.37
Consumer, Non-cyclical: 23.88% (30 September 2021: 20.03%)
1,398 AstraZeneca 141,645 9.02375 Beiersdorf 30,169 1.92
1,934 British American Tobacco 61,782 3.93947 Coca-Cola HBC 15,147 0.9627 Just Eat Takeaway 700 0.04
259 Pernod Ricard 43,621 2.78535 Reckitt Benckiser Group 31,201 1.99107 Roche 32,361 2.06

54
TT INTERNATIONAL FUNDS PLC
STATEMENT OF INVESTMENTS – TT UK Equity Fund (CONTINUED)As at 31 March 2022
Holdings Financial assets at fair value through profit or loss Fair Value
£ % of
Net Assets
Equities: 97.11% (30 September 2021: 99.56%) (Continued)
Consumer, Non-cyclical: 23.88% (30 September 2021: 20.03%) (Continued)
5,031 RWS 18,615 1.18
Total Consumer, Non-cyclical 375,241 23.88
Energy: 14.10% (30 September 2021: 8.38%)
7,663 BP 28,763 1.831,428 Ceres Power Holdings 10,539 0.67
633 DCC 37,512 2.396,864 Shell 144,727 9.21
Total Energy 221,541 14.10
Financial: 9.52% (30 September 2021: 15.94%)
30,995 Agronomics Limited 5,951 0.3815,478 Agronomics Limited Rights 758 0.054,417 Bank of Ireland Group 21,679 1.389,777 Melrose Industries 12,207 0.78
11,538 NatWest Group 24,911 1.596,381 Phoenix Group 39,179 2.493,079 Prudential 34,916 2.221,942 Standard Chartered 9,908 0.63
Total Financial 149,509 9.52
Industrial: 13.46% (30 September 2021: 13.10%)
10,254 Accsys Technologies 14,868 0.958,979 Balfour Beatty 23,076 1.472,116 Biffa 6,771 0.433,026 Compass Group 49,929 3.181,297 CRH 39,844 2.53
292 Kingspan Group 21,971 1.406,448 National Express Group 15,024 0.953,084 Renewi 20,388 1.302,495 Smart Metering Systems 19,686 1.25
Total Industrial 211,557 13.46
Technology: 1.20% (30 September 2021: 0.76%)
13,114 Serco Group 18,897 1.20
Total Technology 18,897 1.20
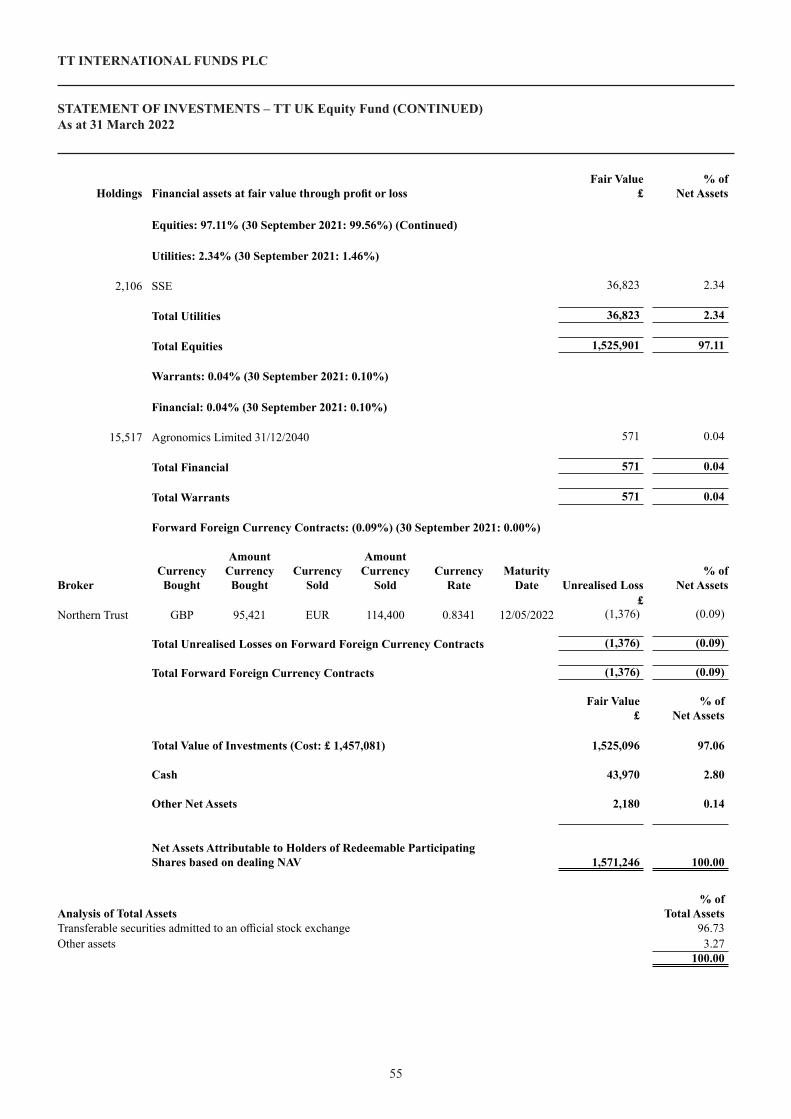
54 55
TT INTERNATIONAL FUNDS PLC
STATEMENT OF INVESTMENTS – TT UK Equity Fund (CONTINUED)As at 31 March 2022
Holdings Financial assets at fair value through profit or loss Fair Value
£ % of
Net Assets
Equities: 97.11% (30 September 2021: 99.56%) (Continued)
Utilities: 2.34% (30 September 2021: 1.46%)
2,106 SSE 36,823 2.34
Total Utilities 36,823 2.34
Total Equities 1,525,901 97.11
Warrants: 0.04% (30 September 2021: 0.10%)
Financial: 0.04% (30 September 2021: 0.10%)
15,517 Agronomics Limited 31/12/2040 571 0.04
Total Financial 571 0.04
Total Warrants 571 0.04
Forward Foreign Currency Contracts: (0.09%) (30 September 2021: 0.00%)
BrokerCurrency Bought
Amount Currency Bought
Currency Sold
Amount Currency
SoldCurrency
RateMaturity
Date Unrealised Loss% of
Net Assets£
Northern Trust GBP 95,421 EUR 114,400 0.8341 12/05/2022 (1,376) (0.09)
Total Unrealised Losses on Forward Foreign Currency Contracts (1,376) (0.09)
Total Forward Foreign Currency Contracts (1,376) (0.09)
Fair Value £
% of Net Assets
Total Value of Investments (Cost: £ 1,457,081) 1,525,096 97.06
Cash 43,970 2.80
Other Net Assets 2,180 0.14
Net Assets Attributable to Holders of Redeemable Participating Shares based on dealing NAV 1,571,246 100.00
Analysis of Total Assets% of
Total AssetsTransferable securities admitted to an official stock exchange 96.73Other assets 3.27
100.00–
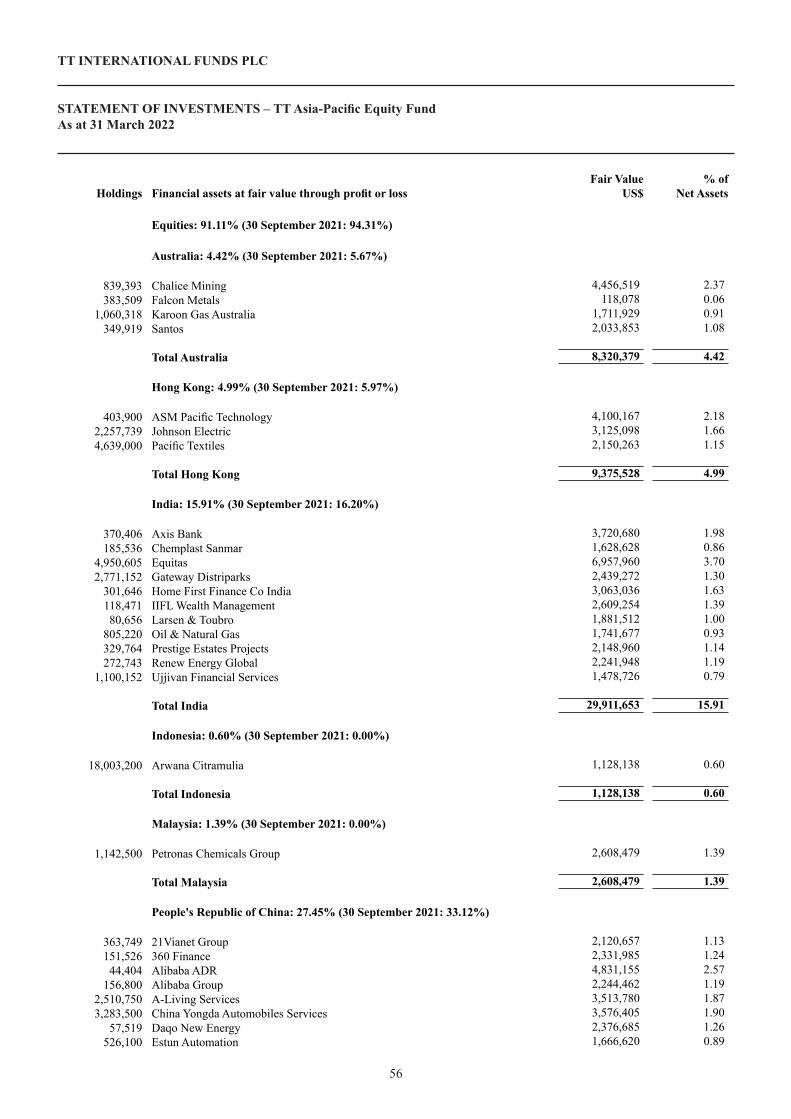
5756
TT INTERNATIONAL FUNDS PLC
STATEMENT OF INVESTMENTS – TT Asia-Pacific Equity FundAs at 31 March 2022
Holdings Financial assets at fair value through profit or lossFair Value
US$% of
Net Assets Equities: 91.11% (30 September 2021: 94.31%)
Australia: 4.42% (30 September 2021: 5.67%)
839,393 Chalice Mining 4,456,519 2.37383,509 Falcon Metals 118,078 0.06
1,060,318 Karoon Gas Australia 1,711,929 0.91349,919 Santos 2,033,853 1.08
Total Australia 8,320,379 4.42
Hong Kong: 4.99% (30 September 2021: 5.97%)
403,900 ASM Pacific Technology 4,100,167 2.182,257,739 Johnson Electric 3,125,098 1.664,639,000 Pacific Textiles 2,150,263 1.15
Total Hong Kong 9,375,528 4.99
India: 15.91% (30 September 2021: 16.20%)
370,406 Axis Bank 3,720,680 1.98185,536 Chemplast Sanmar 1,628,628 0.86
4,950,605 Equitas 6,957,960 3.702,771,152 Gateway Distriparks 2,439,272 1.30
301,646 Home First Finance Co India 3,063,036 1.63118,471 IIFL Wealth Management 2,609,254 1.3980,656 Larsen & Toubro 1,881,512 1.00
805,220 Oil & Natural Gas 1,741,677 0.93329,764 Prestige Estates Projects 2,148,960 1.14272,743 Renew Energy Global 2,241,948 1.19
1,100,152 Ujjivan Financial Services 1,478,726 0.79
Total India 29,911,653 15.91
Indonesia: 0.60% (30 September 2021: 0.00%)
18,003,200 Arwana Citramulia 1,128,138 0.60
Total Indonesia 1,128,138 0.60
Malaysia: 1.39% (30 September 2021: 0.00%)
1,142,500 Petronas Chemicals Group 2,608,479 1.39
Total Malaysia 2,608,479 1.39
People's Republic of China: 27.45% (30 September 2021: 33.12%)
363,749 21Vianet Group 2,120,657 1.13151,526 360 Finance 2,331,985 1.2444,404 Alibaba ADR 4,831,155 2.57
156,800 Alibaba Group 2,244,462 1.192,510,750 A-Living Services 3,513,780 1.873,283,500 China Yongda Automobiles Services 3,576,405 1.90
57,519 Daqo New Energy 2,376,685 1.26526,100 Estun Automation 1,666,620 0.89
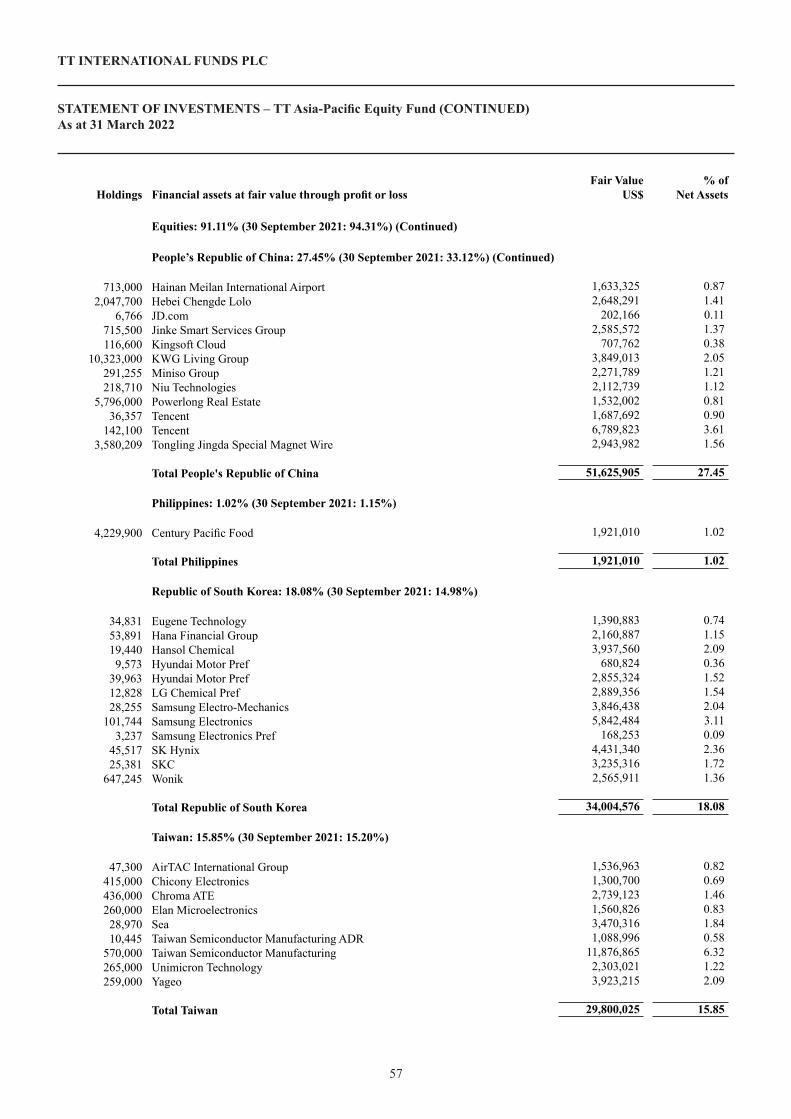
57
TT INTERNATIONAL FUNDS PLC
STATEMENT OF INVESTMENTS – TT Asia-Pacific Equity Fund (CONTINUED)As at 31 March 2022
56
Holdings Financial assets at fair value through profit or loss Fair Value
US$ % of
Net Assets
Equities: 91.11% (30 September 2021: 94.31%) (Continued) People’s Republic of China: 27.45% (30 September 2021: 33.12%) (Continued)
713,000 Hainan Meilan International Airport 1,633,325 0.872,047,700 Hebei Chengde Lolo 2,648,291 1.41
6,766 JD.com 202,166 0.11715,500 Jinke Smart Services Group 2,585,572 1.37116,600 Kingsoft Cloud 707,762 0.38
10,323,000 KWG Living Group 3,849,013 2.05291,255 Miniso Group 2,271,789 1.21218,710 Niu Technologies 2,112,739 1.12
5,796,000 Powerlong Real Estate 1,532,002 0.8136,357 Tencent 1,687,692 0.90
142,100 Tencent 6,789,823 3.613,580,209 Tongling Jingda Special Magnet Wire 2,943,982 1.56
Total People's Republic of China 51,625,905 27.45
Philippines: 1.02% (30 September 2021: 1.15%)
4,229,900 Century Pacific Food 1,921,010 1.02
Total Philippines 1,921,010 1.02
Republic of South Korea: 18.08% (30 September 2021: 14.98%)
34,831 Eugene Technology 1,390,883 0.7453,891 Hana Financial Group 2,160,887 1.1519,440 Hansol Chemical 3,937,560 2.099,573 Hyundai Motor Pref 680,824 0.36
39,963 Hyundai Motor Pref 2,855,324 1.5212,828 LG Chemical Pref 2,889,356 1.5428,255 Samsung Electro-Mechanics 3,846,438 2.04
101,744 Samsung Electronics 5,842,484 3.113,237 Samsung Electronics Pref 168,253 0.09
45,517 SK Hynix 4,431,340 2.3625,381 SKC 3,235,316 1.72
647,245 Wonik 2,565,911 1.36
Total Republic of South Korea 34,004,576 18.08
Taiwan: 15.85% (30 September 2021: 15.20%)
47,300 AirTAC International Group 1,536,963 0.82415,000 Chicony Electronics 1,300,700 0.69436,000 Chroma ATE 2,739,123 1.46260,000 Elan Microelectronics 1,560,826 0.8328,970 Sea 3,470,316 1.8410,445 Taiwan Semiconductor Manufacturing ADR 1,088,996 0.58
570,000 Taiwan Semiconductor Manufacturing 11,876,865 6.32265,000 Unimicron Technology 2,303,021 1.22259,000 Yageo 3,923,215 2.09
Total Taiwan 29,800,025 15.85
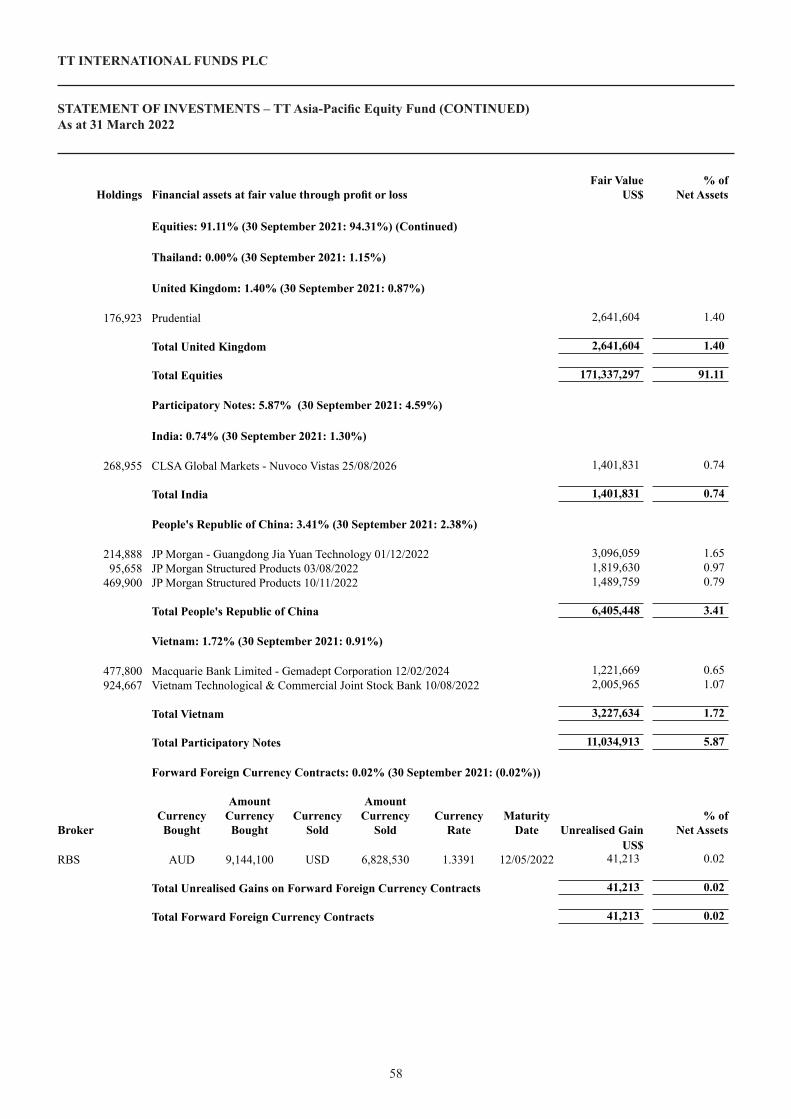
58
TT INTERNATIONAL FUNDS PLC
STATEMENT OF INVESTMENTS – TT Asia-Pacific Equity Fund (CONTINUED)As at 31 March 2022
Holdings Financial assets at fair value through profit or loss Fair Value
US$ % of
Net Assets
Equities: 91.11% (30 September 2021: 94.31%) (Continued)
Thailand: 0.00% (30 September 2021: 1.15%)
United Kingdom: 1.40% (30 September 2021: 0.87%)
176,923 Prudential 2,641,604 1.40
Total United Kingdom 2,641,604 1.40
Total Equities 171,337,297 91.11
Participatory Notes: 5.87% (30 September 2021: 4.59%)
India: 0.74% (30 September 2021: 1.30%)
268,955 CLSA Global Markets - Nuvoco Vistas 25/08/2026 1,401,831 0.74
Total India 1,401,831 0.74
People's Republic of China: 3.41% (30 September 2021: 2.38%)
214,888 JP Morgan - Guangdong Jia Yuan Technology 01/12/2022 3,096,059 1.6595,658 JP Morgan Structured Products 03/08/2022 1,819,630 0.97
469,900 JP Morgan Structured Products 10/11/2022 1,489,759 0.79
Total People's Republic of China 6,405,448 3.41
Vietnam: 1.72% (30 September 2021: 0.91%)
477,800 Macquarie Bank Limited - Gemadept Corporation 12/02/2024 1,221,669 0.65924,667 Vietnam Technological & Commercial Joint Stock Bank 10/08/2022 2,005,965 1.07
Total Vietnam 3,227,634 1.72
Total Participatory Notes 11,034,913 5.87
Forward Foreign Currency Contracts: 0.02% (30 September 2021: (0.02%))
BrokerCurrency Bought
Amount Currency Bought
Currency Sold
Amount Currency
SoldCurrency
RateMaturity
Date Unrealised Gain% of
Net AssetsUS$
RBS AUD 9,144,100 USD 6,828,530 1.3391 12/05/2022 41,213 0.02
Total Unrealised Gains on Forward Foreign Currency Contracts 41,213 0.02
Total Forward Foreign Currency Contracts 41,213 0.02
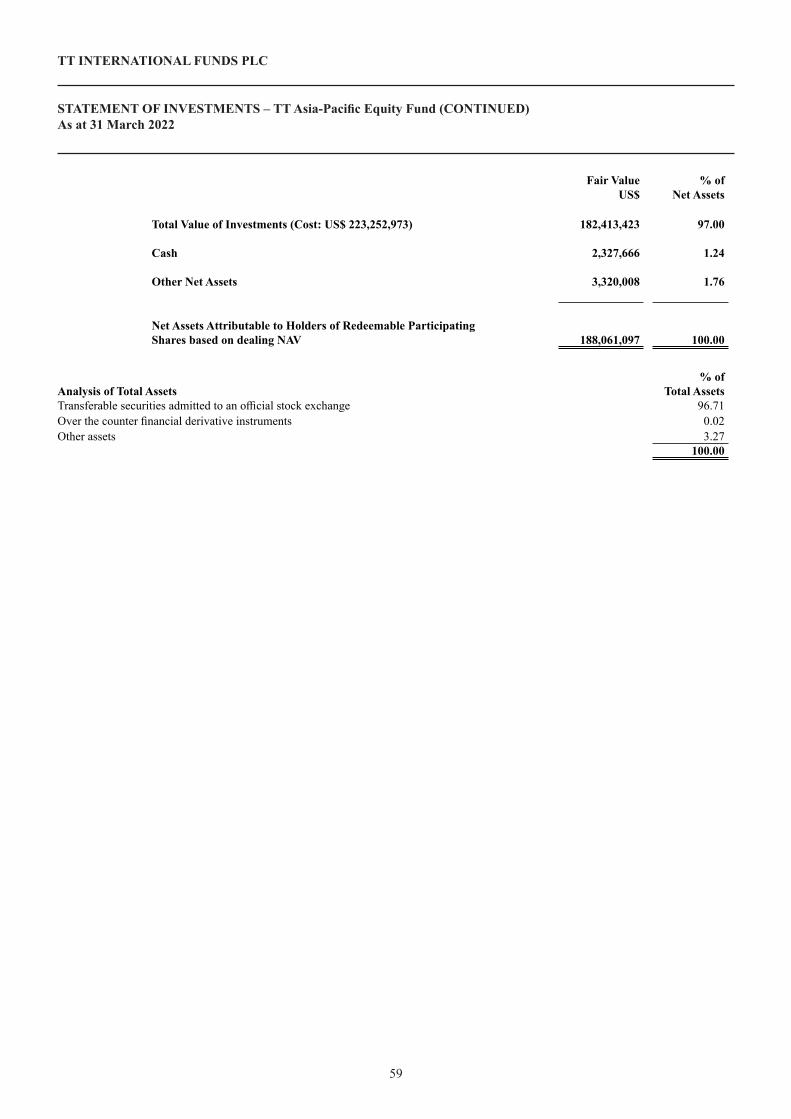
58 59
TT INTERNATIONAL FUNDS PLC
STATEMENT OF INVESTMENTS – TT Asia-Pacific Equity Fund (CONTINUED)As at 31 March 2022
Fair Value US$
% of Net Assets
Total Value of Investments (Cost: US$ 223,252,973) 182,413,423 97.00
Cash 2,327,666 1.24
Other Net Assets 3,320,008 1.76
Net Assets Attributable to Holders of Redeemable Participating Shares based on dealing NAV 188,061,097 100.00
Analysis of Total Assets% of
Total AssetsTransferable securities admitted to an official stock exchange 96.71Over the counter financial derivative instruments 0.02Other assets 3.27
100.00–
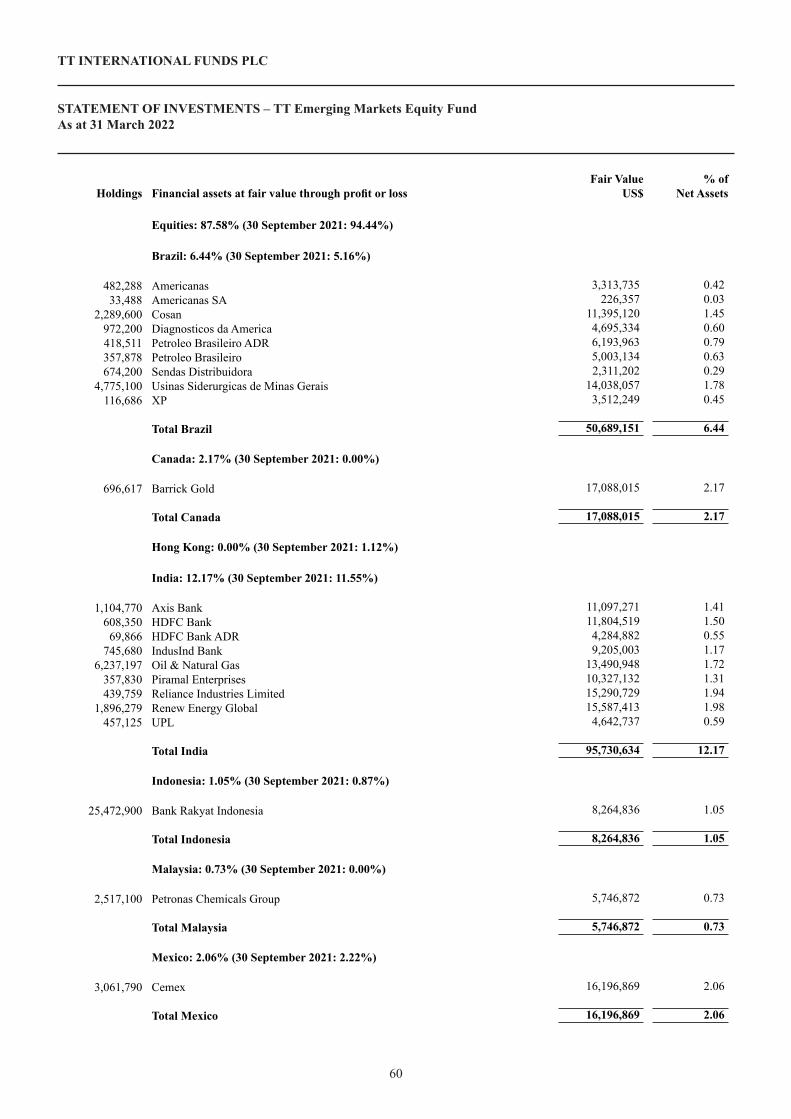
6160
TT INTERNATIONAL FUNDS PLC
STATEMENT OF INVESTMENTS – TT Emerging Markets Equity FundAs at 31 March 2022
Holdings Financial assets at fair value through profit or lossFair Value
US$% of
Net Assets Equities: 87.58% (30 September 2021: 94.44%)
Brazil: 6.44% (30 September 2021: 5.16%)
482,288 Americanas 3,313,735 0.4233,488 Americanas SA 226,357 0.03
2,289,600 Cosan 11,395,120 1.45972,200 Diagnosticos da America 4,695,334 0.60418,511 Petroleo Brasileiro ADR 6,193,963 0.79357,878 Petroleo Brasileiro 5,003,134 0.63674,200 Sendas Distribuidora 2,311,202 0.29
4,775,100 Usinas Siderurgicas de Minas Gerais 14,038,057 1.78116,686 XP 3,512,249 0.45
Total Brazil 50,689,151 6.44
Canada: 2.17% (30 September 2021: 0.00%)
696,617 Barrick Gold 17,088,015 2.17
Total Canada 17,088,015 2.17
Hong Kong: 0.00% (30 September 2021: 1.12%)
India: 12.17% (30 September 2021: 11.55%)
1,104,770 Axis Bank 11,097,271 1.41608,350 HDFC Bank 11,804,519 1.5069,866 HDFC Bank ADR 4,284,882 0.55
745,680 IndusInd Bank 9,205,003 1.176,237,197 Oil & Natural Gas 13,490,948 1.72
357,830 Piramal Enterprises 10,327,132 1.31439,759 Reliance Industries Limited 15,290,729 1.94
1,896,279 Renew Energy Global 15,587,413 1.98457,125 UPL 4,642,737 0.59
Total India 95,730,634 12.17
Indonesia: 1.05% (30 September 2021: 0.87%)
25,472,900 Bank Rakyat Indonesia 8,264,836 1.05
Total Indonesia 8,264,836 1.05
Malaysia: 0.73% (30 September 2021: 0.00%)
2,517,100 Petronas Chemicals Group 5,746,872 0.73
Total Malaysia 5,746,872 0.73
Mexico: 2.06% (30 September 2021: 2.22%)
3,061,790 Cemex 16,196,869 2.06
Total Mexico 16,196,869 2.06
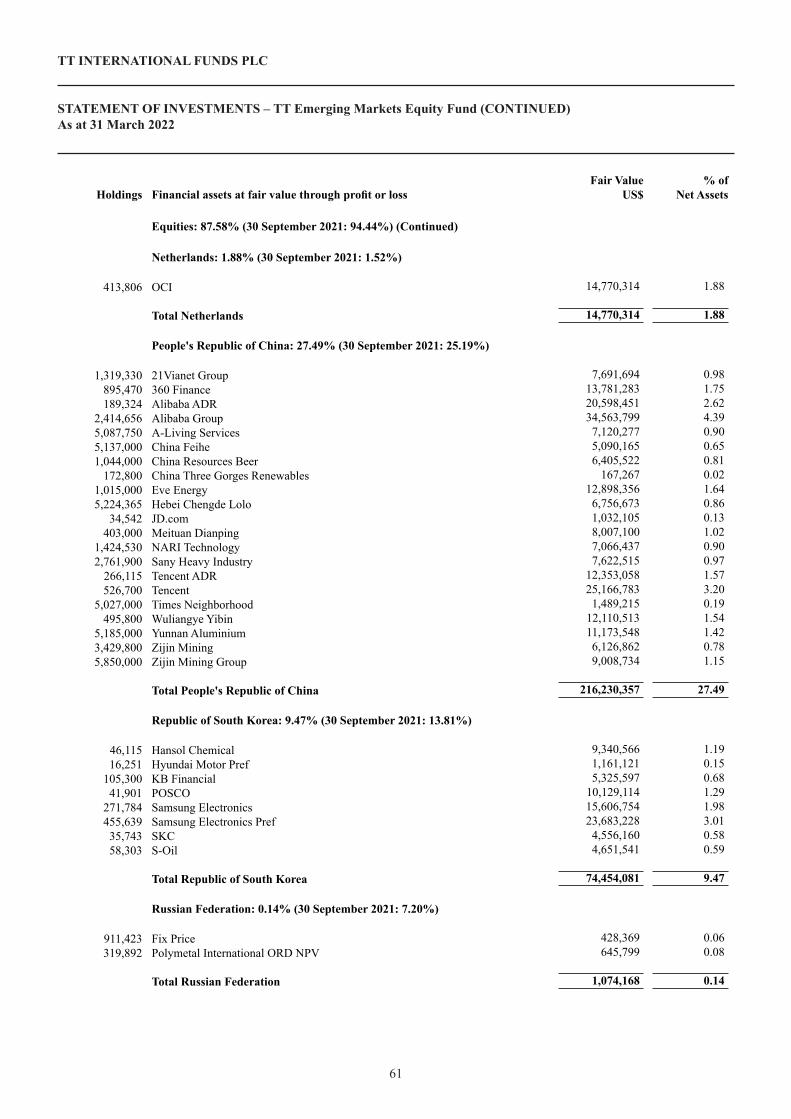
61
TT INTERNATIONAL FUNDS PLC
STATEMENT OF INVESTMENTS – TT Emerging Markets Equity Fund (CONTINUED)As at 31 March 2022
60
Holdings Financial assets at fair value through profit or loss Fair Value
US$ % of
Net Assets
Equities: 87.58% (30 September 2021: 94.44%) (Continued)
Netherlands: 1.88% (30 September 2021: 1.52%)
413,806 OCI 14,770,314 1.88
Total Netherlands 14,770,314 1.88
People's Republic of China: 27.49% (30 September 2021: 25.19%)
1,319,330 21Vianet Group 7,691,694 0.98895,470 360 Finance 13,781,283 1.75189,324 Alibaba ADR 20,598,451 2.62
2,414,656 Alibaba Group 34,563,799 4.395,087,750 A-Living Services 7,120,277 0.905,137,000 China Feihe 5,090,165 0.651,044,000 China Resources Beer 6,405,522 0.81
172,800 China Three Gorges Renewables 167,267 0.021,015,000 Eve Energy 12,898,356 1.645,224,365 Hebei Chengde Lolo 6,756,673 0.86
34,542 JD.com 1,032,105 0.13403,000 Meituan Dianping 8,007,100 1.02
1,424,530 NARI Technology 7,066,437 0.902,761,900 Sany Heavy Industry 7,622,515 0.97
266,115 Tencent ADR 12,353,058 1.57526,700 Tencent 25,166,783 3.20
5,027,000 Times Neighborhood 1,489,215 0.19495,800 Wuliangye Yibin 12,110,513 1.54
5,185,000 Yunnan Aluminium 11,173,548 1.423,429,800 Zijin Mining 6,126,862 0.785,850,000 Zijin Mining Group 9,008,734 1.15
Total People's Republic of China 216,230,357 27.49
Republic of South Korea: 9.47% (30 September 2021: 13.81%)
46,115 Hansol Chemical 9,340,566 1.1916,251 Hyundai Motor Pref 1,161,121 0.15
105,300 KB Financial 5,325,597 0.6841,901 POSCO 10,129,114 1.29
271,784 Samsung Electronics 15,606,754 1.98455,639 Samsung Electronics Pref 23,683,228 3.0135,743 SKC 4,556,160 0.5858,303 S-Oil 4,651,541 0.59
Total Republic of South Korea 74,454,081 9.47
Russian Federation: 0.14% (30 September 2021: 7.20%)
911,423 Fix Price 428,369 0.06319,892 Polymetal International ORD NPV 645,799 0.08
Total Russian Federation 1,074,168 0.14

62
TT INTERNATIONAL FUNDS PLC
STATEMENT OF INVESTMENTS – TT Emerging Markets Equity Fund (CONTINUED)As at 31 March 2022
Holdings Financial assets at fair value through profit or loss Fair Value
US$ % of
Net Assets
Equities: 87.58% (30 September 2021: 94.44%) (Continued)
Saudi Arabia: 0.93% (30 September 2021: 0.00%)
253,512 Saudi Telecom 7,284,711 0.93
Total Saudi Arabia 7,284,711 0.93
Slovenia: 0.88% (30 September 2021: 0.87%)
455,538 Nova Ljubljanska Banka 6,943,905 0.88
Total Slovenia 6,943,905 0.88
South Africa: 0.00% (30 September 2021: 1.42%)
Switzerland: 0.00% (30 September 2021: 0.99%)
Taiwan: 14.50% (30 September 2021: 17.36%)
210,041 AirTAC International Group 6,825,059 0.87381,000 ASE Technology 1,376,315 0.1768,284 Sea 8,179,740 1.0443,587 Taiwan Semiconductor Manufacturing ADR 4,544,381 0.58
3,317,000 Taiwan Semiconductor Manufacturing 69,115,020 8.79963,000 Unimicron Technology 8,369,091 1.06
1,035,000 Yageo 15,677,713 1.99
Total Taiwan 114,087,319 14.50
Thailand: 0.00% (30 September 2021: 1.19%)
Turkey: 0.00% (30 September 2021: 2.80%)
– Turker proje Gayrimenkul ve Yatirim Gelistirme 4 –
Total Turkey 4 –
United Arab Emirates: 1.58% (30 September 2021: 0.00%)
7,619,111 Emaar Properties 12,445,969 1.58
Total United Arab Emirates 12,445,969 1.58
United Kingdom: 4.14% (30 September 2021: 1.17%)
2,223,138 Glencore 14,635,475 1.86477,349 Pepco Group 5,128,302 0.65854,678 Prudential 12,761,037 1.63
Total United Kingdom 32,524,814 4.14

62 63
TT INTERNATIONAL FUNDS PLC
STATEMENT OF INVESTMENTS – TT Emerging Markets Equity Fund (CONTINUED)As at 31 March 2022
Holdings Financial assets at fair value through profit or loss Fair Value
US$ % of
Net Assets
Equities: 87.58% (30 September 2021: 94.44%) (Continued)
United States: 1.95% (30 September 2021: 0.00%)
58,594 Globant 15,355,730 1.95
Total United States 15,355,730 1.95
Total Equities 688,887,749 87.58
Participatory Notes: 7.04% (30 September 2021: 4.39%)
India: 0.55% (30 September 2021: 1.01%)
834,664 Nuvoco Vistas 29/08/2022 4,350,387 0.55
Total India 4,350,387 0.55
People's Republic of China: 4.65% (30 September 2021: 3.38%)
12,625,600 China Three Gorges Renewables 09/11/2022 12,221,340 1.55683,621 Guangdong Jia Yuan Technology Shares 01/12/2022 9,849,462 1.25498,566 JP Morgan PNOTE Pylon Technologies 03/08/2022 9,483,845 1.21560,900 Midea 06/04/2022 5,040,327 0.64
Total People's Republic of China 36,594,974 4.65
United Kingdom: 1.84% (30 September 2021: 0.00%)
2,276,539 HSBC Bank 14/06/2022 14,421,570 1.84
Total United Kingdom 14,421,570 1.84
Total Participatory Notes 55,366,931 7.04
Forward Foreign Currency Contracts: (0.02%) (30 September 2021: 0.00%)
BrokerCurrency Bought
Amount Currency Bought
Currency Sold
Amount Currency
SoldCurrency
RateMaturity
Date Unrealised Loss% of
Net AssetsUS$
HSBC Bank USD 19,207,936 INR 1,471,520,000 0.0131 12/05/2022 (116,785) (0.02)
Total Unrealised Losses on Forward Foreign Currency Contracts (116,785) (0.02)
Total Forward Foreign Currency Contracts (116,785) (0.02)

64
TT INTERNATIONAL FUNDS PLC
STATEMENT OF INVESTMENTS – TT Emerging Markets Equity Fund (CONTINUED)As at 31 March 2022
Fair Value US$
% of Net Assets
Total Value of Investments (Cost: US$ 834,328,661) 744,137,895 94.60
Cash 33,551,528 4.27
Margin and Collateral Cash 784,998 0.10
Other Net Assets 8,100,064 1.03
Net Assets Attributable to Holders of Redeemable Participating Shares based on dealing NAV 786,574,485 100.00
Analysis of Total Assets% of
Total AssetsTransferable securities admitted to an official stock exchange 92.88Other assets 7.12
100.00–

65
TT INTERNATIONAL FUNDS PLC
STATEMENT OF INVESTMENTS – TT Emerging Markets Unconstrained FundAs at 31 March 2022
Holdings Financial assets at fair value through profit or lossFair Value
US$% of
Net Assets Equities: 93.36% (30 September 2021: 92.48%)
Brazil: 4.36% (30 September 2021: 5.70%)
31,224 Americanas 211,053 0.03414,094 Americanas SA 2,845,183 0.43
1,076,700 Diagnosticos da America 5,200,026 0.78586,123 Petroleo Brasileiro 8,194,000 1.23
4,291,900 Usinas Siderurgicas de Minas Gerais 12,617,524 1.89
Total Brazil 29,067,786 4.36
Canada: 2.17% (30 September 2021: 0.00%)
587,771 Barrick Gold 14,418,023 2.17
Total Canada 14,418,023 2.17
Hong Kong: 0.00% (30 September 2021: 0.98%)
India: 13.65% (30 September 2021: 11.05%)
587,904 Axis Bank 5,905,419 0.89594,823 HDFC Bank 11,542,039 1.73486,030 ICICI Bank 4,684,232 0.70567,362 Indusind Bank Limited 7,003,767 1.05446,160 Nuvoco Vistas 2,325,449 0.35
5,622,586 Oil & Natural Gas 12,161,555 1.83299,711 Piramal Enterprises 8,649,792 1.30320,426 Reliance Industries Limited 11,141,437 1.67
1,745,029 Renew Energy Global 14,344,138 2.163,933,286 Ujjivan Financial Services 5,286,773 0.79
771,994 UPL 7,840,668 1.18
Total India 90,885,269 13.65
Luxembourg: 2.09% (30 September 2021: 0.00%)
304,447 Ternium ADR 13,898,005 2.09
Total Luxembourg 13,898,005 2.09
Malaysia: 0.74% (30 September 2021: 0.00%)
2,162,300 Petronas Chemicals Group 4,936,817 0.74
Total Malaysia 4,936,817 0.74
Mexico: 1.53% (30 September 2021: 2.00%)
1,921,661 Cemex 10,165,587 1.53
Total Mexico 10,165,587 1.53
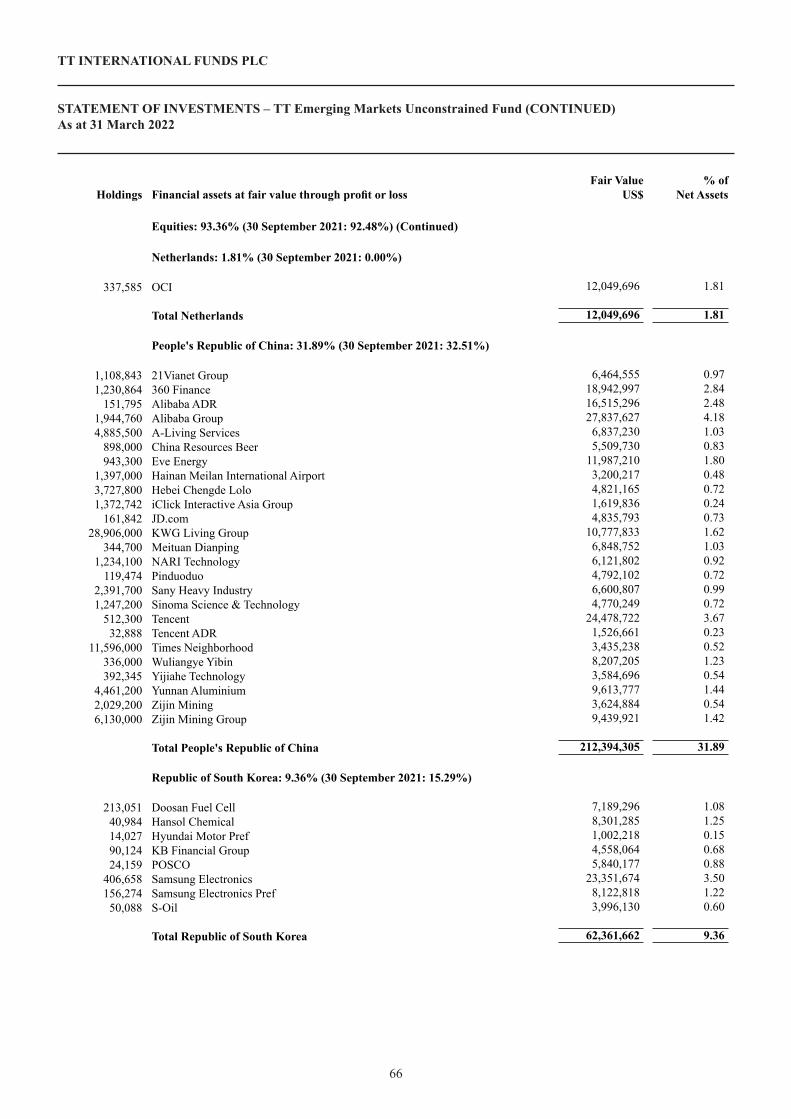
66
TT INTERNATIONAL FUNDS PLC
STATEMENT OF INVESTMENTS – TT Emerging Markets Unconstrained Fund (CONTINUED)As at 31 March 2022
Holdings Financial assets at fair value through profit or loss Fair Value
US$ % of
Net Assets
Equities: 93.36% (30 September 2021: 92.48%) (Continued)
Netherlands: 1.81% (30 September 2021: 0.00%)
337,585 OCI 12,049,696 1.81
Total Netherlands 12,049,696 1.81
People's Republic of China: 31.89% (30 September 2021: 32.51%)
1,108,843 21Vianet Group 6,464,555 0.971,230,864 360 Finance 18,942,997 2.84
151,795 Alibaba ADR 16,515,296 2.481,944,760 Alibaba Group 27,837,627 4.184,885,500 A-Living Services 6,837,230 1.03
898,000 China Resources Beer 5,509,730 0.83943,300 Eve Energy 11,987,210 1.80
1,397,000 Hainan Meilan International Airport 3,200,217 0.483,727,800 Hebei Chengde Lolo 4,821,165 0.721,372,742 iClick Interactive Asia Group 1,619,836 0.24
161,842 JD.com 4,835,793 0.7328,906,000 KWG Living Group 10,777,833 1.62
344,700 Meituan Dianping 6,848,752 1.031,234,100 NARI Technology 6,121,802 0.92
119,474 Pinduoduo 4,792,102 0.722,391,700 Sany Heavy Industry 6,600,807 0.991,247,200 Sinoma Science & Technology 4,770,249 0.72
512,300 Tencent 24,478,722 3.6732,888 Tencent ADR 1,526,661 0.23
11,596,000 Times Neighborhood 3,435,238 0.52336,000 Wuliangye Yibin 8,207,205 1.23392,345 Yijiahe Technology 3,584,696 0.54
4,461,200 Yunnan Aluminium 9,613,777 1.442,029,200 Zijin Mining 3,624,884 0.546,130,000 Zijin Mining Group 9,439,921 1.42
Total People's Republic of China 212,394,305 31.89
Republic of South Korea: 9.36% (30 September 2021: 15.29%)
213,051 Doosan Fuel Cell 7,189,296 1.0840,984 Hansol Chemical 8,301,285 1.2514,027 Hyundai Motor Pref 1,002,218 0.1590,124 KB Financial Group 4,558,064 0.6824,159 POSCO 5,840,177 0.88
406,658 Samsung Electronics 23,351,674 3.50156,274 Samsung Electronics Pref 8,122,818 1.2250,088 S-Oil 3,996,130 0.60
Total Republic of South Korea 62,361,662 9.36

66 67
TT INTERNATIONAL FUNDS PLC
STATEMENT OF INVESTMENTS – TT Emerging Markets Unconstrained Fund (CONTINUED)As at 31 March 2022
Holdings Financial assets at fair value through profit or loss Fair Value
US$ % of
Net Assets
Equities: 93.36% (30 September 2021: 92.48%) (Continued)
Russian Federation: 0.00% (30 September 2021: 2.27%)
Saudi Arabia: 0.92% (30 September 2021: 0.00%)
214,246 Saudi Telecom 6,156,396 0.92
Total Saudi Arabia 6,156,396 0.92
South Africa: 0.00% (30 September 2021: 1.33%)
Taiwan: 14.05% (30 September 2021: 17.67%)
164,737 AirTAC International Group 5,352,953 0.8085,806 Sea 10,278,701 1.5453,264 Taiwan Semiconductor Manufacturing ADR 5,553,305 0.83
2,584,000 Taiwan Semiconductor Manufacturing 53,841,788 8.09617,000 Unimicron Technology 5,362,128 0.81870,000 Yageo 13,178,367 1.98
Total Taiwan 93,567,242 14.05
Thailand: 0.76% (30 September 2021: 0.00%)
3,237,300 Thai Oil 5,038,504 0.76
Total Thailand 5,038,504 0.76
Turkey: 0.00% (30 September 2021: 1.50%)
United Arab Emirates: 1.57% (30 September 2021: 0.14%)
6,402,988 Emaar Properties PJSC 10,459,408 1.57
Total United Arab Emirates 10,459,408 1.57
United Kingdom: 6.57% (30 September 2021: 2.04%)
1,766,918 Glencore 11,632,064 1.75637,908 Prudential 9,524,485 1.43
61,337,953 Savannah Petroleum 22,612,975 3.39
Total United Kingdom 43,769,524 6.57
United States: 1.89% (30 September 2021: 0.00%)
48,000 Globant 12,579,360 1.89
Total United States 12,579,360 1.89
Total Equities 621,747,584 93.36

68
TT INTERNATIONAL FUNDS PLC
STATEMENT OF INVESTMENTS – TT Emerging Markets Unconstrained Fund (CONTINUED)As at 31 March 2022
Holdings Financial assets at fair value through profit or loss Fair Value
US$ % of
Net Assets
Participatory Notes: 5.44% (30 September 2021: 6.44%)
Hong Kong: 0.00% (30 September 2021: 1.69%)
India: 0.48% (30 September 2021: 0.90%)
607,827 CLSA Global Markets - Nuvoco Vistas 25/08/2026 3,168,080 0.48
Total India 3,168,080 0.48
People's Republic of China: 3.79% (30 September 2021: 3.85%)
8,850,300 JP Morgan - China Three Gorges 09/11/2022 8,566,922 1.28591,230 JP Morgan - Guangdong Jia Yuan Technology 01/12/2022 8,518,313 1.28429,463 JP Morgan Pylon Technologies 03/08/2022 8,169,350 1.23
Total People's Republic of China 25,254,585 3.79
United Kingdom: 1.17% (30 September 2021: 0.00%)
1,229,469 HSBC Bank 14/06/2022 7,788,522 1.17
Total United Kingdom 7,788,522 1.17
Total Participatory Notes 36,211,187 5.44
Warrants: 0.04% (30 September 2021: 0.11%)
Hong Kong: 0.04% (30 September 2021: 0.09%)
596,424 Primavera Capital Acquisition 19/01/2026 238,570 0.04
Total Hong Kong 238,570 0.04
Malaysia: 0.00% (30 September 2021: 0.02%)
Total Warrants 238,570 0.04
Forward Foreign Currency Contracts: (0.01%) (30 September 2021: 0.00%)
BrokerCurrency Bought
Amount Currency Bought
Currency Sold
Amount Currency
SoldCurrency
RateMaturity
Date Unrealised Loss% of
Net AssetsUS$
HSBC Bank USD 6,562,198 INR 502,730,000 0.0131 12/05/2022 (39,899) (0.01)
Total Unrealised Losses on Forward Foreign Currency Contracts (39,899) (0.01)
Total Forward Foreign Currency Contracts (39,899) (0.01)
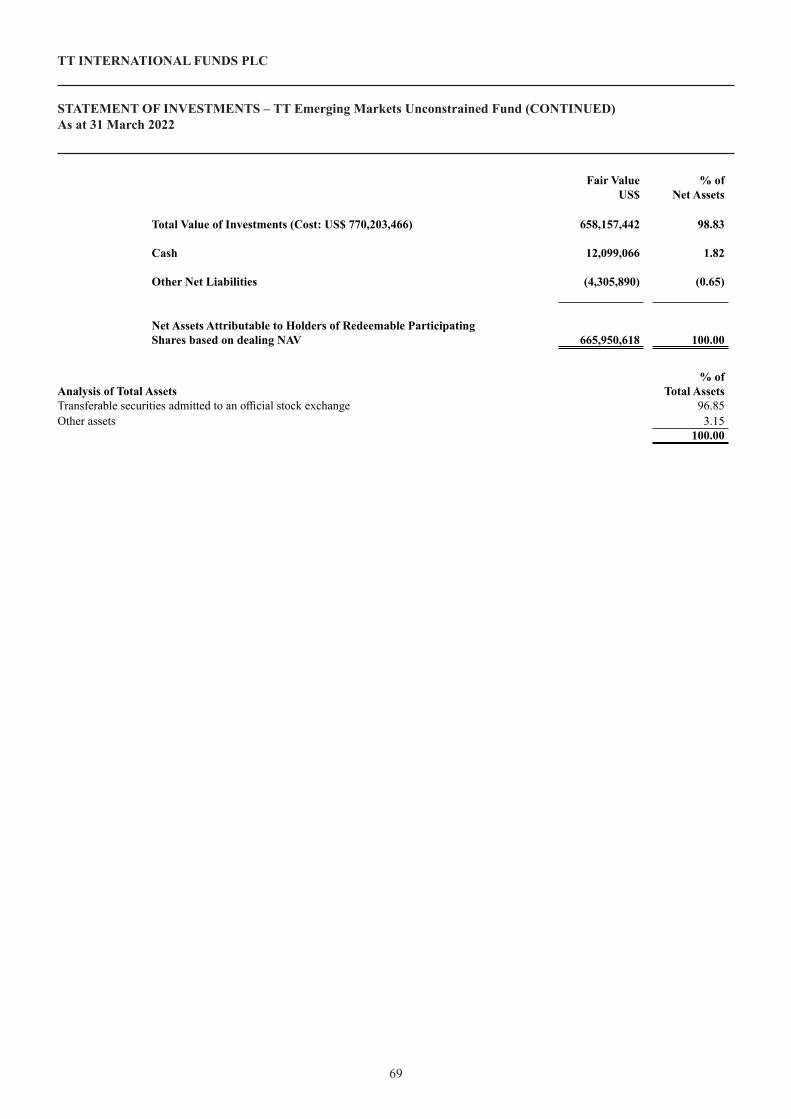
68 69
TT INTERNATIONAL FUNDS PLC
STATEMENT OF INVESTMENTS – TT Emerging Markets Unconstrained Fund (CONTINUED)As at 31 March 2022
Fair Value US$
% of Net Assets
Total Value of Investments (Cost: US$ 770,203,466) 658,157,442 98.83
Cash 12,099,066 1.82
Other Net Liabilities (4,305,890) (0.65)
Net Assets Attributable to Holders of Redeemable Participating Shares based on dealing NAV 665,950,618 100.00
Analysis of Total Assets% of
Total AssetsTransferable securities admitted to an official stock exchange 96.85Other assets 3.15
100.00–

7170
TT INTERNATIONAL FUNDS PLC
STATEMENT OF INVESTMENTS – TT China Focus FundAs at 31 March 2022
Holdings Financial assets at fair value through profit or lossFair Value
US$% of
Net Assets Equities: 91.93% (30 September 2021: 83.05%)
Hong Kong: 2.39% (30 September 2021: 5.06%)
16,000 Power Assets 104,298 2.39
Total Hong Kong 104,298 2.39
People's Republic of China: 85.37% (30 September 2021: 76.40%)
8,338 21Vianet Group 48,611 1.1210,808 360 Finance 166,335 3.82
378 Alibaba ADR 41,126 0.9426,836 Alibaba Group 384,135 8.822,600 Asymchem Laboratories Tianjin 92,295 2.12
16,352 Beijing New Building Materials 78,075 1.791,000 BYD 28,654 0.66
62,000 China Feihe 61,435 1.4129,755 China Merchants Bank 219,362 5.0491,000 China Nonferrous Mining 45,782 1.05
308,000 China Petroleum & Chemical 154,562 3.5576,000 China Youran Dairy 34,936 0.8098,000 CIFI Holdings Group 57,688 1.3324,000 Country Garden Services 102,970 2.366,845 Eve Energy 86,984 2.002,200 Ganfeng Lithium 31,463 0.72
39,600 GF Securities 56,229 1.2920,000 Hainan Meilan International Airport 45,816 1.0539,945 Hebei Chengde Lolo 51,661 1.1921,000 Hua Hong Semiconductor 89,294 2.0517,876 iClick Interactive 21,094 0.48
542 JD.com ADR 31,366 0.723,350 JD.com 100,097 2.30
69,000 Jinxin Fertility 53,128 1.22990 Meituan 37,580 0.86
14,600 Meituan Dianping 290,084 6.665,951 Miniso Group 46,418 1.077,560 Muyuan Foods 67,715 1.56
17,491 NARI Technology 86,765 1.995,214 NIO 109,755 2.522,600 Sungrow Power Supply 43,931 1.018,400 Tencent 401,369 9.22
180,000 Times Neighborhood 53,324 1.222,539 Trip.com ADR 58,702 1.351,050 Trip.com Group 25,287 0.585,279 Wuliangye Yibin 128,946 2.96
10,898 Yantai Jereh Oilfield Services Group 72,360 1.668,279 Yijiahe Technology 75,642 1.74
32,000 Yunnan Aluminium 68,959 1.5828,000 Zijin Mining 43,119 0.9913,900 Zijin Mining ADR 24,830 0.57
Total People's Republic of China 3,717,884 85.37
Taiwan: 2.53% (30 September 2021: 1.59%)
257 Taiwan Semiconductor Manufacturing ADR 26,795 0.62
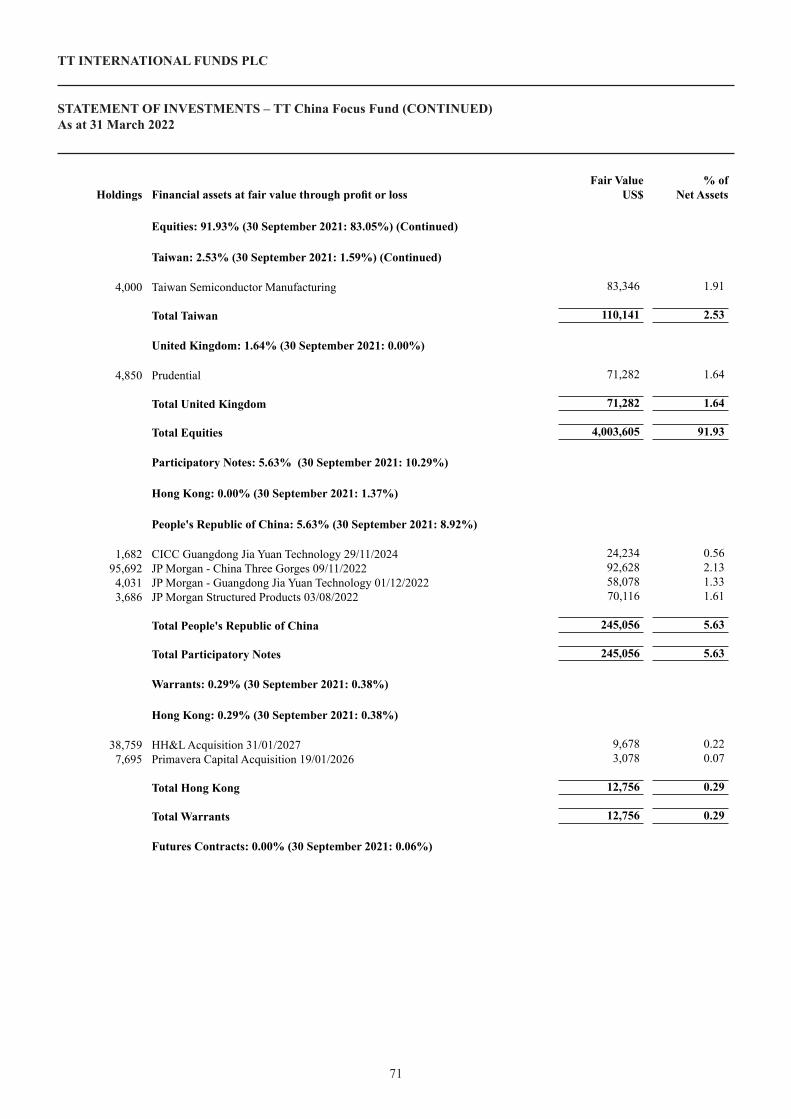
71
TT INTERNATIONAL FUNDS PLC
STATEMENT OF INVESTMENTS – TT China Focus Fund (CONTINUED)As at 31 March 2022
70
Holdings Financial assets at fair value through profit or loss Fair Value
US$ % of
Net Assets
Equities: 91.93% (30 September 2021: 83.05%) (Continued) Taiwan: 2.53% (30 September 2021: 1.59%) (Continued)
4,000 Taiwan Semiconductor Manufacturing 83,346 1.91
Total Taiwan 110,141 2.53
United Kingdom: 1.64% (30 September 2021: 0.00%)
4,850 Prudential 71,282 1.64
Total United Kingdom 71,282 1.64
Total Equities 4,003,605 91.93
Participatory Notes: 5.63% (30 September 2021: 10.29%)
Hong Kong: 0.00% (30 September 2021: 1.37%)
People's Republic of China: 5.63% (30 September 2021: 8.92%)
1,682 CICC Guangdong Jia Yuan Technology 29/11/2024 24,234 0.5695,692 JP Morgan - China Three Gorges 09/11/2022 92,628 2.134,031 JP Morgan - Guangdong Jia Yuan Technology 01/12/2022 58,078 1.333,686 JP Morgan Structured Products 03/08/2022 70,116 1.61
Total People's Republic of China 245,056 5.63
Total Participatory Notes 245,056 5.63
Warrants: 0.29% (30 September 2021: 0.38%)
Hong Kong: 0.29% (30 September 2021: 0.38%)
38,759 HH&L Acquisition 31/01/2027 9,678 0.227,695 Primavera Capital Acquisition 19/01/2026 3,078 0.07
Total Hong Kong 12,756 0.29
Total Warrants 12,756 0.29
Futures Contracts: 0.00% (30 September 2021: 0.06%)
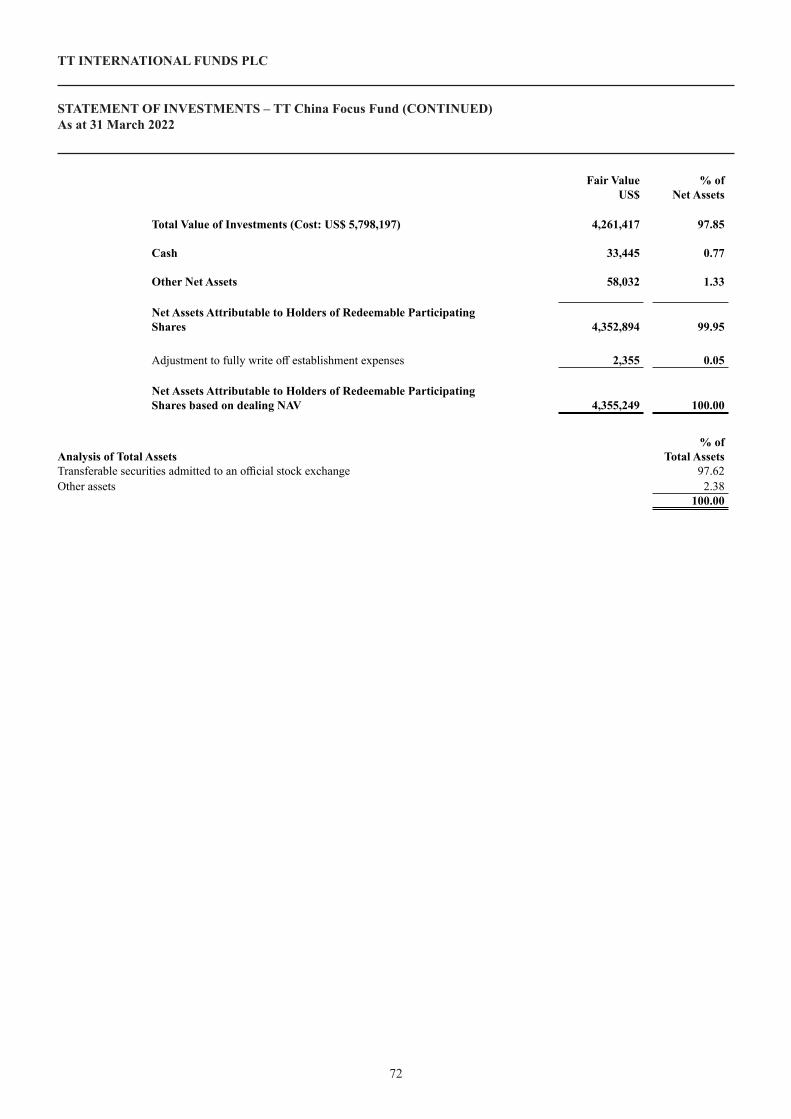
72
TT INTERNATIONAL FUNDS PLC
STATEMENT OF INVESTMENTS – TT China Focus Fund (CONTINUED)As at 31 March 2022
Fair Value US$
% of Net Assets
Total Value of Investments (Cost: US$ 5,798,197) 4,261,417 97.85
Cash 33,445 0.77
Other Net Assets 58,032 1.33
Net Assets Attributable to Holders of Redeemable Participating Shares 4,352,894 99.95
Adjustment to fully write off establishment expenses 2,355 0.05
Net Assets Attributable to Holders of Redeemable Participating Shares based on dealing NAV 4,355,249 100.00
Analysis of Total Assets% of
Total AssetsTransferable securities admitted to an official stock exchange 97.62Other assets 2.38
100.00–

73
TT INTERNATIONAL FUNDS PLC
STATEMENT OF INVESTMENTS – TT Asia Ex Japan Equity FundAs at 31 March 2022
Holdings Financial assets at fair value through profit or lossFair Value
US$% of
Net Assets Equities: 77.44% (30 September 2021: 81.07%)
Australia: 4.47% (30 September 2021: 5.37%)
277,269 Chalice Mining 1,472,081 2.40124,128 Falcon Metals 38,218 0.06349,784 Karoon Gas Australia 564,741 0.92115,332 Santos Limited 670,351 1.09
Total Australia 2,745,391 4.47
Cayman Islands: 0.00% (30 September 2021: 0.36%)
Hong Kong: 5.00% (30 September 2021: 5.91%)
132,400 ASM Pacific Technology 1,344,051 2.19730,277 Johnson Electric 1,010,828 1.65
1,538,000 Pacific Textiles 712,892 1.16
Total Hong Kong 3,067,771 5.00
India: 1.21% (30 September 2021: 2.40%)
90,059 Renew Energy Global 740,285 1.21
Total India 740,285 1.21
Indonesia: 0.62% (30 September 2021: 0.00%)
6,072,400 Arwana Citramulia 380,516 0.62
Total Indonesia 380,516 0.62
Malaysia: 0.98% (30 September 2021: 0.00%)
264,700 Petronas Chemicals Group 604,345 0.98
Total Malaysia 604,345 0.98
People's Republic of China: 28.15% (30 September 2021: 34.16%)
119,479 21Vianet Group 696,562 1.1349,172 360 Finance 756,757 1.2314,971 Alibaba ADR 1,628,845 2.6558,900 Alibaba Group 843,105 1.37
826,250 A-Living Services 1,156,332 1.881,028,500 China Yongda Automobiles Services 1,120,247 1.83
18,980 Daqo New Energy 784,254 1.28147,965 Estun Automation 468,735 0.76228,000 Hainan Meilan International Airport 522,297 0.85672,700 Hebei Chengde Lolo 870,003 1.42
2,747 JD.com 82,080 0.13238,850 Jinke Smart Services Group 863,122 1.4135,923 Kingsoft Cloud 218,053 0.36
3,330,000 KWG Living Group 1,241,617 2.0297,499 Miniso Group 760,492 1.2472,554 Niu Technologies 700,872 1.14

74
TT INTERNATIONAL FUNDS PLC
STATEMENT OF INVESTMENTS – TT Asia Ex Japan Equity Fund (CONTINUED)As at 31 March 2022
Holdings Financial assets at fair value through profit or loss Fair Value
US$ % of
Net Assets
Equities: 77.44% (30 September 2021: 81.07%) (Continued) People’s Republic of China: 28.15% (30 September 2021: 34.16%) (Continued)
1,905,000 Powerlong Real Estate 503,531 0.827,289 Tencent 338,355 0.55
57,700 Tencent 2,757,022 4.491,184,272 Tongling Jingda Special Magnet Wire 973,819 1.59
Total People's Republic of China 17,286,100 28.15
Philippines: 0.92% (30 September 2021: 1.08%)
1,239,000 Century Pacific Food 562,692 0.92
Total Philippines 562,692 0.92
Republic of South Korea: 18.30% (30 September 2021: 14.64%)
11,561 Eugene Technology 461,658 0.7514,648 Hana Financial Group 587,346 0.966,146 Hansol Chemical 1,244,869 2.03
13,370 Hyundai Motor 2nd Pref 955,276 1.562,924 Hyundai Motor Pref Pref 207,952 0.343,818 LG Chemical Pref 859,960 1.409,270 Samsung Electro-Mechanics 1,261,953 2.05
38,271 Samsung Electronics 2,197,650 3.581,716 Samsung Electronics Pref 89,194 0.14
14,934 SK Hynix 1,453,910 2.378,433 SKC 1,074,954 1.75
212,308 Wonik 841,665 1.37
Total Republic of South Korea 11,236,387 18.30
Taiwan: 16.37% (30 September 2021: 15.24%)
14,510 AirTAC International Group 471,487 0.77137,000 Chicony Electronics 429,388 0.70145,000 Chroma ATE 910,947 1.4886,000 Elan Microelectronics 516,273 0.849,560 Sea 1,145,192 1.863,448 Taiwan Semiconductor Manufacturing ADR 359,488 0.58
200,000 Taiwan Semiconductor Manufacturing 4,167,321 6.7988,000 Unimicron Technology 764,777 1.2585,000 Yageo 1,287,542 2.10
Total Taiwan 10,052,415 16.37

74 75
TT INTERNATIONAL FUNDS PLC
STATEMENT OF INVESTMENTS – TT Asia Ex Japan Equity Fund (CONTINUED)As at 31 March 2022
Holdings Financial assets at fair value through profit or loss Fair Value
US$ % of
Net Assets
Equities: 77.44% (30 September 2021: 81.07%) (Continued)
Thailand: 0.00% (30 September 2021: 1.02%)
United Kingdom: 1.42% (30 September 2021: 0.89%)
58,217 Prudential 869,227 1.42
Total United Kingdom 869,227 1.42
Total Equities 47,545,129 77.44
Participatory Notes: 20.65% (30 September 2021: 18.62%)
Australia: 1.05% (30 September 2021: 0.87%)
298,880 Vietnam Technological & Commercial Joint Stock Bank 10/08/2022 648,388 1.05
Total Australia 648,388 1.05
India: 5.52% (30 September 2021: 4.91%)
554,146 CLSA Global Markets - Equitas Holdings 20/09/2024 778,839 1.27104,144 CLSA Global Markets - Gateway Distriparks Limited 23/03/2027 91,671 0.1534,041 CLSA Global Markets - IIFL Wealth Management 05/02/2026 749,733 1.2267,630 CLSA Global Markets - Nuvoco Vistas 25/08/2026 352,497 0.5721,714 Nomura Bank International - Home 1st Finance Co India 02/02/2026 220,493 0.3626,598 Normura Bank International - Larsen & Toubro 20/09/2024 620,468 1.01
265,535 Oil & Natural Gas 30/06/2024 574,348 0.94
Total India 3,388,049 5.52
People's Republic of China: 6.30% (30 September 2021: 5.42%)
117,896 Axis Bank 30/06/2025 1,184,250 1.9361,217 CLSA Global Markets - Chemplast Sanmar 24/08/2026 537,360 0.8771,070 JP Morgan - Guangdong Jia Yuan Technology 01/12/2022 1,023,961 1.6731,838 JP Morgan Structured Products 03/08/2022 605,630 0.99
163,868 JP Morgan Structured Products 10/11/2022 519,523 0.84
Total People's Republic of China 3,870,724 6.30
United Kingdom: 7.18% (30 September 2021: 7.42%)
757,944 Nomura Bank International 29/09/2023 667,171 1.095,004 Nomura Bank International 18/12/2023 110,210 0.18
1,117,296 Nomura Bank International - Equitas 30/12/2021 1,570,334 2.5678,803 Nomura Bank International - Home 1st Finance Co 03/02/2023 800,197 1.3015,775 Nomura Bank International - Nuvoco Vistas 23/08/2023 82,221 0.13
109,515 Nomura Bank International - Prestige Estates 24/02/2023 713,672 1.16345,289 Nomura Bank International - Ujjivan 14/07/2023 464,107 0.76
Total United Kingdom 4,407,912 7.18
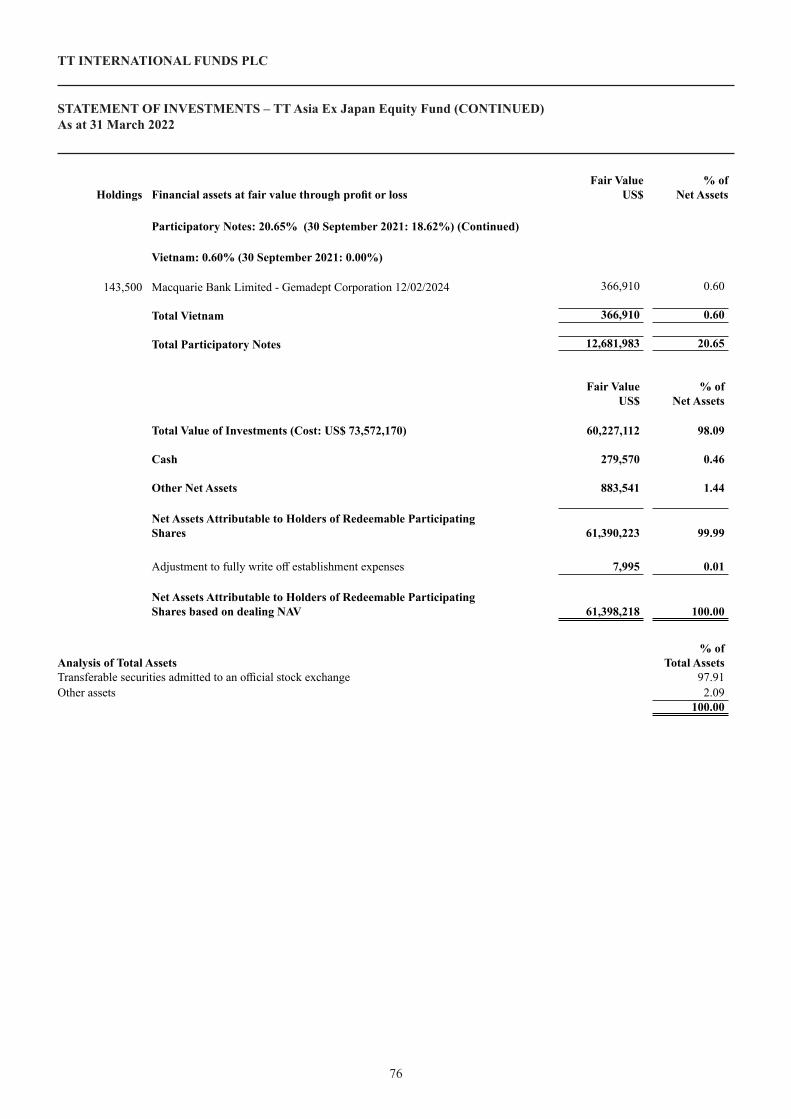
76
TT INTERNATIONAL FUNDS PLC
STATEMENT OF INVESTMENTS – TT Asia Ex Japan Equity Fund (CONTINUED)As at 31 March 2022
Holdings Financial assets at fair value through profit or loss Fair Value
US$ % of
Net Assets
Participatory Notes: 20.65% (30 September 2021: 18.62%) (Continued)
Vietnam: 0.60% (30 September 2021: 0.00%)
143,500 Macquarie Bank Limited - Gemadept Corporation 12/02/2024 366,910 0.60
Total Vietnam 366,910 0.60
Total Participatory Notes 12,681,983 20.65
Fair Value US$
% of Net Assets
Total Value of Investments (Cost: US$ 73,572,170) 60,227,112 98.09
Cash 279,570 0.46
Other Net Assets 883,541 1.44
Net Assets Attributable to Holders of Redeemable Participating Shares 61,390,223 99.99
Adjustment to fully write off establishment expenses 7,995 0.01
Net Assets Attributable to Holders of Redeemable Participating Shares based on dealing NAV 61,398,218 100.00
Analysis of Total Assets% of
Total AssetsTransferable securities admitted to an official stock exchange 97.91Other assets 2.09
100.00–

77
TT INTERNATIONAL FUNDS PLC
STATEMENT OF INVESTMENTS – TT European Opportunities Long/Short FundAs at 31 March 2022
Holdings Financial assets at fair value through profit or lossFair Value
US$% of
Net Assets Government Bonds: 27.34% (30 September 2021: 34.99%)
United States: 27.34% (30 September 2021: 34.99%)
7,000,000 United States Treasury Bill 0.00% 19/05/2022 6,997,721 5.487,000,000 United States Treasury Bill 0.00% 16/06/2022 6,993,941 5.487,000,000 United States Treasury Bill 0.00% 14/07/2022 6,987,816 5.477,000,000 United States Treasury Bill 0.00% 11/08/2022 6,978,825 5.467,000,000 United States Treasury Bill 0.00% 03/11/2022 6,957,433 5.45
Total United States 34,915,736 27.34
Total Government Bonds 34,915,736 27.34
Equities: 31.83% (30 September 2021: 35.32%)
Austria: 0.00% (30 September 2021: 0.59%)
Belgium: 0.00% (30 September 2021: 1.04%)
Denmark: 1.84% (30 September 2021: 4.37%)
9,744 Carlsberg 1,209,738 0.9565,112 Huscompagniet 1,137,574 0.89
Total Denmark 2,347,312 1.84
Finland: 2.71% (30 September 2021: 3.13%)
98,451 Nanoform Finland 458,979 0.3633,720 Neste 1,556,270 1.22
259,918 Nokia 1,441,795 1.13
Total Finland 3,457,044 2.71
France: 0.85% (30 September 2021: 0.50%)
33,169 ArcelorMittal 1,081,331 0.85
Total France 1,081,331 0.85
Germany: 10.46% (30 September 2021: 8.14%)
13,697 Bayerische Motoren Werke 1,197,861 0.9420,063 Brenntag 1,637,176 1.2882,707 Deutsche Telekom 1,558,149 1.2230,799 Infineon Technologies 1,061,810 0.8347,235 Instone Real Estate Group 890,299 0.709,537 KION Group 636,681 0.506,563 Merck 1,386,346 1.093,935 Porsche Automobil Pref 384,851 0.30
45,276 RWE 1,991,377 1.5610,371 SAP 1,166,853 0.9110,368 Siemens 1,449,608 1.13
Total Germany 13,361,011 10.46

78
TT INTERNATIONAL FUNDS PLC
STATEMENT OF INVESTMENTS – TT European Opportunities Long/Short Fund (CONTINUED)As at 31 March 2022
Holdings Financial assets at fair value through profit or loss Fair Value
US$ % of
Net Assets
Equities: 31.83% (30 September 2021: 35.32%) (Continued)
Greece: 2.67% (30 September 2021: 3.07%)
63,710 Hellenic Telecommunications Organization 1,162,546 0.9179,785 Jumbo 1,198,433 0.9471,867 OPAP 1,055,509 0.82
Total Greece 3,416,488 2.67
Luxembourg: 0.72% (30 September 2021: 0.40%)
27,736 Majorel Group 915,939 0.72
Total Luxembourg 915,939 0.72
Netherlands: 5.03% (30 September 2021: 1.93%)
133,593 ABN AMRO Bank 1,730,493 1.362,980 ASML 2,022,575 1.58
13,707 Heineken 1,320,440 1.0337,999 OCI 1,356,329 1.06
Total Netherlands 6,429,837 5.03
Norway: 0.00% (30 September 2021: 2.04%)
Sweden: 0.84% (30 September 2021: 7.39%)
57,101 AAK 1,072,244 0.84
Total Sweden 1,072,244 0.84
Switzerland: 3.86% (30 September 2021: 2.72%)
10,576 Compagnie Financiere Richemont 1,356,119 1.062,628 Lonza Group 1,919,632 1.504,155 Roche 1,654,550 1.30
Total Switzerland 4,930,301 3.86
United States: 2.85% (30 September 2021: 0.00%)
9,320 Herc Holdings 1,557,279 1.226,543 PolyPeptide Group 522,587 0.41
31,361 QIAGEN 1,553,821 1.22
Total United States 3,633,687 2.85
Total Equities 40,645,194 31.83

78 79
TT INTERNATIONAL FUNDS PLC
STATEMENT OF INVESTMENTS – TT European Opportunities Long/Short Fund (CONTINUED)As at 31 March 2022
Holdings Financial assets at fair value through profit or loss Fair Value
US$ % of
Net Assets
Investment Funds: 8.61% (30 September 2021: 7.15%)
Ireland: 8.61% (30 September 2021: 7.15%)
11,001,618 BlackRock ICS US Treasury Fund 11,001,618 8.61
Total Ireland 11,001,618 8.61
Total Investment Funds 11,001,618 8.61
Unrealised Gain US$
% of Net Assets
Contracts for Difference: 1.58% (30 September 2021: 1.75%)
Austria: 0.02% (30 September 2021: 0.06%)
(19,025) Voestalpine 31/12/2049 24,257 0.02
Total Austria 24,257 0.02
Belgium: 0.00% (30 September 2021: 0.05%)
Denmark: 0.15% (30 September 2021: 0.02%)
(14,344) Simcorp 31/12/2049 192,997 0.15
Total Denmark 192,997 0.15
France: 0.38% (30 September 2021: 0.14%)
4,509 Air Liquide 31/12/2049 46,721 0.046,654 Capgemini 31/12/2049 82,684 0.064,120 EssilorLuxottica 31/12/2049 63,875 0.052,006 LVMH Moet Hennessy Louis Vuitton 31/12/2049 76,237 0.06
17,237 Nexans 31/12/2049 66,010 0.056,113 Pernod Ricard 31/12/2049 72,844 0.064,765 Teleperformance 31/12/2049 30,560 0.02
42,551 Veolia Environnement 31/12/2049 45,333 0.04
Total France 484,264 0.38
Germany: 0.11% (30 September 2021: 0.05%)
(10,683) HeidelbergCement 31/12/2049 122,908 0.10(7,446) Zalando 31/12/2049 15,101 0.01
Total Germany 138,009 0.11
Ireland: 0.08% (30 September 2021: 0.31%)
249,492 Bank of Ireland Group 31/12/2049 19,324 0.01169,073 Dalata Hotel Group 31/12/2049 84,722 0.07
Total Ireland 104,046 0.08

80
TT INTERNATIONAL FUNDS PLC
STATEMENT OF INVESTMENTS – TT European Opportunities Long/Short Fund (CONTINUED)As at 31 March 2022
Holdings Financial assets at fair value through profit or loss
Unrealised Gain US$
% of Net Assets
Contracts for Difference: 1.58% (30 September 2021: 1.75%) (Continued)
Netherlands: 0.03% (30 September 2021: 0.30%)
11,212 Airbus 31/12/2049 41,790 0.03
Total Netherlands 41,790 0.03
Spain: 0.13% (30 September 2021: 0.07%)
20,780 Corporacion Acciona Energias Renovables 31/12/2049 96,560 0.07(31,979) Ferrovial 31/12/2049 33,810 0.03163,304 Iberdrola 31/12/2049 36,163 0.03
Total Spain 166,533 0.13
Sweden: 0.18% (30 September 2021: 0.01%)
17,220 Getinge 31/12/2049 37,724 0.03(84,291) Volvo 31/12/2049 183,529 0.15
Total Sweden 221,253 0.18
Switzerland: 0.06% (30 September 2021: 0.05%)
(18,474) Abb 31/12/2049 43,753 0.0439,423 Coca-Cola HBC 31/12/2049 30,260 0.02
Total Switzerland 74,013 0.06
United Kingdom: 0.44% (30 September 2021: 0.69%)
7,478 Astrazeneca 31/12/2049 158,239 0.1215,046 Diageo 31/12/2049 33,801 0.0340,245 GVC Holdings 31/12/2049 19,786 0.0141,316 Johnson Matthey 31/12/2049 24,793 0.02
(221,163) Kingfisher 31/12/2049 178,996 0.14118,263 Renewi 31/12/2049 63,759 0.05(36,967) Weir Group 31/12/2049 87,936 0.07
Total United Kingdom 567,310 0.44
Total Contracts for Difference 2,014,472 1.58
Financial liabilities at fair value through profit or loss
Unrealised (Loss)
US$
% of Net Assets
Contracts for Difference: (1.09%) (30 September 2021: (0.92%))
Denmark: (0.01%) (30 September 2021: 0.00%)
(6,768) Pandora 31/12/2049 (10,060) (0.01)
Total Denmark (10,060) (0.01)
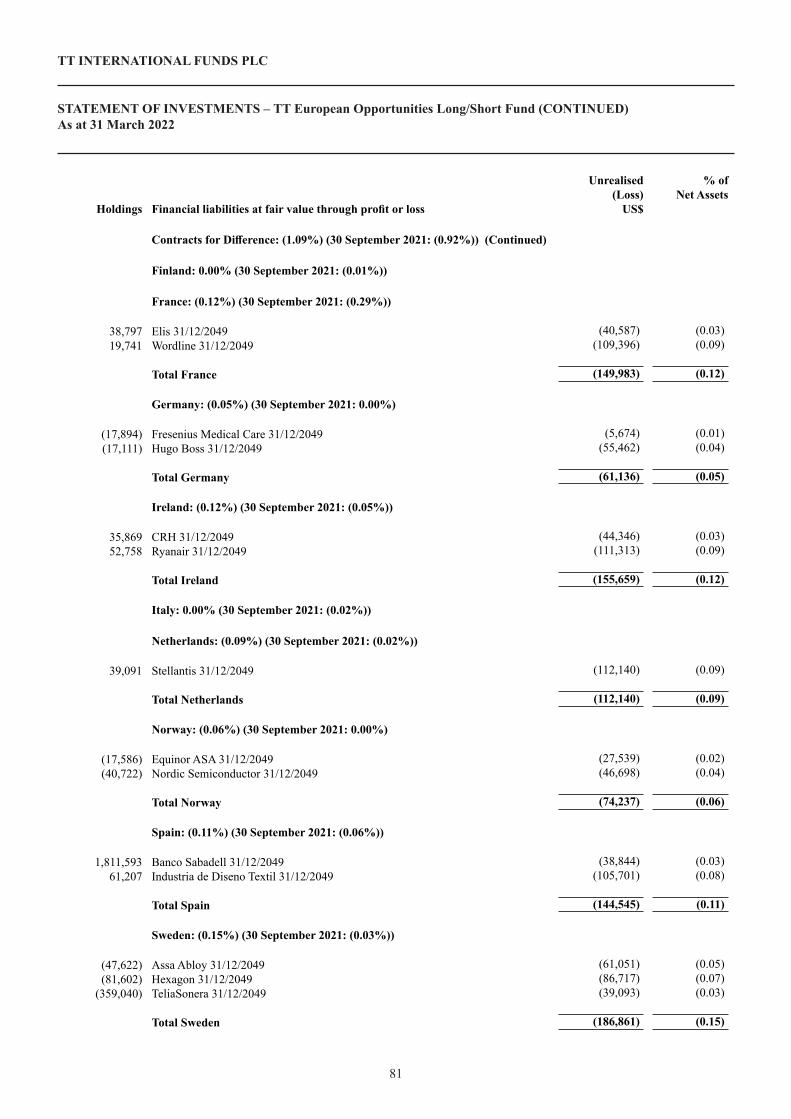
80 81
TT INTERNATIONAL FUNDS PLC
STATEMENT OF INVESTMENTS – TT European Opportunities Long/Short Fund (CONTINUED)As at 31 March 2022
Holdings Financial liabilities at fair value through profit or loss
Unrealised (Loss)
US$
% of Net Assets
Contracts for Difference: (1.09%) (30 September 2021: (0.92%)) (Continued)
Finland: 0.00% (30 September 2021: (0.01%))
France: (0.12%) (30 September 2021: (0.29%))
38,797 Elis 31/12/2049 (40,587) (0.03)19,741 Wordline 31/12/2049 (109,396) (0.09)
Total France (149,983) (0.12)
Germany: (0.05%) (30 September 2021: 0.00%)
(17,894) Fresenius Medical Care 31/12/2049 (5,674) (0.01)(17,111) Hugo Boss 31/12/2049 (55,462) (0.04)
Total Germany (61,136) (0.05)
Ireland: (0.12%) (30 September 2021: (0.05%))
35,869 CRH 31/12/2049 (44,346) (0.03)52,758 Ryanair 31/12/2049 (111,313) (0.09)
Total Ireland (155,659) (0.12)
Italy: 0.00% (30 September 2021: (0.02%))
Netherlands: (0.09%) (30 September 2021: (0.02%))
39,091 Stellantis 31/12/2049 (112,140) (0.09)
Total Netherlands (112,140) (0.09)
Norway: (0.06%) (30 September 2021: 0.00%)
(17,586) Equinor ASA 31/12/2049 (27,539) (0.02)(40,722) Nordic Semiconductor 31/12/2049 (46,698) (0.04)
Total Norway (74,237) (0.06)
Spain: (0.11%) (30 September 2021: (0.06%))
1,811,593 Banco Sabadell 31/12/2049 (38,844) (0.03)61,207 Industria de Diseno Textil 31/12/2049 (105,701) (0.08)
Total Spain (144,545) (0.11)
Sweden: (0.15%) (30 September 2021: (0.03%))
(47,622) Assa Abloy 31/12/2049 (61,051) (0.05)(81,602) Hexagon 31/12/2049 (86,717) (0.07)
(359,040) TeliaSonera 31/12/2049 (39,093) (0.03)
Total Sweden (186,861) (0.15)

82
TT INTERNATIONAL FUNDS PLC
STATEMENT OF INVESTMENTS – TT European Opportunities Long/Short Fund (CONTINUED)As at 31 March 2022
Holdings Financial liabilities at fair value through profit or loss
Unrealised (Loss)
US$
% of Net Assets
Contracts for Difference: (1.09%) (30 September 2021: (0.92%)) (Continued)
Switzerland: 0.00% (30 September 2021: (0.05%))
United Kingdom: (0.38%) (30 September 2021: (0.39%))
17,775 Ashtead Group 31/12/2049 (51,412) (0.04)495,456 Barclays 31/12/2049 (17,759) (0.01)(95,021) Beazley 31/12/2049 (17,469) (0.01)
47,599 Compass Group 31/12/2049 (55,296) (0.04)68,451 Dart Group 31/12/2049 (84,922) (0.07)63,730 Marlowe 31/12/2049 (55,692) (0.04)
281,242 National Express Group 31/12/2049 (98,071) (0.08)38,974 Whitbread 31/12/2049 (108,176) (0.09)
Total United Kingdom (488,797) (0.38)
Total Contracts for Difference (1,383,418) (1.09)
Futures Contracts: (0.11%) (30 September 2021: 0.44%)
Counterparty Description Country Currency No. of Contracts
Unrealised (Loss)
US$
% of Net Assets
Northern TrustEurex E-Stoxx 50 Index June 22 17/06/2022 Germany GBP (1,036) (164,533) (0.13)
Northern TrustEurex DAX Index Future Jun 22 17/06/2022 Germany GBP (9) 22,392 0.02
Total Futures Contracts (142,141) (0.11)
Forward Foreign Currency Contracts: (0.38%) (30 September 2021: 0.48%)
BrokerCurrency Bought
Amount Currency Bought
Currency Sold
Amount Currency
SoldCurrency
RateMaturity
DateUnrealised
Gain/(Loss)% of
Net AssetsUS$
Northern Trust EUR 33,634,680 USD 37,376,942 0.8999 29/04/2022 69,949 0.06Northern Trust GBP 13,318,489 USD 17,492,397 0.7614 29/04/2022 41,099 0.03Northern Trust EUR 1,715,047 USD 1,905,867 0.8999 29/04/2022 3,567 –Northern Trust USD 1,566,280 EUR 1,403,400 1.1161 20/05/2022 2,630 –Northern Trust GBP 834,700 USD 1,096,217 0.7614 20/05/2022 2,543 –Northern Trust USD 977,277 DKK 6,509,900 0.1501 20/05/2022 2,169 –Northern Trust EUR 349,967 USD 388,957 0.8998 29/04/2022 675 –Northern Trust GBP 190,361 USD 250,056 0.7613 29/04/2022 549 –Northern Trust EUR 14,923 USD 16,584 0.8999 29/04/2022 31 –Northern Trust GBP 10,000 USD 13,134 0.7614 29/04/2022 31 –Northern Trust EUR 2,931 USD 3,258 0.8998 29/04/2022 6 –Northern Trust EUR 532 USD 592 0.8981 29/04/2022 – –Northern Trust EUR 118 USD 132 0.8950 29/04/2022 – –Northern Trust USD 29 GBP 22 1.3137 29/04/2022 – –Northern Trust EUR 104,320 USD 116,565 0.8949 29/04/2022 (422) –Northern Trust NOK 2,578,800 USD 297,852 8.6580 20/05/2022 (3,056) –Northern Trust USD 808,015 SEK 7,657,700 0.1055 20/05/2022 (14,400) (0.01)Northern Trust USD 1,713,704 DKK 11,588,100 0.1479 20/05/2022 (22,059) (0.02)Northern Trust USD 5,288,374 CHF 4,934,000 1.0718 20/05/2022 (81,702) (0.06)

82 83
TT INTERNATIONAL FUNDS PLC
STATEMENT OF INVESTMENTS – TT European Opportunities Long/Short Fund (CONTINUED)As at 31 March 2022
Forward Foreign Currency Contracts: (0.38%) (30 September 2021: 0.48%) (Continued)
Broker Currency Bought
Amount Currency Bought
Currency Sold
Amount Currency
SoldCurrency
RateMaturity
DateUnrealised
Gain/(Loss) % of
Net Assets US$ Northern Trust USD 33,885,054 EUR 30,850,000 1.0984 20/05/2022 (487,609) (0.38)
Total Unrealised Losses on Forward Foreign Currency Contracts (485,999) (0.38)
Total Forward Foreign Currency Contracts (485,999) (0.38)
Fair Value US$
% of Net Assets
Total Value of Investments (Cost: US$ 124,885,128) 86,565,462 67.78
Cash 13,155,453 10.30
Margin and Collateral Cash 27,335,975 21.40
Other Net Assets 606,883 0.48
Net Assets Attributable to Holders of Redeemable Participating Shares 127,663,773 99.96
Adjustment to fully write off establishment expenses 48,399 0.04
Net Assets Attributable to Holders of Redeemable Participating Shares based on dealing NAV 127,712,172 100.00
Analysis of Total Assets% of
Total AssetsInvestment Funds 8.38Transferable securities admitted to an official stock exchange 30.96Transferable securities dealt in a regulated market 26.60Financial derivative instruments traded on regulated market 0.02Over the counter financial derivative instruments 1.63Other assets 32.41
100.00–

8584
TT INTERNATIONAL FUNDS PLC
STATEMENT OF INVESTMENTS – TT Environmental Solutions FundAs at 31 March 2022
Holdings Financial assets at fair value through profit or lossFair Value
US$% of
Net Assets Equities: 69.45% (30 September 2021: 82.00%)
Brazil: 4.51% (30 September 2021: 2.68%)
1,257,978 Omega Energia S.A. 3,166,156 4.51
Total Brazil 3,166,156 4.51
Denmark: 1.48% (30 September 2021: 3.17%)
34,769 Vestas Wind Systems 1,038,855 1.48
Total Denmark 1,038,855 1.48
France: 3.39% (30 September 2021: 3.09%)
25,157 Nexans 2,380,629 3.39
Total France 2,380,629 3.39
Germany: 5.16% (30 September 2021: 9.00%)
35,018 Knorr-Bremse 2,713,368 3.874,648 KWS Saat SE 339,774 0.485,549 STEICO 569,869 0.81
Total Germany 3,623,011 5.16
Greece: 0.73% (30 September 2021: 3.48%)
27,688 Terna Energy 511,397 0.73
Total Greece 511,397 0.73
India: 2.91% (30 September 2021: 2.32%)
248,371 Renew Energy Global 2,041,610 2.91
Total India 2,041,610 2.91
Ireland: 1.08% (30 September 2021: 4.56%)
16,772 Smurfit Kappa Group 754,852 1.08
Total Ireland 754,852 1.08
Italy: 5.11% (30 September 2021: 0.00%)
414,461 Terna S.p.A. 3,590,514 5.11
Total Italy 3,590,514 5.11
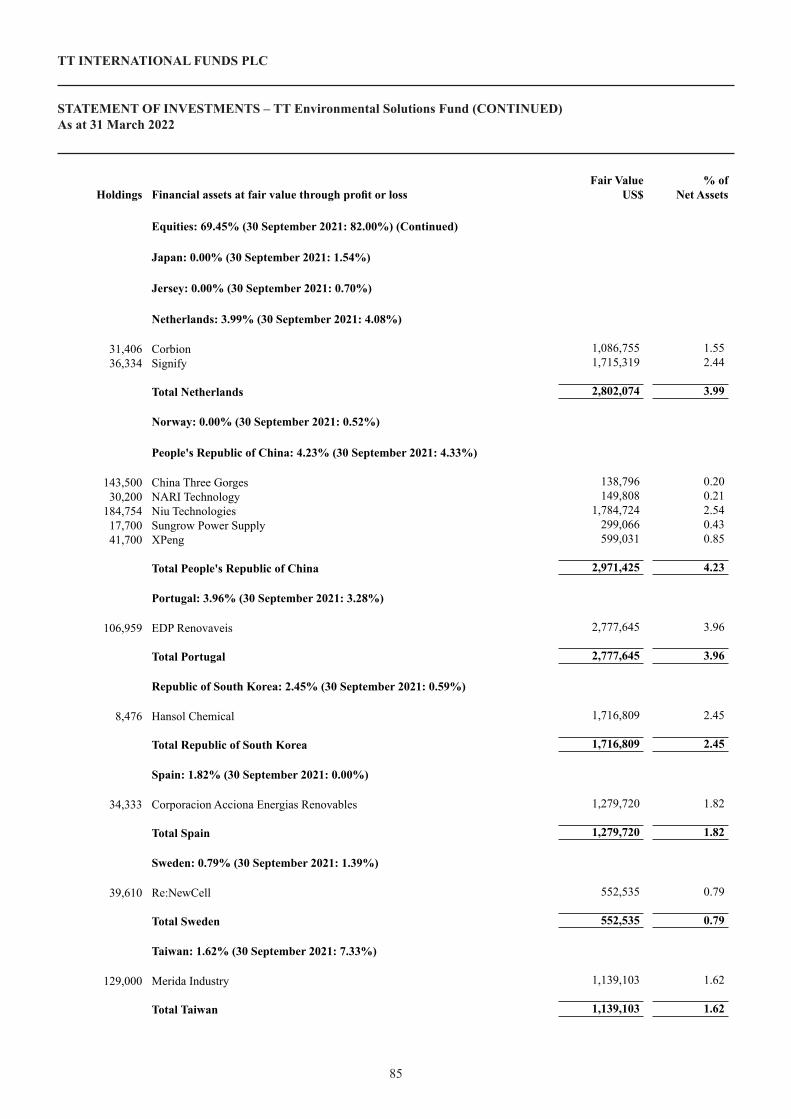
85
TT INTERNATIONAL FUNDS PLC
STATEMENT OF INVESTMENTS – TT Environmental Solutions Fund (CONTINUED)As at 31 March 2022
84
Holdings Financial assets at fair value through profit or loss Fair Value
US$ % of
Net Assets
Equities: 69.45% (30 September 2021: 82.00%) (Continued)
Japan: 0.00% (30 September 2021: 1.54%)
Jersey: 0.00% (30 September 2021: 0.70%)
Netherlands: 3.99% (30 September 2021: 4.08%)
31,406 Corbion 1,086,755 1.5536,334 Signify 1,715,319 2.44
Total Netherlands 2,802,074 3.99
Norway: 0.00% (30 September 2021: 0.52%)
People's Republic of China: 4.23% (30 September 2021: 4.33%)
143,500 China Three Gorges 138,796 0.2030,200 NARI Technology 149,808 0.21
184,754 Niu Technologies 1,784,724 2.5417,700 Sungrow Power Supply 299,066 0.4341,700 XPeng 599,031 0.85
Total People's Republic of China 2,971,425 4.23
Portugal: 3.96% (30 September 2021: 3.28%)
106,959 EDP Renovaveis 2,777,645 3.96
Total Portugal 2,777,645 3.96
Republic of South Korea: 2.45% (30 September 2021: 0.59%)
8,476 Hansol Chemical 1,716,809 2.45
Total Republic of South Korea 1,716,809 2.45
Spain: 1.82% (30 September 2021: 0.00%)
34,333 Corporacion Acciona Energias Renovables 1,279,720 1.82
Total Spain 1,279,720 1.82
Sweden: 0.79% (30 September 2021: 1.39%)
39,610 Re:NewCell 552,535 0.79
Total Sweden 552,535 0.79
Taiwan: 1.62% (30 September 2021: 7.33%)
129,000 Merida Industry 1,139,103 1.62
Total Taiwan 1,139,103 1.62

86
TT INTERNATIONAL FUNDS PLC
STATEMENT OF INVESTMENTS – TT Environmental Solutions Fund (CONTINUED)As at 31 March 2022
Holdings Financial assets at fair value through profit or loss Fair Value
US$ % of
Net Assets
Equities: 69.45% (30 September 2021: 82.00%) (Continued)
United Kingdom: 5.26% (30 September 2021: 8.15%)
220,428 Accsys Technologies 420,829 0.60645,539 Agronomics Limited 163,190 0.23
2,408,235 Agronomics Limited Rights 155,287 0.2254,594 Ceres Power 530,483 0.7664,866 Renewi 577,385 0.82
177,610 Smart Metering Systems 1,845,078 2.63
Total United Kingdom 3,692,252 5.26
United States: 20.96% (30 September 2021: 21.79%)
9,231 Advanced Drainage Systems 1,096,735 1.5615,389 Befesa 1,222,552 1.74
110,591 Eneti 702,253 1.0020,616 Evoqua Water Technologies 968,540 1.386,737 Installed Building Products 569,209 0.819,958 Lindsay 1,563,506 2.23
43,023 Oatly 215,545 0.3114,443 ON Semiconductor 904,276 1.2918,007 Owens Corning 1,647,640 2.3558,971 Planet Labs PBC 299,573 0.4359,584 Plug Power 1,704,698 2.433,081 SolarEdge Technologies 993,222 1.41
66,313 Stem 730,106 1.0455,262 Weyerhaeuser 2,094,430 2.98
Total United States 14,712,285 20.96
Total Equities 48,750,872 69.45
Investment Funds: 0.00% (30 September 2021: 2.24%)
Germany: 0.00% (30 September 2021: 2.24%)
Participatory Notes: 13.34% (30 September 2021: 8.25%)
Hong Kong: 1.81% (30 September 2021: 0.00%)
256,700 CICC Financial Trading - NARI Technology 11/03/2025 1,273,371 1.81
Total Hong Kong 1,273,371 1.81
People's Republic of China: 11.53% (30 September 2021: 5.28%)
1,026,400 CICC Financial Trading - China Three Gorges 04/11/2024 993,536 1.4218,500 CICC Financial Trading - Sungrow Power 17/05/2025 312,583 0.45
2,580,300 JP Morgan - China Three Gorges 09/11/2022 2,497,681 3.564,700 JP Morgan - Contemporary Amperex Technology 08/07/2022 379,296 0.54
81,607 JP Morgan - Guangdong Jia Yuan Technology 01/12/2022 1,175,776 1.67159,947 JP Morgan - NARI Technology 02/06/2022 793,423 1.1344,600 JP Morgan - Sungrow Power Supply 02/06/2022 753,579 1.07

86 87
TT INTERNATIONAL FUNDS PLC
STATEMENT OF INVESTMENTS – TT Environmental Solutions Fund (CONTINUED)As at 31 March 2022
Holdings Financial assets at fair value through profit or loss Fair Value
US$ % of
Net Assets
Participatory Notes: 13.34% (30 September 2021: 8.25%) (Continued)
People’s Republic of China: 11.53% (30 September 2021: 5.28%) (Continued)
62,424 JP Morgan Structured Products 03/08/2022 1,187,445 1.69
Total People's Republic of China 8,093,319 11.53
United States: 0.00% (30 September 2021: 2.97%)
Total Participatory Notes 9,366,690 13.34
Warrants: 0.23% (30 September 2021: 0.50%)
India: 0.08% (30 September 2021: 0.09%)
31,938 Renew Energy Global 23/08/2026 57,489 0.08
Total India 57,489 0.08
United Kingdom: 0.15% (30 September 2021: 0.41%)
2,136,556 Agronomics Limited 31/12/2040 103,547 0.15
Total United Kingdom 103,547 0.15
Total Warrants 161,036 0.23
Forward Foreign Currency Contracts: (0.15%) (30 September 2021: 0.16%)
BrokerCurrency Bought
Amount Currency Bought
Currency Sold
Amount Currency
SoldCurrency
RateMaturity
DateUnrealised
Gain/(Loss)% of
Net AssetsUS$
Northern Trust USD 874,710 GBP 663,000 1.3193 12/05/2022 1,945 –Royal Bank of Canada USD 8,813,675 EUR 8,007,300 1.1007 12/05/2022 (105,023) (0.15)
Total Unrealised Losses on Forward Foreign Currency Contracts (103,078) (0.15)
Total Forward Foreign Currency Contracts (103,078) (0.15)

88
TT INTERNATIONAL FUNDS PLC
STATEMENT OF INVESTMENTS – TT Environmental Solutions Fund (CONTINUED)As at 31 March 2022
Fair Value US$
% of Net Assets
Total Value of Investments (Cost: US$ 64,344,554) 58,175,520 82.87
Cash 13,038,980 18.57
Other Net Liabilities (1,045,815) (1.49)
Net Assets Attributable to Holders of Redeemable Participating Shares 70,168,685 99.95
Adjustment to fully write off establishment expenses 34,248 0.05
Net Assets Attributable to Holders of Redeemable Participating Shares based on dealing NAV 70,202,933 100.00
Analysis of Total Assets% of
Total AssetsTransferable securities admitted to an official stock exchange 80.96Other assets 19.04
100.00–

89
TT INTERNATIONAL FUNDS PLC
STATEMENT OF CHANGES IN THE PORTFOLIO – TT UK Equity FundFor the six months ended 31 March 2022
Listed below are the largest cumulative investment purchases greater than 1% for the six months ended 31 March 2022.
Security Units Acquisition Cost £
Compass Group 3,026 49,486Phoenix Group 6,381 42,630Tesco 13,632 39,559Royal Dutch Shell 2,180 36,217Whitbread 1,040 31,698AstraZeneca 367 31,634Beiersdorf 375 28,740BP 7,663 28,565NatWest Group 11,538 27,331JET2 2,154 25,125Kingspan Group 292 21,185Shell 988 20,052SSE 1,193 19,204Pernod Ricard 104 16,588British American Tobacco 535 16,200Ryanair Holdings 1,159 16,101Glencore 3,678 15,179Weir Group 786 13,571Serco Group 9,265 13,478Reckitt Benckiser Group 211 12,730Prudential 960 11,330Telecom Plus 709 10,654RWS 1,995 10,514Cairn Homes 10,511 10,501Watches of Switzerland Group 832 9,407Bank of Ireland Group 2,026 8,915Dalata Hotel Group 1,836 6,607
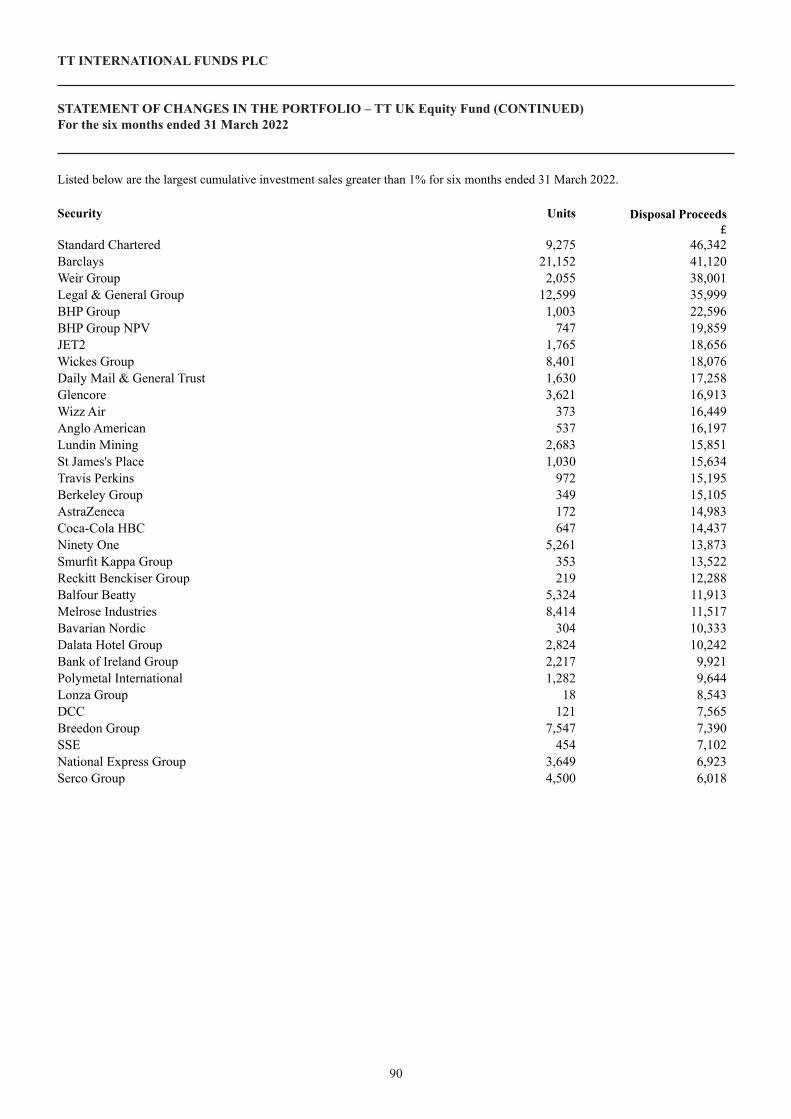
90
TT INTERNATIONAL FUNDS PLC
STATEMENT OF CHANGES IN THE PORTFOLIO – TT UK Equity Fund (CONTINUED)For the six months ended 31 March 2022
Listed below are the largest cumulative investment sales greater than 1% for six months ended 31 March 2022.
Security Units Disposal Proceeds £
Standard Chartered 9,275 46,342Barclays 21,152 41,120Weir Group 2,055 38,001Legal & General Group 12,599 35,999BHP Group 1,003 22,596BHP Group NPV 747 19,859JET2 1,765 18,656Wickes Group 8,401 18,076Daily Mail & General Trust 1,630 17,258Glencore 3,621 16,913Wizz Air 373 16,449Anglo American 537 16,197Lundin Mining 2,683 15,851St James's Place 1,030 15,634Travis Perkins 972 15,195Berkeley Group 349 15,105AstraZeneca 172 14,983Coca-Cola HBC 647 14,437Ninety One 5,261 13,873Smurfit Kappa Group 353 13,522Reckitt Benckiser Group 219 12,288Balfour Beatty 5,324 11,913Melrose Industries 8,414 11,517Bavarian Nordic 304 10,333Dalata Hotel Group 2,824 10,242Bank of Ireland Group 2,217 9,921Polymetal International 1,282 9,644Lonza Group 18 8,543DCC 121 7,565Breedon Group 7,547 7,390SSE 454 7,102National Express Group 3,649 6,923Serco Group 4,500 6,018

91
TT INTERNATIONAL FUNDS PLC
STATEMENT OF CHANGES IN THE PORTFOLIO – TT Asia-Pacific Equity FundFor the six months ended 31 March 2022
Listed below are the largest cumulative investment purchases greater than 1% for the six months ended 31 March 2022.
Security Units Acquisition Cost US$
Axis Bank 563,467 5,198,962Samsung Electro-Mechanics 33,496 4,610,760JP Morgan - Guangdong Jia Yuan Technology 214,888 4,454,640Pharmaron Beijing 227,500 4,250,764Tongling Jingda Special Magnet Wire 3,580,209 3,771,195SKC 25,381 3,597,221Sea 30,623 3,360,358Hansol Chemical 12,784 2,855,120ASE Technology 779,000 2,793,295Chemplast Sanmar 343,175 2,727,466Alibaba 22,183 2,699,263Unimicron Technology 450,000 2,674,070Petronas Chemicals Group 1,142,500 2,623,578Prudential 177,966 2,503,053A-Living Services 984,000 2,387,637Hana Financial Group 53,891 2,189,992Taiwan Semiconductor Manufacturing 97,000 2,103,035Santos 349,919 2,081,586Hebei Chengde Lolo 1,271,200 2,055,684LOTTE Fine Chemical 30,641 2,047,213IIFL Wealth Management 99,098 1,943,256Chalice Mining 359,560 1,934,677Elan Microelectronics 320,000 1,929,385Tencent 36,357 1,923,612Oil & Natural Gas 805,220 1,881,477Larsen & Toubro 80,656 1,869,970JP Morgan Structured Products 469,900 1,794,059JP Morgan Structured Products 61,275 1,740,577Niu Technologies 121,132 1,715,639China Yongda Automobiles Services 1,333,000 1,713,762Jinke Smart Services Group 343,500 1,609,879KWG Living Group 2,687,000 1,418,359Powerlong Real Estate 2,133,000 1,405,293Yageo 88,000 1,305,272Alibaba Group 98,800 1,293,294Estun Automation 371,000 1,241,989Eugene Technology 34,831 1,225,074Gateway Distriparks 330,767 1,136,092Taiwan Semiconductor Manufacturing 10,445 1,077,901

92
TT INTERNATIONAL FUNDS PLC
STATEMENT OF CHANGES IN THE PORTFOLIO – TT Asia-Pacific Equity Fund (CONTINUED)For the six months ended 31 March 2022
Listed below are the largest cumulative investment sales greater than 1% for six months ended 31 March 2022.
Security Units Disposal Proceeds US$
Delta Electronics 789,000 7,370,471Axis Bank 633,249 6,313,113Karoon Gas Australia 3,802,390 5,219,036OZ Minerals 236,861 4,647,804ASE Technology 1,255,000 4,573,108Chroma ATE 540,000 3,898,974Home First Finance Co India 371,146 3,761,646SK Hynix 36,487 3,687,089Eugene Technology 81,275 3,518,222Pharmaron Beijing 227,500 3,031,103Noah 83,217 2,919,217CLSA Global Markets - Chemplast Sanmar 304,568 2,863,765Siam Cement 225,800 2,595,917Zhejiang Sanhua Intelligent Controls 582,800 2,205,832Chalice Mining 347,750 2,174,590Beijing Jingyuntong Technology 1,100,200 1,963,955China Youran Dairy Group 3,524,000 1,950,890Sinoma Science & Technology 322,000 1,949,847LOTTE Fine Chemical 30,641 1,910,392Equitas 1,198,596 1,883,756DL E&C 18,660 1,792,249Phoenix Mills 130,170 1,751,137Renew Energy Global 206,386 1,691,691Prestige Estates Projects 260,598 1,672,858Unimicron Technology 185,000 1,472,003Dairy Farm International 513,500 1,418,404Chicony Electronics 462,000 1,391,327Miniso Group 84,299 1,378,444Taiwan Semiconductor Manufacturing 63,000 1,299,577AirTAC International Group 38,000 1,282,474IIFL Wealth Management 58,136 1,238,172Yageo 72,000 1,228,345Robinsons Retail 1,045,780 1,226,323JP Morgan Structured Products 31,811 1,206,431Prudential 59,545 1,193,458Chemplast Sanmar 157,639 1,186,276Samsung Electronics 17,916 1,133,591

93
TT INTERNATIONAL FUNDS PLC
STATEMENT OF CHANGES IN THE PORTFOLIO – TT Emerging Markets Equity FundFor the six months ended 31 March 2022
Listed below are the largest cumulative investment purchases greater than 1% for the six months ended 31 March 2022.
Security Units Acquisition Cost US$
Alibaba 348,669 40,515,221 Prudential 1,330,079 21,624,531 China Three Gorges Renewables 17,520,200 18,827,474 Tencent 309,000 18,773,841 Tencent 315,253 18,713,801 Globant 67,206 17,820,507 Barrick Gold 703,368 17,452,336 Wuliangye Yibin 512,100 17,290,062 Yunnan Energy New Material 388,800 17,206,342 Pinduoduo 179,463 16,412,609 Glencore 3,138,171 16,099,471 Guangdong Jia Yuan Technology Shares 706,174 15,328,823 Yandex 219,130 14,804,709 Sberbank Of Russia 2,779,150 14,503,093 HSBC Bank 2,360,055 13,281,254 Hong Kong Exchanges & Clearing 211,900 12,521,039 Petroleo Brasileiro 1,032,253 12,416,337 Yunnan Aluminium 5,249,100 12,238,038 Midea 1,039,100 12,036,614 Pharmaron Beijing 472,100 11,495,640 SKC 74,217 10,963,779 Emaar Properties 7,692,945 10,599,535 XP 357,156 10,520,747 Cosan 2,330,600 10,175,980 Alibaba Group 666,300 10,091,984 POSCO 42,548 10,073,394 Banco Bradesco 2,527,448 9,706,345 Taiwan Semiconductor Manufacturing 429,000 9,635,560 IndusInd Bank 760,023 9,595,362 Gazprom 1,963,650 8,868,827 Hansol Chemical 46,546 8,455,429 Meituan Dianping 403,000 8,251,675 Sany Heavy Industry 2,788,700 7,804,786 Saudi Telecom 255,969 7,640,660 Piramal Enterprises 221,024 7,451,519 NARI Technology 1,445,130 7,379,094 China Resources Beer 1,044,000 6,670,560 Sea 68,946 6,386,383
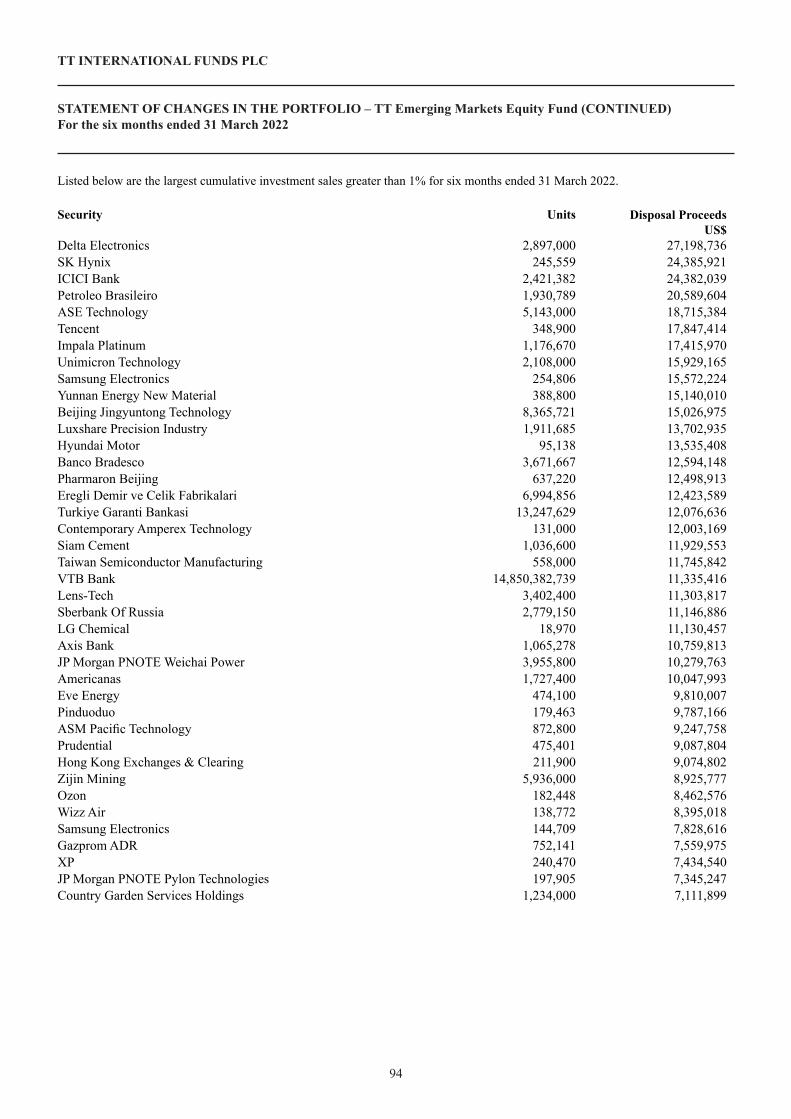
94
TT INTERNATIONAL FUNDS PLC
STATEMENT OF CHANGES IN THE PORTFOLIO – TT Emerging Markets Equity Fund (CONTINUED)For the six months ended 31 March 2022
Listed below are the largest cumulative investment sales greater than 1% for six months ended 31 March 2022.
Security Units Disposal Proceeds US$
Delta Electronics 2,897,000 27,198,736SK Hynix 245,559 24,385,921ICICI Bank 2,421,382 24,382,039Petroleo Brasileiro 1,930,789 20,589,604ASE Technology 5,143,000 18,715,384Tencent 348,900 17,847,414Impala Platinum 1,176,670 17,415,970Unimicron Technology 2,108,000 15,929,165Samsung Electronics 254,806 15,572,224Yunnan Energy New Material 388,800 15,140,010Beijing Jingyuntong Technology 8,365,721 15,026,975Luxshare Precision Industry 1,911,685 13,702,935Hyundai Motor 95,138 13,535,408Banco Bradesco 3,671,667 12,594,148Pharmaron Beijing 637,220 12,498,913Eregli Demir ve Celik Fabrikalari 6,994,856 12,423,589Turkiye Garanti Bankasi 13,247,629 12,076,636Contemporary Amperex Technology 131,000 12,003,169Siam Cement 1,036,600 11,929,553Taiwan Semiconductor Manufacturing 558,000 11,745,842VTB Bank 14,850,382,739 11,335,416Lens-Tech 3,402,400 11,303,817Sberbank Of Russia 2,779,150 11,146,886LG Chemical 18,970 11,130,457Axis Bank 1,065,278 10,759,813JP Morgan PNOTE Weichai Power 3,955,800 10,279,763Americanas 1,727,400 10,047,993Eve Energy 474,100 9,810,007Pinduoduo 179,463 9,787,166ASM Pacific Technology 872,800 9,247,758Prudential 475,401 9,087,804Hong Kong Exchanges & Clearing 211,900 9,074,802Zijin Mining 5,936,000 8,925,777Ozon 182,448 8,462,576Wizz Air 138,772 8,395,018Samsung Electronics 144,709 7,828,616Gazprom ADR 752,141 7,559,975XP 240,470 7,434,540JP Morgan PNOTE Pylon Technologies 197,905 7,345,247Country Garden Services Holdings 1,234,000 7,111,899
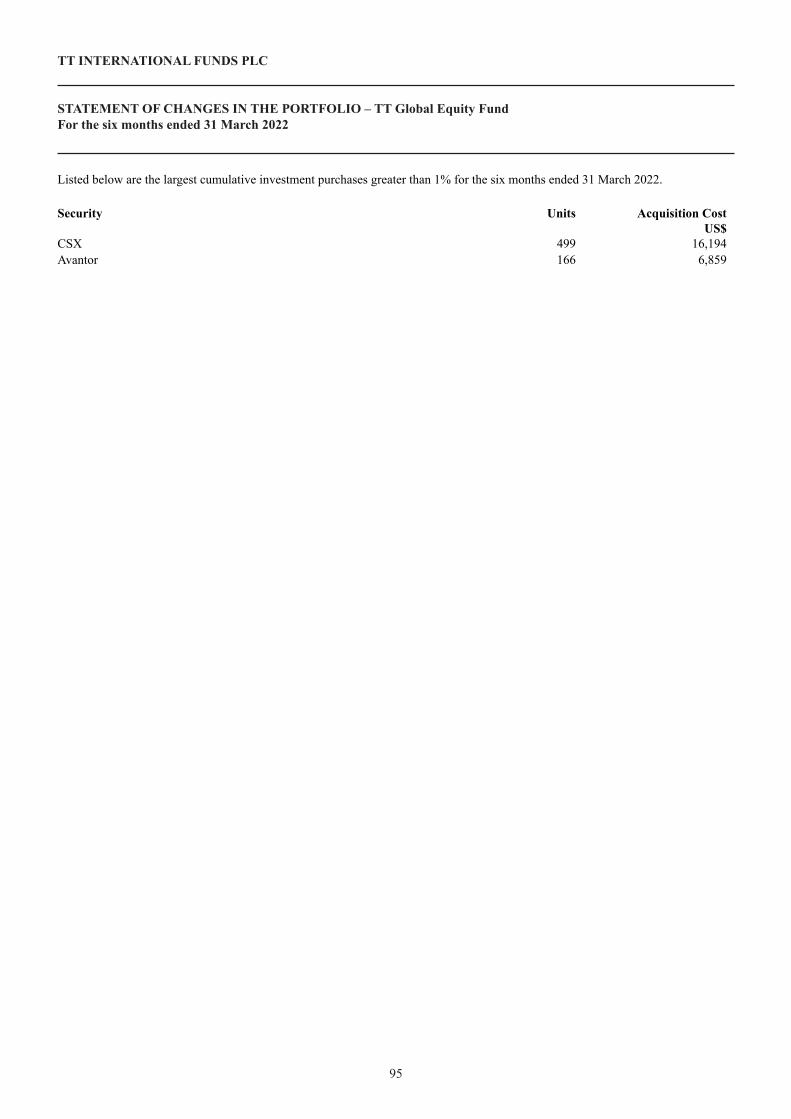
95
TT INTERNATIONAL FUNDS PLC
STATEMENT OF CHANGES IN THE PORTFOLIO – TT Global Equity FundFor the six months ended 31 March 2022
Listed below are the largest cumulative investment purchases greater than 1% for the six months ended 31 March 2022.
Security Units Acquisition Cost US$
CSX 499 16,194Avantor 166 6,859
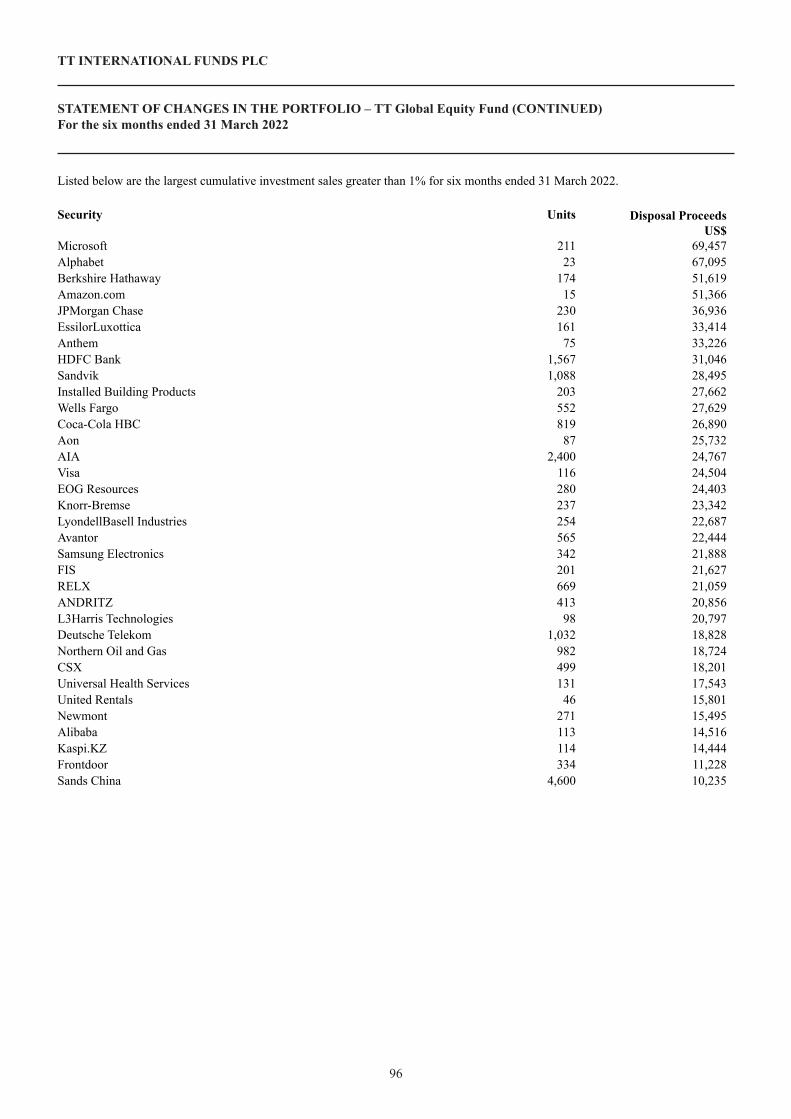
96
TT INTERNATIONAL FUNDS PLC
STATEMENT OF CHANGES IN THE PORTFOLIO – TT Global Equity Fund (CONTINUED)For the six months ended 31 March 2022
Listed below are the largest cumulative investment sales greater than 1% for six months ended 31 March 2022.
Security Units Disposal Proceeds US$
Microsoft 211 69,457Alphabet 23 67,095Berkshire Hathaway 174 51,619Amazon.com 15 51,366JPMorgan Chase 230 36,936EssilorLuxottica 161 33,414Anthem 75 33,226HDFC Bank 1,567 31,046Sandvik 1,088 28,495Installed Building Products 203 27,662Wells Fargo 552 27,629Coca-Cola HBC 819 26,890Aon 87 25,732AIA 2,400 24,767Visa 116 24,504EOG Resources 280 24,403Knorr-Bremse 237 23,342LyondellBasell Industries 254 22,687Avantor 565 22,444Samsung Electronics 342 21,888FIS 201 21,627RELX 669 21,059ANDRITZ 413 20,856L3Harris Technologies 98 20,797Deutsche Telekom 1,032 18,828Northern Oil and Gas 982 18,724CSX 499 18,201Universal Health Services 131 17,543United Rentals 46 15,801Newmont 271 15,495Alibaba 113 14,516Kaspi.KZ 114 14,444Frontdoor 334 11,228Sands China 4,600 10,235

97
TT INTERNATIONAL FUNDS PLC
STATEMENT OF CHANGES IN THE PORTFOLIO – TT Emerging Markets Unconstrained FundFor the six months ended 31 March 2022
Listed below are the largest cumulative investment purchases greater than 1% for the six months ended 31 March 2022.
Security Units Acquisition Cost US$
Alibaba 247,725 27,514,975Tencent 389,700 23,337,357HDFC Bank 861,043 18,422,257Pinduoduo 202,407 18,200,840JP Morgan - China Three Gorges 14,379,100 15,232,400Globant 56,921 15,099,498Barrick Gold 587,771 14,585,420Yunnan Energy New Material 307,800 13,650,887JP Morgan - Guangdong Jia Yuan Technology 591,230 12,699,485Ternium 304,447 12,665,569Petroleo Brasileiro 1,103,997 12,380,594Glencore 2,461,290 12,376,411Wuliangye Yibin 336,000 11,377,908OCI 374,974 10,695,917Yandex 160,112 10,620,676Yunnan Aluminium 4,461,200 10,387,431Gazprom ADR 1,150,753 10,065,872Sea 90,862 9,801,025Lojas Americanas 10,169,600 9,665,313Yijiahe Technology 1,070,345 9,413,898Prudential 637,908 8,944,783Emaar Properties PJSC 6,402,988 8,826,914Pharmaron Beijing 369,800 8,784,826Tencent 133,791 7,849,568LOTTE Fine Chemical 111,183 7,386,653SberBank 569,907 7,309,120EcoPro BM 25,034 7,281,095Indusind Bank Limited 567,362 7,231,201UPL 771,994 7,112,342Meituan Dianping 344,700 7,057,946HSBC Bank 1,229,469 7,040,630A-Living Services 3,446,250 6,971,497Alibaba Group 491,000 6,883,640Taiwan Semiconductor Manufacturing 298,000 6,850,749Hansol Chemical 40,984 6,752,132Sany Heavy Industry 2,391,700 6,693,776Saudi Telecom 214,246 6,395,231Hong Kong Exchanges & Clearing 106,700 6,300,429NARI Technology 1,234,100 6,266,905Eve Energy 391,500 6,220,071China Resources Beer 898,000 5,736,425POSCO 24,159 5,710,817360 Finance 277,841 5,649,982Axis Bank 633,342 5,649,652

98
TT INTERNATIONAL FUNDS PLC
STATEMENT OF CHANGES IN THE PORTFOLIO – TT Emerging Markets Unconstrained Fund (CONTINUED)For the six months ended 31 March 2022
Listed below are the largest cumulative investment sales greater than 1% for six months ended 31 March 2022.
Security Units Disposal Proceeds US$
SK Hynix 209,659 20,491,268Delta Electronics 1,968,000 18,686,229Tencent 343,600 16,351,101ASE Technology 4,448,000 16,144,272Americanas 2,656,965 15,346,371Axis Bank 1,497,124 14,497,374JP Morgan Arctech Solar Holding 31/08/2022 411,578 14,342,557ICICI Bank 1,385,849 14,171,509Gazprom ADR 2,210,568 13,711,122Beijing Jingyuntong Technology 7,297,700 13,138,731Unimicron Technology 1,710,000 13,080,054Impala Platinum 896,881 12,525,408Petroleo Brasileiro 1,176,527 12,110,477Yunnan Energy New Material 307,800 11,996,114Eregli Demir ve Celik Fabrikalari 6,153,958 11,211,902Contemporary Amperex Technology 108,600 9,807,126Lens-Tech 2,821,800 9,372,646LG Chemical 15,943 9,341,201Eugene Technology 215,774 9,273,952Samsung Electronics 148,570 9,177,393CICC Financial Trading - Beijing Sinohytec 10/09/2024 2,093,695 9,046,708Pharmaron Beijing 474,700 9,004,241Eve Energy 420,300 8,480,164Yijiahe Technology 678,000 7,814,099Hyundai Motor 55,410 7,733,294SberBank 569,907 7,551,465Taiwan Semiconductor Manufacturing 371,000 7,511,314EcoPro BM 25,034 7,445,731MediaTek 239,000 7,413,188ASM Pacific Technology 684,500 7,207,167Zijin Mining 4,618,000 7,007,276LOTTE Fine Chemical 111,183 6,931,980Petroleo Brasileiro 517,874 6,564,331Ozon 138234 6304791JP Morgan - China Three Gorges 5528800 6063707Samsung Electronics 110191 5932067Country Garden Services Holdings 977000 5839981Shanghai Junshi Biosciences 1066200 5526891Tencent 100903 5513082
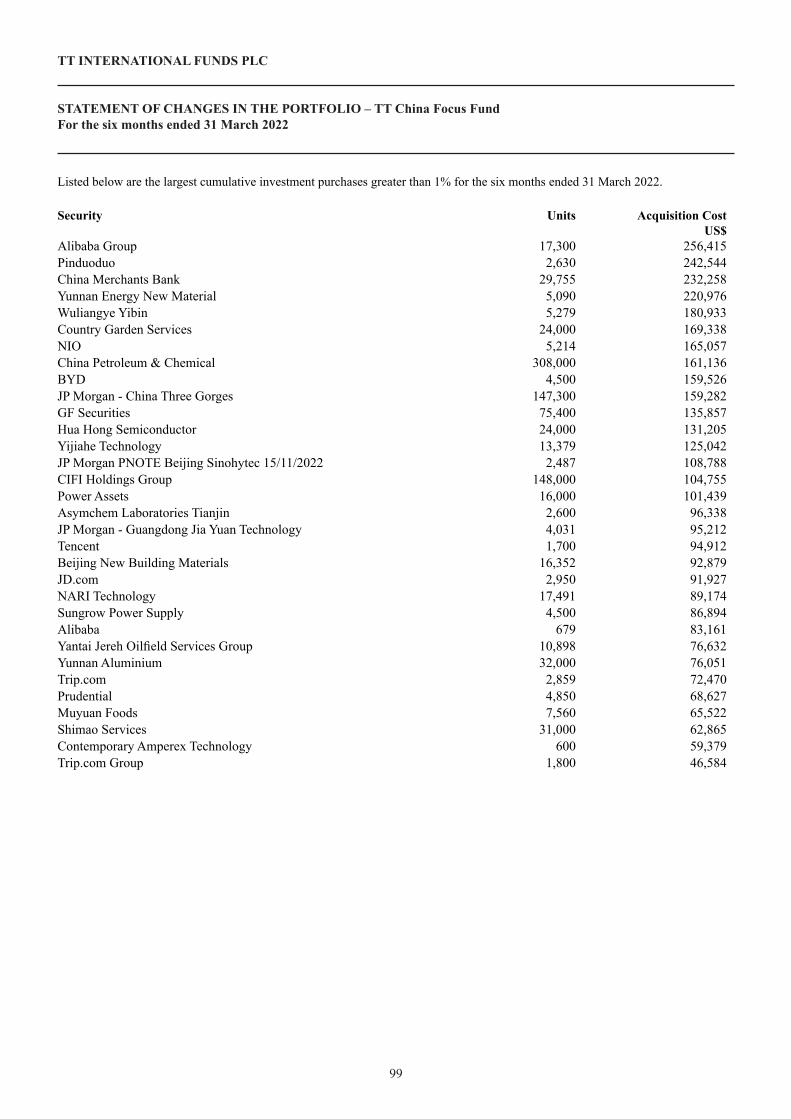
99
TT INTERNATIONAL FUNDS PLC
STATEMENT OF CHANGES IN THE PORTFOLIO – TT China Focus FundFor the six months ended 31 March 2022
Listed below are the largest cumulative investment purchases greater than 1% for the six months ended 31 March 2022.
Security Units Acquisition Cost US$
Alibaba Group 17,300 256,415Pinduoduo 2,630 242,544China Merchants Bank 29,755 232,258Yunnan Energy New Material 5,090 220,976Wuliangye Yibin 5,279 180,933Country Garden Services 24,000 169,338NIO 5,214 165,057China Petroleum & Chemical 308,000 161,136BYD 4,500 159,526JP Morgan - China Three Gorges 147,300 159,282GF Securities 75,400 135,857Hua Hong Semiconductor 24,000 131,205Yijiahe Technology 13,379 125,042JP Morgan PNOTE Beijing Sinohytec 15/11/2022 2,487 108,788CIFI Holdings Group 148,000 104,755Power Assets 16,000 101,439Asymchem Laboratories Tianjin 2,600 96,338JP Morgan - Guangdong Jia Yuan Technology 4,031 95,212Tencent 1,700 94,912Beijing New Building Materials 16,352 92,879JD.com 2,950 91,927NARI Technology 17,491 89,174Sungrow Power Supply 4,500 86,894Alibaba 679 83,161Yantai Jereh Oilfield Services Group 10,898 76,632Yunnan Aluminium 32,000 76,051Trip.com 2,859 72,470Prudential 4,850 68,627Muyuan Foods 7,560 65,522Shimao Services 31,000 62,865Contemporary Amperex Technology 600 59,379Trip.com Group 1,800 46,584

100
TT INTERNATIONAL FUNDS PLC
STATEMENT OF CHANGES IN THE PORTFOLIO – TT China Focus Fund (CONTINUED)For the six months ended 31 March 2022
Listed below are the largest cumulative investment sales greater than 1% for the six months ended 31 March 2022.
Security Units Disposal Proceeds US$
Yunnan Energy New Material 5,090 200,383Daqo New Energy 3,254 190,415China Oilfield Services 228,000 190,250Luxshare Precision Industry 26,103 185,805Contemporary Amperex Technology 1,752 155,872Primavera Capital Acquisition 15,390 149,659Pinduoduo 2,630 143,671JP Morgan - Arctech Solar 31/08/2022 3,707 128,137Xiabuxiabu Catering Management China 163,000 122,339Shimao Property 104,090 118,775Beijing Jingyuntong Technology 66,155 118,381Meituan Dianping 3,800 115,231BYD 3,500 108,482Ganfeng Lithium 7,200 107,827Magnum Opus Acquisition 10,255 105,670JP Morgan - Beijing Sinohytec 17/11/2021 2,281 100,542CICC Financial Trading - Beijing Sinohytec 10/09/2024 28,427 93,183Alibaba Group 5,500 92,247Lens Technology 30,284 86,042China Nonferrous Mining 157,000 83,400Eve Energy 4,000 83,384Viomi Technology 17,458 81,116Nine Dragons Paper 75,000 79,022JP Morgan - Beijing Sinohytec 15/11/2022 2,487 73,315Shimao Services 107,687 72,668Hainan Meilan International Airport 25,000 72,584JP Morgan - Shuhua Sports 15/08/2022 30,600 71,462Tencent 1,300 69,270Q Technology Group 60,000 67,757JP Morgan Structured Products 1,993 66,182Yijiahe Technology 5,100 59,293Pharmaron Beijing 3,100 57,212JP Morgan - China Three Gorges 51,608 55,929Meituan 787 55,615Zijin Mining 36,000 54,713JP Morgan - Weichai Power 12/11/2021 21,552 54,311Sinoma Science & Technology 8,645 52,520Miniso Group 3,982 51,675Macquarie Bank - Pharmaron Beijing 27/02/2023 2,299 51,589Kingsoft Cloud 5,848 51,525Macquarie Bank - Zhongji Innoli 07/07/2022 9,526 50,682GF Securities 35,800 47,916ASM Pacific Technology 4,600 47,508
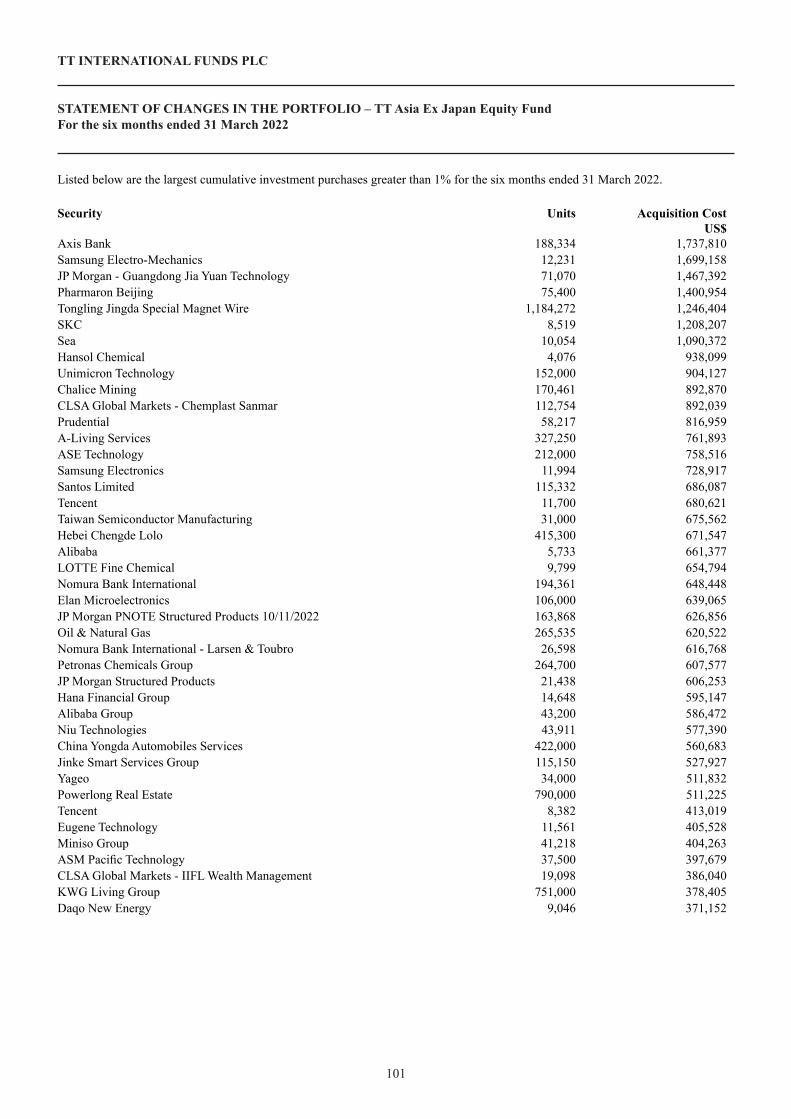
101
TT INTERNATIONAL FUNDS PLC
STATEMENT OF CHANGES IN THE PORTFOLIO – TT Asia Ex Japan Equity FundFor the six months ended 31 March 2022
Listed below are the largest cumulative investment purchases greater than 1% for the six months ended 31 March 2022.
Security Units Acquisition Cost US$
Axis Bank 188,334 1,737,810Samsung Electro-Mechanics 12,231 1,699,158JP Morgan - Guangdong Jia Yuan Technology 71,070 1,467,392Pharmaron Beijing 75,400 1,400,954Tongling Jingda Special Magnet Wire 1,184,272 1,246,404SKC 8,519 1,208,207Sea 10,054 1,090,372Hansol Chemical 4,076 938,099Unimicron Technology 152,000 904,127Chalice Mining 170,461 892,870CLSA Global Markets - Chemplast Sanmar 112,754 892,039Prudential 58,217 816,959A-Living Services 327,250 761,893ASE Technology 212,000 758,516Samsung Electronics 11,994 728,917Santos Limited 115,332 686,087Tencent 11,700 680,621Taiwan Semiconductor Manufacturing 31,000 675,562Hebei Chengde Lolo 415,300 671,547Alibaba 5,733 661,377LOTTE Fine Chemical 9,799 654,794Nomura Bank International 194,361 648,448Elan Microelectronics 106,000 639,065JP Morgan PNOTE Structured Products 10/11/2022 163,868 626,856Oil & Natural Gas 265,535 620,522Nomura Bank International - Larsen & Toubro 26,598 616,768Petronas Chemicals Group 264,700 607,577JP Morgan Structured Products 21,438 606,253Hana Financial Group 14,648 595,147Alibaba Group 43,200 586,472Niu Technologies 43,911 577,390China Yongda Automobiles Services 422,000 560,683Jinke Smart Services Group 115,150 527,927Yageo 34,000 511,832Powerlong Real Estate 790,000 511,225Tencent 8,382 413,019Eugene Technology 11,561 405,528Miniso Group 41,218 404,263ASM Pacific Technology 37,500 397,679CLSA Global Markets - IIFL Wealth Management 19,098 386,040KWG Living Group 751,000 378,405Daqo New Energy 9,046 371,152

102
TT INTERNATIONAL FUNDS PLC
STATEMENT OF CHANGES IN THE PORTFOLIO – TT Asia Ex Japan Equity Fund (CONTINUED)For the six months ended 31 March 2022
Listed below are the largest cumulative investment sales greater than 1% for six months ended 31 March 2022.
Security Units Disposal Proceeds US$
Delta Electronics 268,000 2,488,792Axis Bank 222,170 2,205,104Karoon Gas Australia 1,307,659 1,793,641OZ Minerals 79,087 1,547,470CLSA Global Markets - Chemplast Sanmar 156,461 1,368,157SK Hynix 13,642 1,359,641ASE Technology 367,000 1,336,311Chroma ATE 178,000 1,262,239Eugene Technology 26,576 1,146,220Noah 28,631 1,016,655Pharmaron Beijing 75,400 1,002,347Siam Cement 75,300 867,955Chalice Mining 133,070 840,780Nomura Bank International - Home 1st Finance Co India 85,875 801,038Nomura Bank International - Prestige Estates 124,612 750,407Zhejiang Sanhua Intelligent Controls 197,300 746,487Renew Energy Global 85,498 740,484CLSA Global Markets - Equitas Holdings 426,739 695,930Beijing Jingyuntong Technology 368,000 656,913Miniso Group 40,218 656,655Sinoma Science & Technology 107,900 653,462China Youran Dairy Group 1,115,000 615,540LOTTE Fine Chemical 9,799 611,141CLSA Global Markets - Phoenix Mills 15/11/2023 44,937 606,209DL E&C 6,168 594,843Nomura Bank International - Home 1st Finance Co 56,622 559,075Alibaba 3,480 532,841AirTAC International Group 16,000 531,942Yageo 31,000 511,732Unimicron Technology 64,000 504,670LG Chemical 1,827 480,425Dairy Farm International 163,100 456,590JP Morgan Structured Products 11,834 448,486Chicony Electronics 147,000 442,692Niu Technologies 16,535 432,942Taiwan Semiconductor Manufacturing 21,000 428,475Samsung Electro-Mechanics 2,961 421,138
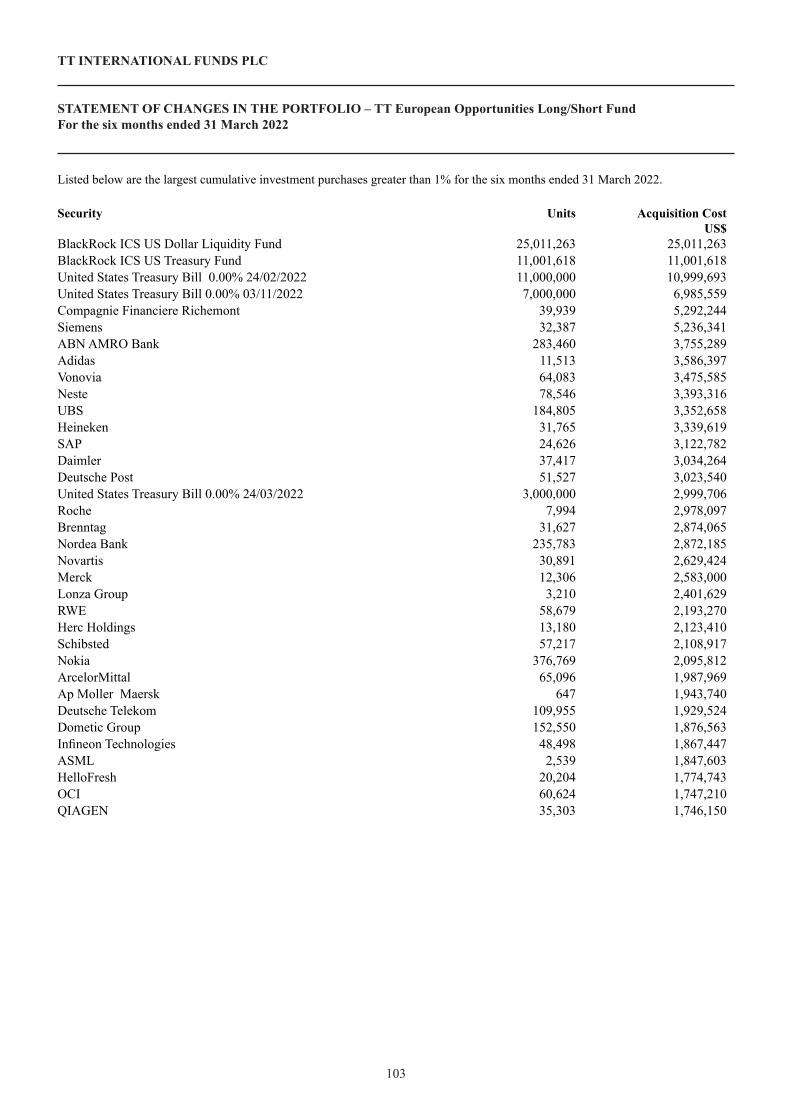
103
TT INTERNATIONAL FUNDS PLC
STATEMENT OF CHANGES IN THE PORTFOLIO – TT European Opportunities Long/Short FundFor the six months ended 31 March 2022
Listed below are the largest cumulative investment purchases greater than 1% for the six months ended 31 March 2022.
Security Units Acquisition Cost US$
BlackRock ICS US Dollar Liquidity Fund 25,011,263 25,011,263 BlackRock ICS US Treasury Fund 11,001,618 11,001,618 United States Treasury Bill 0.00% 24/02/2022 11,000,000 10,999,693 United States Treasury Bill 0.00% 03/11/2022 7,000,000 6,985,559 Compagnie Financiere Richemont 39,939 5,292,244 Siemens 32,387 5,236,341 ABN AMRO Bank 283,460 3,755,289 Adidas 11,513 3,586,397 Vonovia 64,083 3,475,585 Neste 78,546 3,393,316 UBS 184,805 3,352,658 Heineken 31,765 3,339,619 SAP 24,626 3,122,782 Daimler 37,417 3,034,264 Deutsche Post 51,527 3,023,540 United States Treasury Bill 0.00% 24/03/2022 3,000,000 2,999,706 Roche 7,994 2,978,097 Brenntag 31,627 2,874,065 Nordea Bank 235,783 2,872,185 Novartis 30,891 2,629,424 Merck 12,306 2,583,000 Lonza Group 3,210 2,401,629 RWE 58,679 2,193,270 Herc Holdings 13,180 2,123,410 Schibsted 57,217 2,108,917 Nokia 376,769 2,095,812 ArcelorMittal 65,096 1,987,969 Ap Moller Maersk 647 1,943,740 Deutsche Telekom 109,955 1,929,524 Dometic Group 152,550 1,876,563 Infineon Technologies 48,498 1,867,447 ASML 2,539 1,847,603 HelloFresh 20,204 1,774,743 OCI 60,624 1,747,210 QIAGEN 35,303 1,746,150

104
TT INTERNATIONAL FUNDS PLC
STATEMENT OF CHANGES IN THE PORTFOLIO – TT European Opportunities Long/Short Fund (CONTINUED)For the six months ended 31 March 2022
Listed below are the largest cumulative investment sales greater than 1% for six months ended 31 March 2022.
Security Units Disposal Proceeds US$
BlackRock ICS US Dollar Liquidity Fund 35,018,181 35,018,181United States Treasury Bill 0.00% 24/02/2022 11,000,000 11,000,000United States Treasury Bill 0.00% 24/03/2022 10,000,000 10,000,000United States Treasury Bill 0.00% 27/01/2022 7,000,000 7,000,000United States Treasury Bill 0.00% 02/12/2021 7,000,000 7,000,000Compagnie Financiere Richemont 42,659 5,695,204Deutsche Post 74,782 4,054,762UBS 184,805 3,659,522Siemens 22,019 3,434,859Adidas 11,513 3,288,720Vonovia 64,083 3,247,115Neste 66,938 3,145,941Heineken 28,504 3,081,242Pandora 28,095 3,042,593Roche 7,653 2,973,379DSV 13,783 2,953,326SKF 123,192 2,860,050Telefonaktiebolaget LM Ericsson 250,570 2,823,318Nordea Bank 235,783 2,793,997Brenntag 30,292 2,765,439Daimler 37,417 2,705,782Outotec 246,768 2,696,247Storebrand 234,781 2,530,732Novartis 30,891 2,502,861Porsche Automobil 24,922 2,442,513RWE 57,989 2,319,328Ap Moller Maersk 647 2,203,611Outokumpu 364,666 2,175,042ABN AMRO Bank 149,867 2,167,891Atlas Copco 33,621 2,110,413Infineon Technologies 48,559 2,075,531

105
TT INTERNATIONAL FUNDS PLC
STATEMENT OF CHANGES IN THE PORTFOLIO – TT Environmental Solutions FundFor the six months ended 31 March 2022
Listed below are the largest cumulative investment purchases greater than 1% for the six months ended 31 March 2022.
Security Units Acquisition Cost US$
JP Morgan - China Three Gorges 09/11/2022 3,747,000 4,169,144 Terna S.p.A. 414,461 3,282,442 ON Semiconductor 50,250 2,837,094 JP Morgan - Yunnan Energy New Material 07/11/2022 55,800 2,279,434 Niu Technologies 122,562 2,040,703 Plug Power 73,939 1,947,952 JP Morgan - Guangdong Jia Yuan Technology 01/12/2022 86,507 1,870,649 EDP Renovaveis 78,831 1,827,292 Corporacion Acciona Energias Renovables 55,991 1,784,236 Hansol Chemical 7,151 1,772,942 Lindsay 11,723 1,656,088 Weyerhaeuser 43,223 1,646,588 ROCKWOOL International 3,923 1,624,386 Corbion 34,249 1,410,802 Installed Building Products 12,074 1,391,851 Renew Energy Global 169,950 1,373,014 Knorr-Bremse 13,991 1,332,367 UBS Bloomberg CMCI Components Emissions ETF 1,238 1,288,415 CICC Financial Trading - NARI Technology 11/03/2025 256,700 1,268,335 Befesa 15,389 1,227,282 Nexans 12,621 1,180,318 Terna Energy 81,964 1,167,319 CICC Financial Trading - China Three Gorges 04/11/2024 1,026,400 1,122,366 Owens Corning 11,869 1,046,840 JP Morgan - Pylon Technologies 03/08/2022 31,996 1,028,403 Merida Industry 111,000 1,024,352 Signify 20,092 956,279 Advanced Drainage Systems 8,179 937,513 JP Morgan - Sungrow Power Supply 02/06/2022 47,600 876,572 Omega Geracao 173,300 871,331 Evoqua Water Technologies 21,916 860,665 STEICO 7,224 860,287 Agronomics Limited 2,844,684 853,707 Oatly 66,342 815,696 Vestas Wind Systems 29,009 812,757 Delta Electronics 89,000 807,155 Eneti 115,791 806,736 Stem 66,313 760,672 Smurfit Kappa Group 12,937 686,916 SolarEdge Technologies 2,708 680,825 Ceres Power 57,958 661,783
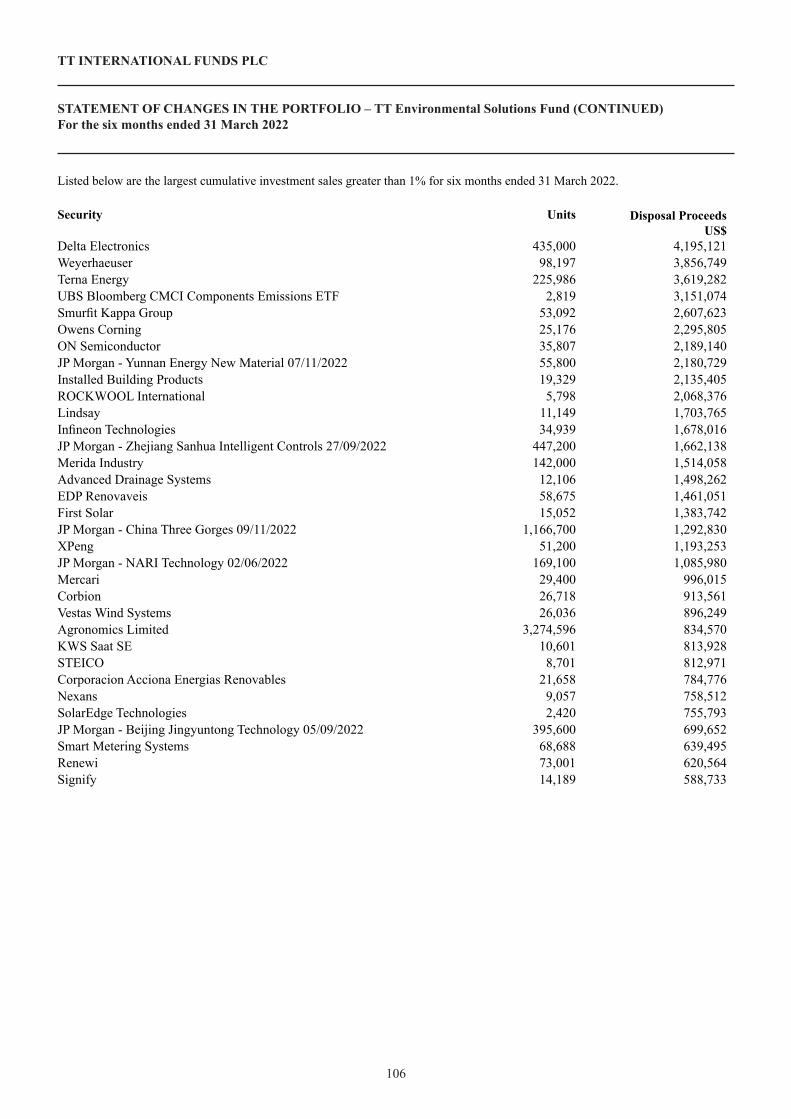
106
TT INTERNATIONAL FUNDS PLC
STATEMENT OF CHANGES IN THE PORTFOLIO – TT Environmental Solutions Fund (CONTINUED)For the six months ended 31 March 2022
Listed below are the largest cumulative investment sales greater than 1% for six months ended 31 March 2022.
Security Units Disposal Proceeds US$
Delta Electronics 435,000 4,195,121Weyerhaeuser 98,197 3,856,749Terna Energy 225,986 3,619,282UBS Bloomberg CMCI Components Emissions ETF 2,819 3,151,074Smurfit Kappa Group 53,092 2,607,623Owens Corning 25,176 2,295,805ON Semiconductor 35,807 2,189,140JP Morgan - Yunnan Energy New Material 07/11/2022 55,800 2,180,729Installed Building Products 19,329 2,135,405ROCKWOOL International 5,798 2,068,376Lindsay 11,149 1,703,765Infineon Technologies 34,939 1,678,016JP Morgan - Zhejiang Sanhua Intelligent Controls 27/09/2022 447,200 1,662,138Merida Industry 142,000 1,514,058Advanced Drainage Systems 12,106 1,498,262EDP Renovaveis 58,675 1,461,051First Solar 15,052 1,383,742JP Morgan - China Three Gorges 09/11/2022 1,166,700 1,292,830XPeng 51,200 1,193,253JP Morgan - NARI Technology 02/06/2022 169,100 1,085,980Mercari 29,400 996,015Corbion 26,718 913,561Vestas Wind Systems 26,036 896,249Agronomics Limited 3,274,596 834,570KWS Saat SE 10,601 813,928STEICO 8,701 812,971Corporacion Acciona Energias Renovables 21,658 784,776Nexans 9,057 758,512SolarEdge Technologies 2,420 755,793JP Morgan - Beijing Jingyuntong Technology 05/09/2022 395,600 699,652Smart Metering Systems 68,688 639,495Renewi 73,001 620,564Signify 14,189 588,733

MANAGEMENT AND ADMINISTRATION
107
DIRECTORSNorbert Bannon (Irish)*John Broughan (Irish)* (Chairman)Yvonne Connolly (Irish)Eric Mackay (British) *Independent Non-Executive Directors ADMINISTRATOR AND REGISTRARNorthern Trust International Fund Administration Services (Ireland) LimitedGeorges Court54-62 Townsend StreetDublin 2Ireland
DEPOSITARYNorthern Trust Fiduciary Services (Ireland) LimitedGeorges Court54-62 Townsend StreetDublin 2Ireland
COMPANY SECRETARYDechert Secretarial LimitedSecond Floor 5 Earlsfort TerraceDublin 2Ireland
SWISS PAYING AGENTNeue Privat Bank AGLimmatquai 1Am BellevuePostfach8024 Zürich
GERMAN PAYING AGENTMarcard, Stein & Co AGBallindamm 3620095 HamburgGermany
MANAGERCarne Global Fund Managers (Ireland) Limited2nd Floor, Block EIveagh CourtHarcourt RoadDublin 2Ireland
REGISTERED NUMBER: 346579
REGISTERED OFFICE OF THE COMPANYSecond Floor5 Earlsfort TerraceDublin 2 Ireland
INVESTMENT MANAGER AND DISTRIBUTORTT International Asset Management Limited62 Threadneedle StreetLondonEC2R 8HPUnited Kingdom
INDEPENDENT AUDITORSDeloitte Ireland LLPChartered Accountants & Statutory Audit FirmDeloitte & Touche HouseEarlsfort TerraceDublin 2Ireland
IRISH LEGAL ADVISERSDechert Second Floor5 Earlsfort TerraceDublin 2Ireland
SWISS REPRESENTATIVEFirst Independent Fund Services AGKlausstrasse 338008 ZurichSwitzerland
AUSTRIAN PAYING AGENTRaiffeisen Bank International AGAm Stadtpark 9A-1030 ViennaAustria
AUSTRIAN TAX REPRESENTATIVEPricewaterhouseCoopersWirtschaftsprüfung und Steuerberatung GmbHErdbergstrasse 200A-1030 ViennaAustria SUB INVESTMENT MANAGER* TT International (Hong Kong) Limited20/F, 18 On Lan StreetCentral, Hong Kong .
*in respect of TT Asia-Pacific Equity Fund, TT Emerging Markets Equity Fund, TT Emerging Markets Unconstrained Fund, TT China Focus Fund and TT Asia ex Japan Equity Fund………. Focus Fund and TT Asia ex Japan Equity Fund
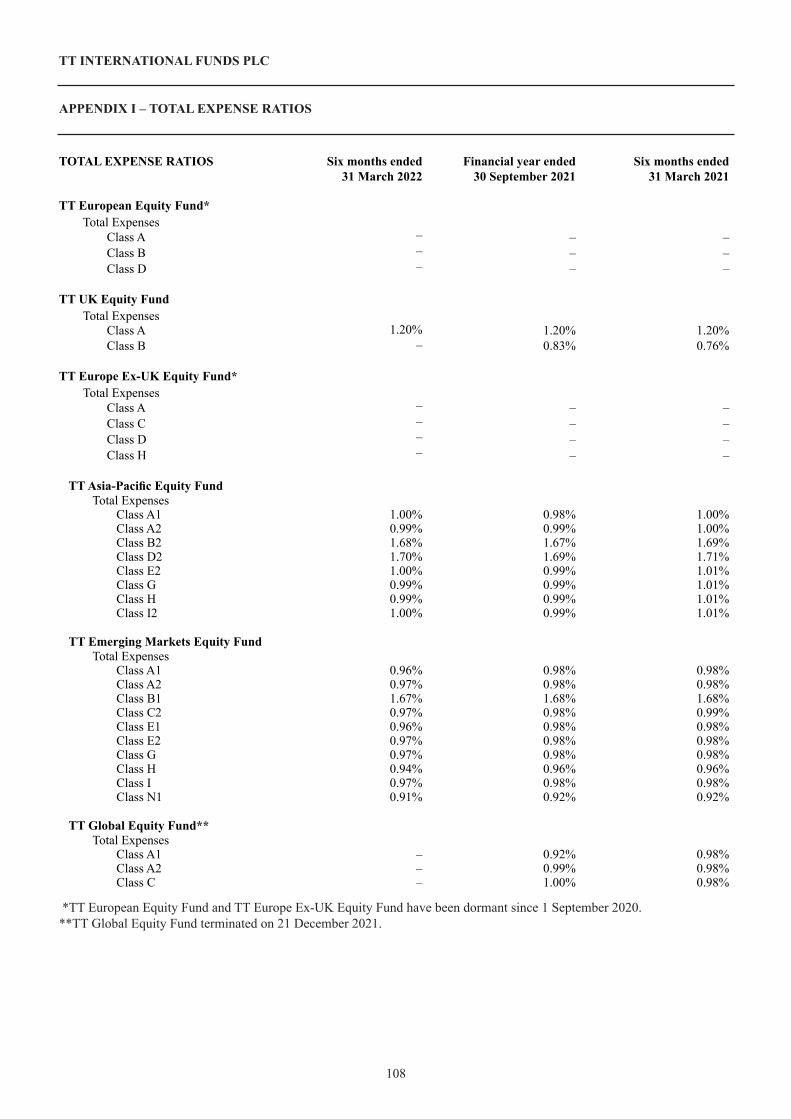
109108
TT INTERNATIONAL FUNDS PLC
APPENDIX I – TOTAL EXPENSE RATIOS
TOTAL EXPENSE RATIOS Six months ended 31 March 2022
Financial year ended 30 September 2021
Six months ended 31 March 2021
TT European Equity Fund*Total Expenses
Class A – – –Class B – – –Class D – – –
TT UK Equity FundTotal Expenses
Class A 1.20% 1.20% 1.20%Class B – 0.83% 0.76%
TT Europe Ex-UK Equity Fund*Total Expenses
Class A – – –Class C – – –Class D – – –Class H – – –
TT Asia-Pacific Equity FundTotal Expenses
Class A1 1.00% 0.98% 1.00%Class A2 0.99% 0.99% 1.00%Class B2 1.68% 1.67% 1.69%Class D2 1.70% 1.69% 1.71%Class E2 1.00% 0.99% 1.01%Class G 0.99% 0.99% 1.01%Class H 0.99% 0.99% 1.01%Class I2 1.00% 0.99% 1.01%
TT Emerging Markets Equity FundTotal Expenses
Class A1 0.96% 0.98% 0.98%Class A2 0.97% 0.98% 0.98%Class B1 1.67% 1.68% 1.68%Class C2 0.97% 0.98% 0.99%Class E1 0.96% 0.98% 0.98%Class E2 0.97% 0.98% 0.98%Class G 0.97% 0.98% 0.98%Class H 0.94% 0.96% 0.96%Class I 0.97% 0.98% 0.98%Class N1 0.91% 0.92% 0.92%
TT Global Equity Fund**Total Expenses
Class A1 – 0.92% 0.98%Class A2 – 0.99% 0.98%Class C – 1.00% 0.98%
*TT European Equity Fund and TT Europe Ex-UK Equity Fund have been dormant since 1 September 2020.**TT Global Equity Fund terminated on 21 December 2021.

109
TT INTERNATIONAL FUNDS PLC
APPENDIX I – TOTAL EXPENSE RATIOS (CONTINUED)
108
TOTAL EXPENSE RATIOS Six months ended 31 March 2022
Financial year ended 30 September 2021
Six months ended 31 March 2021
TT Emerging Markets Unconstrained FundTotal Expenses
Class A1 1.16% 1.18% 1.17%Class A2 1.16% 1.18% 1.18%Class C2 1.16% 1.19% 1.19%Class E1 – 0.54% 0.95%Class E2 1.16% 1.18% 1.18%Class D2 1.66% 1.69% –Class G 1.16% 1.18% 1.17%Class H 1.16% 1.18% 1.17%Class I 1.16% 1.18% 1.18%
TT China Focus FundTotal Expenses
Class A2 1.29% 1.27% 1.20%Class E2 1.30% 1.27% 1.20%
TT Asia Ex Japan Equity FundTotal Expenses
Class A2 1.03% 1.02% 1.04%Class E2 1.02% 1.02% 1.04%
TT European Opportunities Long/Short FundTotal Expenses
Class A1 0.69% 0.79% 0.74%Class A1 Performance Fee 0.04% 1.47% 2.98%Class A2 1.18% 1.29% –Class B1 0.76% 0.79% 0.97%Class B1 Performance Fee (0.09%) 0.52% 1.51%Class B2 1.28% 1.29% –Class C1 0.77% 0.79% 0.89%Class C1 Performance Fee 0.05% 0.20% 0.77%Class C2* 1.26% – –Class C2 Performance Fee 2.17% – –
TT Environmental Solutions FundTotal Expenses
Class A1 0.82% 0.90% 0.85%Class B1 0.82% 0.90% 0.87%Class B2 0.82% 0.90% 0.86%Class B5* 1.02% – –Class B6* 1.02% – –Class Z 0.63% 0.70% –
*Launched during the financial period.

111110
TT INTERNATIONAL FUNDS PLC
APPENDIX II – SECURITIES FINANCING TRANSACTIONS REGULATION
The Securities Financing Transactions Regulation (“SFTR”) requires the following financial reporting and disclosure obligations under Article 13 of SFTR.
TT UK Equity Fund
Global Data
Securities and commodities on loan as a proportion of total lendable assets 9%
Assets engaged by SFT Type GBP % of AUMSecurities lending 143,358 9
Concentration Data
Top Counterparties Collateral GBP
1 HSBC Bank Plc 58,731 2 J.P. Morgan Securities Plc 49,550 3 Macquarie Bank Limited, London Branch 26,219 4 Barclays Capital Securities Ltd. 16,382 5 BNP Paribas Arbitrage 4,283 6 UBS AG, London Branch 785
Largest collateral issuers Collateral GBP
1 United Kingdom Government 58,731 2 United States Equities 31,192 3 United Kingdom Equities 15,393 4 Japan Equities 10,692 5 Canada Equities 9,573 6 Cayman Islands Equities 5,620 7 Netherlands Equities 4,575 8 Sweden Equities 3,888 9 Germany Equities 3,241 10 Norway Equities 2,801
Aggregate Transaction Data
Securities lendingCollateral type: Government
Bonds 38%Equities 62%
Collateral currency: AUD 1% CAD 6% DKK 1% EUR 5% GBP 49% HKD 5% JPY 7%NOK 2% SEK 3% USD 21%
Maturity: <1 day 1 day - 1week
1 week - 1month 1-3 months 3 months -
1 year > 1 year Openmaturity
- Collateral 100%- Securities Lending 100%Countries of counterparties
UK, US
Settlement & clearing type:
Bilateral0%
Tri-party 100%
Reuse of Collateral
Share of collateral re-used 0%Maximum permitted collateral re-use 0%Return on cash collateral re-investment 0%

111
TT INTERNATIONAL FUNDS PLC
APPENDIX II – SECURITIES FINANCING TRANSACTIONS REGULATION (CONTINUED)
110
Safekeeping – Collateral Received
All collateral received is held by Northern Trust Fiduciary Services (Ireland) Limited, as Depositary.
Total collateral received as at 31 March 2022 was £ 156,100.
Safekeeping – Collateral Granted
Collateral held in: Collateral volumes
Segregated accounts 0%Pooled accounts 100%Other 0%
Return & Cost
Securities lendingFund Administrator Total
GBP % GBP % GBP % Return 302 75% 100 25% 403 100%Cost 100 100% 100 100%
TT Asia-Pacific Equity Fund
Global Data
Securities and commodities on loan as a proportion of total lendable assets 6%
Assets engaged by SFT Type USD % of AUMSecurities lending 9,771,612 6
Concentration Data
Top Counterparties Collateral USD
1 J.P. Morgan Securities Plc 5,244,166 2 The Bank of Nova Scotia, New York Agency 1,555,816 3 Merrill Lynch International 1,389,997 4 UBS AG, London Branch 816,092 5 Barclays Capital Securities Ltd. 713,300 6 BNP Paribas Prime Brokerage International Ltd. 235,310 7 The Bank Of Nova Scotia, London Branch 175,697 8 BOFA Securities Inc 89,985
Largest collateral issuers Collateral USD
1 United States Government 6,195,824 2 United States Equities 2,298,536 3 Germany Government 531,884 4 United Kingdom Government 224,714 5 Netherlands Government 214,265 6 France Government 186,292 7 United Kingdom Equities 100,102 8 Ireland Equities 97,330 9 Canada Government 74,086 10 Canada Equities 65,069
TT UK Equity Fund (continued)

112
TT INTERNATIONAL FUNDS PLC
APPENDIX II – SECURITIES FINANCING TRANSACTIONS REGULATION (CONTINUED)
Aggregate Transaction Data
Securities lendingCollateral type: Government
Bonds 74%Equities 26%
Collateral currency: CAD 1% EUR 10% GBP 3% USD 86%
Maturity: <1 day 1 day - 1 week
1 week - 1 month 1-3 months 3 months
- 1 year > 1 year Open maturity
- Collateral 100%- Securities Lending 100%Countries of counterparties
UK, US, France
Settlement & clearing type:
Bilateral 52%
Tri-party 48%
Reuse of Collateral
Share of collateral re-used 0%Maximum permitted collateral re-use 0%Return on cash collateral re-investment 0%
Safekeeping – Collateral Received
All collateral received is held by Northern Trust Fiduciary Services (Ireland) Limited, as Depositary.
Total collateral received as at 31 March 2022 was US$ 10,222,685.
Safekeeping – Collateral Granted
Collateral held in: Collateral volumes
Segregated accounts 0%Pooled accounts 100%Other 0%
Return & Cost
Securities lendingFund Administrator Total
USD % USD % USD % Return 5,556 75% 1,850 25% 7,406 100%Cost 1,850 100% 1,850 100%
TT Emerging Markets Equity Fund
Global Data
Securities and commodities on loan as a proportion of total lendable assets 3%
Assets engaged by SFT Type USD % of AUMSecurities lending 19,905,109 3
TT Asia-Pacific Equity Fund (continued)

112 113
TT INTERNATIONAL FUNDS PLC
APPENDIX II – SECURITIES FINANCING TRANSACTIONS REGULATION (CONTINUED)
Concentration Data
Top Counterparties Collateral USD
1 The Bank of Nova Scotia, New York Agency 10,173,377 2 UBS AG, London Branch 4,669,049 3 J.P. Morgan Securities Plc 3,400,196 4 Morgan Stanley & Co. International Plc 2,704,043 5 Credit Suisse AG, Dublin Branch 438,796 6 Macquarie Bank Limited, London Branch 93,952 7 HSBC Bank Plc 84,350
Largest collateral issuers Collateral USD
1 United States Equities 9,721,952 2 United States Government 9,531,937 3 Germany Government 900,090 4 Ireland Equities 395,028 5 Netherlands Government 341,261 6 Switzerland Equities 235,333 7 Cayman Islands Equities 153,826 8 Netherlands Equities 112,740 9 Canada Equities 75,167 10 France Equities 54,073
Aggregate Transaction Data
Securities lendingCollateral type: Government
Bonds 50%Equities 50%
Collateral currency: EUR 6% USD 94%Maturity: <1 day 1 day - 1
week1 week - 1 month 1-3 months 3 months
- 1 year > 1 year Open maturity
- Collateral 100%- Securities Lending 100%Countries of counterparties
UK, US, Ireland
Settlement & clearing type:
Bilateral 16%
Tri-party 84%
Reuse of Collateral
Share of collateral re-used 0%Maximum permitted collateral re-use 0%Return on cash collateral re-investment 0%
Safekeeping – Collateral Received
All collateral received is held by Northern Trust Fiduciary Services (Ireland) Limited, as Depositary.
Total collateral received as at 31 March 2022 was US$ 21,567,063.
TT Emerging Markets Equity Fund (continued)

114
TT INTERNATIONAL FUNDS PLC
APPENDIX II – SECURITIES FINANCING TRANSACTIONS REGULATION (CONTINUED)
Safekeeping – Collateral Granted
Collateral held in: Collateral volumes
Segregated accounts 0%Pooled accounts 100%Other 0%
Return & Cost
Securities lendingFund Administrator Total
USD % USD % USD % Return 40,902 75% 13,632 25% 54,534 100%Cost 13,632 100% 13,632 100%
TT Emerging Markets Unconstrained Fund
Global Data
Securities and commodities on loan as a proportion of total lendable assets 4%
Assets engaged by SFT Type USD % of AUMSecurities lending 22,861,895 4
Concentration Data
Top Counterparties Collateral USD
1 Barclays Bank Plc 9,834,416 2 J.P. Morgan Securities Plc 6,116,106 3 The Bank of Nova Scotia, New York Agency 5,947,600 4 HSBC Bank Plc 1,675,319 5 UBS AG, London Branch 528,155 6 The Bank Of Nova Scotia, London Branch 100,476
Largest collateral issuers Collateral USD
1 United States Government 11,241,705 2 United States Equities 6,837,736 3 France Government 4,239,091 4 Canada Government 903,946 5 Ireland Equities 240,052 6 Switzerland Equities 181,697 7 Germany Government 131,221 8 Cayman Islands Equities 105,682 9 United Kingdom Equities 75,778 10 Netherlands Equities 71,510
TT Emerging Markets Equity Fund (continued)

114 115
TT INTERNATIONAL FUNDS PLC
APPENDIX II – SECURITIES FINANCING TRANSACTIONS REGULATION (CONTINUED)
Aggregate Transaction Data
Securities lendingCollateral type: Government
Bonds 69%Equities 31%
Collateral currency: CAD 4% EUR 19% USD 77%
Maturity: <1 day 1 day - 1 week
1 week - 1 month
1-3 months
3 months - 1 year > 1 year Open
maturity- Collateral 100%- Securities Lending 100%Countries of counterparties
UK, US
Settlement & clearing type:
Bilateral 25%
Tri-party 75%
Reuse of Collateral
Share of collateral re-used 0%Maximum permitted collateral re-use 0%Return on cash collateral re-investment 0%
Safekeeping – Collateral Received
All collateral received is held by Northern Trust Fiduciary Services (Ireland) Limited, as Depositary.
Total collateral received as at 31 March 2022 was US$ 24,218,491.
Safekeeping – Collateral Granted
Collateral held in: Collateral volumes
Segregated accounts 0%Pooled accounts 100%Other 0%
Return & Cost
Securities lendingFund Administrator Total
USD % USD % USD % Return 53,629 75% 17,875 25% 71,504 100%Cost 17,875 100% 17,875 100%
TT China Focus Fund
Global Data
Securities and commodities on loan as a proportion of total lendable assets 6%
Assets engaged by SFT Type USD % of AUMSecurities lending 227,568 6
TT Emerging Markets Unconstrained Fund (continued)

116
TT INTERNATIONAL FUNDS PLC
APPENDIX II – SECURITIES FINANCING TRANSACTIONS REGULATION (CONTINUED)
Concentration Data
Top Counterparties Collateral USD
1 The Bank of Nova Scotia, London Branch 199,416 2 The Bank of Nova Scotia, New York Agency 182,142 3 Barclays Bank Plc 176,641 4 UBS AG, London Branch 126,933 5 Credit Suisse Securities (USA) LLC 78,277
Largest collateral issuers Collateral USD
1 United States Equities 130,749 2 United States Government 59,352 3 United Kingdom Equities 23,685 4 Canada Equities 15,022 5 Ireland Equities 4,743 6 Switzerland Equities 4,238 7 Japan Equities 2,281 8 Netherlands Equities 1,980 9 France Equities 1,326 10 Cayman Islands Equities 567
Aggregate Transaction Data
Securities lendingCollateral type: Government
Bonds 24%Equities76%
Collateral currency: CAD 6% EUR 1% GBP 11% HKD 1% JPY 1% USD 80%Maturity: <1 day 1 day - 1
week1 week - 1 month
1-3 months
3 months - 1 year > 1 year Open
maturity- Collateral 100%- Securities Lending 100%Countries of counterparties
UK, US
Settlement & clearing type:
Bilateral 24%
Tri-party 76%
Reuse of Collateral
Share of collateral re-used 0%Maximum permitted collateral re-use 0%Return on cash collateral re-investment 0%
Safekeeping – Collateral Received
All collateral received is held by Northern Trust Fiduciary Services (Ireland) Limited, as Depositary.
Total collateral received as at 31 March 2022 was US$ 245,372.
Safekeeping – Collateral Granted
Collateral held in: Collateral volumes
Segregated accounts 0%Pooled accounts 100%Other 0%
TT China Focus Fund (continued)
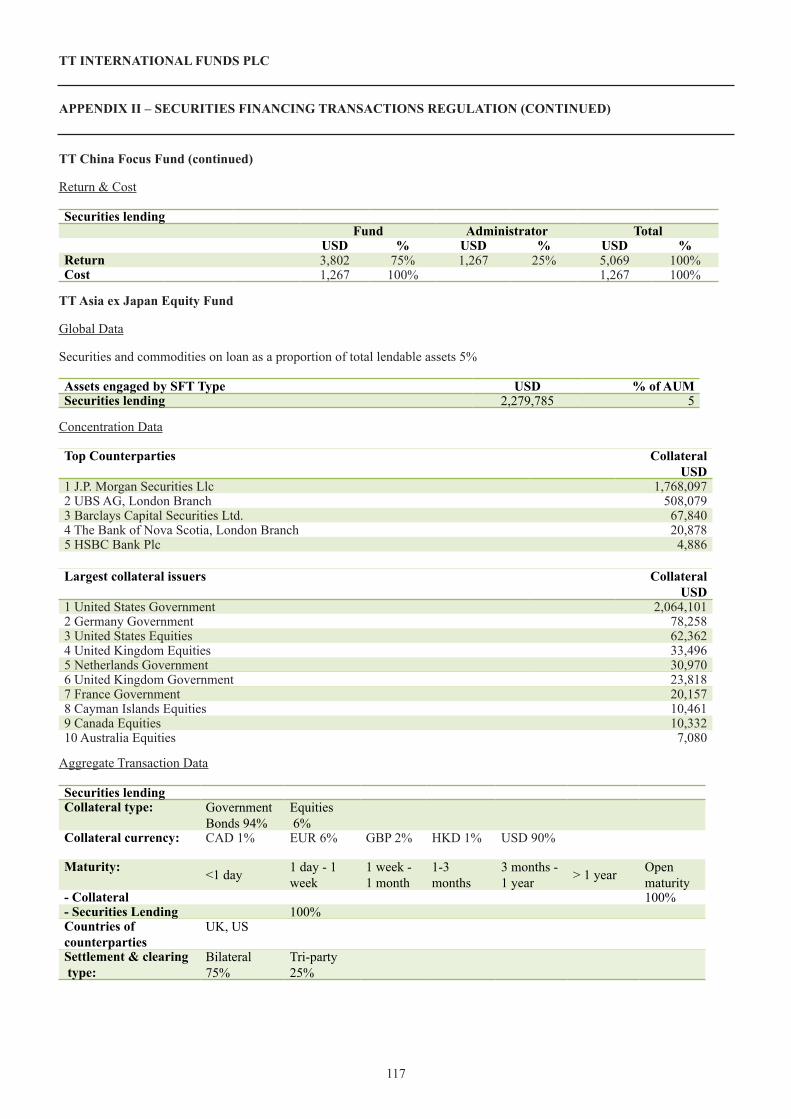
116 117
TT INTERNATIONAL FUNDS PLC
APPENDIX II – SECURITIES FINANCING TRANSACTIONS REGULATION (CONTINUED)
Return & Cost
Securities lendingFund Administrator Total
USD % USD % USD % Return 3,802 75% 1,267 25% 5,069 100%Cost 1,267 100% 1,267 100%
TT Asia ex Japan Equity Fund
Global Data
Securities and commodities on loan as a proportion of total lendable assets 5%
Assets engaged by SFT Type USD % of AUMSecurities lending 2,279,785 5
Concentration Data
Top Counterparties Collateral USD
1 J.P. Morgan Securities Llc 1,768,097 2 UBS AG, London Branch 508,079 3 Barclays Capital Securities Ltd. 67,840 4 The Bank of Nova Scotia, London Branch 20,878 5 HSBC Bank Plc 4,886
Largest collateral issuers Collateral USD
1 United States Government 2,064,101 2 Germany Government 78,258 3 United States Equities 62,362 4 United Kingdom Equities 33,496 5 Netherlands Government 30,970 6 United Kingdom Government 23,818 7 France Government 20,157 8 Cayman Islands Equities 10,461 9 Canada Equities 10,332 10 Australia Equities 7,080
Aggregate Transaction Data
Securities lendingCollateral type: Government
Bonds 94%Equities 6%
Collateral currency: CAD 1% EUR 6% GBP 2% HKD 1% USD 90%
Maturity: <1 day 1 day - 1 week
1 week - 1 month
1-3 months
3 months - 1 year > 1 year Open
maturity- Collateral 100%- Securities Lending 100%Countries of counterparties
UK, US
Settlement & clearing type:
Bilateral 75%
Tri-party 25%
TT China Focus Fund (continued)
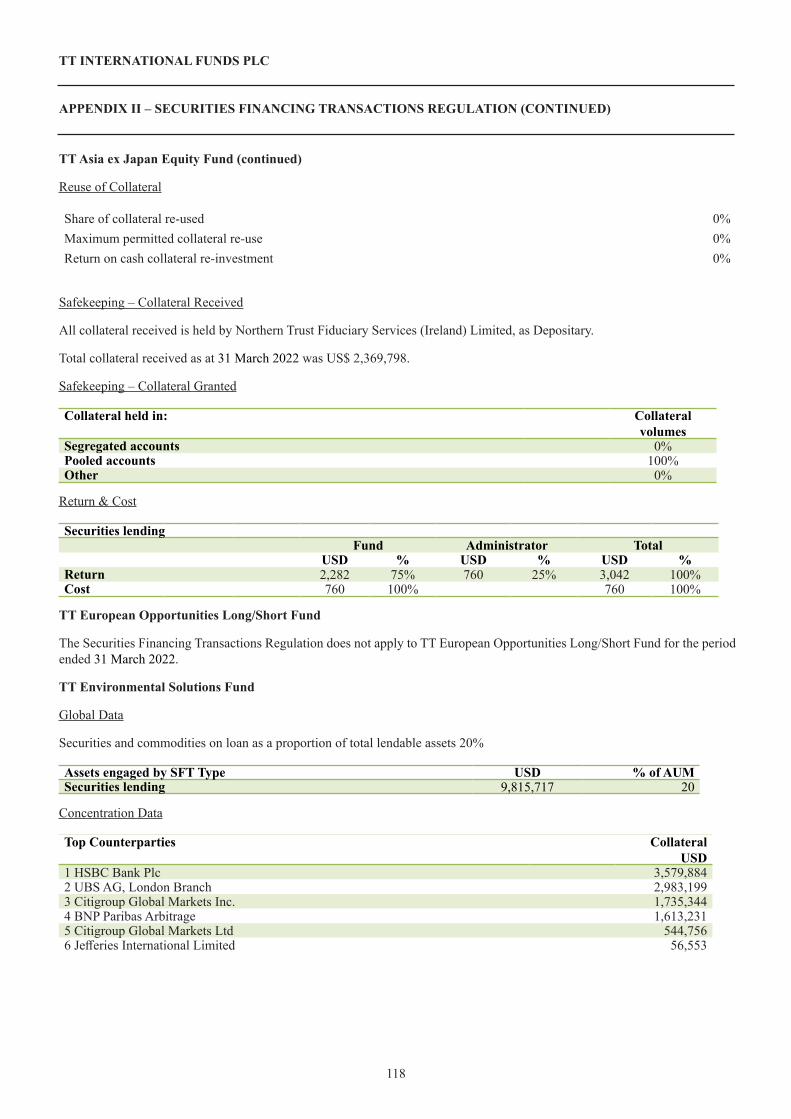
118
TT INTERNATIONAL FUNDS PLC
APPENDIX II – SECURITIES FINANCING TRANSACTIONS REGULATION (CONTINUED)
Reuse of Collateral
Share of collateral re-used 0%Maximum permitted collateral re-use 0%Return on cash collateral re-investment 0%
Safekeeping – Collateral Received
All collateral received is held by Northern Trust Fiduciary Services (Ireland) Limited, as Depositary.
Total collateral received as at 31 March 2022 was US$ 2,369,798.
Safekeeping – Collateral Granted
Collateral held in: Collateral volumes
Segregated accounts 0%Pooled accounts 100%Other 0%
Return & Cost
Securities lendingFund Administrator Total
USD % USD % USD % Return 2,282 75% 760 25% 3,042 100%Cost 760 100% 760 100%
TT European Opportunities Long/Short Fund
The Securities Financing Transactions Regulation does not apply to TT European Opportunities Long/Short Fund for the period ended 31 March 2022.
TT Environmental Solutions Fund
Global Data
Securities and commodities on loan as a proportion of total lendable assets 20%
Assets engaged by SFT Type USD % of AUMSecurities lending 9,815,717 20
Concentration Data
Top Counterparties Collateral USD
1 HSBC Bank Plc 3,579,884 2 UBS AG, London Branch 2,983,199 3 Citigroup Global Markets Inc. 1,735,344 4 BNP Paribas Arbitrage 1,613,231 5 Citigroup Global Markets Ltd 544,756 6 Jefferies International Limited 56,553
TT Asia ex Japan Equity Fund (continued)

118 119
TT INTERNATIONAL FUNDS PLC
APPENDIX II – SECURITIES FINANCING TRANSACTIONS REGULATION (CONTINUED)
Largest collateral issuers Collateral USD
1 United States Equities 4,434,682 2 United States Government 2,322,796 3 United Kingdom Equities 1,171,993 4 Switzerland Equities 308,689 5 Japan Equities 300,399 6 Cayman Islands Equities 230,042 7 France Government 214,691 8 United Kingdom Government 205,560 9 Austria Government 181,157 10 Germany Government 174,733
Aggregate Transaction Data
Securities lendingCollateral type: Government
Bonds 31%Equities 69%
Collateral currency: AUD 1% CAD 1% CHF 2% EUR 9% GBP 14% HKD 3% JPY 3%USD 67%
Maturity: <1 day 1 day - 1 week
1 week - 1 month 1-3 months 3 months -
1 year > 1 year Open maturity
- Collateral 100%- Securities Lending 100%Countries of counterparties
UK, US
Settlement & clearing type:
Bilateral 17%
Tri-party 83%
Reuse of Collateral
Share of collateral re-used 0%Maximum permitted collateral re-use 0%Return on cash collateral re-investment 0%
Safekeeping – Collateral Received
All collateral received is held by Northern Trust Fiduciary Services (Ireland) Limited, as Depositary.
Total collateral received as at 31 March 2022 was US$10,515,892.
Safekeeping – Collateral Granted
Collateral held in: Collateral volumes
Segregated accounts 0%Pooled accounts 100%Other 0%
Return & Cost
Securities lendingFund Administrator Total
USD % USD % USD % Return 8,151 75% 2,715 25% 10,866 100%Cost 2,715 100% 2,715 100%
TT Environmental Solutions Fund (continued)