Real time phase detection based online monitoring of batch fermentation processes
Upload
independentCategory
view
0download
0
IntroductionCellular networks are becoming increasing-ly complex. In coming years the introduc-tion of third-generation networks will com-pound this situation. As a consequence,there is a need for simple or automated op-eration and maintenance (O&M), to decreaseoperators’ costs and to use hardware invest-ments in the most effective way. Likewise,operators need customized functionality—a requirement that puts great demands onsystem flexibility. This kind of flexibilitycan be achieved by allowing the network toproduce real-time events instead of counter-based statistics. But doing so requires an ef-fective and well-structured network archi-tecture.
This article describes an architecture thatemploys event-based statistics for buildingeffective and flexible performance monitor-ing and optimization applications. It alsopoints to Ericsson system properties, activ-ities, and experiments, showing that Ericsson is well on its way toward creatinga common platform for the monitoring andoptimization of second- (GSM) and third-generation (WCDMA) mobile systems.
Optimization in a radioaccess networkThe radio access network provides connec-tion links between mobile stations (MS) andthe core telecommunications network.
In GSM systems, the radio communica-tion with each mobile station is maintainedby base station controllers (BSC), which con-trol several base transceiver stations (BTS).A BTS covers a limited geographical areaknown as a cell. When a mobile stationmoves between cells, it is up to the BSC tomove the signaling to the correspondingBTS. This process is called handover. InWCDMA systems the principle is the same,but the terminology is somewhat different.
The operator uses a management systemto manage the network. In Figure 1, the em-phasis is on the management signalingwithin the radio network. Along with a va-riety of other applications—for example,fault management and customer services—the typical management system has tools forhelping the operator to optimize, or tune,the radio network.
Networks have traditionally been opti-mized by a radio engineer who, using plan-ning tools, performance analysis data, andexperience, sends configuration commandsto the network.
The term optimization algorithm shouldbe interpreted to mean software that can as-sist the radio engineer and handle a widerange of optimization situations, from slowvariations in the radio network, such as de-ploying new cells, to fast variations, such aschanging traffic load. Ideally, the optimiza-tion algorithms optimize system perfor-mance without continuous operator inter-vention. However, in complicated situa-tions it is important to include the radio en-gineer in decisions.
An algorithm could be employed to de-crease the coverage of a cell due to tempo-rary traffic overload. An optimization ap-plication of this kind continuously config-ures the network in accordance with mea-surements emitted from it. If this applica-tion were removed or ceased to function, thenetwork could continue to maintain its traf-fic services, albeit in a less optimized way.
The architectureDistributed agentsTraditionally, management applications ex-ecute in a central management node. Pre-
4 Ericsson Review No. 1, 2002
Real-time performance monitoring and optimization of cellular systemsPer Gustås, Per Magnusson, Jan Oom and Niclas Storm
As cellular networks grow in size and complexity, the process of manag-ing them becomes increasingly costly for mobile operators. For this rea-son, automated network management is very appealing.
The authors describe an architecture that uses event-based statisticsfor real-time performance monitoring and optimization of cellular net-works. They present the results of a field trial together with SmarTone inHong Kong, and conclude with an overview of current product develop-ments in this field.
3GPP Third-generation Partnership ProjectBSC Base station controllerBTS Base transceiver stationCORBA Common object request broker
architectureCT Control taskCTR Cell traffic recordingFAS Frequency allocation supportFOX Frequency optimization expertGPEH General performance event handlingGSM Global system for mobile communi-
cationGUI Graphical user interfaceHCS Hierarchical cell structureIP Internet protocolIRP Integration reference point
MS Mobile stationMT Monitoring taskMTR Mobile traffic recordingNCS Neighboring cell supportNOX Neighboring optimization expertO&M Operation and maintenanceOSS Operations support systemPM Performance monitoringRANOS Radio network operation supportRNC Radio network controllerR-PMO Real-time performance monitoringTCH Traffic channelTCP Transport control protocolUETR User equipment traffic recordingWCDMA Wideband code-division multiple
access
BOX A, TERMS AND ABBREVIATIONS
Ericsson Review No. 1, 2002 5
defined statistics are periodically sent fromnetwork elements to the central manage-ment node. By contrast, real-time perfor-mance monitoring and optimization appli-cations require a more flexible aggregationof measurement data. However, it is not fea-sible to send raw measurement data, sincein large networks (having, for example, asmany as 40,000 BTSs) this would put extreme performance requirements on thecentral management system and on the datacapacity of the management network (Figure 2).
To create an effective environment for theperformance monitoring and optimizationfunctions that rely on large amounts ofevent-based measurement data, an architec-ture is needed that permits the distributionof functions. Raw measurement data mustbe handled efficiently and should be col-lected and processed near the source beforeit is forwarded to the next-higher level inthe hierarchy (Figure 2).
The topic of distributed management sys-tems has been dealt with extensivelythroughout the years. The challenge here hasbeen to apply the theories to create an ar-chitecture that is suited for the real-timeperformance monitoring and optimizationof cellular networks.
Accordingly, the applications have beensplit up into parts and subdivided through-out the management nodes and traffic nodesof the network. In this article, we call a mod-ule that constitutes a distributable part ofthe management application an agent.Note: The word agent is used simply to referto distribution and an open interface. It doesnot try to quantify any degree of intelli-gence. Agents interact via open interfaces atdifferent levels of the system. The conceptof integration reference points (IRP) is beingused within the Third-generation Partner-ship Project (3GPP) as the means of achiev-ing a management standard for interopera-ble third-generation cellular systems.1 Atpresent, standards exist within the fault- andconfiguration management areas and Ericsson has submitted a proposal for per-formance management.
The use of interacting, yet autonomous,measurement and control functions calls forrobust and scalable management systemsthat can be distributed across the network.Ideally, the distribution should be indepen-dent of the borders constituted by physicalnodes. This is achieved by using protocolsthat expose the same interface to the indi-vidual agents regardless of whether the data
Central management level
Core network
Regional management level
Base station controllers
Radio access network
Base tranciever stations and cells
Mobile stations
Figure 1A radio access network.
Visualization Visualization
Application Application
Central case Distributed case
Agent Agent Agent Agent
High volume of raw data
Network element
Network element
Network element
Network element
Network element
Network element
Network element
Network element
Low volume of preprocessed data
Figure 2Distributed functions are a solution for handling large amounts of data.

is transported locally or via a connecting net-work.
Monitoring and control tasksA real-time performance monitoring or op-timization application is functionally builtup by means of monitoring tasks (MT) andcontrol tasks (CT). Figure 3 shows aschematic and ideal distribution of tasksthroughout a complete system. Note, how-ever, that consideration has not been givento the physical deployment into differentnodes or agents.
Measurement information flows upwardin the system, whereas control informationflows downward. Control tasks typically acton measurement information in the samelayer and control information from the next-higher (superordinate) layer. Monitoringtasks are usually configured by control tasksat the superordinate layer.
Monitoring tasks monitor the perfor-mance of related resources (ordinarily sub-ordinate agents or real network resources)by subscribing to real-time performancedata. Once a subscription has been set up,events will be delivered to the subscriberuntil it cancels the subscription.
Although a monitoring task can be con-
nected to other monitoring tasks in any way,a strict hierarchy (Figure 3) is most oftensuitable for cellular systems. The lowestlevel monitoring tasks collect low-level in-formation, such as bit error rate, carrier-to-interference ratio, handover events, call dropevents, and so on. It uses this informationto calculate statistics, such as call drop rate.Higher-level agents subscribe to lower-levelinformation in order to compute more ab-stract quantities, such as capacity and qual-ity for a region or for the entire system. Thesequantities convey more meaningful infor-mation to an operator or a control system.
Control tasks also operate in real-time andare used for controlling network resources,either directly or via other (typically lower-layer) control tasks. A control action can bebased on performance data from one or moremonitoring tasks, external control actionsreceived from other control tasks, or both.The control rules can be of almost any typesuggested in the control literature. The con-trol tasks can also be interconnected in anyway. As with monitoring tasks, however, astrict hierarchy is often preferable for cellu-lar systems. This arrangement solves thecontrol problems at the lowest possiblelevel, where the problems can be handledwith maximum speed. But if this is not ad-equate, higher-level and more cautious con-trollers can be invoked to resolve the con-trol matters.
Monitoring agents are built up from oneor more monitoring tasks. Optimizationagents are built up from a combination ofmonitoring and control tasks.
Tasks versus agentsAgents provide a means of building appli-cations that can be scaled and distributed.If different tasks should execute on differentphysical nodes, then they must reside with-in different agents. Different tasks shouldalso reside within different agents in orderto achieve full flexibility and scalability.However, to achieve high performance, thecontrol and monitoring tasks of the samephysical node could be configured to con-stitute an agent:• Tasks can communicate more efficiently
than agents, since they do not require anopen communication interface that sup-ports distribution.
• If several tasks within an agent subscribeto the same information, the informationneeds only be sent once to the agent,which can then distribute it internally tothe appropriate tasks.
6 Ericsson Review No. 1, 2002
Visualization
Monitoring task
Monitoring task
Monitoring task
Monitoring task
Control task
Control task
Control task
Control task
Network resource
Network resource
Network resource
Figure 3Schematic view of task allocation in a system (not considering deployment). The numberof layers can be extended.
Ericsson Review No. 1, 2002 7
• Different scheduling mechanisms can beused at the agent and task levels—that is,operating system-based scheduling can beemployed at the agent level, whereas asimpler scheduling mechanism can beemployed at the task level.
A monitoring andoptimization prototypeA prototype project was launched in 1999with the primary goal of demonstrating thatreal-time performance monitoring and op-timization is feasible using this architecturein a real environment.
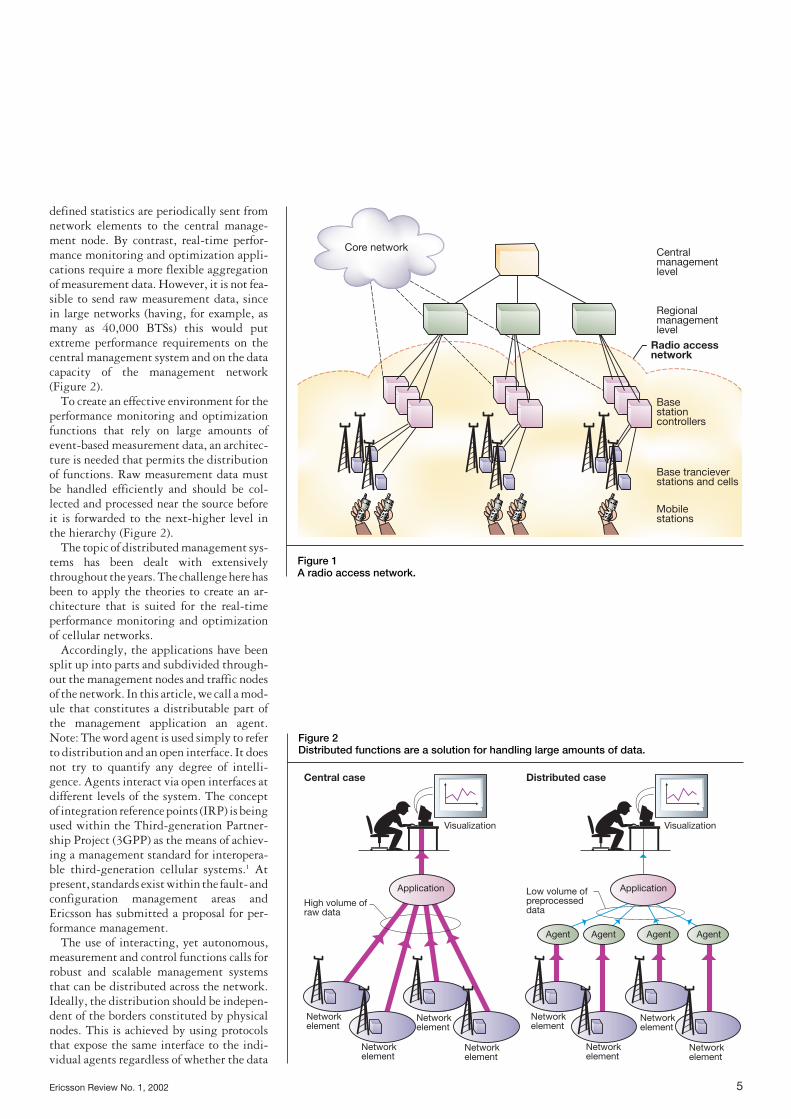
The optimization problemHierarchical cell structures (HCS) are usedto push traffic down to a lower layer (small-er cells). For instance, by pushing the traf-fic down to layer-1 cells, operators make bet-ter use of the hardware in these cells and re-duce the load in surrounding layer-2 andlayer-3 cells. The result is an increase in thetotal network capacity.
The mobile station uses the received sig-nal strength from a BTS to make handoverdecisions. The HCS feature defines a signalstrength threshold (LEVTHR) for eachlayer-1 cell. If a mobile station that is usinga layer-2 or layer-3 cell measures a layer-1cell signal strength that exceeds this thresh-old it will attempt to hand the call over tothe layer-1 cell. Likewise, if the signalstrength falls below this threshold, the mo-bile station will abandon the layer-1 cell.Accordingly, there is a close relationship be-tween the LEVTHR threshold and the geo-graphical size of the cell. Notwithstanding,there were some drawbacks to this featurethat needed to be resolved through the in-troduction of an optimization algorithm:• The use of a threshold setting that is too
aggressive can cause congestion in thelayer-1 cell. When this is the case, it isdifficult to provide service to the mobilestations that are close to the micro basestation.
• A setting that is too aggressive can pushtraffic down causing it to suffer from in-terference due to frequency reuse in thenetwork.
Note: In recent releases of GSM from Ericsson these drawbacks have been resolved.
Optimizing algorithmAn algorithm was developed to resolve thesedrawbacks. The goal was to improve capac-ity while maintaining quality in a network
with hierarchical cell structures. The algo-rithm continuously measures the capacityand quality of all regulated cells, and peri-odically modifies the size (LEVTHR thresh-old) of layer-1 cells according to the follow-ing guidelines:• To improve the capacity (grade of service),
the traffic load should be balanced be-tween layer-1 cells and upper layer neigh-bors. This is done by adjusting the size ofthe layer-1 cell.
• If the quality is inadequate in the layer-1(micro) cells, the size of the layer-1 cellshould be decreased. To determine qual-ity, the algorithm measures – drop rate (percentage of abnormally ter-
minated calls) in the layer-1 cells; and– failed handovers from neighboring
layer-2 and layer-3 cells to layer-1 cells.The criteria mentioned above are periodi-cally combined into a new cell size propos-al for each layer-1 cell, which is sent to theBSC.
Layer-3 cells
Layer-2 cells
Layer-1 cells
Figure 4Hierarchical cell structures.

Prototype implementationThe prototype (Figure 5) consisted of • a graphical user interface (GUI) imple-
mented in Java—to present real-time per-formance statistics and to control theadaptive tuning algorithms;
• a monitoring and optimization system(also implemented in Java);
• a subscription and control interface thatconverts from a proprietary Ericsson for-mat to an open agent interface (usingCORBA); and
• an Ericsson BSC (Release 7) which hadbeen extended with a subscription serverthat can extract real-time performancedata.
The monitoring and optimization system(Figure 6) included the drop rate measure-ment, failed handover rate measurement,traffic load measurement, and HCS controltasks, which implement the optimizing al-gorithm.
The drop rate measurement task sub-scribes to the call disconnect and handoverperformed events from the BSC, and calcu-lates the drop rate of each cell.
The failed handover rate measurementtask subscribes to the handover attempt andhandover performed events from the BSC,and calculates the handover failure rate fromthe layer-2 and layer-3 neighbors of a spe-cific layer-1 cell.
8 Ericsson Review No. 1, 2002
BSC
Subscription interface
Monitoring and optimization system
GUI (PM and control)PC running Windows NT4
Sun enterprise E250 running Solaris 2.6
Ericsson base station controller
Control interface
Subscription server
Open
InternalFigure 5Architecture of the prototype system.
Subscription interface
Internal
Internal
CORBA
CORBALayer 1
cell
CORBA
CORBA
Control in
terface
BSC
GUI
Drop rate
Failed hand- over
Traffic load
Drop rateFailed handover
Traffic load
HCS control task
Cell region (L1 cell and L2 and L3 neighbors)
Layer-2 and
layer-3 cell
Figure 6Task implementation showing the controlof one layer-1 cell.
Ericsson Review No. 1, 2002 9
The traffic load measurement task sub-scribes to the traffic load event from the BSCand calculates traffic load for each cell. Traf-fic load is received every 10 seconds from theBSC.
The HCS control task subscribes to eventsfrom the drop rate, failed handover and traf-fic load measurement tasks of its own layer-1 cell and to traffic load measurement tasksof all neighboring layer-2 and layer-3 cells.It also regularly calculates a new LEVTHRthreshold value.
A single host (Sun E250 workgroup serv-er) was able to run the entire adaptive tun-ing system for the limited field trial area,which included a total of 105 cells. All thetasks were contained within one agent.Open interfaces (CORBA) were used be-tween the GUI, optimization system, andthe BSC, but not internally between tasks.
Field trialThe field trial took place in Hong Kong incooperation with SmarTone. Five cells werechosen as layer-1 test cells. All were GSM900 cells that could be categorized as streetcells rather than microcells. Their neigh-bors, a total of 100 cells, were also includedas test cells, giving a total of 105 cells.
Drop rate monitoring, traffic load moni-toring, and HCS control tasks were instan-tiated for all 105 cells. These tasks sub-scribed to BSC events and periodically gen-erated the following results:• Events from subscribed monitoring and
control tasks were sent every 10 secondsto the GUI for real-time display.
• A new LEVTHR value from each HCScontrol task was sent every five minutesto the BSC.
Algorithm evaluation
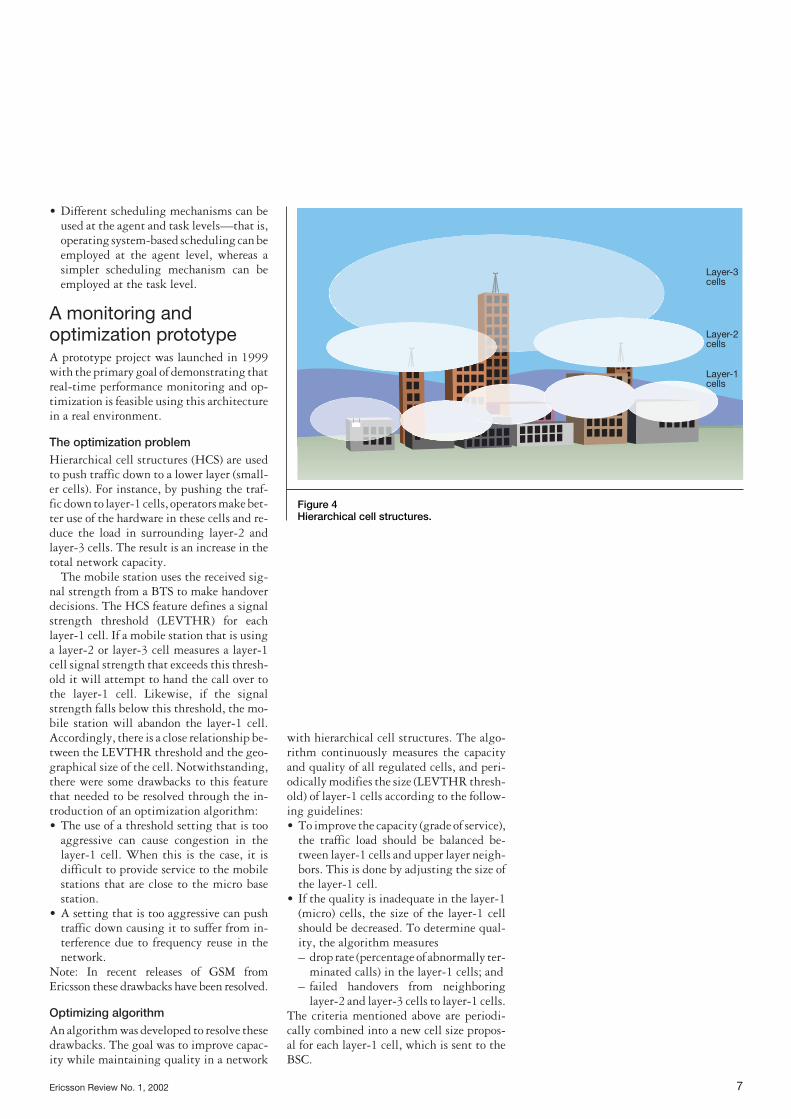
The adaptive tuning algorithm worked asexpected according to simulations. Figure 7shows how the number of idle channels inlayer-1 cells can be increased due to changesin cell size (LEVTHR).
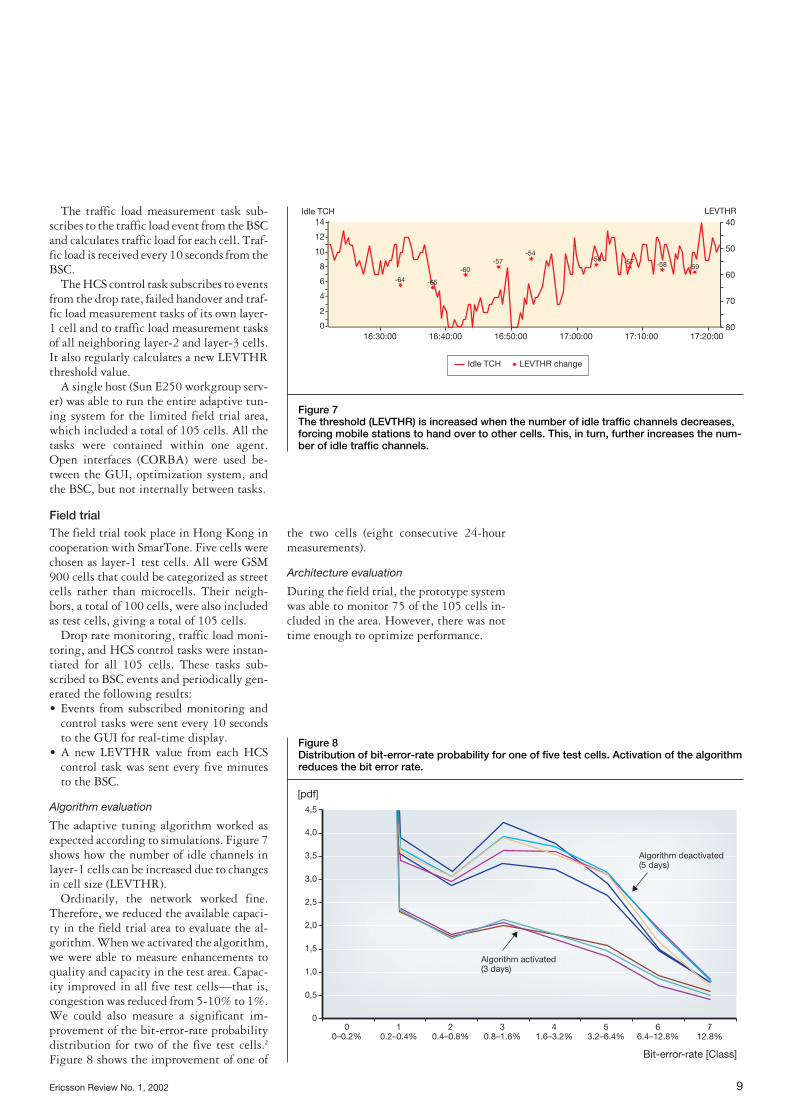
Ordinarily, the network worked fine.Therefore, we reduced the available capaci-ty in the field trial area to evaluate the al-gorithm. When we activated the algorithm,we were able to measure enhancements toquality and capacity in the test area. Capac-ity improved in all five test cells—that is,congestion was reduced from 5-10% to 1%.We could also measure a significant im-provement of the bit-error-rate probabilitydistribution for two of the five test cells.2
Figure 8 shows the improvement of one of
the two cells (eight consecutive 24-hourmeasurements).
Architecture evaluation
During the field trial, the prototype systemwas able to monitor 75 of the 105 cells in-cluded in the area. However, there was nottime enough to optimize performance.
Idle TCH14
12
10
8
6
4
2
016:30:00 16:40:00 16:50:00
Idle TCH LEVTHR change
17:00:00
LEVTHR
17:10:00 17:20:00
40
50
60-58-57-56
-54-57
-60
-65-64
-59
70
80
Figure 7The threshold (LEVTHR) is increased when the number of idle traffic channels decreases,forcing mobile stations to hand over to other cells. This, in turn, further increases the num-ber of idle traffic channels.
Algorithm deactivated (5 days)
Algorithm activated (3 days)
0 0–0.2%
4,0
4,5
[pdf]
Bit-error-rate [Class]
3,5
3,0
2,5
2,0
1,5
1,0
0,5
01
0.2–0.4%2
0.4–0.8%3
0.8–1.6%4
1.6–3.2%5
3.2–6.4%6
6.4–12.8%7
12.8%
Figure 8Distribution of bit-error-rate probability for one of five test cells. Activation of the algorithmreduces the bit error rate.
The field trial has given valuable inputthat can be applied to future products with-in this area. For instance we have learnedthat• performance-critical parts should be im-
plemented in C++ instead of in Java;• the need for interprocess communication
should be kept to a minimum; and• when events are transmitted using
CORBA calls they should be sent inbatches (several events transmitted in thesame message).
Latency measurements indicated that ittook from 10 to 35 seconds for an event in
the network (for example, a dropped call) tobe measured (percentage change in droppedcalls) and displayed in the GUI. In mostcases a latency of less than one minute is ac-ceptable.
From ideas to products Based on input from previous product ex-perience as well as on the results from theprototype and field test, Ericsson is now in-troducing event-based reporting mecha-nisms into GSM (Release 9.1) and WCDMA(Phase 2).
Event mechanism in GSMAn event mechanism is being introducedinto the BSC in Ericsson GSM BSS R9.1.The mechanism permits the operations andsupport system (OSS) to subscribe to real-time event data. The events are sent to theOSS over a TCP/IP connection.
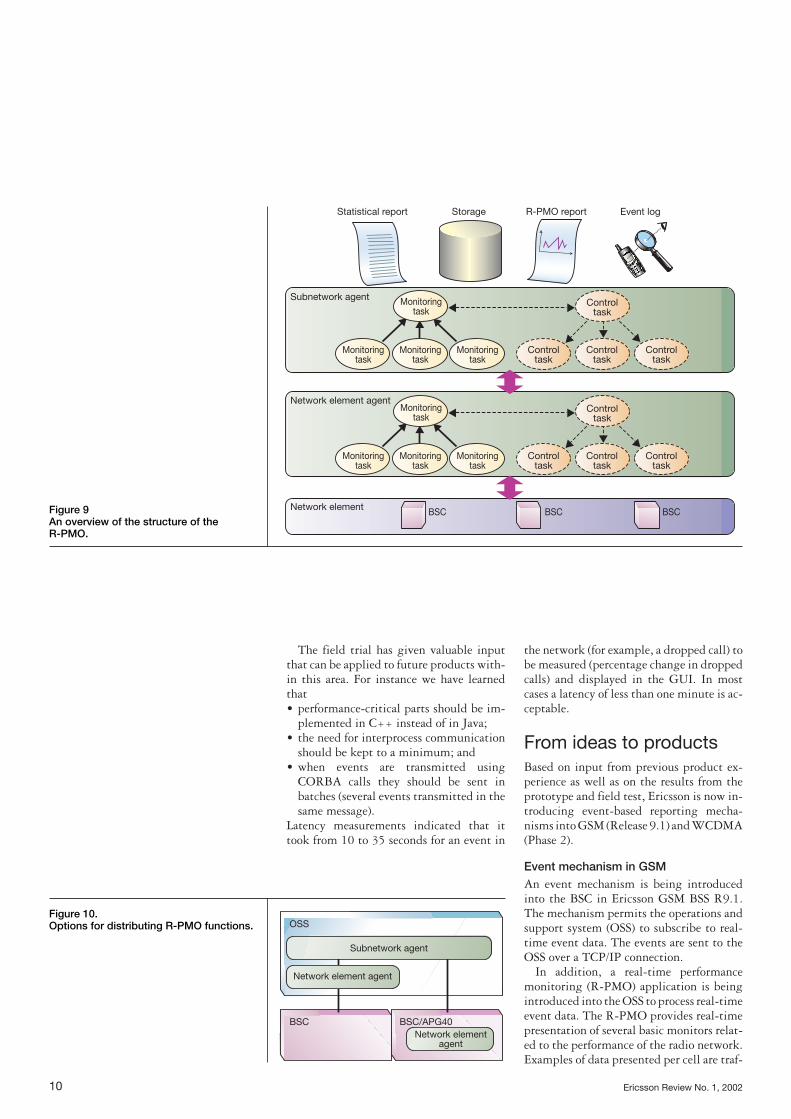
In addition, a real-time performancemonitoring (R-PMO) application is beingintroduced into the OSS to process real-timeevent data. The R-PMO provides real-timepresentation of several basic monitors relat-ed to the performance of the radio network.Examples of data presented per cell are traf-
10 Ericsson Review No. 1, 2002
Monitoring task
Monitoring task
Monitoring task
Monitoring task
Control task
Control task
Control task
Control task
Monitoring task
Monitoring task
Monitoring task
BSC BSC BSC
Monitoring task
Control task
Control task
Control task
Control task
Statistical report
Subnetwork agent
Network element agent
Network element
Storage R-PMO report Event log
Figure 9An overview of the structure of the R-PMO.
Subnetwork agent
OSS
BSC BSC/APG40Network element
agent
Network element agent
Figure 10.Options for distributing R-PMO functions.
Ericsson Review No. 1, 2002 11
fic level, TCH utilization, voice quality, andbasic handover information. End-user re-ports provide an overview and detailedanalysis of individual values.
The implementation of the R-PMO ap-plication has been greatly facilitated by themonitoring tasks (Figure 9), which performsimple and well-defined functions. The R-PMO implements a monitoring taskframework that supports the administrationof tasks. The framework also provides sev-eral basic services, such as giving access toconfiguration information, subscriptionmechanisms that allow monitoring tasks tosubscribe to information from lower-levelmonitoring tasks or raw performance events.New monitoring tasks can be added to theOSS with little extra effort.
Control tasks are not currently support-ed, but the framework has been designedwith them in mind.
The R-PMO server software has two maincomponents—a subnetwork agent, whichhandles the overview of the network at theOSS level, and a network element agent,which is responsible for processing the datafrom a single network element.
The amount of data that is sent from theBSC to the OSS is relative to the traffic vol-ume. For large BSCs this can amount to sev-eral hundred kbit/s during peak hours. Thedata format used on the internal BSC-OSSlink is proprietary to Ericsson. However, ex-ternal applications can access the event dataand also monitor values via an open PM IRPinterface in the OSS.
The APG40, a new Windows NT-basedinput-output processor for the BSC, can beused to move part of the R-PMO function-ality to the BSC itself (Figure 10). The dis-tribution of functions to the BSC makes itpossible to reduce the load on the OSS-BSClink significantly. The APG40 deploymentis not part of the R9.1 version of R-PMO.
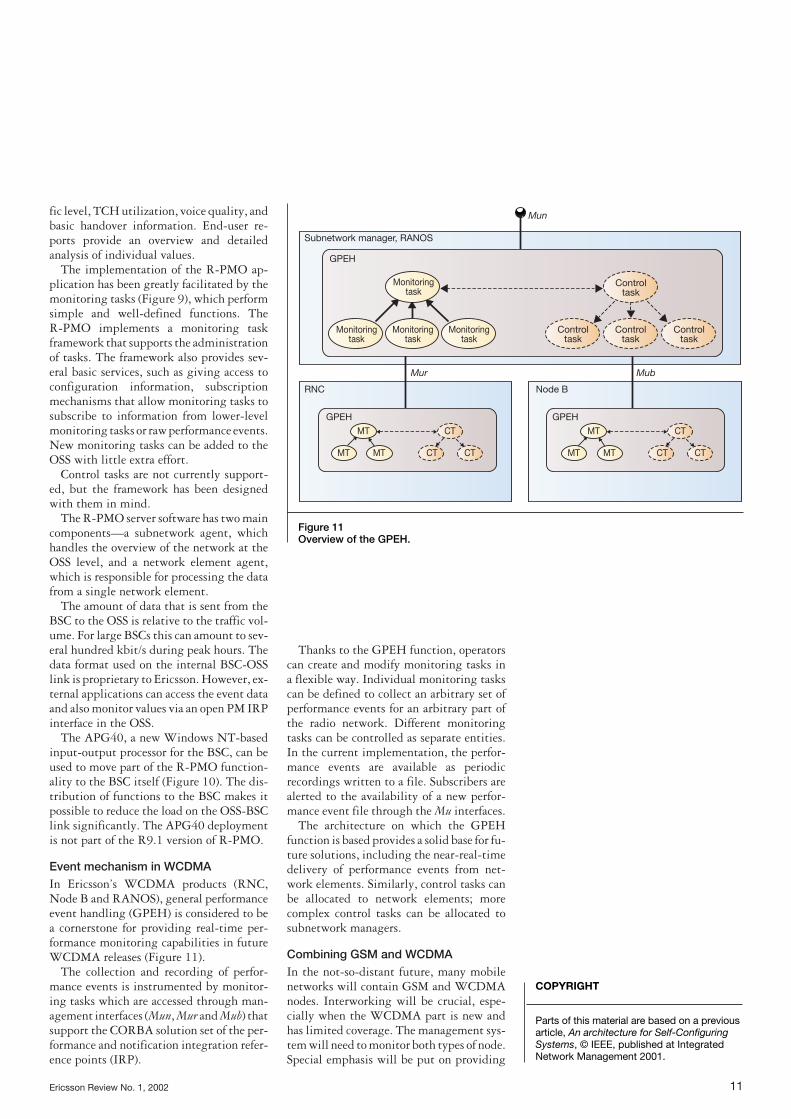
Event mechanism in WCDMAIn Ericsson’s WCDMA products (RNC,Node B and RANOS), general performanceevent handling (GPEH) is considered to bea cornerstone for providing real-time per-formance monitoring capabilities in futureWCDMA releases (Figure 11).
The collection and recording of perfor-mance events is instrumented by monitor-ing tasks which are accessed through man-agement interfaces (Mun, Mur and Mub) thatsupport the CORBA solution set of the per-formance and notification integration refer-ence points (IRP).
Thanks to the GPEH function, operatorscan create and modify monitoring tasks ina flexible way. Individual monitoring taskscan be defined to collect an arbitrary set ofperformance events for an arbitrary part ofthe radio network. Different monitoringtasks can be controlled as separate entities.In the current implementation, the perfor-mance events are available as periodicrecordings written to a file. Subscribers arealerted to the availability of a new perfor-mance event file through the Mu interfaces.
The architecture on which the GPEHfunction is based provides a solid base for fu-ture solutions, including the near-real-timedelivery of performance events from net-work elements. Similarly, control tasks canbe allocated to network elements; morecomplex control tasks can be allocated tosubnetwork managers.
Combining GSM and WCDMAIn the not-so-distant future, many mobilenetworks will contain GSM and WCDMAnodes. Interworking will be crucial, espe-cially when the WCDMA part is new andhas limited coverage. The management sys-tem will need to monitor both types of node.Special emphasis will be put on providing
Parts of this material are based on a previousarticle, An architecture for Self-ConfiguringSystems, © IEEE, published at IntegratedNetwork Management 2001.
COPYRIGHT
Subnetwork manager, RANOS
GPEH
GPEH GPEH
Node BRNC
Mur Mub
Mun
Monitoring task
MT
MT MT
CT
CT CT
MT
MT MT
CT
CT CT
Monitoring task
Monitoring task
Monitoring task
Control task
Control task
Control task
Control task
Figure 11Overview of the GPEH.
tools for monitoring and tuning intersystembehavior, such as handover.
In terms of type of available event and ar-chitecture, GSM and WCDMA event mech-anisms share many common principles. Thismeans that the existing mechanisms providea good base on which to build applicationsthat support GSM and WCDMA. Theevent-reporting mechanisms in GSM andWCDMA can monitor • control functions (connection handling);• mobility functions (handover, cell up-
date);• capacity functions (admission, conges-
tion);• bearer functions (data throughput);• measurement reports;• configuration management functions;
and• inter-node communication.GSM and WCDMA each use subscription-based principles for reporting events. Theapplications can thus specify which eventsare to be activated. Moreover, the mecha-nisms support the IRP concept.
ApplicationsThe event mechanisms in GSM andWCDMA provide a solid base that can beused for creating a wide range of applica-tions.
Performance monitoring
The R-PMO application provides immedi-ate feedback on the performance of the net-work. Monitors, such as counter values andgauges, can be shown with low resolutionand very short delay. Operators can thusreact quickly to problems in the networkand see the immediate effect of configura-tion updates. This is useful for trouble-shooting and can also be used when new fea-tures are being introduced and tuned, andwhen parameters are being changed. The R-PMO application includes a range of pre-defined reports on traffic load, quality, andso on. Real-time performance events couldalso be considered as enablers of a wide rangeof performance monitoring services, such as• alarms that supervise traffic conditions in
the network;• the identification of specified situations
in the network that depend on the corre-lation between events. This gives almostunlimited possibilities of finding specif-ic behaviors in the network. Examples areidentifying cells with a large amount offast moving mobile stations or ping-ponghandover situations; and
• the monitoring of end-user performanceto determine whether or not the customergets what he pays for.
Troubleshooting
Event data is a powerful tool for trouble-shooting. The mobile traffic recording(MTR) application for GSM and the userequipment traffic recording (UETR) appli-cation for WCDMA allow operators torecord the traffic behavior of select mobilestations, including measurement data relat-ing to the air interface. This data can be usedto check parameter settings in the network(for example, handover parameters).
The cell traffic recording (CTR) applica-tion for GSM and the corresponding appli-cation for WCDMA allow operators torecord the traffic behavior of mobile stationsin a specific recording area (for instance, agiven set of cells).
Optimizing applications
The frequency allocation support (FAS) andfrequency optimization expert (FOX) ap-plications in GSM help operators to choose
12 Ericsson Review No. 1, 2002
Sun, Solaris and Java are registered trade-marks of Sun Microsystems, Inc. in the Unit-ed States and other countries.
Windows NT is a registered trademark ofMicrosoft Corporation.
TRADEMARKS
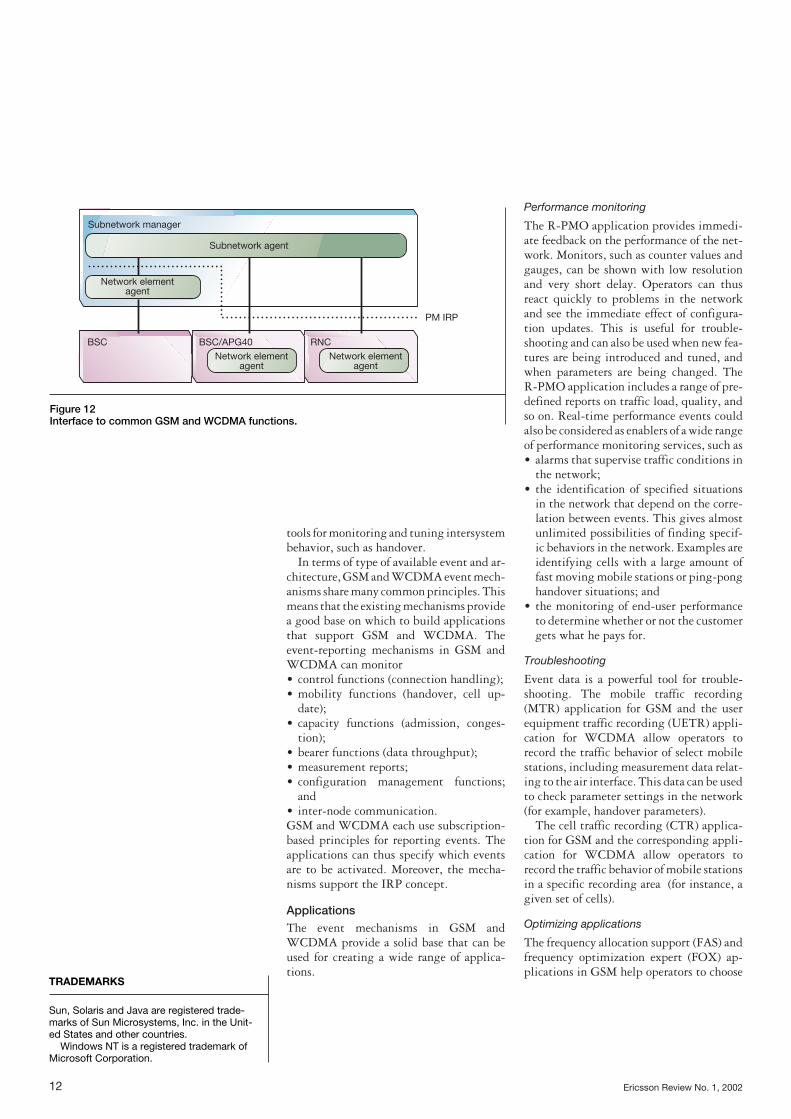
Subnetwork manager
Subnetwork agent
BSC RNCBSC/APG40
PM IRP
Network element agent
Network element agent
Network element agent
Figure 12Interface to common GSM and WCDMA functions.

Ericsson Review No. 1, 2002 13
which frequencies should be allocated to thecells in their GSM networks. FAS presentsthe results in reports, so that the operatorcan decide which frequency changes to im-plement, whereas FOX automatically finds,suggests and implements frequency changesthat will improve network quality.
The neighboring cell support (NCS) andneighboring optimization expert (NOX)applications give operators a way of opti-mizing the neighboring cell lists for all cellsin their GSM network. NCS and NOX helpoperators to add and remove cells from theneighboring cell lists that every GSM cellneeds to have in order for handovers to workbetween cells. NCS presents the recordedmeasurements and statistics in several re-ports, which the operator can study to seewhich neighboring cell relations should beremoved and added. NOX has the addedfunctionality of suggesting which neigh-boring cells should be removed or added,and of implementing these changes auto-matically. Real-time performance eventscould also be an enabler for a wide range ofoptimization services, such as• neighbor cell list optimization for com-
bined GSM and WCDMA networks;• optimization of power settings; and• loadsharing between cells, frequencies
and systems.
Event-based statistics
Ideally, to preserve flexibility, the softwarethat manages the radio network should notalso have to calculate statistics. As the radionetwork is enhanced (has more features addedto it) it becomes more complex. The additionof a counter-based interface to the switch re-quires a massive addition of new counters—to keep network performance visible. Thesame results can be achieved with a small setof performance events. Events contain de-tailed information about individual mobilestations and can be correlated with networkelements, cells, parts of cells, and even indi-vidual calls or phone types.
Extracting data from the traffic machinealso gives operators the opportunity to gath-er and correlate data from more than one net-work element. This gives performance dataon relations between cells served by differ-ent network elements and different systems,
such as GSM or WCDMA. New statisticscan quickly be introduced and tailored toindividual customers’ needs.
The statistics can then be processed by thesame storage, monitoring and presentationsystems that are currently used to fulfillcompatibility requirements. Event-basedstatistics allow for a flexible approach—op-erators can easily add new counters withouthaving to update the software in the net-work elements.
Inter-system performance management
The event mechanisms in GSM andWCDMA are at the same level, which meansthat future products can support both sys-tems simultaneously. Operators can thusgenerate statistics for a combinedGSM/WCDMA network, including specif-ic inter-system statistics, such as inter-system handover.
Moreover, operators will be able to adap-tively tune inter-system aspects, such asinter-system neighbor cell lists.
External applications
The use of event data is not limited to theapplications described above, but can also beused to create new functions that help oper-ators to increase their revenue. The eventdata contains detailed information about thetype and distribution of traffic in the net-work. When combined with other externaldata this can serve as the basis for servicesprovided by the operator or a third party.One such example is road traffic information.
ConclusionThis article describes an architecture andprototype based on real-time performanceevents for monitoring and optimizing cel-lular networks. The events-based architec-ture admits fast and flexible development ofperformance monitoring and optimizationapplications. It also provides open interfacesthat enable customized performance moni-toring.
Existing mechanisms in GSM andWCDMA products adhere to many of thearchitectural principles described, which inturn allow efficient monitoring of combinedsystems.
1 HYPERLINK3GPP TS 32.102 V4.2.0 (2001-09) 3G Telecom Management Architectureftp://ftp.3gpp.org/specs/2001-09/Rel-4/32_series/32102-420.zip
2 ETSI GSM Technical Specification 05.08
REFERENCES
Copyright © 2022 FDOKUMEN