Cooling Towers Real Time Performance Monitoring - Curtiss ...
31
Cooling Towers Real Time Performance Monitoring EPRI Cooling Tower Technology Conference - 2018 Jeff Marion – Exelon Greg Alder – Curtiss-Wright
-
Upload
khangminh22 -
Category
Documents
-
view
8 -
download
0
Transcript of Cooling Towers Real Time Performance Monitoring - Curtiss ...

Cooling Towers Real Time
Performance Monitoring
EPRI Cooling Tower Technology Conference - 2018
Jeff Marion – Exelon
Greg Alder – Curtiss-Wright

Cooling Tower Purpose
• Remove heat from circulating water system
• Principal of operation:
Use cool air flow to remove sensible and latent heat
from circulating water by heat transfer and
evaporation
Air is heated as it passes through the circulating
water spray decreasing density and providing
buoyancy to maintain flow (natural draft) or fans
(mechanical draft) are used to push or pull air
through the tower
• Types:
Natural Draft Cooling Tower
Mechanical Draft Cooling Tower

Cooling Tower Operational Theory
A cooling tower is a heat exchanger where two fluids (air and water) are brought into direct contact.
The heat gained by the air equals the heat lost by the water
G(h2-h1) = L(t1-t2)• G = Mass flow of dry air lbm/min
• h1 = Enthalpy of entering air btu/lbm (dry air)
• h2 = Enthalpy of leaving air btu/lbm (dry air)
• L= Mass flow of water lb/min
• t1 = Hot water temperature entering tower
• t2 = cold water temperature leaving tower

Cooling Tower Temperature Relationships

Cooling Tower Performance Calculation –Input Parameters
• WBT (Wet Bulb Temperature)
• DBT (Dry Bulb Temperature)
• RH (Relative Humidity)
• CWT (Cold Water Temperature)
• HWT (Hot Water Temperature)
• CW Flow (Circulating Water)
• Fan Horse Power
When RH = 100%, the air
is not able to hold any
more water and so water
will not evaporate in
100% humid air (WBT = .
DBT). But when the RH is
less than 100%, the WBT
will be less than the DBT
and water will evaporate.

Performance Calculation Results & Definitions
• Cooling Tower Range = HWT minus CWT
• Cooling Tower Approach = CWT minus WBT
• lower is better; good parameter to trend
• approach changes are inverse to airflow passing through tower
– airflow in natural draft towers is a function of buoyancy from air density
delta between inside to outside of tower
• Predicted CW Flow• obtained from manufacturer design curves and input parameters
• Capability = Ratio of actual and predicted CW flow• actual flow corrected for fan power in mechanical draft towers
• Predicted CWT• obtained from manufacturer design curves and input parameters
• Generation Impact• difference in generation based upon actual and predicted CWTs

Cooling Tower Capability
• The capability is an indicator of how close the tower is
able to bring the CWT to the WBT of the incoming air
(lower approach).
• A larger cooling tower [i.e. moves more air and/or has
more fill] will produce a lower approach for a given heat
load, flow rate and entering air condition.
• The lower the WBT (indicates either cool air, low humidity
or a combination of the two) the better the tower can cool
the water. – the thermal performance of the cooling tower is thus affected by the
entering WBT

Cooling Tower Predicted CW Flow and Temperatures
• Obtained using set of manufacturers performance curves
• Curve outputs include:– CWT
• Curve inputs include:– WBT
– Range
– RH
The Following Slides Show Step by
Step How to Calculate Predicted
CW Flow and Capability

Step 1: Collect Curve Input Data (test or real-time)
Step 1: Test Data
Parameter Reading Units
Flow 9500 gpm
CWT 85 Deg F
WBT 79.8 Deg F
Range 28 Deg F
Fan Power 110 HP

Step 2: Read Predicted Values from Curves
Step 2: Read Predicted Values From Vendor Supplied Performance
Curves at Measured Wet Bulb Temperature and CW Flows
Step 2 Plot Perf. Curve Data
Range 9000 10000 11000
24 83.9 84.5 85.0
30 84.3 85.1 85.9
36 84.5 85.2 86.4
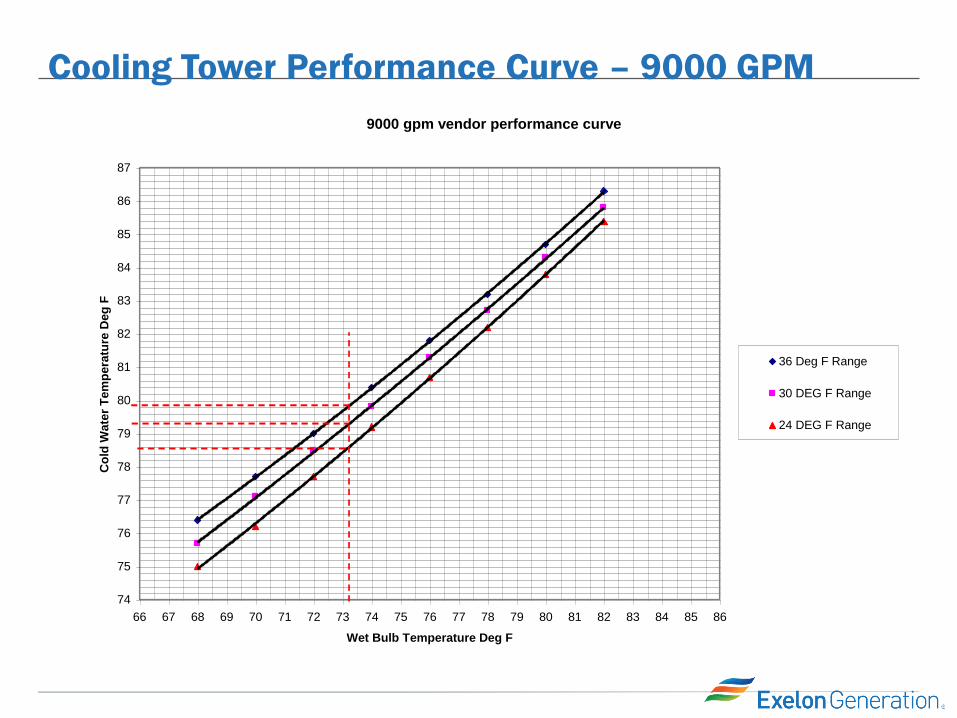
Cooling Tower Performance Curve – 9000 GPM
9000 gpm vendor performance curve
74
75
76
77
78
79
80
81
82
83
84
85
86
87
66 67 68 69 70 71 72 73 74 75 76 77 78 79 80 81 82 83 84 85 86
Wet Bulb Temperature Deg F
Co
ld W
ate
r T
em
pera
ture
Deg
F
36 Deg F Range
30 DEG F Range
24 DEG F Range

Cooling Tower Performance Curve -10000 GPM
10000 gpm vendor performance curve
75
76
77
78
79
80
81
82
83
84
85
86
87
88
66 67 68 69 70 71 72 73 74 75 76 77 78 79 80 81 82 83 84 85 86
Wet Bulb Temperature Deg F
Co
ld W
ate
r T
em
pera
ture
Deg
F
36 Deg F Range
30 DEG F Range
24 DEG F Range

Cooling Tower Performance Curve -11000 GPM
11000 gpm vendor performance curve
76
77
78
79
80
81
82
83
84
85
86
87
88
89
66 67 68 69 70 71 72 73 74 75 76 77 78 79 80 81 82 83 84 85 86
Wet Bulb Temperature Deg F
Co
ld W
ate
r T
em
pera
ture
Deg
F
36 Deg F Range
30 DEG F Range
24 DEG F Range
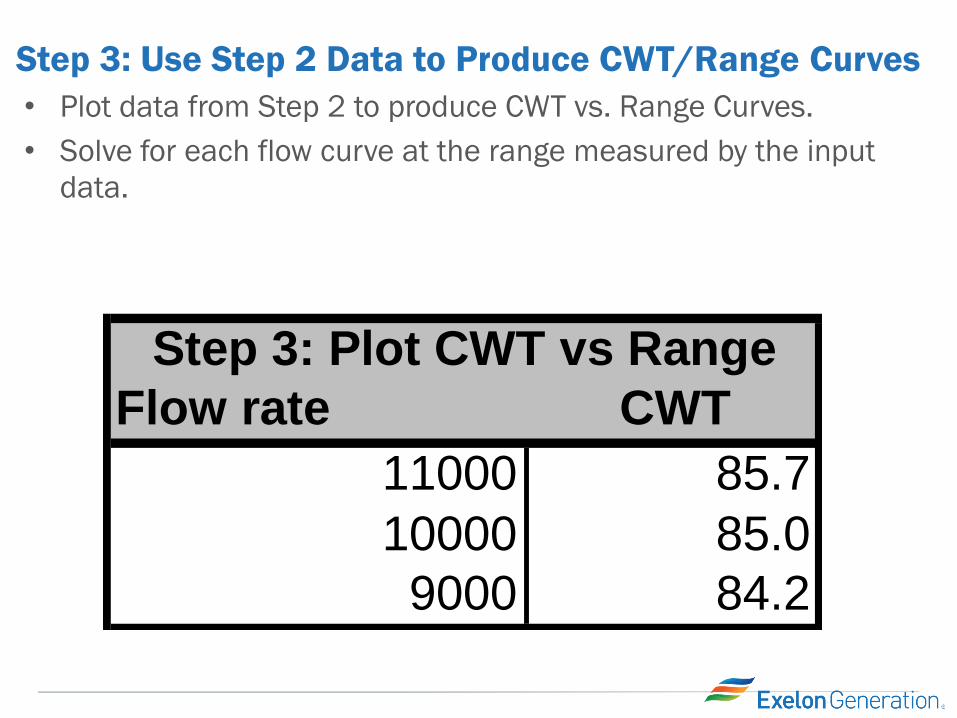
Step 3: Use Step 2 Data to Produce CWT/Range Curves
• Plot data from Step 2 to produce CWT vs. Range Curves.
• Solve for each flow curve at the range measured by the input
data.
Flow rate CWT
11000 85.7
10000 85.0
9000 84.2
Step 3: Plot CWT vs Range

Step 3: Use Step 2 Data to Produce CWT/Range CurvesPlot CWT VS Range for all flows (Step 3)
y = -0.0071x2 + 0.5441x + 76
y = -0.0082x2 + 0.5481x + 76.045
y = -0.0027x2 + 0.214x + 80.304
82.0
82.5
83.0
83.5
84.0
84.5
85.0
85.5
86.0
86.5
87.0
20 21 22 23 24 25 26 27 28 29 30 31 32 33 34 35 36 37
Range DEG F
Co
ld W
ate
r T
em
p D
eg
F
9000
10000
11000
Poly. (11000)
Poly. (10000)
Poly. (9000)

Step 4: Determine Predicted CW Flow
Step 4: Determine Predicted CW Flow
• Cross plot Step 4 graph to produce a CWT vs. Predicted CW Flow
curve.
• Read from this curve the Predicted CW Flow at the measured
CWT.

Step 4: Plot CWT vs. Predicted FlowPlot of CWT vs Predicted Flow and test range and Wet Bulb Temperature (step 4)
y = 95.219x2 - 14830x + 582617
8000
8500
9000
9500
10000
10500
11000
11500
12000
84.0 84.2 84.4 84.6 84.8 85.0 85.2 85.4 85.6 85.8
CWT Deg F
Flo
w G
PM
Series1
Poly. (Series1)

Step 5: Correct Actual CW Flow for Fan Power
Adjusted Test Flow =
Test Flow * (Design Fan HP/Test Fan HP)1/3
Design Fan HP = 120
Measured Fan HP = 108
Adjusted Test Flow = 9500 *(120/108) 1/3 = 9780 gpm
Mechanical Draft only.
Natural draft has no flow
correction.

Step 6: Calculate Cooling Tower Capability
% CAPABILITY = ADJUSTED CW FLOW x 100
PREDICTED CW FLOW
% CAPABILITY = 9780 GPM x 100 = 97.56%
10024 GPM

Exelon Nuclear Units with Cooling Towers
• Byron Unit 1 & 2 (Counterflow Conversion from Cross flow)
• Nine Mile Point Unit 2 (Counterflow)
• Limerick Unit 1 & 2 (Crossflow)
• TMI A (Counterflow Conversion) & B (Crossflow)
• Dresden 2 & 3 (Mechanical Draft, Counterflow)
• Peach Bottom 2 & 3 (Mechanical Draft, Crossflow)

Byron 1 & 2 (Counterflow Conversion from Crossflow)

22
Exelon Cooling Tower Thermal Performance Background
Background:
• Cooling tower monitoring with Excel lacked
functionality due to software upgrades and
using off-line data
• PMAX, a recently available real-time cooling
tower monitoring tool needed verification to
be used as a replacement to Excel based
performance calculations
Goals:
• Audit the site-specific spreadsheets and
PMAX engineering models and then
compare to ensure accurate performance
monitoring of cooling towers
• Replace site-specific spreadsheets with
PMAX

23
Exelon Cooling Tower Calculation (Excel Based)

PMAX Real-Time Cooling Tower Performance Displays (web based)

Exelon Real-Time Cooling Tower Performance Display

Exelon Real-Time Condenser Performance Display

Sample Cooling Tower Performance Trend – Approach and Range
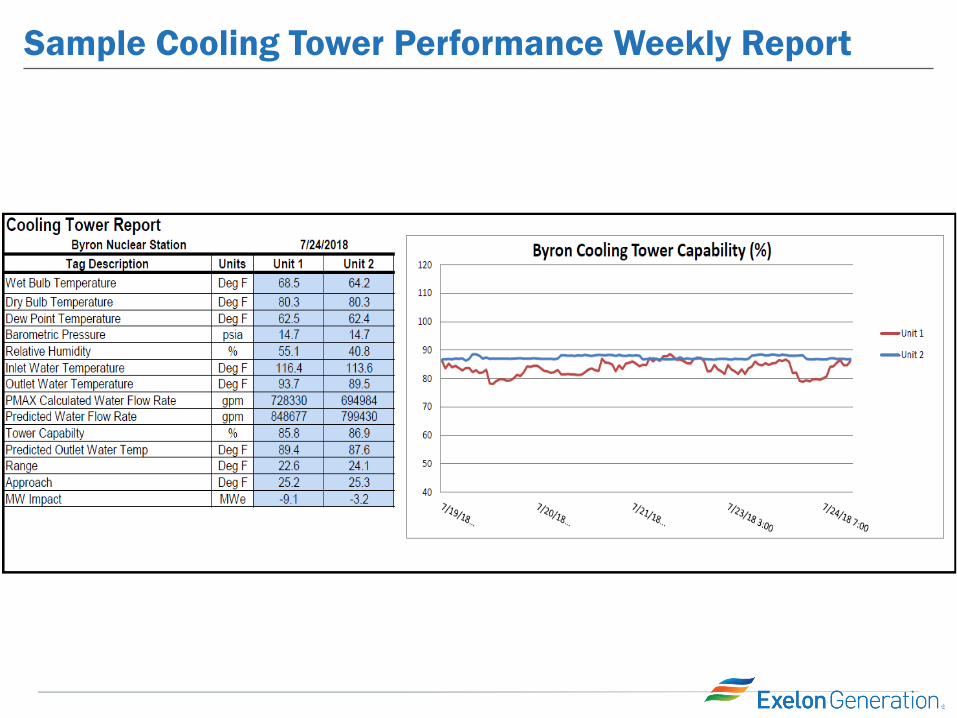
Sample Cooling Tower Performance Weekly Report
29
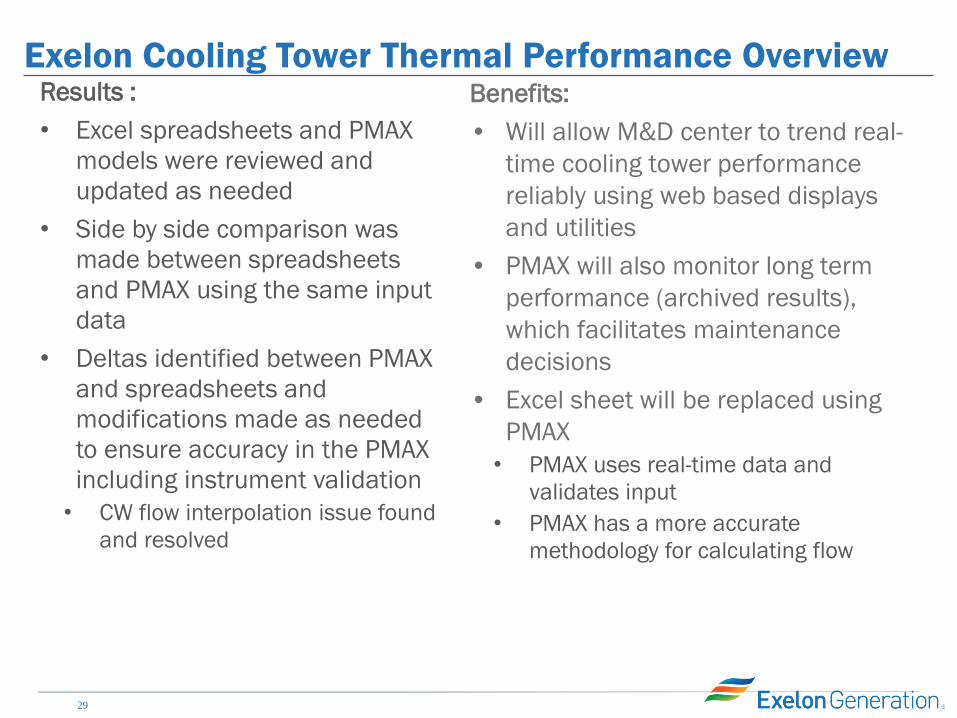
Exelon Cooling Tower Thermal Performance OverviewResults :
• Excel spreadsheets and PMAX
models were reviewed and
updated as needed
• Side by side comparison was
made between spreadsheets
and PMAX using the same input
data
• Deltas identified between PMAX
and spreadsheets and
modifications made as needed
to ensure accuracy in the PMAX
including instrument validation
• CW flow interpolation issue found
and resolved
Benefits:
• Will allow M&D center to trend real-
time cooling tower performance
reliably using web based displays
and utilities
• PMAX will also monitor long term
performance (archived results),
which facilitates maintenance
decisions
• Excel sheet will be replaced using
PMAX
• PMAX uses real-time data and
validates input
• PMAX has a more accurate
methodology for calculating flow

Conclusion
• Cooling tower performance results are
calculated and presented in real-time
• Instruments can be validated before
entering performance calculations
• Cooling tower performance
calculation inputs and results are
archived and available for trends,
reports (automated and manual),
alarm checks, and diagnostics
• Web based displays presenting
cooling tower performance
information are available to all users
within the utility to assist with quickly
finding thermal performance issues
quickly

Questions?