Terrestrial Laser Scanner for Surveying and Monitoring Middle Age Towers
13
TS 4D – TLS Application I 4445 1/13 Eleonora Bertacchini, Emanuele Boni, Alessandro Capra, Cristina Castagnetti, Marco Dubbini Terrestrial laser scanner for surveying and monitoring middle age towers FIG Congress 2010 Facing the Challenges – Building the Capacity Sydney, Australia, 11-16 April 2010 Terrestrial Laser Scanner for Surveying and Monitoring Middle Age Towers Eleonora BERTACCHINI, Emanuele BONI, Alessandro CAPRA, Cristina CASTAGNETTI, Marco DUBBINI, Italy Key words: Deformation measurement, engineering survey, laser scanning, positioning. SUMMARY We had the opportunity to make surveying of some middle age towers located in Emilia Romagna region (Italy): Ghirlandina tower (Modena), “Della Sagra” tower (Carpi, Modena) , Asinelli tower (Bologna). Those towers are very interesting by architectural and artistic point of view; Ghirlandina and Asinelli are Cultural Heritage site of UNESCO. Terrestrial laser scanner (TLS) instrument has been used with an accuracy at 1 cm level in order to obtain good restitution in absolute coordinates, even with a precise topographic determination of GCP (Ground Control Points). Tridimensional restitution of the towers is here presented; we would like to point out the attention on the way that we use the TLS for enhancing the geometrical characteristics, particularly the height of the towers and the axis development that were determined through the trajectory of barycenter of transversal sections. The determination of actual geometry is essential for the study of the buildings and it is a first fundamental step for monitoring the towers.
-
Upload
independent -
Category
Documents
-
view
1 -
download
0
Transcript of Terrestrial Laser Scanner for Surveying and Monitoring Middle Age Towers
TS 4D – TLS Application I 4445 1/13
Eleonora Bertacchini, Emanuele Boni, Alessandro Capra, Cristina Castagnetti, Marco Dubbini
Terrestrial laser scanner for surveying and monitoring middle age towers
FIG Congress 2010
Facing the Challenges – Building the Capacity
Sydney, Australia, 11-16 April 2010
Terrestrial Laser Scanner for Surveying and Monitoring Middle Age
Towers
Eleonora BERTACCHINI, Emanuele BONI, Alessandro CAPRA,
Cristina CASTAGNETTI, Marco DUBBINI, Italy
Key words: Deformation measurement, engineering survey, laser scanning, positioning.
SUMMARY
We had the opportunity to make surveying of some middle age towers located in Emilia
Romagna region (Italy): Ghirlandina tower (Modena), “Della Sagra” tower (Carpi, Modena)
, Asinelli tower (Bologna). Those towers are very interesting by architectural and artistic
point of view; Ghirlandina and Asinelli are Cultural Heritage site of UNESCO.
Terrestrial laser scanner (TLS) instrument has been used with an accuracy at 1 cm level in
order to obtain good restitution in absolute coordinates, even with a precise topographic
determination of GCP (Ground Control Points).
Tridimensional restitution of the towers is here presented; we would like to point out the
attention on the way that we use the TLS for enhancing the geometrical characteristics,
particularly the height of the towers and the axis development that were determined through
the trajectory of barycenter of transversal sections.
The determination of actual geometry is essential for the study of the buildings and it is a first
fundamental step for monitoring the towers.

TS 4D – TLS Application I 4445 2/13
Eleonora Bertacchini, Emanuele Boni, Alessandro Capra, Cristina Castagnetti, Marco Dubbini
Terrestrial laser scanner for surveying and monitoring middle age towers
FIG Congress 2010
Facing the Challenges – Building the Capacity
Sydney, Australia, 11-16 April 2010
Terrestrial Laser Scanner for Surveying and Monitoring Middle Age
Towers
Eleonora BERTACCHINI, Emanuele BONI, Alessandro CAPRA,
Cristina CASTAGNETTI, Marco DUBBINI, Italy
1. INTRODUCTION
Terrestrial laser scanner technology applied to historical monuments is a useful instrument to
establish structure geometry and it assures a global and accurate analysis of architectures
although their complexity. The resulting three-dimensional survey is an essential database for
both structural features evaluation and restoration activities planning.
The definition of a tridimensional digital model, indeed, allows the knowledge of the real
geometry; in addition to that, the 3D model can be enriched by means of a texture of
photographical high resolution images, allowing a detailed analysis of surface features and the
generation of photorealistic models known as “virtual realities”.
The University of Modena worked together with local governments for the conservation and
analysis of cultural heritage and these important collaborations allowed the authors to identify
survey procedures and processing methods specific for the study of structures with a mainly
vertical extension. This paper deals with the Asinelli Tower in Bologna (Italy), the
Ghirlandina Tower and “Della Sagra” Tower in Modena (Italy) surveys. All these towers,
dating back to the 12th century and built in brickwork, are examples of the North-Italian
Romanesque style.. Some differences also exist among them, such as the way they were built,
their height, the foundation type and the following modifications.
Figure 1: From left to right: “Della Sagra” Tower (Modena-Italy), Ghirlandina
Tower (Modena-Italy) and Asinelli Tower (Bologna-Italy)
TS 4D – TLS Application I 4445 3/13
Eleonora Bertacchini, Emanuele Boni, Alessandro Capra, Cristina Castagnetti, Marco Dubbini
Terrestrial laser scanner for surveying and monitoring middle age towers
FIG Congress 2010
Facing the Challenges – Building the Capacity
Sydney, Australia, 11-16 April 2010
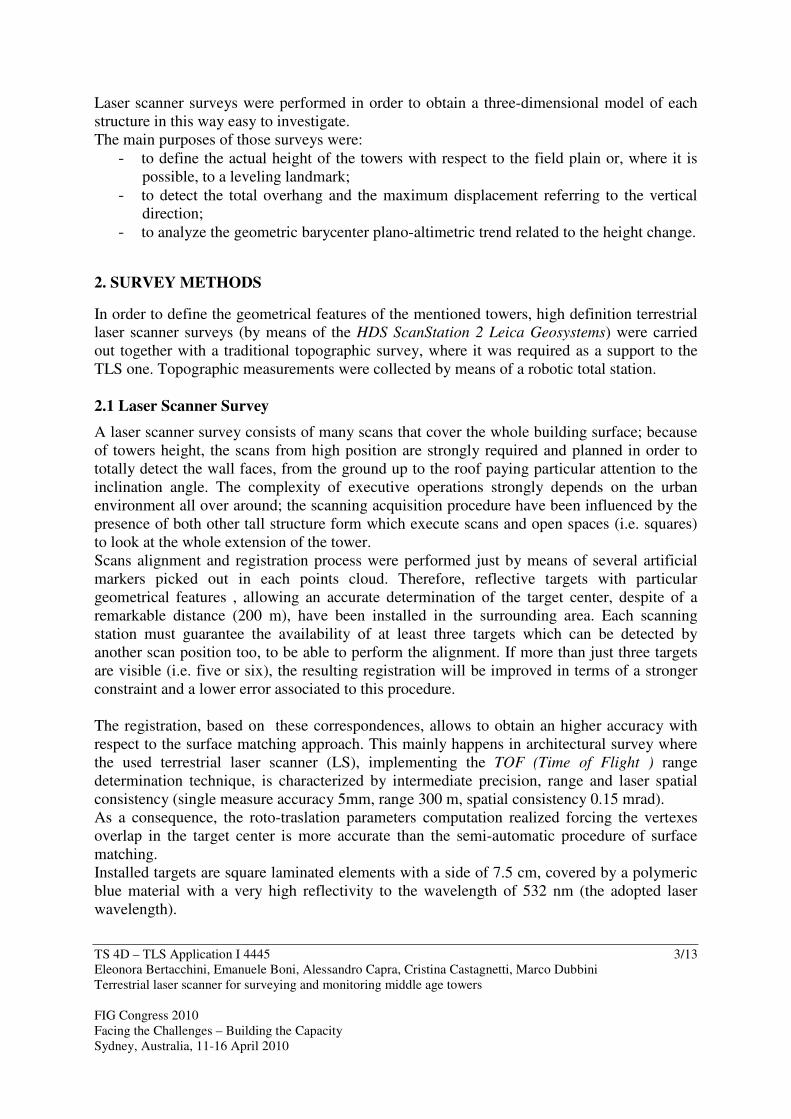
Laser scanner surveys were performed in order to obtain a three-dimensional model of each
structure in this way easy to investigate.
The main purposes of those surveys were:
- to define the actual height of the towers with respect to the field plain or, where it is
possible, to a leveling landmark;
- to detect the total overhang and the maximum displacement referring to the vertical
direction;
- to analyze the geometric barycenter plano-altimetric trend related to the height change.
2. SURVEY METHODS
In order to define the geometrical features of the mentioned towers, high definition terrestrial
laser scanner surveys (by means of the HDS ScanStation 2 Leica Geosystems) were carried
out together with a traditional topographic survey, where it was required as a support to the
TLS one. Topographic measurements were collected by means of a robotic total station.
2.1 Laser Scanner Survey
A laser scanner survey consists of many scans that cover the whole building surface; because
of towers height, the scans from high position are strongly required and planned in order to
totally detect the wall faces, from the ground up to the roof paying particular attention to the
inclination angle. The complexity of executive operations strongly depends on the urban
environment all over around; the scanning acquisition procedure have been influenced by the
presence of both other tall structure form which execute scans and open spaces (i.e. squares)
to look at the whole extension of the tower.
Scans alignment and registration process were performed just by means of several artificial
markers picked out in each points cloud. Therefore, reflective targets with particular
geometrical features , allowing an accurate determination of the target center, despite of a
remarkable distance (200 m), have been installed in the surrounding area. Each scanning
station must guarantee the availability of at least three targets which can be detected by
another scan position too, to be able to perform the alignment. If more than just three targets
are visible (i.e. five or six), the resulting registration will be improved in terms of a stronger
constraint and a lower error associated to this procedure.
The registration, based on these correspondences, allows to obtain an higher accuracy with
respect to the surface matching approach. This mainly happens in architectural survey where
the used terrestrial laser scanner (LS), implementing the TOF (Time of Flight ) range
determination technique, is characterized by intermediate precision, range and laser spatial
consistency (single measure accuracy 5mm, range 300 m, spatial consistency 0.15 mrad).
As a consequence, the roto-traslation parameters computation realized forcing the vertexes
overlap in the target center is more accurate than the semi-automatic procedure of surface
matching.
Installed targets are square laminated elements with a side of 7.5 cm, covered by a polymeric
blue material with a very high reflectivity to the wavelength of 532 nm (the adopted laser
wavelength).

TS 4D – TLS Application I 4445 4/13
Eleonora Bertacchini, Emanuele Boni, Alessandro Capra, Cristina Castagnetti, Marco Dubbini
Terrestrial laser scanner for surveying and monitoring middle age towers
FIG Congress 2010
Facing the Challenges – Building the Capacity
Sydney, Australia, 11-16 April 2010
A white circle with a 2.5 cm diameter is located in the center of each target, allowing the
exact vertex positioning. Thanks to the high target reflectivity, the LS is able to quickly
identify the most reasonable position of targets as soon as the points clouds acquisition is
finished.
A very high resolution scan (acquisition rate 1 mm), a little bit larger than the target area, is
recommended to exactly place the vertex at the center of the target: the TLS, knowing the
geometry of targets, places the vertex at the very center of each targets, also identifying them
by a number.
Figure 2: Reflective targets used for the registration (on the left);targets installation on the tower’s
wall(on the right) . In each tower at least eight targets were placed in every wall, close to the edges and
equally distributed along the tower’s extent.
Targets were placed on walls both of the tower and of the neighbouring buildings; their
position and number guarantee an high global accuracy (sub-centimetric) of the 3D digital
model.
Remembering the purpose of this work, which is the survey of structures with mainly vertical
extension, points clouds have to be blocked at the top of the tower; this is achieved through
location and detection of common points close to the top. The points clouds registration can
be even obtained by means of the identification of common targets just at the bottom of the
tower.
The point cloud registration can also be obtained by identifying common targets only at the
bottom of the tower. However, no matter how numerous the targets may be, this method
would result in a cloud displacement at the top of the building that cannot be ignored.
For all of the three surveys, targets were installed along the extent of the tower or up high on
the neighboring buildings. Target application must not be underestimated, as it is essential to
the subsequent acquisition phase. In the case of towers, suitable equipment (such as aerial
baskets) or specialists (such as climbers) are often required.

TS 4D – TLS Application I 4445 5/13
Eleonora Bertacchini, Emanuele Boni, Alessandro Capra, Cristina Castagnetti, Marco Dubbini
Terrestrial laser scanner for surveying and monitoring middle age towers
FIG Congress 2010
Facing the Challenges – Building the Capacity
Sydney, Australia, 11-16 April 2010
Careful inspection of the site is therefore essential in order to spot the optimum scanning
positions and to arrange for target installation. It is important to make sure that the markers
will remain fixed throughout the survey period, without however damaging the structure they
are applied to (especially when dealing with buildings of great historic and architectural value
– as in our case). Fixing can be made by means of two-component chemical reagents,
adhesives, nails or small bolts, as the case may require.
A sampling step of 8 mm was set on each scan station at the average distance from the surface
to scan, but only where this resolution was significant.
Since the towers are located within the historic centre of towns, are very tall and not
surrounded by similarly high buildings, for some of the tower sides the survey had to be
carried out from ground stations (e.g. west side of the Asinelli tower). In order to reduce the
laser beam inclination angle in the upper part of the tower, a moderate distance was chosen
(100m). Therefore, taking into account beam divergence, the laser spot generates a mark on
the building of approximately 1.5 cm. Setting an 8 mm scanning step, which was remarkably
below the laser spot size, would not have been very significant and in fact disadvantageous
because of the higher scanning time.
The laser scanner featured dual axis compensation (1.5” regulation), which is essential for
accurate verticality survey models. It integrated also a camera – coaxial to the laser beam –
capable of tiling the instrument field of vision with 24x24 size and 1 Megapixel resolution
images. By texturing the point model with these images, a cloud can be obtained in which the
points, besides 3D coordinates, bear reflectance and RGB information. This allows production
of realistic orthophotos with valuable metric accuracy, using relatively simple procedures.
2.2 Total Station Survey
The vertical development of the buildings also suggested carrying out an additional high
precision topographic survey (1” angular resolution and 1mm+1ppm accuracy for distance
measurement) by means of a grid comprised of ground stations and retro-reflective targets.
Figure 3: On the left total station and prisms during acquisition; on the right statistic analysis of the
support network

TS 4D – TLS Application I 4445 6/13
Eleonora Bertacchini, Emanuele Boni, Alessandro Capra, Cristina Castagnetti, Marco Dubbini
Terrestrial laser scanner for surveying and monitoring middle age towers
FIG Congress 2010
Facing the Challenges – Building the Capacity
Sydney, Australia, 11-16 April 2010
This was essential also in order to combine the interior surveys with the external environment
surveys. At the “Della Sagra” tower (Carpi, Modena, Italy), an external traverse survey was
carried out, made up of 10 station points, collimated by means of a robotic total station which
allowed the scans to be referenced within an univocal local reference system.
The station points were defined so as to make a closed ring around the Della Sagra tower and
they were identified by characteristic local flooring elements or suitable markers. This will
help in the case the survey must be repeated or for further measurements at a later time: a
local reference system was created on the square and, consequently, every additional
measurement connected with studies or checks of the tower can be georeferenced within the
same reference system used for all current measurements and calculations.
From each station point of the traverse survey, the following was collimated, in sequence: the
previous vertex, used for instrument orientation, the next vertex, previously fitted with prisms,
and a sufficient number of visible targets. The reference system was then shifted into the
tower, to the floors that have windows, and interior targets were collimated from the interior
vertexes.
3. DATA PROCESSING
Data analysis and processing was carried out using Cyclone 6.0 software, suitable for display,
investigation and editing of models comprised of hundreds of millions of points. However, to
avoid too large point models (above 200 million points), the scans had to be examined and
optimized one by one, removing the unnecessary data. For this purpose, percentage reduction
filters were used, where geometrically allowed (surface coplanarity), as well as ad hoc cuts
for removing gross errors and objects unrelated with the survey.
3.1 Points Clouds Registration
The 3D digital models were generated by registering the point clouds of the individual scans.
This allowed all the point clouds to be referred to the reference system of a desired scan in
which the z axis coincides with the vertical, thanks to activation of the dual-axis compensator.
The error, meant as the distance between the same vertex in the different point clouds after
merging, was always less than 1 cm. This alignment error must be added to the intrinsic
acquisition accuracy (ScanStation 2 TOF LS accuracy: 5mm). The 3D point model shows
centimeter precision, that is more than adequate in order to survey the geometry of the
structure and to allow future analysis of its behavior.
In the case of the “Della Sagra” tower, a topographic survey was also carried out, both as a
supporting survey and for merging the interior and exterior measurements. But this did not
increase model accuracy compared to cloud registration through homologous targets.
At the Asinelli tower, despite the height of above 90 metres, a careful arrangement of the scan
stations enabled us to obtain a similar accuracy level - approx. 1 cm - while preserving perfect
coplanarity of the sides acquired from different scan points, including the top area.

TS 4D – TLS Application I 4445 7/13
Eleonora Bertacchini, Emanuele Boni, Alessandro Capra, Cristina Castagnetti, Marco Dubbini
Terrestrial laser scanner for surveying and monitoring middle age towers
FIG Congress 2010
Facing the Challenges – Building the Capacity
Sydney, Australia, 11-16 April 2010
Figure 4: Report of the registration between two point clouds. The accuracy levels,
constraint characteristics and roto-translation parameters are specified.
Figure 5: 3D points digital models after registration and clouds cleaning (Ghirlandina
Tower on the left, Asinelli Tower on the right)

TS 4D – TLS Application I 4445 8/13
Eleonora Bertacchini, Emanuele Boni, Alessandro Capra, Cristina Castagnetti, Marco Dubbini
Terrestrial laser scanner for surveying and monitoring middle age towers
FIG Congress 2010
Facing the Challenges – Building the Capacity
Sydney, Australia, 11-16 April 2010
3.2 3D Analisys
Having the overall point model available, means handling the metric content of the structure.
Processing this model by applying cut-planes and extracting slices allows calculation of the
overall height of the structure, but also determination of the position of the geometric
barycenter and its variation along the elevation, that is overhang of the towers.
The first data that can be determined is the height of the towers. This can be calculated
directly on a point model after identifying leveling benchmarks or the walk-on plane at the
entrance. It is a very simple operation which however requires careful attention, since the
acquisition of the roofing elements on top is often incomplete because of the limited view
angle. In order to compare the measurements taken with historical data, geometric details
must be clearly identifiable on the 3D model and their geometry must have remained
unchanged over the years.
The operation required is a difference between the z coordinates of the model points. Being
the z axis representative of the vertical plane, the height of the tower is obtained. This does
not always correspond to the original height, that is the length of the longitudinal axis.
In order to obtain the inclined height, the above measurement must be corrected by the
inclination angle of the tower.
Figura 6 : Top view of slices of the Ghirlandina tower (each section line corresponds to a
10 m difference in elevation) and projection on the horizontal plane of the section
barycenter positions from 15 m elevation to the top.
A geometric characteristic that is essential in order to assess the structural behavior of a
building extending basically in the vertical direction is its inclination from the vertical axis.
A first indication of the structure behavior can be obtained directly with Cyclone. Its
orthographic views and editing tools allow a preliminary estimate of the overall overhang and
its main direction.

TS 4D – TLS Application I 4445 9/13
Eleonora Bertacchini, Emanuele Boni, Alessandro Capra, Cristina Castagnetti, Marco Dubbini
Terrestrial laser scanner for surveying and monitoring middle age towers
FIG Congress 2010
Facing the Challenges – Building the Capacity
Sydney, Australia, 11-16 April 2010
However, in order to calculate the out-of-plumb with due accuracy, the barycenter of the
reference base and top sections must be determined. In this case, the required data processing
was made using a CAD system.
Regarding the subject type of work, it is essential to be aware that both the high slenderness
of the structures and their construction history, may bring about a behavior that is different
from the rotation of a rigid body. From this comes the need to know the real plane-altimetric
development of the barycentric axis and to analyze its reactions with type of foundations,
section variations, corrections that were made during construction
and subsequent extension and restoration works.
In order to characterize the structure of the barycentric axis of the
tower, thin horizontal slices of the model (approximately 10 cm)
have been extracted. Considering that the number of points wasn’t
elevated (some thousand), it has been possible to import the slices in
CAD work setting and to quickly vectorialize the section, through
modeling tools taken from the CloudWorx application.
Then the position of the geometric barycentre in the 3D space has
been determined tracing the diagonals of the sections that show a
double symmetry.
Obviously, the matching between geometric barycentre and real
barycentre of the section is a function of the masses distribution, and
secondary of the symmetry of the walls regarding both thickness and
materials.
For this purpose, it would be important to realize LS scans of the
indoor space.
In fact the survey executed to the Sagra’s Tower, interesting both the
external surface and the indoor geometries, enabled us to accurately
determine the thickness of the tower walls and floors (Figure 6). The
inner spaces have an almost square plant with a 4,5 m long facet and
the walls continue to be thicker than a meter, though losing thickness
on top.
Despite a height of almost 50 meters, this structure is rather compact.
The behavior that was detected was the rotation of a rigid body about
the base of the northern side.
3.3 Main Case : Asinelli Tower
A careful analysis was made for the Asinelli tower in Bologna (Italy). This over 90 meter tall
structure dates back to the Middle Ages and stands in the middle of the old town. The
building is a masonry construction with a selenite base resting on alluvial soil subject to
subsidence.
The analysis, whose first part was carried out similarly to Ghirlandina Tower, showed minor
buckling in the north-south direction (4 cm max. distance between barycenters of the sections
Figura 7: Silhouette view
of “Della Sagra” Tower
3D model showing
outdoor and indoor scans

TS 4D – TLS Application I 4445 10/13
Eleonora Bertacchini, Emanuele Boni, Alessandro Capra, Cristina Castagnetti, Marco Dubbini
Terrestrial laser scanner for surveying and monitoring middle age towers
FIG Congress 2010
Facing the Challenges – Building the Capacity
Sydney, Australia, 11-16 April 2010
every 5 meters elevation), whereas a 211 cm displacement was detected from the vertical
towards west.
This overhang measure is the planimetric distance between the barycenter of the first section
that can be identified above the base (10 m elevation) and the top of the tower not including
the turret on the top (90m). In order to determine a value that is representative of the actual
out-of-plumb of the structure, it is necessary to extrapolate the barycenter of the ground
section by prolonging the barycentric axis in the most appropriate way.
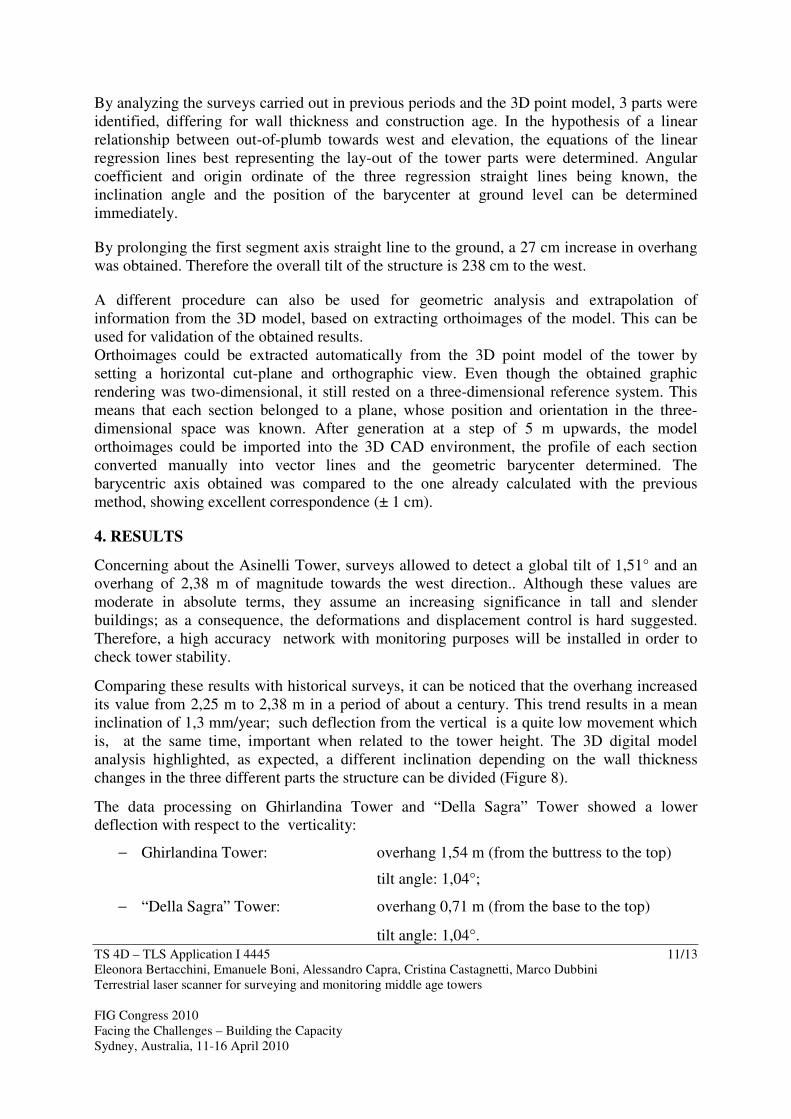
Figure 8: Regression straight lines showing the correlation between overhang to the west
and elevation in the three sections of the Asinelli tower and view of the south side of the
tower with the different tilt degrees in the three sections.
TS 4D – TLS Application I 4445 11/13
Eleonora Bertacchini, Emanuele Boni, Alessandro Capra, Cristina Castagnetti, Marco Dubbini
Terrestrial laser scanner for surveying and monitoring middle age towers
FIG Congress 2010
Facing the Challenges – Building the Capacity
Sydney, Australia, 11-16 April 2010
By analyzing the surveys carried out in previous periods and the 3D point model, 3 parts were
identified, differing for wall thickness and construction age. In the hypothesis of a linear
relationship between out-of-plumb towards west and elevation, the equations of the linear
regression lines best representing the lay-out of the tower parts were determined. Angular
coefficient and origin ordinate of the three regression straight lines being known, the
inclination angle and the position of the barycenter at ground level can be determined
immediately.
By prolonging the first segment axis straight line to the ground, a 27 cm increase in overhang
was obtained. Therefore the overall tilt of the structure is 238 cm to the west.
A different procedure can also be used for geometric analysis and extrapolation of
information from the 3D model, based on extracting orthoimages of the model. This can be
used for validation of the obtained results.
Orthoimages could be extracted automatically from the 3D point model of the tower by
setting a horizontal cut-plane and orthographic view. Even though the obtained graphic
rendering was two-dimensional, it still rested on a three-dimensional reference system. This
means that each section belonged to a plane, whose position and orientation in the three-
dimensional space was known. After generation at a step of 5 m upwards, the model
orthoimages could be imported into the 3D CAD environment, the profile of each section
converted manually into vector lines and the geometric barycenter determined. The
barycentric axis obtained was compared to the one already calculated with the previous
method, showing excellent correspondence (± 1 cm).
4. RESULTS
Concerning about the Asinelli Tower, surveys allowed to detect a global tilt of 1,51° and an
overhang of 2,38 m of magnitude towards the west direction.. Although these values are
moderate in absolute terms, they assume an increasing significance in tall and slender
buildings; as a consequence, the deformations and displacement control is hard suggested.
Therefore, a high accuracy network with monitoring purposes will be installed in order to
check tower stability.
Comparing these results with historical surveys, it can be noticed that the overhang increased
its value from 2,25 m to 2,38 m in a period of about a century. This trend results in a mean
inclination of 1,3 mm/year; such deflection from the vertical is a quite low movement which
is, at the same time, important when related to the tower height. The 3D digital model
analysis highlighted, as expected, a different inclination depending on the wall thickness
changes in the three different parts the structure can be divided (Figure 8).
The data processing on Ghirlandina Tower and “Della Sagra” Tower showed a lower
deflection with respect to the verticality:
− Ghirlandina Tower: overhang 1,54 m (from the buttress to the top)
tilt angle: 1,04°;
− “Della Sagra” Tower: overhang 0,71 m (from the base to the top)
tilt angle: 1,04°.

TS 4D – TLS Application I 4445 12/13
Eleonora Bertacchini, Emanuele Boni, Alessandro Capra, Cristina Castagnetti, Marco Dubbini
Terrestrial laser scanner for surveying and monitoring middle age towers
FIG Congress 2010
Facing the Challenges – Building the Capacity
Sydney, Australia, 11-16 April 2010
Significant aspects to take into account in order to realize an efficient work are:
− The reconstruction resolution of the barycentric axis could be increased through the
definition of an increasing number of horizontal slices. It is possible to keep a shorter cut-
plane sampling rate without any further complications in the analysis procedure.
− The indoor environments survey could be useful in order to check the actual symmetry of
the structure; the mass center, indeed, is strongly influenced by walls thickness.
− The described survey procedure and processing methods allow an accurate determination
of towers height and inclination. The achieved accuracy (centimetric-level precision) is a
great result in relation to the short survey and processing time which was required. In addition
to that, taking into account the big elevation of the towers, it is very hard to perform and even
just think about any different kind of surveying approach.
− The exact and clear location of the barycenter, related to the horizontal slice at the base
of the tower, can be very difficult; in this situation, the actual vertical displacement can only
be known by means of the barycentric axis extrapolation to the ground level. This step is
realized thanks to the 3D digital model available by the laser scanner scans.
REFERENCES
Balzani M., Scopino R., Uccelli F. 2008, “Il rilievo 3D per l’integrazione dei sistemi informativi di
documentazione storica e di restauro della Cattedrale di Pisa e della Piazza dei Miracoli”, Il Cantiere della
Conoscenza;
Bertacchini E., Capra A., Castagnetti C., Dubbini M., 2008, “Il Monitoraggio della Torre civica di Modena
detta della “Ghirlandina”, Proceedings of SIFET08.
Boni E. 2009, “Tecniche di rilievo laser scanner per lo studio dei beni culturali”, Graduation Thesis, Modena.
Cadignani R. et al., 2009, “La torre Ghirlandina: un progetto per la conservazione”, Sossella Editore;
G.Tucci F. Sacerdote., 2007, “Sistemi a scansione per l’architettura e il territorio” Firenze, Allinea Editore;
BIOGRAPHICAL NOTES
Eleonora Bertacchini. Born in Reggio Emilia (Italy) the 18-01-1982. Second level graduation
in 2007 at University of Modena and Reggio Emilia, in Environmental Engineering, now
attending Ph.D. school of “High mechanics and automotive design & techology” interested in
surveying and mapping sciences and remote sensing.
Emanuele Boni was born in Modena (Italy) on 16-10-1984 and is graduate in Environmental
Engineering with first class honours on March 2009. From the beginning of 2010 he is Ph.D.
student at the High Mechanics and Automotive Design&Technology School, University of
Modena (Engineering Faculty). His main studies are focus on laser scanner survey
technologies and point cloud data processing.
Alessandro Capra was born the 5/5/1961 in Bologna. University degree in Mining
Engineering. Full Professor of Surveying and Mapping at Engineering Faculty in Modena of
Modena and Reggio Emilia University. Chief officer of Geosciences group of SCAR
TS 4D – TLS Application I 4445 13/13
Eleonora Bertacchini, Emanuele Boni, Alessandro Capra, Cristina Castagnetti, Marco Dubbini
Terrestrial laser scanner for surveying and monitoring middle age towers
FIG Congress 2010
Facing the Challenges – Building the Capacity
Sydney, Australia, 11-16 April 2010
(Scientific Committee on Antarctic Research). President of SIFET (Italian Society of
Photogrammetry and Surveying) scientific committee. Editor-in.-chief of Applied Geomatics
journal.
Cristina Castagnetti, born in Reggio Emilia (Italy) the 22 July 1982. October 2006 second
level degree in Environmental Engineering with first class honours at Modena University. At
the moment, Ph.D. student at the High Mechanics and Automotive Design&Technology
School, University of Modena (Engineering Faculty). Geomatic is the main topic and in detail
GNSS systems applied to navigation. Scientifical publications: 2.
Marco Dubbini. Born in Ravenna (Italy) the 02 May 1967. Degree in Civil Engineering at
University of Bologna in 1998. Ph.D. in Geodetic and Topographical Sciences at University
of Bologna in 2002. At the moment Scientifical Technical Graduated employment at
University of Bologna. Num. 23 scientifical publications.
CONTACTS
Prof. Alessandro Capra DIMeC - University of Modena and Reggio Emilia
Via Vignolese, 905
41100 Modena
ITALY
Tel. +39-059-2056188
Email: [email protected]