Real-time monitoring of scale formation in reverse osmosis using electrical impedance spectroscopy
8
Real-time monitoring of scale formation in reverse osmosis using electrical impedance spectroscopy Zhixin Hu, Alice Antony n , Greg Leslie, Pierre Le-Clech UNESCO Centre for Membrane Science and Technology, The University of New South Wales, Sydney 2052, Australia article info Article history: Received 12 August 2013 Received in revised form 3 October 2013 Accepted 9 November 2013 Available online 21 November 2013 Keywords: Calcium sulfate Electrical impedance spectroscopy Real time monitoring Reverse osmosis abstract Early detection of scale formation in reverse osmosis systems remains challenging since the bulk measurements of the operating data are not sufficiently sensitive to detect the subtle changes occurring across the membrane. Electrical impedance spectroscopy (EIS) was investigated as a tool for measuring the electrical properties in real time and to identify changes that occur during calcium sulfate scaling in a reverse osmosis system. EIS signals were obtained across a frequency range of 10 1 –10 5 Hz during the filtration of calcium sulfate scale forming constituents in recirculation and batch modes. The measured capacitance and conductance of various electrically distinct layers were compared against the flux measurements, in order to assess their significance to indicate the scale formation. The rate of change in conductance was higher than the flux decline. Change in the conductance value around 38 Hz, corresponding to the coating layer on the active membrane surface was most suitable. From the suggested approach of monitoring the changes in conductance at 10–100 Hz, scale formation can be detected prior to observing any significant permeate flux decline. & 2013 Elsevier B.V. All rights reserved. 1. Introduction Inorganic scale formation during reverse osmosis (RO) filtration is a significant contributor to the decline in hydraulic and removal performance, which eventually results in high operating and maintenance costs [1]. Optimization of system design and operat- ing conditions, combined with appropriate addition of antiscalant agents is now commonly implemented to better control scale formation [2]. In water treatment industries, the only practical method for monitoring the performance of the RO system in-situ and real time relies on the normalization of bulk observations of pressure, flow and conductivity. Specifically, monitoring the per- formance of the tail end RO element is used as a tool to detect the scale formation. A ratio of the tail end specific flux to the overall system flux is relatively stable in absence of scaling; as scale develops in the tail element, the specific flux ratio declines, indicating the severity of the scaling [3]. Thus, continuous mon- itoring of the RO performance allows assessing the extent of fouling on the membrane and the need to conduct chemical cleaning. However, these measurements lack the sensitivity to detect the subtle changes occurring across the membrane that set the trend for either improvement or decline in system performance [4,5]. Therefore, these monitoring parameters are expected to inadequately detect the onset of material deposition on the membrane, and only deliver a significant signal, for well- established fouling formation [6,7]. This phenomenon is exacer- bated in industrial membrane modules, in which significant fouling profiles are observed within the length of the membrane [6]. This lack of detailed and timely assessment of the fouling state can result in delay in applying the necessary cleaning strategies, negating their effectiveness for fully developed scaling layers. Therefore there is a great need to develop an advanced, in-situ, real-time monitoring technique, capable of early detection of the early stages of scale fomation. Among the several in-situ, real-time techniques reported [2,8], ultrasonic time-domain reflectrometry (UTDR) and ex-situ scale observation detector (EXSOD) feature a potential for industrial implementation. UTDR relies on the use of ultrasonic sound waves to detect the thickness of the fouling layer [9], while EXSOD uses high resolution digital photography to assess the fouling charac- teristics [5]. Both methods are capable of detecting membrane scaling and indicating onset of fouling before significant change in flux decline can be measured. With the unique capacity of characterizing and analyzing the structures of micro-porous membranes, electrical impedance spectroscopy (EIS) has been proposed as another valuable approach to study inorganic fouling on RO membranes [10]. Previous studies from Coster and co- workers [10–13] have demonstrated that EIS offers potential for online monitoring of membrane fouling and optimization of operation systems. The recently developed EIS unit enables the Contents lists available at ScienceDirect journal homepage: www.elsevier.com/locate/memsci Journal of Membrane Science 0376-7388/$ - see front matter & 2013 Elsevier B.V. All rights reserved. http://dx.doi.org/10.1016/j.memsci.2013.11.014 n Corresponding author. Tel.: þ61 293 855 373; fax: þ61 293 855 966. E-mail address: [email protected] (A. Antony). Journal of Membrane Science 453 (2014) 320–327
-
Upload
independent -
Category
Documents
-
view
0 -
download
0
Transcript of Real-time monitoring of scale formation in reverse osmosis using electrical impedance spectroscopy

Real-time monitoring of scale formation in reverse osmosisusing electrical impedance spectroscopy
Zhixin Hu, Alice Antony n, Greg Leslie, Pierre Le-ClechUNESCO Centre for Membrane Science and Technology, The University of New South Wales, Sydney 2052, Australia
a r t i c l e i n f o
Article history:Received 12 August 2013Received in revised form3 October 2013Accepted 9 November 2013Available online 21 November 2013
Keywords:Calcium sulfateElectrical impedance spectroscopyReal time monitoringReverse osmosis
a b s t r a c t
Early detection of scale formation in reverse osmosis systems remains challenging since the bulkmeasurements of the operating data are not sufficiently sensitive to detect the subtle changes occurringacross the membrane. Electrical impedance spectroscopy (EIS) was investigated as a tool for measuringthe electrical properties in real time and to identify changes that occur during calcium sulfate scaling in areverse osmosis system. EIS signals were obtained across a frequency range of 10�1–105 Hz during thefiltration of calcium sulfate scale forming constituents in recirculation and batch modes. The measuredcapacitance and conductance of various electrically distinct layers were compared against the fluxmeasurements, in order to assess their significance to indicate the scale formation. The rate of change inconductance was higher than the flux decline. Change in the conductance value around 38 Hz,corresponding to the coating layer on the active membrane surface was most suitable. From thesuggested approach of monitoring the changes in conductance at 10–100 Hz, scale formation can bedetected prior to observing any significant permeate flux decline.
& 2013 Elsevier B.V. All rights reserved.
1. Introduction
Inorganic scale formation during reverse osmosis (RO) filtrationis a significant contributor to the decline in hydraulic and removalperformance, which eventually results in high operating andmaintenance costs [1]. Optimization of system design and operat-ing conditions, combined with appropriate addition of antiscalantagents is now commonly implemented to better control scaleformation [2]. In water treatment industries, the only practicalmethod for monitoring the performance of the RO system in-situand real time relies on the normalization of bulk observations ofpressure, flow and conductivity. Specifically, monitoring the per-formance of the tail end RO element is used as a tool to detect thescale formation. A ratio of the tail end specific flux to the overallsystem flux is relatively stable in absence of scaling; as scaledevelops in the tail element, the specific flux ratio declines,indicating the severity of the scaling [3]. Thus, continuous mon-itoring of the RO performance allows assessing the extent offouling on the membrane and the need to conduct chemicalcleaning. However, these measurements lack the sensitivity todetect the subtle changes occurring across the membrane thatset the trend for either improvement or decline in systemperformance [4,5]. Therefore, these monitoring parameters are
expected to inadequately detect the onset of material depositionon the membrane, and only deliver a significant signal, for well-established fouling formation [6,7]. This phenomenon is exacer-bated in industrial membrane modules, in which significantfouling profiles are observed within the length of the membrane[6]. This lack of detailed and timely assessment of the fouling statecan result in delay in applying the necessary cleaning strategies,negating their effectiveness for fully developed scaling layers.Therefore there is a great need to develop an advanced, in-situ,real-time monitoring technique, capable of early detection of theearly stages of scale fomation.
Among the several in-situ, real-time techniques reported [2,8],ultrasonic time-domain reflectrometry (UTDR) and ex-situ scaleobservation detector (EXSOD) feature a potential for industrialimplementation. UTDR relies on the use of ultrasonic sound wavesto detect the thickness of the fouling layer [9], while EXSOD useshigh resolution digital photography to assess the fouling charac-teristics [5]. Both methods are capable of detecting membranescaling and indicating onset of fouling before significant change influx decline can be measured. With the unique capacity ofcharacterizing and analyzing the structures of micro-porousmembranes, electrical impedance spectroscopy (EIS) has beenproposed as another valuable approach to study inorganic foulingon RO membranes [10]. Previous studies from Coster and co-workers [10–13] have demonstrated that EIS offers potential foronline monitoring of membrane fouling and optimization ofoperation systems. The recently developed EIS unit enables the
Contents lists available at ScienceDirect
journal homepage: www.elsevier.com/locate/memsci
Journal of Membrane Science
0376-7388/$ - see front matter & 2013 Elsevier B.V. All rights reserved.http://dx.doi.org/10.1016/j.memsci.2013.11.014
n Corresponding author. Tel.: þ61 293 855 373; fax: þ61 293 855 966.E-mail address: [email protected] (A. Antony).
Journal of Membrane Science 453 (2014) 320–327
continuous in-situ, real-time monitoring under high pressureconditions; recent studies demonstrated the application of EISfor the functional and structural characterization of RO systemsduring filtration by in-situ real time measurement at a sub-micronlevel [14,15]. These studies developed a method of functionalcharacterization of membranes in real time during the filtrationenabling to understand the changes that occur across the mem-brane and early detection of fouling. However no previous studiescompared the significance of impedance signals against theconventional flux parameters.
In a previous study, dielectric structural modeling of EISmeasurements could detect and characterize five electricallydistinct layers and a concentration/diffusion polarization elementthroughout the filtration experiment [14]. These layers matchedthe known thicknesses of layers in the membrane system. Thein-situ measurements provided a basis for characterizing thestructural features of the RO system, each membrane sublayerresponding to specific frequencies. The frequencies reported weretaken as a rationale for the present study, monitoring the scaleformation in real time using EIS. Calcium sulfate is a non-alkalinescale, presenting significant challenge for its removal from themembrane surface. The objective of this paper was to implementthe EIS technique, to monitor the electrical property changes in ROmembranes and compare the significance of impedance signalsand flux decline in detecting the calcium sulfate scale formation.Based on both continuous and batch filtration modes, an improvedprotocol was developed to obtain more relevant information fromthe EIS data. Selection of relevant frequencies and impedanceparameters was considered, to simplify the monitoring process.
2. Methods and materials
2.1. Experimental set-up
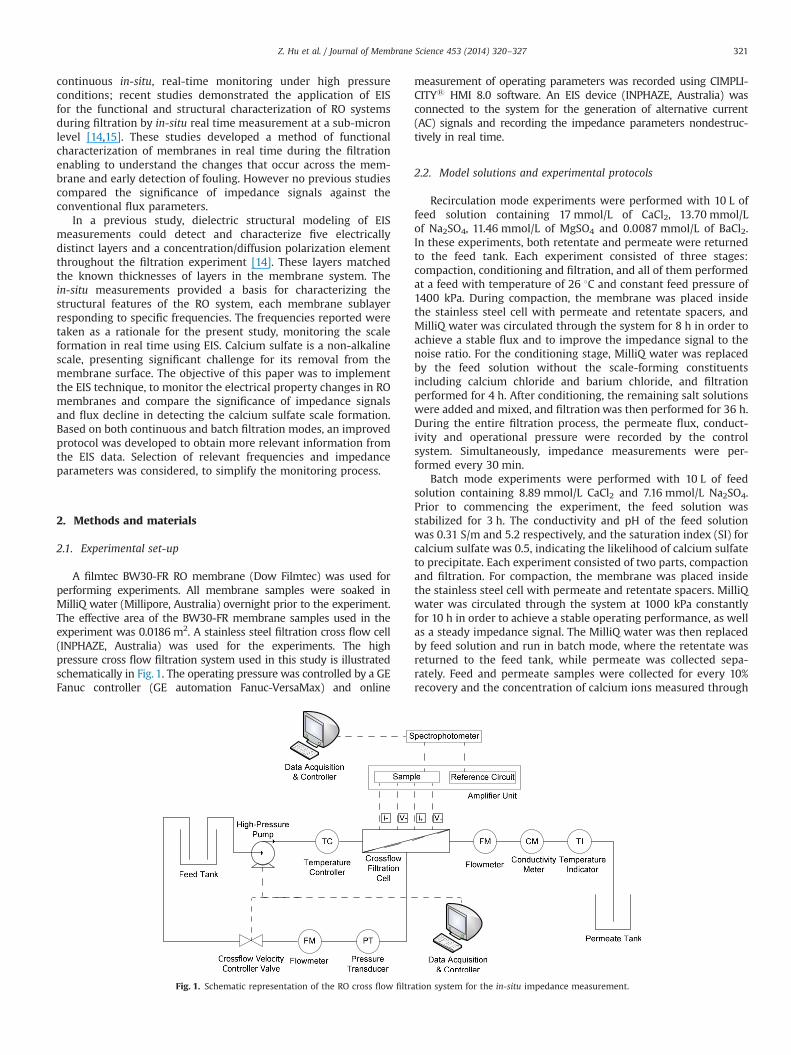
A filmtec BW30-FR RO membrane (Dow Filmtec) was used forperforming experiments. All membrane samples were soaked inMilliQ water (Millipore, Australia) overnight prior to the experiment.The effective area of the BW30-FR membrane samples used in theexperiment was 0.0186 m2. A stainless steel filtration cross flow cell(INPHAZE, Australia) was used for the experiments. The highpressure cross flow filtration system used in this study is illustratedschematically in Fig. 1. The operating pressure was controlled by a GEFanuc controller (GE automation Fanuc-VersaMax) and online
measurement of operating parameters was recorded using CIMPLI-CITYs HMI 8.0 software. An EIS device (INPHAZE, Australia) wasconnected to the system for the generation of alternative current(AC) signals and recording the impedance parameters nondestruc-tively in real time.
2.2. Model solutions and experimental protocols
Recirculation mode experiments were performed with 10 L offeed solution containing 17 mmol/L of CaCl2, 13.70 mmol/Lof Na2SO4, 11.46 mmol/L of MgSO4 and 0.0087 mmol/L of BaCl2.In these experiments, both retentate and permeate were returnedto the feed tank. Each experiment consisted of three stages:compaction, conditioning and filtration, and all of them performedat a feed with temperature of 26 1C and constant feed pressure of1400 kPa. During compaction, the membrane was placed insidethe stainless steel cell with permeate and retentate spacers, andMilliQ water was circulated through the system for 8 h in order toachieve a stable flux and to improve the impedance signal to thenoise ratio. For the conditioning stage, MilliQ water was replacedby the feed solution without the scale-forming constituentsincluding calcium chloride and barium chloride, and filtrationperformed for 4 h. After conditioning, the remaining salt solutionswere added and mixed, and filtration was then performed for 36 h.During the entire filtration process, the permeate flux, conduct-ivity and operational pressure were recorded by the controlsystem. Simultaneously, impedance measurements were per-formed every 30 min.
Batch mode experiments were performed with 10 L of feedsolution containing 8.89 mmol/L CaCl2 and 7.16 mmol/L Na2SO4.Prior to commencing the experiment, the feed solution wasstabilized for 3 h. The conductivity and pH of the feed solutionwas 0.31 S/m and 5.2 respectively, and the saturation index (SI) forcalcium sulfate was 0.5, indicating the likelihood of calcium sulfateto precipitate. Each experiment consisted of two parts, compactionand filtration. For compaction, the membrane was placed insidethe stainless steel cell with permeate and retentate spacers. MilliQwater was circulated through the system at 1000 kPa constantlyfor 10 h in order to achieve a stable operating performance, as wellas a steady impedance signal. The MilliQ water was then replacedby feed solution and run in batch mode, where the retentate wasreturned to the feed tank, while permeate was collected sepa-rately. Feed and permeate samples were collected for every 10%recovery and the concentration of calcium ions measured through
Fig. 1. Schematic representation of the RO cross flow filtration system for the in-situ impedance measurement.
Z. Hu et al. / Journal of Membrane Science 453 (2014) 320–327 321

inductively coupled plasma-optical emission spectroscopy analysis(Perkin Elmer Optima 3000 DV 3000, USA). During the entirefiltration process, permeate flux, conductivity and operationalpressure were recorded. All the permeate flux data presentedwere after averaging for definite time and normalized with respectto the initial flux rate, i.e., average flux value for the first 10 min.
Surface examination of the membrane samples after filtrationwas obtained using a Hitachi S3400-N scanning electron micro-scope (SEM). The center part of the membrane samples from theRO cell channel were first cut into 2�2 cm2 pieces then sputtercoated with gold using an Emitech K550x sputter coater. SEMimaging was conducted with electron beam voltages ranging5–15 keV and an average working distance of 10 mm.
The osmotic pressure simulation experiment was conducted witha 10 L solution mixed with 7.74 mmol/L MgCl2 and 12.47 mmol/LNaCl and MilliQ water to achieve the same osmotic pressure changeas in the scaling experiments in batch mode, without any scaleformation. In this solution, the ratio of molar concentration of Mg2þ
to Naþ was kept the same as the ratio of Ca2þ to Naþ in batchexperiment solutions.
2.3. Impedance measurements
EIS is based on the injection of sinusoidal AC i¼ i0sin(ωt) ofknown amplitude i0 and angular frequency ω, into a system andmeasuring the voltage (potential difference) across the system andthe phase difference between the current and voltage [2]. Theresulting EIS spectra contain information on the impedance, phaseangle, conductance and capacitance of the system. The variation ofthese properties with frequency commonly referred to as disper-sion, can be used to determine the number and properties of“layers” which compose the system. In the present study, impe-dance measurements were performed during filtration, in realtime, at frequencies ranging between 10�1 and 106 Hz. Analysisand comparison of impedance signals were performed around sixselected frequencies that were reported to represent the existenceof electrically distinct layers in the RO system [14].
The EIS spectra generated in response to the current (i) issimilarly sinusoidal, and can be expressed as
v¼ v0 sin ðωt�θÞ ð1Þwhere ν0 is the voltage amplitude and θ is the phase differencebetween the sample and reference circuits. The measured impe-dance can be expressed as a complex variable as
Z ¼ v0i0e� jθ ¼ v0
i0ð cos θ� j sin θÞ ð2Þ
where j is the imaginary constant defined by j2¼�1. Eq. (2)includes the measurable parameters ν0, i0 and θ which also yieldthe impedance magnitude ν0/i0 and phase θ. The admittance, Y, ofthe membrane system is the reciprocal of impedance, defined as
Y � 1Z� Gþ jωC ð3Þ
where, G is the conductance, and quantifies the ability of thesystem to conduct electric charge (i.e. in this instance the ions) andC is the capacitance, and quantifies the capacity of the system tostore the charge. For an electrically homogeneous system G and Care independent of frequency. However, in the electrically hetero-geneous membrane system comprised of electrically distinctsubstructures (membrane layers and interfaces of differing dielec-tric and conductance properties), G and C are strongly dependenton frequency. It has been proposed that the conductance (G) andcapacitance (C) of different membrane layers could be used tomonitor fouling [10,11].
Apart from the direct measurement of the impedance signals,the impedance data are often represented in complex impedance
plane or Nyquist formats. In Nyquist plots, the data are presentedas a locus of points, where each data point corresponds to adifferent measurement frequency. The electrical impedance of thesystem is then represented as a complex number, (Z¼Zreal� jZimg)where, the real (Zreal) and imaginary (Zimg) parts are related to theelectrical resistance (inverse of conductance) and capacitance byfollowing equation:
ZðωÞ ¼ G
G2þC2ω2� j
CωG2þC2ω2
ð4Þ
where, ω is the angular frequency, Zreal¼G/(G2þC2ω2) andZimg¼Cω/(G2þC2ω2).
The Nyquist plot is obtained by plotting �Zimg against Zreal. Theshape of the Nyquist plot yields insight into the reaction orgoverning phenomena; every semicircle is characteristic of asingle time constant and loops indicate the existence of morethan one time constant required to describe the process.
3. Results and discussion
3.1. Flux decline and surface examination in recirculation mode
In the recirculation mode experiments, the retentate andpermeate is returned to the feed tank and the osmotic pressureis expected to remain relatively constant throughout the filtration.In recirculation experiment, it is aimed to monitor the nascentstages of the scale formation through flux and impedance signalsand compare them. The normalized flux decline curve obtainedduring operation for 36 h is presented in Fig. 2. Over this duration,the normalized flux decreased by nearly 11%. The flux decline wasrapid until 15 h; after which, the rate of decline decreased, beforestabilizing after 34 h. Based on the results from permeate con-ductivity, the nominal rejection of ions was found to improve until15 h, followed by a stable rejection after 15 h.
The SEM images obtained for the membrane surface after 36 h ispresented in Fig. 3. The images at two different magnificationsindicate the very initial stages of scale formation. Small crystals ofCaSO4 were observed, quite uniformly throughout the examinedmembrane, implying the nucleation of surface crystals and absenceof a continuous scale layer.
3.2. Electrical properties in recirculation mode
Fig. 4 shows the frequency dependence of the conductanceobserved for the RO system during filtration. The conductanceincreased at all frequencies, as filtration progressed. Two dielectricrelaxations were observed from the experimental results, arisingdue to the interfacial polarization effects. Although two relaxa-tions were observed, the experimental values fitted into theMaxwell Wagner model revealed six electrically distinct layersand the fitting rational for rejecting the two relaxation dispersions
200
300
400
500
600
700
800
0.85
0.90
0.95
1.00
0 10 20 30 40Time (h)
Perm
eate
con
duct
ivity
(µS/
cm)
Nor
mal
ised
Flu
x (J
/Jo) Normalised Flux (NF) Conductivity
Fig. 2. Normalized flux decline and permeate conductivity during the calciumsulfate filtration in recirculation mode.
Z. Hu et al. / Journal of Membrane Science 453 (2014) 320–327322

and accepting the six element model is explained elsewhere [14].In interest of the present study was to compare the signalintensities, and therefore experimental results were not fitted intothe model for structural characterization. However, the selectionof specific frequencies for comparing the impedance parameterswas performed based on the modeling results reported by Antonyet al. [14]. Electrically distinct layers were reported to be thefiltrate layer (106 Hz), polyester support (105 Hz), polyethersulfonemicro-porous substrate (104 Hz), polyamide active layer (103 Hz)and a thin polyvinyl alcohol hydrophilic film (101 Hz).
During filtration, the conductance at all frequencies increasedas a function of time. The increase in conductance is due to theincreased accumulation of ions at the membrane solute interfacethat reflects in various membrane components, the diffusionpolarization layer, membrane layers and filtrate. The building upof the ionic charges at the membrane solution interface is inherentto the filtration process resulting in the concentration polarization.The elevated solute concentration at the membrane surface alsoresults in back diffusion into the bulk [16], until a steady state isreached. As the solute concentration increases during the filtrationreaching supersaturation, the precipitation/crystallization doesnot occur immediately; its takes some time for some of the saltclusters to nucleate and exceed a critical size above which theycontinue to grow instead of redissolving [17]. During the earlystage of RO filtration, accumulation of these charged ions asreflected through the increased conductance is a precursor forthe formation of scaling. However, after 18 h, the conductancedecreased slightly at all frequencies. This is likely due to the backdiffusion of ions from to the bulk.
The change in conductance is further confirmed through theNyquist plot, presented in Fig. 5. The complex plane data obtainedat various stages of filtration are marked to show that low frequencydata are on the right side of the plot and higher frequencies are on theleft. The Nyquist plot represents the dispersions arising due to theelements and processes as it provides a direct view of the manner inwhich the real component of the impedance (inverse of the con-ductance) varies with the imaginary component (equals to 1/jωC) at
each frequency. The Nyquist plot shows two semicircles, each of whichis representative of association with a single time constant elementdue to charge transfer phenomenon, denoting the dispersion acrossthe frequencies. Apart from the semicircles, loops were observed atthe lower range of the imaginary impedance similar to the results ofSim et al. [15], suggested to be due to the inductive behavior. Thedecrease in the radius of the semicircle during the fouling processoccurs due to the increase in conductance. In Fig. 5, the radius of thesemicircle decreased after 2 h and remained unchanged after 18 h atall frequencies.
The plot of measured capacitance against the frequency ispresented in Fig. 6. Unlike the change in conductance, thecapacitance did not change at all frequencies; significant changein capacitance was observed only at the frequency between 10 and100 Hz, as the experiment progressed. This frequency range isrepresentative of the coating layer and active membrane surface.The capacitance was low at the beginning of the experiment and
Fig. 3. SEM images of CaSO4 scaling on membrane surface at two magnifications after 36 h filtration in recirculation mode.
2
2.5
3
3.5
4
4.5
0 1 10 100 1,000 10,000 100,000
Con
duct
ance
(S/m
2)
Frequency (Hz)
after 2 h after 5 h after 10 hafter 18 h after 32 h after 35 h
Fig. 4. Measured conductance across the frequency range during filtration(recirculation mode). 0.00
0.05
0.10
0.15
0.00 0.05 0.10 0.15 0.20 0.25 0.30 0.35 0.40 0.45
-Im
agin
ary
Impe
danc
e (O
hms·
m)
Real Impedance (Ohms·m )
after 2 h after 5 hafter 10 h after 18 hafter 32 h after 35 h
Low frequency
High frequency
Fig. 5. Nyquist plot for selected spectra in recirculation mode.
1.E-06
1.E-05
1.E-04
1.E-03
1.E-02
1.E-01
1.E+00
0 1 10 100 1,000 10,000 100,000
Cap
acita
nce
(F/m
2 )
Frequency (Hz)
after 2 h after 5 hafter 10 h after 18 hafter 32 h after 35 h
Fig. 6. Measured capacitance across the frequency range during filtration(recirculation mode).
Z. Hu et al. / Journal of Membrane Science 453 (2014) 320–327 323

steadily increased with time. This explains the manifestation ofcharge storage in the vicinity of the membrane surface thatincreases over time. As the filtration progresses, accumulation ofthe scale forming ions at the membrane layer is responsible for theincreasing charge.
3.3. Comparison of change in capacitance and flux
The temporal change in capacitance was especially studied atfrequencies ranging from 10 to 100 Hz and compared with the fluxmeasurements, in order to identify the specific frequency at whichthe changes are significant. In Fig. 7, the change in capacitancemeasured at 38, 73 and 153 Hz is presented in comparison withthe normalized flux decline curve. The rate of change in thecapacitance was calculated for every 5 h of filtration using thefollowing Eq. (4) and the results presented in Table 1.
Rate of change¼ Sðnþ1Þ�SðnÞSðinitalÞ 100% ð5Þ
where, Sn is the signal (impedance or flux decline) obtained at agiven recovery and S(nþ1) is the signal the subsequentrecovery point.
During the first 2 h of operation, the electrical signals werehighly unstable, slowly approaching a stable stage thereafter,however little fluctuations in the capacitance were observedgenerally until 20 h. This is likely due to the large water fluxacross the membrane disturbing the electrical signals. In terms ofsignal intensities, the rate of change in the signal intensity wasgenerally more significant for the capacitance than the permeateflux at all frequencies. Among the three frequencies, 73 Hz is quitepromising; the change in capacitance after 20 h of operation was12%, 22% and 14% compared to respective flux decline of 0.8%, 1.2%and 1.3%.
During the first 15 h, the build-up of the concentration polar-ization layer seemed to be the dominant process. This wasreflected through the rapid flux decline as well the significantchange in the capacitance and conductance near the membranesolution interface recorded at 18 h. Between 15 and 25 h, theconcentration polarization layer stabilized, evident from the stable
conductance values obtained after 18 h. Although further increasein the conductance was not observed, rise in the capacitance after20 h indicated the existence of charge storage at the membranesurface. After 20 h, the scaling was expected to take place from thesignificant change in the capacitance at 73 Hz.
3.4. Flux decline in batch mode
In batch mode experiments, the increasing osmotic pressurecontributed greatly to the normalized flux decline and the EISparameters. In order to study the impact of onset of scaling in thismode, where normalized flux declined was due to both scalingdevelopment and increasing osmotic pressure, a comparison experi-ment (i.e. “osmotic pressure simulation experiment”) was performedto simulate the situation in which only osmotic pressure affected thenormalized flux decline (without scale forming constituents).
Fig. 8 illustrates the normalized flux decline obtained duringthe scaling and osmotic pressure simulation experiments. Thenormalized flux values were similar in both experiments as therecovery increased to 80%. Beyond this point, the flux decline ofthe scaling experiment became significant. As indicated by thenormalized flux curves, osmotic pressure was significantly con-tributing to the flux decline until 82% recovery (inset of Fig. 8),after this point, severe scaling occurred, contributing the fluxdecline.
During filtration of solution containing calcium sulfate, fluxdecline regions can be divided into three regions as shown inFig. 9. The first stage is the flux decline due to concentrationpolarization occurring at the beginning of the experiment; thesecond stage is the flux decline resulting from surface crystal-lization and the last stage is dominated by bulk precipitation whenthe critical concentration of the scale forming ions has beenachieved [18]. In order to elucidate the type of mechanismsoccurring, scaling resistance (Rscaling) and SI were calculated atvarious recovery points.
Total membrane resistance (Rtotal) in a typical scaling experi-ment is the sum of intrinsic membrane resistance (Rm), resistancedue to osmotic pressure (Rop) and due to scale formation (Rscaling)
RtotalðscalingÞ ¼ RmþRopþRscaling ¼TMPμJ
ð6Þ
On the other hand, total resistance without any scale formingconstituents total resistance will be:
Rtotalðno scalingÞ ¼ RmþRop ð7Þ
If the osmotic pressure during both cases is equal, then theresistance due the scale formation can be deduced as
Rscaling ¼ RtotalðscalingÞ �Rtotalðno scalingÞ ð8Þ3.0E-07
5.3E-06
1.0E-05
1.5E-05
2.0E-05
2.5E-05
3.0E-05
0.85
0.90
0.95
1.00
0 5 10 15 20 25 30 35
Cap
acita
nce
(F/m
2 )
Nor
mal
ized
flux
(J/J
0)
Time (h)
Normalized FluxCapacitance at 38 Hz
Capacitance at 73 HzCapacitance at 152 Hz
Fig. 7. Comparison of flux decline and capacitance as a function of time(recirculation mode).
Table 1Rate of change (%) in capacitance and flux decline.
Time range (h) 38 Hz 73 Hz 152 Hz Permeate flux
0–5 �30.3 �44.7 �15.7 3.710-May 29.1 35.5 24.4 1.415-Oct 6.8 8.2 3.9 0.915–20 �2.2 �2.2 �0.9 0.620–25 9.7 11.8 3.1 0.825–30 13 22.2 7.3 1.230–35 11.7 14 5.6 1.3
Fig. 8. Normalized fluxes of two experiments as a function of recovery.
Z. Hu et al. / Journal of Membrane Science 453 (2014) 320–327324
SI values were calculated by withdrawing the feed samples forevery 10% recovery and the end of the scaling experiment andanalyzing the ionic concentration.
Calculated Rscaling values and SI from 0% to 80% are plottedagainst recovery and are presented in Fig. 9. Change in Rscaling wasnot appreciable until 60%, where the SI value was 1.19. As SI wasgreater than one, it indicated the positive potential for correspond-ing scale formation [2]. Therefore, in terms of the SI values, thescaling is feasible beyond 50% recovery. Thus, the onset of surfacecrystallization is expected to happen between 50% and 60% ofrecovery. The period before this point is referred as the inductionperiod [19]. At 70% recovery, the SI value was maximum (1.63) andbeyond this point the SI value decreased. This could be due to theonset of bulk precipitation. The increase of Rscaling from 70% to 80%was significant as the bulk precipitation dominates the crystal-lization via an increased amount of nucleation sites at the surface[20]. Therefore, the scale flux decline and corresponding resistancechange were divided into three regions, and the potential changesoccurring at these regions are suggested to be, scaling inductionfrom 0% to 50%, surface crystallization from 50% to 70% and bulkprecipitation from 70% to 80%.
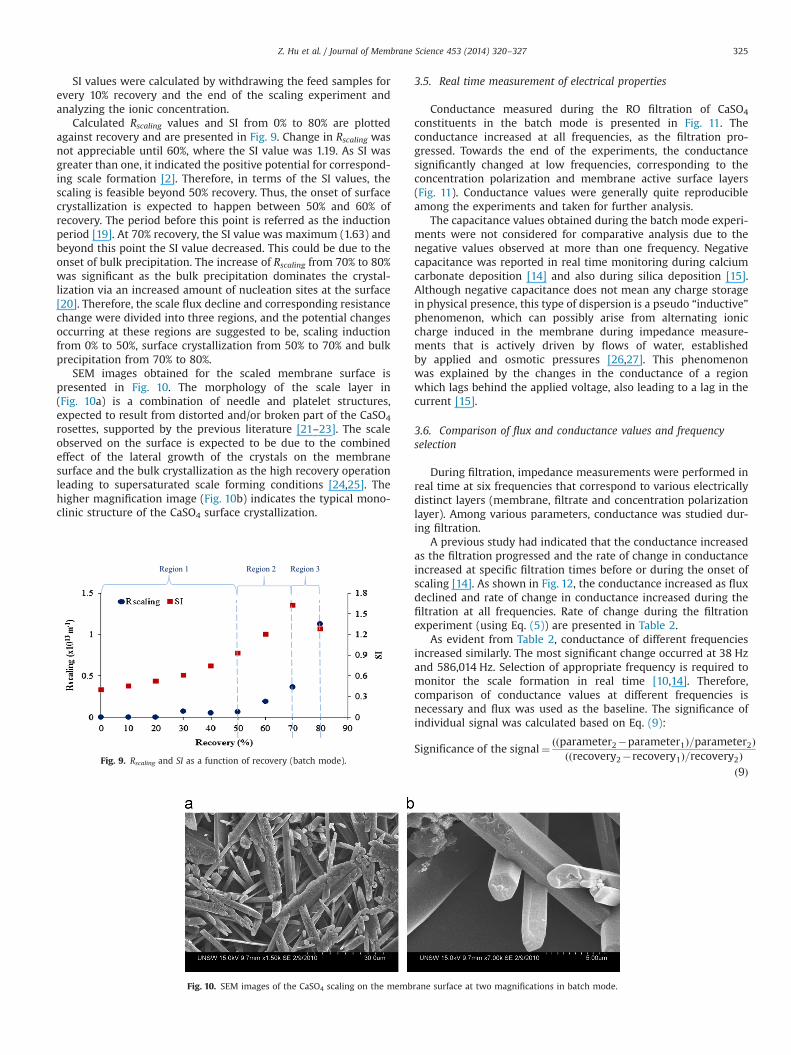
SEM images obtained for the scaled membrane surface ispresented in Fig. 10. The morphology of the scale layer in(Fig. 10a) is a combination of needle and platelet structures,expected to result from distorted and/or broken part of the CaSO4
rosettes, supported by the previous literature [21–23]. The scaleobserved on the surface is expected to be due to the combinedeffect of the lateral growth of the crystals on the membranesurface and the bulk crystallization as the high recovery operationleading to supersaturated scale forming conditions [24,25]. Thehigher magnification image (Fig. 10b) indicates the typical mono-clinic structure of the CaSO4 surface crystallization.
3.5. Real time measurement of electrical properties
Conductance measured during the RO filtration of CaSO4
constituents in the batch mode is presented in Fig. 11. Theconductance increased at all frequencies, as the filtration pro-gressed. Towards the end of the experiments, the conductancesignificantly changed at low frequencies, corresponding to theconcentration polarization and membrane active surface layers(Fig. 11). Conductance values were generally quite reproducibleamong the experiments and taken for further analysis.
The capacitance values obtained during the batch mode experi-ments were not considered for comparative analysis due to thenegative values observed at more than one frequency. Negativecapacitance was reported in real time monitoring during calciumcarbonate deposition [14] and also during silica deposition [15].Although negative capacitance does not mean any charge storagein physical presence, this type of dispersion is a pseudo “inductive”phenomenon, which can possibly arise from alternating ioniccharge induced in the membrane during impedance measure-ments that is actively driven by flows of water, establishedby applied and osmotic pressures [26,27]. This phenomenonwas explained by the changes in the conductance of a regionwhich lags behind the applied voltage, also leading to a lag in thecurrent [15].
3.6. Comparison of flux and conductance values and frequencyselection
During filtration, impedance measurements were performed inreal time at six frequencies that correspond to various electricallydistinct layers (membrane, filtrate and concentration polarizationlayer). Among various parameters, conductance was studied dur-ing filtration.
A previous study had indicated that the conductance increasedas the filtration progressed and the rate of change in conductanceincreased at specific filtration times before or during the onset ofscaling [14]. As shown in Fig. 12, the conductance increased as fluxdeclined and rate of change in conductance increased during thefiltration at all frequencies. Rate of change during the filtrationexperiment (using Eq. (5)) are presented in Table 2.
As evident from Table 2, conductance of different frequenciesincreased similarly. The most significant change occurred at 38 Hzand 586,014 Hz. Selection of appropriate frequency is required tomonitor the scale formation in real time [10,14]. Therefore,comparison of conductance values at different frequencies isnecessary and flux was used as the baseline. The significance ofindividual signal was calculated based on Eq. (9):
Significance of the signal¼ ððparameter2�parameter1Þ=parameter2Þððrecovery2�recovery1Þ=recovery2Þ
ð9Þ
Region 1 Region 2 Region 3
Fig. 9. Rscaling and SI as a function of recovery (batch mode).
Fig. 10. SEM images of the CaSO4 scaling on the membrane surface at two magnifications in batch mode.
Z. Hu et al. / Journal of Membrane Science 453 (2014) 320–327 325
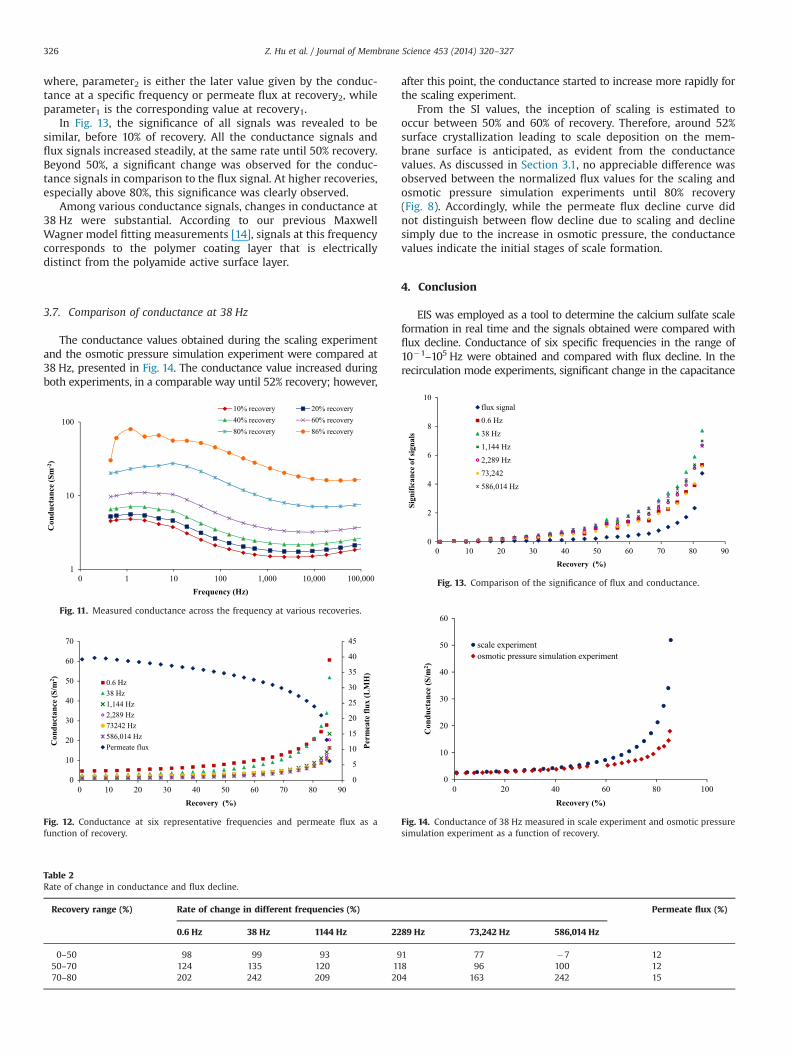
where, parameter2 is either the later value given by the conduc-tance at a specific frequency or permeate flux at recovery2, whileparameter1 is the corresponding value at recovery1.
In Fig. 13, the significance of all signals was revealed to besimilar, before 10% of recovery. All the conductance signals andflux signals increased steadily, at the same rate until 50% recovery.Beyond 50%, a significant change was observed for the conduc-tance signals in comparison to the flux signal. At higher recoveries,especially above 80%, this significance was clearly observed.
Among various conductance signals, changes in conductance at38 Hz were substantial. According to our previous MaxwellWagner model fitting measurements [14], signals at this frequencycorresponds to the polymer coating layer that is electricallydistinct from the polyamide active surface layer.
3.7. Comparison of conductance at 38 Hz
The conductance values obtained during the scaling experimentand the osmotic pressure simulation experiment were compared at38 Hz, presented in Fig. 14. The conductance value increased duringboth experiments, in a comparable way until 52% recovery; however,
after this point, the conductance started to increase more rapidly forthe scaling experiment.
From the SI values, the inception of scaling is estimated tooccur between 50% and 60% of recovery. Therefore, around 52%surface crystallization leading to scale deposition on the mem-brane surface is anticipated, as evident from the conductancevalues. As discussed in Section 3.1, no appreciable difference wasobserved between the normalized flux values for the scaling andosmotic pressure simulation experiments until 80% recovery(Fig. 8). Accordingly, while the permeate flux decline curve didnot distinguish between flow decline due to scaling and declinesimply due to the increase in osmotic pressure, the conductancevalues indicate the initial stages of scale formation.
4. Conclusion
EIS was employed as a tool to determine the calcium sulfate scaleformation in real time and the signals obtained were compared withflux decline. Conductance of six specific frequencies in the range of10�1–105 Hz were obtained and compared with flux decline. In therecirculation mode experiments, significant change in the capacitance
1
10
100
0 1 10 100 1,000 10,000 100,000
Con
duct
ance
(Sm
-2)
Frequency (Hz)
10% recovery 20% recovery40% recovery 60% recovery80% recovery 86% recovery
Fig. 11. Measured conductance across the frequency at various recoveries.
0
5
10
15
20
25
30
35
40
45
0
10
20
30
40
50
60
70
0 10 20 30 40 50 60 70 80 90
Perm
eate
flux
(LM
H)
Con
duct
ance
(S/m
2 )
Recovery (%)
0.6 Hz38 Hz1,144 Hz2,289 Hz73242 Hz586,014 HzPermeate flux
Fig. 12. Conductance at six representative frequencies and permeate flux as afunction of recovery.
Table 2Rate of change in conductance and flux decline.
Recovery range (%) Rate of change in different frequencies (%) Permeate flux (%)
0.6 Hz 38 Hz 1144 Hz 2289 Hz 73,242 Hz 586,014 Hz
0–50 98 99 93 91 77 �7 1250–70 124 135 120 118 96 100 1270–80 202 242 209 204 163 242 15
0
2
4
6
8
10
0 10 20 30 40 50 60 70 80 90
Sign
ifica
nce
of si
gnal
s
Recovery (%)
flux signal0.6 Hz
38 Hz1,144 Hz
2,289 Hz73,242
586,014 Hz
Fig. 13. Comparison of the significance of flux and conductance.
0
10
20
30
40
50
60
0 20 40 60 80 100
Con
duct
ance
(S/m
2 )
Recovery (%)
scale experimentosmotic pressure simulation experiment
Fig. 14. Conductance of 38 Hz measured in scale experiment and osmotic pressuresimulation experiment as a function of recovery.
Z. Hu et al. / Journal of Membrane Science 453 (2014) 320–327326

values at 73 Hz was observed. Rate of change in the capacitance valuesat 73 Hz were more significant than the rate of change in the fluxvalues. In the batch mode experiments, marked changes were seen atalmost all frequencies. However, conductance measured at 38 Hz,corresponding to the coating layer (above the polyamide active layer)gave the most significant change. Observing the change in conduc-tance signal at low frequencies in the range of 10–100 Hz that relatesto the membrane coating layer can signal the nascent stages of scaleformation. Therefore, attaching EIS as a side stream to a full scalemodule can signal the nascent stages of scale formation, well beforepermeate flux decline can be observed. Whilst measurement at lowfrequency was identified to be most sensitive from the lab experi-ments, the suitability of this frequency in industrial applications willhave to be field tested.
Acknowledgments
The authors thank Water Research Australia (WaterRA) andWater Research Foundation (WaterRF) for the financial support inperforming this work.
References
[1] S. Shirazi, C.-J. Lin, D. Chen, Inorganic fouling of pressure-driven membraneprocesses—a critical review, Desalination 250 (2010) 236–248.
[2] A. Antony, J.H. Low, S. Gray, A.E. Childress, P. Le-Clech, G. Leslie, Scaleformation and control in high pressure membrane water treatment systems:a review, J. Membr. Sci. 383 (2011) 1–16.
[3] T. Knoell, M. Patel, The Challenges of Identifying, Evaluating and ImplementingAntiscalants in RO Reuse Applications: So Many Choices—So Few Winners,AWWA Membrane Technology Conference, Long Beach, California, 2011.
[4] M. Uchymiak, A.R. Bartman, N. Daltrophe, M. Weissman, J. Gilron,P.D. Christofides, W.J. Kaiser, Y. Cohen, Brackish water reverse osmosis (BWRO)operation in feed flow reversal mode using an ex situ scale observationdetector (EXSOD), J. Membr. Sci. 341 (2009) 60–66.
[5] M. Uchymiak, A. Rahardianto, E. Lyster, J. Glater, Y. Cohen, A novel RO ex situscale observation detector (EXSOD) for mineral scale characterization andearly detection, J. Membr. Sci. 291 (2007) 86–95.
[6] K.D. Cobry, Z. Yuan, J. Gilron, V.M. Bright, W.B. Krantz, A.R. Greenberg,Comprehensive experimental studies of early-stage membrane scaling duringnanofiltration, Desalination 283 (2011) 40–51.
[7] K.G. Tay, L. Song, A more effective method for fouling characterization in a full-scale reverse osmosis process, Desalination 177 (2005) 95–107.
[8] A.R. Bartman, E. Lyster, R. Rallo, P.D. Christofides, Y. Cohen, Mineral scalemonitoring for reverse osmosis desalination via real-time membrane surfaceimage analysis, Desalination 273 (2011) 64–71.
[9] J.S. Park, T.C. Chilcott, H.G.L. Coster, S.H. Moon, Characterization of BSA-foulingof ion-exchange membrane systems using a subtraction technique for lumpeddata, J. Membr. Sci. 246 (2005) 137–144.
[10] J.M. Kavanagh, S. Hussain, T.C. Chilcott, H.G.L. Coster, Fouling of reverseosmosis membranes using electrical impedance spectroscopy: measurementsand simulations, Desalination 236 (2009) 187–193.
[11] H.G.L. Coster, K.J. Kim, K. Dahlan, J.R. Smith, C.J.D. Fell, Characterisation ofultrafiltration membranes by impedance spectroscopy. I. Determination of theseparate electrical parameters and porosity of the skin and sublayers,J. Membr. Sci. 66 (1992) 19–26.
[12] H.G.L. Coster, T.C. Chilcott, The characterization of membranes and membranesurfaces using impedance spectroscopy, Surfactant Sci. Ser. 79 (1999)749–792.
[13] J. Cen, J. Kavanagh, H. Coster, G. Barton, Fouling of reverse osmosis membranesby cane molasses fermentation wastewater: detection by electrical impedancespectroscopy techniques, Desalination Water Treat. 51 (2012) 969–975.
[14] A. Antony, T. Chilcott, H. Coster, G. Leslie, In situ structural and functionalcharacterization of reverse osmosis membranes using electrical impedancespectroscopy, J. Membr. Sci. 425–426 (2013) 89–97.
[15] L.N. Sim, Z.J. Wang, J. Gu, H.G.L. Coster, A.G. Fane, Detection of reverse osmosismembrane fouling with silica, bovine serum albumin and their mixture usingin-situ electrical impedance spectroscopy, J. Membr. Sci. 443 (2013) 45–53.
[16] T.H. Chong, F.S. Wong, A.G. Fane, Implications of critical flux and cakeenhanced osmotic pressure (CEOP) on colloidal fouling in reverse osmosis:experimental observations, J. Membr. Sci. 314 (2008) 101–111.
[17] N. Pomerantz, Y. Ladizhansky, E. Korin, M. Waisman, N. Daltrophe, J. Gilron,Prevention of scaling of reverse osmosis membranes by “zeroing” the elapsednucleation time. Part I. Calcium sulfate, Ind. Eng. Chem. Res. 45 (2006)2008–2016.
[18] S. Lee, J. Kim, C.-H. Lee, Analysis of CaSO4 scale formation mechanism invarious nanofiltration modules, J. Membr. Sci. 163 (1999) 63–74.
[19] H.-J. Oh, Y.-K. Choung, S. Lee, J.-S. Choi, T.-M. Hwang, J.H. Kim, Scale formationin reverse osmosis desalination: model development, Desalination 238 (2009)333–346.
[20] T.M. Pääkkönen, M. Riihimäki, C.J. Simonson, E. Muurinen, R.L. Keiski, Crystal-lization fouling of CaCO3—analysis of experimental thermal resistance and itsuncertainty, Int. J. Heat Mass Transfer 55 (2012) 6927–6937.
[21] W.-Y. Shih, A. Rahardianto, R.-W. Lee, Y. Cohen, Morphometric characterizationof calcium sulfate dihydrate (gypsum) scale on reverse osmosis membranes,J. Membr. Sci. 252 (2005) 253–263.
[22] S.H. Najibi, H. Müller-Steinhagen, M. Jamialahmadi, Calcium sulfate scaleformation during subcooled flow boiling, Chem. Eng. Sci. 52 (1997)1265–1284.
[23] D. Bramson, D. Hasson, R. Semiat, The roles of gas bubbling, wall crystal-lization and particulate deposition in CaSO4 scale formation, Desalination 100(1995) 105–113.
[24] A.G. Pervov, Scale formation prognosis and cleaning procedure schedules inreverse osmosis systems operation, Desalination 83 (1991) 77–118.
[25] M. Okazaki, S. Kimura, Scale formation on reverse osmosis membranes,J. Chem. Eng. Jpn. 17 (1984) 145–151.
[26] T.C. Chilcott, Origin of resonant electrical impedances in membranes inducedby osmosis: analytical solutions of the AC Nernst–Planck, Poisson andcontinuity equations as functions of water velocity, J. Membr. Sci. 438(2013) 65–76.
[27] T. Chilcott, A. Antony, H. Coster, G. Leslie, In situ characterization of fouling inreverse osmosis membranes using electrical impedance spectroscopy, J. Phys.Conf. Ser. 434 (2013).
Z. Hu et al. / Journal of Membrane Science 453 (2014) 320–327 327