Extraction of valuable minerals from reverse osmosis brine in ...
Journal of Membrane Science 319 (2008) 111–125
Contents lists available at ScienceDirect
Journal of Membrane Science
journa l homepage: www.e lsev ier .com/ locate /memsci
Direct observation of initial microbial deposition onto reverseosmosis and nanofiltration membranes
Arun Subramania, Eric M.V. Hoekb,∗
a Department of Chemical and Environmental Engineering, University of California, Riverside, CA 92521, USAb Civil & Environmental Engineering Department and Water Technology Research Center, University of California, Los Angeles, CA 90095, USA
overnranesismsw veess, (
tatic dinte
ppeasitionan ∼ing toenh
ce pryticaacter
a r t i c l e i n f o
Article history:Received 29 October 2007Received in revised form 15 March 2008Accepted 19 March 2008Available online 27 March 2008
Keywords:Reverse osmosisNanofiltrationBiofoulingDLVO theoryContact angleZeta potential
a b s t r a c t
Physicochemical factors gnanofiltration (NF) membthree different microorganity, (b) decreasing crossflomembrane surface roughn(cell-membrane) electrosmacroscopically repulsiveheterogeneities – which asufficient microbial depohours. At fluxes greater thsive interfacial forces leadions destabilized cells andbetween membrane surfacaptured by a simple, analmembranes are prone to b
dynamics governs initial micro1. Introduction
Biofouling has been called the Achilles heel of membraneprocesses and is a particular problem for reverse osmosis (RO)membranes in wastewater reclamation [1]. Deleterious conse-quences of membrane biofouling include increased hydraulicresistance, decreased membrane permeability, enhanced concen-tration polarization, and decreased salt rejection [2–4]. Whilecolloidal and particulate fouling can be reduced to a great extentthrough pretreatment, biofouling is more complicated becausedeposited cells can grow, multiply, and relocate. Therefore, mem-brane biofouling has been found to occur extensively on NF andRO membranes even after significant pretreatment of the influentstream (including bioreactors, conventional water treatment, andmembrane filtration) [5].
∗ Corresponding author at: Civil & Environmental Engineering Department, 5732GBoelter Hall, PO Box 951593, University of California, Los Angeles, CA 90095-1593,USA. Tel.: +1 310 206 3735; fax: +1 310 206 2222.
E-mail address: [email protected] (E.M.V. Hoek).
0376-7388/$ – see front matter © 2008 Elsevier B.V. All rights reserved.doi:10.1016/j.memsci.2008.03.025
ing initial rates of microbial deposition onto reverse osmosis (RO) andwere studied using direct microscopic observation. Deposition rates for
onto four NF/RO membranes increased with (a) increasing permeate veloc-locity, (c) increasing salt rejection, (d) increasing cell size, (e) increasingf) decreasing (cell-membrane) free energy of adhesion, and (g) decreasingouble layer repulsion. Relatively hydrophilic, smooth surfaces produced
rfacial interactions (i.e., cells should not deposit); however, microscopicr inherent to interfacially polymerized polyamide thin films – facilitated
onto clean membranes that microcolonies formed within minutes to8 �m s−1 (∼20 lmh or 16 gfd), permeate drag forces overwhelmed repul-purely convective deposition. Concentration polarization of rejected salt
anced deposition onto NF/RO membrane surfaces. The complex interplayoperties, concentration polarization, and hydrodynamics was reasonablyl interfacial force model. These results help explain why polyamide NF/ROial adhesion and how the balance between crossflow and permeate hydro-bial deposition onto clean NF/RO membranes.
© 2008 Elsevier B.V. All rights reserved.
Initial microbial cell deposition, a.k.a., “primary adhesion,” is a
critical early stage event in the overall process of biofouling [6].Differences in microbial cell surface properties may result frombiological factors such as the growth phase and nutritional envi-ronment [7–9]; however, primary adhesion of cells – at a particulargrowth stage and adapted to a fixed nutrient environment – islargely controlled by physicochemical factors such as hydrody-namics, solution chemistry, and interfacial forces [10–13]. Oncedeposited, cells can grow, multiply, and produce extra-cellular poly-mers (EPS), which form a tangled matrix of fibers that providestructure to the assemblage termed a “biofilm.” Once formed, abiofilm is difficult to remove because the EPS layer strongly adherescells to the membrane surface and protects microbes from attack bypredators and biocides [6,2]. Hence, efforts to combat membranebiofouling by developing NF/RO membrane materials, process opti-mization strategies, and cleaning regimens must begin with anunderstanding of the fundamental mechanisms of microbial depo-sition.Microscopic techniques for direct observation of microbial (andabiotic particle) deposition have been demonstrated in the past,but were restricted to low-pressure membrane filtration (MF/UF)processes [14–22]. Membrane chemistry and hydrodynamic con-
of Membrane Science 319 (2008) 111–125
112 A. Subramani, E.M.V. Hoek / Journalditions are significantly different in NF/RO membrane processes.For example, polysulfone, polyethylene, and polypropylene arewidely used to make MF/UF membranes [23,24], whereas mod-ern NF/RO membranes are polyamide composites [25]. Moreover,the rejection of salts with NF/RO membranes leads to the devel-opment of salt concentration polarization (CP), which is absentin MF/UF processes. The impact of CP on microbial depositionis not fundamentally understood. Thus, there is a need to elu-cidate the fundamental mechanisms governing initial microbialadhesion to NF/RO membranes at representative process condi-tions.
In this study, a newly designed crossflow membrane filtrationmodule facilitates direct microscopic observation of microbial celldeposition onto NF/RO membranes. We consider five commer-cially prepared membranes with salt rejections ranging from 0 tomore than 95%. Saccharomyces cerevisiae, Pseudomonas putida, andBacillus subtilis JH642 are employed as model microbial foulants.Both fungal and bacterial genera are found in biofilms formedon RO membranes used to treat domestic wastewater, while themost frequently recovered bacterial genera included Bacillus andPseudomonas [5]. Using direct microscopic observation, micro-bial deposition rates were determined for different combinationsof (1) membrane surface properties, (2) cell surface properties,(3) feed solution ionic strength, and (4) hydrodynamic condi-tions. Next, the impacts of (NF/RO membrane) salt rejection andconcentration polarization on microbial deposition rates werestudied. Finally, directly observed deposition rates were corre-lated with interfacial interactions, which were predicted fromexperimentally measured microbe and membrane physicochem-ical properties.
2. Materials and methods
2.1. Direct microscopic observation module and flow system
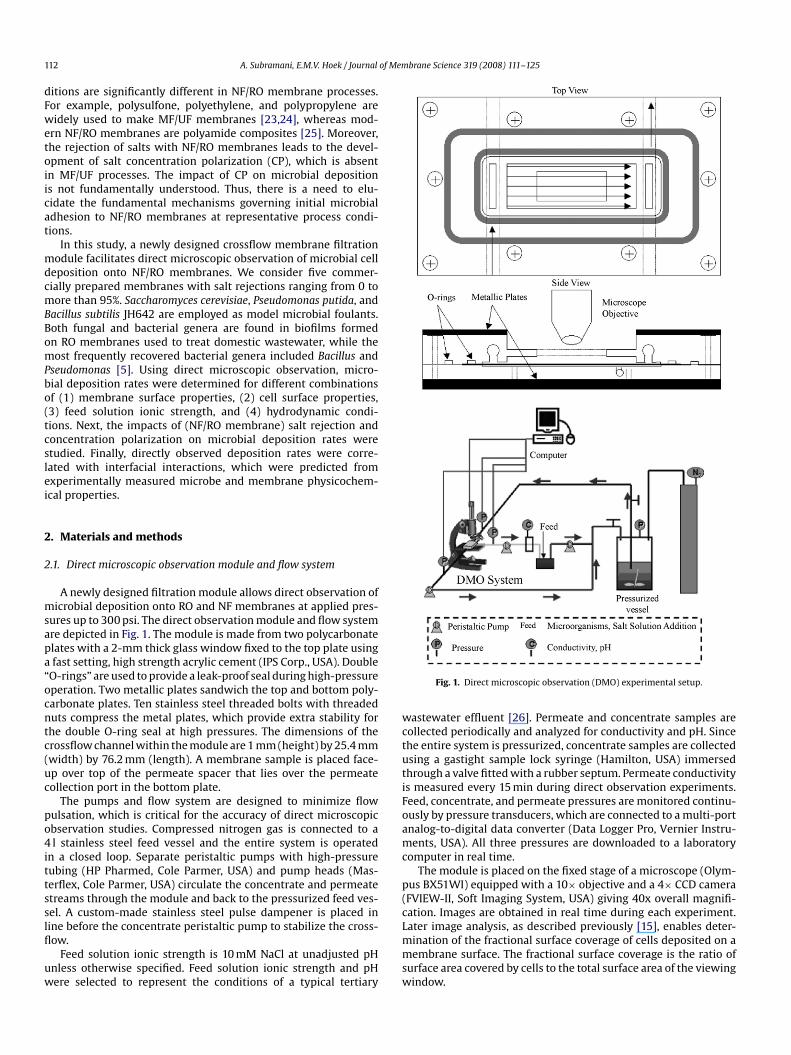
A newly designed filtration module allows direct observation ofmicrobial deposition onto RO and NF membranes at applied pres-sures up to 300 psi. The direct observation module and flow systemare depicted in Fig. 1. The module is made from two polycarbonateplates with a 2-mm thick glass window fixed to the top plate usinga fast setting, high strength acrylic cement (IPS Corp., USA). Double“O-rings” are used to provide a leak-proof seal during high-pressureoperation. Two metallic plates sandwich the top and bottom poly-
carbonate plates. Ten stainless steel threaded bolts with threadednuts compress the metal plates, which provide extra stability forthe double O-ring seal at high pressures. The dimensions of thecrossflow channel within the module are 1 mm (height) by 25.4 mm(width) by 76.2 mm (length). A membrane sample is placed face-up over top of the permeate spacer that lies over the permeatecollection port in the bottom plate.The pumps and flow system are designed to minimize flowpulsation, which is critical for the accuracy of direct microscopicobservation studies. Compressed nitrogen gas is connected to a4 l stainless steel feed vessel and the entire system is operatedin a closed loop. Separate peristaltic pumps with high-pressuretubing (HP Pharmed, Cole Parmer, USA) and pump heads (Mas-terflex, Cole Parmer, USA) circulate the concentrate and permeatestreams through the module and back to the pressurized feed ves-sel. A custom-made stainless steel pulse dampener is placed inline before the concentrate peristaltic pump to stabilize the cross-flow.
Feed solution ionic strength is 10 mM NaCl at unadjusted pHunless otherwise specified. Feed solution ionic strength and pHwere selected to represent the conditions of a typical tertiary
Fig. 1. Direct microscopic observation (DMO) experimental setup.
wastewater effluent [26]. Permeate and concentrate samples arecollected periodically and analyzed for conductivity and pH. Sincethe entire system is pressurized, concentrate samples are collectedusing a gastight sample lock syringe (Hamilton, USA) immersedthrough a valve fitted with a rubber septum. Permeate conductivityis measured every 15 min during direct observation experiments.Feed, concentrate, and permeate pressures are monitored continu-ously by pressure transducers, which are connected to a multi-portanalog-to-digital data converter (Data Logger Pro, Vernier Instru-ments, USA). All three pressures are downloaded to a laboratorycomputer in real time.
The module is placed on the fixed stage of a microscope (Olym-pus BX51WI) equipped with a 10× objective and a 4× CCD camera(FVIEW-II, Soft Imaging System, USA) giving 40x overall magnifi-cation. Images are obtained in real time during each experiment.Later image analysis, as described previously [15], enables deter-mination of the fractional surface coverage of cells deposited on amembrane surface. The fractional surface coverage is the ratio ofsurface area covered by cells to the total surface area of the viewingwindow.
of Mem
A. Subramani, E.M.V. Hoek / JournalThe slope of fractional surface coverage, �, plotted against time,t, gives the net deposition rate constant:
kd = ��
�t
1�a2
1N0
(1)
where a is the microbial cell radius, N0 is the number concentrationof microorganisms in the feed suspension. The total microscopicviewing area is 0.03 mm2 for all direct observation experiments.All direct observation experiments are repeated at least three timesusing different microbial cell concentrations in the feed.
2.2. Membrane selection and characterization
Polyamide thin film composite NF and RO membranes are desig-nated as HL (GE-Osmonics, Minnetonka, MN), NF270 (Dow-FilmTec,Minneapolis, MN), NF90 (Dow-FilmTec, Minneapolis, MN), andESPA4 (Hydranautics, Oceanside, CA). According to the manufac-turers, HL and NF270 are piperazine (PIP)-based nanofiltrationmembranes, whereas NF90 and ESPA4 are m-phenylene diamine(MPD)-based reverse osmosis membranes. Our designation of NFis based both on the PIP film chemistry and low observed rejectionof monovalent ions. We also use a polyacrylonitrile UF membrane,designated hereafter as MX50 (GE-Osmonics, Minnetonka, MN), asa model membrane exhibiting no salt rejection.
Intrinsic separation performance of membranes is character-ized by permeation tests involving laboratory deionized water andNaCl solutions. In RO and NF processes, the driving force for per-meation is the difference between the trans-membrane hydraulic,�p, and osmotic, ��, pressures. Thus, the local permeate velocityis described by
vw = �p − ��
�Rm, (2)
where Rm is the hydraulic membrane resistance and vw is the per-meate velocity. The trans-membrane osmotic pressure is
�� = 2RT · CP · Rscb (3)
In Eq. (3), cb is the bulk solute feed concentration, Rs (=1 − cp/cb)is the observed salt rejection, CP is the concentration polarizationfactor, R is the universal gas constant, and T is the absolute tem-perature. Concentration polarization derives from salt rejection,convection, and diffusion as,
CP = cm
cb= 1 − Rs + Rs exp
(vw
ks
), (4)
where ks is the solute mass transfer coefficient. For lami-nar crossflow, the appropriate Sherwood number correlation isSh = ksdH/D ∼= 1.85(Re Sc dH/L)1/3 [27].
Surface morphology of membranes is quantified by tappingmode AFM (AutoProbe CP, Park Scientific Instruments, USA) andimaged by SEM (XL30 FEG SEM, FEI Company, Hillsboro, USA).Membrane surface (zeta) potentials are determined from measuredstreaming potentials (EKA, Anton Paar, USA) following previouslydescribed methods [28]. Streaming potentials are measured on atleast three separate occasions using different membrane samples.Average values are reported with standard deviations to indicatereproducibility.
Lifshitz–van der Waals (�LW), electron donor (�−), and electronacceptor (�+) components of membrane surface energy were deter-mined from contact angles of deionized water, ethylene glycol, anddiiodomethane as previously described by Brant and Childress [29].However, membrane surface energies were calculated from mea-sured contact angles using a modified form of the extended Young
brane Science 319 (2008) 111–125 113
equation given by(1 + cos �
r
)�TOT
l = 2
(√�LW
s �LWl +
√�+
s �−l +
√�−
s �+l
). (5)
Here � is the equilibrium contact angle of the liquid on the surface,r is Wenzel’s “roughness area ratio” (actual surface area divided bythe planar area [30]) and �TOT is the total liquid surface energy. Thesubscripts s and l represent the solid (membrane) surface and theprobe liquid, respectively. At least 12 equilibrium contact angleswere determined for each membrane with the highest and lowestvalues discarded. The average of left and right contact angles wastaken as the equilibrium contact angle.
2.3. Microbial cell preparation and characterization
P. putida is a gram-negative, aerobic bacteria cultured in trypti-case soy broth (TSB). B. subtilis is a gram-positive, aerobic bacteriacultured in Luria–Bertani broth (LB). Pure bacterial cell cultureswere suspended and grown at 25 ◦C, shaken at 150 rpm and incu-bated until mid-exponential phase was reached, at which timecells were harvested by centrifugation at 3800 × g. S. cerevisiaeis cultured and all cells stained (to enable direct microscopicobservation) as previously described [14,15,22]. After staining,cells were re-suspended in nutrient free NaCl solutions of vary-ing ionic strength. The nutrient free conditions were selected torepresent the low biogrowth potential of chlorinated tertiary efflu-ent, common to practical wastewater reclamation RO facilities[26].
The size and shape of microbial cells are determined by SEM(XL30 FEG, Philips, USA). The equivalent spherical radius of the cellsare calculated from the Perrin shape factor, which considers thelengths of major and minor axes and equates the volume of a sphereto that of an oblate (S. cerevisiae) or prolate spheroid (P. putidaand B. subtilis). The apparent hydrodynamic diameter of all cellsis measured using dynamic light scattering (90 Plus, BrookhavenInst. Corp., USA) and the number concentration of cells in each sus-pension is quantified using a hemacytometer following proceduresdescribed by Kang et al. [15].
Electrophoretic mobility of microbial cells is measured byparticle electrophoresis (ZetaPALS, Brookhaven Instruments Cor-poration). Cell concentrations of 105–106 ml−1 are characterizedat all combinations of pH and ionic strength used in depositionexperiments. Electrophoretic mobilities are converted into cell sur-
face (zeta) potentials via the Helmholtz–Smoluchowski equation[31].Microbial cell surface energies are calculated using Eq. (5) andsessile drop contact angles of deionized water, ethylene glycol,and diiodomethane measured on microbial lawns. Microbial lawnsare formed by filtering cell suspensions onto 0.45 �m membranefilters, allowing a brief drying time before measuring probe liq-uid contact angles. Contact angles on P. putida and B. subtilis areobtained using the ‘plateau contact angles’ method of van Oss [32].However, contact angles on lawns of S. cerevisiae cells are deter-mined from five measured angles obtained immediately followingdeposition of the liquid droplet. Surface energies of microorganismsare determined using Eq. (5) with r = 1.
2.4. Modeling interfacial forces
Lifshitz–van der Waals (LW), Lewis acid–base (AB), and elec-trostatic double layer (EL), i.e., “extended DLVO” or “XDLVO”,interactions are combined with interfacial hydrodynamic forcesof crossflow lift (CL) and permeation drag (PD), and gravity (G)in the interfacial force model. The net interfacial force (FIN) was
of Mem
114 A. Subramani, E.M.V. Hoek / Journaldetermined from,
FIN = FPD + FCL + FG + FLW + FAB + FEL (6)
FPD = −(6��avw)fG0 (6a)
FCL = 81.2(�w��̇30 )
1/2a3 (6b)
FG = −43
�a3g(�bc − �w) (6c)
FLW = 2�h20 �GLW
1w2a(
1h2
)(1 + 5.32h
LW
)−1
(6d)
FAB = 2� �GAB1w2a exp
(−h0 − h
AB
)(6e)
FEL = 4�ε(
zF
RT
)2 (�c�m
EL
)a exp
(− h
EL
)(6f)
where � is the solution viscosity, a is particle radius, vw is thepermeate water velocity, fG0 is the hydrodynamic correction fac-tor [33], �̇0 is the wall shear rate, � is the density of water,g is the gravitation constant, �p is the particle/cell density, �w
is the density of water, LW (=100 nm), AB (∼=0.6 nm), and EL
(=[3.28 × 10⁹√
cNaCl
]−1, cNaCl in moles per liter) are character-
istic decay lengths for LW, AB, and EL interactions in water[34,35], h0 represents the minimum interfacial separation dis-tance (0.157 ± 0.009 nm [31,35]), ε is the dielectric permittivityof water (=78.5 × 8.854 × 10−12 C V−1 m−1), �GLW
1w2 and �GAB1w2 are
the Lifshitz–van der Waals and Lewis acid–base interfacial freeenergies, �m and �c are determined from the dimensionless sur-
face (zeta) potentials (=tanh[zF�m/c/4RT]), and �c and �m are zetapotentials of the cell and membrane. Goren’s [33] interfacial hydro-dynamic correction factor is a complex function of membranehydraulic resistance, particle size, and separation distance, butat contact is reasonably approximated by fG0(y=0) ≈ ((2/3)Rma)1/2,and thus, the interfacial drag force at contact is FPD(y=0) ≈vw(4.9��R1/2m a3/2), where the term in parentheses is the effec-tive friction factor (combining both Goren and Stokes drag) at themembrane interface.
3. Results and discussion
3.1. Measured physicochemical properties of membranes
Polyamide RO membranes (like NF90 and ESPA4) typically com-prise polymers based on m-phenylene diamine and trimesoylchloride (MPD-TMC), which produce highly cross-linked, micro-porous films of about 50–250 nm in thickness [36]. These filmsexhibit good separation performance and have residual carboxylfunctionality, which gives rise to their net negative charge andmoderate hydrophilicity. However, the interfacial polymerization
Table 1Measured physicochemical properties of membranes
Rm (m−1) Rs (%) �water (◦) �glycerol (◦) �ethylene glycol (◦)
HL 3.3 × 10¹³ 20 41.2 ± 0.8 34.6 ± 0.8 21.2 ± 0.9
NF270 2.5 × 10¹³ 30 39.7 ± 0.4 27.6 ± 0.8 12.2 ± 2.1
NF90 5.0 × 10¹³ 75 67.5 ± 0.3 53.4 ± 0.4 14.4 ± 1.9
ESPA4 1.0 × 10¹⁴ 90 69.9 ± 0.8 24.5 ± 0.0 16.8 ± 0.0MX50a 1.0 × 10¹² 0 24.7 ± 4.6 25.5 ± 0.6 24.9 ± 2.1
a Data taken from Wang et al. [22].
brane Science 319 (2008) 111–125
reaction is rapid and violent, producing a rough surface. In contrast,NF membranes (like NF270 and HL) typically comprise polymersbased on piperazine and trimesoyl chloride (PIP-TMC), whichproduce minimally cross-linked, nanoporous films of 10–50-nmthickness [37]. These films are very hydrophilic, negatively charged,and smooth on the nanoscale. Characteristically, NF membranesreject monovalent salts poorly, but divalent salts highly throughDonnan exclusion.
Measured physicochemical properties of the four test NF/ROmembranes and the UF membrane are listed in Table 1. Membranehydraulic resistances (Rm) are similar (∼1013 m−1) for HL, NF270,and NF90, an order of magnitude higher for ESPA4 (∼1014 m−1), andan order of magnitude lower for MX50 (∼1012 m−1). The permeatedrag force experienced by a microbial cell approaching a mem-brane surface is proportional to the Stokes drag force multipliedby an interfacial hydrodynamic correction factor. Theoretically, fora given permeate flux, a membrane with greater intrinsic hydraulicresistance produces more permeate drag on a depositing cell (pro-portional to Rm
1/2). Membrane resistances increase in order ofMX50 < HL ∼ NF270 < NF90 < ESPA4.
Salt rejections reported in Table 1 are average valuesobserved for 10 mM NaCl feed solutions at unadjusted pHof 5.8 ± 0.2. Observed salt rejection increases in the order ofMX50 < HL < NF270 < NF90 < ESPA4 at fixed operating conditions.The UF membrane (MX50) does not exhibit any salt rejection, so themembrane surface ionic strength is equal to the bulk ionic strength.The ionic strength at the membrane surface will be higher than thatin the bulk for the NF/RO membranes because of salt concentrationpolarization.
Measured contact angles of water are ∼25◦ for MX50, ∼40◦
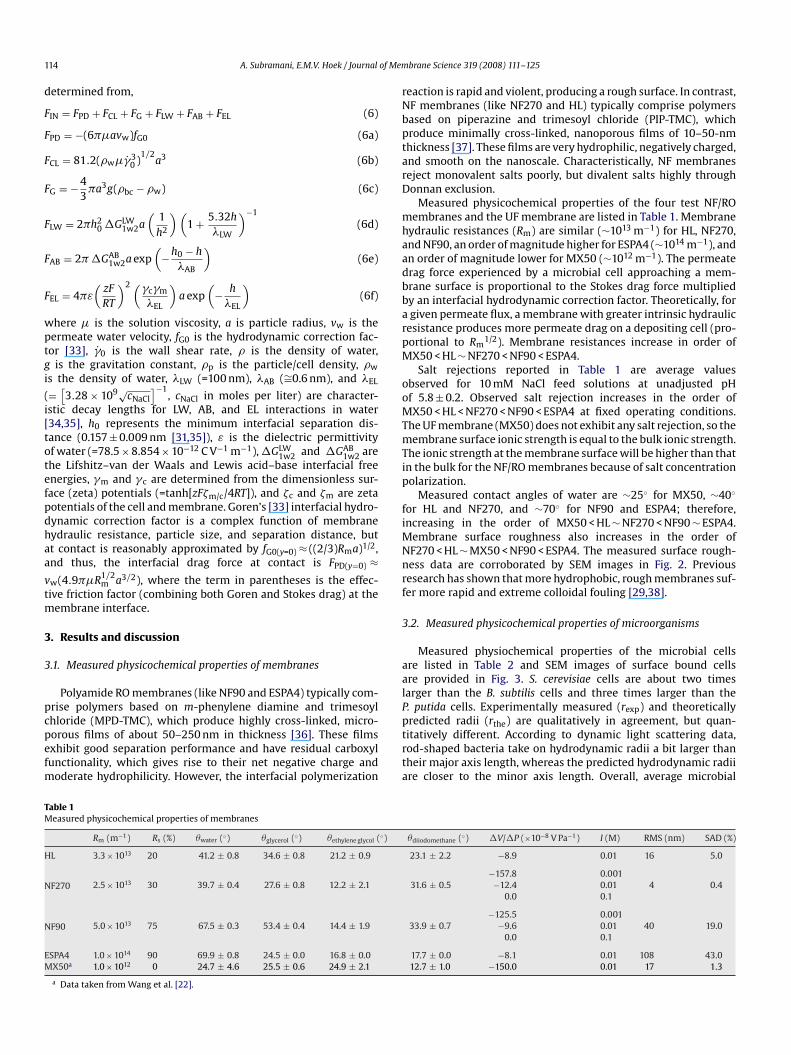
for HL and NF270, and ∼70◦ for NF90 and ESPA4; therefore,increasing in the order of MX50 < HL ∼ NF270 < NF90 ∼ ESPA4.Membrane surface roughness also increases in the order ofNF270 < HL ∼ MX50 < NF90 < ESPA4. The measured surface rough-ness data are corroborated by SEM images in Fig. 2. Previousresearch has shown that more hydrophobic, rough membranes suf-fer more rapid and extreme colloidal fouling [29,38].
3.2. Measured physicochemical properties of microorganisms
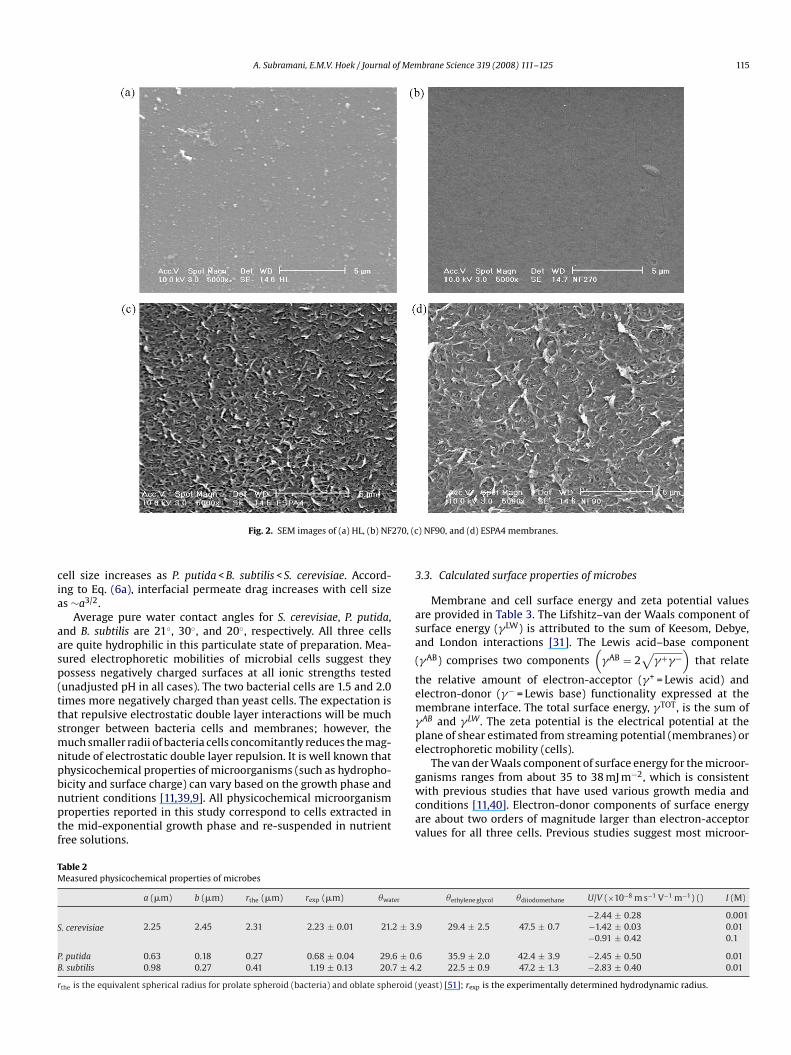
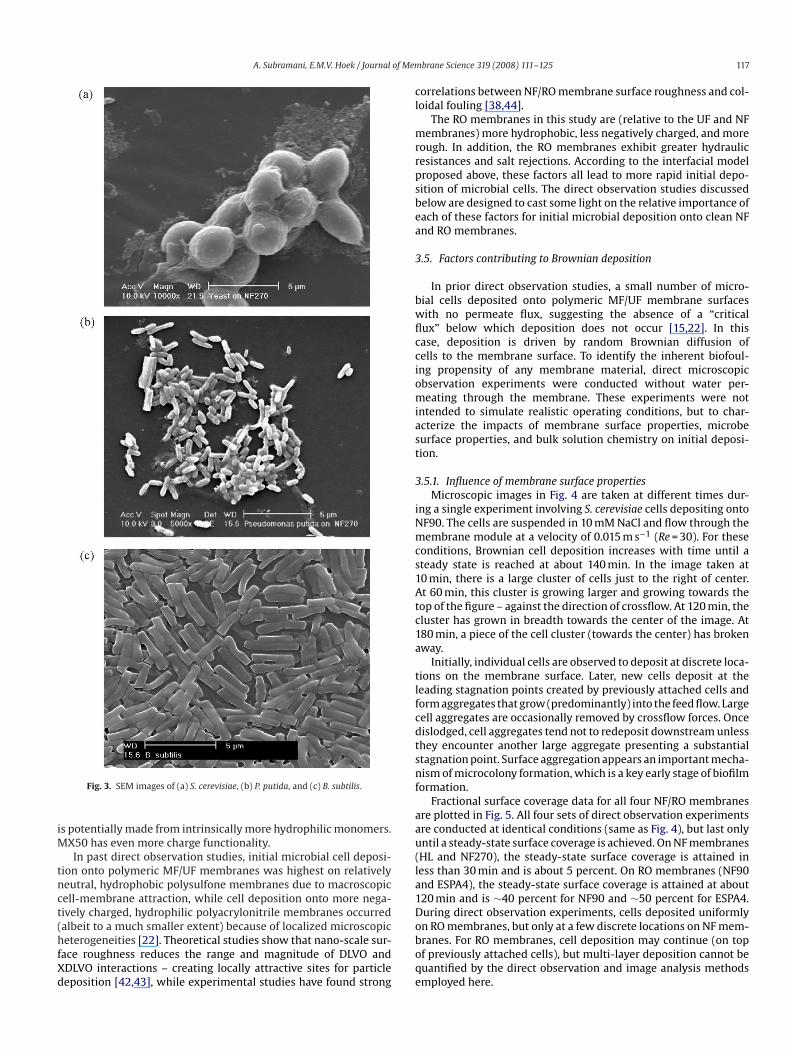
Measured physiochemical properties of the microbial cellsare listed in Table 2 and SEM images of surface bound cellsare provided in Fig. 3. S. cerevisiae cells are about two timeslarger than the B. subtilis cells and three times larger than theP. putida cells. Experimentally measured (rexp) and theoreticallypredicted radii (rthe) are qualitatively in agreement, but quan-titatively different. According to dynamic light scattering data,rod-shaped bacteria take on hydrodynamic radii a bit larger thantheir major axis length, whereas the predicted hydrodynamic radiiare closer to the minor axis length. Overall, average microbial
�diiodomethane (◦) �V/�P (×10−8 V Pa−1) I (M) RMS (nm) SAD (%)
23.1 ± 2.2 −8.9 0.01 16 5.0
−157.8 0.00131.6 ± 0.5 −12.4 0.01 4 0.4
0.0 0.1
−125.5 0.00133.9 ± 0.7 −9.6 0.01 40 19.0
0.0 0.1
17.7 ± 0.0 −8.1 0.01 108 43.012.7 ± 1.0 −150.0 0.01 17 1.3
A. Subramani, E.M.V. Hoek / Journal of Membrane Science 319 (2008) 111–125 115
270, (c
Fig. 2. SEM images of (a) HL, (b) NFcell size increases as P. putida < B. subtilis < S. cerevisiae. Accord-ing to Eq. (6a), interfacial permeate drag increases with cell sizeas ∼a3/2.
Average pure water contact angles for S. cerevisiae, P. putida,and B. subtilis are 21◦, 30◦, and 20◦, respectively. All three cellsare quite hydrophilic in this particulate state of preparation. Mea-sured electrophoretic mobilities of microbial cells suggest theypossess negatively charged surfaces at all ionic strengths tested(unadjusted pH in all cases). The two bacterial cells are 1.5 and 2.0times more negatively charged than yeast cells. The expectation isthat repulsive electrostatic double layer interactions will be muchstronger between bacteria cells and membranes; however, themuch smaller radii of bacteria cells concomitantly reduces the mag-nitude of electrostatic double layer repulsion. It is well known thatphysicochemical properties of microorganisms (such as hydropho-bicity and surface charge) can vary based on the growth phase andnutrient conditions [11,39,9]. All physicochemical microorganismproperties reported in this study correspond to cells extracted inthe mid-exponential growth phase and re-suspended in nutrientfree solutions.
Table 2Measured physicochemical properties of microbes
a (�m) b (�m) rthe (�m) rexp (�m) �water
S. cerevisiae 2.25 2.45 2.31 2.23 ± 0.01 21.2 ± 3.
P. putida 0.63 0.18 0.27 0.68 ± 0.04 29.6 ± 0.B. subtilis 0.98 0.27 0.41 1.19 ± 0.13 20.7 ± 4.
rthe is the equivalent spherical radius for prolate spheroid (bacteria) and oblate spheroid (
) NF90, and (d) ESPA4 membranes.
3.3. Calculated surface properties of microbes
Membrane and cell surface energy and zeta potential valuesare provided in Table 3. The Lifshitz–van der Waals component ofsurface energy (�LW) is attributed to the sum of Keesom, Debye,and London interactions [31]. The Lewis acid–base component
(�AB) comprises two components(
�AB = 2√
�+�−)
that relate
the relative amount of electron-acceptor (�+ = Lewis acid) andelectron-donor (�− = Lewis base) functionality expressed at themembrane interface. The total surface energy, �TOT, is the sum of�AB and �LW. The zeta potential is the electrical potential at theplane of shear estimated from streaming potential (membranes) orelectrophoretic mobility (cells).
The van der Waals component of surface energy for the microor-ganisms ranges from about 35 to 38 mJ m−2, which is consistentwith previous studies that have used various growth media andconditions [11,40]. Electron-donor components of surface energyare about two orders of magnitude larger than electron-acceptorvalues for all three cells. Previous studies suggest most microor-
�ethylene glycol �diiodomethane U/V (×10−8 m s−1 V−1 m−1) () I (M)
−2.44 ± 0.28 0.0019 29.4 ± 2.5 47.5 ± 0.7 −1.42 ± 0.03 0.01
−0.91 ± 0.42 0.1
6 35.9 ± 2.0 42.4 ± 3.9 −2.45 ± 0.50 0.012 22.5 ± 0.9 47.2 ± 1.3 −2.83 ± 0.40 0.01
yeast) [51]; rexp is the experimentally determined hydrodynamic radius.
116 A. Subramani, E.M.V. Hoek / Journal of Membrane Science 319 (2008) 111–125
2)
.3
.0
.0
.2
.0
.6
.6.7
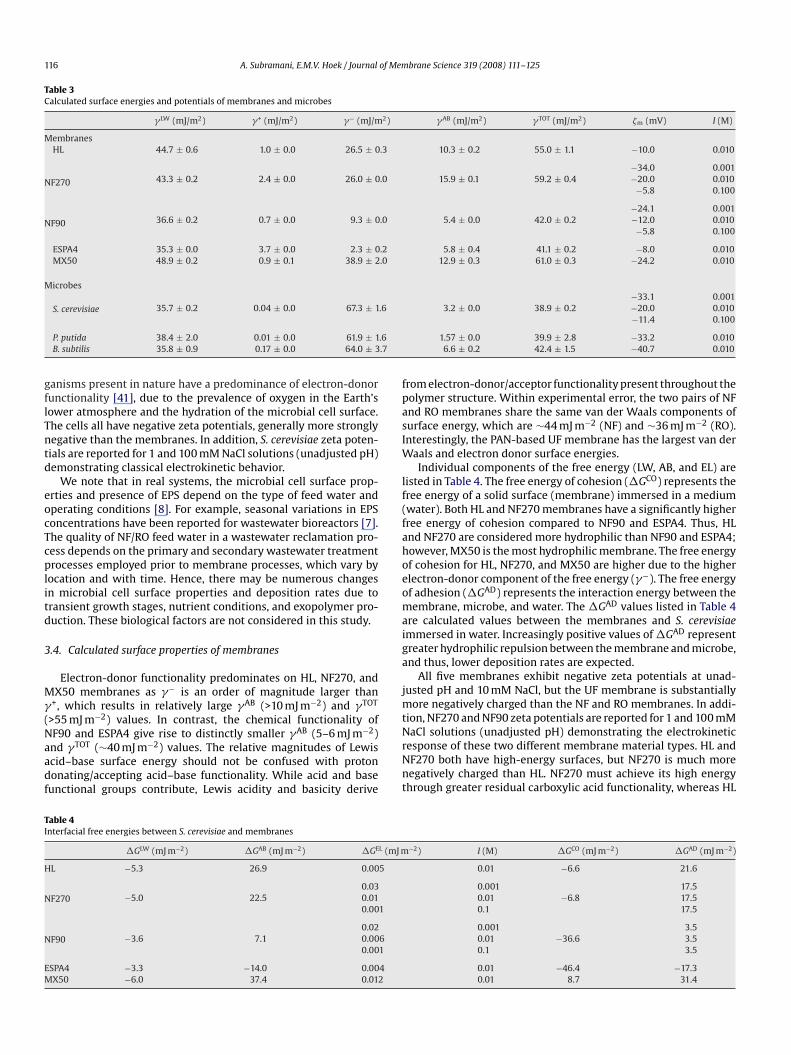
Table 3Calculated surface energies and potentials of membranes and microbes
�LW (mJ/m2) �+ (mJ/m2) �− (mJ/m
MembranesHL 44.7 ± 0.6 1.0 ± 0.0 26.5 ± 0
NF270 43.3 ± 0.2 2.4 ± 0.0 26.0 ± 0
NF90 36.6 ± 0.2 0.7 ± 0.0 9.3 ± 0
ESPA4 35.3 ± 0.0 3.7 ± 0.0 2.3 ± 0MX50 48.9 ± 0.2 0.9 ± 0.1 38.9 ± 2
Microbes
S. cerevisiae 35.7 ± 0.2 0.04 ± 0.0 67.3 ± 1
P. putida 38.4 ± 2.0 0.01 ± 0.0 61.9 ± 1B. subtilis 35.8 ± 0.9 0.17 ± 0.0 64.0 ± 3
ganisms present in nature have a predominance of electron-donorfunctionality [41], due to the prevalence of oxygen in the Earth’slower atmosphere and the hydration of the microbial cell surface.The cells all have negative zeta potentials, generally more stronglynegative than the membranes. In addition, S. cerevisiae zeta poten-tials are reported for 1 and 100 mM NaCl solutions (unadjusted pH)demonstrating classical electrokinetic behavior.
We note that in real systems, the microbial cell surface prop-erties and presence of EPS depend on the type of feed water and
operating conditions [8]. For example, seasonal variations in EPSconcentrations have been reported for wastewater bioreactors [7].The quality of NF/RO feed water in a wastewater reclamation pro-cess depends on the primary and secondary wastewater treatmentprocesses employed prior to membrane processes, which vary bylocation and with time. Hence, there may be numerous changesin microbial cell surface properties and deposition rates due totransient growth stages, nutrient conditions, and exopolymer pro-duction. These biological factors are not considered in this study.3.4. Calculated surface properties of membranes
Electron-donor functionality predominates on HL, NF270, andMX50 membranes as �− is an order of magnitude larger than�+, which results in relatively large �AB (>10 mJ m−2) and �TOT
(>55 mJ m−2) values. In contrast, the chemical functionality ofNF90 and ESPA4 give rise to distinctly smaller �AB (5–6 mJ m−2)and �TOT (∼40 mJ m−2) values. The relative magnitudes of Lewisacid–base surface energy should not be confused with protondonating/accepting acid–base functionality. While acid and basefunctional groups contribute, Lewis acidity and basicity derive
Table 4Interfacial free energies between S. cerevisiae and membranes
�GLW (mJ m−2) �GAB (mJ m−2) �GEL (mJ m
HL −5.3 26.9 0.005
NF2700.03
−5.0 22.5 0.010.001
NF900.02
−3.6 7.1 0.0060.001
ESPA4 −3.3 −14.0 0.004MX50 −6.0 37.4 0.012
�AB (mJ/m2) �TOT (mJ/m2) �m (mV) I (M)
10.3 ± 0.2 55.0 ± 1.1 −10.0 0.010
−34.0 0.00115.9 ± 0.1 59.2 ± 0.4 −20.0 0.010
−5.8 0.100
−24.1 0.0015.4 ± 0.0 42.0 ± 0.2 −12.0 0.010
−5.8 0.100
5.8 ± 0.4 41.1 ± 0.2 −8.0 0.01012.9 ± 0.3 61.0 ± 0.3 −24.2 0.010
−33.1 0.0013.2 ± 0.0 38.9 ± 0.2 −20.0 0.010
−11.4 0.100
1.57 ± 0.0 39.9 ± 2.8 −33.2 0.0106.6 ± 0.2 42.4 ± 1.5 −40.7 0.010
from electron-donor/acceptor functionality present throughout thepolymer structure. Within experimental error, the two pairs of NFand RO membranes share the same van der Waals components ofsurface energy, which are ∼44 mJ m−2 (NF) and ∼36 mJ m−2 (RO).Interestingly, the PAN-based UF membrane has the largest van derWaals and electron donor surface energies.
Individual components of the free energy (LW, AB, and EL) arelisted in Table 4. The free energy of cohesion (�GCO) represents thefree energy of a solid surface (membrane) immersed in a medium
(water). Both HL and NF270 membranes have a significantly higherfree energy of cohesion compared to NF90 and ESPA4. Thus, HLand NF270 are considered more hydrophilic than NF90 and ESPA4;however, MX50 is the most hydrophilic membrane. The free energyof cohesion for HL, NF270, and MX50 are higher due to the higherelectron-donor component of the free energy (�−). The free energyof adhesion (�GAD) represents the interaction energy between themembrane, microbe, and water. The �GAD values listed in Table 4are calculated values between the membranes and S. cerevisiaeimmersed in water. Increasingly positive values of �GAD representgreater hydrophilic repulsion between the membrane and microbe,and thus, lower deposition rates are expected.All five membranes exhibit negative zeta potentials at unad-justed pH and 10 mM NaCl, but the UF membrane is substantiallymore negatively charged than the NF and RO membranes. In addi-tion, NF270 and NF90 zeta potentials are reported for 1 and 100 mMNaCl solutions (unadjusted pH) demonstrating the electrokineticresponse of these two different membrane material types. HL andNF270 both have high-energy surfaces, but NF270 is much morenegatively charged than HL. NF270 must achieve its high energythrough greater residual carboxylic acid functionality, whereas HL
−2) I (M) �GCO (mJ m−2) �GAD (mJ m−2)
0.01 −6.6 21.6
0.001 17.50.01 −6.8 17.50.1 17.5
0.001 3.50.01 −36.6 3.50.1 3.5
0.01 −46.4 −17.30.01 8.7 31.4
A. Subramani, E.M.V. Hoek / Journal of Mem
form aggregates that grow (predominantly) into the feed flow. Large
Fig. 3. SEM images of (a) S. cerevisiae, (b) P. putida, and (c) B. subtilis.
is potentially made from intrinsically more hydrophilic monomers.MX50 has even more charge functionality.
In past direct observation studies, initial microbial cell deposi-tion onto polymeric MF/UF membranes was highest on relativelyneutral, hydrophobic polysulfone membranes due to macroscopiccell-membrane attraction, while cell deposition onto more nega-tively charged, hydrophilic polyacrylonitrile membranes occurred(albeit to a much smaller extent) because of localized microscopicheterogeneities [22]. Theoretical studies show that nano-scale sur-face roughness reduces the range and magnitude of DLVO andXDLVO interactions – creating locally attractive sites for particledeposition [42,43], while experimental studies have found strong
brane Science 319 (2008) 111–125 117
correlations between NF/RO membrane surface roughness and col-loidal fouling [38,44].
The RO membranes in this study are (relative to the UF and NFmembranes) more hydrophobic, less negatively charged, and morerough. In addition, the RO membranes exhibit greater hydraulicresistances and salt rejections. According to the interfacial modelproposed above, these factors all lead to more rapid initial depo-sition of microbial cells. The direct observation studies discussedbelow are designed to cast some light on the relative importance ofeach of these factors for initial microbial deposition onto clean NFand RO membranes.
3.5. Factors contributing to Brownian deposition
In prior direct observation studies, a small number of micro-bial cells deposited onto polymeric MF/UF membrane surfaceswith no permeate flux, suggesting the absence of a “criticalflux” below which deposition does not occur [15,22]. In thiscase, deposition is driven by random Brownian diffusion ofcells to the membrane surface. To identify the inherent biofoul-ing propensity of any membrane material, direct microscopicobservation experiments were conducted without water per-meating through the membrane. These experiments were notintended to simulate realistic operating conditions, but to char-acterize the impacts of membrane surface properties, microbesurface properties, and bulk solution chemistry on initial deposi-tion.
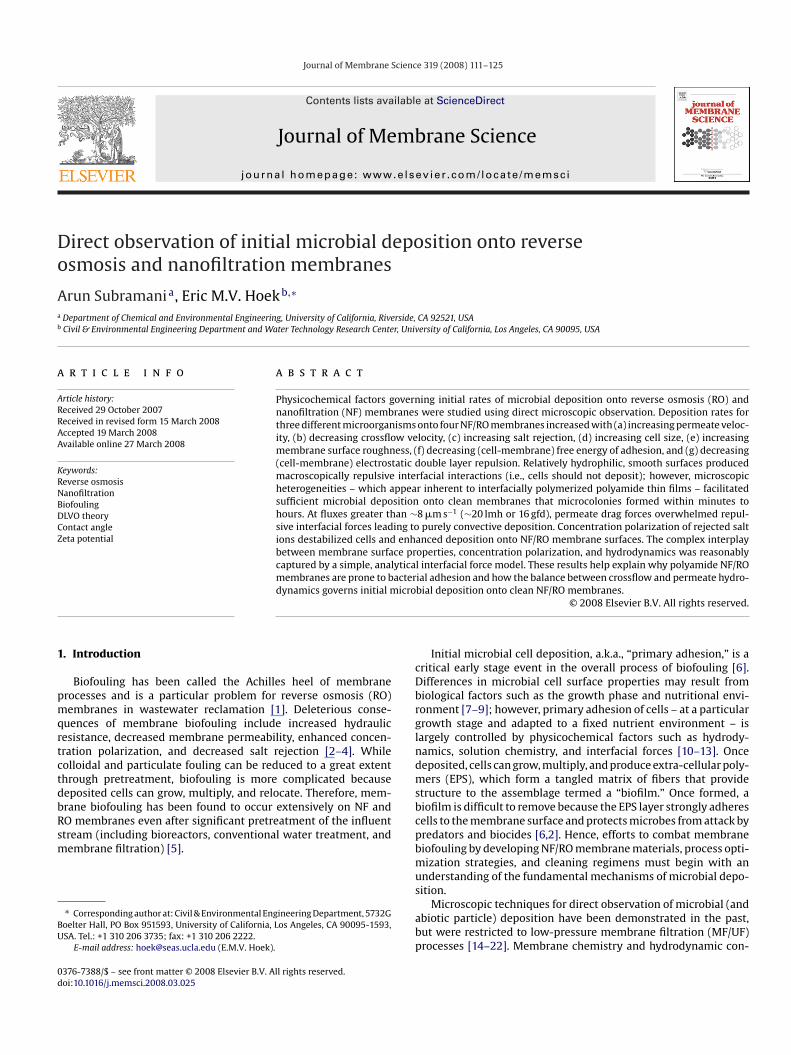
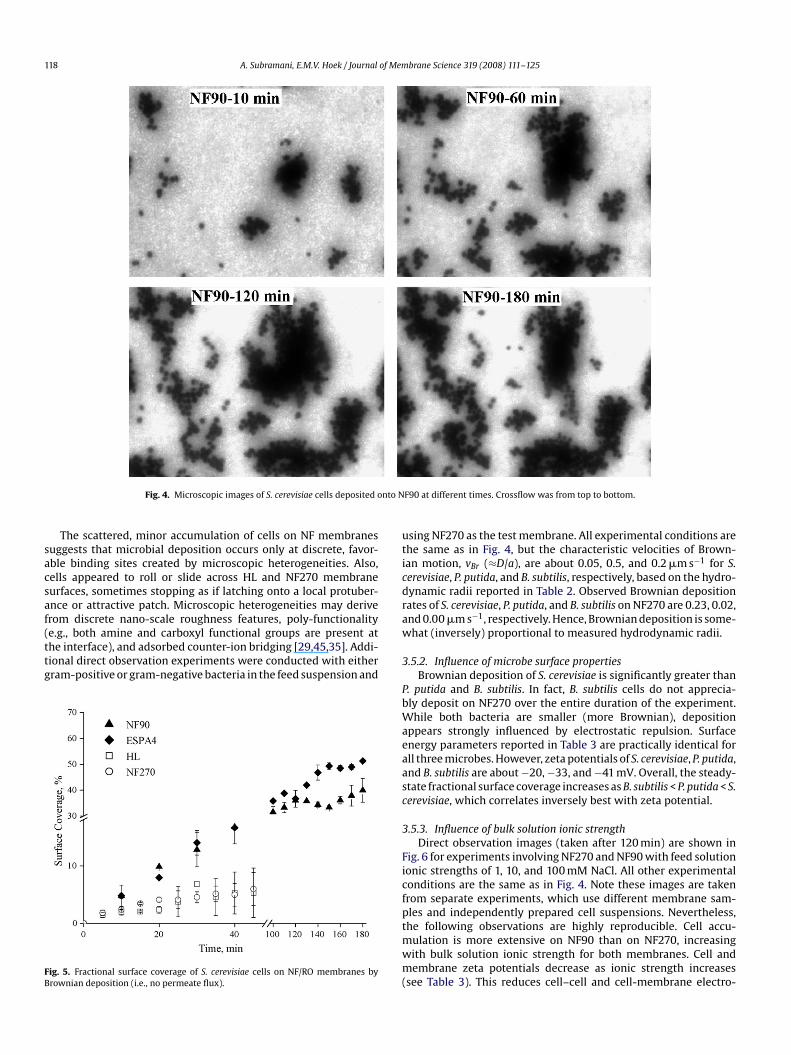
3.5.1. Influence of membrane surface propertiesMicroscopic images in Fig. 4 are taken at different times dur-
ing a single experiment involving S. cerevisiae cells depositing ontoNF90. The cells are suspended in 10 mM NaCl and flow through themembrane module at a velocity of 0.015 m s−1 (Re = 30). For theseconditions, Brownian cell deposition increases with time until asteady state is reached at about 140 min. In the image taken at10 min, there is a large cluster of cells just to the right of center.At 60 min, this cluster is growing larger and growing towards thetop of the figure – against the direction of crossflow. At 120 min, thecluster has grown in breadth towards the center of the image. At180 min, a piece of the cell cluster (towards the center) has brokenaway.
Initially, individual cells are observed to deposit at discrete loca-tions on the membrane surface. Later, new cells deposit at theleading stagnation points created by previously attached cells and
cell aggregates are occasionally removed by crossflow forces. Oncedislodged, cell aggregates tend not to redeposit downstream unlessthey encounter another large aggregate presenting a substantialstagnation point. Surface aggregation appears an important mecha-nism of microcolony formation, which is a key early stage of biofilmformation.
Fractional surface coverage data for all four NF/RO membranesare plotted in Fig. 5. All four sets of direct observation experimentsare conducted at identical conditions (same as Fig. 4), but last onlyuntil a steady-state surface coverage is achieved. On NF membranes(HL and NF270), the steady-state surface coverage is attained inless than 30 min and is about 5 percent. On RO membranes (NF90and ESPA4), the steady-state surface coverage is attained at about120 min and is ∼40 percent for NF90 and ∼50 percent for ESPA4.During direct observation experiments, cells deposited uniformlyon RO membranes, but only at a few discrete locations on NF mem-branes. For RO membranes, cell deposition may continue (on topof previously attached cells), but multi-layer deposition cannot bequantified by the direct observation and image analysis methodsemployed here.
118 A. Subramani, E.M.V. Hoek / Journal of Membrane Science 319 (2008) 111–125
Fig. 4. Microscopic images of S. cerevisiae cells deposited onto N
The scattered, minor accumulation of cells on NF membranessuggests that microbial deposition occurs only at discrete, favor-able binding sites created by microscopic heterogeneities. Also,cells appeared to roll or slide across HL and NF270 membranesurfaces, sometimes stopping as if latching onto a local protuber-ance or attractive patch. Microscopic heterogeneities may derivefrom discrete nano-scale roughness features, poly-functionality(e.g., both amine and carboxyl functional groups are present atthe interface), and adsorbed counter-ion bridging [29,45,35]. Addi-tional direct observation experiments were conducted with eithergram-positive or gram-negative bacteria in the feed suspension and
Fig. 5. Fractional surface coverage of S. cerevisiae cells on NF/RO membranes byBrownian deposition (i.e., no permeate flux).
F90 at different times. Crossflow was from top to bottom.
using NF270 as the test membrane. All experimental conditions arethe same as in Fig. 4, but the characteristic velocities of Brown-ian motion, vBr (≈D/a), are about 0.05, 0.5, and 0.2 �m s−1 for S.cerevisiae, P. putida, and B. subtilis, respectively, based on the hydro-dynamic radii reported in Table 2. Observed Brownian depositionrates of S. cerevisiae, P. putida, and B. subtilis on NF270 are 0.23, 0.02,and 0.00 �m s−1, respectively. Hence, Brownian deposition is some-what (inversely) proportional to measured hydrodynamic radii.
3.5.2. Influence of microbe surface propertiesBrownian deposition of S. cerevisiae is significantly greater than
P. putida and B. subtilis. In fact, B. subtilis cells do not apprecia-
bly deposit on NF270 over the entire duration of the experiment.While both bacteria are smaller (more Brownian), depositionappears strongly influenced by electrostatic repulsion. Surfaceenergy parameters reported in Table 3 are practically identical forall three microbes. However, zeta potentials of S. cerevisiae, P. putida,and B. subtilis are about −20, −33, and −41 mV. Overall, the steady-state fractional surface coverage increases as B. subtilis < P. putida < S.cerevisiae, which correlates inversely best with zeta potential.3.5.3. Influence of bulk solution ionic strengthDirect observation images (taken after 120 min) are shown in
Fig. 6 for experiments involving NF270 and NF90 with feed solutionionic strengths of 1, 10, and 100 mM NaCl. All other experimentalconditions are the same as in Fig. 4. Note these images are takenfrom separate experiments, which use different membrane sam-ples and independently prepared cell suspensions. Nevertheless,the following observations are highly reproducible. Cell accu-mulation is more extensive on NF90 than on NF270, increasingwith bulk solution ionic strength for both membranes. Cell andmembrane zeta potentials decrease as ionic strength increases(see Table 3). This reduces cell–cell and cell-membrane electro-

A. Subramani, E.M.V. Hoek / Journal of Membrane Science 319 (2008) 111–125 119
0 at N
Fig. 6. Microscopic images of S. cerevisiae cells deposited on NF270 and NF9static double layer repulsion. Dynamic light scattering data suggestmicrobial cells do not aggregate in the bulk at any of the ionicstrengths tested (data not shown), so the relationship between bulksolution ionic strength and cell deposition appears directly relatedto microbe–membrane electrostatic double layer repulsion.
In the absence of permeation, interfacial forces combine withBrownian motion to govern initial microbial deposition; van derWaals, electrostatic, and crossflow lift forces are plotted in Fig. 7(a).In Fig. 7(b) acid–base forces are included along with the otherforces plotted in Fig. 7(a). An effective Brownian force can becalculated from kT/a and is on the order of 10−6 nN for S. cere-visiae. At 1 and 10 mM ionic strength, the net interaction forceis repulsive and is about six orders of magnitude larger than theforce of Brownian motion. The repulsive force is about two timeslarger for NF270 than NF90, and in proportion to the membranezeta potentials. Deposition is macroscopically unfavorable becauselong-range electrostatic double layer repulsion dominates all otherforces. Despite the massive repulsive force (relative to the force ofBrownian diffusion), cells still deposit on both membranes. Inclu-sion of acid–base interactions (Fig. 7b) leads to total repulsion at
aCl concentrations of 1, 10, and 100 mM. Crossflow was from top to bottom.
short range (<5 nm) for all ionic strengths tested. For NF90, theinteraction force is attractive at very short-range due to weak elec-trostatic repulsion and strong hydrophobic attraction.
At 1 and 10 mM ionic strengths, the small amount of depositionis attributed to microscopic heterogeneity. The strong electrostaticrepulsion and simple electrolyte composition (i.e., no Ca2+) suggestsurface roughness is the main source of heterogeneity. Previoustheoretical studies suggest nano-scale surface roughness reducesthe range and magnitude of colloid–membrane DLVO interactions,creating locally favorable binding sites [42,43]. Numerous sharplypeaked protuberances on the surface of NF90 (Fig. 2c) create plen-tiful locations that are favorable for Brownian deposition. This mayexplain the fairly even distribution of cells accumulated on the sur-face of NF90. In contrast, the relatively sparse roughness features onNF270 (Fig. 2b) lead only to a few, localized spots on the membranesurface that are favorable for Brownian deposition.
At 100 mM ionic strength, electrostatic repulsion is negligibleand deposition is macroscopically favorable on both membranes.While many cells deposit on both the membranes, there are notice-ably more on NF90. In absence of significant electrostatic double
120 A. Subramani, E.M.V. Hoek / Journal of Membrane Science 319 (2008) 111–125
gfd
)(�
ms−1
)F
DLV
O,8
gfd
C(n
N)
FX
DLV
O,8
gfd
C(n
N)
k d(8
gfd
)(�
ms−1
)F
DLV
O,1
6gf
dC
(nN
)F
XD
LVO
,16
gfd
C(n
N)
k d(1
6gf
d)
(�m
s−1)
±0.
290.
200.
261.
41±
0.35
0.09
0.17
4.16
±1.
18
±0.
03–
––
––
–±
0.47
0.67
0.4
42.
05±
1.10
0.4
90.
405.
00
±0.
00
±0.
23–
––
––
–
±0.
23–
––
––
–±
0.23
0.33
0.20
3.33
±0.
00.
180.
185.
83±
1.17
±0.
0–
––
––
–
±1.
180.
120.
044.
44
±0.
960.
010.
03–
F G.
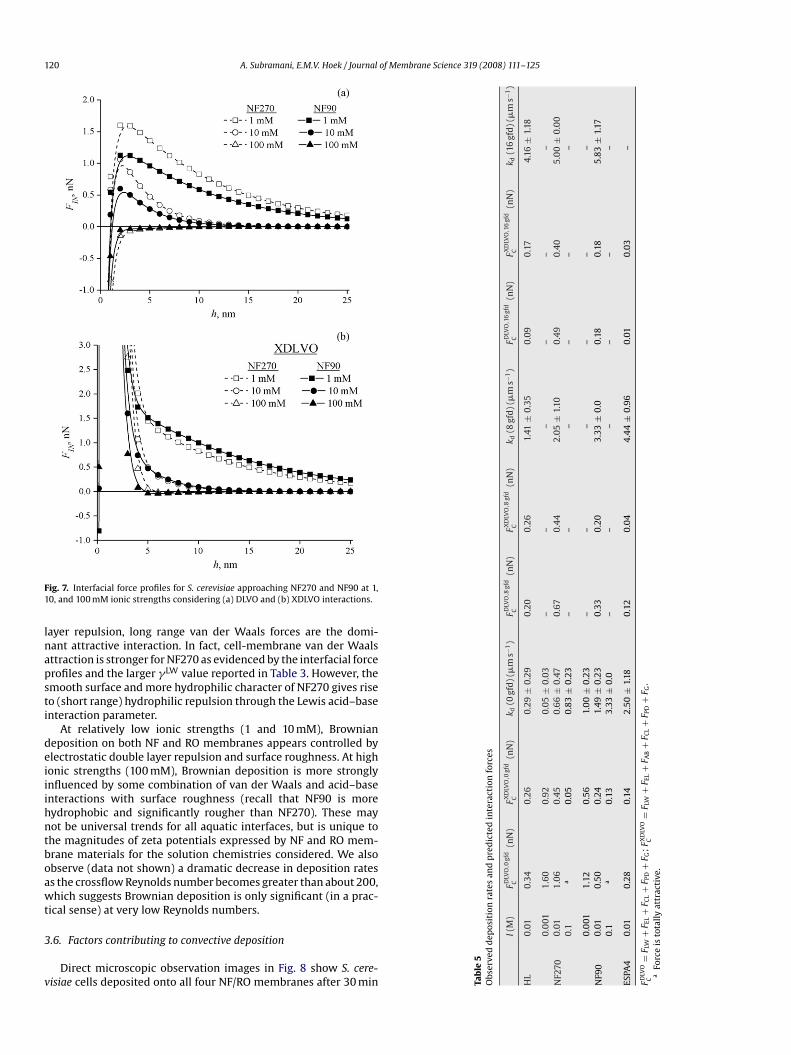
Fig. 7. Interfacial force profiles for S. cerevisiae approaching NF270 and NF90 at 1,10, and 100 mM ionic strengths considering (a) DLVO and (b) XDLVO interactions.
layer repulsion, long range van der Waals forces are the domi-nant attractive interaction. In fact, cell-membrane van der Waalsattraction is stronger for NF270 as evidenced by the interfacial forceprofiles and the larger �LW value reported in Table 3. However, thesmooth surface and more hydrophilic character of NF270 gives rise
to (short range) hydrophilic repulsion through the Lewis acid–baseinteraction parameter.At relatively low ionic strengths (1 and 10 mM), Browniandeposition on both NF and RO membranes appears controlled byelectrostatic double layer repulsion and surface roughness. At highionic strengths (100 mM), Brownian deposition is more stronglyinfluenced by some combination of van der Waals and acid–baseinteractions with surface roughness (recall that NF90 is morehydrophobic and significantly rougher than NF270). These maynot be universal trends for all aquatic interfaces, but is unique tothe magnitudes of zeta potentials expressed by NF and RO mem-brane materials for the solution chemistries considered. We alsoobserve (data not shown) a dramatic decrease in deposition ratesas the crossflow Reynolds number becomes greater than about 200,which suggests Brownian deposition is only significant (in a prac-tical sense) at very low Reynolds numbers.
3.6. Factors contributing to convective deposition
Direct microscopic observation images in Fig. 8 show S. cere-visiae cells deposited onto all four NF/RO membranes after 30 min Ta
ble
5O
bser
ved
dep
osit
ion
rate
san
dp
red
icte
din
tera
ctio
nfo
rces
I(M
)F
DLV
O,0
gfd
C(n
N)
FX
DLV
O,0
gfd
C(n
N)
k d(0
HL
0.01
0.34
0.26
0.29
NF2
700.
001
1.60
0.92
0.05
0.01
1.06
0.45
0.66
0.1
a0.
050.
83
NF9
00.
001
1.12
0.56
1.0
00.
010.
500.
241.
49
0.1
a0.
133.
33
ESPA
40.
010.
280.
142.
50
FD
LVO
C=
F LW
+F E
L+
F CL+
F PD
+F G
;F
XD
LVO
C=
F LW
+F E
L+
F AB
+F C
L+
F PD
+a
Forc
eis
tota
llyat
trac
tive
.

A. Subramani, E.M.V. Hoek / Journal of Membrane Science 319 (2008) 111–125 121
ESPA
Fig. 8. Microscopic images of S. cerevisiae cells deposited onto NF270, HL, NF90, andof permeation. Experimental conditions include: crossflow veloc-ity of 0.04 m s−1 (Re = 80), permeation velocity of 4 �m s−1 (8 gfd),unadjusted pH of 5.2 ± 0.2, ionic strength of 10 mM NaCl, and feedcell concentration of 2 × 10⁶ ml−1. According to these images, fewercells deposited onto NF membranes than on RO membranes. Cellsuniformly deposited onto NF90 and ESPA4 surfaces, whereas sur-face aggregation occurs at discrete locations on NF270 and HLsurfaces. While these results qualitatively agree with Browniandeposition experiments (no permeation), a number of additionalfactors contribute to the observed cell deposition patterns.
3.6.1. Influence of permeate velocity
A permeate velocity of 1 �m s−1 equals 3.6 l m−2 h−1 (“lmh”) or2 gal ft−2 d−1 (“gfd”). Brownian velocities of all three microbial cellsare between 0.05 and 0.2 �m s−1, so permeate convection domi-nates microbial cell transport for all permeation velocities greaterthan 1 �m s−1. The DLVO migration velocity, vDLVO(≈ FDLVO/fstfG0 =FDLVO/4.9�R1/2
m a3/2) acts to propel microbial cells away from themembrane surface. In the solution chemistry tested, DLVO migra-tion velocities for S. cerevisiae interacting with HL, NF270, NF90, andESPA4 are about 1.10, 4.09, 1.31, and 0.52 �m s−1, respectively. TheDLVO force was calculated at a separation distance of 3 nm (1 Debyelength), where the net interaction force is a maximum. The migra-tion velocity is highest for NF270 due to its relatively largest zetapotential (−20 mV), leading to a larger contribution to migration byelectrostatic repulsion. At a permeation velocity of 4 �m s−1, theo-retical net deposition rates, kdep,the(= vp − vDLVO) are 3.36, 1.41, 3.14,and 3.41 �m s−1, and at 8 �m s−1 deposition rates are 7.71, 6.11, 7.53,and 7.50 �m s−1, respectively.
Inclusion of short-range acid–base interactions leads to theXDLVO migration velocity (≈FXDLVO/fStfG0). The XDLVO interactionforce is very large at small separation distances due to the strongacid–base interactions between microbes and membranes. The
4 membranes after 30 min of permeation. Crossflow was from top to bottom.
XDLVO migration velocities for S. cerevisiae interacting with HL,NF270, NF90, and ESPA4 are about 0.84, 1.74, 0.63, and 0.26 �m s−1.The XDLVO migration velocities are higher for HL and NF270 dueto larger contribution from hydrophilic repulsion. The migrationvelocity is lowest for ESPA4 because it is more hydrophobic than theother membranes. At a permeation velocity of 4 �m s−1, theoreticalnet deposition rates, kdep,the (= vp − vXDLVO) are 3.16, 2.30, 3.48, and3.93 �m s−1; at a permeation velocity of 8 �m s−1 deposition ratesare 7.26, 6.46, 7.53, and 7.92 �m s−1, respectively. Whether one con-siders DLVO or XDLVO interactions, permeation drag overwhelmsinterfacial forces at fluxes greater than ∼8 �m s−1 (∼20 lmh or16 gfd).
3.6.2. Influence of membrane surface propertiesInterfacial free energy parameters and observed net deposi-
tion rates at permeation velocities of 0, 4, and 8 �m s−1 (0, 8, and16 gfd) are listed in Table 5 (derived from analysis of microscopicimages). These data are for S. cerevisiae depositing onto NF andRO membranes. At a permeation velocity of 4 �m s−1, observeddeposition rates are on average 1.41, 2.05, 3.33, and 4.44 for HL,NF270, NF90, and ESPA4, respectively. Observed deposition rates at8 �m s−1 are 4.16, 5.00, and 5.83 for HL, NF270, and NF90, respec-tively (ESPA4 not analyzed). Hence, theoretical net deposition rates(as calculated) tend to overestimate, but give reasonable values andtrends for cell deposition onto RO membranes, i.e. higher depositionrates for hydrophobic membranes (NF90 and ESPA4). Depositiononto hydrophilic NF membranes is not reasonably described bythe difference in permeation and DLVO migration velocities. Theseobservations are consistent with DLVO theory in general, but specif-ically, theoretical net deposition rates (as calculated) do not accountfor possible effects of Lewis acid–base interactions, membrane sur-face roughness, or concentration polarization. Inclusion of XDLVOmigration velocity accounts for short-range acid–base interactions.
of Mem
�G
17.514.316.1 0.00 ± 0.00 0.83 ± 0.24 4.16 ± 1.18
processes. Hence, NF/RO membranes likely have an intrinsicallyhigher propensity to accumulate microbial cells than MF/UF mem-branes because the interfacial solution chemistry promotes celldestabilization.
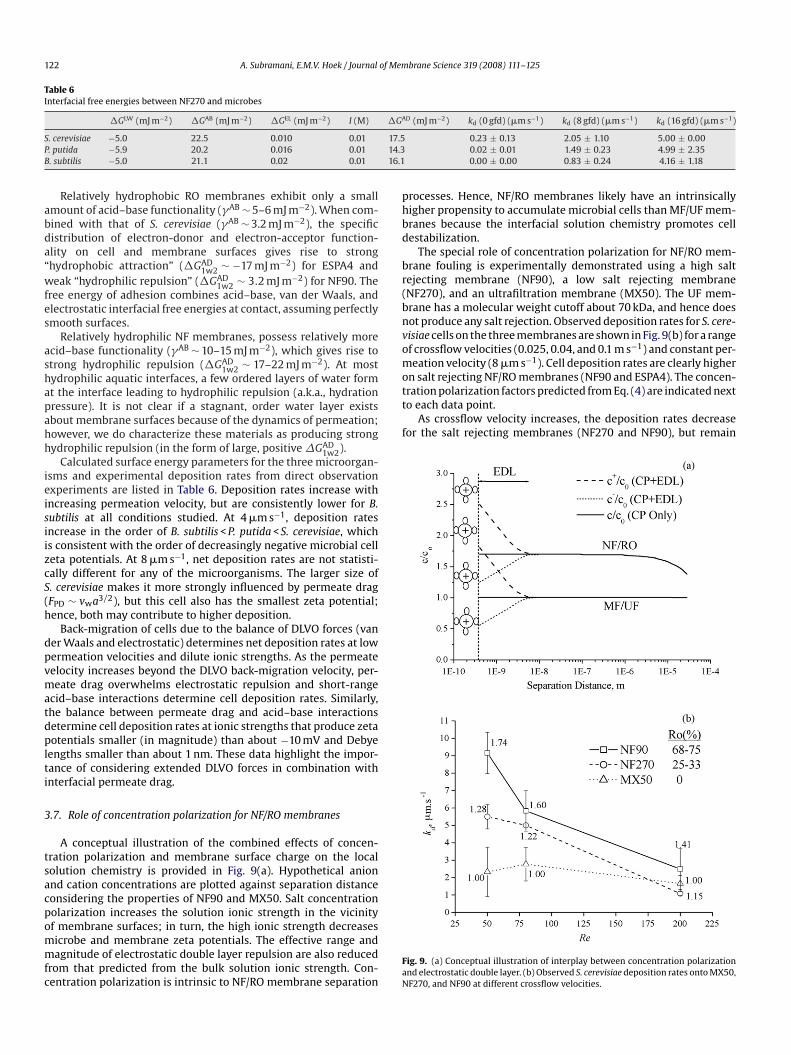
The special role of concentration polarization for NF/RO mem-brane fouling is experimentally demonstrated using a high saltrejecting membrane (NF90), a low salt rejecting membrane(NF270), and an ultrafiltration membrane (MX50). The UF mem-brane has a molecular weight cutoff about 70 kDa, and hence doesnot produce any salt rejection. Observed deposition rates for S. cere-visiae cells on the three membranes are shown in Fig. 9(b) for a rangeof crossflow velocities (0.025, 0.04, and 0.1 m s−1) and constant per-meation velocity (8 �m s−1). Cell deposition rates are clearly higheron salt rejecting NF/RO membranes (NF90 and ESPA4). The concen-tration polarization factors predicted from Eq. (4) are indicated nextto each data point.
As crossflow velocity increases, the deposition rates decreasefor the salt rejecting membranes (NF270 and NF90), but remain
122 A. Subramani, E.M.V. Hoek / Journal
Table 6Interfacial free energies between NF270 and microbes
�GLW (mJ m−2) �GAB (mJ m−2) �GEL (mJ m−2) I (M)
S. cerevisiae −5.0 22.5 0.010 0.01P. putida −5.9 20.2 0.016 0.01B. subtilis −5.0 21.1 0.02 0.01
Relatively hydrophobic RO membranes exhibit only a smallamount of acid–base functionality (�AB ∼ 5–6 mJ m−2). When com-bined with that of S. cerevisiae (�AB ∼ 3.2 mJ m−2), the specificdistribution of electron-donor and electron-acceptor function-ality on cell and membrane surfaces gives rise to strong“hydrophobic attraction” (�GAD
1w2 ∼ −17 mJ m−2) for ESPA4 andweak “hydrophilic repulsion” (�GAD
1w2 ∼ 3.2 mJ m−2) for NF90. Thefree energy of adhesion combines acid–base, van der Waals, andelectrostatic interfacial free energies at contact, assuming perfectlysmooth surfaces.
Relatively hydrophilic NF membranes, possess relatively moreacid–base functionality (�AB ∼ 10–15 mJ m−2), which gives rise tostrong hydrophilic repulsion (�GAD
1w2 ∼ 17–22 mJ m−2). At mosthydrophilic aquatic interfaces, a few ordered layers of water format the interface leading to hydrophilic repulsion (a.k.a., hydrationpressure). It is not clear if a stagnant, order water layer existsabout membrane surfaces because of the dynamics of permeation;however, we do characterize these materials as producing stronghydrophilic repulsion (in the form of large, positive �GAD
1w2).Calculated surface energy parameters for the three microorgan-
isms and experimental deposition rates from direct observationexperiments are listed in Table 6. Deposition rates increase withincreasing permeation velocity, but are consistently lower for B.subtilis at all conditions studied. At 4 �m s−1, deposition ratesincrease in the order of B. subtilis < P. putida < S. cerevisiae, whichis consistent with the order of decreasingly negative microbial cellzeta potentials. At 8 �m s−1, net deposition rates are not statisti-cally different for any of the microorganisms. The larger size ofS. cerevisiae makes it more strongly influenced by permeate drag(FPD ∼ vwa3/2), but this cell also has the smallest zeta potential;hence, both may contribute to higher deposition.
Back-migration of cells due to the balance of DLVO forces (vander Waals and electrostatic) determines net deposition rates at lowpermeation velocities and dilute ionic strengths. As the permeatevelocity increases beyond the DLVO back-migration velocity, per-meate drag overwhelms electrostatic repulsion and short-range
acid–base interactions determine cell deposition rates. Similarly,the balance between permeate drag and acid–base interactionsdetermine cell deposition rates at ionic strengths that produce zetapotentials smaller (in magnitude) than about −10 mV and Debyelengths smaller than about 1 nm. These data highlight the impor-tance of considering extended DLVO forces in combination withinterfacial permeate drag.3.7. Role of concentration polarization for NF/RO membranes
A conceptual illustration of the combined effects of concen-tration polarization and membrane surface charge on the localsolution chemistry is provided in Fig. 9(a). Hypothetical anionand cation concentrations are plotted against separation distanceconsidering the properties of NF90 and MX50. Salt concentrationpolarization increases the solution ionic strength in the vicinityof membrane surfaces; in turn, the high ionic strength decreasesmicrobe and membrane zeta potentials. The effective range andmagnitude of electrostatic double layer repulsion are also reducedfrom that predicted from the bulk solution ionic strength. Con-centration polarization is intrinsic to NF/RO membrane separation
brane Science 319 (2008) 111–125
AD (mJ m−2) kd (0 gfd) (�m s−1) kd (8 gfd) (�m s−1) kd (16 gfd) (�m s−1)
0.23 ± 0.13 2.05 ± 1.10 5.00 ± 0.000.02 ± 0.01 1.49 ± 0.23 4.99 ± 2.35
Fig. 9. (a) Conceptual illustration of interplay between concentration polarizationand electrostatic double layer. (b) Observed S. cerevisiae deposition rates onto MX50,NF270, and NF90 at different crossflow velocities.
of Membrane Science 319 (2008) 111–125 123
A. Subramani, E.M.V. Hoek / Journalthe same for the UF membrane. The reduction in deposi-tion on NF/RO membranes with increasing crossflow velocity isattributed to decreasing concentration polarization, which resultsin relatively higher electrostatic double layer repulsion betweenthe cell and membrane surfaces. If hydrodynamic interactions
were responsible for this deposition behavior, then the depo-sition rate would decrease for the UF membrane. The relativeinsignificance of crossflow hydrodynamics for microbial deposi-tion onto MF and UF membranes was previously demonstrated[15,22].3.8. Correlating interfacial forces and observed deposition rates
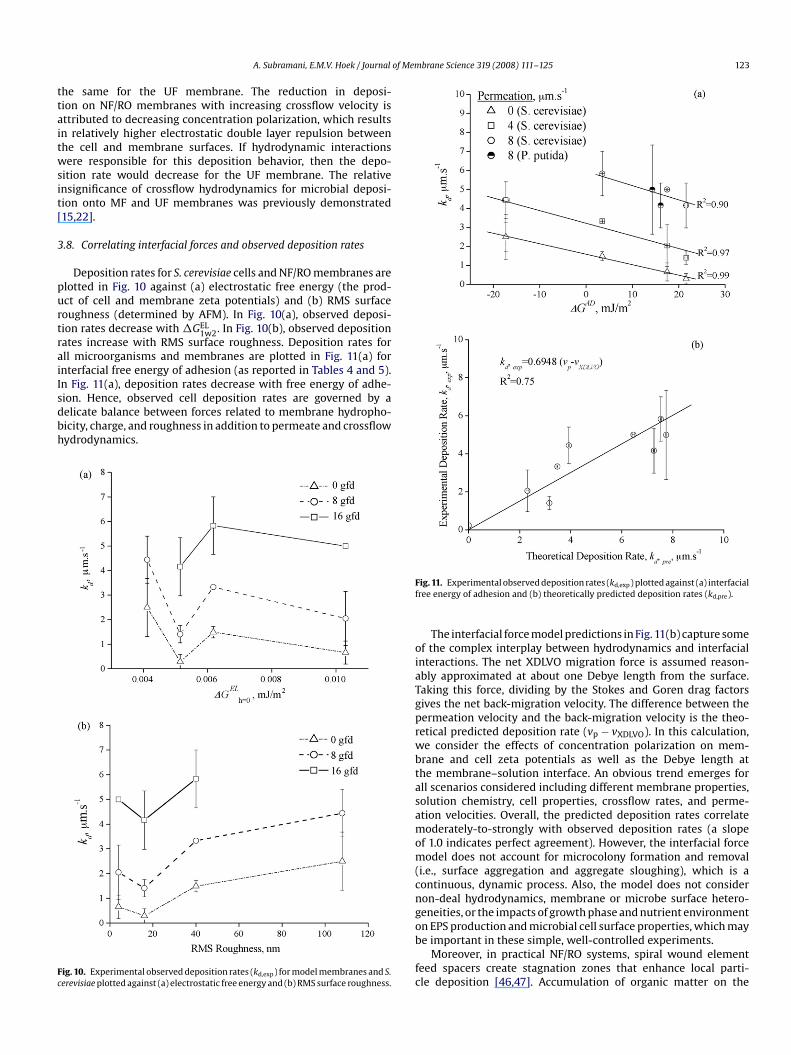
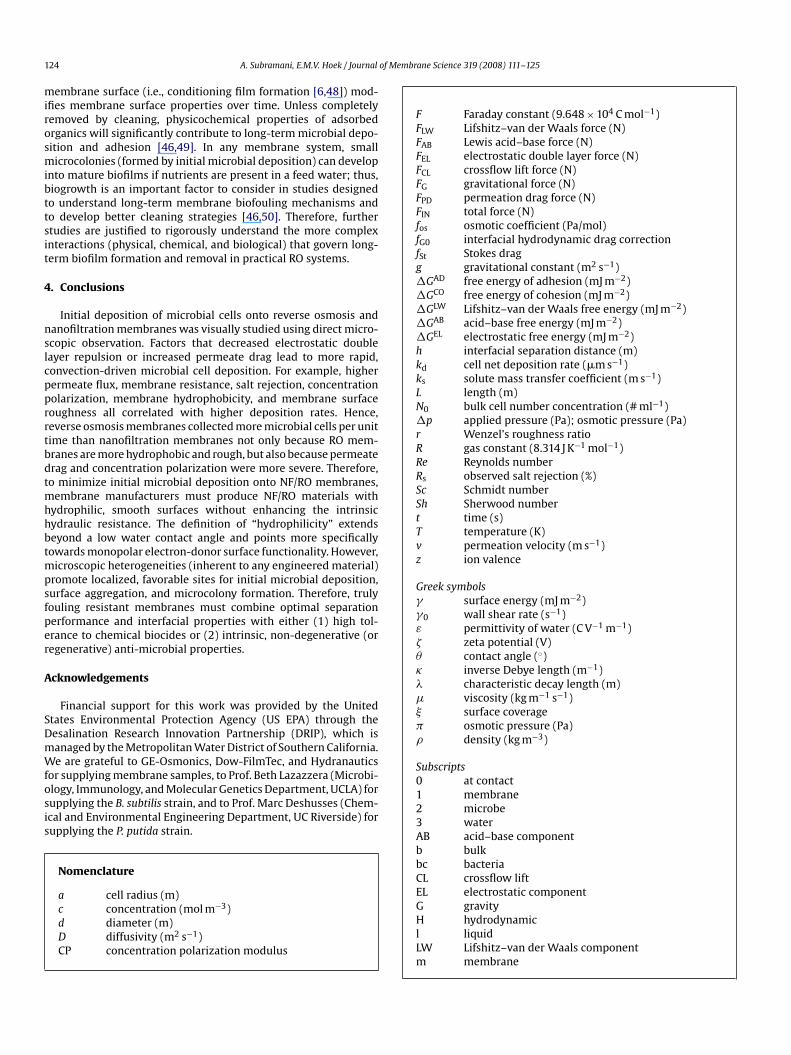
Deposition rates for S. cerevisiae cells and NF/RO membranes areplotted in Fig. 10 against (a) electrostatic free energy (the prod-uct of cell and membrane zeta potentials) and (b) RMS surfaceroughness (determined by AFM). In Fig. 10(a), observed deposi-tion rates decrease with �GEL
1w2. In Fig. 10(b), observed depositionrates increase with RMS surface roughness. Deposition rates forall microorganisms and membranes are plotted in Fig. 11(a) forinterfacial free energy of adhesion (as reported in Tables 4 and 5).In Fig. 11(a), deposition rates decrease with free energy of adhe-sion. Hence, observed cell deposition rates are governed by adelicate balance between forces related to membrane hydropho-bicity, charge, and roughness in addition to permeate and crossflowhydrodynamics.
Fig. 10. Experimental observed deposition rates (kd,exp) for model membranes and S.cerevisiae plotted against (a) electrostatic free energy and (b) RMS surface roughness.
Fig. 11. Experimental observed deposition rates (kd,exp) plotted against (a) interfacialfree energy of adhesion and (b) theoretically predicted deposition rates (kd,pre).
The interfacial force model predictions in Fig. 11(b) capture someof the complex interplay between hydrodynamics and interfacialinteractions. The net XDLVO migration force is assumed reason-ably approximated at about one Debye length from the surface.Taking this force, dividing by the Stokes and Goren drag factors
gives the net back-migration velocity. The difference between thepermeation velocity and the back-migration velocity is the theo-retical predicted deposition rate (vp − vXDLVO). In this calculation,we consider the effects of concentration polarization on mem-brane and cell zeta potentials as well as the Debye length atthe membrane–solution interface. An obvious trend emerges forall scenarios considered including different membrane properties,solution chemistry, cell properties, crossflow rates, and perme-ation velocities. Overall, the predicted deposition rates correlatemoderately-to-strongly with observed deposition rates (a slopeof 1.0 indicates perfect agreement). However, the interfacial forcemodel does not account for microcolony formation and removal(i.e., surface aggregation and aggregate sloughing), which is acontinuous, dynamic process. Also, the model does not considernon-deal hydrodynamics, membrane or microbe surface hetero-geneities, or the impacts of growth phase and nutrient environmenton EPS production and microbial cell surface properties, which maybe important in these simple, well-controlled experiments.Moreover, in practical NF/RO systems, spiral wound elementfeed spacers create stagnation zones that enhance local parti-cle deposition [46,47]. Accumulation of organic matter on the
of Membrane Science 319 (2008) 111–125
F Faraday constant (9.648 × 10⁴ C mol−1)FLW Lifshitz–van der Waals force (N)FAB Lewis acid–base force (N)FEL electrostatic double layer force (N)FCL crossflow lift force (N)FG gravitational force (N)FPD permeation drag force (N)FIN total force (N)fos osmotic coefficient (Pa/mol)fG0 interfacial hydrodynamic drag correctionfSt Stokes dragg gravitational constant (m2 s−1)�GAD free energy of adhesion (mJ m−2)�GCO free energy of cohesion (mJ m−2)�GLW Lifshitz–van der Waals free energy (mJ m−2)�GAB acid–base free energy (mJ m−2)�GEL electrostatic free energy (mJ m−2)h interfacial separation distance (m)kd cell net deposition rate (�m s−1)ks solute mass transfer coefficient (m s−1)L length (m)N0 bulk cell number concentration (# ml−1)�p applied pressure (Pa); osmotic pressure (Pa)r Wenzel’s roughness ratioR gas constant (8.314 J K−1 mol−1)Re Reynolds numberRs observed salt rejection (%)Sc Schmidt numberSh Sherwood numbert time (s)T temperature (K)v permeation velocity (m s−1)z ion valence
Greek symbols� surface energy (mJ m−2)�0 wall shear rate (s−1)ε permittivity of water (C V−1 m−1)� zeta potential (V)� contact angle (◦) inverse Debye length (m−1) characteristic decay length (m)
−1 −1
124 A. Subramani, E.M.V. Hoek / Journal
membrane surface (i.e., conditioning film formation [6,48]) mod-ifies membrane surface properties over time. Unless completelyremoved by cleaning, physicochemical properties of adsorbedorganics will significantly contribute to long-term microbial depo-sition and adhesion [46,49]. In any membrane system, smallmicrocolonies (formed by initial microbial deposition) can developinto mature biofilms if nutrients are present in a feed water; thus,biogrowth is an important factor to consider in studies designedto understand long-term membrane biofouling mechanisms andto develop better cleaning strategies [46,50]. Therefore, furtherstudies are justified to rigorously understand the more complexinteractions (physical, chemical, and biological) that govern long-term biofilm formation and removal in practical RO systems.
4. Conclusions
Initial deposition of microbial cells onto reverse osmosis andnanofiltration membranes was visually studied using direct micro-scopic observation. Factors that decreased electrostatic doublelayer repulsion or increased permeate drag lead to more rapid,convection-driven microbial cell deposition. For example, higherpermeate flux, membrane resistance, salt rejection, concentrationpolarization, membrane hydrophobicity, and membrane surfaceroughness all correlated with higher deposition rates. Hence,reverse osmosis membranes collected more microbial cells per unittime than nanofiltration membranes not only because RO mem-branes are more hydrophobic and rough, but also because permeatedrag and concentration polarization were more severe. Therefore,to minimize initial microbial deposition onto NF/RO membranes,membrane manufacturers must produce NF/RO materials withhydrophilic, smooth surfaces without enhancing the intrinsichydraulic resistance. The definition of “hydrophilicity” extendsbeyond a low water contact angle and points more specificallytowards monopolar electron-donor surface functionality. However,microscopic heterogeneities (inherent to any engineered material)promote localized, favorable sites for initial microbial deposition,surface aggregation, and microcolony formation. Therefore, trulyfouling resistant membranes must combine optimal separationperformance and interfacial properties with either (1) high tol-erance to chemical biocides or (2) intrinsic, non-degenerative (orregenerative) anti-microbial properties.
Acknowledgements
Financial support for this work was provided by the UnitedStates Environmental Protection Agency (US EPA) through theDesalination Research Innovation Partnership (DRIP), which ismanaged by the Metropolitan Water District of Southern California.We are grateful to GE-Osmonics, Dow-FilmTec, and Hydranauticsfor supplying membrane samples, to Prof. Beth Lazazzera (Microbi-ology, Immunology, and Molecular Genetics Department, UCLA) forsupplying the B. subtilis strain, and to Prof. Marc Deshusses (Chem-ical and Environmental Engineering Department, UC Riverside) forsupplying the P. putida strain.
Nomenclature
a cell radius (m)c concentration (mol m−3)d diameter (m)D diffusivity (m2 s−1)CP concentration polarization modulus
� viscosity (kg m s )� surface coverage� osmotic pressure (Pa)� density (kg m−3)
Subscripts0 at contact1 membrane2 microbe3 waterAB acid–base componentb bulkbc bacteriaCL crossflow liftEL electrostatic componentG gravityH hydrodynamicl liquidLW Lifshitz–van der Waals componentm membrane
of Mem
[
[
[
[
[
[
[
[
[
[
[
[
[
[
[
[
[
[
[
[
[
[
[
[
[
[
[
[
[
[
and presence of nutrient broth, Microbiology 143 (1997) 2569.
A. Subramani, E.M.V. Hoek / Journal
w waterp permeatePD permeation drags solid
SuperscriptsLW Lifshitz–van der Waal component+ electron-acceptor component− electron-donor component
References
[1] H.C. Flemming, G. Schaule, T. Griebe, J. Schmitt, A. Tamachkiarowa,Biofouling—the Achilles heel of membrane processes, Desalination 113 (1997)215.
[2] H.C. Flemming, Biofouling in water systems—cases, causes and countermea-sures, Appl. Microbiol. Biotechnol. 59 (2002) 629.
[3] H.F. Ridgway, H.C. Flemming, Microbial adhesion and biofouling in reverseosmosis membranes, in: B.S. Parekh (Ed.), Reverse Osmosis Technology, MarcelDekker, New York, 1988, pp. 429–481.
[4] H.F. Ridgway, J. Safarik, Biofouling on reverse osmosis membranes, in: H.C.Flemming, G.G. Geesey (Eds.), Biofouling and Biocorrosion in Industrial WaterSystems, Springer-Verlag, Heidelberg, Berlin, 1991, pp. 81–111.
[5] H.F. Ridgway, H.C. Flemming, Membrane biofouling, in: J. Mallevialle, P.E. Oden-daal, M.R. Wiesner (Eds.), Water Treatment Membrane Processes, McGraw-Hill,1996, pp. 6.1–6.62.
[6] W.G. Characklis, K.C. Marshall, Biofilms, John Wiley & Sons, 1990.[7] D. Al-Halbouni, J. Traber, S. Lyko, T. Wintgens, T. Melin, D. Tacke, A. Janot, W. Dott,
J. Hollender, Correlation of EPS content in activated sludge at different sludgeretention times with membrane fouling phenomena, Water Res. 42 (2008)1475.
[8] D.T. Sponza, Investigation of extracellular polymer substances (EPS) and physic-ochemical properties of different activated sludge flocs under steady-stateconditions, Enzyme Microbiol. Technol. 32 (2003) 375.
[9] S.L. Walker, J.E. Hill, J.A. Redman, M. Elimelech, Influence of growth phase onadhesion kinetics of Escherichia coli D21g, Appl. Environ. Microbiol. 71 (2005)3093.
10] R. Bos, H.C. Van Der Mei, H.J. Busscher, Physico-chemistry of initial microbialadhesive interactions—its mechanisms and methods for study, FEMS Microbiol.
Rev. 23 (1999) 179.11] G. Chen, K.A. Strevett, Impact of surface thermodynamics on bacterial transport,Environ. Microbiol. 3 (2001) 237.
12] G. Chen, K.A. Strevett, Microbial surface thermodynamics and interactions inaqueous media, J. Colloid Interface Sci. 261 (2003) 283.
13] M. Hermansson, The DLVO theory in microbial adhesion, Colloid Surf. B: Bioin-terfaces 14 (1999) 105.
14] S. Kang, H. Choi, Effect of surface hydrophobicity on the adhesion of S-cerevisiaeonto modified surfaces by poly(styrene-ran-sulfonic acid) random copolymers,Colloid Surf. B: Biointerfaces 46 (2005) 70.
15] S.T. Kang, A. Subramani, E.M.V. Hoek, M.A. Deshusses, M.R. Matsumoto, Directobservation of biofouling in cross-flow microfiltration: mechanisms of deposi-tion and release, J. Membr. Sci. 244 (2004) 151.
16] H. Li, A.G. Fane, H.G.L. Coster, S. Vigneswaran, Direct observation of particledeposition on the membrane surface during crossflow microfiltration, J. Membr.Sci. 149 (1998) 83.
17] H. Li, A.G. Fane, H.G.L. Coster, S. Vigneswaran, An assessment of depolarisationmodels of crossflow microfiltration by direct observation through the mem-brane, J. Membr. Sci. 172 (2000) 135.
18] H. Li, A.G. Fane, H.G.L. Coster, S. Vigneswaran, Observation of deposition andremoval behaviour of submicron bacteria on the membrane surface duringcrossflow microfiltration, J. Membr. Sci. 217 (2003) 29.
19] W.D. Mores, R.H. Davis, Direct visual observation of yeast deposi-tion and removal during microfiltration, J. Membr. Sci. 189 (2001)217.
20] W.D. Mores, R.H. Davis, Yeast foulant removal by backpulses in crossflow micro-filtration, J. Membr. Sci. 208 (2002) 389.
[
[
[
[
[
[
[
[
[
[
[
[
brane Science 319 (2008) 111–125 125
21] W.D. Mores, R.H. Davis, Yeast-fouling effects in cross-flow microfiltration withperiodic reverse filtration, Ind. Eng. Chem. Res. 42 (2003) 130.
22] S. Wang, G. Guillen, E.M.V. Hoek, Direct observation of microbial adhesion tomernbranes, Environ. Sci. Technol. 39 (2005) 6461.
23] C. Anselme, E.P. Jacobs, Ultrafiltration, in: J. Mallevialle, P.E. Odendaal, M.R.Wiesner (Eds.), Water Treatment Membrane Processes, McGraw-Hill, 1996, pp.10.1–10.88.
24] J.G. Jacangelo, C.A. Buckley, Microfiltration, in: J. Mallevialle, P.E. Odendaal, M.R.Wiesner (Eds.), Water Treatment Membrane Processes, McGraw-Hill, 1996, pp.11.1–11.39.
25] J.S. Taylor, E.P. Jacobs, Reverse osmosis and nanofiltration, in: J. Mallevialle,P.E. Odendaal, M.R. Wiesner (Eds.), Water Treatment Membrane Processes,McGraw-Hill, 1996, pp. 9.1–9.70.
26] E.M.V. Hoek, J. Allred, T. Knoell, B.H. Jeong, Modeling the effects of fouling onfull scale reverse osmosis processes, J. Membr. Sci. 314 (2008) 33.
27] S. Kim, E.M.V. Hoek, Modeling concentration polarization in reverse osmosisprocesses, Desalination 186 (2005) 111.
28] S.L. Walker, S. Bhattacharjee, E.M.V. Hoek, M. Elimelech, A novel asymmetricclamping cell for measuring streaming potential of flat surfaces, Langmuir 18(2002) 2193.
29] J.A. Brant, A.E. Childress, Assessing short-range membrane–colloid interactionsusing surface energetics, J. Membr. Sci. 203 (2002) 257.
30] R.N. Wenzel, Surface roughness and contact angle, J. Phys. Colloids Chem. 53(1949) 1466.
31] J. Israelachvili, Intermolecular & Surface Forces, second ed., Academic Press,1992.
32] C.J. Van Oss, Acid–base interfacial interactions in aqueous-media, Colloid Surf.A: Physicochem. Eng. Asp. 78 (1993) 1.
33] S.L. Goren, Hydrodynamic force resisting the approach of a sphere to a planepermeable wall, J. Colloid Interface Sci. 69 (1979) 78.
34] M. Elimelech, J. Gregory, X. Jia, R.A. Williams, Particle Deposition & Aggregation:Measurement, Modeling and Simulation, Butterworth-Heinemann, Woburn,MA, 1995.
35] C.J. Van Oss, Interfacial Forces in Aqueous Media, Marcel Dekker, Inc., New York,NY, 1994.
36] R.J. Petersen, Composite reverse-osmosis and nanofiltration membranes, J.Membr. Sci. 83 (1993) 81.
37] S. Verissimo, K.V. Peinemann, J. Bordado, Influence of the diamine structure onthe nanofiltration performance, surface morphology and surface charge of thecomposite polyamide membranes, J. Membr. Sci. 279 (2006) 266.
38] E.M. Vrijenhoek, S. Hong, M. Elimelech, Influence of membrane surface prop-erties on initial rate of colloidal fouling of reverse osmosis and nanofiltrationmembranes, J. Membr. Sci. 188 (2001) 115.
39] M.B. Habash, H.C. Van Der Mei, G. Reid, H.J. Busscher, Adhesion of Pseudomonasaeruginosa to silicone rubber in a parallel plate flow chamber in the absence
40] H.C. Van Der Mei, R. Bos, H.J. Busscher, A reference guide to microbial cell surfacehydrophobicity based on contact angles, Colloid Surf. B: Biointerfaces 11 (1998)213.
41] C.J. Van Oss, R.F. Giese, W. Wu, On the predominant electron-donicity of polarsolid surfaces, J. Adhes. 63 (1997) 71.
42] E.M.V. Hoek, G.K. Agarwal, Extended DLVO interactions between spherical par-ticles and rough surfaces, J. Colloid Interface Sci. 298 (2006) 50.
43] E.M.V. Hoek, S. Bhattacharjee, M. Elimelech, Effect of surface roughness oncolloid–membrane DLVO interactions, Langmuir 19 (2003) 4836.
44] X.H. Zhu, M. Elimelech, Colloidal fouling of reverse osmosis membranes: mea-surements and fouling mechanisms, Environ. Sci. Technol. 31 (1997) 3654.
45] J.A. Brant, A.E. Childress, Colloidal adhesion to hydrophilic membrane surfaces,J. Membr. Sci. 241 (2004) 235.
46] A. Subramani, Microbial adhesion mechanisms in reverse osmosis and nanofil-tration, Ph.D. Dissertation, University of California, Riverside, Riverside, CA,2007.
47] A. Subramani, S. Kim, E.M.V. Hoek, Pressure, flow, and concentration profiles inopen and spacer-filled membrane channels, J. Membr. Sci. 277 (2005) 7.
48] J.W. Costerton, T.J. Marrie, K.J. Cheng, Phenomena of bacterial adhesion, in: D.C.Savage, M. Fletcher (Eds.), Bacterial Adhesion: Mechanisms and PhysiologicalSignificance, Plenum Press, New York, 1985, pp. 3–43.
49] A. Subramani, E.M.V. Hoek, Role of organic macromolecules in bacterial adhe-sion to NF/RO membranes. J. Colloid Interface Sci., in preparation.
50] A. Subramani, E.M.V. Hoek, Biofilm formation, cleaning, and regrowth onreverse osmosis and nanofiltration membranes, Water Res., in preparation.
51] R.F. Probstein, Physicochemical Hydrodynamics—An Introduction, John Wiley& Sons, Hoboken, NJ, 2003.
Copyright © 2022 FDOKUMEN