Development of Lab-scale Forward Osmosis Membrane
227
Development of Lab-scale Forward Osmosis Membrane Bioreactor (FO-MBR) with Draw Solute Regeneration for Wastewater Treatment Fozia Parveen Jesus College A thesis submitted for the degree of Doctor of Philosophy Department of Engineering Science, University of Oxford Michaelmas Term 2018
-
Upload
khangminh22 -
Category
Documents
-
view
1 -
download
0
Transcript of Development of Lab-scale Forward Osmosis Membrane
Development of Lab-scale Forward Osmosis Membrane
Bioreactor (FO-MBR) with Draw Solute Regeneration for
Wastewater Treatment
Fozia Parveen
Jesus College
A thesis submitted for the degree of Doctor of Philosophy
Department of Engineering Science, University of Oxford
Michaelmas Term 2018
ii
I dedicate this thesis to, my parents, for it was their dream
that I simply had to live

iii
Acknowledgements
As tough as these five years have been, I only want to look back with gratitude for
all the kind people I met in Oxford for their guidance and support.
First of all, Professor Nick Hankins and Dr Sher Jamal Khan for introducing me to
this opportunity and for guiding me through my research in my DPhil and Masters
respectively. My college Advisor, Stephen Morris for listening to me in moments of
emotional crisis. Professor Ian, Helen and Wei for sitting through our Wednesday
group presentations and providing useful feedback.
The list of people to thank is very long, five years after all. I would really like to thank
the dearest of friends I have made in college. My super woman Vivi, and Pedro,
Marein, Jess, Karan, Luigi, Vanessa, Angela, and Rachita for not giving up on me.
My DPhil sisters, Rabia and ‘the’ Ping Shen for sharing the bench and stories. My
office colleagues Bo (bro), Kim, Farrukh, Elias, Kat, Sihao and Ali for tolerating me
through these years. My lab colleagues Shiv, Ana, Lakshmi, Gabi, Li, Yalda, Cordie
and Marimar for letting me work in the lab with ever-growing mess and area claimed.
Few families in Oxford for nearly adopting and feeding me like Awais bhai and
Maria, Tia, and Sayrul bhai and family.
The many amazing people I got to know in Oxford such as Fouzia Farooq, Nabeel,
Gustavo, Cheryl, Kokil, Salima, Rahim, Naeema, Zia, Catherine, Rafi, Lali, and so
so many more. To Saqib bhai, Saman, Rizwana, Ainee, Mateen, Usman, Daniyal,
for writing to me during this time and Ghalib bhai for his presence. My cousins
Nahida, Rukhsana, Farzandu, Ashk, Nanu, KD, dadaq and Sania for keeping me in
their thoughts. My uncles especially Bhuttu and Bakhtu mamu for all the silly things
they do and say and Imtu mamu for keeping in touch. To my beautiful family and
iv
friends from Pakistan for taking pride in me and my journey and for the love and
prayers that I didn’t deserve. Dearest Peru bhai for being so understanding. My
sister in laws, Afshan and Salma for joining the gang. My Jimmy guru for all the
moral and financial support, my selfless Tariq Jon, Aliya for being the best elder
sister, Chimmu darling the commando with dagger of honour. For the ever growing
family and new entrants Majeed and Sinnan, my handsome nephews whose smile
let me get through a bad day especially the darkest days during the last two years.
v
Table of Contents
ACKNOWLEDGEMENTS ....................................................................................... III
LIST OF TABLES .................................................................................................. IX
LIST OF FIGURES ................................................................................................ XI
LIST OF ABBREVIATIONS .................................................................................. XV
LIST OF SYMBOLS ............................................................................................ XIX
CHAPTER 1 ............................................................................................................ 1
INTRODUCTION ..................................................................................................... 1
1.1BACKGROUND .................................................................................................. 1
1.2 RESEARCH OBJECTIVES ............................................................................... 2
1.3 SIGNIFICANCE AND NOVELTY ...................................................................... 3
1.4 CHAPTER SUMMARY ...................................................................................... 5
CHAPTER 2 ............................................................................................................ 7
LITERATURE REVIEW ........................................................................................... 7
2.1 FORWARD OSMOSIS SYSTEMS- THEORY AND PRINCIPLES .................... 7
2.1.1. CONCENTRATION POLARIZATION ....................................................................... 8
2.1.1.1 Internal Concentration Polarisation .................................................... 13
2.1.1.2 External Concentration Polarisation ................................................... 15
2.2 FORWARD OSMOSIS MEMBRANES ............................................................ 19
2.3 FORWARD OSMOSIS DRAW SOLUTIONS .................................................. 27
2.3.1 Inorganic Solutes .................................................................................. 30
2.3.2 Organic Draw Solutions ........................................................................ 33
vi
2.4 MEMBRANE DISTILLATION .......................................................................... 41
2.4.1 MD Membrane Characteristics .............................................................. 43
2.4.2 Applications of Membrane Distillation ................................................... 45
2.4.3 Heat and Mass Transfer in MD ............................................................. 47
2.4.4 Temperature Polarization (TP) .............................................................. 49
2.4.5 Fouling in MD ........................................................................................ 50
2.5 MEMBRANE BIOREACTORS (MBRS) ........................................................... 51
2.5.1 Forward Osmosis Membrane Bioreactor (FO-MBR) ............................. 55
2.6 THE FO-MD HYBRID ...................................................................................... 61
2.7 CONCLUSIONS .............................................................................................. 66
CHAPTER 3 .......................................................................................................... 67
COMPARATIVE PERFORMANCE OF A NANO FILTRATION (NF) MEMBRANE
AND A TRADITIONAL FO MEMBRANE FOR USE IN A LAB SCALE FORWARD
OSMOSIS MEMBRANE BIOREACTOR (FO-MBR) .............................................. 67
3.1 INTRODUCTION ............................................................................................. 67
3.2 METHODOLOGY ............................................................................................ 68
3.2.1 Establishment of FO-MBR .................................................................... 68
3.2.2 Chemicals and Solutions ....................................................................... 71
3.2.3. Toxicity ................................................................................................. 74
3.2.4. Viscosity ............................................................................................... 75
3.2.5 Membranes ........................................................................................... 75
3.3 RESULTS AND DISCUSSION ........................................................................ 76
3.3.1 Osmotic Pressure as a Function of Concentration ................................ 76
3.3.2 Forward Osmosis Membrane versus Nanofiltration Membrane ............ 82
vii
3.3.3 Reverse Solute Transport ..................................................................... 92
3.3.4 Viscosity ................................................................................................ 95
3.3.5 Toxicity .................................................................................................. 96
3.4. CONCLUSIONS ............................................................................................. 98
CHAPTER 4 ........................................................................................................ 101
INTEGRATION OF FORWARD OSMOSIS AND MEMBRANE DISTILLATION
UNITS FOR REGENERATION OF NOVEL DRAW SOLUTIONS AND WATER
RECLAMATION ................................................................................................... 101
4.1 INTRODUCTION ........................................................................................... 101
4.2 METHODOLOGY .......................................................................................... 102
4.2.1 Chemicals and Membranes ................................................................ 102
4.2.2 Benchscale Setup ............................................................................... 103
4.2.3 FO-MD Hybrid Experiments ................................................................ 104
4.3 RESULTS AND DISCUSSION ...................................................................... 105
4.3.1 Effect of Temperature on MD Flux ...................................................... 105
4.3.2 Effect of Feed Flow on MD Flux .......................................................... 110
4.3.3. Effect of Feed Type on MD Flux ........................................................ 112
4.3.4 Performance of FO-MD Hybrids with Various Draw Solutions ............ 115
4.4 CONCLUSIONS ............................................................................................ 123
CHAPTER 5 ........................................................................................................ 127
OPTIMISING THE MEMBRANE CLEANING REGIME FOR THE FOMBR-MD LAB
SCALE SYSTEM ................................................................................................. 127
5.1 INTRODUCTION ........................................................................................... 127
viii
5.2 METHODOLOGY .......................................................................................... 129
5.2.1 Basic Cleaning of the Membranes ...................................................... 131
5.2.2 Acidic Cleaning of the Membranes ..................................................... 131
5.3 RESULTS AND DISCUSSION ...................................................................... 132
5.3.1 FO-MBR Hybrid ................................................................................... 132
5.3.2. Membrane cleaning-NaCl Draw Solution ........................................... 135
5.3.3. Membrane cleaning-TEAB Draw Solution .......................................... 138
5.3.4. Membrane Cleaning-PDAC Draw Solution ........................................ 142
5.4 CONCLUSIONS ............................................................................................ 146
CHAPTER 6 ........................................................................................................ 148
CONCLUSIONS AND RECOMMENDATIONS FOR FUTURE WORK ............... 148
6.1 SUMMARY OF WORK DONE ....................................................................... 148
6.2 CONCLUSIONS ............................................................................................ 149
6.3 RECOMMENDATIONS FOR FUTURE WORK ............................................. 152
APPENDIX I ............................................................................................................ 156
FOMBR-MD Hybrid Scale up ....................................................................... 156
APPENDIX II ........................................................................................................... 165
FOMBR- MD bench-scale setup: installation cost ........................................ 165
Appendix III .................................................................................................. 167
List of Journal Articles and Conference Presentations by the Author .......... 167
KEYNOTE LECTURES ....................................................................................... 168
REFERENCES .................................................................................................... 170
ix
List of Tables
Table 2.1 Summary of Operating conditions, performance, structural parameter,
water and solute permeability for FO membranes ................................................ 21
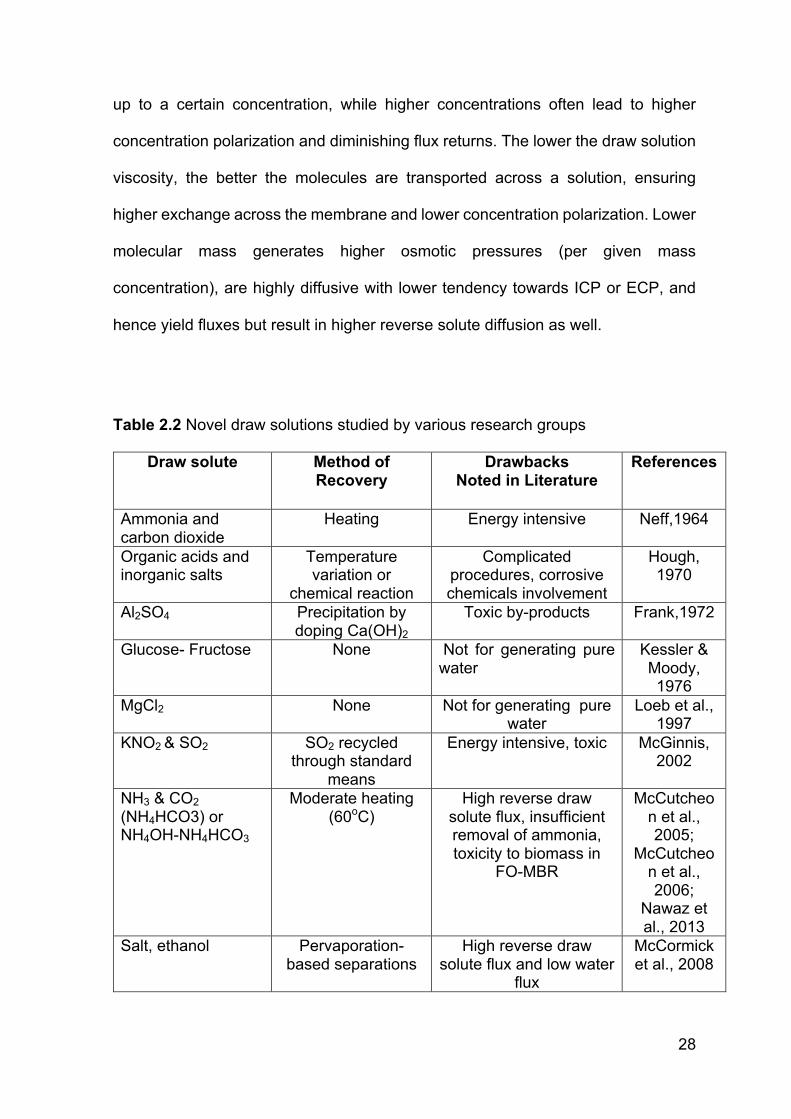
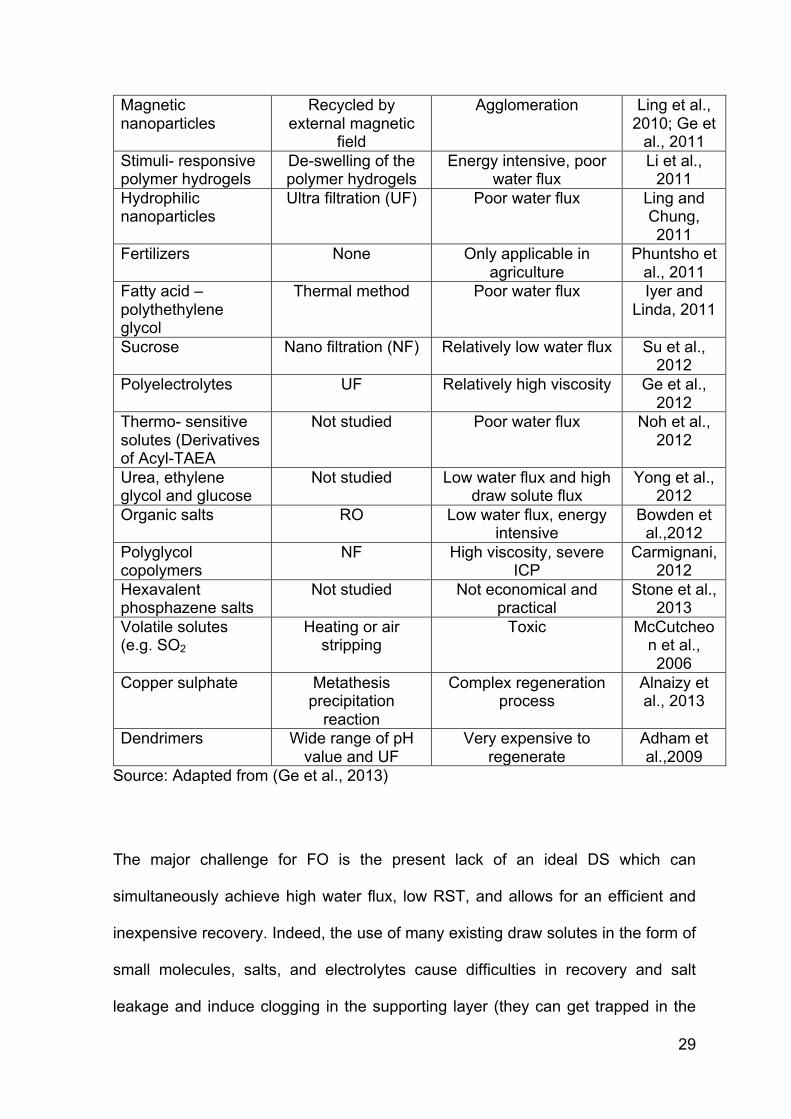
Table 2.2 Novel draw solutions studied by various research groups .................... 28
Table 2.3 MNPs application for FO ....................................................................... 37
Table 2.4 A summary of the removal efficiencies of FO-MBRs for organics, nitrogen
and phosphorus. (Wang et al., 2016) .................................................................... 58
Table 2.5 Summary of forward osmosis membrane bioreactors (FO-MBRs) in
literature (Wang et al., 2016) ................................................................................. 59
Table 2.6. Summary of hybrid FO–MD processes with different draw solutes (Wang
et al., 2015) ........................................................................................................... 64
Table 3.1 Chemical composition of synthetic wastewater used in FO-MBR studies
(Khan et al., 2013) ................................................................................................. 71
Table 3.2 Summary of the draw solutions used in the current study; * denotes Mol
Wt of each monomeric unit, ** denotes average molecular weight of the
polyelectrolyte solution .......................................................................................... 72
Table 3.3 Chemical composition of 2X M9 media for bacterial growth in microbroth
dilution test with a final pH of 7.0 (Harwood & Cutting, 1990) ............................... 74
Table 3.4 Osmotic pressure for draw solutes determined using measured osmolality
values. ................................................................................................................... 80
Table 3.5 Flux with HTI CTA membrane at 1h and 8h time intervals with percentage
decline in flux using DI water and FO-MBR as feed DI water (AL-DS mode) and FO-
MBR as feed (AL-FS mode) at a CFV of 0.12m/s. ................................................ 88
x
Table 3.6 Flux with NF membrane at 1h and 8h time interval with percentage decline
in flux using DI water (AL-DS mode) and FO-MBR as feed (AL-FS mode) at a CFV
of 0.12m/s. ............................................................................................................. 90
Table 3.7 Reverse solute transport (GMH) for draw solutes used in the study after
24 hours of FO operation when run in the absence of a draw re-concentration
system (AL-DS mode, CFV: 0.12m/s). .................................................................. 93
Table 3.8 Viscosities of draw solution at operational concentrations .................... 96
Table 5.1 Summary of best cleaning procedures based on SEM imaging of
membranes after cleaning. .................................................................................. 145
Table 5.2 FO and MD flux for TEAB in the FOMBR-MD hybrid .......................... 145
Table 6.1 Draw solution RST loss in FOMBR-MD hybrid (see also Appendix I) 154
xi
List of Figures
Figure 1.1 Thesis Summary and key decision ........................................................ 4
Figure 2.1 Concentration polarisation in FO (Zhao et al., 2012). Cfeed, Cdraw, Δπeff
and Jw represent the feed solution concentration, draw solution concentration,
effective osmotic driving force and water flux, respectively. ICP represents the
change in draw concentration across the support layer; ECP is that between the
active layer surface and the bulk draw solution. ...................................................... 9
Figure 2.2 Dilutive (a) and concentrative (b) ICP across asymmetric membrane
(Zhao et al., 2012). In both cases, ICP is the change in draw concentration across
the support layer. ................................................................................................... 10
Figure 2.3 Relationship between FO, RO, and PRO (adapted from Lee et al., 1981)
............................................................................................................................... 12
Figure 2.4 Double-skinned forward osmosis membrane to reduce ICP and fouling
in FO ...................................................................................................................... 24
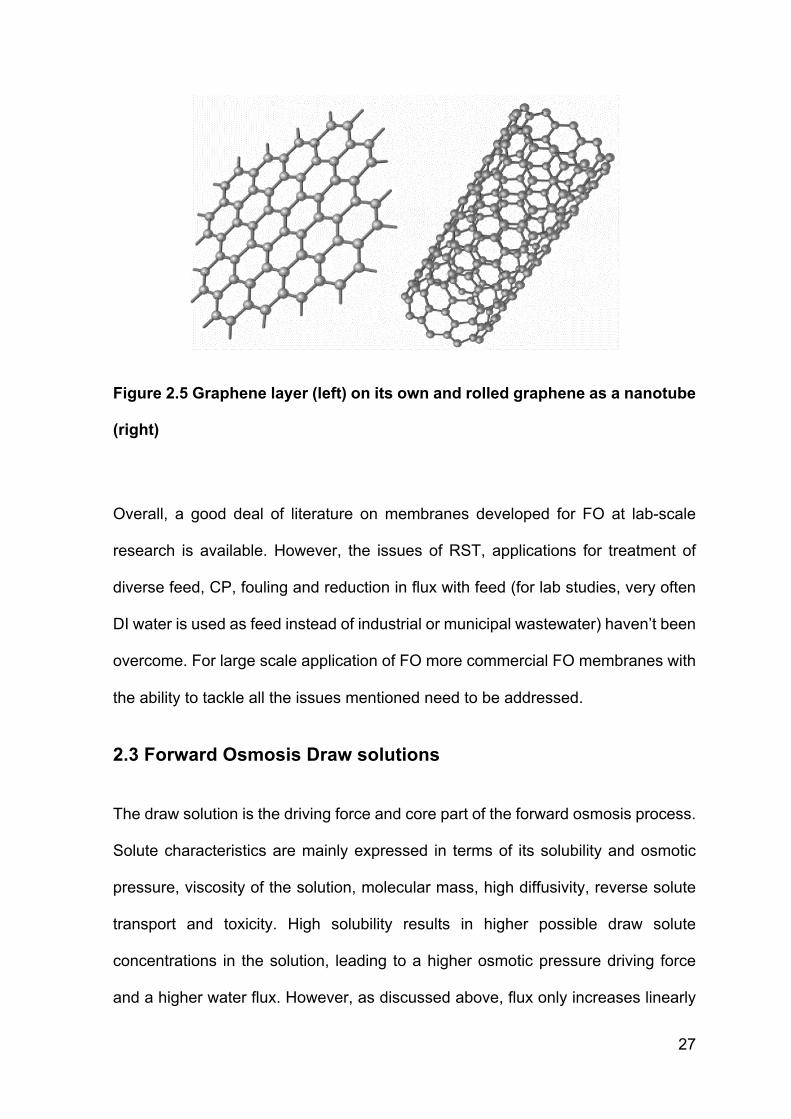
Figure 2.5 Graphene layer (left) on its own and rolled graphene as a nanotube
(right) ..................................................................................................................... 27
Figure 2.6 Carboxyethyl amine sodium salts; (DDTP-Na) (n=1); (TTHP-Na) (n=2);
(TPHP-Na) (n=3). .................................................................................................. 35
Figure 2.7 Hydrogel mechanical squeezing (Yu et al., 2016) ............................... 36
Figure 2.8 Hexa(4-ethylcarboxylatophenoxy)phosphazene salt structure (Stone et
al., 2013) ............................................................................................................... 40
Figure 2.9 Membrane distillation configurations: DCMD; AGMD; VMD; SGMD ... 43
Figure 2.10 Heat and mass transfer across a DCMD membrane (Adapted from
Histove et al., 2015) .............................................................................................. 49
Figure 2.11 Temperature distribution in an MD process with a fouled layer ........ 51
xii
Figure 2.12 Development of the large-scale MBR plants around the world (the
capacity of each plant > 100,000 m3/d) (Meng et al., 2017) .................................. 54
Figure 2.13 A simple graphical demonstration of a submerged FO-MBR (with a
continuous draw and feed solution loop) ............................................................... 55
Figure 2.14 Schematic diagram of FO-MD hybrid for desalination (Wang et al.,
2015) ..................................................................................................................... 63
Figure 3.1 Schematic diagram for the external membrane cell: (a) Section of top
and bottom plate; (b) Plan view of a single plate. .................................................. 69
Figure 3.2 Forward osmosis (FO) bench scale setup showing a feed solution and
draw solution loop, the tank for the latter being placed on a weighing balance .... 70
Figure 3.3 Molecular structure for polyelectrolytes used in the current study (a)
PDAC (C8H16Cl N)n , (b) PGBE (CH3(CH2)3(OCH2CH2)nOH) ................................. 73
Figure 3.4 SEM images of a flat sheet FO membrane (a) SL (b) AL (Blandin et al.,
2014). .................................................................................................................... 75
Figure 3.5 Plan view SEM image of NF membrane used in the study ................. 76
Figure 3.6 Initial fluxes for polyelectrolytes PDAC and PGBE with NF and CTA
membranes using both DI water as feed (AL-DS) and a live monoculture FO-MBR
feed (denoted ‘Bio’, AL-FS mode) at 0.5M concentration (CFV: 0.12m/s) ............ 83
Figure 3.7 Initial fluxes using SDS and TEAB as draw solutes against both DI water
(AL-DS) as feed and a live monoculture FO-MBR feed (denoted ‘Bio’, AL-FS mode)
for CTA and NF membranes at 0.05M surfactant concentration (CFV: 0.12m/s). 85
Figure 3.8 initial fluxes for NaCl and Na3PO4 as draw solutes using the CTA
membrane and both DI water (AL-DS) as feed and a live monoculture FO-MBR feed
(denoted ‘Bio’, AL-FS mode) at 0.5M concentration (CFV: 0.12m/s). ................... 87
xiii
Figure 3.9 Optical density of bacterial solution using microbroth dilution test in
minimal media with draw solutes ........................................................................... 98
Figure 4.1 Membrane distillation setup established in the lab ............................ 102
Figure 4.2 Bench scale FO-MD hybrid established in the lab ............................ 103
Figure 4.3 MD water flux at different temperatures with CFV of 0.12 m/s at feed
temperatures of 35, 45 and 55ºC and draw temperature of 20ºC respectively (AL-
FS mode). ............................................................................................................ 107
Figure 4.4 Heat and mass transfer profiles during membrane distillation .......... 107
Figure 4.5 Effect of Feed cross flow velocity on flux performance with the feed
temperature at 35°C using PDAC as MD feed (AL-FS mode) ............................ 111
Figure 4.6 MD and FO flux over three days with NaCl as a draw solution and DI
water as a feed at a CFV of 0.12m/s (FO: AL-DS, MD: AL-FS) .......................... 117
Figure 4.7 MD and FO flux over three days with TEAB as a draw solution and DI
water as a feed at a CFV of 0.12m/s (FO: AL-DS, MD: AL-FS) .......................... 120
Figure 4.8 MD and FO flux over three days with PDAC as a draw solution and DI
water as a feed at a CFV of 0.12m/s (FO: AL-DS, MD: AL-FS). ......................... 121
Figure 4.9 RST in FO feed (DI water) and MD permeate (DI water) in a continuous
setup at a CFV of 0.12m/s (FO: AL-DS, MD: AL-FS) .......................................... 123
Figure 5.1 SEM images for a nascent forward osmosis cellulose triacetate
membrane (a) Active layer (b) Support layer, and a PTFE MD membrane (c)
Support layer (d) Active layer .............................................................................. 130
Figure 5.2 MD and FO flux over three days with NaCl, TEAB and PDAC as the FO
draw solution and synthetic wastewater with bacterial inoculum as the FO feed in
an FOMBR-MD hybrid at a CFV of 0.12m/s (FO: AL-FS, MD: AL-FS)................ 134
xiv
Figure 5.3 SEM image when NaCl was used as a draw solute after basic cleaning
at two different magnifications (a) SL-DS, FO (b) AL-FS, FO (c) AL-FS, MD ..... 136
............................................................................................................................. 138
Figure 5.6 SEM image when TEAB was used as a draw solute after basic cleaning
(a) AL-FS MD (b) AL-FS FO (c) SL-DS FO ......................................................... 141
Figure 5.7 SEM image when PDAC was used as a draw solute after basic cleaning
(a) AL-FS MD (b) AL-FS FO (c) SL-DS FO ......................................................... 143
Figure 5.8 SEM image when PDAC was used as a draw solute after acidic cleaning
(a) AL-FS MD (b) SL-DS FO (c) AL-FS FO ......................................................... 144
xv
List of Abbreviations
A Water permeability coefficient
AFM Atomic force microscopy
AGMD Air Gap Membrane Distillation
AITC Allyl isothyocyanate
AL Active layer
AL-DS Active later facing draw solute
AL-FS Active layer facing feed solute
B Solute permeability coefficient
CECP Cake enhanced concentration polarization
CFV Crossflow velocity
CMC Critical micelle concentration
CNF Carbon nanofiber
CNT Carbon nanotube
CP Concentration polarization
CTA Cellulose triacetate
CTB Cooling tower blowdown water
DAP di-ammonium phosphate
DCMD Direct Contact Membrane Distillation
xvi
DS Draw solute
ECP External Concentration polarization
ED Electrodialysis
EDTA Ethylenediaminetetraacetic acid
EDTP-Na Ethylenimine pentapropionic acid sodium
FO Forward osmosis
FO-MBR Forward Osmosis membrane bioreactor
FS Feed Solution
GO Graphene oxide
HRT Hydraulic retention time
HTI Hydration technology inc.
ICP Internal concentration polarization
Js Solute flux (GMH)
LBL Layer by layer
MBR Membrane bioreactor
MD Membrane distillation
MF Microfiltration
MFC Magnetic field control
Na-CQDs Na+-functionalized carbon quantum dots
NF Nanofiltration
xvii
PAA-Na Polyacrylic acid-sodium salt
PAI Polyamide-imide
PAM Polyacrylamide
PBI Polybenzimidazole
PDAC Polydiallyldimethylammonium chloride
PEGDA Polyethylene glycol diacrylate
PEI Polyethyleneimine
PES Polyethersulfone
PGBE Poly (ethylene glycol) butyl ether
PP Polypropylene
PRO Pressure retarded osmosis
PSA Poly (sodium acrylate)
PSA-NIPAM Poly (sodium acrylate)-poly(N-isopropylacrylamide)
PTFE Polytetrafluoroethylene
PVDF Polyvinylidene fluoride
RO Reverse osmosis
RST Reverse solute transport
SDS Sodium dodecyl sulphate
SEM Scanning electron microscopy
SGMD Sweeping Gas Membrane Distillation
xviii
SL Support layer
SND Simultaneous nitrification and denitrification
SRT Sludge retention time
SSM Stainless steel mesh
TDS Total dissolved solid
TEAB Tetraethyl ammonium bromide
TMC Trimesoyl chloride
TMP Transmembrane pressure
TOC Total organic carbon
UF Ultrafiltration
VMD Vacuum Membrane Distillation
xix
List of Symbols
A Membrane area (m2)
C Concentration (M)
Cbf Feed concentration in the bulk (M)
Cmf Feed concentration at the membrane surface (M)
D Diffusion coefficient
dh Hydraulic diameter
F Force (N)
Js Reverse solute transport (GMH)
Jw Water flux (LMH)
k Mass transfer coefficient
K Solute resistivity
kD Mass transfer coefficient at the draw side
kF Mass transfer coefficient at the feed side
L Length (m)
n number of solute molecules
P Pressure (atm)
Pf Hydraulic pressure on the feed side (atm)
Pp Hydraulic pressure on the permeate side (atm)
xx
Q Heat flux (subscripts f,m,p for feed, permeate and membrane
respectively)
R Ideal gas constant (m3atm/K mol)
Re Reynolds number
S Membrane structure (m)
Sh Sherwood number
T Temperature (K; ºC)
Tbb Temperature in the permeate bulk (K; ºC)
Tbf Temperature in the feed (K; ºC)
Tmb Temperatures at the cold membrane surfaces (K; ºC)
Tmf Temperature at the hot membrane surfaces (K; ºC)
V Velocity (m/s)
V Volume (m3)
x Thickness of support layer
X Mole fraction
η Coefficient of viscosity (N/m2)
Φ Osmotic coefficient
! Dimensionless Vant Hoff’s factor
" Osmotic pressure (atm; Pa)
# Tortuosity
xxi
# Temperature Polarization
# Thermal boundary layer
$ Porosity of the membrane
d Boundary layer thickness (FO), Membrane thickness (MD)
%& Coefficient of water
"'( Osmotic pressure of bulk draw solution
"') Osmotic pressure at the membrane surface, draw side
"*( Osmotic pressure of bulk draw solution
"*) Osmotic pressure at the membrane surface, feed side
+) Density of the membrane (kg/m3)
+,-. Density of the polymer
∆" Osmotic pressure gradient
xxii
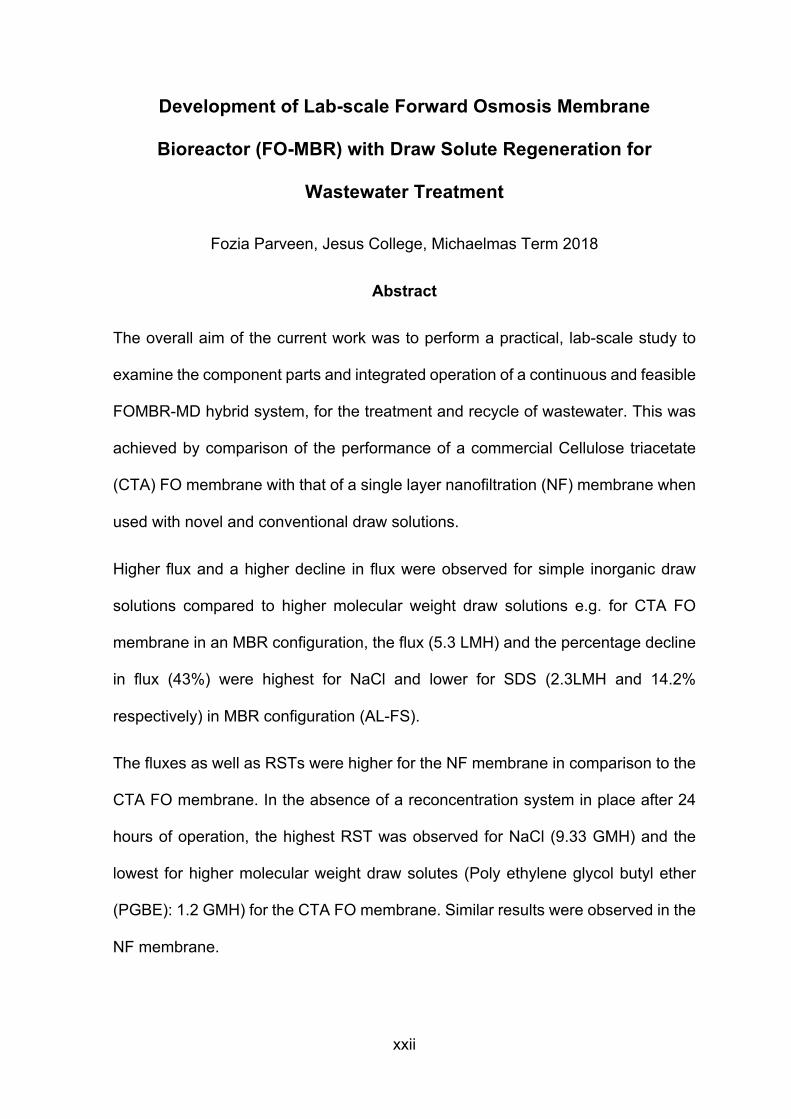
Development of Lab-scale Forward Osmosis Membrane
Bioreactor (FO-MBR) with Draw Solute Regeneration for
Wastewater Treatment
Fozia Parveen, Jesus College, Michaelmas Term 2018
Abstract
The overall aim of the current work was to perform a practical, lab-scale study to
examine the component parts and integrated operation of a continuous and feasible
FOMBR-MD hybrid system, for the treatment and recycle of wastewater. This was
achieved by comparison of the performance of a commercial Cellulose triacetate
(CTA) FO membrane with that of a single layer nanofiltration (NF) membrane when
used with novel and conventional draw solutions.
Higher flux and a higher decline in flux were observed for simple inorganic draw
solutions compared to higher molecular weight draw solutions e.g. for CTA FO
membrane in an MBR configuration, the flux (5.3 LMH) and the percentage decline
in flux (43%) were highest for NaCl and lower for SDS (2.3LMH and 14.2%
respectively) in MBR configuration (AL-FS).
The fluxes as well as RSTs were higher for the NF membrane in comparison to the
CTA FO membrane. In the absence of a reconcentration system in place after 24
hours of operation, the highest RST was observed for NaCl (9.33 GMH) and the
lowest for higher molecular weight draw solutes (Poly ethylene glycol butyl ether
(PGBE): 1.2 GMH) for the CTA FO membrane. Similar results were observed in the
NF membrane.
xxiii
In the toxicity test, B.subtilis was still able to grow at the highest draw solution
concentration (0.5M). The highest percentage growth was observed for Na3PO4
(53% compared to that of the control) and the lowest growth was observed for SDS
(16%), proving their non-toxicity even at such a higher concentration.
For MD optimisation, a temperature difference of 15ºC was chosen with a low feed
temperature of 35ºC and a permeate temperature of 20ºC. An increase in cross flow
velocity (CFV) decreased the temperature and concentration polarization and
increased the flux for MD. An optimum CFV of 0.17 m/s was selected. The MD feed
concentration also affected the flux when all other conditions were similar; slightly
lower fluxes for feed (which was the diluted draw solutions) with higher molecular
weight solutes (Polydiallyldimethylammonium chloride (PDAC): 1.8 LMH) were
observed than with lower molecular weight solutes (NaCl: 2.1 LMH). When MD was
combined in a hybrid system with FO, steadier fluxes were observed for the FO
compared to FO run on its own, and the RST was lower. Due to a higher FO flux, a
more balanced system was achieved for NaCl compared to that of TEAB
(Tetraethylammonium bromide) and PDAC. The FO-MD hybrid enabled pure water
production and a non-volatile component rejection of nearly 99%.
Cleaning tests were performed on the membranes which were employed throughout
this study, using both acidic (2% HNO3 with 2% H3PO4) and basic (0.5 mM EDTA
with 0.5g/L NaOH) cleaning solutions. Observation of SEM images of the
membrane surfaces revealed that the low molecular weight (NaCl) and high
molecular weight (PAC) draw solutes exhibited a lower residual fouling after
cleaning than the medium molecular weight (TEAB) draw solute. The level of
residual fouling also seemed consistent with earlier observations of flux decline.
Apart from the case of the NaCl draw solute, acidic cleaning was generally more
xxiv
effective than basic cleaning for both sides of the FO membrane. The two cleaning
methods were equally effective for the MD membrane active layer
1
Chapter 1
Introduction
1.1Background
Globally, water demand is predicted to increase significantly over the coming
decades. Two thirds of the world’s population currently live in areas that experience
water scarcity for at least one month a year. About 500 million people live in areas
where water consumption exceeds the locally renewable water resources by a
factor of two (WWAP, 2017). Alongside efficient use of water resources, two
strategies to combat water scarcity are; (1) Water reuse and recycling through
wastewater treatment; (2) Desalination of seawater and brackish water. Membrane
technology plays a vital role in both of these processes (Wachinski, 2013). Thus,
water scarcity is a major driver for the treatment of domestic and municipal
secondary effluent water for reuse and recycling. Methods of wastewater treatment
were initially developed in response to public health issues and the adverse
conditions caused by the discharge of wastewater to the environment
(Tchobanoglous et al., 2014).
In this thesis, a niche membrane technology applicable to water and wastewater
treatment known as forward osmosis (FO) has been used. FO has been combined
with membrane distillation (MD) to create an integrated, hybrid treatment process
at laboratory scale which yields clean water. This hybrid process will be evaluated
in detail in the chapters to follow.
2
1.2 Research Objectives
The work reported in this thesis represents one of the first engineering-oriented
studies to examine the component parts and integrated operation of a continuous
FOMBR-MD system for the treatment and recycle of wastewater. The specific
objectives of the study are:
• To investigate the feasibility of a range of novel draw solutions for use in FO,
when applied to waste water treatment and recycle.
• To thus develop a continuous FO-MBR hybrid for the treatment of
wastewater, and achieve fouling control such that continuous operation is
feasible, and thence:
• To investigate the possibility of achieving a stable and acceptable MD flux
for the recycle of wastewater, using the FOMBR-MD Hybrid;
All of these objectives are to be achieved using a system developed at the
laboratory-scale. At the end of the thesis, the future work which must be addressed
to allow running of a full-scale, engineered system will be discussed.
Based on the objectives stated, two key research questions were established;
1. Would using a higher pore-size Nano-filtration (NF) membrane in
combination with high molecular weight novel draw solutions for forward
osmosis improve the overall performance of FO-MBR systems by improving
flux without excessive reverse solute transport?
2. Can FO-MBR systems with novel high molecular weight draw solutions be
used in combination with MD for continuous draw regeneration and water
reclamation?

3
1.3 Significance and Novelty
The present study has attempted to explore a range of novel draw solutions in both
the FO-MBR, and in an FOMBR-MD hybrid. Most of the studies in the literature are
focused on simple inorganic draw solutions such as NaCl and MgCl2 (Table 2.1,
Table 2.5). The present study also includes micellar draw solutions that have been
previously explored by our research group in simple FO systems but have not been
integrated into a full and continuous FOMBR-MD process. Their application was
further built upon here by evaluating their use in the FO-MBR, particularly in relation
to their potential toxicity, and the FO-MD hybrid systems for practical, continuous
application in which the FO and MD fluxes can be maintained and balanced.
Similarly, polyelectrolytes have been tested in continuous, hybrid systems. These
polyelectrolytes have not previously been studied in either FO, FO-MBR or FOMBR-
MD hybrid systems. To complete the picture alongside flux performance, reverse
solute transport (RST), toxicity and membrane cleaning performances were studied.
Indeed, unlike all the studies that are specifically focused on either the membrane,
the type of draw solution or water reclamation from the draw solution, the present
work conducts a complete study by considering all these aspects in an integrated
fashion, and thus examines the feasibility of long term, continuous application of the
system.
The topics of each chapter and their interrelationship have been summarised in
Figure 1.1 and section 1.4 of this chapter, and these topics are then explored in
greater detail in the individual chapters which follow.
4
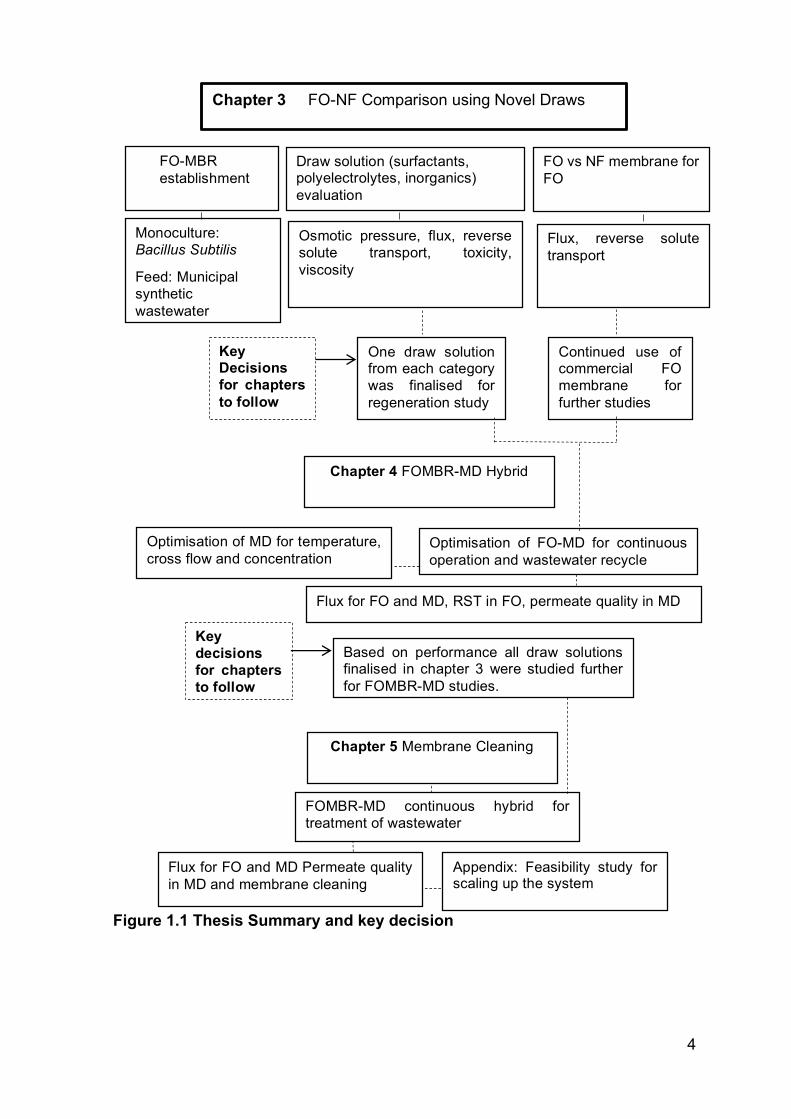
Figure 1.1 Thesis Summary and key decision
Chapter 3 FO-NF Comparison using Novel Draws
FO-MBR establishment
Draw solution (surfactants, polyelectrolytes, inorganics) evaluation
FO vs NF membrane for FO
Monoculture: Bacillus Subtilis
Feed: Municipal synthetic wastewater
Osmotic pressure, flux, reverse solute transport, toxicity, viscosity
Flux, reverse solute transport
One draw solution from each category was finalised for regeneration study
Continued use of commercial FO membrane for further studies
Key Decisions for chapters to follow
Optimisation of MD for temperature, cross flow and concentration
Optimisation of FO-MD for continuous operation and wastewater recycle
Flux for FO and MD, RST in FO, permeate quality in MD
Key decisions for chapters to follow
Based on performance all draw solutions finalised in chapter 3 were studied further for FOMBR-MD studies.
Chapter 5 Membrane Cleaning
FOMBR-MD continuous hybrid for treatment of wastewater
Flux for FO and MD Permeate quality in MD and membrane cleaning
Appendix: Feasibility study for scaling up the system
Chapter 4 FOMBR-MD Hybrid
5
1.4 Chapter Summary
In the following, a summary of the scope of the work attempted in each chapter is
given,
Chapter 3: Comparative performance of an NF membrane and a traditional FO
membrane for use in a Lab Scale FO-MBR
This chapter aims to investigate the application of various novel draw solutions in
conjunction with different membrane types for municipal wastewater treatment by
FO. A lab-scale FO process was established to conduct the experiments.
Nanofiltration (NF) and commercial HTI Forward Osmosis (FO) membranes were
tested and compared in a live membrane bioreactor (MBR) for performance
comparison. The NF membrane offered the possibility of higher fluxes, but reverse
solute transport was also investigated. Synthetic municipal wastewater was
selected as a feed, and the Bacillus subtilis species was inoculated in the solution
and grown overnight for development of a monoculture bioreactor. DI water was
used as feed solution for control. Conventional inorganic salts (NaCl, Na3PO4) were
examined in comparison with the previously untested surfactants (TEAB, SDS) and
polyelectrolytes (PDAC, PGBE) as draw solutes. Osmotic pressure, flux, toxicity
(due to reverse solute transport) and viscosity were observed for the draw solutions.
The high molecular weight draw solutes offered the promise of reducing reverse
solute transport while reducing the energy penalty for draw solute regeneration.
6
Chapter 4: Integration of Forward Osmosis and Membrane Distillation Units
for Regeneration of Novel Draw Solutions and Water Reclamation
Using a range of novel draw solutes, a study was carried out to study and optimize
the integration of a Membrane Distillation (MD) unit with a Forward Osmosis (FO)
unit as a means of recovering clean water from the latter and regenerating the draw
solution. In this hybrid system, the diluted draw solution was fed to the MD unit.
Indeed, the hybrid setup was used to develop a continuously operating FO-MD
system to also study the reverse transport of solute and hence their potential toxicity
to the bacterial species in the bioreactor, and the fouling of the membrane over the
longer-term operation. Indeed, few if any studies can be found on the longer-term
operation of the FO-MD hybrid, especially using a diverse range of draw solutes.
Chapter 5: Optimising the Membrane Cleaning Regime for the FOMBR-MD Lab
Scale System
In this chapter, the cleaning of membranes used with different draw solutes was
studied using the basic cleaning solution used throughout this study, and a
comparison was made with acidic cleaning of the membrane. The membranes were
imaged before and after cleaning using SEM imaging and compared. For basic
cleaning, 0.5mM EDTA was used with 0.5g/l NaOH. For acidic cleaning, 2% HNO3
and 2% H3PO4 was used for cleaning the membrane. The initial decline in flux was
measured in-situ for an integrated FOMBR-MD system prior to cleaning. The
capability of the cleaning process to restore original flux and allow sustained
operation was investigated later in Chapter 6 and Annexe I.
7
Chapter 2
Literature Review
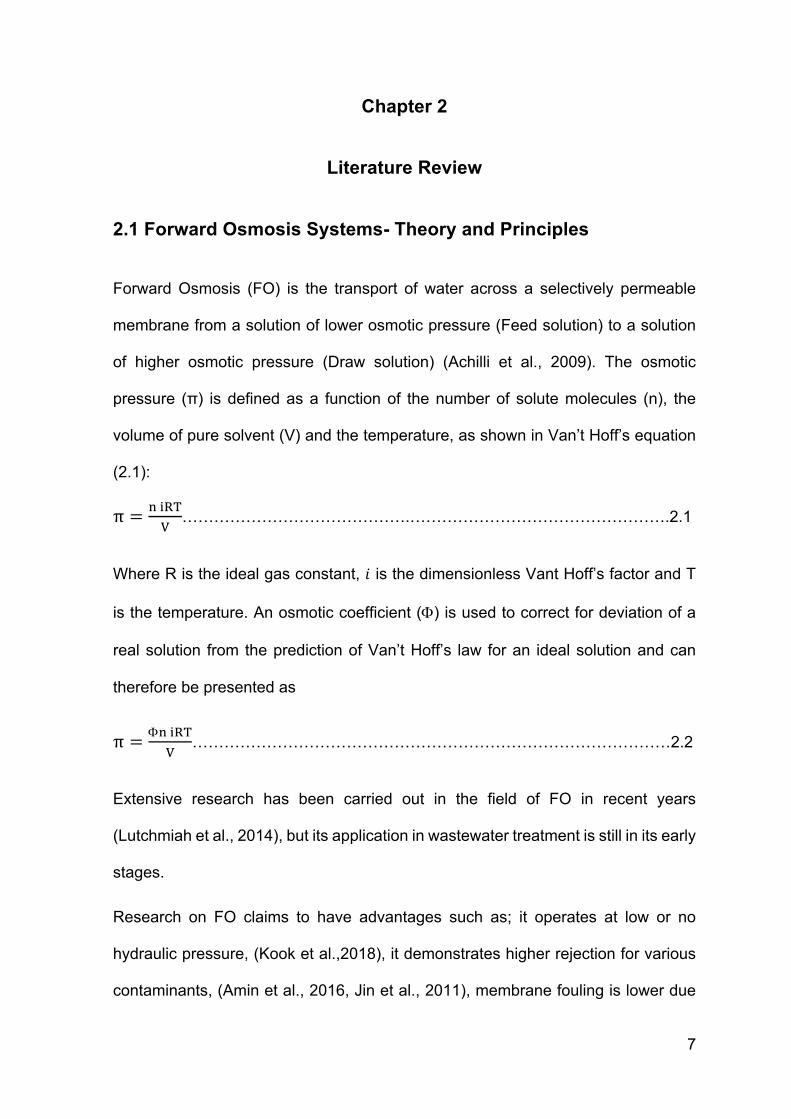
2.1 Forward Osmosis Systems- Theory and Principles
Forward Osmosis (FO) is the transport of water across a selectively permeable
membrane from a solution of lower osmotic pressure (Feed solution) to a solution
of higher osmotic pressure (Draw solution) (Achilli et al., 2009). The osmotic
pressure (π) is defined as a function of the number of solute molecules (n), the
volume of pure solvent (V) and the temperature, as shown in Van’t Hoff’s equation
(2.1):
π =2456
7…………………………………….………………………………………….2.1
Where R is the ideal gas constant, ! is the dimensionless Vant Hoff’s factor and T
is the temperature. An osmotic coefficient (F) is used to correct for deviation of a
real solution from the prediction of Van’t Hoff’s law for an ideal solution and can
therefore be presented as
π =F2456
7………………………………………………………………………………2.2
Extensive research has been carried out in the field of FO in recent years
(Lutchmiah et al., 2014), but its application in wastewater treatment is still in its early
stages.
Research on FO claims to have advantages such as; it operates at low or no
hydraulic pressure, (Kook et al.,2018), it demonstrates higher rejection for various
contaminants, (Amin et al., 2016, Jin et al., 2011), membrane fouling is lower due
8
to flow resistance being solely responsible for the hydraulic pressure drop in the
membrane module. The membrane fouling is reversible and osmotic backwashing
is sufficient to recover the membrane efficiency in most cases (Liu and Mi, 2012).
There are many disadvantages of FO as well; attaining a steady and large flux is
one of the major challenges for large scale implementation of forward osmosis.
Although new membranes (thin film) are being developed and new draw solutions,
explored to improve the process (Li et al., 2017, Huang et al., 2015, Castrillon et al.,
2014, Lay et al., 2011), fouling is still an important problem that occurs in all liquid-
phase membrane processes (Lay et al. 2012). In FO, fouling is particularly
exacerbated by internal concentration polarization (ICP) in the support layer of the
FO membrane. Both external concentration polarization (ECP) on the active layer,
and internal concentration polarisation in the support layer, negatively influence the
flux of an FO membrane.
It is also important to understand that, in view of practical water recycle and
production applications, FO is usually designated as a “pre-treatment” process to
directly treat feed wastewaters (Li et al., 2016).
2.1.1. Concentration Polarization
In an osmotically driven membrane process, concentration polarisation is caused
by the concentration difference between the feed solution and the draw solution
through an asymmetric FO membrane (Figure 2.1). As stated previously, both
internal and external concentration polarization can occur in FO. Generally, ECP
occurs at the surface of the dense active layer while ICP occurs within the porous
support layer of the membrane.
9
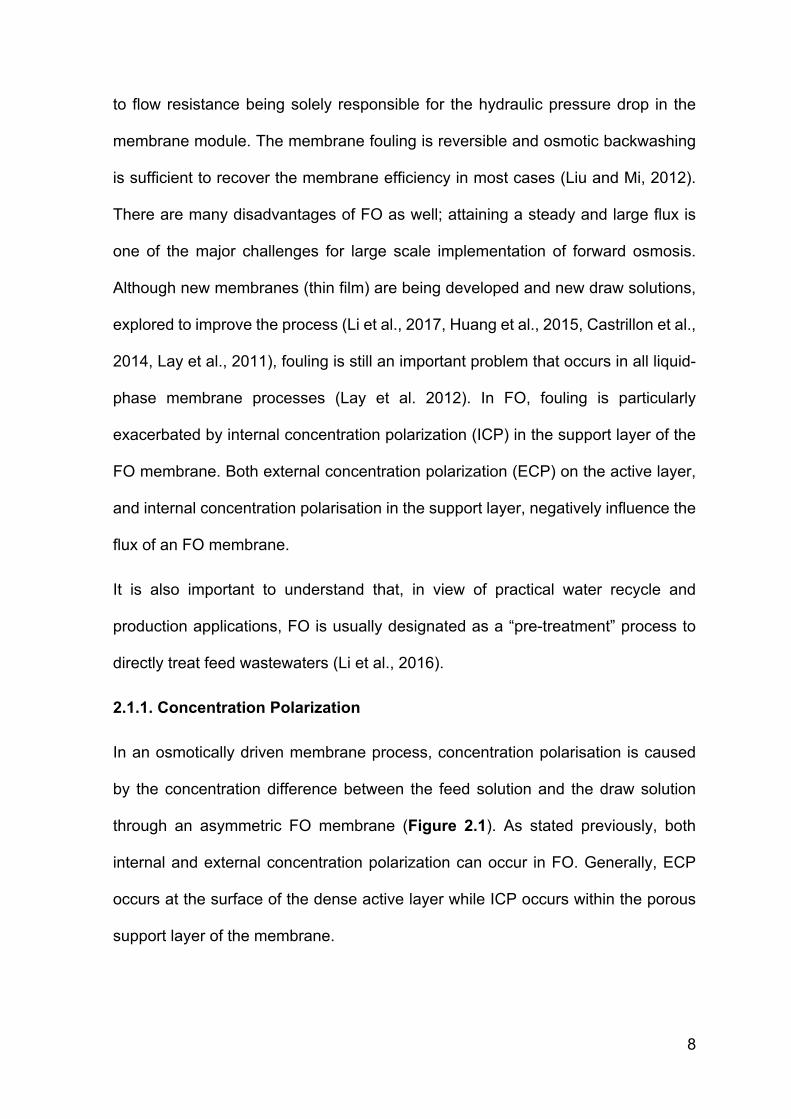
Both concentrative ECP and dilutive ECP may occur at the active layer in an
osmotically driven membrane process, depending on the membrane orientation.
Concentrative ECP occurs on the active layer at the feed side when the membrane
support layer is facing the draw solution, while dilutive ECP occurs on the active
layer at the draw side when the membrane support layer is facing the feed solution.
ECP reduces the net driving force, due to increased osmotic pressure at the
membrane active layer interface on the feed side of the membrane, or decreased
osmotic pressure at the membrane active layer surface on the draw solution side.
However, the adverse effect of ECP on the permeate flux can be mitigated by
increasing the flow turbulence or velocity, or optimizing the water flux.
Figure 2.1 Concentration polarization in FO (Zhao et al., 2012). Cfeed, Cdraw, Δπeff and Jw represent the feed solution concentration, draw solution concentration, effective osmotic driving force and water flux, respectively. ICP represents the change in draw concentration across the support layer; ECP is that between the active layer surface and the bulk draw solution.
10
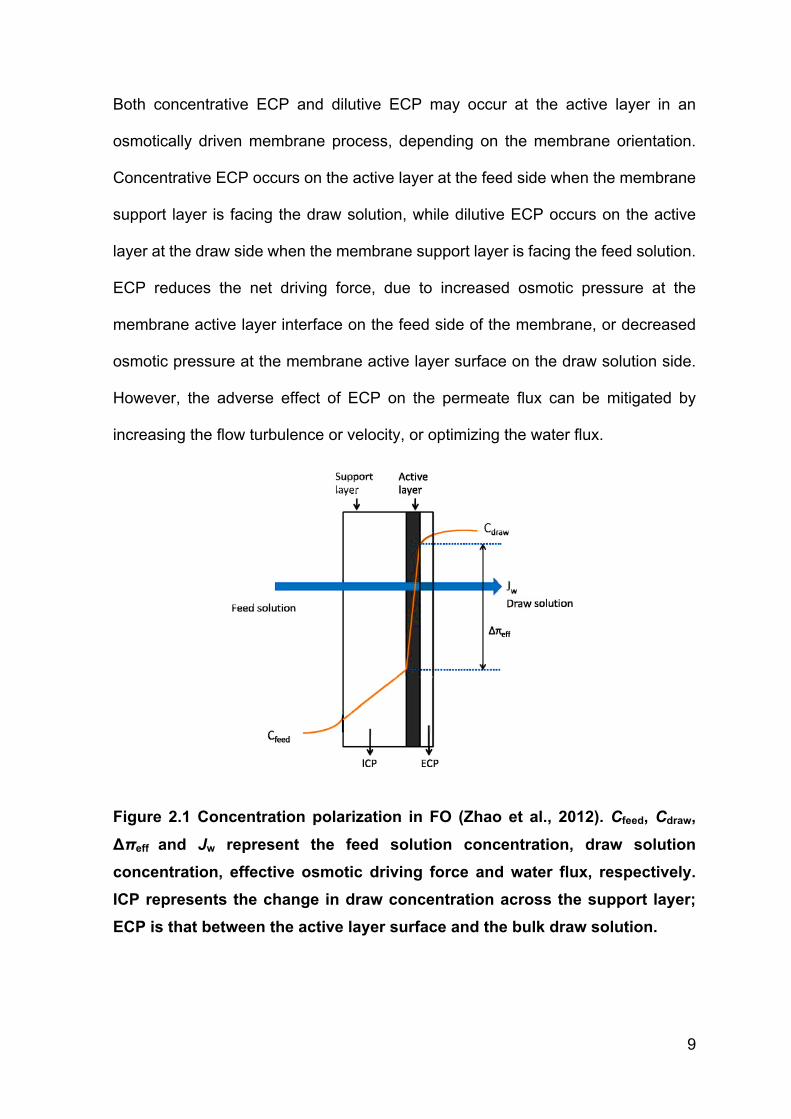
Significant water flux decline in FO can be caused by ICP. Both dilutive and
concentrative ICP can occur in the membrane support layer, depending on
membrane orientation (Figure 2.2). When (a) the draw solution is placed against
the membrane support layer, dilutive ICP will occur within the membrane support
layer as water permeates across the membrane from the feed solution to the draw
solution. Concentrative ICP occurs (b) as the solute in the feed solution accumulates
within the membrane support layer. More critically, because ICP occurs within the
support layer, it cannot be mitigated by altering hydrodynamic conditions, such as
increasing the flow rate or turbulence.
Figure 2.2 Dilutive (a) and concentrative (b) ICP across asymmetric membrane
(Zhao et al., 2012). In both cases, ICP is the change in draw concentration
across the support layer.

11
The water permeability coefficient (A), the solute permeability coefficient (B) and the
membrane structure (S) describe the inherent properties of an osmotic membrane.
An osmotically driven membrane should ideally achieve high flux (high A) and low
reverse solute transport (low B), and S must be minimised to reduce internal
concentration polarization (ICP). The general equation for flux (Jw) in an osmotically-
driven membrane process is often presented in the literature as equation 2.3 (see,
for example, Nicolle, 2013):
J9 = A ∆π;<< −∆P ………………………………………………………………….2.3
where A is the water permeability coefficient of the active layer of the membrane,
and ∆πeff and DP are the effective osmotic pressure difference and net hydraulic
pressure difference across the active layer, respectively. Thus, strictly speaking,
this equation is a specific one which applies across the active layer. In a more
general equation, the effects of internal and external concentration polarisation
should be included (see below).
FO occurs when DP is zero and an osmotic gradient is present. Pressure retarded
osmosis (PRO) applies a hydraulic pressure lower than the osmotic pressure to the
draw solute side. The net flux is in the same direction as FO (towards the draw
solution). Reverse Osmosis (RO) uses a hydraulic pressure which exceeds the
osmotic pressure (DP >∆?), resulting in flux from a concentrated solution to the
permeate. Figure 2.3 represents the relationship between FO, PRO, and RO.
Internal concentration polarization can occur in FO and PRO due to hindered
diffusion of solute in the porous support layer of the asymmetric membrane. The
12
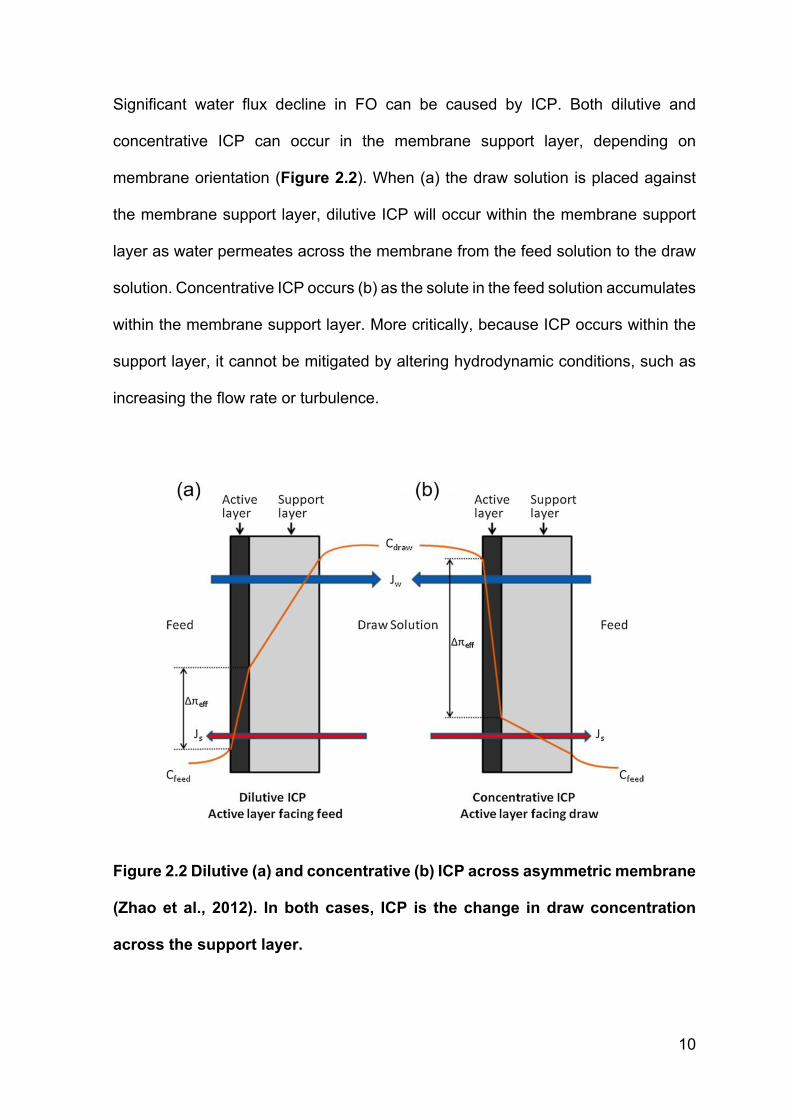
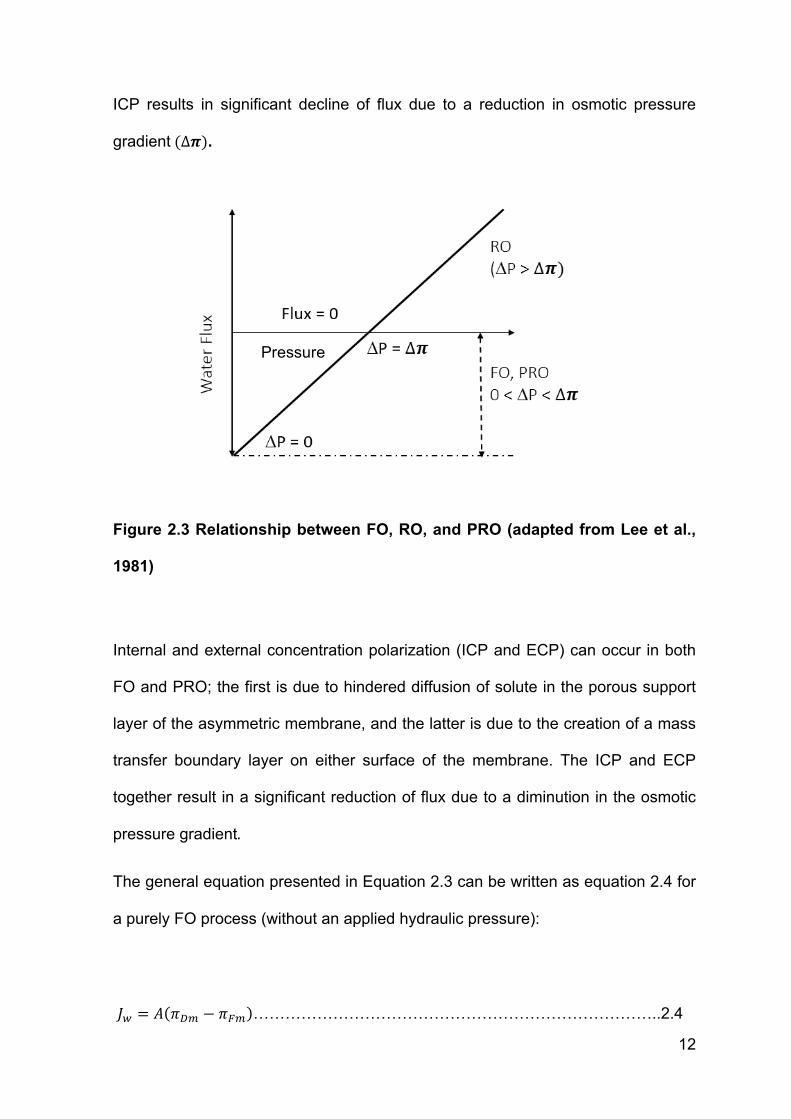
ICP results in significant decline of flux due to a reduction in osmotic pressure
gradient(∆?).
Figure 2.3 Relationship between FO, RO, and PRO (adapted from Lee et al.,
1981)
Internal and external concentration polarization (ICP and ECP) can occur in both
FO and PRO; the first is due to hindered diffusion of solute in the porous support
layer of the asymmetric membrane, and the latter is due to the creation of a mass
transfer boundary layer on either surface of the membrane. The ICP and ECP
together result in a significant reduction of flux due to a diminution in the osmotic
pressure gradient.
The general equation presented in Equation 2.3 can be written as equation 2.4 for
a purely FO process (without an applied hydraulic pressure):
C& = D "') − "*) …………………………………………………………………..2.4
Pressure
13
Where "') and "*) are the effective osmotic pressures applying at the draw
solution side and feed solution side of the membrane active layer, respectively.
However, for this equation to be useful, it would need to be presented in terms of
bulk concentrations of the draw and feed solutions. To do this requires a full
consideration of the internal and external concentration polarisation effects, as
discussed below.
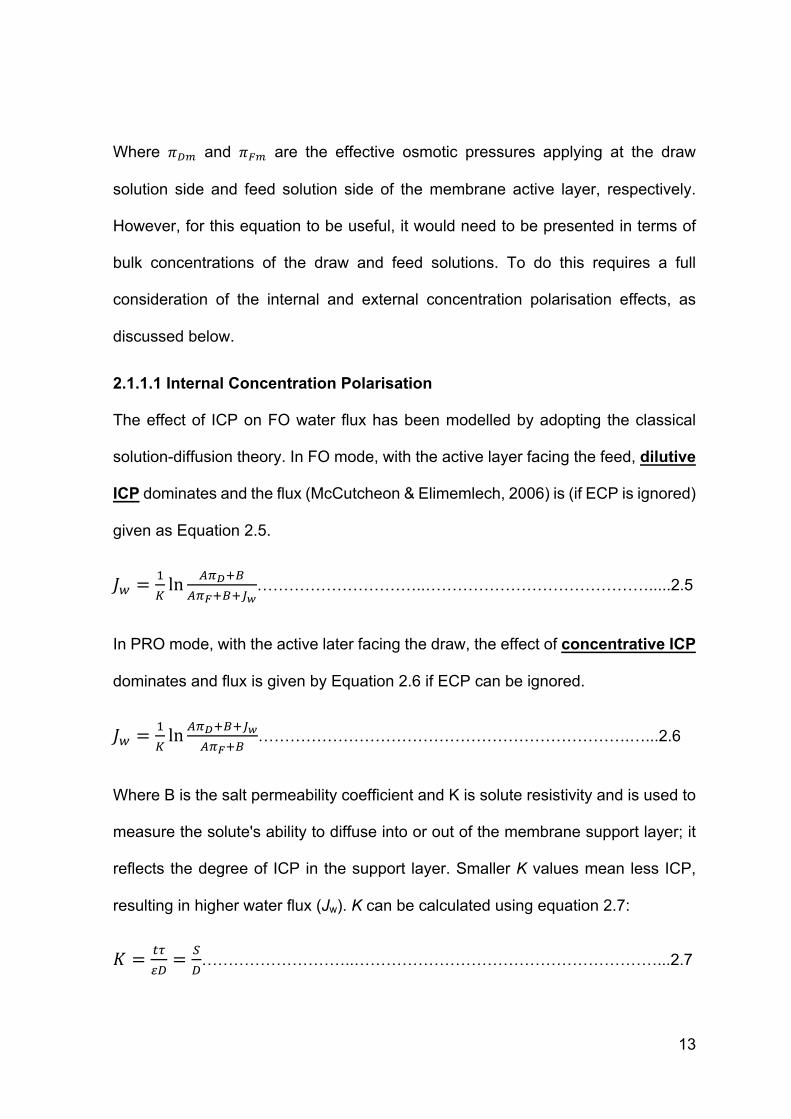
2.1.1.1 Internal Concentration Polarisation
The effect of ICP on FO water flux has been modelled by adopting the classical
solution-diffusion theory. In FO mode, with the active layer facing the feed, dilutive
ICP dominates and the flux (McCutcheon & Elimemlech, 2006) is (if ECP is ignored)
given as Equation 2.5.
C& =E
Fln
IJKLM
IJNLMLOP…………………………..…………………………………….....2.5
In PRO mode, with the active later facing the draw, the effect of concentrative ICP
dominates and flux is given by Equation 2.6 if ECP can be ignored.
C& =E
Fln
IJKLMLOPIJNLM
…………………………………………………………….…...2.6
Where B is the salt permeability coefficient and K is solute resistivity and is used to
measure the solute's ability to diffuse into or out of the membrane support layer; it
reflects the degree of ICP in the support layer. Smaller K values mean less ICP,
resulting in higher water flux (Jw). K can be calculated using equation 2.7:
Q =RS
T'=
U
'………………………..…………………………………………………...2.7
14
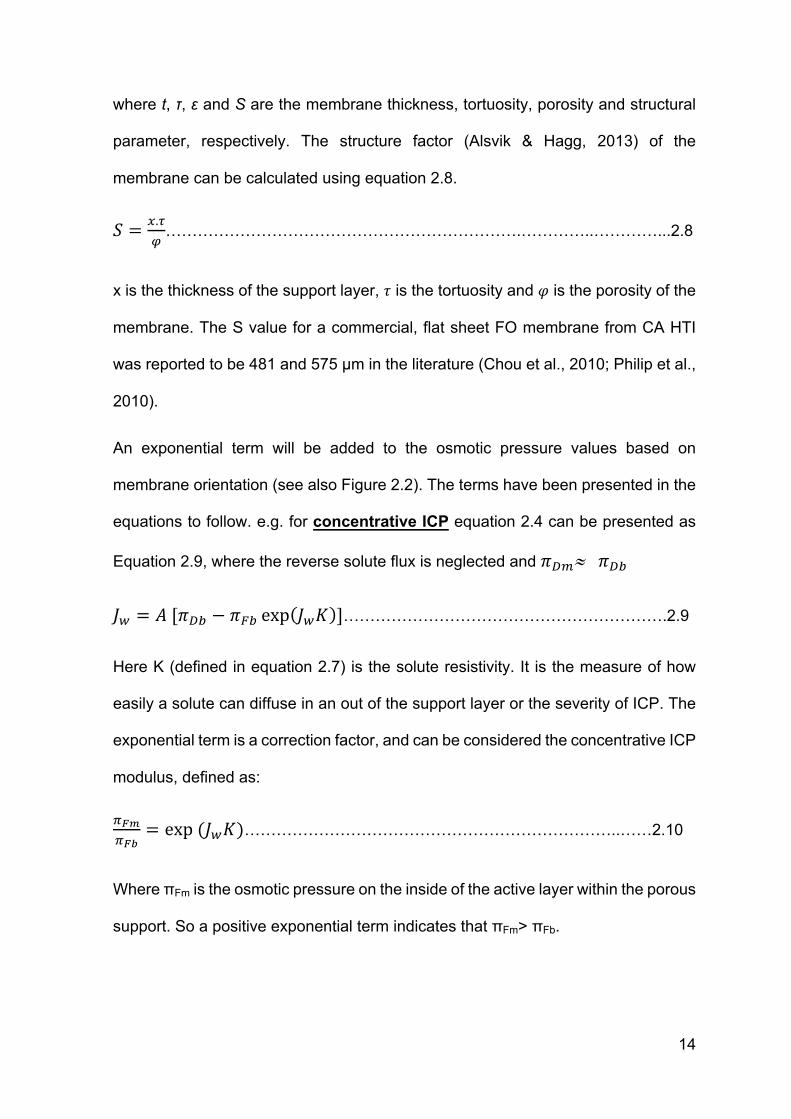
where t, τ, ɛ and S are the membrane thickness, tortuosity, porosity and structural
parameter, respectively. The structure factor (Alsvik & Hagg, 2013) of the
membrane can be calculated using equation 2.8.
V =W.S
X………………………………………………………….…………..…………...2.8
x is the thickness of the support layer, # is the tortuosity and $ is the porosity of the
membrane. The S value for a commercial, flat sheet FO membrane from CA HTI
was reported to be 481 and 575 µm in the literature (Chou et al., 2010; Philip et al.,
2010).
An exponential term will be added to the osmotic pressure values based on
membrane orientation (see also Figure 2.2). The terms have been presented in the
equations to follow. e.g. for concentrative ICP equation 2.4 can be presented as
Equation 2.9, where the reverse solute flux is neglected and "')» "'(
C& = D["'( − "*( exp C&Q ]…………………………………………………….2.9
Here K (defined in equation 2.7) is the solute resistivity. It is the measure of how
easily a solute can diffuse in an out of the support layer or the severity of ICP. The
exponential term is a correction factor, and can be considered the concentrative ICP
modulus, defined as:
JN^JN_
= exp(C&Q)……………………………………………………………..……2.10
Where πFm is the osmotic pressure on the inside of the active layer within the porous
support. So a positive exponential term indicates that πFm> πFb.

15
Similarly, if reverse solute transport is considered to be negligible and "*)» "*(
the dilutive ICP flux given by Loeb et al. (1997) can be rearranged as equation
2.11:
C& = D["'(`ab(−C&Q) − "*(]………………………...………………...……2.11
Here πDb is corrected by the dilutive ICP modulus and defined as equation 2.12,
JK^JK_
= exp(−C&Q)………………………………………………………………….2.12
Where, "') is the concentration of the draw solution on the inside of the active layer
within the porous support. The negative exponential value indicates that "')< "'(.
2.1.1.2 External Concentration Polarisation
Similarly, to ICP modulus, equation 2.13 shows the concentrative ECP modulus
while 2.14 shows the dilutive ECP modulus. "*) and "*( are the osmotic pressures
of the feed solution at the membrane surface and the bulk respectively while "')
and "'( are the osmotic pressures of the draw solution at the membrane surface
and bulk, respectively (McCutcheon & Elimemlech, 2006).
JN^JN_
= expOPc
……………………………………………………..………………..2.13
JK^JK_
= exp(−OPc)…………………………………………………….……………...2.14
k is the mass transfer coefficient (Shirazi et al.,2010) and is given as the ratio of
diffusion coefficient (D) and boundary layer thickness (d).
e ='
f……………………………………………………..……………………………2.15
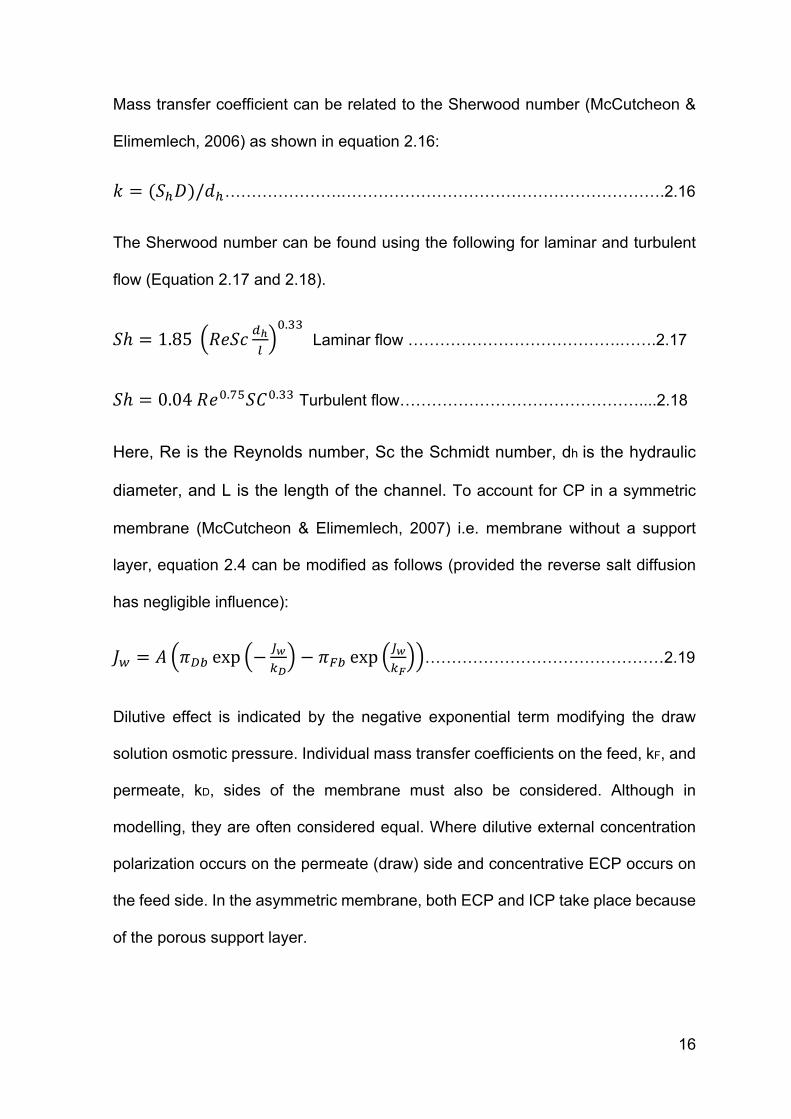
16
Mass transfer coefficient can be related to the Sherwood number (McCutcheon &
Elimemlech, 2006) as shown in equation 2.16:
e = (Vgh)/jg………………….…………………………………………………….2.16
The Sherwood number can be found using the following for laminar and turbulent
flow (Equation 2.17 and 2.18).
Vℎ = 1.85 o`Vpqr.
s.tt Laminar flow ………………………………….…….2.17
Vℎ = 0.04o`s.wxVys.tt Turbulent flow………………………………………....2.18
Here, Re is the Reynolds number, Sc the Schmidt number, dh is the hydraulic
diameter, and L is the length of the channel. To account for CP in a symmetric
membrane (McCutcheon & Elimemlech, 2007) i.e. membrane without a support
layer, equation 2.4 can be modified as follows (provided the reverse salt diffusion
has negligible influence):
C& = D "'( exp −OPcK
− "*( expOPcN
………………………………………2.19
Dilutive effect is indicated by the negative exponential term modifying the draw
solution osmotic pressure. Individual mass transfer coefficients on the feed, kF, and
permeate, kD, sides of the membrane must also be considered. Although in
modelling, they are often considered equal. Where dilutive external concentration
polarization occurs on the permeate (draw) side and concentrative ECP occurs on
the feed side. In the asymmetric membrane, both ECP and ICP take place because
of the porous support layer.
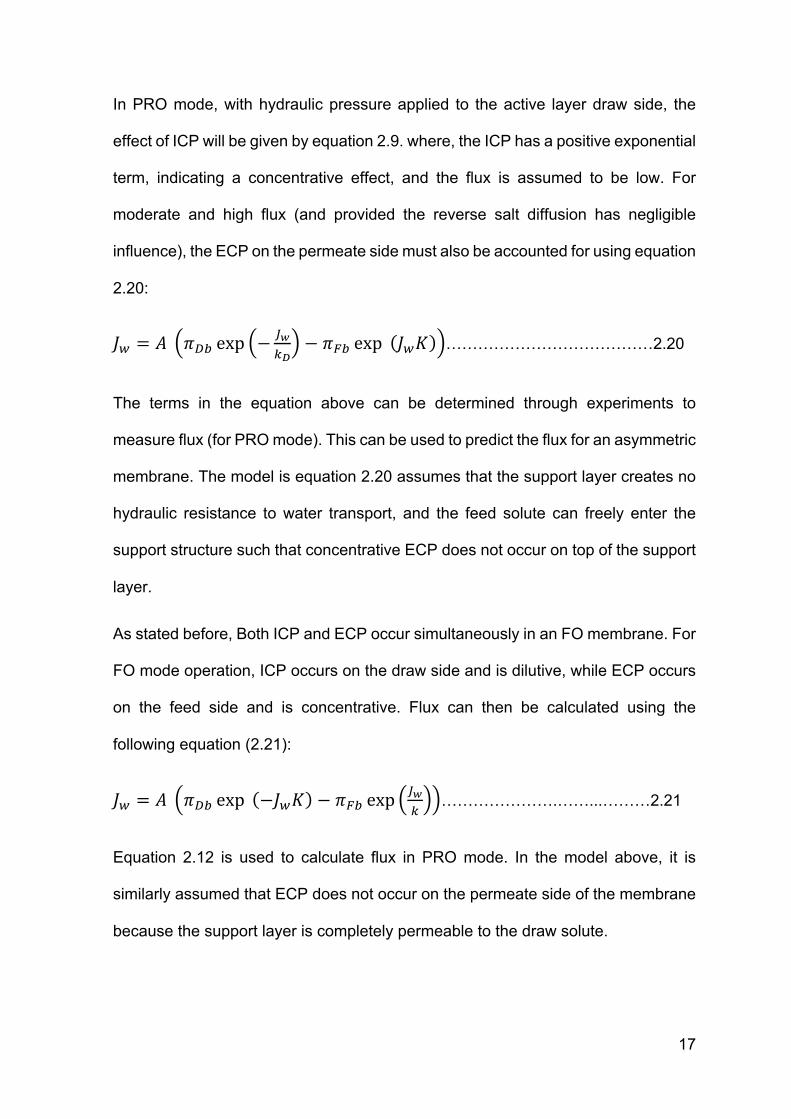
17
In PRO mode, with hydraulic pressure applied to the active layer draw side, the
effect of ICP will be given by equation 2.9. where, the ICP has a positive exponential
term, indicating a concentrative effect, and the flux is assumed to be low. For
moderate and high flux (and provided the reverse salt diffusion has negligible
influence), the ECP on the permeate side must also be accounted for using equation
2.20:
C& = D "'( exp −OPcK
− "*( exp C&Q …………………………………2.20
The terms in the equation above can be determined through experiments to
measure flux (for PRO mode). This can be used to predict the flux for an asymmetric
membrane. The model is equation 2.20 assumes that the support layer creates no
hydraulic resistance to water transport, and the feed solute can freely enter the
support structure such that concentrative ECP does not occur on top of the support
layer.
As stated before, Both ICP and ECP occur simultaneously in an FO membrane. For
FO mode operation, ICP occurs on the draw side and is dilutive, while ECP occurs
on the feed side and is concentrative. Flux can then be calculated using the
following equation (2.21):
C& = D "'( exp −C&Q − "*( expOPc
………………….……...………2.21
Equation 2.12 is used to calculate flux in PRO mode. In the model above, it is
similarly assumed that ECP does not occur on the permeate side of the membrane
because the support layer is completely permeable to the draw solute.
18
The ECP and ICP moduli influence negatively to the overall osmotic driving force.
The negative contribution of each increases with higher flux, which suggests a self-
limiting flux behaviour. This explains why increasing the overall osmotic driving force
no longer increases the flux, or does so with diminishing effect, above a certain
level. Both concentration polarization and reverse solute diffusion are the limiting
factors in FO application (Yip & Elimelech, 2011).
Reverse solute transport (Js) can be calculated using the concentration gradients:
Cz = {∆y……………………………………………….……………………………..2.22
Where, ∆C is the transmembrane concentration difference for the solute across the
active layer. Js is presented in units of g/m2h which has been abbreviated to GMH
(analogously to LMH).
An osmotically-driven membrane should be able to achieve high flux (high A) and
lower reverse solute transport (low B). Values of “A” and “B” for the HTI flat sheet
FO membranes are 0.81 L/m2h bar (2.2 x 10⁻¹² m/s Pa) and 0.62 L/m2h (1.7 x 10⁻⁷
m/s), respectively (Wang et al., 2010). The HTI CTA membrane has been widely
studied and variously promoted and criticised for its performance in water treatment
(Fam et al., 2013).
Reverse solute transport (RST) can reduce the flux and increase the cost of
operation for an FO process. Reverse flux selectivity is used to describe RST and
is the ratio of water flux and reverse solute flux, given as Jw/Js. Although reverse flux
selectivity is shown to be independent of the S value (it depends on the selectivity
of the AL), a low S value is still important to minimise ICP (Phillip et al., 2010).
19
Low fluxes can also be attributed to coupling between water and solutes; therefore,
the reflection coefficient was introduced (to account for this coupling). It is calculated
by taking the ratio of experimental flux and predicted water flux.
σ =}~.�ÄÅ
}~.ÅÇ�É……………………………………….……………………………………2.23
The membrane that allows the solvent to pass but not the solute would have a Ñ of
1.
Alongside ICP and RST, fouling is also an issue in osmotic membrane processes
(Alsvick & Hagg, 2013). Research is currently in progress to tackle the issues of
performance, RST and fouling, including synthesis of novel draw solutions and
membranes. This is described in detail in the sections which follow.
2.2 Forward Osmosis Membranes
It is desirable to have forward osmosis membranes with high flux, low RST and
reduced concentration polarization (CP). An improvement in the support layer to
reduce ICP is important to develop a high-efficiency FO membrane having high
water permeability and low solute permeability, but the latter has not yet been
achieved commercially (Uragami, 2017). The most widely used commercial FO
membrane is a flat sheet FO membrane made up of cellulose triacetate (CTA)
coated on polyester mesh and sourced from Hydration Technology Innovations
(HTI). Other commercial suppliers such as Porifera, Aquaporin, Toray and Oasys
water now provide commercial FO membranes (Nicoll, 2013) but have not been
studied extensively.
As the forward osmosis system relies on the chemical potential difference to drive
water molecules across a membrane surface, and due to a lack of hydraulic
20
pressure gradient, membrane strength is not as important as it is for RO, NF and
UF. Therefore, work on the development of single layer FO membranes without a
conventional support layer has been ongoing (Gai & Zhang, 2015).
Optimization of an FO membrane that can produce a much higher flux as compared
to an RO membrane under typical operating conditions for both is still considered to
be a challenge. Indeed, the hydraulic pressure applied in RO is often higher than
the osmotic pressure achieved by various existing draw solutions, which calls for
higher permeabilities in FO membranes. Therefore, various research groups are
trying to produce new FO membranes for further development of this field. A
summary of membranes alongside the operating conditions, solute and water
permeability and structure parameter are given in Table 2.1.
As stated several times before, the studies on membranes fabrication have often
been tested for performance with NaCl and MgCl2 as draws solution and DI water
as feed instead of complex feeds such as seawater or wastewater. Indeed, many of
the novel draw solutions (discussed later) are not available commercially, and that
is one of the main reasons for their lack of application. Lower cost, high osmotic
pressure, high diffusivity and higher fluxes make simple inorganic draw solutions
easiest viable option, but higher reverse solute transport cannot be neglected and
their buildup over time and increase in toxicity for microbes when used in
wastewater treatment application cannot be ignored.
21
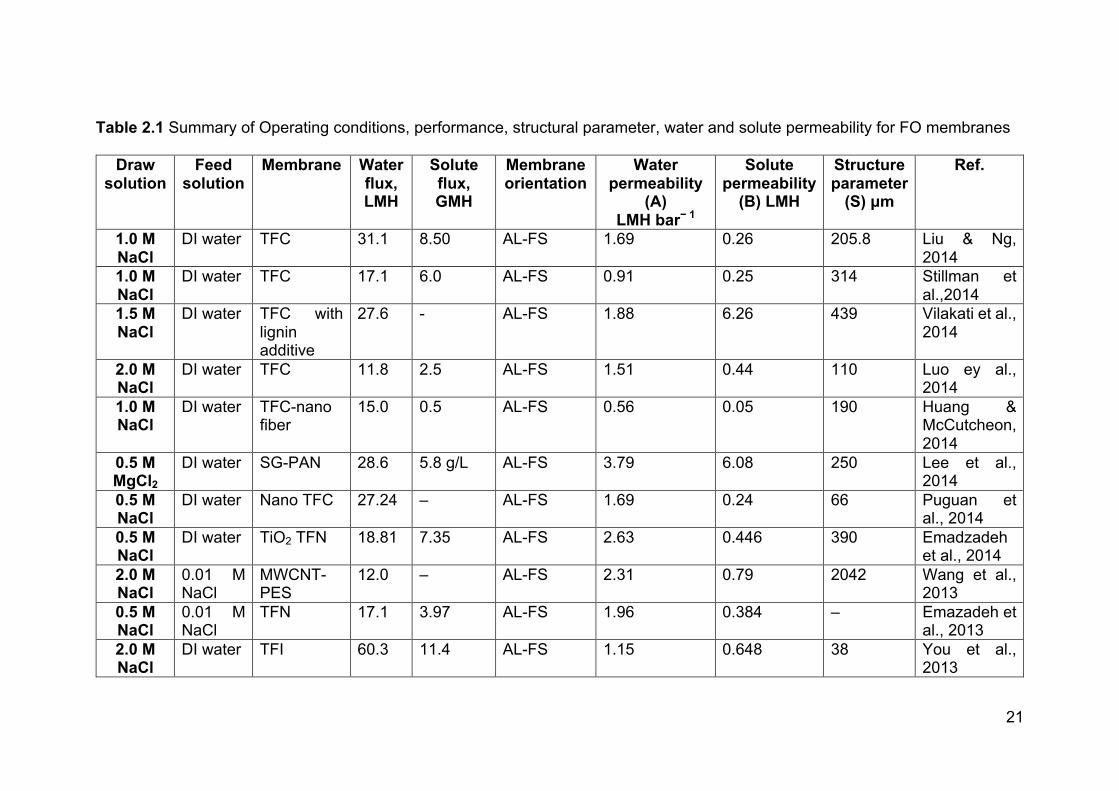
Table 2.1 Summary of Operating conditions, performance, structural parameter, water and solute permeability for FO membranes
Draw solution
Feed solution
Membrane Water flux, LMH
Solute flux, GMH
Membrane orientation
Water permeability
(A) LMH bar− 1
Solute permeability
(B) LMH
Structure parameter
(S) μm
Ref.
1.0 M NaCl
DI water TFC 31.1 8.50 AL-FS 1.69 0.26 205.8 Liu & Ng, 2014
1.0 M NaCl
DI water TFC 17.1 6.0 AL-FS 0.91 0.25 314 Stillman et al.,2014
1.5 M NaCl
DI water TFC with lignin additive
27.6 - AL-FS 1.88 6.26 439 Vilakati et al., 2014
2.0 M NaCl
DI water TFC 11.8 2.5 AL-FS 1.51 0.44 110 Luo ey al., 2014
1.0 M NaCl
DI water TFC-nano fiber
15.0 0.5 AL-FS 0.56 0.05 190 Huang & McCutcheon, 2014
0.5 M MgCl2
DI water SG-PAN 28.6 5.8 g/L AL-FS 3.79 6.08 250 Lee et al., 2014
0.5 M NaCl
DI water Nano TFC 27.24 – AL-FS 1.69 0.24 66 Puguan et al., 2014
0.5 M NaCl
DI water TiO2 TFN 18.81 7.35 AL-FS 2.63 0.446 390 Emadzadeh et al., 2014
2.0 M NaCl
0.01 M NaCl
MWCNT-PES
12.0 – AL-FS 2.31 0.79 2042 Wang et al., 2013
0.5 M NaCl
0.01 M NaCl
TFN 17.1 3.97 AL-FS 1.96 0.384 – Emazadeh et al., 2013
2.0 M NaCl
DI water TFI 60.3 11.4 AL-FS 1.15 0.648 38 You et al., 2013

22
0.5 M NaCl
DI water PSf N-TFC 21 12.6 AL-FS 3.3 340 Ma et al., 2013
0.5 M MgCl2
DI water 3-bilayer LbL
28 1.97 AL-DS 1.15 3.161 445 Cui et al., 2013
0.5 M NaCl
DI water TFC-sPPSU
22.51 5.49 AL-FS 1.99 0.0399 163 Zhong et al., 2013
1.5 M NaCl
DI water Nylon-TFC 6 1 AL-FS 0.917 0.3 1940 Huang & McCutcheon, 2014
0.5 M NaCl
10 mM NaCl
LbL AgNPs 17.9 2.8 AL-FS 3.924 – – Liu et al., 2013
2.0 M NaCl
10 mM NaCl
TFN 25 3 AL-FS 3.6 0.103 380 Amini et al., 2013
1.0 M NaCl
DI water CTA/CA 10.39 4.909 AL-FS – – – Nguyen et al., 2013
2.0 M NaCl
DI water TFC-sPPSU
48 7.6 AL-FS 3.23 1.05 65.2 Widjojo et al., 2013
0.5 M MgCl2
DI water PAI-PES/PEI
20.8 6.448 AL-FS 4.1 0.08 63.3 Setiawan et al., 2013
1.5 M NaCl
DI water TFC with nano fiber
35.0 8.0 AL-FS 2.04 1.57 109.1 Bui & McCutcheon, 2013
1.5 M NaCl
DI water PA/ACE-TFC
12.5 1.4 AL-FS – – – Han et a;., 2013
0.3 M NaCl
DI water LbL 11 8 AL-DS – – – Duong et a., 2013
0.1 M MgCl2
DI water LbL 20.66 0.138 g/L AL-FS 6.1 – – Liu et al., 2013
1.0 M NaCl
DI water CAB 9.4 3.9 AL-FS 0.51 0.4 – Ong et al., 2012
23
0.5 M MgCl2
DI water PAI/PES 27.5 5.5 AL-FS 15.9 – – Setiawan et al., 2012
2.0 M NaCl
DI water PDA@Psf TFC
24 – AL-DS 0.6 0.19 151 Han et al., 2012
2.0 M NaCl
DI water CAP-TFC 31.8 1.6 AL-DS 1.42 0.132 695 Li et al., 2012
2.0 M NaCl
DI water TFC-PES 32.1 6.15 AL-FS 1.18 0.135 219 Sukipaneerit & Chung, 2012
0.5 M MgCl2
DI water LbL 42.3 19.516 AL-FS 3.204 0.508 – Qi et al., 2012
0.5 M MgCl2
DI water LbL 8 16.8 AL-DS – – – Su et al., 2012
0.5 M NaCl
DI water TFC 13 3.6 AL-FS 0.77 0.11 238 Wang et al., 2012
2.0 M NaCl
DI water TFC 21 2.2 AL-FS 0.73 0.25 324 Widjojo et al., 2011
0.5 M NaCl
DI water TFC 18.7 1.6 AL-FS – – – Shi et al., 2011
1.0 M MgCl2
DI water LbL 28.7 17.136 AL-FS 10.224 3.456 – Saren et al., 2011
3.0 M NaCl
DI water PES 30 8.766 AL-FS – – – Liu &Ng, 2014
2.0 M NaCl
DI water CA 10 3 AL-FS 0.2 – – Zhang et al., 2011
0.5 M NaCl
10 mM NaCl
TFC 12 4.9 AL-FS 1.78 0.338 – Wei et al., 2011
1.0 M NaCl
DI water TFC 25 – AL-FS 1.9 0.33 312 Tiraferri et al., 2011
24
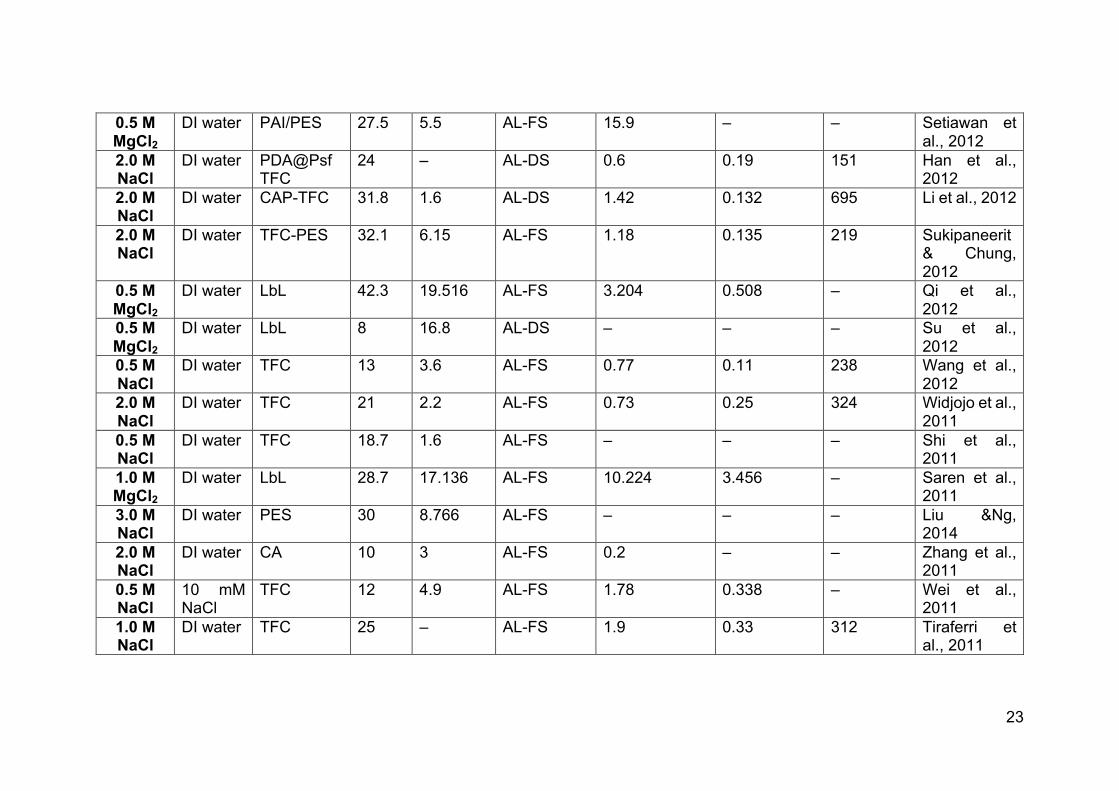
As mentioned before in chapter 2, the S value for HTI membrane in literature has
been reported to be, between 450-600 µm. Most of the values shown in Table 2.1
are very well below the S value for HTI value with the exception of few very high S
values. Higher water permeability is related to higher flux and lower solute transport
to that of lower solute permeability values. Highest values of fluxes are achieved
with a combination of higher A value and lower S value.
Current research on FO membranes is focused on the development of membranes
with antifouling capability, such as hydrogel membranes (Li et al., 2017, Huang et
al., 2015, Castrillon et al., 2014).
Developing a membrane although very crucial is not the only important aspect. In
the studies presented in the Table 2.1, the development of modules to operate at
large scale were not discussed, for which hydrodynamic control can be an issue.
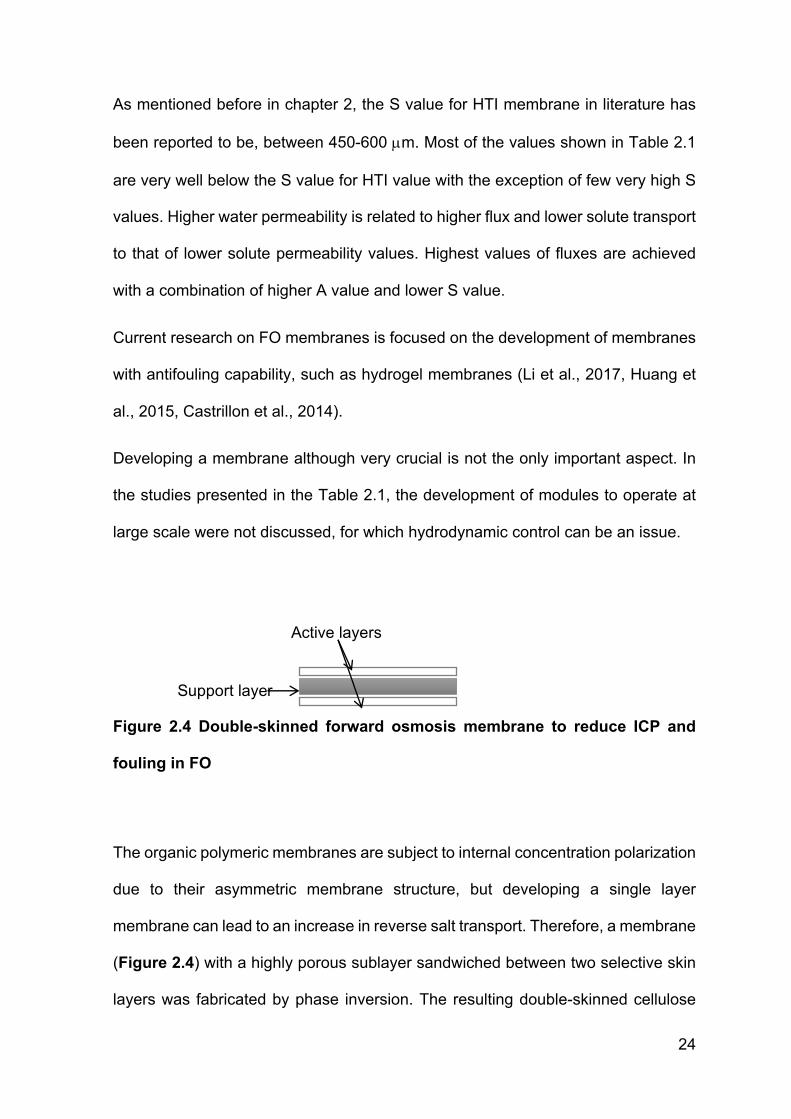
Figure 2.4 Double-skinned forward osmosis membrane to reduce ICP and
fouling in FO
The organic polymeric membranes are subject to internal concentration polarization
due to their asymmetric membrane structure, but developing a single layer
membrane can lead to an increase in reverse salt transport. Therefore, a membrane
(Figure 2.4) with a highly porous sublayer sandwiched between two selective skin
layers was fabricated by phase inversion. The resulting double-skinned cellulose
Support layer
Active layers
25
acetate membrane displayed a water flux of 48.2 LMH and a salt transport of 6.5
GMH, using 5 M MgCl2 as draw solute (Wang et al., 2010). More studies on the
membrane are not found. Indeed, this is true for almost all the novel draw solutions
and membranes reported from literature. The RST for this membrane is still quite
high, despite a low pore sized active layer exposed on both sides of the membrane.
As also observed all the membranes presented in the study have not been tested
for FO-MBR operation.
The TFC membranes for FO presented in the table 2.1 were fabricated via interfacial
polymerization on a polysulfone substrate containing a disulfonated poly(arylene
ether sulfone) hydrophilic-hydrophobic multiblock copolymer to increase the
hydrophilicity and reduce fouling. One of the combinations showed an extremely
high-water flux of 40 LMH in FO mode and 74.4 LMH in PRO mode, when 2M NaCl
solution was used as the draw solute. When feed with 3.5 wt % NaCl was in place,
water fluxes of 18.6 and 29.06 LMH were achieved under FO mode and PRO mode,
respectively (Zhang et al., 2016). The authors claimed the flux to be one of the
highest fluxes achieved however, follow up studies were not found.
Qin et al., (2015) fabricated a nanocomposite FO membrane composed of an oil-
repelling and salt-rejecting hydrogel selective layer on top of a polymeric support
layer infused with graphene oxide (GO) nanosheets [Figure 2.5 (left)]. The hydrogel
selective layer showed high oleophobicity, resulted in low fouling of the membrane.
This membrane was used for shale gas wastewater treatment and showed greater
than 99% oil removal and was recommended for saline and oily wastewater
treatment.
26
Reducing ICP and increasing water permeation are important for forward osmosis
optimisation. A second generation of forward osmosis membranes have been
introduced in the form of graphene sheets and carbon nanotubes, and examples for
both are given below.
Graphene is a thin, single, tightly packed layer of pure carbon. It is the world’s
thinnest and strongest material. Because of the strength, nanoporous graphene can
be used as a semipermeable membrane, without the need for a fabric support. Flux
was shown to be three times higher than that of typical CTA membranes, with
excellent salt rejection, and because of the absence of a support layer, the ICP was
reduced to zero (Gai et al., 2014). However, to date, the graphene sheets have only
been applied in microscopic-scale systems and full-scale systems have not been
realised.
Highly stable and novel supports made of carbon nanotubes were fabricated for
both FO and RO. A TFC membrane was fabricated by interfacial polymerization; a
dense poly(amide) PA layer was formed on a self-supporting bucky paper made of
hydroxyl functionalised entangled carbon nanotubes (CNTs). However, the study
conducted was not adequate or complete, and more research is needed to make
further conclusions (Dumee et al., 2013).
27
Figure 2.5 Graphene layer (left) on its own and rolled graphene as a nanotube
(right)
Overall, a good deal of literature on membranes developed for FO at lab-scale
research is available. However, the issues of RST, applications for treatment of
diverse feed, CP, fouling and reduction in flux with feed (for lab studies, very often
DI water is used as feed instead of industrial or municipal wastewater) haven’t been
overcome. For large scale application of FO more commercial FO membranes with
the ability to tackle all the issues mentioned need to be addressed.
2.3 Forward Osmosis Draw solutions
The draw solution is the driving force and core part of the forward osmosis process.
Solute characteristics are mainly expressed in terms of its solubility and osmotic
pressure, viscosity of the solution, molecular mass, high diffusivity, reverse solute
transport and toxicity. High solubility results in higher possible draw solute
concentrations in the solution, leading to a higher osmotic pressure driving force
and a higher water flux. However, as discussed above, flux only increases linearly
28
up to a certain concentration, while higher concentrations often lead to higher
concentration polarization and diminishing flux returns. The lower the draw solution
viscosity, the better the molecules are transported across a solution, ensuring
higher exchange across the membrane and lower concentration polarization. Lower
molecular mass generates higher osmotic pressures (per given mass
concentration), are highly diffusive with lower tendency towards ICP or ECP, and
hence yield fluxes but result in higher reverse solute diffusion as well.
Table 2.2 Novel draw solutions studied by various research groups
Draw solute
Method of Recovery
Drawbacks Noted in Literature
References
Ammonia and carbon dioxide
Heating Energy intensive Neff,1964
Organic acids and inorganic salts
Temperature variation or
chemical reaction
Complicated procedures, corrosive chemicals involvement
Hough, 1970
Al2SO4 Precipitation by doping Ca(OH)2
Toxic by-products Frank,1972
Glucose- Fructose None Not for generating pure water
Kessler & Moody, 1976
MgCl2 None Not for generating pure water
Loeb et al., 1997
KNO2 & SO2 SO2 recycled through standard
means
Energy intensive, toxic McGinnis, 2002
NH3 & CO2 (NH4HCO3) or NH4OH-NH4HCO3
Moderate heating (60oC)
High reverse draw solute flux, insufficient removal of ammonia, toxicity to biomass in
FO-MBR
McCutcheon et al., 2005;
McCutcheon et al., 2006;
Nawaz et al., 2013
Salt, ethanol Pervaporation-based separations
High reverse draw solute flux and low water
flux
McCormick et al., 2008
29
Magnetic nanoparticles
Recycled by external magnetic
field
Agglomeration Ling et al., 2010; Ge et
al., 2011 Stimuli- responsive polymer hydrogels
De-swelling of the polymer hydrogels
Energy intensive, poor water flux
Li et al., 2011
Hydrophilic nanoparticles
Ultra filtration (UF) Poor water flux Ling and Chung, 2011
Fertilizers None Only applicable in agriculture
Phuntsho et al., 2011
Fatty acid –polythethylene glycol
Thermal method Poor water flux Iyer and Linda, 2011
Sucrose Nano filtration (NF) Relatively low water flux Su et al., 2012
Polyelectrolytes UF Relatively high viscosity Ge et al., 2012
Thermo- sensitive solutes (Derivatives of Acyl-TAEA
Not studied Poor water flux Noh et al., 2012
Urea, ethylene glycol and glucose
Not studied Low water flux and high draw solute flux
Yong et al., 2012
Organic salts RO Low water flux, energy intensive
Bowden et al.,2012
Polyglycol copolymers
NF High viscosity, severe ICP
Carmignani, 2012
Hexavalent phosphazene salts
Not studied Not economical and practical
Stone et al., 2013
Volatile solutes (e.g. SO2
Heating or air stripping
Toxic McCutcheon et al., 2006
Copper sulphate Metathesis precipitation
reaction
Complex regeneration process
Alnaizy et al., 2013
Dendrimers Wide range of pH value and UF
Very expensive to regenerate
Adham et al.,2009
Source: Adapted from (Ge et al., 2013)
The major challenge for FO is the present lack of an ideal DS which can
simultaneously achieve high water flux, low RST, and allows for an efficient and
inexpensive recovery. Indeed, the use of many existing draw solutes in the form of
small molecules, salts, and electrolytes cause difficulties in recovery and salt
leakage and induce clogging in the supporting layer (they can get trapped in the
30
support layer due to poor diffusion), the latter leading to severe fouling and internal
concentration polarization. All of these which may not be economical nor acceptable
in practice. Several strategies for draw regeneration have been proposed, such as
heating/distillation, magnetic separation, precipitation, ultra- and nano-filtration, RO,
membrane distillation, and physical triggers such as pressure or temperature
swings. Table 2.2 shows a review for draw solutions and their regeneration
methods, majorly UF, NF, heating and application of magnetic field etc.
2.3.1 Inorganic Solutes
Several inorganic draw solutes have been tested for forward osmosis including
simple salts, inorganic fertilisers, and hydroacid complexes. Some are presented in
this section starting with the most recent publication.
Trung et al., (2017) evaluated ammonium iron (II) sulfate, ammonium iron (III)
sulfate, and ammonium iron (III) citrate as novel draw solutes. Water flux was in the
range of 8.9 LMH to 12 LMH with DI water as feed in AL-DS configuration. More
than 90% of iron complexes were recovered by an NF-90 membrane. Ammonium
iron (II) sulfate [(NH4)2Fe(SO4)2·6H2O], showed negligible reverse solute flux with a
moderate water flux of 8.9 LMH, while Ammonium iron (III) sulfate [FeNH4(SO4)2]
showed a reverse solute flux of 2.5 GMH and a water flux of 11.66 LMH. Ammonium
iron (III) citrate [(NH4)5Fe (C6H4O7)2] showed a reverse solute flux of 1.3 GMH and
a water flux of 8.7LMH, and Ammonium bicarbonate [NH4HCO3] showed a reverse
solute flux of 1.2 GMH and a water flux of 8LMH. The flux values are comparable to
NaCl the RST values are also high and the study has not been extended to testing
a more complex feed e.g. water flux of 8LMH and 15LMH could be achieved in FO

31
and PRO mode respectively but the RST increased to 5GMH compared to 1.5 GMH
achieved with FO mode (Ren & McCutcheon, 2014).
Some novel draw solutions aim at reducing the RST in FO. A combination of 0.5 mM
Triton X100 with 0.55 M Na3PO4 draw solution (AL-FS) was used as draw solute to
achieve this end. With the said combination, the RST was only 0.13 GMH and water
fluxes of 4.89 LMH and 1.15 LMH were achieved for brackish water (total dissolved
solids: 4090 ppm) and seawater (TDS: 36,800 ppm) respectively. Thus, flux values
were comparable to other inorganic solutes but the RST was reduced by an order
of magnitude. However, the overall fluxes achieved were still lower than desired
high fluxes for large scale operation. Furthermore, a UF-NF recovery system was
able to achieve 98% recovery of the draw solute (Nguyen et al., 2015). Even though
very low RST and very high recovery was achievable the flux us still very lower than
what will be required to scale up a plant.
Inorganic fertilizers (Mishra & Shrivastava, 2015) have also been evaluated as draw
solutes (AL-FS), to eliminate the need for the removal and later regeneration of draw
solutions but instead for direct use of the final product water, in a process known as
fertigation. Six inorganic fertilizer draw solutes, including ammonium nitrate
(NH4NO3), sodium nitrate (NaNO3), potassium chloride (KCl), potassium nitrate
(KNO3), di-ammonium phosphate (DAP), and mono-ammonium phosphate (MAP),
were tested as potential draw solutes at 1 and 2 M draw solution concentrations
with DI water as a feed. The highest performance ratio (percentage ratio of
experimental to calculated flux) was shown by the low molecular weight ammonium
nitrate (8.46 LMH) and potassium chloride (9.39 LMH) at 1M concentration,
whereas DAP (14.67 LMH) with the highest molecular weight showed the worst
performance ratio at 2M draw solution concentration. This is indeed one of the major
32
limitations for high molecular weight draw solutions i.e. their osmotic pressure is
reduced per mass concentration and lower fluxes are achieved.
Ge et al., (2014) assessed cobaltous hydroacid complexes as FO draw solutes and
compared them with the ferric hydroacid complex. Solutions of cobaltous hydroacid
complexes produced a high osmotic pressure, due to the presence of abundant
hydrophilic groups that dissociated to form multi-charged anions and Na cations in
aqueous solution. Their expanded molecular structure also led to a lower reverse
solute transport. Cellulose triacetate, a TFC membrane on a PES support and a
hollow fiber polybenzimidazole/polyethersulfone (PBI/PES) membrane were used
to evaluate the draw solutes and relatively high fluxes were achieved. With DI water
as feed in PRO (AL-DS) mode, the TFC membrane produced a high water flux of
39-48 LMH at 2.0 M draw solute for Fe-CA. A water flux of 17.4 LMH (Fe-CA) was
achieved when 3.5 wt% NaCl was used as a feed and Co-CA gave a flux of 13 LMH.
This hydroacid complex was easily regenerated using NF. However, a potential set-
back is their higher cost as compared to other inorganic solutes. Another major area
of concern is nearly 50% drop in flux as the feed is changed from DI water to
seawater. This also needs attention of researchers in the area.
Achilli et al., (2010) extensively tested fourteen inorganic draw solutions in the
laboratory for water flux and RST through an FO membrane (Symmetric). The
measured water fluxes ranged from 10.9 LMH for KCl to 5.5 LMH for MgSO4 at 2.8
MPa osmotic pressure. Other draw solutions in their order of ranking (based on
performance and replenishment cost) included NH4Cl, KBr, NaCl, CaCl2, CaSO4,
NaHCO3, Ca(NO3)2, MgCl2, (NH4)2SO4, KHCO3, Na2SO4, NH4HCO3. DI water was
used a feed. Larger-sized hydrated anions showed the lowest reverse solute
diffusion, regardless of their cationic counterpart. CaCl2, KHCO3, MgCl2, MgSO4,
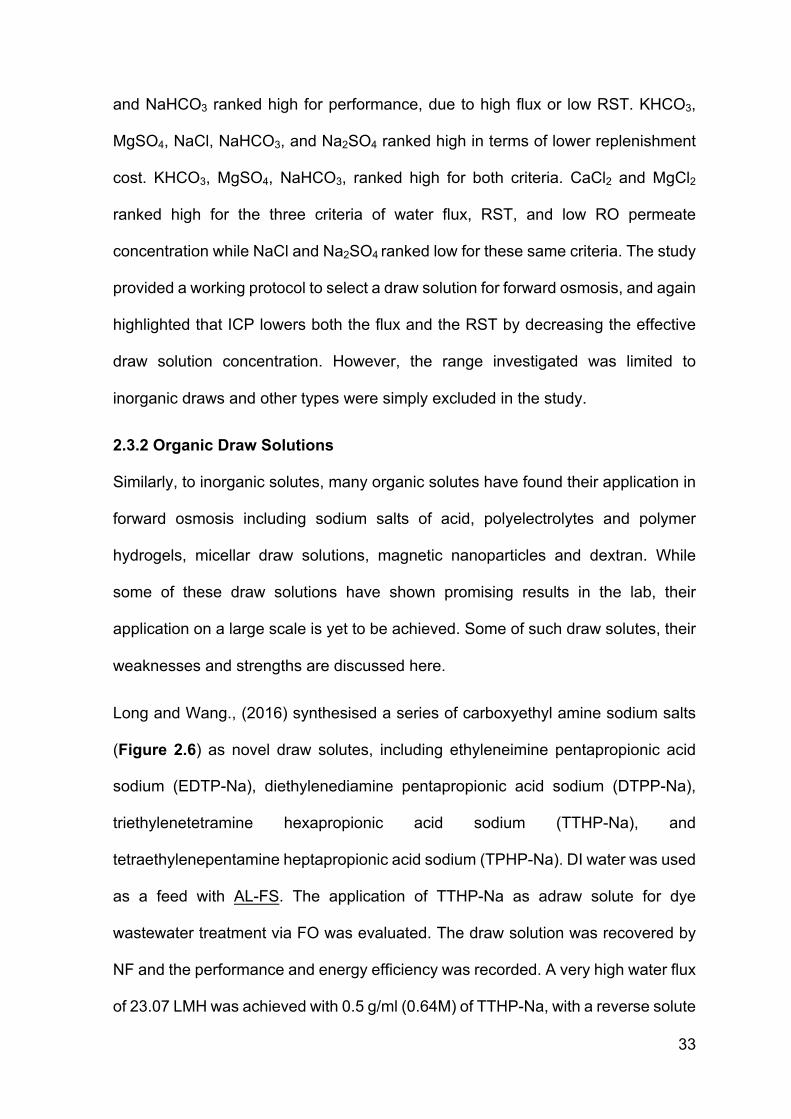
33
and NaHCO3 ranked high for performance, due to high flux or low RST. KHCO3,
MgSO4, NaCl, NaHCO3, and Na2SO4 ranked high in terms of lower replenishment
cost. KHCO3, MgSO4, NaHCO3, ranked high for both criteria. CaCl2 and MgCl2
ranked high for the three criteria of water flux, RST, and low RO permeate
concentration while NaCl and Na2SO4 ranked low for these same criteria. The study
provided a working protocol to select a draw solution for forward osmosis, and again
highlighted that ICP lowers both the flux and the RST by decreasing the effective
draw solution concentration. However, the range investigated was limited to
inorganic draws and other types were simply excluded in the study.
2.3.2 Organic Draw Solutions
Similarly, to inorganic solutes, many organic solutes have found their application in
forward osmosis including sodium salts of acid, polyelectrolytes and polymer
hydrogels, micellar draw solutions, magnetic nanoparticles and dextran. While
some of these draw solutions have shown promising results in the lab, their
application on a large scale is yet to be achieved. Some of such draw solutes, their
weaknesses and strengths are discussed here.
Long and Wang., (2016) synthesised a series of carboxyethyl amine sodium salts
(Figure 2.6) as novel draw solutes, including ethyleneimine pentapropionic acid
sodium (EDTP-Na), diethylenediamine pentapropionic acid sodium (DTPP-Na),
triethylenetetramine hexapropionic acid sodium (TTHP-Na), and
tetraethylenepentamine heptapropionic acid sodium (TPHP-Na). DI water was used
as a feed with AL-FS. The application of TTHP-Na as adraw solute for dye
wastewater treatment via FO was evaluated. The draw solution was recovered by
NF and the performance and energy efficiency was recorded. A very high water flux
of 23.07 LMH was achieved with 0.5 g/ml (0.64M) of TTHP-Na, with a reverse solute

34
transport of 0.75 GMH in PRO mode. Similarly, DTPP and EDTP also showed fluxes
over 20LMH and RSTs below 0.5GMH in PRO mode. The fluxes dropped to 15LMH
and under for FO mode and RSTs between 0.6-0.8 GMH were observed (Long &
Wang, 2016). The authors also synthesized a series of organic phosphonate salts
(OPSs) by the one-step Mannich-like reaction. Their osmotic pressure, viscosities
and FO performance were evaluated. In general, a high flux of 47-54 LMH with a
very low reverse solute transport was observed, using a homemade TFC
membrane. Tetraethylenepentamine heptakis(methylphosphonic) sodium salt
(TPHMP-Na) exhibited the best performance at 0.5M out of the following:
diethylenetriamine pentakis(methylphosphonic) sodium salt (DTPMP-Na),
tetraethylenepentamine heptakis(methylphosphonic) sodium salt (TPHMP-Na),
polyethylenimine (methylenephosphonic) sodium salt (PEI-600P-Na) and
polyethylenimine (methylenephosphonic) sodium salt (PEI-1800P-Na). Recovery
with 92% rejection was observed in an NF recovery system. These draw solutes
were stated to be novel with potential use in FO (Long et al., 2016) but the cost,
regeneration and reuse data were not reported.
The same group also synthesized a series of renewable, non-toxic gluconate salts
as FO draw solutes suitable for food processing applications; potassium gluconate
salt (Glu-K), sodium gluconate salt (Glu-Na), zinc gluconate salt (Glu-Zn), and
iron(II) gluconate salt (Glu-Fe(II)). Apple juice was used as a feed solution. The
results showed that 2M Glu-K draw solution generated a comparable water flux
(∼23.17 LMH) to that of NaCl solution, but with a significantly lower solute leakage
(∼1.09 gMH) in PRO mode. The salts were recovered by NF and their application
in the food industry was proposed (Long & Wang, 2016). However, their reuse
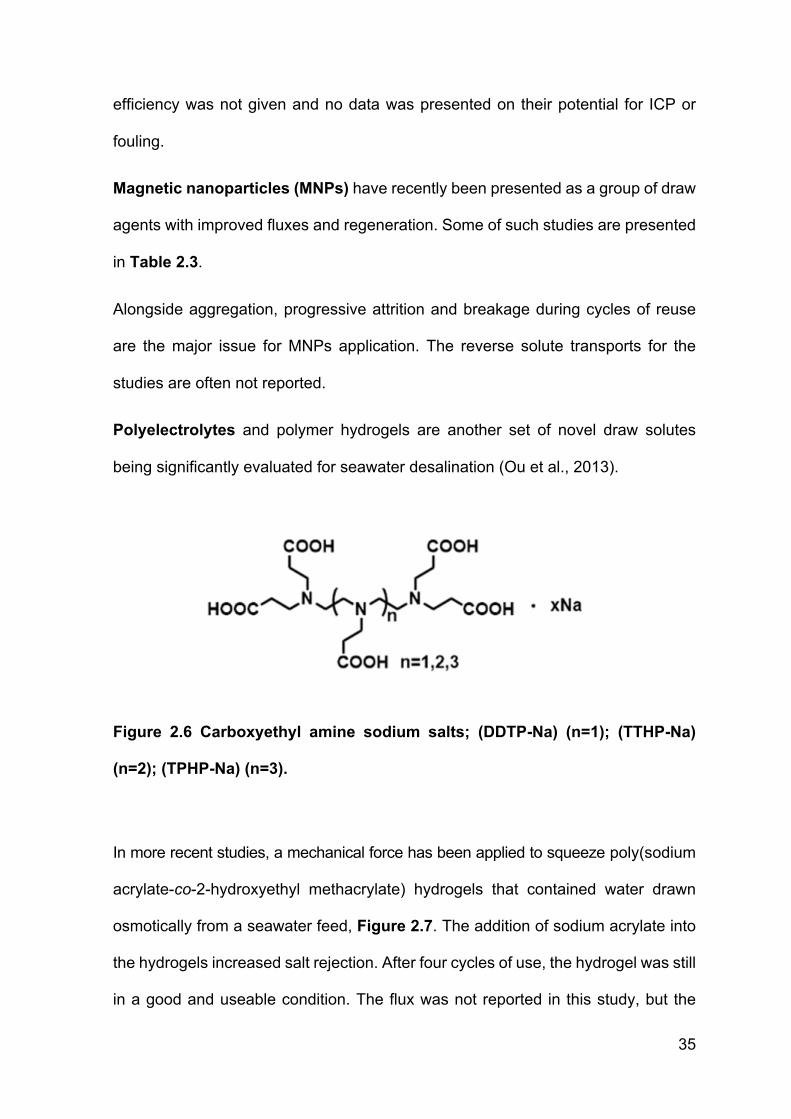
35
efficiency was not given and no data was presented on their potential for ICP or
fouling.
Magnetic nanoparticles (MNPs) have recently been presented as a group of draw
agents with improved fluxes and regeneration. Some of such studies are presented
in Table 2.3.
Alongside aggregation, progressive attrition and breakage during cycles of reuse
are the major issue for MNPs application. The reverse solute transports for the
studies are often not reported.
Polyelectrolytes and polymer hydrogels are another set of novel draw solutes
being significantly evaluated for seawater desalination (Ou et al., 2013).
Figure 2.6 Carboxyethyl amine sodium salts; (DDTP-Na) (n=1); (TTHP-Na)
(n=2); (TPHP-Na) (n=3).
In more recent studies, a mechanical force has been applied to squeeze poly(sodium
acrylate-co-2-hydroxyethyl methacrylate) hydrogels that contained water drawn
osmotically from a seawater feed, Figure 2.7. The addition of sodium acrylate into
the hydrogels increased salt rejection. After four cycles of use, the hydrogel was still
in a good and useable condition. The flux was not reported in this study, but the
36
hydrogels were recommended for use in both FO and RO (Yu et al., 2016).
Operating with such a hydrogel at full scale, the design of a suitable mechanical
press which could operate continuously was not reported but represents a
significant challenge.
Figure 2.7 Hydrogel mechanical squeezing (Yu et al., 2016)
Na+-functionalized carbon quantum dots (Na-CQDs) that are biocompatible in
nature have also been proposed as FO draw solutes. With a 0.4g/ml draw solution
concentration and seawater as feed, a reasonable high flux of 10 LMH was
observed. Again, the cost of synthesis, especially at large scale, is likely to be an
issue. Membrane distillation was used to recover the draw solute (Guo et al., 2014).
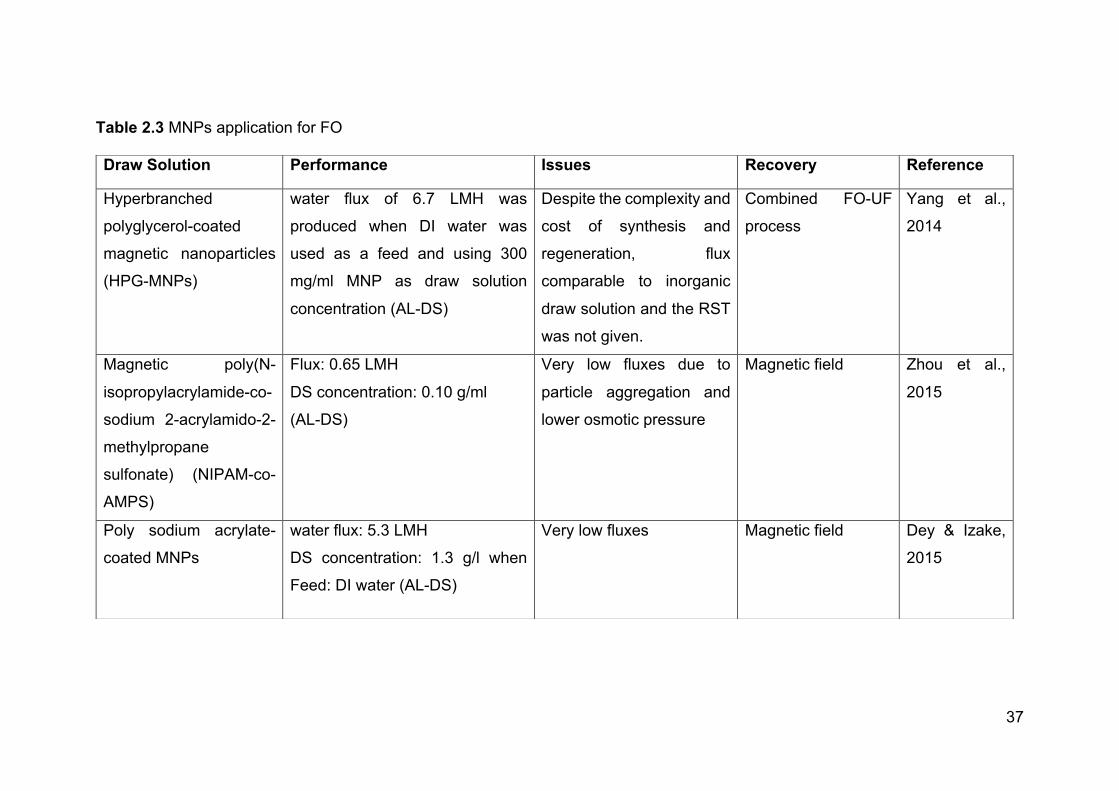
37
Table 2.3 MNPs application for FO
Draw Solution Performance Issues Recovery Reference
Hyperbranched
polyglycerol-coated
magnetic nanoparticles
(HPG-MNPs)
water flux of 6.7 LMH was
produced when DI water was
used as a feed and using 300
mg/ml MNP as draw solution
concentration (AL-DS)
Despite the complexity and
cost of synthesis and
regeneration, flux
comparable to inorganic
draw solution and the RST
was not given.
Combined FO-UF
process
Yang et al.,
2014
Magnetic poly(N-
isopropylacrylamide-co-
sodium 2-acrylamido-2-
methylpropane
sulfonate) (NIPAM-co-
AMPS)
Flux: 0.65 LMH
DS concentration: 0.10 g/ml
(AL-DS)
Very low fluxes due to
particle aggregation and
lower osmotic pressure
Magnetic field Zhou et al.,
2015
Poly sodium acrylate-
coated MNPs
water flux: 5.3 LMH
DS concentration: 1.3 g/l when
Feed: DI water (AL-DS)
Very low fluxes Magnetic field Dey & Izake,
2015
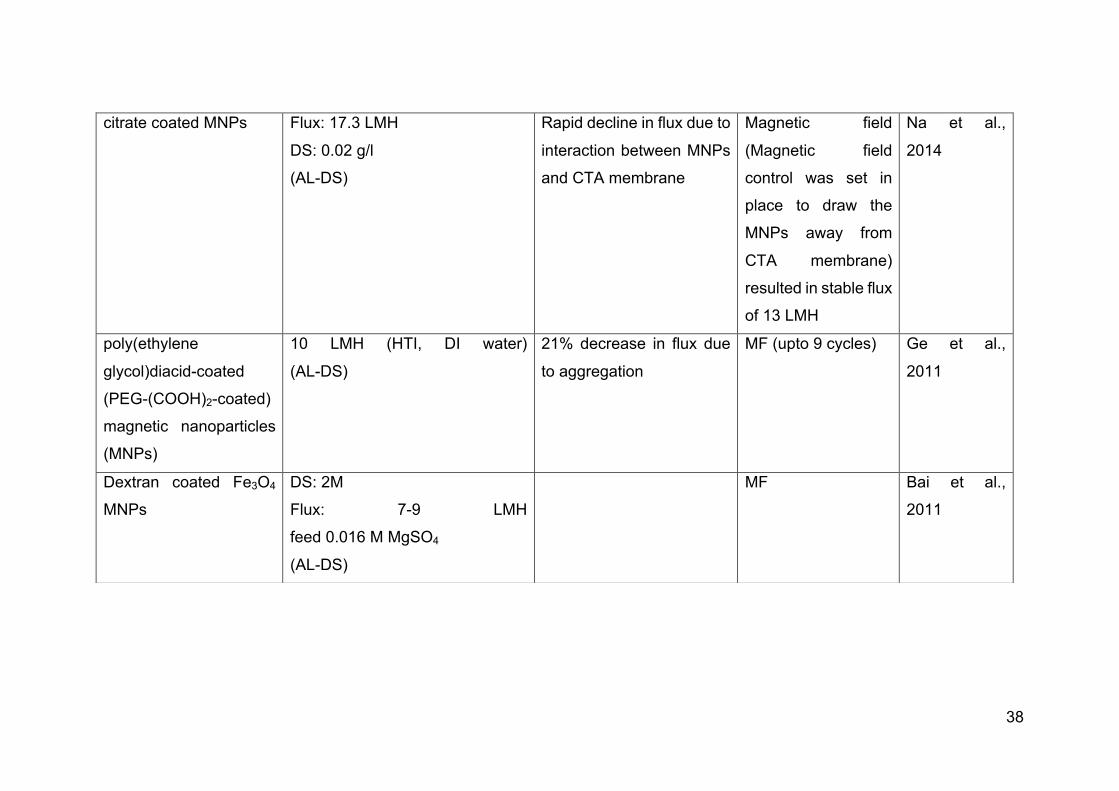
38
citrate coated MNPs Flux: 17.3 LMH
DS: 0.02 g/l
(AL-DS)
Rapid decline in flux due to
interaction between MNPs
and CTA membrane
Magnetic field
(Magnetic field
control was set in
place to draw the
MNPs away from
CTA membrane)
resulted in stable flux
of 13 LMH
Na et al.,
2014
poly(ethylene
glycol)diacid-coated
(PEG-(COOH)2-coated)
magnetic nanoparticles
(MNPs)
10 LMH (HTI, DI water)
(AL-DS)
21% decrease in flux due
to aggregation
MF (upto 9 cycles) Ge et al.,
2011
Dextran coated Fe3O4
MNPs
DS: 2M
Flux: 7-9 LMH
feed 0.016 M MgSO4
(AL-DS)
MF Bai et al.,
2011
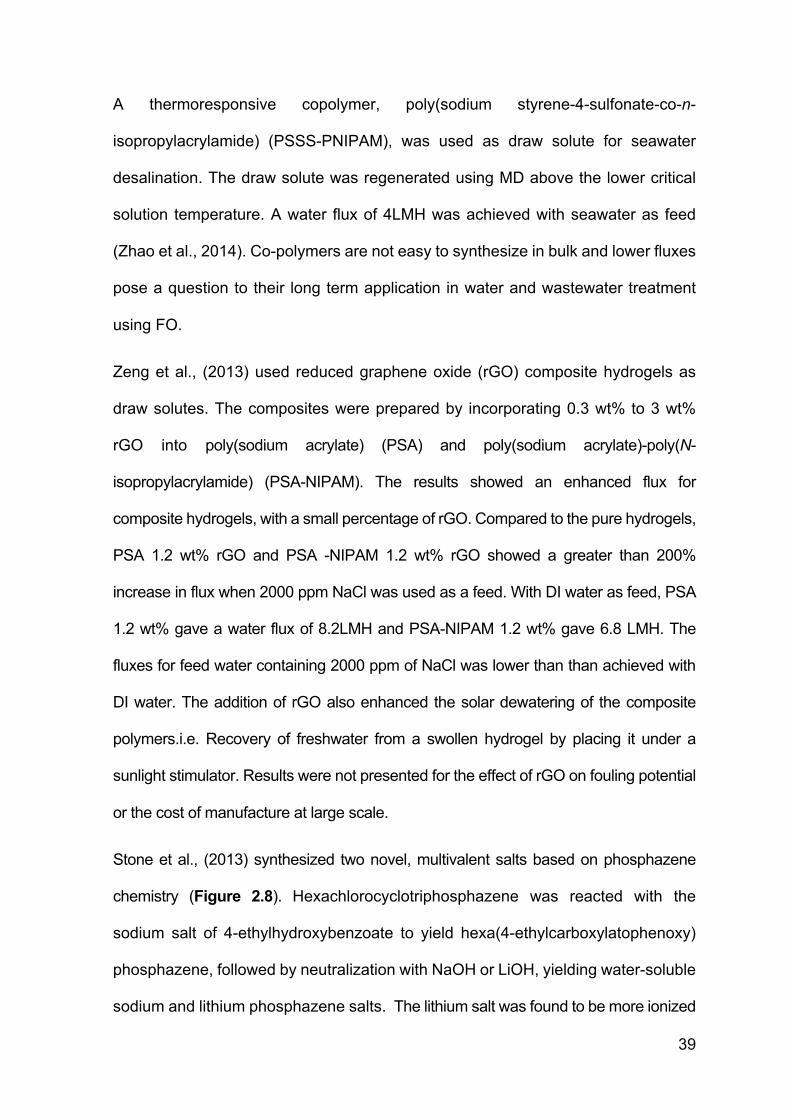
39
A thermoresponsive copolymer, poly(sodium styrene-4-sulfonate-co-n-
isopropylacrylamide) (PSSS-PNIPAM), was used as draw solute for seawater
desalination. The draw solute was regenerated using MD above the lower critical
solution temperature. A water flux of 4LMH was achieved with seawater as feed
(Zhao et al., 2014). Co-polymers are not easy to synthesize in bulk and lower fluxes
pose a question to their long term application in water and wastewater treatment
using FO.
Zeng et al., (2013) used reduced graphene oxide (rGO) composite hydrogels as
draw solutes. The composites were prepared by incorporating 0.3 wt% to 3 wt%
rGO into poly(sodium acrylate) (PSA) and poly(sodium acrylate)-poly(N-
isopropylacrylamide) (PSA-NIPAM). The results showed an enhanced flux for
composite hydrogels, with a small percentage of rGO. Compared to the pure hydrogels,
PSA 1.2 wt% rGO and PSA -NIPAM 1.2 wt% rGO showed a greater than 200%
increase in flux when 2000 ppm NaCl was used as a feed. With DI water as feed, PSA
1.2 wt% gave a water flux of 8.2LMH and PSA-NIPAM 1.2 wt% gave 6.8 LMH. The
fluxes for feed water containing 2000 ppm of NaCl was lower than than achieved with
DI water. The addition of rGO also enhanced the solar dewatering of the composite
polymers.i.e. Recovery of freshwater from a swollen hydrogel by placing it under a
sunlight stimulator. Results were not presented for the effect of rGO on fouling potential
or the cost of manufacture at large scale.
Stone et al., (2013) synthesized two novel, multivalent salts based on phosphazene
chemistry (Figure 2.8). Hexachlorocyclotriphosphazene was reacted with the
sodium salt of 4-ethylhydroxybenzoate to yield hexa(4-ethylcarboxylatophenoxy)
phosphazene, followed by neutralization with NaOH or LiOH, yielding water-soluble
sodium and lithium phosphazene salts. The lithium salt was found to be more ionized
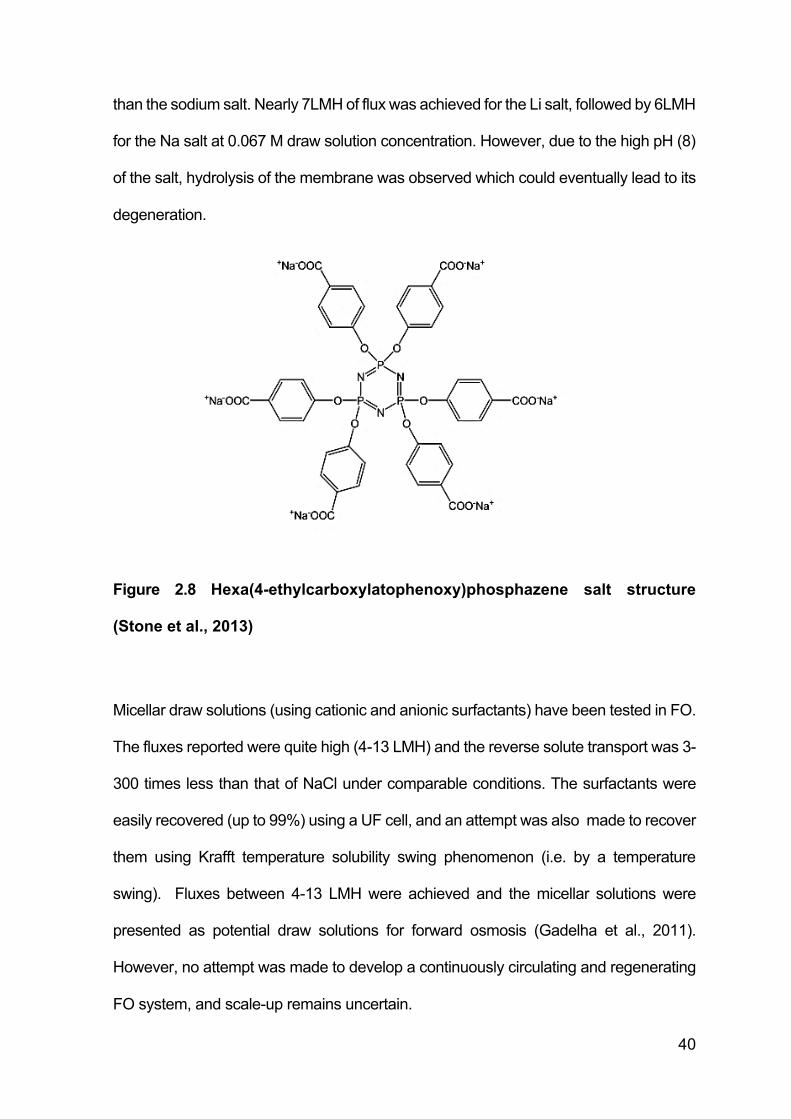
40
than the sodium salt. Nearly 7LMH of flux was achieved for the Li salt, followed by 6LMH
for the Na salt at 0.067 M draw solution concentration. However, due to the high pH (8)
of the salt, hydrolysis of the membrane was observed which could eventually lead to its
degeneration.
Figure 2.8 Hexa(4-ethylcarboxylatophenoxy)phosphazene salt structure
(Stone et al., 2013)
Micellar draw solutions (using cationic and anionic surfactants) have been tested in FO.
The fluxes reported were quite high (4-13 LMH) and the reverse solute transport was 3-
300 times less than that of NaCl under comparable conditions. The surfactants were
easily recovered (up to 99%) using a UF cell, and an attempt was also made to recover
them using Krafft temperature solubility swing phenomenon (i.e. by a temperature
swing). Fluxes between 4-13 LMH were achieved and the micellar solutions were
presented as potential draw solutions for forward osmosis (Gadelha et al., 2011).
However, no attempt was made to develop a continuously circulating and regenerating
FO system, and scale-up remains uncertain.
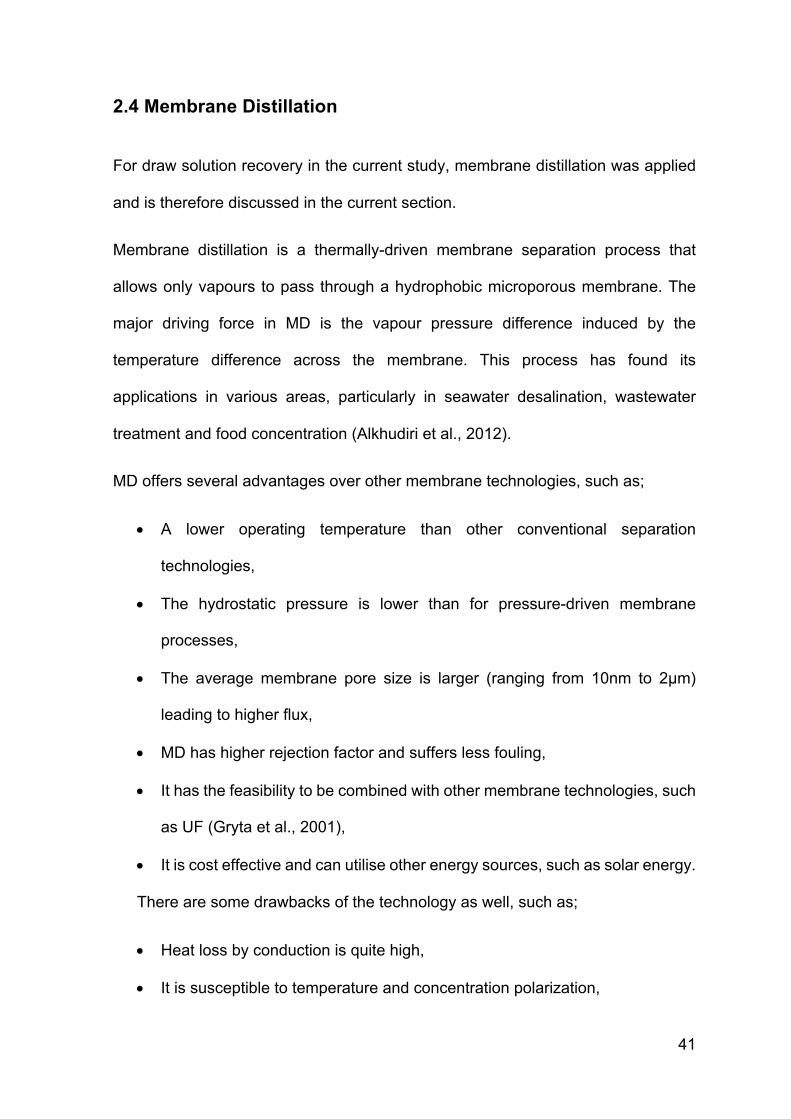
41
2.4 Membrane Distillation
For draw solution recovery in the current study, membrane distillation was applied
and is therefore discussed in the current section.
Membrane distillation is a thermally-driven membrane separation process that
allows only vapours to pass through a hydrophobic microporous membrane. The
major driving force in MD is the vapour pressure difference induced by the
temperature difference across the membrane. This process has found its
applications in various areas, particularly in seawater desalination, wastewater
treatment and food concentration (Alkhudiri et al., 2012).
MD offers several advantages over other membrane technologies, such as;
• A lower operating temperature than other conventional separation
technologies,
• The hydrostatic pressure is lower than for pressure-driven membrane
processes,
• The average membrane pore size is larger (ranging from 10nm to 2µm)
leading to higher flux,
• MD has higher rejection factor and suffers less fouling,
• It has the feasibility to be combined with other membrane technologies, such
as UF (Gryta et al., 2001),
• It is cost effective and can utilise other energy sources, such as solar energy.
There are some drawbacks of the technology as well, such as;
• Heat loss by conduction is quite high,
• It is susceptible to temperature and concentration polarization,
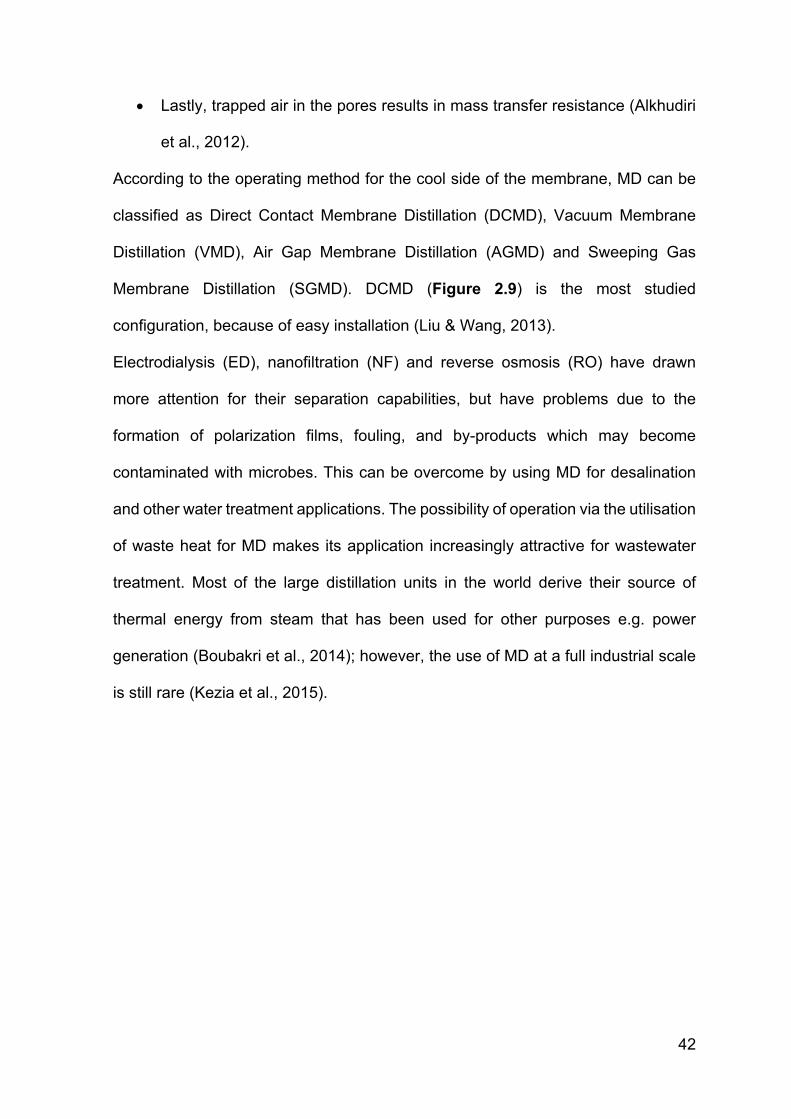
42
• Lastly, trapped air in the pores results in mass transfer resistance (Alkhudiri
et al., 2012).
According to the operating method for the cool side of the membrane, MD can be
classified as Direct Contact Membrane Distillation (DCMD), Vacuum Membrane
Distillation (VMD), Air Gap Membrane Distillation (AGMD) and Sweeping Gas
Membrane Distillation (SGMD). DCMD (Figure 2.9) is the most studied
configuration, because of easy installation (Liu & Wang, 2013).
Electrodialysis (ED), nanofiltration (NF) and reverse osmosis (RO) have drawn
more attention for their separation capabilities, but have problems due to the
formation of polarization films, fouling, and by-products which may become
contaminated with microbes. This can be overcome by using MD for desalination
and other water treatment applications. The possibility of operation via the utilisation
of waste heat for MD makes its application increasingly attractive for wastewater
treatment. Most of the large distillation units in the world derive their source of
thermal energy from steam that has been used for other purposes e.g. power
generation (Boubakri et al., 2014); however, the use of MD at a full industrial scale
is still rare (Kezia et al., 2015).
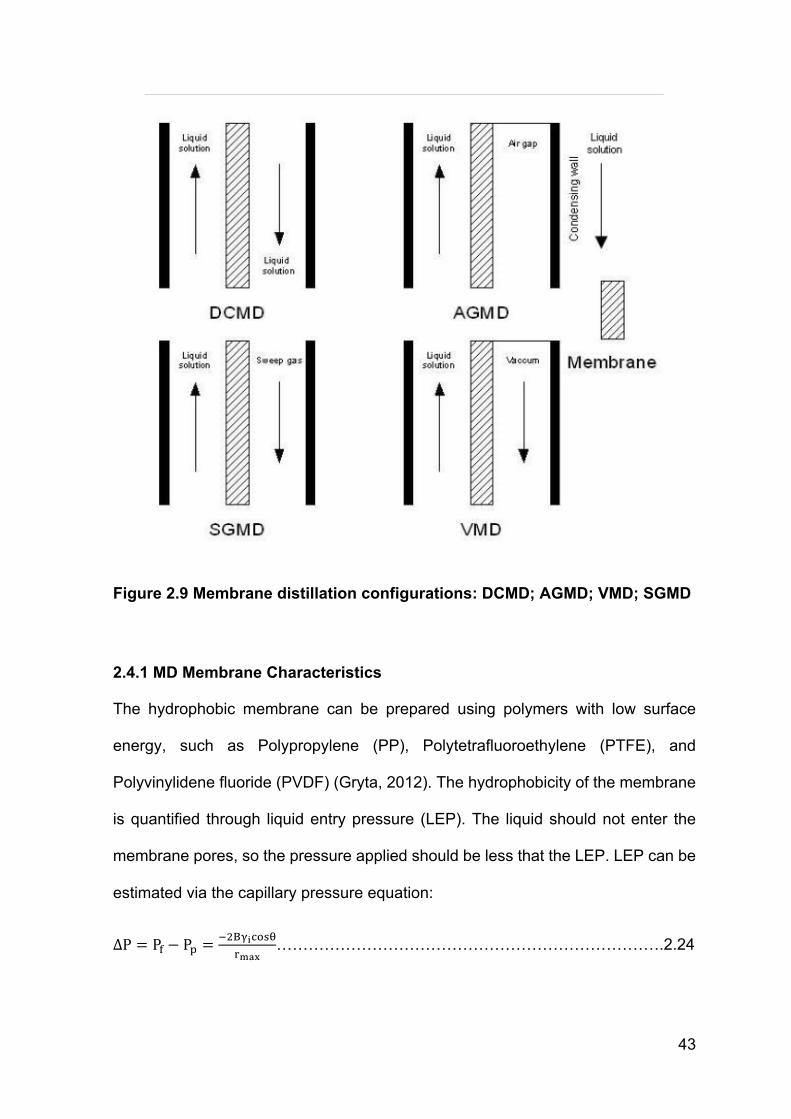
43
Figure 2.9 Membrane distillation configurations: DCMD; AGMD; VMD; SGMD
2.4.1 MD Membrane Characteristics
The hydrophobic membrane can be prepared using polymers with low surface
energy, such as Polypropylene (PP), Polytetrafluoroethylene (PTFE), and
Polyvinylidene fluoride (PVDF) (Gryta, 2012). The hydrophobicity of the membrane
is quantified through liquid entry pressure (LEP). The liquid should not enter the
membrane pores, so the pressure applied should be less that the LEP. LEP can be
estimated via the capillary pressure equation:
∆P = P$ − P& ='()*+,-./
0123……………………………………………………………….2.24
44
Where, Pf and Pp are the hydraulic pressure on the feed and permeate side, B is a
geometric pore coefficient (it is 1 for cylindrical pores), 45 is liquid surface tension,
6 is the contact angle and rmax is the maximum pore size (Franken et al., 1987).
The MD membrane should have low resistance to mass transfer, and low thermal
conductivity to prevent heat loss across the membrane. The membrane should have
good thermal stability against temperature and harsh chemicals. Membrane
thickness, therefore, has an important role in MD. There is an inverse relationship
between membrane thickness and permeate flux (Alkhudiri et al., 2012).
The thermal boundary layers are established because vaporization occurs on the
hot side of the membrane and condensation takes place on the other, cool side of
the membrane. The ratio of the temperature change across the membrane to that
between the bulk liquid and vapour is known as the temperature polarization
coefficient (Schofield et al., 1987); see equation 2.33 below.
Although the tendency for fouling in MD is significantly lower than that in pressure
driven membrane filtration where particles are evident to deposit on membrane
surface, but it can still arise in MD. Fouling in MD depends on the membrane
properties, module geometry, feed solution concentration and the operating
conditions of the setup (Shirazi et al., 2010). Inorganic fouling or scaling, particulate
or colloidal fouling, organic fouling and biological fouling may all take place in MD.
Scaling of the membrane may lead to partial membrane wetting, which then leads
to additional thermal resistance and hydrophobic breakdown, allowing the draw
solution to move through the membrane directly (Gryta, 2005).
45
2.4.2 Applications of Membrane Distillation
MD has found potential applications in (1) clean water production, (2) food
concentration, and (3) heavy metal removal and wastewater treatment. A few such
studies are presented here.
Gunko et al., (2006) concentrated apple juice using DCMD with a PVDF membrane
having a pore size of 0.45 µm. Nearly 50% of solid content was obtained in the
retentate when the permeate flux reached 9 LMH. However, when the concentration
of the juice reached >60% in solid content, productivity was reduced to < 4 LMH (3-
3.8LMH). The study was more focused on studying the membrane properties with
time rather than its long term application in reconcentration. Fouling and
temperature polarization were not presented in detail.
Shirzai et al., (2012) studied desalination using three hydrophobic membranes
available commercially, specifically PP, PVDF, and PTFE in a DCMD configuration.
The results showed that the feed temperature is the most important parameter in
MD. The PTFE membrane showed better performance for fouling and long-term
operation.
Hsu et al., (2012) used NaCl and real seawater as a feed for an MD desalination
process. A PTFE membrane with a pore size of 0.2µm and a thickness of 175 µm
was used in the study. The accumulation rate of scaling was depressed by reducing
polarization when NaCl was used as feed; however, this effect was not very obvious
when seawater was used as feed (Hsu et al., 2012).
Schofield et al., (1990) also studied pure water, NaCl, and sugar as feed with a
PVDF membrane having a pore size of 0.4µm. Concentrations up to 25 and 30%
salt and sucrose solute gave fluxes 60-70% lower than that of pure water feed. The
46
decline in flux for NaCl was due to vapour pressure reduction, while in the case of
sucrose, the decline in flux was attributed to increasing viscosity.
MD has also been recommended for heavy metal removal from wastewater.
Solutions containing Nickel were tested and upto 99% rejection was reported
(Zolotarev et al, 1994). Oil mill wastewater treatment and concentration have also
been investigated with MD. The commercially available membranes
polytetrafluoroethylene (TF200) and polyvinylidene fluoride (GVHP) were used in a
DCMD configuration to test permeate water quality and polyphenols retention. The
membrane TF200 showed a better separation coefficient (99%) after 9 hours of
DCMD operation than the membrane GVHP (89%) (El- Abbasi et al., 2013). In
general, PTFE membranes have been reported to show better flux and rejection in
MD application.
Yu et al., studied the application of DCMD for the treatment of cooling tower
blowdown water (CTB) using a bench scale set up with a PP membrane having a
pore size of 0.1µm. A flux of 30 LMH with nearly 99.95% salt rejection was achieved
at 60ºC. Membrane fouling was found to be the major issue with such complex feed
solutions. Thus, scaling was investigated and it was found that in silica free CTB
water, insoluble calcium carbonate is the major contributor, while in the presence of
silica, calcium carbonate, silica and sulfate precipitated together. This scaling
resulted in a decrease in the performance efficiency by reducing the flux and salt
rejection. Therefore, membrane cleaning was applied to recover the membrane
performance (Yu et al., 2013).
DCMD has also been applied for ammonia removal in wastewater, as the latter is a
common wastewater pollutant that results in eutrophication in water bodies. A PVDF
47
HF membrane with a pore size of 0.22µm was used. Ammonium chloride was added
into distilled water and the pH adjusted. The ammonium stripping was observed.
The permeate had a receiving solution of 0.01 mol/L sulfuric acid. Ammonia removal
of up to 99.5% was achieved within 105 minutes. Feed pH was an important factor
in MD performance up until a pH of 12.2. The increase in feed temperature and
velocity also increase the removal efficiency of the pollutant (Qu et al., 2013).
Thermal cogeneration plants need purified water at various steps, such as boilers,
district heat make-up water systems, and flue gas condensate treatment. A rig was
deployed at Idbäcken Cogeneration Facility (Nyköping, Sweden) with a five-module
MD unit capable of producing 1–2 m3/day of purified water. A district heating supply
line was employed for heating while municipal water was used for cooling;
feedstocks included municipal water and flue gas condensate. The flux of MD was
highly dependent on the feedstock temperature, flow rate and temperature
difference across the membrane. The performance was stable for up to 370 hours
of operation. After 13 days of operation, both scale formation and permeate flow
rate deterioration occurred. However, the clogging was partial and performance was
recovered again very close to the original performance (Kullab & Martin, 2011).
Despite better performance MD also faces issues like fouling, CP and TP. To
understand the fouling better, temperature and concentration polarization is
discussed in the following section.
2.4.3 Heat and Mass Transfer in MD
Heat and mass transfer occur simultaneously in MD operation (Figure 2.10). Heat
is transferred between the bulk feed and the membrane surface via conduction,
while across the membrane heat transfer takes place by conduction and convection
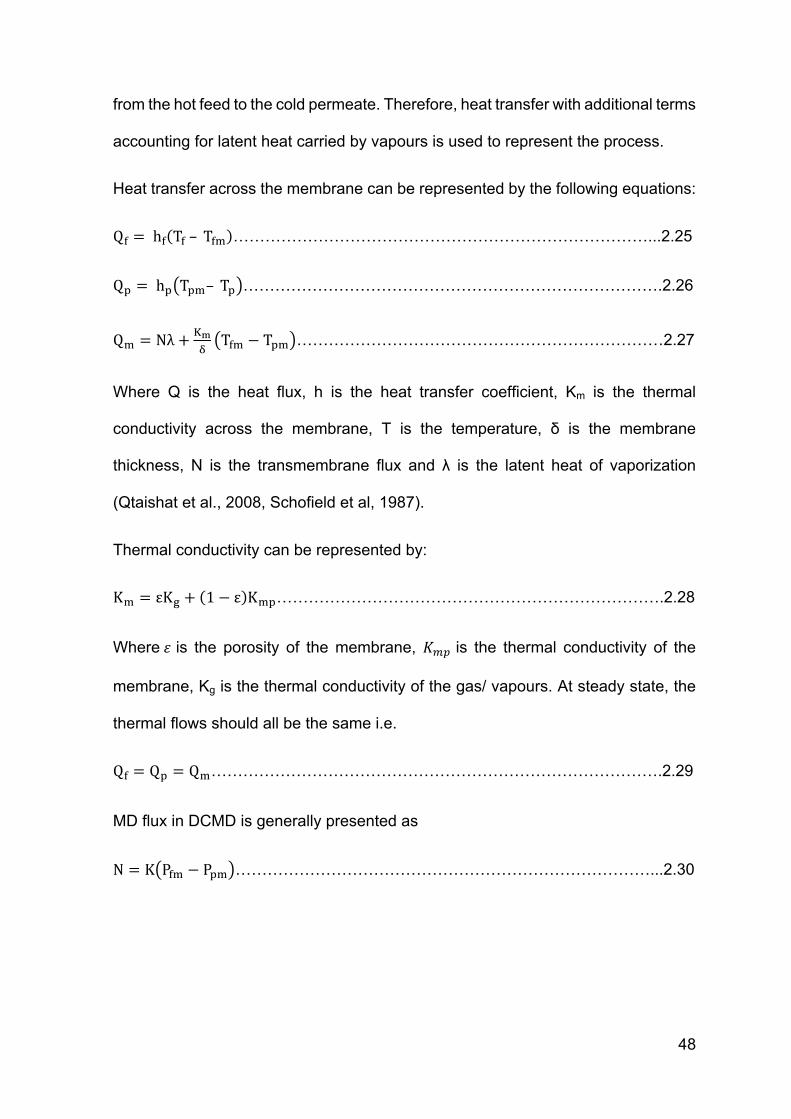
48
from the hot feed to the cold permeate. Therefore, heat transfer with additional terms
accounting for latent heat carried by vapours is used to represent the process.
Heat transfer across the membrane can be represented by the following equations:
Q$ = h$ T$–T$< ……………………………………………………………………...2.25
Q& = h& T&<–T& …………………………………………………………………….2.26
Q< = Nλ + @1A
T$< − T&< ……………………………………………………………2.27
Where Q is the heat flux, h is the heat transfer coefficient, Km is the thermal
conductivity across the membrane, T is the temperature, δ is the membrane
thickness, N is the transmembrane flux and λ is the latent heat of vaporization
(Qtaishat et al., 2008, Schofield et al, 1987).
Thermal conductivity can be represented by:
K< = εKD + 1 − ε K<&……………………………………………………………….2.28
WhereF is the porosity of the membrane, GHI is the thermal conductivity of the
membrane, Kg is the thermal conductivity of the gas/ vapours. At steady state, the
thermal flows should all be the same i.e.
Q$ = Q& = Q<………………………………………………………………………….2.29
MD flux in DCMD is generally presented as
N = K P$< − P&< ……………………………………………………………………...2.30
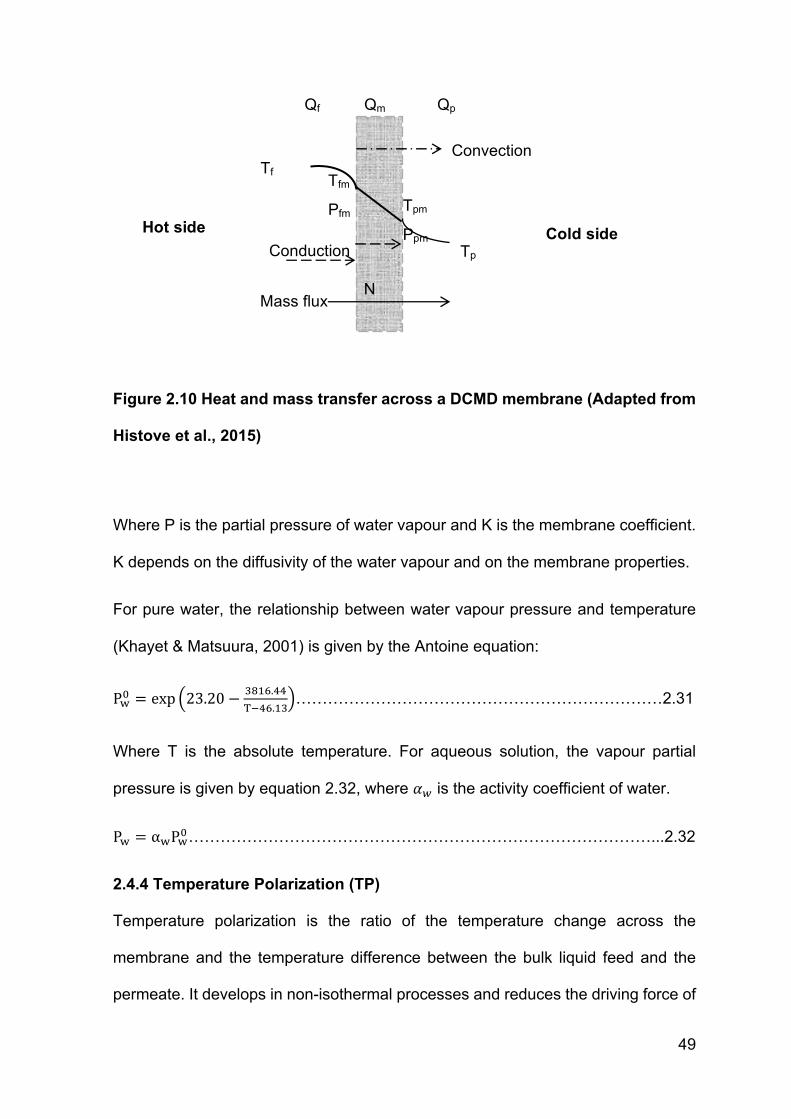
49
Qf Qm Qp
Figure 2.10 Heat and mass transfer across a DCMD membrane (Adapted from
Histove et al., 2015)
Where P is the partial pressure of water vapour and K is the membrane coefficient.
K depends on the diffusivity of the water vapour and on the membrane properties.
For pure water, the relationship between water vapour pressure and temperature
(Khayet & Matsuura, 2001) is given by the Antoine equation:
PJK = exp 23.20 − STUV.WW
X'WV.US……………………………………………………………2.31
Where T is the absolute temperature. For aqueous solution, the vapour partial
pressure is given by equation 2.32, where YZ is the activity coefficient of water.
PJ = αJPJK……………………………………………………………………………...2.32
2.4.4 Temperature Polarization (TP)
Temperature polarization is the ratio of the temperature change across the
membrane and the temperature difference between the bulk liquid feed and the
permeate. It develops in non-isothermal processes and reduces the driving force of
Tf Tfm
Pfm Tpm
Ppm Tp
Hot side Cold side
N Mass flux
Conduction
Convection
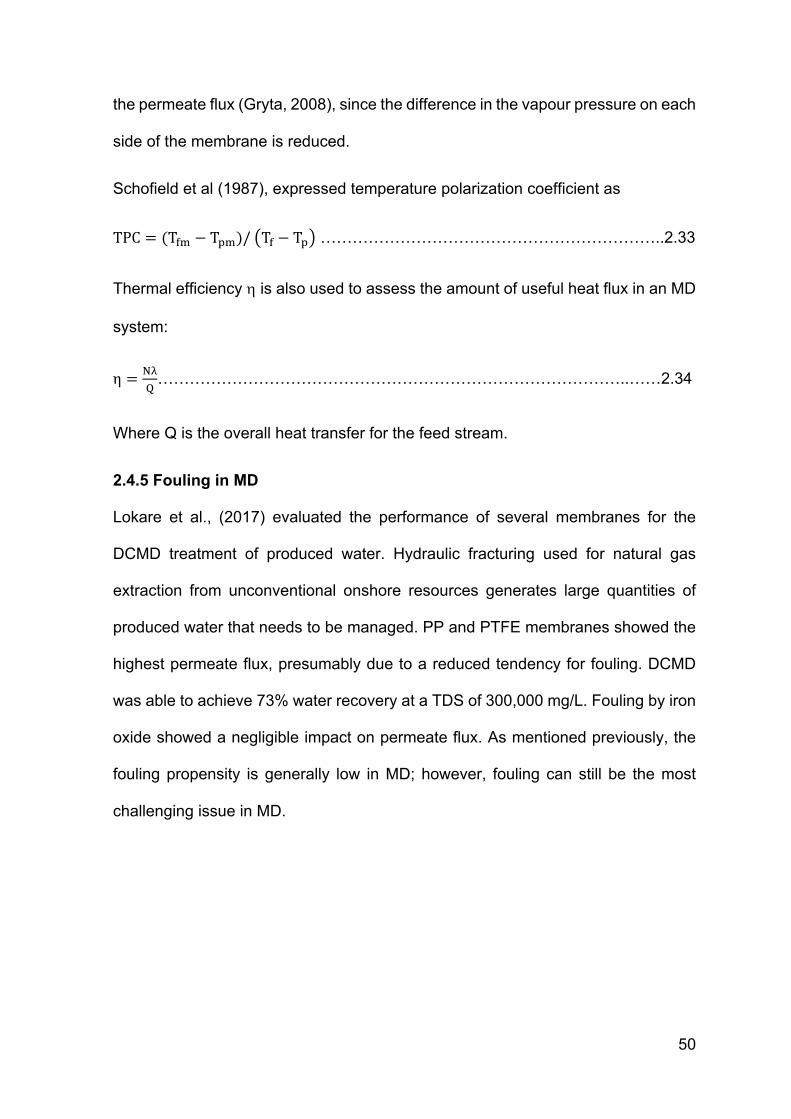
50
the permeate flux (Gryta, 2008), since the difference in the vapour pressure on each
side of the membrane is reduced.
Schofield et al (1987), expressed temperature polarization coefficient as
TPC = (T$< − T&<)/ T$ − T& ………………………………………………………..2.33
Thermal efficiency h is also used to assess the amount of useful heat flux in an MD
system:
η = ab
c……………………………………………………………………………..……2.34
Where Q is the overall heat transfer for the feed stream.
2.4.5 Fouling in MD
Lokare et al., (2017) evaluated the performance of several membranes for the
DCMD treatment of produced water. Hydraulic fracturing used for natural gas
extraction from unconventional onshore resources generates large quantities of
produced water that needs to be managed. PP and PTFE membranes showed the
highest permeate flux, presumably due to a reduced tendency for fouling. DCMD
was able to achieve 73% water recovery at a TDS of 300,000 mg/L. Fouling by iron
oxide showed a negligible impact on permeate flux. As mentioned previously, the
fouling propensity is generally low in MD; however, fouling can still be the most
challenging issue in MD.
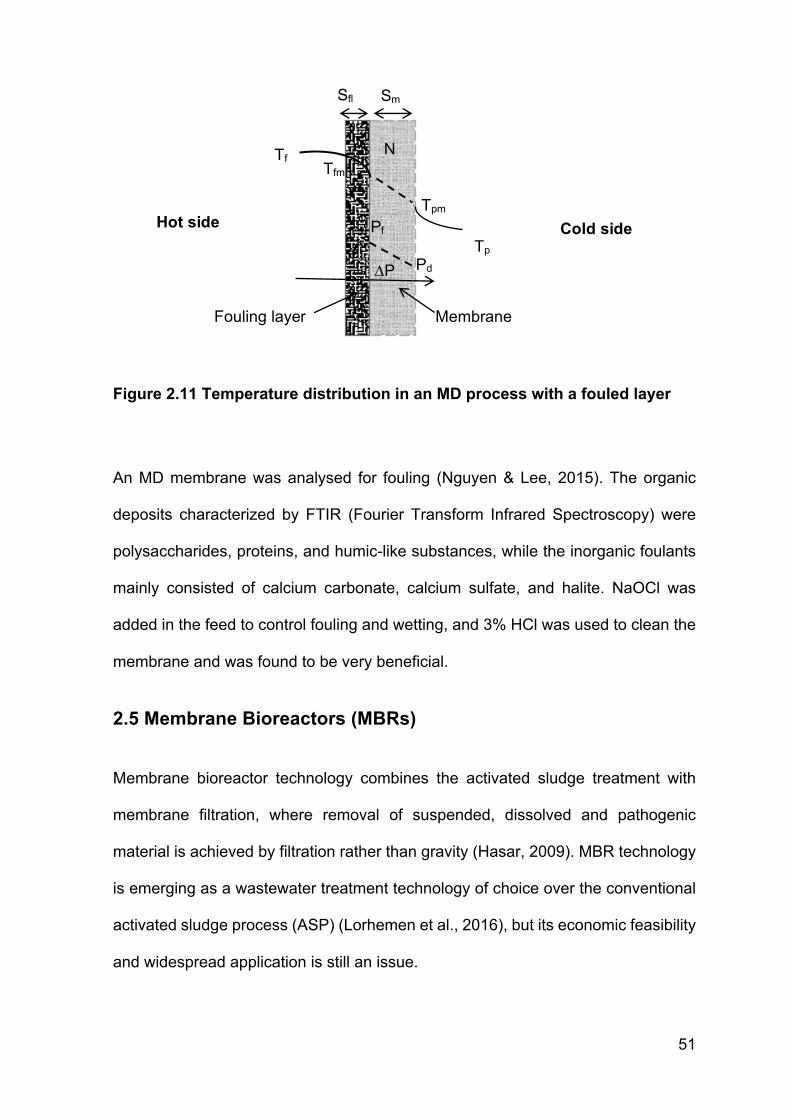
51
Figure 2.11 Temperature distribution in an MD process with a fouled layer
An MD membrane was analysed for fouling (Nguyen & Lee, 2015). The organic
deposits characterized by FTIR (Fourier Transform Infrared Spectroscopy) were
polysaccharides, proteins, and humic-like substances, while the inorganic foulants
mainly consisted of calcium carbonate, calcium sulfate, and halite. NaOCl was
added in the feed to control fouling and wetting, and 3% HCl was used to clean the
membrane and was found to be very beneficial.
2.5 Membrane Bioreactors (MBRs)
Membrane bioreactor technology combines the activated sludge treatment with
membrane filtration, where removal of suspended, dissolved and pathogenic
material is achieved by filtration rather than gravity (Hasar, 2009). MBR technology
is emerging as a wastewater treatment technology of choice over the conventional
activated sludge process (ASP) (Lorhemen et al., 2016), but its economic feasibility
and widespread application is still an issue.
Tpm
Tfm
Tf
Tp
Hot side Cold side
Tfm
Pf
Pd ∆P
Fouling layer Membrane
N
Sfl Sm
52
MBR offers several advantages over conventional wastewater treatment plants
such as;
• MBR can be operated to ensure simultaneous nitrification and denitrification
and phosphorus removal by precipitation (Melin et al., 2006).
• The effluent is of high quality and the use of the membrane eliminates the
need for secondary (to remove pathogens, dissolved and organic matter) and
tertiary treatment (Bhatti et al., 2009) resulting in a smaller footprint.
• Operational conditions are more controlled, as an independent sludge
retention time (SRT) and hydraulic retention time (HRT) can be maintained.
At the same time, a high sludge concentration allows better treatment of
wastewater.
The disadvantages of the MBR include;
• MBR is expensive to install and operate.
• Frequent monitoring and maintenance of the membrane is required.
• Certain limitations are caused by the need for temperature, pressure and pH
values to satisfy membrane tolerances and the sensitivity of membranes to
some chemicals.
• Oxygen transfer may be less efficient because of high MLSS concentration,
and also if there is surplus sludge its treatability is doubtful (Melin et al.,
2006).
• Membrane fouling reduces membrane filtration capacity by reducing filtration
flux (Dias et al., 2003). Microbes responsible for treatment of wastewater are
also responsible for biofouling of the membrane (Wagner and Loy, 2002).
Major microorganisms present in wastewater are bacteria, protozoa, metazoa,
algae and fungi but bacteria make up most (95%) of all the wastewater
53
microorganisms in activated sludge, and have an important role in wastewater
treatment (Gerardi, 2006).
Nutrient removal is done through two major processes:
• Fixed film processes
• Suspended growth processes
The fixed film processes are based on the ability of microorganisms to grow on
surfaces because of the availability of food, and their protection from high velocity
currents and other environmental conditions. Physical forces such as adhesion and
adsorption are responsible for attachment.
As the adsorbed microorganisms grow and reproduce, extracellular polymeric
substances (EPS) is produced and a gel matrix layer is formed on the surface; this
film is known as biofilm. Removal of wastewater nutrients in fixed film processes is
only attained when the wastewater is brought into contact with the biofilm.
Simultaneous nitrification and denitrification (SND) occurs within flocs or inner
zones of the biofilm that allows heterotrophic denitrifiers to produce nitrogen gas
(Yang et al., 2009).
In suspended growth, the bacterial flocs are in continuous contact with wastewater.
Bacteria, protozoa and metazoa dominate suspended growth processes (Curtis,
2003). Most of the bacteria are Gram negative heterotrophic and rod shaped in
aerobic conditions, including Pseudomonas, Chromobacter, Achromobacter,
Alcaligenes and Flavobacterium. Coliforms are said to enter wastewater from the
influent and are not considered indigenous. Nitrifying bacteria as well as filamentous
bacteria (Beggiatoa, Thiothrix and Sphaerotilus) are also present in wastewater and
form biofilms.
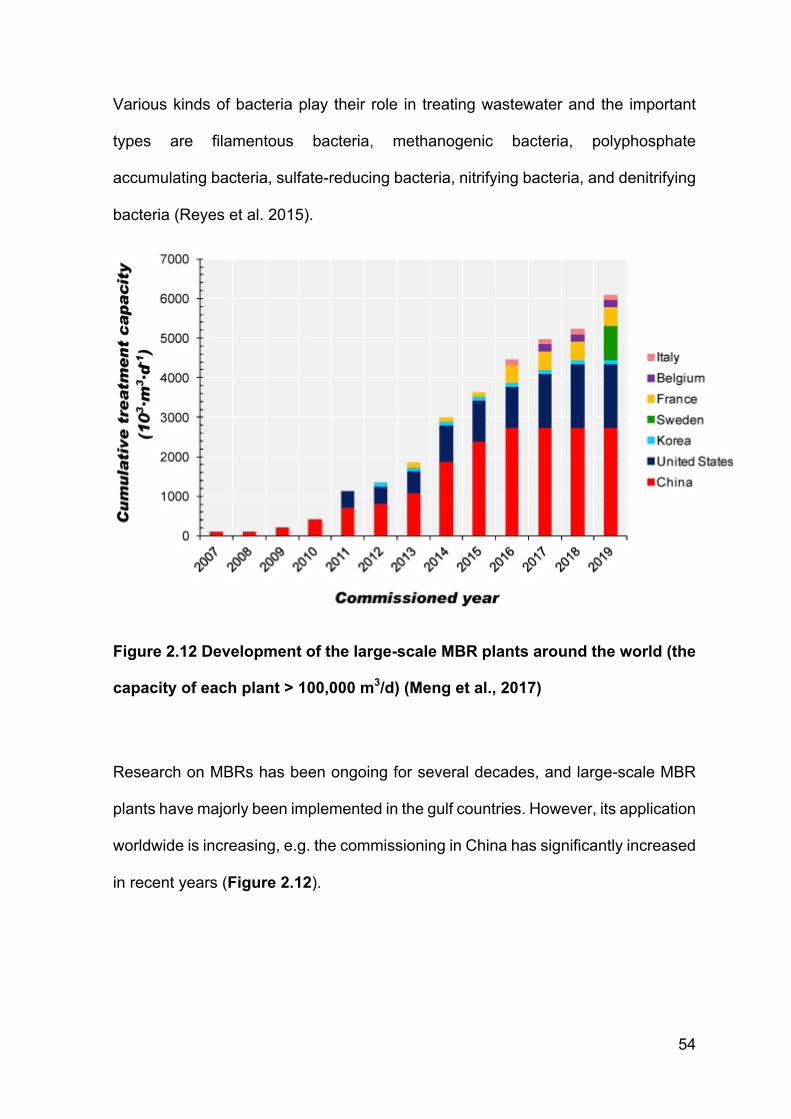
54
Various kinds of bacteria play their role in treating wastewater and the important
types are filamentous bacteria, methanogenic bacteria, polyphosphate
accumulating bacteria, sulfate-reducing bacteria, nitrifying bacteria, and denitrifying
bacteria (Reyes et al. 2015).
Figure 2.12 Development of the large-scale MBR plants around the world (the
capacity of each plant > 100,000 m3/d) (Meng et al., 2017)
Research on MBRs has been ongoing for several decades, and large-scale MBR
plants have majorly been implemented in the gulf countries. However, its application
worldwide is increasing, e.g. the commissioning in China has significantly increased
in recent years (Figure 2.12).
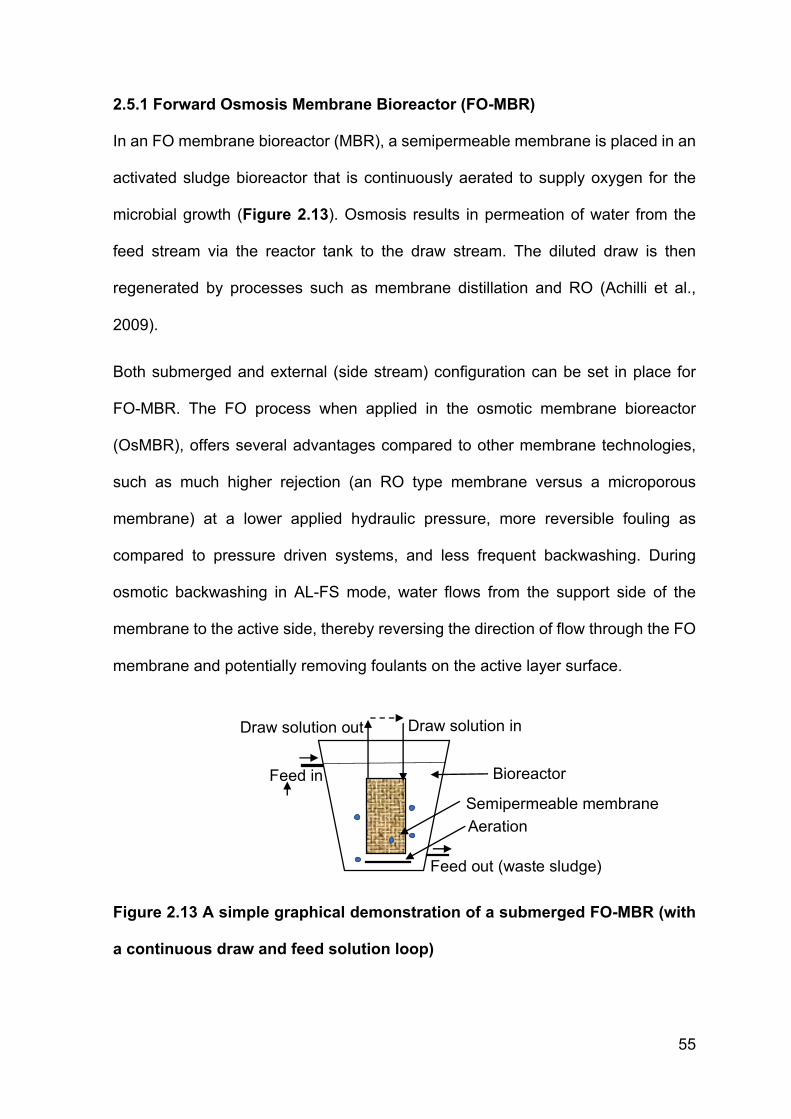
55
2.5.1 Forward Osmosis Membrane Bioreactor (FO-MBR)
In an FO membrane bioreactor (MBR), a semipermeable membrane is placed in an
activated sludge bioreactor that is continuously aerated to supply oxygen for the
microbial growth (Figure 2.13). Osmosis results in permeation of water from the
feed stream via the reactor tank to the draw stream. The diluted draw is then
regenerated by processes such as membrane distillation and RO (Achilli et al.,
2009).
Both submerged and external (side stream) configuration can be set in place for
FO-MBR. The FO process when applied in the osmotic membrane bioreactor
(OsMBR), offers several advantages compared to other membrane technologies,
such as much higher rejection (an RO type membrane versus a microporous
membrane) at a lower applied hydraulic pressure, more reversible fouling as
compared to pressure driven systems, and less frequent backwashing. During
osmotic backwashing in AL-FS mode, water flows from the support side of the
membrane to the active side, thereby reversing the direction of flow through the FO
membrane and potentially removing foulants on the active layer surface.
Figure 2.13 A simple graphical demonstration of a submerged FO-MBR (with
a continuous draw and feed solution loop)
Draw solution out
Feed in
Feed out (waste sludge)
Draw solution in
Bioreactor
Aeration Semipermeable membrane
56
One major technical limitation of the FO-MBR is the salinity build-up occurring in the
submerged OMBR tank; this is due to accumulation behind the membrane of salts
from the influent, as well as reverse solute transport. This build-up affects the
biodegradation efficiency due to the finite salinity tolerance of the organisms present
in the reactor tank Optimising draw solutions, the selection of membranes, and
operation at lower sludge retention time were all recommended to improve the
performance of the FO-MBR (Wang et al., 2016). Although a continuous
regeneration system in place can reduce the salinity build-up in the feed, extended
membrane filtration units and independent operation of the FO-MBR can still face
operational issues including fouling, power cost etc (Blandin et al., 2018).
A study (Blandin et al., 2018) aimed at retrofitting an existing MBR into an FO-MBR
to minimise cost and salinity and to improve water quality was conducted. A flux of
over 10 LMH was achieved. The study proved the possibility to (partly or fully)
transform existing MBR facilities while improving existing performances obtained by
other OMBR designs /configurations /membranes in the literature. Comparison
between MBR and FO-MBR revealed that the low fouling propensity and low energy
consumption claims are somewhat contradictory for FO-MBR. A high water flux and
permeate quality can certainly be of interest in water reuse but technical and
economic assessments are still needed to support application of the FO-MBR
Another recent study compared submerged and sidestream FO membrane module
configurations (under similar conditions) in the FO-MBR (Morrow et al., 2018). The
initial water flux and water flux after fouling versus time was the same for submerged
and sidestream configurations. The steady-state water flux of fouled membranes
was the same for submerged and sidestream configurations using two specific draw
solution concentrations, leading to the concept of a homeostatic flux in FO-MBRs
57
similar to the critical flux in conventional membrane bioreactors. Thinner cake layers
were formed in the sidestream configuration where fouling is mitigated with
hydraulic crossflow as compared to the submerged configuration where fouling is
mitigated via air scouring. Hydraulic pressure from recirculation pumping on the
feed side of the sidestream configuration may have also resulted in a more compact
cake layer over time. Note that the submerged configuration uses additional
aeration for air scouring while in sidestream configuration additional pumping is
needed for recirculation. A higher draw solution concentration increased fouling and
scaling. All of these factors need to be taken into consideration for FO-MBR
application
An FO-MBR with 1M NaCl as draw solution to treat wastewater showed 96%, 43%
and 100% removal of PO43−-P, NH4
+-N, and total organic carbon. As reported in
previous studies, an increase in salinity was observed in the feed tank due to
reverse solute transport. Water flux was reduced with increasing salinity, with
membrane fouling occurring at elevated salinity levels on the feed side. At 7-day
intervals, 2.5 L of supernatant was withdrawn from the FOMBR for phosphorus
recovery as magnesium phosphate and sodium hydrogen phosphite hydrate. The
FOMBR enriched phosphate ions by six times, reducing the costs of chemical use
for pH adjustment (Hunang et al., 2015).
A number of studies showing the removal efficiency of FO-MBRs is presented in
Table 2.4, while FOMBRs are described in more detail in Table 2.5. It can be
observed from Table 2.4 that greater removal efficiencies are achieved with FO-
MBRs.
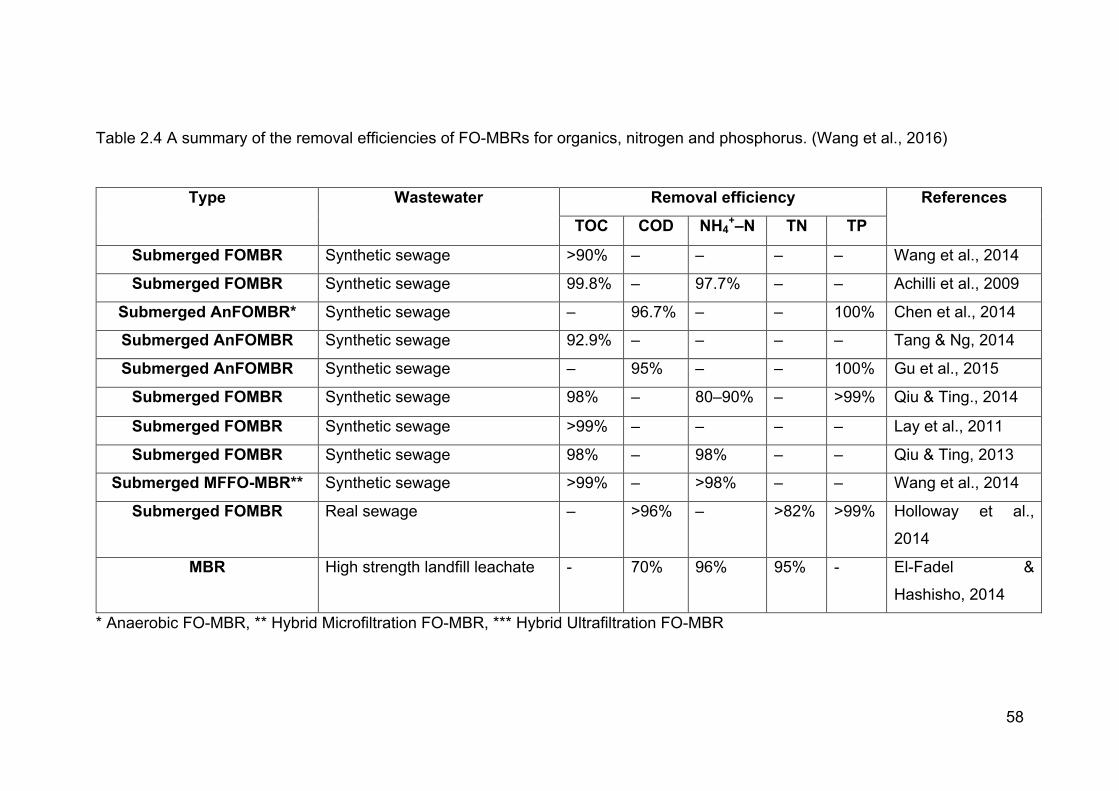
58
Table 2.4 A summary of the removal efficiencies of FO-MBRs for organics, nitrogen and phosphorus. (Wang et al., 2016)
Type Wastewater Removal efficiency References
TOC COD NH4+–N TN TP
Submerged FOMBR Synthetic sewage >90% – – – – Wang et al., 2014
Submerged FOMBR Synthetic sewage 99.8% – 97.7% – – Achilli et al., 2009
Submerged AnFOMBR* Synthetic sewage – 96.7% – – 100% Chen et al., 2014
Submerged AnFOMBR Synthetic sewage 92.9% – – – – Tang & Ng, 2014
Submerged AnFOMBR Synthetic sewage – 95% – – 100% Gu et al., 2015
Submerged FOMBR Synthetic sewage 98% – 80–90% – >99% Qiu & Ting., 2014
Submerged FOMBR Synthetic sewage >99% – – – – Lay et al., 2011
Submerged FOMBR Synthetic sewage 98% – 98% – – Qiu & Ting, 2013
Submerged MFFO-MBR** Synthetic sewage >99% – >98% – – Wang et al., 2014
Submerged FOMBR Real sewage – >96% – >82% >99% Holloway et al.,
2014
MBR High strength landfill leachate - 70% 96% 95% - El-Fadel &
Hashisho, 2014
* Anaerobic FO-MBR, ** Hybrid Microfiltration FO-MBR, *** Hybrid Ultrafiltration FO-MBR
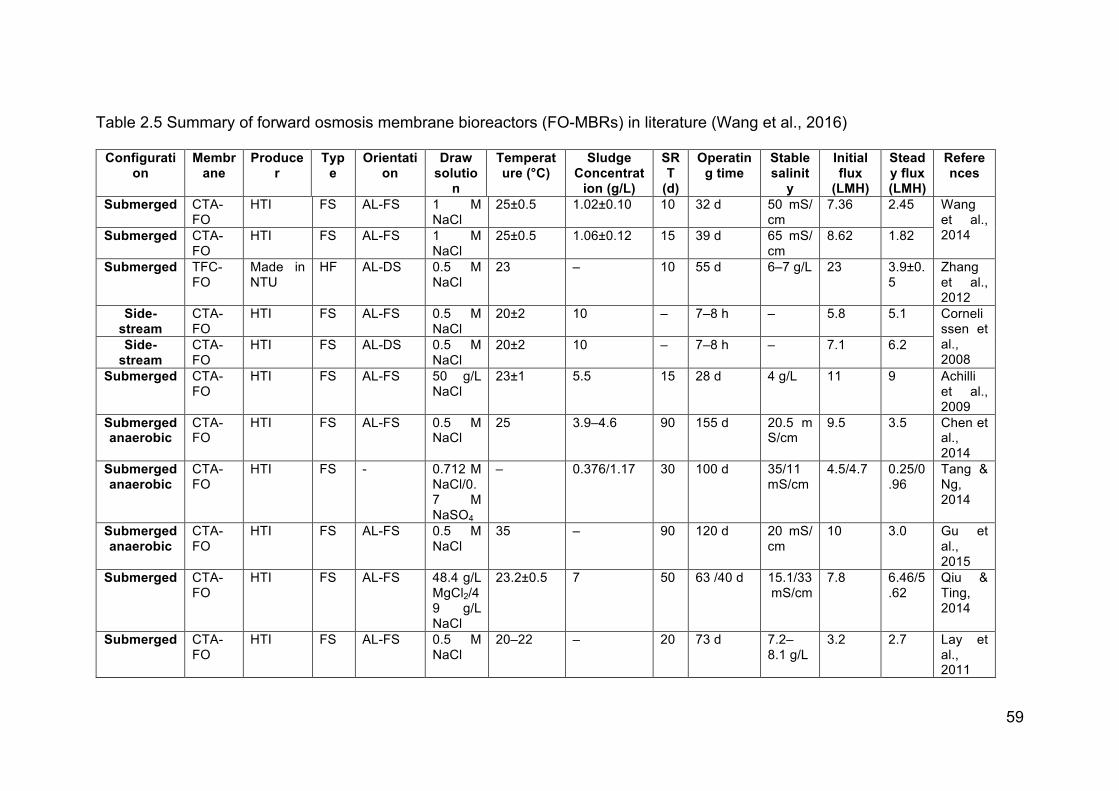
59
Table 2.5 Summary of forward osmosis membrane bioreactors (FO-MBRs) in literature (Wang et al., 2016)
Configurati
on
Membr
ane
Produce
r
Typ
e
Orientati
on
Draw
solutio
n
Temperat
ure (°C)
Sludge
Concentrat
ion (g/L)
SR
T
(d)
Operatin
g time
Stable
salinit
y
Initial
flux
(LMH)
Stead
y flux
(LMH)
Refere
nces
Submerged CTA-FO
HTI FS AL-FS 1 M NaCl
25±0.5 1.02±0.10 10 32 d 50 mS/cm
7.36 2.45 Wang et al., 2014 Submerged CTA-
FO HTI FS AL-FS 1 M
NaCl 25±0.5 1.06±0.12 15 39 d 65 mS/
cm 8.62 1.82
Submerged TFC-FO
Made in NTU
HF AL-DS 0.5 M NaCl
23 – 10 55 d 6–7 g/L 23 3.9±0.5
Zhang et al., 2012
Side-
stream
CTA-FO
HTI FS AL-FS 0.5 M NaCl
20±2 10 – 7–8 h – 5.8 5.1 Cornelissen et al., 2008
Side-
stream
CTA-FO
HTI FS AL-DS 0.5 M NaCl
20±2 10 – 7–8 h – 7.1 6.2
Submerged CTA-FO
HTI FS AL-FS 50 g/L NaCl
23±1 5.5 15 28 d 4 g/L 11 9 Achilli et al., 2009
Submerged
anaerobic
CTA-FO
HTI FS AL-FS 0.5 M NaCl
25 3.9–4.6 90 155 d 20.5 mS/cm
9.5 3.5 Chen et al., 2014
Submerged
anaerobic
CTA-FO
HTI FS - 0.712 M NaCl/0.7 M NaSO4
– 0.376/1.17 30 100 d 35/11 mS/cm
4.5/4.7 0.25/0.96
Tang & Ng, 2014
Submerged
anaerobic
CTA-FO
HTI FS AL-FS 0.5 M NaCl
35 – 90 120 d 20 mS/cm
10 3.0 Gu et al., 2015
Submerged CTA-FO
HTI FS AL-FS 48.4 g/L MgCl2/49 g/L NaCl
23.2±0.5 7 50 63 /40 d 15.1/33 mS/cm
7.8 6.46/5.62
Qiu & Ting, 2014
Submerged CTA-FO
HTI FS AL-FS 0.5 M NaCl
20–22 – 20 73 d 7.2–8.1 g/L
3.2 2.7 Lay et al., 2011
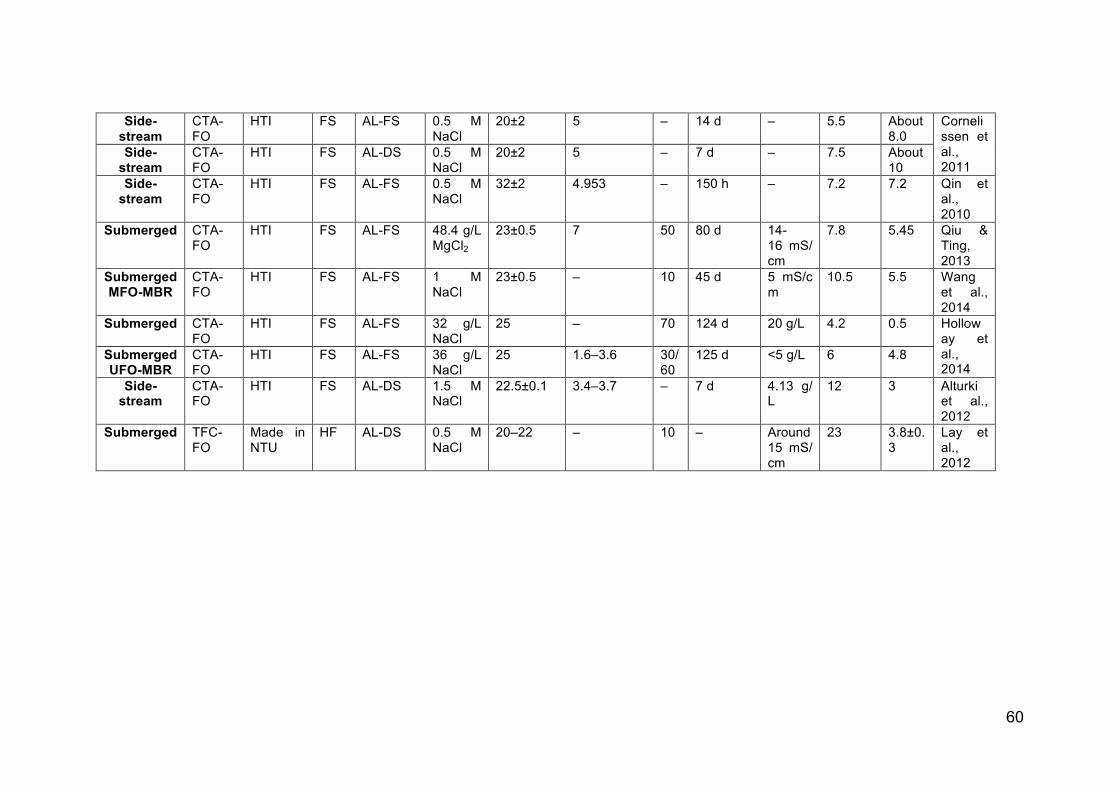
60
Side-
stream
CTA-FO
HTI FS AL-FS 0.5 M NaCl
20±2 5 – 14 d – 5.5 About 8.0
Cornelissen et al., 2011
Side-
stream
CTA-FO
HTI FS AL-DS 0.5 M NaCl
20±2 5 – 7 d – 7.5 About 10
Side-
stream
CTA-FO
HTI FS AL-FS 0.5 M NaCl
32±2 4.953 – 150 h – 7.2 7.2 Qin et al., 2010
Submerged CTA-FO
HTI FS AL-FS 48.4 g/L MgCl2
23±0.5 7 50 80 d 14-16 mS/cm
7.8 5.45 Qiu & Ting, 2013
Submerged
MFO-MBR
CTA-FO
HTI FS AL-FS 1 M NaCl
23±0.5 – 10 45 d 5 mS/cm
10.5 5.5 Wang et al., 2014
Submerged CTA-FO
HTI FS AL-FS 32 g/L NaCl
25 – 70 124 d 20 g/L 4.2 0.5 Holloway et al., 2014
Submerged
UFO-MBR
CTA-FO
HTI FS AL-FS 36 g/L NaCl
25 1.6–3.6 30/60
125 d <5 g/L 6 4.8
Side-
stream
CTA-FO
HTI FS AL-DS 1.5 M NaCl
22.5±0.1 3.4–3.7 – 7 d 4.13 g/L
12 3 Alturki et al., 2012
Submerged TFC-FO
Made in NTU
HF AL-DS 0.5 M NaCl
20–22 – 10 – Around 15 mS/cm
23 3.8±0.3
Lay et al., 2012
61
2.6 The FO-MD hybrid
Water and wastewater reclamation using FO involves two steps; dilution of the draw
solution during the osmotic flow from feed to draw, followed by water reclamation
from the diluted draw solution. The recovery method is principally determined by the
nature of the selected draw solute. As described in section 2.2, polymer based
hydrogels and NH4CO3 have been recovered using moderate low-grade heat,
because of their ability to change phase with temperature (Li et al., 2011; McGinnins
et al., 2002). Magnetic nanoparticles have been recovered by application of a
magnetic field because of their magnetic properties (Ge et al., 2011) and by UF
because of their larger physical/molecular sizes (Ling & Chung, 2011). 2-
methylmidazole based draw was recovered using an FO-MD hybrid based on
thermal stability, and divalent inorganic solutes (Na2SO4) have been reported to be
recovered by FO-NF because of lower molecular weight (Zhao et al., 2012a).
FO-MD is a membrane-based hybrid technology, consisting of FO and MD units
where FO draws clean water from a feed such as wastewater and MD re-
concentrates the diluted draw solution (Figure 2.14). This integration provides high
product water quality (the membrane only allows water vapours to pass through),
low fouling tendency (because of the membrane being hydrophobic) and the
potential utilization of low-grade, industrial waste heat due to the potential for vapour
formation at lower temperatures (Ge et al., 2012). Although the FO-MD hybrid has
been studied for the concentration of protein solutions (Wang et al., 2007), olive mill
wastewater treatment (El-Abbasi et al., 2013), dye wastewater treatment and sewer
mining wastewater (Xie et al., 2013), detailed studies on the use of FO-MD for
municipal wastewater treatment using novel draw solutions (as opposed to more
62
conventional ones, such as inorganic salts) is rather scarce. The FO-MD hybrid can
be an option for water reclamation compared to pressure intensive membrane
filtration systems, as it has demonstrated higher and more stable flux and resulted
in a high-quality product water (El-Abbasi et al., 2013; Xie et al., 2013). A summary
is given for all studies performed previously in Table 2.6.
Advantage of the hybrid systems is that they provide a double barrier to the feed (in
terms of contaminants, microorganisms etc) and therefore ensure high quality
product water. Particular recovery systems such as magnetic fields and heat are
very specific to suitable draw solutes. However, although MD is less likely to foul,
fouling can still be an important issue in MD application. For its longer-term
application, coupling it with processes like FO is recommended, as FO pre-treats
the feed and allows the MD to operate at lower temperature without organic and
inorganic scaling. Such a process allows the DS to be recovered and reused
continually, and is an ideal hybrid system for advanced wastewater treatment (Xie
et al., 2013). Thus, the low fouling and low energy requirement tendency in FO can
be easily combined with high quality permeate production in MD (Wang et al., 2011).
On the other hand, the term ‘low energy consumption’, long associated with FO
systems, is only valid when the regeneration systems are not required or applied.
The challenge now facing FO is that the use of FO hybrid systems to allow the
regeneration increases the capital cost as well as the energy demand of the overall
system (Chekli et al., 2016).
Wu et al., studied rejection of Hg, Cd, and Pb and the effect of coexisting metals on
Hg removal through Forward Osmosis (FO) and Membrane Distillation (MD (Wu et
al., 2017). More than 97% rejection for each metal was achieved through the FO
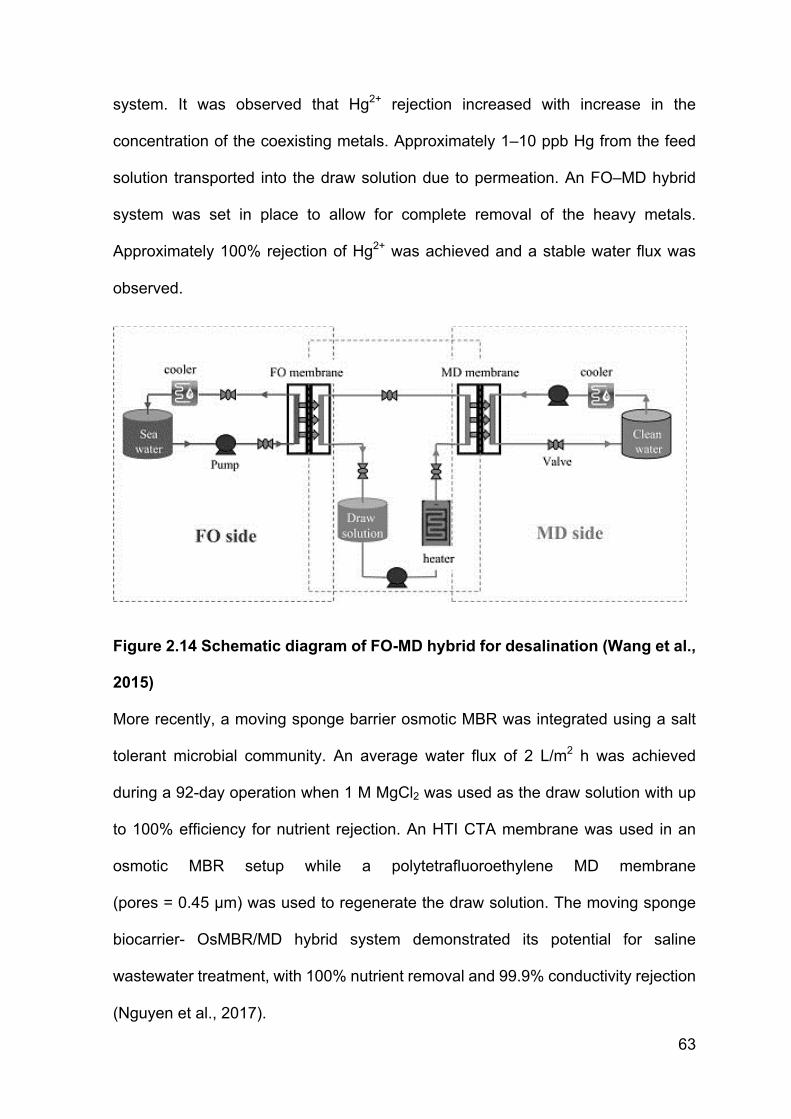
63
system. It was observed that Hg2+ rejection increased with increase in the
concentration of the coexisting metals. Approximately 1–10 ppb Hg from the feed
solution transported into the draw solution due to permeation. An FO–MD hybrid
system was set in place to allow for complete removal of the heavy metals.
Approximately 100% rejection of Hg2+ was achieved and a stable water flux was
observed.
Figure 2.14 Schematic diagram of FO-MD hybrid for desalination (Wang et al.,
2015)
More recently, a moving sponge barrier osmotic MBR was integrated using a salt
tolerant microbial community. An average water flux of 2 L/m2 h was achieved
during a 92-day operation when 1 M MgCl2 was used as the draw solution with up
to 100% efficiency for nutrient rejection. An HTI CTA membrane was used in an
osmotic MBR setup while a polytetrafluoroethylene MD membrane
(pores = 0.45 μm) was used to regenerate the draw solution. The moving sponge
biocarrier- OsMBR/MD hybrid system demonstrated its potential for saline
wastewater treatment, with 100% nutrient removal and 99.9% conductivity rejection
(Nguyen et al., 2017).
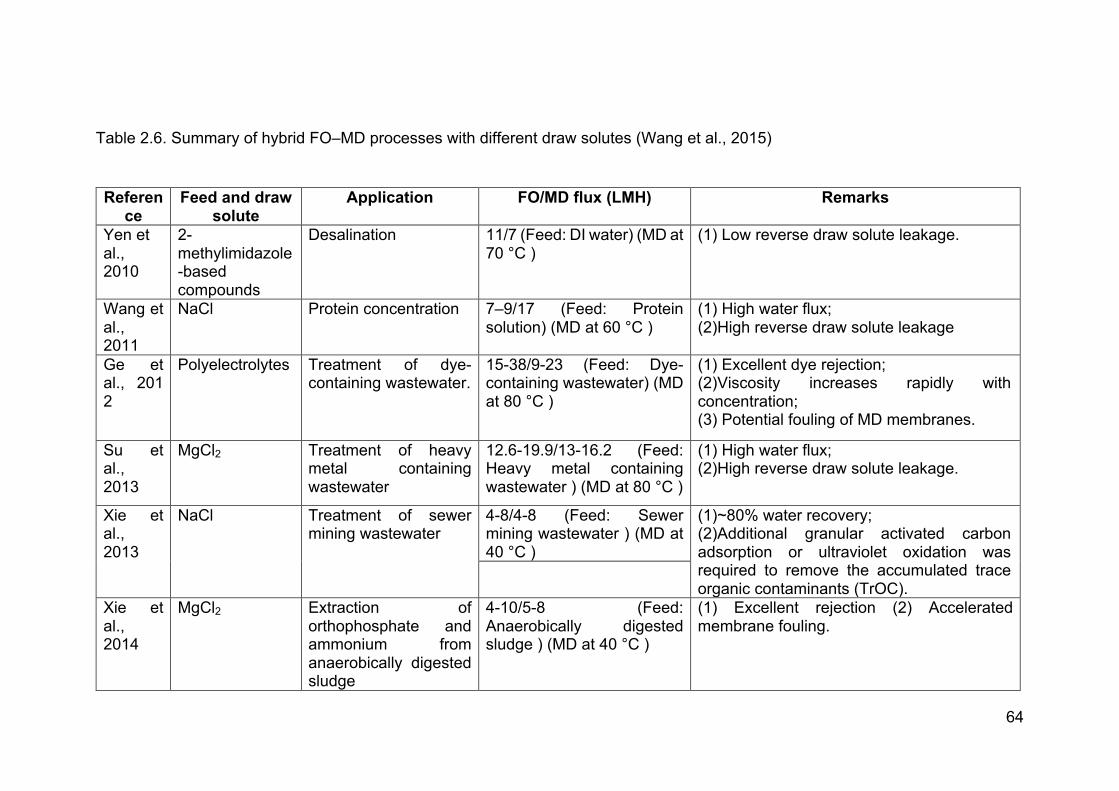
64
Table 2.6. Summary of hybrid FO–MD processes with different draw solutes (Wang et al., 2015)
Referen
ce Feed and draw
solute Application FO/MD flux (LMH) Remarks
Yen et al., 2010
2-methylimidazole-based compounds
Desalination 11/7 (Feed: DI water) (MD at 70 °C )
(1) Low reverse draw solute leakage.
Wang et al., 2011
NaCl Protein concentration 7–9/17 (Feed: Protein solution) (MD at 60 °C )
(1) High water flux; (2)High reverse draw solute leakage
Ge et al., 2012
Polyelectrolytes Treatment of dye-containing wastewater.
15-38/9-23 (Feed: Dye-containing wastewater) (MD at 80 °C )
(1) Excellent dye rejection; (2)Viscosity increases rapidly with concentration; (3) Potential fouling of MD membranes.
Su et al., 2013
MgCl2 Treatment of heavy metal containing wastewater
12.6-19.9/13-16.2 (Feed: Heavy metal containing wastewater ) (MD at 80 °C )
(1) High water flux; (2)High reverse draw solute leakage.
Xie et al., 2013
NaCl Treatment of sewer mining wastewater
4-8/4-8 (Feed: Sewer mining wastewater ) (MD at 40 °C )
(1)~80% water recovery; (2)Additional granular activated carbon adsorption or ultraviolet oxidation was required to remove the accumulated trace organic contaminants (TrOC).
Xie et al., 2014
MgCl2 Extraction of orthophosphate and ammonium from anaerobically digested sludge
4-10/5-8 (Feed: Anaerobically digested sludge ) (MD at 40 °C )
(1) Excellent rejection (2) Accelerated membrane fouling.
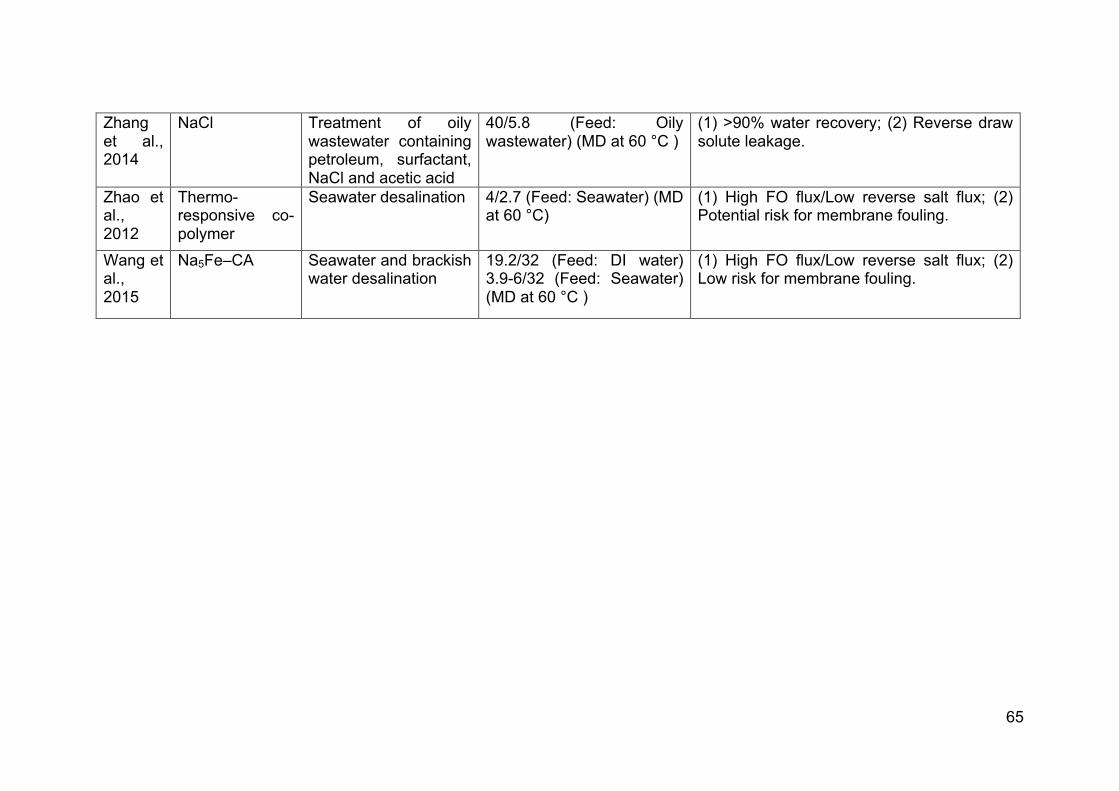
65
Zhang et al., 2014
NaCl Treatment of oily wastewater containing petroleum, surfactant, NaCl and acetic acid
40/5.8 (Feed: Oily wastewater) (MD at 60 °C )
(1) >90% water recovery; (2) Reverse draw solute leakage.
Zhao et al., 2012
Thermo-responsive co-polymer
Seawater desalination 4/2.7 (Feed: Seawater) (MD at 60 °C)
(1) High FO flux/Low reverse salt flux; (2) Potential risk for membrane fouling.
Wang et al., 2015
Na5Fe–CA Seawater and brackish water desalination
19.2/32 (Feed: DI water) 3.9-6/32 (Feed: Seawater) (MD at 60 °C )
(1) High FO flux/Low reverse salt flux; (2) Low risk for membrane fouling.
66
2.7 Conclusions • As mentioned in the introduction and from the discussion on draw solutions it
can be observed that FO, FO-MBR and FO-MD hybrid systems mostly use
NaCl or MgCl2 as the draw solution and DI water as a feed to achieve higher
flux. Although a range of novel draw solutions have been tested (section 2.2)
for FO their use has not continued in further studies. There is therefore a need
for study that compares such simple draw solutions with novel draw solutions
especially in FO-MBR and FO hybrid configurations.
• Similarly, the membranes that have been tested have also focused on NaCl or
MgCl2 as a draw solution. There is a need for the research on FO membranes
and FO draw solutions to be combined, especially for large-scale application of
the systems.
• Some studies on FO-MBR have focused on RST and salinity build-up with time
but toxicity studies of the draw solutes over a longer period of time have not
been studied.
• Although the FO-MD hybrid has been studied for olive mill wastewater
treatment (El-Abbasi et al., 2013), dye wastewater treatment (Ge et al., 2012)
and sewer mining wastewater (Xie et al., 2013), detailed studies on the use of
FO-MD for municipal wastewater treatment using novel draw solutions is rather
scarce and in this thesis, we have tried to evaluate this area of wastewater
treatment.
This gap in research in FO aligns with the research objectives of the current study and
will be addressed in chapters to follow.
67
Chapter 3
Comparative performance of a Nano filtration (NF) membrane and a
traditional FO membrane for use in a Lab Scale Forward Osmosis
Membrane Bioreactor (FO-MBR)
3.1 Introduction
The overall aim of this thesis was to perform an engineering-oriented study to examine
the component parts and integrated operation of a continuous and feasible FOMBR-
MD system for the treatment and recycle of wastewater. Developing an appropriate
combination of membrane and draw solution was a key task, and the research
question addressed by this chapter was to ask whether the use of a higher pore- size
Nano-filtration (NF) membrane in combination with high molecular weight novel draw
solutions for forward osmosis could improve the overall performance of FO-MBR
systems; this would be achieved by improving flux without causing excessive reverse
solute transport nor toxicity to the feed bacterial consortium.
A single layer nanofiltration membrane was used in this study alongside the HTI FO
membrane. Draw solutions were evaluated to test the above hypothesis; relatively
higher fluxes will be observed for NF membranes, while potentially higher reverse
solute transport might be circumvented by the use of higher molecular weight draw
solutions. Inorganic draw solutes (NaCl, Na3PO4), Surfactants (TEAB, SDS), and
Polyelectrolytes (PDAC, PEGBE) were tested as draw solutes. Fluxes, microbial
toxicity and viscosity were observed for the draw solutions.
68
The basis for this study was to compare the commercially available HTI membrane
with a single layer NF membrane for performance (provided by Chuyang Tang,
University of Hong Kong), using different molecular size draw solutes and using a
biologically active feed. A single layer NF membrane was explored because the
conventional RO style FO membranes have very small pore size and a very thick
support layer, both of which can contribute to a decline in FO Flux. Thus, the ultimate
objective of the current study was to investigate whether the single layer NF
membrane can potentially outperform or even replace the commercial double layer FO
membranes.
3.2 Methodology
3.2.1 Establishment of FO-MBR
Bench-scale Forward Osmosis Setup
The forward osmosis bench scale setup consisted mainly of a flat sheet membrane
module fitted into an acrylic membrane cell (Figure 3.1). The cells were fabricated
with symmetrical flow channels on both sides of the membrane and sealed with a nitrile
rubber gasket. Spacers were placed on each side of the membrane, as it disrupts the
concentration boundary layer and increases the permeation rate (Yun et al., 2011).
The membrane had an effective surface area of 47.25cm2. Water flux was calculated
using equation 3.1:
J=∆"
#∆$………………………………………………………………………………….....…3.1
Where J (LMH) is the permeate flux, ∆m is the increase in volume of permeate water
(L); A is the effective surface area of the membrane (m2); ∆t is the time (h).
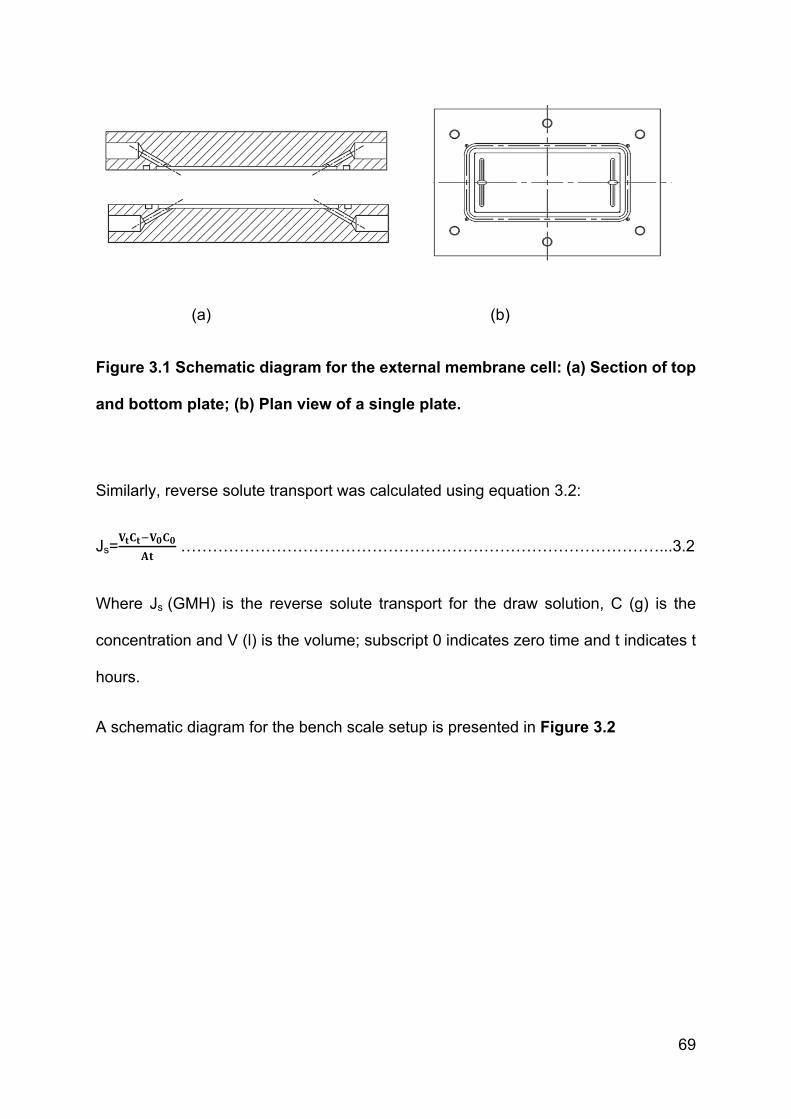
69
(a) (b)
Figure 3.1 Schematic diagram for the external membrane cell: (a) Section of top
and bottom plate; (b) Plan view of a single plate.
Similarly, reverse solute transport was calculated using equation 3.2:
Js=%$&$'%(&(
#$ ………………………………………………………………………………...3.2
Where Js (GMH) is the reverse solute transport for the draw solution, C (g) is the
concentration and V (l) is the volume; subscript 0 indicates zero time and t indicates t
hours.
A schematic diagram for the bench scale setup is presented in Figure 3.2
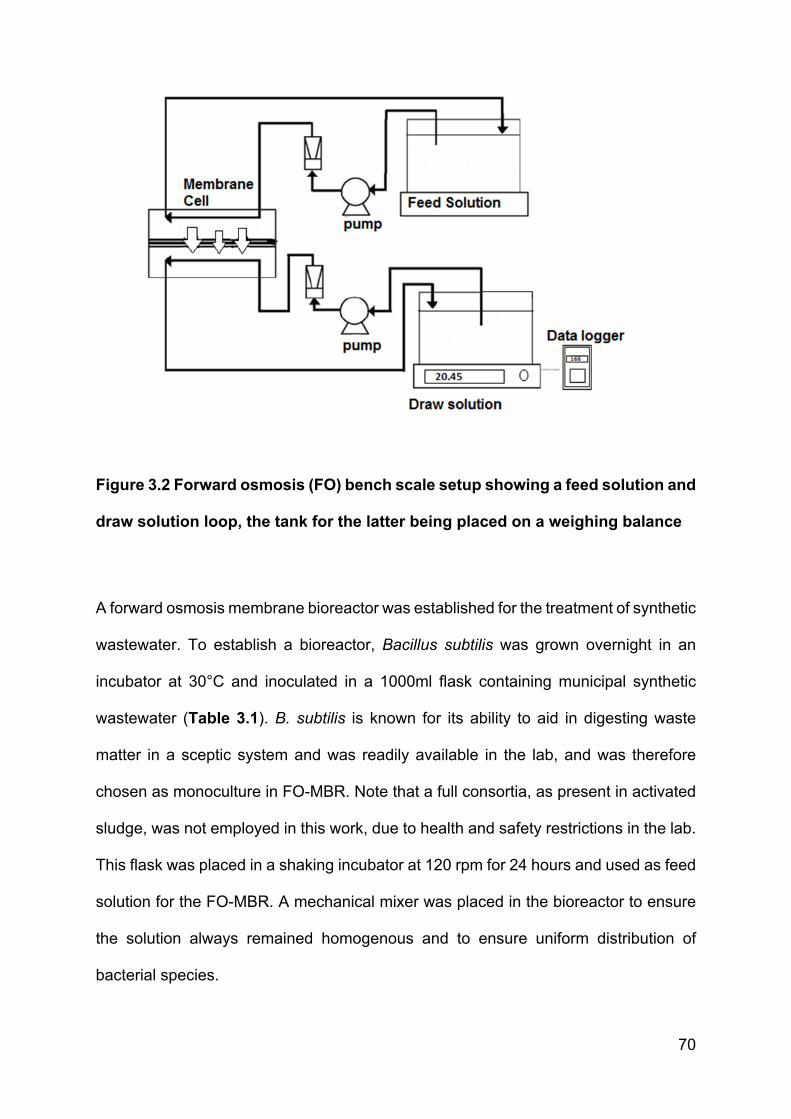
70
Figure 3.2 Forward osmosis (FO) bench scale setup showing a feed solution and
draw solution loop, the tank for the latter being placed on a weighing balance
A forward osmosis membrane bioreactor was established for the treatment of synthetic
wastewater. To establish a bioreactor, Bacillus subtilis was grown overnight in an
incubator at 30°C and inoculated in a 1000ml flask containing municipal synthetic
wastewater (Table 3.1). B. subtilis is known for its ability to aid in digesting waste
matter in a sceptic system and was readily available in the lab, and was therefore
chosen as monoculture in FO-MBR. Note that a full consortia, as present in activated
sludge, was not employed in this work, due to health and safety restrictions in the lab.
This flask was placed in a shaking incubator at 120 rpm for 24 hours and used as feed
solution for the FO-MBR. A mechanical mixer was placed in the bioreactor to ensure
the solution always remained homogenous and to ensure uniform distribution of
bacterial species.
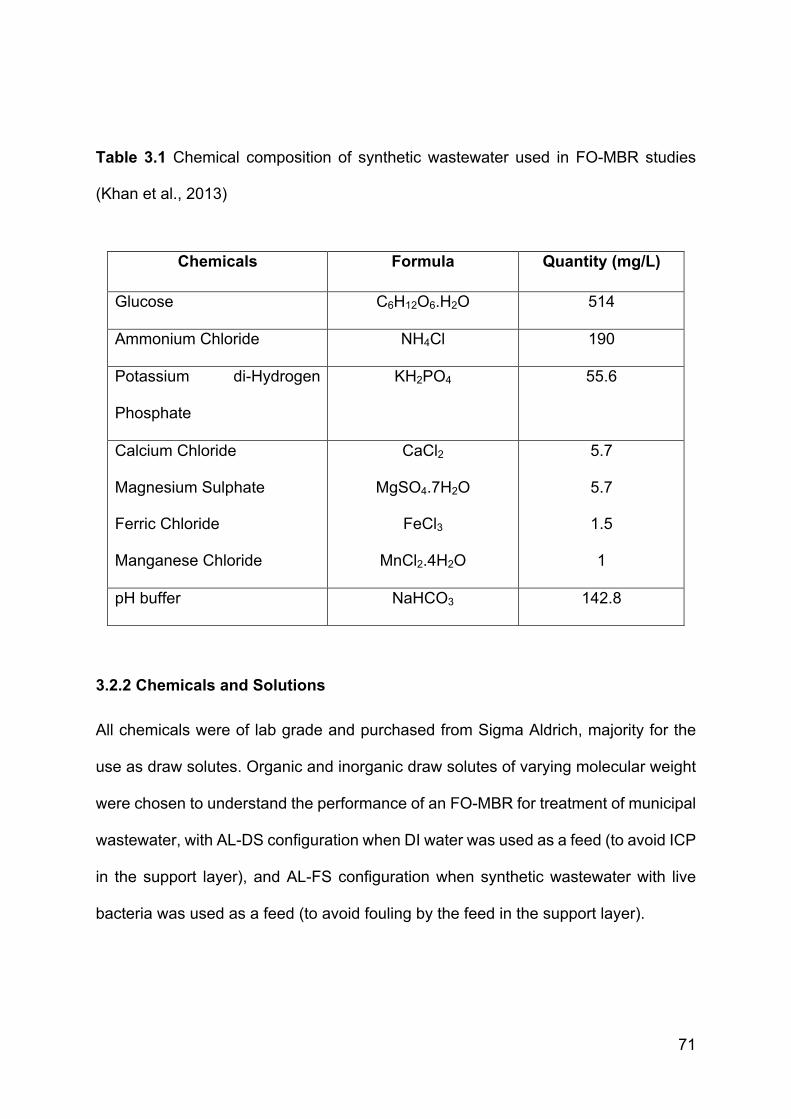
71
Table 3.1 Chemical composition of synthetic wastewater used in FO-MBR studies
(Khan et al., 2013)
3.2.2 Chemicals and Solutions
All chemicals were of lab grade and purchased from Sigma Aldrich, majority for the
use as draw solutes. Organic and inorganic draw solutes of varying molecular weight
were chosen to understand the performance of an FO-MBR for treatment of municipal
wastewater, with AL-DS configuration when DI water was used as a feed (to avoid ICP
in the support layer), and AL-FS configuration when synthetic wastewater with live
bacteria was used as a feed (to avoid fouling by the feed in the support layer).
Chemicals Formula Quantity (mg/L)
Glucose C6H12O6.H2O 514
Ammonium Chloride NH4Cl 190
Potassium di-Hydrogen
Phosphate
KH2PO4 55.6
Calcium Chloride
Magnesium Sulphate
Ferric Chloride
Manganese Chloride
CaCl2
MgSO4.7H2O
FeCl3
MnCl2.4H2O
5.7
5.7
1.5
1
pH buffer NaHCO3 142.8
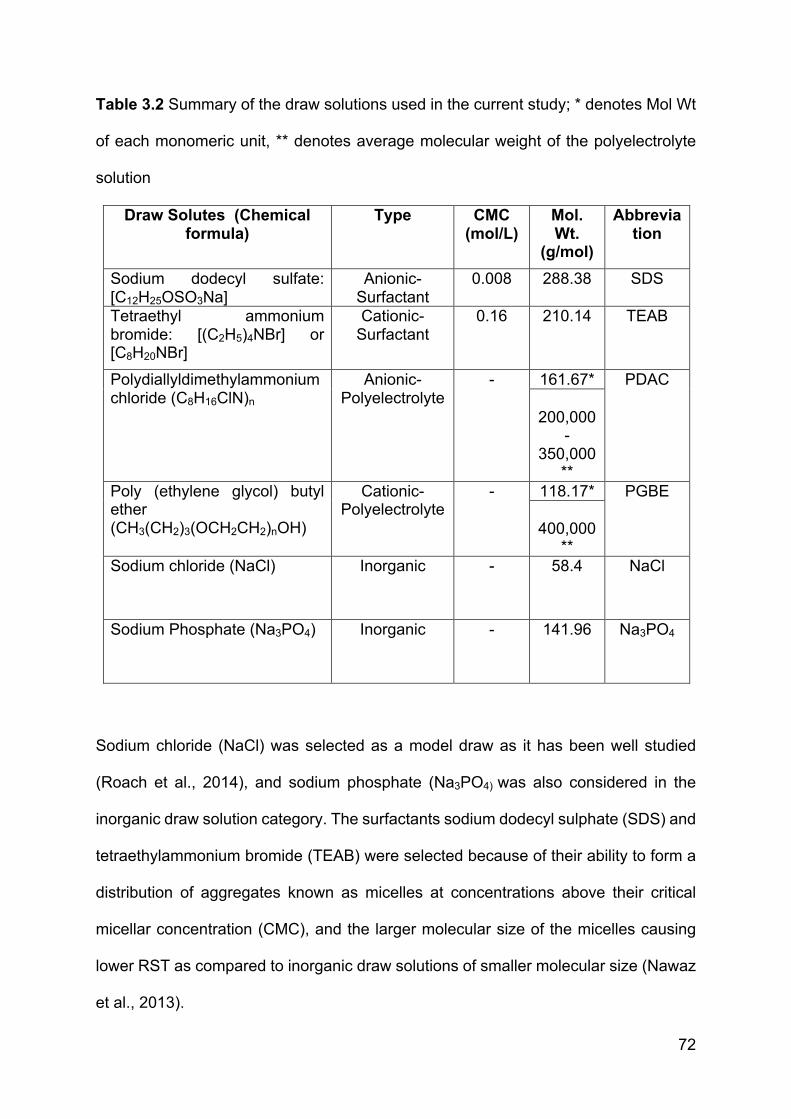
72
Table 3.2 Summary of the draw solutions used in the current study; * denotes Mol Wt
of each monomeric unit, ** denotes average molecular weight of the polyelectrolyte
solution
Draw Solutes (Chemical formula)
Type CMC (mol/L)
Mol. Wt.
(g/mol)
Abbreviation
Sodium dodecyl sulfate: [C12H25OSO3Na]
Anionic-Surfactant
0.008 288.38 SDS
Tetraethyl ammonium bromide: [(C2H5)4NBr] or [C8H20NBr]
Cationic- Surfactant
0.16 210.14 TEAB
Polydiallyldimethylammonium chloride (C8H16ClN)n
Anionic-Polyelectrolyte
- 161.67* PDAC
200,000-
350,000**
Poly (ethylene glycol) butyl ether (CH3(CH2)3(OCH2CH2)nOH)
Cationic- Polyelectrolyte
- 118.17* PGBE
400,000**
Sodium chloride (NaCl) Inorganic - 58.4 NaCl
Sodium Phosphate (Na3PO4) Inorganic - 141.96 Na3PO4
Sodium chloride (NaCl) was selected as a model draw as it has been well studied
(Roach et al., 2014), and sodium phosphate (Na3PO4) was also considered in the
inorganic draw solution category. The surfactants sodium dodecyl sulphate (SDS) and
tetraethylammonium bromide (TEAB) were selected because of their ability to form a
distribution of aggregates known as micelles at concentrations above their critical
micellar concentration (CMC), and the larger molecular size of the micelles causing
lower RST as compared to inorganic draw solutions of smaller molecular size (Nawaz
et al., 2013).
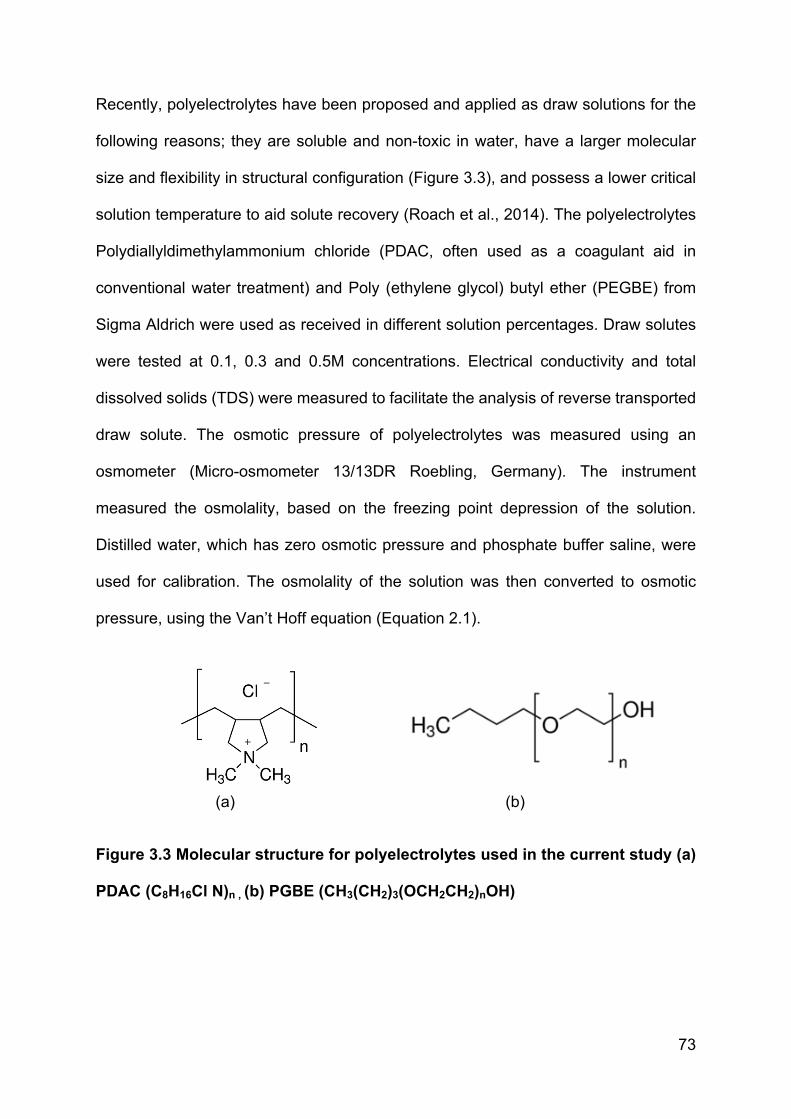
73
Recently, polyelectrolytes have been proposed and applied as draw solutions for the
following reasons; they are soluble and non-toxic in water, have a larger molecular
size and flexibility in structural configuration (Figure 3.3), and possess a lower critical
solution temperature to aid solute recovery (Roach et al., 2014). The polyelectrolytes
Polydiallyldimethylammonium chloride (PDAC, often used as a coagulant aid in
conventional water treatment) and Poly (ethylene glycol) butyl ether (PEGBE) from
Sigma Aldrich were used as received in different solution percentages. Draw solutes
were tested at 0.1, 0.3 and 0.5M concentrations. Electrical conductivity and total
dissolved solids (TDS) were measured to facilitate the analysis of reverse transported
draw solute. The osmotic pressure of polyelectrolytes was measured using an
osmometer (Micro-osmometer 13/13DR Roebling, Germany). The instrument
measured the osmolality, based on the freezing point depression of the solution.
Distilled water, which has zero osmotic pressure and phosphate buffer saline, were
used for calibration. The osmolality of the solution was then converted to osmotic
pressure, using the Van’t Hoff equation (Equation 2.1).
(a) (b)
Figure 3.3 Molecular structure for polyelectrolytes used in the current study (a)
PDAC (C8H16Cl N)n , (b) PGBE (CH3(CH2)3(OCH2CH2)nOH)
74
3.2.3. Toxicity
Toxicity of the draw solutes is a very important issue, whether with reference to reverse
solute transport to the feed side of the bioreactor or to the draw solutes left in the
permeate after draw solution recovery. Toxic compounds in the permeate may cause
environmental and health issues, and will increase the cost of treatment when using
forward osmosis as a follow up treatment will be required to remove the toxic
substances from the FO permeate. Toxicity issues may also affect the biological
functioning of the FO-MBR.
Table 3.3 Chemical composition of 2X M9 media for bacterial growth in microbroth
dilution test with a final pH of 7.0 (Harwood & Cutting, 1990)
Chemical Formula Quantity (g)
Disodium hydrogen phosphate Na2HPO4
25.6
Potassium di-Hydrogen
Phosphate
KH2PO4
6
Sodium Chloride NaCl 1
Ammonium Chloride NH4Cl
2
Glucose C6H12O6.H2O 0.4
Toxicity of all the draw solutes was evaluated using a microbroth dilution test where a
bacterial culture of Bacillus Subtilis was allowed to grow in an incubator at 32°C
overnight. This culture was then added to individual eppendorfs and centrifuged at
10,000rpm for 15 minutes. The pellet was then filled with 500µl of M9 media and 500µl
of individual draw solutions at higher concentration to observe possible sudden shocks
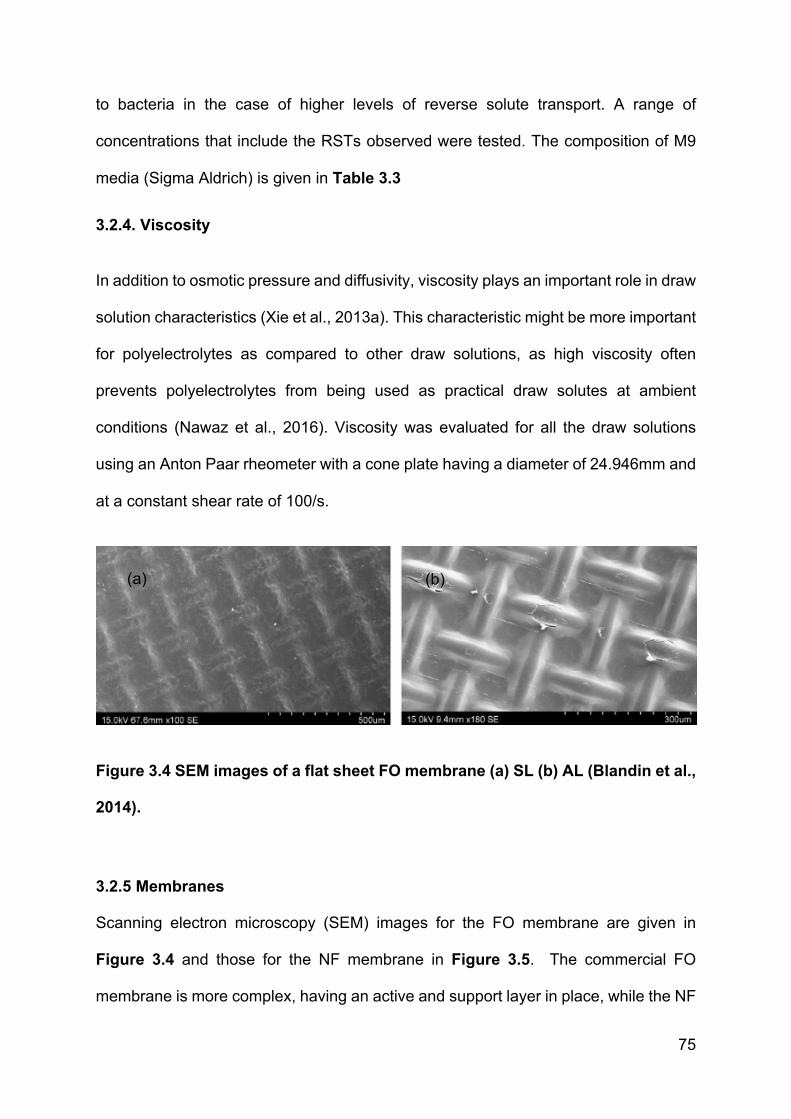
75
to bacteria in the case of higher levels of reverse solute transport. A range of
concentrations that include the RSTs observed were tested. The composition of M9
media (Sigma Aldrich) is given in Table 3.3
3.2.4. Viscosity
In addition to osmotic pressure and diffusivity, viscosity plays an important role in draw
solution characteristics (Xie et al., 2013a). This characteristic might be more important
for polyelectrolytes as compared to other draw solutions, as high viscosity often
prevents polyelectrolytes from being used as practical draw solutes at ambient
conditions (Nawaz et al., 2016). Viscosity was evaluated for all the draw solutions
using an Anton Paar rheometer with a cone plate having a diameter of 24.946mm and
at a constant shear rate of 100/s.
Figure 3.4 SEM images of a flat sheet FO membrane (a) SL (b) AL (Blandin et al.,
2014).
3.2.5 Membranes
Scanning electron microscopy (SEM) images for the FO membrane are given in
Figure 3.4 and those for the NF membrane in Figure 3.5. The commercial FO
membrane is more complex, having an active and support layer in place, while the NF
(a) (b)
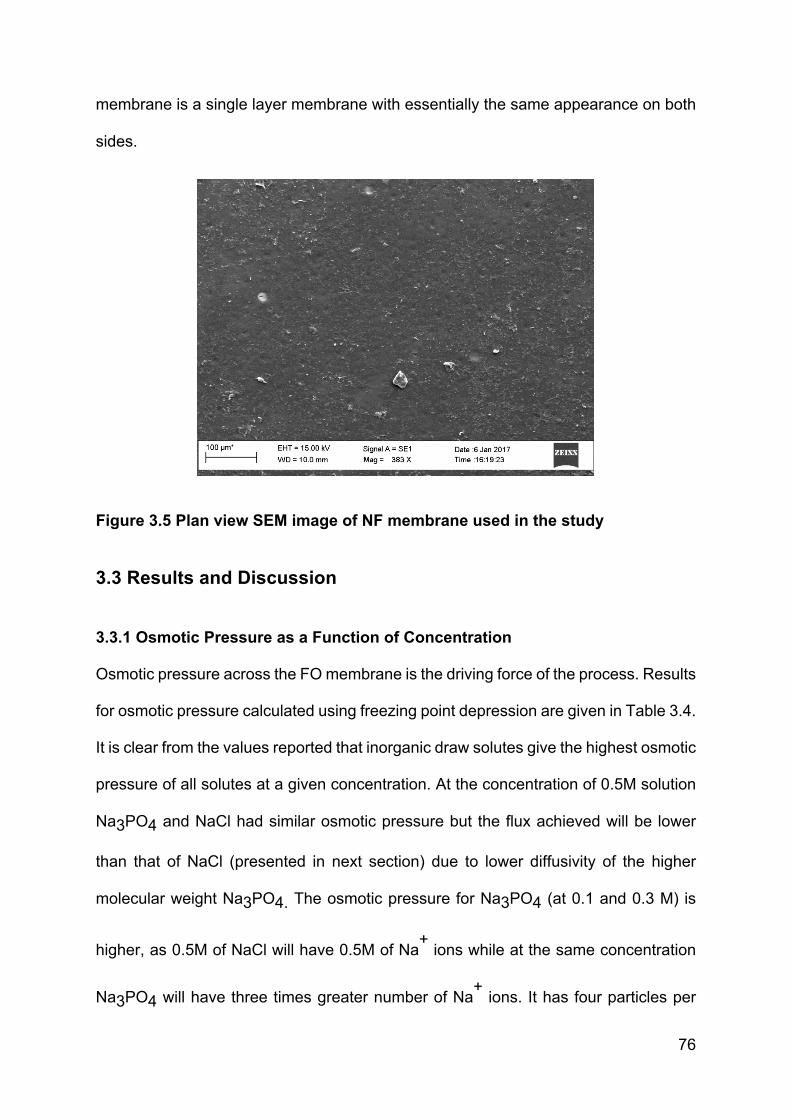
76
membrane is a single layer membrane with essentially the same appearance on both
sides.
Figure 3.5 Plan view SEM image of NF membrane used in the study
3.3 Results and Discussion
3.3.1 Osmotic Pressure as a Function of Concentration
Osmotic pressure across the FO membrane is the driving force of the process. Results
for osmotic pressure calculated using freezing point depression are given in Table 3.4.
It is clear from the values reported that inorganic draw solutes give the highest osmotic
pressure of all solutes at a given concentration. At the concentration of 0.5M solution
Na3PO4 and NaCl had similar osmotic pressure but the flux achieved will be lower
than that of NaCl (presented in next section) due to lower diffusivity of the higher
molecular weight Na3PO4. The osmotic pressure for Na3PO4 (at 0.1 and 0.3 M) is
higher, as 0.5M of NaCl will have 0.5M of Na+ ions while at the same concentration
Na3PO4 will have three times greater number of Na+ ions. It has four particles per
77
mole compared to that of NaCl that has only two particles per mole. MgCl2 and
Na2SO4 have been reported to give higher osmotic pressure than NaCl for the same
reason (Law & Mohammad, 2017). The osmotic pressure does not increase as much
after 0.5M concentration and at 1M the osmotic pressure is lower than NaCl. It can be
related to interaction between Na and PO4 ions in a solution, or with the degree of
dissociation of the draw solute at higher concentration, however no such account has
been presented in literature. The lower flux for Na3PO4 can also be explained with
respect to its higher molecular weight compared to that of NaCl. Lower diffusivity in
the case of the latter will give a small mass transfer coefficient leading to lower osmotic
pressure at the membrane surface for the draw solution [as presented in equation 2.14
for ECP].
TEAB also shows good flux. Although its value at 1M was comparable to that of NaCl
as well, but using surfactant at higher concentration is not ideal, as at concentration
above the CMC the surfactants tend to become insoluble, due to growth in micellar
size. Certainly, sodium chloride solutions are expected to conform most closely to ideal
solution behaviour and thus yield the linear trend predicted by the Van’t Hoff equation.
The osmotic pressure value measured for NaCl at 1M concentration was 4.41 MPa,
and this value is close to that reported in the literature i.e. 4.46 MPa at 1M (Johnson
et al., 2017), or 4.2 at ~1M (Achilli et al., 2010). In general, osmotic pressures for many
draw solutions are not reported in literature. For all draw solutes, the osmotic pressure
increases in the following order at 0.5 M draw solution concentration:
PDAC < PGBE < TEAB < Na3PO4, NaCl.
Unfortunately, the osmotic pressure value could not be measured for SDS by the
freezing point depression method due to spontaneous crystal formation. At lower
78
temperatures, SDS precipitates and is no longer soluble in water, resulting in lower
freezing point depression values than expected. Since all the colligative properties of
SDS are then reduced, its apparent osmotic pressure is lower than that expected with
complete solubility, and measurement were thus discontinued e.g. Gadelha et al.,
reported an osmotic pressure of 0.33 MPa for 0.1M SDS concentration. Despite these
problems, freezing point depression was deemed a fit method to calculate the osmotic
pressure for inorganic draws solutions, the polyelectrolytes and the cationic surfactant,
TEAB.
The values observed for polyelectrolytes were comparatively low. This lower osmotic
pressure could be the result of a coiled configuration of polyelectrolytes in an
79
aqueous solution, leading to non-ideal solution behavior (see values in Table 3.4).
Linear polymers only obey the Van’t Hoff equation at lower concentration in a good
solvent. At higher concentrations, complex osmotic behaviors are observed due to the
high degree of polymerization and hence the interaction between the chains leading
to coiling. Their random configuration allows them to occupy larger volumes. An
additional virial coefficient that takes the interaction of two chains into account should
be incorporated into the Vant’t Hoff equation. In short, the non-ideality has a bigger
effect for larger molecules than smaller ones.
Ionic surfactants have been reported to produce higher osmotic pressure values
compared to anionic surfactants because of the combination of unbound ions and the
large repulsive interaction between micelles. But in forward osmosis, using surfactant
as a draw solute, actual fluxes have been reported to be lower than the predicted
79
fluxes and are caused by the combined influences of concentration polarization and
viscosity with increasing concentration (Roach et al., 2014).
In the current study various draw solution concentrations (0.1, 0.3, 0.5M) were tested
to select the optimum concentration range for FO tests. With an increase in
concentration, the osmotic pressure increases and leads to higher flux, this trend is
expected from the Van’t Hoff equation. The same rising trend has been shown in many
different studies for other draw solutes (Mccutheon et al., 2006, Achilli et al., 2009,
Choi et al., 2009, Xu et al., 2010). However, it appears that an initially linear
relationship shifts to a logarithmic (as observed in the case of Na3PO4) one at higher
concentration of various inorganic draw solutions. Very high concentration of draw
solutions were not tested in the current study, as literature suggests that the ECP and
ICP are greater at higher draw solution concentrations or higher fluxes (Tan and Ng,
2010). Concentration of draw solution and increased crossflow also increase the
80
flux. Indeed, the effect of ECP was expected and shown to be minimal when a cross
flow setup was in place with a CFV greater than 0.21m/s (Xu et al., 2010).
With no draw regeneration system in place, the FO setup in this work had to be run in
batch mode, and a moderate concentration of 0.5M solution was chosen for FO and
FO-MBR configurations after initial testing of 0.1, 0.3 and 0.5M concentrations.
In this study, a decline in flux with time was often observed. Since a draw solution
regeneration was not in place, the decline may have arisen at least in part as a result
of dilution of the draw solution in the absence of a regeneration system, although
fouling could also be expected to play a role (see also page 91).

80
The osmotic pressure values at 0.5M concentration revealed greater values and
higher concentration of surfactants were not feasible for use therefore 0.5M draw
solution concentration were used for further studies.
Table 3.4 Osmotic pressure for draw solutes determined using measured osmolality
values.
Chemical
Concentration (M)
Osmotic pressure (MPa)
1. Sodium chloride (NaCl) 0.1 0.54± 0.025
0.3 1.09± 0.025
0.5 2.13± 0.025
1 4.41± 0.025
2. Sodium phosphate (Na3PO4) 0.1 0.67± 0.025
0.3 1.18± 0.025
0.5 2.13± 0.025
1 2.90± 0.025
3. Sodium dodecyl sulfate [C12H25OSO3Na]
Freezing point depression measurements
not practical due to poor solubility and
crystallization at low temperature.
4. Tetraethyl ammonium bromide [(C2H5)4NBr] or [C8H20NBr]
0.1 0.42± 0.025
0.3 0.85± 0.025
0.5 1.61± 0.025
1 4.00 ± 0.025
5. Poly Diallyldimethylammonium chloride (PDAC)
0.18 0.05± 0.025
0.31 0.12± 0.025

81
0.61 0.20± 0.025
4. Poly (ethylene glycol) butyl ether
(PGBE)
0.2 0.43 ± 0.025
0.42 0.63 ± 0.025
0.85 1.30 ± 0.025
Several further observations should be made about the measurements reported in
Table 3.4.
1. Each measurement was performed three times; the variance in values suggested
a standard deviation of 0.025 MPa, which is the value reported for the estimate in
error.
However, a random error analysis suggests an error one order of magnitude smaller,
as follows.
The freezing point osmometer measures osmotic pressure indirectly via the
depression in freezing point of the solution compared to pure water. This is calculated
via the generalized Van’t Hoff equation (2.2), for which the concentration, activity
coefficient and Van’t Hoff coefficient (related to the number of charged species per
molecule of species) are lumped into a single term, the ‘osmolality’. The measurement
nevertheless assumes that osmotic pressure is a colligative property, dependent only
on the concentration and not the nature of the solute species, which is unlikely to be
true in general.
According to reference (Gonotec, 1996), the depression in freezing point associated
with unit osmolality is -1.86°C. The accuracy of temperature measurement is stated
as roughly +/- 2 x 10⁻³ °C so the relative error in osmolality measurement is about 1 x
10-3. By taking the log of both sides of equation (2.1) and differentiating, it is seen that
82
the relative error in osmotic pressure is the sum of the relative errors in osmolality and
temperature; this of course ignores the activity terms in the more general form of the
equation, (2.2), for which osmotic pressure can in any case no longer be considered
colligative (Wallace et al., 2008).
Since the temperature relative error is very much smaller than for the osmolality, and
for osmotic pressures on the order of 1 to 5 MPa, the absolute error is thus between
1 and 5 x 10⁻³ MPa. The fact that this is much lower than the standard deviation in the
experimental measurements suggests that the accuracy in measurement of the
temperature, and equally the accuracy at which it is maintained in the measurement
device, is less than the value suggested. Furthermore, the assumption of solution
ideality, necessary for accurate measurement, does not hold true (see also point 2).
Finally, the concentration of the made up solutions are themselves subject to
experimental error, though this is likely to be smaller than one millimolar and thus not
contributory to the observed variances.
2. In practice, we can observe from Table 3.4 that equation 2.1 holds better for the
simpler solutes (1 and 2) than for the more complex, high molecular weight solutes
(4 to 6); the latter demonstrate a marked non-linear relationship between osmotic
pressure and concentration. This is indicative of the expected non-ideal interaction
between these solutes in solution. It will be seen later that this non-ideality has
consequences for both flux response and membrane fouling/cleaning.
3.3.2 Forward Osmosis Membrane versus Nanofiltration Membrane
Figures 3.6, 3.7 and 3.8 show the initial fluxes for CTA and NF membranes for the
draw solutions studied, with both DI water (AL-DS mode) as a control feed and live
monoculture feed in the FO-MBR (run in AL-FS mode). It can be observed that the
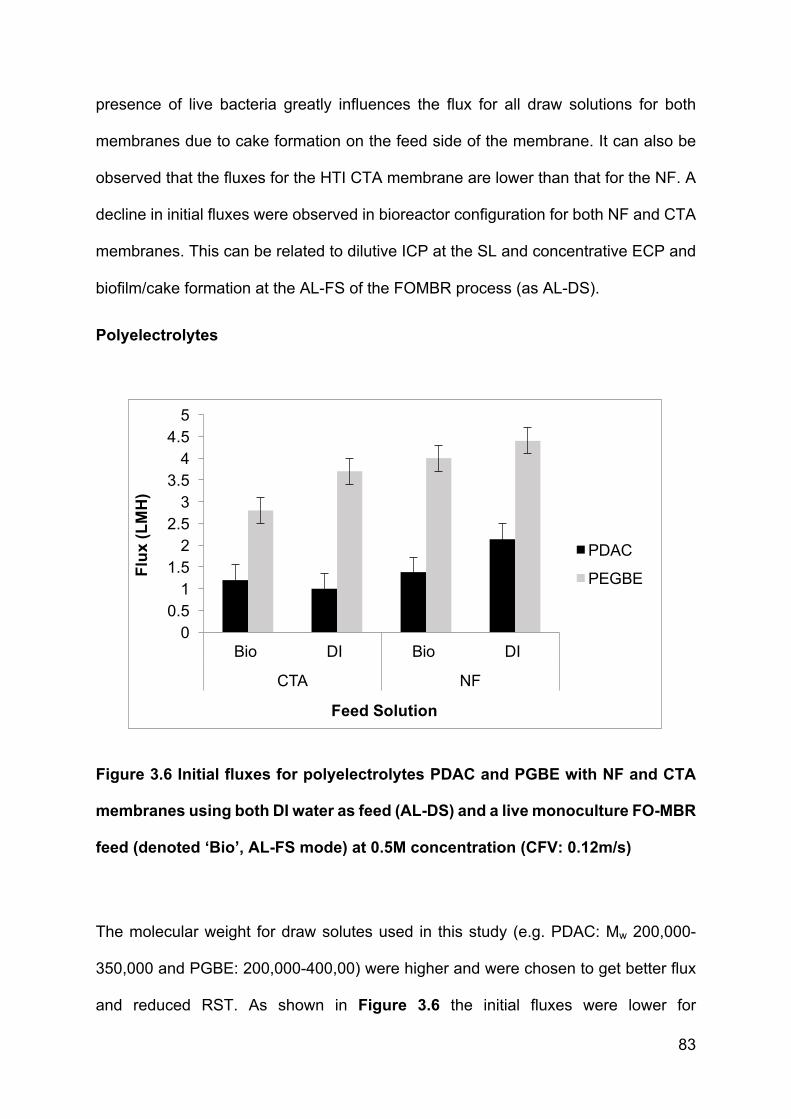
83
presence of live bacteria greatly influences the flux for all draw solutions for both
membranes due to cake formation on the feed side of the membrane. It can also be
observed that the fluxes for the HTI CTA membrane are lower than that for the NF. A
decline in initial fluxes were observed in bioreactor configuration for both NF and CTA
membranes. This can be related to dilutive ICP at the SL and concentrative ECP and
biofilm/cake formation at the AL-FS of the FOMBR process (as AL-DS).
Polyelectrolytes
Figure 3.6 Initial fluxes for polyelectrolytes PDAC and PGBE with NF and CTA
membranes using both DI water as feed (AL-DS) and a live monoculture FO-MBR
feed (denoted ‘Bio’, AL-FS mode) at 0.5M concentration (CFV: 0.12m/s)
The molecular weight for draw solutes used in this study (e.g. PDAC: Mw 200,000-
350,000 and PGBE: 200,000-400,00) were higher and were chosen to get better flux
and reduced RST. As shown in Figure 3.6 the initial fluxes were lower for
00.5
11.5
22.5
33.5
44.5
5
Bio DI Bio DI
CTA NF
Flu
x (L
MH
)
PDAC
PEGBE
Feed Solution
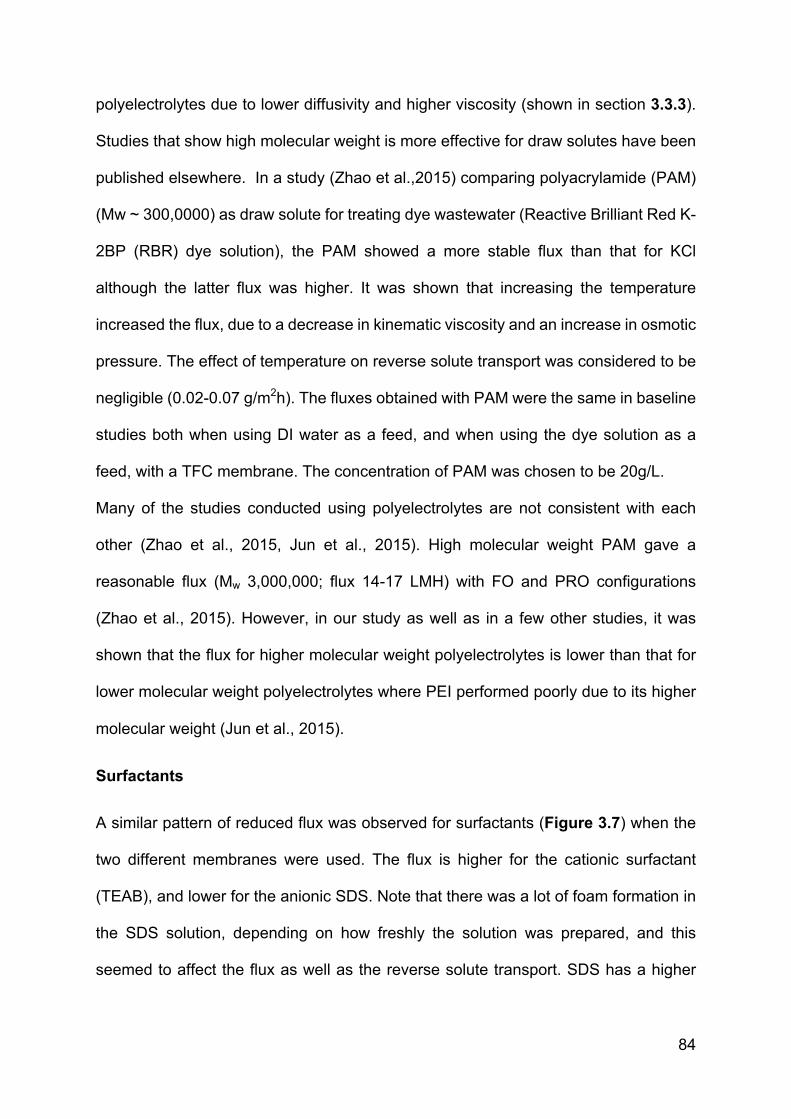
84
polyelectrolytes due to lower diffusivity and higher viscosity (shown in section 3.3.3).
Studies that show high molecular weight is more effective for draw solutes have been
published elsewhere. In a study (Zhao et al.,2015) comparing polyacrylamide (PAM)
(Mw ~ 300,0000) as draw solute for treating dye wastewater (Reactive Brilliant Red K-
2BP (RBR) dye solution), the PAM showed a more stable flux than that for KCl
although the latter flux was higher. It was shown that increasing the temperature
increased the flux, due to a decrease in kinematic viscosity and an increase in osmotic
pressure. The effect of temperature on reverse solute transport was considered to be
negligible (0.02-0.07 g/m2h). The fluxes obtained with PAM were the same in baseline
studies both when using DI water as a feed, and when using the dye solution as a
feed, with a TFC membrane. The concentration of PAM was chosen to be 20g/L.
Many of the studies conducted using polyelectrolytes are not consistent with each
other (Zhao et al., 2015, Jun et al., 2015). High molecular weight PAM gave a
reasonable flux (Mw 3,000,000; flux 14-17 LMH) with FO and PRO configurations
(Zhao et al., 2015). However, in our study as well as in a few other studies, it was
shown that the flux for higher molecular weight polyelectrolytes is lower than that for
lower molecular weight polyelectrolytes where PEI performed poorly due to its higher
molecular weight (Jun et al., 2015).
Surfactants
A similar pattern of reduced flux was observed for surfactants (Figure 3.7) when the
two different membranes were used. The flux is higher for the cationic surfactant
(TEAB), and lower for the anionic SDS. Note that there was a lot of foam formation in
the SDS solution, depending on how freshly the solution was prepared, and this
seemed to affect the flux as well as the reverse solute transport. SDS has a higher
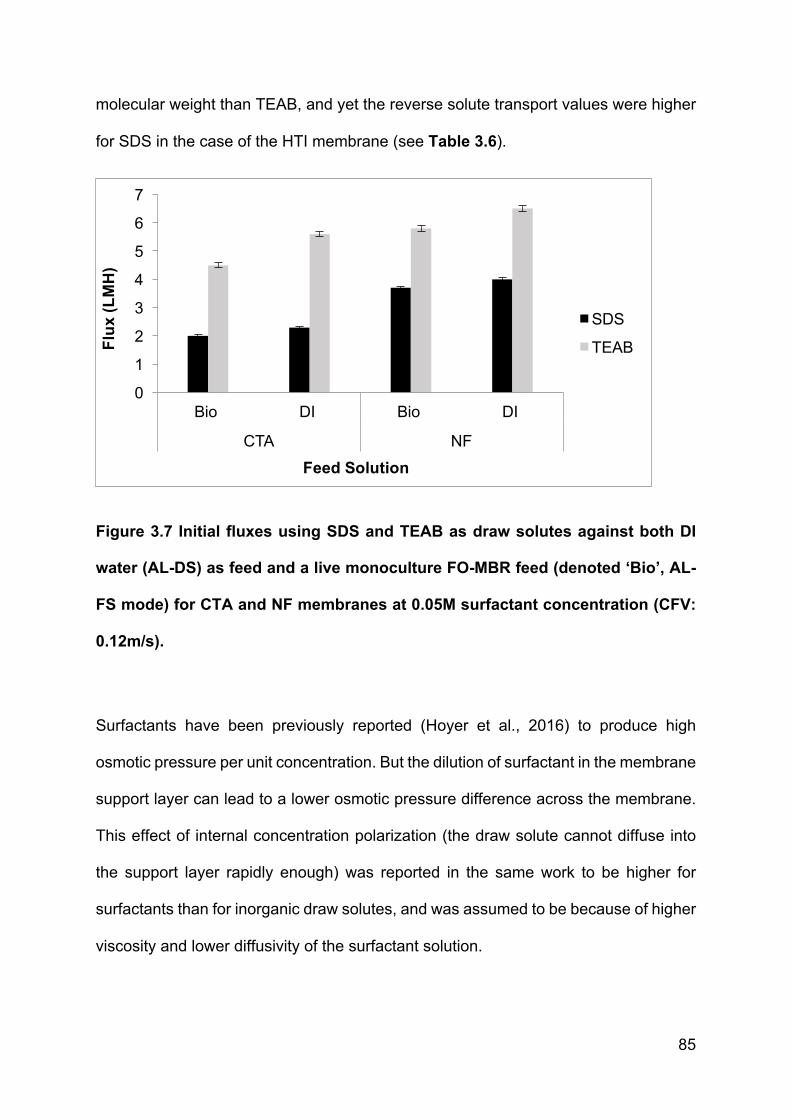
85
molecular weight than TEAB, and yet the reverse solute transport values were higher
for SDS in the case of the HTI membrane (see Table 3.6).
Figure 3.7 Initial fluxes using SDS and TEAB as draw solutes against both DI
water (AL-DS) as feed and a live monoculture FO-MBR feed (denoted ‘Bio’, AL-
FS mode) for CTA and NF membranes at 0.05M surfactant concentration (CFV:
0.12m/s).
Surfactants have been previously reported (Hoyer et al., 2016) to produce high
osmotic pressure per unit concentration. But the dilution of surfactant in the membrane
support layer can lead to a lower osmotic pressure difference across the membrane.
This effect of internal concentration polarization (the draw solute cannot diffuse into
the support layer rapidly enough) was reported in the same work to be higher for
surfactants than for inorganic draw solutes, and was assumed to be because of higher
viscosity and lower diffusivity of the surfactant solution.
0
1
2
3
4
5
6
7
Bio DI Bio DI
CTA NF
Flu
x (L
MH
)
SDS
TEAB
Feed Solution
86
If the hydrocarbon chain length is long, then a microscopic phase separation can
appear i.e. micelles will be formed. Longer chain hydrocarbons have a lower CMC and
thus fewer monomers and lower osmotic pressure (as in the case of SDS). The HTI
CTA membrane, used in the current study, prevents the passage of micelles, but does
allow for the passage of surfactant monomers and thus allows for a higher reverse
transport- a clear disadvantage.
In the current study much higher fluxes were observed for TEAB but the decline in flux
was also higher. On the contrary lower fluxes were achieved by SDS but the decline
in flux for bio feed as well as overtime was lower.
Inorganic Draw solutions
Initial flux for the inorganic draw solutes is shown in Figure 3.8 for the HTI-CTA
membranes. They were not tested against the NF membrane because of the ability of
monovalent ions to pass directly through the membrane.
In Table 3.4 it can be observed that both inorganic draw solutions have similar osmotic
pressure and therefore same values of flux were expected at 0.5M concentration of
draw solution. It can be observed that the flux for Na3PO4 has lower flux than that of
NaCl in both DI and MBR as feed. This is because draw solution with divalent ions in
general yield lower fluxes than monovalent ions even at the same osmotic pressure,
which is due to the lower diffusivity coefficients of the divalent ions in comparison with
those of the monovalent ions (Holloway et al., 2015). Higher diffusivity is another
reason why NaCl is widely used for FO in the literature.
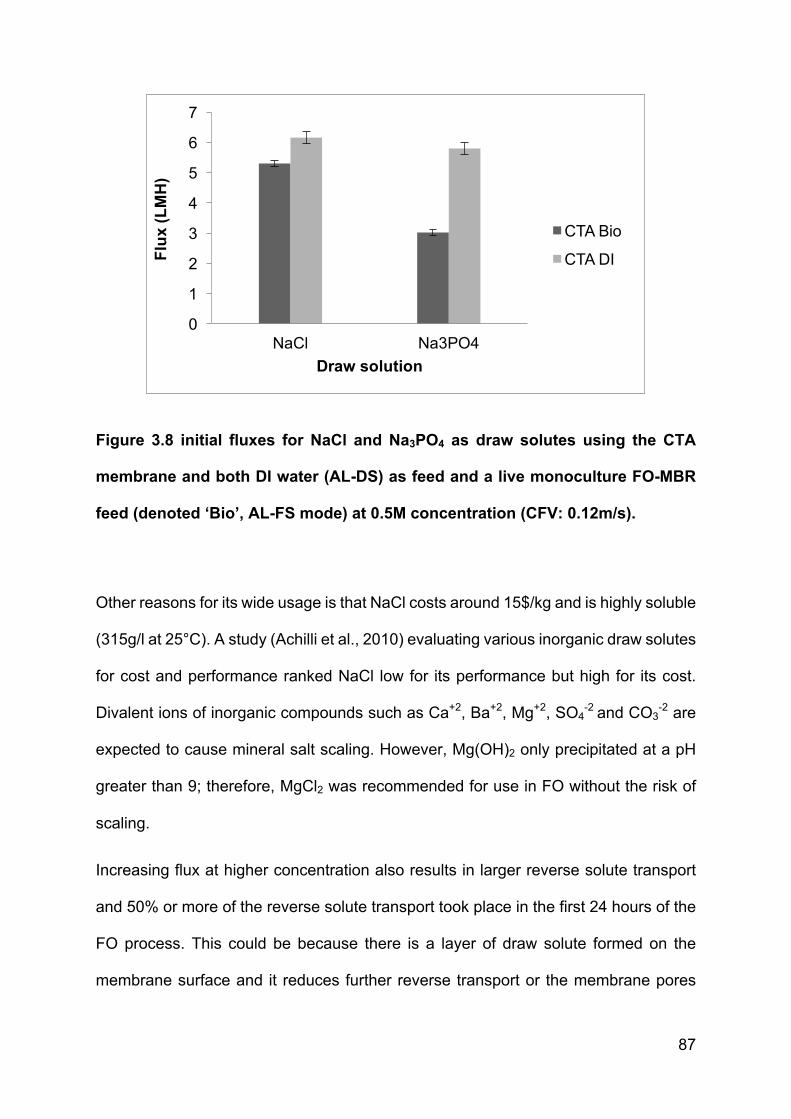
87
Figure 3.8 initial fluxes for NaCl and Na3PO4 as draw solutes using the CTA
membrane and both DI water (AL-DS) as feed and a live monoculture FO-MBR
feed (denoted ‘Bio’, AL-FS mode) at 0.5M concentration (CFV: 0.12m/s).
Other reasons for its wide usage is that NaCl costs around 15$/kg and is highly soluble
(315g/l at 25°C). A study (Achilli et al., 2010) evaluating various inorganic draw solutes
for cost and performance ranked NaCl low for its performance but high for its cost.
Divalent ions of inorganic compounds such as Ca+2, Ba+2, Mg+2, SO4-2 and CO3
-2 are
expected to cause mineral salt scaling. However, Mg(OH)2 only precipitated at a pH
greater than 9; therefore, MgCl2 was recommended for use in FO without the risk of
scaling.
Increasing flux at higher concentration also results in larger reverse solute transport
and 50% or more of the reverse solute transport took place in the first 24 hours of the
FO process. This could be because there is a layer of draw solute formed on the
membrane surface and it reduces further reverse transport or the membrane pores
0
1
2
3
4
5
6
7
NaCl Na3PO4
Flu
x (L
MH
)
Draw solution
CTA Bio
CTA DI
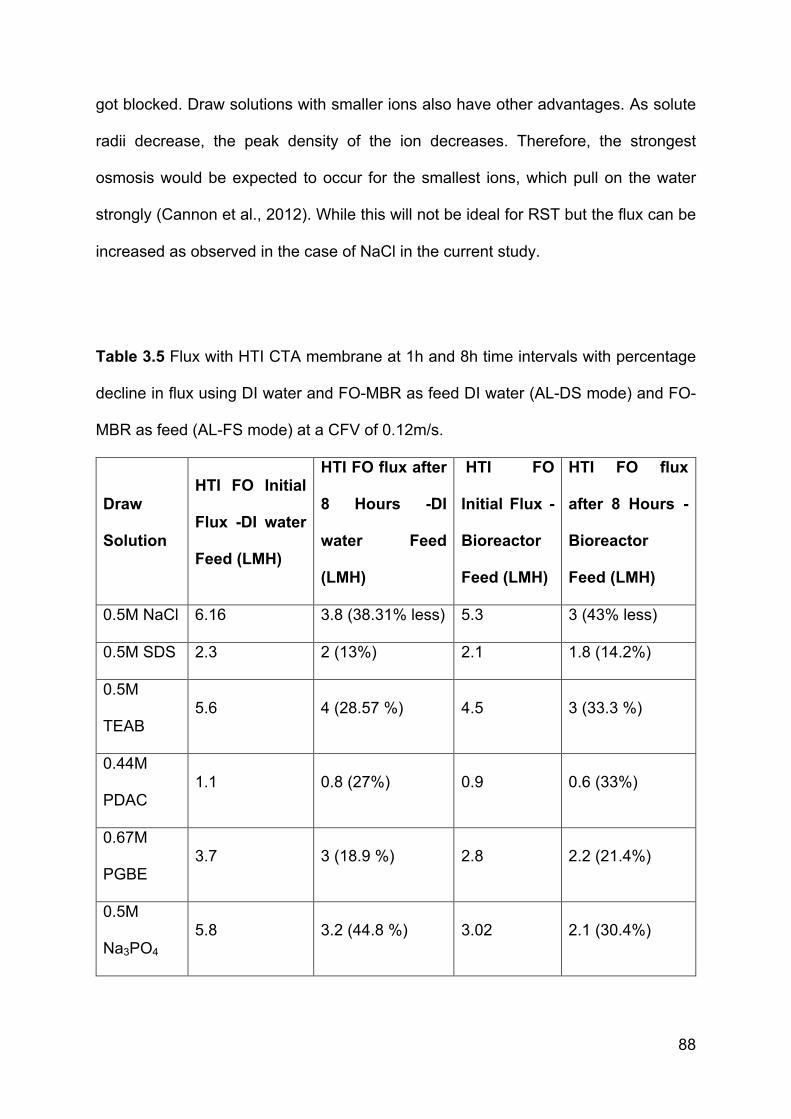
88
got blocked. Draw solutions with smaller ions also have other advantages. As solute
radii decrease, the peak density of the ion decreases. Therefore, the strongest
osmosis would be expected to occur for the smallest ions, which pull on the water
strongly (Cannon et al., 2012). While this will not be ideal for RST but the flux can be
increased as observed in the case of NaCl in the current study.
Table 3.5 Flux with HTI CTA membrane at 1h and 8h time intervals with percentage
decline in flux using DI water and FO-MBR as feed DI water (AL-DS mode) and FO-
MBR as feed (AL-FS mode) at a CFV of 0.12m/s.
Draw
Solution
HTI FO Initial
Flux -DI water
Feed (LMH)
HTI FO flux after
8 Hours -DI
water Feed
(LMH)
HTI FO
Initial Flux -
Bioreactor
Feed (LMH)
HTI FO flux
after 8 Hours -
Bioreactor
Feed (LMH)
0.5M NaCl 6.16 3.8 (38.31% less) 5.3 3 (43% less)
0.5M SDS 2.3 2 (13%) 2.1 1.8 (14.2%)
0.5M
TEAB 5.6 4 (28.57 %) 4.5 3 (33.3 %)
0.44M
PDAC 1.1 0.8 (27%) 0.9 0.6 (33%)
0.67M
PGBE 3.7 3 (18.9 %) 2.8 2.2 (21.4%)
0.5M
Na3PO4 5.8 3.2 (44.8 %) 3.02 2.1 (30.4%)
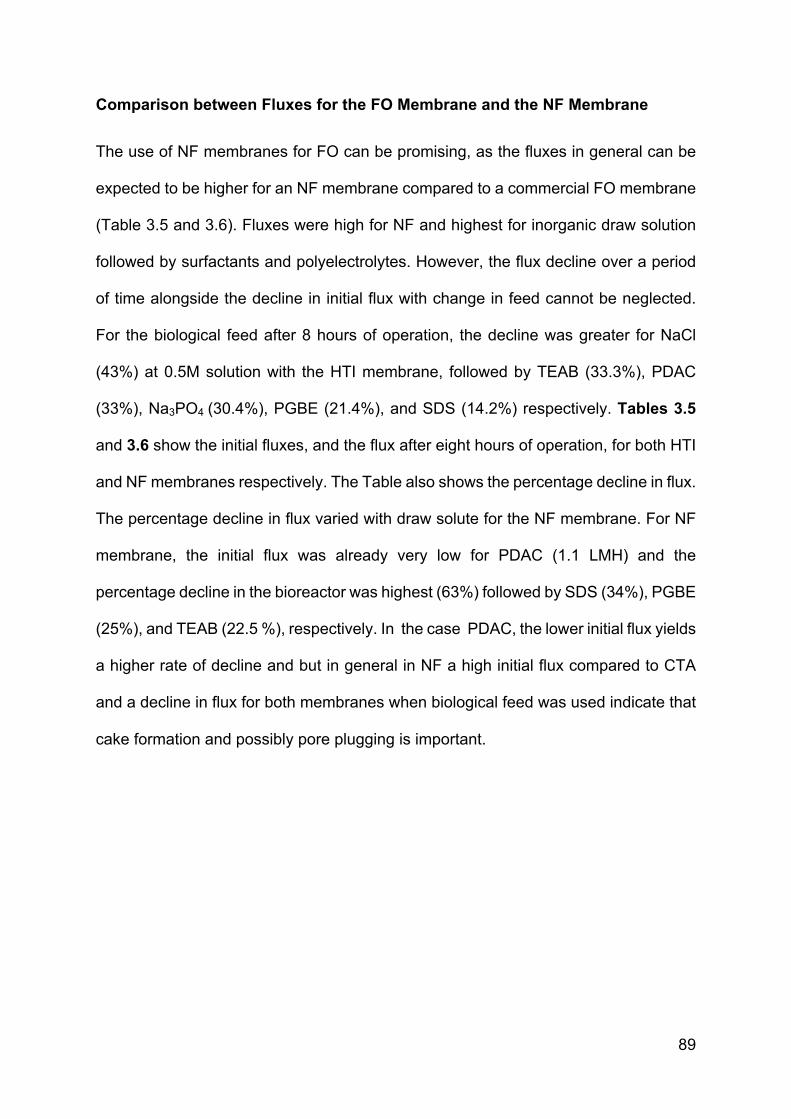
89
Comparison between Fluxes for the FO Membrane and the NF Membrane
The use of NF membranes for FO can be promising, as the fluxes in general can be
expected to be higher for an NF membrane compared to a commercial FO membrane
(Table 3.5 and 3.6). Fluxes were high for NF and highest for inorganic draw solution
followed by surfactants and polyelectrolytes. However, the flux decline over a period
of time alongside the decline in initial flux with change in feed cannot be neglected.
For the biological feed after 8 hours of operation, the decline was greater for NaCl
(43%) at 0.5M solution with the HTI membrane, followed by TEAB (33.3%), PDAC
(33%), Na3PO4 (30.4%), PGBE (21.4%), and SDS (14.2%) respectively. Tables 3.5
and 3.6 show the initial fluxes, and the flux after eight hours of operation, for both HTI
and NF membranes respectively. The Table also shows the percentage decline in flux.
The percentage decline in flux varied with draw solute for the NF membrane. For NF
membrane, the initial flux was already very low for PDAC (1.1 LMH) and the
percentage decline in the bioreactor was highest (63%) followed by SDS (34%), PGBE
(25%), and TEAB (22.5 %), respectively. In the case PDAC, the lower initial flux yields
a higher rate of decline and but in general in NF a high initial flux compared to CTA
and a decline in flux for both membranes when biological feed was used indicate that
cake formation and possibly pore plugging is important.
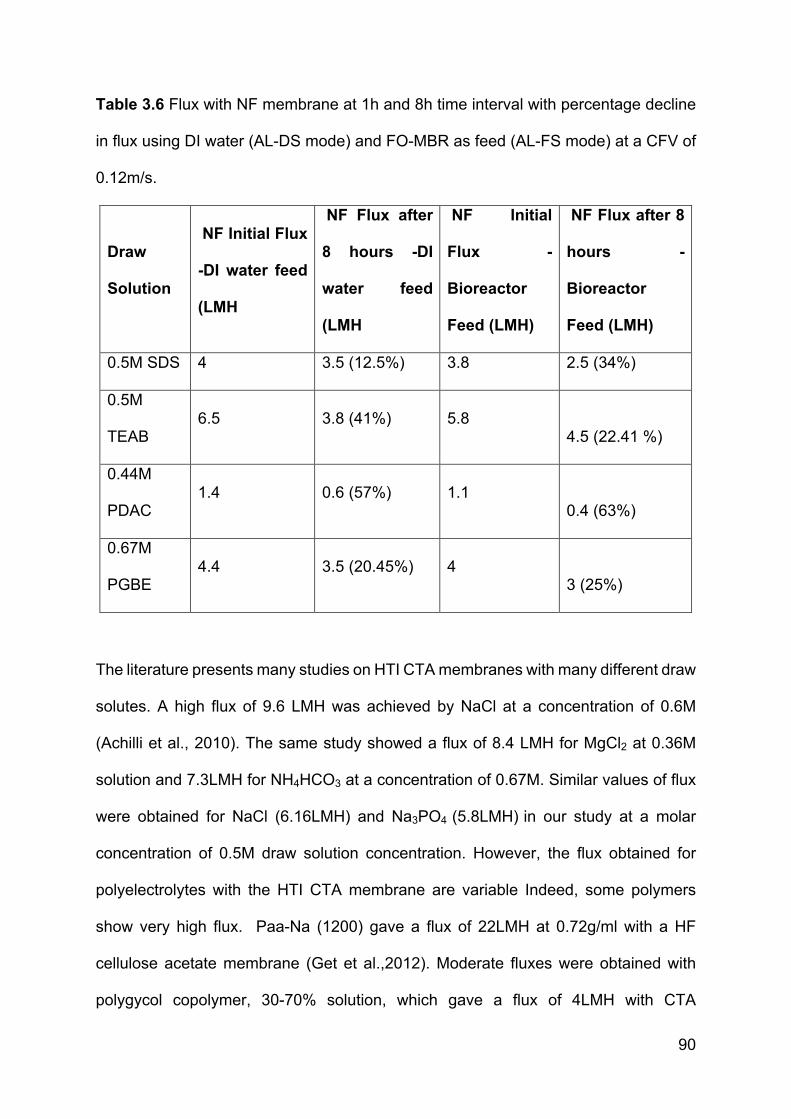
90
Table 3.6 Flux with NF membrane at 1h and 8h time interval with percentage decline
in flux using DI water (AL-DS mode) and FO-MBR as feed (AL-FS mode) at a CFV of
0.12m/s.
Draw
Solution
NF Initial Flux
-DI water feed
(LMH
NF Flux after
8 hours -DI
water feed
(LMH
NF Initial
Flux -
Bioreactor
Feed (LMH)
NF Flux after 8
hours -
Bioreactor
Feed (LMH)
0.5M SDS 4 3.5 (12.5%) 3.8 2.5 (34%)
0.5M
TEAB 6.5 3.8 (41%) 5.8
4.5 (22.41 %)
0.44M
PDAC 1.4 0.6 (57%) 1.1
0.4 (63%)
0.67M
PGBE 4.4 3.5 (20.45%) 4
3 (25%)
The literature presents many studies on HTI CTA membranes with many different draw
solutes. A high flux of 9.6 LMH was achieved by NaCl at a concentration of 0.6M
(Achilli et al., 2010). The same study showed a flux of 8.4 LMH for MgCl2 at 0.36M
solution and 7.3LMH for NH4HCO3 at a concentration of 0.67M. Similar values of flux
were obtained for NaCl (6.16LMH) and Na3PO4 (5.8LMH) in our study at a molar
concentration of 0.5M draw solution concentration. However, the flux obtained for
polyelectrolytes with the HTI CTA membrane are variable Indeed, some polymers
show very high flux. Paa-Na (1200) gave a flux of 22LMH at 0.72g/ml with a HF
cellulose acetate membrane (Get et al.,2012). Moderate fluxes were obtained with
polygycol copolymer, 30-70% solution, which gave a flux of 4LMH with CTA
91
membrane when 3.5% NaCl was used as feed solution (Carmigani et al., 2012). Such
concentration weight percentages reported in the literature for polymers as draw
solutes are high and similar concentrations were not used in the current study because
of the highly viscous solution obtained.
Literature suggests that the flux decline is severe relative to the initial flux. In a long-
term study with municipal wastewater, Wang et. al. (2016), demonstrated the
respective contributions of cake enhanced concentration polarization (CECP), ECP
and RST to water flux decrease. The flux was calculated and the said parameters were
observed at the critical concentration factor (CCF) and concentration factors 1, 3, 5
and 8 times that of the influent sewage. CCF is the ratio of draw solute concentration
to that of feed concentration, which is a useful parameter to define the concentration
factor where highest flux could be achieved. It was shown that 58.1% of the flux decline
is due to RST, followed by 21.9% due to ECP and 20% due to CECP. The contribution
of CECP, ECP and reverse solute transport to water flux decline decreased at the
points of membrane cleaning. In this case, CECP contributed to 52.8%, RST
contributed to 20.7% and ECP contributed to 20.7% of the water flux decline. Overall,
CECP was then the highest contributor to the flux decline (Wang et al., 2016).
Generally, membrane cleaning is expected to remove cake formation but the decline
in flux contributed due to cake formation cannot be neglected.
Overall, for both CTA and NF membrane, a decline in flux was observed over several
hours, and initial fluxes were lower for biological feed; the contributory factors were
likely to be cake formation on the AL of the membrane, dilution of the draw solution,
and ICP in the support layer of the membrane. There is a need for a reconcentration
system in place to understand the decline better.
92
3.3.3 Reverse Solute Transport
Reverse solute transport of ions from the draw solution (DS) to the feed is a potential
problem with forward osmosis (FO). RST is reduced when divalent ion salts, such as
MgCl2 and MgSO4 with a larger hydrated radius, are used instead of salts with
monovalent ions only e.g., NaCl (Holloway et al., 2015). The observed reverse solute
transport is reported for all draw solutions with NF and HTI membranes in Table 3.7.
As mentioned previously, tests were not performed for the inorganic draw solutes
versus the NF membrane, but values of RST for monovalents can be expected to be
perhaps an order of magnitude greater than for the HTI membrane.
For the HTI membrane, the following order in RST was observed:
NaCl> SDS > Na3PO4 > TEAB > PGBE> PDAC
For the NF membrane, the following order was observed:
SDS > TEAB > PDAC > PGBE
It can first be observed that the reverse solute transport is related to the charge of
draw solute. For example, for NF the anionic polymer and surfactant show slightly
higher RST values than the cationic surfactant and polymer, respectively, while RST
for sodium chloride was higher than sodium phosphate for the HTI membrane. It can
immediately be seen from the values reported that solute molecular size is an
important factor to determine the reverse solute transport of a draw solution. The RST
values are lowest for highest molecular weight draw solutes (polyelectrolytes).
In general, values for reverse solute transport are slightly higher for NF than that for
HTI but are still of comparable magnitude, and the issue of RST does not prevent the
use of NF as an FO membrane when paired to the draw solutes tested, particularly
those of larger molecular weight
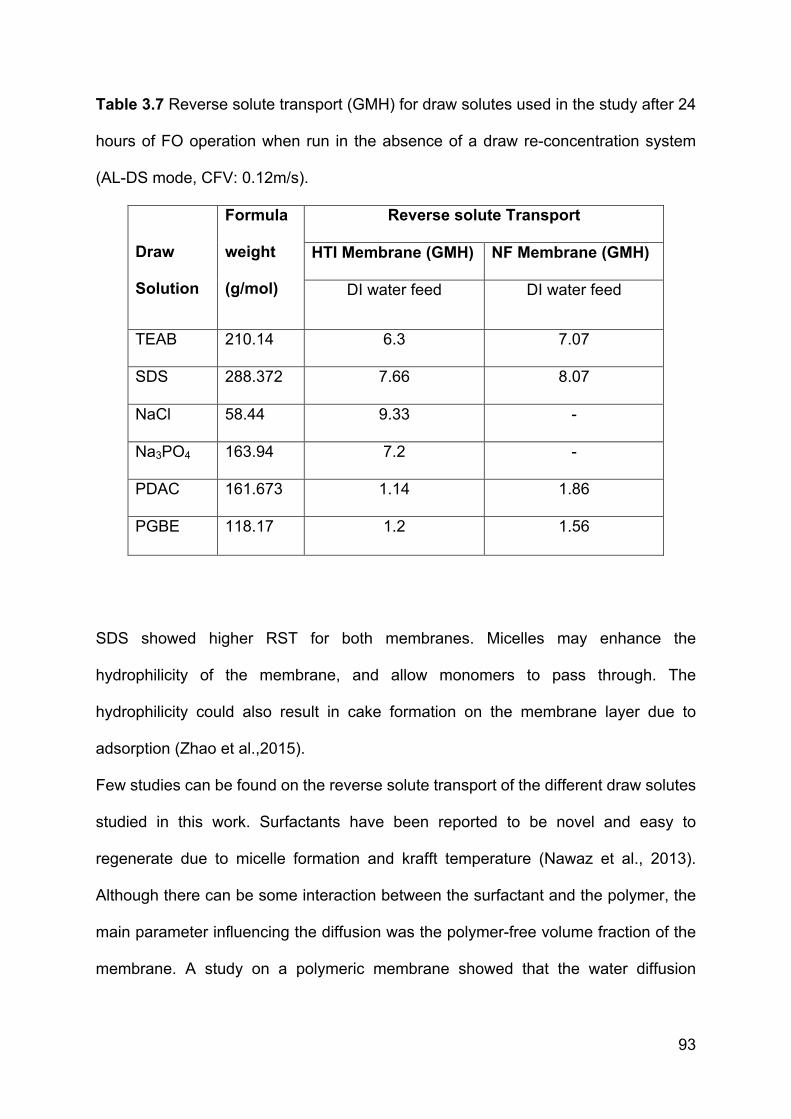
93
Table 3.7 Reverse solute transport (GMH) for draw solutes used in the study after 24
hours of FO operation when run in the absence of a draw re-concentration system
(AL-DS mode, CFV: 0.12m/s).
Draw
Solution
Formula
weight
(g/mol)
Reverse solute Transport
HTI Membrane (GMH) NF Membrane (GMH)
DI water feed DI water feed
TEAB 210.14 6.3 7.07
SDS 288.372 7.66 8.07
NaCl 58.44 9.33 -
Na3PO4 163.94 7.2 -
PDAC 161.673 1.14 1.86
PGBE 118.17 1.2 1.56
SDS showed higher RST for both membranes. Micelles may enhance the
hydrophilicity of the membrane, and allow monomers to pass through. The
hydrophilicity could also result in cake formation on the membrane layer due to
adsorption (Zhao et al.,2015).
Few studies can be found on the reverse solute transport of the different draw solutes
studied in this work. Surfactants have been reported to be novel and easy to
regenerate due to micelle formation and krafft temperature (Nawaz et al., 2013).
Although there can be some interaction between the surfactant and the polymer, the
main parameter influencing the diffusion was the polymer-free volume fraction of the
membrane. A study on a polymeric membrane showed that the water diffusion
94
coefficients are mainly dependent on the polymer density, and no significant effect of
the polymeric surface was found (Valentene et al.,2005).
Unlike RO, solutes in FO can diffuse in both directions i.e. both forward and reverse.
The reverse diffusion takes place partly because of concentration polarization and
mostly because of the concentration gradient. In a separate study (Hanckok & Cath,
2009). Drawn water flux and reverse salt diffusion increased with increasing
concentration for both NaCl and MgCl2. DI was used as a feed and the experiments
were run in AL-FS configuration. When both draw solutes were used at similar osmotic
pressures, the flux was lower for MgCl2 (by 25-30%) compared to NaCl; the lower
diffusion coefficient of the former would lead to an increased severity of ICP The higher
viscosity of the MgCl2 also contributed to an increased ECP. The RST was also lower
for MgCl2 (by 59-67%). The reverse solute flux for MgCl2 may be subject to Donnan
equilibrium, whereby large Mg2 ions diffuse slower and limit the diffusion of counter
ions. Draw solute ions (Na and Cl) were shown to reverse diffuse at nearly equal molar
proportions in the case of MgSO4, CaSO4, K2SO4, H3PO4, and NH4HCO3 as feed
solutions, but in the case of Ba(NO3)2 the chloride ion diffused at a faster rate than
sodium.
Size exclusion and electrostatic effects clearly have an important role to play in forward
and reverse solute transport (Alsvik & Hagg, 2013). At lower and equal flow velocities,
the draw solute is concentrated at the membrane surface on the feed side and the
concentration boundary layer on the DS side of the membrane is not well mixed and
remains diluted. This results in diminishing chemical potential gradient between the
DS and feed solution and retardation in the net diffusion of salts into the feed solution
and high CFV has an important role to play in diminishing this (Hanckok & Cath, 2009).
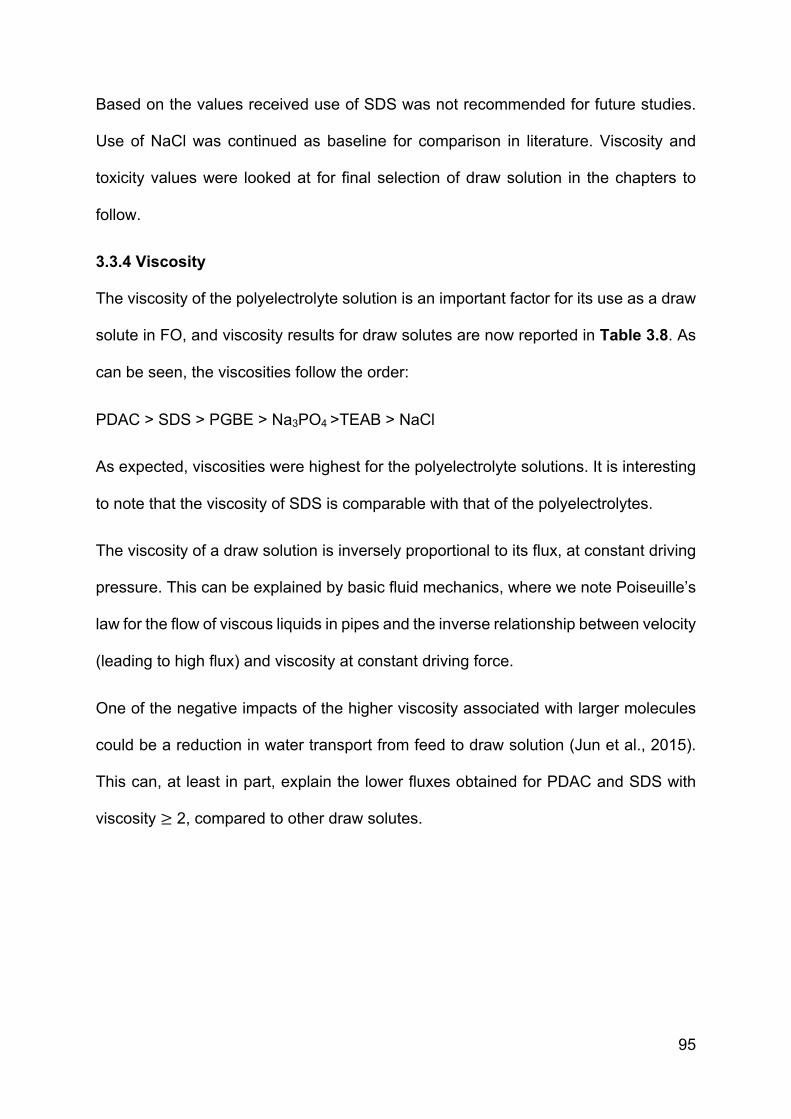
95
Based on the values received use of SDS was not recommended for future studies.
Use of NaCl was continued as baseline for comparison in literature. Viscosity and
toxicity values were looked at for final selection of draw solution in the chapters to
follow.
3.3.4 Viscosity
The viscosity of the polyelectrolyte solution is an important factor for its use as a draw
solute in FO, and viscosity results for draw solutes are now reported in Table 3.8. As
can be seen, the viscosities follow the order:
PDAC > SDS > PGBE > Na3PO4 >TEAB > NaCl
As expected, viscosities were highest for the polyelectrolyte solutions. It is interesting
to note that the viscosity of SDS is comparable with that of the polyelectrolytes.
The viscosity of a draw solution is inversely proportional to its flux, at constant driving
pressure. This can be explained by basic fluid mechanics, where we note Poiseuille’s
law for the flow of viscous liquids in pipes and the inverse relationship between velocity
(leading to high flux) and viscosity at constant driving force.
One of the negative impacts of the higher viscosity associated with larger molecules
could be a reduction in water transport from feed to draw solution (Jun et al., 2015).
This can, at least in part, explain the lower fluxes obtained for PDAC and SDS with
viscosity ≥ 2, compared to other draw solutes.
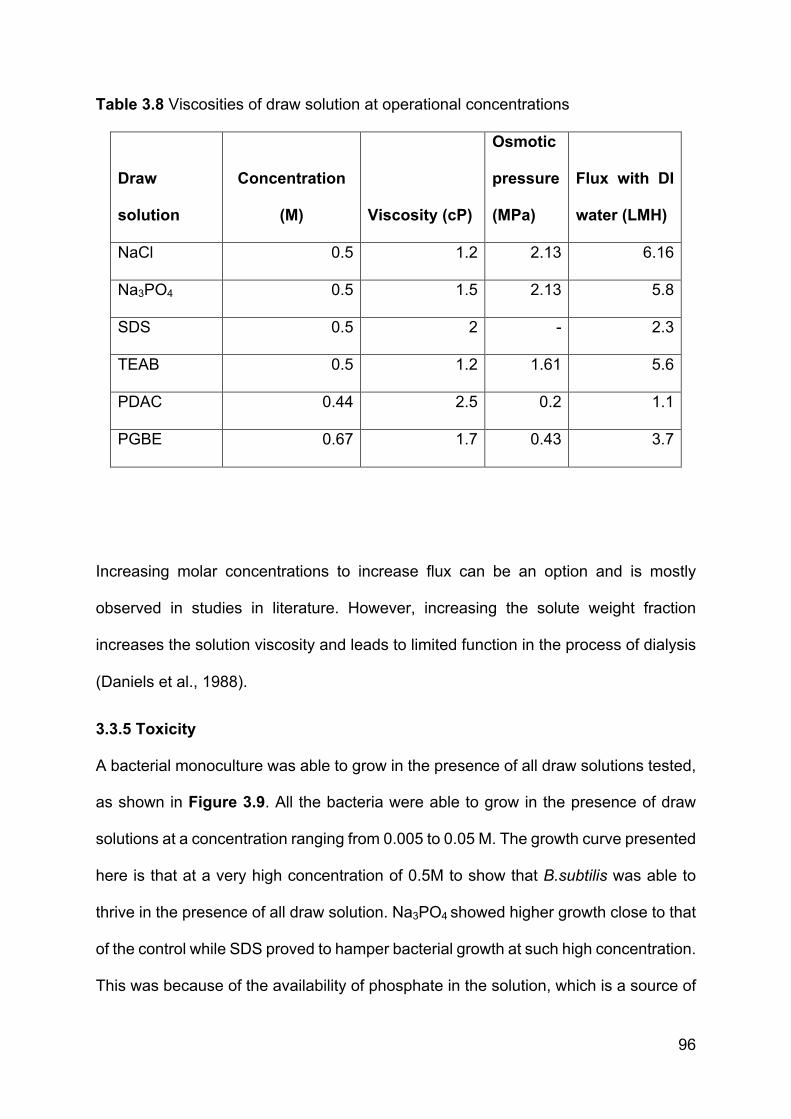
96
Table 3.8 Viscosities of draw solution at operational concentrations
Draw
solution
Concentration
(M) Viscosity (cP)
Osmotic
pressure
(MPa)
Flux with DI
water (LMH)
NaCl 0.5 1.2 2.13 6.16
Na3PO4 0.5 1.5 2.13 5.8
SDS 0.5 2 - 2.3
TEAB 0.5 1.2 1.61 5.6
PDAC 0.44 2.5 0.2 1.1
PGBE 0.67 1.7 0.43 3.7
Increasing molar concentrations to increase flux can be an option and is mostly
observed in studies in literature. However, increasing the solute weight fraction
increases the solution viscosity and leads to limited function in the process of dialysis
(Daniels et al., 1988).
3.3.5 Toxicity
A bacterial monoculture was able to grow in the presence of all draw solutions tested,
as shown in Figure 3.9. All the bacteria were able to grow in the presence of draw
solutions at a concentration ranging from 0.005 to 0.05 M. The growth curve presented
here is that at a very high concentration of 0.5M to show that B.subtilis was able to
thrive in the presence of all draw solution. Na3PO4 showed higher growth close to that
of the control while SDS proved to hamper bacterial growth at such high concentration.
This was because of the availability of phosphate in the solution, which is a source of
97
phosphorus for bacteria and a constituent of nucleic acids, nucleotides, phospholipids,
LPS, teichoic acids etc. SDS too is known to be toxic but the gram negative bacteria
still did well at the higher concentration presented.
Few previous studies have been performed on draw solute toxicity for bacteria. For E.
coli toxicity, eight inorganics were tested in one study (Nawaz et al.,2013); sodium
chloride [NaCl], calcium chloride [CaCl2], potassium chloride [KCl], magnesium
chloride [MgCl2], potassium sulfate [K2SO4], magnesium sulfate [MgSO4], sodium
sulfate [Na2SO4], ammonium sulfate [(NH4)2SO4]. Four surfactants were also tested;
TMOAB, DTAB, MTAB, and SDS. SDS was strongly recommended, based on its
ability to generate high fluxes and allow E. coli to grow at all concentrations tested.
Among inorganic draw solutions, MgCl2, CaCl2 and ammonium sulfate were highly
recommended because of high fluxes and non-toxicity, while sodium sulfate was not
recommended because of reduced bacterial growth
As a follow up to the study by Nawaz et al cited above, a more detailed study was
conducted using P.aeruginosa monoculture and an activated sludge mixed consortium
to see the effect of draw solution concentration on feed. Four surfactants TEAB,
TMOAB, SDS, and 1-OSA were tested for toxicity. Reverse solute transport for
surfactants as draw solutions was observed to be much lower as compared to that for
inorganic draw solutes. Significant bacterial growth was observed in the presence of
TEAB and SDS, and therefore these two draw solutions were recommended for future
studies (Nawaz et al., 2016).
This has now been carried on to prove that these draw solutes were not toxic to
bacteria even at higher concentration. Inorganic draw solutions were least toxic,
followed by polyelectrolytes and surfactants. Because of better bacterial growth PDAC
98
and TEAB were continued as draw solution and NaCl was selected as baseline for
future studies.
Figure 3.9 Optical density of bacterial solution using microbroth dilution test in
minimal media with draw solutes
3.4. Conclusions
• The experimental results were in agreement with the hypothesis that an NF
membrane for FO yields better fluxes as compared to the commercial HTI CTA
membrane. However, for both FO and NF, the initial fluxes were lower than that
achieved with DI water when the feed was changed to monoculture MBR.
The decrease in Flux for CTA membrane was:
-0.1
0
0.1
0.2
0.3
0.4
0.5
0.6
0.7
0 5 10 15 20 25 30
TEAB
PDAC
PGBE
Na3PO4
NaCl
SDS
Control
Time (h)
Op
tica
l Den
sity
99
TEAB (28.5 %), Na3PO4 (44.8 %), PGBE (18.9%), NaCl (38%), PDAC (27%),
SDS (13%)
While the decrease in flux for NF with the change in feed was as follows:
PDAC (57%), TEAB (41 %), PGBE (20.4%), SDS (12.5%).
• Flux decline over a period of time was also relatively high; however, since a re-
concentration system was not in place, it was difficult to conclude whether that
was because of increasing concentration polarization in the feed, draw dilution,
RST of draw into the feed or fouling of the membrane. For CTA membrane with
DI water the decline in flux was 8 hours was as under:
NaCl (38.3%), SDS (13%), TEAB (28.57%), PDAC (27%), PGBE (18.9%),
Na3PO4 (19.2%)
The flux decline overtime for FO-MBR configuration with CTA membrane is
given here:
NaCl (43%), SDS (14.2%), TEAB (33.3%), PDAC (33.3%), PGBE (21.4%),
Na3PO4 (30.4%)
All the draw solute have an additional decline in flux in FO-MBR configuration
and role of biofouling or cake formation can be noticed.
• Typical levels of reverse solute Transport (RST) were not toxic to bacterial
monoculture FOMBRs. At the highest concentration of draw solute tested
(0.5M), a significant percentage growth (relative to the absence of the draw
solute) was still achieved by all draw solutes. SDS showed the lowest
percentage growth of 16% and Na3PO4 showed the highest percentage growth
of 53%, followed by NaCl (46.5%), PDAC (33.8%), TEAB (28.83%), and PGBE
(18.34%) respectively. Yet typical concentration values of draw solute
100
undergoing RST in this study are below 0.5M and therefore use of these draw
solutes with a biological feed is supported by this study.
• Draw solutes that exhibited higher viscosity e.g. PDAC and SDS had viscosities
≥ 2cP, also exhibited lower fluxes. Viscosity of a draw solution is therefore
important in draw solution selection.
• Flat sheet/hollow fibre NF membranes in combination with high molecular
weight draw solutes provide potentially attractive working systems for the
FOMBR because:
o The fluxes were higher when an NF membrane was in place for the FO-
MBR (as shown in Table 3.5); however, the percentage decline in flux
with time was also higher for the NF membrane.
o The reverse solute transport values, although slightly higher, were still
comparable to the HTI membrane (as shown in Table 3.6).
So far, the regeneration of draw solutions has not been considered. Nevertheless, it
is important to study the characterization of the membranes and draw solutions being
used in the presence of a continuous regeneration system, in order to optimize the
process when running under continuous and long-term operation. With this in mind,
an FO-MD hybrid was set up in the next phase of the project.
101
Chapter 4
Integration of Forward Osmosis and Membrane Distillation Units for
Regeneration of Novel Draw Solutions and Water Reclamation
4.1 Introduction
The overall aim of this work was to perform an engineering-oriented study of the
component parts and integrated operation of a continuous and feasible FOMBR-MD
system. In Chapter 3, novel draw solutions were tested for a batch FO system without
a re-concentration process. Nevertheless, It is recommended that a continuous
recovery system should be put in place to better study such issues as long-term
performance and permeate quality. The FO-MD hybrid system was chosen because
it was relatively straight forward to establish in combination with the FOMBR in our
lab, and is promising as a low (perhaps using waste-grade) energy technique for draw
solute regeneration. MD had similar set-up requirements (Figure 4.1) to that of the FO
setup already established in the lab (Figure 3.2). The modest temperature difference
at which water recovery could be achieved using MD made it easy to run a continuous
hybrid system. Both the FO and MD setups had a similar cell design. The main
additions to the setup to run the MD were the water heating (using a water bath) and
cooling (chiller) mechanism. The effects of feed and permeate temperature, and the
cross-flow velocity, were included in the study.
In this Chapter, an MD setup was established at bench scale and optimized for
reconcentrating the draw solution continuously to produce clean water alongside FO.
This hybrid setup was used to develop a continuous and self-regenerating FO-MD
system to study the reverse transport of solute, toxicity, and fouling of the membrane
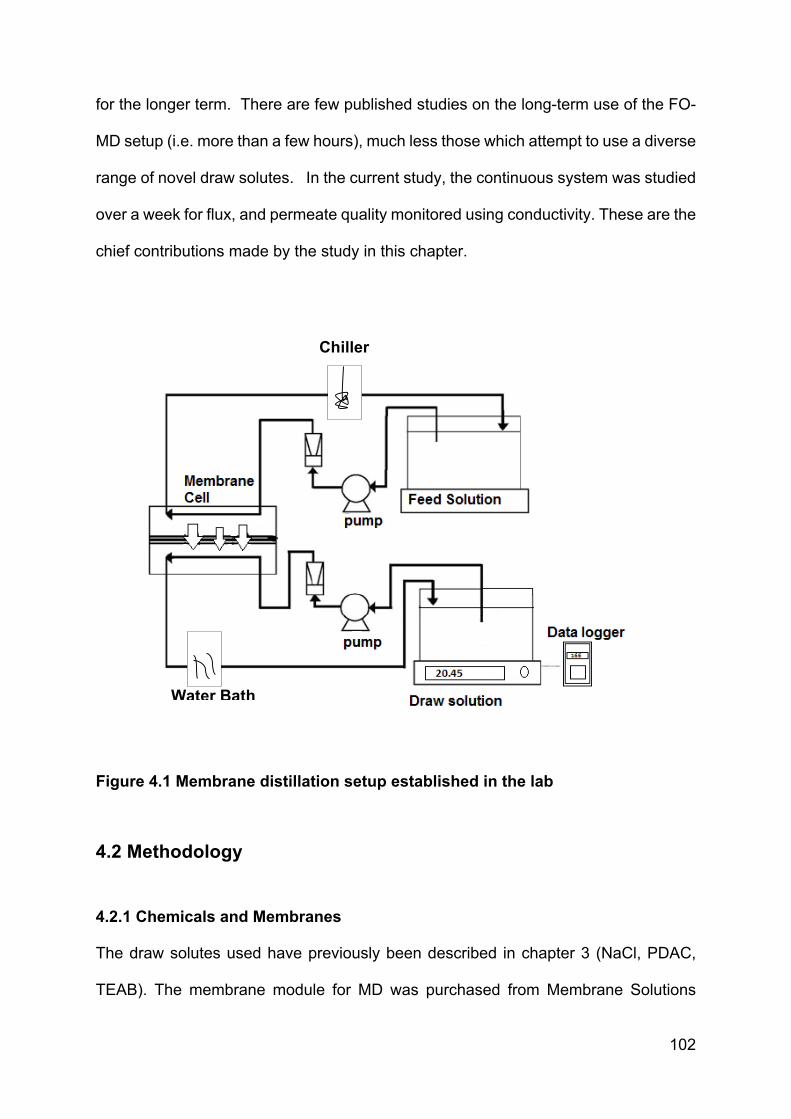
102
for the longer term. There are few published studies on the long-term use of the FO-
MD setup (i.e. more than a few hours), much less those which attempt to use a diverse
range of novel draw solutes. In the current study, the continuous system was studied
over a week for flux, and permeate quality monitored using conductivity. These are the
chief contributions made by the study in this chapter.
Figure 4.1 Membrane distillation setup established in the lab
4.2 Methodology
4.2.1 Chemicals and Membranes
The draw solutes used have previously been described in chapter 3 (NaCl, PDAC,
TEAB). The membrane module for MD was purchased from Membrane Solutions
Water Bath
Chiller
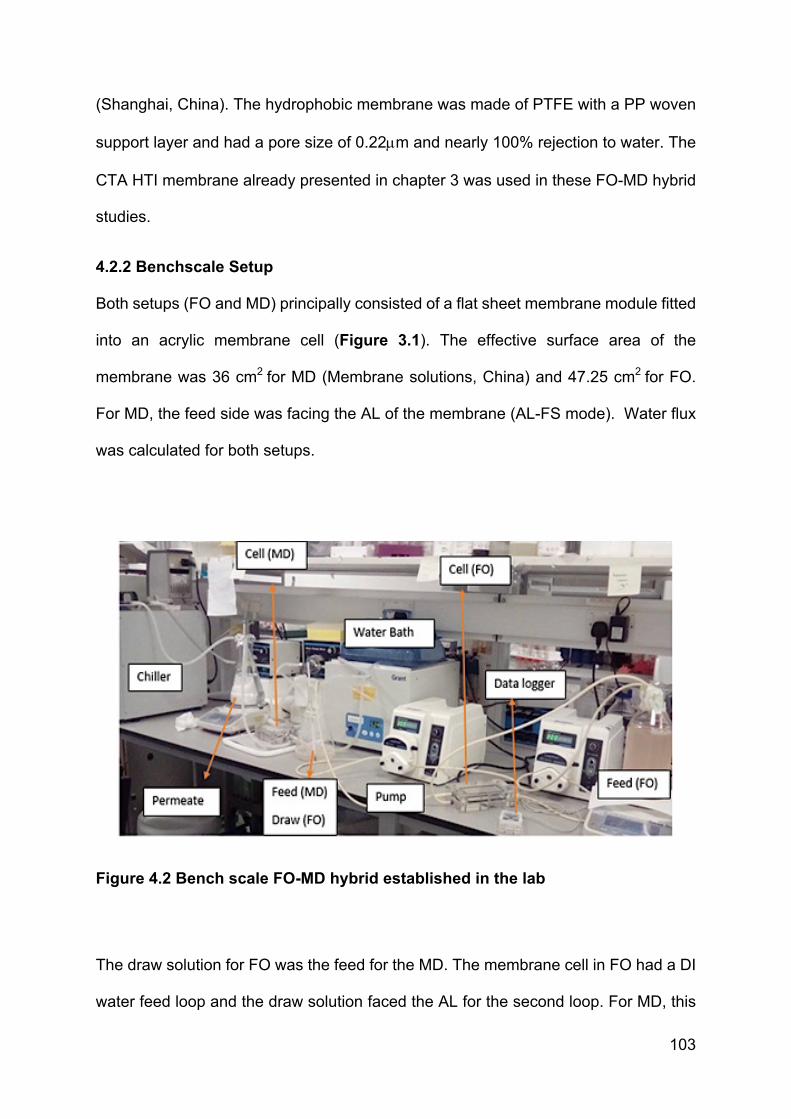
103
(Shanghai, China). The hydrophobic membrane was made of PTFE with a PP woven
support layer and had a pore size of 0.22µm and nearly 100% rejection to water. The
CTA HTI membrane already presented in chapter 3 was used in these FO-MD hybrid
studies.
4.2.2 Benchscale Setup
Both setups (FO and MD) principally consisted of a flat sheet membrane module fitted
into an acrylic membrane cell (Figure 3.1). The effective surface area of the
membrane was 36 cm2 for MD (Membrane solutions, China) and 47.25 cm2 for FO.
For MD, the feed side was facing the AL of the membrane (AL-FS mode). Water flux
was calculated for both setups.
Figure 4.2 Bench scale FO-MD hybrid established in the lab
The draw solution for FO was the feed for the MD. The membrane cell in FO had a DI
water feed loop and the draw solution faced the AL for the second loop. For MD, this
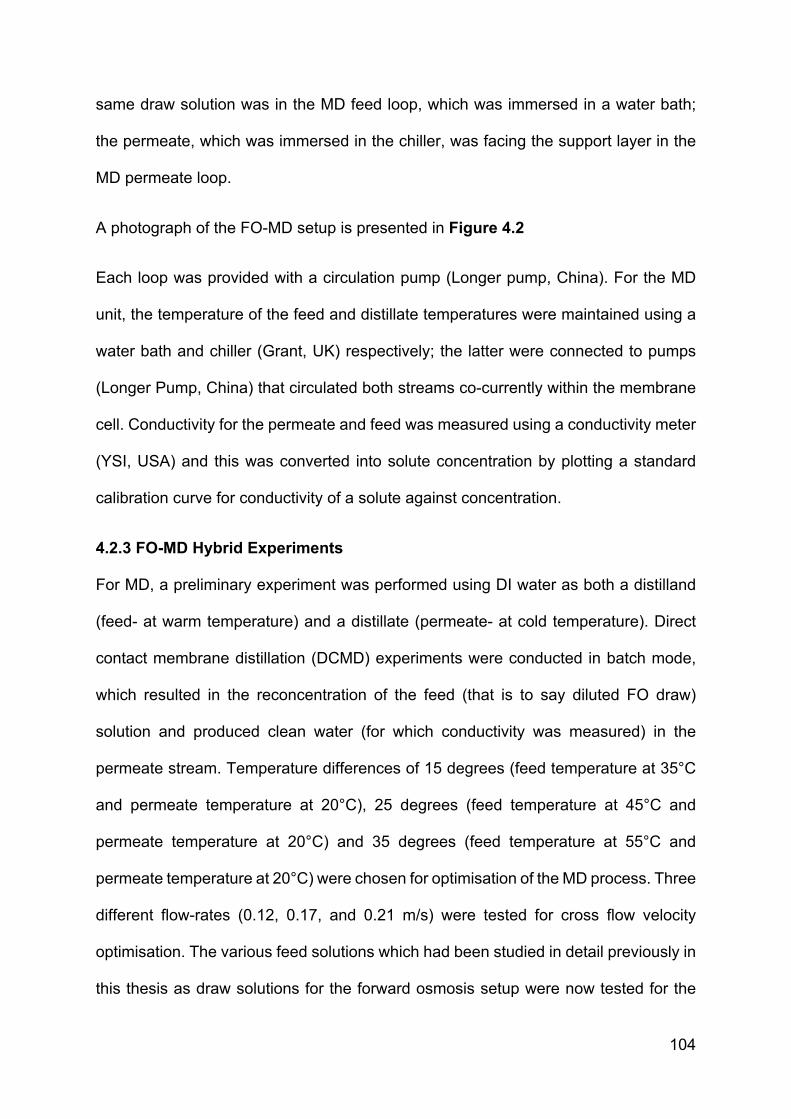
104
same draw solution was in the MD feed loop, which was immersed in a water bath;
the permeate, which was immersed in the chiller, was facing the support layer in the
MD permeate loop.
A photograph of the FO-MD setup is presented in Figure 4.2
Each loop was provided with a circulation pump (Longer pump, China). For the MD
unit, the temperature of the feed and distillate temperatures were maintained using a
water bath and chiller (Grant, UK) respectively; the latter were connected to pumps
(Longer Pump, China) that circulated both streams co-currently within the membrane
cell. Conductivity for the permeate and feed was measured using a conductivity meter
(YSI, USA) and this was converted into solute concentration by plotting a standard
calibration curve for conductivity of a solute against concentration.
4.2.3 FO-MD Hybrid Experiments
For MD, a preliminary experiment was performed using DI water as both a distilland
(feed- at warm temperature) and a distillate (permeate- at cold temperature). Direct
contact membrane distillation (DCMD) experiments were conducted in batch mode,
which resulted in the reconcentration of the feed (that is to say diluted FO draw)
solution and produced clean water (for which conductivity was measured) in the
permeate stream. Temperature differences of 15 degrees (feed temperature at 35°C
and permeate temperature at 20°C), 25 degrees (feed temperature at 45°C and
permeate temperature at 20°C) and 35 degrees (feed temperature at 55°C and
permeate temperature at 20°C) were chosen for optimisation of the MD process. Three
different flow-rates (0.12, 0.17, and 0.21 m/s) were tested for cross flow velocity
optimisation. The various feed solutions which had been studied in detail previously in
this thesis as draw solutions for the forward osmosis setup were now tested for the
105
performance of the DCMD setup. The draw solutes included TEAB (surfactant), PDAC
(polyelectrolyte), and NaCl (inorganic/baseline). These draw solutes were dissolved
in DI water to formulate the initial draw solutions, all at a concentration of0.5M). The
experiments were run over several days (3-7) to understand the effects of draw solute
dilution and concentration polarization on the flux of the FO and MD membranes. For
MD, the membrane orientation was AL-FS and for FO the membrane orientation was
AL-DS; this latter was because DI water was used as feed for these optimisation
experiments.
4.3 Results and Discussion
4.3.1 Effect of Temperature on MD Flux
The feed temperature is an important parameter in the membrane distillation process
as it controls the vapour formation. Since the permeate production rate is proportional
to the vapour pressure difference between feed and permeate (Equation 4.1),
increasing the feed temperature will increase the permeate production rate.
When the feed temperature and thus the temperature difference across the membrane
is low, permeate flux has a direct linear relationship with the partial pressure difference
across the membrane (Khayat & Matsuura, 2011), as presented in equation 4.1; it
can thus be controlled.
+", − +". =0+
01 1"1", − 1". …………………………………………..……………4.1
Where 234 − 235 is the transmembrane vapour pressure difference, and 634 − 635 is
the transmembrane temperature difference, and dP/dT represents the vapour
pressure gradient at Tm. The flux for MD can be represented by equation 4.2:
106
78 = &8∆P:…………………...……………………………………………………………4.2
Where <= is the permeate flux, >= is the mass transfer coefficient and ∆Pm is the
transmembrane vapour pressure difference. Combining both equations, we get
equation 4.3:
78 = &8 0+
01 ∆1"1", − 1". ……………………………………………………………4.3
Antione’s equation describes the relationship between vapour pressure and
temperature for water (between 0ºC and 373.946ºC). Note that for temperatures above
the critical temperature (373.946ºC), where water is a supercritical fluid, the vapour
pressure gradient is practically constant the an inverse slope (i.e. dT/dP) ≈ 235
kPa/ºC.
A temperature difference of 15°C (feed temperature: 35°C, permeate temperature:
20°C) was preferred for final operation out of the three combinations available, based
on the principle that low-grade waste heat at low temperatures is available on-site in
many industrial sites or in homes, and is thus convenient to use for membrane
distillation. Note that the concept of using solar-driven MD is also promising for green
and environmentally-friendly water treatment and desalination using solar powered
membrane distillation (Qtaishat & Banat, 2012; Chang et al., 2010). The draw solutions
NaCl (0.5M), PDAC (0.15M) and TEAB (0.5M) were tested against the above
temperature differences at a cross flow velocity of 0.12m/s, and the results are shown
in Figure 4.3.
MD involves simultaneous heat and mass transfer processes, and therefore heat and
mass transfer profiles are involved simultaneously, as shown in Figure 4.4
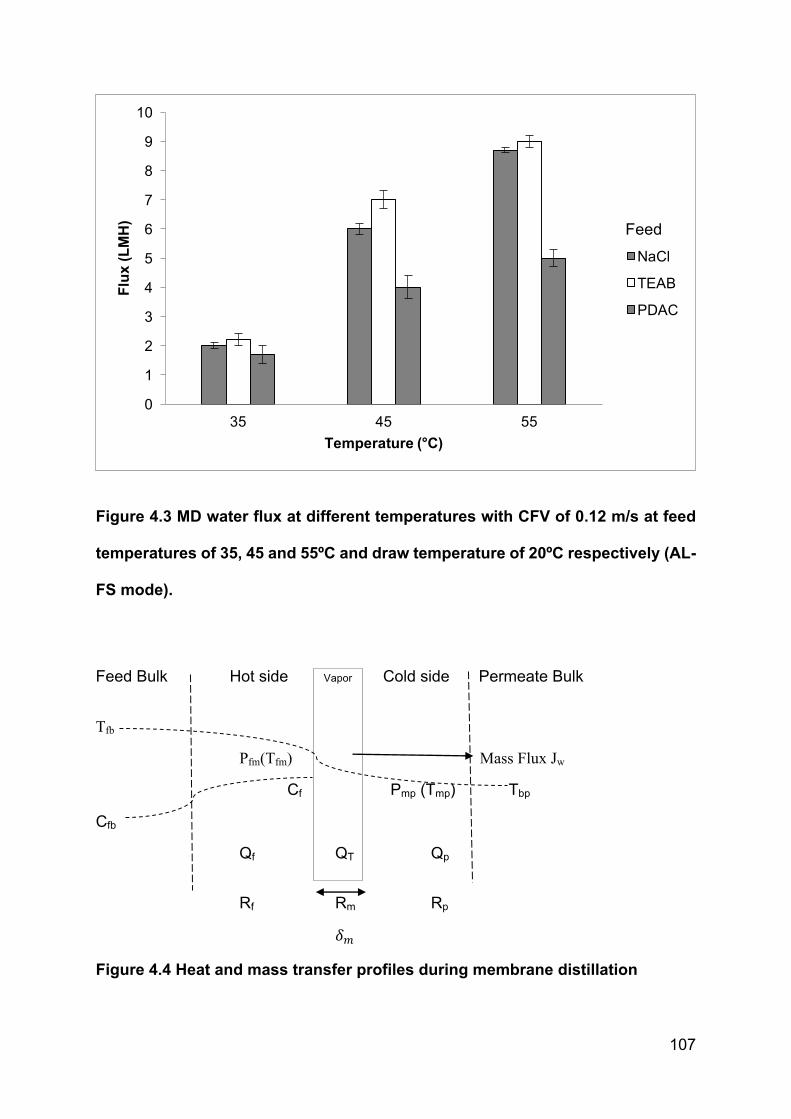
107
Figure 4.3 MD water flux at different temperatures with CFV of 0.12 m/s at feed
temperatures of 35, 45 and 55ºC and draw temperature of 20ºC respectively (AL-
FS mode).
Feed Bulk Hot side Vapor Cold side Permeate Bulk
Tfb
Pfm(Tfm) Mass Flux Jw
Cf Pmp (Tmp) Tbp
Cfb
Qf QT Qp
Rf Rm Rp
@3
Figure 4.4 Heat and mass transfer profiles during membrane distillation
0
1
2
3
4
5
6
7
8
9
10
35 45 55
Flux
(LM
H)
Temperature (°C)
NaCl
TEAB
PDAC
Feed
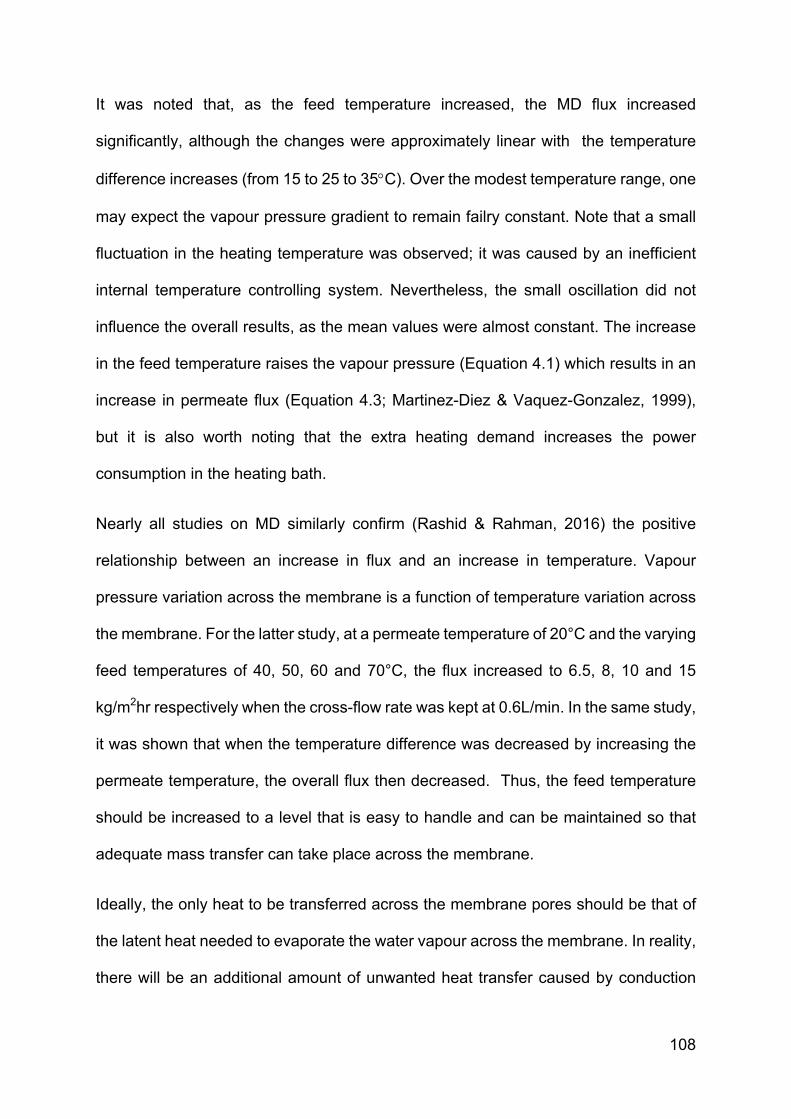
108
It was noted that, as the feed temperature increased, the MD flux increased
significantly, although the changes were approximately linear with the temperature
difference increases (from 15 to 25 to 35°C). Over the modest temperature range, one
may expect the vapour pressure gradient to remain failry constant. Note that a small
fluctuation in the heating temperature was observed; it was caused by an inefficient
internal temperature controlling system. Nevertheless, the small oscillation did not
influence the overall results, as the mean values were almost constant. The increase
in the feed temperature raises the vapour pressure (Equation 4.1) which results in an
increase in permeate flux (Equation 4.3; Martinez-Diez & Vaquez-Gonzalez, 1999),
but it is also worth noting that the extra heating demand increases the power
consumption in the heating bath.
Nearly all studies on MD similarly confirm (Rashid & Rahman, 2016) the positive
relationship between an increase in flux and an increase in temperature. Vapour
pressure variation across the membrane is a function of temperature variation across
the membrane. For the latter study, at a permeate temperature of 20°C and the varying
feed temperatures of 40, 50, 60 and 70°C, the flux increased to 6.5, 8, 10 and 15
kg/m2hr respectively when the cross-flow rate was kept at 0.6L/min. In the same study,
it was shown that when the temperature difference was decreased by increasing the
permeate temperature, the overall flux then decreased. Thus, the feed temperature
should be increased to a level that is easy to handle and can be maintained so that
adequate mass transfer can take place across the membrane.
Ideally, the only heat to be transferred across the membrane pores should be that of
the latent heat needed to evaporate the water vapour across the membrane. In reality,
there will be an additional amount of unwanted heat transfer caused by conduction
109
through the membrane. This conductive flux consists of the sum in series of the
conductive heat flux through the nonporous part of the polymeric membrane and the
conductive heat flux through the water vapour in the pore space of the membrane. The
loss due to this conductive flux results directly in a decrease in temperature of the hot
feed solution and an increase in temperature of the cold distillate water flowing in the
module (normally one or both of these temperatures is constrained at the surface, but
the effective difference across the membrane is smaller, and thus the required heating
rate is larger than that expected for a certain flux). This leads to temperature
polarization across the membrane. In short, a higher temperature difference is needed
for MD to achieve a given flux. In addition, the surface tension and viscosity of the
water vapour (gas) affects the pore wetting and may result in contamination of the
permeate by the feed (Chemical Rubber Co, 1970); leakage is a greater potential
problem at higher temperatures.
Temperature polarization is measured with coefficient A, as shown in equation 4.4:
B = (1", − 1"D)/1D, − 1DD)……………………………………………………………..4.4
Where Tmf and Tmb are the temperatures at the hot and cold membrane surfaces,
respectively, while Tbf and Tbb are the temperatures in the feed and permeate bulk
solutions, respectively (Martinez-Diez & Vaquez-Gonzalez, 1999).
As mentioned above, the increase in temperature may also increase the forward
transport of the solutes in the feed solution by increasing the fluid-phase movement of
these molecules, due to wetting of the membrane (because of increase in diffusion
with temperature). In these studies, conductivity in the permeate (20ºC) increased as
the feed temperature was increased, indicating a solute leakage across the
110
membrane, which is another reason for preferring a lower temperature difference for
the FO-MD hybrid.
In terms of the safety and permissibility of the draw solutes, PDAC is used in drinking
water as a coagulant and is not considered a hazard either by contact or ingestion. It
is also important to note that as a part of the manufacturing process, NaCl is a
constituent of the PDAC product solution. A maximum dose of 10mg/L PDAC is
permitted by the drinking water inspectorate of the UK in their September 2015 report.
Similarly, NaCl is commonly found in drinking water but WHO recommends an overall
consumption of less than 2g/L of NaCl daily as being more beneficial than >2g/L of
salt consumption a day. The limits for TEAB in drinking water are not defined, probably
because it is not expected to be present in the drinking water. Note however, that food-
grade (i.e. consumable in small quantity) surfactants are available as an alternative.
4.3.2 Effect of Feed Flow on MD Flux
As seen in the section above, optimization of the MD process with respect to
temperature is not straight-forward because temperature polarization is a non-linear
process and difficult to predict. In addition, because of concentration polarization,
cross flow velocity and the concentration of the feed must also be considered during
optimisation. Various feed cross flow velocities (0.12, 0.17, and 0.21m/s) were tested
to optimize the feed cross-flow velocity for the bench scale lab setup. The results of
this experiment are shown in Figure 4.5.
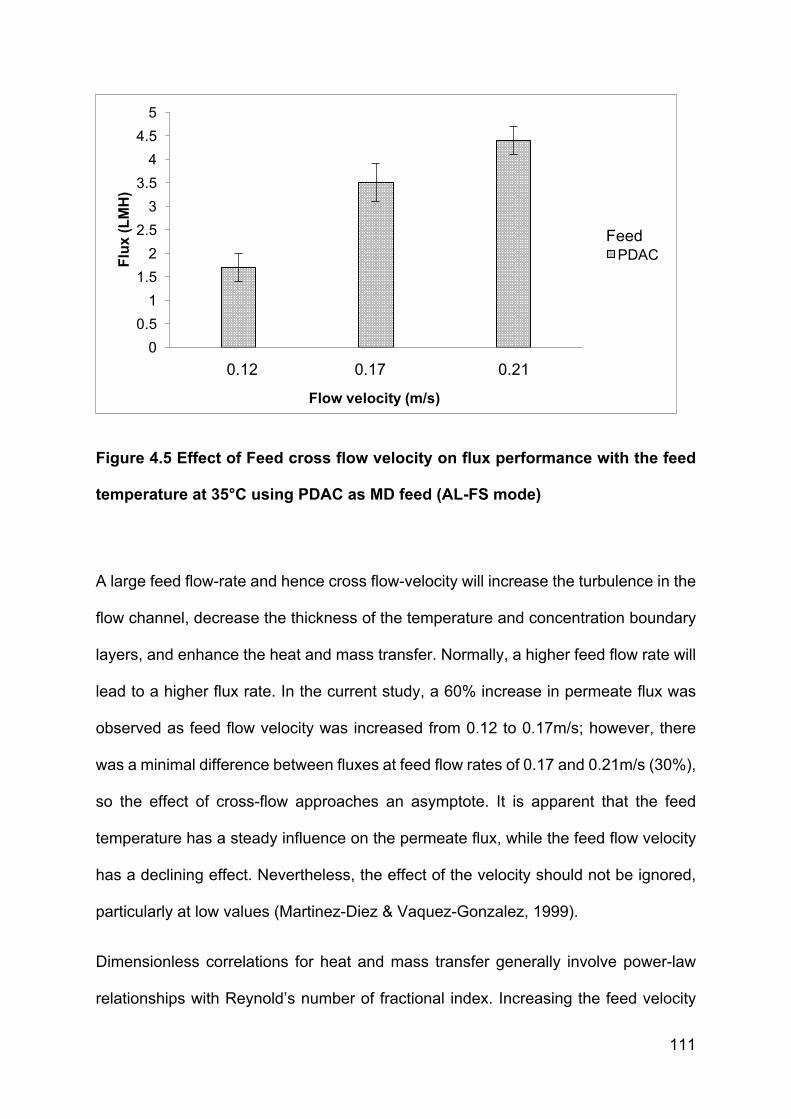
111
Figure 4.5 Effect of Feed cross flow velocity on flux performance with the feed
temperature at 35°C using PDAC as MD feed (AL-FS mode)
A large feed flow-rate and hence cross flow-velocity will increase the turbulence in the
flow channel, decrease the thickness of the temperature and concentration boundary
layers, and enhance the heat and mass transfer. Normally, a higher feed flow rate will
lead to a higher flux rate. In the current study, a 60% increase in permeate flux was
observed as feed flow velocity was increased from 0.12 to 0.17m/s; however, there
was a minimal difference between fluxes at feed flow rates of 0.17 and 0.21m/s (30%),
so the effect of cross-flow approaches an asymptote. It is apparent that the feed
temperature has a steady influence on the permeate flux, while the feed flow velocity
has a declining effect. Nevertheless, the effect of the velocity should not be ignored,
particularly at low values (Martinez-Diez & Vaquez-Gonzalez, 1999).
Dimensionless correlations for heat and mass transfer generally involve power-law
relationships with Reynold’s number of fractional index. Increasing the feed velocity
00.5
11.5
22.5
33.5
44.5
5
100 350 550
Flux
(LM
H)
Flow velocity (m/s)
PDACFeed
0.12 0.17 0.21
112
results in an increase in the Reynolds number, which decreases the mass and heat
transfer boundary layer thickness and increases the mass and heat transfer
coefficients (Boubakri et al., 2014b) but at a slower rate of increase.
4.3.3. Effect of Feed Type on MD Flux
Like temperature polarization, concentration polarization also leads to a reduced
effective driving force for transport. Concentration polarization is primarily governed
by the flux level. Concentration polarization at a membrane surface is quantified using
the parameter G and is presented in equation 4.5 for a feed to the membrane
H =&",&D,
……………………………………………………………………………………4.5
Where, Cmf and Cbf are the feed concentration at the membrane surface and the bulk,
respectively (Martinez-Diez & Vaquez-Gonzalez, 1999).
Since the feed for the MD unit is the diluted draw solution exiting from the FO unit in
the FO-MD hybrid, the effect of feed concentration for MD was also studied in the
current study. The FO flux was high for simple feeds such as NaCl (2.1LMH), followed
by slightly lower values for TEAB (1.9LMH) and then PDAC (1.8LMH) under similar
feed with AL-DS mode at 0.12m/s.
An increase in concentration of the solute in the feed can slightly decrease the heat
transfer coefficient i.e. at higher solute concentrations; the solution becomes more
viscous; the thermal conductivity also becomes lower and reduces the convective heat
transfer. Slower rates of heat transfer from bulk flow to the membrane surface increase
the temperature polarization.
113
In a previous study (Boubakri et al., 2014), NaCl solution was used as a feed and it
was shown that the fluxes reduced significantly compared to when only distilled water
was used as a feed. This is because of the fact that NaCl addition leads to a reduction
in the vapour pressure of the water.
In another study (Hwang et al., 2011) at a feed temperature of 60°C, a permeate
temperature of 20°C and a cross flow velocity of 0.5m/s, the permeation flux
decreased by 10.9% when the feed NaCl concentration increased from 1 to 6 wt%.
The associated decrease in bulk vapour pressure was approximately 5.2%. The
reason for the bigger than expected drop was attributed to membrane surface
temperature polarization that was initially ignored in the study. The temperature
polarization layer formed on the PTFE reduces water permeation and the reduction is
high when the concentration (of NaCl) and thus flux increases. The effect of salt
concentration on flux thus appears to be stronger than the consequent vapour
pressure difference alone. This might have arisen as a result of a concentration
polarization layer forming on the membrane surface, which would tend to reduce the
convection heat transfer due to the latter coupling with the mass transfer.
The highest flux was observed for NaCl, possibly because of the greater ability of fully
dissociative salts to reduce the vapour pressure of a solution. This can affect the flux
as vapour pressure driving force is reduced.
The vapour pressure of a non-volatile solution is governed by Raoult’s law, given in
equation 4.6:
Psolution=(Xsolvent)(P°solvent)…………………..…………………………………………....4.6

114
Where P is the vapour pressure, Xsolvent is the mole fraction and P° is the vapour
pressure of the pure solvent. In this study, water was used as a solvent and has a
vapour pressure of 3.16 KPa at room temperature while 0.5 M NaCl solution has a
vapour pressure of 2.6 KPa.
For a single feed solute, increasing the concentration can decrease the MD flux. Feed
fluxes between 4.5 and 10 wt% NaCl solutions have been studied (Naidu et al., 2017)
and the study demonstrated that permeate flux decreased with increasing
concentration. This was attributed to a reduction in the driving force to transport the
vapour through the membrane pores. This study also showed that addition of CaSO4
or bovine serum albumin (BSA) into NaCl solution did not cause severe fouling.
However, an addition of MgCl2 and MgSO4 did have a fouling tendency on the PTFE
membrane. This same PTFE membrane, also used in the current study, has been
reported for its durability and higher solute rejection compared to that of PVDF which
is the second most widely used MD membrane (Cheng et al., 2010).
Surfactant adsorption on hydrophobic surfaces is co-cooperative; surfactant
monomers in general do not form micellar-type structures on the surfaces, and instead
they form hemi-micelles (monolayers) or admicelles (bilayers) (Naidu et al.,2017).
There is strong evidence of surfactants causing a wetting of the membrane. Indeed,
surfactant concentration and hydrophobicity have an influence on both membrane
fouling and wetting behaviour. Hydrophobic interactions (nonpolar tails) and
electrostatic interactions (polar heads) typically play crucial roles in the adsorption of
ionic surfactants like SDS. Surfactants can carry both negative and positive charges
on their hydrophilic head groups and will be attracted to opposite charges on the
membrane surface. However, they can still adsorb on electro-neutral surfaces via
hydrophobic (tail-surface) interactions. In general, the higher the concentration, the
115
higher the adsorption that could be observed. When more SDS monomers were
adsorbed onto the membrane surface, they rendered the membrane more hydrophilic,
implying the formation of tails-down heads-up monolayers or heads-down heads-up
bilayers. The hydrophilic heads may be able to draw more liquid water from the feed
into the permeate by reducing the contact angle within pores and will thus increase
the wetting of the membrane (Ling et al., 2011), allowing for liquid migration and
possible hydrodynamic solute transport into the permeate.
4.3.4 Performance of FO-MD Hybrids with Various Draw Solutions
FO-MD hybrid results with DI water as a feed solution are presented in Figures 4.6,
4.7 and 4.8. Relatively simple draw solutes such as NaCl, which are more soluble at
a higher temperature and give rise to a higher osmotic flux, also lead to greater
lowering of vapour pressure; as a consequence, the rate at which they draw water
from the FO feed keeps up with and seems balanced with the rate at which water is
being drawn from the draw solution as MD Permeate. However, the fluxes were
certainly not as balanced with the higher molecular weight draw solutes TEAB and
PDAC; in these cases the MD flux was always higher
The decline in flux for FO with NaCl as draw solute in Figure 4.6 indicates that the
fouling in the FO membrane is significant and takes place in a similar fashion to the
experiments without a regeneration system in place (Table 3.5). It was assumed in the
latter case that the dilution might result in a decline in flux. However, in the present
case with draw regeneration, since FO and MD fluxes are fairly balanced then the
dilution is not at all significant. The MD flux on the other hand seems somewhat more
stable, and the percentage decline in flux is lower for MD as compared to FO.
However, the decline in flux for the FO is low as compared to an FO system running
116
on its own without regeneration. As presented in chapter 3, Table 3.5, 38% decline in
flux was observed after 8 hours, while with the MD system in place, a 27% decline in
flux was observed only after 24 hours. Even at the end of day three, a less than 50%
decline in flux was observed, although this is still not an ideal result. As stated above,
in the current study the MD flux was roughly equal to the FO flux (or exceeded it),
suggesting that the draw solution is of steady or increasing concentration; thus the FO
flux should remain constant or even increase with time. This supports the hypothesis
that membrane fouling is likely to at least be partly the cause, though the effect of
reverse solute transport into the feed of the batch-type FO loop cannot be ignored (see
below). In a reported study of an FO-MD hybrid (Ge et al., 2012a), the conditions
were optimized such that the water transfer rate was the same for FO and MD units.
The study doesn’t show a decline in flux over a longer time but suggests that the flux
performance of an FO-MD hybrid was better than the performance of FO on its own
Compared to the flux for FO, the flux for MD was somewhat steadier and this may be
because the temperature of the latter was carefully controlled. However, over the days
of the experiment, controlling the temperature at a steady value using the water bath
and chiller was not straightforward due to changes in ambient temperature and the
water level decrease in the water bath (due to evaporation). Because of this, some
variation in fluxes can be expected. The MD flux shows that an increase in temperature
during the operation of a continuously running setup may affect the flux but not as
severely as for FO. The fluxes throughout a single day were very stable, and a less
than 25% decline in flux was observed even after the end of three days of operation.
It would certainly be recommended that the membranes be cleaned at the end of daily
operation or at least after two days of operation, to keep them clean and to avoid
membrane fouling which apparently leads to a steady decline.
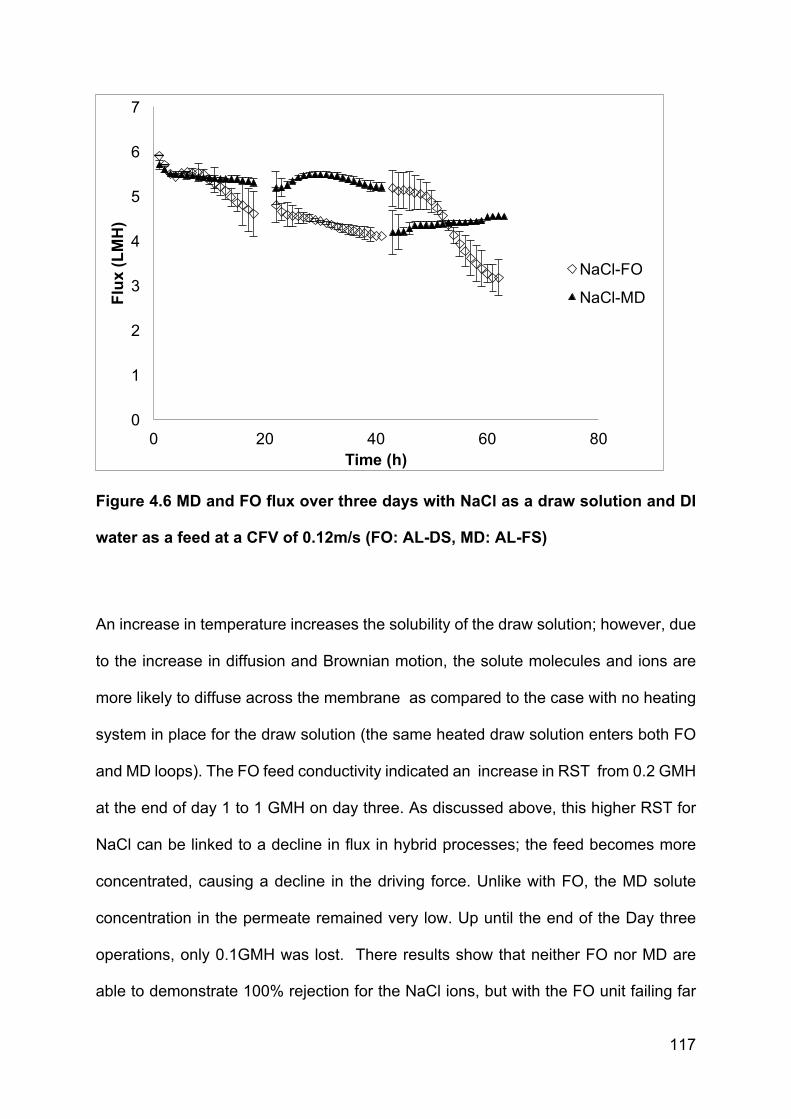
117
Figure 4.6 MD and FO flux over three days with NaCl as a draw solution and DI
water as a feed at a CFV of 0.12m/s (FO: AL-DS, MD: AL-FS)
An increase in temperature increases the solubility of the draw solution; however, due
to the increase in diffusion and Brownian motion, the solute molecules and ions are
more likely to diffuse across the membrane as compared to the case with no heating
system in place for the draw solution (the same heated draw solution enters both FO
and MD loops). The FO feed conductivity indicated an increase in RST from 0.2 GMH
at the end of day 1 to 1 GMH on day three. As discussed above, this higher RST for
NaCl can be linked to a decline in flux in hybrid processes; the feed becomes more
concentrated, causing a decline in the driving force. Unlike with FO, the MD solute
concentration in the permeate remained very low. Up until the end of the Day three
operations, only 0.1GMH was lost. There results show that neither FO nor MD are
able to demonstrate 100% rejection for the NaCl ions, but with the FO unit failing far
0
1
2
3
4
5
6
7
0 20 40 60 80
Flu
x (L
MH
)
Time (h)
NaCl-FO
NaCl-MD
118
worse. For this reason, it is advantageous therefore for higher molecular weight draw
solutes to be considered and evaluated.
The Na ion has a covalent radius of 0.157nm and an ionic radius of 0.095nm while the
Cl ion has a covalent radius of 0.099nm and an ionic radius of 0.181nm. As these ions
are very small in size, their permeation into some, if not all, membrane pores is highly
likely. Since the MD membranes have a porosity which is on the microscale (0.1-
0.22µm), this means that if wetting of the membrane is caused for any reason then the
draw solutes could readily leak into the permeate. Therefore, the setup should always
be monitored for any wetting changes by continuous permeate conductivity
monitoring. Looking at the hydrated size of the two ions, it seems likely that they might
also pass through an FO membrane with an effective pore size in the nanometer
range.
TEAB has been evaluated previously as a draw solution in Chapter 3 of this thesis.
The TEA cation has a hydrated radius of 0.45nm and an ionic radius of 0.385 nm and
is most likely to be retained by the FO membrane; however, the Br anion has an ionic
radius of 0.196nm. This means that, depending on the membrane size, the smaller
ions might be able to pass through. If we look at the flux in Figure 4.7, it can be seen
that in this case the flux is steadier for FO than for MD. This suggests that as the draw
solute increases in molecular weight and becomes more complex in molecular
structure, the decline in flux for MD is more obvious as compared to the case of the
simple solutes such as NaCl (see below). Nevertheless, at the outset, the system was
less balanced with respect to FO (lower) and MD (higher) fluxes than was the case
with simple inorganic draw solutes, though The overall decline in flux for TEAB is lower
in FO. The lower fluxes for the higher molecular weight draw solutes at similar
119
concentrations (See also Table 3.5) probably reflects both their lower diffusivity (and
greater tendency towards CP) and their lower activity.
The results show that the membrane should be cleaned, depending on the kind of feed
used. Because the MD flux exceeds the FO flux, the draw solution is being
concentrated at a higher rate than it is being diluted and the flux for FO would be
expected to increase. In fact, it remains relatively constant up until day two and then
reduces slightly on day three, which is indicative of fouling. This also suggests that
very high concentrations of surfactants should be avoided as a draw solution, due to
an increased fouling tendency.
The decline in MD flux can be related to the gradual increase in the draw solution
concentration and the consequent decrease in vapour pressure driving force. The
imbalance in fluxes suggests that the MD flux needs to be more carefully controlled
for the higher molecular weight draw solutes, such as via reduction of feed
temperature; at the outset of the experiment, the MD flux was too high.
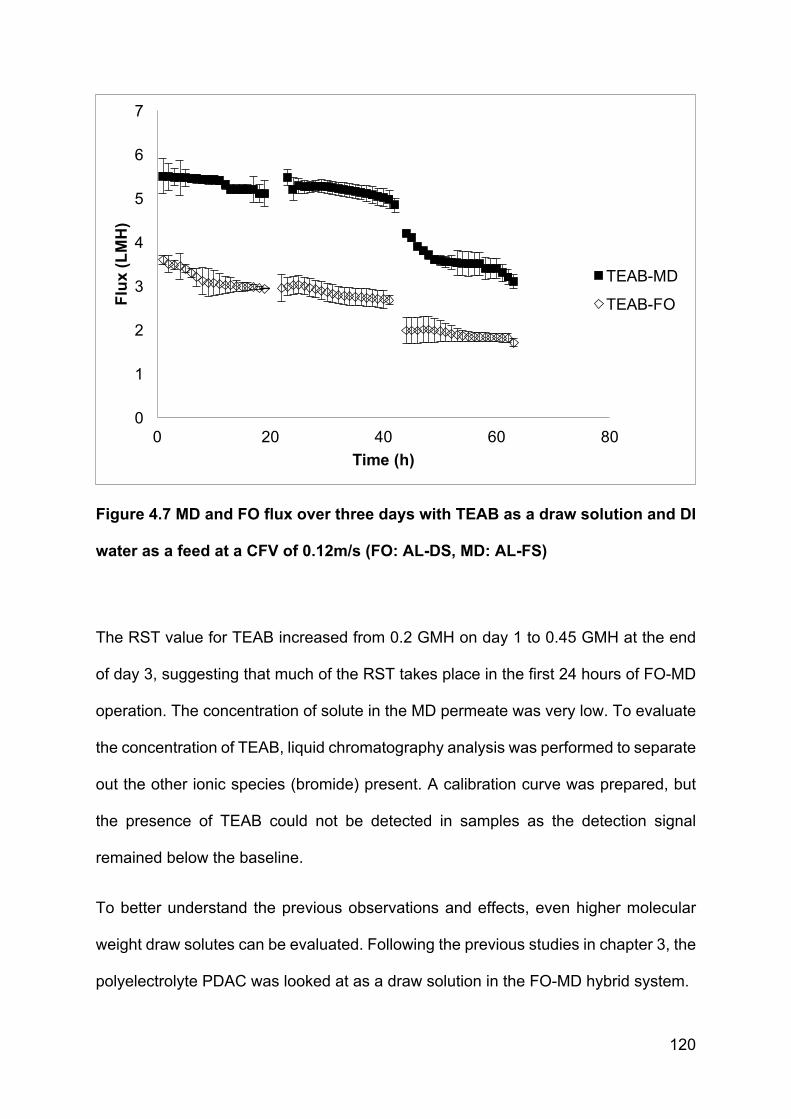
120
Figure 4.7 MD and FO flux over three days with TEAB as a draw solution and DI
water as a feed at a CFV of 0.12m/s (FO: AL-DS, MD: AL-FS)
The RST value for TEAB increased from 0.2 GMH on day 1 to 0.45 GMH at the end
of day 3, suggesting that much of the RST takes place in the first 24 hours of FO-MD
operation. The concentration of solute in the MD permeate was very low. To evaluate
the concentration of TEAB, liquid chromatography analysis was performed to separate
out the other ionic species (bromide) present. A calibration curve was prepared, but
the presence of TEAB could not be detected in samples as the detection signal
remained below the baseline.
To better understand the previous observations and effects, even higher molecular
weight draw solutes can be evaluated. Following the previous studies in chapter 3, the
polyelectrolyte PDAC was looked at as a draw solution in the FO-MD hybrid system.
0
1
2
3
4
5
6
7
0 20 40 60 80
Flu
x (L
MH
)
Time (h)
TEAB-MD
TEAB-FO
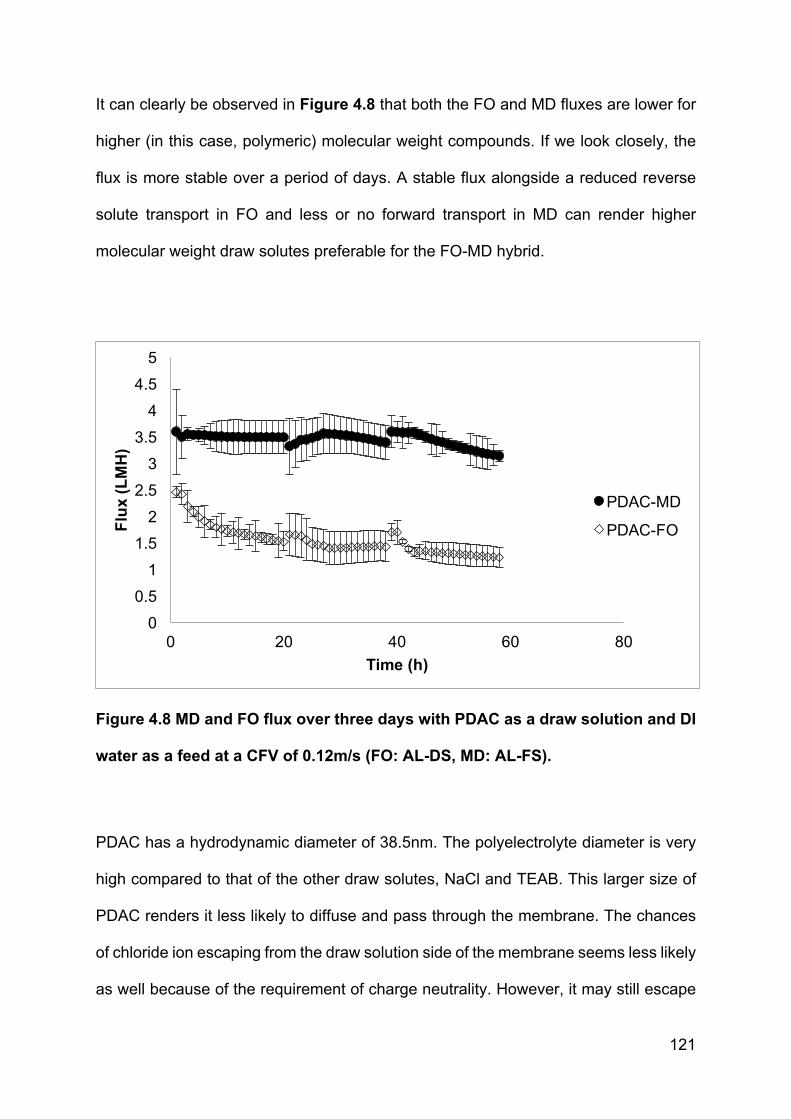
121
It can clearly be observed in Figure 4.8 that both the FO and MD fluxes are lower for
higher (in this case, polymeric) molecular weight compounds. If we look closely, the
flux is more stable over a period of days. A stable flux alongside a reduced reverse
solute transport in FO and less or no forward transport in MD can render higher
molecular weight draw solutes preferable for the FO-MD hybrid.
Figure 4.8 MD and FO flux over three days with PDAC as a draw solution and DI
water as a feed at a CFV of 0.12m/s (FO: AL-DS, MD: AL-FS).
PDAC has a hydrodynamic diameter of 38.5nm. The polyelectrolyte diameter is very
high compared to that of the other draw solutes, NaCl and TEAB. This larger size of
PDAC renders it less likely to diffuse and pass through the membrane. The chances
of chloride ion escaping from the draw solution side of the membrane seems less likely
as well because of the requirement of charge neutrality. However, it may still escape
00.5
11.5
22.5
33.5
44.5
5
0 20 40 60 80
Flu
x (L
MH
)
Time (h)
PDAC-MD
PDAC-FO
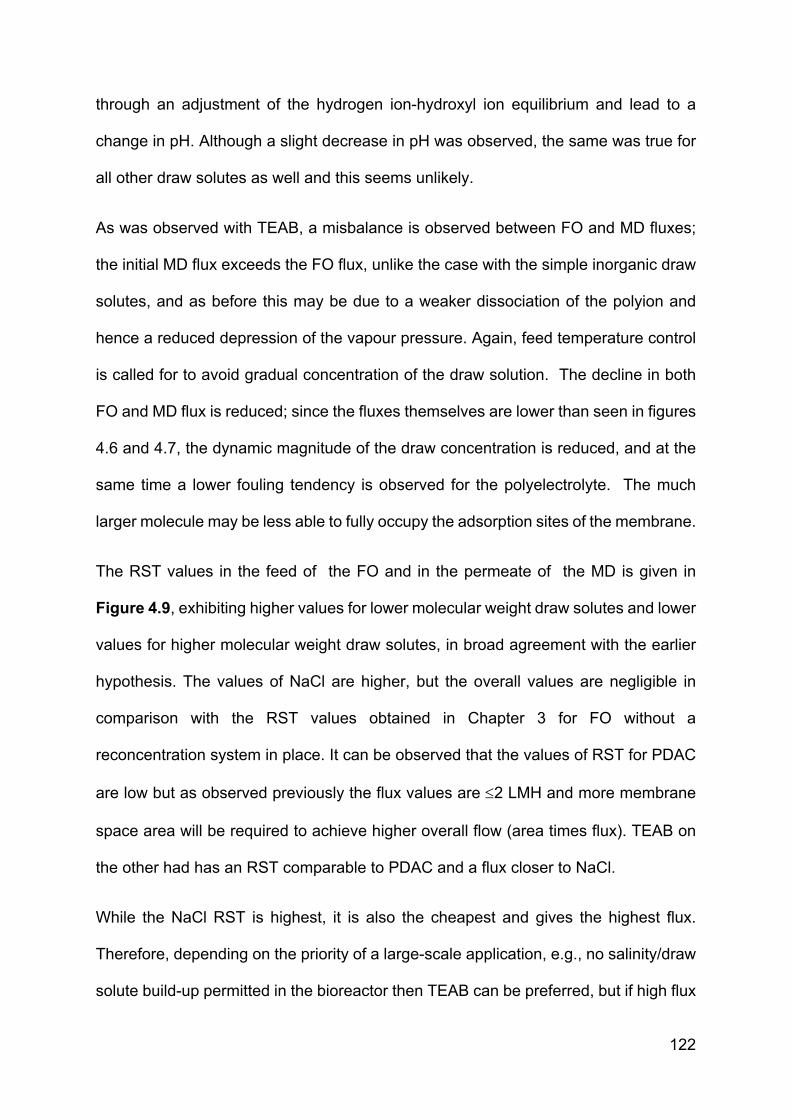
122
through an adjustment of the hydrogen ion-hydroxyl ion equilibrium and lead to a
change in pH. Although a slight decrease in pH was observed, the same was true for
all other draw solutes as well and this seems unlikely.
As was observed with TEAB, a misbalance is observed between FO and MD fluxes;
the initial MD flux exceeds the FO flux, unlike the case with the simple inorganic draw
solutes, and as before this may be due to a weaker dissociation of the polyion and
hence a reduced depression of the vapour pressure. Again, feed temperature control
is called for to avoid gradual concentration of the draw solution. The decline in both
FO and MD flux is reduced; since the fluxes themselves are lower than seen in figures
4.6 and 4.7, the dynamic magnitude of the draw concentration is reduced, and at the
same time a lower fouling tendency is observed for the polyelectrolyte. The much
larger molecule may be less able to fully occupy the adsorption sites of the membrane.
The RST values in the feed of the FO and in the permeate of the MD is given in
Figure 4.9, exhibiting higher values for lower molecular weight draw solutes and lower
values for higher molecular weight draw solutes, in broad agreement with the earlier
hypothesis. The values of NaCl are higher, but the overall values are negligible in
comparison with the RST values obtained in Chapter 3 for FO without a
reconcentration system in place. It can be observed that the values of RST for PDAC
are low but as observed previously the flux values are £2 LMH and more membrane
space area will be required to achieve higher overall flow (area times flux). TEAB on
the other had has an RST comparable to PDAC and a flux closer to NaCl.
While the NaCl RST is highest, it is also the cheapest and gives the highest flux.
Therefore, depending on the priority of a large-scale application, e.g., no salinity/draw
solute build-up permitted in the bioreactor then TEAB can be preferred, but if high flux
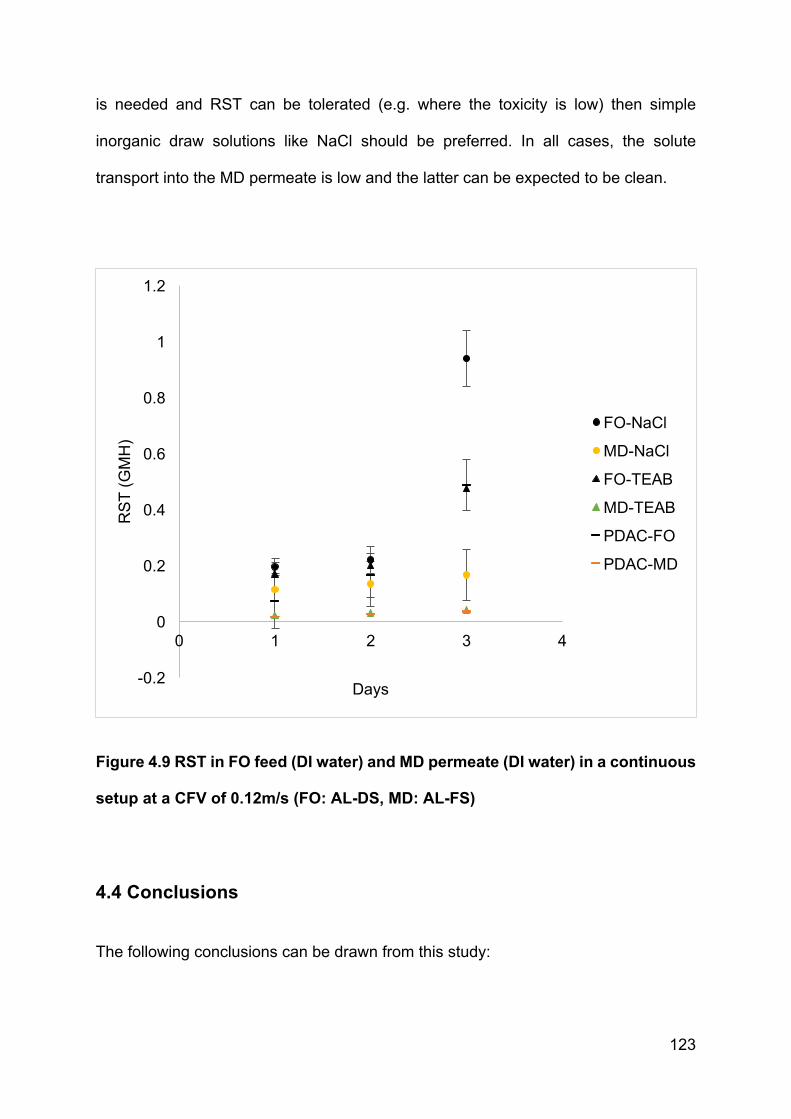
123
is needed and RST can be tolerated (e.g. where the toxicity is low) then simple
inorganic draw solutions like NaCl should be preferred. In all cases, the solute
transport into the MD permeate is low and the latter can be expected to be clean.
Figure 4.9 RST in FO feed (DI water) and MD permeate (DI water) in a continuous
setup at a CFV of 0.12m/s (FO: AL-DS, MD: AL-FS)
4.4 Conclusions
The following conclusions can be drawn from this study:
-0.2
0
0.2
0.4
0.6
0.8
1
1.2
0 1 2 3 4
RST
(GM
H)
Days
FO-NaCl
MD-NaCl
FO-TEAB
MD-TEAB
PDAC-FO
PDAC-MD
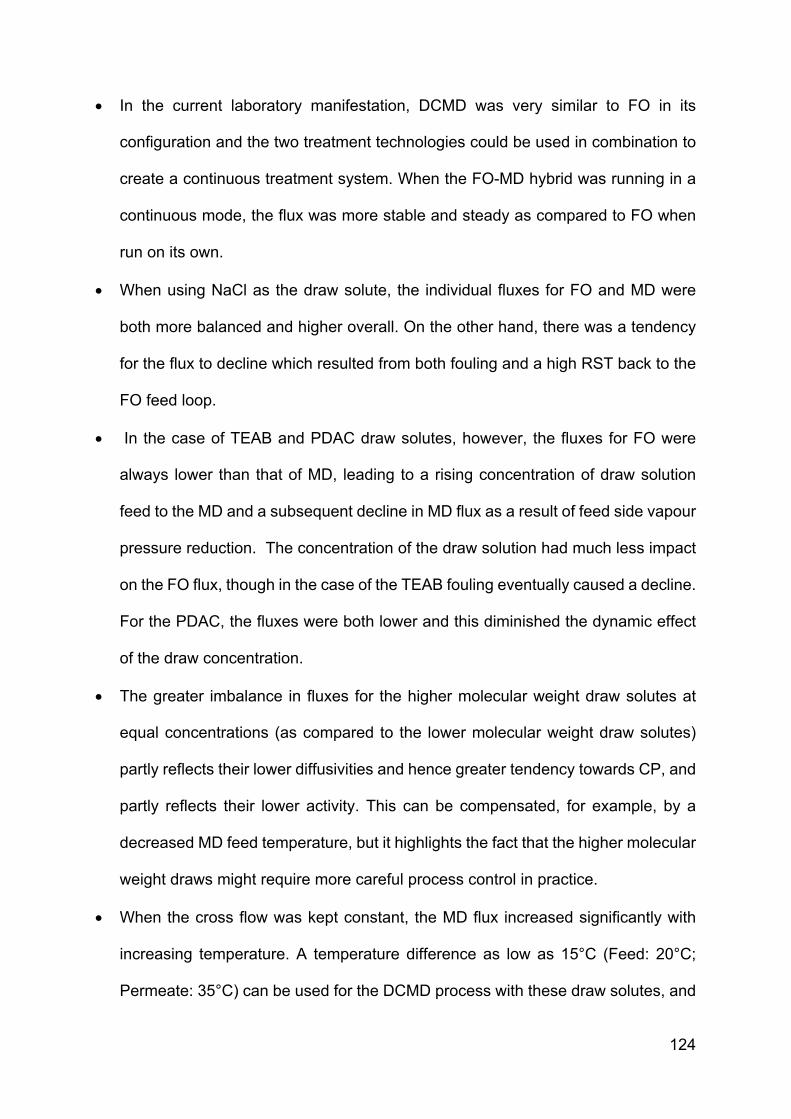
124
• In the current laboratory manifestation, DCMD was very similar to FO in its
configuration and the two treatment technologies could be used in combination to
create a continuous treatment system. When the FO-MD hybrid was running in a
continuous mode, the flux was more stable and steady as compared to FO when
run on its own.
• When using NaCl as the draw solute, the individual fluxes for FO and MD were
both more balanced and higher overall. On the other hand, there was a tendency
for the flux to decline which resulted from both fouling and a high RST back to the
FO feed loop.
• In the case of TEAB and PDAC draw solutes, however, the fluxes for FO were
always lower than that of MD, leading to a rising concentration of draw solution
feed to the MD and a subsequent decline in MD flux as a result of feed side vapour
pressure reduction. The concentration of the draw solution had much less impact
on the FO flux, though in the case of the TEAB fouling eventually caused a decline.
For the PDAC, the fluxes were both lower and this diminished the dynamic effect
of the draw concentration.
• The greater imbalance in fluxes for the higher molecular weight draw solutes at
equal concentrations (as compared to the lower molecular weight draw solutes)
partly reflects their lower diffusivities and hence greater tendency towards CP, and
partly reflects their lower activity. This can be compensated, for example, by a
decreased MD feed temperature, but it highlights the fact that the higher molecular
weight draws might require more careful process control in practice.
• When the cross flow was kept constant, the MD flux increased significantly with
increasing temperature. A temperature difference as low as 15°C (Feed: 20°C;
Permeate: 35°C) can be used for the DCMD process with these draw solutes, and
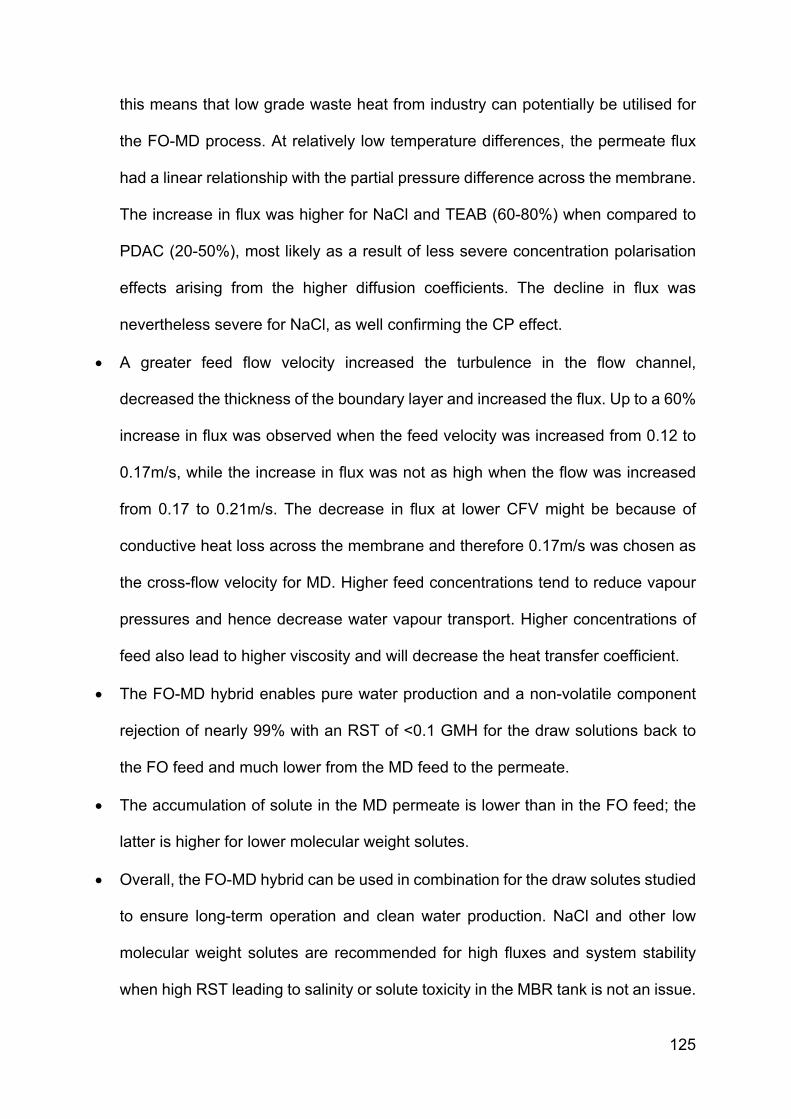
125
this means that low grade waste heat from industry can potentially be utilised for
the FO-MD process. At relatively low temperature differences, the permeate flux
had a linear relationship with the partial pressure difference across the membrane.
The increase in flux was higher for NaCl and TEAB (60-80%) when compared to
PDAC (20-50%), most likely as a result of less severe concentration polarisation
effects arising from the higher diffusion coefficients. The decline in flux was
nevertheless severe for NaCl, as well confirming the CP effect.
• A greater feed flow velocity increased the turbulence in the flow channel,
decreased the thickness of the boundary layer and increased the flux. Up to a 60%
increase in flux was observed when the feed velocity was increased from 0.12 to
0.17m/s, while the increase in flux was not as high when the flow was increased
from 0.17 to 0.21m/s. The decrease in flux at lower CFV might be because of
conductive heat loss across the membrane and therefore 0.17m/s was chosen as
the cross-flow velocity for MD. Higher feed concentrations tend to reduce vapour
pressures and hence decrease water vapour transport. Higher concentrations of
feed also lead to higher viscosity and will decrease the heat transfer coefficient.
• The FO-MD hybrid enables pure water production and a non-volatile component
rejection of nearly 99% with an RST of <0.1 GMH for the draw solutions back to
the FO feed and much lower from the MD feed to the permeate.
• The accumulation of solute in the MD permeate is lower than in the FO feed; the
latter is higher for lower molecular weight solutes.
• Overall, the FO-MD hybrid can be used in combination for the draw solutes studied
to ensure long-term operation and clean water production. NaCl and other low
molecular weight solutes are recommended for high fluxes and system stability
when high RST leading to salinity or solute toxicity in the MBR tank is not an issue.
126
Higher molecular weight solutes, such as TEAB or PDAC, are recommended when
high flux is less critical and the microbial consortium is expected to be more
sensitive to RST and solute toxicity; however, process control becomes more
critical for long term operation.
It is important for the FO-MD system to be tested for wastewater treatment, i.e as an
FOMBR-MD, because the nature of the FO feed will be different. This system will be
presented alongside membrane cleaning in the chapter to follow.
127
Chapter 5
Optimising the Membrane Cleaning Regime for the FOMBR-MD Lab
Scale System
5.1 Introduction
The overall aim of this work was to perform an engineering-oriented study of the
component parts and integrated operation of a continuous and feasible FOMBR-MD
system. Previous chapters, and chapter 4 in particular, have suggested that
membrane fouling is a pertinent issue in the FOMBR-MD process and may lead to a
detrimental decline in flux. With this in mind, a study of membrane cleaning regimes
to mitigate the effects of fouling and attempt to restore original flux is called for. Prior
to this, flux declines were first measured for integrated and continuously operating
FOMBR-MD hybrid systems; these studies formed a necessary prior extension of the
previous chapter which studied flux changes in the FO-MD system (with DI water as
the FO feed).
Membrane fouling in FO has been reported by some workers to be less detrimental
and more reversible as compared to RO. Nevertheless, the issue remains somewhat
contentious in the research community, and there can be little doubt that membrane
fouling remains one of the major drawback for practical implementation of the FO
process (Li et al., 2017a). The research to date on FO fouling has mainly focused on
organic fouling of the membrane. The organic fouling is caused by organic
macromolecules, such as humic acid, or biopolymers, such as proteins (Kwan et al.,
2015; Motsa et al., 2014). Alongside foulant, the fouling is also highly dependent upon
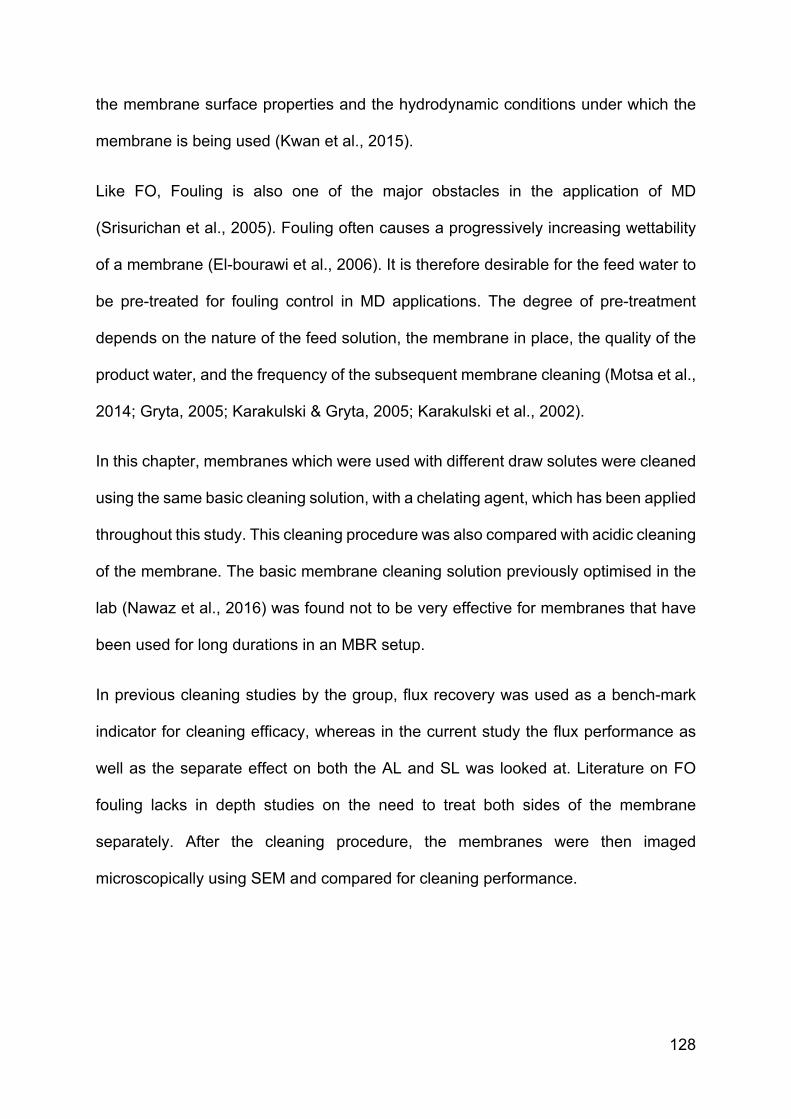
128
the membrane surface properties and the hydrodynamic conditions under which the
membrane is being used (Kwan et al., 2015).
Like FO, Fouling is also one of the major obstacles in the application of MD
(Srisurichan et al., 2005). Fouling often causes a progressively increasing wettability
of a membrane (El-bourawi et al., 2006). It is therefore desirable for the feed water to
be pre-treated for fouling control in MD applications. The degree of pre-treatment
depends on the nature of the feed solution, the membrane in place, the quality of the
product water, and the frequency of the subsequent membrane cleaning (Motsa et al.,
2014; Gryta, 2005; Karakulski & Gryta, 2005; Karakulski et al., 2002).
In this chapter, membranes which were used with different draw solutes were cleaned
using the same basic cleaning solution, with a chelating agent, which has been applied
throughout this study. This cleaning procedure was also compared with acidic cleaning
of the membrane. The basic membrane cleaning solution previously optimised in the
lab (Nawaz et al., 2016) was found not to be very effective for membranes that have
been used for long durations in an MBR setup.
In previous cleaning studies by the group, flux recovery was used as a bench-mark
indicator for cleaning efficacy, whereas in the current study the flux performance as
well as the separate effect on both the AL and SL was looked at. Literature on FO
fouling lacks in depth studies on the need to treat both sides of the membrane
separately. After the cleaning procedure, the membranes were then imaged
microscopically using SEM and compared for cleaning performance.
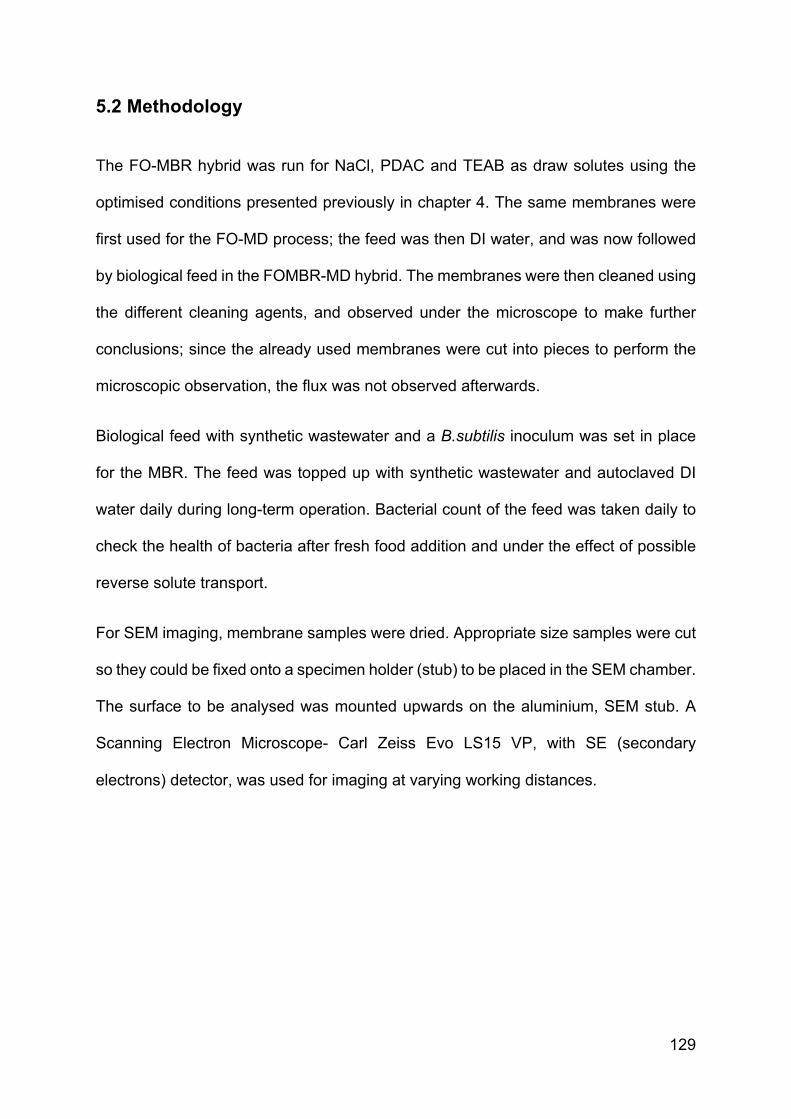
129
5.2 Methodology
The FO-MBR hybrid was run for NaCl, PDAC and TEAB as draw solutes using the
optimised conditions presented previously in chapter 4. The same membranes were
first used for the FO-MD process; the feed was then DI water, and was now followed
by biological feed in the FOMBR-MD hybrid. The membranes were then cleaned using
the different cleaning agents, and observed under the microscope to make further
conclusions; since the already used membranes were cut into pieces to perform the
microscopic observation, the flux was not observed afterwards.
Biological feed with synthetic wastewater and a B.subtilis inoculum was set in place
for the MBR. The feed was topped up with synthetic wastewater and autoclaved DI
water daily during long-term operation. Bacterial count of the feed was taken daily to
check the health of bacteria after fresh food addition and under the effect of possible
reverse solute transport.
For SEM imaging, membrane samples were dried. Appropriate size samples were cut
so they could be fixed onto a specimen holder (stub) to be placed in the SEM chamber.
The surface to be analysed was mounted upwards on the aluminium, SEM stub. A
Scanning Electron Microscope- Carl Zeiss Evo LS15 VP, with SE (secondary
electrons) detector, was used for imaging at varying working distances.
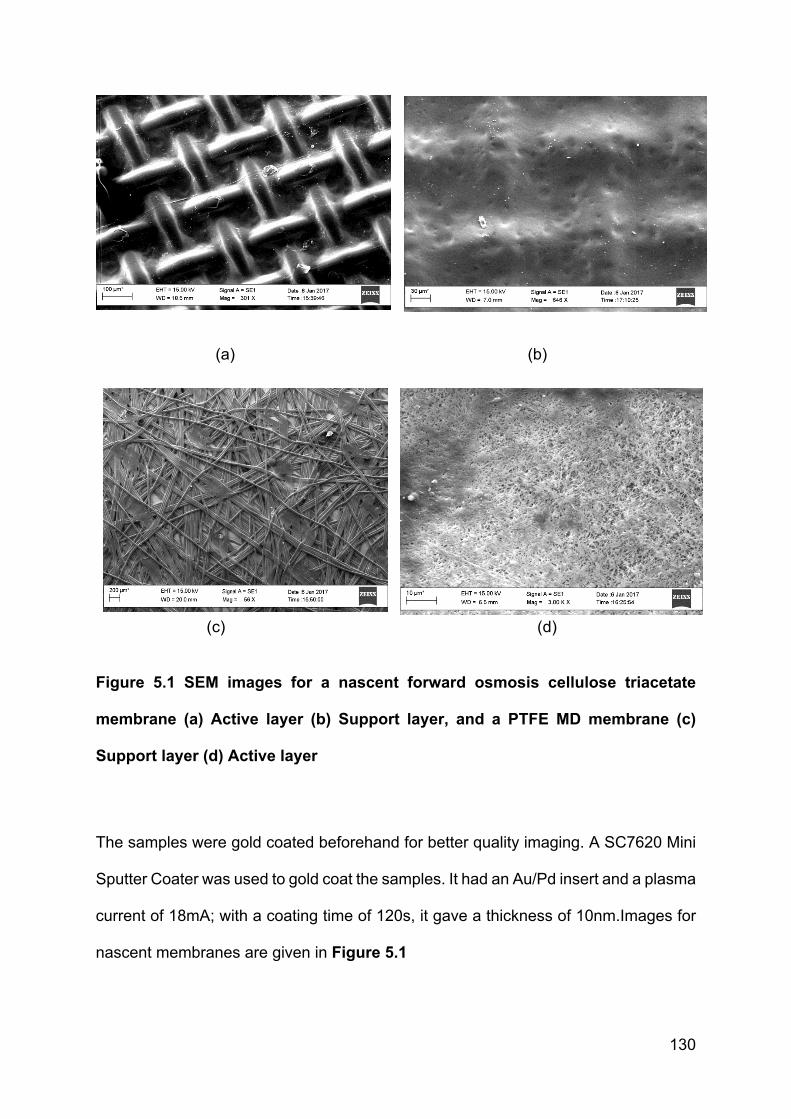
130
(a) (b)
Figure 5.1 SEM images for a nascent forward osmosis cellulose triacetate
membrane (a) Active layer (b) Support layer, and a PTFE MD membrane (c)
Support layer (d) Active layer
The samples were gold coated beforehand for better quality imaging. A SC7620 Mini
Sputter Coater was used to gold coat the samples. It had an Au/Pd insert and a plasma
current of 18mA; with a coating time of 120s, it gave a thickness of 10nm.Images for
nascent membranes are given in Figure 5.1
(c) (d)
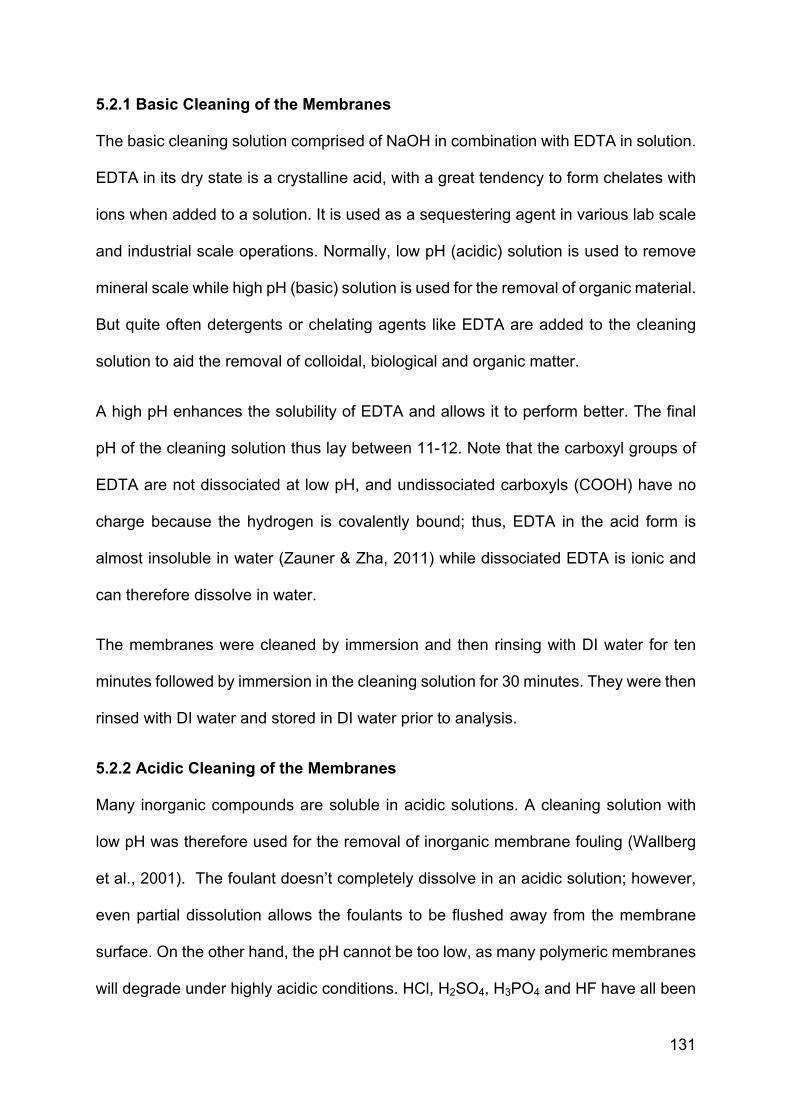
131
5.2.1 Basic Cleaning of the Membranes
The basic cleaning solution comprised of NaOH in combination with EDTA in solution.
EDTA in its dry state is a crystalline acid, with a great tendency to form chelates with
ions when added to a solution. It is used as a sequestering agent in various lab scale
and industrial scale operations. Normally, low pH (acidic) solution is used to remove
mineral scale while high pH (basic) solution is used for the removal of organic material.
But quite often detergents or chelating agents like EDTA are added to the cleaning
solution to aid the removal of colloidal, biological and organic matter.
A high pH enhances the solubility of EDTA and allows it to perform better. The final
pH of the cleaning solution thus lay between 11-12. Note that the carboxyl groups of
EDTA are not dissociated at low pH, and undissociated carboxyls (COOH) have no
charge because the hydrogen is covalently bound; thus, EDTA in the acid form is
almost insoluble in water (Zauner & Zha, 2011) while dissociated EDTA is ionic and
can therefore dissolve in water.
The membranes were cleaned by immersion and then rinsing with DI water for ten
minutes followed by immersion in the cleaning solution for 30 minutes. They were then
rinsed with DI water and stored in DI water prior to analysis.
5.2.2 Acidic Cleaning of the Membranes
Many inorganic compounds are soluble in acidic solutions. A cleaning solution with
low pH was therefore used for the removal of inorganic membrane fouling (Wallberg
et al., 2001). The foulant doesn’t completely dissolve in an acidic solution; however,
even partial dissolution allows the foulants to be flushed away from the membrane
surface. On the other hand, the pH cannot be too low, as many polymeric membranes
will degrade under highly acidic conditions. HCl, H2SO4, H3PO4 and HF have all been
132
used for cleaning various membranes. In the current study, 2% HNO3 and 2% H3PO4
was used for cleaning the membrane. Various concentrations of the solution were
tested and the pH was kept at 2 or above, according to the instructions of the
membrane manufacturers i.e. HTI and Membrane Solutions.
As before, the membranes were first cleaned with DI water for ten minutes, followed
by the cleaning solution for 30 minutes. They were then cleaned with DI water again
before being stored in DI water prior to SEM imaging.
5.3 Results and Discussion
5.3.1 FO-MBR Hybrid
The FO-MBR hybrid flux for 0.5 M NaCl, TEAB and PDAC as draw solutes is shown
in Figure 5.2. After this set of experiments, the membranes were taken out of the cell
and cut into samples for cleaning analysis.
It was expected from chapter 4 that the MD flux would be more stable because it has
a simpler inorganic, low molecular weight feed i.e. NaCl solution, while the FO feed
loop is itself being fed by the MBR (synthetic wastewater with a Bacillus subtilis
inoculum in it). Because of a continuous reconcentration system in place, it was also
desired (and anticipated from the results in chapter 4) that the draw solution would
ideally remain at a concentration of 0.5M at all times.
At the beginning, the flux graph shows that the NaCl draw solute with its high osmotic
potential is able to draw water molecules from the wastewater tank During this time,
the MD setup is acclimatizing to the experimental conditions and temperature, and is
stabilising as time passes. The increasing concentration polarization (due to a gradual
increase in feed concentration; we are after all operating a batch reactor) and gradual

133
dilution of the draw solution causes a rapid decline in flux for the forward osmosis until
day two. On the other hand, the MD flux gradually increases before decreasing and
then finally becomes steady by day two up to day four. It is believed that in the case
of NaCl, after two days the critical flux for the MD was reached. Critical flux (Field &
Pearce, 2011) is defined as “a flux below which a decline of flux with time does not
occur; above it, fouling is observed”. When compared with the FO-MBR hybrid for
TEAB and PDAC as a draw solute, it can be observed that with a small molecular
weight draw solute like NaCl (Figure 5.2) FO membrane fouling occurs in the first two
days and then the FO-MBR becomes a self-sustainable system. Flux for both FO and
MD remain the same after a certain amount of time and fouling. For larger molecular
weight compounds, on the other hand, a different pattern was observed (see below).
In a particular study (Aimar et al., 1989), in the first two days as the membrane fouled,
permeate flux declined, partly because the hydrodynamic conditions at the membrane
surface changed with time. The decline in flux was accounted for by overall ICP, ECP
and membrane fouling on the membrane surface. The results also suggested that
critical flux for osmotic and vapour pressure-driven membrane systems is reached
later than for pressure driven membrane systems.
Because of the higher flux evident for regeneration than for FO in the case of TEAB,
the draw solute for the FO process in this case might become more concentrated than
its initial concentration, and this higher concentration might have led to the greater
chemical fouling of the membrane.
When PDAC was used as a draw solution in the FO-MBR hybrid setup, the fluxes for
both the FO and MD processes were steadier in the first three days and started to
decline more rapidly on the fourth day. In this hybrid setup, it could be observed that
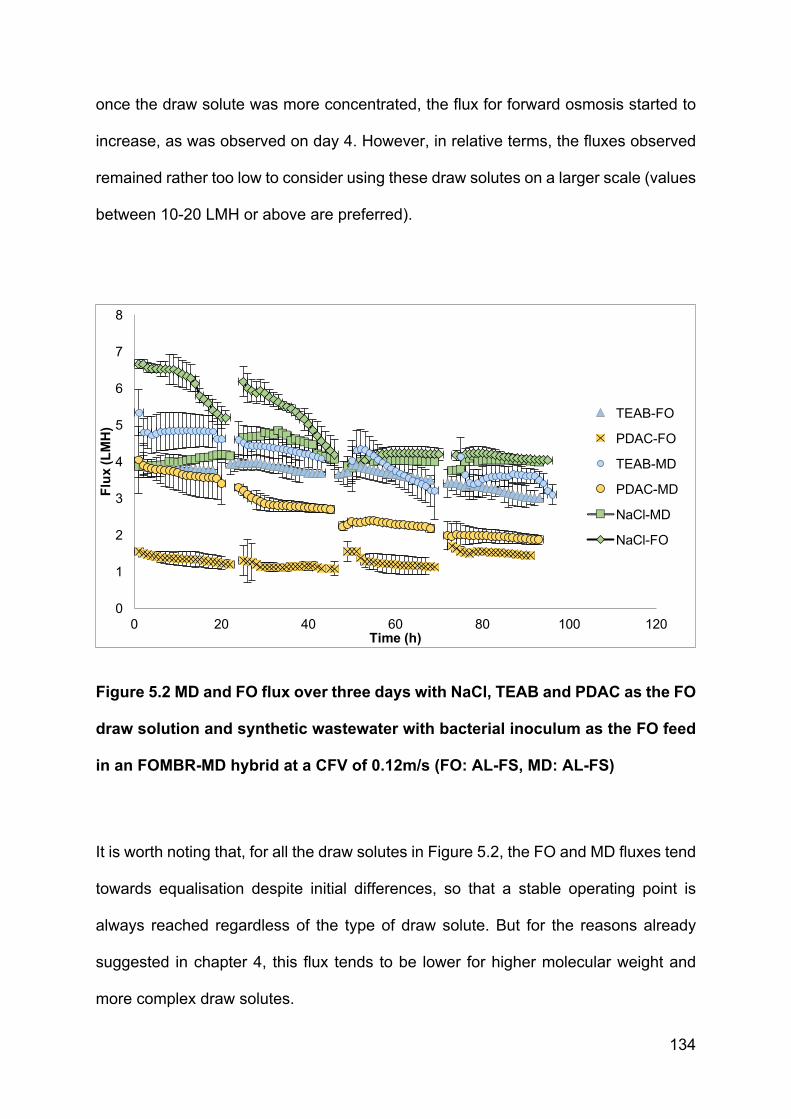
134
once the draw solute was more concentrated, the flux for forward osmosis started to
increase, as was observed on day 4. However, in relative terms, the fluxes observed
remained rather too low to consider using these draw solutes on a larger scale (values
between 10-20 LMH or above are preferred).
Figure 5.2 MD and FO flux over three days with NaCl, TEAB and PDAC as the FO
draw solution and synthetic wastewater with bacterial inoculum as the FO feed
in an FOMBR-MD hybrid at a CFV of 0.12m/s (FO: AL-FS, MD: AL-FS)
It is worth noting that, for all the draw solutes in Figure 5.2, the FO and MD fluxes tend
towards equalisation despite initial differences, so that a stable operating point is
always reached regardless of the type of draw solute. But for the reasons already
suggested in chapter 4, this flux tends to be lower for higher molecular weight and
more complex draw solutes.
0
1
2
3
4
5
6
7
8
0 20 40 60 80 100 120
Flu
x (L
MH
)
Time (h)
TEAB-FO
PDAC-FO
TEAB-MD
PDAC-MD
NaCl-MD
NaCl-FO
135
Because of the complexity of the feed, the reverse solute transport could not be
calculated in the FOMBR unit. However, the bacterial count of the MBR was checked
daily to observe any decline in the bacterial count. It was noted that the overall health
of the MBR remained very good, suggesting that the reverse solute transport (even
though not measured) did not have a deleterious effect on the microbial consortium
Only the forward solute transport to the MD permeate was looked at using electrical
conductivity, to analyse the quality of the product water. The forward solute transport
was less than 0.1 GMH at the end of day 7 of the FOMBR-MD hybrid.
5.3.2. Membrane cleaning-NaCl Draw Solution
Basic cleaning- NaCl Draw Solution
The SEM image for membranes cleaned with basic solution with chelating agent
(NaOH and EDTA) is shown in Figure 5.3. Each image indicates the membrane
surface and the solution it faced. The figures in (a) show that there is draw solution
deposition on the FO support layer, while those in (b) show that the microbial growth/
biofilm production on the active layer is minimal and the membrane condition remains
very close to that of the virgin membrane so that the fouling is reversible or at least
removable. Similar to FO, the MD membrane in (c) also seemed to remain very close
to its nascent state (compare also with Figure 5.1 (d) and the basicity of the solution
does not seem to have damaged the membranes.
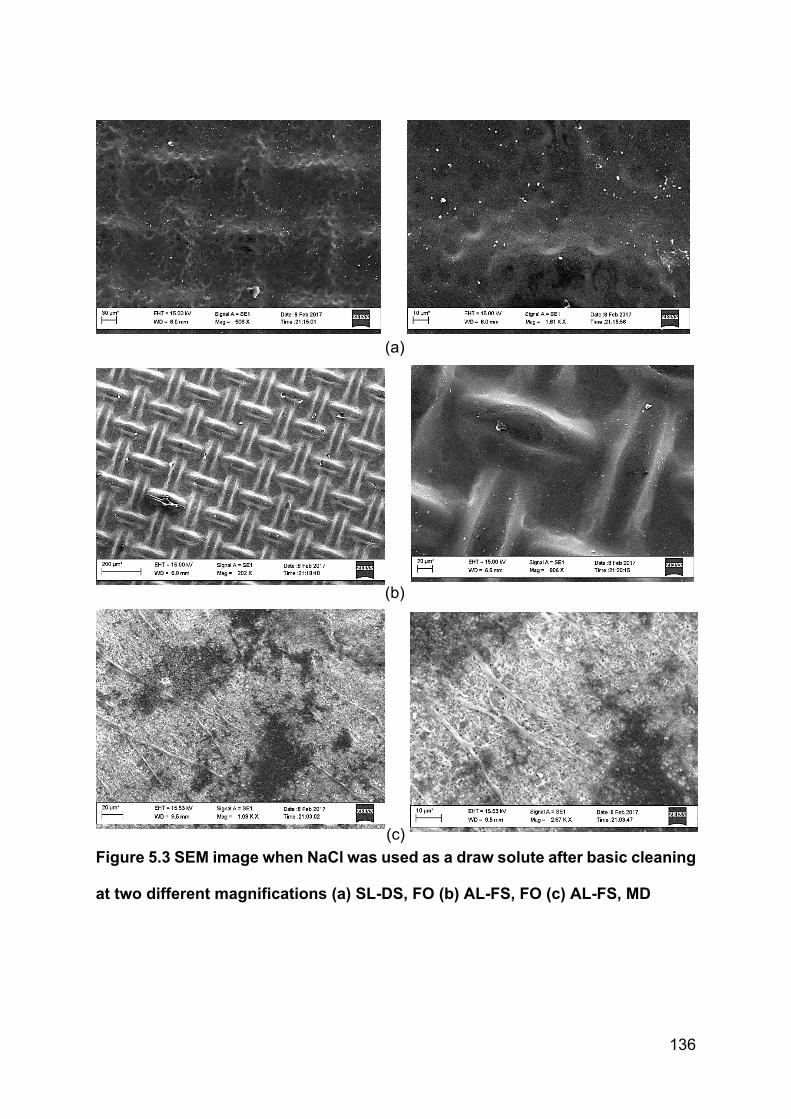
136
Figure 5.3 SEM image when NaCl was used as a draw solute after basic cleaning
at two different magnifications (a) SL-DS, FO (b) AL-FS, FO (c) AL-FS, MD
(a)
(b)
(c)
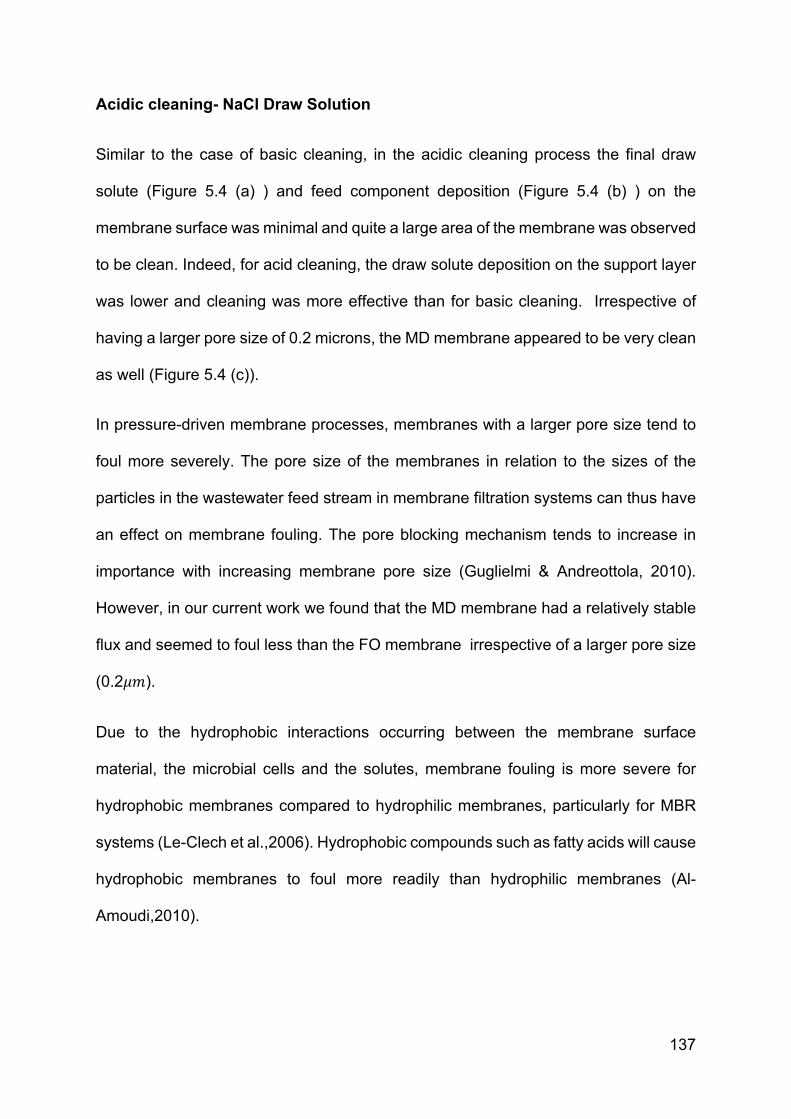
137
Acidic cleaning- NaCl Draw Solution
Similar to the case of basic cleaning, in the acidic cleaning process the final draw
solute (Figure 5.4 (a) ) and feed component deposition (Figure 5.4 (b) ) on the
membrane surface was minimal and quite a large area of the membrane was observed
to be clean. Indeed, for acid cleaning, the draw solute deposition on the support layer
was lower and cleaning was more effective than for basic cleaning. Irrespective of
having a larger pore size of 0.2 microns, the MD membrane appeared to be very clean
as well (Figure 5.4 (c)).
In pressure-driven membrane processes, membranes with a larger pore size tend to
foul more severely. The pore size of the membranes in relation to the sizes of the
particles in the wastewater feed stream in membrane filtration systems can thus have
an effect on membrane fouling. The pore blocking mechanism tends to increase in
importance with increasing membrane pore size (Guglielmi & Andreottola, 2010).
However, in our current work we found that the MD membrane had a relatively stable
flux and seemed to foul less than the FO membrane irrespective of a larger pore size
(0.2IJ).
Due to the hydrophobic interactions occurring between the membrane surface
material, the microbial cells and the solutes, membrane fouling is more severe for
hydrophobic membranes compared to hydrophilic membranes, particularly for MBR
systems (Le-Clech et al.,2006). Hydrophobic compounds such as fatty acids will cause
hydrophobic membranes to foul more readily than hydrophilic membranes (Al-
Amoudi,2010).
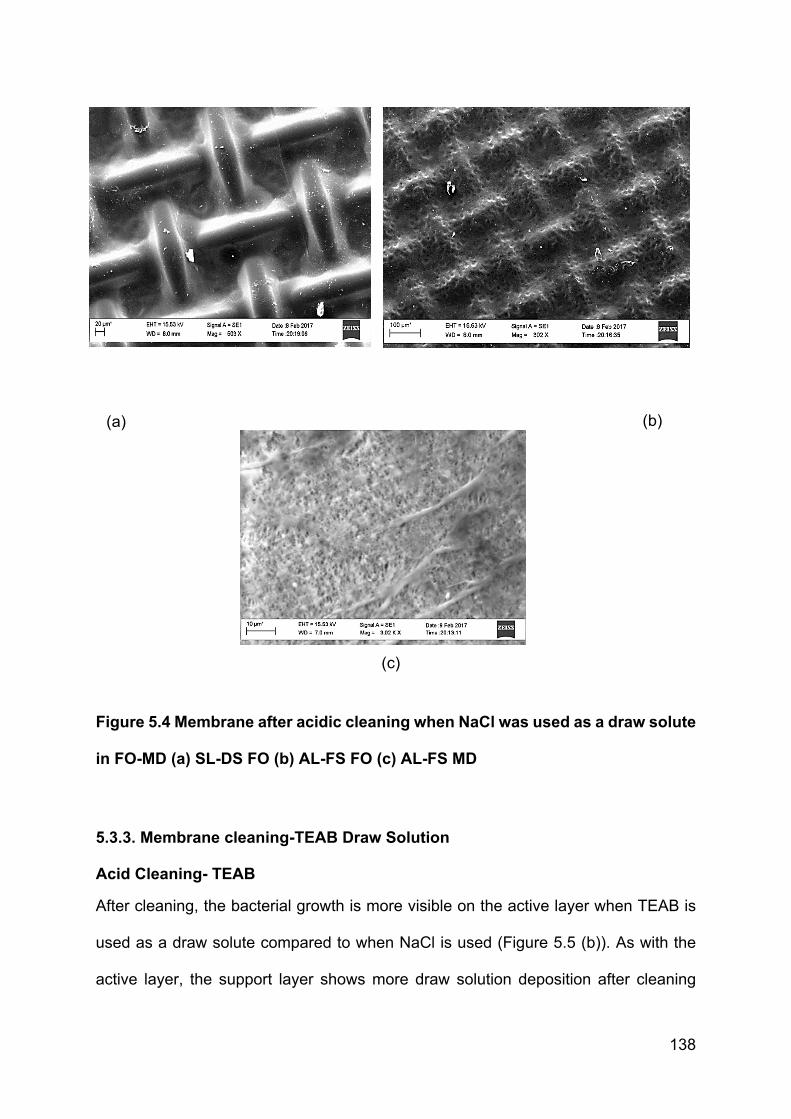
138
Figure 5.4 Membrane after acidic cleaning when NaCl was used as a draw solute
in FO-MD (a) SL-DS FO (b) AL-FS FO (c) AL-FS MD
5.3.3. Membrane cleaning-TEAB Draw Solution
Acid Cleaning- TEAB
After cleaning, the bacterial growth is more visible on the active layer when TEAB is
used as a draw solute compared to when NaCl is used (Figure 5.5 (b)). As with the
active layer, the support layer shows more draw solution deposition after cleaning
(b)
(c)
(a)
139
(Figure 5.5 (c)). This suggests that larger molecular weight draw solutes that are able
to osmotically draw water through a membrane because of their chemical potential
also contribute to higher levels of chemical fouling to the membrane. This fouling
tendency can also be related to the hydrophobic and associative characteristic of
surfactants, and their ability to adsorb and cause wetting is clearly an issue with
respect to MD membranes (Figure 5.5 (a)).
Basic Cleaning-TEAB Draw Solution
The cleaning potential should be compared with respect to the cleaning agents. When
basic cleaning is compared with acidic cleaning (note that basic cleaning was used
throughout the project), the SEM images below suggest that it is not as effective as
acidic cleaning of the membrane. The MD membrane seemed to have fared well for
all cleaning techniques (Figures 5.3 (c), 5.4 (c), 5.6 (a)). However, unlike the MD
membrane, both the AL and SL sides show major foulant deposition on the FO
membrane surface after basic cleaning for the TEAB draw solution (Figure 5. 6 (b)
and (c)).
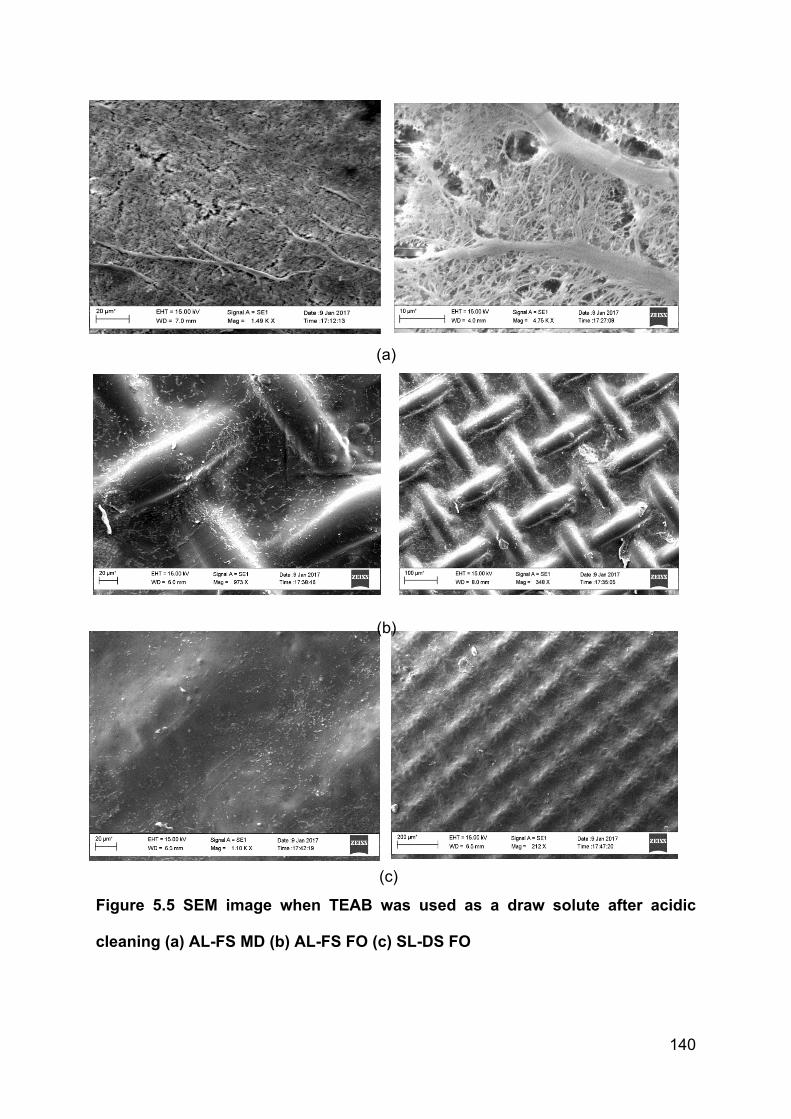
140
Figure 5.5 SEM image when TEAB was used as a draw solute after acidic
cleaning (a) AL-FS MD (b) AL-FS FO (c) SL-DS FO
(a)
(b)
(c)
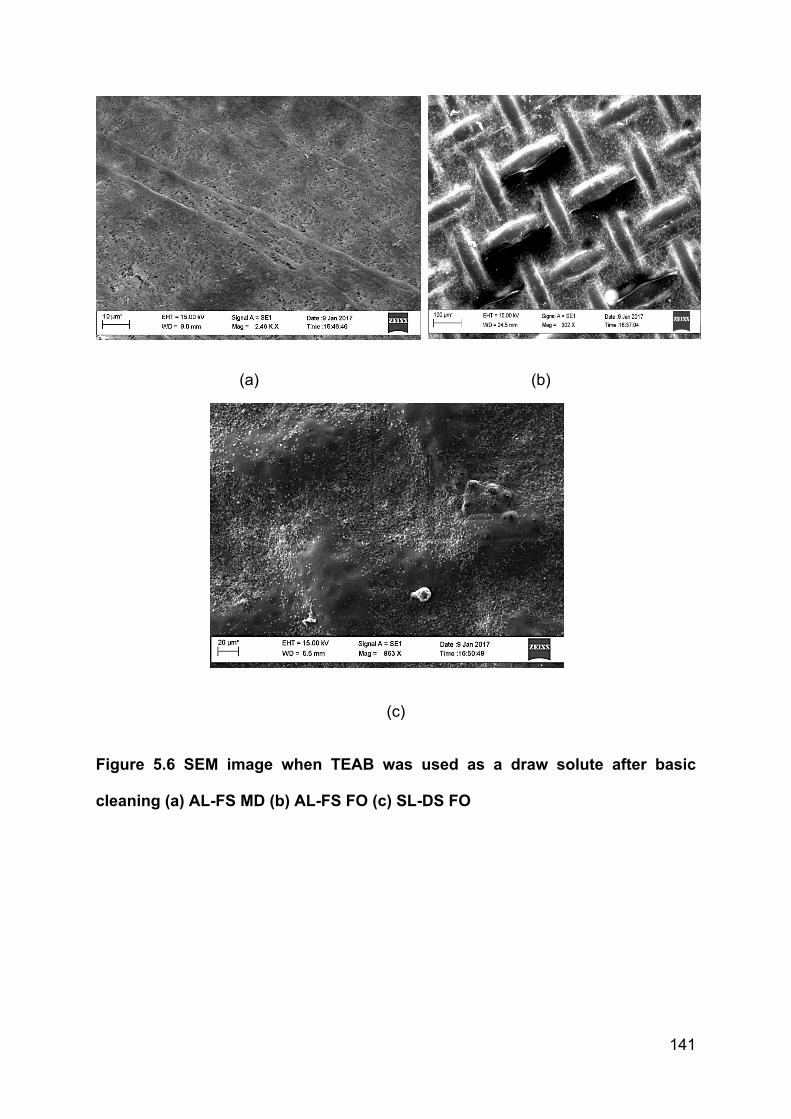
141
(a) (b)
(c)
Figure 5.6 SEM image when TEAB was used as a draw solute after basic
cleaning (a) AL-FS MD (b) AL-FS FO (c) SL-DS FO
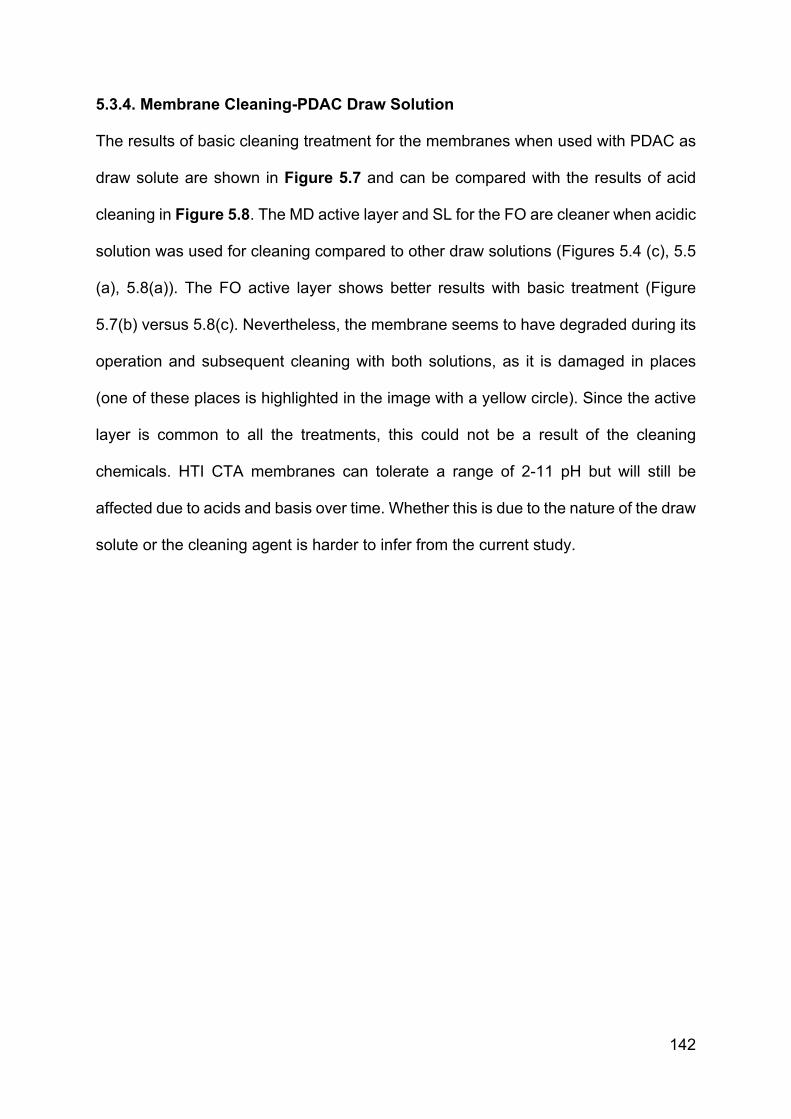
142
5.3.4. Membrane Cleaning-PDAC Draw Solution
The results of basic cleaning treatment for the membranes when used with PDAC as
draw solute are shown in Figure 5.7 and can be compared with the results of acid
cleaning in Figure 5.8. The MD active layer and SL for the FO are cleaner when acidic
solution was used for cleaning compared to other draw solutions (Figures 5.4 (c), 5.5
(a), 5.8(a)). The FO active layer shows better results with basic treatment (Figure
5.7(b) versus 5.8(c). Nevertheless, the membrane seems to have degraded during its
operation and subsequent cleaning with both solutions, as it is damaged in places
(one of these places is highlighted in the image with a yellow circle). Since the active
layer is common to all the treatments, this could not be a result of the cleaning
chemicals. HTI CTA membranes can tolerate a range of 2-11 pH but will still be
affected due to acids and basis over time. Whether this is due to the nature of the draw
solute or the cleaning agent is harder to infer from the current study.
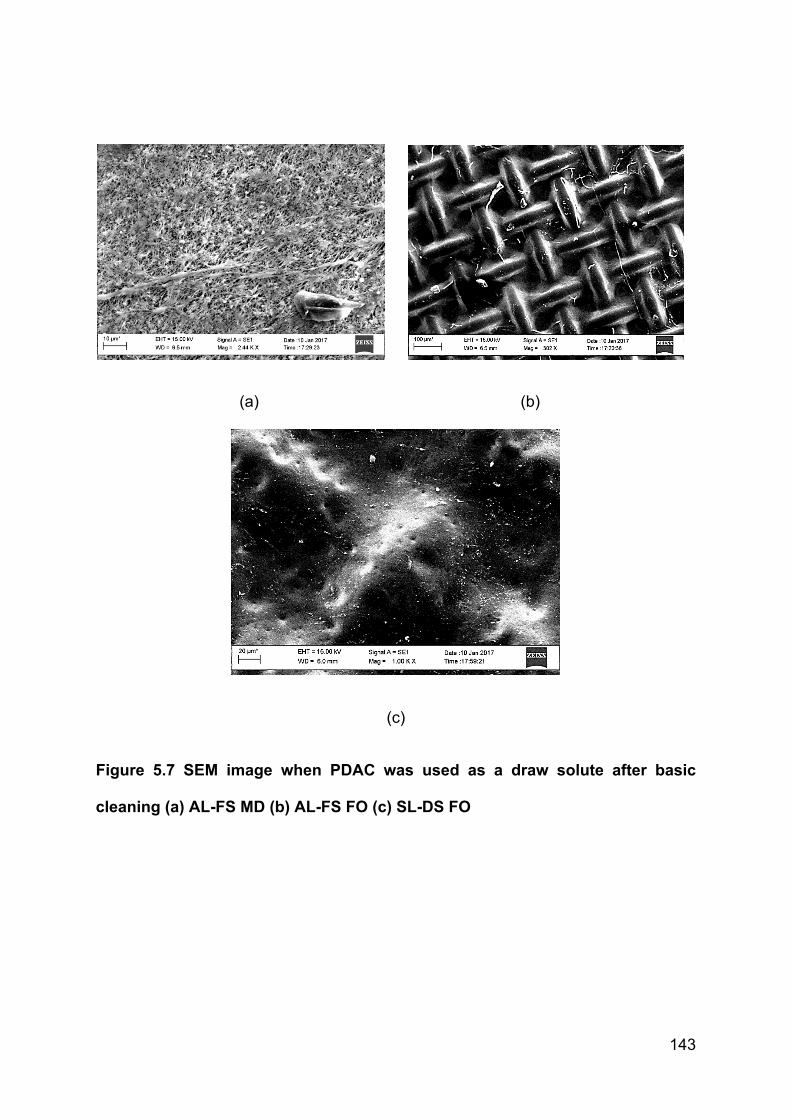
143
(a) (b)
(c)
Figure 5.7 SEM image when PDAC was used as a draw solute after basic
cleaning (a) AL-FS MD (b) AL-FS FO (c) SL-DS FO
144
Acidic Cleaning- PDAC Draw Solution
(a) (b)
(c)
Figure 5.8 SEM image when PDAC was used as a draw solute after acidic
cleaning (a) AL-FS MD (b) SL-DS FO (c) AL-FS FO
As was also the case with NaCl, PDAC did not deposit on the membrane surface as
much as TEAB (compare Figures 5.5 and 5.6 with Figures 5.7 and 5.8).
Based on the various SEM images obtained, the following recommendations can be
made with regard to the best method for cleaning the membranes chemically.
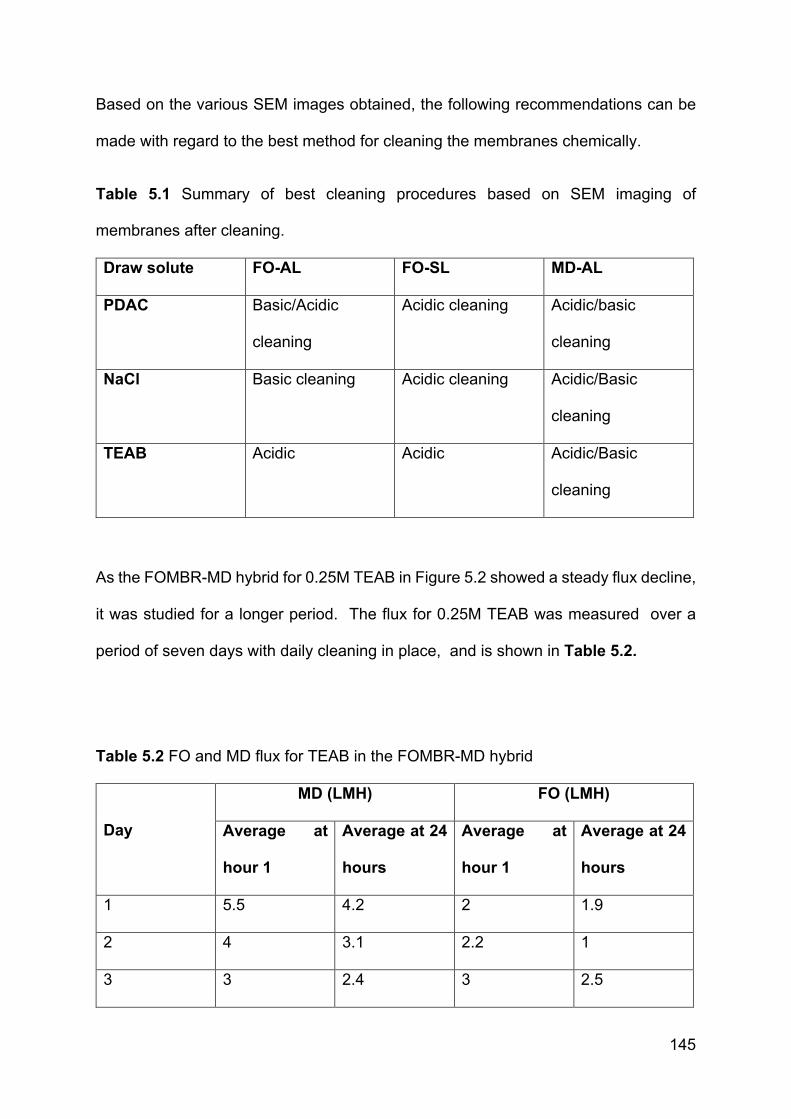
145
Based on the various SEM images obtained, the following recommendations can be
made with regard to the best method for cleaning the membranes chemically.
Table 5.1 Summary of best cleaning procedures based on SEM imaging of
membranes after cleaning.
Draw solute FO-AL FO-SL MD-AL
PDAC Basic/Acidic
cleaning
Acidic cleaning Acidic/basic
cleaning
NaCl Basic cleaning Acidic cleaning Acidic/Basic
cleaning
TEAB Acidic Acidic Acidic/Basic
cleaning
As the FOMBR-MD hybrid for 0.25M TEAB in Figure 5.2 showed a steady flux decline,
it was studied for a longer period. The flux for 0.25M TEAB was measured over a
period of seven days with daily cleaning in place, and is shown in Table 5.2.
Table 5.2 FO and MD flux for TEAB in the FOMBR-MD hybrid
Day
MD (LMH) FO (LMH)
Average at
hour 1
Average at 24
hours
Average at
hour 1
Average at 24
hours
1 5.5 4.2 2 1.9
2 4 3.1 2.2 1
3 3 2.4 3 2.5
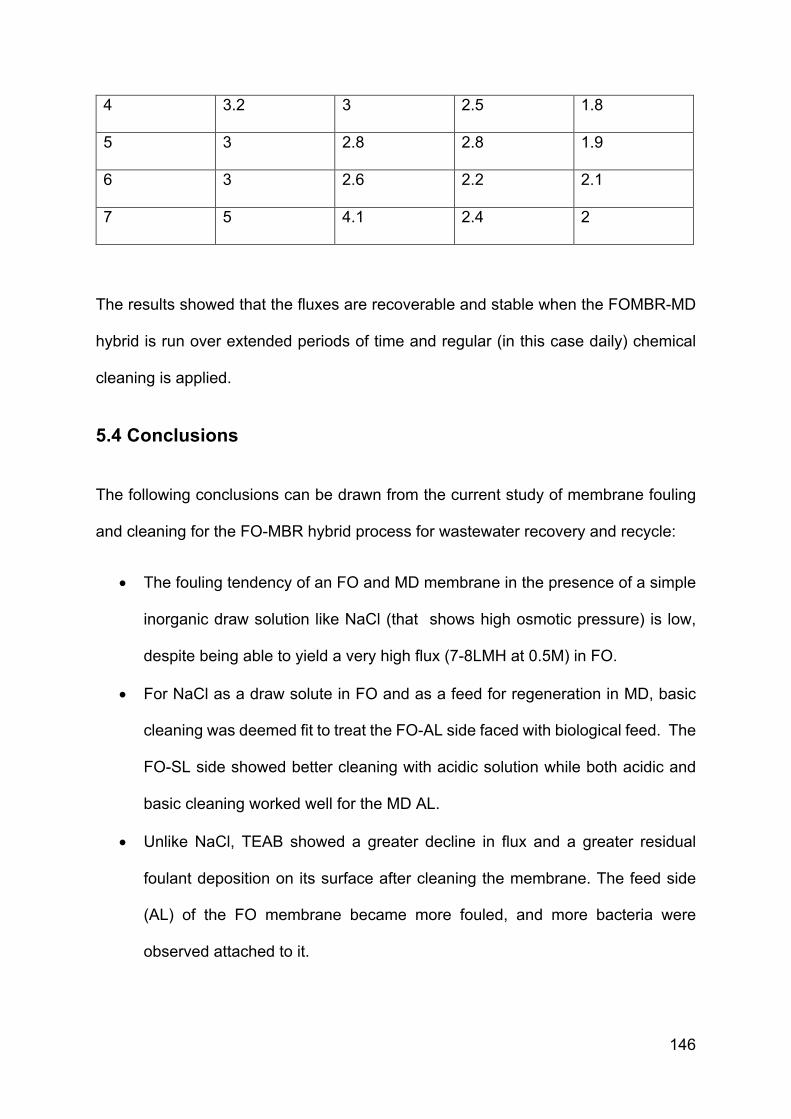
146
4 3.2 3 2.5 1.8
5 3 2.8 2.8 1.9
6 3 2.6 2.2 2.1
7 5 4.1 2.4 2
The results showed that the fluxes are recoverable and stable when the FOMBR-MD
hybrid is run over extended periods of time and regular (in this case daily) chemical
cleaning is applied.
5.4 Conclusions
The following conclusions can be drawn from the current study of membrane fouling
and cleaning for the FO-MBR hybrid process for wastewater recovery and recycle:
• The fouling tendency of an FO and MD membrane in the presence of a simple
inorganic draw solution like NaCl (that shows high osmotic pressure) is low,
despite being able to yield a very high flux (7-8LMH at 0.5M) in FO.
• For NaCl as a draw solute in FO and as a feed for regeneration in MD, basic
cleaning was deemed fit to treat the FO-AL side faced with biological feed. The
FO-SL side showed better cleaning with acidic solution while both acidic and
basic cleaning worked well for the MD AL.
• Unlike NaCl, TEAB showed a greater decline in flux and a greater residual
foulant deposition on its surface after cleaning the membrane. The feed side
(AL) of the FO membrane became more fouled, and more bacteria were
observed attached to it.
147
• The acidic cleaning solution out-performed the basic cleaning solution for both
the AL and SL membrane surfaces when TEAB was used as draw solute. While
the acidic cleaning of the FO membrane was observed to be more effective
than with basic cleaning, the MD membrane was observed to clean equally well
with both acidic and basic cleaning solutions.
• The PDAC draw solute showed the lowest flux of all for FO, but unlike the other
two draw solutes its FO and MD flux is more steady and stable, and a negligible
decline in flux was observed for PDAC. However, because the MD flux was
almost double that for FO, and the draw solute was thus concentrating more by
MD than it was diluting by FO, a slight increase in flux was observed after
several days
• Having a larger molecular size than TEAB, PDAC was expected to cause more
concentration polarization and fouling in the FO membrane. However, the
membrane observed under SEM after cleaning showed that the clean
membranes are comparable to that when using NaCl as draw solute. It can
therefore be inferred that the medium molecular size compounds with higher
flux cause more fouling than the larger molecular compounds with relatively
lower flux. This might also be explained by the lower flux generated by the high
molecular weight leading to lower fouling and vice versa. The larger molecule
is also less able to occupy all the available adsorption sites on the membrane.
Acid cleaning was always shown to be suitable and preferable for treating the
FO membrane support layer, while in some cases basic cleaning was
preferable for the FO membrane active layer. For the MD membrane (feed
side), both acidic and basic cleaning were equally effective.
148
Chapter 6
Conclusions and Recommendations for Future Work
6.1 Summary of Work Done
The overall aim of the current work was to perform a practical, lab-scale study
involving thorough experimental work to examine the component parts and integrated
operation of a continuous and feasible FOMBR-MD hybrid system for the treatment
and recycle of wastewater, using novel and existing draw solutions to achieve stable
and acceptable fluxes. This was investigated by comparing organic (surfactants and
polyelectrolytes) and inorganic draw solutes using two different membranes (HTI and
NF) in a live membrane bioreactor (MBR) for performance comparison. Synthetic
municipal wastewater was selected as a feed, and Bacillus subtilis species was
inoculated in the solution and grown overnight for development of a monoculture
bioreactor. DI water was used as feed for control. Conventional inorganic salts (NaCl,
Na3PO4) were tested against the surfactants (TEAB, SDS) and polyelectrolytes
(PDAC, PGBE) as novel draw solutes. Osmotic pressure, flux, toxicity, reverse solute
transport and viscosity were observed for the draw solutions. The study was then
extended to investigate the integration of a Membrane Distillation (MD) unit with the
Forward Osmosis (FO) unit as a means of recovering clean water from the latter and
regenerating the draw solution. In this hybrid system, the diluted draw solution was fed
to the MD unit. This hybrid setup was used to run a continuous FOMBR-MD system
to study the flux, reverse transport of solute, and their toxicity. To conclude the study,
acidic and basic cleaning solutions were employed for both FO and MD membranes
for different draw solutions followed by observation using SEM. For basic cleaning,
149
0.5mM EDTA was used with 0.5g/l NaOH. For acidic cleaning, 2% HNO3 and 2%
H3PO4 was used for cleaning the membrane.
6.2 Conclusions
It was found that NF membranes when used in the FO-MBR yield a higher flux. The
initial fluxes were higher for the NF membrane than the HTI FO membrane in FO-MBR
because the NF was a single layer membrane with higher pore size and water
permeability than that of the HTI FO membrane. With the NF membrane, as the feed
was changed from DI water to monoculture synthetic wastewater, a decline in flux was
observed over several hours. The decrease in Flux for CTA membrane was; TEAB
(28.5 %), Na3PO4 (44.8 %), PGBE (18.9%), NaCl (38%), PDAC (27%), SDS (13%),
While the decrease in flux for NF with the change in feed was; PDAC (57%), TEAB
(41 %), PGBE (20.4%), SDS (12.5%). Measurements of reverse solute transport were
also made; the RST values for the NF membrane were only slightly higher than for the
HTI-FO membrane, and in either case led to a low consequent toxicity to the microbial
consortium. In the absence of a reconcentration system in place after 24 hours of
operation, the highest RST was observed for NaCl (9.33 GMH) and the lowest for
higher molecular weight draw solutes (PGBE: 1.2 GMH), both for the CTA FO
membrane, and similar results were observed for the NF membrane. Draw solutes
that exhibited highest viscosities also showed lower fluxes (≥ 2cP for SDS and PDAC),
while draw solutes that exhibited lower viscosities, showed highest flux (e.g. NaCl:
1.2cP). NF membranes are therefore recommended for further investigation in the
FOMBR-MD process. Although the observed RST values were not toxic for the
bacteria under observation, long-term accumulation of draw solute in a water and
wastewater treatment plant using FO can be an issue requiring further investigation.
150
When the FO-MD hybrid was set in place and allowed continuous system operation
with regeneration of the draw solution, the flux achieved was more stable and steady
as compared to when FO when run on its own. A temperature difference as low as
15°C (Feed: 20°C; Permeate: 35°C) was used and a CFV of 0.17m/s was finalised to
achieve better performance. A more balanced FO-MD hybrid system was observed
for NaCl (Figure 4.6), as it gave a high flux for FO and the overall fluxes for FO and
MD seemed to balance such that the draw solution remained at the same
concentration. A steady decline in flux was still observed (although much lower than
that compared to FO run on its own), however, which was attributed to both membrane
fouling, and RST leading to the presence of draw solute in the feed. In the case of
TEAB (Figure 4.7) and PDAC (Figure 4.8), however, the fluxes for FO were initially
lower than those for MD, leading to a gradual concentration of the draw solution being
fed to the MD. The more concentrated draw solution did not cause an increase in the
FO flux ; the increase in feed concentration due to RST was likely to be small, and it
was concluded that fouling must play a role. For the case of PDAC, the fluxes were
both low and thus the dynamics of draw concentration were less apparent.
Overall, it was shown that the FO-MD hybrid can be used in combination with the draw
solutes studied to ensure long term operation and clean water production, provided
that balanced systems (FO/MD) with high fluxes are achieved. In this regard, control
of the MD flux (perhaps by regulation of the feed temperature) is expected to be more
important for the larger molecular weight solutes due to their poorer flux performance
per unit concentration. That said, an FOMBR-MD system can always be expected to
evolve to a state in which FO and MD fluxes are balanced, since greater MD flux leads
to greater draw concentration and thence FO flux, and vice versa. The final flux is
necessarily lower in the case of poor flux performers, such as the PDAC.
151
Acid cleaning was shown to be suitable for treating the FO membrane support layer.
Basic cleaning was sometimes preferable for the FO membrane active layer, while for
the MD membrane feed side both acidic and basic cleaning worked equally and
adequately. For TEAB, which was the draw solute studied with the greatest tendency
to foul, it was shown that a continuously operated FOMBR-MD system can be run for
extended periods of time (several days) and with relatively constant and stable flux on
the order of 4-5 LMH, provided that regular membrane cleaning was performed.
Overall, for nearly all draw solutes, the highest reverse (FO) and forward solute (MD)
transport was seen to occur during the first two days and the following days showed a
lower reverse solute transport. The RST was lowest for the high molecular weight draw
solutes. The forward solute transport across the MD membrane to the permeate as
observed via electrical conductivity was very low, suggesting that the water is fit for
reuse (including for potable purposes after appropriate further treatment) or
environmental discharge. Similar trends were observed for FOMBR-MD hybrid and
high quality permeate was achieved (>99% rejection of solute).
It is recommended that when high flux is important and salinity or solute build-up
issues are not important, low molecular weight, inorganic salts are used as draw
solutes. On the other hand, when flux is less important and toxicity issues due to
salinity build-up are critical, higher molecular weight organic or poly-electrolytic solutes
are used.
The overall aim of this work, which was to perform an engineering-oriented study of
the component parts and integrated operation of a continuous and feasible FOMBR-
MD system, was deemed a success in the sense that such a system was installed and
run over the longer term. Nevertheless, key questions remain and key deficiencies in
152
the experimental procedure must be addressed, and these points are discussed
below.
6.3 Recommendations for Future Work
Due to the lab health and safety regulations, real wastewater was not permitted for the
current research project and therefore municipal synthetic wastewater with a
monoculture was established to mimic the reality. This is not the best alternative to
wastewater from treatment plant; the author has previously worked with wastewater
and understands well that the operational issues and their scale will be yet greater
with real wastewater. It is recommended that future studies incorporate real
wastewater; this will likely have an effect on membrane fouling, toxicity, FO flux and
RST, and so on.
A key limitation of the current work is that it has been run using a continuous, closed-
loop batch system. This presents a number of questions with respect to its applicability
to a full-scale, engineered system. In the FO process, reverse solute transport can be
expected to lead to a non-steady state accumulation of draw solute in the MBR tank;
a fully continuous system is to be preferred, in which fresh wastewater is fed and spent
sludge (containing retained draw solute) is removed from the tank, and make-up draw
solute is introduced to the draw tank, allowing a closed material balance. The long-
term accumulation of draw solute in the MBR tank will have implications for microbial
toxicity, fouling and FO flux stability. In the MD regeneration loop, the forward solute
transport to the permeate appears to be minimal; however, solutes introduced in the
wastewater feed can forward transport across the FO membrane and again build-up
in the MD feed loop, causing gradual loss of the vapour pressure driving force in the
latter.
153
The lower temperatures needed as well as the lower temperature differences required
for FO-MD in the lab made it easy to operate, but less control was possible during
long-term study. For example, changes in the weather were able to affect the
temperature of the system; this was partly because it was impossible to immerse the
whole process or at least the entirety of the flow loops in the water bath or chiller (the
establishment of a submerged membrane system was attempted, but this could not
be achieved). Indeed, the temperature of the FO feed was mostly not controlled
because of the limited size of the chiller bath and the priority for temperature control
of the permeate.
It was also realised that control of the MD feed temperature was more important for
those draw solutes with higher molecular weight which exhibited a poorer FO flux
performance. Greater temperature control is therefore necessary. An alternative might
be to place the whole system in a sealed tent in which air temperature is controlled.
For temperature polarization, temperature sensors were placed close to the
membrane and in the main supply. Values were observed in person, but automatic
monitoring overnight was not possible because of lack of the sensors required.
Similarly, simultaneous temperature control in all three streams was not achieved; in
addition to the limitations mentioned above, the author did not have access to the
many sensors, controllers and actuators required. Again, future work should consider
including these components.
A direct osmotic pressure measuring device was fabricated and developed during the
project, but could not be made to perform correctly because of a leak in the system.
Such a device would nevertheless be desirable, since osmotic pressure is a key
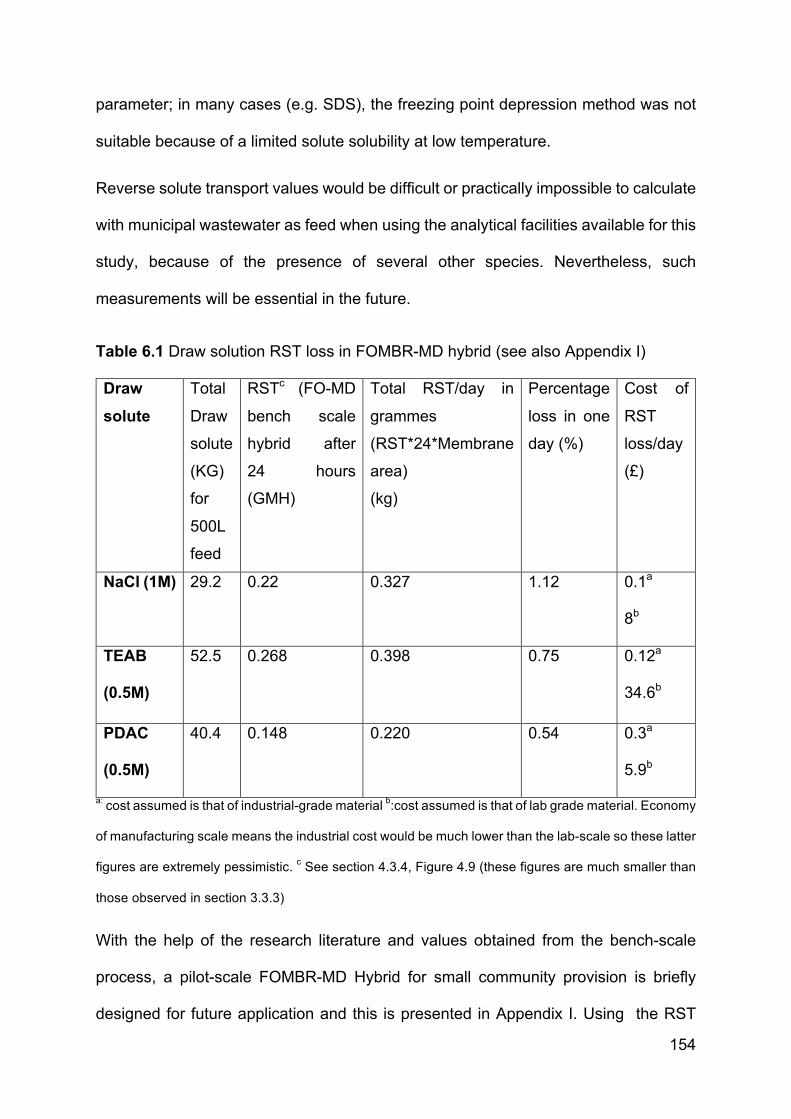
154
parameter; in many cases (e.g. SDS), the freezing point depression method was not
suitable because of a limited solute solubility at low temperature.
Reverse solute transport values would be difficult or practically impossible to calculate
with municipal wastewater as feed when using the analytical facilities available for this
study, because of the presence of several other species. Nevertheless, such
measurements will be essential in the future.
Table 6.1 Draw solution RST loss in FOMBR-MD hybrid (see also Appendix I)
Draw
solute
Total
Draw
solute
(KG)
for
500L
feed
RSTc (FO-MD
bench scale
hybrid after
24 hours
(GMH)
Total RST/day in
grammes
(RST*24*Membrane
area)
(kg)
Percentage
loss in one
day (%)
Cost of
RST
loss/day
(£)
NaCl (1M) 29.2 0.22 0.327 1.12 0.1a
8b
TEAB
(0.5M)
52.5 0.268 0.398 0.75 0.12a
34.6b
PDAC
(0.5M)
40.4 0.148 0.220 0.54 0.3a
5.9b
a: cost assumed is that of industrial-grade material b:cost assumed is that of lab grade material. Economy
of manufacturing scale means the industrial cost would be much lower than the lab-scale so these latter
figures are extremely pessimistic. c See section 4.3.4, Figure 4.9 (these figures are much smaller than
those observed in section 3.3.3)
With the help of the research literature and values obtained from the bench-scale
process, a pilot-scale FOMBR-MD Hybrid for small community provision is briefly
designed for future application and this is presented in Appendix I. Using the RST
155
values obtained from the FO-MD hybrid, the RST loss and the material cost
incurred/day was calculated and is presented in Table 6.1. It can be observed from
this Table that there is a significant amount of RST; as mentioned above, the
associated material cost and other issues like long term salinity in the case of NaCl
and toxicity in the case of TEAB during very long-term operations of the hybrid systems
will need to be taken into account.
The next important consideration for FO-MD hybrid process is the level of flux of FO
and MD (and finding a balance between the two systems by suitable control, as
discussed elsewhere). For examples, in Table 4 in appendix I it can be observed that
the membrane requirement for the PDAC draw solution is approximately 290 modules
of 2.5m2 surface area, which is very high and will lead to a high capital costs, due to
the very low flux values of PDAC in FO compared to that for regeneration with MD. In
the current study, the same concentration of draw solutions were used for FO
throughout, in order to allow a meaningful comparison. Their use at a higher
concentration would yield a correspondingly higher flux. It is advised for future
research on this system to focus on using draw solutions at a concentration where
similar fluxes between FO and MD can initially be produced; the system should then
proceed in a balance fashion as discussed previously. Nevertheless, this might cause
other problems to arise from the increased RST, toxicity, and fouling. The alternative
would be to control MD feed temperature, but this would imply lower fluxes.
The research objectives of the current study were intentionally broad, as the objectives
were ambitious. Nevertheless, with the successful establishment and optimisation of
the FO-MD process in the lab, more focused research studies can and should be
performed in the future.
156
Appendix I
FOMBR-MD Hybrid Scale up
The overall aim of this study was to perform an engineering-oriented study to examine
the component parts and integrated operation of a continuously operated MBR FO-
MD hybrid system for the treatment and recycle of wastewater. By and large, this was
achieved. However, the focus of the current study was on a continuously run closed-
loop, batch process at the lab-scale; due to limited resources and time, it was not
possible to consider all the issues related to scale-up to a full-size, open-loop and
continuous system, nor to monitor and control those factors which would play an
important role. Although current economic and technical uncertainties are such that
the hybrid process is not yet recommended for very large-scale wastewater treatment
plants, such as those required to serve a population on the order of tens of thousands,
scaling up for the installation of a niche, small-scale treatment plant is more feasible,
and is briefly considered in the following design exercise.
A small housing society of 150 people is considered for the currently recommended
installation, with a water consumption and wastewater generation of 150L/person/day.
The wastewater treatment plant will comprise of an equalisation tank, followed by
primary treatment (coarse filtration, and flocculation). FO membranes will be installed
in the bioreactor tank as secondary treatment, and this will be followed by an MD
installation in the re-generation tank as tertiary treatment. A schematic for the process
flowsheet is given in Figure 1, and an outline design for the secondary and tertiary
treatment processes are given below.
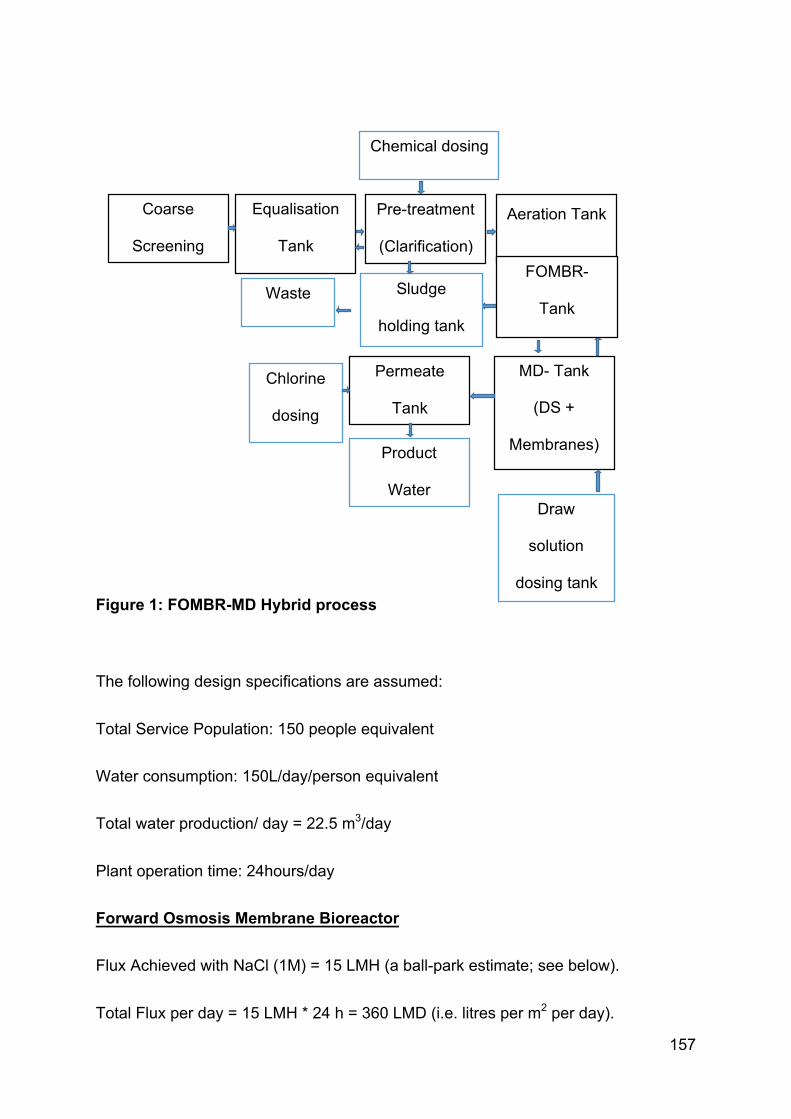
157
Figure 1: FOMBR-MD Hybrid process
The following design specifications are assumed:
Total Service Population: 150 people equivalent
Water consumption: 150L/day/person equivalent
Total water production/ day = 22.5 m3/day
Plant operation time: 24hours/day
Forward Osmosis Membrane Bioreactor
Flux Achieved with NaCl (1M) = 15 LMH (a ball-park estimate; see below).
Total Flux per day = 15 LMH * 24 h = 360 LMD (i.e. litres per m2 per day).
MD- Tank
(DS +
Membranes)
Permeate
Tank
Waste
sludge
Chlorine
dosing
Pre-treatment
(Clarification)
Equalisation
Tank
Coarse
Screening
Aeration Tank
FOMBR-
Tank Sludge
holding tank
Product
Water
Chemical dosing
(if needed)
Draw
solution
dosing tank
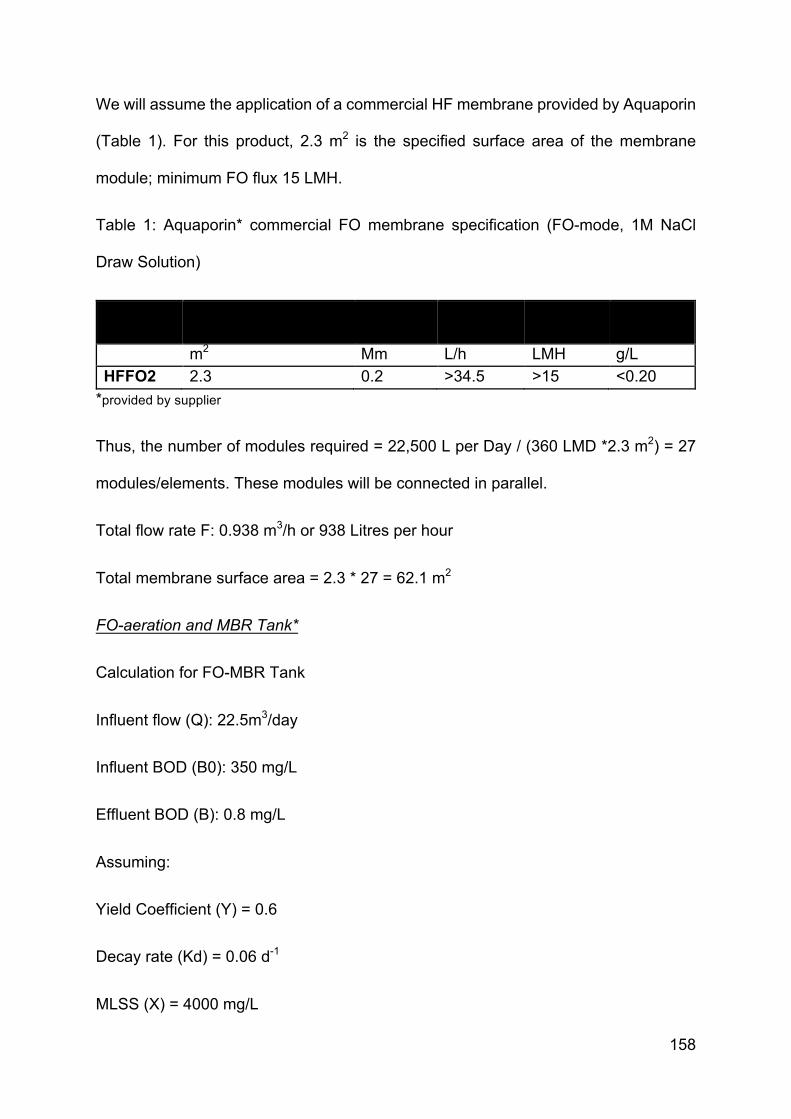
158
We will assume the application of a commercial HF membrane provided by Aquaporin
(Table 1). For this product, 2.3 m2 is the specified surface area of the membrane
module; minimum FO flux 15 LMH.
Table 1: Aquaporin* commercial FO membrane specification (FO-mode, 1M NaCl
Draw Solution)
Product Membrane area per element
Fibre ID Permeate Flow rate
Water Flux
Specific RST
m2 Mm L/h LMH g/L HFFO2 2.3 0.2 >34.5 >15 <0.20
*provided by supplier
Thus, the number of modules required = 22,500 L per Day / (360 LMD *2.3 m2) = 27
modules/elements. These modules will be connected in parallel.
Total flow rate F: 0.938 m3/h or 938 Litres per hour
Total membrane surface area = 2.3 * 27 = 62.1 m2
FO-aeration and MBR Tank*
Calculation for FO-MBR Tank
Influent flow (Q): 22.5m3/day
Influent BOD (B0): 350 mg/L
Effluent BOD (B): 0.8 mg/L
Assuming:
Yield Coefficient (Y) = 0.6
Decay rate (Kd) = 0.06 d-1
MLSS (X) = 4000 mg/L
159
Activated Sludge MLSS (Xw) = 10,000 mg/L
SRT = 10 days
V= (10*22.5*0.6)/4 [(0.35-0.0008)/ (1+0.06*10)]
V= 135/4 (0.349/1.6) = 7.08m3
Assume Depth = 2m
Therefore, Area = 7.08/2= 3.54m2 (Length: 1.88m, Width: 1.88m)
HRT = V/Q0 = (7.08m3 *24)/ 22.5 m3d-1 = 7.5h
Volume of wasted sludge = (7.08 m3*4)/(10*10) = 0.283m3 per day
Thus HRT= 7.5 h and SRT= 10 days
Reactor volume = F X HRT = 7.04m3 (Depth: 2m, length: 1.88m, width: 1.88m)
Draw Solute Consumption
According to Figure 4.9, the loss of NaCl draw solute is 0.2 GMH or 0.2 X 24 X 62.1 =
0.3 kg per day or 0.013kg/m3 water produced. Assuming industrial grade NaCl, this
costs a half less than pence per m3 water produced (see Table 6.1 for all draw solutes).
Membrane Distillation
We assume the average MD flux achieved is 7 LMH (from Figure 4.3, a ball-park
estimate of flux for the diluted NaCl draw solution is 7 LMH).
Total MD Flux per day = 7 * 24 = 168 LMD
By mass balance at steady-state operation, the total water drawn by FO is equal to
the water regenerated by MD = 22,500 Litres per Day.
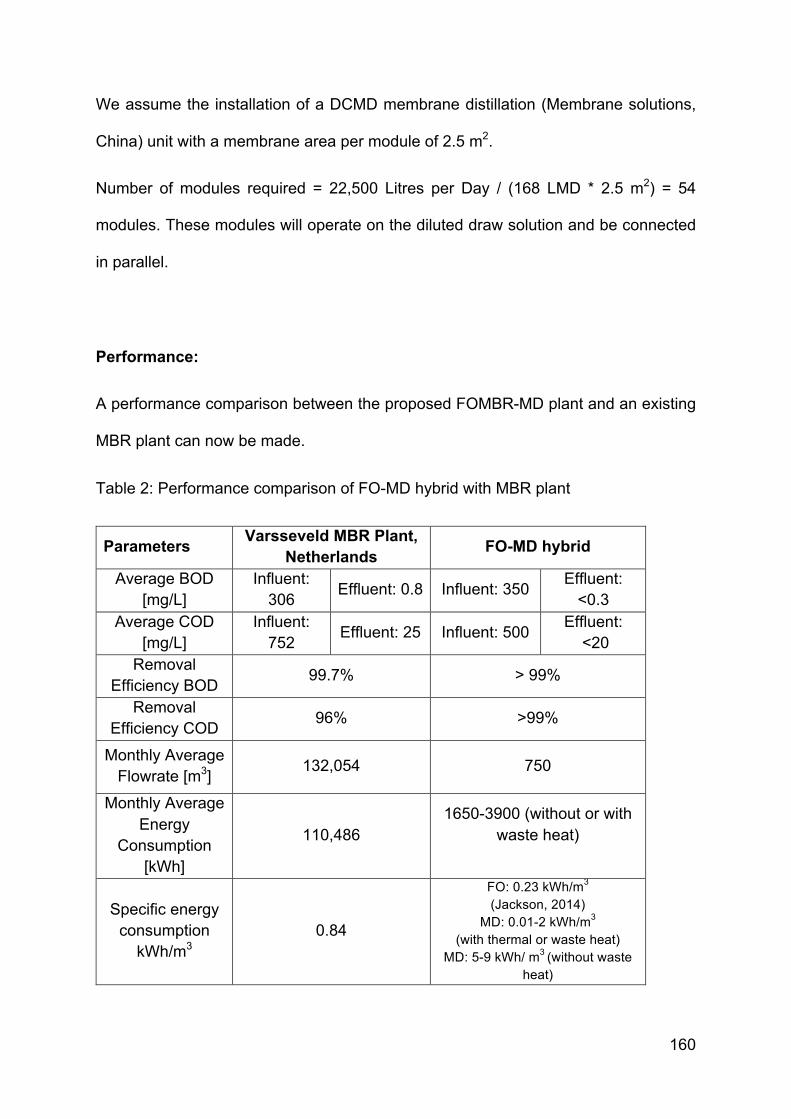
160
We assume the installation of a DCMD membrane distillation (Membrane solutions,
China) unit with a membrane area per module of 2.5 m2.
Number of modules required = 22,500 Litres per Day / (168 LMD * 2.5 m2) = 54
modules. These modules will operate on the diluted draw solution and be connected
in parallel.
Performance:
A performance comparison between the proposed FOMBR-MD plant and an existing
MBR plant can now be made.
Table 2: Performance comparison of FO-MD hybrid with MBR plant
Parameters Varsseveld MBR Plant,
Netherlands FO-MD hybrid
Average BOD [mg/L]
Influent: 306 Effluent: 0.8 Influent: 350 Effluent:
<0.3 Average COD
[mg/L] Influent:
752 Effluent: 25 Influent: 500 Effluent: <20
Removal Efficiency BOD 99.7% > 99%
Removal Efficiency COD 96% >99%
Monthly Average Flowrate [m3] 132,054 750
Monthly Average Energy
Consumption [kWh]
110,486 1650-3900 (without or with
waste heat)
Specific energy consumption
kWh/m3 0.84
FO: 0.23 kWh/m3
(Jackson, 2014)
MD: 0.01-2 kWh/m3 (with thermal or waste heat)
MD: 5-9 kWh/ m3 (without waste heat)
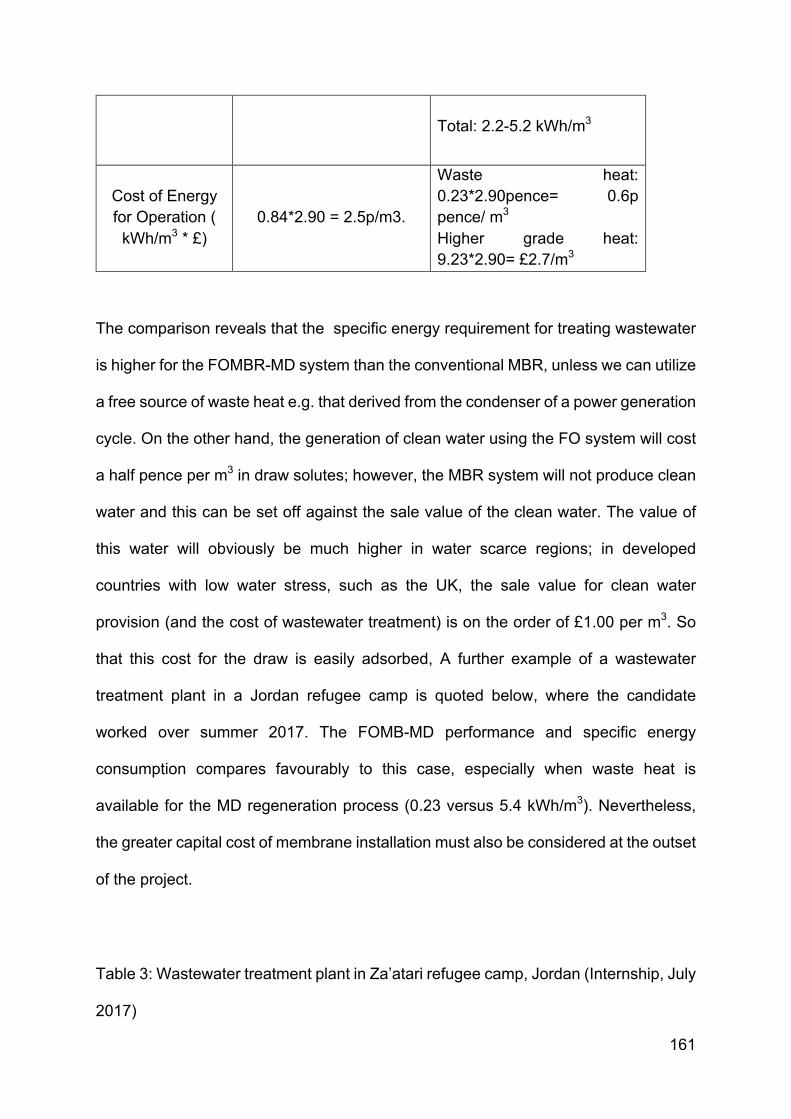
161
Total: 2.2-5.2 kWh/m3
Cost of Energy for Operation (
kWh/m3 * £) 0.84*2.90 = 2.5p/m3.
Waste heat: 0.23*2.90pence= 0.6p pence/ m3 Higher grade heat: 9.23*2.90= £2.7/m3
The comparison reveals that the specific energy requirement for treating wastewater
is higher for the FOMBR-MD system than the conventional MBR, unless we can utilize
a free source of waste heat e.g. that derived from the condenser of a power generation
cycle. On the other hand, the generation of clean water using the FO system will cost
a half pence per m3 in draw solutes; however, the MBR system will not produce clean
water and this can be set off against the sale value of the clean water. The value of
this water will obviously be much higher in water scarce regions; in developed
countries with low water stress, such as the UK, the sale value for clean water
provision (and the cost of wastewater treatment) is on the order of £1.00 per m3. So
that this cost for the draw is easily adsorbed, A further example of a wastewater
treatment plant in a Jordan refugee camp is quoted below, where the candidate
worked over summer 2017. The FOMB-MD performance and specific energy
consumption compares favourably to this case, especially when waste heat is
available for the MD regeneration process (0.23 versus 5.4 kWh/m3). Nevertheless,
the greater capital cost of membrane installation must also be considered at the outset
of the project.
Table 3: Wastewater treatment plant in Za’atari refugee camp, Jordan (Internship, July
2017)
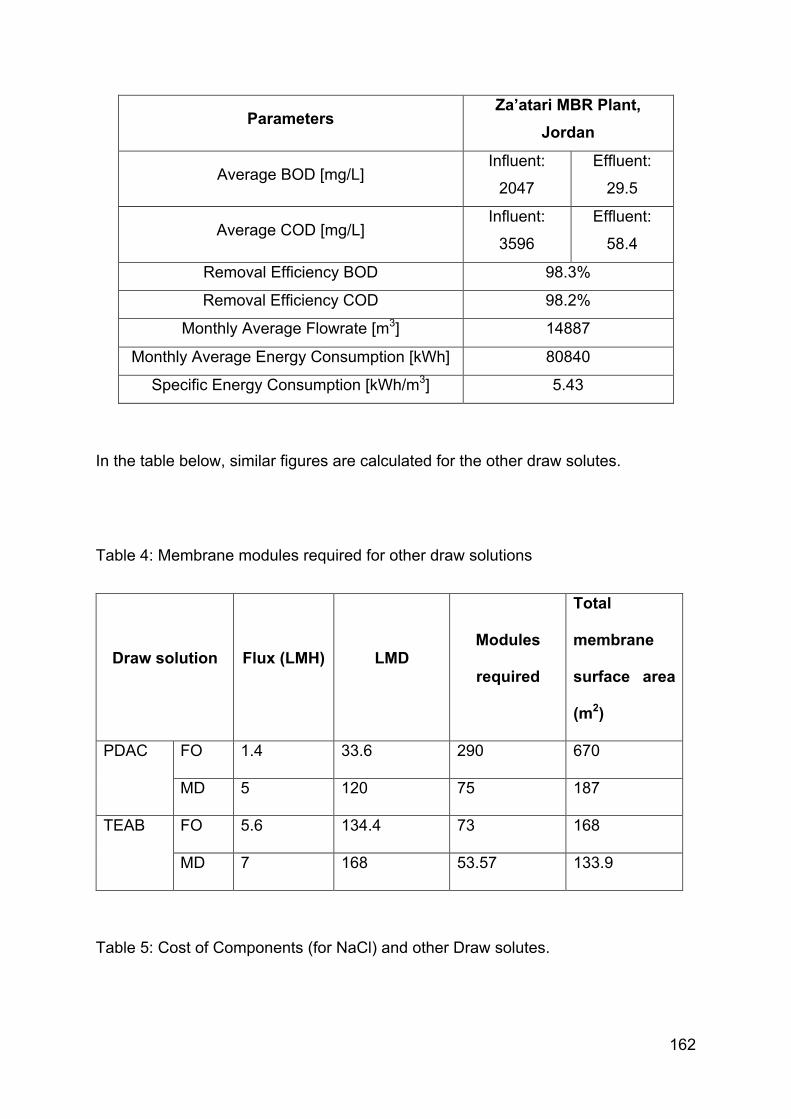
162
Parameters Za’atari MBR Plant,
Jordan
Average BOD [mg/L] Influent:
2047
Effluent:
29.5
Average COD [mg/L] Influent:
3596
Effluent:
58.4
Removal Efficiency BOD 98.3%
Removal Efficiency COD 98.2%
Monthly Average Flowrate [m3] 14887
Monthly Average Energy Consumption [kWh] 80840
Specific Energy Consumption [kWh/m3] 5.43
In the table below, similar figures are calculated for the other draw solutes.
Table 4: Membrane modules required for other draw solutions
Draw solution Flux (LMH) LMD Modules
required
Total
membrane
surface area
(m2)
PDAC FO 1.4 33.6 290 670
MD 5 120 75 187
TEAB FO 5.6 134.4 73 168
MD 7 168 53.57 133.9
Table 5: Cost of Components (for NaCl) and other Draw solutes.
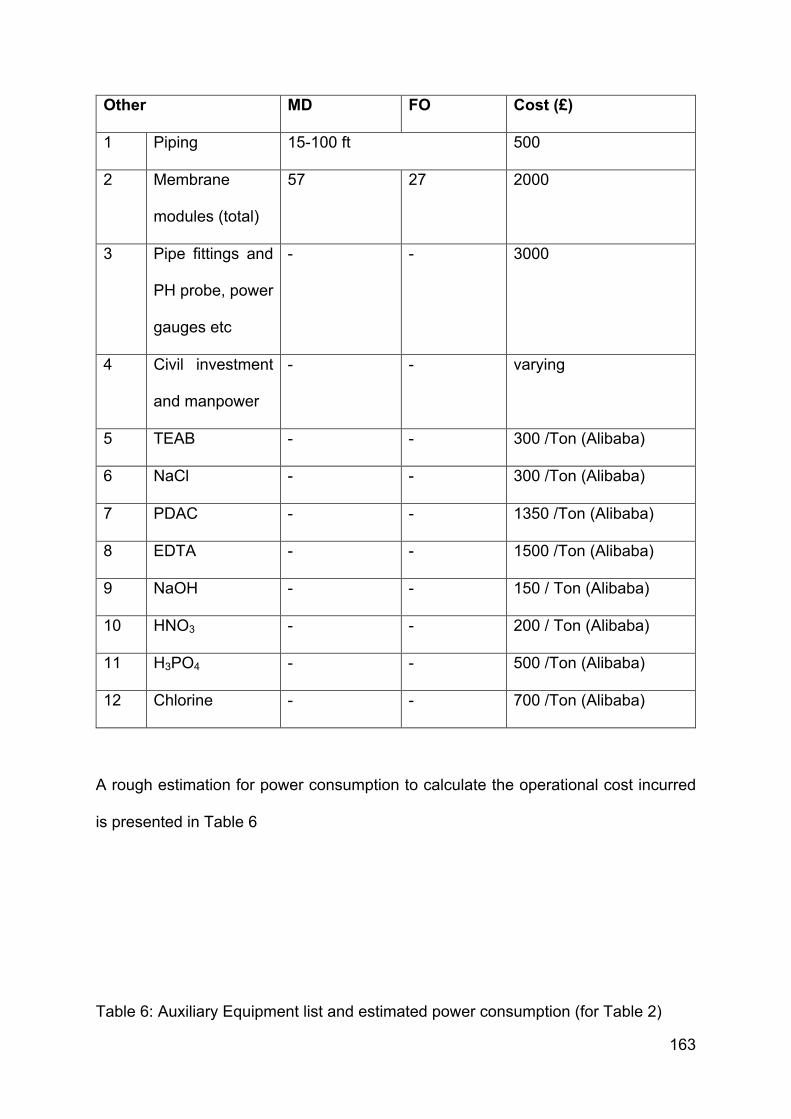
163
Other MD FO Cost (£)
1 Piping 15-100 ft 500
2 Membrane
modules (total)
57 27 2000
3 Pipe fittings and
PH probe, power
gauges etc
- - 3000
4 Civil investment
and manpower
- - varying
5 TEAB - - 300 /Ton (Alibaba)
6 NaCl - - 300 /Ton (Alibaba)
7 PDAC - - 1350 /Ton (Alibaba)
8 EDTA - - 1500 /Ton (Alibaba)
9 NaOH - - 150 / Ton (Alibaba)
10 HNO3 - - 200 / Ton (Alibaba)
11 H3PO4 - - 500 /Ton (Alibaba)
12 Chlorine - - 700 /Ton (Alibaba)
A rough estimation for power consumption to calculate the operational cost incurred
is presented in Table 6
Table 6: Auxiliary Equipment list and estimated power consumption (for Table 2)
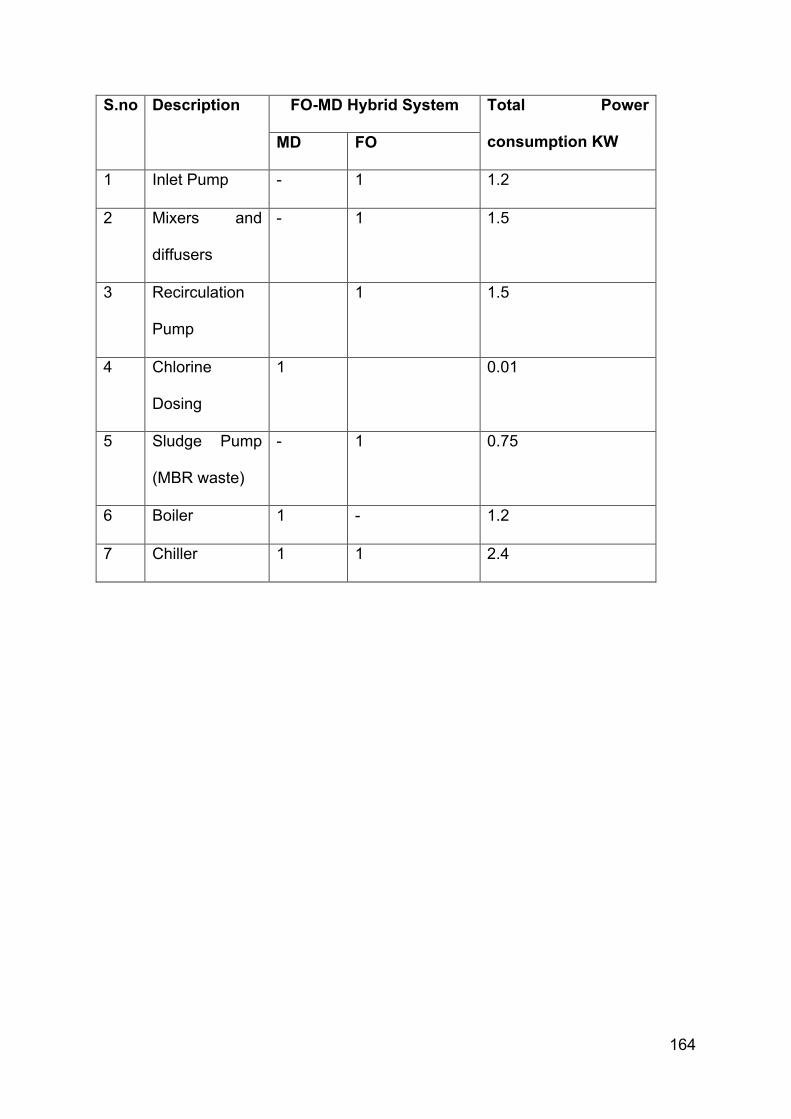
164
S.no Description FO-MD Hybrid System Total Power
consumption KW MD FO
1 Inlet Pump - 1 1.2
2 Mixers and
diffusers
- 1 1.5
3 Recirculation
Pump
1 1.5
4 Chlorine
Dosing
1 0.01
5 Sludge Pump
(MBR waste)
- 1 0.75
6 Boiler 1 - 1.2
7 Chiller 1 1 2.4
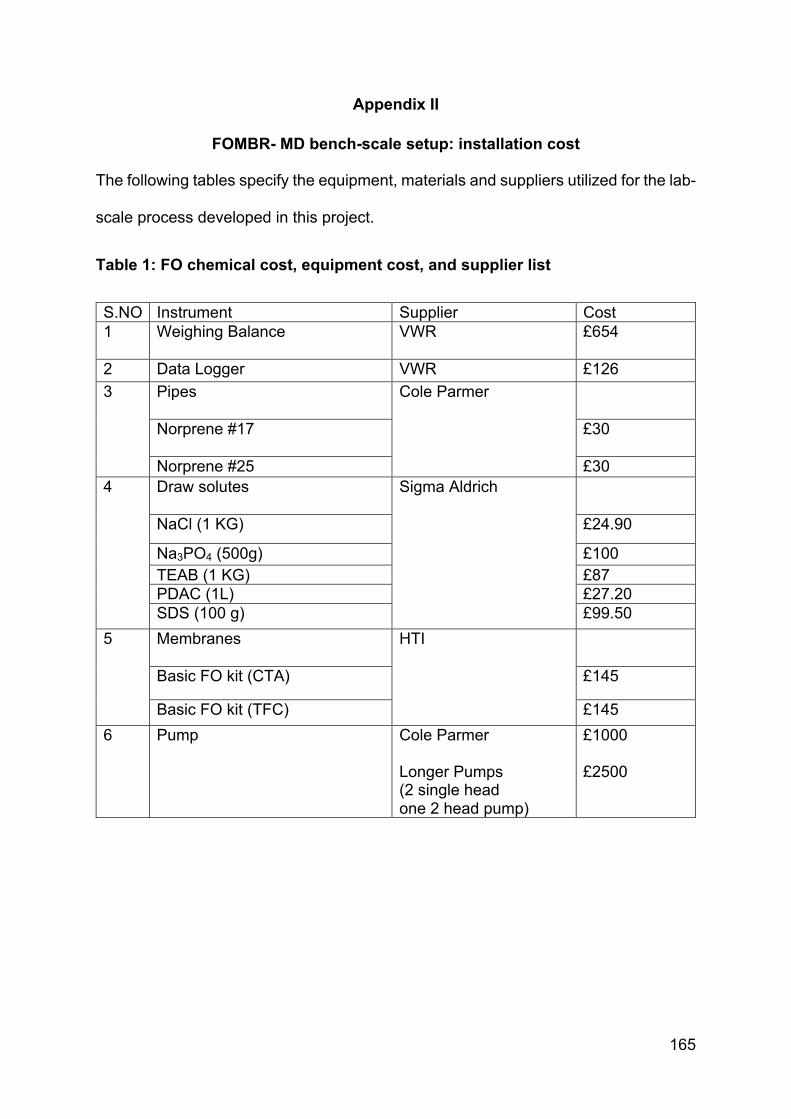
165
Appendix II
FOMBR- MD bench-scale setup: installation cost
The following tables specify the equipment, materials and suppliers utilized for the lab-
scale process developed in this project.
Table 1: FO chemical cost, equipment cost, and supplier list
S.NO Instrument Supplier Cost 1 Weighing Balance VWR
£654
2 Data Logger VWR £126 3 Pipes
Cole Parmer
Norprene #17
£30
Norprene #25 £30 4 Draw solutes
Sigma Aldrich
NaCl (1 KG) £24.90
Na3PO4 (500g) £100 TEAB (1 KG) £87 PDAC (1L) £27.20 SDS (100 g) £99.50
5 Membranes
HTI
Basic FO kit (CTA) £145
Basic FO kit (TFC) £145 6 Pump
Cole Parmer Longer Pumps (2 single head one 2 head pump)
£1000 £2500
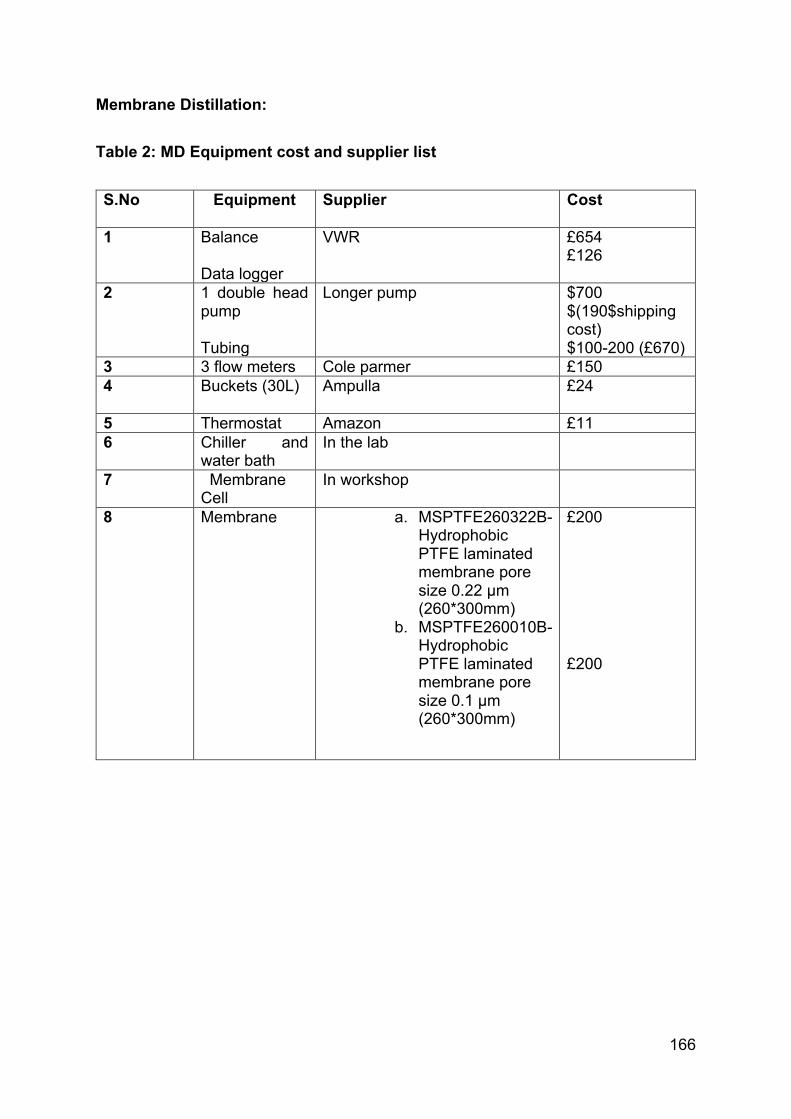
166
Membrane Distillation:
Table 2: MD Equipment cost and supplier list
S.No Equipment
Supplier Cost
1 Balance Data logger
VWR £654 £126
2 1 double head pump Tubing
Longer pump $700 $(190$shipping cost) $100-200 (£670)
3 3 flow meters Cole parmer £150 4 Buckets (30L)
Ampulla £24
5 Thermostat Amazon £11 6 Chiller and
water bath In the lab
7 Membrane Cell
In workshop
8 Membrane a. MSPTFE260322B- Hydrophobic PTFE laminated membrane pore size 0.22 µm (260*300mm)
b. MSPTFE260010B- Hydrophobic PTFE laminated membrane pore size 0.1 µm (260*300mm)
£200 £200
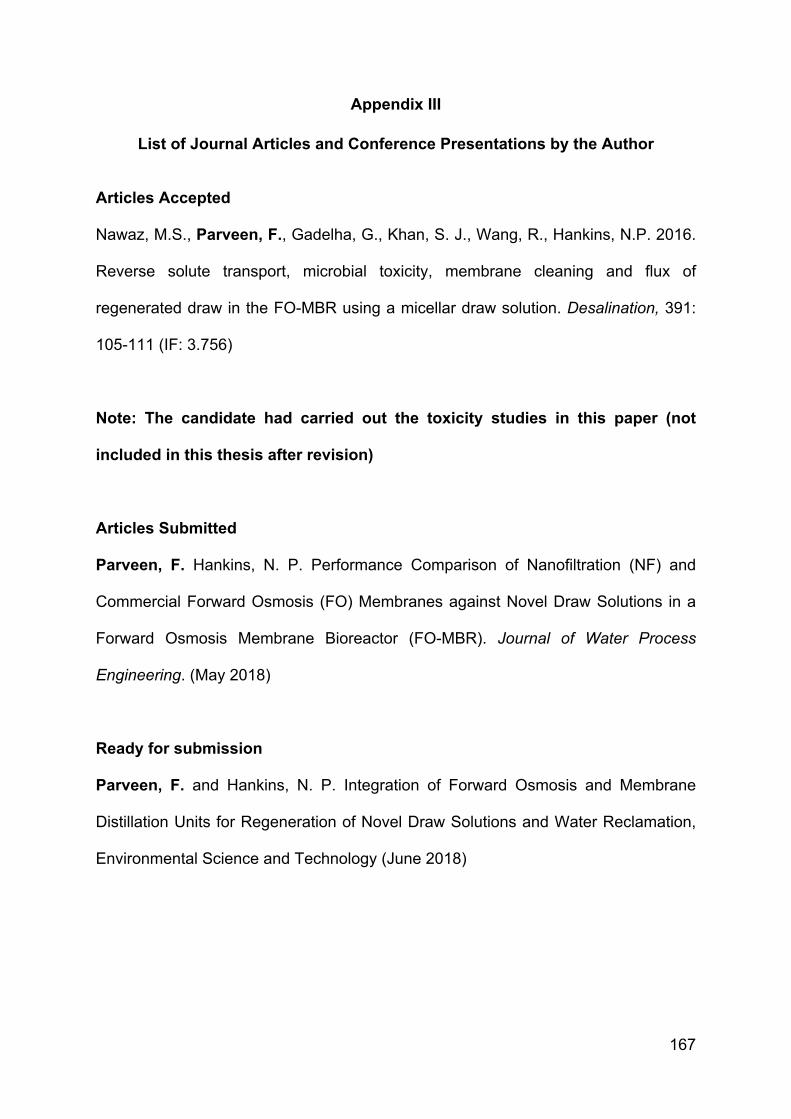
167
Appendix III
List of Journal Articles and Conference Presentations by the Author
Articles Accepted
Nawaz, M.S., Parveen, F., Gadelha, G., Khan, S. J., Wang, R., Hankins, N.P. 2016.
Reverse solute transport, microbial toxicity, membrane cleaning and flux of
regenerated draw in the FO-MBR using a micellar draw solution. Desalination, 391:
105-111 (IF: 3.756)
Note: The candidate had carried out the toxicity studies in this paper (not
included in this thesis after revision)
Articles Submitted
Parveen, F. Hankins, N. P. Performance Comparison of Nanofiltration (NF) and
Commercial Forward Osmosis (FO) Membranes against Novel Draw Solutions in a
Forward Osmosis Membrane Bioreactor (FO-MBR). Journal of Water Process
Engineering. (May 2018)
Ready for submission
Parveen, F. and Hankins, N. P. Integration of Forward Osmosis and Membrane
Distillation Units for Regeneration of Novel Draw Solutions and Water Reclamation,
Environmental Science and Technology (June 2018)
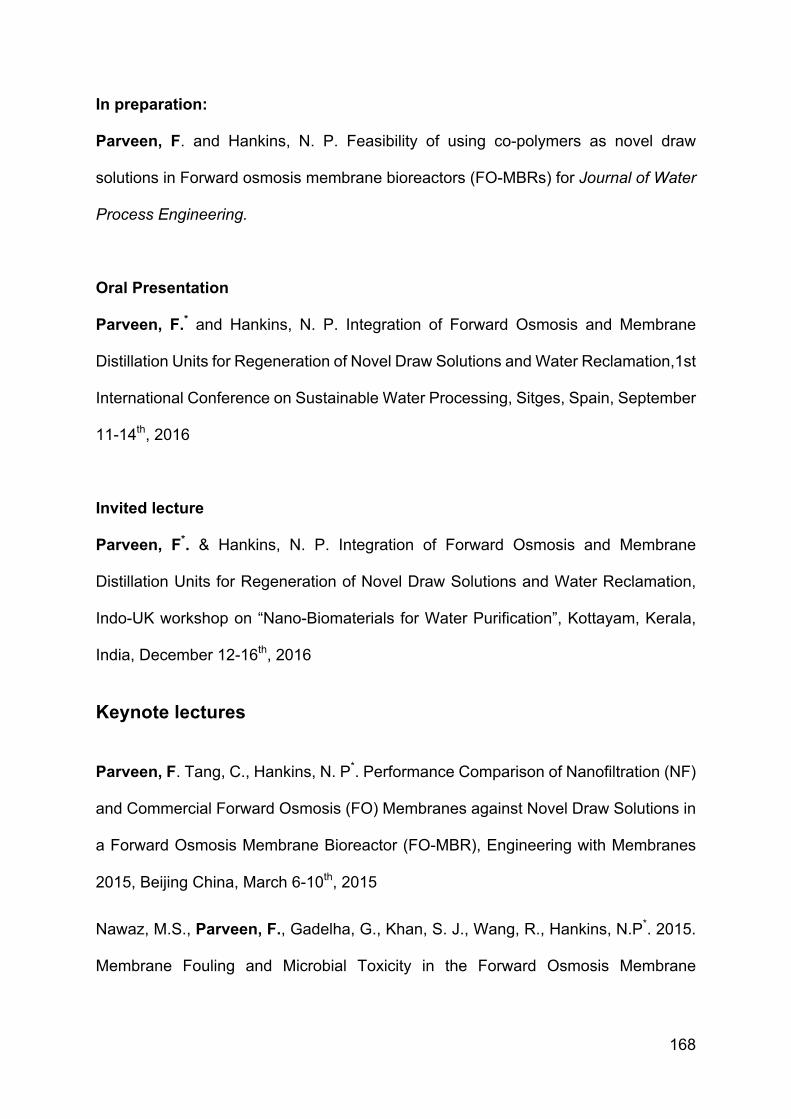
168
In preparation:
Parveen, F. and Hankins, N. P. Feasibility of using co-polymers as novel draw
solutions in Forward osmosis membrane bioreactors (FO-MBRs) for Journal of Water
Process Engineering.
Oral Presentation
Parveen, F.* and Hankins, N. P. Integration of Forward Osmosis and Membrane
Distillation Units for Regeneration of Novel Draw Solutions and Water Reclamation,1st
International Conference on Sustainable Water Processing, Sitges, Spain, September
11-14th, 2016
Invited lecture
Parveen, F*. & Hankins, N. P. Integration of Forward Osmosis and Membrane
Distillation Units for Regeneration of Novel Draw Solutions and Water Reclamation,
Indo-UK workshop on “Nano-Biomaterials for Water Purification”, Kottayam, Kerala,
India, December 12-16th, 2016
Keynote lectures
Parveen, F. Tang, C., Hankins, N. P*. Performance Comparison of Nanofiltration (NF)
and Commercial Forward Osmosis (FO) Membranes against Novel Draw Solutions in
a Forward Osmosis Membrane Bioreactor (FO-MBR), Engineering with Membranes
2015, Beijing China, March 6-10th, 2015
Nawaz, M.S., Parveen, F., Gadelha, G., Khan, S. J., Wang, R., Hankins, N.P*. 2015.
Membrane Fouling and Microbial Toxicity in the Forward Osmosis Membrane
169
Bioreactor using Micellar Draw Solutions. 2nd International Conference on Desalination
Using Membrane Technology, Singapore, 26-29 July 2015
Poster
Parveen, F.* and Hankins, N. P. 2015. Performance Evaluation of Nanofiltration and
Commercial Forward Osmosis (FO) Membrane for Forward Osmosis Membrane
Bioreactor (FO-MBR), IWA UK Young Water Professionals Conference, April 13-15th,
2015
* Presenter
Others:
Jul – Aug 2017 Intern- UNICEF WASH section, Amman Jordan
Responsibilities: Za’atari Refugee camp wastewater treatment plant performance
evaluation and improvement recommendation
Mar 2016 Thought for food summit, Pitch competition, Zurich, Switzerland.
Business plan competition for food production. Our team called ‘oxmosis’ was the only
team from the UK in the Top 10.
Business idea: Using forward osmosis for wastewater treatment using fertiliser as
draw solution, followed by direct use of draw water for fertigation.
170
References
Abdelrasoul, A., Doan, H., & Lohi, A. 2013. Mass Transfer - Advances in Sustainable
Energy and Environment Oriented Numerical Modeling. Intech Open Access
Publisher, 195
Achilli, A., Cath, T. Y., and Childress, A. E. 2010. Selection of inorganic-based draw
solutions for forward osmosis applications. Journal of Membrane Science, 364(1-2):
233-241
Achilli, A., Cath, T.Y., Marchand, E.A., Childress, A.E. 2009. The forward osmosis
membrane bioreactor: a low fouling alternative to MBR processes. Desalination,
239:10–21
Adham, S., Oppenheimer, J., Liu, L., and Kumar, M. 2009. Dewatering Reverse
Osmosis concentrate from water reuse applications using Forward Osmosis, Water
Reuse Foundation.
Adham, S., Oppenheimer, J., Liu, L., Kumar, M.2007. Dewatering reverse osmosis
concentrate from water reuse applications using forward osmosis. Water Reuse
Foundation Research Report
Aimar, P. Howell, J.A., Turner, M.1989. Effects of concentration boundary layer
development on the flux limitations in ultrafiltration, Chemical Engineering Research
and Design, 67(3): 255–261.
Al-Amoudi, A. S.2010. Factors affecting natural organic matter (NOM) and scaling
fouling in NF membranes: A review. Desalination, 259(1-3): 1-10
171
Alejo, T., Arruebo, M., Carcelen, V., Mosalvo, V. M., Sebastian, V. 2017. Advances in
draw solutes for forward osmosis: Hybrid organic-inorganic nanoparticles and
conventional solutes. Chemical Engineering Journal, 309: 738–752
Alkhudhiri, A., Darwish, N., Hilal, N. 2012. Membrane distillation: A comprehensive
review. Desalination, 287:2-18
Alsvik, L. I. and Hagg, M. 2013. Pressure Retarded Osmosis and Forward Osmosis
Membranes. Materials and Methods. Polymers, 5:303-327.
Altaee, A., Miller, G. J., Zaragoza, G., Sahrif, A. O. 2017. Energy efficiency of RO and
FO-RO system for high salinity seawater treatment. Clean technologies and
Environmental policy, 19(1): 77-91
Alturki, A., McDonald, J., Khan, S. J., Hai, F. I,Price, W. E., Nghiem, E. D. 2012.
Performance of a novel osmotic membrane bioreactor (OMBR) system: flux stability
and removal of trace organics. Bioresource Technology, 113: 201-206
Amin, M.M., Heidari, M., Momeni, S. A., Ebrahimi, H. 2016. Performance evaluation
of membrane bioreactor for treating industrial wastewater: A case study in Isfahan
Mourchekhurt industrial estate. International Journal of Environmental Health
Engineering, 5:12
Amini, M., Jahanshahi, M., Rahimpour, A. 2013.Synthesis of novel thin film
nanocomposite (TFN) forward osmosis membranes using functionalized multi-walled
carbon nanotubes. Journal of Membrane Science, 435: 233-241
Amos, D. A., Markels, J. H., Lynn, S. B & Radke, C. J. (1998). Osmotic Pressure and
Interparticle Interactions in Ionic Micellar Surfactant Solutions. Journal of Physical
Chemistry, 102:2793-2753
172
Bai, H., Liu, Z., Sun, D.D. 2011. Highly water soluble and recovered dextran coated
Fe3O4 magnetic nanoparticles for brackish water desalination. Separation and
Purification Technology, 81:392–399
Batchelder, G.W. 1965. Process for the Demineralization of Water, US Patent,
3171799.
Bhausaheb, L., Pangarkar, M. G. Sane, M. G. 2011. Reverse Osmosis and Membrane
Distillation for Desalination of Groundwater: A Review. ISRN Materials Science, Article
ID 523124, doi:10.5402/2011/52312
Blandin, G.,Gautier, C., Toran, M. S., Monclus, H., Rodriguez-Roda, Ignasi., Comas,
J. 2018. Retrofitting membrane bioreactor (MBR) into osmotic membrane bioreactor
(OMBR): a pilot scale study. Chemical Engineering Journal,
https://doi.org/10.1016/j.cej.2018.01.103
Boubakri, A., Bouchrit, R., Hafiane, Bouguecha, S. A. 2014. Fluoride removal from
aqueous solution by direct contact membrane distillation: theoretical and experimental
studies. Environmental Science and Pollution Research. 21(17):10493-10501
Boubakri, A., Hafiane, A. and Bouguecha, S.A.T. 2014b. Direct contact membrane
ditillation: capability to desalt draw water. Arabian Journal of Chemistry,
http://dx.doi.org/10.1016/j.arabjc.2014.01.010
Bowden, K.S., Achilli, A. , Childress. A.E. 2012. Organic ionic salt draw solutions for
osmotic membrane bioreactors. Bioresource Technology, 122: 207-216
Bowles, B. L., & Miller, A. J. 1993. Antibotulinal properties of selected aromatic and
aliphatic aldehydes. Journal of Food Protection, 56:788-794.
173
Bowles, B. L., Sackitey, S. K., Williams, A. C. 1995. Inhibitory effects of flavor
compounds on Staphylococcus aureus WRRC B124. Journal of Food Safety, 15:337-
347.
Brul, S. & Coote, P. 1999. Preservative agents in foods: mode of action and microbial
resistance mechanisms. International Journal of Food Microbiology, 50:1-17.
Bui, N.-N., McCutcheon, J. R. 2013.Hydrophilic nanofibers as new supports for thin
film composite membranes for engineered osmosis. Environmental Science and
Technology, 47: 1761-1769
Camacho, L.M., Dumee, L., Zhang, J., Li, J., Duke, M., Gomez, J. & Grey, S. 2013.
Advances in Membrane Distillation for Water Desalination and Purification
Applications. Water, 5:94-196
Cannon J, Kim D, Maruyama S, et al. (2012). Influence of ion size and charge on
osmosis. Journal of Physical Chemistry B, 116:4206–4211. doi:10.1021/jp2113363
Carmignani, G., Sitkiewitz, S. & Webley, J.W.2012. Recovery of Retrograde Soluble
Solute for Forward Osmosis Water Treatment, WO 2012/148864.
Cath, T. Y., Gormly,S., Beaudry, E.G., Flynn, M.T., Adams, V.D., Childress A.E. 2005.
Membrane Contactor Processes for Wastewater Reclamation in Space Part I. Direct
Osmotic Concentration as Pretreatment for Reverse Osmosis. Journal of Membrane
Science, 257(1-2):85-98.
Cath, T.Y., Hancock, N.T., Lundin, C.D., HoppeJones, C. Drewes, J.E. 2010. A multi-
barrier osmotic dilution process for simultaneous desalination and purification of
impaired water, Journal of Membrane Science, 362:417–426.
174
Chang, H., Wang, G. Chen, Y., Li, C., Chang, C. 2010. Modeling and optimization of
a solar driven membrane distillation desalination system. Renewable Energy, 35(12):
2714-2722
Chekli, L., Sherub, P., Kim, S. E., Kim, J., Choi, J. Y., Choi, J., Kim, S., Kim, J. H.,
Hong, S., Sohn, J., Shon, H. K. 2016. A comprehensive review of hybrid forward
osmosis systems: Performance, applications and future prospects. Journal of
Membrane Science, 497 (430-449)
Chemical Rubber Co., Handbook of Chemistry and Physics, 50th edition, Cleveland,
Ohio, 1970
Chen, L., Gu, Y.S., Cao, C.Q., Zhang, J., Ng, J.W., Tang, C.Y. (2014). Performance
of a submerged anaerobic membrane bioreactor with forward osmosis membrane for
low-strength wastewater treatment. Water Resource, 50: 114-123
Cheng,T., Han, C.,Hwang, K., Ho, C., & Cooper, W. J. 2010. Influence of Feed
Composition on Distillate Flux and Membrane Fouling in Direct Contact Membrane
Distillation, Separation Science and Technology, 45:7, 967-974,
DOI:10.1080/01496391003666908
Choi, Y. J., Choi, J. S., Oh, H. J., Lee, S., Yang, D. R. and Kim, J. H. (2009). Toward
a combined system of forward osmosis and reverse osmosis for seawater
desalination. Desalination, 247(1-3): 239-246.
Chou, S., Shi, L., Wang, R.,Tang, C.Y., Qiu, C., Fane, A. G .2010. Characteristics
and potential application of a novel forward osmosis hollow fiber membrane.
Desalination, 261:365-372
175
Chung, T., Lui, L., Wan, C. F., Cui, Y., Amy, G. 2015. What is next for forward osmosis
(FO) and pressure retarded osmosis (PRO). Separation and Purification Technology.
156(2): 856-860
Coday, B. D. Xu, P., Beaudry, E. G., Herron, J., Lampi, K., Hancock, N. T. and Cath,
T. Y. 2014. The sweet spot of forward osmosis: Treatment of produced water, drilling
wastewater, and other complex and difficult liquid streams. Desalination, 33:23-35.
Cornelissen, E.R., Harmsen, D., Beerendonk, E.F. , Qin, J.J., Oo, H., de Korte, K.F.,
Kappelhof, J.W.M.N. 2011. The innovative Osmotic Membrane Bioreactor (OMBR) for
reuse of wastewater. Water Science and Technology, 63: 1557-1565
Cornelissen, E.R., Harmsen, D., de Korte, K.F., Ruiken, C.J.,Qin, J.J., Oo, H.,
Wessels, L.P. 2008. Membrane fouling and process performance of forward osmosis
membranes on activated sludge. Journal of Membrane Science, 319 (1-2):158-168
Costa, R., Pereira, J. L., Gomes, J., Goncalves, F., Hunkeler, D., Rasteiro, M. G. 2014.
The effects of acrylamide polyelectrolytes on aquatic organisms: Relating toxicity to
chain architecture. Chemosphere, 112:177-184
Cui, Y., Wang, H., Wang, H., Chung, T.-S. 2013.Micro-morphology and formation of
layer-by-layer membranes and their performance in osmotically driven processes
Daniels, F. H., Nedev, N.D., Cataldo, T., Leonardo, E. F. & Cortell, S.(1988). The use
of polyelectrolytes as osmotic agents for peritoneal dialysis. Kidney International.
33:925-929
Darton, T., Annunziata, U., Pisano, F.D.V., Gallego, S. 2004. Membrane autopsy helps
to provide solutions to operational problems. Desalination, 167:239-245
176
Dey, P., Izake, E.L.2015. Magnetic nanoparticles boosting the osmotic efficiency of a
polymeric FO draw agent: effect of polymer conformation. Desalination, 373:79–85
Dufour, V., Stahl, M., Baysse, C. 2015. The antibacterial properties of isothiocyanates.
Microbiology, 161, 229-243
Dumée, L., Lee, J., Sears, K., Tardy, B., Duke, M., Gray, S. 2013.Fabrication of thin
film composite poly(amide)-carbon-nanotube supported membranes for enhanced
performance in osmotically driven desalination systems. Journal of Membrane
Science, 427:422–430
Duong, P.H.H., Zuo, J., Chung, T.-S. 2013. Highly crosslinked layer-by-layer
polyelectrolyte FO membranes: understanding effects of salt concentration and
deposition time on FO performance. Journal of Membrane Science, 427: 411-421
EL-Abbasi, A., Hafidi, A., Khayet, M. & Gracia-Payo, M. C. 2013. Integrated direct
contact membrane distillation for olive mill wastewater treatment. Desalination,
323:31-38
El-Bourawi, M.S., Ding, Z., Ma, R., Khayet, M. 2006. A framework for better
understanding membrane distillation separation process Journal of Membrane
Science, 285, 4–29
El-Fadel, M., Hashisho, J. 2014. A comparative examination of MBR and SBR
performance for the treatment of high-strength landfill leachate. Journal of the Air &
Waste Management Association, 64(9): 1073-1084
Emadzadeh, D. , Lau, W.J. , Ismail, A.F. 2013.Synthesis of thin film nanocomposite
forward osmosis membrane with enhancement in water flux without sacrificing salt
rejection. Desalination, 330: 90-99
177
Environmental Protection Agency. 2003. Membrane filtration guide manual.
Washington DC: Allgeier, S.
Ettouney, H.M. , El-Dessouky, H.T., Faibish, R.S., Gowin, P.2002. Evaluating the
economics of desalination, Chemical Engineering Progress, 98 (12):32–40
Ettouney, H.M. , El-Dessouky, H.T., Faibish, R.S., Gowin, P.2002. Evaluating the
economics of desalination, Chemical Engineering Progress, 98 (12):32–40
Fam, W., Phuntsho ,S., Lee, J. H. & Shon, H. K. 2013.Performance comparison of
thin-film composite forward osmosis membranes, Desalination and Water Treatment,
51(31-33):6274-6280
Field, R. 2010. Fundamentals of fouling. Peinemann,K.V., Nunes, S. P. (Eds.),
Membranes for Water Treatment, Wiley-VCH Verlag GmbH & Co. KGaA,
Weinheim,1–24
Field, R. W. & Pearce, G. K. 2011. Critical, sustainable and threshold fluxes for
membrane filtration with water industry applications. Advances in Interface Colloid and
Science, 164: (38-44).
Frank, B.S. 1972. Desalination of Sea Water, US Patent 3670897
Franken, A.C.M.,Nolton, J.A.M., Mulder, M.H.V.,Bargeman, D., Smolders, C.A. 1987.
Wetting criteria for the applicability of membrane distillation. Journal of Membrane
Science, 33 (3): 315–328
Franken, A.C.M.,Nolton, J.A.M., Mulder, M.H.V.,Bargeman, D., Smolders, C.A. 1987.
Wetting criteria for the applicability of membrane distillation. Journal of Membrane
Science, 33 (3): 315–328
178
Gadelha, G. A. F., and Hankins, N. P. 2011. Assessment of draw-solution performance
in combination with assymetric membranes for forward osmosis. IDAWC, Perth,
Australia
Gai, J. & Zhang, X. 2015. Single-layer graphene membranes for super-excellent brine
separation in forward osmosis. RSC Advances. 5: 68109-68116 (DOI:
10.1039/C5RA09512C)
Gai, J.G., Gong, X.L.2014. Zero internal concentration polarization of membrane:
Functionalized graphene. Journal of Material Chemistry, 2:425–429.
Ge, Q., Ling, M., Tung, T., -S. 2013. Draw solutions for forward osmosis processes:
Developments, challenges, and prospects for the future. Journal of Membrane
Science, 442:225-237
Ge, Q., Su, J., Chung, T.-S. , Amy, G.2011. Hydrophilic superparamagnetic
nanoparticles: synthesis, characterization, and performance in forward osmosis
processes. Industrial and Engineering Chemistry Research, 50: 382–388
Ge, Q., Wang, P., Wan, C., and Chung, T.-S. 2012. Polyelectrolyte-Promoted Forward
Osmosis–Membrane Distillation (FO–MD) Hybrid Process for Dye Wastewater
Treatment. Environmental science and technology, 46(11): 62366243
Ge, Q.C., Fu, F.J., Chung, T.S.2014. Ferric and cobaltous hydroacid complexes for
forward osmosis (FO) processes. Water Research, 58: 230–238
Gill, A. O. & Holley, R. A. 2004. Mechanisms of Bactericidal Action of Cinnamaldehyde
against Listeria monocytogenes and of Eugenol against L. monocytogenes and
Lactobacillus sakei. Applied Environmental Microbiology, 70(10): 5750-5755
179
Gonotec GmbH, Instruction Manual for Osmomat 030 Freezing Point Osmometer,
1996, Page 2.
Gryta, M., Karakulski, K., Morawski, A.W.2001. Purification of oily wastewater by
hybrid UF/MD, Water Research, 35 (15):3665–3669
Gryta, M., Tomaszewska, M. & Karakulski, K. 2006. Wastewater treatment by
membrane distillation. Desalination, 198(1-3): 67-73
Gryta, M.2005. Long-term performance of membrane distillation process. Journal of
Membrane Science, 265 (1–2):153–159
Gryta, M.2005. Long-term performance of membrane distillation process. Journal of
Membrane Science, 265 (1–2):153–159
Gryta, M.2005. Long-term performance of membrane distillation process. Journal of
Membrane Science, 265:153–159
Gryta, M. 2008. Fouling in direct contact membrane distillation. Journal of Membrane
Science, 325 (1): 383-394
Gryta, M. 2012. Effectiveness of water desalination by membrane distillation process.
Membranes, 2: 415-429
Gryta, M. Tomaszewska, M., Karakulski, K.2006. Wastewater treatment by membrane
distillation, Desalination, 198:67–73
Gu, Y.S., Chen, L., Ng, J.W., Lee, C., Chang, V.W.C., Tang, C.Y. 2015.Development
of anaerobic osmotic membrane bioreactor for low-strength wastewater treatment at
mesophilic condition. Journal of Membrane Science, 490: 197-208
180
Guglielmi G., Andreottola G.2010. Selection and Design of Membrane Bior, Handbook
of Environmental Engineering reactors in Environmental Bioengineering, in
Environmental Biotechnology. Wang L.K., Ivanov V., Tay J.-H., Hung Y.-T., editors.
Volume 10. Humana Press; New York, NY, USA: pp. 439–514.
Gunko, S., Verbych, S.,Bryk,M.,Hilal,M. 2006. Concentration of apple juice using direct
contact membrane distillation. Desalination, 190 (1–3):117–124
Guo, C.X., Zhao, D., Zhao, Q., Wang, P., Lu, X.2014. Na+-functionalized carbon
quantum dots: a new draw solute in forward osmosis for seawater desalination.
Chemical Communications, 50:7318–7321
Gupta, V. K., Ali, I., Saleh, T.A., Nayak, A. and Agarwal, S. 2012. Chemical treatment
technologies for waste-water recycling—an overview. Royal Society of Chemistry
Advances, 2: 6380-6388
Han, J., Cho, Y.H. , Kong, H., Han, S., Park, H.B. 2013.Preparation and
characterization of novel acetylated cellulose ether (ACE) membranes for desalination
applications. Journal of Membrane Science, 428: 533-545
Hancock, N.T. & Cath. T.Y. 2009 .Solute coupled diffusion in osmotically driven
membrane processes, Environmental Science and Technology, 43: 6769–6775.
Harwood, C. R., and S. M. Cutting. 1990. Chemically defined growth media and
supplements, p. 548. In C. R. Harwood and S. M. Cutting (ed.), Molecular biological
methods for Bacillus. Wiley, Chichester, United Kingdom.
Helander, I. M., Alakomi, H. L., Latva-Kala, K., Mattila-Sandholm, T., Pol, L., Smid, E.
J., Gorris, L. G. M., von Wright, A. 1998. Characterization of the action of selected
181
essential oil components on Gram-negative bacteria. Journal of Agriculture Food
Chemistry, 46:3590-3595.
Hickenbottom, K. L. and Cath, T. Y. 2014. Sustainable operation of Membrane
distillation for enhancement of mineral recovery from hypersaline solutions. Journal of
Membrane Science, 454:426-435
Hickenbottom, K. L. and Cath, T. Y. 2014. Sustainable operation of Membrane
distillation for enhancement of mineral recovery from hypersaline solutions. Journal of
Membrane Science, 454:426-435
Holloway, R. W., Maltos, R., Vaneeste, J. & Cath, T. Y. 2015. Mixed draw solutions
for improved forward osmosis performance. Journal of Membrane Science, 491: 121-
131
Hough, W.T. 1970. Process for Extracting Solvent from a Solution, US Patent 3532621
Hoyer, M., Haseneder, R. &Repke, J.2016. Development of a hybrid water treatment
process using forward osmosis with thermal regeneration of a surfactant draw solution.
Desalination and water Treatment, 57:59 (28670-28683)
Hsu, S.T., Cheng, K.T., Chiou, J.S.2002. Seawater desalination by direct contact
membrane distillation. Desalination, 143 (3):279–287
Huang, L. , McCutcheon, J.R. 2014.Hydrophilic nylon 6,6 nanofibers supported thin
film composite membranes for engineered osmosis. Journal of Membrane Science,
457:162-169
Huang, M. H. Chen, Y. S. Huang, C. H. Sun, P. Z. Crittenden, J. 2015.Rejection and
adsorption of trace pharmaceuticals by coating a forward osmosis membrane with
TiO2. Chemical Engineering Journal, 279:904– 911
182
Hunag, L., Lee, D., Lai, J. 2015b. Forward osmosis membrane bioreactor for
wastewater treatment with phosphorus recovery. Bioresource Technology, 198: 418-
423
Hwang, H. J., He, K., Grey, S., Zhang, J. & Moon, S. L. 2011. Direct contact membrane
distillation (DCMD): Experimental study on the commercial PTFE membrane and
modelling. Journal of Membrane Science. 371(1-2):90-98
Jin, X., Tang, C. Y., Gu. Y, She, Q., Qi, Saren. 2011. Boric Acid Permeation in Forward
Osmosis Membrane Processes: Modeling, Experiments, and Implications.
Environmental Science and Technology. 45 (6): 2323–2330
Jun, B. M., Nguyen, T. P. N., Ahn, S. H., Kim., I.C. & Kwon, Y. N. 2015. The application
of polyethyleneimine draw solution in a combined forward osmosis/nanofiltration
system, Journal of Applied polymer science, 132(27), DOI: 10.1002/app.42198
Karakulski, K., Gryta, M., Morawski, A. 2002. Membrane processes used for potable
water quality improvement, Desalination, 145:315–319
Karakulski, K. , Gryta, M. 2005. Water demineralisation by NF/MD integrated
processes, Desalination, 177 :109–119
Kavanaugh, N.L., Ribbeck, K.2012. Selected antimicrobial essential oils eradicate
Pseudomonas spp. and Staphylococcus aureus biofilms. Applied Environmental
Microbiology.78(11):4057–4061.
Kesieme, U. K., Milne, N., Aral, H., Cheng, C. Y., Duke, M. 2013. Economic analysis
of desalination technologies in the context of carbon pricing, and opportunities for
membrane distillation. Desalination, 323: 66–74
183
Kessler, J.O., Moody, C.D. 1976.Drinking water from sea water by forward osmosis,
Desalination, 18:297–306.
Kessler, J.O., Moody, C.D. 1976.Drinking water from sea water by forward osmosis.
Desalination, 18:297–306.
Kezia, K., Lee, J., Weeks, M. and Kentish, S. 2015. Direct contact membrane
distillation for concentration of saline dairy effluent. Water Research, 81:167-177
Khan, S. J., Parveen, F., Ahmed, Aman., Hashmi, I. and Hankins, N. 2013.
Performance evaluation and bacterial characterization of FO-MBR. Bioresource
Technology, 141:2-7
Khayet, M., Matsuura, T.2001. Preparation and characterization of polyvinylidene
fluoride membranes for membrane distillation. Industrial and Engineering Chemistry
Research ,40 (24):5710–5718
Khayet, M., Matsuura T. 2011. Membrane distillation principles and applications,
Elservier B.V., ch. 10, pp. 254-268.
Khorshidi, B., Bhinder,A., Thundat, T., Pernitsky, D., Sadrzadeh, M. 2016. Developing
high throughput thin film composite polyamide membranes for forward osmosis
treatment of SAGD produced water, Journal of Membrane Science,
http://dx.doi.org/10.1016/j.memsci.2016.03.052
Kim, B., Gwak, G., Hong, S. 2017. Review on methodology for determining forward
osmosis (FO) membrane characteristics: Water permeability (A), solute permeability
(B), and structural parameter (S). Desalination, 422: 5-16
Kook, S., Swetha, C. D., Lee, J., Lee, C., Fane, T., Kim, I. S. 2018. Forward Osmosis
Membranes under Null-Pressure Condition: Do Hydraulic and Osmotic Pressures
184
Have Identical Nature?. Environmental Science and Technology, 52 (6): 3556-
3566Amin
Kullab, A., Martin, A. 2011. Membrane distillation and applications for water
purification in thermal cogeneration plants. Separation and Purification Technology,
76(3):231-237
Kurokawa, H., Sawa, T.1996. Heat recovery characteristics of membrane distillation.
Heat transfer-Japanese Research, 25:135–150
Kwan, S.E., Bar-Zeev, E., Elimelech, M. 2015. Biofouling in forward osmosis and
reverse osmosis: measurements and mechanisms. Journal of Membrane Science,
493:703–708.
Law, J. Y. & Mohammad, A. W. 2017. Assessing the forward osmosis performances
using CTA membrane: effect of solution volume ratio and type of draw solute. Jurnal
Teknologi. 79(5):47-52
Lay, W.C.L., Zhang, J.S., Tang, C.Y. Wang, R. Liu, Y., Fane, A.G. 2012. Analysis of
salt accumulation in a forward osmosis system. Separation Science and Technology,
47: 1837-1848
Lay, W.C.L., Zhang, Q., Zhang, J., McDougald, D., Tang, C., Wang, R., Liu, Y., Fane,
A.G. 2011.Study of integration of forward osmosis and biological process: membrane
performance under elevated salt environment, Desalination, 283:123–130.
Lay, W.C.L., Zhang, Q., Zhang, J., McDougald, D., Tang, C., Wang, R., Liu, Y., Fane
A.G.2012. Effect of pharmaceuticals on the performance of a novel osmotic membrane
bioreactor (OMBR), Separation Science and Technology, 47:543–554.
185
Le-Clech ,P., Chen, V., Fane, T.A.G.2006. Fouling in membrane bioreactors used in
wastewater treatment. Journal of Membrane Science, 284:17–53. doi:
10.1016/j.memsci.2006.08.019
Lechunga, M., Fernandez-serrano, M., Jurado, E., Nunez-Olea, J. & Rios, F. 2016.
Acute toxicity of anionic and non-ionic surfactants to aquatic organisms. Ecotoxicology
and Environmental Safety, 125:1-8
Lee, J.-Y. ,Qi, S. , Liu, X. , Li, Y. , Huo, F. ,Tang , C.Y.2014. Synthesis and
characterization of silica gel–polyacrylonitrile mixed matrix forward osmosis
membranes based on layer-by-layer assembly. Separartion and Purification
Technology, 124: 207-216
Lee, S. 2004. Microbial Safety of Pickled Fruits and Vegetables and Hurdle
Technology. Internetional Journal of Food Safety, 4: 21–32
Lee K.L., Baker R.W., Lonsdale H.K.1981. Membranes for power generation by
pressure-retarded osmosis, Journal of Membrane Science, 8(2): 141-171
Li, D., Yan, Y. S., Wang, H. T. Recent advances in polymer and polymer composite
membranes for reverse and forward osmosis processes Progress in Polymer Science.
2016, 61, 104– 155
Li, D., Zhang, X., Yao, J., Simon, G.P., Wang, H. 2011. Stimuli-responsive polymer
hydrogels as a new class of draw agent for forward osmosis desalination. Chemical
Communications, 47:1710–1712
Li, F., Sun, M. L., Cheng, Q. X., Tian, Q., Ma, C. Y., Huang, M. H. Characterization
and antifouling performance of cellulose triacetate forward osmosis membranes
modified with graphene oxide Desalination. Water Treat. 2017, 62, 32– 42
186
Li, J., Liu, Q., Liu, Y., Xie, J. 2017. Development of electro-active forward osmosis
membranes to remove phenolic compounds and reject salts. Environmental science:
Water Research and Technology, 3:139-146
Li, L. Liu, X., Li, H. 2017. A review of forward osmosis membrane fouling: types,
research methods and future prospects. Environmental Technology Reviews, 6:1
Li, Z.Y., Yangali-Quintanilla, V., Valladares-Linares, R., Amy,G.2012 . Flux patterns
and membrane fouling propensity during desalination of seawater by forward osmosis.
Water Research, 46:195–204.
Ling, M. M., and Chung, T.-S. 2011. Desalination process using super hydrophilic
nanoparticles via forward osmosis integrated with ultrafiltration regeneration.
Desalination, 278:194-202.
Ling, M.M., Chung, T.S., Lu, X. 2011. Facile synthesis of thermosensitive
magnetic nanoparticles as ‘‘smart’’ draw solutes in forward osmosis. Chemical
Communication, 47:10788–10790
Liu, B., Yu, J., Li, D., Lv, D., Zhang, J. 2015. Research advance on draw solution in
forward osmosis process. International Conference on Advances in Energy and
Environmental Science, 898-902
Liu, H. & Wang, J. 2013. Treatment of radioactive wastewater using Direct contact
membrane distillation. Journal of Hazardous waste, 261:307-315
Liu, X.,Ng, H.Y. 2014.Double-blade casting technique for optimizing substrate
membrane in thin-film composite forward osmosis membrane fabrication. Journal of
Membrane Science, 469 :112-126
187
Liu, X. , Qi, S. , Li, Y. , Yang, L., Cao, B., Tang, C.Y. 2013.Synthesis and
characterization of novel antibacterial silver nanocomposite nanofiltration and forward
osmosis membranes based on layer-by-layer assembly. Water Research, 47: 3081-
3092
Liu, Y. & Mi, B.2012. Combined fouling of forward osmosis membranes: synergistic
foulant interaction and direct observation of fouling layer formation. Journal of
Membrane Science, 407-408: 136-144
Liu, Y., Mi, B. 2012. Combined fouling of forward osmosis membranes: synergistic
foulant interaction and direct observation of fouling layer formation. Journal of
Membrane Sciences, 407: 136-144
Loeb, S., Titelman, L.,Korngold, E.,Freiman.J. 1997. Effect of porous support fabric on
osmosis through a Loeb–Sourirajan type asymmetric membrane. Journal of
Membrane Science, 129 :243-249
Loeb, S. 2002. Large-scalepower production by pressure-retarded osmosis using river
water and seawater passing through spiral modules. Desalination,143:115–122.
Loeb. S. 1975. Osmotic powerplants. Science, 189:654–655.
Loeb. S. 1975. Osmotic powerplants. Science,189:654–655.
Lokare, O. R., Tavakkoli, S., Wadekar,S., Khanna, V., Vidic., R. D. 2017. Fouling in
direct contact membrane distillation of produced water from unconventional gas
extraction. Journal of Membrane Science, 524:493-501
Long, Q., Qi, G., Wang, Y. 2016. Evaluation of Renewable Gluconate Salts as Draw
Solutes in Forward Osmosis Process. Sustainable Chemistry and Engineering, 4:85-
93
188
Long, Q., Shen, L., Chen, R., Huang, J., Xiong, S., Wang, Y. 2016. Synthesis and
Application of Organic Phosphonate Salts as Draw Solutes in Forward Osmosis for
Oil–Water Separation. Environmental Science and Technology, 50 (21): 12022-12029
Long, Q., Wang, Y. 2015. Novel carboxyethyl amine sodium salts as draw solutes with
superior forward osmosis performance. AIChe Journal, 62 (4): 1226-1235
Long, Q., Wang, Y. 2015. Novel carboxyethyl amine sodium salts as draw solutes with
superior forward osmosis performance. AIChe Journal, 62 (4): 1226-1235
Lorhemen, O. T., Hamza, R. A. & Tay, J. H. 2018. Membrane Bioreactor (MBR)
Technology for Wastewater Treatment and Reclamation: Membrane Fouling.
Membranes (Basel). 6(2):33, doi: 10.3390/membranes6020033
Luo, L., Wang, P. , Zhang, S., Han, G. , Chung, T.-S. 2014. Novel thin-film composite
tri-bore hollow fiber membrane fabrication for forward osmosis. Journal of Membrane
Science, 461: 28-38
Lutchmiah, K., Verliefdea, A. R. D., Roest, K., Rietveld, L. C. & Cornelissen, E. R.
2014. Forward osmosis for application in wastewater treatment: a review. Water
Research, 58: 179–197
Ma, N., Wei, J., Qi, S., Zhao, Y., Gao, Y., Tang, C.Y. 2013.Nanocomposite substrates
for controlling internal concentration polarization in forward osmosis membranes.
Journal of Membrane Science, 441:54-62
Mallevialle, J., Odendall, P.E., and Wiesner, M.R. 1996. Water treatment membrane
processes. McGraw-Hill, New York
189
Martinetti, C. R., Childress, A. E., and Cath, T. Y. 2009. High recovery of concentrated
RO brines using forward osmosis and membrane distillation. Journal of Membrane
Science, 331:31-39.
MartinezDiez, L. &Vaquez-Gonalez. 1999. Temperature and concentration
polarization in membrane distillation of aqueous salt solutions. Journal of Membrane
Science, 156:265-273
McCutcheon, J.R., Elimelech, M. 2007. Modelling water flux in forward osmosis:
Implications for improved membrane design. American Institute of Chemical
Engineers Journal, 53(7):1736-1744
McCutcheon, J.R., McGinnis, R.L., Elimelech, M. 2005.A novel ammonia-carbon
dioxide forward (direct) osmosis desalination process. Desalination, 174:1-11.
McCutcheon, J. R., McGinnis, R. L. and Elimelech, M., 2006. Desalination by
ammonia-carbon dioxide forward osmosis: Influence of draw and feed solution
concentrations on process performance. Journal of Membrane Science, 278: 114-123.
McGinnis, R.L. 2002. Osmotic Desalination Process, US Patent, 6391205 B1.
Meng, F., Zhang, S., Oh, Y., Zhou, Z., Shin, H., Chae, S. 2017. Fouling in membrane
bioreactors: An updated review. Water Research, 114:151-180
Mi, B., Elimelech, M. 2010. Organic fouling of forward osmosis membranes: fouling
reversibility and cleaning without chemical reagents. Journal of Membrane Science,
348(1):337-345
Mishra, T., Srivastava, R. K. 2015. Selection of inorganic-based fertilizers in forward
osmosis for water desalination. International Journal of Environment, 4(2):319-329
190
Morrow, C. P., McGaughey, A. L., Hiibel, S. R., Childress, A. E. 2018. Submerged or
sidestream? The influence of module configuration on fouling and salinity in osmotic
membrane bioreactors. Journal of Membrane Sciences, 548: 583-593
Motsa, M.M., Mamba, B.B., D’Haese, A., Hoek, E. M. V.,Verliefde, A. R. D.2014 .
Organic fouling in forward osmosis membranes: the role of feed solution chemistry
and membrane structural properties. Journal of Membrane Science, 460:99–109.
Na, Y., Yang, S., Lee, S.2014. Evaluation of citrate-coated magnetic nanoparticles as
draw solute for forward osmosis. Desalination, 347: 34–42
Naidu, G., Jeong, S., Choi, Y. & vigneswaran, S. 2017. Membrane distillation for
wastewater reverse osmosis concentrates treatment with water reuse potential.
Journal of Membrane Science, 524:556-525
Nawaz,M.S., Gadelha, G., Khan, S. J. and Hankins, N. 2013. Microbial toxicity effects
of reverse transported draw solute in the forward osmosis membrane bioreactor (FO-
MBR). Journal of Membrane Sciences, 429:323-329.
Nawaz, M.S., Parveen, F., Gadelha, G., Khan, S. J., Wang, R. & Hankins, N.P. (2016).
Reverse solute transport, microbial toxicity, membrane cleaning and flux of
regenerated draw in the FO-MBR using a micellar draw solution. Desalination, Volume
391, Pages 105-111
Neff, R.A. 1964. Solvent Extractor, US Patent, 3130156.
Nguyen, H.T., Chen, S.S., Nguyen, N.C., Ngo, H.H. , Guo, W.S. , Li, C.W.2015.
Exploring an innovative surfactant and phosphate-based draw solution for forward
osmosis desalination. Journal of Membrane science, 489:212–219
191
Nguyen, H.T., Chen, S.S., Nguyen, N.C., Ngo, H.H., Guo, W.S. , Li, C.W.2015.
Exploring an innovative surfactant and phosphate-based draw solution for forward
osmosis desalination. Journal of Membrane science, 489:212–219
Nguyen, N. C., Chen, S., Nguyen, H. T., Chen, Y., Ngo, H. H., Guo, W., Ray, S. S.,
Chang, H. & Le, Q. H. (2017). Applicability of an integrated moving sponge biocarrier-
osmotic membrane bioreactor MD system for saline wastewater treatment using highly
salt-tolerant microorganisms. Separation and Purification Technology, In press,
Corrected proof.
Nguyen,Q., Lee, S. 2015. Fouling analysis and control in a DCMD process for SWRO
brine. Desalination, 367, 21-27
Noh, M., Mok, Y., Lee, S., Kim, H.,Lee, S. H., Jin, G. W., Seo, J. H.,. Koo, H., Parka,
T. H., Lee, Y. 2012.Novel lower critical solution temperature phase transition materials
effectively control osmosis by mild temperature changes. Chemical Communications,
48 :3845-3847
Ong, R.C., Chung, T-S., de Wit, J.S., Helmer, B.J. 2015. Novel cellulose ester
substrates for high performance flat-sheet thin-film composite (TFC) forward osmosis
(FO) membranes. Journal of Membrane Science, 473: 63–71.
Ong, R.C. ,Chung, T.-S. Helmer, B.J. , de Wit, J.S. 2012.Novel cellulose esters for
forward osmosis membranes. Industrial and Engineering Chemistry Research, 51:
16135-16145
Ooi, L. S., Li, Y., Kam, S. L. , Wang, H., Wong, E. Y., Ooi, V. E. 2006. Antimicrobial
activities of cinnamon oil and cinnamaldehyde from the Chinese medicinal herb
Cinnamomum cassia Blume. The American Journal of Chinese Medicine, 34(3):511-
522
192
Ou, R., Wang, Y., Wang, H. & Xu, T., 2013. Thermo-sensitive polyelectrolytes as draw
solutions in forward osmosis process. Desalination. 318:48-55
Ou, R., Wang, Y., Wang, H., Xu, T. 2013. Thermo-sensitive polyelectrolytes as draw
solutions in forward osmosis process. Desalination, 318: 48-55
Palvic, Z., Vidakovic-Cifrek, Z. & Puntaric, D. 2005. Toxicity of surfactants to green
microalgae Pseudokirchneriella subcapitata and Scenedesmus subspicatus and to
marine diatoms Phaeodactylum tricornutum and Skeletonema costatum.
Chemosphere, 61(8):1061-1068
Petrotos, K.B., Quantick, P., Petropakis, H. 1998. A study of the direct osmotic
concentration of tomato juice in tubular membrane—module configuration. I. The
effect of certain basic process parameters on the process performance, Journal of
Membrane Science, 150: 99–110.
Phillip, W.A., Yong, J.S., Elimelech, M.2010. Reverse draw solute permeation in
forward osmosis: Modelling and experiments. Environmental Science Technology, 44:
5170–5176.
Phuntsho, S,Shon, H. K., Hong, S.K.,Lee, S.Y., Vigneswaran, S. 2011.A novel low
energy fertilizer driven forward osmosis desalination for direct fertigation: evaluating
the performance of fertilizer draw solutions. Journal of Membrane Science, 375:172-
181
Puguan, J.M.C. , Kim, H.-S., Lee, K.-J. , Kim, H. 2014.Low internal concentration
polarization in forward osmosis membranes with hydrophilic crosslinked PVA
nanofibers as porous support layer. Desalination, 336 :24-31
193
Qin, D., Liu, S., Sun, D. D., Song, X., Bai, H. 2015. A new nanocomposite forward
osmosis membrane custom-designed for treating shale gas wastewater. Scientific
Reports, 5, 14530
Qin,J.J., Kekre, K.A., Oo, M.H., Tao, G.H., Lay, C.L., Lew, C.H., Cornelissen, E.R.,
Ruiken, C.J. (2010). Preliminary study of osmotic membrane bioreactor: effects of
draw solution on water flux and air scouring on fouling. Water Science and
Technology, 62: 1353-1360
Qiu, C., Setiawan, L., Wang, R. , Tang, C.Y. , Fane, A.G.2012. High performance flat
sheet forward osmosis membrane with an NF-like selective layer on a woven fabric
embedded substrate. Desalination, 287:266–270
Qiu, G. L., Ting, Y.P. 2014. Direct phosphorus recovery from municipal wastewater
via osmotic membrane bioreactor (OMBR) for wastewater treatment. Bioresource
Technology, 170: 221-229
Qiu, G.L. Ting, Y.P. 2013. Osmotic membrane bioreactor for wastewater treatment
and the effect of salt accumulation on system performance and microbial community
dynamics. Bioresource Technology, 150: 287-297
Qtaishat, M., Mastuura, T., Kruczek, B., Khayet, M. 2008. Heat and mass transfer
analysis in direct contact membrane distillation. Desalination, 219: 272-292
Qtaishat, M. R. & Banat, F. 2013. Desalination by solar powered membrane distillation
systems. Desalination, 308: 186-197
Qu, D., Sun, D., Wang, H., Yun, Y.2013. Experimental study of ammonia removal from
water by modified direct contact membrane distillation. Desalination, 326: 135-140.
194
Rashid, K. T. & Rahman, S. B. A. 2016. Ehancement of the Flux of PVDF-Co-HFP
Hollow Fiber membranes for Direct Contact Membrane Distillation Applications. ARPN
Journal of Engineering and Applied Sciences. 11:2189-2192
Rebello, S., Asok, A.K., Mundayoor, S., Jisha, M. S. 2014. Surfactants: toxicity,
remediation and green surfactants. Environmental Chemistry Letters, 12: 275-287
Ren, J., McCutcheon, J, R. 2014. A new commercial thin film composite membrane
for forward osmosis. Desalination, 343:187-193
Reyes, M., Borras, L., Seco, A., Ferrer, J. 2015. Identification and quantification of
microbial populations in activated sludge and anaerobic digestion processes.
Environmental Technology. 36(1): 45- 53.
Roach, J. D., Al-Abdulmalek, A., Al-Naama, A. and Haji, M. 2014. Use of micellar
draws solutions as draw agents in forward osmosis. Journal of Surfactant and
Detergents, 17:1241-1248
Saren, Q., Qiu, C.Q., Tang, C.Y.2011. Synthesis and characterization of novel forward
osmosis membranes based on layer-by-layer assembly, Environmental Science and
Technology, 45:5201-5208
Schofield, R.W.,Fane, A. G., Fell, C. J.D., Macoun, R. 1990. Factors affecting flux in
membrane distillation. Desalination, 77: 279–294
Schofield, R.W., Fane, A.G., Fell, C.J.D.1987. Heat and mass transfer in membrane
distillation. Journal of Membrane Science, 33 (3):299–313
Setiawan, L. , Wang, R. , Shi, L. , Li, K. ,Fane, A.G. 2010.Novel dual-layer hollow fiber
membranes applied for forward osmosis process. Journal of Membrane Science, 421–
422 :238-246
195
Setiawan, L. , Wang, R. ,Tan, S. , Shi, L. ,Fane, A.G. 2013.Fabrication of poly(amide-
imide)-polyethersulfone dual layer hollow fiber membranes applied in forward osmosis
by combined polyelectrolyte cross-linking and depositions. Desalination, 312: 99-106
Shen, M., Keten, S. & Lueptow, R.M. 2016. Dynamics of water and solute transport in
polymeric reverse osmosis membranes via molecular dynamics simulations. Journal
of Membrane Science, 506 :95-108.
Shi, L. ,Chou, S.R. ,Wang, R. ,Fang, W.X. , Tang, C.Y. ,Fane, A.G. 2011.Effect of
substrate structure on the performance of thin-film composite forward osmosis hollow
fiber membranes. Journal of Membrane Science, 382:116-123
Shirazi, M.M.A., Kargari, A., Shirazi, M.J.A.2012. Direct contact membrane distillation
for seawater desalination. Desalination and Water Treatment, 49: 368-375.
Shirazi, M.M.A., Kargari, A., Shirazi, M.J.A.2012. Direct contact membrane distillation
for seawater desalination. Desalination and Water Treatment, 49: 368-375.
Shirazi, S., Lin, C.-J., Chen, D.2010. Inorganic fouling of pressure-driven membrane
processes -A critical review. Desalination, 250 (1): 236–248
Soroush, A. 2015. Development of Antimicrobial Thin Film Composite Forward
Osmosis Membranes by Using Silver Nanoparticles and Graphene Oxide
Nanosheets, Concordia University, Montreal, Canada.
Srisurichan, S., Jiraratananon, R., Fane, A.G.2006. Mass transfer mechanisms and
transport resistances in direct contact membrane distillation process. Journal of
Membrane Science, 277 (1–2): 186–194
Srisurichan,S. Jiraratananon, R. Fane, A.G.2005. Humic acid fouling in the membrane
distillation. Desalination, 174 :63–72
196
Stillman, D., Krupp,L., La, Y.-H.2014. Mesh-reinforced thin film composite
membranes for forward osmosis applications: the structure–performance relationship
Stone, M. L., Rae, C., Stewart, F. F., and Wilson, A. D. 2013a. Switchable polarity
solvents as draw solutes for forward osmosis. Desalination, 312, 124-129.
Stone, M. L., Wilson, A. D., Harrup, M. K., Stewart, F. 2013. An initial study of
hexavalent phosphazene salts as draw solutes in forward osmosis. Desalination, 312:
130-136
Su, J., Ong, R.C., Wang, P., Chung, T.S., Helmer, B.J., De Wit, J.S. 2013. Advanced
FO membranes from newly synthesized CAP polymer for wastewater reclamation
through an integrated FO–MD hybrid system. American Institute of Chemical
Engineers, 59: 1245-1254
Su, J. C., Chung, T. S., Helmer, B. J.,de Wit, J. S.2012. Enhanced double-skinned FO
membranes with inner dense layer for wastewater treatment and macromolecule
recycle using sucrose as draw solute. Journal of Membrane Science, 396:92-100
Sukitpaneenit, P., Chung, T.-S. 2012.High performance thin-film composite forward
osmosis hollow fiber membranes with macrovoid-free and highly porous structure for
sustainable water production. Environmental Science and Technology, 46:7358-7365
Tan, C. H., and Ng, H. Y. 2010. A novel hybrid forward osmosis –nanofiltration (FO-
NF) process for seawater desalination: Draw solution selection and system
configuration.Desalination and Water Treatment, 13, 356–361.
Tchobanoglous, G., Burton, F. L., Stensel, H. D. 2014. Wastewater engineering:
treatment and resource recovery, 5th edn. Metcalf and Eddy Inc., McGraw-Hill, New
York
197
Tijing, L.D., Yun, C.W., Choi, J.S., Lee, S., Kim, S., Shon, H. K.2015. Fouling and its
control in membrane distillation—a review. Journal of Membrane Science, 475:215–
244.
Tiraferri, A. , Yip, N.Y. ,Phillip, W.A., Schiffman, J.D. , Elimelech. M. 2011.Relating
performance of thin-film composite forward osmosis membranes to support layer
formation and structure. Journal of Membrane Science, 367:340-352
Trung, N. Q., Nhan, L. V., Thao, P. T. P., Giang, T. 2017. Novel draw solutes of iron
complexes easier recovery in FO process. Journal of water reuse and Desalination, In
press
UN-Water, FAO, 2007. Coping with water scarcity. Challenge of the twenty-first
century. UN-Water, FAO/Publication
Uragami, T. 2017. Science and Technology of Separation Membranes, 2 Volume Set.
Japan: Wiley.
Us’yarov. O. G. 2004. Critical micellization concentration of ionic surfactants:
Comparison of theoretical and experimental results. Colloid Journal, 66:612–616
Valente, A. J. M., Burrows, H.D., Polishchuk, A. Y., Domingues, C. P., Borges, O.M.
F., Eusebio, M.E.S., Maria, T.M.R., Lobo, V.M.M. & Monkman, A.P. 2005. Permeation
of sodium dodecyl sulfate through polyaniline-modified cellulose acetate membranes.
Polymer, 46 (16): 5918-5928.
Vilakati, G.D., Wong, M.C.Y., Hoek, E.M.V., Mamba, B.B. 2014.Relating thin film
composite membrane performance to support membrane morphology fabricated using
lignin additive. Journal of Membrane Science, 469 :216-224
Wachinski, A.M. 2013. Membrane processes for water reuse. McGraw-Hill, New York
198
Wak, G., Jung, B., Han, S. & Hong, S. 2015. Evaluation of poly (aspartic acid sodium
salt) as a draw solute for forward osmosis. Water Research, 80:294-305
Wallberg, O. Jonsson, A., Wickstrom, P. 2001. Membrane cleaning — a case study in
a sulphite pulp mill bleach plant. Desalination, 141(3): 259-268
Wallace, M., Cui, Z., Hankins, N.P. 2008. A thermodynamic benchmark for assessing
an emergency drinking water device based on forward osmosis. Desalination, 227:
34-45
Wang, K.Y., Chung, T.-S., Amy, G.2011. Developing thin-film-composite forward
osmosis membranes on the PES/SPSf substrate through interfacial polymerization.
American Institute of Chemical Engineers, 53(3):770-781
Wang, K.Y., Chung, T.-S., Qin, J.-J. 2007. Polybenzimidazole (PBI) nanofiltration
hollow fiber membranes applied in forward osmosis process. Journal of Membrane
Science, 300:6–12
Wang, K.Y., Chung, T.S., Ong. R. C. 2010. Double-Skinned Forward Osmosis
Membranes for Reducing Internal Concentration Polarization within the Porous
Sublayer. Industrial and Engineering Chemistry Research, 49:4824-4831
Wang, K. Y., Teoh, M. M., Nugroho, A., Chung, T. 2011. Integrated forward osmosis–
membrane distillation (FO–MD) hybrid system for the concentration of protein
solutions. Chemical Engineering Science, 66(11): 2421-2430
Wang, P., Cui, Y., Ge, Q., Tew, T. F., Chung, T. 2015. Evaluation of hydroacid complex
in the forward osmosis–membrane distillation (FO–MD) system for desalination.
Journal of Membrane Science. Journal of Membrane Science, 494: 1-7
199
Wang, X., Chang, V.W.C., Tang, C.Y. 2016. Osmotic membrane bioreactor (OMBR)
technology for wastewater treatment and reclamation: Advances, challenges, and
prospects for the future. Journal of Membrane Science, 504:113–132
Wang, X.H., Chen, Y., Yuan, B., Li, X.F., Ren, Y.P. 2014. Impacts of sludge retention
time on sludge characteristics and membrane fouling in a submerged osmotic
membrane bioreactor. Bioresource Technology, 161:340-347
Wang, X.H. Yuan, B. Chen, Y. Li, X.F., Ren, Y.P. 2014. Integration of micro-filtration
into osmotic membrane bioreactors to prevent salinity build-up
Wang, Z., Zheng, J., Tang, J., Wang, X., Wu, Z. 2016. A pilot-scale forward osmosis
membrane system for concentrating low-strength municipal wastewater: performance
and implications. Scientific Reports 6, Article number: 21653
Widjojo, N. ,Chung, T.-S. , Weber, M. ,Maletzko, C. ,Warzelhan, V. 2013. A sulfonated
polyphenylenesulfone (sPPSU) as the supporting substrate in thin film composite
(TFC) membranes with enhanced performance for forward osmosis (FO). Chem.
Engineering Journal, 220 :15-23
Wu, C.-Y.,Chen, S.-S., Zhang, D.-Z.,Kobayashi, J. 2017.Hg removal and the effects
of coexisting metals in forward osmosis and membrane distillation. Water Science and
Technology, DOI: 10.2166/wst.2017.143
WWAP (United Nations World Water Assessment Programme). 2012.Report on the
development of water resources in the world 2012. Worldwide evaluation of water
(WWAP) program, UNESCO
200
Xie, M., Nghiem, L.D., Price, W. E. and Elimelech, M. 2013. A forward osmosis-
Membrane distillation hybrid process for direct sewer mining: system performance and
limitation. Environmental Science and Technology, 47:13486-13493
Xie, M., Nghiem, L.D., Price, W. E. and Elimelech, M. 2013. A forward osmosis-
Membrane distillation hybrid process for direct sewer mining: system performance and
limitation. Environmental Science and Technology, 47:13486-13493
Xie, M., Nghiem, L.N., Price, W.E., Elimelech, M. 2014.Toward resource recovery from
wastewater: extraction of phosphorus from digested sludge using a hybrid forward
osmosis–membrane distillation process. Environmental Science and Technology
Letters, 1:191-195
Xie, M., Price, W. E., Nghiem, L. D. & Elimelech, M. 2013. Effects of feed and draw
solution temperature and transmembrane temperature difference on the rejection of
trace organic contaminants by forward osmosis. Journal of Membrane Science, 438
57-64.
Xu, Y., Peng, X., Tamg, C. Y., Fu, Q. S. and Nie, S. 2010. Effect of draw solution
concentration and operating conditions on forward osmosis and pressure retarded
osmosis performance in a spiral wound module. Journal of Membrane Science, 348(1-
2): 298-309
Yaeli, J. 1992. Method and apparatus for processing liquid solutions of suspensions
particularly useful in the desalination of saline water, US patent, 5098575
Yang, H.-M., Seo, B.-K., Lee, K.-W., Moon, J.-K.2014. Hyperbranched polyglycerol-
coated magnetic nanoparticles as draw solute in forward osmosis. Asian Journal of
Chemistry, 26: 4031–4034
201
Yang, Q., Wang, K.Y., Chung, T. S. 2009. Dual-Layer Hollow Fibers with Enhanced
Flux As Novel Forward Osmosis Membranes for Water Production. Environmental
Science and Technology, 43:2800-2805
Yasukawa, M., Tanka, Y., Takahashi, T., Shibuya, M., Mishima, S., Matsuyama, H.
(2015). Effect of Molecular Weight of Draw Solute on Water Permeation in Forward
Osmosis Process. Industrial and Engineering chemistry research. 54, 8239−8246
Yen, S. K., Mehnas Haja, N. F., Su, M., Wang, K. Y. & Chung, T.-S.2010.Study of
draw solutes using 2-methylimidazole-basedcompounds in forward osmosis. Journal
of Membrane Science, 364, 242–252.
Yip, N. Y. & Elimelech, M. 2011. Performance Limiting Effects in Power Generation
from Salinity Gradients by Pressure Retarded Osmosis. Enviroenmental Science and
Technology, 45(23):10273-10282
Yong, J. S., Phillip, W. A., Elimelech, M. 2012. Coupled reverse draw solute
permeation and water flux in forward osmosis with neutral draw solutes. Journal of
Membrane Science, 392-393: 9-17
You, S., Tang,C., Yu, C., Wang, X., Zhang,J., Han,J. Gan, Y., Ren, N. 2013. Forward
Osmosis with a Novel Thin-Film Inorganic Membrane. Environmental Science and
Technology, 47 (15), 8733-8742.
Yu, C., Wang, Y., Lang, X., Fan, S. 2016. A Method for Seawater Desalination via
Squeezing Ionic Hydrogels. Environmental Science and Technology, 50(23): 13024-
13031
202
Yu, X., Yang, H., Lei, H., Shapiro, A.2013. Experimental evaluation on concentrating
cooling tower blowdown water by direct contact membrane distillation. Desalination,
323:134-141.
Yun, Y., Wang, J., Ma, R. & Fane, A.G. 2011. Effects of channel spacers on direct
contact membrane distillation. Desalination and Water Treatment, 34:63-69
Zauner, P. and Zha, F. 2011. Method of cleaning membranes. US 20110056522 A1.
Zeng, Y., Qiu, L., Wang, K., Yao, J., Li, D., Simon, G. P., Wang, R., Wang, H. 2013.
Singificantly enhances water flux in forward osmosis desalination with polymer
graphene composite hydrogels as draws agents. Royal Society of Chemistry, 3, 887-
894
Zhang, J.S., Loong, W.L.C., Chou, S.R., Tang, C.Y., Wang, R., Fane, A.G. (2012).
Membrane biofouling and scaling in forward osmosis membrane bioreactor
Zhang, X. Tian,J. Ren,Z.,Shi,W., Zhang,Z., Xu,Y., Gao,S., Cui, F. 2016. High
performance thin-film composite (TFC) forward osmosis (FO) membrane fabricated
on novel hydrophilic disulfonated poly(arylene ether sulfone) multiblock
copolymer/polysulfone substrate. Journal of Membrane Science, 520:529–539
Zhao, D.L., Wang, P., Zhao, Q.P., Chen, N.P., Lu, X.M.2014. Thermoresponsive
copolymer-based draw solution for seawater desalination in a combined process of
forward osmosis and membrane distillation. Desalination, 348:26–32
Zhao, D.L., Wang, P., Zhao, Q.P., Chen, N.P., Lu, X.M.2014. Thermoresponsive
copolymer-based draw solution for seawater desalination in a combined process of
forward osmosis and membrane distillation. Desalination, 348:26–32
203
Zhao, P., Gao, B., Xu, S., Kong, J., Ma, D., Shon, H. K., Yue, Q. & Liu, P. 2015.
Polyelectrolyte-promoted forward osmosis process for dye wastewater treatment –
Exploring the feasibility of using polyacrylamide as draw solute. Chemical Engineering
Journal, 264:32-38
Zhao, S., Zou, L., Mulcahy, D. 2012. Brackish water desalination by a hybrid forward
osmosis–nanofiltration system using divalent draw solute. Desalination, 284: 175-181
Zhao, S. Hunag, K., Lin, H. 2015. Impregnated Membranes for Water Purification
Using Forward Osmosis. Industrial and Engineering Chemistry Research,
54(49):12354-12366
Zhong, P., Fu, X., Chung, T. S. 2013. Development of Thin-Film Composite forward
Osmosis Hollow Fiber Membranes Using Direct Sulfonated Polyphenylenesulfone
(sPPSU) as Membrane Substrates. Environmental Science Technology, 47
(13):7430–7436
Zhou, A., Luo, H., Wang, Q., Chen, L., Zhang, T.C., Tao, T.2015. Magnetic
thermoresponsive ionic nanogels as novel draw agents in forward osmosis. RSC
Advances, 5:15359–15365
Zolotarev, P.P., Ugrozov, V. V., Volkina, I. B., Nikulin, V.M.1994.Treatment of waste
water for removing heavy metals by membrane distillation. Journal of Hazardous
Material, 37 (1):77–82