Winery wastewater purification by reverse osmosis and oxidation of the concentrate by solar...
11
Winery wastewater purification by reverse osmosis and oxidation of the concentrate by solar photo-Fenton L.A. Ioannou a,b , C. Michael a,b , N. Vakondios c , K. Drosou c , N.P. Xekoukoulotakis c , E. Diamadopoulos c , D. Fatta-Kassinos a,b,⇑ a NIREAS-International Water Research Center, P.O. Box 20537, CY-1678 Nicosia, Cyprus b Department of Civil Engineering and Environmental Engineering, University of Cyprus, P.O. Box 20537, CY-1678 Nicosia, Cyprus c Technical University of Crete, Department of Environmental Engineering, GR-73100 Chania, Greece article info Article history: Received 31 May 2013 Received in revised form 29 July 2013 Accepted 30 July 2013 Available online 6 August 2013 Keywords: Concentrate Reverse osmosis Solar photo-Fenton oxidation Winery wastewater abstract Membrane processes have received in recent years considerable attention for the separation and concen- tration of inorganic and organic compounds from various wastewater streams. This work investigated the efficiency of a pilot-scale reverse osmosis (RO) process on the treatment of winery wastewater with an initial chemical oxygen demand (COD) of 5350 mg L 1 . The removal of COD by the RO process reached 97% resulting in a permeate with residual COD level lower than 150 mg L 1 . Furthermore, the total nitro- gen removal reached 67%, total phosphorous 76.2%, total suspended solids 94%, total solids 96%, and con- ductivity 94%. These results demonstrated an excellent solid and soluble salts separation. Toxicity and phytotoxicity assays in the feed, concentrate and permeate samples were also performed, showing that the toxicity of the original effluent could be reduced or even eliminated through the RO process. More- over, the volume recovery achieved in the recirculation mode was 65%, whereas in the single pass was 50%. Further treatment of the concentrate (COD 10290 mg L 1 ) by solar photo-Fenton oxidation achieved a COD reduction of 75%. In an effort to evaluate the capacity of the RO process to concentrate valuable polyphenols, five selected compounds were examined. The process proved to be quite efficient in almost completely concentrating them in the concentrate stream. Ó 2013 Elsevier B.V. All rights reserved. 1. Introduction Winery wastewater is generated by the different activities car- ried out during the wine production, mainly from washing and rinsing operations of fermentation tanks, barrels, and other items [1]. Volumes and pollution loads vary greatly in relation to the working period (vintage, racking, bottling) and to the winemaking technologies used (e.g. in the production of red, white and special wines) [2,3]. The high amount of effluent produced (usually 1–2 L water L 1 wine), and the seasonal nature of this industry raise spe- cific problems for the treatment process in terms of volume and composition of the influent [4]. There are numerous treatment options (biological, physico- chemical and advanced) for winery wastewater, all of which aim to achieve a significant reduction in the concentration of organic matter and the solids present, and some may also reduce inorganic load [5]. Biological treatment is particularly well suited to the treatment of winery wastewater, because the majority of the or- ganic components in the waste stream are readily biodegradable. The difficulties that the biological treatment systems face are the variable nature of wastewater composition and quantity [1,6,7]. This variability means that treatment plants must be able to handle fluctuations in influent composition and volumes, and allow a ser- ies of start-up and shut-down activities, which is a challenge when working with biological systems [5]. Tested biological treatment processes included so far: activated sludge process, sequencing batch reactor (SBR), fixed bed biofilm reactor (FBBR), air-bubble column bioreactor, jet-loop activated sludge reactor, anaerobic digestion, etc. [3,6,8–10]. It has been frequently observed that pollutants contained in winery wastewater like various recalcitrant high molecular weight compounds (e.g. polyphenols, tannins and lignins) are not mineral- ized by the biological treatment [11]. More specifically, according to the existent literature, the resid- ual COD concentration of the winery effluents after various biolog- ical processes, ranges from 110 to 5440 mg L 1 , with an average of 2700 mg L 1 [6,12–23], while the residual BOD ranges from 101 to 1060 mg L 1 [18,8]. These results show that the biological treat- ment does not lead to complete mineralization. Consequently, other technologies for more exhaustive winery wastewater treatment must be applied to reach effluent quality 1383-5866/$ - see front matter Ó 2013 Elsevier B.V. All rights reserved. http://dx.doi.org/10.1016/j.seppur.2013.07.049 ⇑ Corresponding author at: Department of Civil Engineering and Environmental Engineering, University of Cyprus, P.O. Box 20537, CY-1678 Nicosia, Cyprus. E-mail address: [email protected] (D. Fatta-Kassinos). Separation and Purification Technology 118 (2013) 659–669 Contents lists available at ScienceDirect Separation and Purification Technology journal homepage: www.elsevier.com/locate/seppur
Transcript of Winery wastewater purification by reverse osmosis and oxidation of the concentrate by solar...

Separation and Purification Technology 118 (2013) 659–669
Contents lists available at ScienceDirect
Separation and Purification Technology
journal homepage: www.elsevier .com/ locate /seppur
Winery wastewater purification by reverse osmosis and oxidation of theconcentrate by solar photo-Fenton
1383-5866/$ - see front matter � 2013 Elsevier B.V. All rights reserved.http://dx.doi.org/10.1016/j.seppur.2013.07.049
⇑ Corresponding author at: Department of Civil Engineering and EnvironmentalEngineering, University of Cyprus, P.O. Box 20537, CY-1678 Nicosia, Cyprus.
E-mail address: [email protected] (D. Fatta-Kassinos).
L.A. Ioannou a,b, C. Michael a,b, N. Vakondios c, K. Drosou c, N.P. Xekoukoulotakis c, E. Diamadopoulos c,D. Fatta-Kassinos a,b,⇑a NIREAS-International Water Research Center, P.O. Box 20537, CY-1678 Nicosia, Cyprusb Department of Civil Engineering and Environmental Engineering, University of Cyprus, P.O. Box 20537, CY-1678 Nicosia, Cyprusc Technical University of Crete, Department of Environmental Engineering, GR-73100 Chania, Greece
a r t i c l e i n f o
Article history:Received 31 May 2013Received in revised form 29 July 2013Accepted 30 July 2013Available online 6 August 2013
Keywords:ConcentrateReverse osmosisSolar photo-Fenton oxidationWinery wastewater
a b s t r a c t
Membrane processes have received in recent years considerable attention for the separation and concen-tration of inorganic and organic compounds from various wastewater streams. This work investigated theefficiency of a pilot-scale reverse osmosis (RO) process on the treatment of winery wastewater with aninitial chemical oxygen demand (COD) of 5350 mg L�1. The removal of COD by the RO process reached97% resulting in a permeate with residual COD level lower than 150 mg L�1. Furthermore, the total nitro-gen removal reached 67%, total phosphorous 76.2%, total suspended solids 94%, total solids 96%, and con-ductivity 94%. These results demonstrated an excellent solid and soluble salts separation. Toxicity andphytotoxicity assays in the feed, concentrate and permeate samples were also performed, showing thatthe toxicity of the original effluent could be reduced or even eliminated through the RO process. More-over, the volume recovery achieved in the recirculation mode was 65%, whereas in the single pass was50%. Further treatment of the concentrate (COD 10290 mg L�1) by solar photo-Fenton oxidation achieveda COD reduction of 75%. In an effort to evaluate the capacity of the RO process to concentrate valuablepolyphenols, five selected compounds were examined. The process proved to be quite efficient in almostcompletely concentrating them in the concentrate stream.
� 2013 Elsevier B.V. All rights reserved.
1. Introduction
Winery wastewater is generated by the different activities car-ried out during the wine production, mainly from washing andrinsing operations of fermentation tanks, barrels, and other items[1]. Volumes and pollution loads vary greatly in relation to theworking period (vintage, racking, bottling) and to the winemakingtechnologies used (e.g. in the production of red, white and specialwines) [2,3]. The high amount of effluent produced (usually 1–2 Lwater L�1 wine), and the seasonal nature of this industry raise spe-cific problems for the treatment process in terms of volume andcomposition of the influent [4].
There are numerous treatment options (biological, physico-chemical and advanced) for winery wastewater, all of which aimto achieve a significant reduction in the concentration of organicmatter and the solids present, and some may also reduce inorganicload [5]. Biological treatment is particularly well suited to thetreatment of winery wastewater, because the majority of the or-
ganic components in the waste stream are readily biodegradable.The difficulties that the biological treatment systems face are thevariable nature of wastewater composition and quantity [1,6,7].This variability means that treatment plants must be able to handlefluctuations in influent composition and volumes, and allow a ser-ies of start-up and shut-down activities, which is a challenge whenworking with biological systems [5]. Tested biological treatmentprocesses included so far: activated sludge process, sequencingbatch reactor (SBR), fixed bed biofilm reactor (FBBR), air-bubblecolumn bioreactor, jet-loop activated sludge reactor, anaerobicdigestion, etc. [3,6,8–10].
It has been frequently observed that pollutants contained inwinery wastewater like various recalcitrant high molecular weightcompounds (e.g. polyphenols, tannins and lignins) are not mineral-ized by the biological treatment [11].
More specifically, according to the existent literature, the resid-ual COD concentration of the winery effluents after various biolog-ical processes, ranges from 110 to 5440 mg L�1, with an average of2700 mg L�1 [6,12–23], while the residual BOD ranges from 101 to1060 mg L�1 [18,8]. These results show that the biological treat-ment does not lead to complete mineralization.
Consequently, other technologies for more exhaustive winerywastewater treatment must be applied to reach effluent quality

660 L.A. Ioannou et al. / Separation and Purification Technology 118 (2013) 659–669
standards for discharge in the environment. Membrane separationprocesses are becoming quite popular in wastewater treatmentand reclamation, since they combine process stability and excel-lent effluent quality [24,25]. More specifically, reverse osmosis(RO) is currently considered to be the state-of-the-art in industrialwastewater treatment applications [24,26]. The membrane filtra-tion has been demonstrated to be useful in the treatment of a widevariety of effluents including among others various agro-industrialeffluents (i.e. winery [27]; molasses-based distillery [28]; olive mill[29]; dairy wastewater [30], etc.). It should be mentioned thatthere is limited literature dealing with the membrane treatmentof winery wastewater [27], and especially there is no literaturereferring to the application of the RO for the treatment of winerywastewater. However, RO has been found to be a very promisingseparation process for the treatment of other agro-industrialwastewater streams. The development of low-pressure RO pro-cesses has made them an attractive alternative for the treatmentof aqueous wastes since they offer high fluxes and solute separa-tions and can operate over wide temperature and pH ranges [31].RO was found able to achieve a COD removal from 98.2% for thetreatment of olive mill wastewater [29] to 99.9% for the treatmentof molasses-based distillery wastewater [28]. Moreover, ROachieved complete color and BOD removal from olive mill effluents[29], and high efficiencies on the removal of solids (99.8%) andpotassium (99.99%) from molasses-based distillery wastewater[28], as well as high DOC and total nitrogen removal of the orderof 99.8% and 96.3%, respectively, from dairy wastewater [30].
The advantages offered by RO have been well documented inthe literature, such as the excellent effluent quality [24]. However,just like other membrane separation processes, RO suffers fromvarious drawbacks, such as the concentrate generated that con-tains high levels of refractory organic pollutants and inorganicsalts, the membrane fouling, the energy cost, and the membranereplacement [32].
Nevertheless, it is well known that membrane separation pro-cesses do not really destruct the pollutants, but merely concentratethem into smaller volumes of wastewater, i.e. concentrates [32]. Asa result, the concentrates generated in membrane separation pro-cesses contain high levels of refractory organic pollutants and inor-ganic salts [32]. The organic pollutants in the RO concentrate aredifficult to be treated by conventional methods, and their directdischarge into the aquatic environment can cause ecotoxicologicaleffects. Consequently, it is vital to explore appropriate processesfor the effective abatement of organics under an acceptable level[32–35].
Advanced Oxidation Processes (AOPs) are known for their abil-ity to mineralize a wide range of organic compounds [36,37], andhave been successfully applied for the treatment of winery waste-water. The most widely used are: heterogeneous photocatalysis(UV/H2O2/TiO2) [38], heterogeneous and homogeneous photo-Fen-ton oxidation [7,39,40], ozone-based AOPs (O3, O3/UV and O3/UV/H2O2) [3], and the combination of UV-A/Vis radiation and ozone,in the presence of titanium dioxide [41]. The use of the abovemen-tioned AOPs for the treatment of winery wastewater proved to behighly effective, reaching COD removals from 50% [40] to 80%[7,41], and TOC removals even up to 95% [40].
Additionally, various AOPs, including heterogeneous photoca-talysis (UV/TiO2) [34,35], photo- and electro-Fenton oxidation[32,33,42], and ozonation [43] are considered as promising meth-ods for the treatment of the membrane concentrate effluent of avariety of wastewater streams. More specifically, heterogenousphotocatalysis reached a DOC removal up to 80% for the treatmentof the RO concentrate from a secondary treated effluent [35];photo-Fenton oxidation reached 85% COD removal of an RO con-centrate of metal plating [43] and 100% COD removal of the ROconcentrate of a paper mill [42]; ozonation achieved a high
degradation up to 87% for membrane concentrate of natural waterscontaining pesticides [44]; and the organic matter removal effi-ciency of electro-Fenton was high both for the concentrate of land-fill leachate (82% DOC removal) [32], as well as for the ROconcentrate from a steel plant (62% COD removal) [33].
As already mentioned there is no literature dealing with treat-ment of winery wastewater by RO, and according to our knowledgethis is the first integrated study for the treatment of real winerywastewater, using RO and solar photo-Fenton, including an evalu-ation of a number of process parameters for the RO streams (feed,concentrate and permeate), as well as toxicity and phytotoxicityassays.
The main objectives of this study were:
(i) The investigation of the efficiency of a pilot-scale RO processto remove the organic compounds (expressed as COD) fromactual winery wastewater, as well as the optimum experi-mental conditions (pressure and temperature) of the RO pro-cess, during which the maximum volume recovery could beachieved.
(ii) The study of the toxicity of the permeate resulting from theRO process, towards one aquatic organism and three plantspecies, as the treated winery wastewater can be disposedof in surface waters or reused for irrigation.
(iii) The use of solar photo-Fenton oxidation (simulated solarlight) to treat the concentrate from the RO process.
(iv) The investigation of the presence of five polyphenols in thewinery effluent, and their concentration during the RO pro-cess in the concentrate stream, with a view to future recov-ery, due to being high-value natural compounds. It is notedthough that if there is any interest to isolate polyphenolsfrom winery wastewater, then their extraction has to takeplace prior to the advanced oxidation treatment [45], sincethe latter is able to completely destroy them.
2. Material and methods
2.1. Feed (winery wastewater)
Winery wastewater at vintage period (October 2012) was usedfor the experiments. Due to the high suspended solids content andin order to avoid fouling of the membrane, the winery wastewaterwas first centrifuged (Sigma 4–16 K, 14000 rpm, 5 min), and thenfiltered through glass microfilter (Whatman, 1 lm) before fed tothe RO unit. Although these two pretreatment steps are better sui-ted for bench- and pilot-scale applications, in full-scale applica-tions, pretreatment is also necessary in order to preventmembrane fouling and reduced flux. Coagulation/precipitationand/or microfiltration/ultrafiltration though, are more appropriateprocesses for full-scale pretreatment of winery wastewater [46].The characterization of the filtered wastewater (determinedaccording to standard methods) [47] is shown in Table 1.
2.2. Reverse osmosis unit
The RO pilot unit was manufactured by GE-Osmonics (modelE2/375-2535), and is equipped with a AG2521TF spiral-woundedpolyamide membrane (Desal). The technical characteristics of theunit are presented in Table 2.
A plastic feed tank of 30 L capacity was used for storage andsupply of the effluent to the system, as well as for the collectionof the recycled concentrate, when the system was working in recir-culation mode. A pressure pump (Wausau Wisconsin 54401 –Model APB48517D1306AP, 0.37 kW) was used for transportingthe feed liquid through the system. Permeate and concentrate flowrates were measured by two glass rotameters containing metal

Table 1Winery wastewater characteristics after pre-treatment (reverseosmosis feed wastewater).
Parameter Winery wastewatera
pH (20 �C) 6Conductivity (mS cm�1) 3.34Total solids (mg L�1) 5040Suspended solids (mg L�1) 66Total nitrogen (mg L�1) 10COD (mg L�1) 5353BOD5 (mg L�1) 424Total phosphorus (mg L�1) 2.1Total polyphenols (mg L�1) 20
a Average of three measurements.
Table 2Technical characteristics of the reverse osmosis unit.
Process parameters Values
Membrane type Desal, AG2521TFNominal membrane surface area (m2) 1.2Operating temperature range (�C) 12–29Pump power (kW) 0.37pH Range 5.5–8.5
L.A. Ioannou et al. / Separation and Purification Technology 118 (2013) 659–669 661
floats. Two pressure gauges were used to indicate the pressure ofthe inlet and the outlet of the membrane. A flow diagram of theRO unit is shown in Scheme 1.
2.3. Experimental procedure
2.3.1. Reverse osmosisPrior to its use, the RO membrane was washed with distilled
water for 4 h and then conditioned with citric acid according tothe manufacturer’s instructions. In addition, cleaning with distilledwater was also used for cleaning between filtration experiments.More intense cleaning was not necessary due to the short durationof the experimental runs, while no reduction in clean water fluxwas observed. On the contrary, in the case of full-scale RO runsmore intense membrane cleaning/conditioning may be necessary.
In the single pass mode, three different working pressures 5, 7.5and 10 bar were tested at 26 �C, which was the natural winery
Feed
Pump
Flow control valve
Pump
Pressure gauge
Recycling
Scheme 1. Flow diagra
wastewater temperature. At the optimum working pressure deter-mined, a lower temperature of 20 �C was also tested. After eachexperiment, the recovery was measured, and the pH, conductivity,COD, BOD5, TN, TP, TSS, TS and the ecotoxicity in the permeatewere determined.
Following, an experiment in recirculation mode was carried outat the optimum experimental conditions determined at the singlepass mode, in order to investigate the increase of the volumerecovery and the COD removal that could be achieved. For therecirculation mode, the permeate flow was taken out of the loop,while the concentrate was returned to the feed tank. During therecirculation mode the flow rate, the pressure and the COD of boththe concentrate and permeate, at specific times, were monitored.
2.3.2. Solar photo-FentonPhotocatalytic experiments were conducted in a batch reactor
made of borosilicate glass and equipped with double wall for tem-perature control. The experimental set-up and procedure is de-scribed in detail elsewhere [48]. A Newport 91193 (Lamp Xe-OP1 kW) was used for the solar photo-Fenton experiments. In a typ-ical run, 300 mL of the RO concentrate were loaded in the reactionvessel, along with an appropriate amount of catalyst FeSO4�7H2O(Riedel-de Haen) to give a final concentration of Fe(II) 20 mg L�1.The pH of the reaction mixture was adjusted to 3 with H2SO4
(95–97%, Merck), before the catalyst addition. To obtain the opti-mal concentration of the oxidant, a predetermined volume ofH2O2 (35% w/w, Merck) (750–2000 mg L�1) was added all at oncein the reaction mixture and the lamp was immediately turnedon. For the optimum experimental conditions, solar photo-Fentonand dark Fenton experiments were also conducted, where theH2O2 (35% w/w, Merck) was added in doses in the reaction mixture(i.e. when the initial hydrogen peroxide dose was consumed at avalue lower than 25 mg L�1, a new dose of the reagent was added).The reaction mixture was magnetically stirred, while samples werewithdrawn at frequent time intervals, filtered through 0.22 lmMillipore and 0.45 lm, RC, Pall prior to COD analysis.
Hydrogen peroxide was analyzed spectrophotometrically usingammonium metavanadate, which allows H2O2 concentration to bedetermined immediately based on a red–orange peroxovanadiumcation formed during the reaction of H2O2 with metavanadate,with maximum at 450 nm [49]. The presence of H2O2 in the treated
RO membrane
Flow control valve
Pressure gauge
Concentrate
Concentrate wastewater
Production line
Permeate
Permeate collection tank
m of the RO unit.

662 L.A. Ioannou et al. / Separation and Purification Technology 118 (2013) 659–669
samples was also monitored using hydrogen peroxide test strips(Quantofix peroxide, 1–100 mg L�1, Sigma Aldrich).
2.4. Analytical methods
All the samples taken were analyzed immediately. Otherwisethey were kept refrigerated (�18 �C) until the analysis. COD mea-surements were performed using Merck�Spectroquant kits, andBOD was determined using the 444406 OxiDirect meter. Total sus-pended solids (TSS) were measured with A/E 47-mm glass fiber fil-ters (Pall Europe), and total solids (TS) were measured according toStandard Method 2540D [47]. Total nitrogen (TN) was measuredusing Merck TN kit, based on the Standard Method 4500 N [47]. To-tal phosphorous (TP) was measured using Merck TP kit, based onStandard Method 4500-PE [47]. The concentration of total poly-phenols was assessed by the Folin–Ciocalteu method [50] using aUV/Vis Jasco V-530 spectrophotometer. Temperature was continu-ously monitored, and the pH of the samples was recorded with apH meter MicropH2002 (Crison). The conductivity measurementswere carried out using a MicroCM222 (Crison).
2.5. Toxicity assays
Toxicity measurements were carried out, using the DaphtoxkitFTM magna toxicity test, according to the standard testing protocol[51]. The test is based on the observation of the freshwater speciesD. magna immobilization after 24 and 48 h of exposure in thesamples.
The Phytotestkit microbiotest measures the decrease (or the ab-sence) of germination and early growth of plants, which are ex-posed directly to the samples spiked onto a thick filter paper.The filter is provided by the kit manufacturer (MicroBioTestsInc.). A control test was performed using tap water. The plants usedfor the Phytotestkit microbiotest were: the monocotyl Sorgho (Sor-ghum saccharatum), the dicotyl garden cress (Lepidium sativum),and the dicotyl mustard (Sinapis alba). These species are frequentlyused in phytotoxicity analyses due to their rapid germination andgrowth of roots and shoots, and their sensitivity to low concentra-tions of phytotoxic substances (MicroBioTests Inc.). The inhibitionpercentage of the chemical compounds on seed germination (GI),shoot growth (SI), and root growth (RI) was calculated by applyingthe following formula:
%GI;RI;SI ¼ A� BA� 100 ð1Þ
where A is the average number of germinated seeds or the averageroot length or the average shoot length in the control water, and Bthe same parameters for the test wastewaters.
2.6. HPLC method for the determination of polyphenols
A modified HPLC method was used based on the method devel-oped by Rodriguez-Delgado et al. [52], using a Luna C-18 (2) col-umn (5 lm, 250 mm � 4.6 mm) and a security guard column(4 mm � 3 mm), both purchased from Phenomenex; and a gradi-ent eluting solvent consisting of solvent A (methanol-acetic acid–water (10:2:88, v/v)) and solvent B (methanol-acetic acid–water(90:2:8, v/v)).
Prior to HPLC analysis the permeate samples were pre-concen-trated by solid-phase extraction (SPE) using a Sep-Pak� Vac 3 mLC18 cartridge (Waters, Milford, MA, USA) previously activated withmethanol (HPLC grade, >99.9%, Sigma Aldrich) (3 mL). For the con-ditioning of the cartridges, 6 mL of acidified water with acetic acidat pH 2.5, were used. Afterwards, 10 mL of sample was percolatedthrough the cartridge and then washed using 3 mL of acidifiedwater–methanol (9:1, v/v). Finally, the phenolic compounds were
eluted using 3 mL of acidified water–methanol (3:7, v/v) at a rateof 1–2 mL min�1, and 50 lL were injected in the HPLC.
2.7. RO filtration performance
The separation ability of the membrane towards specific com-pounds can be established in terms of solute rejection coefficient(Rj) defined according to the following equation:
Rj ¼ 1� Cp
Cf
� �� 100 ð2Þ
where Cp is the permeate concentration, and Cf is the feed concen-tration. Rj measures the fraction of solute retained by the mem-brane [53].
3. Results and discussion
3.1. Effect of feed pressure and temperature on the volume recoveryand COD rejection
Since membrane filtration is a pressure driven process, the per-meate flux increases with increasing pressure. As expected, thevolume recovery increased almost linearly with pressure. Morespecifically, the volume recovery increased from 10.8% to 24.3%and to 50.4% when increasing the feed pressure from 5 to 7.5and finally to 10 bar. The COD rejection increased from 90% to96.7% when increasing the feed pressure from 5 to 7.5 bar, whileonly a further slight increase was observed from 7.5 to 10 bar(97.3%). Based on the aforementioned findings, 10 bar was identi-fied as the optimum operating pressure, giving the maximum vol-ume recovery (50.4%) and the maximum COD rejection (97.4%) ofthe winery wastewater. It should be mentioned that for the specificRO unit it was not possible to apply a pressure higher than 16 bar(although the pump was capable of providing driving pressures upto 55 bar) due to the PVC piping and pre-filter casing pressurelimitations.
Additionally, the effect of temperature (20 �C and 26 �C) on theperformance of the RO system operating at the optimum pressure(10 bar) was also investigated. A slight increase of the volumerecovery was observed from 44.6% to 50.4% with increasing thetemperature from 20 to 26 �C. A small increase on the COD rejec-tion was also observed (96.9% to 97.3%). These results can beattributed to the reduction of the wastewater viscosity withincreasing temperature [27]. It was not possible to apply a temper-ature higher than 26 �C however, due to the technical specifica-tions of the membrane (maximum temperature 29 �C). Thetemperature increased slightly during the experiment and there-fore a somewhat lower temperature was applied (i.e. 26 �C).
Table 3 depicts the COD, TN, TP, TSS, TS, and conductivity re-moval achieved at the optimum operating conditions, (10 bar and26 �C). As shown, a high level of constituents’ removal wasachieved by RO, reaching values even up to 97.9%.
Due to the fact that the winery wastewater can be discharged inthe environment mainly for irrigation purposes, it is important tocomply with the local environmental limits. The regulations in Cy-prus and Greece [54,55] set maximum limits of 5–15 mg L�1 TN,125 mg L�1 COD, 2 mg L�1 TP and 10–35 mg L�1 TSS for treatedeffluents that can be used for irrigation and can be discharged inwater dams and other water bodies; the RO process seems to bean effective technology for winery wastewater treatment, thatcan reduce these pollutants in the permeate to values below thatof the Cypriot and Greek discharge limits (with the exception ofthe COD value which slightly exceed the limit), as shown inTable 3.
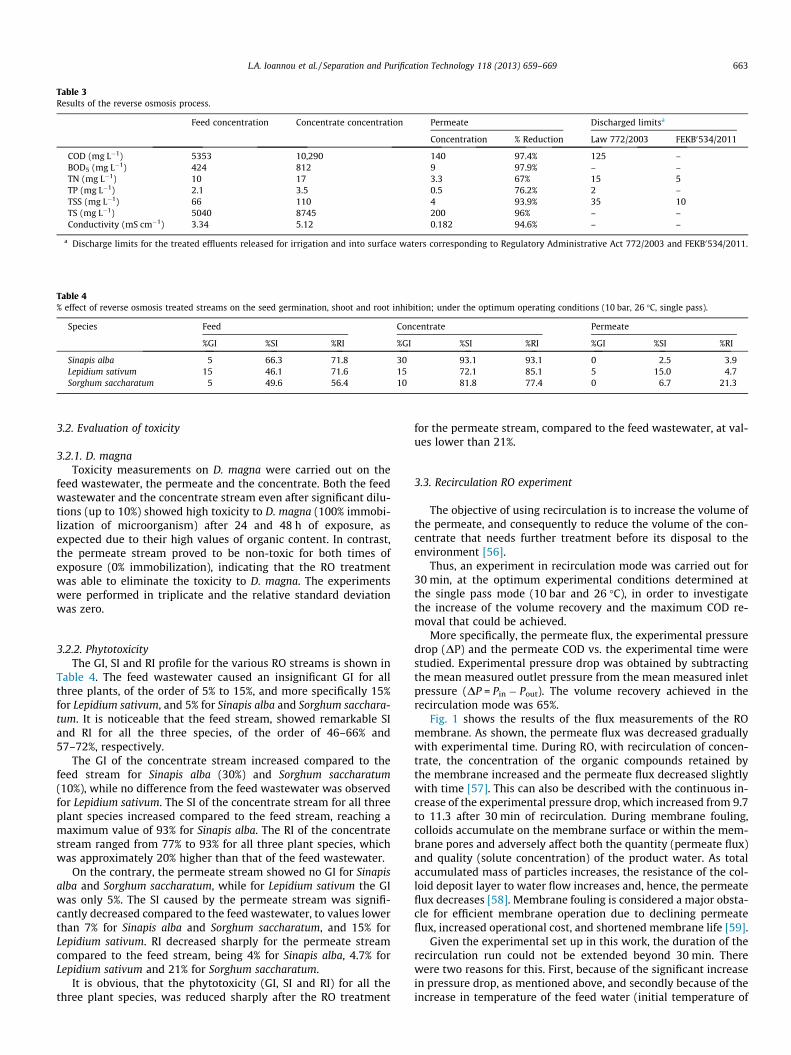
Table 3Results of the reverse osmosis process.
Feed concentration Concentrate concentration Permeate Discharged limitsa
Concentration % Reduction Law 772/2003 FEKB0534/2011
COD (mg L�1) 5353 10,290 140 97.4% 125 –BOD5 (mg L�1) 424 812 9 97.9% – –TN (mg L�1) 10 17 3.3 67% 15 5TP (mg L�1) 2.1 3.5 0.5 76.2% 2 –TSS (mg L�1) 66 110 4 93.9% 35 10TS (mg L�1) 5040 8745 200 96% – –Conductivity (mS cm�1) 3.34 5.12 0.182 94.6% – –
a Discharge limits for the treated effluents released for irrigation and into surface waters corresponding to Regulatory Administrative Act 772/2003 and FEKB0534/2011.
Table 4% effect of reverse osmosis treated streams on the seed germination, shoot and root inhibition; under the optimum operating conditions (10 bar, 26 �C, single pass).
Species Feed Concentrate Permeate
%GI %SI %RI %GI %SI %RI %GI %SI %RI
Sinapis alba 5 66.3 71.8 30 93.1 93.1 0 2.5 3.9Lepidium sativum 15 46.1 71.6 15 72.1 85.1 5 15.0 4.7Sorghum saccharatum 5 49.6 56.4 10 81.8 77.4 0 6.7 21.3
L.A. Ioannou et al. / Separation and Purification Technology 118 (2013) 659–669 663
3.2. Evaluation of toxicity
3.2.1. D. magnaToxicity measurements on D. magna were carried out on the
feed wastewater, the permeate and the concentrate. Both the feedwastewater and the concentrate stream even after significant dilu-tions (up to 10%) showed high toxicity to D. magna (100% immobi-lization of microorganism) after 24 and 48 h of exposure, asexpected due to their high values of organic content. In contrast,the permeate stream proved to be non-toxic for both times ofexposure (0% immobilization), indicating that the RO treatmentwas able to eliminate the toxicity to D. magna. The experimentswere performed in triplicate and the relative standard deviationwas zero.
3.2.2. PhytotoxicityThe GI, SI and RI profile for the various RO streams is shown in
Table 4. The feed wastewater caused an insignificant GI for allthree plants, of the order of 5% to 15%, and more specifically 15%for Lepidium sativum, and 5% for Sinapis alba and Sorghum sacchara-tum. It is noticeable that the feed stream, showed remarkable SIand RI for all the three species, of the order of 46–66% and57–72%, respectively.
The GI of the concentrate stream increased compared to thefeed stream for Sinapis alba (30%) and Sorghum saccharatum(10%), while no difference from the feed wastewater was observedfor Lepidium sativum. The SI of the concentrate stream for all threeplant species increased compared to the feed stream, reaching amaximum value of 93% for Sinapis alba. The RI of the concentratestream ranged from 77% to 93% for all three plant species, whichwas approximately 20% higher than that of the feed wastewater.
On the contrary, the permeate stream showed no GI for Sinapisalba and Sorghum saccharatum, while for Lepidium sativum the GIwas only 5%. The SI caused by the permeate stream was signifi-cantly decreased compared to the feed wastewater, to values lowerthan 7% for Sinapis alba and Sorghum saccharatum, and 15% forLepidium sativum. RI decreased sharply for the permeate streamcompared to the feed stream, being 4% for Sinapis alba, 4.7% forLepidium sativum and 21% for Sorghum saccharatum.
It is obvious, that the phytotoxicity (GI, SI and RI) for all thethree plant species, was reduced sharply after the RO treatment
for the permeate stream, compared to the feed wastewater, at val-ues lower than 21%.
3.3. Recirculation RO experiment
The objective of using recirculation is to increase the volume ofthe permeate, and consequently to reduce the volume of the con-centrate that needs further treatment before its disposal to theenvironment [56].
Thus, an experiment in recirculation mode was carried out for30 min, at the optimum experimental conditions determined atthe single pass mode (10 bar and 26 �C), in order to investigatethe increase of the volume recovery and the maximum COD re-moval that could be achieved.
More specifically, the permeate flux, the experimental pressuredrop (DP) and the permeate COD vs. the experimental time werestudied. Experimental pressure drop was obtained by subtractingthe mean measured outlet pressure from the mean measured inletpressure (DP = Pin � Pout). The volume recovery achieved in therecirculation mode was 65%.
Fig. 1 shows the results of the flux measurements of the ROmembrane. As shown, the permeate flux was decreased graduallywith experimental time. During RO, with recirculation of concen-trate, the concentration of the organic compounds retained bythe membrane increased and the permeate flux decreased slightlywith time [57]. This can also be described with the continuous in-crease of the experimental pressure drop, which increased from 9.7to 11.3 after 30 min of recirculation. During membrane fouling,colloids accumulate on the membrane surface or within the mem-brane pores and adversely affect both the quantity (permeate flux)and quality (solute concentration) of the product water. As totalaccumulated mass of particles increases, the resistance of the col-loid deposit layer to water flow increases and, hence, the permeateflux decreases [58]. Membrane fouling is considered a major obsta-cle for efficient membrane operation due to declining permeateflux, increased operational cost, and shortened membrane life [59].
Given the experimental set up in this work, the duration of therecirculation run could not be extended beyond 30 min. Therewere two reasons for this. First, because of the significant increasein pressure drop, as mentioned above, and secondly because of theincrease in temperature of the feed water (initial temperature of

Fig. 1. Variation of permeate flux and DP of RO membrane vs. operation time, inrecirculation mode; under the optimum operating conditions (10 bar and 26 �C).
0
0,2
0,4
0,6
0,8
1
0 0,5 1 1,5 2 2,5 3 3,5 4
CO
D/C
OD
o
Time (hr)
H2O2: 750 mg/LH2O2: 1000 mg/LH2O2: 1500 mg/LH2O2: 2000 mg/L
Fig. 3. Effect of the initial hydrogen peroxide concentration on the COD removal ofthe RO concentrate stream during the solar photo-Fenton oxidation; [Fe2+]0 =20 mg L�1, [H2O2] = 750–2000 mg L�1, lamp power = 1000 W, pH = 2.9, T = 25 �C.
664 L.A. Ioannou et al. / Separation and Purification Technology 118 (2013) 659–669
26 �C) due to the continuous recirculation of the concentrate,reaching the membrane’s maximum recommended operating tem-perature of 29 �C.
The COD of the permeate vs. operation time in the recirculationmode is shown in Fig. 2. During the experiment, the COD in thepermeate increased gradually to a certain value and then remainedpractically constant. The increase of the permeate COD was due tothe fact that in the feeding stream the COD was increasing alsowith the time. The COD of the permeate was maintained below184 mg L�1 throughout the experiment and the organic removalefficiency was over 95%.
Although the recirculation mode could increase the volumerecovery by 15% compared to the single pass mode, it was provedto be less efficient than the single pass mode for the treatment ofwinery wastewater due to the increase of the permeate COD (by44 mg L�1).
3.4. Solar photo-Fenton treatment of the concentrate generated by theRO process
Although the RO treatment can provide a water stream of goodquality for reuse (as permeate), yet it produces a quantity of con-centrate (ranging usually between 35% and 85% of the feed) [60]with increased amounts of organic matter (10290 mg L�1 and812 mg L�1, expressed as COD and BOD5, respectively (see Table 3).
Fig. 2. Permeate COD vs. operation time, in recirculation mode; under the optimumoperating conditions (10 bar and 26 �C).
Much research effort has been devoted to reduce the generatedconcentrate, by increasing the recovery efficiency of RO systems[60,61]; however this still results in a progressively higher concen-tration of pollutants in the concentrate, making more difficult theappropriate treatment of this waste stream [43].
Even though the BOD in the concentrate is relatively high(812 mg L�1) it cannot be considered biodegradable since the ratioof BOD/COD in the concentrate is 0.079, and therefore far from theratio of 0.3–0.4 which is the criterion of biodegradability of the or-ganic load in wastewaters. The objective of the present study wasto evaluate the efficiency of a fast and green technology to treatfurther the concentrate organic load, as well as to reduce its toxic-ity, in order to be safely disposed in the environment.
For the treatment of the concentrate stream, an alternativetreatment method was tested, to reduce its COD. From the variousAOPs that have been adopted for the wastewater treatment, photo-Fenton oxidation was selected, due to the fact that is a technologywith many advantages including the possible use of solar light tophotoactivate the catalytic process [62,63].
To obtain the optimal H2O2 concentration, experiments wereconducted at several combinations of oxidant concentrations(750–2000 mg H2O2 L�1) at a constant catalyst concentration of20 mg Fe2+ L�1. An increase of H2O2 concentration from 750 to1000 mg L�1 enhanced the COD reduction from 30% to 41% after4 h of solar photo-Fenton treatment, as shown in Fig. 3. This canbe explained by the effect of the additionally produced hydroxyl
0
100
200
300
400
500
600
700
800
900
1000
0
0,1
0,2
0,3
0,4
0,5
0,6
0,7
0,8
0,9
1
0 2 4 6 8 10 12 14 16 18 20
H2O
2co
nsum
ptio
n (m
g L-1 )
COD/
CODo
Time (hr)
solar photo-Fenton oxidationdark Fenton oxidation
H2O2 consumed during solar photo-Fenton oxidation+H2O2
+H2O2
+H2O2
Fig. 4. COD removal of RO concentrate stream vs. operation time of solar photo-Fenton oxidation, under the optimum experimental conditions; [Fe2+]0 = 20 mg L�1,[H2O2]dose = 1000 mg L�1, lamp power = 1000 W, pH = 2.9, T = 25 �C.

Table 5% Effect of reverse osmosis concentrate stream before (10 bar, 26 �C, single pass) and after solar photo-Fenton treatment ([Fe2+]0 = 20 mg L�1, [H2O2]dose = 1000 mg L�1, T = 25 �C)on the seed germination, shoot and root inhibition.
Species Concentrate Concentrate after solar photo-Fenton treatment
%GI %SI %RI %GI %SI %RI
Sinapis alba 30 93.1 93.1 2.5 30.1 32.0Lepidium sativum 15 72.1 85.1 7.5 21.1 29.2Sorghum saccharatum 10 81.8 77.4 2.5 22.5 20.6
(a)PDA detector
(b)
Fluorescence detector
Fig. 5. Chromatograms of a standard mixture using (a) photo-diode array detection (PDA) (k: 280 nm) and (b) fluorescence detection (kex: 280 nm and kem: 320 nm).
L.A. Ioannou et al. / Separation and Purification Technology 118 (2013) 659–669 665
radicals. Further increase of the concentration of H2O2 from 1000to 1500 mg L�1 caused no significant change in the COD reduction.On the other hand, further increase of the concentration of H2O2 to2000 mg L�1 caused a substantial reduction in the COD removalfrom 41% to 34%. The explanation is that at higher concentrations,the H2O2 acts as a scavenger of the hydroxyl radicals, while the HO�
recombine to H2O2, [64–67].The influence of oxidant concentration on the kinetics was also
investigated by several previous studies [64,66–68]. The main find-ings show that neither too low hydrogen peroxide concentration(leading to a rate reduction of the Fenton reaction) nor too highconcentration may be applied (H2O2 act as scavenger of the hydro-xyl radicals produced). However, there is a rather broad concentra-tion interval between both extremes, where none of these twophenomena occurs [69]. In the present study, 1000 mg L�1 ofH2O2 was considered as the optimal dosage at the conditionsstudied.
Extra experiments were performed at the optimum H2O2 con-centration of 1000 mg L�1, and at a lower and at a higher ferrousconcentration of 5 mg L�1 and 30 mg L�1, in order to ensure that20 mg L�1 was really the optimum dose. As shown in Fig. S1, thelower ferrous dosage of 5 mg L�1 led to a significant lower COD re-moval (28 ± 1.8%) compared to 41 ± 2.4% COD removal achieved by20 mg L�1 Fe2+ after 4 h of solar treatment. On the other hand, afurther increase of the concentration of ferrous ion from 20 to30 mg L�1 did not cause any significant change in the COD reduc-tion (42 ± 1.6%). As a result, a ferrous dosage of 20 mg L�1 was re-quired for the treatment of the RO concentrate, since it remarkablyincreased the efficiency of solar photo-Fenton oxidation for thepurification of winery RO concentrate.
In order to achieve further reduction of the COD of the concen-trate winery effluent, an additional experiment was performed atthe optimum ferrous (20 mg L�1) and H2O2 concentrations(1000 mg L�1), where extra additions of oxidant were taken place

Table 6Polyphenols concentration in the concentrate stream through thereverse osmosis process.
Polyphenols Winery wastewater +polyphenols% Concentration
Gallic acid 100Vanillic acid 100Epicatechin 99.1p-Coumaric acid 98.7Ferulic acid 98.7
666 L.A. Ioannou et al. / Separation and Purification Technology 118 (2013) 659–669
during the reaction, so that hydrogen peroxide was always avail-able (i.e. H2O2 in excess) (Fig. 4). The concentration of hydrogen
2
1
Concentrate
(b)
2
1
Feed
(a)
3
3
Permeate
(c)
Fig. 6. HPLC chromatograms of the selected polyphenols added (a) in the feed stream, (bpermeate of the RO process; (1) gallic acid; (2) vanillic acid; (3) epicatechin; (4) p-coudetector.
peroxide was monitored every hour with hydrogen peroxide teststrips (Quantofix peroxide, 1–100 mg L�1, Sigma Aldrich), andwhen this was consumed to a value below 25 mg L�1 a subsequentdose (1000 mg L�1) was added. During the experimental time, theH2O2 was consumed twice; at 6 h and at 14 h. As shown in Fig. 4,the COD of the concentrate stream, decreased until a certain valueafter 12 h of solar treatment (�70%), and then reached a steadystate, while a slight reduction (�5%), almost negligible, was ob-served with the addition of the last dose of H2O2 at 14 h until theend of the treatment (20 h). Summarizing, the solar photo-Fentonoxidation removed after 20 h of treatment �75% of the originallyCOD present in the concentrate steam and 82% of the total poly-phenols content, while the residual total polyphenols was
2
3
54
3
54
3
3
2
4
5
) after one cycle in the concentrate of the RO process, and (c) after one cycle in themaric acid; (5) ferulic acid. Inset graphs show the HPLC chromatograms with FL

L.A. Ioannou et al. / Separation and Purification Technology 118 (2013) 659–669 667
7.1 mg L�1. In addition, a dark experiment (Fenton process) at theoptimum experimental conditions was conducted to assess theoxidation power of Fenton reagent in the absence of solar light.During the Fenton oxidation process, the COD of the concentratestream was removed by �61% after 20 h of treatment and withthe addition of an extra dose of H2O2 (1000 mg L�1) after the firstdose was consumed (Fig. 4). In Fig. 4, the H2O2 consumption duringthe solar photo-Fenton oxidation is also presented.
Following, the effect of the solar photo-Fenton treated concen-trate was tested for phytotoxicity. As shown in Table 5 comparingthe GI of the concentrate stream after solar photo-Fenton treat-ment to the initial concentrate stream, this was reduced from30% to 2.5% for Sinapis alba, from 15% to 7.5% for Lepidium sativumand from 10% to 2.5% for Sorghum saccharatum. It is noticeable thatthe concentrate stream after 20 h of solar treatment showed a 4-fold SI reduction comparing to the initial concentrate stream. Morespecifically, the SI of the concentrate wastewater after the solartreatment was reduced from 99% to 30% for Sinapis alba, from72% to 21% for Lepidium sativum and from 81% to 22.5% for Sorghumsaccharatum. Moreover, the winery concentrate effluent after thesolar photo-Fenton treatment caused a RI of the order of 20.5 to30% for the three plants, which was reduced ca. 3-fold comparingto the initial concentrate wastewater (77% to 93%).
It must be noted that the GI, SI and RI of the concentrate streamafter solar photo-Fenton treatment, were also lower (almost halffor all three species) than the GI, SI and RI of the feed wastewater.
It is therefore apparent that the solar photo-Fenton oxidationcan be considered as an effective process for the treatment of theRO concentrate stream of the winery wastewater, due to the signif-icant reduction of both the organic load and phytotoxicity.
3.5. Determination of polyphenols in winery wastewater
According to the literature, the total polyphenol content of win-ery wastewater ranges from 10 to 1450 mg L�1 [5,40,70–72]. In re-cent years, more emphasis is being placed upon the recovery ofvaluable compounds contained in this kind of effluents [18] andhence to the valorization of the wastewater. As mentioned already,in the case that the polyphenols recovery is desirable this shouldtake place before the concentrate undergoes further treatment asadvanced oxidation process, is capable of completely oxidizingsuch compounds.
Fig. 5a and b shows the separation of the five selected lowmolecular weight polyphenols often determined in wine (gallicacid, vanillic acid, epicatechin, p-coumaric acid and ferulic acid)in various other studies [73–75], by the method applied duringour investigation.
Samples of winery wastewater taken from the feed, concentrateand permeate stream of RO process were analyzed by HPLC. Theselected polyphenols were not identified in any of the three ROstreams tested, not even in the concentrate stream. The absenceof the selected polyphenols may probably be due to the fact thatthe particular winery effluent used was derived mainly from whitewine production, which has lower content of polyphenols (initialtotal polyphenols of feed wastewater 20 mg L�1 measured by Fo-lin–Ciocalteu method [50]).
Because evaluating the capacity of the RO process to concen-trate polyphenols was considered quite important, the feed streamwas spiked with 15 mg L�1 of each one of the five selected poly-phenols. The RO process proved to be quite efficient in almost com-pletely concentrating the five compounds (98.7–100%) in theconcentrate stream, as shown in Table 6. Fig. 6 shows the chro-matograms of the three RO streams taken after the polyphenolsspiking.
Thus, RO can be considered as a promising process for both thepurification of the original winery wastewater and the
concentration of polyphenols in the concentrate stream the aimbeing their recovery.
4. Conclusions
Reverse osmosis followed by solar photo-Fenton oxidation ofthe RO concentrate proved to be a successful combined processfor the integrated treatment of winery effluents. Firstly, the ROseparation process resulted in a permeate stream that fulfills thequality criteria (Greek and Cypriot legislation) in order to be reusedfor irrigation or to be disposed of in surface waters. Moreover, theRO was able to reduce the toxicity from 100% immobilization of D.magna in the feed wastewater to zero in the permeate, while thephytotoxicity was substantially reduced as well. Additionally, allthe polyphenols tested, were almost completely concentrated inthe resulting RO stream (concentrate), demonstrating the capacityof the process purifying and valorizing winery wastewater. On theother hand, the RO concentrate that contains high levels ofrefractory organic pollutants, was successfully treated by solarphoto-Fenton oxidation, achieving a significant reduction of boththe organic load and the phytotoxicity.
Acknowledgments
Nireas, International Water Research Center of the University ofCyprus (NEA YPODOMH/
PTPATH/0308/09), is co-funded by the
European Regional Development Fund and the Republic of Cyprusthrough the Research Promotion Foundation.
Appendix A. Supplementary material
Supplementary data associated with this article can be found, inthe online version, at http://dx.doi.org/10.1016/j.seppur.2013.07.049.
References
[1] R. Mosteo, J. Sarasa, M.P. Ormad, J. Ovelleiro, Sequential solar photo-Fenton-biological system for the treatment of winery wastewaters, J. Agric. FoodChem. 56 (2008) 7333–7338.
[2] P. Artiga, E. Ficara, F. Malpei, J. Garrido, R. Mendez, Treatment of two industrialwastewaters in a submerged membrane bioreactor, Desalination 179 (2005)161–169.
[3] M.S. Lucas, J.A. Peres, G. Li Puma, Treatment of winery wastewater by ozone-based advanced oxidation processes (O3, O3/UV and O3/UV/H2O2) in a pilot-scale bubble column reactor and process economics, Sep. Purif. Technol. 72(2010) 235–241.
[4] A. Eusebio, M. Petruccioli, M. Lageiro, F. Federici, J. Duarte, Microbialcharacterisation of activated sludge in jet-loop bioreactors treating winerywastewaters, J. Ind. Microbiol. Biotechnol. 31 (2004) 29–34.
[5] K. Mosse, A. Patti, E. Christen, T. Cavagnaro, Review: winery wastewaterquality and treatment options in Australia, Aust. J. Grape Wine R. 17 (2011)111–122.
[6] G. Andreottola, P. Foladori, P. Nardelli, A. Denicolo, Treatment of winerywastewater in a full-scale fixed bed biofilm reactor, Sust. Viti. Winery WastesManage. 51 (2005) 71–79.
[7] N. Anastasiou, M. Monou, D. Mantzavinos, D. Kassinos, Monitoring of thequality of winery influents/effluents and polishing of partially treated wineryflows by homogeneous Fe (II) photo-oxidation, Desalination 248 (2009) 836–842.
[8] M. Torrijos, R. Moletta, Winery wastewater depollution by sequencing batchreactor, Water Sci. Technol. 35 (1997) 249–257.
[9] M. Petruccioli, J. Duarte, F. Federici, High-rate aerobic treatment of winerywastewater using bioreactors with free and immobilized activated sludge, J.Biosci. Bioeng. 90 (2000) 381–386.
[10] M. Petruccioli, J. Cardoso Duarte, A. Eusebio, F. Federici, Aerobic treatment ofwinery wastewater using a jet-loop activated sludge reactor, Process Biochem.37 (2002) 821–829.
[11] P.J. Strong, J.E. Burgess, Treatment methods for wine-related and distillerywastewaters: a review, Bioremediation J. 12 (2008) 70–87.
[12] D. Daffonchio, M. Colombo, G. Origgi, C. Sorlini, V. Andreoni, Anaerobicdigestion of winery wastewaters derived from different wine makingprocesses, J. Environ. Sci. Health., Part A 33 (1998) 1753–1770.

668 L.A. Ioannou et al. / Separation and Purification Technology 118 (2013) 659–669
[13] S.V. Kalyuzhnyi, M.A. Gladchenko, V.I. Sklyar, O.V. Kurakova, S.S. Shcherbakov,The UASB treatment of winery wastewater under submesophilic andpsychrophilic conditions, Environ. Technol. 21 (2000) 919–925.
[14] M. Keyser, R.C. Witthuhn, L.-C. Ronquest, T.J. Britz, Treatment of wineryeffluent with upflow anaerobic sludge blanket (UASB)-granular sludgesenriched with Enterobacter sakazakii, Biotechn. Lett. 25 (2003) 1893–1898.
[15] L. Malandra, G. Wolfaardt, A. Zietsman, M. Viljoen-Bloom, Microbiology of abiological contactor for winery wastewater treatment, Water Res. 37 (2003)4125–4134.
[16] G. Coetzee, L. Malandra, G.M. Wolfaardt, M. Viljoen-Bloom, Dynamics of amicrobial biofilm in a rotating biological contactor for the treatment of wineryeffluent, Water SA 30 (2004) 407–412.
[17] A. Eusebio, M. Petruccioli, M. Lageiro, F. Federici, J. Duarte, Microbialcharacterisation of activated sludge in jet-loop bioreactors treating winerywastewaters, J. Ind. Microbiol. Biot. 31 (2004) 29–34.
[18] C. Beck, G. Prades, A.G. Sadowski, Activated sludge wastewater treatmentplants optimisation to face pollution overloads during grape harvest periods,Water Sci. Technol. 51 (2005) 81–88.
[19] R. Moletta, Winery and distillery wastewater treatment by anaerobicdigestion, Water Sci. Technol. 51 (2005) 137–144.
[20] F. Molina, G. Ruiz-Filippi, C. Garcia, E. Roca, J.M. Lema, Winery effluenttreatment at an anaerobic hybrid USBF pilot plant under normal and abnormaloperation, Water Sci. Technol. 56 (2007) 25–31.
[21] R. Ganesh, R. Rajinikanth, J.V. Thanikal, R.A. Ramanujam, M. Torrijos, Anaerobictreatment of winery wastewater in fixed bed reactors, Bioprocess Biosyst. Eng.33 (2010) 619–628.
[22] S. Montalvo, L. Guerrero, E. Rivera, R. Borja, A. Chica, A. Martín, Kineticevaluation and performance of pilot-scale fed-batch aerated lagoons treatingwinery wastewaters, Bioresch. Technol. 101 (2010) 3452–3456.
[23] C. Valderrama, G. Ribera, N. Bahí, M. Rovira, T. Giménez, R. Nomen, S. Lluch, M.Yuste, X. Martinez-Lladó, Winery wastewater treatment for water reusepurpose: Conventional activated sludge versus membrane bioreactor (MBR): acomparative case study, Desalination 306 (2012) 1–7.
[24] L. Tam, T. Tang, G. Lau, K. Sharma, G. Chen, A pilot study for wastewaterreclamation and reuse with MBR/RO and MF/RO systems, Desalination 202(2007) 106–113.
[25] T. Wintgens, T. Melin, A. Schäfer, S. Khan, M. Muston, D. Bixio, et al., The role ofmembrane processes in municipal wastewater reclamation and reuse,Desalination 178 (2005) 1–11.
[26] E. Cséfalvay, P.M. Imre, P. Mizsey, Applicability of nanofiltration and reverseosmosis for the treatment of wastewater of different origin, Cent. Eur. J. Chem.6 (2008) 277–283.
[27] R. Ferrarini, A. Versari, S. Galassi, A preliminary comparison betweennanofiltration and reverse osmosis membranes for grape juice treatment, J.Food Eng. 50 (2001) 113–116.
[28] S.K. Nataraj, K.M. Hosamani, T.M. Aminabhavi, Distillery wastewatertreatment by the membrane-based nanofiltration and reverse osmosisprocesses, Water Res. 40 (2006) 2349–2356.
[29] S. Sridhar, A. Kale, A.A. Khan, Reverse osmosis of edible vegetable oil industryeffluent, J. Membr. Sci. 205 (2002) 83–90.
[30] M. Vourch, B. Balannec, B. Chaufer, G. Dorange, Treatment of dairy industrywastewater by reverse osmosis for water reuse, Desalination 219 (2008) 190–202.
[31] S. Madaeni, Y. Mansourpanah, COD removal from concentrated wastewaterusing membranes, Filtration Sep. 40 (2003) 40–46.
[32] Y. Wang, X. Li, L. Zhen, H. Zhang, Y. Zhang, C. Wang, Electro-Fenton treatmentof concentrates generated in nanofiltration of biologically pretreated landfillleachate, J. Hazard. Mater. 229–230 (2012) 115–121.
[33] M. Zhou, Q. Tan, Q. Wang, Y. Jiao, N. Oturan, M.A. Oturan, Degradation oforganics in reverse osmosis concentrate by electro-Fenton process, J. Hazard.Mater. 215–216 (2012) 287–293.
[34] E. Dialynas, D. Mantzavinos, E. Diamadopoulos, Advanced treatment of thereverse osmosis concentrate produced during reclamation of municipalwastewater, Water Res. 42 (2008) 4603–4608.
[35] P. Westerhoff, H. Moon, D. Minakata, J. Crittenden, Oxidation of organics inretentates from reverse osmosis wastewater reuse facilities, Water Res. 43(2009) 3992–3998.
[36] D. Mantzavinos, I. Poulios, D. Duprez, Special issue on ‘‘Advanced catalyticoxidation processes’’, Catal. Today 124 (2007) 81.
[37] A.S. Stasinakis, I. Elia, A.V. Petalas, C.P. Halvadakis, Removal of total phenolsfrom olive-mill wastewater using an agricultural by-product, olive pomace, J.Hazard. Mater. 160 (2008) 408–413.
[38] P. Navarro, J. Sarasa, D. Sierra, S. Esteban, J.L. Ovelleiro, Degradation of wineindustry wastewaters by photocatalytic advanced oxidation, Water Sci.Technol. 51 (2005) 113–120.
[39] R. Mosteo, P. Ormad, E. Mozas, J. Sarasa, J.L. Ovelleiro, Factorial experimentaldesign of winery wastewaters treatment by heterogeneous photo-Fentonprocess, Water Res. 40 (2006) 1561–1568.
[40] M.P. Ormad, R. Mosteo, C. Ibarz, J.L. Ovelleiro, Multivariate approach to thephoto-Fenton process applied to the degradation of winery wastewaters, Appl.Catal. B-Environ. 66 (2006) 58–63.
[41] O. Gimeno, F.J. Rivas, F.J. Beltrán, M. Carbajo, Photocatalytic ozonation ofwinery wastewaters, J. Agr. Food Chem. 55 (2007) 9944–9950.
[42] D. Hermosilla, N. Merayo, R. Ordóñez, Á. Blanco, Optimization of conventionalFenton and ultraviolet-assisted oxidation processes for the treatment ofreverse osmosis retentate from a paper mill, Waste Manage. (Oxford) 32(2012) 1236–1243.
[43] R.M. Huang, J.Y. He, J. Zhao, Q. Luo, C.M. Huang, Fenton–biological treatment ofreverse osmosis membrane concentrate from a metal plating wastewaterrecycle system, Environ. Technol. 32 (2011) 515–522.
[44] P. Chelme-Ayala, M.G. El-Din, D.W. Smith, Treatability study on membraneconcentrate containing pesticides using advanced oxidation processes, Ozone-Sci. Eng. 32 (2010) 16–24.
[45] P.C. Papaphilippou, C. Yiannapas, M. Politi, V.M. Daskalaki, C. Michael, N.Kalogerakis, D. Mantzavinos, D. Fatta-Kassinos, Sequential coagulation-flocculation, solvent extraction and photo-Fenton oxidation for thevalorization and treatment of olive mill effluent, Chem. Eng. J. 224 (2013) 88.
[46] R. Braz, A. Pirra, M.S. Lucas, J.A. Peres, Combination of long-term aeratedstorage and chemical coagulation/flocculation to winery wastewatertreatment, Desalination 263 (2010) 226–232.
[47] APHA, Standard Methods for the Examination of Water and Wastewater,twentieth ed., American Public Health Association, Washington, DC, USA,1998.
[48] L. Ioannou, T. Velegraki, C. Michael, D. Mantzavinos, D. Fatta-Kassinos,Sunlight, iron and radicals to tackle the resistant leftovers of biotreatedwinery wastewater, Photochem. Photobiol. S. 12 (2013) 664.
[49] R.F.P. Nogueira, M.R.A. Silva, A.G. Trovó, Influence of the iron source on thesolar photo-Fenton degradation of different classes of organic compounds, Sol.Energy 79 (2005) 384–392.
[50] H. Dejmkova, M. Scampicchio, J. Zima, J. Barek, S. Mannino, Determination oftotal phenols in foods by boron doped diamond electrode, Electroanalysis 21(2009) 1014–1018.
[51] ISO 6341, Water quality – Determination of the inhibition of the mobility ofDaphnia magna Straus (Cladocera, Crustacea) – Acute toxicity test, 1996.
[52] M. Rodrıguez-Delgado, S. Malovaná, J. Pérez, T. Borges, F. Garcıa Montelongo,Separation of phenolic compounds by high-performance liquidchromatography with absorbance and fluorimetric detection, J. Chromatogr.A 912 (2001) 249–257.
[53] B. Díaz-Reinoso, A. Moure, H. Domínguez, J.C. Parajó, Ultra-and nanofiltrationof aqueous extracts from distilled fermented grape pomace, J. Food Eng. 91(2009) 587–593.
[54] Cyprus Regulatory Administrative Act on the pollution of water bodies (urbanwastewaters discharges), 2003/772, 2003.
[55] Greek Law on the determination of measures, conditions and proceduresfor the reuse of treated wastewater and other provisions, FEKB 534/2011,2011.
[56] K.N. Bourgeous, J.L. Darby, G. Tchobanoglous, Ultrafiltration of wastewater:effects of particles, mode of operation, and backwash effectiveness, Water Res.35 (2001) 77–90.
[57] P. Ndiaye, P. Moulin, L. Dominguez, J. Millet, F. Charbit, Removal of fluoridefrom electronic industrial effluentby RO membrane separation, Desalination173 (2005) 25–32.
[58] X. Zhu, M. Elimelech, Colloidal fouling of reverse osmosis membranes:measurements and fouling mechanisms, Environ. Sci. Technol. 31 (1997)3654–3662.
[59] P. Xu, J.E. Drewes, T. Kim, C. Bellona, G. Amy, Effect of membrane fouling ontransport of organic contaminants in NF/RO membrane applications, J. Membr.Sci. 279 (2006) 165–175.
[60] L.F. Greenlee, F.L. Testa, F. Desmond, B.D. Freeman, P. Moulin, Effect ofantiscalants on precipitation of an RO concentrate: metals precipitated andparticle characteristics for several water compositions, Water Res. 44 (2010)2672–2684.
[61] R.Y. Ning, T.L. Troyer, Tandom reverse osmosis process for zero-liquiddischarge, Desalination 237 (2009) 238–242.
[62] S. Malato, J. Blanco, A. Vidal, C. Richter, Photocatalysis with solar energy at apilot-plant scale: an overview, Appl. Catal. B-Environ. 37 (2002) 1–15.
[63] R.F.P. Nogueira, Milady Renata Apolinário da Silva, A. Trovó, Influence of theiron source on the solar photo-Fenton degradation of different classes oforganic compounds, Sol. Energy 79 (2005) 384–392.
[64] M.Y. Ghaly, G. Härtel, R. Mayer, R. Haseneder, Photochemical oxidation of p-chlorophenol by UV/H2O2 and photo-Fenton process. A comparative study,Waste Manag. 21 (2001) 41–47.
[65] M. Tamimi, S. Qourzal, N. Barka, A. Assabbane, Y. Ait-Ichou, Methomyldegradation in aqueous solutions by Fenton’s reagent and the photo-Fentonsystem, Sep. Purif. Technol. 61 (2008) 103–108.
[66] A.K. Abdessalem, N. Bellakhal, N. Oturan, M. Dachraoui, M.A. Oturan,Treatment of a mixture of three pesticides by photo-and electro-Fentonprocesses, Desalination 250 (2010) 450–455.
[67] S. Navarro, J. Fenoll, N. Vela, E. Ruiz, G. Navarro, Removal of ten pesticides fromleaching water at pilot plant scale by photo-Fenton treatment, Chem. Eng. J.167 (2011) 42–49.
[68] M.S. Lucas, J.A. Peres, Degradation of Reactive Black 5 by Fenton/UV-C andferrioxalate/H2O2/solar light processes, Dyes Pigm. 74 (2007) 622–629.
[69] S. Malato, P. Fernández-Ibáñez, M.I. Maldonado, J. Blanco, W. Gernjak,Decontamination and disinfection of water by solar photocatalysis: Recentoverview and trends, Catal. Today 147 (2009) 1–59.

L.A. Ioannou et al. / Separation and Purification Technology 118 (2013) 659–669 669
[70] M.S. Lucas, R. Mosteo, M.I. Maldonado, S. Malato, J.A. Peres, Solarphotochemical treatment of winery wastewater in a CPC reactor, J. Agric.Food Chem. 57 (2009) 11242–11248.
[71] F.J. Beltran, J.F. García-Araya, P.M. Alvarez, Continuous flow integratedchemical (ozone)-activated sludge system treating combined agroindustrial-domestic wastewater, Environ. Prog. 19 (2004) 28–35.
[72] M. Arienzo, E.W. Christen, W.C. Quayle, Phytotoxicity testing of winerywastewater for constructed wetland treatment, J. Hazard. Mater. 169 (2009)94–99.
[73] M. Dell’Agli, A. Buscialà, E. Bosisio, Vascular effects of wine polyphenols,Cardiovasc. Res. 63 (2004) 593–602.
[74] K.P. Mosse, T.V. Verheyen, A.J. Cruickshank, A.F. Patti, T.R. Cavagnaro, Solubleorganic components of winery wastewater and implications for reuse, Agric.Water Manage. (2012).
[75] S.V. Nigdikar, N.R. Williams, B.A. Griffin, A.N. Howard, Consumption of redwine polyphenols reduces the susceptibility of low-density lipoproteins tooxidation in vivo, Am. J. Clin. Nutr. 68 (1998) 258–265.