
Indian Distillery Industry - Shakti Sustainable Energy Foundation
Upload
independentCategory
view
1download
0
ASIA-PACIFIC JOURNAL OF CHEMICAL ENGINEERINGAsia-Pac. J. Chem. Eng. 2010; 5: 454–464Published online 25 June 2009 in Wiley InterScience(www.interscience.wiley.com) DOI:10.1002/apj.313
Research ArticleFenton and photo-Fenton treatment of distillery effluentand optimization of treatment conditions with responsesurface methodology
Mojtaba Hadavifar,1 Ali Akbar Zinatizadeh,2,3 Habibollah Younesi1* and Maedeh Galehdar1
1Department of Environmental Science, Faculty of Natural Resources and Marine Sciences, Tarbiat Modares University, Noor, P.O. Box: 64414-356Iran2Department of Applied Chemistry, Faculty of Chemistry, Razi University, Kermanshah, Iran3Water and Environment Division, Water and Power Industry Institute for Applied and Scientific Higher Education, Kermanshah, Iran
Received 14 January 2009; Revised 23 February 2009; Accepted 1 March 2009
ABSTRACT: Two chemical processes, Fenton and photo-Fenton, were tested separately for the treatment of vinasse,which was generated from an alcohol distillery process. In order to evaluate the processes effectiveness, four independentvariables viz. SCOD concentration, initial pH, H2O2 and FeSO4 dosage were applied. Experiments were conductedbased on a central composite design (CCD) and analyzed using response surface methodology (RSM). UV radiationfor 80 min was applied in each experiment during the photo-Fenton process. Two modified quadratic equations wereused for data fitting. The most significant model terms in the processes were found to be the initial chemical oxygendemand (COD) concentration and the initial pH. A higher removal efficiency was achieved in the photo-Fenton processcompared to Fenton alone. The efficiency varied from 18 to 97% for the photo-Fenton process, while it was in therange of 5–47% for Fenton process. The R2 value of the models (R2 > 0.97) shows a very high degree of correlationbetween the parameters. 2009 Curtin University of Technology and John Wiley & Sons, Ltd.
KEYWORDS: Fenton; photo-Fenton; vinasse; alcohol distillery process; RSM
INTRODUCTION
Vinasse is a wastewater generated in the manufactureof ethyl alcohol by fermentation and subsequent dis-tillation. Vinasse is highly toxic and, considering thatthe production of one tone of anhydrous alcohol gen-erates 16 m3 of vinasse on the average, the disposalof vinasse poses a serious environmental problem.[1–3]
It has been characterized, apart from low pH, by itshigh chemical oxygen demand (COD) in the range10 000–50 000 mg/l with an average biological oxygendemand (BOD) to COD ratio of about 0.5.[3]
Some of the existing applications for the disposal ofvinasse are direct landfill application, and methane pro-duction. However, if vinasse is disposed of on land, thealkalinity of the soil is reduced so that crops may bedestroyed, manganese deficiency in the soil occurs andseed germination can be inhibited. Other options areconcentration-incineration of vinasse, considered as anexpensive method[4] and composting for amendment of
*Correspondence to: Habibollah Younesi, Department of Environ-mental Science, Faculty of Natural Resources and Marine Sciences,Tarbiat Modares University, Noor, P.O. Box: 64414-356 Iran.E-mail: [email protected]
soil.[5,6] There are also various chemical and biologicalmethods for wastewater treatment in the molasses-basedalcohol distilleries.[7] Precipitation of the suspendedsolids content of the vinasse in ethanol was studiedby Caqueret et al .[8] Two influential operating parame-ters, i.e. temperature and ethanol/vinasse weight (w/w)ratio of the precipitation, were optimized by a simplemethod. The optimum conditions were determined as4.6 and 21 ◦C respectively for ethanol/vinasse weightratio and temperature whereas 52.4% COD removal wasachieved.
Martin and his coworkers[9] studied anaerobic diges-tion of the products resulting from the partial oxidationof vinasse with ozone. Ozone plus UV light was appliedin order to increase the anaerobic biodegradability ofvinasse. They reported that the yield coefficient andmean specific rate of anaerobic digestion was increasedby 25% compared to that of untreated vinasse. Bel-tran de Heredia et al .[3] applied an integrated Fenton-coagulation/flocculation for COD removal and depura-tion of wine distillery wastewater. Optimal molar ratioof [H2O2] : [Fe2+] = 15 resulted to a COD removal effi-ciency of 74%. In a photo-Fenton process study, winerywastewater was exposed to 0.02–0.5 M concentration
2009 Curtin University of Technology and John Wiley & Sons, Ltd.
Asia-Pacific Journal of Chemical Engineering FENTON AND PHOTO-FENTON TREATMENT OF DISTILLERY WASTEWATER 455
of H2O2 and 5–500 mg/l concentration of FeCl3.6H2Oin homogenous phase.[10] Under these conditions, a 50%COD removal was achieved.
The performance of a photocatalytic process in treat-ing vinasse was investigated by Santana and FernandesMachado.[11] In their study, immobilized TiO2 in glassbeads (TiO2/beads) under sunlight showed high affec-tivity in vinasse treatment. Zayas and his coworkers[2]
investigated the use of coagulation/flocculation (CF)and electrochemical oxidation (EO) processes for treat-ing vinasse. The CF process showed 84% COD removalat coagulant concentration of 20 g/l and at pH of 8.4,while in the EO process the removal efficiency was95%. The UV/H2O2, UV/O3 and UV/H2O2/O3 pro-cesses integrated with chemical coagulation/flocculationfor treatment of the natural organic matter in thewastewater generated from coffee processing wastewa-ter have been investigated.[12] A COD reduction of 67%was obtained when the coffee wastewater was treatedby chemical coagulation/flocculation with lime (1.0 g)and coagulant T-1 (8 ml) at pH 4.6. However, by chemi-cal CF treatment in combination with UV/H2O2, a CODreduction of 86% was achieved after prolonged UV irra-diation.
Response surface methodology (RSM) is a collec-tion of mathematical and statistical techniques useful foranalyzing the effects on the response of several inde-pendent variables.[13] RSM has an important applicationfor a process design and optimization for as well asthe improvement of an existing design. In most RSMproblems, the relationship between the response andthe independent variables is unknown.[14–16] In severalindustrial processes, RSM is almost routinely used toevaluate results and efficiency of the operations. Thecentral composite design is still the symmetrical secondorder experimental design that is utilized mostly for thedevelopment of analytical procedures.[17–23]
In the last few years, RSM has been applied tooptimize and evaluate interactive effects of indepen-dent factors in numerous chemical and biochemicalprocesses such as: application of the central compos-ite design (CCD) and RSM to the advanced treatmentwastewater from olive oil processing using Fenton’speroxidation[24]; selective optimization in thermophilicacidogenesis of cheese-whey wastewater to acetic andbutyric acids[25]; a central composite design withoutstar points in solar photo-Fenton treatment – Processparameters and process control for degradation ofalachlor[26]; preliminary experimental study to evaluatethe most accurate operating parameters, which are usedfor optimization and determination of oil removal effi-ciency from oily wastewater[27]; optimization of treat-ment conditions of whey wastewater with response sur-face methodology.[28]
However, to our knowledge, no work has everbeen published regarding photo-assisted Fenton oxi-dation treatment of the organic compounds present
in vinasse wastewater using combination of Fenton’sreagent (Fe2+/H2O2) and UV light irradiation. In thepresent study, we applied Fenton reaction (Fe2+/H2O2)as a pretreatment coupled with UV light to completethe oxidation of remaining organic matter. The effectof main experimental variables involved in the photoFenton process, such as initial COD, initial dosages ofFeSO4 and H2O2, and the initial pH were investigatedin detail in order to achieve significant COD removalin vinasse wastewater.
MATERIAL AND METHODS
Vinasse preparation
Vinasse was obtained from fermentation of sugarcanemolasses (as carbon source) by Saccharomyces cere-visiae in a batch system. The yeast S. cerevisiae PTCC5010 was obtained from Persian type culture collec-tion (PTCC), Tehran, Iran. The composition of thegrowth medium was (grams per liter): 5; NH4Cl, 100;cane molasses, 2.5; MgSO4, 1.00; yeast extract, 1.00;KH2PO4, 0.2; K2HPO4. The medium was sterilized byautoclaving for 20 min at 1.5 atm and at 121 ◦C. After3 days, the yeast cells were removed by centrifugingfor 15 min at 3000 rpm. The separated supernatant con-sisted of alcohol, which was evaporated by boiling.Characteristics of the vinasse from the distillery efflu-ents are given in Table 1. A high organic load with anaverage soluble COD of 40 000 mg/l is characteristic ofthis wastewater. The evaporation of ethyl alcohol fromthe supernatant in the winery leaves this wastewaterwith a low pH of 4.0. However, the nitrogen load ofdistillery wastewater compared to the phosphorous loadis too low to support an adequate microbial growth. Thesolid matter in the distillery wastewater is about 42 g/land contains mostly soluble organic matter (Table 1).
Table 1. Physicochemical characteristic parameters ofvinasse.
Characteristics Value
Color Dark-brownpH 5COD (mg/l) 40 700BOD5 (mg/l) 23 300TS (g/l) 42Ash or solid matter (g/l) 14.62Phosphate (mg/l) 300Sulfate (mg/l) 17 500Nitrate (mg/l) 3.99Nitrite (mg/l) 0.7Ammonia (mg/l) 3 360Chloride (mg/l) 36
2009 Curtin University of Technology and John Wiley & Sons, Ltd. Asia-Pac. J. Chem. Eng. 2010; 5: 454–464DOI: 10.1002/apj
456 M. HADAVIFAR ET AL. Asia-Pacific Journal of Chemical Engineering
Experimental procedure
The Fenton reagent used in this study was FeSO4 ·7H2O (Merck, Germany) and hydrogen peroxide(Merck, Germany) as the source of radicals. Sodiumhydroxide (Merck, Germany) and sulfuric acid (Merck,Germany) at 1 M concentration were used to adjust pHof the solutions. Wastewater was treated with the Fen-ton reagent by mixing a fresh solution of FeSO4 · 7H2O(15%) and H2O2 solutions (30%) to give differentratios of FeSO4 · 7H2O/H2O2. All experiments wereperformed in a 200 ml beaker consisting of 100 mlvinasse with COD’s ranging from 3000 to 39 000 mg/land pH’s from 2.5 to 8.5. Different concentrations of theferrous sulfate (2 to 10 g/l) were then added. Sampleswere stirred for 5 min at 30 rpm (magnetic stirrer VELPScientifica, Europe) in order to complete dissolving ofthe ferrous sulfate. Subsequently, hydrogen peroxideranging from 3 to 7 ml/l was added to the mixturesand stirred for 15 min at 30 rpm. All the experimentswere carried out at room temperature. The mixtureswere transferred into a 100 ml graduated cylinder andsolids allowed to settle.
Treated samples in the first experiments were exposedto UV radiation for 80 min with additional 2 ml/lH2O2. The irradiation was carried out using twoparallel adjustable F8T5 UV-B, 302 nm fluorescentblack tube (made in Japan), (5300 µw/cm−2 UV-B;1150 µw/cm−2 UV-A and 3.9 µw/cm−2 UV-C) andradiation values in µw/cm−2 were obtained by the useof a UVX radiometer (UVP, USA) using three sen-sors (UVX-25, UVX-31 and VUX-36). The distancebetween the UV lamp and reaction vessel surface wasfixed at 50 mm.
Analytical methods
The mixtures were filtered using ashless filter paperwith 0.45 µm pore sizes to determine total suspendedsolids (TSS) and volatile suspended solids (VSS). Thesludge volume was measured after 30 min. Super-natants from each set of experiments were analyzedfor the COD. The COD was determined by closed-reflux colorimetric method (The palintest system, Pho-tometer 8000, England) according to standard methodsfor examination of water and wastewater.[29] A sampledigestion was performed by an ECO16 Thermoreac-tor (VELP Scientifica, Europe) over 120 min at 150 ◦C.The sample containing H2O2, which interfered with theCOD measurements, was eliminated by adding MnO2powder.[1,2] The pH of the wastewater was measuredusing the pH meter set (CyberScan, Singapore). Totalsolids (TS), volatile solids (VS) and suspended solids(SS) were assessed gravimetrically, in accordance withstandard methods.[29] The ashless filter papers were
burned at 550 ◦C over 60 min in an electrical fur-nace set. All experiments were conducted in triplicate,except in central points, COD measurement were car-ried out in duplicate and the results were averaged.Soluble COD removal was calculated in accordancewith Eqn 1.
R = Initial soluble COD − Final soluble COD
Initial soluble COD× 100
(1)
Experimental design and mathematicalmodeling
The RSM used in the present study was a CCD involv-ing four independent variables viz. SCOD concentra-tion, Initial pH, H2O2 and FeSO4 dosage. The designconsisted of 2k factorial points augmented by 2k axialpoints and a center point where k is the number ofvariables. The two operating variables were consideredat three levels namely, low (−1), central (0) and high(+1). Accordingly, 30 experiments were conducted with25 experiments organized in a factorial design (includ-ing 16 factorial points, 8 axial points and 1 centerpoint) and the remaining five involving the replicationof the central point to get good estimate of experi-mental error. The range and level of the variables incoded units from RSM studies in the experiments forthe removal of COD are given in Table 2. The actualvariables were converted to coded variables using thefollowing equation[30]:
xcoded = XActual − (XHi + XLow )/2
(XHi − XLow )/2(2)
Where, x is the coded variables, X is the actualvariables.
The Design Expert 7.0.7 software (Stat-Ease, Inc.,Minneapolis, MN, USA) was used for regression andgraphical analysis of the obtained data. The Fentonand photo-Fenton treatment of distillery effluent wasassessed based on the full CCD experimental plan(Table 3).
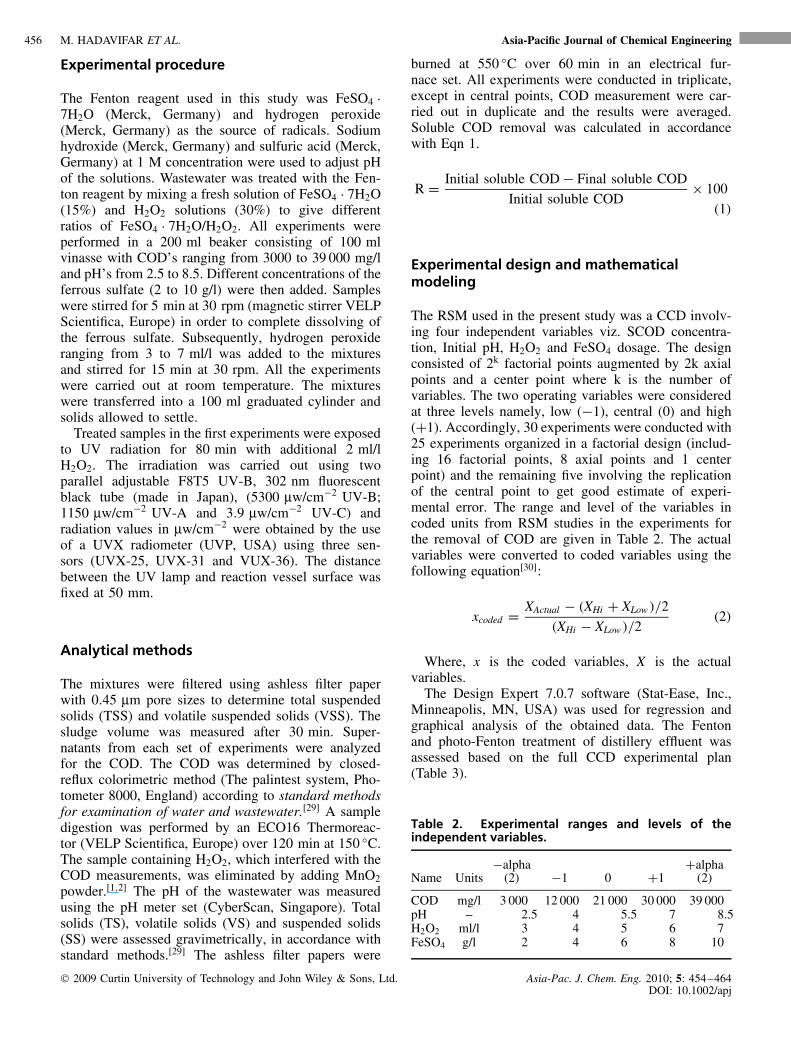
Table 2. Experimental ranges and levels of theindependent variables.
Name Units−alpha
(2) −1 0 +1+alpha
(2)
COD mg/l 3 000 12 000 21 000 30 000 39 000pH – 2.5 4 5.5 7 8.5H2O2 ml/l 3 4 5 6 7FeSO4 g/l 2 4 6 8 10
2009 Curtin University of Technology and John Wiley & Sons, Ltd. Asia-Pac. J. Chem. Eng. 2010; 5: 454–464DOI: 10.1002/apj

Asia-Pacific Journal of Chemical Engineering FENTON AND PHOTO-FENTON TREATMENT OF DISTILLERY WASTEWATER 457
Table 3. Experimental design based on central composite design (CCD).
Variables (coded) Response (SCOD removal), %
Run No.SCOD,
mg/l (A)Initial
pH (B )H2O2 dosage,
ml/l (C )Fe(II) dosage,
g/l (D) Fenton Photo-Fenton
1 21 000(0) 5.5(0) 5(0) 6(0) 31 542 21 000(0) 5.5(0) 5(0) 6(0) 30 533 21 000(0) 5.5(0) 5(0) 6(0) 33 524 21 000(0) 5.5(0) 5(0) 6(0) 28 525 21 000(0) 5.5(0) 5(0) 6(0) 29 526 21 000(0) 5.5(0) 5(0) 6(0) 28 537 12 000(−1) 4.0(−1) 4(−1) 4(−1) 26 648 30 000(+1) 4.0(−1) 4(−1) 4(−1) 11 229 12 000(−1) 7.0(+1) 4(−1) 4(−1) 32 67
10 30 000(+1) 7.0(+1) 4(−1) 4(−1) 9 1911 12 000(−1) 4.0(−1) 6(+1) 4(−1) 33 6912 30 000(+1) 4.0(−1) 6(+) 4(−1) 15 2313 12 000(−1) 7.0(+1) 6(+1) 4(−1) 35 7014 30 000(+1) 7.0(+1) 6(+1) 4(−1) 5 1815 12 000(−1) 4.0(−1) 4(−1) 8(+1) 29 6316 30 000(+1) 4.0(−1) 4(−1) 8(+1) 18 3817 12 000(−1) 7.0(+1) 4(−1) 8(+1) 47 7218 30 000(+1) 7.0(+1) 4(−1) 8(+1) 25 3919 12 000(−1) 4.0(−1) 6(+1) 8(+1) 31 6420 30 000(+1) 4.0(−1) 6(+1) 8(+1) 17 3821 12 000(−1) 7.0(+1) 6(+1) 8(+1) 45 7022 30 000(+1) 7.0(+1) 6(+1) 8(+1) 18 3723 3 000(−2) 5.5(0) 5(0) 6(0) 46 9724 39 000(+2) 5.5(0) 5(0) 6(0) 7 2625 21 000(0) 2.5(−2) 5(0) 6(0) 21 3526 21 000(0) 8.5(+2) 5(0) 6(0) 27 3027 21 000(0) 5.5(0) 3(−2) 6(0) 27 5228 21 000(0) 5.5(0) 7(+2) 6(0) 29 5329 21 000(0) 5.5(0) 5(0) 2(−2) 21 4530 21 000(0) 5.5(0) 5(0) 10(+2) 30 59
After conducting the experiments, the coefficientsof the polynomial model were calculated using thefollowing equation, Khuri and Cornell[15].
Y = β0 + βi Xi + βj Xj + βii Xi2
+ βjj Xj2 + βij Xi Xj + . . . (3)
where, Y is the predicted response, xi , xj , . . . , xk
are the input variables, which affect the responsey, x 2
i , x 2j , . . . , x 2
k are the square effects, xi xj , xi xk andxj xk are the interaction effects, β0, βi (i = 1, 2, . . . , k),βii (i = 1, 2, . . . , k), βij (i = 1, 2, . . . , k ; j = 1, 2, . . . ,
k) are the regression coefficients for the intercept, lin-ear, quadratic, and interaction terms, respectively, andε is the interaction effect and ε is a random error.[31]
Model terms were selected or rejected based on the Pvalue with 95% confidence level. The results were com-pletely analyzed using analysis of variance (ANOVA)by Design Expert software. Three-dimensional plots andtheir respective contour plots were obtained based onthe effect of the levels of the four factors.
RESULTS AND DISCUSSION
Statistical analysis
The single response investigated in this study was theCOD removal efficiency for both Fenton and Photo-Fenton processes. In order to quantify the curvatureeffects, the data from the experimental results were fit-ted to polynomial equation. Two modified quadraticequations were used for data fitting (Table 4). Theregression equations obtained are presented in Table 4.In the Design Expert software, the response datawere analyzed by default. The ANOVA results for allresponses have been summarized in Table 4. The modelterms in the equations are given after elimination ofinsignificant variables and their interactions. Based onthe statistical analysis, the models were highly signif-icant with very low probability values (<0.0001). Itwas shown that the model terms of independent vari-ables were significant at the 99.9% confidence level.The square of correlation coefficients for each responsewas computed as the coefficient of determination (R2).It showed high significant regression at 95% confidence
2009 Curtin University of Technology and John Wiley & Sons, Ltd. Asia-Pac. J. Chem. Eng. 2010; 5: 454–464DOI: 10.1002/apj

458 M. HADAVIFAR ET AL. Asia-Pacific Journal of Chemical Engineering
Table 4. ANOVA results for the equations of the Design Expert 7.0.7 for studied responses.
Process ResponseTrans-
formation
Modifiedequations with
significant terms Probability R2Adj.R2
Adeq.precision SD CV PRESS
Probabilityfor lack
of fit
Fenton SCODremoval
– 29.27 −10.13 A +1.79 B +3.04 D −2.81 AB −1.56 BC +2.94 BD −1.06 CD −0.92A2 −1.54 B 2 −1.17 D2
<0.0001 0.977 0.965 36.307 1.98 7.53 207.85 0.4079
Photo-Fenton
SCODremoval
– 51.98 −18.71A +3.96 D −1.81AB +4.31 AD +1.06 BD +2.05 A2 −5.2 B 2
<0.0001 0.992 0.9894 78.897 1.93 3.9 207.95 0.209
A, SCOD (mg/l); B , Initial pH; C , H2O2 dosage (ml/l); D , FeSO4 dosage (g/l); R2, determination coefficient; Adj. R2, adjusted R2; Adeq.Precision, Adequate precision; SD, standard deviation; CV, coefficient of variation; PRESS, predicted residual error sum of squares
level. The adequacy of the models was tested throughlack-of-fit F-tests.[16] The lack of fit F -statistic was notstatistically significant as the P values were greater than0.05. Adequate precision is a measure of the range inpredicted response relative to its associated error or, inother words, a signal to noise ratio. Its desired valueis 4 or more.[14] The value was found desirable for allmodels. Simultaneously, low values of the coefficientof variation (CV) (3.9–7.53%) indicated good preci-sion and reliability of the experiments as suggested byRefs [15,24,32–34]. Detailed analysis on the models ispresented in the following sections.
Fenton process
A modified quadratic model was selected to describe theresponse surface of removal of COD within the region(Table 4). The predicted plot vs an actual plot for CODremoval is shown in Fig. 1. It shows that the actualvalues are distributed very close to the straight line(y = x) (R2 = 0.977). The effect of variables on theCOD removal efficiencies are shown in Figs 2(a)–(d)as three dimensional plots. From the model (Table 4),the main and second order effects of the factor C (H2O2dosage) is not effective, indicating negligible effect ofthis factor on the process, whereas the most significantmodel terms in the Fenton process were found to bethe initial COD concentration and the pH. Therefore,the effects of the other variables were investigated at aconstant value of H2O2 dosage (middle level = 5 ml/l).
3
Actual
Pre
dict
ed
5.00
16.00
27.00
38.00
49.00
5.00 15.99 26.99 37.98 48.97
Figure 1. Actual vs predicted values for the response inFenton process. This figure is available in colour online atwww.apjChemEng.com.
Figure 2a shows the three-dimensional plot of themodel for COD removal with respect to initial the CODand pH within the design space, with H2O2 dosage atits middle level (5 ml/l) and Fe dosage at its low level(4 g/l). It was found that with an increase in CODin,the COD removal was decreased, while the pH showeddifferent effects, viz. as it was increased, it showed anincreasing effect at high CODin and decreasing effect at
2009 Curtin University of Technology and John Wiley & Sons, Ltd. Asia-Pac. J. Chem. Eng. 2010; 5: 454–464DOI: 10.1002/apj
Asia-Pacific Journal of Chemical Engineering FENTON AND PHOTO-FENTON TREATMENT OF DISTILLERY WASTEWATER 459
1200016500
2100025500
30000 4.04.8
5.56.3
7.0
8.0
14.8
21.5
28.3
35.0
Sol
uble
CO
D r
emov
al %
A: Soluble COD
A: Soluble COD
pH
pH
Design-Expert® Software
Soluble COD removal47
5
X1 = A: Soluble CODX2 = B: pH
Actual FactorsC: H2O2 = 5.00D: Fe = 4.00
(a)
Design-Expert® Software
Soluble COD removal47
5
X1 = A: Soluble CODX2 = B: pH
Actual FactorsC: H2O2 = 5.00D: Fe = 8.00
12000
16500
21000
25500
30000 4.04.8
5.56.3
7.0
16.0
23.8
31.5
39.3
47.0
Sol
uble
CO
D r
emov
al %
(b)
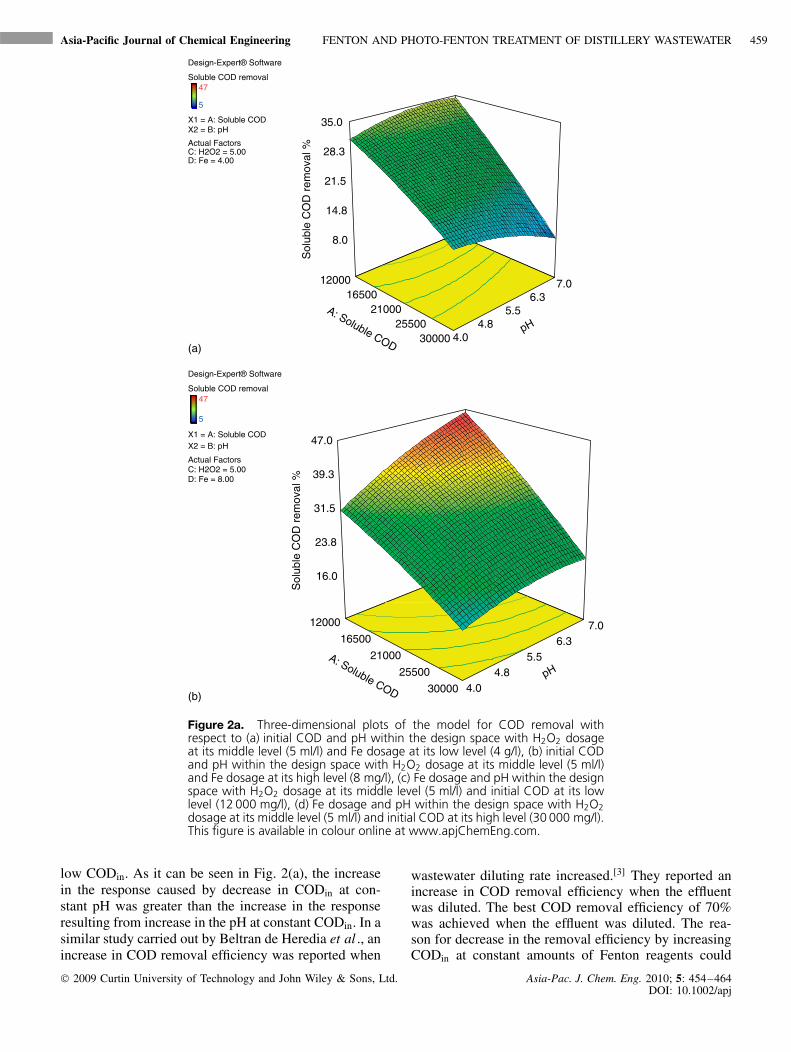
Figure 2a. Three-dimensional plots of the model for COD removal withrespect to (a) initial COD and pH within the design space with H2O2 dosageat its middle level (5 ml/l) and Fe dosage at its low level (4 g/l), (b) initial CODand pH within the design space with H2O2 dosage at its middle level (5 ml/l)and Fe dosage at its high level (8 mg/l), (c) Fe dosage and pH within the designspace with H2O2 dosage at its middle level (5 ml/l) and initial COD at its lowlevel (12 000 mg/l), (d) Fe dosage and pH within the design space with H2O2dosage at its middle level (5 ml/l) and initial COD at its high level (30 000 mg/l).This figure is available in colour online at www.apjChemEng.com.
low CODin. As it can be seen in Fig. 2(a), the increasein the response caused by decrease in CODin at con-stant pH was greater than the increase in the responseresulting from increase in the pH at constant CODin. In asimilar study carried out by Beltran de Heredia et al ., anincrease in COD removal efficiency was reported when
wastewater diluting rate increased.[3] They reported anincrease in COD removal efficiency when the effluentwas diluted. The best COD removal efficiency of 70%was achieved when the effluent was diluted. The rea-son for decrease in the removal efficiency by increasingCODin at constant amounts of Fenton reagents could
2009 Curtin University of Technology and John Wiley & Sons, Ltd. Asia-Pac. J. Chem. Eng. 2010; 5: 454–464DOI: 10.1002/apj
460 M. HADAVIFAR ET AL. Asia-Pacific Journal of Chemical Engineering
4.04.8
5.56.3
7.0
4.00
5.00
6.00
7.00
8.00
31.0
35.0
39.0
43.0
47.0
Sol
uble
CO
D r
emov
al %
pH
pH
FeSO4 (gr/l)
FeSO4 (gr/l)
Design-Expert® Software
Soluble COD removal47
5
X1 = B: pHX2 = D: Fe
Actual FactorsA: Soluble COD = 30000.00C: H2O2 = 5.00
4.04.8
5.56.3
7.0
4.05.0
6.07.0
8.0
5
10
15
20
25
Sol
uble
CO
D r
emov
al %
(d)
Design-Expert® Software
Soluble COD removal47
5
X1 = B: pHX2 = D: Fe
Actual FactorsA: Soluble COD = 12000C: H2O2 = 5.03
(c)
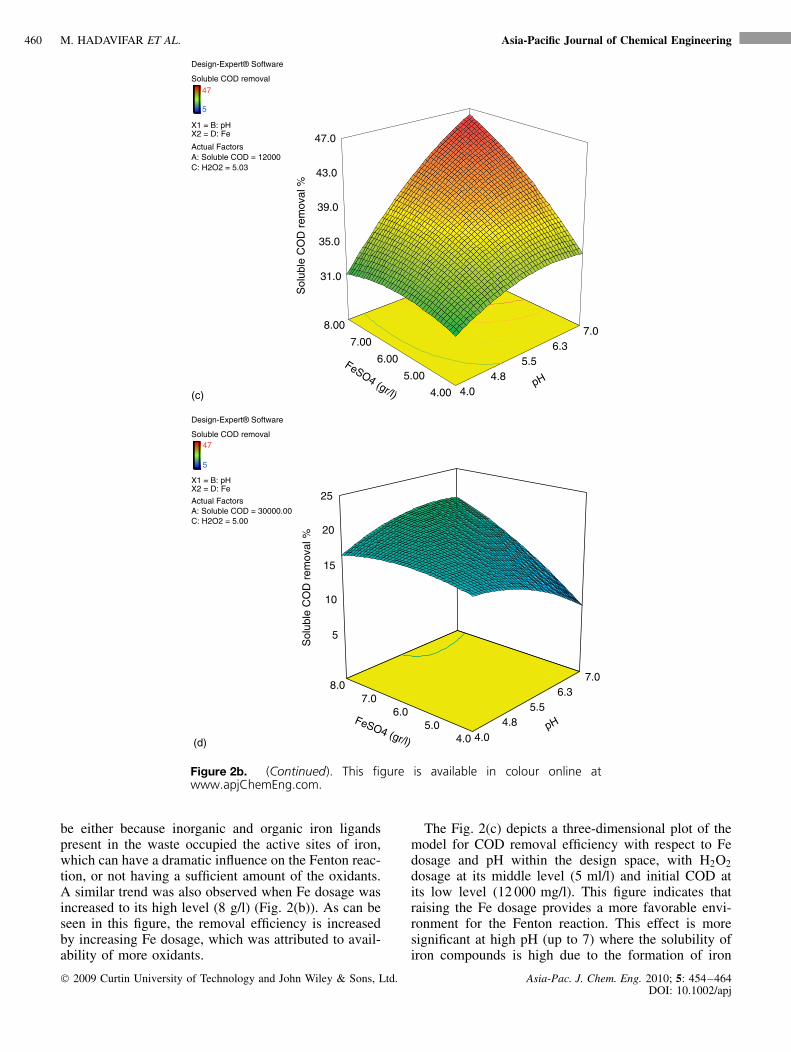
Figure 2b. (Continued). This figure is available in colour online atwww.apjChemEng.com.
be either because inorganic and organic iron ligandspresent in the waste occupied the active sites of iron,which can have a dramatic influence on the Fenton reac-tion, or not having a sufficient amount of the oxidants.A similar trend was also observed when Fe dosage wasincreased to its high level (8 g/l) (Fig. 2(b)). As can beseen in this figure, the removal efficiency is increasedby increasing Fe dosage, which was attributed to avail-ability of more oxidants.
The Fig. 2(c) depicts a three-dimensional plot of themodel for COD removal efficiency with respect to Fedosage and pH within the design space, with H2O2dosage at its middle level (5 ml/l) and initial COD atits low level (12 000 mg/l). This figure indicates thatraising the Fe dosage provides a more favorable envi-ronment for the Fenton reaction. This effect is moresignificant at high pH (up to 7) where the solubility ofiron compounds is high due to the formation of iron
2009 Curtin University of Technology and John Wiley & Sons, Ltd. Asia-Pac. J. Chem. Eng. 2010; 5: 454–464DOI: 10.1002/apj
Asia-Pacific Journal of Chemical Engineering FENTON AND PHOTO-FENTON TREATMENT OF DISTILLERY WASTEWATER 461
chelation by organic ligands. Conversely, iron hydrox-ides and oxyhydroxides are likely to be precipitatedunder higher pH conditions. As a result, Fenton pro-cesses generally must be carried out at pH values wellbelow 7, unless iron-dissolving agents (chelators) areadded. It is well known that the pH of the solutionaffects the hydroxyl radical generation capacity.[35] Itis stated that because metal hydroxide polymers suchas [Fe2(H2O)8(OH)2]4+ and [Fe2(H2O)7(OH)3]3+ haveamorphous structures with large surface areas, posi-tive charges, and hydrophobic properties, they favorinteraction with organic particles at moderate alkalinepH.[36] Therefore, in accordance with this theory, par-ticipation of ferric hydroxide Fe(OH)3 and polymericspecies that favor for flocculation can occur in thealkaline region. Correspondingly, in a similar study,it has been reported that an increase in removal effi-ciency of COD from 54 to 58% was observed withincrease in the pH range of 4–6. However, maximumremoval of COD reached 84% at an initial pH of8.4.[2] Their findings show that the removal efficiency ofCOD may increase with increase in the initial pH, withthe effect being more notable in a moderately alkalinecondition.
The Fig. 2(d) shows the removal efficiency at CODin
of 30 000 mg/l. From this figure, the COD removalhas considerably decreased by increasing CODin com-pared to CODin of 12 000 mg/l (Fig. 2(c)). It might beattributed to a low amount of the oxidative agents aswell as the substrate inhibition in the Fenton reaction atsuch a high concentration. The maximum COD removalefficiency was modeled to be about 46.3% under con-dition of CODin, H2O2 dosage, Fe dosage and pH setat 12 000 mg COD/l, 4 ml/l, 8 g/l and 7, respectively,while the observed value was 47%. In contrast, theminimum removal efficiency (5%) was obtained at thelowest Fe dosage (4 g/l) and the highest CODin, H2O2dosage and pH, i.e. at 30 000 mg COD/l, 6 ml/l and 7,respectively.
Photo-Fenton process
In the presence of light, additional reactions that pro-duce hydroxyl radicals, or increase the production rateof hydroxyl radical, can occur.[37] In the photo-Fentonsystem, irradiation of iron-peroxide solutions can resultin more effective degradation of pollutants than in thedark Fenton systems. The most important aspect ofthe photo-Fenton process is perhaps the photochemi-cal cycling of Fe3+ back to Fe2+.[38] As the rate ofhydroxyl radical formation is governed by the concen-tration of Fe2+, any additional route for reducing ironto the 2+ state will enhance the production rate ofhydroxyl radicals.
2
43
Actual
Pre
dict
ed
18.00
38.00
58.00
78.00
98.00
18.00 37.90 57.81 77.71 97.61
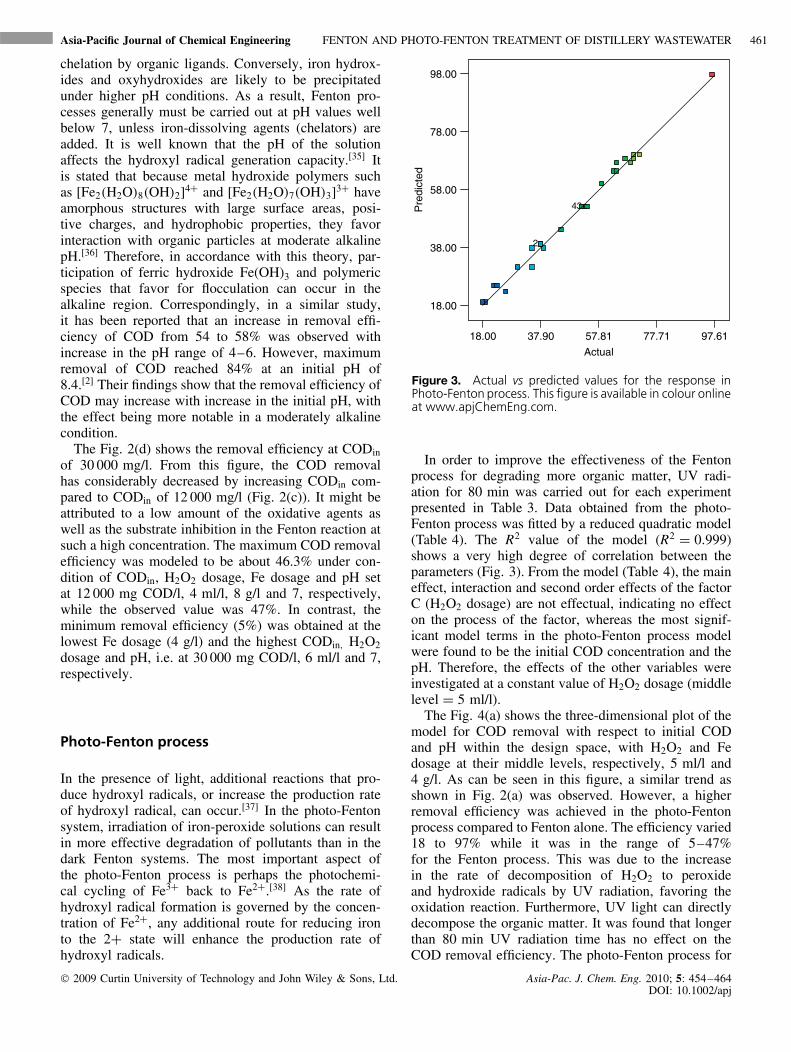
Figure 3. Actual vs predicted values for the response inPhoto-Fenton process. This figure is available in colour onlineat www.apjChemEng.com.
In order to improve the effectiveness of the Fentonprocess for degrading more organic matter, UV radi-ation for 80 min was carried out for each experimentpresented in Table 3. Data obtained from the photo-Fenton process was fitted by a reduced quadratic model(Table 4). The R2 value of the model (R2 = 0.999)shows a very high degree of correlation between theparameters (Fig. 3). From the model (Table 4), the maineffect, interaction and second order effects of the factorC (H2O2 dosage) are not effectual, indicating no effecton the process of the factor, whereas the most signif-icant model terms in the photo-Fenton process modelwere found to be the initial COD concentration and thepH. Therefore, the effects of the other variables wereinvestigated at a constant value of H2O2 dosage (middlelevel = 5 ml/l).
The Fig. 4(a) shows the three-dimensional plot of themodel for COD removal with respect to initial CODand pH within the design space, with H2O2 and Fedosage at their middle levels, respectively, 5 ml/l and4 g/l. As can be seen in this figure, a similar trend asshown in Fig. 2(a) was observed. However, a higherremoval efficiency was achieved in the photo-Fentonprocess compared to Fenton alone. The efficiency varied18 to 97% while it was in the range of 5–47%for the Fenton process. This was due to the increasein the rate of decomposition of H2O2 to peroxideand hydroxide radicals by UV radiation, favoring theoxidation reaction. Furthermore, UV light can directlydecompose the organic matter. It was found that longerthan 80 min UV radiation time has no effect on theCOD removal efficiency. The photo-Fenton process for
2009 Curtin University of Technology and John Wiley & Sons, Ltd. Asia-Pac. J. Chem. Eng. 2010; 5: 454–464DOI: 10.1002/apj

462 M. HADAVIFAR ET AL. Asia-Pacific Journal of Chemical Engineering
Design-Expert® Software
Solubl.COD removal97
18
X1 = A: Initial soluble CODX2 = B: pH
Actual FactorsC: H2O2 = 5.00D: Fe = 6.00
12000
1650021000
2550030000 4.0
4.8
5.5
6.3
7.0
25.0
38.8
52.5
66.3
80.0
Sol
uble
CO
D r
emov
al %
A:Initial soluble COD
pH
(a)
Design-Expert® Software
Solubl.COD removal97
18
X1 = B:pHX2 = D:Fe
Actual FactorsA: Initial soluble COD = 12000.00C: H2O2 = 5.00
4.00
4.75
5.50
6.25
7.00
4.00
5.00
6.00
7.00
8.00
50
57.5
65
72.5
80
Sol
uble
CO
D r
emov
al %
pHFe dosage, g/l(b)
Figure 4a. Three-dimensional plots of the model for COD removal withrespect to (a) initial COD and pH within the design space with H2O2 and Fedosage at their middle levels, (b) Fe dosage and pH within the design spacewith H2O2 dosage at its middle level (5 ml/l) and initial COD at its low level(12 000 mg/l), (c) Fe dosage and pH within the design space with H2O2 dosageat its middle level (5 ml/l) and initial COD at its high level (30 000 mg/l). Thisfigure is available in colour online at www.apjChemEng.com.
domestic wastewater treatment has been carried out byYonar et al .[35] A maximum COD reduction of 73.2%was achieved at initial COD of 12 060 mg/l, initial pHof 5.6 and less than 60 min of reaction time with H2O2
dosage at its middle level of 6 ml/l and Fe dosage ofits middle level of 5 g/l (Fig. 4(a)).
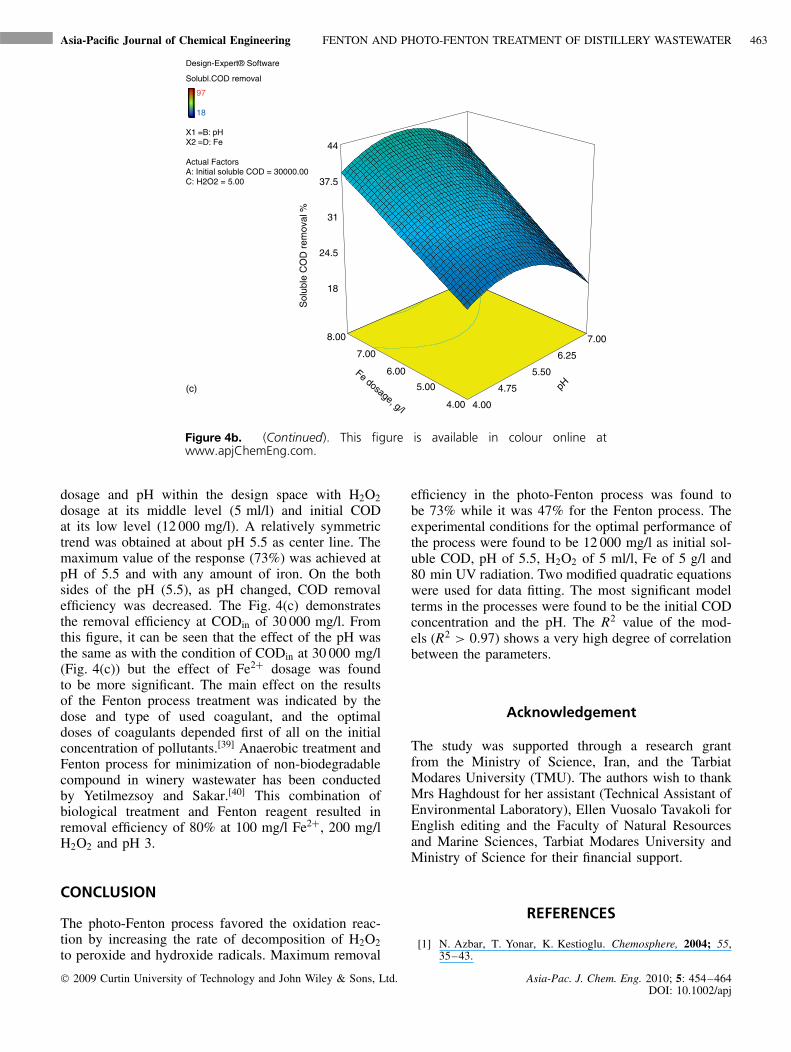
The Fig. 4(b) depicts a three-dimensional plot of themodel for COD removal efficiency with respect to Fe
2009 Curtin University of Technology and John Wiley & Sons, Ltd. Asia-Pac. J. Chem. Eng. 2010; 5: 454–464DOI: 10.1002/apj
Asia-Pacific Journal of Chemical Engineering FENTON AND PHOTO-FENTON TREATMENT OF DISTILLERY WASTEWATER 463
Design-Expert® Software
Solubl.COD removal
97
18
X1 =B: pHX2 =D: Fe
Actual FactorsA: Initial soluble COD = 30000.00C: H2O2 = 5.00
4.00
4.75
5.50
6.25
7.00
4.00
5.00
6.00
7.00
8.00
18
24.5
31
37.5
44
Sol
uble
CO
D r
emov
al %
pHFe dosage, g/l
(c)
Figure 4b. (Continued). This figure is available in colour online atwww.apjChemEng.com.
dosage and pH within the design space with H2O2dosage at its middle level (5 ml/l) and initial CODat its low level (12 000 mg/l). A relatively symmetrictrend was obtained at about pH 5.5 as center line. Themaximum value of the response (73%) was achieved atpH of 5.5 and with any amount of iron. On the bothsides of the pH (5.5), as pH changed, COD removalefficiency was decreased. The Fig. 4(c) demonstratesthe removal efficiency at CODin of 30 000 mg/l. Fromthis figure, it can be seen that the effect of the pH wasthe same as with the condition of CODin at 30 000 mg/l(Fig. 4(c)) but the effect of Fe2+ dosage was foundto be more significant. The main effect on the resultsof the Fenton process treatment was indicated by thedose and type of used coagulant, and the optimaldoses of coagulants depended first of all on the initialconcentration of pollutants.[39] Anaerobic treatment andFenton process for minimization of non-biodegradablecompound in winery wastewater has been conductedby Yetilmezsoy and Sakar.[40] This combination ofbiological treatment and Fenton reagent resulted inremoval efficiency of 80% at 100 mg/l Fe2+, 200 mg/lH2O2 and pH 3.
CONCLUSION
The photo-Fenton process favored the oxidation reac-tion by increasing the rate of decomposition of H2O2to peroxide and hydroxide radicals. Maximum removal
efficiency in the photo-Fenton process was found tobe 73% while it was 47% for the Fenton process. Theexperimental conditions for the optimal performance ofthe process were found to be 12 000 mg/l as initial sol-uble COD, pH of 5.5, H2O2 of 5 ml/l, Fe of 5 g/l and80 min UV radiation. Two modified quadratic equationswere used for data fitting. The most significant modelterms in the processes were found to be the initial CODconcentration and the pH. The R2 value of the mod-els (R2 > 0.97) shows a very high degree of correlationbetween the parameters.
Acknowledgement
The study was supported through a research grantfrom the Ministry of Science, Iran, and the TarbiatModares University (TMU). The authors wish to thankMrs Haghdoust for her assistant (Technical Assistant ofEnvironmental Laboratory), Ellen Vuosalo Tavakoli forEnglish editing and the Faculty of Natural Resourcesand Marine Sciences, Tarbiat Modares University andMinistry of Science for their financial support.
REFERENCES
[1] N. Azbar, T. Yonar, K. Kestioglu. Chemosphere, 2004; 55,35–43.
2009 Curtin University of Technology and John Wiley & Sons, Ltd. Asia-Pac. J. Chem. Eng. 2010; 5: 454–464DOI: 10.1002/apj
464 M. HADAVIFAR ET AL. Asia-Pacific Journal of Chemical Engineering
[2] T. Zayas, V. Romero, L. Salgado, M. Meraz, U. Morales. Sep.Purif. Technol., 2007; 57, 270–276.
[3] J. Beltran de Heredia, J.R. Dominguez, E. Partido. Water Sci.Technol., 2005; 51, 159–166.
[4] A.R. Navarro, M. del, C. Sepulveda, M.C. Rubio. WasteManage., 2000; 20, 581–585.
[5] M. Tejada, J.L. Gonzalez, A.M. Garcia-Martinez, J. Parrado.Bioresour. Technol., 2008; 99, 4949–4957.
[6] M. Tejada, J.L. Gonzalez. Catena, 2006; 68, 41–50.[7] Y. Satyawali, M. Balakrishnan. J. Environ. Manage., 2008;
86, 481–497.[8] V. Caqueret, S. Bostyn, B. Cagnon, H. Fauduet. Bioresour.
Technol., 2008; 99, 5814–5821.[9] M.A. Martın, F. Raposo, R. Borja, A. Martın. Process
Biochem., 2002; 37, 699–706.[10] M.P. Ormad, R. Mosteo, C. Ibarz, J.L. Ovelleiro. Appl. Catal.,
B: Environ., 2006; 66, 58–63.[11] V.S. Santana, N.R.C. Fernandes Machado. Catal. Today,
2008; 133-135, 606–610.[12] T. Zayas Peerez, G. Geissler, F. Hernandez. J. Environ. Sci.,
2007; 19, 300–305.[13] G.E.P. Box, N.R. Draper. Empirical Model-Building and
Response Surfaces, Wiley: New York, 1987.[14] R.l Mason, R.F. Gunst, J.L. Hess. Statistical Design and
Analysis of Experiments, Eighth Applications to Engineeringand Science, Wiley: New York, 2003.
[15] A.I. Khuri, J.A. Cornell. Response Surfaces: Design andAnalyses, Marcel Dekker: New York, 1996.
[16] D.C. Montgomery. Design and Analysis of Experiments,Wiley: New York, 1991.
[17] J.C. Parajo, J.L. Alonso, M.A. Lage, D. Vazquez., BioprocessEng.., 1992; 8, 129–136.
[18] M. Muthukumar, D. Sargunamani, N. Selvakumar, J. VenkataRao. Dyes Pigments, 2004; 63, 127–134.
[19] Q.K. Beg, V. Sahai, R. Gupta. Process Biochem., 2003; 39,203–209.
[20] Z.D.V.L. Mayerhoff, I.C. Roberto, T.T. Franco. Biochem.Eng. J., 2004; 18, 217–223.
[21] Z. Wen, W. Liao, S. Chen. Bioresour. Technol., 2005; 96,491–499.
[22] M.A. Bezerra, R.E. Santelli, E.P. Oliveira, L.S. Villar, L.A.Escaleira. Talanta, 2008; 76, 965–977.
[23] M. Ahmadi, F. Vahabzadeh, B. Bonakdarpour, E. Mofarrah,M. Mehranian. J. Hazard. Mater., 2005; 123, 187–195.
[24] A.L. Ahmad, S. Ismail, S. Bhatia. Environ. Sci. Technol.,2005; 39, 2828–2834.
[25] K. Yang, Y. Yu, S. Hwang. Water Res., 2003; 37, 2467–2477.[26] W. Gernjak, M. Fuerhacker, P. Fernandez-Ibanez, J. Blanco,
S. Malato. Appl. Catal., B: Environ., 2006; 64, 121–130.[27] M. Tir, N. Moulai-Mostefa. J. Hazard. Mater., 2008; 158,
107–115.[28] G. Guven, A. Perendeci, A. Tanyolac. J. Hazard. Mater.,
2008; 157, 69–78.[29] American Water Works Association. Standard Methods
for the Examination of Water and Wastewater, AmericanPublic Health Association (APHA)/American Water WorksAssociation/Water Environment Federation: Washington, DC,1998.
[30] C. Fan, W. Li, X. Li, S. Zhao, L. Zhang, Y. Mo, R. Cheng.Chin. Sci. Bull., 2007; 52, 2054–2062.
[31] C.M. Pey, A. Maestro, I. Sole, C. Gonzalez, C. Solans,J.M. Gutierrez. Colloids Surf., A, 2006; 288, 144–150.
[32] R.O. Kuehl. Design of Experiments: Statistical Principles ofResearch Design and Analysis, Duxbury Press: Pacific Grove,2000; pp.2–225.
[33] A.A.L. Zinatizadeh, A.R. Mohamed, M.D. Mashitah, A.Z.Abdullah, M.H. Isa. Biochem. Eng. J., 2007; 35, 226–237.
[34] F. Ghorbani, H. Younesi, S.M. Ghasempouri, A.A. Zinati-zadeh, M. Amini, A. Daneshi. Chem. Eng. J., 2008; 145,267–275.
[35] T. Yonar, K. Kestioglu, N. Azbar. Appl. Catal., B: Environ.,2006; 67, 223–228.
[36] S.J. Randtke. J. Am. Water Works Assoc., 1988; 80, 40–56.[37] J.J. Pignatello, D. Liu, P. Huston. Environ. Sci. Technol.,
1999; 33, 1832–1839.[38] Y. Sun, J.J. Pignatello. Environ. Sci. Technol., 1993; 27,
304–310.[39] J. Perkowski, L. Kos. Fibres Text. East Eur., 2002; 38, 78.[40] K. Yetilmezsoy, S. Sakar. J. Hazard. Mater., 2008; 151,
547–558.
2009 Curtin University of Technology and John Wiley & Sons, Ltd. Asia-Pac. J. Chem. Eng. 2010; 5: 454–464DOI: 10.1002/apj
Copyright © 2022 FDOKUMEN