
Degradation of clofibric acid in acidic aqueous medium by electro-Fenton and photoelectro-Fenton
10
Degradation of clofibric acid in acidic aqueous medium by electro-Fenton and photoelectro-Fenton Ignasi Sire ´s, Conchita Arias, Pere Lluı ´s Cabot, Francesc Centellas, Jose ´ Antonio Garrido, Rosa Marı ´a Rodrı ´guez, Enric Brillas * Laboratori d’Electroquı ´mica dels Materials i del Medi Ambient, Departament de Quı ´mica Fı ´sica, Facultat de Quı ´mica, Universitat de Barcelona, Martı ´ i Franque `s 1-11, 08028 Barcelona, Spain Received 28 April 2006; received in revised form 17 July 2006; accepted 18 July 2006 Available online 30 August 2006 Abstract Acidic aqueous solutions of clofibric acid (2-(4-chlorophenoxy)-2-methylpropionic acid), the bioactive metabolite of various lipid-reg- ulating drugs, have been degraded by indirect electrooxidation methods such as electro-Fenton and photoelectro-Fenton with Fe 2+ as catalyst using an undivided electrolytic cell with a Pt anode and an O 2 -diffusion cathode able to electrogenerate H 2 O 2 . At pH 3.0 about 80% of mineralization is achieved with the electro-Fenton method due to the efficient production of oxidant hydroxyl radical from Fenton’s reaction between Fe 2+ and H 2 O 2 , but stable Fe 3+ complexes are formed. The photoelectro-Fenton method favors the photo- decomposition of these species under UVA irradiation, reaching more than 96% of decontamination. The mineralization current effi- ciency increases with rising metabolite concentration up to saturation and with decreasing current density. The photoelectro-Fenton method is then viable for treating acidic wastewaters containing this pollutant. Comparative degradation by anodic oxidation (without Fe 2+ ) yields poor decontamination. Chloride ion is released during all degradation processes. The decay kinetics of clofibric acid always follows a pseudo-first-order reaction, with a similar rate constant in electro-Fenton and photoelectro-Fenton that increases with rising current density, but decreases at greater metabolite concentration. 4-Chlorophenol, 4-chlorocatechol, 4-chlororesorcinol, hydroquinone, p-benzoquinone and 1,2,4-benzenetriol, along with carboxylic acids such as 2-hydroxyisobutyric, tartronic, maleic, fumaric, formic and oxalic, are detected as intermediates. The ultimate product is oxalic acid, which forms very stable Fe 3+ -oxalato complexes under electro- Fenton conditions. These complexes are efficiently photodecarboxylated in photoelectro-Fenton under the action of UVA light. Ó 2006 Elsevier Ltd. All rights reserved. Keywords: Drug mineralization; Electro-Fenton; Photoelectro-Fenton; Catalysis; Water treatment 1. Introduction There is great interest in the environmental relevance of pharmaceutical drugs and their metabolites as emerging pol- lutants in waters (Daughton and Jones-Lepp, 2001; Ku ¨m- merer, 2001; Heberer, 2002; Kolpin et al., 2002; Heberer and Adam, 2004; Weigel et al., 2004; Tauxe-Wuersch et al., 2005). Different anti-inflammatories, analgesics, betablockers, lipid regulators, antimicrobials, antiepileptics and estrogens have been detected in sewage treatment plant effluents, surface and ground waters and even in drinking water at concentrations usually ranging from ng l 1 to lgl 1 . The sources of this pollution involve emission from production sites, direct disposal of overplus drugs in house- holds, excretion after drug administration to humans and animals, treatments throughout the water in fish and other animal farms and inadequate treatment of manufacturing waste. Among these compounds, clofibric acid (2-(4-chloro- phenoxy)-2-methylpropionic acid, 1) has long term persis- tence in the environment. It is the bioactive metabolite of clofibrate, etofibrate and etofyllineclofibrate, which are drugs widely used as blood lipid regulators with therapeutic doses of about 1–2 g d 1 per person, since they decrease the 0045-6535/$ - see front matter Ó 2006 Elsevier Ltd. All rights reserved. doi:10.1016/j.chemosphere.2006.07.039 * Corresponding author. Tel.: +34 93 4021223; fax: +34 93 4021231. E-mail address: [email protected] (E. Brillas). www.elsevier.com/locate/chemosphere Chemosphere 66 (2007) 1660–1669
-
Upload
independent -
Category
Documents
-
view
0 -
download
0
Transcript of Degradation of clofibric acid in acidic aqueous medium by electro-Fenton and photoelectro-Fenton
www.elsevier.com/locate/chemosphere
Chemosphere 66 (2007) 1660–1669
Degradation of clofibric acid in acidic aqueous mediumby electro-Fenton and photoelectro-Fenton
Ignasi Sires, Conchita Arias, Pere Lluıs Cabot, Francesc Centellas, Jose Antonio Garrido,Rosa Marıa Rodrıguez, Enric Brillas *
Laboratori d’Electroquımica dels Materials i del Medi Ambient, Departament de Quımica Fısica, Facultat de Quımica,
Universitat de Barcelona, Martı i Franques 1-11, 08028 Barcelona, Spain
Received 28 April 2006; received in revised form 17 July 2006; accepted 18 July 2006Available online 30 August 2006
Abstract
Acidic aqueous solutions of clofibric acid (2-(4-chlorophenoxy)-2-methylpropionic acid), the bioactive metabolite of various lipid-reg-ulating drugs, have been degraded by indirect electrooxidation methods such as electro-Fenton and photoelectro-Fenton with Fe2+ ascatalyst using an undivided electrolytic cell with a Pt anode and an O2-diffusion cathode able to electrogenerate H2O2. At pH 3.0 about80% of mineralization is achieved with the electro-Fenton method due to the efficient production of oxidant hydroxyl radical fromFenton’s reaction between Fe2+ and H2O2, but stable Fe3+ complexes are formed. The photoelectro-Fenton method favors the photo-decomposition of these species under UVA irradiation, reaching more than 96% of decontamination. The mineralization current effi-ciency increases with rising metabolite concentration up to saturation and with decreasing current density. The photoelectro-Fentonmethod is then viable for treating acidic wastewaters containing this pollutant. Comparative degradation by anodic oxidation (withoutFe2+) yields poor decontamination. Chloride ion is released during all degradation processes. The decay kinetics of clofibric acid alwaysfollows a pseudo-first-order reaction, with a similar rate constant in electro-Fenton and photoelectro-Fenton that increases with risingcurrent density, but decreases at greater metabolite concentration. 4-Chlorophenol, 4-chlorocatechol, 4-chlororesorcinol, hydroquinone,p-benzoquinone and 1,2,4-benzenetriol, along with carboxylic acids such as 2-hydroxyisobutyric, tartronic, maleic, fumaric, formic andoxalic, are detected as intermediates. The ultimate product is oxalic acid, which forms very stable Fe3+-oxalato complexes under electro-Fenton conditions. These complexes are efficiently photodecarboxylated in photoelectro-Fenton under the action of UVA light.� 2006 Elsevier Ltd. All rights reserved.
Keywords: Drug mineralization; Electro-Fenton; Photoelectro-Fenton; Catalysis; Water treatment
1. Introduction
There is great interest in the environmental relevance ofpharmaceutical drugs and their metabolites as emerging pol-lutants in waters (Daughton and Jones-Lepp, 2001; Kum-merer, 2001; Heberer, 2002; Kolpin et al., 2002; Hebererand Adam, 2004; Weigel et al., 2004; Tauxe-Wuerschet al., 2005). Different anti-inflammatories, analgesics,betablockers, lipid regulators, antimicrobials, antiepilepticsand estrogens have been detected in sewage treatment plant
0045-6535/$ - see front matter � 2006 Elsevier Ltd. All rights reserved.
doi:10.1016/j.chemosphere.2006.07.039
* Corresponding author. Tel.: +34 93 4021223; fax: +34 93 4021231.E-mail address: [email protected] (E. Brillas).
effluents, surface and ground waters and even in drinkingwater at concentrations usually ranging from ng l�1 tolg l�1. The sources of this pollution involve emission fromproduction sites, direct disposal of overplus drugs in house-holds, excretion after drug administration to humans andanimals, treatments throughout the water in fish and otheranimal farms and inadequate treatment of manufacturingwaste. Among these compounds, clofibric acid (2-(4-chloro-phenoxy)-2-methylpropionic acid, 1) has long term persis-tence in the environment. It is the bioactive metabolite ofclofibrate, etofibrate and etofyllineclofibrate, which aredrugs widely used as blood lipid regulators with therapeuticdoses of about 1–2 g d�1 per person, since they decrease the
I. Sires et al. / Chemosphere 66 (2007) 1660–1669 1661
plasmatic concentration of cholesterol and triglycerides(Buser et al., 1998; Tauxe-Wuersch et al., 2005). Concentra-tions of 1 up to 10 lg l�1 have been detected in sewage treat-ment plant influents and effluents and in rivers, lakes, NorthSea, ground and drinking waters (Heberer and Stan, 1997;Buser et al., 1998; Ternes, 1998; Tixier et al., 2003).
To avoid the potential adverse health effects of drugsand their metabolites as water pollutants on both humansand animals, research efforts are underway to develop effi-cient techniques for achieving their total destruction (Zwie-ner and Frimmel, 2000; Doll and Frimmel, 2004).However, 1 is poorly degraded by oxidation methods suchas ozonolysis (Ternes et al., 2002; Andreozzi et al., 2003),H2O2/UV (Andreozzi et al., 2003), sunlight and UV pho-tolysis (Packer et al., 2003) and TiO2/UV (Doll andFrimmel, 2004), as well as after application of different bio-logical and physico-chemical methods in sewage treatmentplants (Tauxe-Wuersch et al., 2005). More potent oxida-tion procedures are then needed to be applied to destroythis compound in wastewaters.
Recently, indirect electrooxidation methods such as elec-tro-Fenton and photoelectro-Fenton are being developedfor wastewater remediation. In these environmentally cleanelectrochemical techniques, hydrogen peroxide is continu-ously generated in an acidic contaminated solution fromthe two-electron reduction of O2 at reticulated vitreous car-bon (Xie and Li, 2006), mercury pool (Ventura et al.,2002), carbon-felt (Oturan et al., 1999; Gozmen et al.,2003; Hanna et al., 2005; Irmak et al., 2006) and O2-diffu-sion (Boye et al., 2002; Brillas et al., 2004a,b; Sires et al.,2006) cathodes:
O2 + 2Hþ+ 2e�!H2O2 ð1Þ
The oxidizing power of H2O2 is enhanced in the electro-Fenton method by adding small amounts of Fe2+ as cata-lyst to the acidic solution. Hydroxyl radical (�OH) and Fe3+
are then generated from the classical Fenton’s reactionbetween Fe2+ and H2O2 (Sun and Pignatello, 1993):
Fe2þ+ H2O2 ! Fe3þ+ �OH + OH� ð2Þ
Reaction (2) is propagated from Fe2+ regeneration,which mainly occurs by reduction of Fe3+ species at thecathode (Oturan et al., 1999). �OH acts as a non-selective,strong oxidant, with ability to react with organics yieldingdehydrogenated or hydroxylated derivatives until theiroverall mineralization (conversion into CO2, water andinorganic ions). In the photoelectro-Fenton process thesolution is irradiated with UVA light to favor: (i) the pho-todecomposition of complexes of Fe3+ with generated car-boxylic acids (Zuo and Hoigne, 1992; Brillas et al., 2004a,b;Sires et al., 2006) and (ii) the regeneration of Fe2+ fromadditional photoreduction of Fe(OH)2+, which is the pre-dominant Fe3+ species in acid medium (Sun and Pignatello,1993):
Fe(OH)2þ+ hm!Fe2þ+ �OH ð3Þ
Reaction (3) also enhances the production of �OH andhence, the mineralization of organics.
The electro-Fenton treatment of 100-ml solutions with1 mM of 1 and 2 mM Fe2+ in 0.01 M HCl has been previ-ously reported by Oturan et al. (1999), but these authorsonly described its decay kinetics and the detection of someinitial aromatic products. To show the possible viability ofthe electro-Fenton and photoelectro-Fenton methods toremove this metabolite in wastewaters, we have carriedout a detailed study on the degradation of acidic aqueoussolutions of 1 in the pH range 2.0–6.0 using 1.0 mM Fe2+
in both procedures. Comparative treatments in the absenceof this catalyst were also made to demonstrate the positiveoxidation action of �OH formed from reaction (2). Theeffect of current density and clofibric acid concentrationon the degradation process and current efficiency wasexplored. Aromatic products were identified by gas chro-matography–mass spectrometry (GC–MS). The decay of1 and the evolution of its by-products were followed bychromatographic techniques. The results obtained in thisstudy are reported herein.
2. Experimental
2.1. Chemicals
Clofibric acid (1), 4-chlorophenol (2), hydroquinone (3),4-chlororesorcinol (4), p-benzoquinone (6), 1,2,4-benzenet-riol (7), 2-hydroxyisobutyric acid (9), tartronic acid (10),maleic acid (11), fumaric acid (12), formic acid (13) andoxalic acid (14) were either reagent or analytical grade fromSigma-Aldrich, Merck, Panreac and Avocado. 4-Chloro-catechol (5) was synthesized by chlorination of pyrocate-chol with SO2Cl2 at room temperature, as reportedelsewhere (Boye et al., 2002). Analytical grade sulfuric acidwas purchased from Merck. Anhydrous sodium sulfateand heptahydrated ferrous sulfate were analytical gradefrom Fluka. All solutions were prepared with pure waterobtained from a Millipore Milli-Q system with resistivity>18 MX cm at 25 �C. Organic solvents and other chemicalsemployed were either HPLC or analytical grade fromPanreac.
2.2. Apparatus and analysis procedures
The solution pH was measured with a Crison 2000 pH-meter. Electrolyses were carried out at a constant currentdensity (j) of 33, 100 and 150 mA cm�2 with an Amel2053 potentiostat–galvanostat. All samples withdrawnfrom treated solutions were filtered with Whatman0.45 lm PTFE filters before analysis. The mineralizationof each solution of 1 was monitored by the abatement ofits total organic carbon (TOC), determined on a ShimadzuVCSN TOC analyzer. Reproducible TOC values wereobtained from analysis of 100-ll aliquots using the stan-dard non-purgeable organic carbon method. From thesedata, the mineralization current efficiency (MCE) for
1662 I. Sires et al. / Chemosphere 66 (2007) 1660–1669
electrolyzed solutions at a given time t was calculated asfollows:
MCE ¼DðTOCÞexp
DðTOCÞtheor
� 100 ð4Þ
where D(TOC)exp is the experimental TOC removal andD(TOC)theor is the theoretically calculated TOC decayassuming that the applied electrical charge (=current ·time) is only consumed in the mineralization process of 1.
The decay of 1 and the evolution of aromatic intermedi-ates were followed by reversed-phase chromatographyusing a Waters 600 HPLC liquid chromatograph fitted witha Spherisorb ODS2 5 lm, 150 · 4.6 mm (i.d.), column atroom temperature, and coupled with a Waters 996 photo-diode array detector, controlled through a Millennium-32�
program. For each compound, this detector was selected atthe maximum wavelength of its UV-absorption band.These analyses were made by injecting 20-ll aliquots intothe chromatograph and circulating a 50:47:3 (v/v/v) meth-anol/phosphate buffer (pH = 2.5)/pentanol mixture at1.0 ml min�1 as mobile phase. Generated carboxylic acidswere followed by ion-exclusion chromatography by inject-ing 20-ll samples into the above HPLC chromatographfitted with a Bio-Rad Aminex HPX 87 H, 300 · 7.8 mm(i.d.), column at 35 �C. For these measurements, the photo-diode detector was selected at 210 nm and the mobile phasewas 4 mM H2SO4 at 0.6 ml min�1. Cl� concentration inelectrolyzed solutions was determined by ion chromatogra-phy using a Shimadzu 10Avp HPLC chromatograph fittedwith a Shim-Pack IC-A1S, 100 · 4.6 mm (i.d.), anion col-umn at 40 �C and coupled with a Shimadzu CDD 10Avpconductivity detector. These measurements were carriedout with a 2.5 mM phtalic acid and 2.4 mM tris(hydroxy-methyl)aminomethane solution of pH 4.0 as mobile phaseat 1.5 ml min�1.
A 100 ml-solution with 179 mg l�1 of 1 of pH 3.0 waselectrolyzed at 100 mA cm�2 and at 35.0 �C by electro-Fenton with 1.0 mM Fe2+ for 2 min. The resulting organicswere extracted with 45 ml of CH2Cl2 in three times. Thecollected organic solution was dried with anhydrousNa2SO4, filtered and evaporated to about 2 ml. Theremaining products were separated and identified byGC–MS using a Hewlett-Packard 5890 Series II gas chro-matograph fitted with a HP-5 0.25 lm, 30 m · 0.25 mm(i.d.), column, and a Hewlett-Packard 5989 A massspectrophotometer operating in EI mode at 70 eV. Thetemperature ramp for this column was 35 �C for 2 min,10 �C min�1 up to 320 �C and hold time 5 min, and thetemperature of the inlet, transfer line and detector was250 �C, 250 �C and 290 �C, respectively. To identify thefinal carboxylic acids, the above solution was treated underthe same electro-Fenton conditions for 6 h. The resultingsolution was evaporated at low pressure and the remainingsolid was dissolved in 2 ml of ethanol. The esterified acidswere further analyzed by GC–MS using the gas chromato-graph fitted with a HP-INNOWax 0.25 lm, 30 m ·0.25 mm (i.d.), column. In this case the temperature ramp
was 35 �C for 2 min, 10 �C min�1 up to 250 �C and holdtime 15 min, and the temperature of the inlet, transfer lineand detector was always 250 �C.
2.3. Electrolytic system
All electrolyses were conducted in an open, undividedand thermostated cylindrical cell containing 100 ml of solu-tion stirred with a magnetic bar. The anode was a 3-cm2 Ptsheet of 99.99% purity from SEMPSA and the cathode wasa 3-cm2 carbon-PTFE electrode from E-TEK, which wasfed with pure O2 at 12 ml min�1 to generate continu-ously H2O2 from reaction (1). The electrolytic setup andthe preparation of the O2-diffusion cathode have beendescribed (Boye et al., 2002). For the experiments withUVA irradiation, a Philips 6 W fluorescent black light bluetube was placed at 7 cm above the solution. The tube emit-ted UVA light in the wavelength region between 300 and420 nm, with kmax = 360 nm, supplying a photoionizationenergy input to the solution of 140 lW cm�2, detected witha NRC 820 laser power meter working at 514 nm. Bothelectro-Fenton and photoelectro-Fenton treatments wereperformed after addition of 1.0 mM Fe2+ to the solution.All trials were carried out at 35.0 �C, which is the maxi-mum temperature to work with the open electrolytic cellwithout significant water evaporation from solution (Boyeet al., 2002).
3. Results and discussion
3.1. Comparative degradation
Comparative electrolyses at 100 mA cm�2 for 6 h wereinitially made for solutions containing 179 mg l�1 of 1
(equivalent to 100 mg l�1 of TOC) and 0.05 M Na2SO4
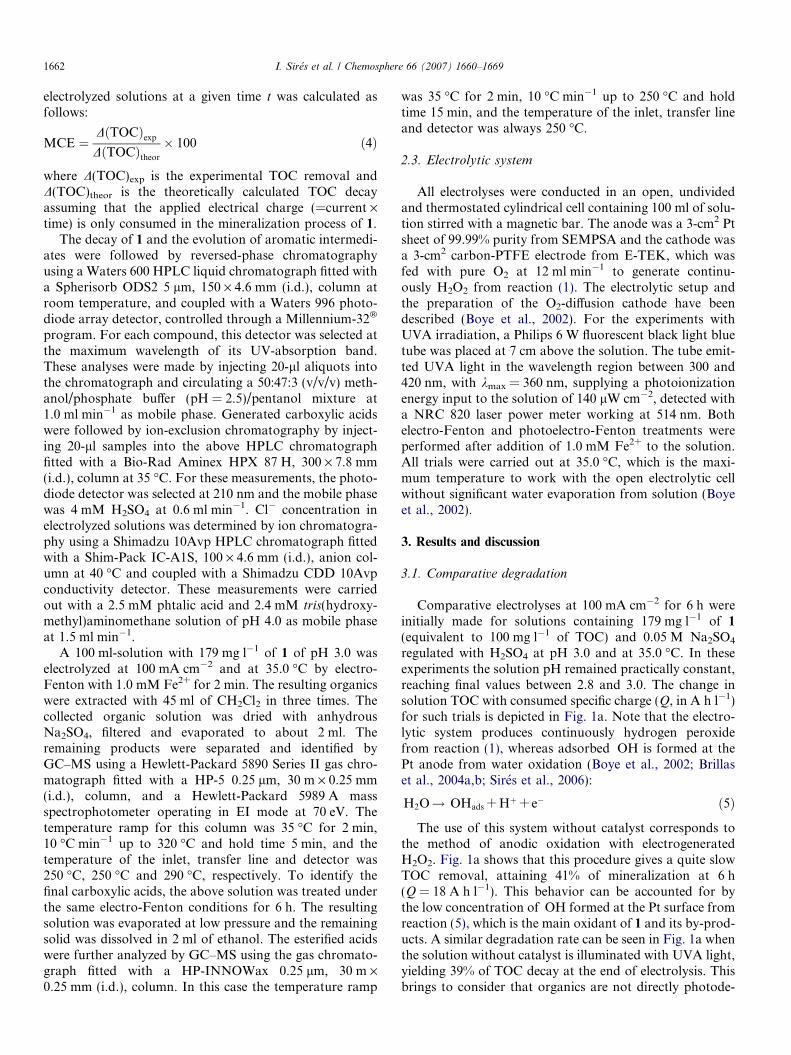
regulated with H2SO4 at pH 3.0 and at 35.0 �C. In theseexperiments the solution pH remained practically constant,reaching final values between 2.8 and 3.0. The change insolution TOC with consumed specific charge (Q, in A h l�1)for such trials is depicted in Fig. 1a. Note that the electro-lytic system produces continuously hydrogen peroxidefrom reaction (1), whereas adsorbed �OH is formed at thePt anode from water oxidation (Boye et al., 2002; Brillaset al., 2004a,b; Sires et al., 2006):
H2O! �OHads + Hþ+ e� ð5Þ
The use of this system without catalyst corresponds tothe method of anodic oxidation with electrogeneratedH2O2. Fig. 1a shows that this procedure gives a quite slowTOC removal, attaining 41% of mineralization at 6 h(Q = 18 A h l�1). This behavior can be accounted for bythe low concentration of �OH formed at the Pt surface fromreaction (5), which is the main oxidant of 1 and its by-prod-ucts. A similar degradation rate can be seen in Fig. 1a whenthe solution without catalyst is illuminated with UVA light,yielding 39% of TOC decay at the end of electrolysis. Thisbrings to consider that organics are not directly photode-
0
20
40
60
80
100
120T
OC
/ m
gl-1
0
5
10
15
20
25
0 3 6 9 12 15 18 21
[Cl–
] / m
gl-1
Q / A h l-1
a
b
Fig. 1. (a) Total organic carbon and (b) concentration of accumulatedchloride ion vs. specific charge for the degradation of 100-ml solutionswith 179 mg l�1 clofibric acid (1) and 0.05 M Na2SO4 of pH 3.0 at100 mA cm�2 and at 35.0 �C using an undivided cell with a 3-cm2 Pt anodeand a 3-cm2 carbon-PTFE O2-diffusion cathode. Method: (d) anodicoxidation with electrogenerated H2O2; (j) anodic oxidation with electro-generated H2O2 under a 6-W UVA irradiation with kmax = 360 nm; (m)electro-Fenton with 1.0 mM Fe2+ in the solution; (r) photoelectro-Fenton with 1.0 mM Fe2+ and UVA light.
I. Sires et al. / Chemosphere 66 (2007) 1660–1669 1663
composed by UVA light. A different behavior can beobserved in Fig. 1a when 1.0 mM Fe2+ is added as catalyst.For the electro-Fenton process, TOC is rapidly reduced by79% at 6 h due to the fast reaction of organics with the greatamounts of �OH produced from Fenton’s reaction (2). Incontrast, the photoelectro-Fenton process leads to quickerTOC decay with almost overall mineralization (>96%TOC removal) at the end of electrolysis. This trend can berelated to: (i) the rapid photolysis of some stable complexesof Fe3+ with generated carboxylic acids under electro-Fen-ton conditions (Zuo and Hoigne, 1992; Brillas et al., 2004a;Sires et al., 2006) and/or (ii) the enhanced generation of �OHfrom additional photoreduction of Fe(OH)2+ from reaction(3). Note that the starting pale yellow solution changed topale orange color at the end of both electro-Fenton andphotoelectro-Fenton degradations. This is indicative ofthe formation of soluble colored polyaromatics in smallextent, which can be not be destroyed by oxidant �OH pro-duced by reactions (2), (3) and (5).
Mineralization of 1 is accompanied by its overall dechlo-rination. Ion chromatograms for the above treated solu-tions only displayed a defined peak related to Cl� ion. Noother chlorine–oxygen ions such as ClO�3 and ClO�4 weredetected by this technique. Fig. 1b shows a gradual accumu-lation of Cl� up to 23 mg l�1 for 4 h (Q = 12 A h l�1) byanodic oxidation with electrogenerated H2O2, whereas forelectro-Fenton and photoelectro-Fenton, a Cl� concentra-tion of about 25 mg l�1 is already attained at 40 min
(Q = 2 A h l�1), whereupon it undergoes a slight drop dueto its oxidation to Cl2 at the Pt anode. These findings indi-cate that chloro-organics are always degraded with releaseof Cl�, although they are much more rapidly destroyed inthe two last methods. However, all procedures only leadto the release of 78–85% of the initial chlorine content of1 (29.5 mg l�1), suggesting that stable colored polyaromat-ics formed during degradation contain the remainingchlorine.
These results indicate that electro-Fenton only yieldspartial decontamination of 1, whereas this pollutant canbe almost completely mineralized by photoelectro-Fenton.For this last technique, the effect of pH, current density andmetabolite concentration on its oxidizing power was inves-tigated to clarify its optimum operative conditions.
3.2. Effect of experimental parameters on the
photoelectro-Fenton process
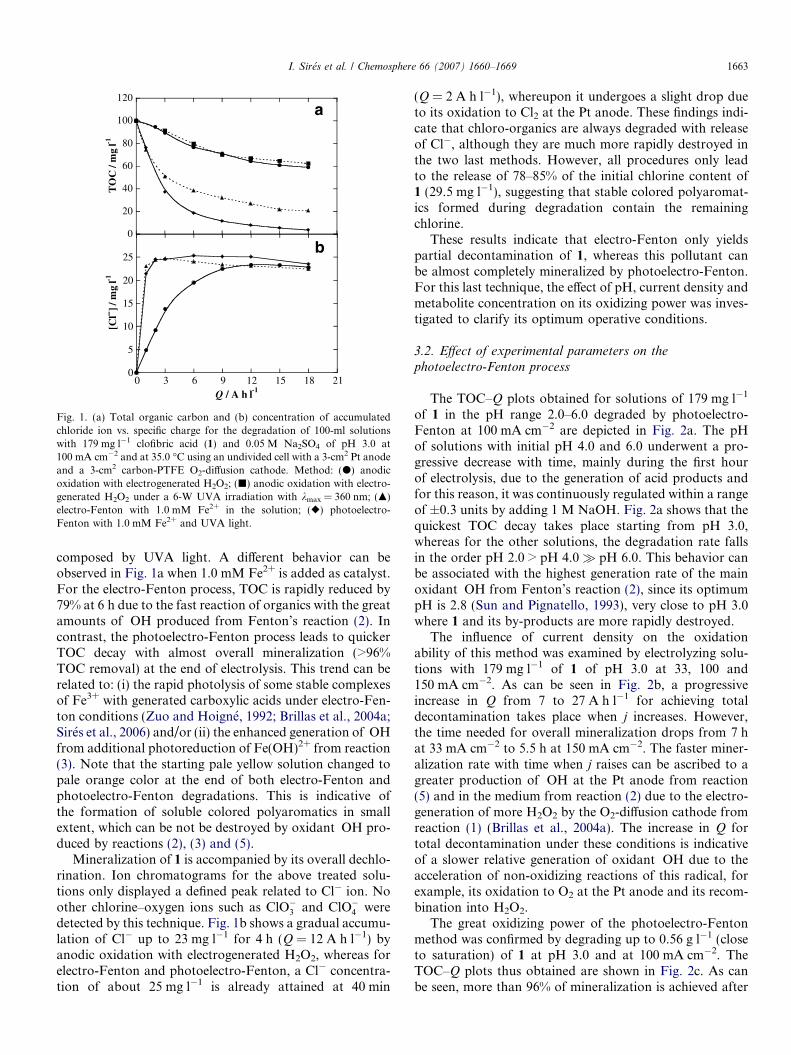
The TOC–Q plots obtained for solutions of 179 mg l�1
of 1 in the pH range 2.0–6.0 degraded by photoelectro-Fenton at 100 mA cm�2 are depicted in Fig. 2a. The pHof solutions with initial pH 4.0 and 6.0 underwent a pro-gressive decrease with time, mainly during the first hourof electrolysis, due to the generation of acid products andfor this reason, it was continuously regulated within a rangeof ±0.3 units by adding 1 M NaOH. Fig. 2a shows that thequickest TOC decay takes place starting from pH 3.0,whereas for the other solutions, the degradation rate fallsin the order pH 2.0 > pH 4.0� pH 6.0. This behavior canbe associated with the highest generation rate of the mainoxidant �OH from Fenton’s reaction (2), since its optimumpH is 2.8 (Sun and Pignatello, 1993), very close to pH 3.0where 1 and its by-products are more rapidly destroyed.
The influence of current density on the oxidationability of this method was examined by electrolyzing solu-tions with 179 mg l�1 of 1 of pH 3.0 at 33, 100 and150 mA cm�2. As can be seen in Fig. 2b, a progressiveincrease in Q from 7 to 27 A h l�1 for achieving totaldecontamination takes place when j increases. However,the time needed for overall mineralization drops from 7 hat 33 mA cm�2 to 5.5 h at 150 mA cm�2. The faster miner-alization rate with time when j raises can be ascribed to agreater production of �OH at the Pt anode from reaction(5) and in the medium from reaction (2) due to the electro-generation of more H2O2 by the O2-diffusion cathode fromreaction (1) (Brillas et al., 2004a). The increase in Q fortotal decontamination under these conditions is indicativeof a slower relative generation of oxidant �OH due to theacceleration of non-oxidizing reactions of this radical, forexample, its oxidation to O2 at the Pt anode and its recom-bination into H2O2.
The great oxidizing power of the photoelectro-Fentonmethod was confirmed by degrading up to 0.56 g l�1 (closeto saturation) of 1 at pH 3.0 and at 100 mA cm�2. TheTOC–Q plots thus obtained are shown in Fig. 2c. As canbe seen, more than 96% of mineralization is achieved after
TO
C /
mg
l-1
0
50
100
150
200
250
300
0 3 6 9 12 15 18 21 24 27 30 33Q / A h l-1
0
20
40
60
80
100
0
20
40
60
80
100
120
a
b
c
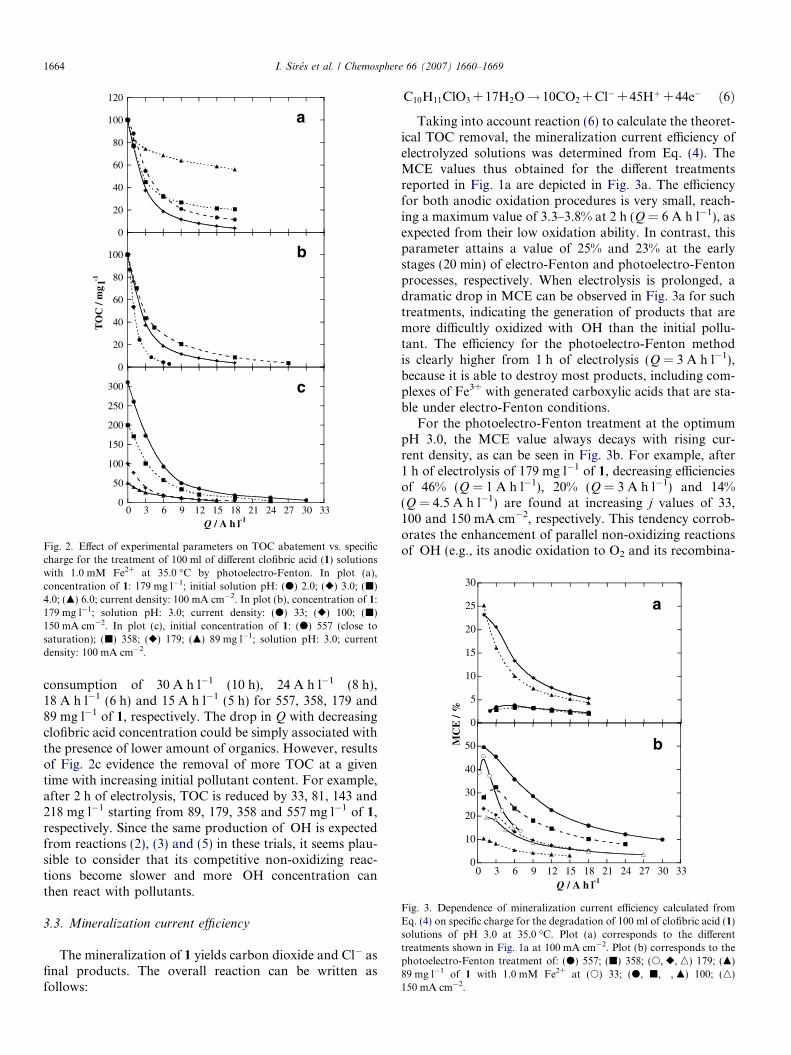
Fig. 2. Effect of experimental parameters on TOC abatement vs. specificcharge for the treatment of 100 ml of different clofibric acid (1) solutionswith 1.0 mM Fe2+ at 35.0 �C by photoelectro-Fenton. In plot (a),concentration of 1: 179 mg l�1; initial solution pH: (d) 2.0; (r) 3.0; (j)4.0; (m) 6.0; current density: 100 mA cm�2. In plot (b), concentration of 1:179 mg l�1; solution pH: 3.0; current density: (d) 33; (r) 100; (j)150 mA cm�2. In plot (c), initial concentration of 1: (d) 557 (close tosaturation); (j) 358; (r) 179; (m) 89 mg l�1; solution pH: 3.0; currentdensity: 100 mA cm�2.
MC
E /
%
0
10
20
30
40
50
0 3 6 9 12 15 18 21 24 27 30 33Q / A h l-1
0
5
10
15
20
25
30
a
b
Fig. 3. Dependence of mineralization current efficiency calculated fromEq. (4) on specific charge for the degradation of 100 ml of clofibric acid (1)solutions of pH 3.0 at 35.0 �C. Plot (a) corresponds to the differenttreatments shown in Fig. 1a at 100 mA cm�2. Plot (b) corresponds to thephotoelectro-Fenton treatment of: (d) 557; (j) 358; (s, r, n) 179; (m)89 mg l�1 of 1 with 1.0 mM Fe2+ at (s) 33; (d, j, �, m) 100; (n)150 mA cm�2.
1664 I. Sires et al. / Chemosphere 66 (2007) 1660–1669
consumption of 30 A h l�1 (10 h), 24 A h l�1 (8 h),18 A h l�1 (6 h) and 15 A h l�1 (5 h) for 557, 358, 179 and89 mg l�1 of 1, respectively. The drop in Q with decreasingclofibric acid concentration could be simply associated withthe presence of lower amount of organics. However, resultsof Fig. 2c evidence the removal of more TOC at a giventime with increasing initial pollutant content. For example,after 2 h of electrolysis, TOC is reduced by 33, 81, 143 and218 mg l�1 starting from 89, 179, 358 and 557 mg l�1 of 1,respectively. Since the same production of �OH is expectedfrom reactions (2), (3) and (5) in these trials, it seems plau-sible to consider that its competitive non-oxidizing reac-tions become slower and more �OH concentration canthen react with pollutants.
3.3. Mineralization current efficiency
The mineralization of 1 yields carbon dioxide and Cl� asfinal products. The overall reaction can be written asfollows:
C10H11ClO3 + 17H2O! 10CO2 + Cl�+ 45Hþ+ 44e� ð6Þ
Taking into account reaction (6) to calculate the theoret-ical TOC removal, the mineralization current efficiency ofelectrolyzed solutions was determined from Eq. (4). TheMCE values thus obtained for the different treatmentsreported in Fig. 1a are depicted in Fig. 3a. The efficiencyfor both anodic oxidation procedures is very small, reach-ing a maximum value of 3.3–3.8% at 2 h (Q = 6 A h l�1), asexpected from their low oxidation ability. In contrast, thisparameter attains a value of 25% and 23% at the earlystages (20 min) of electro-Fenton and photoelectro-Fentonprocesses, respectively. When electrolysis is prolonged, adramatic drop in MCE can be observed in Fig. 3a for suchtreatments, indicating the generation of products that aremore difficultly oxidized with �OH than the initial pollu-tant. The efficiency for the photoelectro-Fenton methodis clearly higher from 1 h of electrolysis (Q = 3 A h l�1),because it is able to destroy most products, including com-plexes of Fe3+ with generated carboxylic acids that are sta-ble under electro-Fenton conditions.
For the photoelectro-Fenton treatment at the optimumpH 3.0, the MCE value always decays with rising cur-rent density, as can be seen in Fig. 3b. For example, after1 h of electrolysis of 179 mg l�1 of 1, decreasing efficienciesof 46% (Q = 1 A h l�1), 20% (Q = 3 A h l�1) and 14%(Q = 4.5 A h l�1) are found at increasing j values of 33,100 and 150 mA cm�2, respectively. This tendency corrob-orates the enhancement of parallel non-oxidizing reactionsof �OH (e.g., its anodic oxidation to O2 and its recombina-
[clo
fibr
ic a
cid]
/ m
g l-1
0
40
80
120
160
200
0 60 120 180 240 300
time / min
ln
0
1
2
3
4
0 30 60 90 120 150
0
100
200
300
400
500
600
0 4 8 12 16 20time / min
time / min
ln(c
0 / c
)
0
1
2
3
4
0 2 4 6 8 10 12
a
b
(c0 / c
)
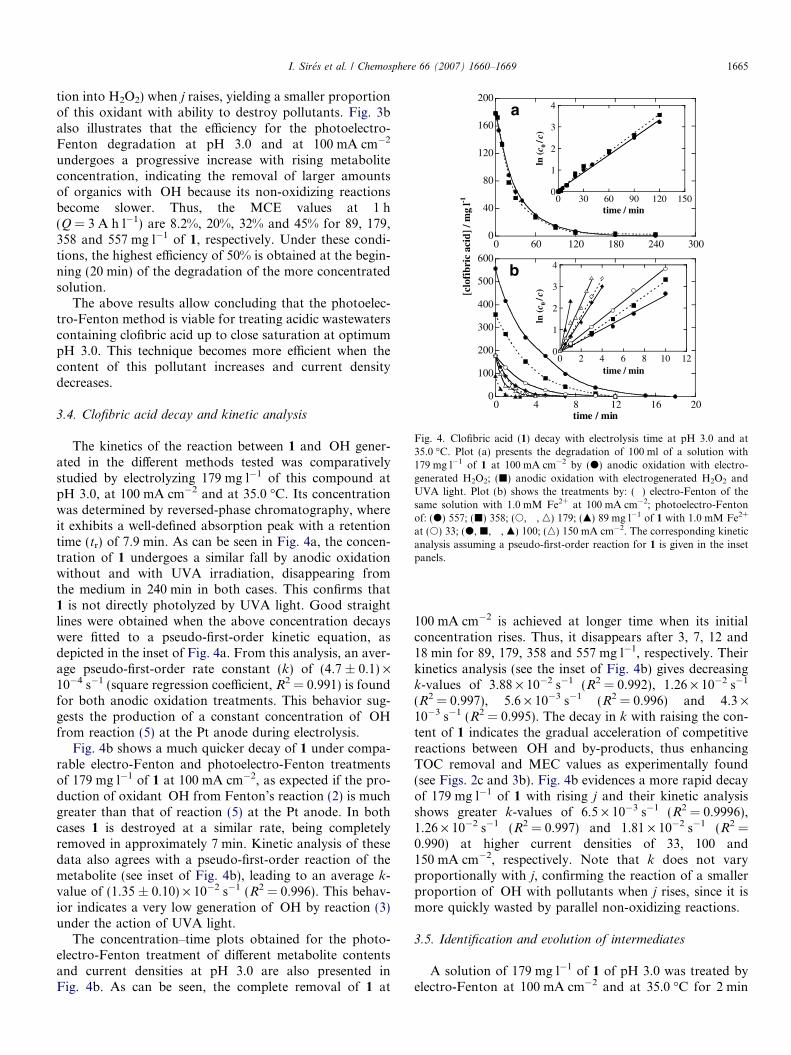
Fig. 4. Clofibric acid (1) decay with electrolysis time at pH 3.0 and at35.0 �C. Plot (a) presents the degradation of 100 ml of a solution with179 mg l�1 of 1 at 100 mA cm�2 by (d) anodic oxidation with electro-generated H2O2; (j) anodic oxidation with electrogenerated H2O2 andUVA light. Plot (b) shows the treatments by: (�) electro-Fenton of thesame solution with 1.0 mM Fe2+ at 100 mA cm�2; photoelectro-Fentonof: (d) 557; (j) 358; (s, �, n) 179; (m) 89 mg l�1 of 1 with 1.0 mM Fe2+
at (s) 33; (d, j, �, m) 100; (n) 150 mA cm�2. The corresponding kineticanalysis assuming a pseudo-first-order reaction for 1 is given in the insetpanels.
I. Sires et al. / Chemosphere 66 (2007) 1660–1669 1665
tion into H2O2) when j raises, yielding a smaller proportionof this oxidant with ability to destroy pollutants. Fig. 3balso illustrates that the efficiency for the photoelectro-Fenton degradation at pH 3.0 and at 100 mA cm�2
undergoes a progressive increase with rising metaboliteconcentration, indicating the removal of larger amountsof organics with �OH because its non-oxidizing reactionsbecome slower. Thus, the MCE values at 1 h(Q = 3 A h l�1) are 8.2%, 20%, 32% and 45% for 89, 179,358 and 557 mg l�1 of 1, respectively. Under these condi-tions, the highest efficiency of 50% is obtained at the begin-ning (20 min) of the degradation of the more concentratedsolution.
The above results allow concluding that the photoelec-tro-Fenton method is viable for treating acidic wastewaterscontaining clofibric acid up to close saturation at optimumpH 3.0. This technique becomes more efficient when thecontent of this pollutant increases and current densitydecreases.
3.4. Clofibric acid decay and kinetic analysis
The kinetics of the reaction between 1 and �OH gener-ated in the different methods tested was comparativelystudied by electrolyzing 179 mg l�1 of this compound atpH 3.0, at 100 mA cm�2 and at 35.0 �C. Its concentrationwas determined by reversed-phase chromatography, whereit exhibits a well-defined absorption peak with a retentiontime (tr) of 7.9 min. As can be seen in Fig. 4a, the concen-tration of 1 undergoes a similar fall by anodic oxidationwithout and with UVA irradiation, disappearing fromthe medium in 240 min in both cases. This confirms that1 is not directly photolyzed by UVA light. Good straightlines were obtained when the above concentration decayswere fitted to a pseudo-first-order kinetic equation, asdepicted in the inset of Fig. 4a. From this analysis, an aver-age pseudo-first-order rate constant (k) of (4.7 ± 0.1) ·10�4 s�1 (square regression coefficient, R2 = 0.991) is foundfor both anodic oxidation treatments. This behavior sug-gests the production of a constant concentration of �OHfrom reaction (5) at the Pt anode during electrolysis.
Fig. 4b shows a much quicker decay of 1 under compa-rable electro-Fenton and photoelectro-Fenton treatmentsof 179 mg l�1 of 1 at 100 mA cm�2, as expected if the pro-duction of oxidant �OH from Fenton’s reaction (2) is muchgreater than that of reaction (5) at the Pt anode. In bothcases 1 is destroyed at a similar rate, being completelyremoved in approximately 7 min. Kinetic analysis of thesedata also agrees with a pseudo-first-order reaction of themetabolite (see inset of Fig. 4b), leading to an average k-value of (1.35 ± 0.10) · 10�2 s�1 (R2 = 0.996). This behav-ior indicates a very low generation of �OH by reaction (3)under the action of UVA light.
The concentration–time plots obtained for the photo-electro-Fenton treatment of different metabolite contentsand current densities at pH 3.0 are also presented inFig. 4b. As can be seen, the complete removal of 1 at
100 mA cm�2 is achieved at longer time when its initialconcentration rises. Thus, it disappears after 3, 7, 12 and18 min for 89, 179, 358 and 557 mg l�1, respectively. Theirkinetics analysis (see the inset of Fig. 4b) gives decreasingk-values of 3.88 · 10�2 s�1 (R2 = 0.992), 1.26 · 10�2 s�1
(R2 = 0.997), 5.6 · 10�3 s�1 (R2 = 0.996) and 4.3 ·10�3 s�1 (R2 = 0.995). The decay in k with raising the con-tent of 1 indicates the gradual acceleration of competitivereactions between �OH and by-products, thus enhancingTOC removal and MEC values as experimentally found(see Figs. 2c and 3b). Fig. 4b evidences a more rapid decayof 179 mg l�1 of 1 with rising j and their kinetic analysisshows greater k-values of 6.5 · 10�3 s�1 (R2 = 0.9996),1.26 · 10�2 s�1 (R2 = 0.997) and 1.81 · 10�2 s�1 (R2 =0.990) at higher current densities of 33, 100 and150 mA cm�2, respectively. Note that k does not varyproportionally with j, confirming the reaction of a smallerproportion of �OH with pollutants when j rises, since it ismore quickly wasted by parallel non-oxidizing reactions.
3.5. Identification and evolution of intermediates
A solution of 179 mg l�1 of 1 of pH 3.0 was treated byelectro-Fenton at 100 mA cm�2 and at 35.0 �C for 2 min
conc
entr
atio
n/ m
g l-1
0
1
2
3
4
5
0 60 120 180 240 300 360 420
0
1
2
3
4
5
6
7
8
0 2 4 6 8 10 12 14time / min
a
b
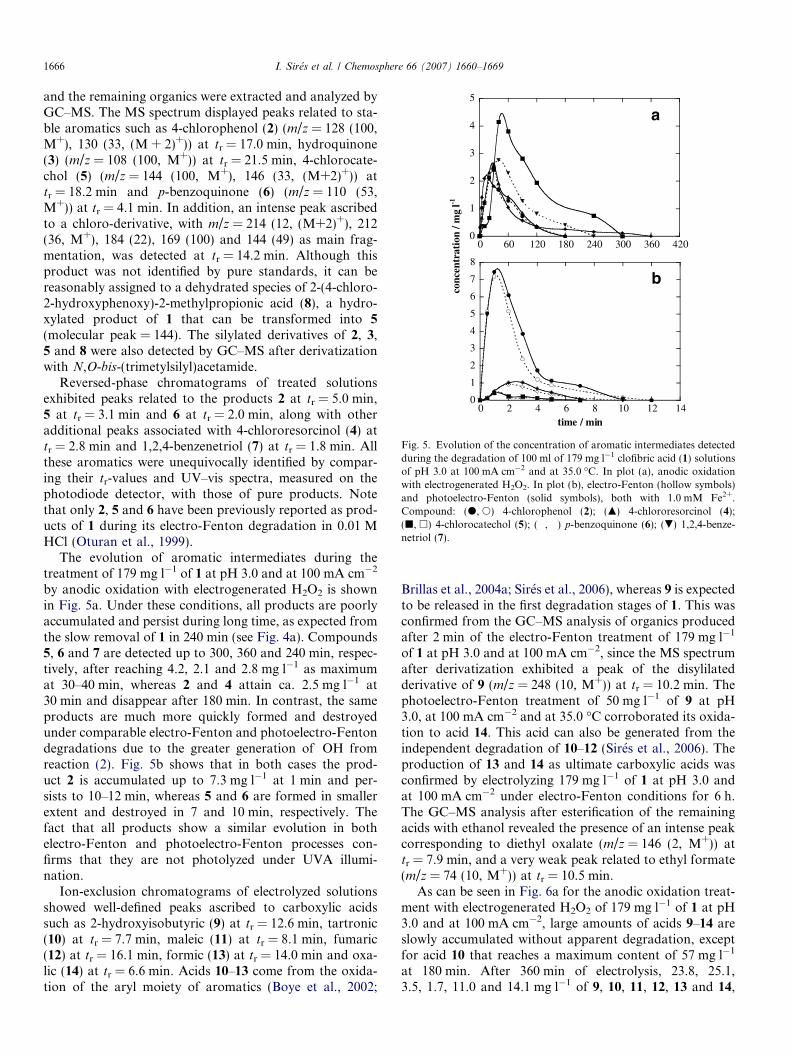
Fig. 5. Evolution of the concentration of aromatic intermediates detectedduring the degradation of 100 ml of 179 mg l�1 clofibric acid (1) solutionsof pH 3.0 at 100 mA cm�2 and at 35.0 �C. In plot (a), anodic oxidationwith electrogenerated H2O2. In plot (b), electro-Fenton (hollow symbols)and photoelectro-Fenton (solid symbols), both with 1.0 mM Fe2+.Compound: (d, s) 4-chlorophenol (2); (m) 4-chlororesorcinol (4);(j, h) 4-chlorocatechol (5); (�, �) p-benzoquinone (6); (.) 1,2,4-benze-netriol (7).
1666 I. Sires et al. / Chemosphere 66 (2007) 1660–1669
and the remaining organics were extracted and analyzed byGC–MS. The MS spectrum displayed peaks related to sta-ble aromatics such as 4-chlorophenol (2) (m/z = 128 (100,M+), 130 (33, (M + 2)+)) at tr = 17.0 min, hydroquinone(3) (m/z = 108 (100, M+)) at tr = 21.5 min, 4-chlorocate-chol (5) (m/z = 144 (100, M+), 146 (33, (M+2)+)) attr = 18.2 min and p-benzoquinone (6) (m/z = 110 (53,M+)) at tr = 4.1 min. In addition, an intense peak ascribedto a chloro-derivative, with m/z = 214 (12, (M+2)+), 212(36, M+), 184 (22), 169 (100) and 144 (49) as main frag-mentation, was detected at tr = 14.2 min. Although thisproduct was not identified by pure standards, it can bereasonably assigned to a dehydrated species of 2-(4-chloro-2-hydroxyphenoxy)-2-methylpropionic acid (8), a hydro-xylated product of 1 that can be transformed into 5
(molecular peak = 144). The silylated derivatives of 2, 3,5 and 8 were also detected by GC–MS after derivatizationwith N,O-bis-(trimetylsilyl)acetamide.
Reversed-phase chromatograms of treated solutionsexhibited peaks related to the products 2 at tr = 5.0 min,5 at tr = 3.1 min and 6 at tr = 2.0 min, along with otheradditional peaks associated with 4-chlororesorcinol (4) attr = 2.8 min and 1,2,4-benzenetriol (7) at tr = 1.8 min. Allthese aromatics were unequivocally identified by compar-ing their tr-values and UV–vis spectra, measured on thephotodiode detector, with those of pure products. Notethat only 2, 5 and 6 have been previously reported as prod-ucts of 1 during its electro-Fenton degradation in 0.01 MHCl (Oturan et al., 1999).
The evolution of aromatic intermediates during thetreatment of 179 mg l�1 of 1 at pH 3.0 and at 100 mA cm�2
by anodic oxidation with electrogenerated H2O2 is shownin Fig. 5a. Under these conditions, all products are poorlyaccumulated and persist during long time, as expected fromthe slow removal of 1 in 240 min (see Fig. 4a). Compounds5, 6 and 7 are detected up to 300, 360 and 240 min, respec-tively, after reaching 4.2, 2.1 and 2.8 mg l�1 as maximumat 30–40 min, whereas 2 and 4 attain ca. 2.5 mg l�1 at30 min and disappear after 180 min. In contrast, the sameproducts are much more quickly formed and destroyedunder comparable electro-Fenton and photoelectro-Fentondegradations due to the greater generation of �OH fromreaction (2). Fig. 5b shows that in both cases the prod-uct 2 is accumulated up to 7.3 mg l�1 at 1 min and per-sists to 10–12 min, whereas 5 and 6 are formed in smallerextent and destroyed in 7 and 10 min, respectively. Thefact that all products show a similar evolution in bothelectro-Fenton and photoelectro-Fenton processes con-firms that they are not photolyzed under UVA illumi-nation.
Ion-exclusion chromatograms of electrolyzed solutionsshowed well-defined peaks ascribed to carboxylic acidssuch as 2-hydroxyisobutyric (9) at tr = 12.6 min, tartronic(10) at tr = 7.7 min, maleic (11) at tr = 8.1 min, fumaric(12) at tr = 16.1 min, formic (13) at tr = 14.0 min and oxa-lic (14) at tr = 6.6 min. Acids 10–13 come from the oxida-tion of the aryl moiety of aromatics (Boye et al., 2002;
Brillas et al., 2004a; Sires et al., 2006), whereas 9 is expectedto be released in the first degradation stages of 1. This wasconfirmed from the GC–MS analysis of organics producedafter 2 min of the electro-Fenton treatment of 179 mg l�1
of 1 at pH 3.0 and at 100 mA cm�2, since the MS spectrumafter derivatization exhibited a peak of the disylilatedderivative of 9 (m/z = 248 (10, M+)) at tr = 10.2 min. Thephotoelectro-Fenton treatment of 50 mg l�1 of 9 at pH3.0, at 100 mA cm�2 and at 35.0 �C corroborated its oxida-tion to acid 14. This acid can also be generated from theindependent degradation of 10–12 (Sires et al., 2006). Theproduction of 13 and 14 as ultimate carboxylic acids wasconfirmed by electrolyzing 179 mg l�1 of 1 at pH 3.0 andat 100 mA cm�2 under electro-Fenton conditions for 6 h.The GC–MS analysis after esterification of the remainingacids with ethanol revealed the presence of an intense peakcorresponding to diethyl oxalate (m/z = 146 (2, M+)) attr = 7.9 min, and a very weak peak related to ethyl formate(m/z = 74 (10, M+)) at tr = 10.5 min.
As can be seen in Fig. 6a for the anodic oxidation treat-ment with electrogenerated H2O2 of 179 mg l�1 of 1 at pH3.0 and at 100 mA cm�2, large amounts of acids 9–14 areslowly accumulated without apparent degradation, exceptfor acid 10 that reaches a maximum content of 57 mg l�1
at 180 min. After 360 min of electrolysis, 23.8, 25.1,3.5, 1.7, 11.0 and 14.1 mg l�1 of 9, 10, 11, 12, 13 and 14,
0
10
20
30
40
50
60
0
10
20
30
40
50
60
70
80
0 60 120 180 240 300 360 420time / min
conc
entr
atio
n / m
g l-1
a
b
Fig. 6. Time-course of the concentration of carboxylic acids detectedunder the same conditions as in Fig. 5. In plot (a), anodic oxidation withelectrogenerated H2O2. In plot (b), electro-Fenton (hollow symbols) andphotoelectro-Fenton (solid symbols), both with 1.0 mM Fe2+. Compound:(�) 2-hydroxyisobutyric acid (9); ( ) tartronic acid (10); (m) maleic acid(11); (j) fumaric acid (12); (.) formic acid (13); (d, s) oxalic acid (14).Concentrations of 9 and 13 in photoelectro-Fenton were determined at33 mA cm�2.
I. Sires et al. / Chemosphere 66 (2007) 1660–1669 1667
respectively, corresponding to 11.0, 7.5, 1.5, 0.7, 2.9 and3.8 mg l�1 of TOC, are found. This balance indicates
O
Cl
OH
Cl
Cl
OH
OH
OH
OHCOOHCH3C
CH3
OH
COOHCH3C
CH3
Cl
OH
OH
O
Cl
COOHCH3C
CH3
OH
OH
- Cl–
OH
1
9
2 4
5
3
OH
8
OH
OH
Fig. 7. Proposed reaction pathway for clofibric acid (1) degradation in acidic aFe2+ as catalyst.
that all detected carboxylic acids give 27 mg l�1 of solubleTOC, a value much lower than 59 mg l�1 determined forthe final degraded solution (see Fig. 1a). That means thatthis solution contains high contents of undetected prod-ucts, probably hardly oxidizable aromatics.
A very different behavior is found for carboxylic acids inthe electro-Fenton and photoelectro-Fenton processes ofthe above solution of 1. These products are rapidlydegraded by both treatments at 100 mA cm�2, so that onlythe ultimate acid 14 is largely accumulated (see Fig. 6b),although less than 0.1 mg l�1 of acid 13 is also detectedat the end of electro-Fenton. Fig. 6b illustrates that 9
and 13 persist in large extent to ca. 60 min when smalleramount of �OH is produced by photoelectro-Fenton at33 mA cm�2. In both methods complexes of acid 14 withFe3+ generated from reaction (2) are expected to be formed(Zuo and Hoigne, 1992). These Fe3+-oxalato complexes aredifficulty oxidized with �OH in electro-Fenton, remainingca. 60 mg l�1 of 14, corresponding to 16 mg l�1 of TOC,at 360 min (see Fig. 6b). Since the resulting solution con-tains 21 mg l�1 of TOC (see Fig. 1a), one can conclude thatthe stable colored chlorinated polyaromatics formed yieldabout 5 mg l�1 of TOC. In contrast, Fig. 6b shows thecomplete mineralization of acid 14 in photoelectro-Fenton,because Fe3+-oxalato complexes are efficiently photode-carboxylated under the action of UVA light (Zuo andHoigne, 1992). The remaining solution TOC (<4 mg l�1,Fig. 1a) can then be ascribed to the stable coloredchlorinated polyaromatics generated during degradationof 1.
O
O
OH
OHOH
COOH
COOH
COOH
COOH
COOH
COOH
CHOH
COOH
Fe3+ -Fe2+
HCOOH
- Cl–
HOOC+
+
+
OH
- Cl–OH
OH
CO2
Fe3+-oxalatocomplexes
hν
OH
6
7
14
13
10
11
12
OH
OH
OH
OH
OH
OH
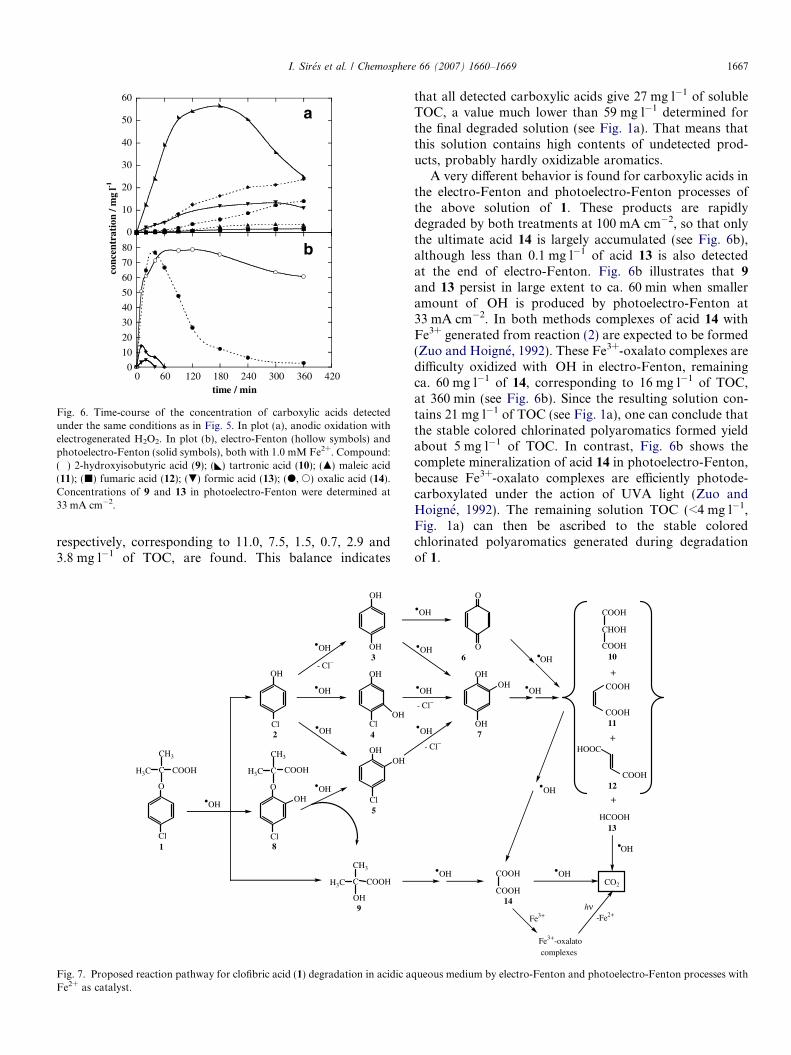
queous medium by electro-Fenton and photoelectro-Fenton processes with

1668 I. Sires et al. / Chemosphere 66 (2007) 1660–1669
3.6. Proposed degradation pathway
Fig. 7 presents a plausible pathway for the degradationof 1 by the electro-Fenton and photoelectro-Fenton pro-cesses with Fe2+ as catalyst. The sequence involves allintermediates detected in this work, including those thatare only identified in anodic oxidation with electrogener-ated H2O2 since they are quickly destroyed, without accu-mulation, in the above methods. Electrogenerated �OH isstated as the main oxidant and the possible parallel oxida-tion of complexes of Fe3+ with other products containingOH groups, different from acid 14, is not indicated for sakeof simplicity.
The process is initiated either by the breaking of theC(1)–O bond of clofibric acid to form the phenol 2 withloss of acid 9, or the direct hydroxylation on its C(2)-posi-tion to give 8. Further parallel attack of �OH on the C(4)-,C(3)- and C(2)-positions of 2 yields the benzenediols 3,with release of Cl� ion, 4 and 5, respectively. Product 5
is also formed from the oxidation of 8 with loss of acid9. The subsequent hydroxylation with dechlorination of 4
and 5 leads to the benzenetriol 7. This product is alsoformed from �OH attack on 3, which is oxidized in parallelto 6. Further degradation of 6 and 7 leads to a mixture ofacids 10, 11, 12 and 13. The latter acid is directly mineral-ized to CO2, whereas the three former ones are indepen-dently transformed into acid 14, which is also generatedfrom the oxidation of 9. The ultimate carboxylic acid 14
is very slowly converted into CO2 by �OH since it formsvery stable Fe3+-oxalato complexes under electro-Fentonconditions. These species can be photodecarboxylated withloss of Fe2+ under the action of UVA light (Zuo andHoigne, 1992).
4. Conclusions
It has been demonstrated that the photoelectro-Fentonmethod with Fe2+ and UVA light as catalysts is able tomineralize more than 96% of 1 in aqueous medium of pH3.0. Its efficiency rises with increasing metabolite contentand with decreasing j. This procedure is then viable fortreating acidic wastewaters containing this pollutant. Incontrast, the electro-Fenton method only yields about80% of decontamination due to the formation of productshardly oxidizable with �OH, which is mainly formed fromreaction (2). Comparative treatment by anodic oxidationwith electrogenerated H2O2 confirms that �OH is producedin much smaller extent at the Pt anode from water oxida-tion. Cl� ion is released during mineralization. The decayof 1 always follows a pseudo-first-order kinetics with simi-lar rate constant for electro-Fenton and photoelectro-Fenton. Aromatic products and generated carboxylic acidshave been identified by GC–MS. From their quantificationby HPLC chromatography, the different oxidation abilityof both methods can be explained from the behavior ofacid 14. This acid forms very stable Fe3+-oxalato com-plexes under electro-Fenton conditions, which can be effi-
ciently photolyzed to CO2 in photoelectro-Fenton underthe action of UVA light.
Acknowledgements
The authors thank the financial support from MEC(Ministerio de Educacion y Ciencia, Spain) under projectCTQ2004-01954/BQU and the grant given to I. Sires byDURSI (Departament d’Universitats, Recerca i Societatde la Informacio, Generalitat de Catalunya) to do thiswork.
References
Andreozzi, R., Caprio, V., Marotta, R., Radovnikovic, A., 2003.Ozonation and H2O2/UV treatment of clofibric acid in water: a kineticinvestigation. J. Hazard. Mater. B 103, 233–246.
Boye, B., Dieng, M.M., Brillas, E., 2002. Degradation of herbicide 4-chlorophenoxyacetic acid by advanced electrochemical oxidationmethods. Environ. Sci. Technol. 36, 3030–3035.
Brillas, E., Banos, M.A., Camps, S., Arias, C., Cabot, P.L., Garrido, J.A.,Rodrıguez, R.M., 2004a. Catalytic effect of Fe2+, Cu2+ and UVA lighton the electrochemical degradation of nitrobenzene using an oxygen-diffusion cathode. New J. Chem. 28, 314–322.
Brillas, E., Boye, B., Sires, I., Garrido, J.A., Rodrıguez, R.M., Arias, C.,Cabot, P.L., Comninellis, C., 2004b. Electrochemical destruction ofchlorophenoxy herbicides by anodic oxidation and electro-Fentonusing a boron-doped diamond electrode. Electrochim. Acta 49, 4487–4496.
Buser, H.R., Muller, M.D., Theobald, N., 1998. Occurrence of thepharmaceutical drug clofibric acid and the herbicide mecoprop invarious Swiss lakes and in the North Sea. Environ. Sci. Technol. 32,188–192.
Daughton, C.G., Jones-Lepp, T.L., (Eds.), 2001. Pharmaceuticals andPersonal Care Products in the Environment. Scientific and RegulatoryIssues. ACS Symposium Series, Washington.
Doll, T., Frimmel, F.H., 2004. Kinetic study of photocatalytic degrada-tion of carbamazepine, clofibric acid, iomeprol and iopromide assistedby different TiO2 materials—determination of intermediates andreaction pathways. Water Res. 38, 955–964.
Gozmen, B., Oturan, M.A., Oturan, N., Erbatur, O., 2003. Indirectelectrochemical treatment of bisphenol A in water via electrochemi-cally generated Fenton’s reagent. Environ. Sci. Technol. 37, 3716–3723.
Hanna, K., Chiron, S., Oturan, M.A., 2005. Coupling enhanced watersolubilization with cyclodextrin to indirect electrochemical treatmentfor pentachlorophenol contaminated soil remediation. Water Res. 39,2763–2773.
Heberer, T., 2002. Tracking persistent pharmaceutical residues frommunicipal sewage to drinking water. J. Hydrol. 266, 175–189.
Heberer, T., Adam, M., 2004. Transport and attenuation of pharmaceu-tical residues during artificial groundwater replenishment. Environ.Chem. 1, 22–25.
Heberer, T., Stan, H.J., 1997. Determination of clofibric acid and N-(phenylsulfonyl)-sarcosine in sewage, river, and drinking water. Int. J.Environ. Anal. Chem. 67, 113–124.
Irmak, S., Yavuz, H.I., Erbatur, O., 2006. Degradation of 4-chloro-2-methylphenol in aqueous solution by electro-Fenton and photoelectro-Fenton processes. Appl. Catal. B: Environ. 63, 243–248.
Kolpin, D.W., Furlong, E.T., Meyer, M.T., Thurman, E.M., Zaugg, S.D.,Barber, L.B., 2002. Pharmaceuticals, hormones, and other organicwastewater contaminants in U.S. Streams, 1999–2000: A nationalreconnaissance. Environ. Sci. Technol. 36, 1202–1211.
Kummerer, K. (Ed.), 2001. Pharmaceuticals in the Environment. Sources,Fate and Risks. Springer, Berlin.
I. Sires et al. / Chemosphere 66 (2007) 1660–1669 1669
Oturan, M.A., Aaron, J.J., Oturan, N., Pinson, J., 1999. Degradation ofchlorophenoxyacid herbicides in aqueous media, using a novelelectrochemical method. Pestic. Sci. 55, 558–562.
Packer, J.L., Werner, J.J., Latch, D.E., McNeill, K., Arnold, W.A., 2003.Photochemical fate of pharmaceuticals in the environment: Naproxen,diclofenac, clofibric acid, and ibuprofen. Aquat. Sci. 65, 342–351.
Sires, I., Garrido, J.A., Rodrıguez, R.M., Cabot, P.L., Centellas, F.,Arias, C., Brillas, E., 2006. Electrochemical degradation of paracet-amol from water by catalytic action of Fe2+, Cu2+, and UVA light onelectrogenerated hydrogen peroxide. J. Electrochem. Soc. 153, D1–D9.
Sun, Y., Pignatello, J.J., 1993. Photochemical reactions involved in thetotal mineralization of 2,4-D by iron(3+)/hydrogen peroxide/UV.Environ. Sci. Technol. 27, 304–310.
Tauxe-Wuersch, A., De Alencastro, L.F., Grandjean, D., Tarradellas, J.,2005. Occurrence of several acidic drugs in sewage treatment plants inSwitzerland and risk assessment. Water Res. 39, 1761–1772.
Ternes, T.A., 1998. Occurrence of drugs in German sewage treatmentplants and rivers. Water Res. 32, 3245–3260.
Ternes, T.A., Meisenheimer, M., McDowell, D., Sacher, F., Brauch, H.J.,Haist-Gulde, B., Preuss, G., Wilme, U., Zulei-Seibert, N., 2002.
Removal of pharmaceuticals during drinking water treatment. Envi-ron. Sci. Technol. 36, 3855–3863.
Tixier, C., Singer, H.P., Oellers, S., Muller, S.R., 2003. Occurrence and fateof carbamazepine, clofibric acid, diclofenac, ibuprofen, ketoprofen, andnaproxen in surface waters. Environ. Sci. Technol. 37, 1061–1068.
Ventura, A., Jacquet, G., Bermond, A., Camel, V., 2002. Electrochemicalgeneration of the Fenton’s reagent: application to atrazine degrada-tion. Water Res. 36, 3517–3522.
Weigel, S., Berger, U., Jensen, E., Kallenborn, R., Thoresen, H.,Huhnerfuss, H., 2004. Determination of selected pharmaceuticalsand caffeine in sewage and seawater from Tromsø/Norway withemphasis on ibuprofen and its metabolites. Chemosphere 56, 583–592.
Xie, Y.B., Li, X.Z., 2006. Interactive oxidation of photoelectrocatalysisand electro-Fenton for azo dye degradation using TiO2–Ti mesh andreticulated vitreous carbon electrodes. Mater. Chem. Phys. 95, 39–50.
Zuo, Y., Hoigne, J., 1992. Formation of hydrogen peroxide and depletionof oxalic acid in atmospheric water by photolysis of iron(III)-oxalatocomplexes. Environ. Sci. Technol. 26, 1014–1022.
Zwiener, C., Frimmel, F.H., 2000. Oxidative treatment of pharmaceuticalsin water. Water Res. 34, 1881–1885.