The determination of spatial pattern inDictyostelium discoideum
Upload
khangminh22Category
view
3download
0
#MapInfoMonday - Articles from 2020 1
#MapInfoMonday Articles from 2020

#MapInfoMonday - Articles from 2020 2
This document holds the 17 #MapInfoMonday articles published on the Knowledge Community in the last half of 2020.
You can read the articles in the document, or use the link at the end of each article to find the original article in the Knowledge Community.
Please use the Knowledge Community to ask any clarifying questions related to these articles.
Contents
Making labels not selectable ....................................................................................................................................... 3
Opening Tables from the Most Recent Used list ................................................................................................... 3
Creating multiple images using Python ................................................................................................................... 4
Making your base map grey ........................................................................................................................................ 7
Filtering Layers using a Thematic Map ..................................................................................................................... 9
Drivetime Zones using the Precisely API .............................................................................................................. 11
Your Account ............................................................................................................................................................ 11
Creating Drivetime Zones ..................................................................................................................................... 12
Organizing Windows .................................................................................................................................................. 15
Zoom to Previous View .............................................................................................................................................. 16
Using Variables in the SQL Window ....................................................................................................................... 18
The Window List in MapInfo Pro ............................................................................................................................. 23
Buffering objects in MapInfo Pro ........................................................................................................................... 24
Finding thistles in a field ............................................................................................................................................ 25
Creating a Dynamic GIFF using Python ................................................................................................................. 30
Creating Voronoi Polygons from Points .............................................................................................................. 34
Creating and modifying Vector Grids ................................................................................................................... 37
Create the Vector Grid ........................................................................................................................................... 38
Move the Vector Grid ............................................................................................................................................. 41
Rotate the Vector Grid........................................................................................................................................... 43
Delete Grid Cells outside the existing polygon ............................................................................................. 44
MapInfo Monday: Attribute Completeness ......................................................................................................... 45
Sorting and Filtering using the Browser window .......................................................................................... 45
Analyzing the values and aggregating statistics ........................................................................................... 46
Grouping the result................................................................................................................................................. 48
Analyzing Workspace load time .............................................................................................................................. 49

#MapInfoMonday - Articles from 2020 3
Making labels not selectable This week's tip and trick is around labels.
Sometimes labels do get in the way when you want to select the spatial object under the label. So instead of selecting the object, you select the label. And sometimes you even move the label just a tiny distance.
You can avoid this by making the labels not selectable on your map. You do this via the often-overlooked Selectable Labels icon in the Layer List next to each Map element. Here you can turn Selectable Labels on and off.
Are you already using this option in MapInfo Pro?
Find the article here in the Knowledge Community.
Opening Tables from the Most Recent Used list This week's tip and trick is about opening tables from the Most Recent Used list in the Open dropdown.
The Most Recent Used list gives you quick access to the files you have used recently and lets you open these quickly.
There are however a few small tips on how you can benefit better from these. In the image below, you can see the tips highlighted when you hold your mouse over a table in the list.

#MapInfoMonday - Articles from 2020 4
You can use the four small buttons to control how to open the table into MapInfo Pro:
• into a browser window, • into the current map window,
• into a new map window,
• or open it without showing it in any windows.
You can combine some of these with a keyboard shortcut: Shift to open the table into a floating window and Ctrl to open the table into a docked window. The Shift shortcut only work if you click on the browser or into a new map window buttons mentioned above.
Are you already using this option in MapInfo Pro?
Find the article here in the Knowledge Community.
Creating multiple images using Python This week's tip and trick is about using Python to generate a series of images from a map. It's also a bit more technical than the earlier #MapInfoMonday Tips & Tricks.
There are multiple scenarios where you want to create multiple versions of the "same" map. You might have multiple locations, you want to be printed, maybe you want to see the same location but slowly zooming into the location from a larger area, and then there is this scenario where you want to show values for one location as they change over time.
I have downloaded the Covid-19 data from Johns Hopkins University via the Github repository they have setup. This gives you access to a number of CSV files with data from all over the World as current status or as time series where you get all the numbers since early March.
In my case, I'm using data from early March into Mid-April. You can of course extend this to go all the way up to the most recent dataset. I'm focusing on the United States but you could also have chosen the entire World as that data also is available.
I have opened the CSV file into MapInfo Pro, created points using the Lat/Long values in the data, added the data to a map where I also have the Precisely Iron map, and I have made the Covid-19 data layer invisible. My script will add a thematic layer to the map using data for each of the days which is why I don't need to display the actual data points from the beginning.
Below you can see how my map looks, and you can also see the Python script in the Python console window at the bottom.

#MapInfoMonday - Articles from 2020 5
Let me take you through the script in some smaller steps.
I'm using the print statement to write a bit of text to the Message window and specifying the table to be used in the loop later on. print("Starting now") sTab = 'time_series_covid19_deaths_US' Next, I need to specify the columns to loop through and a more friendly name to be used for the files generated. For this, I'm creating a list containing multiple lists. The inner lists hold two elements; the column name and the friendly name. themeColumns = [ ['_4_14_20', '2020-04-14'], ['_4_13_20', '2020-04-13'], ['_4_12_20', '2020-04-12'] , ['_4_11_20', '2020-04-11'], ['_4_10_20', '2020-04-10'], ['_4_9_20', '2020-04-09'] , ['_4_8_20', '2020-04-08'], ['_4_7_20', '2020-04-07'], ['_4_6_20', '2020-04-06'] , ['_4_5_20', '2020-04-05'], ['_4_4_20', '2020-04-04'], ['_4_3_20', '2020-04-03'] , ['_4_2_20', '2020-04-02'], ['_4_1_20', '2020-04-01'], ['_3_31_20', '2020-03-31'] , ['_3_30_20', '2020-03-30'], ['_3_29_20', '2020-03-29'], ['_3_28_20', '2020-03-28'] , ['_3_27_20', '2020-03-27'], ['_3_26_20', '2020-03-26'], ['_3_25_20', '2020-03-25'] , ['_3_24_20', '2020-03-24'], ['_3_23_20', '2020-03-23'], ['_3_22_20', '2020-03-22'] , ['_3_21_20', '2020-03-21'], ['_3_20_20', '2020-03-20'], ['_3_19_20', '2020-03-19'] , ['_3_18_20', '2020-03-18'], ['_3_17_20', '2020-03-17'], ['_3_16_20', '2020-03-16'] , ['_3_15_20', '2020-03-15'], ['_3_14_20', '2020-03-14'], ['_3_13_20', '2020-03-13'] , ['_3_12_20', '2020-03-12'], ['_3_11_20', '2020-03-11'], ['_3_10_20', '2020-03-10'] , ['_3_9_20', '2020-03-09'], ['_3_8_20', '2020-03-08'], ['_3_7_20', '2020-03-07'] , ['_3_6_20', '2020-03-06'], ['_3_5_20', '2020-03-05'], ['_3_4_20', '2020-03-04'] , ['_3_3_20', '2020-03-03'], ['_3_2_20', '2020-03-02'], ['_3_1_20','2020-03-01'] ] Now it's time to do the actual loop where I run through all the lists in the list themeColumns. I get the two values from the individual elements of the list, use the do method to pass a Shade statement to MapInfo Pro, create a friendly file name using the nicely formatted date, and then I use another

#MapInfoMonday - Articles from 2020 6
two do statements; one to export the window into a PNG file and the other to remove the thematic layer from the map window. for theme in themeColumns: col = theme[0] date = theme[1] do('shade window FrontWindow() 1 with {} ignore 0 graduated 0.0:0 10000:24 Symbol (35,12583104,36,"MapInfo Symbols",0,0) Symbol (35,255,36,"MapInfo Symbols",0,0) vary size by "LOG"'.format(col)) fileName = r'D:\3. Demo\2. Maps\2020\Covid19\04-14 Data April 14\Time Series\US {}.PNG'.format(date) do('Save Window FrontWindow() As "{}" Type "PNG" Resolution 300'.format(fileName)) do('Remove Map Window FrontWindow() Layer 1') And finally, I use another print statement to write the word Finished to the Message window. print('Finished')
I have attached the full source code as a text file below (go to the online article to find the full source code).
A single exported image looks like this:
And if you create a GIF from all the files, it can look like this (Go to the article online to see the dynamic GIF).
You can do a lot using a few lines of Python code. Python is one of the most used development languages and we are glad to also be able to give MapInfo Pro users access to using Python as an alternative to and in combination with MapBasic.
When you are using the Python Console instead of the MapBasic Window, you get at least two major benefits besides the Python language itself: You can use loops, as I just showed above, and you can also use If statements. These two alone make it way more powerful compared to the MapBasic Window.

#MapInfoMonday - Articles from 2020 7
I hope you found this tip useful.
Find the article here in the Knowledge Community.
Making your base map grey Happy Monday!
This time we'll look at a small tip on how you can make your business map stand out compared to the base map.
Often base maps are colorful, and sometimes it can be hard to highlight the business data or theme, you are creating on top of such a colorful base map.
In the image below, you can see my orange dots illustrating a footpath but it is using similar colors as my base map so it doesn't stand out that much.
MapInfo Pro will let you tone down your raster-based base map with a single click. Select the base map layer in the Explorer window, go to the Style tab, and click on the Grey Scale button.
This tip will work with most of the raster-based data in MapInfo Pro, raster files, and tables from WMS services, Tile Services, and WMTS services.

#MapInfoMonday - Articles from 2020 8
Now the base map will be shown using grey colors, and your business data will be easier to spot.

#MapInfoMonday - Articles from 2020 9
You can also set this via the Adjust Image Styles dialog that you can access via the layer swatch left of the raster layer in the Explorer window. Here you can also adjust the contrast, brightness, and translucency of the raster.
I hope you found this tip useful.
Find the article here in the Knowledge Community.
Filtering Layers using a Thematic Map Happy Monday!
Today we will be looking at filtering layers using a thematic map. Sometimes you only want to view specific elements from a table/layer on your map. How do you filter out those elements that you want to focus on?
There are a few ways of doing it; You could use the filter option in your browser window and add the resulted filtered view to the map you. You can run a query to select the features you want and then add these to the map as a query result. And finally, you can add a theme to your layer and here use your condition to create two groups of features: those that meet your condition, and those that don't.
One of the benefits of using the approach with the thematic map is that it will automatically get updated if you change the data. If you are using a query, you will have to rerun the query to see the changes.
In my example, I have a table with roads where I'm only interested in the roads where the (signed) speed is less than or equal to 50 km/h. What you typically would do is create a thematic map where you group the streets into the many different speed groups. But that would give you multiple results with a variety of colors.
If you want a more clear result, you can create this thematic map as an Individual Theme, and in the dialog Create Thematic Map - Step 2 of 3 select the layer and for Field you select Expression from the bottom of the list. In the Expression dialog shown, you need to enter a condition using this basic structure: Str$(IIf(condition, true_text, false_text))
where
• condition is an expression that your records should meet • true_text is the text to show for records that meet the condition
• false_text is the text to show for records that don't meet the condition.
The Str$() function around the IIf() function tells MapInfo Pro to treat the returned values as strings. This is needed because the IIf() function can return almost any variable type.
#MapInfoMonday - Articles from 2020 10
In my example, the expression looks like this: Str$(IIF(SPEED<=50, "Less than or equal to 50 km/h", "More than 50 km/h"))
The example above shows a way to convert the real values to a friendlier version that easily can be shared with people not that familiar with the data. They can quickly see what is shown on the map. If you just use the condition as the expression, the values returned will be either True or False (1 or 0) which also would work.
In the image below you can see the resulting map, Notice that I have used the Layer List in the Explorer window to turn off the visibility of the roads that have a speed higher than 50 km/h. Also, note that I have renamed the thematic layer to show the condition in a more natural language version.
You can easily change your condition once created via the Theme tab that appears when you select a thematic layer from the Layer List. Click on Expression... at the end of the list and

#MapInfoMonday - Articles from 2020 11
the Expression dialog will appear where you can modify your condition.
I hope you found this tip useful. #MapInfoMonday is your weekly little tip to help you get more from your MapInfo Pro.
Find the article here in the Knowledge Community.
Drivetime Zones using the Precisely API In this week's #MapInfoMonday tip, I'll dive into the usage of Drivetime Zones.
Drivetime Zones is used across multiple verticals from Retail, over Utilities to Emergency Services. They are used to calculate the are you can reach within a given amount of time or distance. Within Retail, it's often used to calculate the estimated area that a retail location is expected to have customers visit from; Within Emergency Services, it's used to estimate the coverage of one or fire stations to be able to analyze how big part of a population can be reached within a given time.
In MapInfo Pro, you can calculate drivetime zones using the MapInfo RouteFinder add-in and a road network dataset. This will give you a lot of other features and will also allow you to modify the route network by adding for example roadworks.
But a more simplistic but still very powerful way to calculate drivetime zones, is relying on the Precisely API for drivetime zones. It's simple because you can't modify the road network. On the other hand, you don't need to worry about updating the road network because that's handle by our API team. You still get access to road speed at different times of the day; "AM Peak", "PM Peak", "Off Peak", and more.
As input, you need a table of points for which you want to calculate the drivetime zones. It can also take some selected points as input.
The use of Drivetime Zones in MapInfo Pro requires credits. While you are on maintenance you get 2000 credits each month. All you need to do is to create an account and log into it from within MapInfo Pro.
Let's get our hands dirty.
Your Account
On the Backstage (the Pro tab) under Services, you can access your account page and see the current status of your credits. If you haven't an account, this is also where you can create one.

#MapInfoMonday - Articles from 2020 12
When you have created your account, and you have logged into your account from the backstage, you can see the state of your account on the backstage. You can see how many credits you have left, and when the next quota starts. If you need more than 2000 credits a month, you can upgrade your account to get more credits.
Creating Drivetime Zones
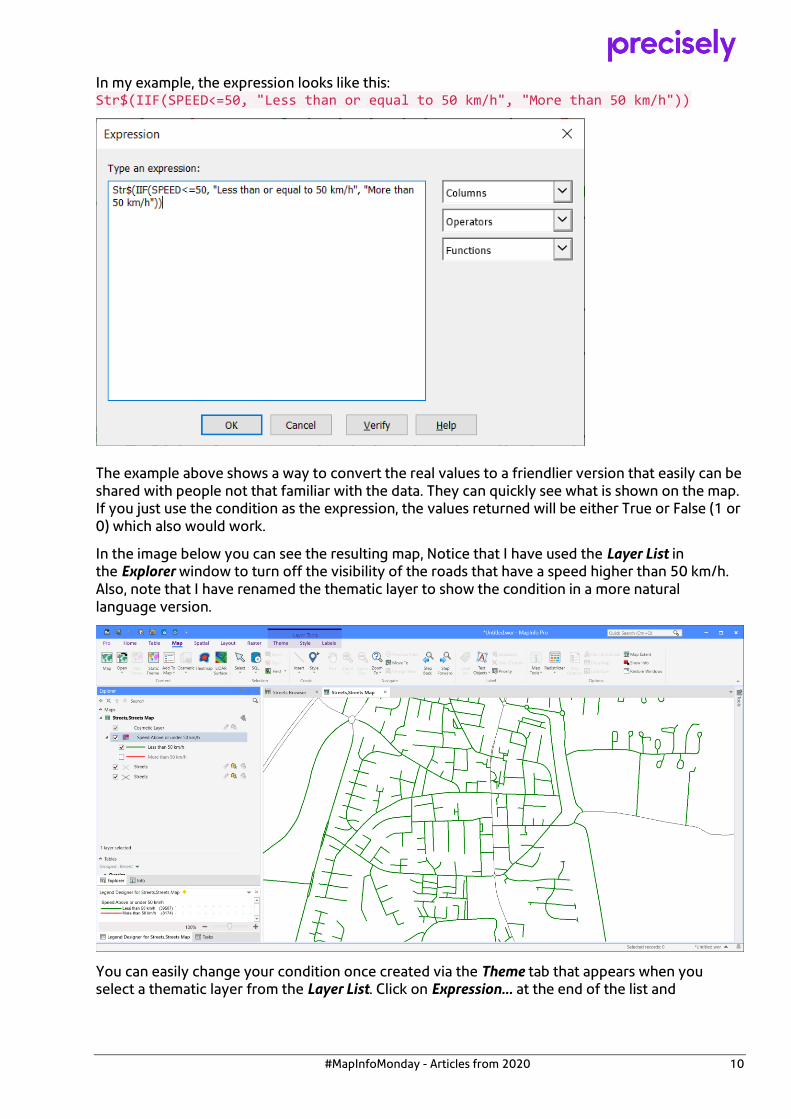
You access the Drivetime Zone tool (also known as Drive Regions or Drivetime Regions) on the Spatial tab under Regions. It will get loaded into a docked window.
#MapInfoMonday - Articles from 2020 13
In this example, we'll create a 5 and a 10-minute drivetime zone around three selected Petrol Stations. To do this, we first select the three petrol stations with the Select tool. You can use anyway in MapInfo Pro to select the points you want to use. The Drivetime Regions tool supports the Selection as input.
In the Drivetime Regions window, you select the Selection as your input, you need to specify the output table which by default uses the name of the input table and adds "_DT" to the filename.
If the output file exists, you can either overwrite it or add the drivetime regions to the existing table.
You need to select a column holding a value that will identify the drivetime regions such as a name or an ID. Under More Options, you specify an additional three columns that you want to bring over into the drivetime regions table.
Now you need to specify the settings for the drivetime regions. You can create Driving or Walking regions, and you can specify their size by either Time or Distance. Finally, you can enter up to three sizes of drive regions that you want created.
Under More Options, you are able to control the settings for the regions. These settings control the result, that you'll end up with. Below you can see the options I have used to create my drivetime zones.
One important setting is whether you want to use historic traffic data to control the speed you can drive on the road segments.

#MapInfoMonday - Articles from 2020 14
When you are ready to proceed, press the Process button to start the calculation. The process runs in the background and lets you continue to use MapInfo Pro. You can view the status of the calculation in the Task window.
The resulting drivetime zones might overlap each other so it is advisable to create a thematic map for the zones, either using the value column - the time in this case - or using the Name column, the individual petrol stations. In this way, you can use the Explorer window to turn on and off the individual zones to get a better view of the coverage. In the example below, I have turned off the visibility of the bigger 10-minute drivetime zones.

#MapInfoMonday - Articles from 2020 15
The resulting drivetime zones are vector polygons which will let you use these to select other points or to calculate statistics based on the overlap of for example a set of demographic data to estimate if you are reaching the expected amount of people. That's a story for another post.
Are you already using the Drivetime Zones option in MapInfo Pro?
#MapInfoMonday is your weekly little tip to help you get more from your MapInfo Pro.
Find the article here in the Knowledge Community.
Organizing Windows Hello all - Peter is away this week and he asked me to share/continue the Monday top tips.
If you are like me, your workspaces will have lots of maps, browsers, layouts, legends and tools open
Usually more than this... and this can be a challenge on a laptop to organize. Much easier on a large screen or even two!

#MapInfoMonday - Articles from 2020 16
A right-click on one of your map, browser or layout title bars gets you to a handy shortcut menu that offer lots of choices
The choices are fairly self-explanatory.
The horizontal and vertical tab groups allow you to neatly divide and sub-divide your screen to accommodate different windows.
The Clone function allows you to duplicate a Map Window with all your style and zoom settings without starting from scratch - and I use this a lot when working on different areas of a map.
Hence it becomes really easy to generate a lot of windows. Being able to Rename a Map Window in the Layer Control (right-click > Rename) is also very useful in navigating between your many windows.
So it is really easy to fill your application with lots of windows. The Hide function comes in useful when you actually want to clear some clutter - but that leaves the issue of "How do you Unhide a Window"?
If you scroll down in the Explorer Panel, below the Layer Control, you will see the information panes for Tables, Windows and Connections.
As you can see, the tick boxes allow you to hide and show all of the windows and panels. Perhaps you could explore this area to manage and tidy up many of your workspaces.
Find the article here in the Knowledge Community.
Zoom to Previous View When working in map windows in MapInfo Pro, I often find myself trying to get back to an earlier map extent (zoom and center).
You can use the command Previous View to return to the view before your current view. This can be found on the Map tab in the Navigate group and you can also access it from the Map context menu via right-click. And you can use the Alt+Left Arrow shortcut key for it too.

#MapInfoMonday - Articles from 2020 17
But this only lets you switch between the current and the previous view. You can't go further back than the most recent view.
But there's an add-in for that. In the MapInfo Marketplace, you can find the tool ZoomHistory by @Kalu Ribush.
Click the Install button in the MapInfo Marketplace to download, install, and run this tool. It will when loaded add two additional commands to the Map tab in the Navigate group: Step Back and Step Forward.
Now you can step through your zoom history at will.

#MapInfoMonday - Articles from 2020 18
Do you have an add-in for MapInfo Pro that you use regularly?
#MapInfoMonday is your weekly little tip to help you get more from your MapInfo Pro.
Find the article here in the Knowledge Community.
Using Variables in the SQL Window In this week's #MapInfoMonday, we will inspect a new feature that we are adding to the upcoming MapInfo Pro v2019.3 that we will release later this week: Variables in the SQL Window.
Until now when you build a query or a small script in the SQL Window it hasn't been that flexible. You couldn't ask the user for input for the script or query, and so you would either have to change the script when you needed it to run using a different table, or you needed to create multiple versions of the script, one for each table.
Now we introduce variables in the SQL Window. This gives you the ability to add placeholders for values that might change each time you run the script or query. To get the values to use, MapInfo Pro will create a dialog asking the end user for input for all the variables in your script or query. Suddenly your scripts and queries have become way more flexible.
Let's take a look which also will give you a better understanding of what this means.
In this example, I have two tables: one with points, and another with polygons, here hexagons. I want to count the number of points inside each polygon/hexagon and create a thematic map based on these numbers. I can do this using Update Column and then create my thematic using the Add Theme option. But if I need to do this often, I can create a small script that wraps it all into one process. As the name of the two tables might change, I'll ask the user to select the two tables to use. That's where the variables come into play.
Here's my map with the points and polygons/hexagons.

#MapInfoMonday - Articles from 2020 19
And on the right side you can see the SQL Window with my script. The script uses a Select statement to join the two tables, the resulting query is then added to my map and the script creates a thematic layer based on the calculated number of points inside each hexagon. I have used MapInfo Pro to build the statements and then copied them from the MapBasic window.
I'm only using two variables in this example; one for each table. You can see them in the highlighted line below: tabHexagons and tabPoints.

#MapInfoMonday - Articles from 2020 20
You can see the available variables in the Variables dropdown where you also access the Edit Variables dialog to create and modify variables.

#MapInfoMonday - Articles from 2020 21
The Edit Variables dialog lets you create as many variables as you want. Remember only to create those that you actually need. MapInfo Pro will ask for input for all the variables in the list, even those that you aren't using in your script.
Below you can see the definition of the tabHexagons variable. The tabPoints variables is very similar.
The type of variable here is Table. This will let the user pick from all the currently open tables. But I have decided to help the user a bit. I have limited the tables shown in the list to those where the dominant object type is polygons (4) for my tabHexagons variable and points (2) for my tabPoints variable. That's the condition you see in the field Values. You can use this to control the list of tables shown. Often you will do this using one or more expressions using the TableInfo() function as below.

#MapInfoMonday - Articles from 2020 22
I have only used the type Table in my example but as you can see here, there is a lot of other types to pick from. We will cover more of these in other posts later.

#MapInfoMonday - Articles from 2020 23
Now let's get to using the script and how the end user will be prompted. When you run the script, a dialog will popup asking the user for some input. The look of this dialog depends on the variable types and the number of variables.
In this example, the dialog only asks for two tables using two dropdowns limited to tables with mostly polygons and tables with mostly points.
The user selects the two tables to use and hits OK to continue. Now the script knows which tables to use and is able to execute the actual work. The final results looks like this. If you had another table with smaller hexagons, you could quickly run the script using this table too and get a different result.
In this example I used the variables in a Select statement, but you can also use the variables in an Update statement or any type of script for that matter.
How do you in general find the new SQL Window we added to MapInfo Pro v2019? Do you think the support for variables will make it more useful to you?
#MapInfoMonday is your weekly little tip to help you get more from your MapInfo Pro.
Find the article here in the Knowledge Community.
The Window List in MapInfo Pro Time for another #MapInfoMonday tip.
MapInfo Pro lets you create multiple maps, browsers, and layout windows and after a while, you can end up with a lot of windows.
Luckily the Window List that you can find in the Explorer window, and as a stand-alone window too, helps you find and work with these windows.

#MapInfoMonday - Articles from 2020 24
You can use the checkbox next to the window names to show and hide the windows. This doesn't close the window, so you can very easily show the window again when you need it.
Another useful feature that I often use when I have many windows, is to double-click on the window. This brings the window to the front and makes it the active window. For map windows, you can do this via the map element in the Layer List part of the Explorer window too.
And finally, you can right-click on the windows and for example, change the window state from tabbed to float or docked if you prefer those states to the standard tabbed state.
#MapInfoMonday is your way to tips & tricks around MapInfo Pro. If you are looking for tips in a specific area of MapInfo Pro, let me know.
Find the article here in the Knowledge Community.
Buffering objects in MapInfo Pro Time for yet another #MapInfoMonday post. This time I'll dive a bit into buffering.
Buffering is a useful way to do spatial analysis. It gives you a quick overview of the coverage for a given set of data using a common spatial distance calculation.
The buffers you create through the buffering process can be used visually or you can use them to do further spatial analysis by selecting other features falling inside these buffer zones.
MapInfo Pro allows you to buffer some selected features and create the buffers in the editable layer using the Buffer Objects command in the Buffer dropdown on the Spatial tab.
You can however also buffer an entire table, or selection, into a new or existing table using the Buffer Table option from the same dropdown.
In both cases, you will get to the Buffer Objects dialog where you specify the buffers to create.

#MapInfoMonday - Articles from 2020 25
A few things to note:
The Value controls the size of the buffers. This can be a fixed value as seen above or it can be a value from a column.
The value can also be negative. This lets you create a buffer inside a polygon where the resulting buffer object is smaller than the input polygon object.
You can create One buffer for all objects or One buffer for each object. The first is especially useful if you need the resulting buffer to select records from other tables afterward. The second lets you transfer the attribute information from the input table to the buffer table.
In the example below, we are looking for addresses nearer than 250 meters to a highway.
A different type of buffers is isochrones where the size depends on the speed you can drive on the roads. This is specifically useful when doing retail analysis or analyzing the coverage for ambulance services. Read more about creating Drivetime zones in MapInfo Pro on the Knowledge Community.
What are you using buffers for?
Find the article here in the Knowledge Community.
Finding thistles in a field Happy #MapInfoMonday!

#MapInfoMonday - Articles from 2020 26
Today we'll dive a bit into the power of using raster analysis in MapInfo Pro Advanced.
Last week Rita Hørfarter from SEGES, who focuses on providing sustainable solutions for future farming in Denmark, reached out with a question related to using the Raster Calculator in MapInfo Pro Advanced.
She has been given the task of identifying areas in a field with a high population of thistles. She had been given a 5GB TIFF covering a 40-hectare field with a resolution of 2.5 cm. The data was captured by a drone.
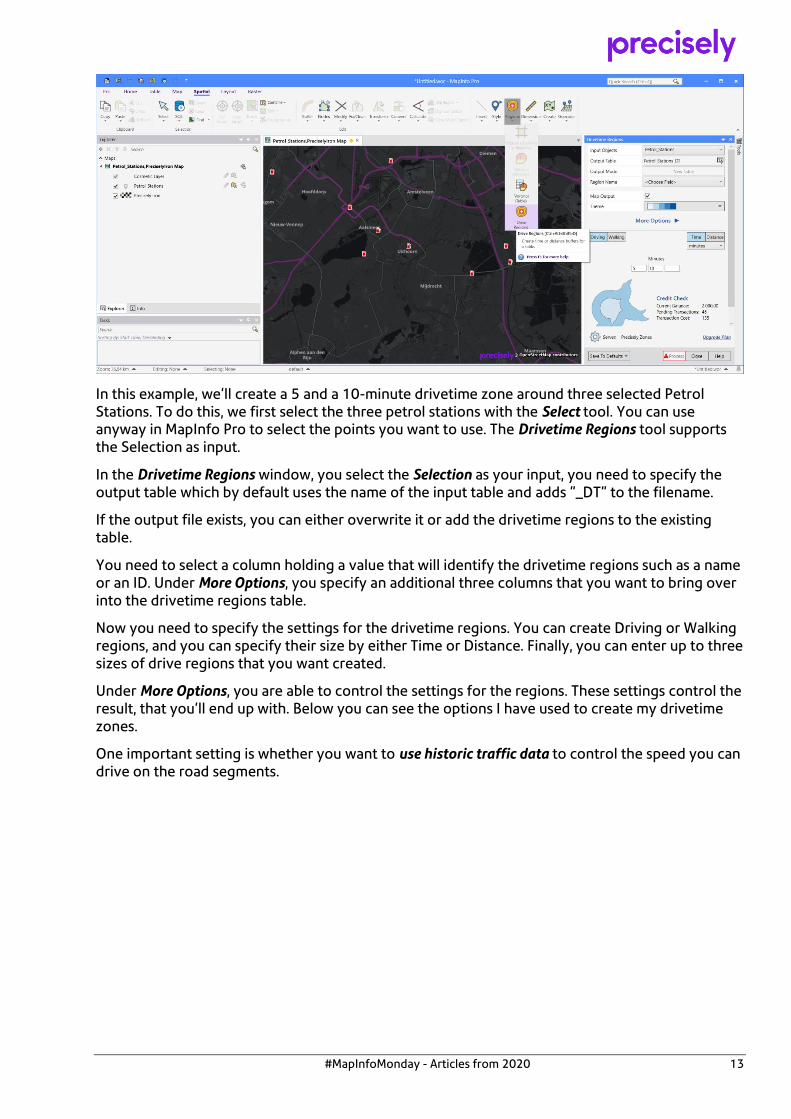
Below you can see this raster grid clipped to the borders of the 40-hectare field.
The TIFF raster grid contained four bands, and Rita's question was only around using these bands in the Raster Calculator in MapInfo Pro Advanced.
A raster grid with multiple bands can be displayed in a couple of ways in MapInfo Pro. You can display it using the RGB method as you can see below where you assign each band to the colors Red, Green, and Blue. In the case where you assign the actual values from the bands red, green, and blue to these, the result will be like an aerial image of the area.
#MapInfoMonday - Articles from 2020 27
You can also switch to the Pseudo mode where you only represent a single band when viewing the raster grid. In the example below, you can see how Rita has switched to Pseudo and chosen to display the values from the Green band.
Back to the real purpose of the exercise here: locating areas with a high population of thistles. Rita knew how she could highlight the areas where the population of thistles probably would be high. She wanted to use an expression using the three color bands to find these. The expression was this:
2 * Green - Red - Blue
She wanted to create a new raster using this expression in the Raster Calculator.

#MapInfoMonday - Articles from 2020 28
To reference a band in a raster grid, you can type "[" after the raster, or after the Input variable referring to the raster grid. This will pop up a list of bands in the raster grid. When you select one of these bands, MapInfo Pro will insert the band number in the expression.
In Rita's case the original expression ended up looking like this:
Input_1[2] * 2 - Input_1[1] - Input_1[3]
where Input_1 refers to the raster grid.
To find the location with a high population of thistles, she was looking for the grid cells where the expression above was higher than 60 or 70. Below you can see an image showing an area with the values being higher than 60 and higher than 70.

#MapInfoMonday - Articles from 2020 29
And finally, here is an image showing the potential areas with many thistles in the entire field. In the image below the threshold has been set to 60.
Thanks for sharing this use case of MapInfo Pro Advanced, Rita.
If you have other interesting use cases of MapInfo Pro or MapInfo Pro Advanced, that you'd like me to cover to not hesitate to reach out. I'd be happy to cover these in an upcoming #MapInfoMonday post.
PS: Did you know that the thistle is the national flower of Scotland? Apparently, it saved a Scottish army's encampment from being taken by surprise by a Norse army one night back in the days according to Wikipedia.
Find the article here in the Knowledge Community.

#MapInfoMonday - Articles from 2020 30
Creating a Dynamic GIFF using Python Happy #MapInfoMonday!
I almost forgot about my post for today but I certainly didn't want to let you down.
This time I had a look at the data that recently had been made freely available by the Danish Meteorological Institute. I downloaded the lightning data from DMI's lightning detector network. It holds lightning data from back in 2002 up till now.
A quick query of the data showed me a single day back in 2002 where more than 100,000 bolts of lightning occurred across Denmark.
So I queried the data from June 18 in 2002 and extracted the observation time from the combined observation data time string. In the map below, you can see all the observations throughout the day.
But in order to get a better understanding of when the observations happened, I created a small Python script that would extract the observation for every 15 minutes, show them on the map, and export this as a single image.
All these individual images, the Python script will combine into a dynamic GIFF which shows how the lightning storm moves across Denmark.
At the top left corner, I inserted a point and labeled it with a time stamp. This time is updated for every hour and the time can so be seen on the image and in the final GIFF.
Here's my Python script
import time
import os
from System import Enum
from MapInfo.Types import *
from MapInfo.Types.Data import *

#MapInfoMonday - Articles from 2020 31
import imageio
#Get the map window
map = pro.Maps[0]
#Get the table to use
table = pro.Catalog.Tables['Lightnings_20020618']
path = os.path.dirname(table.FullPath)
path = os.path.join(path, '20020618.gif')
#print('gif path: ' + path)
#loop through the day
with imageio.get_writer(path, mode='I') as writer:
#loop through the hours
for nHour in range(24): #should be 24
#Loop the 15 minute intervals of each hour
for nMinute in [0,15,30,45]:
tFrom = (2002, 6, 18, nHour, nMinute, 0, 0, 0, 0)
sFrom = time.asctime(tFrom)[11:16]
if nMinute == 45:
if nHour == 23:
nHour = 0
else:
nHour = nHour + 1
nMinute = 00
else:
nHour = nHour
nMinute = nMinute + 15
tTo = (2002, 6, 18, nHour, nMinute, 0, 0, 0, 0)
sTo = time.asctime(tTo)[11:16]
print("{}: {}-{}".format(pro.EvalMapBasicCommand('Time(24)'), sFrom, sTo))
#Build SQL string
sSQL = 'Select * From {} As "t" Where t.OBSERVED_TIME >= "{}"'.format(table.Alias, sFrom)
if sTo != "00:00":
sSQL = sSQL + 'And t.OBSERVED_TIME < "{}"'.format(sTo)
sSQL = sSQL + ' Into _temp noselect'

#MapInfoMonday - Articles from 2020 32
#print(sSQL)
pro.RunMapBasicCommandEx(sSQL)
map.Layers.AddLayer('_temp', 1)
#Update the timestamp
if sFrom[3:5] == "00":
sUpdate = 'Update Time_Title Set TimeStamp = "{}"'.format(sFrom)
pro.RunMapBasicCommandEx(sUpdate)
pro.RunMapBasicCommandEx("Commit Table Time_Title")
#Export the map window to an image file
fileName = pro.EvalMapBasicCommandEx('TempFileName$("")')
sCmd = 'Save Window {} As "{}" Type "PNG" Width 19.0235 Units "cm" Height 14.7637 Units "cm" Resolution 120'.format(map.WindowInfo.WindowId, fileName)
pro.RunMapBasicCommandEx(sCmd)
#Add the map image to the dynamic GIFF
image = imageio.imread(fileName)
writer.append_data(image)
pro.RunMapBasicCommandEx('Kill "{}"'.format(fileName))
In MapInfo Pro v2019.3, I used the Python Console to write and execute my script.
From the Python Console, I can use Ctrl + Enter to execute the script.

#MapInfoMonday - Articles from 2020 33
As the script starts selecting the observations from the morning hours, the bolts of lightning start appearing on the west side of Denmark.
The script deletes the individual map images as they get added to the GIFF which means that the final result is a single GIFF combined from the 24 * 4 time intervals across the day. Here's the final GIFF (go to the article on the Knowledge Community to see the GIF live).
The above method can be used to visualize any data that has time information to it.
I hope you found this interesting. Stay tuned for more #MapInfoMonday tips next week.
Find the article here in the Knowledge Community.

#MapInfoMonday - Articles from 2020 34
Creating Voronoi Polygons from Points Happy #MapInfoMonday, it's time for another tip and trick for the MapInfo Community.
It can sometimes be useful to convert a set of points into a set of polygons that divided the area between the points. We have earlier looked at buffering. But buffers either overlap or underlap, they rarely assign the entire area between the input points.
In the example below, I have created 20 km buffers around my input points but you can see that there are areas where multiple buffers overlap, and there are also areas that aren't covered by a buffer.
To make sure the resulting polygons cover the entire area, you can create Voronoi polygons instead. Voronoi polygons are also known as Thiessen polygons named after Alfred H. Thiessen, an American meteorologist. Voronoi diagrams, or tesselations, were defined by Georgy Voronoy.
They will divide the area so that the area is assigned to the point closest to the area. This means you will end up with polygons that are of different sizes. Bigger polygons where you have points that are further apart, and smaller polygons where the points are closer together.
It is useful for dividing areas of responsibilities for field offices or possibly postal zones. It can also be used as a simple way to divide your sales territory into smaller sales districts where you assign each dealer the area that is closest to that dealer.
You find the Voronoi option on the Spatial tab in the Create group. You can use a selection as input with the Voronoi (Object) method. And the Voronoi (Table) method allows you to pass in an entire table and create a new table as output.
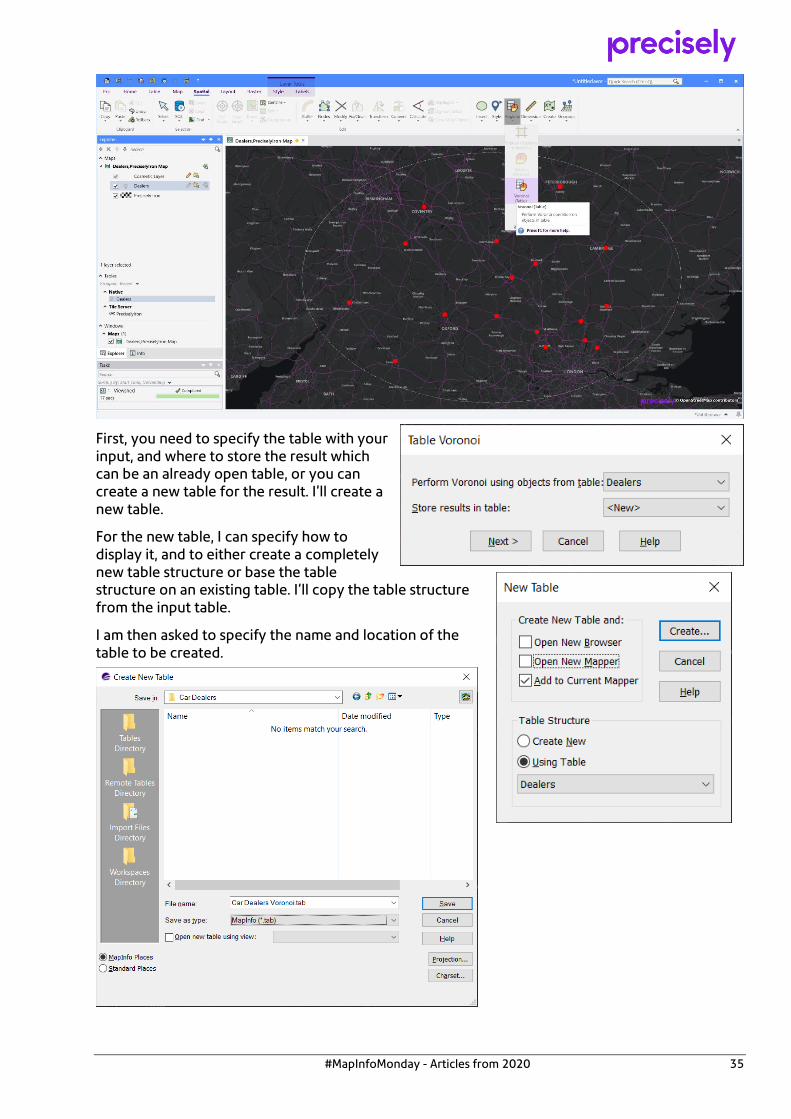
#MapInfoMonday - Articles from 2020 35
First, you need to specify the table with your input, and where to store the result which can be an already open table, or you can create a new table for the result. I'll create a new table.
For the new table, I can specify how to display it, and to either create a completely new table structure or base the table structure on an existing table. I'll copy the table structure from the input table.
I am then asked to specify the name and location of the table to be created.

#MapInfoMonday - Articles from 2020 36
And finally, we get to the Voronoi procedure. The Data Aggregation dialog allows you to copy over the attribute data from the input table to the output table.
When I hit the OK button, MapInfo Pro will calculate the Voronoi polygons for the input points. In the map below, you can see the resulting Voronoi polygons. Every point in each Voronoi polygon is closer to the input point inside that polygon than to any of the other input points.
As you can see from the map above, the extent of Voronoi polygons is similar to the extent of the input points. Often you want the Voronoi polygons to cover a specific area. To do this, you can set that area as your target.
Make sure the layer is editable, select one polygon from the editable layer, and use Set Target on the Spatial tab.

#MapInfoMonday - Articles from 2020 37
Now run through the process of creating your Voronoi polygons again, and you will notice that the resulting polygons will match up with your target area.
I hope you found this useful. Let me know if you have specific features of MapInfo Pro that you want me to cover in an upcoming
Find the article here in the Knowledge Community.
Creating and modifying Vector Grids In this #MapInfoMonday post, I will show you how you can use the Grid Maker tool to create vector grids of a given size for a dedicated area. I will also show you how you can use specific functions in MapCAD to move and rotate your grid. MapCAD is an add-in that adds CAD-like functionality to MapInfo Pro. It has more than 30 different features for creating and modifying spatial data.

#MapInfoMonday - Articles from 2020 38
This specific use case comes from Adrijana who responded to an earlier #MapInfoMonday post. Adrijana is looking for a way to divide a risen bed into 30 cm grid cells as that is the distance between the flowers in each direction.
Create the Vector Grid
The first step is to create a vector grid for our area. In the map below, you can see the risen bed as the red polygon. That is the area I need to create a vector grid for.
From the Tools window, make sure Grid Maker has been loaded and then double-click on the tool to launch it. You will see the Grid Maker dialog appear.

#MapInfoMonday - Articles from 2020 39
Change these settings:
• Distance between lines: In my case, I change this to 0.3 meters • Smoothness: I changed smoothness to 1 but as the grid cells are very small you could also
change it to 0. • New Table: I picked a different location for the vector grid file
• Projection: Make sure to switch to the same coordinate system as the table holding your area of interest. Also, note that as we are using small areas it is recommended to use a table with a bounded coordinate system where the resolution is higher than the typical 10 cm.
• Make sure that the option Select Area from Map has been checked. This allows you to draw a rectangle that you want the grid to cover.
Now hit the OK button, and use the tool that you have been given to draw a rectangle in the map window. When you have drawn the rectangle, the Grid Maker dialog will appear again but this time it will show the coordinates from the rectangle you drew.

#MapInfoMonday - Articles from 2020 40
Hit OK to accept the new extents and get the vector grid created. In the map window below, you can see the vector grid I ended up creating.

#MapInfoMonday - Articles from 2020 41
Move the Vector Grid
Now it is time to adjust the vector grid to the existing polygon. The first step is to move it so that the lower-left grid cells match up with the left corner of the existing polygon. It is not that important to use the lower-left grid cell. That depends on the existing polygon. The important thing is that you align a corner of a grid cell to a node in the existing polygon. When creating the grid, you could have snapped the extent of the vector grid to that node in the existing polygon. That would have made this step unnecessary - at least for my specific polygon. I will also recommend creating the vector grid in an area where it doesn't overlap the point on your existing polygon. If it does overlap, it can be hard to snap to the exact point.
1. Make sure the add-in MapCAD has been loaded as we will be using tools from this add-in. 2. Make sure the vector grid layer is editable 3. Zoom into the map so that you can see the lower-left corner of the vector grid and the left
corner of the existing polygon. 4. Right-click the vector grid layer and select Select All from the context menu to select all the
records in the vector grid table. 5. From the Spatial table, in the Edit group, select the tool Move Along from
the Transform dropdown. 6. Hit the s key to turn on the snap feature. You can see that the word SNAP appears in the
statusbar. 7. Left-click in the corner of the vector grid cells and hold down the left mouse button, drag a
line to the left corner of the existing polygon and let go of the mouse button.

#MapInfoMonday - Articles from 2020 42
Now MapCAD moves the vector grid cells to the new position. In the map below, you can see the moved vector grid cells.

#MapInfoMonday - Articles from 2020 43
Rotate the Vector Grid
In this example, the risen bed is rotated and we want to match this rotation in the vector grid cells. First, we need to calculate the rotation. MapCAD has a tool for this: Calculate Direction. It gives you the direction of a line or polygon segment when you click on it.
Select the tool Calculate Direction from the Calculate dropdown in the Edit group on the Spatial tab. Click on the segment you want to get the direction for. In the map below, you can see I have marked the polygon segment, I click on with an orange arrow. In the Calculate Direction dialog, I can see the direction and I can also store it for later use when clicking on the Store button.
Now I have calculated the direction and I am ready to rotate the vector grid cells.
1. Make sure the layer with the vector grid cells is editable 2. Right-click the vector grid layer and select Select All from the context menu to select all the
records in the vector grid table. 3. From the Spatial table, in the Edit group, select the tool Rotate Object (MapCAD) from
the Transform dropdown. 4. Activate snap if you haven't done this already: Hit the s key to turn on the snap feature. You
can see that the word SNAP appears in the statusbar. 5. With the tool, click on the left corner of the existing polygon to mark the rotation point
that you want to rotate the vector grid cells around. 6. In the dialog Rotation Angle, select the stored value from the popupmenu with the angles,
and then hit the Left button to rotate the vector grid cells counter-clockwise. 7. Hit OK to close the dialog.

#MapInfoMonday - Articles from 2020 44
In the map above, you can see how the vector grid cells now how the same rotation as the existing polygon.
Delete Grid Cells outside the existing polygon
The final step in my example is to delete the vector grid cells that are outside the risen bed. Using the Layer List, make sure the layer with the risen bed (the existing polygon) is on top of the vector grid cell layer. From the Mini Map Toolbar, select the Boundary Selection tool from the Select splitbutton and click inside the existing polygon. This will select all the vector grid cells inside the polygon. More precisely, all the vector grid cells with a centroid inside the polygon. Now use Invert Selection to select all the other records and hit the Delete key on your keyboard to delete these. The final result looks like this

#MapInfoMonday - Articles from 2020 45
I hope you have found this interesting and informative. The tools in MapCAD add a lot of capability to MapInfo Pro when it comes to creating and editing spatial objects. I have attached a PDF document with more tips and tricks on editing data in MapInfo Pro. Any suggestions on topics for an upcoming #MapInfoMonday article are most welcomed.
Find the article here in the Knowledge Community.
MapInfo Monday: Attribute Completeness Happy #MapInfoMonday! Yet another post with a couple of tips & tricks around MapInfo Pro. This time I will give you some hints around analyzing attribute completeness in your data. This is interesting when you start looking at the quality of your data. Is it complete or how complete is it?
Sorting and Filtering using the Browser window
In MapInfo Pro, you can use the browser window to get an overview of the completeness of the data. With a single click on the column title, you can sort the table by that column and quickly see empty strings or 0 values. You can also right-click in the browser window, and use the Filter option to find all records where a numerical column equals 0 or where a character column is empty.

#MapInfoMonday - Articles from 2020 46
But if you have many records and many columns, it can be hard to keep an overview.
Analyzing the values and aggregating statistics
Another approach that has been made possible after the introduction of the IIf() function in MapInfo Pro v17.0, is to aggregate the column values and count how many are valid and how many are considered not valid, or not filled in.
The IIf() function makes it possible for you to convert one value to another depending on the value. This is useful when you want to establish the number of valid and invalid values in your data.
Syntax: IIf( expression, truepart, falsepart )
The IIf() function takes three parameters:
1. A condition in the form of an expression 2. The value to return if the condition is true 3. The value to return if the condition is false
When it comes to analyzing the attribute completeness of your data, you often want to compare the attribute to a valid or invalid value to determine whether it has been filled in or not.
Here are three examples:
• IIf(t.frednr="",0,1): If the value in the column named frednr is empty, the value has not been filled in and the IIf() function returns 0. Otherwise, it will return 1.
• IIf(t.anlnr=0,0,1): If the value in the column named anlnr is 0, the value has not been filled in and the IIf() function returns 0. Otherwise, it will return 1.
• IIf(t.stednavn In ("", "Udefineret"),0,1): if the value in the column named stednavn is either empty or "Udefineret" which is Danish for undefined, the value has not been filled in and the IIf() function returns 0. Otherwise, it will return 1.
I hope these three basic examples give you some idea of how to use the IIf() function to identify values that haven't been filled in.

#MapInfoMonday - Articles from 2020 47
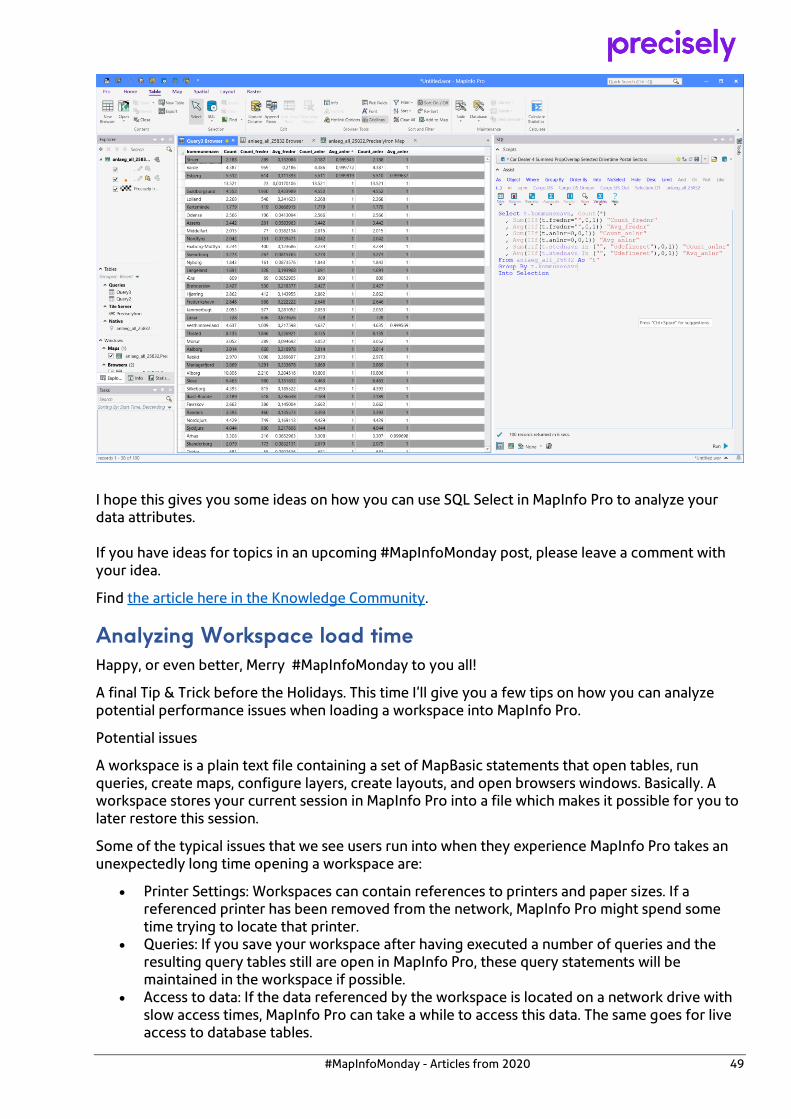
I set the return value of the IIf() function to either 0 or 1. This makes it possible for me to use this return value in two aggregates to be able to count the number of values that have been filled in and also to calculate a percentage of the filled-in values using the average aggregate. In the SQL window below, you can see how I have built a Select statement to count the total number of records in the table, and the number of valid values, and the average for three columns in my dataset. The summed value (Sum) gives me a count of records with a valid value. The average value (Avg) gives me a percentage, as a decimal value, of the attribute completeness for the individual fields. Select Count(*) , Sum(IIf(t.frednr="",0,1)) "Count_frednr" , Avg(IIf(t.frednr="",0,1)) "Avg_frednr" , Sum(IIf(t.anlnr=0,0,1)) "Count_anlnr" , Avg(IIf(t.anlnr=0,0,1)) "Avg_anlnr" , Sum(IIf(t.stednavn In ("", "Udefineret"),0,1)) "Count_stednavn" , Avg(IIf(t.stednavn In ("", "Udefineret"),0,1)) "Avg_stednavn" From anlaeg_all_25832 As "t" Into Selection
Below you can see the result of my query, and the completeness of the three fields. The field frednr only has a valid value in 16% of the records, where the other two columns have valid values in just shy of 100% of the records.

#MapInfoMonday - Articles from 2020 48
Grouping the result
In the example above I only get one record back from the Select statement which gives me a single number for all the records in the table. Sometimes it would make sense to dive a bit more into these numbers to understand how they have originated, and maybe identify why some fields have bad completeness. You can do this by grouping the values by a column. In the example below, I have grouped the result by an area of interest but it could also be grouped by time or by users to see if the is a correlation between any of these and the missing values in a field. Maybe the field was added recently so all the records that originated prior to this date don't have any values in this field.
#MapInfoMonday - Articles from 2020 49
I hope this gives you some ideas on how you can use SQL Select in MapInfo Pro to analyze your data attributes. If you have ideas for topics in an upcoming #MapInfoMonday post, please leave a comment with your idea.
Find the article here in the Knowledge Community.
Analyzing Workspace load time Happy, or even better, Merry #MapInfoMonday to you all!
A final Tip & Trick before the Holidays. This time I'll give you a few tips on how you can analyze potential performance issues when loading a workspace into MapInfo Pro.
Potential issues
A workspace is a plain text file containing a set of MapBasic statements that open tables, run queries, create maps, configure layers, create layouts, and open browsers windows. Basically. A workspace stores your current session in MapInfo Pro into a file which makes it possible for you to later restore this session.
Some of the typical issues that we see users run into when they experience MapInfo Pro takes an unexpectedly long time opening a workspace are:
• Printer Settings: Workspaces can contain references to printers and paper sizes. If a referenced printer has been removed from the network, MapInfo Pro might spend some time trying to locate that printer.
• Queries: If you save your workspace after having executed a number of queries and the resulting query tables still are open in MapInfo Pro, these query statements will be maintained in the workspace if possible.
• Access to data: If the data referenced by the workspace is located on a network drive with slow access times, MapInfo Pro can take a while to access this data. The same goes for live access to database tables.

#MapInfoMonday - Articles from 2020 50
• Generating preview for raster files: When opening raster files of a format supported by MapInfo Raster, the raster engine will generate a set of cache files (typically .pprc and .ghx files) for better performance. If the raster files live in a read-only folder, these cache files are created in your temp folder every time you open the files, slowing down the process.
• Map rendering: very complex maps can take a while to render, and having many map windows will take longer to get rendered than fewer map windows.
The list above is just to give you some idea of where MapInfo Pro could be spending time when loading a workspace. The could also be other causes for potential slowness. In most cases, you will not be seeing any issues.
The easy fixes
The quick fix here is to start turning off using some of the settings from the workspace. Here there is one setting that quickly can tell you if the problem lies with your printers.
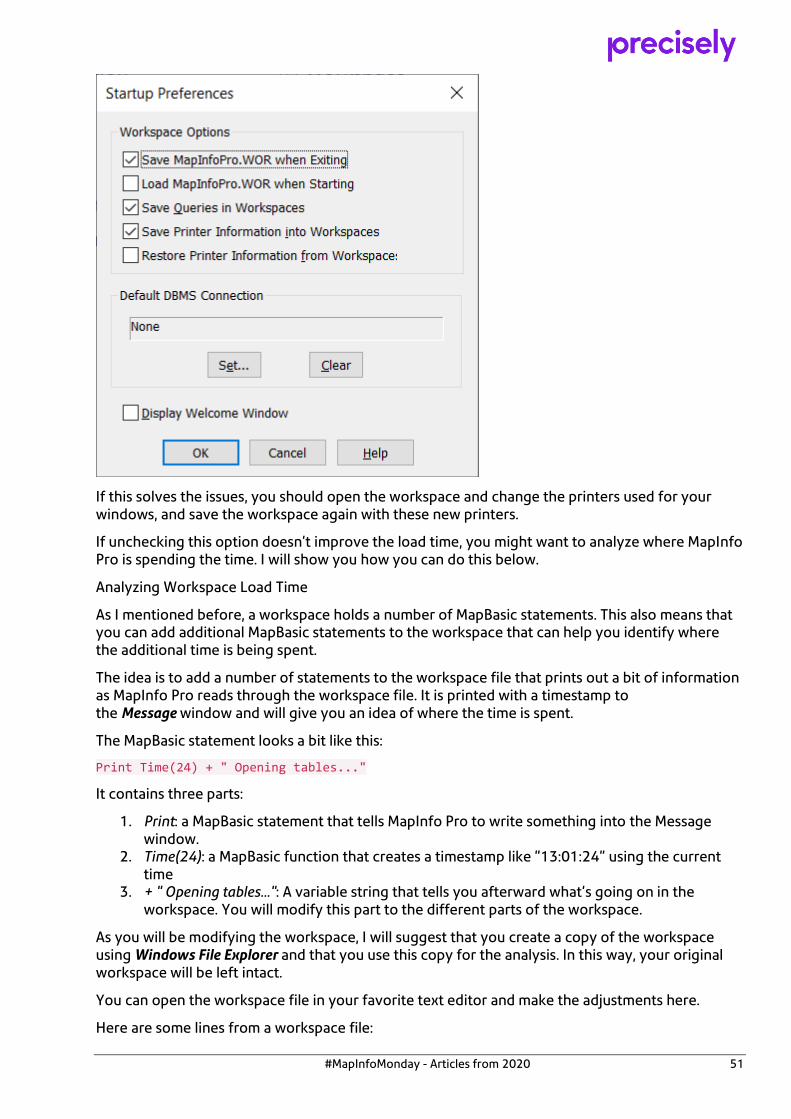
The startup preference, found on the backstage via the Pro tab, Options, lets you set MapInfo Pro up to ignoring Printer Settings in workspaces.
If you are seeing a longer load time for your workspaces, try to disable this option in the Startup Preferences dialog: Restore Printer Information from Workspace.
#MapInfoMonday - Articles from 2020 51
If this solves the issues, you should open the workspace and change the printers used for your windows, and save the workspace again with these new printers.
If unchecking this option doesn't improve the load time, you might want to analyze where MapInfo Pro is spending the time. I will show you how you can do this below.
Analyzing Workspace Load Time
As I mentioned before, a workspace holds a number of MapBasic statements. This also means that you can add additional MapBasic statements to the workspace that can help you identify where the additional time is being spent.
The idea is to add a number of statements to the workspace file that prints out a bit of information as MapInfo Pro reads through the workspace file. It is printed with a timestamp to the Message window and will give you an idea of where the time is spent.
The MapBasic statement looks a bit like this:
Print Time(24) + " Opening tables..."
It contains three parts:
1. Print: a MapBasic statement that tells MapInfo Pro to write something into the Message window.
2. Time(24): a MapBasic function that creates a timestamp like "13:01:24" using the current time
3. + " Opening tables...": A variable string that tells you afterward what's going on in the workspace. You will modify this part to the different parts of the workspace.
As you will be modifying the workspace, I will suggest that you create a copy of the workspace using Windows File Explorer and that you use this copy for the analysis. In this way, your original workspace will be left intact.
You can open the workspace file in your favorite text editor and make the adjustments here.
Here are some lines from a workspace file:
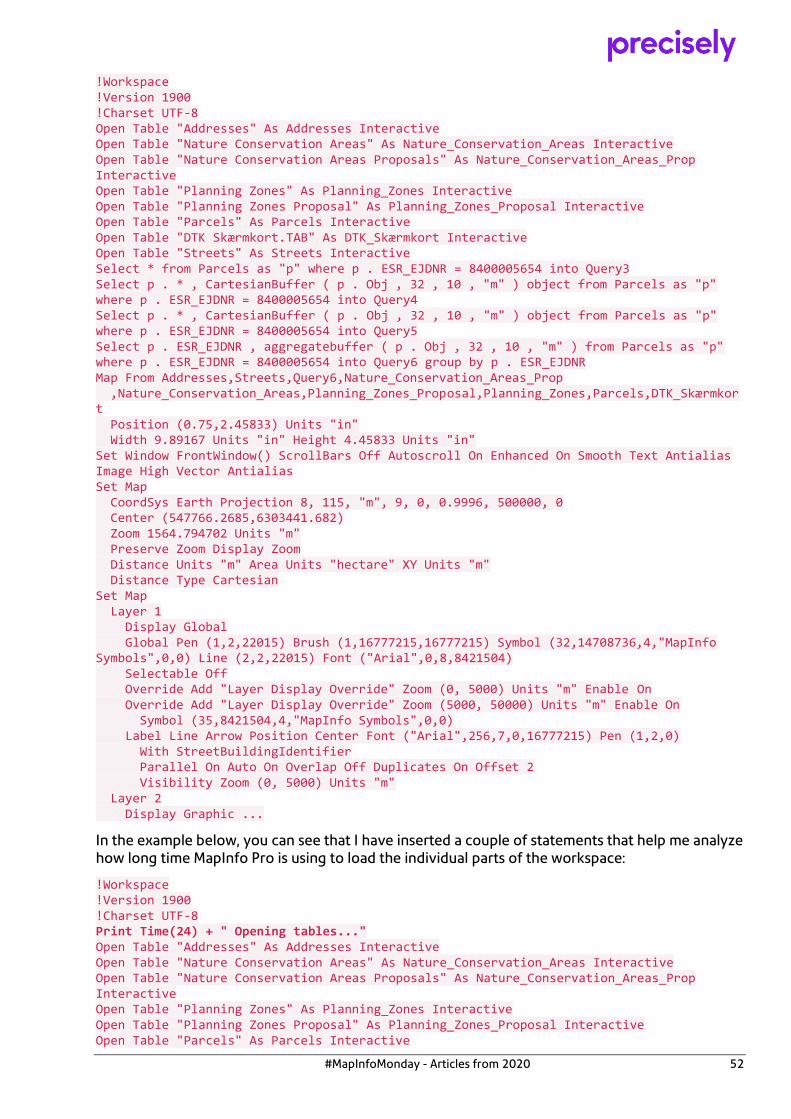
#MapInfoMonday - Articles from 2020 52
!Workspace !Version 1900 !Charset UTF-8 Open Table "Addresses" As Addresses Interactive Open Table "Nature Conservation Areas" As Nature_Conservation_Areas Interactive Open Table "Nature Conservation Areas Proposals" As Nature_Conservation_Areas_Prop Interactive Open Table "Planning Zones" As Planning_Zones Interactive Open Table "Planning Zones Proposal" As Planning_Zones_Proposal Interactive Open Table "Parcels" As Parcels Interactive Open Table "DTK Skærmkort.TAB" As DTK_Skærmkort Interactive Open Table "Streets" As Streets Interactive Select * from Parcels as "p" where p . ESR_EJDNR = 8400005654 into Query3 Select p . * , CartesianBuffer ( p . Obj , 32 , 10 , "m" ) object from Parcels as "p" where p . ESR_EJDNR = 8400005654 into Query4 Select p . * , CartesianBuffer ( p . Obj , 32 , 10 , "m" ) object from Parcels as "p" where p . ESR_EJDNR = 8400005654 into Query5 Select p . ESR_EJDNR , aggregatebuffer ( p . Obj , 32 , 10 , "m" ) from Parcels as "p" where p . ESR_EJDNR = 8400005654 into Query6 group by p . ESR_EJDNR Map From Addresses,Streets,Query6,Nature_Conservation_Areas_Prop ,Nature_Conservation_Areas,Planning_Zones_Proposal,Planning_Zones,Parcels,DTK_Skærmkort Position (0.75,2.45833) Units "in" Width 9.89167 Units "in" Height 4.45833 Units "in" Set Window FrontWindow() ScrollBars Off Autoscroll On Enhanced On Smooth Text Antialias Image High Vector Antialias Set Map CoordSys Earth Projection 8, 115, "m", 9, 0, 0.9996, 500000, 0 Center (547766.2685,6303441.682) Zoom 1564.794702 Units "m" Preserve Zoom Display Zoom Distance Units "m" Area Units "hectare" XY Units "m" Distance Type Cartesian Set Map Layer 1 Display Global Global Pen (1,2,22015) Brush (1,16777215,16777215) Symbol (32,14708736,4,"MapInfo Symbols",0,0) Line (2,2,22015) Font ("Arial",0,8,8421504) Selectable Off Override Add "Layer Display Override" Zoom (0, 5000) Units "m" Enable On Override Add "Layer Display Override" Zoom (5000, 50000) Units "m" Enable On Symbol (35,8421504,4,"MapInfo Symbols",0,0) Label Line Arrow Position Center Font ("Arial",256,7,0,16777215) Pen (1,2,0) With StreetBuildingIdentifier Parallel On Auto On Overlap Off Duplicates On Offset 2 Visibility Zoom (0, 5000) Units "m" Layer 2 Display Graphic ...
In the example below, you can see that I have inserted a couple of statements that help me analyze how long time MapInfo Pro is using to load the individual parts of the workspace:
!Workspace !Version 1900 !Charset UTF-8 Print Time(24) + " Opening tables..." Open Table "Addresses" As Addresses Interactive Open Table "Nature Conservation Areas" As Nature_Conservation_Areas Interactive Open Table "Nature Conservation Areas Proposals" As Nature_Conservation_Areas_Prop Interactive Open Table "Planning Zones" As Planning_Zones Interactive Open Table "Planning Zones Proposal" As Planning_Zones_Proposal Interactive Open Table "Parcels" As Parcels Interactive

#MapInfoMonday - Articles from 2020 53
Open Table "DTK Skærmkort.TAB" As DTK_Skærmkort Interactive Open Table "Streets" As Streets Interactive Print Time(24) + " Running Queries..." Select * from Parcels as "p" where p . ESR_EJDNR = 8400005654 into Query3 Select p . * , CartesianBuffer ( p . Obj , 32 , 10 , "m" ) object from Parcels as "p" where p . ESR_EJDNR = 8400005654 into Query4 Select p . * , CartesianBuffer ( p . Obj , 32 , 10 , "m" ) object from Parcels as "p" where p . ESR_EJDNR = 8400005654 into Query5 Select p . ESR_EJDNR , aggregatebuffer ( p . Obj , 32 , 10 , "m" ) from Parcels as "p" where p . ESR_EJDNR = 8400005654 into Query6 group by p . ESR_EJDNR Print Time(24) + " Creating a map..." Map From Addresses,Streets,Query6,Nature_Conservation_Areas_Prop ,Nature_Conservation_Areas,Planning_Zones_Proposal,Planning_Zones,Parcels,DTK_Skærmkort Position (0.75,2.45833) Units "in" Width 9.89167 Units "in" Height 4.45833 Units "in" Set Window FrontWindow() ScrollBars Off Autoscroll On Enhanced On Smooth Text Antialias Image High Vector Antialias Print Time(24) + " Configuring the map..." Set Map CoordSys Earth Projection 8, 115, "m", 9, 0, 0.9996, 500000, 0 Center (547766.2685,6303441.682) Zoom 1564.794702 Units "m" Preserve Zoom Display Zoom Distance Units "m" Area Units "hectare" XY Units "m" Distance Type Cartesian Print Time(24) + " Configuring the layers..." Set Map Layer 1 Display Global Global Pen (1,2,22015) Brush (1,16777215,16777215) Symbol (32,14708736,4,"MapInfo Symbols",0,0) Line (2,2,22015) Font ("Arial",0,8,8421504) Selectable Off Override Add "Layer Display Override" Zoom (0, 5000) Units "m" Enable On Override Add "Layer Display Override" Zoom (5000, 50000) Units "m" Enable On Symbol (35,8421504,4,"MapInfo Symbols",0,0) Label Line Arrow Position Center Font ("Arial",256,7,0,16777215) Pen (1,2,0) With StreetBuildingIdentifier Parallel On Auto On Overlap Off Duplicates On Offset 2 Visibility Zoom (0, 5000) Units "m" Layer 2 Display Graphic ...
Finally, you should also add a statement at the end of the workspace so that you can see the total load time.
Save the changes to the workspace file in your text editor, and load the workspace file in MapInfo Pro.
As the workspace file is being loaded, you should see text appear in the Message window similar to what you can see below.

#MapInfoMonday - Articles from 2020 54
In my example, you can see it took MapInfo Pro one second to load the workspace. It can take a bit longer before all the windows have been rendered to the screen.
As you work your way through the analysis, it can be necessary to add more statements. If you for example learn that MapInfo Pro is taking a long time opening the tables, you might want to add more statements between the individual tables to figure what specific table(s) is/are the main problem.
Please note that you can't insert these additional lines anywhere in the workspace. You need to make sure they aren't inserted in the middle of an existing statement as that will break the workspace. As a rule of thumb only add statements before a line that hasn't been indented.
I hope this gives you a few ideas on how to pin down potential performance issues you might have when loading workspaces into MapInfo Pro.
Find the article here in the Knowledge Community.
Copyright © 2022 FDOKUMEN