The Role of Economic Growth and Spatial Effects in Poverty in Northern Hungary
http://www.socialsciences.imdea.org/http://repec.imdea.org
in Economics and Social Sciences
Ctra. Colmenar Viejo km. 14, 28049 Madrid, Spain
soci
al s
cien
ces
workingpapers series
www.imdea.org
inst
itute
2011/18
In search of the
‘economic dividend’ of devolution:
Spatial disparities, spatial economic
policy and decentralisation in the UK
by Andy Pike, Andrés Rodríguez-Pose,
John Tomaney, Gianpiero Torrisi and Vassilis Tselios
October 2011
1
In search of the ‘economic dividend’ of
devolution: Spatial disparities, spatial economic
policy and decentralisation in the UK by
Andy Pikea, Andrés Rodríguez-Poseb, John Tomaneya,d,
Gianpiero Torrisia and Vassilis Tseliosc
a Centre for Urban and Regional Development Studies (CURDS), Newcastle University, UK b Department of Geography and Environment, London School of Economics, UK and IMDEA Social Sciences Institute, Madrid, Spain
c Department of Economic Geography, Faculty of Spatial Sciences, University of Groningen, The Netherlands
d Institute for Regional Studies, Monash University, Australia
wor
king
pape
rs s
erie
s
2
In search of the ‘economic dividend’ of devolution: Spatial disparities, spatial economic policy and decentralisation in the UK Abstract After a decade of devolution and amid uncertainties about its effects, it is timely to assess and reflect upon the evidence and enduring meaning of any ‘economic dividend’ of devolution in the UK. Taking an institutionalist and quantitative approach, this paper seeks to discern the nature and extent of any ‘economic dividend’ through a conceptual and empirical analysis of the relationships between spatial disparities, spatial economic policy and decentralisation. Situating the UK experience within its evolving historical context, we find: i) a varied and uneven nature of the relationships between regional disparities, spatial economic policy and decentralisation that change direction during specific time periods; ii) the role of national economic growth is pivotal in explaining spatial disparities and the nature and extent of their relationship with the particular forms of spatial economic policy and decentralisation deployed; and, iii) there is limited evidence that any ‘economic dividend’ of devolution has emerged but this remains difficult to discern because its likely effects are over-ridden by the role of national economic growth in decisively shaping the pattern of spatial disparities and in determining the scope and effects of spatial economic policy and decentralisation.
Keywords: Economic Dividend, Devolution, Spatial Disparities, Spatial Economic Policy, Decentralisation, UK
wor
king
pape
rs s
erie
s
3
Introduction: In search of the ‘economic dividend’ of devolution
The idea of an ‘economic dividend’ has gained significant momentum internationally
and in the UK as a powerful and persuasive argument in the politics and economics of
decentralisation, reflecting a broader international shift from identity to economy
rationales in contemporary forms of state modernisation and ‘rescaling’ (Lobao et al.
2009; Rodríguez-Pose and Sandall 2008). The ‘economic dividend’ is principally
articulated in terms of generating allocative and productive efficiencies alongside the
accountability and participation benefits of decentralisation for decision-making and
co-ordinating collective action in support of economic development (Rodríguez-Pose
and Gill 2005). In the UK in the late 1990s, for example, political advocates argued
for devolution in Wales to improve its economic performance and productivity to
create more and better jobs (Davies 1999). Devolved regional government in the
English regions too was promoted as an ‘economic imperative’ to address the
‘economic deficit’ of persistent spatial disparities between London, the Greater South
East region and the rest (Murphy and Caborn 1996).
Yet, despite its often active political promotion, assessments of the ‘economic
dividend’ are unclear. In the UK, the ESRC’s 6-year research programme on
Devolution and Constitutional Change concluded that:
There is little evidence to suggest that an ‘economic dividend’ should be
expected from devolution, or has yet appeared. There is much to suggest that
devolution – even administrative devolution in England – will lead to a
widening of regional economic disparities, and that there is only a limited
wor
king
pape
rs s
erie
s
4
capacity on the part of UK government to intervene to secure UK wide
economic balance (Jeffery 2006: 1).
More than a decade on from the initial constitutional and devolutionary reforms in the
UK in the late 1990s, it is timely to assess and reflect upon the evidence and enduring
meaning of the ‘economic dividend’ of devolution in the UK. Little research has been
undertaken on this issue to date because it is a far from straightforward task, given the
view that its impacts are “likely to be complex, subtle and difficult to measure”
(Jeffery 2006: 1). Thorny problems include: the contested conceptualisation of any
‘economic dividend’ and its relationships to other forms of dividend (social, political,
cultural); the development of appropriate proxy measures relevant to particular
national contexts; assembling available data of appropriate quality, historical coverage
and international comparability; disentangling and isolating the effects of
decentralisation; and, attributing causation amongst decentralisation’s myriad
relationships with broader economic and institutional change over time (Ashcroft et
al. 2005; McGregor and Swales 2005). Despite such challenges, the need to examine
the evidence is pressing because it is recognised that “weakly supported” and
“optimistic claims” for any ‘economic dividend’:
…drew heavily on academic research on a ‘new’ economic regionalism which
was perhaps too quick to draw generalisations from a combination of
ambitious theory and a narrow range of case studies. More recently
researchers have been more sanguine, balancing their initial optimism with a
fuller consideration of the constraints on improved economic performance and
wor
king
pape
rs s
erie
s

5
on the negative economic impacts that devolution could bring (Jeffery
2006:1).
The situation in Wales is illustrative of the resonance and inconclusive status of the
issue. Accepting that it was the “dirty little secret” of devolution debates, the former
Chair of the Yes Campaign in Wales acknowledged the lack of a necessary and
directly causal connection between decentralisation and economic development and
its geographical unevenness: “In fact…all the important economic indicators in Wales
are going the wrong way. You could say there has been an economic dividend for
Cardiff, but not beyond that…The Labour Government has assumed that devolution is
the recipe for economic development, but in fact it’s just one of the ingredients”
(Kevin Morgan, Cardiff University, cited in Hayman 2008: 1). Further studies are
required, then, especially given that while the economic benefits of decentralisation
are “widely accepted amongst governments and international organisations alike, the
empirical proof for this proposition remains scant” (Rodríguez-Pose et al. 2009: 2041;
see also Balaguer-Coll et al. 2010; Tomaney et al. 2011).
The approach taken here integrates its institutionalist and quantitative analysis in the
context of the unfolding histories of institutional, political and economic change over
time and space within the particularity of the UK state. The argument is that analysis
of any ‘economic dividend’ of devolution in the present needs to be rooted in the past
evolutions of spatial disparities, spatial economic policy and decentralisation within
the political-economies of particular nation states. The historical dimension of the
analysis is critical in understanding the path dependencies that shape the evolution of
wor
king
pape
rs s
erie
s
6
institutional structures and policy approaches over time and space, reflecting legacies
of political choices, strategies and struggles.
With the aim of assessing and reflecting upon the evidence and enduring meaning of
the ‘economic dividend’ of devolution in the UK over a decade after the institutional
and political reforms introduced from 1997, the paper first addresses some conceptual
issues in considering the relationships between spatial disparities, spatial economic
policy and decentralisation. Despite the constraints of comparable data availability,
the analysis then focuses upon the period 1984-2007 in an attempt to discern the
existence (or otherwise), extent and nature of any ‘economic dividend’ arising from
the inter-relation of spatial disparities, spatial economic policy and devolution in the
UK. Last, some conclusions and reflections are provided.
Spatial disparities, spatial economic policy and decentralisation
Given its complex and unclear inter-relationships, the approach here situates the
consideration of any ‘economic dividend’ arising from devolution within an
understanding of the changing relations between spatial disparities, spatial economic
policy and decentralisation. An evolution is evident in the ways in which spatial
disparities are understood and explained with implications for how spatial economic
policy and decentralisation are formulated and implemented. We discern stylised
kinds of approaches – redistributive, free-market and growth-oriented – with different
characteristics concerning their economic theory, causal explanation of spatial
disparities, adjustment process, policy rationales and instruments, institutional
wor
king
pape
rs s
erie
s
7
organisation, geographical focus and scope, political-economic project and language
(Table 1). Spatial economic policy is understood as forms of economic policy with
spatial intent – such as regional or urban policy. We recognise the need and difficulty
of disentangling this from economic policy without explicit spatial intent but with
spatial implications – such as macro-economic, welfare or defence policy. We
acknowledge too the more recent debates about ‘spatially neutral’ or ‘blind’ policy
that is focused upon ‘people’ rather than ‘place’ and explains spatial disparity as the
compositional outcome of sorting processes driven by rational economic agents (see,
for example, Overman 2010).
Transitions in spatial economic policy reflect developments within economic theory
and their differing causal explanations for spatial disparities and views of adjustment
processes. These conceptual and theoretical ideas are then mediated and translated
into policy rationales and instruments within the institutional structures of particular
national political economies (Pike and Tomaney 2009). Uneven, partial and messy
transitions, overlaps and struggles undoubtedly mark the political economy of such
shifts that play out in different ways in different national contexts. The ‘spatial
Keynesianism’ (Martin and Sunley 1997) that marked state intervention through
redistributive forms of policy focused upon investment, stimulation of cumulative
causation and management of aggregate demand and employment in the regions has
been constructed and unravelled toward free market forms in different ways over
differing time periods in different national settings. Emergent approaches in the
growth-oriented form that echo these uneven transitions are evident in the OECD’s
(2010) ‘new paradigm’ (Table 2) and in the UK in New Labour’s ‘new regional
policy’ between 1997 and 2010 (Balls and Healey 2001).
wor
king
pape
rs s
erie
s
8
<Tables 1 and 2 about here>
Integrally related to the changes in how spatial disparities are interpreted and spatial
economic policy formulated is a marked shift in the geographical scale, level and
form of institutional organisation, delivery, government and governance from
centralisation toward varied forms of decentralisation. Indeed, it is critical to
recognise that devolution is only one particular form of decentralisation and itself
comes in different shapes and sizes, driven top-down and/or bottom-up by different
levels of state and non-state actors, and with differing motivations and expectations
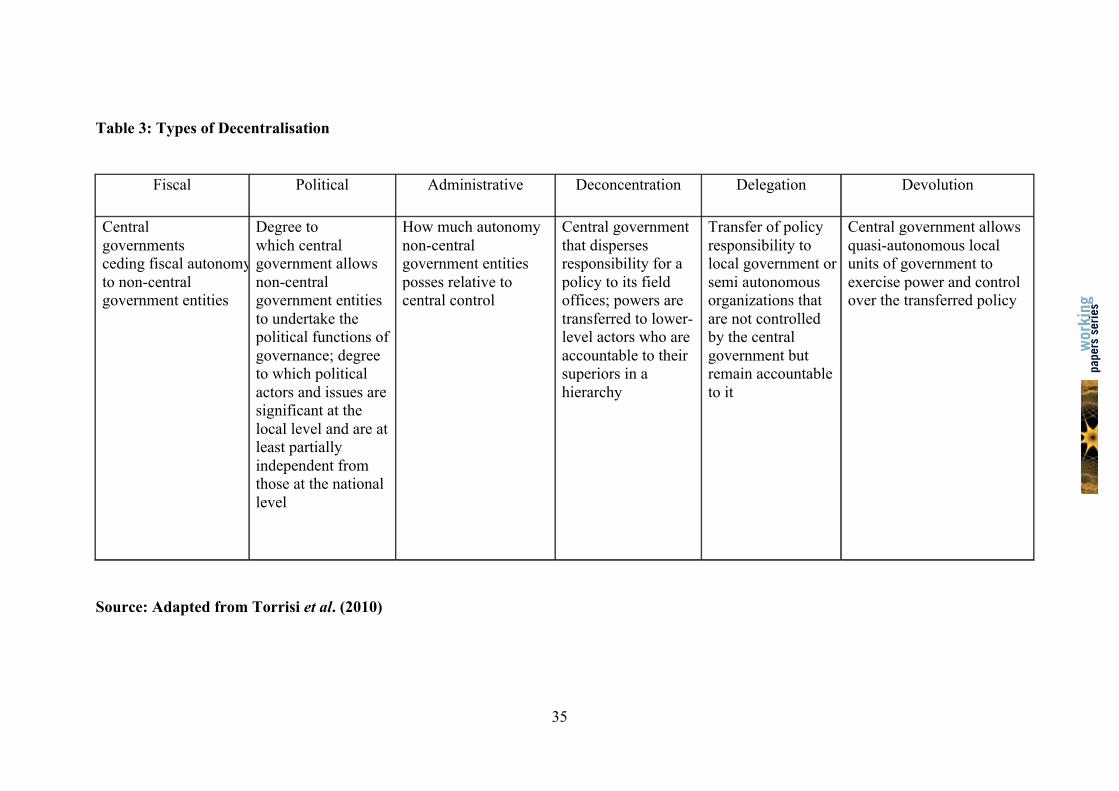
(Rodríguez-Pose and Gill 2005; Torrisi et al. 2010). Table 3 outlines the main types
of decentralisation which vary in their degree of autonomy in fiscal and functional
terms, balance of reserved and decentralised powers and responsibilities, and
administrative and/or democratic accountability. Some blurring and overlap between
these kinds of decentralisation is also evident in the practice and experience of
empirical cases, for example where elements of administrative, political and fiscal
decentralisation are combined in particular settlements and arrangements. In
emphasising the importance of historical context and the evolution of national
political economies, it is evident that as a ‘new state spatiality’ decentralisation will
be highly variegated in different nation states (Peck and Theodore 2007).
<Table 3 about here>
wor
king
pape
rs s
erie
s

9
In considering what any ‘economic dividend’ might mean, then, conceptualising the
potential economic benefits and costs of devolution as a specific kind of
decentralisation is central. Informed by the key arguments from fiscal federalism that
focus upon the existence of allocative and productive efficiencies and accountability
and participation, Table 4 summarises some of the main issues. Several other
concerns are also important to the analytical task. First, decentralisation is widely
acknowledged as a process rather than a one-off event; there is little sense in splitting
the analytical frame into ‘pre-’ and ‘post-’devolution periods. Indeed, understanding
and capturing the timing and lag of any potential benefits and costs flowing from
decentralisation has bedevilled studies to date (McGregor and Swales 2005). Second,
it is important to distinguish the expected or likely benefits and costs of specific forms
of decentralisation such as devolution from what are considered the unexpected,
unlikely and/or somehow additional bonus or windfall economic implications implied
by the term ‘dividend’. Last, given that much of the discussion of the ‘economic
dividend’ to date has focused upon potential efficiency benefits, attention is required
to consider the equity concerns of the distributional impacts of decentralisation in
economic, social and geographical terms.
<Table 4 about here>
wor
king
pape
rs s
erie
s

10
While the aspiration might be to produce some kind of direct and conclusive test or
evaluation of the overall net balance of economic outcomes generated from both
positive and negative effects of devolution, the inter-relatedness of spatial disparities,
spatial economic policy and decentralisation involved means a more finely grained
and nuanced assessment and account is required. Analysts searching for the
‘economic dividend’ need to accept that it may or may not exist and that its extent and
nature over time and space are likely to be highly variable and differentiated;
reflecting potentially strong, weak and indifferent degrees of both positive and
negative impacts as well as place-specific spill-overs from the economic into different
kinds of political, social and cultural domains in the political economies of particular
nation states and territories.
An ‘economic dividend’ of devolution in the UK?
The UK provides the object of analysis and is an important case to consider the
evidence and meaning of any ‘economic dividend’ of devolution for several reasons.
First, the UK has been marked by persistent spatial disparities, especially since the
1930s, which have endured and exerted significant influence upon the national
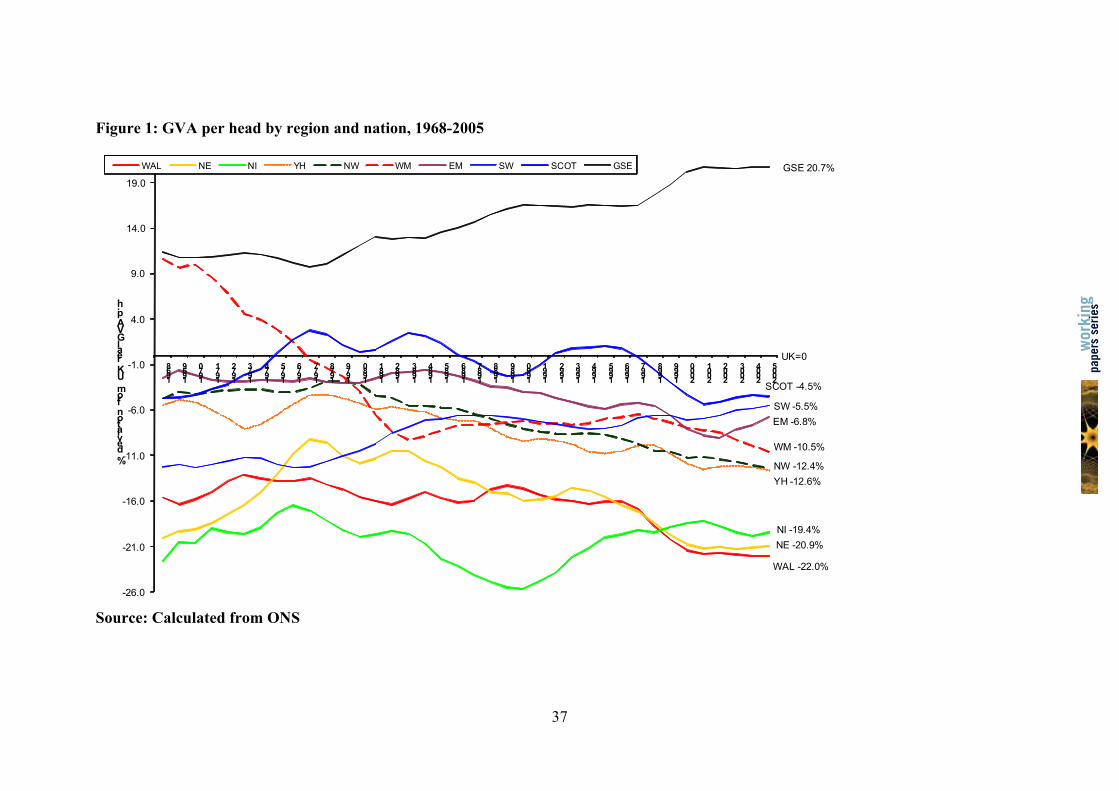
political economy, politics and policy (Martin 1988). Figure 1 illustrates the evolution
of spatial disparities since the late 1960s and reveals the growing gap between
London and the Greater South East and the other nations and regions in the UK.
Second, givens its experience of spatial disparities, the UK has a long history of
development and experimentation with spatial economic policy, punctuated by
institutional innovation, ‘policy on’ and policy off’ episodes alongside ongoing,
periodic scrutiny and reflection upon its principles and purpose (see, for example,
wor
king
pape
rs s
erie
s
11
Barlow 1940; Harrison and Hart 1993; House of Commons 1995; 2003). As Figure 2
shows, the UK has undertaken its own path through the different forms of spatial
economic policy from the redistributive era of capital and labour subsidies up until the
late 1970s through the free market retrenchment during the 1980s and emergence of
more growth oriented forms from the mid-1990s (Fothergill 2005; Pike and Tomaney
2009, 2010). Significantly, the ‘economic dividend’ argument has been central to this
evolution as “Centralised regional policy, the aim of which was to promote economic
equity between the regions, has been replaced by a devolved regional policy which
aims to promote an economic dividend within each region” (Morgan 2006: 3;
emphasis added). Last, the UK is a highly centralised multi-national union state which
only introduced significant decentralisation reforms in its particular form of limited
and conditional devolution and constitutional change in the late 1990s, encompassing
more decentralised governance of spatial economic policy (Marks et al. 2008; Morgan
2007).
< Figure 1 and 2 about here >
That ‘devolution is a process not an event’ (Davies 1999) in the words of the former
Secretary of State for Wales has become a well worn descriptor that nonetheless
characterizes the evolutionary and unfolding nature of decentralisation. Hence, while
the analysis here is focused upon discerning the existence or otherwise of an
‘economic dividend’ in the UK following the institutional changes introduced from
1997, the argument is that such changes need to be situated in the context of
wor
king
pape
rs s
erie
s
12
relationships between spatial disparities, spatial economic policy and decentralisation,
and reflect deep seated currents and legacies from previous eras of change. Our
approach is based on the combined historical paths of three key elements – spatial
disparities, spatial economic policy and decentralisation – during the period 1984 to
2007 (local revenue data are only available for a shorter period from 1987).
Building upon Rodríguez-Pose and Gill (2004) and in the context of constraints in the
backward reach of available data, we consider the historical evolution of spatial
disparities and decentralisation but introduce a new dimension by augmenting the
analysis with a quantitative measure of spatial economic policy. Further, given our
emphasis upon the importance of economic growth in shaping the dynamics of the
key variables, we investigate the implications of including the system's overall
national economic performance in our analysis (i.e. national economic growth and
national economic development). This issue has been identified as important in the
fiscal federalism literature. For example, Oates (1999: 1142) suggests “it may well be
that fiscal decentralisation itself has a real contribution to make to improved economic
and political performance at different stages of development”. In addition, aggregate
economic growth may also be considered as a proxy for the kinds of allocative and
productive efficiencies said to be generated by decentralisation (Rodríguez-Pose et al.
2009). As far as the data availability has allowed, the analysis has gone back to situate
more recent changes in their appropriate historical and economic context.
We use the Gini index (Gini) of regional Gross Disposable Household Income
(GDHI) per head (data from Office for National Statistics) as the proxy for spatial
wor
king
pape
rs s
erie
s
13
disparities1. Although the aggregate nature of data does not allow us to correct for
differences in household composition at the single household level, we adopted a
modified OECD equivalence scale in order to take into account regional differences in
household composition and size generating different economies of scale. More
precisely, the following formula consisting of the ratio between aggregate income
earned by households resident in region j ( ) and a measure of aggregate population
taking into account differences in household size and composition across regions ( )
eq.(1)
has been applied in order to compute per head values of GDHI in region “j” ( ). The
final step consisted of computing the Gini index of across the “R” regions, by
year, according to the formula
eq. (2)
where and , with (i.e. is non-decreasing
ordered)2.
1 The choice of GDHI per head as our dependent variable is not trivial and has important implications. The choice of regional gross disposable income per capita over the Gini index of GDP per capita has the advantage of including transfers of income from individuals, companies and government in the form, for example, of social benefits (European Commission 1999). But, on the other hand, “a region that has a low level of production might have a relatively high level of income due to large social security transfers, but it would still be a less favoured region” (European Commission 2004: 25-26). 2 The complete procedure, including GDHI components and computation, as well as the following measure of policy, is available from the authors on request.
wor
king
pape
rs s
erie
s
14
Given that all measures of fiscal policy have their own regional bias (Short 1981;
Armstrong and Taylor 2000), for spatial economic policy we use a proxy of policy
(Policy) reflecting direct intervention on income. This consists of the difference
between the Gini index calculated on primary household income per head – therefore
before direct policy intervention on income – and the same index calculated on GDHI
per head3. The latter takes into account direct policy intervention on income by means
of positive elements such as social benefits received and other current transfers
received (total secondary resources) and negative elements such as current taxes on
income and wealth (e.g. income tax, council tax), social contributions paid (e.g.
employees pension and social security contributions) and other current transfers paid
(total secondary uses). Therefore, Policy is intended as a broad and regional version
(by considering policy measures other than taxes) of the Reynolds and Smolensky
(1977) index usually calculated to measure the progressiveness of tax systems.
Clearly, this measure theoretically ranges between zero (reflecting total
ineffectiveness of state intervention in reducing spatial disparities) and the value of
the Gini index relative to primary income4 (reflecting the effectiveness of state
intervention in reducing all spatial disparities characterising the distribution of
primary income).
Challenging and enduring methodological issues are involved in calculating measures
able to capture the degree of autonomy afforded to sub-national, regional and local
levels of government through variegated forms of decentralisation (Martinez-Vazquez
and Timofeev 2009; Torrisi et al. 2010). The measure of fiscal decentralisation used
is based upon the local to total general government revenue ratio (Fiscal
3 Per head values computed using in both cases. 4 This would imply a Gini index after state intervention equal to zero.
wor
king
pape
rs s
erie
s
15
Decentralisation). This is a standard measure that is widely used in the international
literature (Oates 1985, Woller and Phillips 1998, Akai and Sakata 2002, Rodríguez-
Pose and Gill 2004). It provides a proxy for capturing the decentralisation of fiscal
powers and responsibilities to lower tiers of government beneath the national level. In
common with other proxy measures it has some limitations. As a relatively narrow
financial and quantitative measure, it is unable fully to capture the distinctive and
variegated nature of decentralisation forms in particular national contexts. This is
relevant in the UK, for example, with very limited and uneven decentralisation of
revenue-raising powers in comparison with greater autonomy over expenditure in the
devolved territories through the block grant mechanism. In addition, where
decentralisation is focused upon legislative and policymaking rather than fiscal
powers this measure can be limited.
However, here we are examining the value of this approach in considering the UK
case in the context of our wider aim of international comparison of the historical
evolution of spatial disparities, spatial economic policy and decentralisation. As a
result, for our specific purposes this measure is preferred to alternative measures used
elsewhere in the literature. First, an expenditure-based measure is not appropriate for
our analysis because the share of local to total national expenditure is not statistically
correlated with our measure of spatial disparities5 and the data is not available across
all EU member states. Second, the uneven nature of the devolution arrangements
within the UK needed a measure capable of capturing the range from the weakest
decentralisation in England to the strongest in Scotland. Third, alternative measures
more explicitly taking into account institutional factors – such as the Regional
5 The Spearman correlation index between Gini and the share of sub-national expenditure in total expenditure is equal to 0.3727 with a p-value of 0.0961.
wor
king
pape
rs s
erie
s

16
Authority Index (Marks et al. 2008) and different decentralisation factor scores
(Schneider 2003) – try to capture the decentralisation of policy and law making
powers but are time-invariant and provide only a temporal snap shot unable to analyse
historical evolution over time. Last, the available data on Government Finance
Statistics from Eurostat provides broad geographical coverage and time series to
enable our broader project of international comparison and historical analysis.
Therefore, given these data, measurement and commensurability constraints as well as
the particular context of the UK’s highly centralised institutional setting, we argue
that this measure is most appropriate for the aims of this study.
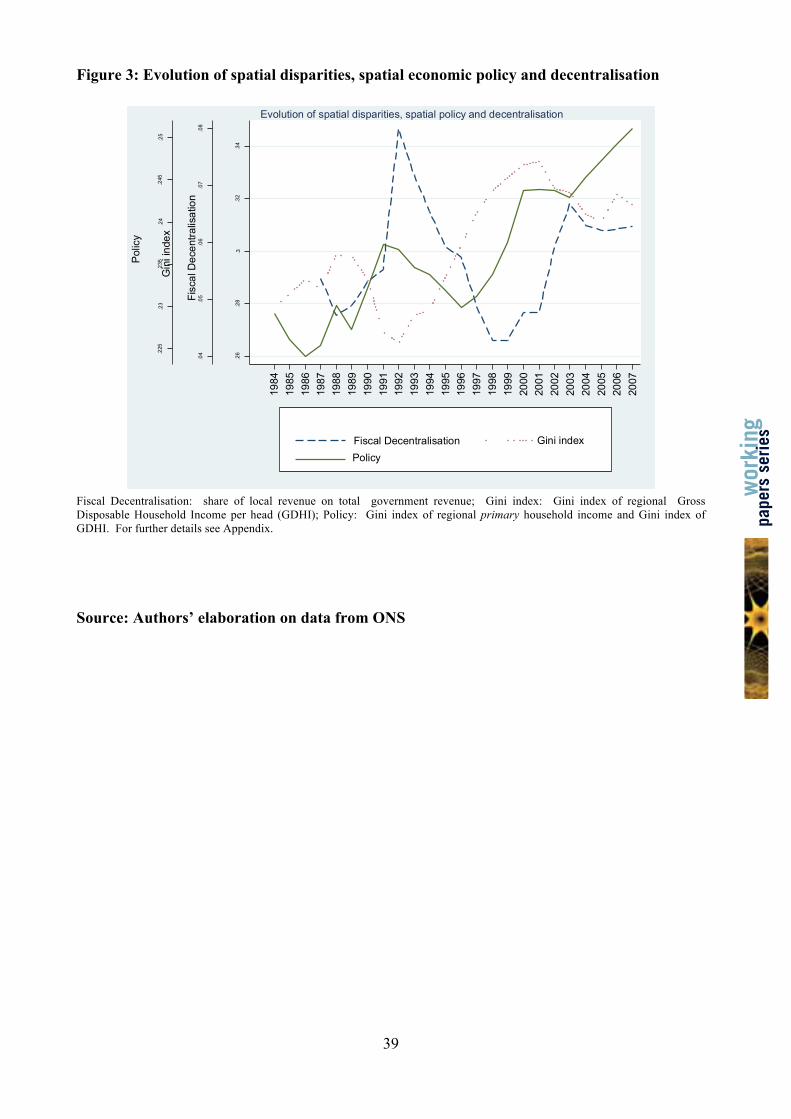
Figure 3 displays the historical evolution of the three variables introduced above in
the UK. The evolution of the line representing the Gini coefficient in Figure 3 shows
that regional disparities have tended to rise during the period of analysis and that their
behaviour has been clearly affected by national economic cycles. The period of the
end of the 1980s growth witnessed a relatively steady increase in spatial disparity.
But, as boom turned to bust in the recession in the early 1990s, spatial disparities in
the UK fell sharply, reaching their nadir in 1992. The economic recovery that ensued
signalled a return to the growth in spatial disparities, which was particularly
pronounced during the last two years of the Major Conservative government and
during the Blair’s first Labour government, peaking in 2001. Since then, and
coinciding with the greater investment in public services of the second and third
Labour administrations, spatial disparities have marginally declined (Figure 3). This
economic cycle-led evolution of disparities fits well with the sheltered-economy
evolution of spatial disparity proposed by Rodríguez-Pose and Fratesi (2007): while
the wealthier and more open regions of the South East of England experience the
wor
king
pape
rs s
erie
s

17
vagaries of the market to a greater extent than the rest of the UK, the increasing
dependence of the poorer northern and western regions on non-market oriented
services – as a consequence of the relative decline of their traditional industrial base –
has made them more impervious to changes in market circumstances. In addition, the
differential sectoral structure and diversity of the private sector in London and the
South East supports its prosperity and resilience rather than its lesser dependence
upon the state per se. This explains the tendency for UK nations and regions to
diverge in periods of boom and to converge in periods of economic crisis (Martin
1993).
< Figure 3 about here>
Having established that the evolution of spatial disparities in the UK seems to be the
result of the combination of market exposure and economic cycles, to what extent has
its particular form of devolution played a role in this process? The Fiscal
Decentralisation variable in Figure 3 illustrates the association between devolution
and the evolution of spatial disparities may have been more than testimonial.
Decreases in sub-national government autonomy in the late 1980s and in the mid- to
late 1990s due to the abolition of Metropolitan Councils and the cutting of the rate
support grant (Duncan and Goodwin 1988), coincide with significant increases in
spatial disparity. By contrast, the apparent rise in fiscal devolution between 1989 and
wor
king
pape
rs s
erie
s
18
1992 is associated with the biggest decline in spatial disparities (Figure 3)6. While
establishing a cause-effect relationship between both phenomena is impossible just by
looking at Figure 3, their coincidence in time may mean that even the limited fiscal
devolution policies pursued by successive British governments in periods of boom
and bust may have played a non-negligible role in shaping spatial disparities.
Regarding the relationship between the evolution of spatial economic policy and the
evolution of spatial disparities, the interaction of the lines points towards a situation
whereby until 2003, at least, spatial economic policy reacts to – rather than shapes –
changes in spatial disparity. The rise in disparities of 1988-1989 is followed by a rise
in spatial policy intervention in subsequent years, while the decline in disparities of
the early 1990s signals the effects of the national automatic stabilizers and a declining
national state involvement in spatial economic policies. This policy trend is only
redressed after 1996, when the evidence of spatial disparities rising anew becomes
clear (Figure 3). Only after 2003 there seems to be a possibility of spatial economic
policies shaping spatial disparities and not vice versa (Figure 3). But to what extent
can we say that changes in spatial disparity are the result of a combination of national
economic cycles and variations in fiscal decentralisation and spatial economic
policies? In order to investigate further the changing relations between spatial
disparities, spatial economic policy and decentralisation for the UK introduced above
and to better discern which factors may be related to shifts in growth patterns and to
changes in policies we also consider changes in national economic performance
(Growth). The rationale here is that all the variables considered are linked with the
6 We address the issue of the reliability of the devolution measure utilised in this analysis further in this section. At this stage both the “decrease in sub-national government autonomy” and the “massive rise in fiscal devolution” should be interpreted as if (our measure of) Fiscal Decentralisation would be able to reflect real change in the central-local relationship.
wor
king
pape
rs s
erie
s
19
economic performance of the system as a whole and that the relation between each
and economic performance is not clear ex ante. As mentioned earlier, shifts in
national economic growth – or changes in national economic cycles – may be the
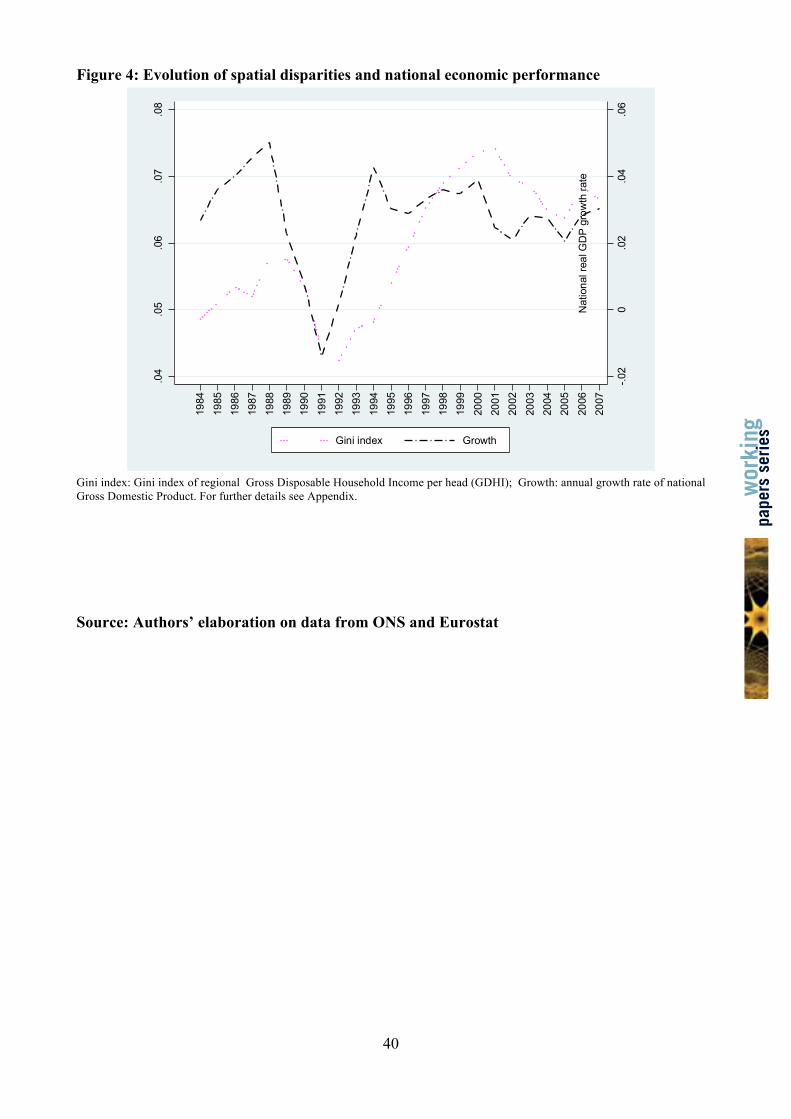
primary force behind the trajectory of spatial disparities in the UK. Figure 4 compares
the evolution of economic performance and regional disparities for the UK for the
period 1984-2007.
< Figure 4 about here >
The analysis illustrates the close relationship between national economic performance
and spatial disparities (Figure 4). With the exception of the most recent period (2005-
2007), the lines mirror each other with rises and declines in national growth tending to
be followed by similar rises and declines – albeit with different time lags depending
on the period – in spatial disparities at the regional level (Figure 4). The dynamic of
the relation between spatial disparities and national economic growth sheds some
light on the varied and uneven nature of the relationship between spatial disparities
and devolution and how it changes direction during specific time periods.
Decomposing Fiscal Decentralisation into its two main components, namely local
revenue (Local revenue) and general government revenue (General revenue), there
seems to be a mechanism linking spatial disparities and devolution with the national
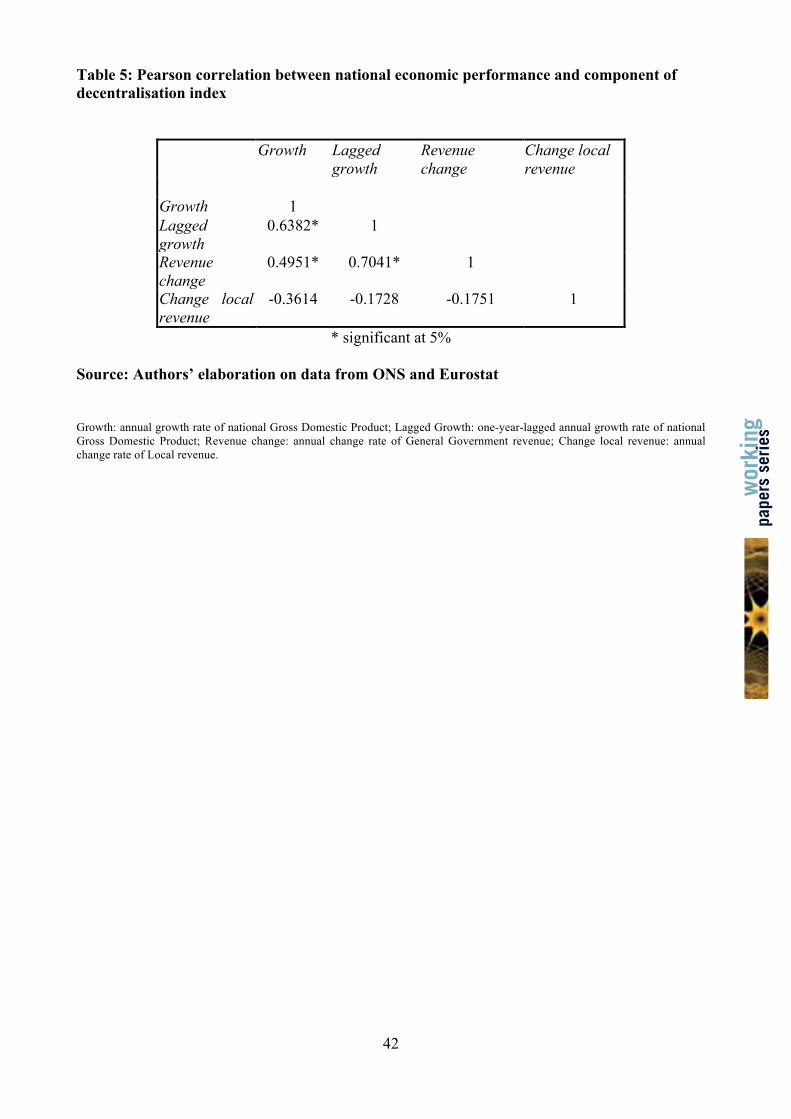
economic cycle. By including a one-year lagged growth rate (Lagged growth), Table
wor
king
pape
rs s
erie
s
20
5 shows: (i) the presence of a negative correlation7, though statistically neutral at 5%
significance level, between economic performance (Growth and Lagged growth) and
the annual change in the local revenue (Change local revenue); and, (ii) a positive
correlation between the former and the annual rate of total revenue change (Revenue
change). This underlines that, in times of economic expansion with increased spatial
disparities, the index of decentralisation – their ratio – has decreased and vice versa.
This evidence could be explained in terms of the traditional automatic stabilising
effect of central taxation with increases during the upturn (via income tax, VAT etc.)
and decline during recession, and the (statistically) neutral correlation between
economic performance and local revenue generally protected during recession (see
point (i) above).
< Table 5 about here>
This analysis suggests that the critical causal relationship is between spatial disparities
and national economic performance. Moreover, given the temporal lag in the relation
between economic performance and other variables emerging from the analysis
above, especially via total revenue (considering also that the correlation between its
change and past change in economic performance is higher than the one with present
economic performance, respectively 0.7370 and 0.5218), we hypothesise that
economic performance could be the initiating factor and that other variables follow its
7 The results reported in Table 4 and 5 refer to the Pearson correlation index. However, when resorting to alternative indices, such as the Spearman's rank correlation coefficients, which allow for non-linear correlation, the magnitude and significance of the coefficients is, by and large, unchanged.
wor
king
pape
rs s
erie
s
21
movement with opposite dynamics and explanations. In other words, the
interpretation of the empirical evidence of the relation between economic
performance and spatial disparities is that – if not wholly driven by the economic
cycle – the evolution of spatial disparities is strongly related to national economic
performance, rather than the result of any ‘economic dividend’ of devolution. This
analysis is based upon our chosen proxy for decentralisation which, while commonly
used in the literature, is – as we have acknowledged – not without its weaknesses
(Martinez-Vazquez and Timofeev 2009). The magnitude and direction of causality,
then, will benefit from further investigation in the context of our cross-national
comparative study (see, for example, Torrisi et al. 2011).
Our analysis suggests that spatial disparities depend heavily upon national economic
performance which, in turn, is strongly driven by geographical concentration of
economic activity in London and the Greater South East. The eventual ‘dividend’ in
terms of spatial disparities is therefore rooted in the national economic performance
strongly shaped by London and the Greater South East. In order to further investigate
these arguments, we perform an analysis on income polarisation across UK regions.
Since it is established that income inequality measures could be low even in the
presence of a strong polarisation (Esteban and Ray 1994), it is worth analysing them
separately. Although different indices of polarisation have been developed in the
literature (Wolfson, 1994; Wang and Tsui, 2000 ; Chakravarty and Majumder, 2001),
we adopt the widely used Generalised Esteban, Gardìn and Ray (2007) (EGR)
polarisation index. Therefore, we apply the following formula to regional GDHI per
head as defined above
wor
king
pape
rs s
erie
s

22
eq.(3)
where and denote respectively the (corrected) average income and the
numerical weight of group j; ∈[1,1.6] is the parameter that captures the degree of
sensitivity of our measure of polarisation, and is the parameter used to express
the weight assigned to the error term in determining group
composition.
Empirical results in the four-groups case – this choice being supported by previous
studies on regional clusters (Rodríguez-Pose and Vilalta-Bufi 2005, Ezcurra 2009) –
are shown in Figure 5. This figure, even with exceptions characterised by increasing
spatial disparities linked with decreasing polarisation (in 1984-1985, to some extent in
1987-1988 and during the economic recovery of 1992-1993) and vice versa (1986-
1987, 1991-1992 and the relatively recent period 2004-2005), confirms empirically
the positive correlation between spatial disparities and polarisation at the regional
level in the UK during the whole period 1994-2003 and the more recent upturn of
both measures in 2005-2006 and downturn relative to 2006-2007. We interpret this
close path involving regional disparities and regional polarisation, combined with the
strong relation between the former and national economic performance discussed
above, as a preliminary confirmation of the role played by the ‘winning’ (Ezcurra
2009) region of London and the Greater South East in driving national economic
performance and in determining its consequences for spatial disparities.
wor
king
pape
rs s
erie
s
23
< Figure 5 about here >
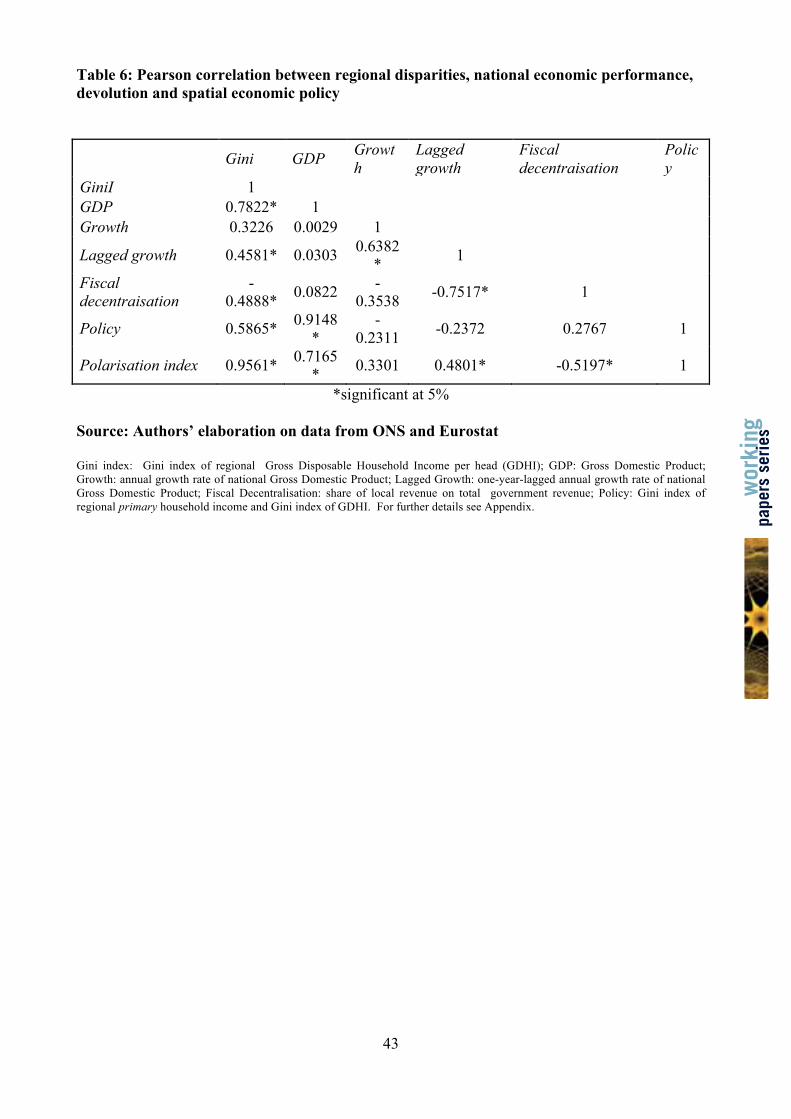
A final step, building upon the analysis of economic growth and Fiscal
decentralisation components, considers the correlations between variables in order to
capture the whole set of overall relations between each other. Table 6 shows this
correlation matrix. The correlations confirm and support the analysis above.
Nonetheless, some points are worth stressing. First, a rather counterintuitive positive
overall correlation between spatial policy and spatial disparity (0.6201) is found.
Indeed, given the formula used to calculate our measure of spatial economic policy,
ceteris paribus, an increase in regional disparities (Gini index relative to GDHI) will
result in a decrease in the measure of spatial economic policy. This is what registered
empirically, for example, during 1984-1986 with increasing spatial disparities linked
with a decrease in the measure of regional policy. However, our analysis confirms
that, overall, disparities in (primary) income before state intervention rose more than
disparities involving GDHI – i.e. once measures of policy operated – generating a
positive correlation between the spatial economic policy and spatial disparities.
Second, a negative overall correlation between decentralisation and spatial disparities
(-0.4807) is confirmed. Fiscal decentralisation is likely to increase the degree of
efficiency in the allocation of resources which may give rise to a spatially even
distribution of income. However, further consideration of national economic
performance and spatial polarisation indicators – combined with the analysis of
correlations reported in Table 5 – shows that this interpretation could be misleading.
Indeed, considering the level and growth rate of national GDP, a strong correlation
between spatial disparities, spatial polarisation and economic performance arises (for
wor
king
pape
rs s
erie
s

24
the former and GDP, Growth, and Lagged growth respectively 0.7844, 0.3905 and
0.4522, while, regarding polarisation, a correlation of 0.7165, 0.331 and 0.4801 is
registered with GDP, Growth and Lagged growth respectively). It is important too
that the coefficient for Lagged growth is – statistically significant at 5% level – and
slightly higher than the one for Growth (although not statistically significant at 5%) in
both cases confirming the existence of a temporal lag between both spatial disparities
and polarisation and their correlation with national economic performance.
< Table 6 about here >
Overall, the interpretation here sees the negative correlation between regional
disparities and devolution as a spurious one that could be explained in terms of the
positive correlation between spatial disparities, spatial polarisation, and national
economic performance combined with the negative correlation between economic
performance and the share of local revenue (-0.3538 and -0.7517 respectively for
Growth and Lagged growth)8. This evidence challenges the argument in favour of a
“strong positive correlation between this measure of devolution and the downturn in
regional per capita differentials” (Calamai 2009: 1140) and highlights the need for
further investigation of the dynamic of the role played by economic growth and
national growth poles. In terms of our analysis, these results have to be interpreted in
the sense that the simultaneous consideration of the historical path of spatial disparity,
spatial economic policy and devolution as separate variables is meaningful given that
8 An ADF test showed there was no co-integration between variables.
wor
king
pape
rs s
erie
s
25
both spatial economic policy and fiscal decentralisation measures incorporate distinct
information that cannot be properly inferred from the simple consideration of spatial
disparity only. This evidence gives further empirical strength to the results reported in
this paper.
Conclusions
More than a decade after the constitutional reforms of the late 1990s which began
devolution in parts of the UK, this paper has sought to assess and reflect upon the
evidence and enduring meaning of the ‘economic dividend’ of devolution in the UK.
Acknowledging the difficulties and methodological challenges involved in seeking to
discern such a complex, subtle and difficult to measure entity (Jeffery 2006), an
institutionalist and quantitative approach has been adopted. This study has sought to
embed any relationships between decentralisation, spatial economic policy and
changes in spatial disparities in their appropriate context of the unfolding histories of
institutional, political and economic change over time and space within the
particularity of the UK state. The UK’s highly centralised system has marked its
particular evolution and established a constrained context for any ‘economic
dividend’ to emerge. This contrasts with the more substantive and extensive fiscal
decentralisation in other countries which have experienced stronger, more widespread
and positive effects under certain conditions (Rodríguez-Pose and Ezcurra 2010).
The analysis has revealed, first, the varied and uneven nature of the relationships
between spatial disparities, spatial economic policy and decentralisation in the UK,
with important changes in direction during the period under analysis. Second, the role
wor
king
pape
rs s
erie
s
26
of national economic growth is pivotal in explaining the evolution of spatial
disparities and the nature and extent of their relationship with the particular forms of
spatial economic policy and decentralisation deployed. The dominance of national
economic growth within the current growth-oriented forms of spatial economic policy
has reinforced its decisive explanatory role, underlining the emergent trade-off
between national economic growth and politically tolerable levels of spatial
disparities (Martin 2008). Last, there was limited evidence that any ‘economic
dividend’ of devolution has emerged yet but this remains difficult to discern because
the likely effects are over-ridden by the role of national economic growth in
decisively shaping the pattern of spatial disparities and in determining the scope and
effects of spatial economic policy and decentralisation.
Given the central importance of the geographical concentration of growth in London
and the Greater South East to national economic growth and the role of state policy
and investment in seeking to accommodate its contradictions (Pike and Tomaney
2010), this ‘super-region’ (Birch et al. 2009) could be interpreted as the principal
beneficiary of the turn to a more growth-oriented spatial economic policy and the
modest decentralisation evident within the devolved arrangements in the English
regions compared to the rest of the UK. The advancement of the interests of an
already prosperous albeit highly unequal region sits uneasily with the ways in which
the ‘economic dividend’ of devolution was promoted as a means to address the
‘economic deficit’ and ameliorate the marked spatial disparities between the nations
and regions within the UK. This concern chimes with anxiety amongst commentators
and parliamentarians evident in the mid-2000s: “In the unlikely event that devolution
yields a uniform economic dividend in each region, the result does nothing to redress
wor
king
pape
rs s
erie
s

27
the territorial inequalities at the heart of the North-South divide. Treating unequals
equally is not a recipe for territorial justice” (Morgan 2006: 3; see also House of
Commons 2003).
The findings point toward the conclusion that even when it might be discerned, any
‘economic dividend’ of devolution is likely to be highly variable, taking different
forms and degrees, and may be episodic or fleeting in its duration. It appears highly
contingent upon particular paths of state institutional change across a range of scales
and to be strongly shaped by national economic growth, the nature of fiscal autonomy
and capacity and willingness for redistribution on the part of national central states.
This examination of the UK case highlights the difficulties of attempting to devise
simple tests and of seeking to make more general and conclusive claims about
‘economic dividends’ resulting from devolution. Indeed, the particularities of the UK
political economy – such as its lack of written constitution and relatively short policy
regime duration – may even amplify and prolong such uncertainties. We
acknowledge, however, that it might be that the timescale of our assessment may be
too foreshortened and that much more than a decade needs to elapse before the effects
of any ‘economic dividend’ become apparent. In addition, improvements are needed
in data availability and methodological development to help create proxies and
indicators able to capture the variegation of spatial economic policy approaches,
forms of decentralisation and evolving spatial disparities in different national contexts
in systematic and comparable ways. Despite these caveats, the study is worthwhile in
contributing to the continued relevance of the concern with the economic and indeed
other dividends of devolution that warrant further studies, especially international
comparative work.
wor
king
pape
rs s
erie
s
28
Acknowledgements
The paper has benefited from the support of the European Research Council under the
European Union’s Seventh Framework Programme (FP7/2007-2013)/ERC grant
agreement nº 269868 and of a Leverhulme Trust Major Research Fellowship. The
research is also part of the Prociudad-CM programme and of the UK Spatial
Economics Research Centre. The views expressed are those of the authors and do not
necessarily represent those of the funders.
wor
king
pape
rs s
erie
s
29
References
Akai N and Sakata M ,2002, “Fiscal decentralization contributes to economic growth: evidence form state-level cross-section data for the United States” Journal of Urban Economics 52 93–108 Armstrong H and Taylor J ,2000, Regional Economics and Policy (Blackwell, Oxford) Ashcroft B Swales J K and McGregor P G ,2005, “Is devolution good for the Scottish economy? A framework for analysis” Devolution Briefings No 26 March ESRC Devolution and Constitutional Change Programme http://www.devolution.ac.uk/Briefing_papers.htm; Accessed: 28 April 2010 Balaguer-Coll M T Prior D and Tortosa-Ausina E ,2010, Devolution Dynamics of Spanish Local Government WP-EC 2010-01 Instituto Valenciano de Investigaciones Económicas IVIE Spain Balls E and Healey J ,2001, Towards a New Regional Policy (The Smith Institute, London) Barlow Sir M ,1940, Report of the Royal Commission on the Distribution of Industrial Population (HMSO, London) Birch M Harding A and Rees J ,2009, “Having it both ways: explaining the contradiction in English spatial development policy” International Journal of Public Sector Management 22 7 587-604 Calamai L ,2009, “The link between devolution and regional disparities: Evidence from the Italian regions” Environment and Planning A 41 5 1129-1151 Chakravarty S R and A Majumder ,2001, “Inequality, polarization and welfare: theory and applications” Australian Economic Papers 40 1-13 Davies R ,1999, Devolution: A Process Not An Event (Institute of Welsh Affairs, Cardiff) Duncan S and Goodwin M ,1988, The Local State and Uneven Development (Polity, Cambridge) Esteban J M C Gardìn et al ,2007, “Extension of a measure of polarization with an application to the income distributions of five OECD countries” Journal of Income Inequality 5 1-19. Ezcurra R. ,2009, “Does Income Polarization Affect Economic Growth? The Case of the European Regions” Regional Studies 43 2 267-285. Fothergill S. ,2005, “A new regional policy for Britain” Regional Studies 39 5 659-667
wor
king
pape
rs s
erie
s

30
Harrison R T and Hart M ,1993, Eds, Spatial Policy in a Divided Nation (Jessica Kingsley, London) Hayman A ,2008, “Welsh devolution has ‘little economic impact’” Regeneration and Renewal 10 October (Haymarket, London) House of Commons ,1995, Regional Policy Trade and Industry Committee Fourth Report Session 1994-1995 (HMSO, London) House of Commons ,2003, Reducing Regional Disparities in Prosperity ODPM Committee Housing, Planning, Local Government and the Regions Committee Ninth Report of Session 2002-03 Vol. 1 Report HC 492-I (TSO, Norwich) Jeffery C ,2006, Final Report of the Devolution and Constitutional Change Programme School of Social and Political Studies University of Edinburgh Lobao L Martin R and Rodríguez-Pose A ,2009, “Editorial: Rescaling the state: new modes of institutional–territorial organization” Cambridge Journal of Regions, Economy and Society 2 1 3-12. Marks G Hooghe L. and Schakel A H ,2008, “Patterns of regional authority” Regional and Federal Studies 18 2 and 3 167-181. Martin R ,1988, “The political economy of Britain’s North-South divide” Transactions of the Institute of British Geographers 13 389-418 Martin R ,1993, “Remapping British regional policy: the end of the North-South divide?” Regional Studies 27 8 797-805 Martin R ,2008, “National growth versus spatial equality? A cautionary note on the new ‘trade-off’ thinking in regional policy discourse” Regional Science Policy and Practice 1 1 3-13 Martin R and Sunley P ,1997, “The post-Keynesian state and the space economy” in R Lee and J Wills ,Eds, Geographies of Economies (Arnold, London) 278-89 Martinez-Vazquez J and Timofeev A ,2009, “A fiscal perspective of state rescaling” Cambridge Journal of Regions, Economy and Society 2 85-105. McGregor P G and Swales K ,2005, “Economics of devolution/decentralization in the UK: Some questions and answers” Regional Studies 39 4 477-494 Morgan K ,2006, “Devolution and development: Territorial justice and the North-South divide” Publius: Journal of Federal Studies 36 1 189-206 Morgan K ,2007, “The polycentric state: New spaces of empowerment and engagement?” Regional Studies 41 9 1237-1251
wor
king
pape
rs s
erie
s
31
Murphy P and Caborn R ,1996, “Regional government: An economic imperative” in S Tindale ,Ed, The State and the Nations (IPPR, London) 184-221 Oates W E ,1985, “Searching for leviathan: an empirical study” American Economic Review 75 748–757 Oates W E ,1999, “An essay on fiscal federalism” Journal of Economic Literature 37 3 1120-1149 OECD ,2010, Regional Development Policies in OECD Countries (OECD, Paris) Overman H ,2010, Urban Renewal and Regional Growth: Muddled Objectives and Mixed Progress Centre for Economic Performance Election Analysis CEP LSE London Peck J and Theodore N ,2007, “Variegated capitalism” Progress in Human Geography 31 6 731-772 Pike A and Tomaney J. ,2009, “The state and uneven development: The governance of economic development in the post-devolution UK” Cambridge Journal of Regions Economy and Society 2 1 13-34. Pike A and Tomaney J ,2010, “State and economy: governing uneven development in the UK” in N M Coe and A Jones ,Eds, The Economic Geography of the UK (Sage, London) 91-109 Reynolds M and Smolensky E ,1977, Public Expenditures, Taxes, and the Distribution of Income: The United States, 1950, 1961, 1970 (Academic Press, New York) Rodríguez-Pose A and Ezcurra R ,2010, “Does decentralization matter for regional disparities? A cross-country analysis” Journal of Economic Geography 10 Rodríguez-Pose A and Fratesi U ,2007, “Regional business cycles and the emergence of sheltered economies in the southern periphery of Europe” Growth and Change 38 4 621-648. Rodríguez-Pose A. and Gill N. ,2004, “Is there a global link between regional disparities and devolution?” Environment and Planning A 36 12 2097-2117. Rodríguez-Pose A and Gill N ,2005, "On the 'economic dividend' of devolution" Regional Studies 39 4 405-420 Rodríguez-Pose A and Sandall R ,2008, “From identity to the economy: analysing the evolution of the decentralisation discourse” Environment and Planning C: Government and Policy 26 1 54-72 Rodríguez-Pose Tijmstra S J R and Bwire A ,2009, “Fiscal decentralisation, efficiency and growth” Environment and Planning A 41 9 2041-2062
wor
king
pape
rs s
erie
s
32
Rodríguez-Pose A and M Vilalta-Bufi ,2005, “Education, migration, and job satisfaction: the regional returns of human capital in the EU” Journal of Economic Geography 5 545-566. Schneider A ,2003, “Decentralisation: Conceptualization and measurement” Studies in Comparative International Development 38 3 32-56. Short J ,Ed, ,1981, Public Expenditure and Taxation in UK Regions (Gower, Farnborough Hants) Tomaney J Pike A Rodríguez-Pose A Torrisi G and Tselios V ,2011, Decentralisation Outcomes: A Review of Evidence and Analysis of International Data Final Report to Department of Communities and Local Government CURDS Newcastle Upon Tyne Torrisi G Pike A Rodríguez-Pose A Tomaney J and Tselios V ,2010, Defining and Measuring Decentralisation: A Critical Review Unpublished Paper CURDS Newcastle Upon Tyne Torrisi G Pike A Tomaney J and Tselios V ,2011, (Re-)exploring the Link between Devolution and Regional Disparities in Italy Unpublished Paper CURDS Newcastle Upon Tyne Wang Y and K Tsui ,2000, “Polarization orderings and new classes of polarization indices” Journal of Public Economic Theory 2 349-363. Wolfson M ,1994, “Divergent inequalities: theory and empirical results” The Review of Income and Wealth 43 401-22 Woller G M and Phillips K ,1998, “Fiscal decentralisation and LDC economic growth an empirical investigation” Journal of Development Studies 34 139–148 Wren C ,2005, “Regional grants: Are they worth it?” Fiscal Studies 26 2 245-75
wor
king
pape
rs s
erie
s

33
Table 1: Redistributive, Free-Market and Growth-oriented Spatial Economic Policy
Characteristic Redistributive Free-market Growth-oriented Economic theory Keynesian growth
theory Neo-classical (exogenous) growth theory
New (endogenous) growth theory
Causal explanation of spatial disparities
Low aggregate demand and investment, structural weaknesses
Inherited factor endowments and quality, inflexibility and immobility in factor markets
Constructed factor endowments and increasing returns generating productivity and innovation differentials
Adjustment process Spatial disparities persist through cumulative causation, multiplier, spread and backwash effects
Factor market adjustment returns to equilibrium and convergence reduces spatial disparities
Agglomeration and spill-over effects, national growth and spatial disparity trade-off
Policy rationales Redistribution for economic efficiency and spatial and social equity and balance
Improving factor market efficiency, flexibility and mobility
Market failures or equity
Policy instruments Automatic capital and labour subsidies, industrial development controls, infrastructure investment
Regional Selective Assistance, enterprise grants for SMEs and new start-ups
Innovation grants, Venture capital funds
Institutional organisation
Centralised, national
Centralised, national
Decentralised, sub-national, regional, city(-regional) and/or local
Geographical focus and scope
Regional Regional, local and urban
City(-regional)
Political-economic project
Social Democratic New Right, Neo-liberal
Third Way, Neo-liberal
Language Regional inequalities, redistribution
Regional and local divides, trickle-down
Spatial disparities, performance gaps spill-overs
Source: Authors’ research
wor
king
pape
rs s
erie
s

34
Table 2: Paradigm shift of regional development policy
Old paradigm New paradigm Problem recognition Regional disparities in
income, infrastructure stock and employment
Lack of regional competitiveness, underused regional potential
Objectives Equity through balanced regional development
Competitiveness and equity
General policy framework Compensating temporally for local disadvantages of lagging regions, responding to shocks (e.g. industrial decline) (Reactive to probems)
Tapping underutilised regional potential through regional programming (Proactive for potential)
- Theme coverage Sectoral approach with a limited set of sectors
Integrated and comprehensive development projects with wider policy area coverage
- Spatial orientation Targeted at lagging regions
All-region focus
- Unit for policy intervention
Administrative areas Functional areas
- Time dimension Short term Long term - Approach One-size-fits-all approach Context-specific approach
(place-based approach) - Focus Exogenous investments
and transfers Endogenous local assets and knowledge
Instruments Subsidies and state aid (often to individual firms)
Mixed investment for soft and hard capital (business infrastructure, labour market, infrastructure)
Actors Central government Different levels of government, various stakeholders (public, private, NGOs)
Source: OECD (2010: 13)
wor
king
pape
rs s
erie
s
35
Table 3: Types of Decentralisation
Fiscal Political Administrative Deconcentration Delegation Devolution
Central governments ceding fiscal autonomy to non-central government entities
Degree to which central government allows non-central government entities to undertake the political functions of governance; degree to which political actors and issues are significant at the local level and are at least partially independent from those at the national level
How much autonomy non-central government entities posses relative to central control
Central government that disperses responsibility for a policy to its field offices; powers are transferred to lower-level actors who are accountable to their superiors in a hierarchy
Transfer of policy responsibility to local government or semi autonomous organizations that are not controlled by the central government but remain accountable to it
Central government allows quasi-autonomous local units of government to exercise power and control over the transferred policy
Source: Adapted from Torrisi et al. (2010)
wor
king
pape
rs s
erie
s

36
Table 4: Potential Economic Benefits and Costs of Devolution
Potential Benefits
Potential Costs
Devolved policies better reflect territorial preferences (allocative efficiencies)
Additional administrative costs of additional layers of government and/or governance institutions
Improved knowledge of territorial economic potential (productive efficiencies)
Loss of scale economies in policy formulation and delivery Increased ‘rent-seeking’ by interest groups better able to influence sub-national territorial rather than national institutions
Democratic accountability improves efficiency of policy formulation and implementation, fosters innovation
Weaker disciplines of monitoring and evaluation (national finance ministries as tougher drivers of efficiency than territorial institutions)
Fiscal autonomy provides hard budget constraints and (where applicable) tax-varying power allows marginal changes to taxation and spending
Budget constraints increasingly tied to territorial fiscal capacity Weak incentives due to lack of mechanism linking public spending with tax revenues raised within sub-national territories
Lower coordination and compliance costs vis-à-vis the rest of the national territory
Reduced coordination with the rest of the national territory with possible negative spill-over effects both on and from sub-national territories
Source: Adapted from Ashcroft et al. (2005: 3)
wor
king
pape
rs s
erie
s
37
Figure 1: GVA per head by region and nation, 1968-2005
-26.0
-21.0
-16.0
-11.0
-6.0
-1.0
4.0
9.0
14.0
19.0
1968
1969
1970
1971
1972
1973
1974
1975
1976
1977
1978
1979
1980
1981
1982
1983
1984
1985
1986
1987
1988
1989
1990
1991
1992
1993
1994
1995
1996
1997
1998
1999
2000
2001
2002
2003
2004
2005
% deviation from UK real GVA p.h.
WAL NE NI YH NW WM EM SW SCOT GSE GSE 20.7%
SCOT -4.5%
SW -5.5%EM -6.8%
WM -10.5%
NW -12.4%YH -12.6%
NI -19.4%NE -20.9%
WAL -22.0%
UK=0
Source: Calculated from ONS
wor
king
pape
rs s
erie
s

38
Figure 2: Expenditure on Regional Industrial Assistance, 1960-2002
Source: Wren (2005) (Figures are for actual grant payments at constant prices for Great Britain)
0
0.5
1
1.5
2
2.5
1960 1965 1970 1975 1980 1985 1990 1995 2000
Employment Premiums
Automatic Investment Support
Discretionary Assistance
wor
king
pape
rs s
erie
s
39
Figure 3: Evolution of spatial disparities, spatial economic policy and decentralisation
.225
.23
.235
.24
.245
.25
Polic
y
.04
.05
.06
.07
.08
Gin
i ind
ex
.26
.28
.3.3
2.3
4
Fisc
al D
ecen
tralis
atio
n
1984
1985
1986
1987
1988
1989
1990
1991
1992
1993
1994
1995
1996
1997
1998
1999
2000
2001
2002
2003
2004
2005
2006
2007
Fiscal Decentralisation Gini indexPolicy
Evolution of spatial disparities, spatial policy and decentralisation
Fiscal Decentralisation: share of local revenue on total government revenue; Gini index: Gini index of regional Gross Disposable Household Income per head (GDHI); Policy: Gini index of regional primary household income and Gini index of GDHI. For further details see Appendix.
Source: Authors’ elaboration on data from ONS
wor
king
pape
rs s
erie
s
40
Figure 4: Evolution of spatial disparities and national economic performance
-.02
0.0
2.0
4.0
6
Nat
iona
l rea
l GD
P g
row
th ra
te
.04
.05
.06
.07
.08
Gin
i ind
ex o
f reg
iona
l GD
HI
1984
1985
1986
1987
1988
1989
1990
1991
1992
1993
1994
1995
1996
1997
1998
1999
2000
2001
2002
2003
2004
2005
2006
2007
Gini index Growth
Gini index: Gini index of regional Gross Disposable Household Income per head (GDHI); Growth: annual growth rate of national Gross Domestic Product. For further details see Appendix.
Source: Authors’ elaboration on data from ONS and Eurostat
wor
king
pape
rs s
erie
s
41
Figure 5: Evolution of spatial disparities and spatial polarisation
.04
.05
.06
.07
.08
Gin
i ind
ex o
f reg
iona
l dis
parit
ies
.004
.005
.006
.007
.008
Gen
eral
ised
mea
sure
of r
egio
nal p
olar
isat
ion
1984
1985
1986
1987
1988
1989
1990
1991
1992
1993
1994
1995
1996
1997
1998
1999
2000
2001
2002
2003
2004
2005
2006
2007
EGR index Gini index
Spatial polarisation and spatial disparities
Gini index: Gini index of regional Gross Disposable Household Income per head (GDHI); EGR index: generalised measure of income polarization (n= 4, δ=1.6, λ= 1). For further details see Appendix. Source: Authors’ elaboration on data from ONS.
wor
king
pape
rs s
erie
s
42
Table 5: Pearson correlation between national economic performance and component of decentralisation index
Growth Lagged growth
Revenue change
Change local revenue
Growth 1 Lagged growth
0.6382* 1
Revenue change
0.4951* 0.7041* 1
Change local revenue
-0.3614 -0.1728 -0.1751 1
* significant at 5%
Source: Authors’ elaboration on data from ONS and Eurostat
Growth: annual growth rate of national Gross Domestic Product; Lagged Growth: one-year-lagged annual growth rate of national Gross Domestic Product; Revenue change: annual change rate of General Government revenue; Change local revenue: annual change rate of Local revenue.
wor
king
pape
rs s
erie
s
43
Table 6: Pearson correlation between regional disparities, national economic performance, devolution and spatial economic policy
Gini GDP Growth
Lagged growth
Fiscal decentraisation
Policy
GiniI 1 GDP 0.7822* 1 Growth 0.3226 0.0029 1
Lagged growth 0.4581* 0.0303 0.6382* 1
Fiscal decentraisation
-0.4888* 0.0822 -
0.3538 -0.7517* 1
Policy 0.5865* 0.9148*
-0.2311 -0.2372 0.2767 1
Polarisation index 0.9561* 0.7165* 0.3301 0.4801* -0.5197* 1
*significant at 5%
Source: Authors’ elaboration on data from ONS and Eurostat Gini index: Gini index of regional Gross Disposable Household Income per head (GDHI); GDP: Gross Domestic Product; Growth: annual growth rate of national Gross Domestic Product; Lagged Growth: one-year-lagged annual growth rate of national Gross Domestic Product; Fiscal Decentralisation: share of local revenue on total government revenue; Policy: Gini index of regional primary household income and Gini index of GDHI. For further details see Appendix.
wor
king
pape
rs s
erie
s
Copyright © 2022 FDOKUMEN