
Income Inequality Impact on Crime in Indonesia : Static and Dynamic Analysis During 2007-2011

http://www.socialsciences.imdea.org/http://repec.imdea.org
in Economics and Social Sciences
Ctra. Colmenar Viejo km. 14, 28049 Madrid, Spain
soci
al s
cien
ces
workingpapers series
www.imdea.org
inst
itute
2011/16
Income inequality, decentralisation and
regional development in Western Europe
by Vassilis Tselios, Andrés Rodríguez-Pose,
Andy Pike, John Tomaney and Gianpiero Torrisi
September 2011

1
Income inequality, decentralisation and regional
development in Western Europe
by
Vassilis Tselios* Andrés Rodríguez-Pose§,‡
Andy PikeѺ
John TomaneyѺ
Gianpiero TorrisiѺ
* Department of Economic Geography, Faculty of Spatial Sciences, University of Groningen, The Netherlands
§ Department of Geography and Environment, London School of Economics, UK ‡ IMDEA Social Sciences, Madrid, Spain Ѻ Centre for Urban and Regional Development Studies (CURDS), Newcastle University,
UK
wor
king
pape
rs s
erie
s

2
Income inequality, decentralisation and regional
development in Western Europe
Abstract
This paper deals with the relationship between decentralisation, regional economic development,
and income inequality within regions. Using multiplicative interaction models and regionally
aggregated microeconomic data for more than 100,000 individuals in the European Union (EU),
it addresses two main questions. First, whether fiscal and political decentralisation in Western
Europe has an effect on within regional interpersonal inequality. Second, whether this potential
relationship is mediated by the level of economic development of the region. The results of the
analysis show that greater fiscal decentralisation is associated with lower interpersonal income
inequality, but as regional income rises, further decentralisation is connected to a lower decrease
in inequality. This finding is robust to the measurement and definition of income inequality, as
well as to the weighting of the spatial units by their population size.
Keywords: Income inequality, income per capita, fiscal and political decentralisation, interaction,
regions, Europe
wor
king
pape
rs s
erie
s

3
1. Introduction
There has been no shortage of interest on the economic implications of the transfer of
power and resources to lower tiers of government. The overwhelming majority of the
analyses which have tackled these issues have been macro-approaches. They have been
concerned with the impact of decentralisation on territories – mainly regions and
countries. As a consequence, the potential effects of political and fiscal decentralisation
on both regional and national economic growth (Davoodi and Zou 1998; Zhang and Zou
2001; Thießen 2003; Rodríguez-Pose and Bwire 2004; Iimi 2005; Dabla-Norris 2006;
Rodríguez-Pose and Ezcurra 2011) and on interregional inequalities (Canaleta et al.
2004; Rodriguez-Pose and Gill 2004; Ezcurra and Pascual 2008; Lessmann 2009;
Rodríguez-Pose and Ezcurra 2010) have been thoroughly scrutinized. There has been,
however, much less interest on the potential influence of decentralisation on interpersonal
inequalities using microeconomic data. The impact of decentralisation on income
distribution has been almost completely overlooked by the literature. Neyapti (2006),
Morelli and Seaman (2007) and Sepúlveda and Martínez-Vázquez (2011) represent the
only exception. Hence our knowledge about the influence, if at all, of decentralisation
processes on interpersonal inequalities is extremely limited and patchy.
This paper aims to cover this gap in the literature by exploring the relationship between
fiscal and political decentralisation, regional economic development, and within-regional
income inequality in the European Union (EU) using regionally aggregated
microeconomic data for more than 100,000 individuals. It addresses the questions of
whether (a) decentralisation in Western Europe has an effect on within regional
interpersonal inequality and whether (b) this relationship is mediated by the level of
economic development of the region.1 In answering this question, the paper makes four
contributions to the field. First, it looks at the black box of the income distribution
1 This paper examines income distribution among individuals rather than among households because, following the arguments of Kuznets and Gallman (1989), it makes little sense to talk about income inequality among households, as the sizes of the underlying units vary significantly (see Peracchi 2002). Concentrating on individual rather than on household income allows to abstract income data from changes in patterns of household formation. Moreover, the paper addresses income, not wage, distribution, because we are interested in the distribution of wealth, regardless of whether wealth results from the accumulation of labour earnings or capital income. We consider income distribution not only for the population as a whole, but also for normally working people (i.e.: those who work 15 hours per week or more).
wor
king
pape
rs s
erie
s

4
implications of the decentralisation processes which have been common across Europe
over the last three decades (Hooghe et al. 2008). Second, it finds that fiscal
decentralisation matters for interpersonal inequality across the regions of Europe. Third,
it shows that this relationship is affected by the level of development of the region. And,
finally, it sheds light on the governance arrangements that are most appropriate for
developing and delivering equity.
The paper uses multiplicative interaction models to examine whether regional per-capita
income intervenes in the relationship between fiscal and political decentralisation and
income inequality within regions. In other words, we examine whether the magnitude of
this relation varies across different development levels.
The paper is organised as follows. In the next section, we discuss the potential association
between fiscal and political decentralisation and income inequality within regions from a
theoretical perspective and how this association may vary at different levels of regional
economic development. Section 3 introduces the empirical model and presents the data,
the variables, and some descriptive statistics. Section 4 is devoted to the results which
arise from the multiplicative interaction models. The final section concludes, discusses
some potential limitations, and draws some implications for policy.
2. Decentralisation, income inequality and level of development
2.1 Decentralisation and income inequality
The economic case for local authorities and regional autonomy has often been built on
efficiency and equity grounds. From an efficiency perspective, persistent interregional
inequalities are bound to be inefficient at the national level. The underutilisation and
underperformance of workers and productive capacity in lagging regions lowers overall
national wealth. From an equity perspective, persistent income inequality systematically
disadvantages individuals, creating a raft of economic, social, and political problems (see
Martin 2008). While excessive interpersonal inequality has potentially pernicious
economic effects, in a healthily functioning economy a degree of income inequality is
also generally conceived to create incentives for achievement, productivity and
innovation (Rodríguez-Pose and Tselios 2009a). The relative weight between equity and
wor
king
pape
rs s
erie
s

5
efficiency depends on the political strategy of local authorities and central government.
More market-oriented parties are more likely to promote policies that would increase
efficiency even at the expense of greater inequality, while less market-oriented parties
would tend to give greater priority to the balance between efficiency and equity.
Moreover, local authorities may award more relevance to local economic growth, with
less concern for a nation-wide efficient allocation of productivity resources. This could,
in turn, contribute to a decrease in interregional income inequality, but perhaps not
intraregional inequalities. Although this paper investigates the relationship between
equity and decentralisation, equity and efficiency are not necessarily unrelated and can be
considered complimentary (Martin 2008).
But what do we know about how decentralisation affects – if at all – interpersonal
inequality within a region and/or a country? The studies which have dealt with this
question so far reach contradictory results. Morelli and Seaman (2007) highlight that, in
the case of the UK, decentralisation has been harmful for interpersonal inequality,
although the factors behind this relationship are not clear. Neyapti (2006) also shows that
revenue decentralisation in 54 countries has led to increased inequality, although the
impact has been less damaging in countries with good governance levels. By contrast,
Sepúlveda and Martínez-Vazquez (2011), using panel data analysis for 34 countries,
reach the conclusion that decentralisation seems to reduce income inequalities in those
cases where the national government still represents a significant share of the economy.
There is thus little that can be extracted from existing empirical literature. Theoretical
studies about decentralisation provide no further insights. Although interregional and
interpersonal inequalities are not unrelated (Kanbur and Venables 2005), a spawning
literature on fiscal federalism has been concerned with the influence of decentralisation
and its changes on territories, but has shown relatively little interest on the implications
for individuals.
Transfers of powers and resources to lower tiers of government can be envisaged – under
different circumstances and in different contexts – to contribute to increase or reduce
interpersonal inequalities (e.g. Tiebout 1956; Musgrave 1959; Oates 1972; Pauly 1973;
Brown and Oates 1987).
wor
king
pape
rs s
erie
s

6
One of the reasons why decentralisation may foster a decline in interpersonal inequalities
is related to the main fiscal federalism theorem. Decentralising government is often
considered to increase the degree of efficiency in the allocation of resources and to allow
for utility-maximizing behaviour by public agents. This is because subnational
governments are likely to have an information advantage over central governments when
it comes to responding to the needs and preferences of local citizens (Tiebout 1956; Oates
1972; Ezcurra and Pascual 2008). Greater transfers of powers and resources to local and
regional governments, especially if in response to bottom-up regional demands, can thus
promote a better matching of public policies to local needs (Rodríguez-Pose et al. 2009).
If local interpersonal inequalities are perceived to be an important issue, then they can be
more efficiently tackled at a local or regional than at a national scale, because local
decision-makers and public officials may respond better and more efficiently to the
desires of their constituents, and subnational governments may be better able to match
differing preferences across and within jurisdictions (Tiebout 1956).
Another argument which highlights the positive relationship between decentralisation and
equity is that decentralisation brings government closer to the people, increasing social
capital, making local officials not just better informed about local needs, strengths, and
weaknesses, but also better able to set the optimal mix of local policies than bureaucrats
in distant central governments (Lessmann 2009; de Mello 2011). Decentralisation is also
considered to bring further benefits by promoting greater voice, transparency,
accountability, and participation. The creation of opportunities for voice and participation
tends to weaken the hold of local elites and empowers under-represented groups in
society, including the poor, those less well-off, and local marginal groups. Such
empowerment may to lead to the creation of new local forms of governance and to the
adoption of policies involving a wider range of actors and thus more sensitive to the
presence of poverty and interpersonal inequalities (Le Galès 2002; Brenner 2004).
Finally, greater transparency and accountability limit the opportunities for corruption,
once again reducing the risk of a small privileged group capturing the returns of public
policies and contributing to a further reduction in local interpersonal inequality
(Weingast 2009).
wor
king
pape
rs s
erie
s

7
But while there are certain reasons why decentralisation may be regarded as an
inequality-reducing force, there are almost as many reasons which push in the opposite
direction. First, decentralisation weakens the capacity of central government to play an
equalizing role through social and territorial transfers. This fundamentally affects the
capacity of the state to achieve a more balanced distribution of income by channelling
resources from the rich to the poor. And while this task may be undertaken by
subnational governments, it is often the case that subnational governments, especially in
the poorer regions of less developed countries, lack the resources and capacity of the
nation-state to address income inequalities. Hence, some fiscal federalists argue that the
central government should have the basic responsibility for the macroeconomic
stabilization function and for income redistribution in the form of assistance to the poor
(Oates 1999: 1121). Capacity constraints may also play a role in leading to greater
interpersonal income inequality in decentralised contexts. Subnational governments,
because they are likely to attract less skilled and capable officials and decision-makers
(Prud'homme 1995), can end up being less efficient at delivering all kinds of policies.
This may be particularly poignant in cases where interterritorial disparities are significant
and where local governments in the poorest and more unequal regions may lack both the
capacity and resources to tackle inequality as effectively as a more centralized
government. In addition, if local vested interests are powerful, in the absence of strong
local accountability – a situation most likely to happen in less developed and less equal
territories – decentralisation could increase social fragmentation and inequality
(Blanchard and Shleifer 2001; Bardhan and Mookherjee 2006; Neyapti 2006). It can
therefore be assumed that the decentralisation-inequality relationship is thus strongly
moderated by the quality of governance of a country (Neyapti 2006; Kyriacou and Roca-
Sagalés 2011).
Overall, it can be envisaged that decentralisation may increase efficiency when
heterogeneous preferences exist (Pauly 1973). Those regions which prefer higher
interpersonal redistribution may chose a tax-transfer scheme with high redistribution (e.g.
more progressive), while regions with low preferences for redistribution may chose lower
transfers. This may enhance equity only if there is no cross-border mobility and thus
interpersonal redistribution within a region will increase the mobility of potential
wor
king
pape
rs s
erie
s

8
recipients and of potential donor-tax payers. If, by contrast, interregional mobility is
costless, this may lead to a greater mobility of potential recipients and potential donor-tax
payers.
2.2 The role of development: rich versus poor regions
The above sub-section underlines that whether decentralisation is good or bad for equity
is highly contingent on the level of development of a territory. There are several reasons
for this. First of all, it is widely known that poor regions face greater budget constraints
than richer ones. Intergovernmental grants, which tend to focus on equity considerations,
usually constitute the main source of local revenues to poor regions creating an
environment of ‘transfer dependency’ (Oates 2008). Greater decentralisation tends to
curtail this flow of funds from central government to regions and localities, disrupting the
equalisation flow from richer to poorer areas. Hence, subnational governments in less
well-off areas may end up with inadequate sources of revenue to tackle local inequality,
meaning that they can never truly enjoy fiscal autonomy (Weingast 2009). In contrast, the
greater capacity of richer local and regional authorities to rely on their own revenues
entails that they are often in a better shape to address inequality problems. There thus
seems to be a ‘threshold level of economic development’ at which fiscal decentralisation
becomes attractive (Oates 2008) and more likely to deliver a reduction in inequality.
Hence, poorer areas may have a lower capacity to deliver greater interpersonal equality
and may often generate incentives for migration (Pauly 1973).
By contrast, when there are strong inefficiencies within a system and these are properly
addressed by decentralisation processes, efficiency gains may be greater in those areas
where the inefficiencies were originally larger (Rodríguez-Pose and Ezcurra 2010).
Consequently, if the efficiency gains are put to good use, interpersonal inequality would
decrease faster in less developed than in more developed areas, although large
institutional and capacity constraints may operate in an opposite direction.
This quick look at the theory has revealed that, first, we know rather little about the
potential implications of decentralisation trends for interpersonal inequality and, second,
that the potential factors at play can derive either in greater or in lower inequality. The
relationship is also likely to be influenced by the level of development of a region or a
wor
king
pape
rs s
erie
s

9
locality. Hence the questions of whether decentralisation has an effect on within regional
interpersonal inequality and whether this possible relationship is mediated by the level of
economic development of the region remain open and have to be addressed from an
empirical perspective.
3. Econometric specification, data and variables
3.1 Econometric specification: detecting interactions
These are precisely the questions driving this paper. Does decentralisation affect
interpersonal inequality across the regions of Western Europe? And, is this relationship
contingent on a region’s level of development? Or, in other words, does decentralisation
affect interpersonal inequality in core and lagging regions differently? In order to answer
these questions we build an econometric specification based upon the theoretical
approach and empirical applications described in the previous section. Our econometric
specification is based on panel data analysis in order to minimise potential problems of
omitted variable bias, to increase degrees of freedom, and to improve the accuracy of the
parameter estimates (i.e. Wooldridge 2002; Greene 2003; Baltagi 2005). In our
multiplicative interaction model, income inequality within regions is determined
according to the following equation.
ittiititstitstitst
itstststststitit
xIncPCPSIncPCTOIncPCPDIncPCFDPSTOPDFDIncPCIncIneqεφνγβββ
ββββββα
+++++++
+++++++=
987
654321
where itIncIneq is the within-region income inequality for region i at time t , itIncPC is
the regional per-capita income for region i at time t , stFD is a proxy for the degree of
fiscal decentralisation for country s at time t , stPD is a proxy for the degree of political
decentralisation for country s at time t .
The model also includes a series of control variables aimed at testing the role of other
factors likely to moderate the decentralisation-inequality relationship. Most prominent
among these control factors are stTO , the trade openness for country s at time t , and
stPS , the public sector size for country s at time t . The reason for introducing trade
openness in the analysis is the crucial role that interregional and international trade plays
wor
king
pape
rs s
erie
s
10
on economic performance and consequently, on interpersonal inequality through a
multitude of mechanisms such as capital mobility, labour migration, technological
diffusion, and forward and backward linkages. Numerous theories (e.g. neoclassical trade
theory, new trade theory, and the new economic geography theory) have stressed this
relationship. More specifically, neoclassical trade theory argues that trade openness may
result in a reduction of income inequality and in increases in economic development.
According to Ricardian theory, as regions and countries specialise in the production of
those goods they produce most efficiently and buy goods that they produce less
efficiently from other regions and countries, benefits for both home and foreign
economies are generated, thus reducing disparities and increasing welfare. In a
Heckscher-Ohlin framework, the capital-abundant economies specialise in the production
and export of capital-intensive goods, while the labour-abundant economies specialise in
the production and export of labour-intensive goods, which implies that trade openness
makes economies more prosperous and successful in the long run. New trade theory
(Krugman 1980) and the new economic geography theory stress the existence of an
inverted U relationship between trade cost and agglomeration. If there is relatively little
trade (high trade cost or low trade openness), welfare is mainly determined by product
market competition. For intermediate trade costs, centripetal forces outweigh centrifugal
ones. Firms and workers cluster together as firms produce more efficiently and workers
enjoy higher welfare by being close to large markets. Consequently, having an access
advantage raises local factor prices, induces factor inflows, and increases the home
market effect. For very low trade costs, the price of local factors tends to increase,
enhancing factor market competition and reducing disparities. Nevertheless, the above
predictions depend on the theoretical assumptions of each model (i.e. Krugman and
Elizondo 1996).
Similarly, public sector size has a crucial role in the decentralisation-inequality
relationship. Zax (1989) argues that if decentralisation encourages ‘competition’ among
governments, the local public sector size shrinks, while if decentralisation sacrifices scale
economies, the local public sector size expands. In other words, decentralisation, on the
one hand, multiplies the public service bundles available to citizens through the
propagation of government units which may promote ‘competition’ among governments,
wor
king
pape
rs s
erie
s

11
efficient provision of local public services, and a smaller local public sector, all other
things equal. On the other, it leads to smaller government units, but only if the production
or administration of local public services is subject to scale economies (Zax 1989).
The other variables included in the model are as follows. itx is a vector of regional-
specific characteristics for region i at time t . By adding itx we are able to capture the
main structural and economic features of the regions of Western Europe and to take into
account some important sources of regional heterogeneity (Sterlacchini 2008).
As we also want to test whether the relationship between fiscal and political
decentralisation and inequality is contingent on the level of development of a region, we
include a series of interaction variables between the key dependent variables and income
per capita – taken as an imperfect proxy for the level of development of a region. These
interactions are itst IncPCFD , itst IncPCPD , itst IncPCTO and itst IncPCPS which
represent the interaction terms between fiscal decentralisation, political decentralisation,
trade openness and public sector size with regional per-capita income, respectively.
Finally, iν depicts the unobserved time-invariant characteristics of region i (represents
the regional fixed effects), tφ denotes time-dummies (represents the time-period fixed
effects), and itε is the disturbance term (idiosyncratic error). In other words, iν controls
for all space-specific time-invariant variables, while tφ controls for all time-specific
space-invariant variables (Baltagi 2005).
The analysis uses fixed effects estimators controlling for time-invariant regional
characteristics iν . It controls for the effects of the omitted variables that are peculiar to
each region and accommodates regional heterogeneity (through iν ). This estimator wipes
out all the regional-specific time-invariant variables,2 but a failure to account for these
controls increases the risk that biased estimation results might be obtained. In addition,
we calculate the p-values of the Breusch and Pagan’s (1980) Lagrange Multiplier (LM)
statistic, testing the validity of the pooled ordinary least square estimator. We therefore
estimate a two-way error component model in which 1β is the coefficient on the 2 This implies that it is not possible to estimate the impact of iν on income inequality by fixed effects.
wor
king
pape
rs s
erie
s

12
moderator (income per capita), 2β and 3β are the coefficients on the key independent
variables (fiscal decentralisation, political decentralisation, respectively) and 4β and 5β
are the coefficients of the two main control variables (trade openness and public sector
size, respectively). 6β , 7β , 8β and 9β are coefficients on interaction terms of the
independent variables with the moderator. Following the work by Brambor et al. (2006),
we calculate the marginal effects of fiscal decentralisation (
IncPCFDIncIneq
62 ββ +=∂∂ ), political decentralisation (
IncPCPDIncIneq
73 ββ +=∂∂ ), trade openness ( IncPCTO
IncIneq84 ββ +=∂
∂ ) and
public sector size ( IncPCPSIncIneq
95 ββ +=∂∂ ) on income inequality which change
across the observed range of regional per-capita income. We resort to a multiplicative
interaction analysis because of its noticeable advantages with respect to alternative
methods, such as comparing subgroup-based correlation coefficients. The latter type of
analysis disregards the continuous nature of the development level moderator and has a
lower explanatory capacity as the division into subgroups reduces the sample size
(Dawson and Richter 2006).
In our model, we do not expect a non-linear relationship between per-capita income, our
moderator, and income inequality for four reasons: (a) per-capita income is the moderator
of the decentralisation-inequality relationship; (b) a large number of the relevant
empirical studies which examine the relationship between economic development and
income inequality focus not only on Western European countries, as our study, but also
on less economically advanced countries (Rodríguez-Pose and Tselios 2009a); (c) the
studies in question show that the declining segment of the Kuznets curve begins around
1970 (Nielsen and Alderson 1997; Rodríguez-Pose and Tselios 2009a); and (d) any non-
linear relationship between two variables is likely to be the result of omitted variable bias
(Greene 2003). A non-linear function is characterised by the fact that the change in
income inequality for a given change in per-capita income depends on the starting value
of per-capita income. However, the starting value of per-capita income may also depend
on the fiscal and political decentralisation level. Therefore, we assume a linear
wor
king
pape
rs s
erie
s

13
relationship between per-capita income and income inequality for developed countries
(Western European countries) over a relatively limited period of time (1995-2000)
(Rodríguez-Pose and Tselios 2009a).3
3.2 Data and variables
We use variables not only at regional, but also at a national level. Regional variables are
based either on micro- or macro-data. Regional variables based on micro-data are
extracted from the European Community Household Panel (ECHP) data survey,4 while
regional variables based on macro data stem from Eurostat’s Regio dataset. The
elaboration process of both datasets is coordinated by Eurostat, making comparisons
reliable. National variables are extracted from the World Bank and the work by Hooghe
et al. (2008). The resulting dataset includes data for 102 regions at NUTS I or II level
from 13 countries in Western Europe between 1995 and 2000, the only years for which
the ECHP is available (NUTS I: Austria, Belgium, Denmark, France, Germany, Greece,
Ireland, Italy, Luxemburg, Spain and Sweden; NUTS II: Portugal and the United
Kingdom).
Within-region income inequality ( itIncIneq ), the dependent variable, is calculated using
the generalised Theil entropy index. For a region i with population N of individuals
{ }N...,,2,1∈κ , where each individual is associated with a unique value of the measured
income, income inequality is defined as ∑=κ
κκκ )log( pyyIncIneq , where κy is the
income share that is individual κ ’s total income as a proportion of the total income for
the entire regional population N , and κp denotes population share. As the basic units are
individuals, the population share is N1 . To check the robustness of the results, income
inequality is also calculated using the Gini index, the squared coefficient of variation, and
the Atkinson index. All these indices are expressed as a common form of income and
3 We also test whether our conditional hypothesis is robust to the assumption of a non-linear relationship between per-capita income and income inequality. 4 In the ECHP data survey, between 104,953 and 124,663 individuals were interviewed every year about their socioeconomic status and information was collected about their income, job, education status, living conditions, age, etc. (see Peracchi 2002). The ECHP has provided a rich microeconomic dataset that can be regionalised providing accurate data at the regional level and solving problems of comparability between countries. This survey is the only comparable longitudinal data source at European level.
wor
king
pape
rs s
erie
s
14
population share. This means that if, for example, the regional population share is
constant, inequality indices differ only because they employ different distance functions
of the income ratios. Therefore, a change in income inequality for a region i from t to
λ+t is the result of a change in population income and share. This implies that the
evolution of a region’s contribution to change in regional inequality is determined by the
change in both the region’s income ratio and the region’s population share.
Income inequality indices are measured using the microeconomic variable ‘Total net
personal income (detailed, national currency, total year prior to the survey)’ from the
ECHP data survey.5 We measure not only income inequality for the population as a
whole, but also income inequality for normally working people which includes those
working 15 hours per week or more. Wages and salaries are the main source of personal
income as they constitute 45 percent of the personal income of the whole of the
population and 78 percent of the personal income of normally working people, while the
rest is income from self-employment or farming, pensions, unemployment and
redundancy benefits, any other social benefits or grants, and private income (Rodríguez-
Pose and Tselios 2009a).
The main moderator in the model is per-capita income ( itIncPC ). For a region i with
population N of individuals { }N...,,2,1∈κ , regional per-capita income is defined as
∑=κ
κκ pyIncPC . This implies that per-capita income, as income inequality, depends on
the income and population share ( κy and κp ). We use the ECHP data survey to measure
regional per-capita income for the population as a whole and for normally working
people. We use regional per-capita income, instead of regional per-capita GDP, for three
reasons. First, GDP excludes transfers of income from individuals, companies and
government in the form, for example, of social benefits (European Commission 1999).
Second, because of the mismatch between political and administrative boundaries, on the
one hand, and functional boundaries, on the other, the GDP per capita of many European
small urban regions (e.g. Inner London, Brussels, Hamburg) is severely overstated, as a
5 This variable has been adjusted to the same price level using the Harmonised Indices of Consumer Prices and has been converted into euros in order to make them comparable across countries and regions.
wor
king
pape
rs s
erie
s

15
result of differences between where people work and where they live. Third, if a region
does not spend but invests in other regions, its GDP will decline in comparison to a
region that spends borrowed money.6
Fiscal and political decentralisation ( stFD and stPD ) depict the two main independent
variables of our study. We use two proxies for the level of fiscal decentralisation ( stFD )
of European countries: the subnational share in total government expenditure and the
subnational share in total government revenue. The use of these indicators is not without
controversy and they have come under strong criticism because the devolution of fiscal
power from central to regional and local governments is a complex and multidimensional
process (Martínez-Vázquez and McNab 2003; Schneider 2003; Rodríguez-Pose and
Ezcurra 2010) which cannot be captured by a single indicator. Additionally, these indices
do not capture the proportion of intergovernmental transfers that are discretionary or
conditional (Ebel and Yilmaz 2002; Rodden 2004; Stegarescu 2005; Rodríguez-Pose and
Ezcurra 2010). We use regional authority as our political decentralisation variable stPD
for European countries. It is defined by Hooghe et al. (2008) along the following lines:
‘We conceive regional authority in two domains. Self-rule refers to the authority of a
regional government over those living in the region. Shared-rule refers to the authority a
regional government (co-)exercises in the country as a whole. Each is measured along
eight dimensions or scales which describe institutional alternatives’. More specifically,
self-rule taps regional authority over institutional depth, policy making (economic,
cultural-educational, and welfare), fiscal autonomy (in three areas of control: tax base,
tax rate, and revenue split), and representation which denotes the capacity of regional
actors to select regional office holders. Shared-rule includes law making, executive
control, fiscal control, and constitutional reform. We also include a third domain of
regional authority which represents the sum of the self-rule and shared-rule scores (the
regional authority indicator, RAI total) (Hooghe et al. 2008). All these indicators have
several advantages over rival indices (e.g. Lijphart 1999; Woldendorp et al. 2000;
Schneider 2003; Brancati 2006), as they measure political decentralisation along a
multitude of dimensions and allow for – admittedly limited – change over time.
6 www.undp.org/hdr2001/ - United Nations Development Programme.
wor
king
pape
rs s
erie
s

16
Trade openness ( stTO ) for a European country s at time t is measured by the level of
trade as a percentage of GDP (source: World Bank).
Public sector size ( stPS ) for a European country s at time t is measured as total
government expenditure as a percentage of GDP (source: World Bank).
In order to measure other regional specific characteristics ( itx ) we resort to the standard
regional variables used in the literature (Berry and Glaeser 2005; Tselios 2008;
Rodríguez-Pose and Tselios 2009a): educational endowment, unemployment, and
sectoral composition. (a) Regional educational endowment is calculated using the
microeconomic variable ‘Highest level of general or higher education completed’ which
is extracted from the ECHP data survey. Individuals are classified into three mutually-
exclusive and comparable educational categories. We calculate the percentage of the
population who have successfully achieved (i) less than second stage of secondary level
education (which is our base category), (ii) second stage of secondary level education and
(iii) recognised third level education. (b) Regional unemployment is measured as the
percentage of unemployed respondents (self-defined). This variable is also extracted from
the ECHP data survey. (c) The regional sectoral composition variables are extracted from
the Eurostat database. We calculate (i) the added value per capita of agriculture, hunting,
forestry and fishing (added value per capita of agricultural sector), (ii) the added value of
mining and quarrying, manufacturing, electricity, gas and water supply, and construction
(added value per capita of industrial sector), and (iii) the added value of services
(excluding extra-territorial organizations and bodies) (added value per capita of service
sector).
The means, standard deviation, and minimum and maximum value for the above
variables are reported in Table 1. Income inequality within regions measured using the
Theil index decreases slightly over the period of analysis, while per-capita income
increases, both for the whole population and for normally working people. During the
period of analysis fiscal decentralisation, proxied by the subnational share in total
government expenditure, increased by 11.05 per cent, but proxied by the subnational
share in total government revenue remained almost constant. Political decentralisation,
wor
king
pape
rs s
erie
s

17
captured by the three domains of regional authority, increased. Finally, the moderator of
trade openness also increased, while the moderator of public sector size remained almost
constant.7 As for the regional specific characteristics, citizens in Western Europe raised
their educational attainment, regional unemployment declined, and the contribution of the
service sector in the regional economy increased. Overall, the evolution of all regional
and national variables between 1995 and 2000 shows limited change over time. Taking
also into account that the fixed effects coefficients can be interpreted as short/medium-
run or time-series effects, as they reflect within-region time-series variation (Mairesse
1990; Durlauf and Quah 1999), the business cycle is not expected to drive the estimated
effects.
Insert Table 1 around here
4. Regression Results
The empirical analysis exploits the panel structure of the dataset for the 102 EU regions
included in the analysis over the period 1995-2000. We also – following Brambor et al.
(2006) – plot the marginal effects. Regressions 1-11 of Table 2 display the fixed effects
results when the dependent variable is income inequality for the whole population
measured using the Theil index. In all these regressions, the p-values of Breusch and
Pagan’s LM test strongly reject the validity of pooled OLS models and point to fixed
effects models as the most appropriate. In addition, since there is not much difference
between the significance of the homoskedasticity and the heteroscedasticity consistent
covariance matrix estimator (White 1980), we report the homoskedastic results.8 The
standard errors are clustered at the country level. Finally, as the time-dummies in our
econometric specification are statistically significant, we use a two-way error component
model.
Insert Table 2 around here
Insert Figure 1 around here
7 Appendix 1 shows the values of the national variables (fiscal and political decentralisation, trade openness and public sector size) for the 13 countries. 8 The heteroskedastic results can be provided upon request.
wor
king
pape
rs s
erie
s

18
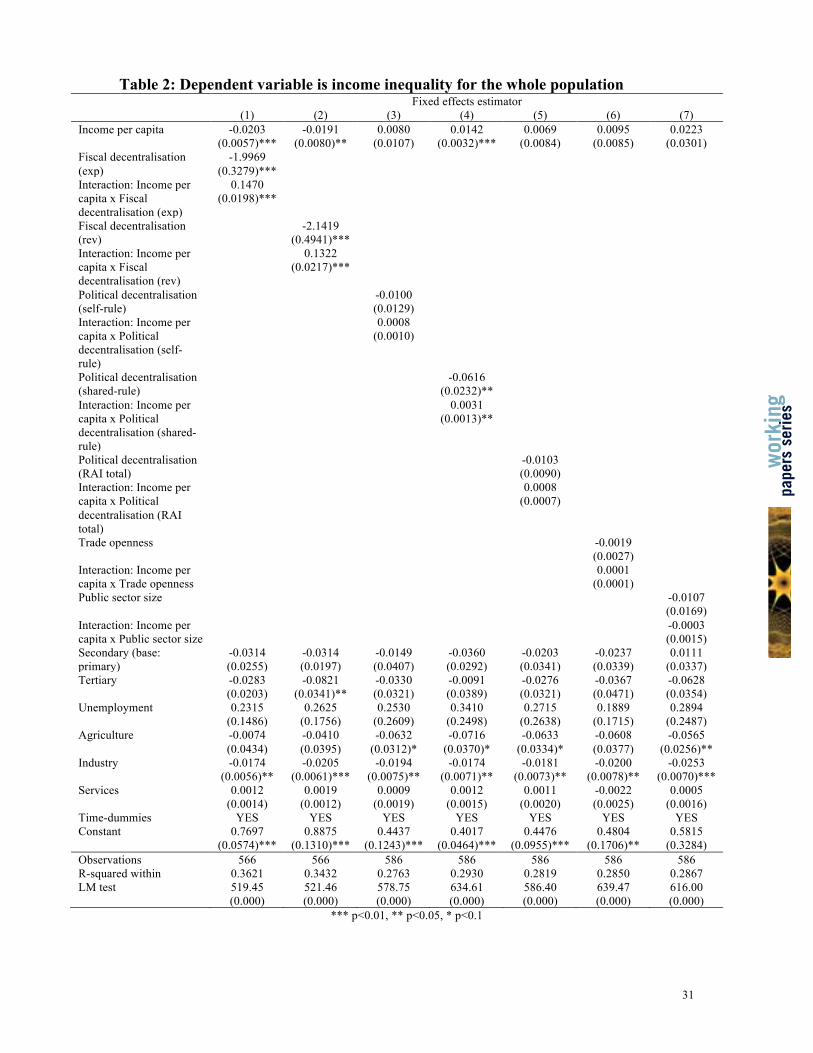
Regression 1 indicates that greater fiscal decentralisation, proxied by the subnational
share in total government expenditure, leads to a significant reduction of interpersonal
income inequality within a region. This association is, however, strongly mediated by
regional income per capita. The coefficient for itst IncPCFD is positive, indicating that
the reduction of income inequality linked to decentralisation declines as regional income
per head increases. However, this explanation needs to be handled with care, as the
coefficients of continuous interaction variables are difficult to interpret, and, as Brambor
et al. (2006) indicate, this type of results can only throw limited light about the validity of
our hypothesis (as they would only be correct if income were zero). We therefore
calculate how the marginal effect of decentralisation changes across the observed range
of regional per-capita income. This is presented in Figure 1a, where the solid sloping line
denotes how the marginal effect of decentralisation on regional income inequality
changes with regional economic development. Any particular point in this line is
IncPCFDIncIneq
62 ββ +=∂∂ . The dotted lines on both sides of the solid line represent
the 95% confidence intervals, which allow us to determine the conditions under which
decentralisation has a statistically significant effect on income inequality.9 Figure 1a
corroborates the regression results: while greater fiscal decentralisation has contributed to
a reduction of within-region interpersonal inequality, the relationship is moderated by the
level of development of the region. As income rises, the capacity of fiscal
decentralisation to contribute to a reduction in interpersonal inequality wanes. This
implies that, while in less developed regions higher levels of fiscal decentralisation are
associated with a decline in within regional interpersonal inequality, this association is
lower in better-off regions. When fiscal decentralisation is measured by the subnational
share in total government revenue, rather than expenditure, the results are similar
(Regression 2 in Table 1 and Figure 1b). Hence, and in contrast to what could have been
expected from the discussion in the theoretical section, the relationship between
decentralisation and income inequality is negative for less developed European regions
and this effect peters out as regional income rises. These results indicate that subnational
governments may have indeed an information advantage over central governments to the 9 Decentralisation has a statistically significant effect whenever the upper and lower bounds of the confidence interval are both above (or below) the zero line (Brambor et al. 2006: 76).
wor
king
pape
rs s
erie
s
19
needs and preferences about local citizens, and local decision makers may respond better
and more efficiently to the desires of their constituents over inequality (Tiebout 1956;
Oates 1972; Ezcurra and Pascual 2008).
When we turn to the potential impact of political decentralisation on income inequality
(Table 2, Regressions 3-5), the regression results show a negative coefficient on
decentralisation for all proxies (self-rule, shared-rule, and RAI-total) and a positive
coefficient on the interaction term of decentralisation with per-capita income, although
the coefficients are only significant for shared-rule. This result is upheld by the figures
showing the marginal effects (Figures 1c, 1d and 1e). They confirm that only when
European regions exercise considerable authority in the country as a whole (shared-rule),
greater political decentralisation will lead to a lowering of income inequality within
regions, as both the upper and lower bounds of the confidence interval are below the zero
line (Figure 1d). This is not the case in Figures 1c and 1e, indicating that overall political
decentralisation and self-rule, or the capacity of regional governments to implement
policies at the local level, do not have a significant impact on the evolution of
interpersonal inequality. Therefore factors such as the influence of autonomous
governments over national law-making, executive control, fiscal control and
constitutional reform seem to foster equity, while more regional authority seems not to
affect income distribution. As in the case of fiscal decentralisation, the decentralisation-
inequality relationship for shared-rule is sensitive to the level of development of the
region concerned: higher levels of decentralisation lead to a decline in interpersonal
disparities at both low and high income regions, although the slope of the decline is
greater for poorer than for richer regions.
The control variables included in the model are expected to have an influence over within
region inequality levels. Income inequality can be affected not only by fiscal and political
decentralisation, but also by trade openness and public sector size, as well as by
unemployment, the sectoral structure of the region, and by the level of education of the
population. Regressions 6 and 7 in Table 2 and Figures 1f and 1g examine the association
between trade openness and public sector size, on the one hand, and income inequality,
on the other, respectively, and whether these associations are moderated by regional
wor
king
pape
rs s
erie
s

20
economic development. The results indicate that these associations are not as clear cut as
could have been expected in theory. The marginal effect of trade openness (Figure 1f)
and public sector size (Figure 1g) on within-region interpersonal income inequality is not
statistically significant. Moreover, the regression coefficients on the regional controls
highlight that a rise in the added value per capita of agriculture and industry is associated
with a decrease in inequality, while the impact of services, tertiary education and
unemployment is unclear (Table 2, Regressions 1-7).
Regressions 8-9 display the combined impact of fiscal and political decentralisation on
interpersonal income inequality within regions. The results indicate that greater fiscal
decentralisation – regardless of how it is measured – has contributed to a reduction of
within-region interpersonal inequality, although, as income rises, its capacity to
contribute to a reduction in interpersonal inequality wanes. By contrast, overall levels of
political decentralisation (RAI-total) are irrelevant for the evolution of within region
interpersonal inequality.
A fundamental issue encountered in exploring the association between decentralisation
and inequality and the role of regional economic development in this relationship is
connected to the size of the units of analysis. European regions vary enormously in
population and it is therefore legitimate to ask whether larger regions should carry more
weight than smaller ones. Sala-i-Martin (2003) has highlighted the relevance of using
weights in analyses involving welfare and inequalities. Firebaugh (2003) has also argued
that if the goal is to see how regional economies work – with each region viewed as a
separate realisation of certain underlying economic processes – then each region should
be weighted the same. Since fiscal and political decentralisation concern the welfare of
people, government policies and the way regional economies work, we re-estimate the
analysis using weighted regressions (Regressions 10-11). The use of population weights
allows us to control for regional and national size, controlling for greater heterogeneity
and for the possibility of larger local governments in bigger countries undertaking widely
different policies than in smaller, more homogeneous, and compact regions and countries
(Rodríguez-Pose and Ezcurra 2010). The regression results using weighted variables
underline the robustness of our previous analysis. Once again, greater fiscal
wor
king
pape
rs s
erie
s
21
decentralisation is associated with lower inequality, but as income rises, further
decentralisation is connected to a lower decrease in inequality. It should be noted here
that since the weighted variables contain some outliers. Omitting the outliers has virtually
no effect on the results.
A further problem of our empirical specifications is the potential for reverse causality and
endogeneity: a rise in interpersonal income inequalities at the local level may help trigger
a greater decentralisation of public funds, giving local government more scope for
redistributive policies, or vice versa. In order to address whether there is an endogeneity
problem we resort to running the analysis using a generalised method of moments
(GMM) estimation. GMM permits a certain degree of endogeneity in the regressors
(Arellano and Bond 1991). In these dynamic regressions, the correlation between the
explanatory variables and the error term is handled by instrumental variables.
Regressions 12-15 display the Arellano and Bover (1995) and Blundell and Bond (1998)
estimator. Both the weighted and unweighted results with an annual lagged dependent
variable are displayed. The results further confirm the robustness of our initial
estimations for fiscal decentralisation. Once again, greater fiscal decentralisation
contributes to a reduction of within-region interpersonal inequality, and this contribution
wanes as income rises. The results for political decentralisation (RAI-total) differ,
however, from those of the static estimations. They show – more in agreement with
theoretical expectations – that political decentralisation produces greater interpersonal
inequality, but that this relationship declines as regional income per head rises.
We finally take into account the spatial aspects of the econometric specifications, as the
potential presence of spatial dependence may indicate model misspecification.10 The
results of the Moran’s I test (Cliff and Ord 1981) adapted to the estimated residuals of the
fixed effects regression reject the null hypothesis of spatial dependence.11 The Moran’s I
10 Our empirical strategy follows the specification searches and testing strategies of Anselin and Rey (1991) and Florax et al. (2003). We estimate a model without spatially lagged variable (spatially lagged income inequality), and, if the null hypothesis of no spatial correlation is rejected, we apply a remedial procedure, by adjusting the context of model specification (Anselin and Moreno 2003; Florax et al. 2003). 11 The −k nearest neighbours weights matrix has been used for k =5, 7 and 9. For example, Moran’s I test for Regression 8 and for k =5 is 0.0828 and is not statistically significant, Although spatial dependence may matter for income inequality, controlling for national characteristics in our analysis contributes to limit
wor
king
pape
rs s
erie
s

22
test is not used in the estimated residuals of the GMM regression results, as the
explanatory variables are endogenous.
The territorial scale of the analysis (intra- versus inter-regional inequality) is crucial in
the inequality-decentralisation relationship. If, for example, we assume that all rich
people live in one jurisdiction and all poor people in another, intra-jurisdictional
inequality will be zero, but inter-jurisdictional inequality and intrapersonal inequality for
the total federation is high. However, this does not apply to the European case. Using the
same data (ECHP) and multilevel decomposition of the Theil index of income inequality,
Rodríguez-Pose and Tselios (2009b) have shown that 80 percent of the income inequality
in Europe takes place among individuals living in the same region (intraregional
inequalities), while 7 percent is between-region and within-country (interregional
inequalities), and the rest (13 percent) is between-country inequality (international
inequalities). We have further explored this issue by using data on interpersonal income
inequality and income per capita within countries extracted from the same database
(ECHP). The main argument of our study – that greater fiscal decentralisation is
associated with lower interpersonal income inequality within regions, but as regional
income rises, further decentralisation is connected to a lower decrease in inequality – also
holds at the country level (see Appendix 2).12 It should be noted here that the ‘R-squared
within’ is higher than in Table 2. This is a symptom that national variables are key factors
in explaining the relationship between inequality and decentralisation, as well as further
proof that the within-region component accounts for the largest proportion of all
European income inequality.
The above findings are also robust a) to changing the measure of inequality (the Gini
index, the squared coefficient of variation and the Atkinson index), b) to the definition of
income inequality (income inequality for normally working people) and c) to the
inclusion of a squared term in per-capita income.13
its influence. In addition, the variance in-between regions – but within-country income inequality – is much lower (almost half) than the variance in-between countries income inequality. 12 However, this result should be interpreted with some caution due to the low number of observations (70). 13 These results are available from the authors upon request.
wor
king
pape
rs s
erie
s
23
5. Concluding Remarks
This paper has been one of the first to explore the virtually untouched field of how fiscal
and political decentralisation processes affect individuals rather than territories. By using
regionally aggregated microeconomic data in order to measure the level of interpersonal
inequality for the regions of Europe, we have been able to address whether
decentralisation matters for the evolution of within regional interpersonal inequality and
whether this relationship is mediated by the level of development of the region.
The results highlight that the influence of decentralisation on interpersonal inequality is
much stronger than expected. In contrast with a theoretical field that had little to say
about this topic and where predictions about the direction of the relationship between
both factors were uncertain, the results of our multiplicative interaction regression
analysis unequivocally point to the fact that greater fiscal decentralisation in Europe is
associated with lower income inequality within regions. They also suggest that this
relationship is highly influenced by the level of wealth of the region to which authority
and funds are being decentralised. However, the sign of the relationship counters most
theoretical predictions. Against the views that worse-off regions would be disadvantaged
because of capacity and funding constraints, which could prevent them from effectively
implementing policies which could reduce interpersonal inequality, it is precisely these
less well-off regions which seem to be benefiting the most from the inequality-reducing
effects of fiscal decentralisation processes. As income rises, the association declines.
Political decentralisation, in contrast, seems to have a weaker connection with income
inequality. The political powers of regions and their capacity to influence national
policies do not seem to affect the evolution of intraregional income inequalities. If
anything, the results of the dynamic analysis point in an opposite direction to the effect
found for fiscal decentralisation: greater political decentralisation may lead to a marginal
increase in interregional inequalities, but this effect wanes as the income per capita of the
region rises.
Although given the exploratory nature of the analysis, the results should be considered
with caution, especially due to the short time-series available, the analysis opens new
wor
king
pape
rs s
erie
s

24
avenues for research about the potential economic implications of decentralisation. In
contrast to the studies which have focused on aggregate outcomes about the impact of
greater level of autonomy on aggregate growth and on interterritorial disparities, the
focus on the impact of decentralisation in income distribution creates a much richer and
potentially much more useful field for the study of the implications of changing the scales
at which policies are implemented. If decentralisation is all about delivering better
policies to individuals, looking precisely at those individuals may offer a more accurate
evaluation of its outcomes.
wor
king
pape
rs s
erie
s

25
Acknowledgements
We are particularly grateful to Eric Sheppard, the editor in charge, and to three
anonymous reviewers for their incisive comments to earlier versions of the manuscript.
An earlier version of the paper was presented at the SERC conference in London. We
will also like to thank participants for their suggestions. The paper has benefited from the
support of the European Research Council under the European Union’s Seventh
Framework Programme (FP7/2007-2013)/ERC grant agreement nº 269868 and of a
Leverhulme Trust Major Research Fellowship. The research is also part of the Prociudad-
CM programme and of the UK Spatial Economics Research Centre. The views expressed
are those of the authors and do not necessarily represent those of the funders.
wor
king
pape
rs s
erie
s

26
References
Anselin, L., Moreno, R., 2003. Properties of Tests for Spatial Error Components. Regional Science and Urban Economics 33, 595-618
Anselin, L., Rey, S., 1991. Properties of tests for spatial dependence in linear regression models. Geographical Analysis 23, 112-131
Arellano, M., Bond, S., 1991. Some tests of specification for panel data - Monte-Carlo evidence and an application to employment equations. Review of Economic Studies 58, 277-297
Arellano, M., Bover, O., 1995. Another look at the instrumental variable estimation of error-components models. Journal of Econometrics 68, 29-51
Baltagi, B.H., 2005. Econometric analysis of panel data. John Wiley, Chichester. Bardhan, P., Mookherjee, D., 2006. Decentralisation and accountability in infrastructure
delivery in developing countries. Economic Journal 116, 101-127 Berry, C.R., Glaeser, E.L., 2005. The divergence of human capital levels across cities.
Papers in Regional Science 84, 407-444 Blanchard, O., Shleifer, A., 2001. Federalism with and without political centralization:
China versus Russia. Imf Staff Papers 48, 171-179 Blundell, R., Bond, S., 1998. Initial conditions and moment restrictions in dynamic panel
data models. Journal of Econometrics 87, 115-143 Brambor, T., Clark, W.R., Golder, M., 2006. Understanding interaction models:
Improving empirical analyses. Political Analysis 14, 63-82 Brancati, D., 2006. Decentralization: fueling the fire or dampening the flames of ethnic
conflict and secessionism? International Organization 60, 651-685 Brenner, N., 2004. New state spaces: urban governance and the rescaling of statehood.
Oxford University Press, Oxford, New York. Breusch, T.S., Pagan, A.R., 1980. The Lagrange multiplier test and its applications to
model specification in econometrics. Review of Economic Studies 47, 239-253 Brown, C.C., Oates, W.E., 1987. Assistance to the poor in a federal system. Journal of
Public Economics 32, 307-330 Canaleta, C.G., Arzoz, P.P., Garate, M.R., 2004. Regional economic disparities and
decentralisation. Urban Studies 41, 71-94 Cliff, A.D., Ord, J.K., 1981. Spatial processes: models & applications. Pion, London. Dabla-Norris, E., 2006. The challenge of fiscal decentralisation in transition countries.
Comparative Economic Studies 48, 100-131 Davoodi, H., Zou, H.-f., 1998. Fiscal decentralization and economic growth: A cross-
country study. Journal of Urban Economics 43, 244-257 Dawson, J.F., Richter, A.W., 2006. Probing three-way interactions in moderated multiple
regression: development and application of a slope difference test. Journal of Applied Psychology 91, 917-926
de Mello, L., 2011. Does fiscal decentralisation strengthen social capital? Cross-country evidence and the experiences of Brazil and Indonesia. Environment and Planning C: Government and Policy 29, 281-296
Durlauf, S.N., Quah, D.T., 1999. The new empirics of economic growth. In: Taylor JB & Woodford M (eds.) Handbook of macroeconomics. North-Holland: Elsevier, Amsterdam; New York, pp. 555-677.
wor
king
pape
rs s
erie
s

27
Ebel, R.D., Yilmaz, S., 2002. On the measurement and impact of fiscal decentralization. World Bank Policy Resaerch Working Paper No. 2809
European Commission, 1999. The European regions: sixth periodic report on the socio-economic situation in the regions of the European Union. Official Publication Office, Luxembourg
Ezcurra, R., Pascual, P., 2008. Fiscal decentralization and regional disparities: evidence from several European Union countries. Environment and Planning A 40, 1185-1201
Firebaugh, G., 2003. The new geography of global income inequality. Harvard University Press, Cambridge, MA.
Florax, R., Folmer, H., Rey, S.J., 2003. Specification Searches in Spatial Econometrics: the Relevance of Hendry's Methodology. Regional Science and Urban Economics 33, 557-579
Greene, W.H., 2003. Econometric analysis. Prentice Hall, Upper Saddle River, N.J., [Great Britain].
Hooghe, L., Marks, G., Schakel, A.H., 2008. Operationalizing regional authority: a coding scheme for 42 countries, 1950-2006. Regional and Federal Studies 18, 123-142
Iimi, A., 2005. Decentralization and economic growth revisited: an empirical note. Journal of Urban Economics 57, 449-461
Kanbur, R., Venables, A.J., 2005. Spatial inequality and development. In: Kanbur R & Venables AJ (eds.) Spatial inequality and development. Oxford University Press, New York, pp. 3-11.
Krugman, P., 1980. Scale Economies, Product Differentiation, and the Pattern of Trade. American Economic Review 70, 950-959
Krugman, P., Elizondo, R.L., 1996. Trade Policy and the Third World Metropolis. Journal of Development Economics 49, 137-150
Kuznets, S., Gallman, R.E., 1989. Economic Development, the Family, and Income Distribution: Selected Essays. Cambridge University Press, Cambridge.
Kyriacou, A.P., Roca-Sagalés, O., 2011. Fiscal and political decentralization and government quality. Environment and Planning C: Government and Policy 29, 204-223
Le Galès, P., 2002. European cities: social conflicts and governance. Oxford University Press, New York, Oxford.
Lessmann, C., 2009. Fiscal decentralization and regional disparity: evidence from cross-section and panel data. Environment and Planning A 41, 2455-2473
Lijphart, A., 1999. Patterns of democracy: government forms and performance in thirty-six countries. Yale University Press, New Haven, CT.
Mairesse, J., 1990. Time-series and cross-sectional estimates on panel data: why are they different and why they should be equal. In: Hartog J, Ridder G & Theeuwes J (eds.) Panel data and labor market studies. North Holland, New York, pp. 81-95.
Martin, R., 2008. National growth versus spatial equality? A cautionary note on the new 'trade-off' thinking in regional policy discourse. Regional Science Policy and Practice 1, 3-13
Martínez-Vázquez, J., McNab, R.M., 2003. Fiscal decentralization and economic growth. World Development 31, 1597-1616
wor
king
pape
rs s
erie
s

28
Morelli, C., Seaman, P., 2007. Devolution and inequality: a failure to create a community of equals? Transactions of the Institute of British Geographers 32, 523-538
Musgrave, R.A., 1959. The theory of public finance. McGraw Hill, New York. Neyapti, B., 2006. Revenue decentralization and income distribution. Economics Letters
92, 409-416 Nielsen, F., Alderson, A.S., 1997. The Kuznets curve and the great U-turn: income
inequality in U.S countries, 1970 to 1990. American Sociological Review 62, 12-33
Oates, W.E., 1972. Fiscal federalism. Harcourt Brace Jovanovich, New York. Oates, W.E., 1999. An essay on fiscal federalism. Journal of Economic Literature 37,
1120-1149 Oates, W.E., 2008. On the evolution of fiscal federalism: theory and institutions. National
Tax Journal 61, 313-334 Pauly, M.V., 1973. Income redistribution as a local public good. Journal of Public
Economics 2, 35-58 Peracchi, F., 2002. The European Community Household Panel: a review. Empirical
Economics 27, 63-90 Prud'homme, R., 1995. The dangers of decentralization. World Bank Research Observer
10, 201-220 Rodden, J., 2004. Comparative federalism and decentralization: on meaning and
measurement. Comparative Politics 36, 481-500 Rodríguez-Pose, A., Bwire, A., 2004. The economic (in)efficiency of devolution.
Environment and Planning A 36, 1907-1928 Rodríguez-Pose, A., Ezcurra, R., 2010. Does decentralization matter for regional
disparities? a cross-country analysis. Journal of Economic Geography 10, 619-644
Rodríguez-Pose, A., Ezcurra, R., 2011. Is fiscal decentralisation harmful for regional growth? Evidence from the OECD countries. Journal of Economic Geography 11, 619-643
Rodriguez-Pose, A., Gill, N., 2004. Is there a global link between regional disparities and devolution? Environment and Planning A 36, 2097-2117
Rodríguez-Pose, A., Tijmstra, S.A.R., Bwire, A., 2009. Fiscal decentralisation, efficiency, and growth. Environment and Planning A 41, 2041-2062
Rodríguez-Pose, A., Tselios, V., 2009a. Education and income inequality in the regions of the European Union. Journal of Regional Science 49, 411-437
Rodríguez-Pose, A., Tselios, V., 2009b. Mapping regional personal income distribution in Western Europe: income per capita and inequality. Finance a Uver-Czech Journal of Economics and Finance 59, 41-70
Sala-i-Martin, X.X., 2003. Keynote Speech: Convergence and Divergence – Theoretical Underpinnings. In: Tumpel-Gugerell G, Mooslechner P & Oesterreichische nationalbank. (eds.) Economic Convergence and Divergence in Europe: Growth and Regional Development in an Enlarged European Union. Edward Elgar, Cheltenham, pp. 117-127.
Schneider, A., 2003. Decentralization: conceptualization and measurement. Studies in Comparative International Development 38, 32-56
wor
king
pape
rs s
erie
s

29
Sepúlveda, C.F., Martínez-Vázquez, J., 2011. The consequences of fiscal decentralization on poverty and income equality. Environment and Planning C: Government and Policy 29, 321-343
Stegarescu, D., 2005. Public sector decentralisation: measurement concepts and recent international trends. Fiscal Studies 26, 301-333
Sterlacchini, A., 2008. R&D, higher education and regional growth: uneven linkages among European regions. Research Policy 37, 1096-1107
Thießen, U., 2003. Fiscal decentralisation and economic growth in high-income OECD countries. Fiscal Studies 24, 237-274
Tiebout, C.M., 1956. A pure theory of local expenditures. Journal of Political Economy 64, 416-424
Tselios, V., 2008. Income and educational inequalities in the regions of the European Union: geographical spillovers under welfare state restrictions. Papers in Regional Science 87, 403-430
Weingast, B.R., 2009. Second generation fiscal federalism: The implications of fiscal incentives. Journal of Urban Economics 65, 279-293
White, H., 1980. A heteroskedasticity consistent covariance matrix estimator and a direct test for heteroskedasticity. Econometrica 48, 817-838
Woldendorp, J., Keman, H., Budge, I., 2000. Party government in 48 democracies (1945-1998): composition - duration - personnel. Kluwer Academic Publishers, Dordrecht.
Wooldridge, J.M., 2002. Econometric analysis of cross section and panel data. MIT Press, Cambridge, Mass.
Zax, J.S., 1989. Is there a Leviathan in your neighbourhood? American Economic Review 79, 560-567
Zhang, T., Zou, H.-f., 2001. The growth impact of intersectoral and intergovernmental allocation of public expenditure: With applications to China and India. China Economic Review 12, 58-81
wor
king
pape
rs s
erie
s

30
Table 1: Descriptive analysis Variable Year Obs Mean Std. Dev. Min Max
Dep
ende
nt
varia
ble Income inequality (Theil index)
for the whole population 1995 94 0.4162 0.1571 0.1750 0.8296 2000 102 0.3602 0.1365 0.1057 0.7368
Income inequality (Theil index) for normally working people
1995 94 0.2421 0.0754 0.1263 0.4902 2000 102 0.2142 0.0708 0.0569 0.4099
Mod
erat
or
Income per capita (/1000) for the whole population
1995 94 9.7638 3.5351 3.4003 18.9265 2000 102 12.8134 4.5534 4.0543 21.1400
Income per capita (/1000) for normally working people
1995 94 13.1867 4.3246 4.9414 28.4248 2000 102 16.6180 5.2058 5.8032 29.3148
Inde
pend
ent v
aria
ble
Fiscal decentralisation (exp) 1995 98 0.2435 0.0774 0.0927 0.4540 2000 98 0.2704 0.0933 0.1084 0.4668
Fiscal decentralisation (rev) 1995 98 0.2777 0.0838 0.1139 0.4614 2000 98 0.2746 0.0905 0.1244 0.4603
Political decentralisation (self-rule)
1995 102 12.9137 5.2234 0 22 2000 102 13.0824 5.5139 0 22
Political decentralisation (shared-rule)
1995 102 2.0990 3.3044 0 9 2000 102 2.2284 3.2298 0 9
Political decentralisation (RAI total)
1995 102 15.0128 7.9867 0 29.2 2000 102 15.3431 8.0791 0 29.2
Trade openness 1995 102 58.7465 22.1864 43.6400 191.5760 2000 102 69.8551 31.2254 53.1757 278.9909
Public sector size 1995 102 20.0143 2.6600 15.4509 26.6144 2000 102 19.6564 2.4374 13.8081 26.0055
Con
trol v
aria
ble
Primary 1995 94 0.5360 0.1734 0.1444 0.9026 2000 102 0.4554 0.1759 0.1151 0.8595
Secondary 1995 94 0.2729 0.1658 0.0725 0.6334 2000 102 0.2844 0.1835 0.0798 0.6823
Tertiary 1995 94 0.1911 0.1066 0.0180 0.4094 2000 102 0.2603 0.1502 0.0358 0.5556
Unemployment 1995 94 0.0580 0.0329 0 0.1654 2000 102 0.0446 0.0280 0.0059 0.1485
Agriculture 1995 101 0.4413 0.3202 0.0108 1.4235 2000 97 0.4417 0.3284 0.0073 1.4441
Industry 1995 101 4.3274 1.7705 0.8403 9.2803 2000 97 5.6157 1.9288 1.3328 10.4844
Services 1995 101 10.0483 5.0555 3.6392 33.7703 2000 97 14.4104 5.9178 5.1171 38.7076
wor
king
pape
rs s
erie
s
31
Table 2: Dependent variable is income inequality for the whole population Fixed effects estimator (1) (2) (3) (4) (5) (6) (7) Income per capita -0.0203
(0.0057)*** -0.0191
(0.0080)** 0.0080
(0.0107) 0.0142
(0.0032)*** 0.0069
(0.0084) 0.0095
(0.0085) 0.0223
(0.0301) Fiscal decentralisation (exp)
-1.9969 (0.3279)***
Interaction: Income per capita x Fiscal decentralisation (exp)
0.1470 (0.0198)***
Fiscal decentralisation (rev)
-2.1419 (0.4941)***
Interaction: Income per capita x Fiscal decentralisation (rev)
0.1322 (0.0217)***
Political decentralisation (self-rule)
-0.0100 (0.0129)
Interaction: Income per capita x Political decentralisation (self-rule)
0.0008 (0.0010)
Political decentralisation (shared-rule)
-0.0616 (0.0232)**
Interaction: Income per capita x Political decentralisation (shared-rule)
0.0031 (0.0013)**
Political decentralisation (RAI total)
-0.0103 (0.0090)
Interaction: Income per capita x Political decentralisation (RAI total)
0.0008 (0.0007)
Trade openness -0.0019 (0.0027)
Interaction: Income per capita x Trade openness
0.0001 (0.0001)
Public sector size -0.0107 (0.0169)
Interaction: Income per capita x Public sector size
-0.0003 (0.0015)
Secondary (base: primary)
-0.0314 (0.0255)
-0.0314 (0.0197)
-0.0149 (0.0407)
-0.0360 (0.0292)
-0.0203 (0.0341)
-0.0237 (0.0339)
0.0111 (0.0337)
Tertiary -0.0283 (0.0203)
-0.0821 (0.0341)**
-0.0330 (0.0321)
-0.0091 (0.0389)
-0.0276 (0.0321)
-0.0367 (0.0471)
-0.0628 (0.0354)
Unemployment 0.2315 (0.1486)
0.2625 (0.1756)
0.2530 (0.2609)
0.3410 (0.2498)
0.2715 (0.2638)
0.1889 (0.1715)
0.2894 (0.2487)
Agriculture -0.0074 (0.0434)
-0.0410 (0.0395)
-0.0632 (0.0312)*
-0.0716 (0.0370)*
-0.0633 (0.0334)*
-0.0608 (0.0377)
-0.0565 (0.0256)**
Industry -0.0174 (0.0056)**
-0.0205 (0.0061)***
-0.0194 (0.0075)**
-0.0174 (0.0071)**
-0.0181 (0.0073)**
-0.0200 (0.0078)**
-0.0253 (0.0070)***
Services 0.0012 (0.0014)
0.0019 (0.0012)
0.0009 (0.0019)
0.0012 (0.0015)
0.0011 (0.0020)
-0.0022 (0.0025)
0.0005 (0.0016)
Time-dummies YES YES YES YES YES YES YES Constant 0.7697
(0.0574)*** 0.8875
(0.1310)*** 0.4437
(0.1243)*** 0.4017
(0.0464)*** 0.4476
(0.0955)*** 0.4804
(0.1706)** 0.5815
(0.3284) Observations 566 566 586 586 586 586 586 R-squared within 0.3621 0.3432 0.2763 0.2930 0.2819 0.2850 0.2867 LM test 519.45
(0.000) 521.46 (0.000)
578.75 (0.000)
634.61 (0.000)
586.40 (0.000)
639.47 (0.000)
616.00 (0.000)
*** p<0.01, ** p<0.05, * p<0.1
wor
king
pape
rs s
erie
s

32
Table 2 (cont.): Dependent variable is income inequality for the whole population Fixed effects estimator GMM estimator Weighted Weighted (8) (9) (10) (11) (12) (13) (14) (15) Income per capita 0.0338
(0.0293) 0.0162
(0.0351) 0.0157
(0.0017)*** 0.0130
(0.0025)*** -0.0061 (0.0081)
-0.0097 (0.0087)
0.0021 (0.0007)***
0.0020 (0.0007)***
Fiscal decentralisation (exp)
-2.0669 (0.4451)***
-0.8037 (0.3456)**
-0.2860 (0.1309)**
-0.1436 (0.0516)***
Interaction: Income per capita x Fiscal decentralisation (exp)
0.1696 (0.0371)***
0.0229 (0.0110)*
0.0178 (0.0103)*
0.0074 (0.0027)***
Fiscal decentralisation (rev)
-2.0712 (0.5065)***
-0.8005 (0.3603)**
-0.2391 (0.1421)*
-0.1145 (0.0369)***
Interaction: Income per capita x Fiscal decentralisation (rev)
0.1507 (0.0400)***
0.0186 (0.0125)
0.0137 (0.0120)
0.0058 (0.0015)***
Political decentralisation (RAI total)
-0.0009 (0.0081)
-0.0003 (0.0080)
0.0019 (0.0016)
0.0011 (0.0015)
0.0038 (0.0017)**
0.0032 (0.0018)*
0.0018 (0.0004)***
0.0016 (0.0003)***
Interaction: Income per capita x Political decentralisation (RAI total)
0.0003 (0.0006)
0.0003 (0.0006)
-0.0000 (0.0000)
0.0000 (0.0000)
-0.0002 (0.0001)*
-0.0002 (0.0001)
-0.0001 (0.0000)***
-0.0001 (0.0000)***
Trade openness -0.0012 (0.0025)
-0.0013 (0.0027)
0.0008 (0.0009)
0.0006 (0.0010)
0.0003 (0.0003)
0.0003 (0.0003)
0.0002 (0.0001)**
0.0002 (0.0001)**
Interaction: Income per capita x Trade openness
0.0001 (0.0001)
0.0001 (0.0001)
-0.0000 (0.0000)
-0.0000 (0.0000)
-0.0000 (0.0000)
-0.0000 (0.0000)
-0.0000 (0.0000)*
-0.0000 (0.0000)**
Public sector size 0.0261 (0.0138)*
0.0167 (0.0144)
-0.0002 (0.0071)
0.0004 (0.0062)
-0.0088 (0.0055)
-0.0114 (0.0059)*
-0.0007 (0.0005)
-0.0008 (0.0005)*
Interaction: Income per capita x Public sector size
-0.0033 (0.0013)**
-0.0023 (0.0015)
-0.0003 (0.0002)
-0.0003 (0.0002)
0.0005 (0.0004)
0.0007 (0.0004)
-0.0000 (0.0000)
-0.0000 (0.0000)
Secondary (base: primary)
-0.0512 (0.0327)
-0.0436 (0.0325)
0.0170 (0.0281)
-0.0057 (0.0322)
-0.0415 (0.0224)*
-0.0364 (0.0233)
-0.0337 (0.0171)*
-0.0374 (0.0164)**
Tertiary -0.0680 (0.0276)**
-0.0891 (0.0488)*
-0.0240 (0.0469)
-0.0522 (0.0560)
-0.0668 (0.0286)**
-0.0691 (0.0277)**
-0.0404 (0.0244)
-0.0445 (0.0234)*
Unemployment 0.2253 (0.1177)*
0.2717 (0.1604)
0.2469 (0.1889)
0.2558 (0.2224)
0.1283 (0.0836)
0.1199 (0.0846)
0.1119 (0.0716)
0.1096 (0.0712)
Agriculture -0.0194 (0.0428)
-0.0516 (0.0344)
-0.0598 (0.0337)
-0.0685 (0.0287)**
-0.0024 (0.0072)
-0.0034 (0.0075)
-0.0009 (0.0055)
-0.0007 (0.0059)
Industry -0.0178 (0.0056)***
-0.0205 (0.0068)**
-0.0123 (0.0091)
-0.0129 (0.0077)
-0.0021 (0.0017)
-0.0023 (0.0017)
-0.0021 (0.0014)
-0.0023 (0.0015)
Services -0.0009 (0.0016)
-0.0003 (0.0016)
-0.0025 (0.0026)
-0.0024 (0.0029)
0.0001 (0.0005)
-0.0001 (0.0006)
-0.0000 (0.0004)
0.0000 (0.0004)
Lagged income inequality 0.8644 (0.0257)***
0.8682 (0.0248)***
0.8886 (0.0223)***
0.8880 (0.0218)***
Time-dummies YES YES YES YES YES YES YES YES Constant 0.3971
(0.3856) 0.6247
(0.4556) 0.4822
(0.0870)*** 0.5393
(0.1045)*** 0.2027
(0.1226) 0.2569
(0.1306)* 0.0469
(0.0184)** 0.0503
(0.0179)*** Observations 566 566 566 566 477 477 477 477 R-squared within 0.3877 0.3610 0.2945 0.2876 LM test 607.13
(0.000) 312.39 (0.000)
496.17 (0.000)
479.54 (0.000)
AR(1) test -4.71 (0.000)
-4.71 (0.000)
-4.63 (0.000)
-4.59 (0.000)
AR(2) test -0.89 (0.373)
-0.88 (0.380)
-1.06 (0.290)
-1.06 (0.290)
Sargan test 327.19 (0.003)
323.88 (0.004)
324.44 (0.045)
321.52 (0.057)
*** p<0.01, ** p<0.05, * p<0.1
wor
king
pape
rs s
erie
s

33
Figure 1: Marginal effects 1a: Regression 1 (Fiscal decentralisation, expenditure)
1b: Regression 2 (Fiscal decentralisation, revenue)
-3-2
-10
1
0 1 2 3 4 5 6
Income per capita
Marginal Effect of Decentralisation95% Confidence Interval
Dependent Variable: Income Inequality
-3
-2-1
01
0 1 2 3 4 5 6
Income per capita
Marginal Effect of Decentralisation95% Confidence Interval
Dependent Variable: Income Inequality
wor
king
pape
rs s
erie
s

34
1c: Regression 3 (Political decentralisation, self-rule)
1d: Regression 4 (Political decentralization, shared-rule)
-.05
-.025
0.0
25.0
5
0 1 2 3 4 5 6
Income per capita
Marginal Effect of Decentralisation95% Confidence Interval
Dependent Variable: Income Inequality
-.1
5-.1
-.05
0.0
5
0 1 2 3 4 5 6
Income per capita
Marginal Effect of Decentralisation95% Confidence Interval
Dependent Variable: Income Inequality
wor
king
pape
rs s
erie
s

35
1e: Regression 5 (Political decentralization, RAI)
1f: Regression 6 (Trade openness)
-.05
-.025
0.0
25
0 1 2 3 4 5 6
Income per capita
Marginal Effect of Decentralisation95% Confidence Interval
Dependent Variable: Income Inequality
-.0
1-.0
050
.005
.01
0 1 2 3 4 5 6
Income per capita
Marginal Effect of Decentralisation95% Confidence Interval
Dependent Variable: Income Inequality
wor
king
pape
rs s
erie
s

36
1g: Regression 7 (Public sector size)
-.05
-.025
0.0
25.0
5
0 1 2 3 4 5 6
Income per capita
Marginal Effect of Decentralisation95% Confidence Interval
Dependent Variable: Income Inequality
wor
king
pape
rs s
erie
s

37
Appendix 1: Values of national variables by country
Country Year
Fiscal decentr. (exp)
Fiscal decentr. (rev)
Political decentr. (self-rule)
Political decentr. (shared-rule)
Political decentr. (RAI total)
Trade openness
Public sector size
AUSTRIA 1995 0.2984 0.3299 12.0 6.0 18.0 70.4181 20.0913 BELGIUM 1995 0.3033 0.3167 22.0 7.0 29.0 131.2467 21.5408 DENMARK 1995 0.4540 0.4614 10.1 0.1 10.2 71.1857 25.2254 FRANCE 1995 0.1697 0.1864 16.0 0.0 16.0 44.4107 23.6875 GERMANY 1995 0.3547 0.3993 20.2 9.0 29.2 47.4403 19.5742 IRELAND 1995 0.2340 0.2668 6.0 0.0 6.0 140.6212 16.3139 ITALY 1995 0.2048 0.2427 16.2 1.3 17.5 47.6728 17.9609 LUXEMBOURG 1995 0.1230 0.1336 0.0 0.0 0.0 191.5760 15.9096 PORTUGAL 1995 0.0927 0.1139 3.3 0.2 3.5 63.6079 17.8529 SPAIN 1995 0.2795 0.3230 18.2 3.0 21.2 44.7663 18.0830 SWEDEN 1995 0.3308 0.3776 10.0 0.0 10.0 72.7369 26.6144 UK 1995 0.2142 0.2480 9.8 0.1 9.9 56.8911 19.7624 GREECE 1995 9.0 0.0 9.0 43.6400 15.4509 AUSTRIA 2000 0.3173 0.3347 12.0 6.0 18.0 89.4929 18.3705 BELGIUM 2000 0.3090 0.3111 22.0 7.0 29.0 166.3527 21.3227 DENMARK 2000 0.4668 0.4603 10.1 0.1 10.2 87.1529 25.1243 FRANCE 2000 0.1669 0.1871 16.0 0.0 16.0 56.2274 22.9002 GERMANY 2000 0.3956 0.4036 20.2 9.0 29.2 66.4015 19.0017 IRELAND 2000 0.2677 0.2695 6.0 0.0 6.0 183.1218 13.8081 ITALY 2000 0.2530 0.2724 18.2 1.3 19.5 53.1757 18.4481 LUXEMBOURG 2000 0.1180 0.1244 0.0 0.0 0.0 278.9909 15.1000 PORTUGAL 2000 0.1084 0.1266 3.5 0.2 3.7 70.4073 19.3204 SPAIN 2000 0.3442 0.3580 19.1 3.0 22.1 61.1964 17.1928 SWEDEN 2000 0.4053 0.3831 10.0 0.0 10.0 86.8859 26.0054 UK 2000 0.2213 0.2155 9.3 0.5 9.9 57.8316 18.9639 GREECE 2000 10.0 0.0 10.0 63.2216 17.8095 AUSTRIA 1995-2000 0.3104 0.3367 12.0 6.0 18.0 79.5447 19.1776 BELGIUM 1995-2000 0.3060 0.3158 22.0 7.0 29.0 144.6451 21.5256 DENMARK 1995-2000 0.4619 0.4529 10.1 0.1 10.2 75.6948 25.3467 FRANCE 1995-2000 0.1681 0.1853 16.0 0.0 16.0 49.0231 23.4391 GERMANY 1995-2000 0.3903 0.4027 20.2 9.0 29.2 55.0519 19.3630 IRELAND 1995-2000 0.2461 0.2643 6.0 0.0 6.0 156.2111 14.7584 ITALY 1995-2000 0.2292 0.2514 17.5 1.3 18.8 47.7688 18.2206 LUXEMBOURG 1995-2000 0.1200 0.1293 0.0 0.0 0.0 230.8233 15.8976 PORTUGAL 1995-2000 0.0996 0.1255 3.4 0.2 3.6 65.8937 18.3906 SPAIN 1995-2000 0.3104 0.3413 18.8 3.0 21.8 52.1945 17.5378 SWEDEN 1995-2000 0.3729 0.3701 10.0 0.0 10.0 77.7299 26.7523 UK 1995-2000 0.2166 0.2287 7.1 0.2 7.4 56.5796 18.8608 GREECE 1995-2000 9.7 0.0 9.7 50.4910 15.6910
wor
king
pape
rs s
erie
s
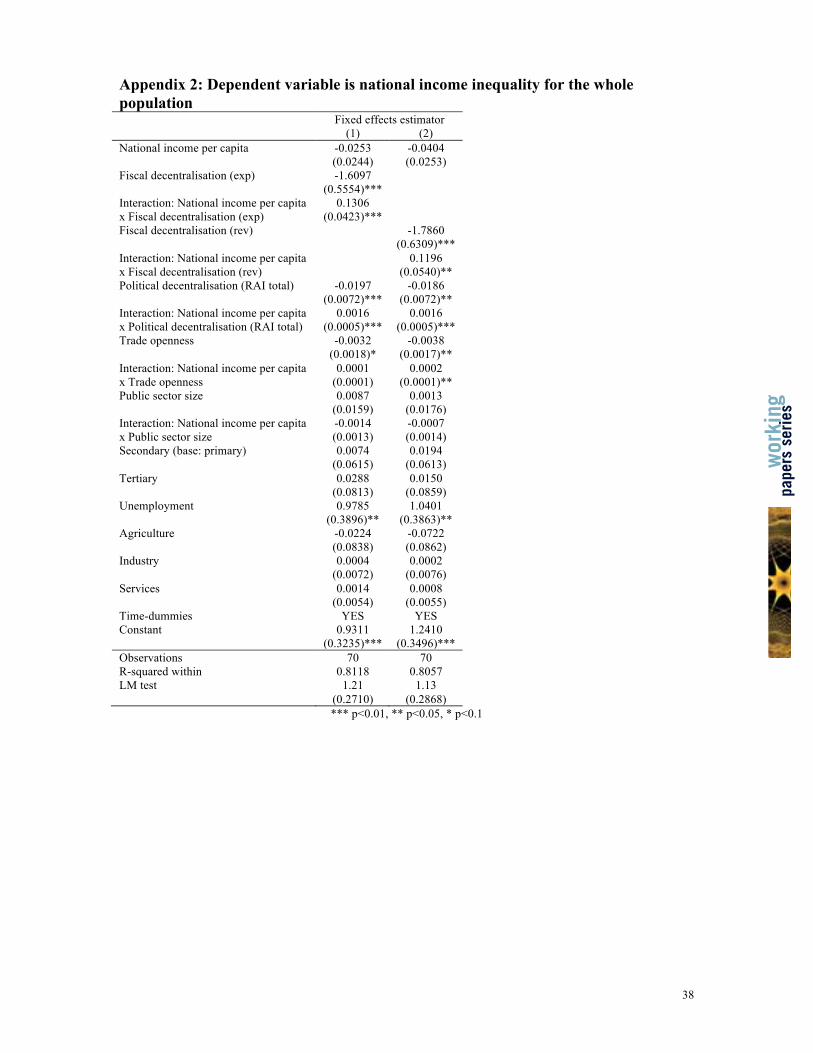
38
Appendix 2: Dependent variable is national income inequality for the whole population Fixed effects estimator (1) (2) National income per capita -0.0253
(0.0244) -0.0404 (0.0253)
Fiscal decentralisation (exp) -1.6097 (0.5554)***
Interaction: National income per capita x Fiscal decentralisation (exp)
0.1306 (0.0423)***
Fiscal decentralisation (rev) -1.7860 (0.6309)***
Interaction: National income per capita x Fiscal decentralisation (rev)
0.1196 (0.0540)**
Political decentralisation (RAI total) -0.0197 (0.0072)***
-0.0186 (0.0072)**
Interaction: National income per capita x Political decentralisation (RAI total)
0.0016 (0.0005)***
0.0016 (0.0005)***
Trade openness -0.0032 (0.0018)*
-0.0038 (0.0017)**
Interaction: National income per capita x Trade openness
0.0001 (0.0001)
0.0002 (0.0001)**
Public sector size 0.0087 (0.0159)
0.0013 (0.0176)
Interaction: National income per capita x Public sector size
-0.0014 (0.0013)
-0.0007 (0.0014)
Secondary (base: primary) 0.0074 (0.0615)
0.0194 (0.0613)
Tertiary 0.0288 (0.0813)
0.0150 (0.0859)
Unemployment 0.9785 (0.3896)**
1.0401 (0.3863)**
Agriculture -0.0224 (0.0838)
-0.0722 (0.0862)
Industry 0.0004 (0.0072)
0.0002 (0.0076)
Services 0.0014 (0.0054)
0.0008 (0.0055)
Time-dummies YES YES Constant 0.9311
(0.3235)*** 1.2410
(0.3496)*** Observations 70 70 R-squared within 0.8118 0.8057 LM test 1.21
(0.2710) 1.13
(0.2868) *** p<0.01, ** p<0.05, * p<0.1
wor
king
pape
rs s
erie
s
Copyright © 2022 FDOKUMEN