Third sector - Income inequality
18
IPBJ Vol. 5 (1), 49 - 65 (2013) 49 COMPARATIVE ASSESSMENT OF THE ROLE OF STATE, THIRD SECTOR AND COMBINED INTERVENTION OF STATE AND THIRD SECTOR IN INTERVENING INCOME INEQUALITIES THROUGH SHGS Byra Reddy V.J. Associate Professor at Indus Business Academy (IBA), Bangalore, India Shashidhar. C Asst. Professor at The Oxford College of Arts, Bangalore, India Veena K.N Associate Professor at Indus Business Academy (IBA), Bangalore, India ABSTRACT Inequality reduction in general and income inequality reduction in particular has occupied huge efforts/resources of the state since independence in India. Given that more than 300 million people are under poverty line in India today and the sheer deprivation that they face, evaluation of inequality reduction methods in India assume greater significance. In the above context, the present paper is an attempt to understand the effectiveness of income inequality reduction methods by the state, third sector and the combined intervention of the state and third sector. For this purpose four villages in the Gulbarga district of Karnataka were chosen to assess the relative effectiveness of the interventions by state, third sector and the combined interventions of state and third sector. The results of the study show that, Combined intervention of the State and Third Sector on Income inequalities through SHGs is distinctly better in providing regular employment to employed people than other types of intervention. Combined intervention of State and Third Sector in Income inequalities is distinctly better both in empowering people with higher incomes and discouraging people from borrowing money from money lenders at very high interest rates. It could also be concluded that combined intervention of State and Third Sector provides better terms of borrowing than State intervention alone or Third Sector intervention alone. Earning and saving patters are much better in combined intervention of State and Third Sector than other interventions. Keywords: inequality, income inequality, third sector, state and SHGs 49 IPBJ Vol. 5 (1), 49 - 65 (2013)
-
Upload
dsbacademy -
Category
Documents
-
view
3 -
download
0
Transcript of Third sector - Income inequality

IPBJ Vol. 5 (1), 49 - 65 (2013) 49
COMPARATIVE ASSESSMENT OF THE ROLE OF STATE, THIRD SECTOR AND COMBINED
INTERVENTION OF STATE AND THIRD SECTOR IN INTERVENING INCOME INEQUALITIES
THROUGH SHGS
Byra Reddy V.J.Associate Professor at Indus Business Academy (IBA), Bangalore, India
Shashidhar. CAsst. Professor at The Oxford College of Arts, Bangalore, India
Veena K.NAssociate Professor at Indus Business Academy (IBA), Bangalore, India
ABSTRACT
Inequality reduction in general and income inequality reduction in particular has occupied huge efforts/resources of the state since independence in India. Given that more than 300 million people are under poverty line in India today and the sheer deprivation that they face, evaluation of inequality reduction methods in India assume greater significance. In the above context, the present paper is an attempt to understand the effectiveness of income inequality reduction methods by the state, third sector and the combined intervention of the state and third sector. For this purpose four villages in the Gulbarga district of Karnataka were chosen to assess the relative effectiveness of the interventions by state, third sector and the combined interventions of state and third sector.
The results of the study show that, Combined intervention of the State and Third Sector on Income inequalities through SHGs is distinctly better in providing regular employment to employed people than other types of intervention. Combined intervention of State and Third Sector in Income inequalities is distinctly better both in empowering people with higher incomes and discouraging people from borrowing money from money lenders at very high interest rates. It could also be concluded that combined intervention of State and Third Sector provides better terms of borrowing than State intervention alone or Third Sector intervention alone. Earning and saving patters are much better in combined intervention of State and Third Sector than other interventions.
Keywords: inequality, income inequality, third sector, state and SHGs
49 IPBJ Vol. 5 (1), 49 - 65 (2013)

50 IPBJ Vol. 5 (1), 49 - 65 (2013)
INTRODUCTION
One of the very important roles of Third Sector is that of inequality reduction, be it Social inequality, Economic inequality or political inequality. Some spaces of inequality such as the inequalities in the Space of Health, Education, Gender and Income form the basis of social, Economic and Political inequality.
Of the many spaces of inequality noted earlier, inequality in the space of Income is an important one. There is a broad understanding among scholars working in this area that inequality reduction in Income is predominantly the task of State. But the protagonists of Third Sector say that the ‘Third Sector’ too has a vital role in intervening in Income inequality, particularly though SHGs and Micro Finance. Between these two views is the view that State should work with Third Sector to reduce inequalities in Income. There is abundant literature to support and contradict the three views (Kothari 1988; Young 1991; Kohli 1991; Abramson 1999; Nelson 1995; Gaventa 1999; Fowler 2000a; Jha 2004; Munshi and Abraham 2004; Pandey 2005 and Chandhoke 2003, 2009). This particular study tries to evaluate the combined intervention of the State and Third Sector on Income inequalities through SHGs.
REVIEW OF LITERATURE
The need and role of State in India to reduce inequalities:
The idea of broader view of development concerning good quality of life is not a new one, as far as India is concerned. The emphasis on development in terms of a long, healthy and fulfilling life dates back to the pre-independence era. Dada Bhai Naoroji in his book, ‘Poverty and UN British Rule’, deliberated on this view of development exclusively. In fact, National planning committee report spelt out in concrete terms the concept and the content of minimum standard of living. A committee headed by pandit Jawaharlal Nehru, suggested that assurance of a national minimum standard in respect of all essentials of physical and social well-being to every family within a reasonable period of time, as the goal of all schemes of development. The constitutional provisions on the directive principles of the State policy specifically enjoined the government to ensure adequate livelihood and employment, health and nutrition, education and security, to all citizens. What came out of such a clear thinking about development on the eve and just after independence was quite contrary. Ram Manohar Lohia, Sometime in the end of 1950s dramatised the outcome, in the parliament, calling to its attention, more
IPBJ Vol. 5 (1), 49 - 65 (2013) 51
than half of the population that subsisted on less than six annas per head per day. Development policy in India in the post independent period got itself enmeshed with the growth preoccupation, as was the case with development Economics elsewhere. It was widely believed by policy makers and political leadership in India, that growth would ‘trickle down’ to the poorest sections of the society and to this end, nothing proactively needs to be done.
India’s record of inequalities, even now, when it is the second fastest growing economy in the world, is rather appalling. Though, the type of growth that India is witnessing at present is quite heartening to note, so far, this growth has only accentuated the prevailing inequalities by polarising development all the more. There are also indicators that it would continue to accentuate the existing inequalities (Deaton and Dreze 2002)
Income inequality in Karnataka:
Income and consumption distribution, and the incidence of income poverty depend on the distribution of assets and employment opportunities for utilizing the only endowment of the asset-less rural poor, i.e. labor, and its price, viz. real wage rate. Hence, this section will examine the situation in rural Karnataka with respect to these factors that have critical implications for income distribution and poverty. The sectoral distribution of State income shows a decline in the share of the primary sector from 38.10 per cent in 1993-94 to 20.90 per cent in 2003-04. The secondary sector’s share has increased marginally, from 24 per cent in 1993-94 to 25.5 per cent in 2003-04. There is, however, a significant increase in the share of the tertiary sector, with 37.9 per cent in 1993-94 increasing to nearly 54 per cent in 2003-04, contributing to more than half of the State’s income. The average area of operational holdings1 in Karnataka in 1991-92 was 1.85 hectare (ha.), which was higher than the all-India estimate of 1.34 ha. The extent of inequality in the distribution of operational holdings, as measured by the Gini ratio, was 0.609 (0.641) in rural Karnataka (all-India). Available estimates indicate an increase in the extent of inequality between three time-points in rural Karnataka as well as in rural all-India. During the same period, the percentage of marginal holdings increased from 28.76 per cent (45.77 per cent) to 38.40 per cent (56.00 per cent), and finally, to 49.71 per cent (62.79 per cent) in rural Karnataka (rural all-India); the corresponding estimates of area operated were 5.10 per cent (9.21 per cent), 5.80 per cent (11.50 per cent) and 9.56 per cent (15.60 per cent) respectively (NSSO 1997). The distributional perspective indicates that the percentage of tenant holdings is low in Karnataka (8.0 per cent in 1991-92) relative to the all-India level (11.0 per
52 IPBJ Vol. 5 (1), 49 - 65 (2013)
cent) (NSSO 1997). This is an outcome of the land reforms implemented in the 1980s. However, from the perspective of vulnerability (a major focus of any debate on deprivation), the percentage
The role of Third Sector in Reducing Inequalities:
Third Sector encompasses that particular set of organisations variously called and including NGOs, nonprofits, people’s organisations, voluntary associations, voluntary development organisations, civil society organisations, unions, religious organisations and cooperatives.
One of the very important aspects of the Third Sector initiatives is, the initiative’s voluntarity, this is to say that Third Sector initiatives are self propelled rather than externally instigated. An important concomitant aspect that follows voluntarity is the non-profit nature of this initiative. In fact, conceptual understanding of Third Sector or voluntary organisations becomes abundantly clear, if they are understood as organisations, whose goal is not profit but non-profit. The end of community that Third Sector seeks to work at, varies with the needs of the community, for instance ends such as empowering women, providing a particular type of a health service, providing vocational education etc. Third Sector while working at these ends is essentially engrossed at mobilizing resources required for these ends and realizing these ends with the mobilized resources. At no point in the whole process ‘profits’ or ‘profit motive’ is an end of Third Sector. In the recent decades, these organisations have been playing an important role in ‘Development’ and development debates.
Theodore Levitt (1972) in his book, ‘The Third Sector, New Tactics for a Responsive Society’, traces the origin of Third Sector to the failure of the State and the market. He calls the State as the first sector and the market as the second sector and then goes on to argue that the State and the market have failed on account of a ‘condition’ in the society, that has been brought about by the failure of the first two sectors. To quote Levitt “the issue now is not about the particular problems emanating from the condition of the society but is about the condition common to all problems” in order to address the condition common to all problems of the society he says the ‘Third Sector’ came into existence. Lester V Solomon talking about the importance of the Third Sector says, “Third Sector may contribute the significant economic and social development of the twentieth century, much the nation-state was of the nineteenth century” (Solomon 1994). By 2002, the changed geopolitical environment and the economic downturn challenged both the (by now) relatively large infrastructure of global civil society organizations, and the broad value base of cosmopolitanism in many countries across the world, in

IPBJ Vol. 5 (1), 49 - 65 (2013) 53
particular among the middle classes and elites (Held 2003). As a result, new organizational forms and ways of organizing and communications have gained in importance, with social forums (Glasius and Timms 2006), Internet based mobilization (Clarke and Themudo 2006), and transnational networks (Katz and Anheier, 2006), as prominent examples. These developments, as the expansion of global civil society generally, are accompanied by a resurgence of religion in some parts of the world, and a change in state–religion relationships (Inglehart and Norris 2007; Juergensmayer 2007), creating a more conflict-prone, and highly diversified, complex sphere of ideas, values, institutions, organizations, networks, and individuals.
In the context of the above discussions on the current debates on inequality per se and inequality in development debates, Inequalities in India development debates and Third Sector in Development debates, the present study identifies two major study areas; One that of understanding the notion of ‘inequality’ and setting inequality in the present Indian and Karnataka’s context and Two that of assessing the inequality reduction ability of State and the Third Sector. In order to accomplish these challenges the study identifies the following objectives.
OBJECTIVE OF THE STUDY
It is possible to put these debates in the right perspective, from an empirical comparative assessment of the interventions of State and a comparable intervention of the Third Sector and a comparable intervention of the combined intervention of the State and the Third Sector with a minimal intervention of the State and the Third Sector in addressing Income inequalities. With the objective of obtaining an empirical comparative assessment of the Interventions of State, Third Sector, Combined intervention of State and Third Sector with minimal intervention of State and Third Sector, the present study carried out a field survey in the backward district of Gulbarga in the State of Karnataka in India.
SAMPLE SELECTION AND METHODOLOGY OF THE STUDY
In the district of Gulbarga, four villages – Anthapnal, sonth, Dinsi and Tadakal - which are broadly homogeneous on social economic and Political parameters such as size of population, amenities available, Caste, lifestyles of populations, Prevalence of Social capital, type and system of governance etc., have been chosen for the study. These four villages have been further selected in such a way that; in one village(Antahpnal) there

54 IPBJ Vol. 5 (1), 49 - 65 (2013)
is a strong State intervention in the form of an effectively run SHG by State being active, in the second village(Sonth) there is a strong Third Sector intervention in the form of a NGO run SHG intervening in Income inequalities, in the third village(Dinsi)there is both State and Third Sector intervention in the form of both a state run SHG and a NGO run SHG intervening in Income Inequalities and in the fourth village(Tadakal), there is minimal State and Third Sector intervention in the form of the villagers of this village not having any form of SHG intervention in to savings.
Data on health inequalities from 30 households each from these four villages i.e., 120 households has been collected. For the purpose of the study broad group of variables such as, employment details, income, wealth, saving pattern, borrowing pattern and loss of work due to illnesses are considered. These broad variables include specific indicative variables specific to each of them like, employment details is indicated by specific variables such as employment status, occupation, nature of employment and the number of days worked during the preceding month of the survey. Income is indicated through income per day from main activity and total family income per annum. Wealth is indicated through the size of land holding by the household. Saving pattern is indicated through savings of the household in Self-help groups (SHGs), savings in LIC and total savings. Borrowing patterns are indicated through amount borrowed and source of borrowing. Loss of work due to illness is indicated through the number of days of employment lost due to sickness. However in the present paper data on total savings and the savings in SGHs are analysed.
RESULTS AND DISCUSSION
Table 1 Income earned per day by respondents by villages
Income per day for all individuals from
main activity in Rupees
Total
Less than 40 41-80 81-150
1 5 1 -250
251 and above
VILLAGEAnthapnal
(SI)
Count 8 28 29 2 3 70Expected
Count 10.7 30.6 24.3 1.9 2.5 70.0
% of Total 3.1% 11.0% 11.4% .8% 1.2% 27.6%

IPBJ Vol. 5 (1), 49 - 65 (2013) 55
Income per day for all individuals from
main activity in Rupees
Total
Less than 40 41-80 81-150
1 5 1 -250
251 and above
Dinsi(TSI)
Count 5 36 17 3 6 67Expected
Count 10.3 29.3 23.2 1.8 2.4 67.0
% of Total 2.0% 14.2% 6.7% 1.2% 2.4% 26.4%
Sonth(SI&TSI)
Count 2 22 30 2 0 56Expected
Count 8.6 24.5 19.4 1.5 2.0 56.0
% of Total .8% 8.7% 11.8% .8% .0% 22.0%
Tadakal(MI)
Count 24 25 12 0 0 61Expected
Count 9.4 26.7 21.1 1.7 2.2 61.0
% of Total 9.4% 9.8% 4.7% .0% .0% 24.0%
TotalCount 39 111 88 7 9 254
Expected Count 39.0 111.0 88.0 7.0 9.0 254.0% of Total 15.4% 43.7% 34.6% 2.8% 3.5% 100.0%
Table 2 Results of chi – square tests for Income earned per day by respondents by villages
Chi-Square Tests
Value df Asymp. Sig. (2-sided)
Pearson Chi-Square 58.124(a) 12 .000(***)Likelihood Ratio 58.127 12 .000
a 8 cells (40.0%) have expected count less than 5. The minimum expected count is 1.54.
Table 3. ANOVA results for Income earned per day by respondents by villages
ANOVA Income per day for all
individuals from main activity
Sum of Squares df Mean
Square F Sig.
Between Villages 24.614 3 8.205 11.427 .000(***)Within Villages 179.496 250 .718
Total 204.110 253

56 IPBJ Vol. 5 (1), 49 - 65 (2013)
Table 4 Results of post-hoc tests for Income earned per day by respondents by villages
Multiple Comparisons Dependent Variable: Income per day for all individuals from
main activity LSDMean
Difference (I-J) Std. Error Sig.
95% Confidence
Interval(I) VILLAGE (J) VILLAGE Lower Bound
Upper Bound
Anthapnal(SI)
Dinsi -5.1599E-02 .1448 .722 -.3368 .2336Sonth -8.5714E-02 .1519 .573 -.3849 .2135
Tadakal .6824(***) .1484 .000 .3901 .9747Dinsi(TSI)
Anthapnal 5.160E-02 .1448 .722 -.2336 .3368Sonth -3.4115E-02 .1534 .824 -.3363 .2680
Tadakal .7340(***) .1500 .000 .4387 1.0294Sonth
(SI&TSI)Anthapnal 8.571E-02 .1519 .573 -.2135 .3849
Dinsi 3.412E-02 .1534 .824 -.2680 .3363Tadakal .7681(***) .1568 .000 .4593 1.0770
Tadakal(MI)
Anthapnal -.6824(***) .1484 .000 -.9747 -.3901Dinsi -.7340(***) .1500 .000 -1.0294 -.4387Sonth -.7681(***) .1568 .000 -1.0770 -.4593
* The mean difference is significant at the .05 level.
The data in tables 1 through 4 provide information on Income per day for all employed individuals. According to table 1, of the 254 employed respondents, 111 earn between 41 – 80 Rupees per day, 88 of them earn 81 – 150 Rupees per day, 16 of them earn more than 151 Rupees per day and 39 respondents earn less than Rupees 40 per day.
It is interesting to note that in village, Tadakal, charactersied by minimal intervention by State and Third Sector, exhibit two undesirable aspects. There are no respondent earning 151-250 and 251 and above Rupees in this village, while in the other three villages there are at least a very few people who earn above 151 Rupees per day. The number of respondents earning less than 40 Rupees per day is 24 out of 61 respondents which is highest in this class interval when compared with the same for other three villages. The village, Sonth, characterised by combined intervention of State and Third Sector in Income has the highest number of 30 respondents earning 81 – 150 Rupees per day, which is the highest in this class interval for all villages surveyed for income inequalities. The village, Dinsi, characterised by Third Sector intervention, has the highest number of 9 out of 67 respondent earning above Rupees 151 per day, this is the highest for these class intervals when compared to the same for other three villages.
IPBJ Vol. 5 (1), 49 - 65 (2013) 57
Pearson chi-square measure of association (chi square = 58.124) for income earned per day by employed respondents by villages in table 2 shows a significant p value (p = 0.000). This level of significance implies a very high association between the income earned per day by employed respondents by villages and type of intervention in the three villages surveyed. This statistical inference is particularly important considering the income generating ability of the SHGs.
Table 6.4.13 showing ANOVA results for average income earned per day by employed respondents in the villages surveyed for Income inequalities shows a F- value (11.427) with significance 0.000. This level of significance implies a very high degree of variance between average income earned per day by employed respondents and type of intervention among villages surveyed for Income inequalities.
Table 4 showing post-hoc tests of variance, with multiple comparisons between villages with different interventions by average income earned per day by employed respondents in the villages surveyed for income inequalities shows the following results. The difference in average income earned per day between employed respondents of village Tadakal, characterised by minimal intervention of State and Third Sector and the difference of average income earned in the other three villages, Anthapnal, Dinsi and Sonth, characterised by State, Third Sector and combined intervention in income respectively shows a significance level of 0.000. This level of significance implies a very high degree of variance in the average incomes earned by respondents of village Tadakal and the other three villages. Further, considering that the difference of the other three villages with Tadakal shows a negative sign it can be implied that the average income earned per day in Tadakal is the lowest than that of other three villages with varying interventions of State and Third Sector. It is also of interest to note that the differences of average incomes earned per day between villages, Anthapnal, Dinsi and Sonth, characterised by State, Third Sector and combined intervention in income respectively shows a statistically insignificant variance. This implies the distribution of average incomes earned per day by employed respondents in these three villages shows an insignificant variance.
58 IPBJ Vol. 5 (1), 49 - 65 (2013)
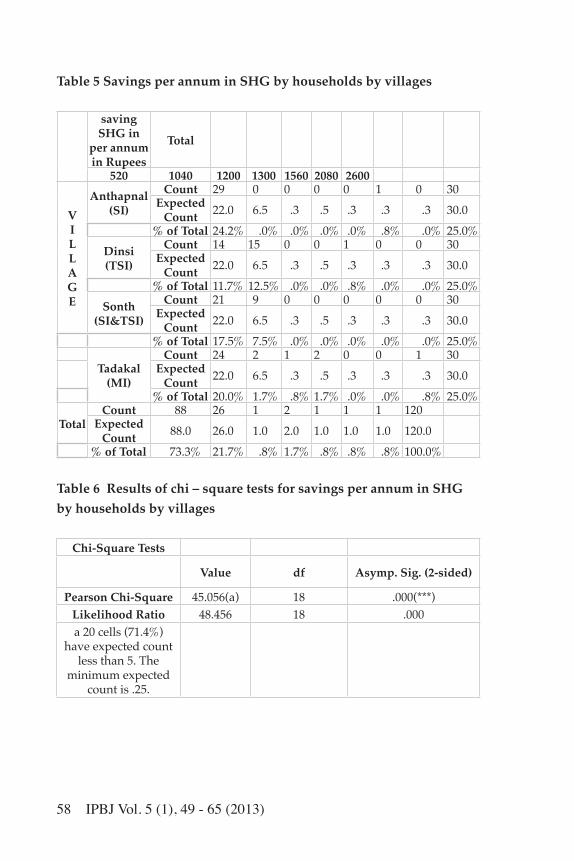
Table 5 Savings per annum in SHG by households by villages
saving SHG in
per annum in Rupees
Total
520 1040 1200 1300 1560 2080 2600
VILLAGE
Anthapnal(SI)
Count 29 0 0 0 0 1 0 30Expected
Count 22.0 6.5 .3 .5 .3 .3 .3 30.0
% of Total 24.2% .0% .0% .0% .0% .8% .0% 25.0%Dinsi(TSI)
Count 14 15 0 0 1 0 0 30Expected
Count 22.0 6.5 .3 .5 .3 .3 .3 30.0
% of Total 11.7% 12.5% .0% .0% .8% .0% .0% 25.0%Sonth
(SI&TSI)
Count 21 9 0 0 0 0 0 30Expected
Count 22.0 6.5 .3 .5 .3 .3 .3 30.0
% of Total 17.5% 7.5% .0% .0% .0% .0% .0% 25.0%
Tadakal(MI)
Count 24 2 1 2 0 0 1 30Expected
Count 22.0 6.5 .3 .5 .3 .3 .3 30.0
% of Total 20.0% 1.7% .8% 1.7% .0% .0% .8% 25.0%
TotalCount 88 26 1 2 1 1 1 120
Expected Count 88.0 26.0 1.0 2.0 1.0 1.0 1.0 120.0
% of Total 73.3% 21.7% .8% 1.7% .8% .8% .8% 100.0%
Table 6 Results of chi – square tests for savings per annum in SHG by households by villages
Chi-Square Tests
Value df Asymp. Sig. (2-sided)
Pearson Chi-Square 45.056(a) 18 .000(***)Likelihood Ratio 48.456 18 .000a 20 cells (71.4%)
have expected count less than 5. The
minimum expected count is .25.

IPBJ Vol. 5 (1), 49 - 65 (2013) 59
Table 7 ANOVA results for savings per annum in SHG by households by villages
ANOVA saving SHG 13
Sum of Squares df Mean Square F Sig.
Between Villages 892093.333 3 297364.444 2.833 .041Within Villages 12177493.333 116 104978.391
Total 13069586.667 119
Table 8 Results of post-hoc tests for savings per annum in SHG by households by villages
Multiple Comparisons Dependent
Variable: saving SHG 13 LSD
Mean Difference
(I-J) Std. Error Sig.95%
Confidence Interval(I) VILLAGE (J)
VILLAGELower Bound
Upper Bound
Anthapnal(SI)
Dinsi -242.6667(**) 83.6574 .004 -408.3607 -76.9727Sonth -104.0000 83.6574 .216 -269.6940 61.6940
Tadakal -126.6667 83.6574 .133 -292.3607 39.0273Dinsi(TSI)
Anthapnal 242.6667(**) 83.6574 .004 76.9727 408.3607Sonth 138.6667 83.6574 .100 -27.0273 304.3607
Tadakal 116.0000 83.6574 .168 -49.6940 281.6940Sonth
(SI&TSI)Anthapnal 104.0000 83.6574 .216 -61.6940 269.6940
Dinsi -138.6667 83.6574 .100 -304.3607 27.0273Tadakal -22.6667 83.6574 .787 -188.3607 143.0273
Tadakal(MI)
Anthapnal 126.6667 83.6574 .133 -39.0273 292.3607Dinsi -116.0000 83.6574 .168 -281.6940 49.6940Sonth 22.6667 83.6574 .787 -143.0273 188.3607
* The mean difference is
significant at the .05 level.
Two other factors that determines standard of living in the general sense and that enables or disables people to live quality life are savings and borrowings. Tables 5 through 8 provide information on savings pattern and borrowing habits of respondents surveyed to understand Income inequalities. savings patterns of respondents are analysed under three specific indicators – Savings in SHGs as presence of various types of

60 IPBJ Vol. 5 (1), 49 - 65 (2013)
SHGs formed the basis for interventions, Savings in LICs , that gives us an idea of general savings pattern of respondents and total family savings.
The surveyed data on savings in SHGs are presented in table 5. In This table the amount of savings that households were making is classified under the amount decided by the SHGs that they will save per week. Therefore, there is varied amount under the savings per annum in Rupees head.
It is clear from the table that of the 120 households, 88 save Rupees 520, 26 save Rupees1040, 2 households save Rupees 1300 and 1 household each saves Rupees 1200, 1560, 2080 and Rupees 2600 respectively.
It is seen from the table that in village, Anthapnal, characterised by State intervention there are 29 households that save Rupees 520, whereas one household saves Rupees 2080. In village, Dinsi, characterised by Third Sector intervention, 14 households save Rupees 520, 15 households save Rupees 1040, whereas one household saves Rupees 1560. In village Sonth, characterised by combined intervention, 21 save Rupees 520, whereas 9 save Rupees 1040. In the village, Tadakal, characterised by minimal intervention of State and Third Sector, 24 households save Rupees 520, 2 households save 1040, 2 households save Rupees 1300 and 1 household each save Rupees 1200 and 2600 respectively.
Pearson chi-square measure of association (chi square = 45.056) for savings in SFG by households surveyed for income inequalities by villages in table 6 shows a significant p value (p = 0.000). This level of significance implies a very high association between savings in SHGs and type of intervention in the three villages surveyed. This statistical inference is particularly important considering the income generating ability of the SHGs.
Table 7 showing ANOVA results for average annual savings in SHGs by households surveyed for income inequalities by villages shows a F- value (2.833) with significance 0.041. This level of significance implies a high degree of variance between average annual savings in SHGs and type of intervention among villages surveyed for Income inequalities.
Table 8 showing post-hoc tests of variance, in multiple comparisons between villages, with different interventions by average annual savings in SHGs shows the following results. The difference in average annual savings in SHGs between the village, Anthapnal, characterised by State

IPBJ Vol. 5 (1), 49 - 65 (2013) 61
intervention and village Dinsi, characterised by Third Sector intervention shows significance at less than 1% level. This implies a very high level variance in average savings between these two villages. The rest of the difference comparisons between other villages does not show any statistical significance.
Table 9 Total family savings per annum by households by villages
Total Savings of the family per annum
in RupeesTotal
Less than 3000 3001 – 60006001
– 9000
9001 –
12000
12001 and
above
VILLAGE
Anthapnal(SI)
Count 26 1 0 3 0 30Expected
Count 16.5 3.0 6.0 3.0 1.5 30.0
% of Total 21.7% .8% .0% 2.5% .0% 25.0%
Dinsi(TSI)
Count 9 3 11 4 3 30Expected
Count 16.5 3.0 6.0 3.0 1.5 30.0
% of Total 7.5% 2.5% 9.2% 3.3% 2.5% 25.0%
Sonth(SI&TSI)
Count 14 8 6 1 1 30Expected
Count 16.5 3.0 6.0 3.0 1.5 30.0
% of Total 11.7% 6.7% 5.0% .8% .8% 25.0%
Tadakal(MI)
Count 17 0 7 4 2 30Expected
Count 16.5 3.0 6.0 3.0 1.5 30.0
% of Total 14.2% .0% 5.8% 3.3% 1.7% 25.0%
Total Count 66 12 24 12 6 120Expected Count 66.0 12.0 24.0 12.0 6.0 120.0
% of Total 55.0% 10.0% 20.0% 10.0% 5.0% 100.0%
Table 10 Results of chi – square tests for total family savings per annum by households by villages
Chi-Square TestsValue df Asymp. Sig. (2-sided)
Pearson Chi-Square 37.606(a) 12 .000(***)Likelihood Ratio 45.044 12 .000a 12 cells (60.0%)
have expected count less than 5. The
minimum expected count is 1.50.
Table 9 shows total family savings including savings in SHG and LIC per annum. Total family savings per annum are organized in class intervals
62 IPBJ Vol. 5 (1), 49 - 65 (2013)
of Rupees 3000 each. According to this table, of the total 120 households surveyed, 66 households save less than Rupees 3000 per annum, 24 households save Rupees 6001 to 9000, 6 households save Rupees 120001 and above and 12 households each save Rupees 3301 – 6000 and Rupees 9001 – 12000.
It is seen from the table that in village Anthapnal, characterised by State intervention, 26 households save less than Rupees 3000. This village also does not have any household reporting savings of Rupees 12001 and above. In village, Dinsi characterised by Third Sector intervention 11 households save Rupees 6001 – 9000 per annum.
Pearson chi-square measure of association (chi square = 37.606) for total family savings per annum by households surveyed for income inequalities by villages in table 10 shows a significant p value (p = 0.000). This level of significance implies a very high association between total family savings per annum and type of intervention in the three villages surveyed.
FINDINGS
The study reflects following findings.
• On the parameter income earned per day by the employed respondents from main activity, it is found that in the minimal intervention village Tadakal, there is no respondent earning Rupees 151-250 and Rupees 251 and above Rupees in this village, while in the other three villages there are at least a very few people who earn above 151 Rupees per day.
• It is found that in minimal intervention village Tadakal, the number of respondents earning less than 40 Rupees per day is 24 out of 61 respondents which is highest in this class interval when compared with the same for other three villages
• It is found that in the Third Sector intervention village Dinsi, the number of employed respondents earning above Rupees 151 per day is the highest i.e., 9 out of 67 respondents. , this is the highest for these class intervals when compared to the same for other three villages. Whereas number of employed respondents earning above Rupees 151 and above is 16 for all the four surveyed villages.

IPBJ Vol. 5 (1), 49 - 65 (2013) 63
• The above findings are corroborated by the Pearson chi-square measure of association that shows a significant p value (p = 0.000). This level of significance implies a very high association between the income earned per day by employed respondents by villages and type of intervention in the three villages surveyed.
• On the parameter Savings per annum in SHG, it is found that of the 120 households, 88 save Rupees 520, 26 save Rupees1040, 2 households save Rupees 1300 and 1 household each saves Rupees 1200, 1560, 2080 and Rupees 2600 respectively.
• On the parameter total family savings per annum, it is found that of the total 120 households surveyed, 66 households save less than Rupees 3000 per annum, 24 households save Rupees 6001 to 9000, 6 households save Rupees 120001 and above and 12 households each save Rupees 3301 – 6000 and Rupees 9001 – 12000 per annum.
• On the parameter amount of money borrowed by the household in the 5 years preceding the survey, it is found that there have been 219 instances of borrowings by the 120 households surveyed.
• It is found that Of the 219 instances of borrowing, 77 have been instances of households borrowing Rupees 20001 – 50000, 72 have been instances households borrowing 12001 – 20000 Rupees.
• The above findings are corroborated by the Pearson chi-square measure of association that shows a significant p value (p = 0.000). This level of significance implies a very high association between total borrowings in the last 5 years by households and type of intervention in the three villages surveyed.
CONCLUSIONS
Combined intervention of the State and Third Sector on Income inequalities through SHGs is distinctly better in providing regular employment to employed people than other types of intervention.
Combined intervention of State and Third Sector in Income inequalities is distinctly better both in empowering people with higher incomes and discouraging people from borrowing money from money lenders at very high interest rates. It could also be concluded that combined intervention

64 IPBJ Vol. 5 (1), 49 - 65 (2013)
of State and Third Sector provides better terms of borrowing than State intervention alone or Third Sector intervention alone. Earning and saving patters are much better in combined intervention of State and Third Sector than other interventions.
REFERENCES
Elizabeth, A. S. (1999). What is the point of equality? Ethics, January 1999, 287-337.
Atkinson, A. B. (1983). Social justice and public policy. Brighton: Wheatsheaf and Cambridge, mass. MIT press.
Beteille, A. (1969). Social inequality harmondsworth: Penguin Books.
Neera, C. (1995). State and civil society: exploration in political theory. New Delhi, Sage Publications.
Sudipta, K. (2001). In search of civil society. In Sudipta K. & Sunil K. (eds), civil society: history and possibilities, pp. 298-323. Cambridge: Cambridge University Pess.
Rajni, K. (1988). The state against democracy: in search of humane governance. Delhi, Ajanta Publications.
Panikar, P.G.K., & Soman, C.R. (1984). Health Status of Kerala (Trivandrum: Centre for Development Studies).
Catherine, R. E., & Chia-ling, W. (1995). The times between education & health. American Sociological Review, 60(5),719-745.
Sen, A. K. (1973). On economic inequality. Oxford: Clarendon press and New York: Norton)
Sen, A. K. (1980). Equality of what? In Macmillan (1980). (Repr. In sen 1982a and in Rawls et al. 1987).
Sen, A.K. (1983). Development: which way now. Economic Journal, 93.
Sen, A.K. (1983). Poor, relatively speaking. Oxford Economic Papers, 35.
IPBJ Vol. 5 (1), 49 - 65 (2013) 65
Abhijith, S., & Himanshu (2005). Poverty and inequality in India: getting closer to the truth. Reprinted in Angus Deaton and Valerie Kozel (eds). Data and dogma: the great Indian poverty debate. Macmillan, New Delhi, 306-370 (Available at www.networkideas.org.).
Sreedhara T.N., & Byra R.V.J. (2003). Institutional governance and third sector development in India. Southern Economist, 44, November 15.
Sreedhara T.N., & Rajarama, T. (2003). Third Sector in India. Monograph, TSRGI, University of Mysore, Manasagangotri, Mysore.
Srinivasan, T.N. (1981). Malnutrition: some measurement and policy issues. Journal of Development Economics, 8.
Stewart, F. (1985). Planning to meet basic needs, Macmillan London.
Sundaram, K., & Tendulkar, S.D. (2003). Poverty in India in the 1990s: Revised results for all-India and 15 major states for 1993-94. Economic and Political Weekly, 15-22 November: 4865-4872.
Rajesh, T., & Mohanty, R. (eds). (2003). Does civil society matter? Governance in contemporary India. New Delhi: Sage Publications.
UNDP, (1990). The human development report 1990, New York: United Nations development Program).
UNDP, (1991). The human development report 1991, New York: United Nations development Program.