
The long-term patterns of regional income inequality in Spain (1860-2000)
24
Working Papers in Economic History UNIVERSIDAD CARLOS III DE MADRID c/ Madrid 126 28903 Getafe (Spain) Tel: (34) 91 624 96 37 Site: http://www.uc3m.es/uc3m/dpto/HISEC/working_papers/working_papers_general.html DEPARTAMENTO DE HISTORIA ECONÓMICA E INSTITUCIONES October 2010 WP 10-08 The Long-Term Patterns of Regional Income Inequality in Spain (1860-2000) Daniel A. Tirado, Joan R. Rosés and Julio Martínez-Galarraga Abstract This paper studies the evolution of Spanish regional inequality from 1860 to 2000. The results point to the coexistence of two basic forces behind changes in regional economic inequality: differences in economic structure and labor productivity across regions. In the Spanish case, the initial expansion of industrialization during the period 1860-1900, in a context of growing economic integration of regions, promoted the spatial concentration of manufacturing in certain regions, which also benefited from the greatest advances in terms of labor productivity. Since 1900 and until 1985, the diffusion of manufacturing and services production to a greater number of locations generated the emulation of production structures and a process of catching-up in labor productivity and wages. So, in these first 125 years, national market integration and economic growth has been followed by a U- shaped evolution of regional incomes inequality. Nevertheless, some productivity differentials remained and, from 1985 on, the Spanish entry in the UE generated a new upsurge of divergence in productivity across Spanish regions that could be in the base of a new phase of regional income divergence. Keywords: Industrialization; Market Integration; Heckscher-Ohlin Model; New Economic Geography. JEL Classification: N93; N94; R11. Daniel A. Tirado (Corresponding author): Departament d´Anàlisi Econòmica, Universitat de València and XREPP, Facultat d’Economia, Edificio Departamental Oriental, Av. Tarongers, 46011 València, Spain. Email: [email protected] http://www.ub.edu/histeco/cat/tirado.htm Joan Ramón Rosés: Departamento de Historia Económica e Instituciones and Instituto Figuerola, Universidad Carlos III de Madrid, C/Madrid 126, 28903 Getafe, Spain. Email: [email protected] http://www.uc3m.es/portal/page/portal/dpto_historia_economica_inst/profesorado/joan_roses Julio Martínez-Galarraga: Departament d´Història i Institucions Econòmiques and XREPP, Universitat de Barcelona, Avg. Diagonal 690, 08034 Barcelona, Spain. Email: [email protected] http://www.ub.edu/histeco/cat/jmartinez.htm
-
Upload
independent -
Category
Documents
-
view
4 -
download
0
Transcript of The long-term patterns of regional income inequality in Spain (1860-2000)
Working Papers in Economic History
UNIVERSIDAD CARLOS III DE MADRID c/ Madrid 126 28903 Getafe (Spain)Tel: (34) 91 624 96 37Site: http://www.uc3m.es/uc3m/dpto/HISEC/working_papers/working_papers_general.html
DEPARTAMENTO DEHISTORIA ECONÓMICAE INSTITUCIONES
October 2010 WP 10-08
The Long-Term Patterns of Regional IncomeInequality in Spain (1860-2000)Daniel A. Tirado, Joan R. Rosés and Julio Martínez-Galarraga
AbstractThis paper studies the evolution of Spanish regional inequality from 1860 to2000. The results point to the coexistence of two basic forces behind changesin regional economic inequality: differences in economic structure and laborproductivity across regions. In the Spanish case, the initial expansion ofindustrialization during the period 1860-1900, in a context of growingeconomic integration of regions, promoted the spatial concentration ofmanufacturing in certain regions, which also benefited from the greatestadvances in terms of labor productivity. Since 1900 and until 1985, thediffusion of manufacturing and services production to a greater number oflocations generated the emulation of production structures and a process ofcatching-up in labor productivity and wages. So, in these first 125 years,national market integration and economic growth has been followed by a U-shaped evolution of regional incomes inequality. Nevertheless, someproductivity differentials remained and, from 1985 on, the Spanish entry inthe UE generated a new upsurge of divergence in productivity across Spanishregions that could be in the base of a new phase of regional incomedivergence.Keywords: Industrialization; Market Integration; Heckscher-Ohlin Model;New Economic Geography.JEL Classification: N93; N94; R11.
Daniel A. Tirado (Corresponding author): Departament d´Anàlisi Econòmica, Universitat de València andXREPP, Facultat d’Economia, Edificio Departamental Oriental, Av. Tarongers, 46011 València, Spain.Email: [email protected]://www.ub.edu/histeco/cat/tirado.htmJoan Ramón Rosés: Departamento de Historia Económica e Instituciones and Instituto Figuerola,Universidad Carlos III de Madrid, C/Madrid 126, 28903 Getafe, Spain.Email: [email protected]://www.uc3m.es/portal/page/portal/dpto_historia_economica_inst/profesorado/joan_rosesJulio Martínez-Galarraga: Departament d´Història i Institucions Econòmiques and XREPP, Universitat deBarcelona, Avg. Diagonal 690, 08034 Barcelona, Spain.Email: [email protected]://www.ub.edu/histeco/cat/jmartinez.htm

1
The Long-Term Patterns of RegionalIncome Inequality in Spain
(1860-2000)
Daniel A. TiradoJoan R. Rosés
Julio Martínez-Galarraga
AbstractThis paper studies the evolution of Spanish regional inequality from 1860 to 2000.The results point to the coexistence of two basic forces behind changes in regionaleconomic inequality: differences in economic structure and labor productivity acrossregions. In the Spanish case, the initial expansion of industrialization during theperiod 1860-1900, in a context of growing economic integration of regions,promoted the spatial concentration of manufacturing in certain regions, which alsobenefited from the greatest advances in terms of labor productivity. Since 1900 anduntil 1985, the diffusion of manufacturing and services production to a greaternumber of locations generated the emulation of production structures and a processof catching-up in labor productivity and wages. So, in these first 125 years, nationalmarket integration and economic growth has been followed by a U-shaped evolutionof regional incomes inequality. Nevertheless, some productivity differentialsremained and, from 1985 on, the Spanish entry in the UE generated a new upsurgeof divergence in productivity across Spanish regions that could be in the base of anew phase of regional income divergence.
Keywords: Industrialization; Market Integration; Heckscher-Ohlin Model; NewEconomic Geography.
JEL Codes: N93; N94; R11.
Daniel A. Tirado (Corresponding author): Departament d´Anàlisi Econòmica, Universitat de Valènciaand XREPP, Facultat d’Economia, Edificio Departamental Oriental, Av. Tarongers, 46011 València,Spain.Email: [email protected]://www.ub.edu/histeco/cat/tirado.htmJoan Ramón Rosés: Departamento de Historia Económica e Instituciones and Instituto Figuerola,Universidad Carlos III de Madrid, C/Madrid 126, 28903 Getafe, Spain.Email: [email protected]://www.uc3m.es/portal/page/portal/dpto_historia_economica_inst/profesorado/joan_rosesJulio Martínez-Galarraga: Departament d´Història i Institucions Econòmiques and XREPP, Universitatde Barcelona, Avg. Diagonal 690, 08034 Barcelona, Spain.Email: [email protected]://www.ub.edu/histeco/cat/jmartinez.htm
Joan Rosés acknowledges financial support from the Spanish Ministry of Science and Innovation projects“Consolidating Economics” within the Consolider-Ingenio 2010 Program and Project ECO2009-13331-C02-01.Daniel Tirado and Julio Martínez-Galarraga acknowledge the financial support from the Network in Economics andPublic Policies (XREPP) launched by the Generalitat de Catalunya. Daniel Tirado also thanks the financial supportof Spanish Ministry of Education grant (PR2009-0218) that has funded his visit to University of California-Daviswhere a large part of the paper was written.

2
The Long-Term Patterns of Regional Income Inequality in Spain(1860-2000)
1. Introduction
Regional income inequality shows a persistent pattern in apparently well integratedeconomies such as European Union. As pointed out by Puga (2002), nearly a quarter ofEuropean citizens live in regions with a pc GDP below 75% European average. That is to say,despite sizeable intervention through Structural Funds, regional inequalities in Europe seem tohave not narrowed substantially. In fact, although income differences across Member Stateshave fallen since mid 1980s, inequalities between regions within each Member State havepersisted. So, albeit a great amount of resources have been devoted to reduce this divergence,regional inequality is still a matter of concern for European policy-makers.
From a theoretical point of view, international and regional economics have explainedincome disparities on the basis of differences between regions in their endowments of naturalresources, factors of production, infrastructure, or technology. In this context, the removal ofobstacles to the movement of goods and/or factors would by itself cause convergence offactor returns and living standards. However, as it has been posed by New EconomicGeography literature (henceforth, NEG) there are relevant forces missing from the traditionalanalysis, which can affect regional disparities -even without large differences in underlyingcharacteristics- and prevent convergence. NEG theoretical models suggest that the interactionbetween transport costs, increasing returns and size of market under a monopolisticcompetition framework can lead to spatial agglomeration of economic activity (Krugman,1991). In this context, firms produce more efficiently and workers enjoy higher welfare bybeing close to large markets, and that large markets are in turn those where more firms andworkers locate. This creates a cumulative causation process that tended to increase incomedifferences along the process of integration of economies in a single market. Besides, in thisvein, studies like Puga (1999) show that the relationship between the process of regionalintegration and the degree of concentration of economic activity could describe a bell-shapednon-monotonic evolution. That is to say, when transport (transaction) costs are high industrywould be disperse across the space. When transport costs are intermediate, centripetal forcesintensify agglomeration when workers are mobile. For low transport (transaction costs), a newtendency towards dispersion can emerge. Congestion costs could act as a centrifugal forcefavoring the dispersion of economic activity. Therefore, progressive market integration caneventually lead, as traditional models predict, to income convergence.
Growth theory also offers insights about the causes of regional inequality. In thetextbook Solow model, in a closed economy context, differences in capital per worker led toslow income convergence across locations (Barro and Sala-i-Martin, 2003). If we add to themodel cross-regional movements of capital, convergence rates may increase due to the factthat capital moves from capital-abundant to capital-scarce regions following differences in itsrelative remuneration (Barro et al 1995). Nevertheless, the new strand of growth theory, theendogenous growth theory, also makes contradictory predictions about the impact of cross-regional integration. In the presence of increasing returns, the basic model (Romer, 1986)predicts that increasing movements of capital will lead to regional divergence. Instead, if weconsider that technology is not a public good and, hence, subject to decision-making

3
processes of individual agents and their prospect for monopoly rents, an increased scale of theeconomy will have a lasting positive effect on growth.
So, albeit theoretical basis for the analysis of the determinants of differences ineconomic growth across territories are well established, more empirical work needs to bedone. In this respect, the empirical analysis of the evolution and determinants of regionalincome inequality in the long lasting experiences of growth and integration of nationaleconomies could be of great help. The reason is that this kind of approach would offerevidence on the determinants of regional growth both, in periods characterized by growinginequality across regions and in those in which income converge could have dominated thestage.
In this respect, an old economic history tradition has also posed that economic growthin the context of integration of different regions could led to the initial increase in regional percapita income inequalities. The fundamental reasons could be related to the specialization andstructural change processes associated to growth and economic integration. Williamson(1965) described this fact considering the evolution of incomes in a cross section of countriesan analyzing the long term evolution of regional inequality in the US. He posed first thehypothesis that regional inequality could have followed an inverted U-pattern along theprocess of growth of national economies, with growing inequality during the XIXth centuryand convergence from then on. He concluded that, in the case of the US, structural change andspecialization could have favored increasing inequality in the first stages of economic growth,but the advance in the process of structural change and integration, with associated increasesin capital movements and internal migrations, would help to explain the long term reductionin income inequalities across the States. Kim (1998) also analyzed extensively the evolutionof regional inequality across the United States in the long term and stated the existence of aninverted U shape evolution. Besides, he pointed out that specialization and divergence ineconomic structures would be in the base of the increasing segment of this curve during thesecond half of the XIXth century. During the XXth century, further progress in the process ofgrowth and national market integration was accompanied by the reduction of regional incomeinequality. The homogenization of economic structures and convergence in productivityacross the States may have had the central role in the process. Caselli and Coleman (2001)went a step forward in the study of the determinants of long term regional inequality in theUS and related the convergence among regions within the US to the reduction of agriculturalemployment in the poorest locations.
Recently, Combes et al. (2008) have studied the long term evolution of economicdisparities across French regions. These authors conclude that the spatial distribution ofmanufacturing and services have traced a U inverted curve since the mid-nineteenth century.In this case, they pointed out that the existence of agglomeration economies would be arelevant factor for the understanding of regional incomes evolution in France from 1860 to1930. From them on differences in regional human capital stocks would be the main factor inexplaining regional income growth differences, in a context of global income inequalityreductions. In short, each one of these papers finds out the existence of a long term U invertedshaped relationship between national economic growth, market integration and regionalinequality and stress the role played by different mechanisms in explaining this behaviour innational experiences such as the United States or France.

4
As regards the case of Spain, the evolution of regional inequality is well documentedsince 1955 when the Banco Bilbao Vizcaya (BBV) first published the series of regionalincome. This information has been used in a good number of studies focused on the analysisof regional economic growth following the influential work of Barro and Sala-i-Martin(1991). The results point out the existence of convergence (both βy σ) since 1955 until theend of the 1970s. However, in the 1980s the process of convergence came to a halt and in thelast decades there is no evidence of further regional convergence in Spain.1
Before 1955, data concerning the geographical distribution of GDP is scarce andtherefore, the study of regional inequality in the long run has been particularly difficult. Forthe XIXth century and the first decades of the XXth century the only available data onregional income come from Álvarez Llano (1986). Nevertheless, this author does not provideinformation on the methodology employed in the estimation and thus, the reliability of thefigures has been seriously questioned.2 In addition, for the period between 1930 and 1955,data on regional GDP has been provided by Alcaide (2003). Taking the figures offered byÁlvarez Llano, Carreras (1990) carried out a first exercise to analyse the evolution of regionalinequality in Spain from a historical perspective. Carreras found a constant tendency towardsthe increase of regional inequality since 1800, reaching a maximum around 1950 or 1960.From that moment onwards, regional disparities began to decrease showing an inverted Ushape evolution in the long run. As a consequence, by 1983, regional inequality was lowerthat at the starting date, almost two centuries before.3 Nevertheless, the new estimation ofregional per capita incomes for the period 1860-1930 offered in this article challenges thisview and points to the beginning of the XXth as the starting point of the process of regionalconvergence in Spain.
In short, this article proposes that the empirical study of regional economic inequalityacross regions in Spain, a country with a long lasting economic growth and market integrationexperience, could helps us to disentangle what the main mechanisms at work are. Analyzingthe long term Spanish experience of integration and economic growth from this point of viewcould be especially interesting because first, in Spain more than 150 years of internaleconomic and political integration have not been followed by the disapearence of pc GDPdifferences across regions. Second, it could help us to ascertain if the relative importance offactors determining the existence of different regional growth paths have changed along theperiod analyzed. That is to say, along the different phases of Spanish economic growth, andprobably in phases both of amplification and reduction of regional income inequalities. Andthird, this long term analysis consents us to analyze the evolution of regional inequalitiesalong two coexisting different processes of economic integration: one internal, starting in themiddle of the XIXth century, and one external that, in the Spanish case, after a failed startingpoint in the second half of the XIXth century, was resumed in the middle of the XXth centuryand accelerated from the Spanish adhesion to the EU in 1986 on.
The remainder of the paper is structured as follows. First, we offer a brief summary ofthe historical process of growth and market integration of the Spanish economy. Second, wewill present new evidence on regional inequality patterns in the long term. For doing that, wewill present new historical estimations of per worker GDP for NUTS II Spanish regions for
1 Mas et al. (1994), De la Fuente (1996).2 The years considered by Álvarez Llano (1986) were 1802, 1849, 1860, 1901, 1921 and 1930. For a criticalevaluation of these data, see Carreras (1990).3 This evolution can be completed with Martín (1996) and Domínguez (2002). As in Carreras (1990), theanalyses are both based on the GDP estimates by Álvarez Llano (1986).
5
the period between 1860 and 1930 and will link it to well known data corresponding to theperiod 1930-2000 (Alcaide, 2003, BBV 1999 and FUNCAS 2004). Besides, we present themain stylized facts on the evolution of Spanish per worker regional GDP. Section 4decomposes the determinants of regional variation in per worker GDP and Section 5 presentsthe conclusions.
2.- Long term market integration and economic growth of Spanish economy
Spanish modern economic growth process started during the second third of the XIXthcentury. From then on, and perhaps with the exception of the years 1930-1952, that is to saythe years of the Spanish Civil War and its aftermath, Spanish per capita GDP experiencedpositive and sustained growth rates. Besides, following the analysis carried out by Prados dela Escosura (2005) and Prados de la Escosura and Roses (2009), it registered significantaccelerations during some historical lapses such as the periods 1921-29, 1953-58, 1959-1974or 1987-2000.
Table 1Average logarithmic pc GDP growth rates (1850-2000)
1850-1883 1.41884-1920 0.71921-1929 2.81930-1952 0.01953-1958 3.91959-1974 5.81975-1986 1.81987-2000 3.3
Source.- Prados de la Escosura and Roses (2009)
This process of economic growth was enhanced initially by the adoption of wellknown innovations in industrial production, the advance in the structural change process andthe progress in the integration of national markets for good and factors of production and alsointo the growingly globalized Atlantic economy.
In particular, and from a long term perspective, Spanish internal market integrationreceived a strong impulse in the middle of the XIXth century. In fact, before mid-nineteenthcentury, Spanish regions were relatively independent regional economies. The presence ofbarriers to interregional trade and the movement of capital and labor were ubiquitous: localtariffs and regulations on domestic commerce were widespread; weights and measuresdiffered across regions; transport costs were very high due to the particular geography ofSpain, which avoided an extensive water transport system, and the low public investment intransport infrastructures; economic information moved slowly across regions; banking systemwas underdeveloped; and many regions had their own currencies (although all currencieswere based on a bi-metallic monetary system). As a consequence, Spanish commodityregional markets were scarcely integrated, albeit certain interdependence in commodity prices

6
existed since the eighteenth century,4 and prices of production factors differed markedly fromone region to another.
Both market liberalization and transport improvements, particularly the completion ofSpain’s railways network, induced the creation of a national market for most importantcommodities during the second half of the nineteenth century. The successive politicalreforms of the nineteenth-century gave legal backup to property rights, eliminated tariffs andlocal restrictions on home commerce and assured the free mobility of people and capital. 5
Nevertheless, the integration of the Spanish economy into the Global Atlanticeconomy did not follow a similar pattern. Although the liberal reforms established in themiddle of the XIXth century supposed the end of main prohibitions on foreign trade andfavored the free movement of capitals and labor across Spanish foreign borders, Spanishforeign trade policy took a protectionist drive from the end of the 1880s. This protectionistturn and the renounce of Spain to participate in the international monetary system driven bythe gold standard prevented that Spain took advantage of the convergence effects generated inthe Atlantic economy during the first wave of globalization in the XIXth century (O’Rourkeand Williamson, 2001).
The Spanish Civil War and the first years of Francoist regime put a break on theSpanish growth process and on the advance of economic integration of national market.Regulation of markets for goods and factors throughout government control of prices andquantities in final goods, intermediates, energy, capital markets and labour market rewardsdetermined the absence of incentives for mobility of factors and resources creating a falseimage of prices convergence without a significant increase in quantities movements acrossregions. Capital did not flow in the same intensity across regions, internal workersmovements live a halt after its big first expansion in the 1920s (Silvestre, 2003). Besides, theabsence of sounded programs of investment in infrastructure did not collaborate in thereduction of transport costs during the 1940s and the first years of the 1950s.
As far as the integration of the Spanish economy in the international markets for goodsand factors of production is concerned, the Francoist regime adoption of an autharquic policyimplied the total isolation of Spanish economy from the international market influences.Foreign trade and international capital movements registered during these years their leastlevels in Modern Spanish Economic History.
The economic liberalisation and stabilisation measures introduced at the end of the1950s favoured the transition of the Spanish economy towards a new phase in its long-termeconomic development. This period was characterised, among other elements, by highaggregate growth rates of production and by the lead taken by the industrial sector in thecountry’s economic activity. Linked to this, Spanish economic growth in the 1960s was alsotypified by the advances made in the construction industry and the services sector, stimulatedby the growing mobility of the work force that was becoming increasingly concentrated in thebig cities. New investments on infrastructures such as roads, railways, communication andenergy supply and distribution favoured further reductions in internal transport cost duringthese years.
4 See, for example, Ringrose (1996).5 A detailed analysis of this process in Martinez-Galarraga, Roses and Tirado (2009).
7
These liberalizing policies also affected the Spanish integration into the internationaleconomy. Although at a slow pace, Spain started to recover its position in the internationalmarkets. The Spanish adhesion to some international organisms such as GATT, World Bankor IMF and the liberal winds that also arrived to the regulation of international commodityand capital movements marked the starting point for a new wave of growth of internationalmovements of goods, capital and labor across Spanish borders. Nevertheless, the level ofintegration reached by the Spanish markets for goods and capitals during this period cannot beconsidered as that corresponding to a truly open economy.
The crisis of the seventies, which in the case of Spain stretched well into the eighties,put a brake on these upward trends, and high average growth rates of GDP were not recordedagain until the final years of the XXth century (1985-2000). This new phase in Spanisheconomic growth was no longer linked to the leadership of industrial production, but rather tothat of the services and construction sectors. In respect of the evolution of the transactioncosts, during these years, a new wave of investment in the infrastructures helped to reducefurther the transport cost across Spanish regions and also across national borders. Hugeinvestment programs in freeways, high-speed railway system and telecommunications weredeveloped during these years and favoured major advances both in the integration of internalSpanish market and also in the integration of Spain into the international markets. In thisrespect, the adhesion of Spain to the EU in 1986 acted as a big institutional reform thatprobably changed the framework in which specialization of Spanish regions took place.
Given these conditions, we now need to analyse whether the evidence concerning theevolution in the regional inequality patterns in Spain has followed a long-term profile that fellin line with the changes experienced by the process of growth and internal and externalmarket integration. Here, it should be recalled that, in broad terms, the increasing integrationof the Spanish internal market could have favoured both the initial appearance of a process ofgeographical agglomeration of activity and divergence in regional pc GDP levels and thesubsequent opening up of a process of convergence once the transport costs and thedevelopment level was great enough. In other words, the long term regional inequality couldhave described an inverted U-shaped curve during the process of integration and growth ofthe Spanish economy. Notwithstanding, the impulse received in the last years in theintegration of the Spanish economy in the international markets could have had effects in thepatterns of growth and specialization of Spanish regions and so it could have affected the longterm evolution of regional income inequality.
3. Long term patterns of regional income inequality: new data and stylized facts
For analyzing the long term evolution and determinants of regional inequality in Spainit has been needed to estimate or collect data on Gross Added Value by sectors and regionsand on regional employment by sectors for the years 1860-2000. As far as estimates ofregional GDP for Spanish regions for the years before the Spanish Civil War do not exist (orare not enough reliable), we have estimated new figures for several years along the period1860-1930. In particular, the availability of sources consents us to estimate these figures forthe years 1860, 1900, 1910, 1920 and 1930. From 1930 on, the data have been collected fromdifferent well known sources such as Alcaide (2003) for the years 1930-1950, BBV (1999)for the years 1955-1995 and FUNCAS (2004) for the year 2000. As far as these sources arewell known and extensively described and used by Spanish economists, we dedicate the next
8
paragraphs to show the procedure and the sources we have used to produce a new set ofestimates of regional per capita GDP in Spain for the period 1860-1930.
In this respect, our estimation of Spanish per worker regional GDP is mainly based onthe methodology developed by Geary and Stark (2002). This departs from the basic principlethat the national per capita GDP is equal to the sum of all regions’ per capita GDPs.Algebraically, the total GDP of the Spanish economy is the sum of all regional GDPs:
(1) i
iESP YY
However, given that provincial GDP (Yi) is not already available, this will be proxiedaccording to the following equation:
(2) j
ijiji LyY
yij being the output, or the average added value, per worker in each region i, in sector j,and Lij the number of workers in each region and sector. As we have no data for yij, this valueis proxied by taking the Spanish sectoral output per worker (yj), assuming that regional laborproductivity in each sector is reflected by its wage relative to the Spanish average (wij/wj). Inconsequence, we can assume that the regional GDP will be given by:
(3) ij
j
j
ijjji L
w
wyY
where, as suggested by Geary and Stark (2002), wij is the wage paid in region i insector j, wj is the Spanish wage in each sector j, and βj is a scalar that preserves the relativeregion differences but scales the absolute values so that the regional total for each sector addsup to the Spanish totals.6 So, in the absence of output figures, Geary and Stark (2002) set amodel of indirect estimation based on wage income, which allows for an estimation of GDPby region at factor cost, in current values. The basic data involved in this estimationprocedure are national output per worker by sector, and nominal wages and active population,by sector and region. However, in several industries (see below), we had not to resort toindirect estimates given direct estimates of regional output had been computed. It should benoted that this methodology also allows us to compute not only regional GDPs but alsofigures for the different industries. Geary and Stark (2002) distributed regional GDPs in threedifferent industries (agriculture, manufacturing and services) but, instead, we have consideredup to five sectors (agriculture, mining, manufacturing, construction and services) for Spaingiven the availability of data.7
Agriculture
In agriculture, we were able to compute direct production estimates (nominal grossvalue added) for 1900, 1910, 1920 and 1930. More specifically, the quantities of productionof different agrarian products collected by GEHR (1991) were multiplied by the relative
6 Spanish GDP was taken from Prados de la Escosura (2003).7 However, to simplify our further discussion, we will aggregate mining, manufacturing and construction togenerate industrial sector value added.

9
prices and the transforming coefficients calculated from the data provided by Simpson (1994).Then, these real values were converted into nominal values using the disaggregated agrarianprices provided by Prados de la Escosura (2003). Finally, we have scaled the absolute valuesso that the provincial total for each sector adds up to the Spanish totals for agricultural valuefrom Prados de la Escosura (2003).
For the year 1860, we have employed a modified version of Geary-Stark’s method. Amajor problem with agricultural estimations is that we know the daily wages but not theamount of working days over the year and the amount of female workforce in agriculture.Moreover, it is likely that these factors varied widely across regions. For this reason, we havemodified the initial estimation based on the original method with a scalar computed bydividing our direct estimation for 1910 by that obtained with Geary-Stark’s method.8 Inconsequence, we assume that the amount of days worked and the relative amount of womenworking in each province remained constant between 1860 and 1910.
Mining
The provincial mining production was calculated from information on the productionvalues disaggregated by province, which were drawn from the Spanish Statistical Yearbook(Anuario Estadístico de España) for the years 1860, 1910, 1920 and 1930.9 These figuresallowed us to distribute Spain’s mining gross value added at factor cost between the differentprovinces. However, given the absence of direct production data for 1900, we resorted to analternative methodology: the active provincial population engaged in mining in 1900 wasmultiplied by a productivity coefficient obtained from 1920 data.10 In other words, we assumethat labor productivity in mining in each province in 1900 was equal to that in 1920.
Industry: Manufacturing and Public Utilities
To carry out the estimation of regional industrial value added, we begin by assumingthe existence of a production function with constant returns to scale where the output isobtained from the contribution of two production factors, labor and capital.11 The industrialgross value added (GVAIND) is defined as:
(4) GVAINDit = it (it * Lit) + (1-it) (rit*Kit)
with it being the share of the wage income in industrial gross value added in region iat time t, it industrial wage in region i at time t, Lit the total active industrial population inregion i at time t, rit the returns to capital in industry in region i at time t, and Kit the capitalstock in industry in i at time t. For the Spanish case, there is information available for each ofthe components of equation (4) except for r it. For this reason, we had to assume perfect capitalmobility. Then,
8 The source of wages is Rosés and Sánchez-Alonso (2004), and the source of agricultural population is theSpanish population census.9 We have taken the values of 1915 for 1910 and 1931 for 1930.10 This is the year in which mining workforce was more exactly registered by Spanish population census (ForoHispánico de Cultura, 1957).11 In this sector, we have followed the refinement of Crafts (2005) to the original Geary and Stark (2002)methodology, using tax data to allocate non-wage manufacturing income across regions.

10
(5) rit=rt i
The wage income included in equation (4) was estimated as follows. First, the seriesconcerning industrial employment in each province were compiled from the informationprovided by the Population Censuses of 1860, 1900, 1910, 1920 and 1930.12 Then, wecollected the data available on nominal industrial wages from a variety of sources.13 Finally,under the assumption that the number of yearly working days is identical in all provinces, wecomputed the wage income by multiplying wages by the size of the industrial workingpopulation.14
The data for constructing provincial capital income in equation (4) were drawn fromseveral fiscal sources. The main source for our calculations is the Estadística Administrativade la Contribución Industrial y de Comercio (EACI) that collects all statistical information onthe industrial tax, which was established in 1845. This industrial tax consisted of a fixed rateover the main means of production in use (Nadal and Tafunell, 1992, p. 256). The rate wasdifferent for each type of machinery and industrial branch, but did not adjust immediately tochanges in machinery productivity. Furthermore, the coverage of this tax was modifiedsubstantially by 1907. Joint stock companies, which were the largest Spanish industrial firms,were exempted from industrial tax payment but assigned to a new corporate tax based on netprofits (Impuesto de Sociedades). More prominently, over the years, many firms transformedthemselves into joint stock companies in order to benefit from the lower tax rates of this newcorporate income tax (Nadal and Tafunell, 1992, p. 259). Later, in 1921, all types ofpartnerships were assigned to this corporate tax, and hence, many firms were exempted fromthe payment of the old industrial tax. In consequence, from the year 1907 onward, theinformation given by the EACI is not representative of industrial activities. Fortunately,Betrán (1999: 674-675), in this monumental study on the industrial localization in Spain inthe first third of the XXth century, reconstructed the industrial taxes paid in each province in1913 and 1929, employing data on the two types of taxes paid by industrial companies. Insum, fiscal sources and Betrán (1999) allow us to compute the regional participation in thecapital income in 1856, 1893, 1913 and 1929.15
Once the provincial distribution of labor and capital income is obtained, we need tocalculate the weight of each factor’s income in total industrial gross value added. In thisrespect, substantial international evidence shows that the output proportions in labor andcapital remain relatively stable for long periods (Gollin, 2002). For this reason, we have optedto compute different factor-shares for each industry, but not for each industrial benchmark. Itshould be noted, however, that, given that provincial industrial structure varies over time,
12 We have also corrected for errors and underreporting of original data according to Foro Hispánico de Cultura(1957).13 Madrazo (1984) provided data for 1860, Sánchez-Alonso (1995) for 1900, Ministerio de Trabajo (1927) for1920, and Silvestre (2003) for 1910 and 1930. However, this kind of data is not available for the Canary Islands;we had to assume that their wages are equal to the lowest of the Peninsula.14 It should be noted that the coverage of the wages database is far from perfect; thus, we had to make someassumptions: first, the series of wages, not homogeneous throughout time, are representative of industry; second,as regards the use of nominal wages, there will be bias to the extent that there are regional variations in pricelevels (Geary and Stark, 2002, pp. 933-934).15 For 1920, due to the absence of fiscal data, capital shares were interpolated employment figures for 1910 and1930. Finally, the addition of the Basque Country and Navarre in the second half of the XIXth century relies onthe data in Parejo (2001), who estimated the contributions of these regions to the Spanish total based on thehistorical indices of industrial production. This regional information was split by provinces according to theshare of industrial active population in each date.

11
these shares also varied in the different benchmarks at the provincial level. More specifically,to compute these factor-shares, we used the information from the Input-Output Table forSpain in 1958 (TIO1958).16 From this source, capital and labor shares were calculated fornine industrial branches.17 We thus can identify, for this level of aggregation, the factor-sharesaccording to the productive structure of the industrial sector in each province and year. Thedata on the provincial productive structure by year were obtained from the same fiscal sourcesdiscussed in the previous paragraph. Finally, with this information, specific factor-shares foreach province and for each benchmark were constructed, except for the Basque Country andNavarre.18
Construction
This sector is composed of two subsectors: residential construction and public works.Data on residential construction were distributed across provinces, with data on urbanizationrates (the percentage of the population living in cities with more than 5,000 inhabitants) fromReher (1994). In the case of public works, we distributed gross national value added acrossprovinces, with data on the provincial stock of infrastructures from Herranz (2008).19
Services
Many historical studies have suffered from the absence of information on wages in theservice industries. Geary and Stark (2002: 923), who faced the same problem in their study ofthe British economy, calculated the service sector wages as a weighted average of theagriculture and industry series in each province, where the weights were each sector’s share ofthe labor force. Our strategy is slightly different. Prados de la Escosura (2003) provided thegross value added of eleven different branches of the Spanish service industry: transport,communications, trade, banking and insurance, housing, public administration, education,health services, hotels and restaurants, domestic services and professions. Taking into accountthis level of disaggregation, we compiled the data on the active population from thePopulation Censuses. We scaled the absolute values so that the provincial total for each sectoradds up to the Spanish totals for the working population engaged in services from Prados dela Escosura (2003). Then, according to the skills and productivity levels of the workforce, weemployed different wages. More specifically, we resorted to agrarian wages for domesticservice; an unweighted average of industry urban unskilled and skilled wages for commerce,hotels and restaurants; an unweighted average of agrarian and industry urban wages (unskilledand skilled) for transport and communications; and, finally, urban skilled wages for theremaining branches.20
16 Using this source to elaborate the factor-shares and then apply them in retrospect implies the assumption thatthe intensity in the use of factors in 1958 is a good proxy for previous years. However, we have to point out thatthis assumption has also been employed in previous estimations of the Spanish Industrial Production Indices(Carreras, 1983; Prados de la Escosura, 2003).17 The industrial branches are food, textiles, metal, chemicals, paper, wood, ceramic, leather and miscellaneousindustries. However, due to data restriction, the industrial branches considered are only seven (food, textiles andfootwear, metal, chemicals, paper, wood and cork, and ceramics) in 1913 and 1929.18 Since this fiscal information is not available for the Basque Country and Navarre, and it is not possible toknow their industrial structures, a similar labor share to the Spanish total is assumed for these regions.19 Given that Herranz’s (2008) database is only available from 1870 onwards, the data for 1860 was only basedon urban population.
20 Underlining wages were drawn from Rosés and Sánchez-Alonso (2004).

12
Finally, in order to be able to link our regional GDP estimation for the years 1860-1930 with those existing for the years 1930-2000, we have also escalated all the originalabsolute figures on sectoral and regional GDP so the NUTSII totals add up to the Spanishtotal offered in Prados de la Escosura (2003).
These new dataset consents us to carry out a preliminary description of the regionalincome inequality in Spain in the long-term. In this respect, Figure 1 presents the long termevolution of regional per worker GDP inequality measured through the Coefficient ofVariation (CV). As it can be seen in the figure, also in the Spanish case there was a growingtrend in income inequality between the first two cut-off points to be analysed, that is the yearsbetween 1860 and 1900. Since that date, it started a period of gradual reduction of regionalincome inequality. Nevertheless, it has also to be stated that regional per worker incomeconvergence accelerated during the period 1960-1980, and that it seems to find a halt inperiods such as the 25 years following the Spanish Civil War and in the years following theSpanish adhesion to the former EEC (nowadays EU). In the long term, regional incomeinequality would have followed a U-shaped pattern with a growing phase between 1860 and1900 followed by a long phase of regional inequalities reduction that would have lasted untilthe 1980s. From then on, the persistence of regional inequalities could be pointing to the endof this regional σ-convergence process.
Figure 1Long term regional per worker GDP inequality. Spanish NUTS3
0.15
0.20
0.25
0.30
0.35
0.40
0.45
0.50
0.55
1860
1865187
018
751880
1885
1890
1895
1900
1905
1910
1915192
019
251930
1935
1940
1945
1950
1955
1960
1965197
019
7519
8019
8519
90199
520
00
CV Poly. (CV)
In short, the descriptive evidence about the evolution of regional income inequality inSpain illustrates that its long term evolution might have followed a U-inverted shape and so,that its trajectory could be consistent with the existence of both kinds of forces highlighted bythe theoretical literature. Those proposed by traditional growth and trade theories that pointout to the reduction of regional income inequalities along the process of integration ofnational economies and those pointed out by NEG models where growth and integrationcould favour agglomeration in the productive processes, which in the context of a reduction oftransaction costs could favour an initial increase in income inequalities. Nevertheless the
13
interruption of the process of reduction of income inequalities during the years 1980-2000puts some caveats on the validity of this plain explanation.
4. The determinants of Regional Inequality
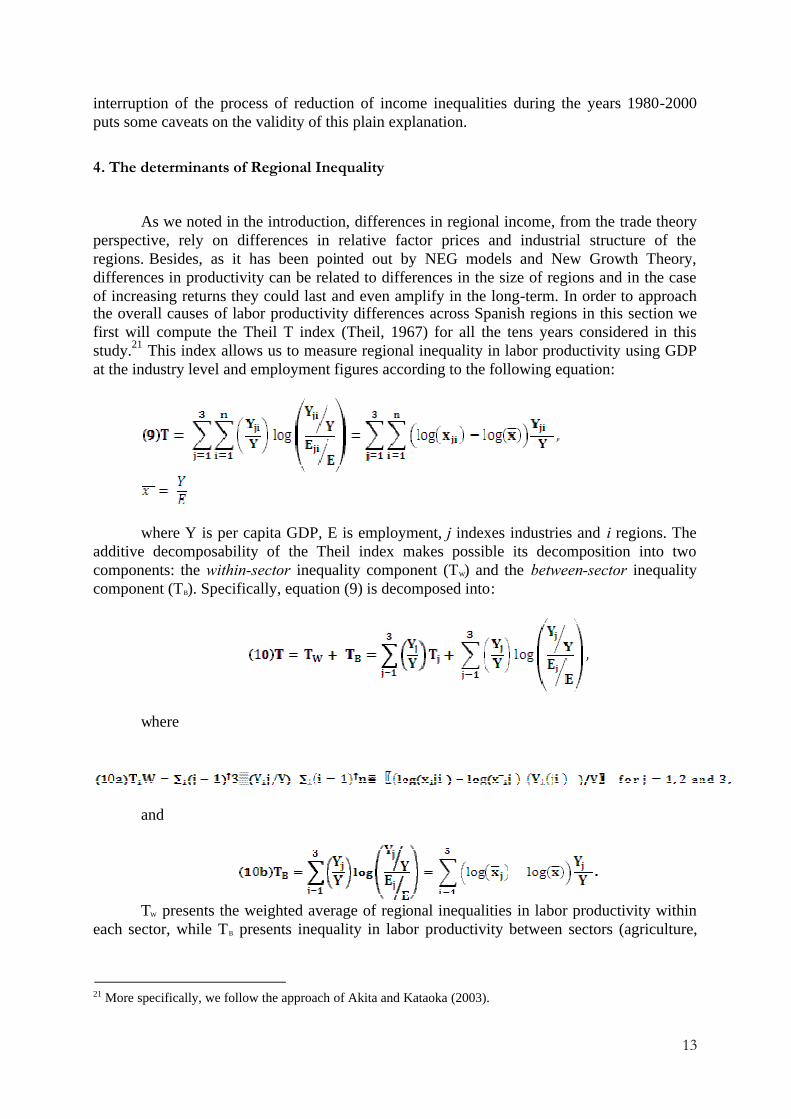
As we noted in the introduction, differences in regional income, from the trade theoryperspective, rely on differences in relative factor prices and industrial structure of theregions. Besides, as it has been pointed out by NEG models and New Growth Theory,differences in productivity can be related to differences in the size of regions and in the caseof increasing returns they could last and even amplify in the long-term. In order to approachthe overall causes of labor productivity differences across Spanish regions in this section wefirst will compute the Theil T index (Theil, 1967) for all the tens years considered in thisstudy.21 This index allows us to measure regional inequality in labor productivity using GDPat the industry level and employment figures according to the following equation:
where Y is per capita GDP, E is employment, j indexes industries and i regions. Theadditive decomposability of the Theil index makes possible its decomposition into twocomponents: the within-sector inequality component (TW) and the between-sector inequalitycomponent (TB). Specifically, equation (9) is decomposed into:
where
and
TW presents the weighted average of regional inequalities in labor productivity withineach sector, while TB presents inequality in labor productivity between sectors (agriculture,
21 More specifically, we follow the approach of Akita and Kataoka (2003).
14
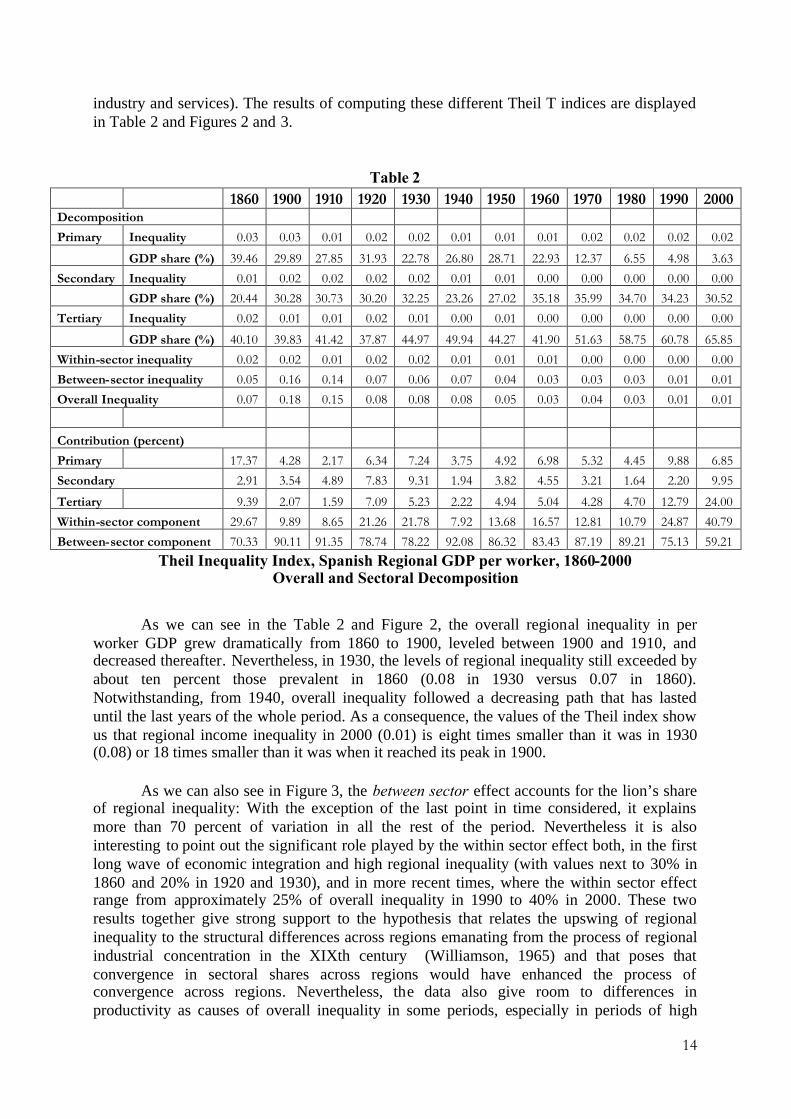
industry and services). The results of computing these different Theil T indices are displayedin Table 2 and Figures 2 and 3.
Table 2
Theil Inequality Index, Spanish Regional GDP per worker, 1860-2000Overall and Sectoral Decomposition
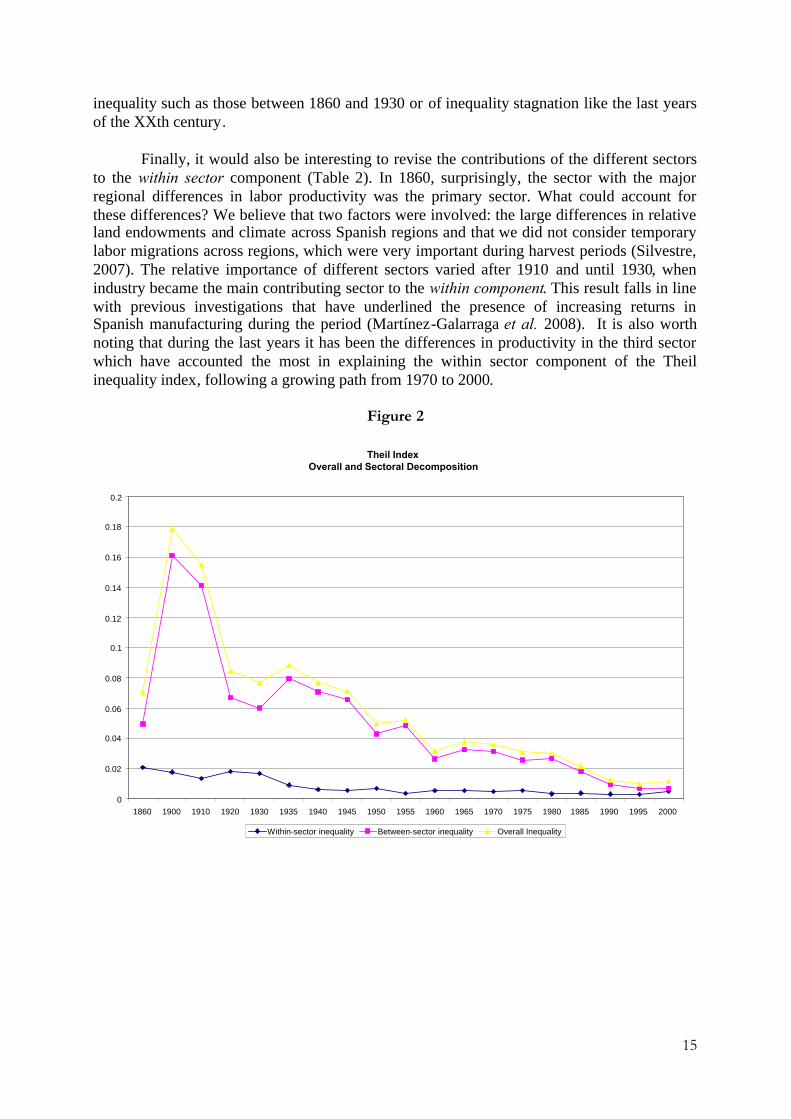
As we can see in the Table 2 and Figure 2, the overall regional inequality in perworker GDP grew dramatically from 1860 to 1900, leveled between 1900 and 1910, anddecreased thereafter. Nevertheless, in 1930, the levels of regional inequality still exceeded byabout ten percent those prevalent in 1860 (0.08 in 1930 versus 0.07 in 1860).Notwithstanding, from 1940, overall inequality followed a decreasing path that has lasteduntil the last years of the whole period. As a consequence, the values of the Theil index showus that regional income inequality in 2000 (0.01) is eight times smaller than it was in 1930(0.08) or 18 times smaller than it was when it reached its peak in 1900.
As we can also see in Figure 3, the between sector effect accounts for the lion’s shareof regional inequality: With the exception of the last point in time considered, it explainsmore than 70 percent of variation in all the rest of the period. Nevertheless it is alsointeresting to point out the significant role played by the within sector effect both, in the firstlong wave of economic integration and high regional inequality (with values next to 30% in1860 and 20% in 1920 and 1930), and in more recent times, where the within sector effectrange from approximately 25% of overall inequality in 1990 to 40% in 2000. These tworesults together give strong support to the hypothesis that relates the upswing of regionalinequality to the structural differences across regions emanating from the process of regionalindustrial concentration in the XIXth century (Williamson, 1965) and that poses thatconvergence in sectoral shares across regions would have enhanced the process ofconvergence across regions. Nevertheless, the data also give room to differences inproductivity as causes of overall inequality in some periods, especially in periods of high
1860 1900 1910 1920 1930 1940 1950 1960 1970 1980 1990 2000DecompositionPrimary Inequality 0.03 0.03 0.01 0.02 0.02 0.01 0.01 0.01 0.02 0.02 0.02 0.02
GDP share (%) 39.46 29.89 27.85 31.93 22.78 26.80 28.71 22.93 12.37 6.55 4.98 3.63Secondary Inequality 0.01 0.02 0.02 0.02 0.02 0.01 0.01 0.00 0.00 0.00 0.00 0.00
GDP share (%) 20.44 30.28 30.73 30.20 32.25 23.26 27.02 35.18 35.99 34.70 34.23 30.52Tertiary Inequality 0.02 0.01 0.01 0.02 0.01 0.00 0.01 0.00 0.00 0.00 0.00 0.00
GDP share (%) 40.10 39.83 41.42 37.87 44.97 49.94 44.27 41.90 51.63 58.75 60.78 65.85Within-sector inequality 0.02 0.02 0.01 0.02 0.02 0.01 0.01 0.01 0.00 0.00 0.00 0.00Between-sector inequality 0.05 0.16 0.14 0.07 0.06 0.07 0.04 0.03 0.03 0.03 0.01 0.01Overall Inequality 0.07 0.18 0.15 0.08 0.08 0.08 0.05 0.03 0.04 0.03 0.01 0.01
Contribution (percent)Primary 17.37 4.28 2.17 6.34 7.24 3.75 4.92 6.98 5.32 4.45 9.88 6.85Secondary 2.91 3.54 4.89 7.83 9.31 1.94 3.82 4.55 3.21 1.64 2.20 9.95
Tertiary 9.39 2.07 1.59 7.09 5.23 2.22 4.94 5.04 4.28 4.70 12.79 24.00Within-sector component 29.67 9.89 8.65 21.26 21.78 7.92 13.68 16.57 12.81 10.79 24.87 40.79Between-sector component 70.33 90.11 91.35 78.74 78.22 92.08 86.32 83.43 87.19 89.21 75.13 59.21
15
inequality such as those between 1860 and 1930 or of inequality stagnation like the last yearsof the XXth century.
Finally, it would also be interesting to revise the contributions of the different sectorsto the within sector component (Table 2). In 1860, surprisingly, the sector with the majorregional differences in labor productivity was the primary sector. What could account forthese differences? We believe that two factors were involved: the large differences in relativeland endowments and climate across Spanish regions and that we did not consider temporarylabor migrations across regions, which were very important during harvest periods (Silvestre,2007). The relative importance of different sectors varied after 1910 and until 1930, whenindustry became the main contributing sector to the within component. This result falls in linewith previous investigations that have underlined the presence of increasing returns inSpanish manufacturing during the period (Martínez-Galarraga et al. 2008). It is also worthnoting that during the last years it has been the differences in productivity in the third sectorwhich have accounted the most in explaining the within sector component of the Theilinequality index, following a growing path from 1970 to 2000.
Figure 2
Theil IndexOverall and Sectoral Decomposition
0
0.02
0.04
0.06
0.08
0.1
0.12
0.14
0.16
0.18
0.2
1860 1900 1910 1920 1930 1935 1940 1945 1950 1955 1960 1965 1970 1975 1980 1985 1990 1995 2000
Within-sector inequality Between-sector inequality Overall Inequality

16
Figure 3
Between and Within Sectors ComponentsTheil Index
0
10
20
30
40
50
60
70
80
90
100
1860 1900 1910 1920 1930 1935 1940 1945 1950 1955 1960 1965 1970 1975 1980 1985 1990 1995 2000
Within-sector component Between-sector component
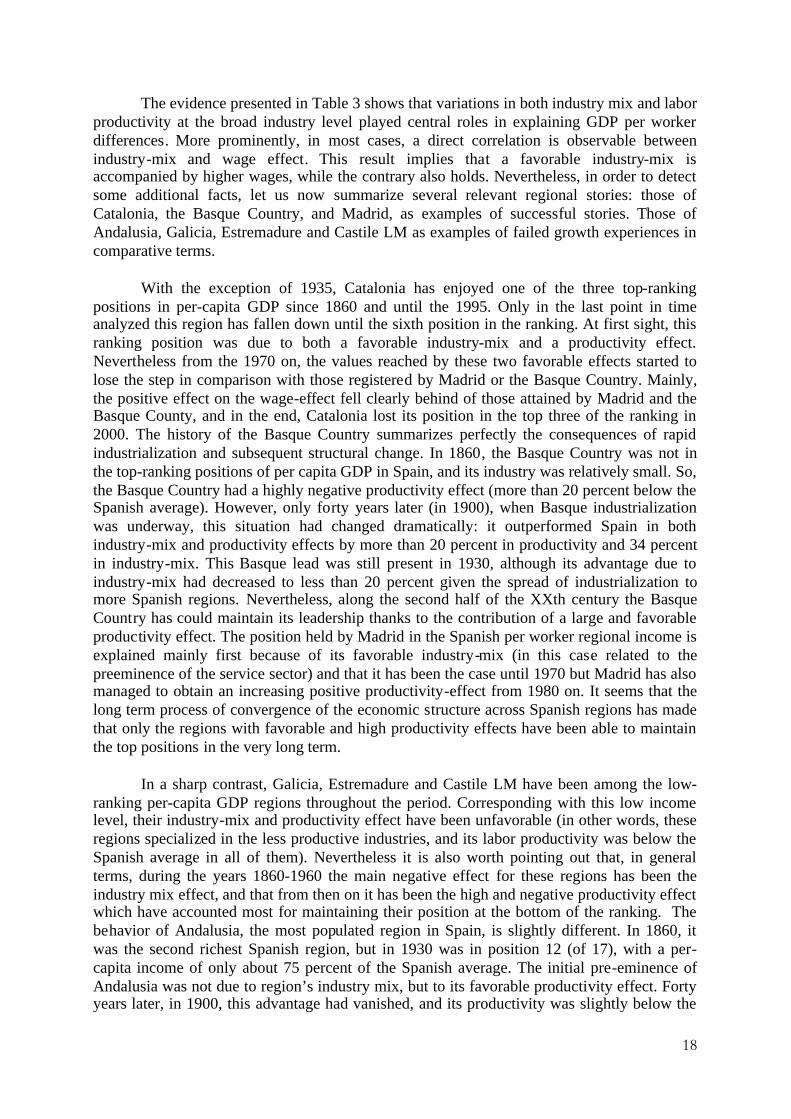
To offer some light to individual stories, we also investigated this question by utilizinga straightforward modification of the procedure developed by Hanna (1951) and alsoemployed by Kim (1998) to separate income differences into industry-mix and gross valueadded (GVA) components.22 The procedure involves constructing two hypothetical regionalper worker GDPs and comparing them with actual per worker GDPs. The first assumes thatall regions have identical industry mixes and identical industry per worker GVAs, with theindustry mix and per worker GVA set equal to the overall national average. The secondhypothetical per worker GDP assumes that regions have different industry mixes but identicalper worker GVAs, which are set equal to the national average. The difference between thetwo hypothetical incomes, which are based on industry-mix income and the overall nationalGVA, furnishes a measure of the GDP per worker disparities caused by the divergence inregional industrial structures (industry-mix effect). The difference between the actual GDPand the hypothetical industry-mix income is a measure of the regional GDP per workervariations due to divergence in per worker GVA (productivity effect).23 The results of thisexercise are shown, for selected years, in Table 3.
22 Per worker GVA in industry and region i is: GVAi = (wi Li + ri Ki) / Li. However, given the presence of perfectcapital markets, ri Ki / Li should be equal across all locations. Consequently, wi drives per worker GVAdifferences across all regions.23 The use of one-digit industrial classification in our calculations may conceal the greater importance ofproductivity in explaining regional differences in income per worker than is deserved. Regional per worker GVAin manufacturing and services activities may be different due to variations in regional industrial structures at afiner industry level.

17
Table 3. Hanna-Kim decomposition
1860 1900 1930 1940 1950 1960 1970 1980 1990 2000Andalusia
Industry-mix 2.3 2.7 -9.4 -5.75 -7.42 -8.48 -6.60 -6.05 -3.67 -3.12
Wage-effect 30.9 -6.7 -10.7 -8.01 -12.18-
16.08-
10.48 -8.10 -8.57 -11.02
AragonIndustry-mix -4.1 -3.3 -4.7 -5.59 -8.54 -3.80 -4.62 -1.37 -0.70 -0.68Wage-effect 8.2 0.5 0.7 3.34 -3.71 0.24 2.08 2.04 1.16 4.46
AsturiasIndustry-mix -15.4 -24.4 4.6 0.67 1.16 2.03 -5.09 -5.26 -2.80 -1.53Wage-effect -47.8 -8.8 -2.3 14.33 7.06 -4.53 2.14 1.25 -6.95 2.26
Balearic I.Industry-mix -5.1 1.5 6.2 7.18 5.87 3.99 7.78 6.72 3.73 3.58Wage-effect -19.5 -38.1 2.2 2.32 -0.50 0.68 -2.67 -2.28 2.04 -18.18
Canary I.Industry-mix -2.3 0.1 14.3 2.86 -9.99 -9.76 1.36 1.76 1.22 0.41Wage-effect -26.6 -46.7 -33.8 -8.45 -3.68 -5.70 -6.49 -3.48 1.18 -11.32
CantabriaIndustry-mix -1.6 0.9 8 3.83 5.09 0.81 -4.23 -4.96 -2.05 -1.53Wage-effect -19.3 -10.4 11.3 -10.11 -2.63 4.83 5.82 1.45 -4.92 9.87
Castile L.M.Industry-mix 2.8 -12.7 -17.5 -26.44 -16.32 18.13 16.85 -11.90 -4.00 -4.52Wage-effect 6.3 9.6 -17.8 -10.91 -10.77 12.08 10.99 -12.37 -9.85 -13.73
Castile L.Industry-mix -1.6 -18.9 -9.1 -13.01 -9.23 12.61 14.00 -10.13 -4.57 -2.25Wage-effect -10.6 -0.3 -13.8 -0.29 2.02 11.12 -7.89 -7.83 -7.43 0.61
CataloniaIndustry-mix 9.8 30.8 15.1 15.66 15.05 11.84 9.12 7.13 3.93 2.44Wage-effect 6.8 28.9 19.4 10.69 11.85 14.18 9.58 8.01 6.20 5.58
ValenciaIndustry-mix -0.9 1.9 0.6 -3.62 -2.94 0.32 1.76 2.70 1.50 1.37Wage-effect 7.4 11.5 15.4 1.54 -0.38 0.88 -2.18 -2.38 -1.67 -15.03
EstremadureIndustry-mix -3.8 -19.6 -13.1 -37.01 -27.28 24.16 26.01 -17.86 -9.05 -7.91Wage-effect -18.2 -19.7 -37 -20.70 -22.26 22.82 26.97 -18.52 -14.56 -24.19
GaliciaIndustry-mix -14.7 -35.5 -18.8 -25.10 -21.11 24.34 30.75 -28.80 -15.25 -9.10Wage-effect -69.4 -50.1 -37.7 -13.97 -17.51 28.63 25.98 -19.79 -18.39 -14.06
MadridIndustry-mix 29.1 58.7 36.5 34.70 26.26 16.24 15.69 11.34 4.77 3.87Wage-effect 14.7 0.9 22.4 -1.75 4.97 13.84 8.74 9.59 11.39 14.43
MurciaIndustry-mix 0.8 -11 -0.9 -8.99 -6.09 -4.32 -1.49 -3.75 -2.52 -4.02Wage-effect 12.8 -18.5 -5.3 -12.29 -22.99 15.82 10.71 -10.18 -5.21 -10.42
NavarraIndustry-mix 3.8 -0.1 -11.9 -5.09 -2.42 -0.73 -0.79 1.33 2.48 0.20Wage-effect 5 -10.5 11 10.74 4.34 7.87 6.41 5.79 3.14 16.25
Basque C.Industry-mix 4 34.4 19.4 13.14 9.59 11.07 8.35 6.50 3.80 1.57Wage-effect -21 21.8 26.9 16.72 27.76 19.29 18.50 9.95 7.53 18.80
RiojaIndustry-mix 2.2 7.3 0.4 -4.22 -2.16 -5.95 -8.80 -3.65 -1.13 -2.56Wage-effect -3.2 6.6 -15.4 15.99 2.53 4.82 1.03 4.24 1.83 1.15
18
The evidence presented in Table 3 shows that variations in both industry mix and laborproductivity at the broad industry level played central roles in explaining GDP per workerdifferences. More prominently, in most cases, a direct correlation is observable betweenindustry-mix and wage effect. This result implies that a favorable industry-mix isaccompanied by higher wages, while the contrary also holds. Nevertheless, in order to detectsome additional facts, let us now summarize several relevant regional stories: those ofCatalonia, the Basque Country, and Madrid, as examples of successful stories. Those ofAndalusia, Galicia, Estremadure and Castile LM as examples of failed growth experiences incomparative terms.
With the exception of 1935, Catalonia has enjoyed one of the three top-rankingpositions in per-capita GDP since 1860 and until the 1995. Only in the last point in timeanalyzed this region has fallen down until the sixth position in the ranking. At first sight, thisranking position was due to both a favorable industry-mix and a productivity effect.Nevertheless from the 1970 on, the values reached by these two favorable effects started tolose the step in comparison with those registered by Madrid or the Basque Country. Mainly,the positive effect on the wage-effect fell clearly behind of those attained by Madrid and theBasque County, and in the end, Catalonia lost its position in the top three of the ranking in2000. The history of the Basque Country summarizes perfectly the consequences of rapidindustrialization and subsequent structural change. In 1860, the Basque Country was not inthe top-ranking positions of per capita GDP in Spain, and its industry was relatively small. So,the Basque Country had a highly negative productivity effect (more than 20 percent below theSpanish average). However, only forty years later (in 1900), when Basque industrializationwas underway, this situation had changed dramatically: it outperformed Spain in bothindustry-mix and productivity effects by more than 20 percent in productivity and 34 percentin industry-mix. This Basque lead was still present in 1930, although its advantage due toindustry-mix had decreased to less than 20 percent given the spread of industrialization tomore Spanish regions. Nevertheless, along the second half of the XXth century the BasqueCountry has could maintain its leadership thanks to the contribution of a large and favorableproductivity effect. The position held by Madrid in the Spanish per worker regional income isexplained mainly first because of its favorable industry-mix (in this case related to thepreeminence of the service sector) and that it has been the case until 1970 but Madrid has alsomanaged to obtain an increasing positive productivity-effect from 1980 on. It seems that thelong term process of convergence of the economic structure across Spanish regions has madethat only the regions with favorable and high productivity effects have been able to maintainthe top positions in the very long term.
In a sharp contrast, Galicia, Estremadure and Castile LM have been among the low-ranking per-capita GDP regions throughout the period. Corresponding with this low incomelevel, their industry-mix and productivity effect have been unfavorable (in other words, theseregions specialized in the less productive industries, and its labor productivity was below theSpanish average in all of them). Nevertheless it is also worth pointing out that, in generalterms, during the years 1860-1960 the main negative effect for these regions has been theindustry mix effect, and that from then on it has been the high and negative productivity effectwhich have accounted most for maintaining their position at the bottom of the ranking. Thebehavior of Andalusia, the most populated region in Spain, is slightly different. In 1860, itwas the second richest Spanish region, but in 1930 was in position 12 (of 17), with a per-capita income of only about 75 percent of the Spanish average. The initial pre-eminence ofAndalusia was not due to region’s industry mix, but to its favorable productivity effect. Fortyyears later, in 1900, this advantage had vanished, and its productivity was slightly below the

19
average; in addition, its industry-mix was not particularly different from the nation’s average.From then on, it seems rather clear that the negative productivity effect has been at the stillfront of the low position of this region in the Spanish per worker income ranking.
In short, it seems that the explanation of the factors behind the successful or failingpositions of regions in terms of per worker GDP has changed along the long term nationalexperience of growth and integration. During the initial phases it has been the industry-mixeffect the main factor determining the relative position of regions. Further on, theconvergence of economic structures have determined that the main explanation of the top andbottom positions was linked to the presence of marked positive or negative productivityeffects. This factor has earned more and more explicative power along the growth experienceduring the XXth century. In fact, the region that has most improved its position in the rankingalong the XXth century, Navarre (11th in 1900 and 3rd in 2000), never had an extremelypositive industry-mix effect and its successful experience is basically explained but thepresence of a favorable and high productivity effect.
5. Conclusions
In this paper we have offered a long term view on regional inequality in Spain and wehave also tried to point out to some of its proximate causes. For doing that we have assembleda new data base on regional per worker GDP that links new estimates for the period 1860-1930 with those existing for the years 1930-2000. As a result, we have been able to analyzethe long term evolution of regional per worker GDP inequality across Spanish NUTS2regions and to decompose it into its proximate determinants.
Spanish regional income inequality has followed a long term U-inverted shape pattern.But it has to be mentioned that during the years 1980-2000 it seems to be experiencing a newtrend towards a limited growth of inequality. That is to say, a new upswing turn in the processthat prevents that the reduction of inequality went beyond the point reached in the 1980s.
The decomposition of inequality in terms of that generated by differences inproductivity across regions or by the existing differences in economic structure has shownthat growing dissimilarities in both components acted side by side in explaining the upswingphase of inequality in the second half of the XIXth century. From them on, the growingconvergence of economic structures accounted the most in the explanation of the reduction ofregional incomes inequalities. Nevertheless, differences in productivity have remained quitestable and they are the main mechanism at work in explaining the current slightly growingphase of regional income inequality.
This kind of evidence fits well with the stories proposed by neoclassical trade andgrowth theory, in the sense that the advance in the process of national market integrationcould have favored the reduction of regional income inequality in the long term (mobility offactors of production could have impulsed the reduction of differences in factor endowmentsand rewards across regions), but also fits well with stories arising from New Growth Theoryand New Economic Geography models. Albeit the great level of national market integrationcould have also propelled the redistribution of activity across Spanish regions after an initialphase of agglomeration, differences in productivity have remained in the long term and,besides, they have been amplified during the last years of the XXth century, when the Spanish
20
economy has been involved in a new institutional framework. This is its growing integrationin the European market. So, albeit growing inequality during the initial phase of growth andinternal market integration can be explained through the consideration of the divergence ofeconomic structures and the presence of differences in productivity across regions, in the lastyears it is the growth of productivity differentials, basically in the service sector, whatexplains the new upswing trend in regional income inequality in Spain.
Particular regional stories confirm this perception. The explanation for the factorsbehind the success or fail of regions in terms of per worker GDP has changed along the longterm national experience of growth and integration. During the initial phases it has been theindustry-mix effect the main factor determining the relative position of regions. Further on,the convergence of economic structures have determined that the main explanation of the topand bottom positions was linked to the presence of marked positive or negative productivityeffects.
In short, it could be argued that, initially, structural change (industrialization) wasconcentrated in a reduced group of regions that also experienced the greater increases inproductivity, favoring the initial increase of inequality across Spanish regions. From thebeginning of the XXth century, further advances in the integration of the national marketfavored the mobility of factors of production and, with low transport and transaction costs, afast convergence of regional economic structures that provoked the reduction of incomeinequalities. Notwithstanding, productivity differentials remained, preventing furtheradvances in the reduction in income inequalities and, in the last years analyzed, thisproductivity differentials were at the forefront of the explanation of the apparent upsurge ofregional inequality in the context of the integration of the Spanish economy in the EuropeanUnion.
Our results also have important implications for judging the validity of alternativetheoretical explanations for regional inequality. Broadly speaking, it seems that the proposalof Epifani (2005), which combines HO and NEG models, could help out to explain theSpanish historical experience. More prominently, as our decomposition of per capita GDP inproductivity and industry-mix effects shows, regions that specialized in the most productiveindustries also enjoyed the higher labor productivity levels. In other words, they had favorableendowments and also benefited from NEG forces. However, it seems that HO forces were themain driver behind unequal regional development, given that between-sector differencesaccounted for the lion’s share of regional differences in labor productivity. However, theincreasing returns explanation, mainly related to within industry differences in industry andservices, was also significant in the first phase of Spanish economic growth and marketintegration, and it is significant again during the current phase of growth and Spanishintegration in the European single market.
References
Akita, T., Kataoka, M., 2003. Regional Income Inequality in the Post-War Japan. ERSAconference papers ersa03p480, European Regional Science Association.
Alcaide, J., 2003. Evolucion economica de las regiones y provincias espanolas en el siglo XX,FBBVA, Madrid.

21
Alvarez Llano, 1986. Evolucion de la estructura economica regional de Espana en la historia:una aproximacion, Situacion.
Anuario estadístico de España (ad annum), Madrid.
Barro, R.J., Sala-i-Martin, X., 1991. Convergence across states and regions. Brookings Papersof Economic Activity 1991(1), 107-182.
Barro, R.J, Mankiw, G.N., Sala-i-Martin, X., 1995. Capital Mobility in Neoclassical Modelsof Growth. American Economic Review 85(1), 103-15.
Barro, R. J., Sala-i-Martin, X., 2003. Economic growth. McGraw Hill, New York.
Betrán, C., 1999. Difusión y localización industrial en España durante el primer tercio delsiglo XX. Revista de Historia Económica 17(3), 663-696.
Carreras, A., 1983. La producción industrial espanyola i italiana des de mitjan segle XIX finsa l’actualitat. Ph.D dissertation (unpublished), Universitat Autònoma de Barcelona.
Carreras, A.., 1990. Fuentes y datos para el analisis regional de la industrializacion espanola,in Carreras, A. and Nadal, J. (eds.) Pautas regionales de la industrializacion espanola(siglos XIX y XX), Ariel, Barcelona, 3-20.
Caselli, F., Coleman, W. J., 2001. The U.S. Structural Transformation and RegionalConvergence: A Reinterpretation. Journal of Political Economy 109(3), 584-616.
Censo de población (ad annum). Madrid.
Combes, P., Lafourcade, M., Thisse, J., Toutain, J., 2008. The rise and fall of spatialinequalities in France: a long-run perspective. Working Paper, Paris School ofEconomics, 2008-54.
Crafts, N. F. R., 2005. Regional GDP in Britain, 1871-1911: some estimates. Scottish Journalof Political Economy 52 (1), 54-64.
De la Fuente, A., 1996. Convergencia y otras historias: economía regional desde unaperspectiva neoclásica, Revista de Economia Aplicada.
Dominguez, R., 2002. La riqueza de las regiones, Alianza, Madrid.
Epifani, P., 2005. Heckscher-Ohlin and agglomeration. Regional Science and UrbanEconomics 35(6), 645-657.
Estadística Administrativa de la Contribución Industrial y de Comercio (ad annum). Madrid.
Foro Hispánico de Cultura, 1957. La población activa española de 1900 a 1957. ForoHispánico de Cultura, Madrid.
Geary, F., Stark, T., 2002. Examining Ireland’s Post-famine Economic Growth Performance.Economic Journal 112 (October), 919-935.
GEHR – Grupo de Estudios de Historia Rural, 1991. Estadísticas históricas de la producciónagraria española, 1859-1935. Ministerio de Agricultura, Pesca y Alimentación,Madrid.
Gollin, D., 2002. Getting Income Shares Right. Journal of Political Economy 110(21), 458-474.
Hanna, F., 1951. Contribution of Manufacturing Wages to Differences in per capita Income.Review of Economics and Statistics 33(1), 18-28.
22
Herranz, A., 2008. Infraestructuras y crecimiento económico en España (1850-1935).Fundación de los ferrocarriles españoles, Madrid.
Kim, S., 1998. Economic Integration and Convergence: U.S. Regions, 1840-1987. Journal ofEconomic History 58 (3), 659-683.
Kim, S., Margo, R. A., 2004. Historical perspectives on U.S. economic geography. In:Henderson, J.V., Thisse, J. F. (Eds.), Handbook of Regional and Urban Economics,volume 4, chapter 66. Elsevier, Amsterdam, 2981-3019.
Krugman, P., 1991. Geography and Trade. The MIT Press, Cambridge (MA).
Madrazo, S., 1984. El sistema de transportes en España. Turner, Madrid.
Martin, M., 1996. Disparidades economicas regionales en Espana: nuevas aprotaciones,Estudios Regionales, 44, 165-186.
Mas, M., Maudos, J., Perez, F., Uriel, E.,1994. Disparidades regionales y convergencia en lasComunidades Autonomas, Revista de Economia Aplicada.
Martínez-Galarraga, J., Paluzie, E., Pons, J., Tirado, D.A., 2008. Agglomeration and labourproductivity in Spain over the long term. Cliometrica 2 (3), 195-212.
Martínez-Galarraga, J., Roses, J. R., Tirado, D.A., 2009. The Upswing of Regional IncomeInequality in Spain, 1860-1930, UC3M-Working Papers in Economic History, WP 09-05.
Ministerio de Trabajo, 1927. Estadística de salarios y jornadas de trabajo referida al período1914-1925. Madrid.
Nadal, J.,Tafunell, X., 1992. Sant Martí de Provençals, pulmó industrial de Barcelona (1847-1992). Columna, Barcelona.
O’Rourke, K. H., Williamnson, J. G., 2001. Globalization and History. The evolution of anineteenth century Atlantic economy, MIT Press.
Parejo, A., 2001. Industrialización, desindustrialización y nueva industrialización de lasregiones españolas (1950-2000). Un enfoque desde la historia económica. Revista deHistoria Industrial 19-20, 15-75.
Prados de la Escosura, L., 2003. El progreso económico de España, 1850-2000. FundaciónBBVA, Madrid.
Prados de la Escosura, L., 2005. Growth and Structural Change in Spain, 1850-2000: AEuropean Perspective. Revista de Historia Económica / Journal of Iberian and LatinAmerican Economic History 25 (1), 147-181.
Prados de la Escosura, L., Rosés, J.R., 2009. The Sources of Long-run Economic Growth inSpain, 1850-2000, Journal of Economic History, in press.
Puga, D., 1999. The rise and fall of regional inequalities, Europena Economic Review, 43 (2),303-334.
Puga, D., 2002. European regional policies in light of recent location theories. Journal ofEconomic Geography 2(4), 373-406.
Reher, D., 1994. Ciudades, procesos de urbanización y sistemas urbanos en la penínsulaibérica, 1550-1991. In: Guàrdia, M., Monclús, F. J., Oyón, J.L. (Eds.), Atlas históricode las ciudades europeas. Península Ibérica. Salvat - Centre de Cultura Contemporàniade Barcelona, Barcelona, 1-30.
23
Ringrose, D., 1996. Spain, Europe and the “Spanish Miracle”, 1700-1990. CambridgeUniversity Press, Cambridge (MA).
Romer, P.M., 1986. Increasing Returns and Long-Run Growth, Journal of Political Economy,Vol. 94, No. 5, pp. 1002-1037
Rosés, J. R., Sánchez-Alonso, B., 2004. Regional wage convergence in Spain 1850-1930.Explorations in Economic History 41(2), 404-425.
Sánchez-Alonso, B., 1995. Las causas de la emigración española, 1880-1930. AlianzaEditorial, Madrid.
Silvestre, J., 2003. Migraciones interiores y mercado de trabajo en España, 1877-1936. Phd.dissertation (unpublished). Universidad de Zaragoza.
Silvestre, J., 2007. Temporary Internal Migrations in Spain, 1860-1930. Social ScienceHistory 2007 31(4), 539-574.
Simpson, J., 1994. La producción y la productividad agraria española, 1890-1936. Revista deHistoria Económica 12 (1), 43-84.
Theil, H. 1967. Economics and Information Theory. North Holland, Amsterdam.
Williamson, J. G., 1965. Regional inequality and the process of national development: Adescription of the patterns. Economic Development and Cultural Change 13(4), 3-84.