Not Separate, Not Equal: Poverty and Inequality in Post-Apartheid ...
Upload
independentCategory
view
3download
0
Poverty, Income Inequality, and Economic Growth in
China
Jiantuo YU
China Development Research Foundation
December, 2011
Contents
Multidimensional Poverty in China
Trend of Income Distribution
Implications for Economic Growth in the Future
1.Multidimensional Poverty in China
Why Multidimensional Perspective?
Dimensions and Indicators
Methodology & Data
Basic Results
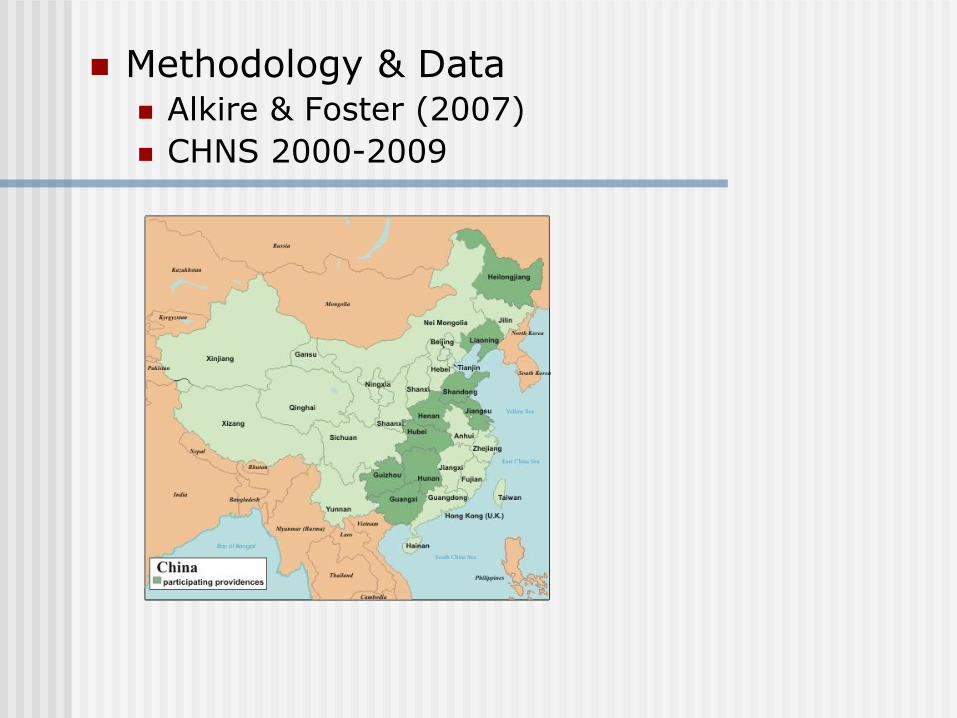
Methodology & Data Alkire & Foster (2007)
CHNS 2000-2009
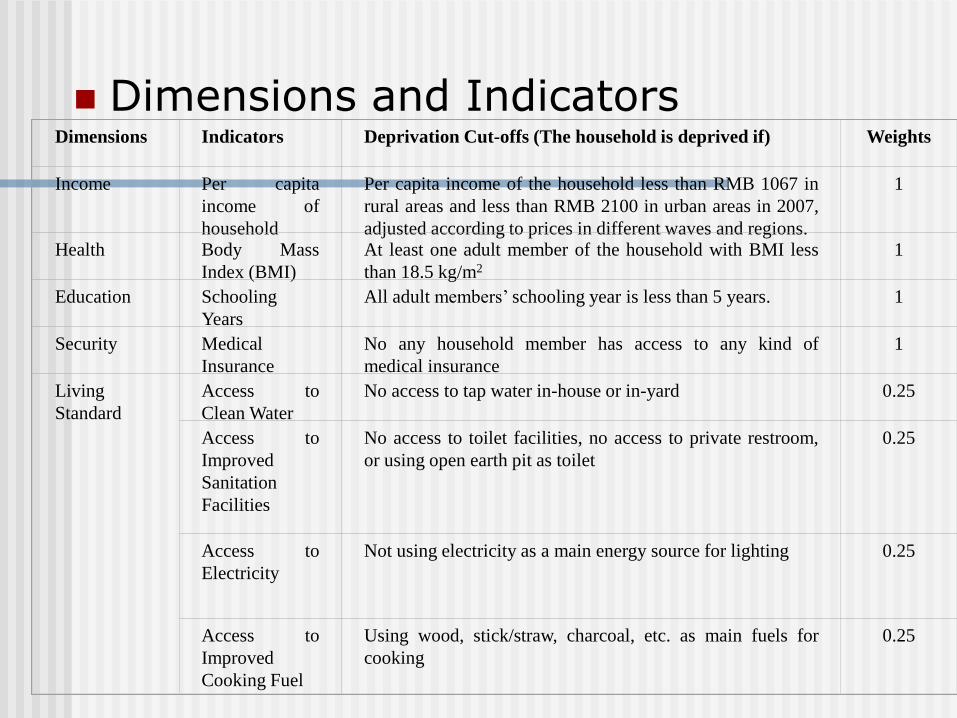
Dimensions and Indicators Dimensions
Indicators
Deprivation Cut-offs (The household is deprived if)
Weights
Income
Per capita
income of
household
Per capita income of the household less than RMB 1067 in
rural areas and less than RMB 2100 in urban areas in 2007,
adjusted according to prices in different waves and regions.
1
Health
Body Mass
Index (BMI)
At least one adult member of the household with BMI less
than 18.5 kg/m2
1
Education
Schooling
Years
All adult members’ schooling year is less than 5 years.
1
Security
Medical
Insurance
No any household member has access to any kind of
medical insurance
1
Living
Standard
Access to
Clean Water
No access to tap water in-house or in-yard
0.25
Access to
Improved
Sanitation
Facilities
No access to toilet facilities, no access to private restroom,
or using open earth pit as toilet
0.25
Access to
Electricity
Not using electricity as a main energy source for lighting
0.25
Access to
Improved
Cooking Fuel
Using wood, stick/straw, charcoal, etc. as main fuels for
cooking
0.25
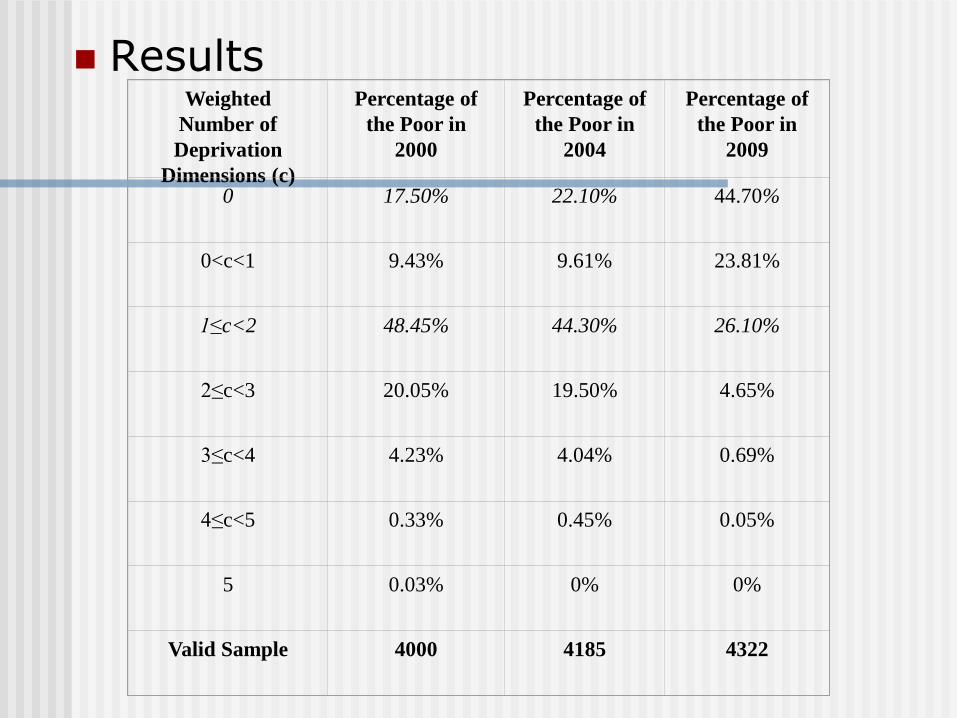
Results Weighted
Number of
Deprivation
Dimensions (c)
Percentage of
the Poor in
2000
Percentage of
the Poor in
2004
Percentage of
the Poor in
2009
0
17.50%
22.10%
44.70%
0<c<1
9.43%
9.61%
23.81%
1≤c<2
48.45%
44.30%
26.10%
2≤c<3
20.05%
19.50%
4.65%
3≤c<4
4.23%
4.04%
0.69%
4≤c<5
0.33%
0.45%
0.05%
5
0.03%
0%
0%
Valid Sample
4000
4185
4322
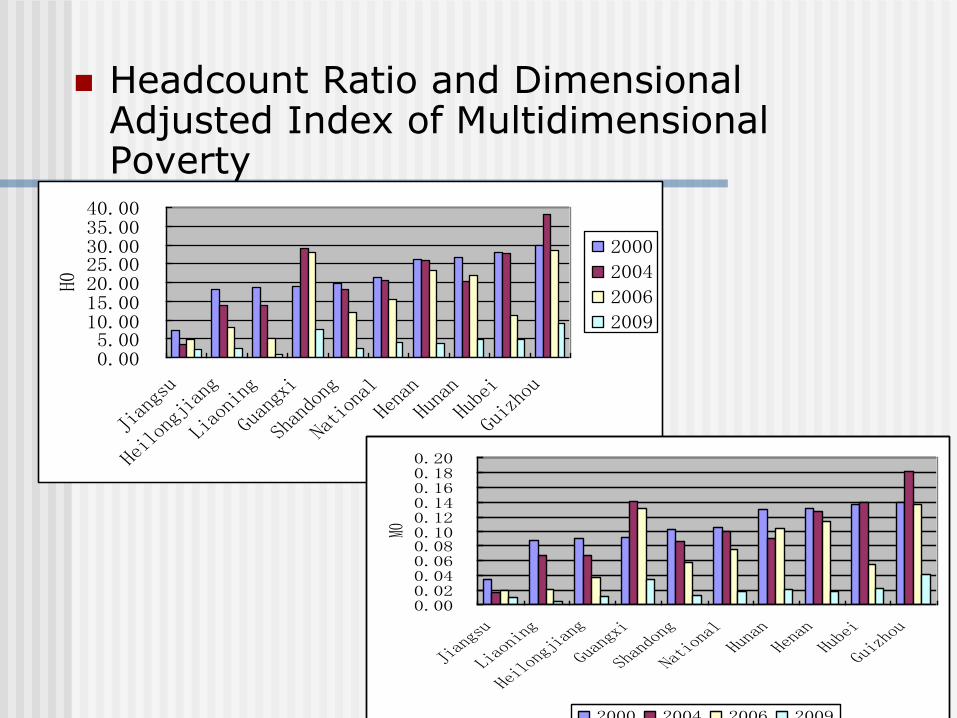
0.005.0010.0015.0020.0025.0030.0035.0040.00
Jiangsu
Heilongjiang
Liaoning
Guangxi
Shandong
National
Henan
Hunan
Hubei
Guizhou
H0
2000
2004
2006
2009
0.000.020.040.060.080.100.120.140.160.180.20
Jiangsu
Liaoning
Heilongjiang
Guangxi
Shandong
National
HunanHenan
Hubei
Guizhou
M0
2000 2004 2006 2009
Headcount Ratio and Dimensional Adjusted Index of Multidimensional Poverty
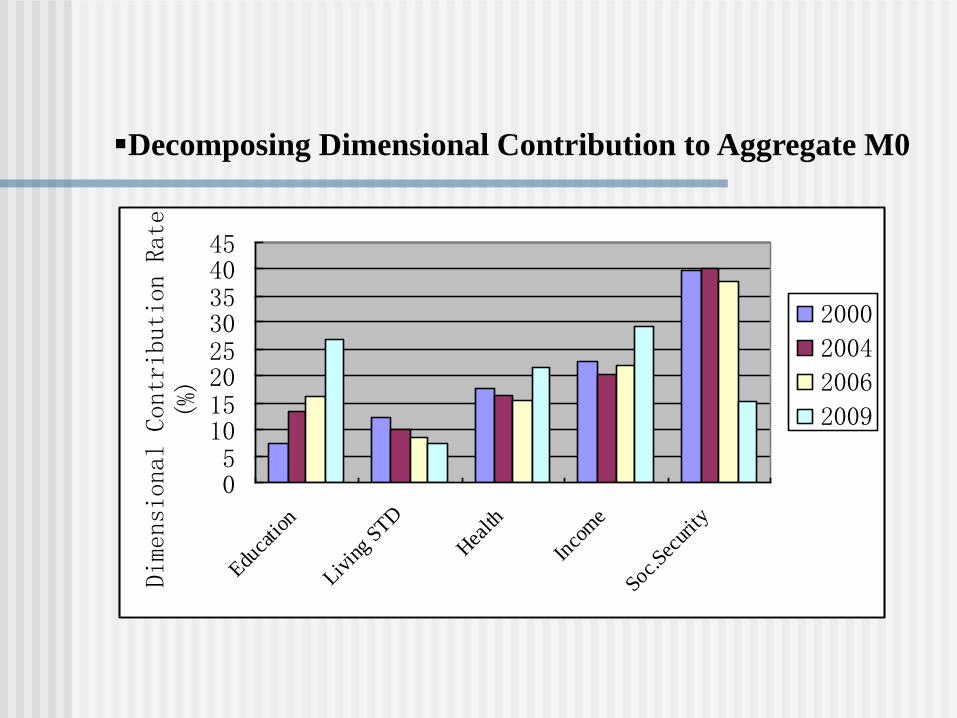
051015202530354045
Educa
tion
Livin
g STD
Hea
lth
Inco
me
Soc.Sec
urity
Dimensional Contribution Rate
(%)
2000
2004
2006
2009
Decomposing Dimensional Contribution to Aggregate M0
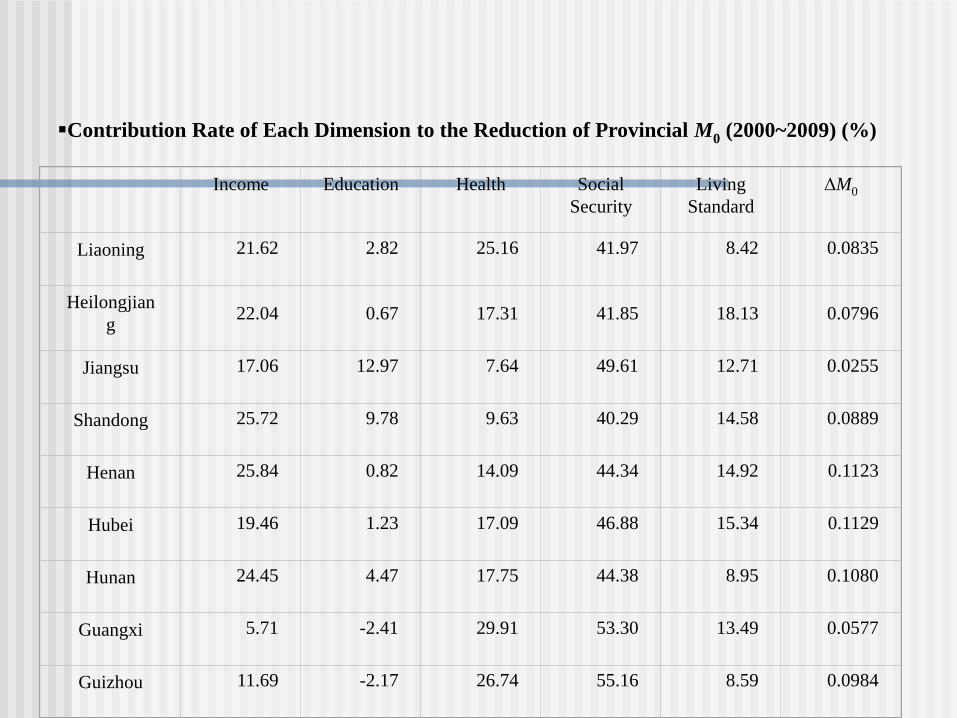
Income
Education
Health
Social
Security
Living
Standard
ΔM0
Liaoning
21.62
2.82
25.16
41.97
8.42
0.0835
Heilongjian
g
22.04
0.67
17.31
41.85
18.13
0.0796
Jiangsu
17.06
12.97
7.64
49.61
12.71
0.0255
Shandong
25.72
9.78
9.63
40.29
14.58
0.0889
Henan
25.84
0.82
14.09
44.34
14.92
0.1123
Hubei
19.46
1.23
17.09
46.88
15.34
0.1129
Hunan
24.45
4.47
17.75
44.38
8.95
0.1080
Guangxi
5.71
-2.41
29.91
53.30
13.49
0.0577
Guizhou
11.69
-2.17
26.74
55.16
8.59
0.0984
Contribution Rate of Each Dimension to the Reduction of Provincial M0 (2000~2009) (%)
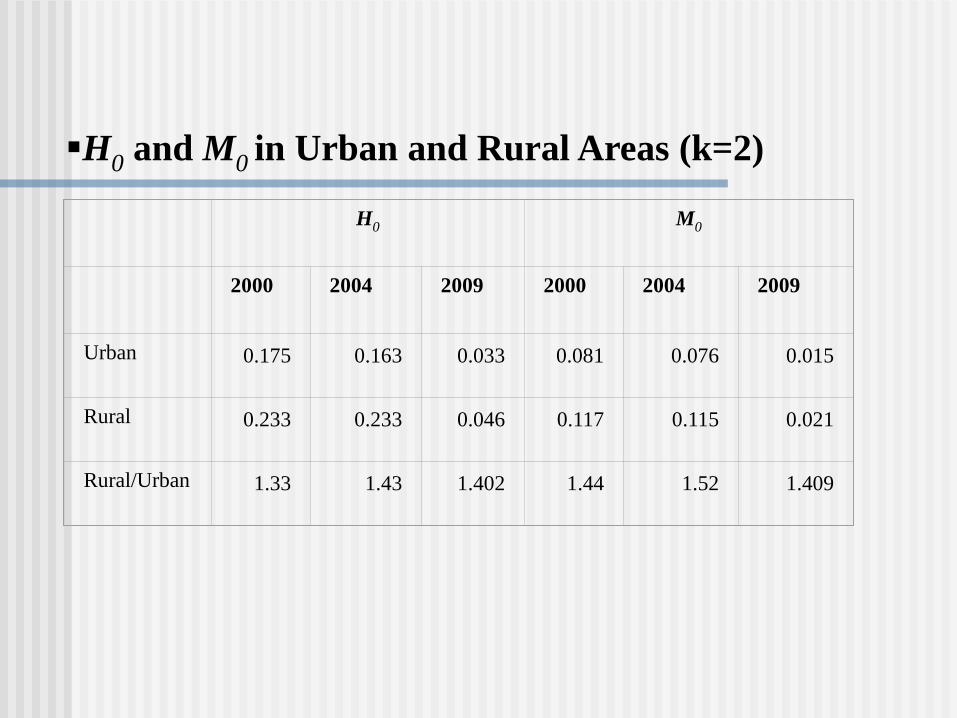
H0 and M0 in Urban and Rural Areas (k=2)
H0
M0
2000
2004
2009
2000
2004
2009
Urban
0.175
0.163
0.033
0.081
0.076
0.015
Rural
0.233
0.233
0.046
0.117
0.115
0.021
Rural/Urban
1.33
1.43
1.402
1.44
1.52
1.409
2. Trend of Income Inequality in China
Aggregate Income Inequality
Urban-rural inequality
Income Inequalities within urban and rural areas
Regional inequality
Grey Income
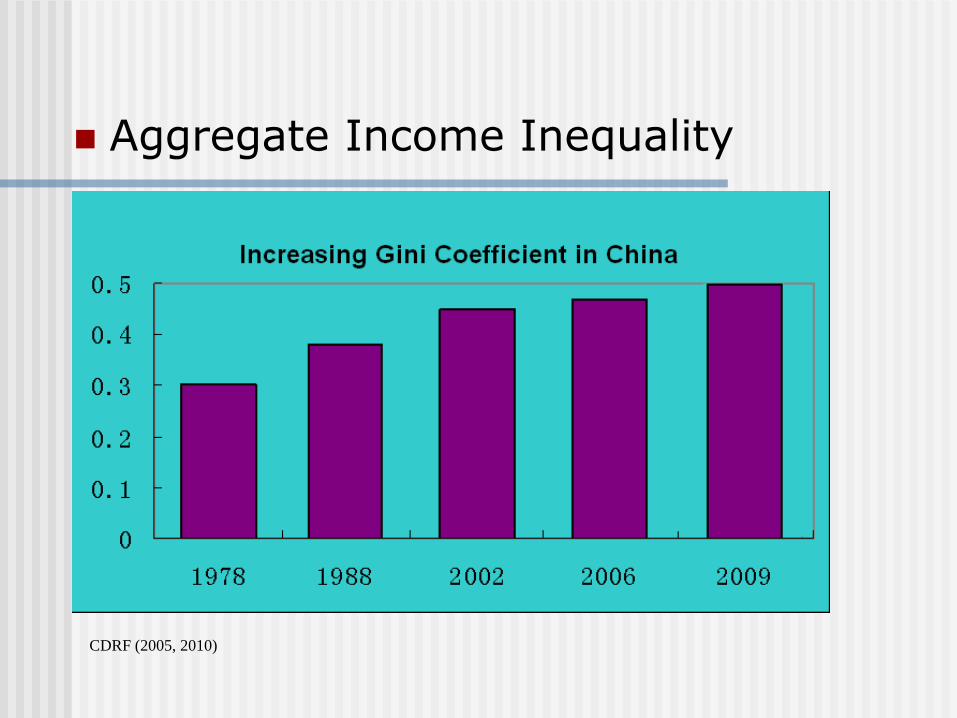
Aggregate Income Inequality
CDRF (2005, 2010)
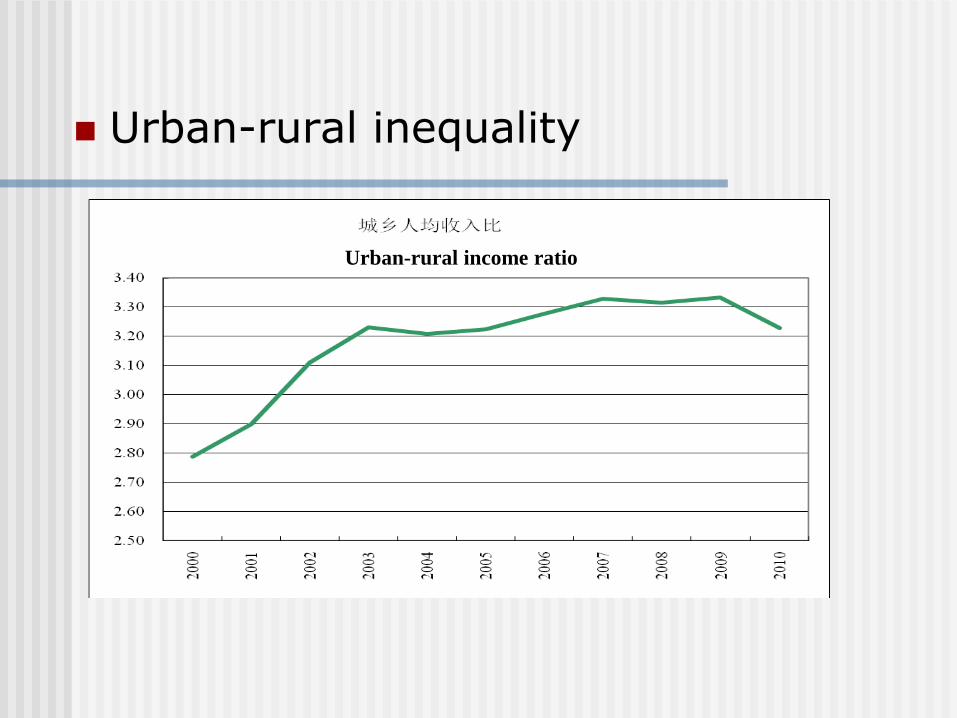
Urban-rural inequality
Urban-rural income ratio
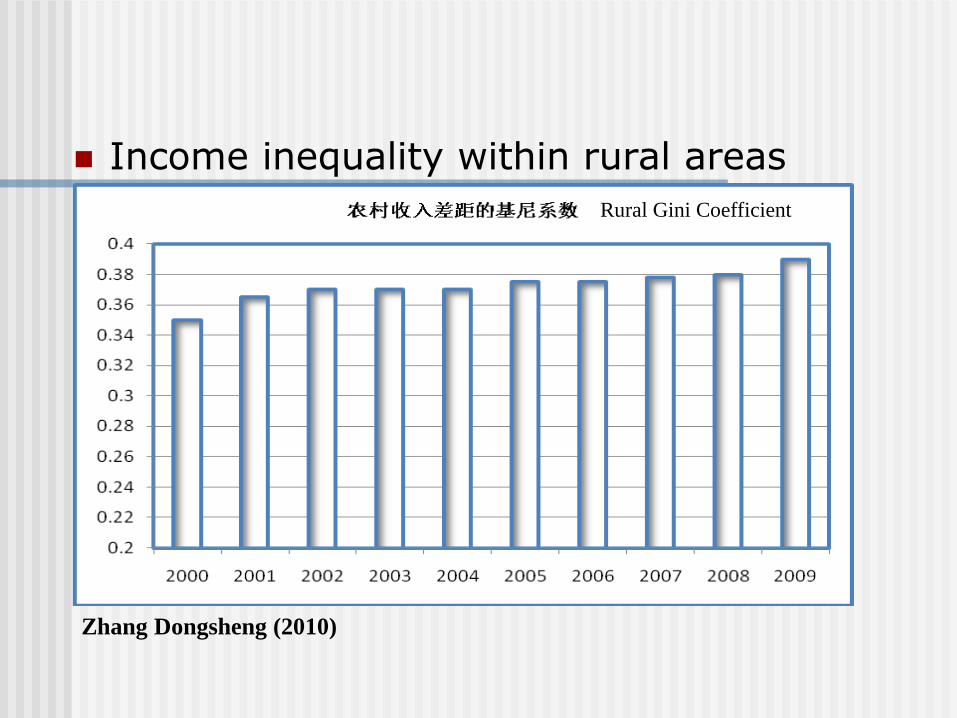
Income inequality within rural areas
Zhang Dongsheng (2010)
Rural Gini Coefficient
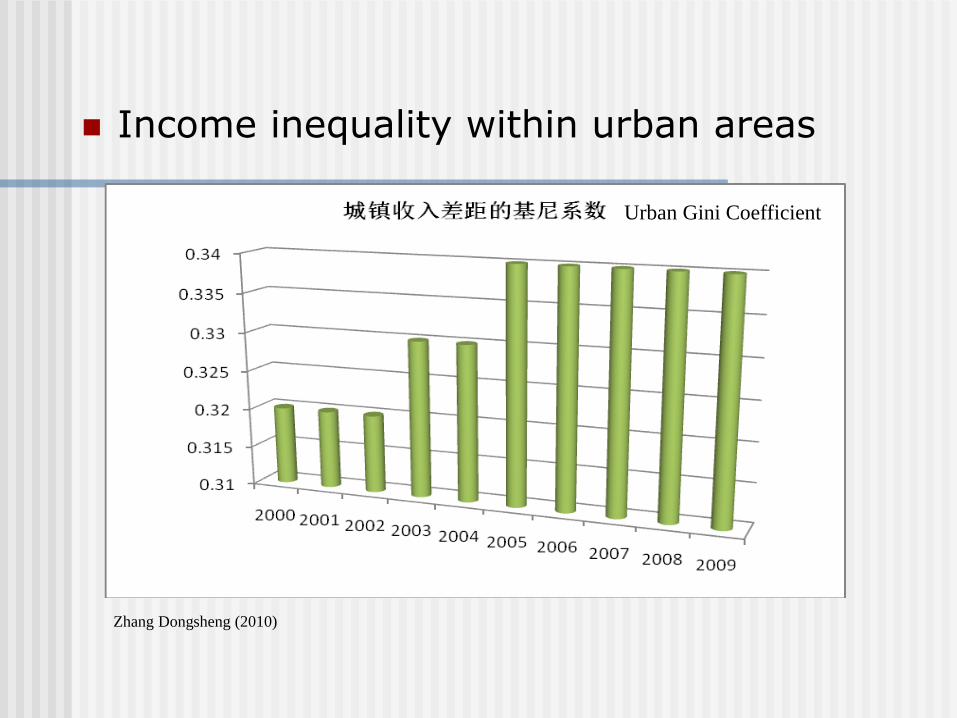
Income inequality within urban areas
Urban Gini Coefficient
Zhang Dongsheng (2010)

Re-estimated Urban Income Inequality
Urban Gini based on NBS Survey
Urban Gini based on Luo Chuliang (2010)
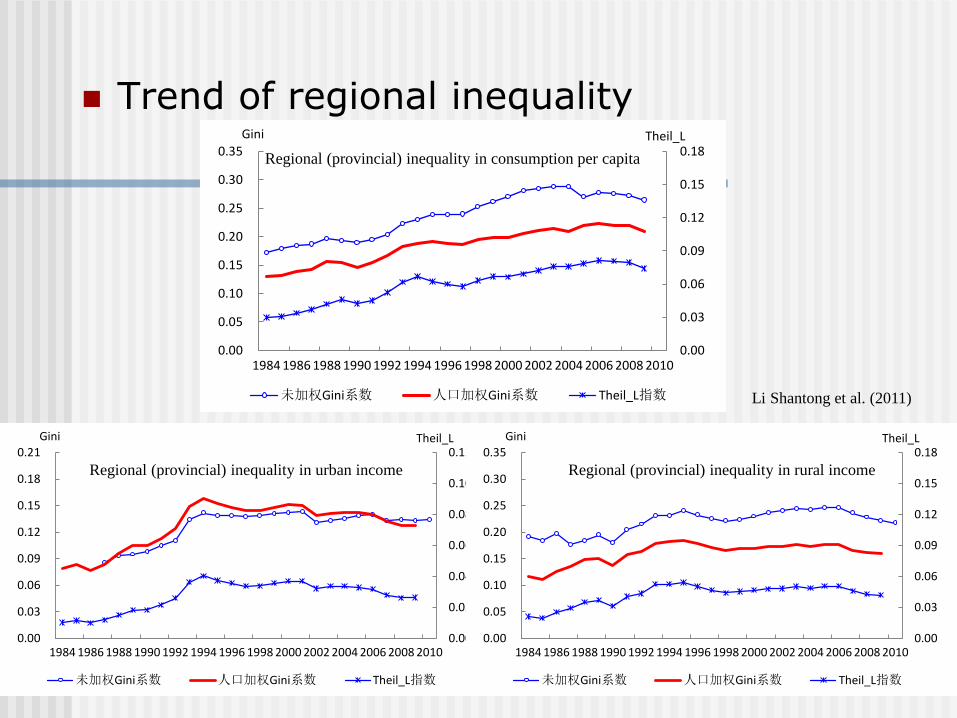
Trend of regional inequality
0.00
0.03
0.06
0.09
0.12
0.15
0.18
0.00
0.05
0.10
0.15
0.20
0.25
0.30
0.35
19841986198819901992199419961998200020022004200620082010
Theil_LGini
未加权Gini系数 人口加权Gini系数 Theil_L指数
0.00
0.02
0.04
0.06
0.08
0.10
0.12
0.00
0.03
0.06
0.09
0.12
0.15
0.18
0.21
19841986198819901992199419961998200020022004200620082010
Theil_LGini
未加权Gini系数 人口加权Gini系数 Theil_L指数
0.00
0.03
0.06
0.09
0.12
0.15
0.18
0.00
0.05
0.10
0.15
0.20
0.25
0.30
0.35
19841986198819901992199419961998200020022004200620082010
Theil_LGini
未加权Gini系数 人口加权Gini系数 Theil_L指数
Regional (provincial) inequality in consumption per capita
Regional (provincial) inequality in urban income Regional (provincial) inequality in rural income
Li Shantong et al. (2011)
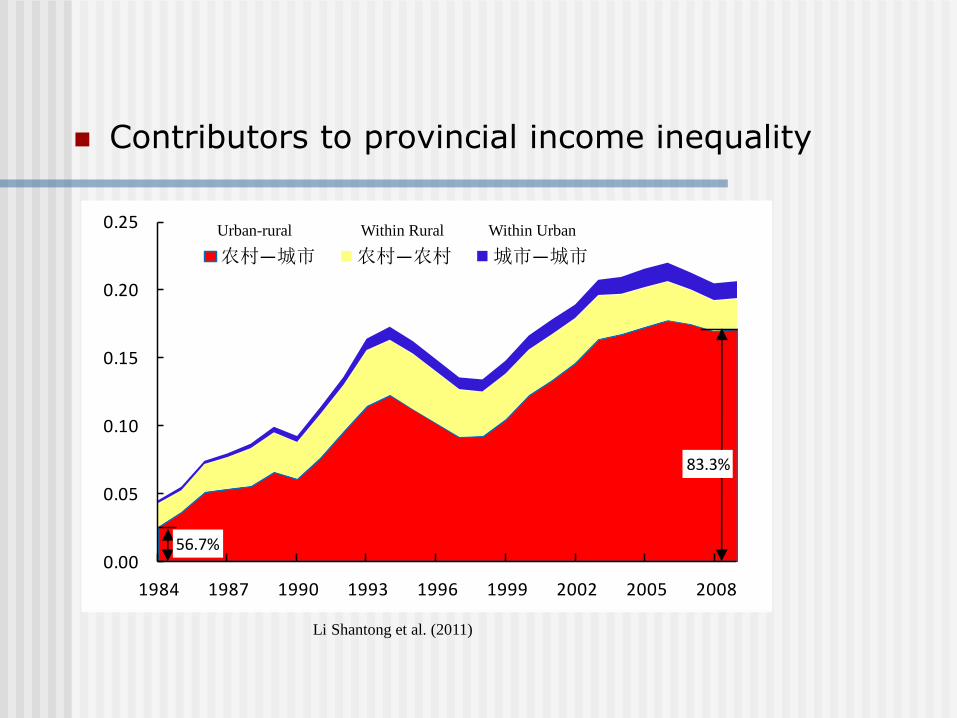
Contributors to provincial income inequality
0.00
0.05
0.10
0.15
0.20
0.25
1984 1987 1990 1993 1996 1999 2002 2005 2008
农村—城市 农村—农村 城市—城市
83.3%
56.7%
Within Rural Within Urban Urban-rural
Li Shantong et al. (2011)
Grey Income Debate
Grey income was estimated as high as 5.4 trillion Yuan in 2010 (Wang Xiaolu, 2010)
Grey income is an issue to be concerned, but probably is not as serious as that estimated by Wang (Luo, Yue, and Li, 2010)
3. Implications for China’s
Economic Growth in the Future
Decreasing poverty, either in income poverty or multidimensional poverty, but
• Low standard of poverty line
• Less focus on other dimensions
• Less focus on Children poverty
•Segmentation of Policies
The income inequality probably has reached to a turning point, at least in some aspects, but Income inequality is still serious
It’s not sure whether the trend will be sustained?
Dramatic widening urban inequality
Will transfer schemes among regions and between rural and urban areas be affordable and sustainable?
Achieving a more equitable and sustainable economic growth
Improve human capital
Promote Urbanization
Growing middle class and structural change
Reform the factor market

Improving Productivity: Investment in Children and Human Capital
0 1 2 3 4 5 6 7 8 9 10
贫困发生率
%
图1. 中国农村不同年龄组人群贫困发生率
1998 2005
1998-2001年我国贫困县扶贫资金投向结构
文教卫生3%
工业14%
基础设施20%
农业46%
交通运输6%
技术培训1%
其它9%
商业服务业1%
技术培训
文教卫生
商业服务业
交通运输
工业
基础设施
农业
其它
CDRF (2007)
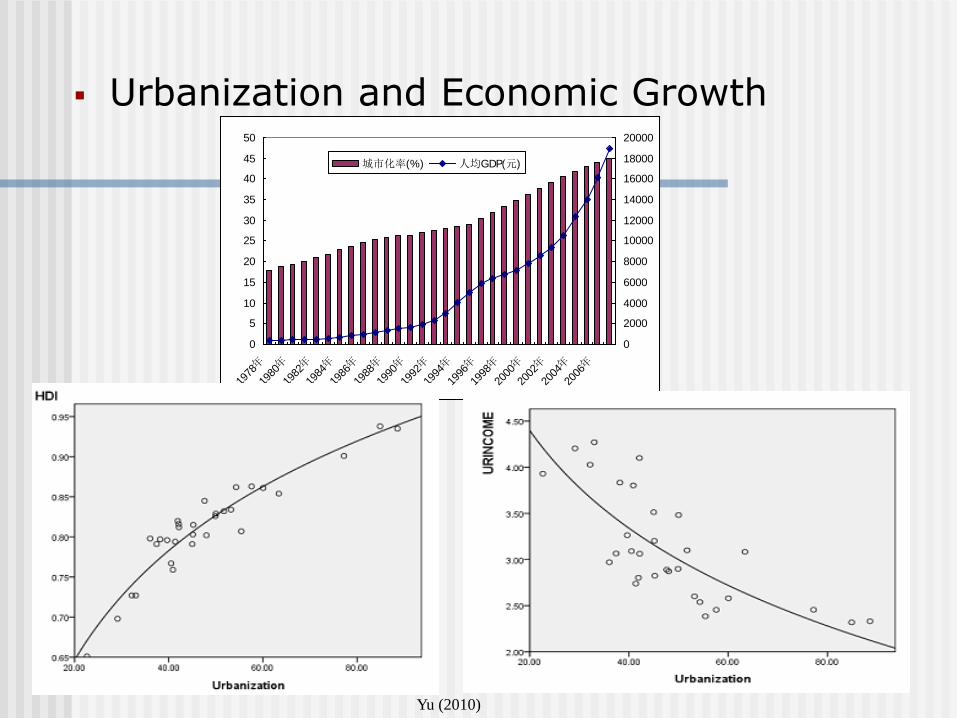
Urbanization and Economic Growth
0
5
10
15
20
25
30
35
40
45
50
1978年
1980年
1982年
1984年
1986年
1988年
1990年
1992年
1994年
1996年
1998年
2000年
2002年
2004年
2006年
0
2000
4000
6000
8000
10000
12000
14000
16000
18000
20000
城市化率(%) 人均GDP(元)
Yu (2010)
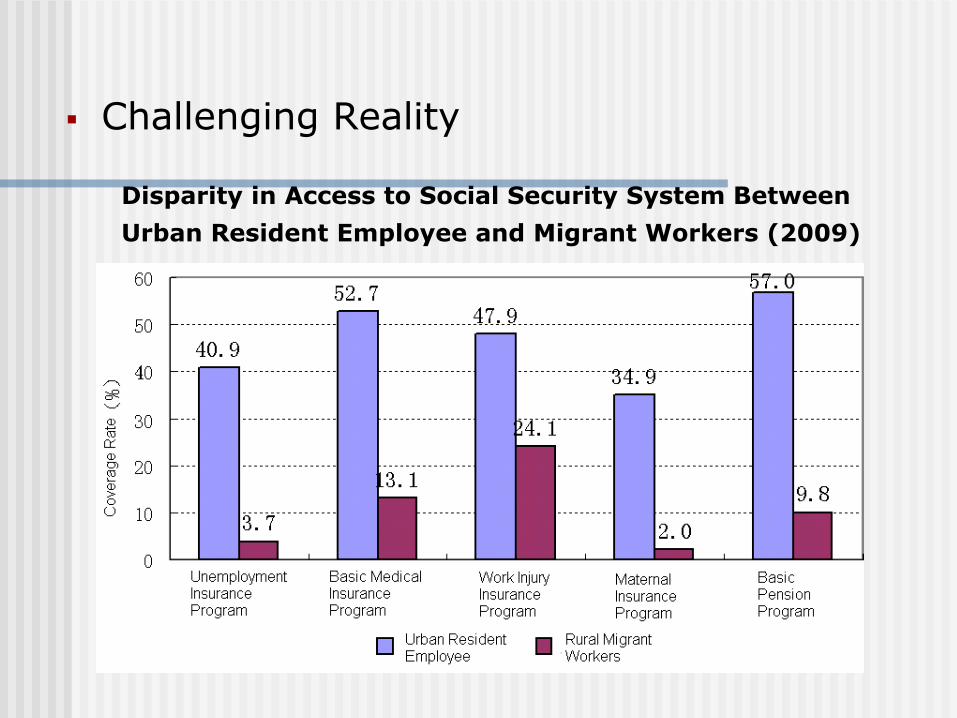
Challenging Reality
Disparity in Access to Social Security System Between
Urban Resident Employee and Migrant Workers (2009)
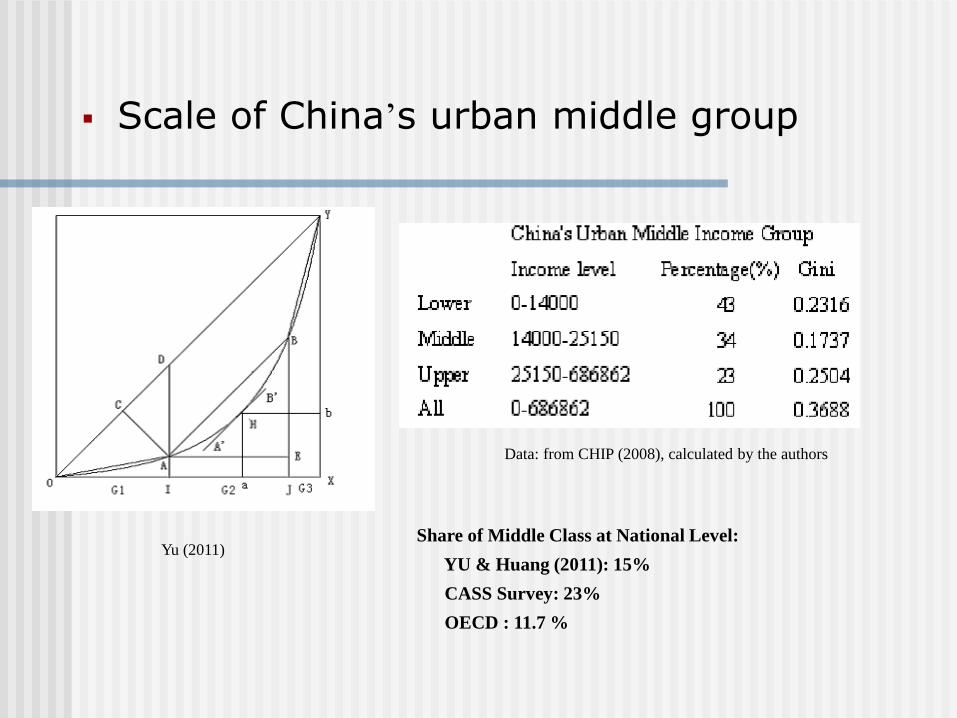
Scale of China’s urban middle group
Yu (2011)
Data: from CHIP (2008), calculated by the authors
Share of Middle Class at National Level:
YU & Huang (2011): 15%
CASS Survey: 23%
OECD : 11.7 %

Reform Factor Market
Labor market reform
Liberalize Interest rate and deregulate -exchange rate regime
Land reform
Marketize natural resources
Many Thanks
Jiantuo Yu
China Development Research Foundation
December, 2011
Copyright © 2022 FDOKUMEN