JACFIncome Inequality
12
In This Issue: Regulation and Capital Markets Pick Your Poison—Fragmentation or Market Power? An Analysis of RegNMS, High Frequency Trading, and Securities Market Structure 8 Craig Pirrong, University of Houston Systematic Policy and Forward Guidance 15 Charles I. Plosser, Federal Reserve Bank of Philadelphia Another Look at Bookbuilding, Auctions, and the Future of the IPO Process 19 Zhaohui Chen, University of Virginia. Alan D. Morrison, University of Oxford, William J. Wilhelm, Jr., University of Virginia and Lingnan College, Sun-Yat-Sen University Economic Growth and Inequality: Why It Matters and What’s Coming Next 30 Chris Pinney, High Meadows Institute Is There a Better Way to Examine Income Inequality? 40 Ron Schmidt, University of Rochester A South African Success Story: Excellence in the Corporate Use of Capital and Its Social Benefits 50 Brian Kantor, Investec Wealth & Investment and David Holland, David Holland Consulting Attracting Long-Term Investors Through Integrated Thinking and Reporting: A Clinical Study of a Biopharmaceutical Company 57 Andrew Knauer and George Serafeim, Harvard Business School Mechanisms of Board Turnover: Evidence From Backdating 65 Frederick L. Bereskin, University of Delaware, and Clifford W. Smith, Jr., University of Rochester Do Bond Covenants Affect Borrowing Costs? 79 Martin Fridson, Lehmann, Livian, Fridson Advisors LLC; Xiaoyi Xu, FridsonVision LLC; Ruili Liu, FridsonVision LLC; Yinqiao Yin, Bond Street Group The Decision to Repurchase Debt 85 Timothy Kruse, Xavier University; Tom Nohel and Steven K.Todd, Loyola University Chicago More Evidence That Corporate R&D Investment (and Effective Boards) Can Increase Firm Value 94 Jamie Y. Tong, University of Western Australia and Feida (Frank) Zhang, Murdoch University 2013 Nobel Prize Revisited: Do Shiller’s Models Really Have Predictive Power? 101 Brian Kantor and Christopher Holdsworth, Investec Securities and University of Cape Town VOLUME 26 | NUMBER 2 | SPRING 2014 APPLIED CORPORATE FINANCE Journal of
-
Upload
independent -
Category
Documents
-
view
0 -
download
0
Transcript of JACFIncome Inequality

In This Issue: Regulation and Capital Markets
Pick Your Poison—Fragmentation or Market Power? An Analysis of RegNMS, High Frequency Trading, and Securities Market Structure
8 Craig Pirrong, University of Houston
Systematic Policy and Forward Guidance 15 Charles I. Plosser, Federal Reserve Bank of Philadelphia
Another Look at Bookbuilding, Auctions, and the Future of the IPO Process 19 Zhaohui Chen, University of Virginia. Alan D. Morrison,
University of Oxford, William J. Wilhelm, Jr., University of
Virginia and Lingnan College, Sun-Yat-Sen University
Economic Growth and Inequality: Why It Matters and What’s Coming Next 30 Chris Pinney, High Meadows Institute
Is There a Better Way to Examine Income Inequality? 40 Ron Schmidt, University of Rochester
A South African Success Story: Excellence in the Corporate Use of Capital and Its Social Benefits
50 Brian Kantor, Investec Wealth & Investment and
David Holland, David Holland Consulting
Attracting Long-Term Investors Through Integrated Thinking and Reporting: A Clinical Study of a Biopharmaceutical Company
57 Andrew Knauer and George Serafeim,
Harvard Business School
Mechanisms of Board Turnover: Evidence From Backdating 65 Frederick L. Bereskin, University of Delaware, and
Clifford W. Smith, Jr., University of Rochester
Do Bond Covenants Affect Borrowing Costs? 79 Martin Fridson, Lehmann, Livian, Fridson Advisors LLC;
Xiaoyi Xu, FridsonVision LLC; Ruili Liu, FridsonVision LLC;
Yinqiao Yin, Bond Street Group
The Decision to Repurchase Debt 85 Timothy Kruse, Xavier University; Tom Nohel and
Steven K.Todd, Loyola University Chicago
More Evidence That Corporate R&D Investment (and Effective Boards) Can Increase Firm Value
94 Jamie Y. Tong, University of Western Australia and
Feida (Frank) Zhang, Murdoch University
2013 Nobel Prize Revisited: Do Shiller’s Models Really Have Predictive Power? 101 Brian Kantor and Christopher Holdsworth, Investec
Securities and University of Cape Town
VOLUME 26 | NUMBER 2 | SPRING 2014
APPLIED CORPORATE FINANCEJournal of

30 Journal of Applied Corporate Finance • Volume 26 Number 2 Spring 2014
Economic Growth and Inequality: Why It Matters and What’s Coming Next
1. Thomas Piketty. Capital in the Twenty-First Century. Harvard University Press, 2014.
by Chris Pinney, High Meadows Institute
Income inequality has become a top policy concern of the Obama administration as well as the focus of global private and public sector lead-ers at national and international forums. This
paper is designed to shed light on the current and future driv-ers of income inequality and their implications for economic and social development.
Most economists agree that a certain amount of inequality is necessary to create the pools of capital that fund investment in new ventures and technologies—and most would also agree that such capital and investment are essential contributors to economic growth and social progress. However, there is no agreement about the optimal level of inequality, or the point at which too much or too little inequality slows economic growth and can become a destabilizing force that threatens social cohesion as well as the economy.
Most experts agree that one important—if not the most important—driver of rising income inequality is the increase in the share of national income that now accrues to “capital” (in the form of interest, dividends, and other realized invest-ment returns) in relation to the share that goes to “labor” (as wages, salaries, pension, and other work-related benefits). Capital’s need for labor to produce goods and services has historically ensured a dynamic balance between these two forms of income within society. But at the same time, capital’s drive to increase returns to investors has continually challenged this balance as it seeks to increase productivity and financial gain through labor-saving technological innovation.
In the U.S. during the last 100 years, successive waves of technological innovations have transformed the economy from an agricultural to an industrial to what is now being described as a “post-industrial” society. Each wave of innova-tion has dramatically lifted productivity, driving economic growth and increasing the returns to capital. At the same time as these waves of innovation destroyed jobs, they generated new jobs and income for workers as companies created new categories of products and services.
During most of the 20th century, income inequality in the U.S. and most OECD countries was limited by this dynamic, and by a social contract in which governments placed constraints on the free movement of capital, set labor
compensation standards, and redistributed income through progressive taxation. Labor, for its part, was effective in advocating for its share of income from productivity gains through collective action and unions. The result was that both labor and capital shared the benefits of economic growth, and today the living standards of even the poorest Americans vastly exceed those of 100 years earlier.
Some economists, including the French economist Thomas Piketty in his bestselling book Capital in the Twenty-First Century, have argued that this social contract and the moderate levels of income inequality during the last century are in fact an anomaly compared to historical norms. Piketty attributes the low levels of income inequality during this period to social upheavals, economic depressions, and wars during the 20th century that shook up the social order, destroyed wealth and returns to capital, and gave rise to pressures for higher taxation on both high income earners and wealth.1 But during the last 50 years—a period of relative stability and rising incomes for all—Piketty suggests that these pressures have moderated, contributing to a steady decline in tax rates on high income earners and wealth. As a conse-quence, he postulates that we now may be returning to a norm in which the private return to capital exceeds the rate of national income and output—a condition that, in the absence of high levels of taxation, is expected to lead to an accelerat-ing flow of income to those with capital, and to ever greater inequality.
Piketty’s analysis is clearly reinforced by recent data, which shows income inequality rising rapidly in most OECD countries. Until a decade ago, the share of U.S. total national income going to workers was relatively stable at around 70%, while the share going to capital—mainly corporate profits and returns on financial investments—made up the other 30%. Slowly but steadily, however, labor’s share of total national income in the U.S. and other OECD countries has been falling, while the share going to capital owners has gone up. The result has been rising income inequality within both the U.S and other OECD countries. A study by the U.S. Congres-sional budget office shows that, between 1979 and 2007, the share of national income for the top 20 percent increased by 10% while other income groups saw their share fall by 2-3%.
31Journal of Applied Corporate Finance • Volume 26 Number 2 Spring 2014
2. Congressional Budget Office. Trends in the Distriubtion of Household Income Be-tween 1979 and 2007. CBO, October 2011.
3. Credit Suisse. Global Wealth Report 2013. Credit Suisse, 2013.4. Paul Wiseman & Bernard Condon. Will machines create a world without work?
Associated Press, 2013.5. Drum, K. Welcome, Robot Overlords. Please Don’t Fire Us? Mother Jones, 2013.6. Bernard Condon & Paul Wiseman. Millions Of Middle-Class Jobs Killed By Ma-
chines In Great Recession’s Wake. Associated Press, 2013.
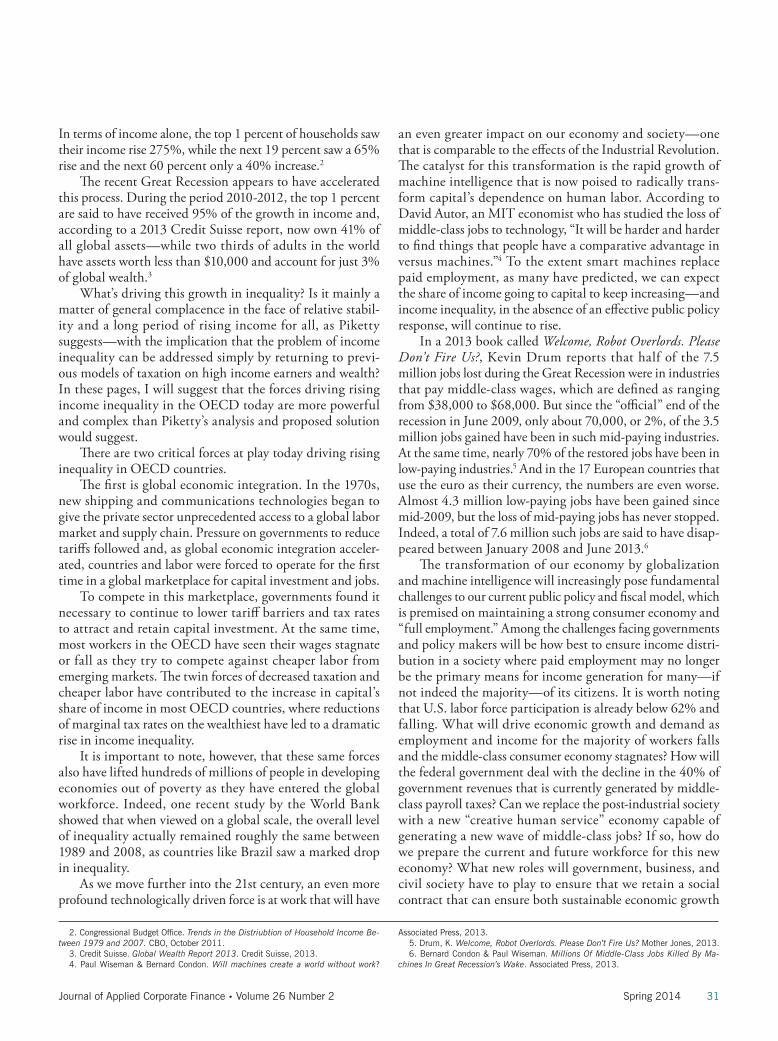
an even greater impact on our economy and society—one that is comparable to the effects of the Industrial Revolution. The catalyst for this transformation is the rapid growth of machine intelligence that is now poised to radically trans-form capital’s dependence on human labor. According to David Autor, an MIT economist who has studied the loss of middle-class jobs to technology, “It will be harder and harder to find things that people have a comparative advantage in versus machines.”4 To the extent smart machines replace paid employment, as many have predicted, we can expect the share of income going to capital to keep increasing—and income inequality, in the absence of an effective public policy response, will continue to rise.
In a 2013 book called Welcome, Robot Overlords. Please Don’t Fire Us?, Kevin Drum reports that half of the 7.5 million jobs lost during the Great Recession were in industries that pay middle-class wages, which are defined as ranging from $38,000 to $68,000. But since the “official” end of the recession in June 2009, only about 70,000, or 2%, of the 3.5 million jobs gained have been in such mid-paying industries. At the same time, nearly 70% of the restored jobs have been in low-paying industries.5 And in the 17 European countries that use the euro as their currency, the numbers are even worse. Almost 4.3 million low-paying jobs have been gained since mid-2009, but the loss of mid-paying jobs has never stopped. Indeed, a total of 7.6 million such jobs are said to have disap-peared between January 2008 and June 2013.6
The transformation of our economy by globalization and machine intelligence will increasingly pose fundamental challenges to our current public policy and fiscal model, which is premised on maintaining a strong consumer economy and “full employment.” Among the challenges facing governments and policy makers will be how best to ensure income distri-bution in a society where paid employment may no longer be the primary means for income generation for many—if not indeed the majority—of its citizens. It is worth noting that U.S. labor force participation is already below 62% and falling. What will drive economic growth and demand as employment and income for the majority of workers falls and the middle-class consumer economy stagnates? How will the federal government deal with the decline in the 40% of government revenues that is currently generated by middle-class payroll taxes? Can we replace the post-industrial society with a new “creative human service” economy capable of generating a new wave of middle-class jobs? If so, how do we prepare the current and future workforce for this new economy? What new roles will government, business, and civil society have to play to ensure that we retain a social contract that can ensure both sustainable economic growth
In terms of income alone, the top 1 percent of households saw their income rise 275%, while the next 19 percent saw a 65% rise and the next 60 percent only a 40% increase.2
The recent Great Recession appears to have accelerated this process. During the period 2010-2012, the top 1 percent are said to have received 95% of the growth in income and, according to a 2013 Credit Suisse report, now own 41% of all global assets—while two thirds of adults in the world have assets worth less than $10,000 and account for just 3% of global wealth.3
What’s driving this growth in inequality? Is it mainly a matter of general complacence in the face of relative stabil-ity and a long period of rising income for all, as Piketty suggests—with the implication that the problem of income inequality can be addressed simply by returning to previ-ous models of taxation on high income earners and wealth? In these pages, I will suggest that the forces driving rising income inequality in the OECD today are more powerful and complex than Piketty’s analysis and proposed solution would suggest.
There are two critical forces at play today driving rising inequality in OECD countries.
The first is global economic integration. In the 1970s, new shipping and communications technologies began to give the private sector unprecedented access to a global labor market and supply chain. Pressure on governments to reduce tariffs followed and, as global economic integration acceler-ated, countries and labor were forced to operate for the first time in a global marketplace for capital investment and jobs.
To compete in this marketplace, governments found it necessary to continue to lower tariff barriers and tax rates to attract and retain capital investment. At the same time, most workers in the OECD have seen their wages stagnate or fall as they try to compete against cheaper labor from emerging markets. The twin forces of decreased taxation and cheaper labor have contributed to the increase in capital’s share of income in most OECD countries, where reductions of marginal tax rates on the wealthiest have led to a dramatic rise in income inequality.
It is important to note, however, that these same forces also have lifted hundreds of millions of people in developing economies out of poverty as they have entered the global workforce. Indeed, one recent study by the World Bank showed that when viewed on a global scale, the overall level of inequality actually remained roughly the same between 1989 and 2008, as countries like Brazil saw a marked drop in inequality.
As we move further into the 21st century, an even more profound technologically driven force is at work that will have
32 Journal of Applied Corporate Finance • Volume 26 Number 2 Spring 2014
7. Piketty (2014).8. Branko Milanovic & Christoph Lakner. Global Income Distribution from the Fall of
the Berlin Wall to the Great Recession. World Bank, 2011.
to produce equality as well as economic growth and jobs.But faced in the mid- to late 1970s with the pressures of
inflation and global competition, U.S. companies saw sharp declines in their profitability and market values. As a conse-quence, the 1980s saw the emergence of new kinds of investor activism—including LBOs and hostile takeovers—that at least initially led to cutbacks in employment. As corporate returns on capital began to increase, and the Reagan tax cuts took effect in the early 80’s, growth in income inequality resumed. And it appears to have increased steadily for the past three decades.
From the perspective of 2014, inequality of wealth and income—not only in the U.S. but most developed econo-mies—has begun to look like the natural state of capitalism rather than an exception.
When viewed at a global level, however, income inequal-ity among nations may not have increased to the degree that it has within many developed countries. At least that is one of the main conclusions of a 2011 study by Christoph Lakner and Branko Milanovic, the World Bank’s leading experts in this area.8 After carrying out a comprehensive global survey on inequality based on household incomes covering the period 1988-2008, Lakner and Milanovic conclude that the overall level of global inequality remained largely unchanged between 1989 and 2008. In the past, by far the largest compo-nent of global inequality was accounted for by differences in income and wealth among countries, and one of the effects of globalization has been to shrink such differences, at least to some extent, by providing higher-paying jobs for emerging-market workers.
Consistent with Piketty’s message, Lakner and Milanovic also report that the “within-country” component of global inequality increased continuously over this 20-year period. Also consistent with Piketty’s thesis, an OECD report published in 2011 stated that such inequality first began to rise in the late 1970s and early 1980s in some Anglo-
and social progress for all in a global economy and society? In the pages that follow, I do not attempt to provide
answers to these questions, but rather to shed further light on the forces that are shaping them so that we may better under-stand the scale of the challenges facing us and the nature and extent of the systemic reforms that will be required to address them.
Some Historical Background—and Growing Evidence of Increasing Inequality A number of recent studies have looked at inequality glob-ally—mainly within the U.S., Europe, and the OECD generally, but also with analysis of some developing nations. Much of this work is reviewed by Thomas Piketty in his above-mentioned Capital in the Twenty-First Century, which provides a detailed look at 200 years’ worth of data on the distribution of income and wealth across the world’s devel-oped economies (as well as some large emerging markets).7
Piketty begins by noting that the share of wealth and income accounted for by the richest 20% of these countries’ populations remained high throughout the 18th and most of the 19th centuries, contributing to stark inequalities in wealth and income. Although increases in workers’ wages in the late 19th and early 20th centuries had the effect of stabi-lizing growth in wealth concentrations, such increases did little or nothing to reduce inequalities. After such inequalities were significantly reduced by the great “shocks” of the period from 1914 to 1950—which included two World Wars and the Great Depression—economists became convinced that the resulting compression in the distribution of income and wealth was a natural feature of the maturation of capital-ist economies. This view appeared to be confirmed by a period that Piketty describes as a “Golden Age” of American capitalism—a period stretching from 1945 to 1973 in which a combination of regulation, taxation, and collective bargain-ing appeared to work hand in hand with corporate America
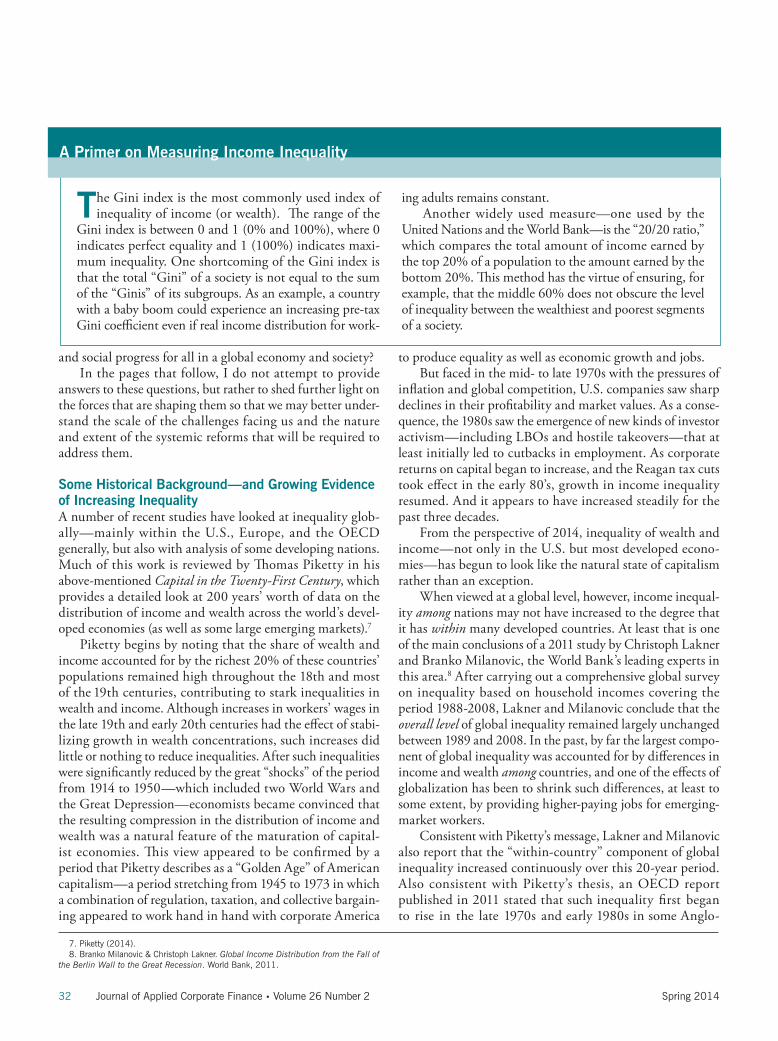
The Gini index is the most commonly used index of inequality of income (or wealth). The range of the
Gini index is between 0 and 1 (0% and 100%), where 0 indicates perfect equality and 1 (100%) indicates maxi-mum inequality. One shortcoming of the Gini index is that the total “Gini” of a society is not equal to the sum of the “Ginis” of its subgroups. As an example, a country with a baby boom could experience an increasing pre-tax Gini coefficient even if real income distribution for work-
ing adults remains constant.Another widely used measure—one used by the
United Nations and the World Bank—is the “20/20 ratio,” which compares the total amount of income earned by the top 20% of a population to the amount earned by the bottom 20%. This method has the virtue of ensuring, for example, that the middle 60% does not obscure the level of inequality between the wealthiest and poorest segments of a society.
A Primer on Measuring Income Inequality

33Journal of Applied Corporate Finance • Volume 26 Number 2 Spring 2014
9. OECD. Growing Income Inequality in OECD Countries: What Drives it and How Can Policy Tackle it? OECD Forum on Inequality. Paris, France. May 2, 2011.
10. At the same time, however, notoriously high-inequality countries like Chile, Mexico and Turkey have actually experienced declining levels of income inequality in re-
cent years.11. Angus Deaton. The Great Escape: Health, Wealth, and the Origins of Inequality.
Princeton University Press, 2013.
as he points out, “made it possible to grow more food, but it also brought new diseases and new inequalities as hierarchic states replaced egalitarian bands of hunter gatherers.”11 Few, of course, would argue that humanity was better off living in caves. And as Deaton emphasizes, the rapid rates of economic growth in parts of the developing world, particularly China and India, have dragged many people out of abject poverty despite rising inequality. To cite just one statistic, Deaton notes that during the past 30 years, the fraction of the world’s population that survives on a dollar a day or less has fallen from an estimated 40% to under 15%.
An even more sanguine assessment of the economic import of inequality was provided by Stephen Moore and Julian Simon in their 2000 book, It’s Getting Better All the Time: 100 Greatest Trends of the Last 100 Years. According to Moore and Simon, the best way to measure economic health and well-being is not equality, but economic growth. Using that standard, real per capita GDP in the U.S. grew nearly sevenfold during the 20th century, despite fluctuating levels of income inequality; and standards of living improved for all economic groups, including the bottom 20% of income earners. In 1900, less than one in five homes had running
phone countries, notably the United Kingdom and the United States, followed by a more widespread increase from the late 1980s on.9 More specifically, the most recent trends show a widening gap between poor and rich in some already high-inequality countries, such as Israel and the United States. And even countries such as Denmark, Germany and Sweden, which have traditionally prided themselves on low inequality, have experienced sharp increases.10
In the United States, income inequality before taxes and transfer payments is actually on a par with that of many OECD countries. But when one looks at inequality after tax and income transfers, American income inequality is highest in the OECD and dwarfs the figures of Japan and Scandi-navia.
How Does Inequality Impact Economic Growth? Now let’s turn to the work of another economist, Angus Deaton, who has spent decades studying health, inequality, and economic development. In a book published last year called The Great Escape: Health, Wealth, and the Origins of Inequality, Deaton argued emphatically that inequality is an inevitable byproduct of progress. “The move to agriculture,”
Figure 1 Income Inequality Before and After Taxes and Transfers
Source: LIS Database, calculations by Janet Gornick (Graduate Center, CUNY), March 7, 2014.Methods: Pre-tax pre-transfer results capture income from labor and capital (LIS variable factor); post tax-post-transfer results capture dispos-
able household income (LIS variable DHI). Income is adjusted to account for household size.
0.23
0.24
0.26
0.26
0.26
0.26
0.27
0.27
0.27
0.29
0.29
0.30
0.31
0.31
0.31
0.31
0.32
0.33
0.33
0.36
0.37
0.45
0.47
0.46
0.47
0.48
0.43
0.41
0.46
0.46
0.52
0.57
0.45
0.35
0.49
0.37
0.48
0.48
0.51
0.52
0.56
0.51
0.10 0.20 0.30 0.40 0.50 0.60
Denmark - 2004
Sweden - 2005
Norway - 2004
Netherlands - 2010
Finland - 2010
Slovak Republic - 2010
Switzerland - 2004
Austria - 2004
Luxembourg - 2010
Germany - 2010
Ireland - 2010
Japan - 2008
Taiwan - 2005
Poland - 2010
Korea - 2006
Australia - 2003
Canada - 2010
Spain - 2010
Greece - 2010
United Kingdom -2010
United States - 2010
GINI OF INCOME BEFORE TAXES AND TRANSFERS GINI OF INCOME AFTER TAXES AND TRANSFERS
0.00

34 Journal of Applied Corporate Finance • Volume 26 Number 2 Spring 2014
12. Stephen Moore & Julian Simon, It’s Getting Better All the Time: 100 Greatest Trends of the Last 100 Years. Cato Institute, 2000.
13. Daron Acemoglu & James Robinson. Why Nations Fail: The Origins of Power, Prosperity, and Poverty. Crown Publishing, 2011.
14. Fuad Hasanov & Oded Izraeli. Income Inequality, Economic Growth, and the Distribution of Income Gains: Evidence from the U.S. Journal of Regional Science, Volume 51 No.3, 2011.
ing moderate levels of inequality as well as high levels of economic growth in most states around the year 2000, the authors proposed that the average level of inequality among the states in 2000 be viewed as an “optimum,” and then measured the effect of deviations from those levels on economic growth rates. Consistent with this hypothesis, the study found a “hump-shaped” relationship between inequality and growth. In other words, those states that experienced levels of inequality either significantly above or below the average for all states in 2000 tended to have lower-than-average rates of growth over the period. At the same time, those states characterized by moderate and fairly stable levels of inequality enjoyed the highest growth rates.
The message from economists, then, is that inequality can be a force for widespread economic prosperity by putting more resources into the hands of capitalists, which in turn promotes savings and investment and catalyzes economic growth. But pushed beyond a certain point, inequality can become a demoralizing and destabilizing force, leading to calls for punitive action against legitimate business competi-tion as well as fraudulent or “rent-seeking” activities.
What Drives Inequality? According to a 2011 OECD report, increases in household income inequality in OECD countries during the past 30 years have been driven largely by changes in the distribu-tion of wages and salaries, which account for 75% of the household incomes of working-age adults. With very few exceptions, the wages of the 10% highest-paid workers have risen relative to those of the 10% lowest-paid workers. This has been attributable both to the increase in earnings shares at the top and the decline in earnings shares at the bottom.
At the same time, top earners have seen their incomes rise particularly sharply during this period. As can be seen in Figure 2, the highest 10% of earners have been leaving the middle earners behind more rapidly than the lowest earners have been drifting away from the middle.
Self-employment is another factor that could play a role. It is much more unequally distributed across countries than wages and salaries, and the self-employed tend to be disproportionally concentrated in the lower income groups in most OECD countries. But since the share of self-employ-ment income accounts for a relatively small share of gross labor income—between 3% and 13%, depending on the country—self-employment can account for at most a minor part of the overall inequality increase.
Another driver of income inequality in OECD countries is the distribution of incomes from capital, which includes income from real estate and other physical property, as well as
water, flush toilets, a vacuum cleaner, or gas or electric heat. As recently as 1950, fewer than 20% of homes had air condi-tioning, a dishwasher, or a microwave oven. Today between 80 and 100% of American homes have all of these modern conveniences. As for standards of health, “Average life expec-tancy in the U.S. has grown by more than 50% since 1900. Infant mortality declined from 1 in 10 back then to 1 in 150 today. Children under 15 are at least 10 times less likely to die, as one in four did during the 19th century, with their death rate reduced by 95%.”12
But none of this really addresses the question: What are the negative consequences of growing inequality in developed economies? And if there are negative consequences, is there such a thing as an optimal level of inequality, at least for a given country or set of circumstances?
In another recent economic bestseller, Why Nations Fail: The Origins of Power, Prosperity, and Poverty, MIT econo-mist Daron Acemoglu and Harvard political scientist James Robinson argue that although free markets tend to create widespread prosperity, they also have the potential to create concentrations of wealth and political power that are often used to suppress competition and entrench “rent-seeking” elites—that is, businessmen whose profits owe more to favor-able regulation and political connections than innovation and efficiency.13 Moreover, even in wealthy countries like the U.S., as economic growth slows and share of income to labor falls, we are already seeing the growth of an “underclass” whose inade-quate education and low skills leave them with poor prospects for full participation in the economy as earners or consumers. As Acemoglu and Robinson point out, the growth of such an underclass has often led historically to political instability and calls for “radical” reforms that pose a significant risk to invest-ment and capital, and as a result economic growth.
In making their argument, Acemoglu and Robinson present an impressive number of case studies showing how the failure to create “inclusive political and economic institu-tions” leads to a vicious cycle in which political and economic inequalities both ref lect and then contribute to further economic stagnation and low standards of living. But is there any detailed empirical evidence on wages and incomes that supports this contention that inequality matters?
In a study published in 2011, economists Fuad Hasanov and Oded Izraeli made an ingenious attempt to explore these questions by looking at income inequality and economic growth rates in 48 U.S. states during the 40-year period from 1960-2000. The study’s findings suggest that inequality and growth are entwined in complex ways and, most important, that both excessively high and low levels of inequality are associated with lower rates of growth.14 Observ-

35Journal of Applied Corporate Finance • Volume 26 Number 2 Spring 2014
15. OECD. Growing Income Inequality in OECD Countries: What Drives it and How Can Policy Tackle it. 2011.
16. Ibid17. Hungerf, T. L. Changes in the Distribution of Income Among Tax Filers Between
1996 and 2006: The Role of Labor Income, Capital Income, and Tax Policy. Congres-sional Research Bureau, 2011.
reforms have also contributed to widening wage disparities, as more low-paid people have found jobs and higher-skilled workers reaped more benefits from a more dynamic economy. In particular, a number of studies have associated more relaxed employment-protection legislation as well as a decline in union density and bargaining coverage with greater wage dispersion.16
Effects of Income Taxes and Benefit Systems. In most countries, the extent of redistribution has increased over the period as a whole. As a result, tax-benefit policies have offset some of the large increases in income inequality. Indeed, up until the mid-1990s, tax-benefit systems in many OECD countries appear to have offset more than half of the rise in market-income inequality.
But during the past 10 or 15 years, as market-income inequality has continued to rise, the stabilizing effect of taxes and benefits on household income inequality has mostly declined. In some countries, taxes and benefits actually became less redistributive during the past decade. In the U.S., for example, taxation policy has been a much more significant driver of inequality than in other OECD countries. Accord-ing to a 2011 report by the Congressional Research Service, although inequality of earnings increased between 1996 and 2006, the largest source of the increase in overall income inequality was the significant increases in capital gains and dividends during this period.17 Partly as a result of reduc-tions in the tax rates on capital gains and dividend income enacted in 2003, capital gains and dividends had become a considerably larger share of total income in 2006 than in 1996, especially for high-income taxpayers.
from investment and savings. The inequality of capital income has increased sharply over the past two decades. Indeed, in two-thirds of OECD countries, the increase in the inequality of capital income was larger, on average, than the increase in the inequality of earnings.
But even if capital’s share of total income has increased in most countries, it’s important to keep in mind that that share remains at the relatively modest level of about 7% for the average country. Not surprisingly, in countries where the share of capital income has increased, this income has accrued almost exclusively to those in the upper 20% of the income distribution.
Effects of Regulatory Changes. During the past two decades, most OECD countries carried out regulatory reforms designed to strengthen competition in the markets for goods and services, along with associated reforms aimed at making their labor markets more flexible. For instance, anti-competitive product-market regulations were reduced significantly in all countries. And employment protection legislation for workers with temporary contracts also became more employer-friendly in many countries.
The results of these reforms, however, have been mixed. On the one hand, empirical evidence points to a significant positive impact of these reforms on levels of employment—that is, on the number of jobs.15 In particular, greater product-market competition tends to increase aggregate employment by reducing market rents and expanding activ-ity that in turn leads to stronger labor demand. But while they have increased the numbers of jobs, many of these
Figure 2 Percent Change in Real After-Tax Income Since 1979
Source: A Guide to Statistics on Historical Trends in Income Inequality, Center on Budget and Policy Priorities.
-50
0
50
100
150
200
250
300
350
1980 1985 1990 1995 2000 2005 2010
Bottom 20%
Middle 60%
Next 19%
Top 1%
201%
65%
49%40%

36 Journal of Applied Corporate Finance • Volume 26 Number 2 Spring 2014
18. James Manyika, David Hunt, Scott Nyquist, Jaana Remes, Vikram Malhotra, Lenny Medonca, Byron Auguste, & Samantha Test. Growth and Renewal in the United
States: Retooling America’s Economic Engine. Journal of Applied Corporate Finance, Vol. 23 No. 1, Winter 2012.
is expected to lead to a higher level of national wealth and, in the process, greater concentrations of wealth and inequality.
But how do these laws stand in relation to the existing theories of capital and employment? And do they have any special relevance to today’s global economy?
Most economists, as Piketty points out, assume that mature economies with well-functioning markets end up achieving and maintaining a fairly stable balance between labor and capital based on a sharing of productivity gains. Corporations, in their efforts to maximize their own produc-tivity and value, are continually looking for ways to invest capital with the expectation of earning returns that are at least equal to their cost of capital—and thus considerably higher than GDP growth rates. The effects of such investment, while reducing the demand for labor in many instances, are assumed to stimulate enough growth to create opportunities and jobs in other sectors.
In support of this proposition that productivity and profits generally lead to growth and more jobs over time, the McKinsey Global Institute (MGI), the research arm of the well-known consulting firm, has published a series of studies that compare the productivity growth of companies in the U.S., Western Europe, and Japan. Measured in terms of increases in output (as reflected in operating profits) per unit of labor that go back as far as 1960, the U.S. private sector has been far and away the most productive in the world. That finding was confirmed by the most recent version of the McKinsey study, which was extended through the end of 2009.18
But what evidence do we have that labor has shared in those productivity gains? As also reported in the McKin-sey study, during the 80-year period from 1929-2009, the
What is the Relationship of Capital to Economic Growth and Inequality?In Capital in the Twenty-First Century, as already noted, Thomas Piketty uses a unique collection of data from 20 countries ranging as far back as the 18th century to identify economic and social patterns that appear to drive the rela-tionship of capital to economic growth. In an effort to explain these patterns, Piketty presents two “laws” that purport to explain and predict when and how capitalism will generate higher levels of inequality—or what he refers to as “diver-gence”—of income and wealth.
The first law aims to explain changes over time in the division of national income between capital and labor. The percentage of income accruing to capital is calculated as the rate of return on capital multiplied by the total stock of wealth as a share of GDP. The rate of return is the sum of all income flowing to capital—rents, dividends, and profits—as a percentage of the value of all capital. The critical insight of Piketty’s first law is that when the return on capital is higher than the general rate of growth of the economy (as reflected in, say, GDP growth), capital’s share of income will rise more rapidly than labor’s wages, producing higher levels of inequality.
Piketty’s second law says that, over long periods and under the right circumstances, the stock of capital, as a percentage of national income, should approach the ratio of the national savings rate to the economic growth rate. So, for example, with a savings rate of 8% and GDP growth of 2% (both of which figures are roughly those of the U.S. economy), wealth should rise to 400% of annual output. But, and perhaps somewhat surprisingly, a drop in long-run growth to 1% would actually have the effect of pushing up expected wealth to 800% of GDP. In other words, a lower GDP growth rate
Figure 3 Federal Tax Rate by Income Group
Source: From http://www.epi.org/publication/rising-income-inequality-role-shifting-market/, Economic Policy Institute.
Full population
0.00%
10.00%
20.00%
30.00%
40.00%
50.00%
60.00%
70.00%
80.00%
1960
1964
1967
1969
1971
1973
1975
1977
1979
1981
1983
1985
1987
1989
1991
1993
1995
1997
1999
2001
0–20th
20–40th
40–60th
60–80th
80–90th
90–95th
95–99th
99–99.5th
99.5–99.9th

37Journal of Applied Corporate Finance • Volume 26 Number 2 Spring 2014
19. Karabarbounis, L. & Neiman, B. Declining Labor Shares and the Global Rise of Corporate Savings. University of Chicago, 2012.
20. Wiseman & Condon (2013).
mental decoupling of the relationship between capital and labor that has been a foundation of our social contract for most of the 20th century.
In a recent University of Chicago working paper called “Declining Labor Shares and the Global Rise of Corporate Saving,” Loukas Karabarbounis and Brent Neiman report that the cost of investment goods relative to consumption goods has dropped 25% over the past 35 years, making it attractive for companies to replace labor with software.19 According to the authors, this development has contributed to a decline in labor’s share of five percentage points of the global corporate gross value added paid to labor over the last 30 years. In countries and industries where the cost of invest-ment goods fell by more, the drop in labor’s share has been correspondingly larger. All around the world, labor is losing out to capital.
What’s more, there is one form of this use of technology that is especially troubling to labor and policy makers: the move to replace human labor with intelligent machines. As described by MIT economist David Autor, who has studied the loss of jobs to technology, such change is more encompass-ing and moving faster. As Autor goes on to say,
Computers most easily target jobs that involve routines, whatever skill level they require. And the most vulnerable of these jobs, economists have found, tend to employ mid-skill workers, even those held by people with college degrees—the very jobs that support a middle-class, consumer economy. So the rise of computer technology poses a threat that previous generations of machines didn’t: The old machines replaced human brawn but created jobs that required human brains. The new machines threaten both.20
relationship between productivity growth and private sector employment (in terms of numbers of jobs) was overwhelm-ingly positive. In all but one of the 71 rolling ten-year periods between 1929 and 2009, the U.S. private sector experienced increases in both productivity and employment.
Why This Time May Well Be DifferentIf there appears to be a generally positive relation between productivity and employment in the private sector, until recently the same could not be said about productivity and wages. Starting in the 1970s, we saw the beginnings of a disconnect between productivity and wages in developed countries; while productivity continued to increase, wages stagnated and in some cases fell. There are two key forces at work here that are likely to play an increasing role in shaping both the size of the labor market and wage compensation.
The first of these is globalization—the opening of global labor and capital markets, and the beginnings of what amounts to a global fiscal policy. These factors have all provided opportunities for global companies in various sectors of the economy to access low-cost overseas labor—opportu-nities to achieve at least short-term increases in productivity that have enabled the returns on capital to exceed the rate of economic growth in OECD countries. But underlying these changes is a much more fundamental and transformative force: the acceleration of labor-saving technological change, which is already shifting—and will continue to shift—the distribution of income away from workers to the owners of capital. As productivity gains continue to outstrip income gains (see Figure 4) and skilled workers are replaced by machines, we may well be seeing the beginning of a funda-
Figure 4 Disconnect between productivity and typical worker’s compensation, 1948–2013
Source: The State of Working America, Economic Policy Institute.
Hourly compensation
109.2%
Productivity
2013: 243.1%
0%
50%
100%
150%
200%
250%
300%
1948 1953 1958 1963 1968 1973 1978 1983 1988 1993 1998 2003 2008 2013
Cum
ulat
ive
perc
ent
chan
ge s
ince
1948
38 Journal of Applied Corporate Finance • Volume 26 Number 2 Spring 2014
21. Carolyn Dimitri, A. E. The 20th Century Transformation of U.S Agriculture and Farm Policy. UDA, 2005.
prosperity and social progress. Central to this widespread pros-perity in the developed economies was a dynamic relationship between capital and labor in which the bargaining power of labor and the legislative power of government ensured that the financial returns created by technology driven productivity gains to capital were shared broadly, lifting all boats.
As we have gone from an agricultural to an industrial to a service economy, millions of jobs have been lost as each economy replaced the previous. The reliance of capital on labor, however, ensured that while millions of jobs were destroyed as old economic models were transformed by technology, millions of new jobs took their place and produc-tivity gains were shared.
This time, however, many experts suggest that we are now experiencing a fundamental paradigm shift in this relation-ship of capital to labor. We are about to enter a world in which the production of the tangible goods and services we need and want will be produced with very little need for human labor except for those skilled workers who design and manage technology. As an analogy, it is useful to note that in 1900, 41% of Americans were employed in agriculture.21 Today, less than 2% of Americans work in an agricultural industry that now feeds a population four times as large as in 1900. At the same time, the price of food as percentage of the average Americans budget has declined dramatically. As machine intelligence impacts large chunks of the service economy, which now employs almost two thirds of Americans, we can anticipate a similar set of impacts on both employment and prices. On the employment side, millions of current workers from accountants to machinists, to commercial pilots to
Additionally, as more robots are built, largely by other robots, “assembly can be done here as well as anywhere else,” says Rob Enderle, an analyst who has been following the computer electronics industry for a quarter-century. “That will replace most of the workers, though you will need a few people to manage the robots.”
As noted earlier, half of the 7.5 million jobs lost during the Great Recession were in industries that pay middle-class wages, defined as ranging from $38,000 to $68,000. But since the end of the recession, only about 2% of the 3.5 million jobs gained have been in such mid-pay industries, while nearly 70% of the restored jobs have been in low-pay industries. And the 17 countries in the European monetary union, having lost 7.6 million mid-paying jobs since 2008, are continuing to lose them.
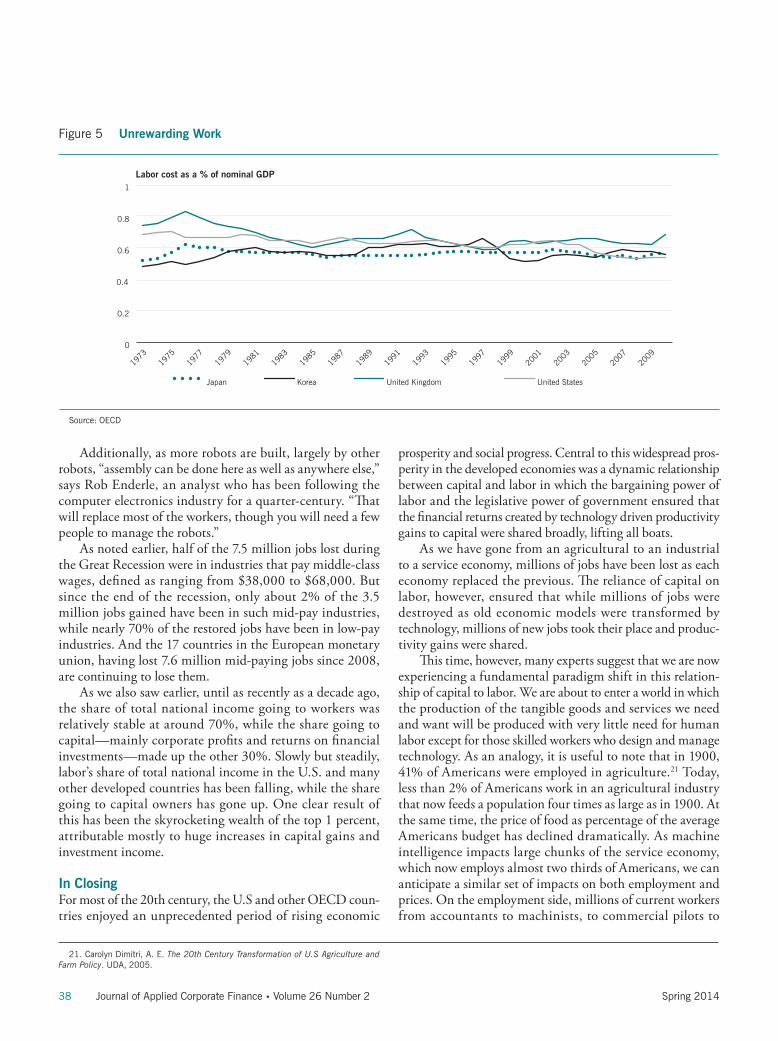
As we also saw earlier, until as recently as a decade ago, the share of total national income going to workers was relatively stable at around 70%, while the share going to capital—mainly corporate profits and returns on financial investments—made up the other 30%. Slowly but steadily, labor’s share of total national income in the U.S. and many other developed countries has been falling, while the share going to capital owners has gone up. One clear result of this has been the skyrocketing wealth of the top 1 percent, attributable mostly to huge increases in capital gains and investment income.
In ClosingFor most of the 20th century, the U.S and other OECD coun-tries enjoyed an unprecedented period of rising economic
Figure 5 Unrewarding Work
Source: OECD
0
0.2
0.4
0.6
0.8
1
1973
1975
1977
1979
1981
1983
1985
1987
1989
1991
1993
1995
1997
1999
2001
2003
2005
2007
2009
Labor cost as a % of nominal GDP
Japan Korea United Kingdom United States
39Journal of Applied Corporate Finance • Volume 26 Number 2 Spring 2014
22. The Economist. The Future of Jobs—The onrushing wave. The Economist, Janu-ary 18, 2014.
Our current trajectory is taking us rapidly into a world in which a relatively few highly trained professionals and a “creative” class working with machine intelligence and those with capital will do very well, while the rest of the workforce (if they can find employment) will be employed in low wage service industries providing human services that machines cannot. If we continue to go down this path, we will in fact confirm Piketty’s hypothesis that we are returning to an historical norm in which high-income inequality is accom-panied by (and even encourages) low economic growth.
To avoid this fate will require bold thinking and a new social contract in which all sectors, from public to private to nonprofit, work together to drive the transformations in education and human services that are needed to address the challenges we are now facing. At the very least, we will need a new model for thinking about the way we distribute income in society to ensure that high levels of income inequality do not stifle economic growth as middle class incomes and employment decline, and deflation becomes an increasing economic threat.
Chris Pinney is President of the High Meadows Institute, a nonprofit
policy institute that is working to understand the role for business lead-
ership in the creation of a 21st century social contract that can sustain
economic and social progress for all.
teachers, will find themselves unemployed. At the same time, however, we can expect the cost of most tangible goods to continue to decline. Indeed, that is perhaps the greatest social benefit of continuous innovation: the continued dramatic decline in the relative cost of “hard goods” and services.
From this perspective, then, this transformation can be seen as a great step forward for humanity. Workers will be freed from the drudgery of performing dangerous or boring jobs, allowing them to pursue or create more personally rewarding forms of work while the relative cost of many essen-tial goods become cheaper. A recent article in The Economist about the rising machine intelligence age suggests that the future of work will revolve around emotional and relational jobs with workers employed in “emotive occupations yet unsuited to machines: a world of artists and therapists, love counsellors and yoga instructors.”22
The challenge, of course, is that our current workforce is neither trained and may not arguably be interested or suited for these kinds of occupations. Equally importantly, this shift will require a fundamental rethinking of what we consider meaningful work and coming to terms with the fact that full employment as the primary mechanism for the distribution of income in society may no longer be a valid public policy goal and that other forms for distributing income now need to be considered. As noted earlier, labor force participation in the U.S. has already fallen to 62% and is projected to fall further.

ADVISORY BOARD
Journal of Applied Corporate Finance (ISSN 1078-1196 [print], ISSN 1745-6622 [online]) is published quarterly, on behalf of Cantillon and Mann, by Wiley Subscrip-tion Services, Inc., a Wiley Company, 111 River St., Hoboken, NJ 07030-5774. Postmaster: Send all address changes to JOURNAL OF APPLIED CORPORATE FINANCE Journal Customer Services, John Wiley & Sons Inc., 350 Main St., Mal-den, MA 02148-5020.
Information for Subscribers: Journal of Applied Corporate Finance is published in four issues per year. Institutional subscription prices for 2013 are: Print & Online: US$548 (US), US$655 (Rest of World), €424 (Europe), £338 (UK). Commercial subscription prices for 2013 are: Print & Online: US$647 (US), US$772 (Rest of World), €500 (Europe), £394 (UK). Individual subscription prices for 2013 are: Print & Online: US$113 (US), £63 (Rest of World), €94 (Europe), £63 (UK). Student subscription prices for 2013 are: Print & Online: US$39 (US), £22 (Rest of World), €33 (Europe), £22 (UK).
Prices are exclusive of tax. Asia-Pacific GST, Canadian GST and European VAT will be applied at the appropriate rates. For more information on current tax rates, please go to www.wileyonlinelibrary.com/tax-vat. The price includes online ac-cess to the current and all online back files to January 1st 2009, where available. For other pricing options, including access information and terms and conditions, please visit www.wileyonlinelibrary.com/access.
Journal Customer Services: For ordering information, claims and any inquiry con-cerning your journal subscription please go to www.wileycustomerhelp.com/ask or contact your nearest office.Americas: Email: [email protected]; Tel: +1 781 388 8598 or +1 800 835 6770 (toll free in the USA & Canada).Europe, Middle East and Africa: Email: [email protected]; Tel: +44 (0) 1865 778315.Asia Pacific: Email: [email protected]; Tel: +65 6511 8000.Japan: For Japanese speaking support, Email: [email protected]; Tel: +65 6511 8010 or Tel (toll-free): 005 316 50 480.Visit our Online Customer Get-Help available in 6 languages at www.wileycustomerhelp.com
Production Editor: Joshua Gannon (email:[email protected]). Delivery Terms and Legal Title Where the subscription price includes print issues and delivery is to the recipient’s address, delivery terms are Delivered at Place (DAP); the recipient is responsible for paying any import duty or taxes. Title to all issues transfers FOB our shipping point, freight prepaid. We will endeavour to fulfil claims for missing or damaged copies within six months of publication, within our reasonable discretion and subject to availability.
Back Issues: Single issues from current and recent volumes are available at the current single issue price from [email protected]. Earlier issues may be obtained from Periodicals Service Company, 11 Main Street, Germantown, NY 12526, USA. Tel: +1 518 537 4700, Fax: +1 518 537 5899, Email: [email protected]
This journal is available online at Wiley Online Library. Visit www.wileyonlineli-brary.com to search the articles and register for table of contents e-mail alerts.
Access to this journal is available free online within institutions in the developing world through the AGORA initiative with the FAO, the HINARI initiative with the WHO and the OARE initiative with UNEP. For information, visit www.aginternet-work.org, www.healthinternetwork.org, www.healthinternetwork.org, www.oare-science.org, www.oarescience.org
Wiley’s Corporate Citizenship initiative seeks to address the environmental, social, economic, and ethical challenges faced in our business and which are important to our diverse stakeholder groups. We have made a long-term commitment to stan-dardize and improve our efforts around the world to reduce our carbon footprint. Follow our progress at www.wiley.com/go/citizenship
Abstracting and Indexing ServicesThe Journal is indexed by Accounting and Tax Index, Emerald Management Reviews (Online Edition), Environmental Science and Pollution Management, Risk Abstracts (Online Edition), and Banking Information Index.
Disclaimer: The Publisher, Cantillon and Mann, its affiliates, and the Editor cannot be held responsible for errors or any consequences arising from the use of information contained in this journal. The views and opinions expressed in this journal do not necessarily represent those of the Publisher, Cantillon and Mann, its affiliates, and Editor, neither does the publication of advertisements constitute any endorsement by the Publisher, Cantillon and Mann, its affiliates, and Editor of the products advertised. No person should purchase or sell any security or asset in reli-ance on any information in this journal.
Copyright © 2014 Cantillon and Mann. All rights reserved. No part of this pub-lication may be reproduced, stored or transmitted in any form or by any means without the prior permission in writing from the copyright holder. Authorization to photocopy items for internal and personal use is granted by the copyright holder for libraries and other users registered with their local Reproduction Rights Organi-zation (RRO), e.g. Copyright Clearance Center (CCC), 222 Rosewood Drive, Dan-vers, MA 01923, USA (www.copyright.com), provided the appropriate fee is paid directly to the RRO. This consent does not extend to other kinds of copying such as copying for general distribution, for advertising or promotional purposes, for creating new collective works or for resale. Special requests should be addressed to: [email protected].
Yakov AmihudNew York University
Mary BarthStanford University
Amar BhidéTufts University
Michael BradleyDuke University
Richard BrealeyLondon Business School
Michael BrennanUniversity of California, Los Angeles
Robert BrunerUniversity of Virginia
Christopher CulpUniversity of Chicago
Howard DaviesInstitut d’Études Politiques de Paris
Robert EcclesHarvard Business School
Carl Ferenbach Berkshire Partners
Kenneth FrenchDartmouth College
Stuart L. GillanUniversity of Georgia
Richard GrecoFilangieri Capital Partners
Trevor HarrisColumbia University
Glenn HubbardColumbia University
Michael JensenHarvard University
Steven KaplanUniversity of Chicago
David LarckerStanford University
Martin LeibowitzMorgan Stanley
Donald LessardMassachusetts Institute of Technology
Robert MertonMassachusetts Institute of Technology
Stewart MyersMassachusetts Institute of Technology
Richard RubackHarvard Business School
G. William SchwertUniversity of Rochester
Alan ShapiroUniversity of Southern California
Clifford Smith, Jr.University of Rochester
Charles SmithsonRutter Associates
Joel M. SternStern Value Management
G. Bennett StewartEVA Dimensions
René StulzThe Ohio State University
Alex TriantisUniversity of Maryland
Laura D’Andrea TysonUniversity of California, Berkeley
Ross WattsMassachusetts Institute of Technology
Jerold ZimmermanUniversity of Rochester
Editor-in-ChiefDonald H. Chew, Jr.
Associate EditorJohn L. McCormack
Design and ProductionMary McBride
EDITORIAL