Formalizing Informality: The Praedial Registration System in ...
Upload
khangminh22Category
view
1download
0
Dualism, Informality and Social Inequality An Informal Economy Perspective of the Challenge of
Inclusive Development in India
Presidential Address delivered on 13 December 2008 by
K. P. Kannan Member
National Commission for Enterprises in the Unorganised Sector New Delhi
At the
50th Annual Conference (Golden Jubilee) of The Indian Society of Labour Economics
December 13-15 , Lucknow
Organised by Giri Institute of Development Studies
In association with Lucknow University and Indian Institute of Management,
Lucknow

2
Dualism, Informality and Social Inequality An Informal Economy Perspective of the Challenge of
Inclusive Development in India
K.P. Kannan
At the outset, let me say how grateful I am to the Indian Society of Labour Economics for
conferring on me the honour of being the President of its Golden Jubilee Conference being held
here in Lucknow – the place where it was born. On this occasion, I would like to join you all in
remembering the founders of the Society led by an erstwhile trade union leader, Shri V.V. Giri,
who later became the President of India. The team, as you all know, included such scholars of
public standing as Radha Kamal Mukherjee, Gyan Chand, C.N. Vakil, V.B. Singh, P.S.
Lokanathan and G.P. Sinha. The eminence, erudition and public standing of the long list of my
predecessors, a number of whom were also my teachers, make me humble on this occasion when
the Society is celebrating the completion of its half-a-century of existence and functioning. I
have chosen for my address today a theme with which I have been closely associated for the past
four years and which, I believe, has opened up a whole range of issues reminding the country of
its backlog of underdevelopment and poverty.
India’s high and sustained rate of growth of over six percent per annum over the last
quarter century has understandably attracted the attention of the world and certainly raised its
profile from one of widespread poverty and underdevelopment to that of an emerging market
driving, along with China, world economic growth. This has created a sense of euphoria within
India that is often so embarrassingly palpable in sections of the Indian media. For a brief period
it was a ‘Shining India’ all over. That this ‘shining India’ hides a massive underbelly of suffering
India became obvious only when the overwhelming majority of the poor and vulnerable people,
the Aam Aadmi, rejected that notion through their electoral vote of no confidence.
The Common Minimum Programme that was offered as an alternative to the euphoria of
a shining India followed by a five year plan with ‘inclusive growth’ as its overarching objective
seemed to provide a ray of hope to the vast majority of labouring poor for a better life. However
the adoption of ‘inclusive growth’1 instead of ‘inclusive development’ seems to convey a
continuation of the faith in the ‘trickle down’ theory of growth as opposed to a strategy of
development that would not only bring about economic transformation but also enhance the
conditions of work as well as human capabilities for a dignified and qualitatively better life. This
could best be summed up as an agenda for human development.

3
What I want to argue here is that India has no option but to follow a human development
centred approach to economic and social development given the massive nature of poverty and
underdevelopment that are reflected in the conditions of work of those who eke out a living in
what may be called the informal economy. An informal economy perspective, as articulated by
the National Commission for Enterprises in the Unorganised Sector (NCEUS for short), a body
that was constituted by the government to study the problems (and to recommend solutions) being
faced by India’s vast informal economy, provides a framework, in my opinion, for such an
approach, because it can capture almost all dimensions of underdevelopment. This is a
perspective that addresses the challenge of development from the point of view of work and
livelihood and through that an understanding of human capabilities and their social correlates
such as gender and social identity. The problem of labour here is not reduced to ‘man-hours’ or
‘man-days’ and its productivity, but to one of actually living people with specific economic,
social and gender characteristics often trapped in a larger social structure that, despite many
changes, remains largely hierarchical and segmented.
The challenge of development in the post-colonial poor countries was sought to be
addressed by development planning. The analytical concept of dualism, as formulated by Arthur
Lewis (1954), proved to be a powerful one that held sway in development literature. It was also a
stylised way to reduce the complexities of an underdeveloped economy into a dual sector system
consisting of agriculture and industry or traditional and modern. Basically it divided the
economy into a subsistence sector and a surplus generating sector. The main focus, by
definition, was on low labour productivity in the subsistence sector. It was posited that a process
of development entails the expansion of the high productivity sector absorbing more and more
labour from the subsistence sector, i.e., from agriculture.
While this concept of dualism implied inequality, the focus was on the sectoral
characteristics and only indirectly between people working and depending on it. The arrival of
the notion of informal employment did indeed help to focus on the characteristics of the people in
the subsistence sector but in the process it also went beyond the sectoral notion of dualism, which
we shall discuss later. But the expectation of a continuously expanding surplus generating sector,
often associated with industry, receded considerably.

4
Neoliberalism’s denial of dualism and development economics
The raison d’etre of development economics, it seems to me, is the concept of dualism and the
need to engineer development by expanding the surplus generating sector often associated with
industry. This also gave rise to the legitimation of planning for development in developing
economies especially those with a mixed one like that of India. Various models of dualism
helped to chalk out the planning process through active intervention of the state in investment in
infrastructure as well as in industry and services. It also sought to generate savings for
investment through fiscal means. Investment by private sector often complimented the public
sector investment that was largely in physical and social infrastructure and in capital goods
industry. One of the instruments for financing development in general and investment in
particular was through the monetisation of deficits that was viewed as a policy variable and not as
a self-imposed binding constraint as in the latter day neoliberal regime. India was indeed a
typical case in this type of mixed economy.
The Keynesian paradigm lent legitimacy to such state interventions. It was, in a manner
of speaking, developmental Keynesianism in a capitalist alternative emulation of certain socialist
virtues. State also acquired some legitimacy reinforced by the euphoria of political liberation
from colonialism.
In the Indian situation, despite many shortcomings, significant achievements were made
especially in economic infrastructure, access to schooling, health care as well as in the expansion
of higher education and a public sector industry that complemented each other. The gradual
expansion of a rent-seeking culture, bureaucratization and micro management of public sector
enterprises and consequent inefficiencies prevented to a large extent the full realisation of the
developmental potential. But a bigger problem was the external environment. The fall of the
Soviet bloc, the success of the export-led model of growth in a few countries especially in Asia,
and the sustained political onslaught in discrediting the Keynesian macro economic management
in Europe on the plank of a TINA (there is no alternative) assertion prepared the external context
for the emergence of neo-liberalism. The oil price hike, the Viet Nam war, and the delinking of
the dollar from gold paved the way for the death of the Bretton Woods agreement in international
financial system. The final onslaught came from the political victories of neoliberalism
personified by Margaret Thatcher in UK and Ronald Reagan in USA that effectively put an end to
the Keynesian legacies in both capitalist and developing countries.

5
The arguments for downsizing the state, especially its withdrawal from public
investment, reduced the role for fiscal policies and led to an argument for market-led economic
growth. Of direct consequence to the dualism and its concomitant policy of planning for
development was undermined by the advocacy of factor market flexibility that ignored the social
and other structural rigidities in such markets. In the case of capital it was freedom for cross
border movements and in the case of labour it was dismantling of labour legislations that were
seen as hindrances to labour market flexibility. Such an agenda was enforced by a variety of
means but most importantly through the control of IMF and World Bank by the US and its allies.
This was made possible by conditionalities imposed upon developing countries when they sought
financial assistance for meeting balance of payments crisis and/or development assistance.
Structural Adjustment Programme became a byword for liberalisation. This led to a process
summed up by the term globalisation but the same logic was applied within a country across
economic sectors and activities. Although India was forced to seek financial assistance from the
IMF only for a brief period in the early 1990s, the spirit of Washington Consensus has been in
force, with some adjustments to accommodate political exigencies, in its pursuit of neoliberal
economic policies since then.
In such a scenario the original conceptualisation of dualism in developing countries got
undermined. Market forces would determine where it is profitable to invest and labour could
move freely according to such investments, or so it was argued. The argument of labour market
flexibility implicitly meant that there is no need to distinguish labour as between subsistence and
surplus generating sectors. This meant that there is no need for ‘protecting’ labour in the formal
(surplus) sector and the labour market would equalise conditions in the formal and informal
sectors. This is the theoretical argument and message of those advocating labour market
flexibility. In this process the role of trade unions was also questioned for protecting the interests
of a small segment of the workforce. In a queer way, the advocates of labour market flexibility
accused the formal sector workers and their organisations for creating barriers to entry of the
informal sector workers. And hence the vehement argument, repeated ad nauseam, for
dismantling of the legal protection to the formal workers without regard to the insecurity that
would follow. In India this has taken the form of a single issue, i.e., eliminating a clause in
Chapter VB in the Industrial Disputes Act that mandates enterprises above a certain size of
employment (100 or more) to seek prior government approval for retrenchment as well as laying
down a certain procedure for such retrenchment. It is well known in this country that this is a
proxy argument for unfettered hiring and firing of workers. The near zero employment elasticity
6
in the formal (organised) manufacturing sector for the past two decades or more has been blamed
on this single ‘constraint’ to labour market flexibility disregarding the more substantive issues
such as changes in the composition of output to cater to high income markets, the pace of labour
saving technological change, and dependence on exports2.
Despite wishing away dualism, the fact of dualism continues, but we would argue below
that it could be captured more meaningfully in terms of formality and informality especially in
the Indian context as we discuss below. This is for two reasons. One is that the pervasive
presence of a subsistence sector in terms of a rural agrarian economy has transformed into a mix
of agriculture, rural industries as well as the emergence of an urban underclass catering to a
whole range of industrial and service requirements at the bottom of the economy. Second, with
the ascendancy of neoliberal policies and resultant globalisation, a new class of informal workers
in the formal sector has come to stay. The result is a process of a kind of structural
transformation with a pervasive presence of an informal economy across economic sectors and in
rural and urban areas.
Informality
While the concept of informality certainly carries the idea of dualism in an economy, it has been
an evolutionary one since it was first used by the ILO. It has undergone different connotations
ranging from such economic activities as that of family-operated tiny enterprises in the urban
economy, unregistered, illegal, and so on. From the point of the developmental process, the
urban informal economy was posited as a ‘waiting shed’ before entry into the formal sector a la
Harris and Todaro (1970). Despite its overwhelming presence in developing countries,
emergence and expansion in transition economies as well as in developed economies, there are
still doubts as to the usefulness of this as an analytical concept3.
But the reality of informality is too obvious to be ignored. It also challenged the primacy
of macroeconomic policies focusing on the relatively small formal economy, brought into the fore
the plight of a large ‘enterprising’ but ‘labouring’ segment of the workforce in addition to the
absence of any legal/social protection to the enterprises qua enterprises or workers qua workers.
The ILO has come to recognise it and has been primarily responsible for initiating studies on
measurement, characteristics and its working and set in motion a discourse on policies and
programmes for what it calls ‘decent work deficit “along the entire continuum from the informal
to the formal end of the economy, and in development-oriented, poverty reduction-focused and

7
gender-equitable ways” (ILO 2002:4)4. It is a sign of the imperative of coming to grips with the
reality of the world of work as distinct from a normative objective for setting standards for labour
and employment in the formal sector.
International attempts to give an operationally meaningful definition have now come a
long way. First the expansion was from self employment to include unprotected work such as
casual work; then from urban to rural; and finally from non-farm to all forms of work. Here the
concept is one of sector, i.e., informal sector. Then the realization has appeared that unprotected
work has started appearing in the formal sector itself. Hence the need to go beyond a sectoral
conceptualisation of informality. This has resulted in the identification of informal workers in the
formal sector as part of the informal economy.
The NCEUS has defined informality in the Indian economy in two dimensions. One,
consisting of enterprises5 and the other consisting of workers. The definition of informal sector
gives pre-eminence to its organisational and institutional characteristics of the economic units.
The core characteristic is one of vulnerability arising from the absence of any form of
institutional protection either. Thus the definition recommended by NCEUS is:
“The informal sector consists of all unincorporated private enterprises owned by individuals or households engaged in the same and production of goods and services operated on a proprietary or partnership basis and with less than ten workers.” (NCEUS 2008b: Ch.2)
This means these units have no legal personality as distinct from that of the owner or
owners highlighting the absence of any institutional protection to such units. And this means that
the risks are solely on the owner in his/her individual capacity. This underlines the inherent
vulnerability of these units to any kind of shocks. The additional dimension here is that of
employment size. Such a size has been in vogue in the case of manufacturing but this has been
extended to all economic units irrespective of the economic sector. As such the informal sector
consists of unprotected small units.
The informal economy concept, as distinct from informal sector, is wider in which the
sector is subsumed. Here the focus is on the vulnerable status of the workers. These are workers
without employment or social security that comes to them by virtue of their employment in the
given enterprise. This includes workers in the informal sector as well as those in the formal
sector. The NCEUS definition has therefore formulated its definition as follows:

8
“Unorganized/informal workers consist of those working in the informal sector or households, excluding regular workers with social security benefits provided by the employers and the workers in the formal sector without any employment and social security benefits provided by the employers.” (NCEUS 2008b: Ch.2)
Table 1: Enterprises in the Informal and Formal Sectors in the Indian economy: An illustration based on Economic Census of
2005
‘Enterprises’ Informal
Sector
Formal
Sector
Total
economy
Total Non-farm (million) 37.25 4.58 41.83
Total Non-farm (%) 89.05 10.95 100.00
Note: Total non-farm enterprises include 5.87 million units in agriculture in the informal sector and 0.21 million units in the formal sector which are largely, if not only, small and big plantations. Source: Computed from the Economic Census of 2005 conducted by the Central Statistical Organisation.
Table 2: Percentage distribution of workers in the informal economy and formal economy at three different levels, 2004-05
Informal employment Formal employment Total Level 1(Urban Non-Agriculture)
Informal Sector 84.4 (98.6) 4.1 (1.4) 67.6 (100) Formal Sector 13.6 (38.1) 95.9 (61.9) 32.4 (100) Total 100 (78.9) 100 (21.1) 100 (100)
Level 2 (Total Non-Agriculture) Informal Sector 84.5 (99.0) 95.6 (1.0) 71.6 (100) Formal Sector 15.5 (45.8) 4.4 (54.2) 38.4 (100) Total 100 (83.9) 100 (16.1) 100 (100)
Level 3 (Total economy incl.agriculture) Informal Sector 93.1 (99.6) 95.7 (0.4) 86.3 (100) Formal Sector 6.9 (46.5) 4.3 (53.5) 13.7 (100) Total 100 (92.3) 100 (7.7) 100 (100) Note: Figures without brackets refer to column total (sector concept) and figures within brackets refer to row total (employment concept). Source: Computed from data from NSS 61st Round.
The focus on workers in the earlier dualistic concept is on low productivity or zero
marginal productivity which gives rise to the notion of surplus labour. Why such modes of
production continue has been debated and economists have pointed out that households in the
9
subsistence sector maximise average productivity and not marginal productivity. It is indeed
driven by livelihood and the need to maintain all working members engaged. The informal
worker concept on the other hand emphasises his/her vulnerability and as such it is also focused
on livelihood but in the tradition of understanding his state of poverty/deprivation and absence of
security. There the human dimension, as distinct from a focus on low labour productivity
dimension, is more prominent. I would therefore argue that the informality of workers is closer to
the tradition and concern of human development in general and human development driven
economic growth in particular. Given the very low level of human capabilities reinforced by
conditions of income poverty and a whole range of human deprivation, the task here is immense
but one that has to be faced if the challenge is one of inclusive development and not maximisation
of aggregate growth per se. An illustrative picture of the dimensions of the challenge in terms of
the size and a few other selected characteristics of the informal economy can be seen from Tables
1 to 3.
The dynamics of development in the dualistic paradigm is one of transition. Given the
experience of the last four decades, if not more, the concern with the informal/formal dichotomy
is with the persistence of the informal sector and then the increase in the informal economy
arising out of informality of work in the formal sector. This question is a critical one in the
Indian context despite the impressive growth performance of the economy and the transformation
of the formal sector into a modern segment capable of withstanding competition in a globalising
world. In the place of the expected transition or movement of workers from the subsistence sector
to the surplus sector (industrial/urban) the transition has been a horizontal one whereby workers
are pushed to move out of the rural (largely informal) economy to the urban informal economy. It
is indeed a matter of serious concern from a long term development point of view that the formal
manufacturing sector has hardly contributed to any perceptible increase in employment, despite
an impressive annual growth rate of around 7 percent for nearly a quarter of a century (see, e.g.
Kannan and Raveendran 2008). As such the informal sector is now a feature of all the three
major sectors of the economy viz., agriculture, industry and services both in rural and urban areas
in varying degrees and traverses these sectors depending on season and want. Such workers are
often at the bottom of the social hierarchy and their plight has been provocatively, yet
graphically, presented in a sociological frame of analysis by scholars such as Jan Breman as one
10
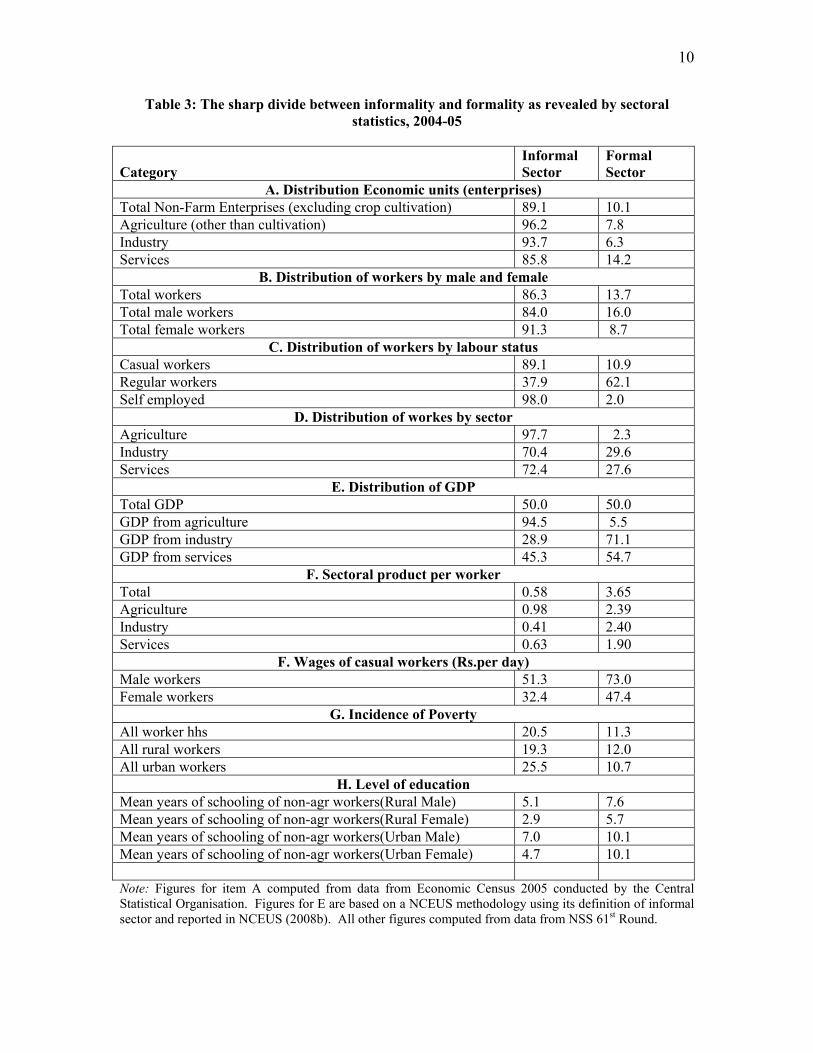
Table 3: The sharp divide between informality and formality as revealed by sectoral statistics, 2004-05
Category
Informal Sector
Formal Sector
A. Distribution Economic units (enterprises) Total Non-Farm Enterprises (excluding crop cultivation) 89.1 10.1 Agriculture (other than cultivation) 96.2 7.8 Industry 93.7 6.3 Services 85.8 14.2
B. Distribution of workers by male and female Total workers 86.3 13.7 Total male workers 84.0 16.0 Total female workers 91.3 8.7
C. Distribution of workers by labour status Casual workers 89.1 10.9 Regular workers 37.9 62.1 Self employed 98.0 2.0
D. Distribution of workes by sector Agriculture 97.7 2.3 Industry 70.4 29.6 Services 72.4 27.6
E. Distribution of GDP Total GDP 50.0 50.0 GDP from agriculture 94.5 5.5 GDP from industry 28.9 71.1 GDP from services 45.3 54.7
F. Sectoral product per worker Total 0.58 3.65 Agriculture 0.98 2.39 Industry 0.41 2.40 Services 0.63 1.90
F. Wages of casual workers (Rs.per day) Male workers 51.3 73.0 Female workers 32.4 47.4
G. Incidence of Poverty All worker hhs 20.5 11.3 All rural workers 19.3 12.0 All urban workers 25.5 10.7
H. Level of education Mean years of schooling of non-agr workers(Rural Male) 5.1 7.6 Mean years of schooling of non-agr workers(Rural Female) 2.9 5.7 Mean years of schooling of non-agr workers(Urban Male) 7.0 10.1 Mean years of schooling of non-agr workers(Urban Female) 4.7 10.1 Note: Figures for item A computed from data from Economic Census 2005 conducted by the Central Statistical Organisation. Figures for E are based on a NCEUS methodology using its definition of informal sector and reported in NCEUS (2008b). All other figures computed from data from NSS 61st Round.
11
of ‘wage hunters and gatherers’, ‘footloose labour’ or ‘crushing of cane and of labour’ (Breman
1985, 1994 and 1996). Despite many studies by sociologists and social anthropologists,
evaluating the informal workers and their livelihood struggles, macro level analysis of socio-
economic correlates and inequality has not been their main interest. Economists have largely, but
not exclusively, been concerned with inequality other than social identity.
Therefore the important differences between the earlier and current dualism that seem to
be relevant to an understanding of the challenge of development in India and countries like India
are:
a) The concept of informality focuses on small scale economic units that have no legal
protection in their own right. Therefore the emphasis is on the absence of institutional
protection and hence their vulnerability. The low productivity characteristic is more of a
revealed fact than a starting point. The livelihood nature of the activities focuses
attention on all types of economic activities and not on a particular sector. A sectoral
view of agriculture (subsistence) being low productivity conceals the existence of
‘efficient’ large farms and estates just as much as a surplus generating industrial sector
conceals a significant segment of small and vulnerable economic units with low
productivity.
b) By focusing on workers in addition to economic units of production, attention is drawn to
the vulnerable status of workers arising out of absence of any institutional protection of
employment or availability of social security associated with such employment. This
highlights the need to investigate the endowments of these workers and their dependents,
both inherited (social identity, gender, property) as well as acquired (such as education
and skill).
One may argue that the reality is one of continuum from most vulnerable to the least
vulnerable. By extension the conept of formality and informality could also been viewed in the
framework of a continuum in a long chain of exploitation within the modern capitalist production
system regardless of spatial location or economic sector, as has been argued by some scholars
(e.g. Breman 1976 or 2008, 1985, and 2003). However, for purposes of analytical convenience,
some stylisation and aggregation is called for. It would appear the absence of a legal personality
to economic units, smallness of operations and absence of protection to workers help to separate
12
all those in the category of informality that provides a meaningful dichotomy between those
unprotected-cum-vulnerable and protected-cum-less vulnerable. In the Indian context, the fact
that an overwhelming proportion of economic units as well as workers belong to the informal
sector and informal economy respectively underscores the massive nature and magnitude of the
problem of underdevelopment in an otherwise growing economy at an historically unprecedented
rate. From a developmental point of view, such a dichotomy reveals the seriousness of the
duality in both economy and society although there are gradations within the two economies that
reveal a pattern consistent with this dichotomy.
An examination of the economic and social characteristics of workers in the informal
economy (as represented by informal sector workers) reveals a systematic pattern of
underdevelopment of large segments of economic sectors and of people working and living under
appalling conditions of poverty and vulnerability. These have already been analysed and
documented along with an analysis of crucial issues for the Indian economy as a whole (NCEUS
2007a and Sengupta, et.al. 2008). Given the size of the country and population, not to speak of
the regional variations, there is considerable scope for extending the research to individual states
and economic activities and their comparison.
What then is the objective from the point of inclusive development? Is it one of including
the informal economy within a framework of inclusive growth? To give it some special attention
and let this large segment cater to the needs of a small segment (formal economy) and its process
of accumulation at the cost of the former? Or, is it an objective of ‘transformation’ of the informal
economy so that a process of ‘levelling up’ can be initiated by ensuring conditions of work that
are considered fair and decent, guaranteeing opportunities for enhancing human capabilities and
access to enterprises for a variety of services to enhance productivity, thereby income and surplus
that will not only enhance their human development but also create a larger domestic market? If
it is the latter, this would then feedback into a virtuous cycle of growth and human development.
This may or may not entail transition to the formal economy. Most likely not, given the capital
intensive and technology driven growth in the formal sector, the overwhelming share of informal
workers in the economy, the absence of any meaningful opportunities for migration unlike the
historical experience of Western Europe, widespread deprivation and social discrimination as
well as exclusion, lack of access to infrastructure, basic social services and other resources. Thus
a meaningful agenda will have to be one of socio-economic transformation of the informal
workers and promotional support to the informal enterprises within a larger agenda as well as a

13
perspective of human development. Such an agenda will have to confront the existing social
inequalities, especially the one rooted in the social structure of Indian society.
Why social?
The Primacy of Social Inequality? Inequality has always been an area of concern and enquiry in social sciences. However
discussions on inequality in economics often revolve around income (or its proxy) through a Gini
ratio or similar measures. In discussions on development the notion of inequality has been
extended to regions and increasingly to gender and to indicators beyond income especially on
such dimensions of human development as education and health. If income is taken as a proxy
for class, then the dimensions often discussed are class, region and gender inequality. No one
will doubt the relevance of these dimensions in the Indian context and each of them
independently and jointly calls for focused attention if the agenda is one of inclusive
development. However, a relatively less researched area in economics, if not in some other social
science disciplines as sociology, is that of social inequality based on social identity. While social
structure that has a systematic relationship with social identity (such as caste and caste-like
groups) has been a concern of sociology it is, in my view, insufficiently linked, let alone weaved,
into the domain of the economic correlates so as to delineate the interface between economic and
social dimensions of development that has a special appeal in the Indian context6. However, the
process of democratic politics in the country has been consistently pushing and pulling this
agenda in varying degrees in different points in time. Social movements since the middle of the
nineteenth century have been the main inspirational source at the core of this agenda of social
assertion for equality for a long time. This assertion was given formal recognition when
independent India gave itself a constitution in 1950 in the form of special treatment (in the form
of affirmative action) for people who were hitherto considered either ‘untouchable’ or excluded
from the mainstream, i.e., those classified as Scheduled Castes and Scheduled Tribes.
Subsequently, political mobilisations of those belonging to the intermediate segment of the Indian
social hierarchy, officially designated as Other Backward Castes (OBC), led to certain affirmative
action in public service employment and higher education throughout the country. Such a system
was already in vogue in some States, especially in the south, for quite sometime. In such States
certain segments of Muslims were also considered as part of the OBC group or its equivalent.
With the appointment of a High Level Group and publication of a report on Muslim population
(popularly known as the Sachar Committee), the condition of the majority of the Muslim

14
population was also highlighted in the public domain. But our main focus here is not to seek a
rationale for affirmative action but to point out to the macro evidence on the overwhelming nature
of social inequality arising out of the Indian social structure even on the basic human capabilities
needed for a life of dignity without poverty.
The increasing social and political assertion of the absolutely and relatively
disadvantaged social groups underlined the need to highlight the economic condition of the
people in a new light. It was this social dimension that was consciously factored in the Report on
Conditions of Work and Promotion of Livelihoods prepared by the National Commission on
Enterprises in the Unorganised Sector (NCEUS 2007a).
The various reports of the NCEUS (2006, 2007a and b and 2008), and subsequent work
arising out of it, point to the fact that the entire Indian economy is fundamentally divided between
a formal i.e., protected and less vulnerable segment and an informal i.e., unprotected and more
vulnerable one. The vast informal economy indeed emerges as the unprotected and vulnerable
segment, both in the legal and social sense. In fact, it would not be an exaggeration to
characterise the Indian economy as one with a large number of small economic units. While half
the income is generated within this informal economy, an overwhelming proportion of workers -
92 percent - and their families are dependent on it for work and livelihood sustenance. This gives
one dimension of the inequality as between formal and informal economies.
Underlying this overall inequality is what may be called the entrenched social inequality
arising out of the hierarchical social structure of the Indian society. Some sociologists have
argued that the Indian social structure is characterised by both hierarchy and difference (e.g.
Gupta 2003: 502-531). While I would not be able to question such a formulation, I believe that
the notion of hierarchy is the dominant and the most relevant one to the issue of inequality.
However some aggregation of the myriad of social groups is called for to make some ‘order out
of this chaos’ especially if one is interested, as I am, to understand the macro level picture of
social inequality. So I would follow a broad classification that places one group (SC/ST) at the
bottom of the social pyramid, another group at the top (called ‘Others’ including upper caste
Hindus, Sikhs, Christians and other small religious groups), and those at the middle (OBC and
Muslims). The middle is given separately because one group belongs to a religion with the
second highest population share.
15
As discussed elsewhere in much detail (NCEUS 2007a) and summed up in Tables 4 and
5 those who are at the lower layers of social inequality are also the ones, as a group, who are
disproportionately represented in the informal economy and are poor and vulnerable. I wish to
elaborate this point by highlighting certain issues and dimensions.
One way of summing up the condition of existence of social groups is by examining their
state of poverty. Abstracting from the multiple dimensions of poverty, I would invite you to look
at the state of income (consumption) poverty in India as given in Table 4. The first thing that is
striking is the layering of poverty along social groups that reveals a pattern. Second, if one clubs
all the poor and vulnerable in one group and the better off (middle and high Income) in another
group, the same pattern is repeated. Third, the association with informal work status, which is of
special concern to us here, is also very close. Nearly 80 percent of India’s informal workers are
poor and vulnerable as against around 77 percent in the population. Elsewhere we have analysed
this in some detail wherein it has been shown that this pattern of social inequality is revealed even
within the class of poor and vulnerable differentiated by education, consumption and informal
work status. This led us to characterize the situation as one of ‘systemic and hierarchical
segmentation’ from a macro-social point of view. (see Sengupta, Kannan and Raveendran 2008).
Does Social Inequality overwhelm Regional Inequality?
My preliminary foray into the interface between social inequality and regional inequality suggests
that the former overwhelms the latter. This is something that has been missing in the
development literature in this country with some exceptions on the condition of the bottom group
(SC/ST) or when issues of affirmative action for the intermediate groups attract political
attention. Here let me start with the findings on income poverty followed by some ‘robust’ data
on other deprivational indicators that are now available through large scale national surveys.
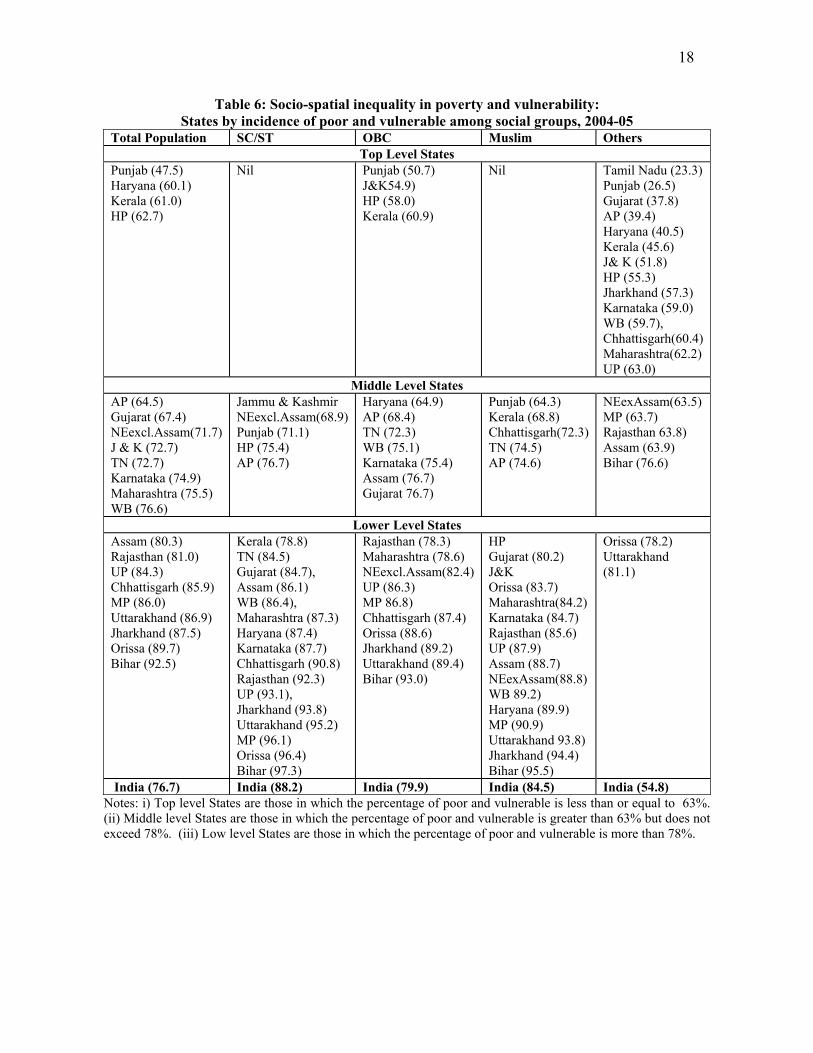
I feel that the findings of this exercise reported in Table 6 should be an eye-opener. This
we do by taking the poor and vulnerable population in the country as a group whose maximum
consumption expenditure does not exceed twice the officially determined poverty line. The
classification is along a relative ranking of States into three groups. Top level States are those

16
Table 4: Percentage Distribution of Population and Informal Workers by Poverty Status and Social Groups
Poverty Status
Population
Informal workers Total SC/ST Muslim OBC Others
1. Extreme Poor 6.4 10.9 8.2 5.2 2.1 5.82. Poor 15.4 21.5 19.2 15.1 6.4 15.03. Marginal 19.0 22.4 22.3 20.4 11.1 19.64. Vulnerable 36.0 33.0 34.8 39.2 35.3 38.45. Middle Income 19.3 11.2 13.3 17.8 34.2 18.76. Higher Income 4.0 1.0 2.2 2.4 11.0 2.79. Poor & Vulnerable (7+8) 76.7 87.8 84.5 79.9 54.8 78.710. Middle & High Income (5+6) 23.3 12.2 15.5 20.2 45.2 21.311. All 100 .0 100.0 100.0 100.0 100.0 100.0Note: The official poverty line (PL) is the benchmark used for determined different poverty status. Extreme poverty means those below 0.75PL, Poor means 1PL, Marginal means between 1 and 1.25PL, Vulnerable means between 1.25 and 2PL, Middle Income means between 2 and 4Pl and High Income means above 4PL. For details see the Appendix in Sengupta, Kannan and Raveendran 2008. The data on consumer expenditure computed for determining poverty status are from the consumer expenditure schedule attached to the Employment and Unemployment Survey of NSS 61st Round. This a slightly abridged version of the detailed consumer expenditure survey conducted separately. The incidence of poor and vulnerable by using the detailed survey works out to 75.3 as against 76.7 by using the abridged schedule.
Table 5: Percentage distribution of informal workers by socio-religious within different poverty status (2004-05)
Poverty Status Socio religious Category SC/ST Muslim OBC Others Total
Shares of workers in each social group Poor & Vulnerable 88.5 84.7 80.1 58.8 78.7 Middle & High income 11.5 15.3 19.9 41.2 21.3 Total 100.0 100.0 100.0 100.0 100.0
Shares of social groups in total informal workers Poor & Vulnerable 34.3 11.3 38.7 15.6 100.0 Middle & High income 16.5 7.6 35.6 40.4 100.0 Total 30.5 10.5 38.1 20.9 100.0
whose incidence of poor and vulnerable does not exceed that of the State with the least incidence
plus one-third of the difference between the least and the most poor and vulnerable State; the
Middle Level includes those States whose incidence do not exceed that of the least poor and
vulnerable State plus two-thirds of the difference between the least and the most poor and
vulnerable State; and the Low Level includes the rest. When the whole population as well as the
four social groups in the selected 21 major States are classified according to their poverty and
17
vulnerability status, there is very little correspondence between the two. Four States which come
to the top level are conspicuous by their absence, along with others, when only SC/ST or Muslims
are considered. That is to say, there is no State in India where the incidence of poor and
vulnerable among all the population is the lowest and gets classified as Top Level showing the
same level for two social groups i.e. the one at the bottom (SC/ST) and one in the middle
(Muslims). On the other hand, for the socially advantaged group called ‘Others’ as high as 14
States occupy the top level position. For this group, regional location is less of a constraint, if not
irrelevant. Regional dimension is indeed instructive and important for policy making but if it is
blind to the deeply embedded social disadvantage, the results could be disappointing. On the
other hand, 16 out of 21 States are at the Low Level when it comes to the poverty and
vulnerability status of the bottom social group (SC/ST). The social disadvantage seems to be still
relevant as a summation of other disadvantages for a large segment of the three out of four broad
social groups presented here. For this bottom layer regional location is equally less important, if
not irrelevant.
Given the controversies over the adequacy of India’s official poverty line as a
representation of human deprivation7, its low level8 and the mismatch between consumer
expenditure norm and the calorie norm9 , there is indeed a case for a multidimensional measure of
poverty/human deprivation and its distribution across regions and social groups. However, the
absence of an agreed multidimensional measure should not blind us to manifest social inequality
such as revealed by Table 5. At the same time, we do have a more robust measure of poverty in
the form of Chronic Energy Deficiency (CED) which is considered a long term indicator of
malnutrition. This should dispel any doubt that might be there in using the income (consumption
expenditure) poverty for a given point in time that might conceal the transient nature of poverty
among some groups. These estimates, computed from the latest National Family and Health
Survey of 2005, are presented in Tables 6 and 7.
18
Table 6: Socio-spatial inequality in poverty and vulnerability: States by incidence of poor and vulnerable among social groups, 2004-05
Total Population SC/ST OBC Muslim Others Top Level States
Punjab (47.5) Haryana (60.1) Kerala (61.0) HP (62.7)
Nil Punjab (50.7) J&K54.9) HP (58.0) Kerala (60.9)
Nil Tamil Nadu (23.3) Punjab (26.5) Gujarat (37.8) AP (39.4) Haryana (40.5) Kerala (45.6) J& K (51.8) HP (55.3) Jharkhand (57.3) Karnataka (59.0) WB (59.7), Chhattisgarh(60.4) Maharashtra(62.2) UP (63.0)
Middle Level States AP (64.5) Gujarat (67.4) NEexcl.Assam(71.7) J & K (72.7) TN (72.7) Karnataka (74.9) Maharashtra (75.5) WB (76.6)
Jammu & Kashmir NEexcl.Assam(68.9) Punjab (71.1) HP (75.4) AP (76.7)
Haryana (64.9) AP (68.4) TN (72.3) WB (75.1) Karnataka (75.4) Assam (76.7) Gujarat 76.7)
Punjab (64.3) Kerala (68.8) Chhattisgarh(72.3) TN (74.5) AP (74.6)
NEexAssam(63.5) MP (63.7) Rajasthan 63.8) Assam (63.9) Bihar (76.6)
Lower Level StatesAssam (80.3) Rajasthan (81.0) UP (84.3) Chhattisgarh (85.9) MP (86.0) Uttarakhand (86.9) Jharkhand (87.5) Orissa (89.7) Bihar (92.5)
Kerala (78.8) TN (84.5) Gujarat (84.7), Assam (86.1) WB (86.4), Maharashtra (87.3) Haryana (87.4) Karnataka (87.7) Chhattisgarh (90.8) Rajasthan (92.3) UP (93.1), Jharkhand (93.8) Uttarakhand (95.2) MP (96.1) Orissa (96.4) Bihar (97.3)
Rajasthan (78.3) Maharashtra (78.6) NEexcl.Assam(82.4) UP (86.3) MP 86.8) Chhattisgarh (87.4) Orissa (88.6) Jharkhand (89.2) Uttarakhand (89.4) Bihar (93.0)
HP Gujarat (80.2) J&K Orissa (83.7) Maharashtra(84.2) Karnataka (84.7) Rajasthan (85.6) UP (87.9) Assam (88.7) NEexAssam(88.8) WB 89.2) Haryana (89.9) MP (90.9) Uttarakhand 93.8) Jharkhand (94.4) Bihar (95.5)
Orissa (78.2) Uttarakhand (81.1)
India (76.7) India (88.2) India (79.9) India (84.5) India (54.8) Notes: i) Top level States are those in which the percentage of poor and vulnerable is less than or equal to 63%. (ii) Middle level States are those in which the percentage of poor and vulnerable is greater than 63% but does not exceed 78%. (iii) Low level States are those in which the percentage of poor and vulnerable is more than 78%.
19
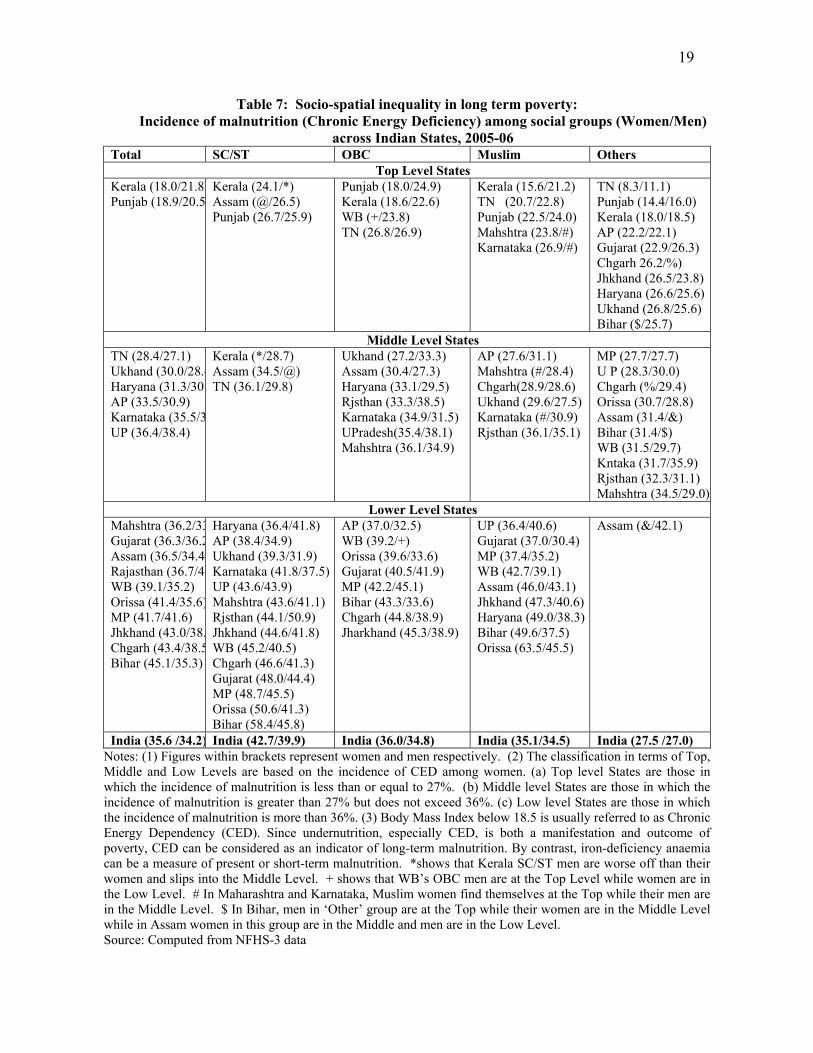
Table 7: Socio-spatial inequality in long term poverty: Incidence of malnutrition (Chronic Energy Deficiency) among social groups (Women/Men)
across Indian States, 2005-06 Total SC/ST OBC Muslim Others
Top Level States Kerala (18.0/21.8)Punjab (18.9/20.5
Kerala (24.1/*) Assam (@/26.5) Punjab (26.7/25.9)
Punjab (18.0/24.9) Kerala (18.6/22.6) WB (+/23.8) TN (26.8/26.9)
Kerala (15.6/21.2) TN (20.7/22.8) Punjab (22.5/24.0) Mahshtra (23.8/#) Karnataka (26.9/#)
TN (8.3/11.1) Punjab (14.4/16.0) Kerala (18.0/18.5) AP (22.2/22.1) Gujarat (22.9/26.3) Chgarh 26.2/%) Jhkhand (26.5/23.8) Haryana (26.6/25.6)Ukhand (26.8/25.6) Bihar ($/25.7)
Middle Level States TN (28.4/27.1) Ukhand (30.0/28.4Haryana (31.3/30.AP (33.5/30.9) Karnataka (35.5/3UP (36.4/38.4)
Kerala (*/28.7) Assam (34.5/@) TN (36.1/29.8)
Ukhand (27.2/33.3) Assam (30.4/27.3) Haryana (33.1/29.5) Rjsthan (33.3/38.5) Karnataka (34.9/31.5) UPradesh(35.4/38.1) Mahshtra (36.1/34.9)
AP (27.6/31.1) Mahshtra (#/28.4) Chgarh(28.9/28.6) Ukhand (29.6/27.5) Karnataka (#/30.9) Rjsthan (36.1/35.1)
MP (27.7/27.7) U P (28.3/30.0) Chgarh (%/29.4) Orissa (30.7/28.8) Assam (31.4/&) Bihar (31.4/$) WB (31.5/29.7) Kntaka (31.7/35.9) Rjsthan (32.3/31.1) Mahshtra (34.5/29.0)
Lower Level StatesMahshtra (36.2/33Gujarat (36.3/36.2Assam (36.5/34.4Rajasthan (36.7/4WB (39.1/35.2) Orissa (41.4/35.6)MP (41.7/41.6) Jhkhand (43.0/38.Chgarh (43.4/38.5Bihar (45.1/35.3)
Haryana (36.4/41.8) AP (38.4/34.9) Ukhand (39.3/31.9) Karnataka (41.8/37.5)UP (43.6/43.9) Mahshtra (43.6/41.1) Rjsthan (44.1/50.9) Jhkhand (44.6/41.8) WB (45.2/40.5) Chgarh (46.6/41.3) Gujarat (48.0/44.4) MP (48.7/45.5) Orissa (50.6/41.3) Bihar (58.4/45.8)
AP (37.0/32.5) WB (39.2/+) Orissa (39.6/33.6) Gujarat (40.5/41.9) MP (42.2/45.1) Bihar (43.3/33.6) Chgarh (44.8/38.9) Jharkhand (45.3/38.9)
UP (36.4/40.6) Gujarat (37.0/30.4) MP (37.4/35.2) WB (42.7/39.1) Assam (46.0/43.1) Jhkhand (47.3/40.6) Haryana (49.0/38.3) Bihar (49.6/37.5) Orissa (63.5/45.5)
Assam (&/42.1)
India (35.6 /34.2) India (42.7/39.9) India (36.0/34.8) India (35.1/34.5) India (27.5 /27.0) Notes: (1) Figures within brackets represent women and men respectively. (2) The classification in terms of Top, Middle and Low Levels are based on the incidence of CED among women. (a) Top level States are those in which the incidence of malnutrition is less than or equal to 27%. (b) Middle level States are those in which the incidence of malnutrition is greater than 27% but does not exceed 36%. (c) Low level States are those in which the incidence of malnutrition is more than 36%. (3) Body Mass Index below 18.5 is usually referred to as Chronic Energy Dependency (CED). Since undernutrition, especially CED, is both a manifestation and outcome of poverty, CED can be considered as an indicator of long-term malnutrition. By contrast, iron-deficiency anaemia can be a measure of present or short-term malnutrition. *shows that Kerala SC/ST men are worse off than their women and slips into the Middle Level. + shows that WB’s OBC men are at the Top Level while women are in the Low Level. # In Maharashtra and Karnataka, Muslim women find themselves at the Top while their men are in the Middle Level. $ In Bihar, men in ‘Other’ group are at the Top while their women are in the Middle Level while in Assam women in this group are in the Middle and men are in the Low Level. Source: Computed from NFHS-3 data
20
In addition, we have also examined two other ‘robust’ measures that could be considered
as proxies for human dignity and by implication human poverty with a deep psycho-social
meaning. These are poor quality of housing known as ‘katcha’ (denoting poor quality of
materials used) and the absence of toilet facility within the household (see Annexure 1 and 2).
The picture that emerges is the same as the above indicators with the middle groups interchanging
places.
Between income poverty and long term poverty (indicated by CED), the results moderate
the profile of socio-spatial inequality somewhat but the overall picture remains the same. The
number of Top level States reduces from four to two and they (Kerala and Punjab) remain at the
same position for all the four social groups. However this need not mean that they have reduced
inter-group inequality within the State, especially between the bottom group (SC/ST) and the top
group (Others) (see, for example, Kannan 2007). What is interesting in this ‘more robust’
measure is the relatively better performance of Muslims compared to the OBCs in five States.
But the striking feature of this measure is that the upper social group – Others – are distributed
either at the Top level or the Middle level while 78 percent (14 out of 18) are in the Low level
when SC/ST population are considered. This is a confirmation of the earlier finding that in so far
as the socially privileged group is concerned regional location is less critical to their state of well
being. And this reinforces our argument that social inequality overwhelms regional inequality.
Given the fact that an overwhelming proportion of the informal workers are poor and vulnerable,
these results reinforce the nexus between informality, social identity and economic vulnerability.
Does Social Inequality overwhelm Gender Inequality?
If one goes by what we call a ‘robust measure’ of long term poverty, one can clearly discern the
dominance of social inequality over gender inequality from Table 7 where we present the
incidence of CED for women and men separately. Women along with their men from the upper
social group experience the least incidence of poverty while women from the bottom layer
experience the most. In fact the disparity between women is much higher ranging from 8 percent
for women from the upper social group in Tamil Nadu to 63 percent for Muslim women in Orissa
(1:7.7) than for men ranging from 11 percent for those in upper social group in Tamil Nadu to 51
percent for SC/ST men in Rajasthan (1: 4.6). There are several aspects of inequality that one can
read from this Table. For SC/ST population, most States are in the Low level while for ‘Others’
they are equally divided between the Top and the Middle levels. The intermediate groups of
OBCs and Muslims are present at all levels but the single largest group is at the bottom level.
21
Their poverty status is more or less at the same level both in terms of regional and gender
differentiation. In an otherwise dismal scenario, two States stand out clearly, i.e., Kerala and
Punjab, where the poverty outcomes for all groups are well ahead of almost all states in the
country. It is interesting to note that Muslim women in Kerala have the best outcome not only
among Muslims in all States but also vis-à-vis other social groups within Kerala as well as all
other States except for the upper social group in Tamil Nadu and Punjab. The inter-group
inequality is also the lowest in Kerala compared to Punjab, the other best performing State. It is
also instructive to note that the CED outcome for women in half of the Top level States is better
than that of men but worse in most other States.
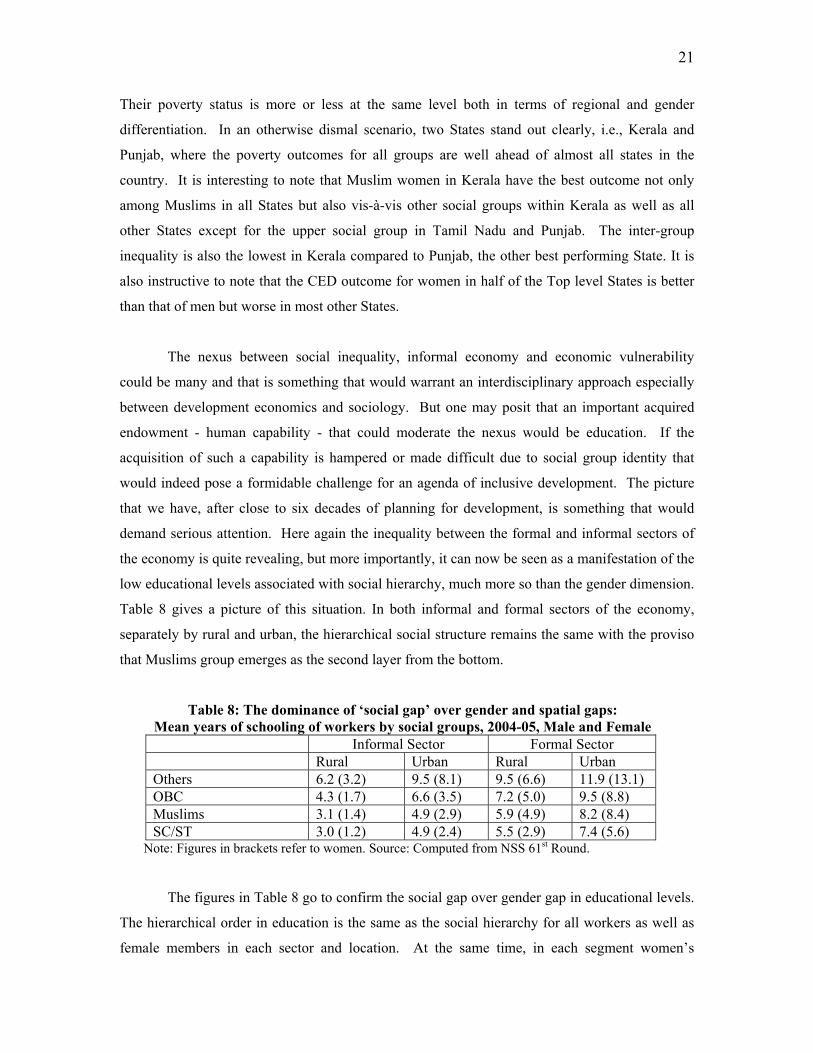
The nexus between social inequality, informal economy and economic vulnerability
could be many and that is something that would warrant an interdisciplinary approach especially
between development economics and sociology. But one may posit that an important acquired
endowment - human capability - that could moderate the nexus would be education. If the
acquisition of such a capability is hampered or made difficult due to social group identity that
would indeed pose a formidable challenge for an agenda of inclusive development. The picture
that we have, after close to six decades of planning for development, is something that would
demand serious attention. Here again the inequality between the formal and informal sectors of
the economy is quite revealing, but more importantly, it can now be seen as a manifestation of the
low educational levels associated with social hierarchy, much more so than the gender dimension.
Table 8 gives a picture of this situation. In both informal and formal sectors of the economy,
separately by rural and urban, the hierarchical social structure remains the same with the proviso
that Muslims group emerges as the second layer from the bottom.
Table 8: The dominance of ‘social gap’ over gender and spatial gaps: Mean years of schooling of workers by social groups, 2004-05, Male and Female Informal Sector Formal Sector Rural Urban Rural Urban Others 6.2 (3.2) 9.5 (8.1) 9.5 (6.6) 11.9 (13.1) OBC 4.3 (1.7) 6.6 (3.5) 7.2 (5.0) 9.5 (8.8) Muslims 3.1 (1.4) 4.9 (2.9) 5.9 (4.9) 8.2 (8.4) SC/ST 3.0 (1.2) 4.9 (2.4) 5.5 (2.9) 7.4 (5.6)
Note: Figures in brackets refer to women. Source: Computed from NSS 61st Round.
The figures in Table 8 go to confirm the social gap over gender gap in educational levels.
The hierarchical order in education is the same as the social hierarchy for all workers as well as
female members in each sector and location. At the same time, in each segment women’s
22
educational attainment is lower than that of men except for those in the urban formal sector.
However if we take the different segments in one set, the gender hierarchy gets subordinated to
the social hierarchy. For example, the top position goes to those in the urban formal sector
women while the bottom position goes to SC/ST women. The women in rural formal sector have
educational attainments much higher than men in rural informal sector.
Social inequality among women is sharper than among men. For example, women from
upper social group in the urban formal sector have 11 times the level of education as compared to
those at the bottom, i.e., SC/ST women in rural informal sector; for men, it is 4. Of course, there
is also a significant difference between rural and urban for workers in all social groups. But such
a difference is usually a consequence of better educated leaving rural areas, besides better public
provisioning for education in urban areas. That the highest gap is between urban female workers
from the upper social group and the rural female workers belonging to SC/ST is also a telling
reality of the Indian social space.
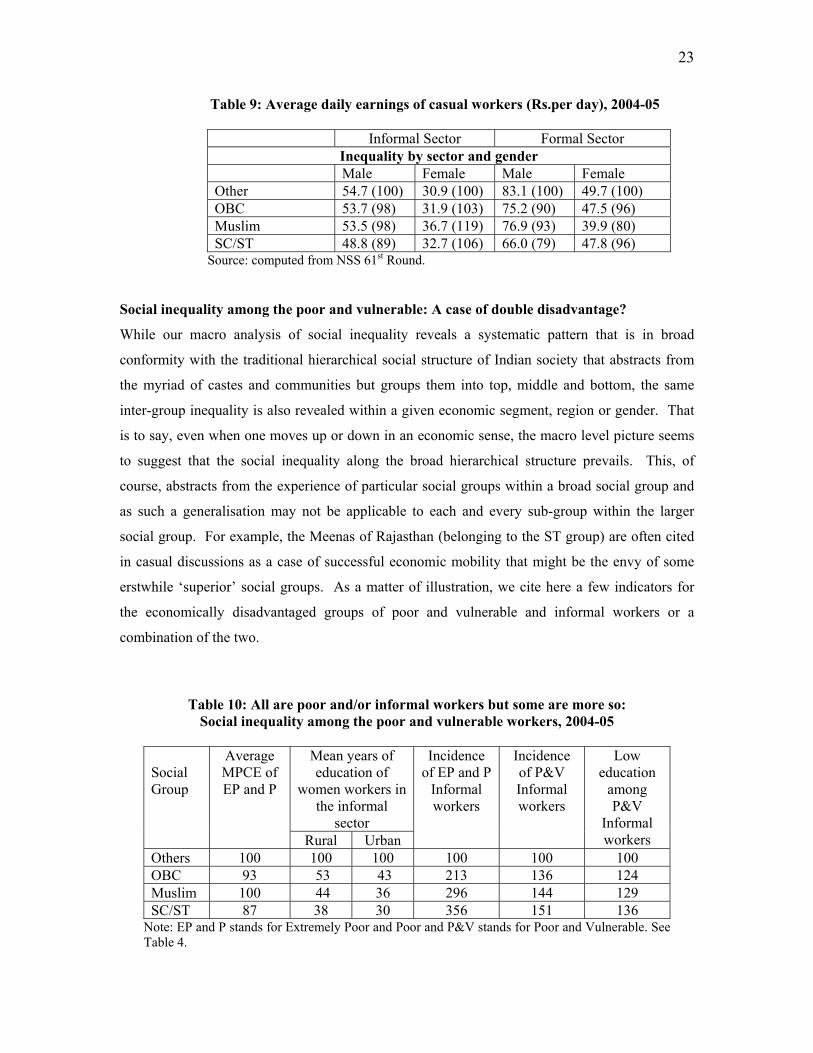
There is also some evidence that is crucial to determining condition of poverty of the
workers especially in the informal economy. A comparison of the wage rate of casual workers,
90 percent of whom work in the informal economy, is quite revealing. The evidence presented in
Table 9 shows a systematic pattern of social inequality, as in the earlier cases except for women
in the informal sector. The change in the pattern of social inequality for this group should be, in
my view, contextualised as to the nature of jobs that women workers from the upper social group,
even if poor and casual labour in status, are willing to perform. Most would prefer not to work
that have a social stigma or under employers who are considered socially low or too low. Often
they work from home (home-based workers) or in households of similar social groups as
domestic servants. Such practices have been reported by sociologists and this could explain why
they do not command a higher wage than the ‘lower’ social status groups who find themselves in
all kinds of work considered low and menial often of a hazardous nature . While gender
inequality is restricted to the respective sectors of the economy, women casual workers in the
formal sector receive a higher wage than SC/ST men workers in the informal sector as well as
women in both informal and formal sectors.
23
Table 9: Average daily earnings of casual workers (Rs.per day), 2004-05
Informal Sector Formal Sector Inequality by sector and gender
Male Female Male Female Other 54.7 (100) 30.9 (100) 83.1 (100) 49.7 (100) OBC 53.7 (98) 31.9 (103) 75.2 (90) 47.5 (96) Muslim 53.5 (98) 36.7 (119) 76.9 (93) 39.9 (80) SC/ST 48.8 (89) 32.7 (106) 66.0 (79) 47.8 (96)
Source: computed from NSS 61st Round.
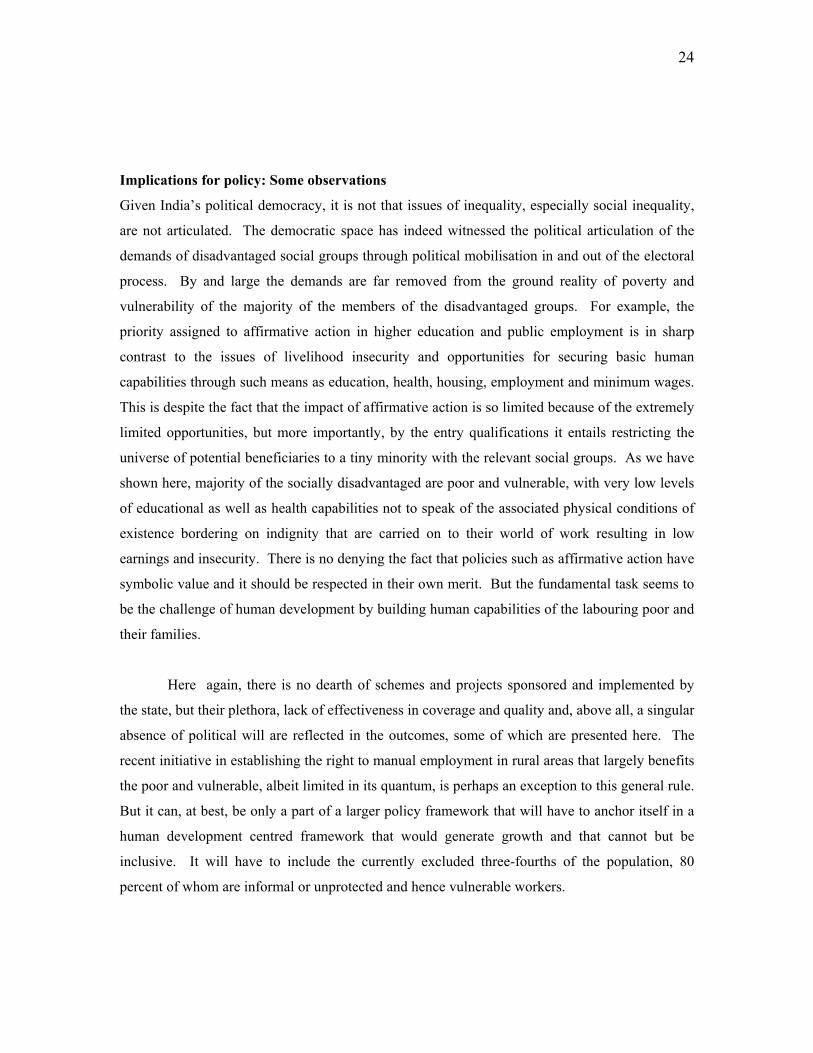
Social inequality among the poor and vulnerable: A case of double disadvantage?
While our macro analysis of social inequality reveals a systematic pattern that is in broad
conformity with the traditional hierarchical social structure of Indian society that abstracts from
the myriad of castes and communities but groups them into top, middle and bottom, the same
inter-group inequality is also revealed within a given economic segment, region or gender. That
is to say, even when one moves up or down in an economic sense, the macro level picture seems
to suggest that the social inequality along the broad hierarchical structure prevails. This, of
course, abstracts from the experience of particular social groups within a broad social group and
as such a generalisation may not be applicable to each and every sub-group within the larger
social group. For example, the Meenas of Rajasthan (belonging to the ST group) are often cited
in casual discussions as a case of successful economic mobility that might be the envy of some
erstwhile ‘superior’ social groups. As a matter of illustration, we cite here a few indicators for
the economically disadvantaged groups of poor and vulnerable and informal workers or a
combination of the two.
Table 10: All are poor and/or informal workers but some are more so:
Social inequality among the poor and vulnerable workers, 2004-05
Social Group
Average MPCE of EP and P
Mean years of education of
women workers in the informal
sector
Incidence of EP and P
Informal workers
Incidence of P&V Informal workers
Low education
among P&V
Informal workers Rural Urban
Others 100 100 100 100 100 100 OBC 93 53 43 213 136 124 Muslim 100 44 36 296 144 129 SC/ST 87 38 30 356 151 136
Note: EP and P stands for Extremely Poor and Poor and P&V stands for Poor and Vulnerable. See Table 4.
24
Implications for policy: Some observations
Given India’s political democracy, it is not that issues of inequality, especially social inequality,
are not articulated. The democratic space has indeed witnessed the political articulation of the
demands of disadvantaged social groups through political mobilisation in and out of the electoral
process. By and large the demands are far removed from the ground reality of poverty and
vulnerability of the majority of the members of the disadvantaged groups. For example, the
priority assigned to affirmative action in higher education and public employment is in sharp
contrast to the issues of livelihood insecurity and opportunities for securing basic human
capabilities through such means as education, health, housing, employment and minimum wages.
This is despite the fact that the impact of affirmative action is so limited because of the extremely
limited opportunities, but more importantly, by the entry qualifications it entails restricting the
universe of potential beneficiaries to a tiny minority with the relevant social groups. As we have
shown here, majority of the socially disadvantaged are poor and vulnerable, with very low levels
of educational as well as health capabilities not to speak of the associated physical conditions of
existence bordering on indignity that are carried on to their world of work resulting in low
earnings and insecurity. There is no denying the fact that policies such as affirmative action have
symbolic value and it should be respected in their own merit. But the fundamental task seems to
be the challenge of human development by building human capabilities of the labouring poor and
their families.
Here again, there is no dearth of schemes and projects sponsored and implemented by
the state, but their plethora, lack of effectiveness in coverage and quality and, above all, a singular
absence of political will are reflected in the outcomes, some of which are presented here. The
recent initiative in establishing the right to manual employment in rural areas that largely benefits
the poor and vulnerable, albeit limited in its quantum, is perhaps an exception to this general rule.
But it can, at best, be only a part of a larger policy framework that will have to anchor itself in a
human development centred framework that would generate growth and that cannot but be
inclusive. It will have to include the currently excluded three-fourths of the population, 80
percent of whom are informal or unprotected and hence vulnerable workers.
25
Towards a Policy Framework
Is it possible to articulate a policy framework for such an approach to development that would be
inclusive? There have been considerable discussion and debate on several alternative
perspectives that share the goals of human development and human development centred
growth10. Perhaps the crisis in the current model of financial capitalism and the consequent
economic crisis threatening the standard of living in the rich countries might provide a more
receptive political environment for such a policy framework. In any case, it would be foolhardy
to think that the massive underdevelopment of the Indian economy characterised by entrenched
social inequality can be successfully faced by a reliance on the neoliberal economic orthodoxy
and its expected trickle down effect to the poor and excluded. I believe there ought to be much
more public debate and discussion on an alternative policy framework to which social scientists
in general and development economists in particular could contribute. It is my case that such a
policy framework has to address the twin challenges of poverty and vulnerability as well as
entrenched social inequality, both of which are coupled with informality in employment. At the
minimum, the following agenda will have to form a sin qua non of such a policy framework.
Foundational requirements
The first task is to identify the foundational requirements that should create institutions and
mechanisms to ensure, for want of a better term, social security in the sense of addressing
capability deficiencies and adversities arising out of contingencies. This may be viewed in terms
of three concentric circles. The broadest circle would consist of a universal system for securing
basic human capabilities; the second inner circle could, and should in my view, focus on the
informal workers and their families; and the third circle should focus on the poor and vulnerable
who need direct public assistance.
These foundational requirements to address capability deficiency may be referred to as
Basic Social Security that is promotional in nature. It should ensure the creation of public
institutions assuring access to literacy and basic education, basic health care services, housing,
drinking water and sanitation and minimum income (for example, via employment). Although
dependence on agriculture for employment is slowly but steadily declining, the land question
remains an extremely relevant one in the rural society especially those who have been
experiencing a continuous process of land alienation such as the Scheduled Tribes and those who
have historically been denied access to some land such as the Scheduled Castes. This will have to
be addressed separately as some of the fiercest points of social conflicts are on this question.
26
The creation of such basic capabilities should be through the establishment of legal entitlements
that would be fitting in a democratic state. Given the basic nature of this foundational
requirement, a universal approach is perhaps the best way to implement them so that a process of
self selection would ensure that those who are in need are the ones who access them the most.
The link to the informal economy comes through the second and inner concentric circle.
Here the need is to provide Protective Social Security in two ways. One is the creation of a
‘social floor’ to the wage workers in the informal economy. At the minimum, such a social floor
should include the three elements advocated by the NCEUS (2007a) viz., minimum conditions of
work, a minimum wage and the provision of a package of Contingent Social Security to meet
such contingencies as sickness and disability arising out of accidents and eventualities such as old
age and death.
Along with the creation of such a ‘social floor’, a necessary complement that would also
ensure its realisation should be the right to employment backed by the payment of minimum
wages along the lines now in vogue i.e., the NREG Programme. The economic feasibility of a
full employment programme in our context of massive poverty and underdevelopment that would
lead to ‘development with dignity’ has been put forward that, I think, demands a wider debate and
deliberation (see Bhaduri 2007).
A third element in the informal economy-focused policy would be the creation of
opportunities for acquisition and development of skills of workers that will not only enhance their
productivity but also ensure a fair share of that. This is a critical constraint given the
overwhelming initial condition of poverty and vulnerability of the households of informal
workers, more so in rural areas.
While the above policies would largely focus on wage workers, we also know that the
self-employed constitute the larger of the two segments in the informal economy. This segment
includes those ranging from the Own Account Workers – the street vendors, rag pickers, rickshaw
pullers, auto and taxi drivers, most home–based women workers and so on – to those ‘employers’
hiring less than ten workers to run their ‘micro’ enterprises. Since they work under conditions
of what may be called ‘self exploitation’ the public policy interventions here should take the form
of measures to develop the workers’ capabilities that have a direct bearing to their productivity
and strengthening the capability of the units to enhance efficiency. These would include

27
promotion of skills, access to credit, technology and a variety of related services that are now
largely available only to the formal sector of the economy. A good part of the single-person self
employed mentioned above is nothing but the ‘disguisedly unemployed’ since they are unable to
access opportunities for regular employment with reasonable wages. A public employment
programme of the kind mentioned above could be an answer to such workers thereby
strengthening, indirectly though, the capacity and market for the output of the micro enterprises.
Just as the foundational requirements for basic human development warrant a collective
approach to delivery, a similar approach is also warranted in the case of promotional services to
the self employed and the micro enterprises. One such approach has been articulated in what is
called the development of ‘Growth Poles’ in the existing industrial/business clusters (see NCEUS
2007a and elaborated in Sengupta, et.al. 2007).
The third and last concentric circle should focus, in my view, on those who cannot make
a living out of work nor have other sources of livelihood such as destitutes and the poor disabled
in a variety of ways and for a variety of reasons. Some may have been informal workers at some
point in time. They need direct public assistance. This should also be the bottom line of any
public policy on development in a democratic polity.
Factoring Social Inequality
The biggest challenge before the Indian State and society is how to factor the overwhelming
presence of social inequality. As we have seen, the informal economy approach encompasses all
the dimensions of inequality. Given a threshold of income or its proxy, it then focuses on the poor
and vulnerable in the society. However, what we have argued here is the presence of the
persistence of social inequality even among the poor. This calls for a coherent social policy at the
macro (national) and meso (state) levels. The present administrative approaches such as sub-
plans (as for example, for STs) have not really been effective. A combination of targeted
programmes, incentives and creation of institutions of a ‘hand-holding’ nature will have to be
thought through. In addition, a system of incentives could be designed for public, collective and
private, especially non-profit, institutions that provide a variety of basic social and developmental
services for greater inclusion of the currently disadvantaged social groups. Surely, employment
and wages as well as creation of opportunities for accessing health and education will go a long
way in enabling the socially discriminated/excluded groups to enhance their capabilities in
28
accessing other services but a system of incentives to institutions that deliver these services could
accelerate the process of inclusion.
But participation in local level institutions of governance is, in my view, a critical factor
for inclusion. With the creation of Panchayat Raj Institutions (PRIs), there is a window of
opportunity for the system to proceed along a path of sustained inclusion. But here again, the
process seems to be long given the weak administrative structure, inadequate resources and a
general lack of political commitment - with some exceptions at the level of State governments –
to strengthening these institutions. Earlier, reservation for women in the PRIs was viewed with
scepticism with regard to their ability to function but that seems to have receded with experience.
I think the agenda of strengthening PRIs is an unfinished one in substantial measure and a firm
direction could go a long way in partially, if not wholly, mitigating the problem of social
inequality. Whether the complex electoral politics will see this as a priority agenda and whether
the forces striving for equitable development will be able to muster the required strength or not
are matters that the unfolding Indian political process is yet to give a firm signal. Ultimately, the
onus for such an agenda will fall in the realm of the larger civil society and its dynamics. In any
case, the ‘social’ dimension of politics and economics will continue to be a live subject.
The lesson that I would like to draw from such an approach is the imperative to reclaim
the role of the ‘developmental state’, which alone can address the basic problems of
underdevelopment and the challenge of creating the foundations for an inclusive development.
The neoliberal argument is often couched in terms of ‘reducing the role of the state’ or
‘downsizing the state’ in economic activities even in countries where the state alone has the
capacity to create opportunities for basic human capabilities for the vast mass of the poor and
vulnerable. However, the reality is not one of withdrawal of the state in economic activities but a
repositioning of the state in favour of capital11. In the Indian case this has often resulted, as for
example, in the creation of what may be called ‘special playing fields’ for large capital (e.g. the
creation of Special Economic Zones) or large infusion of institutional credit in times of liquidity
crunch that has almost turned a blind eye to the near absence of any access to credit and some
other services to the overwhelming majority of small units in the economy (see, e.g. NCEUS
2007b).

29
The Cost of Neglect and Pressure From Below It is not that the Indian State has turned a blind eye to the basic developmental issues. In fact
there is a proliferation of projects, schemes and programmes that address issue of capability
deprivation or deficiency if not any meaningful social security cover to meet adversities. It is
rather the increasing subordination and marginalisation of such policies seeing them as subsidies
or necessary dole outs – in effect wasteful expenditure – to the public exchequer. Riding on the
back of high aggregate growth, the neoliberal agenda offers the 'market solution' as a panacea for
the underdevelopment of the economy. The result has been not only increasing inequality across
class and region but above all social as I have attempted to portray here. The problem is also
rooted in the functioning of the state at different levels in a large and diverse federal polity like
India. The three crucial levels where tensions are generated may briefly be referred to.
At the macro level, the Indian polity is witnessing an increasing tension between what
may be called economics of market and politics of democracy. The former is seen in the
numerous neo-liberal policy measures whose priority is to galvanize aggregate growth through
private capital. Such policies have resulted in numerous new institutions, as for instance Special
Economic Zones and the Public Private Partnership . In the absence of institutions which can
distribute the benefits of growth equitably across regions and social groups, such policy measures
benefit the power of capital, especially the big ones. At the same time, the country is witnessing
fierce political mobilization especially from social groups who perceive themselves to be
disadvantaged and/or discriminated. The electoral democracy not only enhances the aspirations
and expectations of these groups but also pushes the state to take some pro-poor measures, for
instance, the NREG Programme and the Bill on rights of Scheduled Tribes. However, policies
supported by economics of market are able to display a sense of commitment, urgency and fast
track implementation whereas initiatives pushed by the politics of democracy, at best, limp
towards implementation (e.g. child care and nutrition (ICDS), housing for the poor (Indira Awas
Yojana) and employment guarantee (NREGP) and, at worst, are abandoned or put in a limbo
(e.g. contingent social security to the informal workers, right to education, access to credit for
marginal and small farmers as well as micro and small enterprises). In nutshell, urgent policies
required to ‘level up’ the unequal social and economic space are either not conceived or funded or
are half-heartedly executed. This is an area that calls for much deeper exploration to find out
how, and to what extent, such a contradiction in the Indian State emerging due to the economics
of market and politics of democracy has strained the socio-economic fabric of the country.

30
At the meso level, the abovementioned tension has to be understood in terms of certain
dominant tendencies. Some provincial States (e.g. Tamil Nadu, Maharashtra and Gujarat) with
strong sub-national identities and with some favourable initial conditions (e.g. industrial base and
capital) took advantage of the national policies arising out of the economics of market and
strengthened the sub-national bourgeoisie whose economic demands are seen to be met by the
political class. However, not many of them have been able to meet the challenge of inclusion
especially in meeting the capability deficiencies and adversities of the working poor. In a few
other provincial States some of which have a long record of active and sustained mobilization of
the labouring poor and resultant public investment in human development (e.g. Kerala) or a
record of rural economic growth and prosperity (e.g. Punjab) or favourable initial conditions such
as absence of a class of landless and public investment in rural economic and social infrastructure
(e.g. Himachal Pradesh) one can see the redressal of capability deficiencies and adversities in
substantial measure. This has resulted in a relatively better record in human development for the
labouring poor from the ‘lower’ social groups. In a number of other States, the domination of
feudal or feudalistic classes (mostly rural) surplus generation was through feudal/semi-feudal
mode of production processes and capture of state resources. In such a scenario, the systematic
discrimination of ‘lower’ social groups and often the exclusion of the bottom layer are quite
palpable. Public expenditure often metamorphoses into opportunities for rent-seeking.
At the micro or local level either the development policies are structurally/architecturally
flawed or they are captured by the entrenched local interests. The first has been discussed in the
literature and basically connotes that macro policy and planning while taking into account the
objective realities often ignore the ground reality of unequal access to resources and the
entrenched social inequality. As a result, even the best of policies falter during the stage of
implementation. Empowering measures for creation of such constitutional bodies as the PRIs are
far from gaining a real foothold. However, it is the ‘empowerment factor’ that is of critical
importance from the standpoint of the labouring poor. It is invariably perceived as well as
experienced that state’s development initiatives fail to insulate itself from the vested interests and
as a result the public schemes are often turned into rent-seeking avenues. It is at this micro level
where the capture of the state benefits seriously hurt the socio-economic interests of the
marginalised. It is at this level the difference between caste/community and class are relatively
more blurred i.e., lower social groups may belong to the lowest class.

31
The costs of neglect of such inequality arising out of the subordination and consequent
ineffective implementation of basic social and livelihood security agenda to the large mass of the
poor and vulnerable are increasing by the day. In turn, it is the state, and by proxy, the people
who bear the cost that should have been devoted to the basic development agenda. Systematic
studies on the linkage between the failure to assure livelihood security with a life of dignity to the
poor and vulnerable and the different forms and manifestations of social and political tensions
and conflicts are far and few. I think here is a big challenge for the social science community to
take up and make their work directly relevant to the ongoing, and if I may say so, tortuous,
process of socioeconomic change in the country. Given the size of the country and diversity of
social and cultural systems and the magnitude of the problems of underdevelopment, tensions and
often open conflicts erupt and also sustain in different parts. They might be in the name of
region, religion, caste, land, class and so on. While the framework of political democracy ensures
a space for protests, mobilisation and organisation, not all forms of protests are within such a
structured framework but often manifests as violence of one kind or another. Some of them have
been from the bottom layer of the society opting out of the democratic framework. It is quite
instructive that an expert group report to the Planning Commission on 'Development Challenges
in Extremist Affected Areas' has articulated the social and economic dimensions of what is
popularly called the 'Naxalite Movement' and recommends that the Indian State should move
away from its security-centred view of social issues. To quote:
"It should be recognized that there are different kinds of movements, and that calling and treating them generally as unrest, a disruption of land and order, is little more than a rationale for suppressing them by force. It is necessary to contextualize the tensions in terms of social, economic and political background and bring back on the agenda the issues of the people – the right to livelihood, the right to life and a dignified and honourable existence. The State itself should feel committed to the democratic and human rights and humane objectives that are inscribed in the Preamble, the Fundamental Rights and Directive Principles of the Constitution. The State has to adhere strictly to the Rule of Law. Indeed, the State has no other authority to rule." (Government of India 2008: 30).
Of course, only sustained pressure from below will ensure the prioritization and effective
implementation of the basic agenda outlined above. While collective organisations of the
working poor are not absent, their strength, coverage and capacity are quite low. They also do
not have the critical power to force the state to accede to their demands unlike corporate and
trading capital, as well as some of their counterparts in the formal sector. This of course is a

32
larger challenge that the political and civil society committed to a process of inclusive
development will have to address. Thank you for your patient hearing.
13 December 2008 Giri Institute of Development Studies Lucknow

33
Annexure 1 Percentage of Kachha House among Socio-religious Groups across Indian States,
2005-06 Total ST/SC OBC Muslim Other
Top Level States Gujarat (1.5) Punjab (2.4), Kerala (2.5) Maharashtra (2.6) Chhattisgarh (3.3) Haryana (3.6) Karnataka (4.9) Jharkhand (5.6)
Gujarat (3.0) Chhattisgarh (3.7) Haryana (3.9) Maharashtra (4.7) Punjab (5.5), Karnataka (9.0) Jharkhand (9.0) Kerala (9.4)
Kerala(1.6) Gujarat(2.0) Maharashtra(2.6) Haryana(3.0) Punjab(3.1) Chhattisgarh(3.6), Jharkhand(4.0), Karnataka(4.6), West Bengal(9.5), Tamil Nadu(10.4),
Maharashtra (0.3), Kerala (0.9), Karnataka (1.4), Chhattisgarh (1.6), Tamil Nadu (2.9), Jharkhand (3.7), A P (4.3), Uttarakhand(6.6),
Gujarat(0.2), Punjab(0.7), Chhattisgarh (0.9), Haryana(1.0), Kerala (1.5), Jharkhand (1.6), Maharashtra (1.8), Karnataka (2.3), TN (2.3), WB (6.3), AP (6.8), Bihar (7.4), Rajasthan (7.8), UP (8.6), Uttarakhand(11.2),
Middle Level States Tamil Nadu(12.2), Uttarakhand(13.3), Andhra Pradesh(13.3), West Bengal(13.7), Uttar Pradesh(16.4), Assam(20.8),
Uttarakhand(18.6), Tamil Nadu(20.2), West Bengal(20.3),
Andhra Pradesh(12.3), Assam(14.8), Uttar Pradesh(16.2), Uttarakhand(17.6), Rajasthan(18.3),
Uttar Pradesh(14.5), Madhya Pradesh(16.6), West Bengal(17.4),
Assam(13.3), MP (13.8), Orissa(26.8)
Lower Level States Madhya Pradesh(23.8), Rajasthan(24.3), Orissa(32.6), Bihar(32.7),
Assam(23.0), Uttar Pradesh(23.5), Andhra Pradesh(24.1), Madhya Pradesh(29.1), Rajasthan(38.6), Orissa(41.6), Bihar(50.3),
Orissa(23.9), Madhya Pradesh(24.2), Bihar(32.0),
Haryana(23.8), Assam(31.6), Rajasthan(31.9), Bihar(33.3), Orissa(46.0),
India (13.8) India (21.0) India (13.5) India (14.1) India (6.0)
Note: (i) Top level States are those in which the percentage of kachha house is less than or equal to 11.9%. (ii) Middle level States are those in which the percentage of kachha house is greater than 11.9% but does not exceed 22.3%. (iii) Low level States are those in which the percentage of kachha house is more than 22.3%. Source: Computed from data from NFHS-3.

34
Annexure 2 Toilet facility within the household among Socio-Religious Groups across Indian
States, 2005-06 Total Population ST/SC Muslim OBC Others
Top Level States Kerala(96.0) Assam(76.3) Punjab(70.9)
Kerala(87.1), Kerala(98.7) Punjab(85.9), Assam(85.0), Uttarakhand(83.6), Maharashtra(80.0), Tamil Nadu(78.3),
Kerala(96.8) Assam(74.2) Punjab(71.9)
Kerala(97.0) TN (96.0) Assam(84.9) Gujarat(84.3) Punjab(81.1) WB (78.3)
Middle Level States WB (59.5) Uttarakhand (56.8) Gujarat (51.6) Maharashtra (53.0) Haryana (52.4) Karnataka (47.3)
Assam(60.2), Punjab(51.8), West Bengal(46.6),
Gujarat(66.1), Andhra Pradesh(62.7), Karnataka(62.1), Uttar Pradesh(60.5), Chhattisgarh(60.3), Madhya Pradesh(57.7), West Bengal(46.8),
West Bengal(62.6), Haryana(55.8), Maharashtra(52.6), Karnataka(49.4), Uttarakhand(48.0), Tamil Nadu(46.2), Gujarat(40.0),
Bihar(68.3), Rajasthan(67.2), Jharkhand(66.2), Andhra Pradesh(63.4), Chhattisgarh(62.6), Haryana(61.8), Uttarakhand(61.0), Karnataka(59.8), Maharashtra(59.2), Madhya Pradesh(57.1), Uttar Pradesh(53.6)
Lower Level States Tamil Nadu(42.9), Andhra Pradesh(42.4), Uttar Pradesh(33.1), Rajasthan(30.8), Madhya Pradesh(27.0), Bihar(25.2), Jharkhand(22.6), Orissa(19.3), Chhattisgarh(18.7),
Uttarakhand (42.3) Haryana (39.1) Gujarat (33.6), Maharashtra (33.6) AP (29.7) Karnataka (27.3) Tamil Nadu (21.7) UP (18.1) Rajasthan(17.2) Madhya Pradesh(11.5) Chhattisgarh(9.0) Jharkhand(8.9) Bihar(7.0) Orissa(5.7)
Rajasthan (40.8), Orissa (34.0), Jharkhand (33.8), Bihar (27.2), Haryana (20.5),
Gujarat (35.9) AP (23.6) MP (22.4) Rajasthan(21.9) U P (21.2) Orissa (21.6) Bihar (21.2) Jharkhand (19.4) Chhattisgarh (16.3)
Orissa (37.0)
India (44.4) India (27.5) India (59.9) India (36.1) India (67.9)
Note: i) Top level States are those in which the percentage of household with toilet facility is more than 70.2%. ii) Middle level States are those in which the percentage of household with toilet facility is greater than 44.5% but does not exceed 70.2%. iii) Low level States are those in which the percentage of household with toilet facility is less than or equal to 44.5%. Source: Computed from data from NFHS-3.

35
References
Bhaduri, Amit (2005), Development with Dignity: A case for full employment, New Delhi: National Book Trust. Bhalotra, S. R. (1998), ‘The Puzzle of Jobless Growth in Indian Manufacturing”, Oxford Bulletin of Economics and Statistics, 60, 1. Breman, Jan (1985), Of Peasants, Migrants and Paupers: Rural Labour Circulation and Capitalist Production in West India, New Delhi: Oxford University Press. Breman, Jan (1994), Wage Hunters and Gatherers: Search for Work in the Urban and Rural Economy of South Gujarat, New Delhi: Oxford University Press. Breman, Jan (1996 ), Footloose Labour: Working in India’s Informal Economy, Cambridge: Cambridge University Press. Chandrasekhar, C.P. (2008), Re-visiting the Policy Environment for Engendering Employment Intensive Growth, Paper prepared for International Labour Organization, New Delhi (mimeo). Chen, Shaohua and Martin Ravallion (2008), The Developing World is Poorer than we Thought, but not Less Successful in the Fight Against Poverty, Policy Research Working Paper 4703, World Bank, Washington DC. Deshpande, Ashwini (2000), ‘Recasting Economic Inequality’ in Review of Social Economy, Vol. LVIII, No.3, September, pp.381-99. Deshpande, Satish (2003), Contemporary India: A Sociological View, New Delhi: Penguin Books India. Ghose, A.K. (1994), ‘Employment in Organised Manufacturing in India’, Indian Journal of Labour Economics, Vol.37, No.2. Goldar, B. (2000), ‘Employment Growth in Organised Manufacturing in India’, Economic and Political Weekly, April 1, Pg. 1191-95. Goldar, B. (2004), ‘Indian Manufacturing: Productivity Trends in Pre- and Post-Reform Periods’, Economic and Political Weekly, November 20, pg 5033-43. Guha-Khasnobis, Ravi kanbur and Elinor Ostrom (2006), ‘Beyond Formality and Informality’ in Guha-Khasnobis, Ravi kanbur and Elinor Ostrom (2006), Linking the Formal and Informal Economy: Concepts and Policies, New York: Oxford University Press.

36
Gupta, Dipankar (2003), ‘Social Stratification: Hierarchy, Difference and Social Mobility’ in Das, Veena (ed.) (2003), The Oxford India Companion to Sociology and Social Anthropology, Vol.1, New Delhi: Oxford University Press. Harris, J.R. and M.P. Todaro (1970), ‘Migration, Unemployment and Development: A Two Sector Analysis’ in American Economic Review, Vol.60, pp.126-42. Harriss-White, Barbara (200 ), India Working: Essays on Society and Economy, Cambridge: Cambridge University Press. International Labour Office (2002), Decent work and the informal economy, Report VI, International Labour Conference, 90th Session, Geneva: International Labour Office. Lewis, W. Arthur (1954), ‘Economic Development with Unlimited Supplies of labour’ in Manchester School of Economic and Social Studies, Vol.22, pp.139-91. Kannan, K. P. (1994), ‘Levelling Up or Levelling Down? Labour Institutions and Economic Development in India’, Economic and Political Weekly, July 23, pp. 1938-45. Kannan, K.P. (2007), ‘Interrogating Inclusive Growth: Some Reflections on Exclusionary Growth and Prospects for Inclusive Development in India’ in The Indian Journal of Labour Economics, Vol.50, No.1, pp.17-46. Kannan, K.P. and G. Raveendran (2008), Growth Sans Employment: A Quarter Century of Jobless Growth in India’s Organised Manufacturing (mimeo). Mehrotra, Satish and Enrique Delamonica (2008), Eliminating Human Poverty: Macroeconomic and Social Policies for Equitable Growth, Indian Edition, Hyderabad: Orient Longmans. Nagaraj, R. (1994), ‘Wages and Employment in Manufacturing Industries: Trends, Hypothesis and Evidence’, Economic and Political Weekly, Vol. 29, No. 4, January 22. Nagaraj, R. (2000), ‘Organised Manufacturing Employment’, Economic and Political Weekly, September 16, pg. 3445-48. Nagaraj, R. (2004), ‘Fall in Organised Manufacturing Employment: A Brief Note’, Economic and Political Weekly, July 24, pg. 3387-90. NCEUS (2006), Report on Social Security for Unorganised Workers, Government of India, New Delhi. NCEUS (2007a), Report on Conditions of Work and Promotion of livelihoods in the Unorganised Sector, Government of India, New Delhi. Also published by Academic Foundation, New Delhi (2008). NCEUS (2007b ), Report on Financing of Enterprises in the Unorganised Sector and Creation of a National Fund for the Unorganised Sector, Government of India, November.

37
NCEUS (2008a), ‘Contribution of the Unorganised Sector to GDP Report of the Sub Committee of a NCEUS Task Force’, Working Paper 2, New Delhi. NCEUS (2008b), Report on Definitional and Statistical Issues Relating to the Informal Economy, Government of India, December, New Delhi. Papola, T. S. (1994), ‘Structural Adjustment, Labour Market Flexibility and Employment’, Indian Journal of Labour Economics, Vol.37, No.1. Papola, T.S. (2008), Disparities in Development: Trends in Regional Variations in a High Growth Period, Presidential Address to the Fourth Annual Conference of Uttar Pradesh-Uttarakhand Economic Association, DBS College, Kanpur, November 8. Patnaik, Utsa (2006), Poverty and Neo-liberalism in India, Based on Rao Bahadur Kale Memorial Lecture delivered at Gokhale Institute of Politics and Economics, Pune, February 3. Planning Commission (2008), Development Challenges in Extremist Affected Areas, Report of an Expert Group to Planning Commission, Government of India, New Delhi. Saith, Ashwani (2007), Caping, Ranking and Denying Poverty: Artful Mandarins and the Silent Poor, Paper presented at the International Seminar on Revisiting the Poverty Issue, Patna, 20-22 July. Sengupta, Arjun, K.P. Kannan and G. Raveendran (2008), ‘India’s Common People: Who are They, How many are They and How do they Live?’ in Economic and Political Weekly, March 15. Sengupta, Arjun, K.P. Kannan and Ravi Srivastava (2007), ‘Growth Pole: A Case for Special Economic Zone for Clusters of Small and Micro Enterprises’ in The Indian Journal of Labour Economics, Vol.50, No.2, pp.217-230.
Thorat, S.K. and Narendra Kumar (eds.) (2008) , In Search of Inclusive Policy: Addressing
Graded Inequality, IIDS and Rawat Publications, New Delhi.

38
1 Some scholars have even questioned the relevance of the notion of ‘inclusive growth’. For example, Papola (2008:4) notes that “What is (however) certainly implied in the recognition of the need for ‘inclusive growth’, is that a sizeable group of population has not been ‘included’ in and have, therefore, not benefited from growth. Does it mean that growth has not trickled down to these groups? In fact, the notion of ‘trickle down’ does not seem top be a relevant, let alone adequate explanation of this asymmetric process of growth. ‘Trickle-down’ can take place if the poor are also included in growth process, that is, they are engaged in economic activities that are growing, even though the non-poor may be the main actors and, therefore, main beneficiaries of growth. When certain groups of people are not even ‘included’ in the growth process, there is no question of the benefits of growth ‘trickling down’ to them. In other words, in this situation, the notion of ‘trickle down’ is not merely non-operational, it is irrelevant.” 2 Several scholars have studied the issue of ‘jobless growth’ and related issues in organised manufacturing for different periods. See, e.g., Ghose (1994), Kannan (1994), Papola (1994), Bhalotra (1998), Nagaraj (1994, 2000 and 2004), Goldar (2000 and 2004). A recent exercise was carried out by Kannan and Raveendran (2008) covering a period of 23 years from 1981-82 to 2004-05 divided into pre- and post reform periods. The results of this exercise show ‘jobless growth’ over the entire period as well as in two separate periods despite a trend rate of growth of output of around 7 percent. For explanations relating to cheapness of capital, technological change, dependence on exports as well as the high income market see Chandrasekhar (2008) as well as Kannan and Raveendran (2008). 3 See, e.g. Guha-Khasnobis, Ravi Kanbur and Elinor Ostrom (2006). 4 The ILO has been in the forefront of promoting and disseminating a large number of studies and policy recommendations relating to the informal economy as part of a developmental process beginning with a variety of insecurities faced by informal workers. For details see, www.ilo.org 5 In the case of agriculture, the NCEUS recommended that each operational holding in the crop production and plantation may be considered as an enterprise. In the case of other agricultural activities like forestry, animal husbandry and fishing, the general definition of enterprise as used in the economic census and non-agricultural sector surveys can be adopted. For details, see NCEUS (2008b:Ch.2). 6 Insufficiently, yes but not absent. For a macro level analysis of some aspects of economic inequalities along social group lines, see Satish Deshpande (2003:98-124). Another Deshpande (Ashwini Deshpande 2000), notes, on the basis of a critical review of the available literature, that economic scholarship on Indian inequality paying attention to inter-group disparity along social group lines is still in its infancy and makes a case for considering caste as an important ingredient of stratification. For a recent collection of papers on the subject recognizing social inequality as ‘graded inequality’ but largely focusing on access to higher education in the wake of the recent controversy on affirmative action in favour of OBCs, see Thorat and Kumar (2008). 7 See, e.g. Saith (2007). 8 India’s official poverty line was closer to one PPP dollar per capita per day by international price comparison till recently and this was the threshold level of income for ‘extreme poverty’ adopted by the World Bank. However, a recent revision of this threshold income was revised upwards to 1.25 PPP dollars (see Chen and Ravallion 2008). By this standard, Indian official poverty line is below that of ‘extreme poverty’ which is closer to the 1.25PL adopted by the NCEUS to identify those who are poor and marginally poor. 9 The mismatch between the consumer expenditure norm and the calorie norm for determining the poverty line has been brought out by Utsa Patnaik (see Patnaik 2006). In the poverty status grouping of NCEUS (2007a and Sengupta, et al. 2008) and presented here in Table 4 the consumer expenditure level required to
39
cross the official poverty line is 2PL i.e. the group classified as ‘poor and vulnerable’ are poor by Indian official poverty line in terms of the calorie norm. 10 For a synthesis of the literature that shows the superiority of a human development-centred approach to growth and development see, Mehrotra and Delamonica (2008). 11 Barbara Harriss-White argues, with the help of case studies, how the local state in India is an active collaborator in the process of accumulation by the local small and trading capital. Critical of the ‘new political economy’ school and its advocacy of deregulation, She observes: “ ….State is seen as an institution with boundary lines. Civil society is something separate. On this political theorists and policy advisers agree: the State is one thing, markets are another. But at the local level we find no such clear separation. When we look at the local State, the actually existing State below the level of the State capital, as we follow policies down the hierarchy of levels, we soon find ourselves in an economy that is on the edge of – or frankly outside – the ambit of state regulation (despite what is laid down in official statements of intension, and in legislation and orders and institutions); that is, in the informal economy.” Harriss-White 2004:74)
Copyright © 2022 FDOKUMEN