The Impact of Military Spending and Income Inequality on Economic Growth in Turkey
21
This article was downloaded by: [University of Maine - Orono] On: 17 June 2014, At: 09:37 Publisher: Routledge Informa Ltd Registered in England and Wales Registered Number: 1072954 Registered office: Mortimer House, 37-41 Mortimer Street, London W1T 3JH, UK Defence and Peace Economics Publication details, including instructions for authors and subscription information: http://www.tandfonline.com/loi/gdpe20 The impact of military spending and income inequality on economic growth in Turkey Ünal Töngür a & Adem Yavuz Elveren b a Department of Economics, Middle East Technical University, Ankara, Turkey b Department of Economics, Keene State College, Keene, NH, USA Published online: 17 Jun 2014. To cite this article: Ünal Töngür & Adem Yavuz Elveren (2014): The impact of military spending and income inequality on economic growth in Turkey, Defence and Peace Economics, DOI: 10.1080/10242694.2014.925324 To link to this article: http://dx.doi.org/10.1080/10242694.2014.925324 PLEASE SCROLL DOWN FOR ARTICLE Taylor & Francis makes every effort to ensure the accuracy of all the information (the “Content”) contained in the publications on our platform. However, Taylor & Francis, our agents, and our licensors make no representations or warranties whatsoever as to the accuracy, completeness, or suitability for any purpose of the Content. Any opinions and views expressed in this publication are the opinions and views of the authors, and are not the views of or endorsed by Taylor & Francis. The accuracy of the Content should not be relied upon and should be independently verified with primary sources of information. Taylor and Francis shall not be liable for any losses, actions, claims, proceedings, demands, costs, expenses, damages, and other liabilities whatsoever or howsoever caused arising directly or indirectly in connection with, in relation to or arising out of the use of the Content. This article may be used for research, teaching, and private study purposes. Any substantial or systematic reproduction, redistribution, reselling, loan, sub-licensing, systematic supply, or distribution in any form to anyone is expressly forbidden. Terms & Conditions of access and use can be found at http://www.tandfonline.com/page/terms- and-conditions
-
Upload
fitchburgstate -
Category
Documents
-
view
0 -
download
0
Transcript of The Impact of Military Spending and Income Inequality on Economic Growth in Turkey

This article was downloaded by: [University of Maine - Orono]On: 17 June 2014, At: 09:37Publisher: RoutledgeInforma Ltd Registered in England and Wales Registered Number: 1072954 Registeredoffice: Mortimer House, 37-41 Mortimer Street, London W1T 3JH, UK
Defence and Peace EconomicsPublication details, including instructions for authors andsubscription information:http://www.tandfonline.com/loi/gdpe20
The impact of military spending andincome inequality on economic growthin TurkeyÜnal Töngüra & Adem Yavuz Elverenb
a Department of Economics, Middle East Technical University,Ankara, Turkeyb Department of Economics, Keene State College, Keene, NH, USAPublished online: 17 Jun 2014.
To cite this article: Ünal Töngür & Adem Yavuz Elveren (2014): The impact of military spendingand income inequality on economic growth in Turkey, Defence and Peace Economics, DOI:10.1080/10242694.2014.925324
To link to this article: http://dx.doi.org/10.1080/10242694.2014.925324
PLEASE SCROLL DOWN FOR ARTICLE
Taylor & Francis makes every effort to ensure the accuracy of all the information (the“Content”) contained in the publications on our platform. However, Taylor & Francis,our agents, and our licensors make no representations or warranties whatsoever as tothe accuracy, completeness, or suitability for any purpose of the Content. Any opinionsand views expressed in this publication are the opinions and views of the authors,and are not the views of or endorsed by Taylor & Francis. The accuracy of the Contentshould not be relied upon and should be independently verified with primary sourcesof information. Taylor and Francis shall not be liable for any losses, actions, claims,proceedings, demands, costs, expenses, damages, and other liabilities whatsoever orhowsoever caused arising directly or indirectly in connection with, in relation to or arisingout of the use of the Content.
This article may be used for research, teaching, and private study purposes. Anysubstantial or systematic reproduction, redistribution, reselling, loan, sub-licensing,systematic supply, or distribution in any form to anyone is expressly forbidden. Terms &Conditions of access and use can be found at http://www.tandfonline.com/page/terms-and-conditions

THE IMPACT OF MILITARY SPENDING AND INCOMEINEQUALITY ON ECONOMIC GROWTH IN TURKEY
ÜNAL TÖNGÜRa* AND ADEM YAVUZ ELVERENb
aDepartment of Economics, Middle East Technical University, Ankara, Turkey; bDepartment ofEconomics, Keene State College, Keene, NH, USA
(Received 3 November 2013; in final form 16 April 2014)
An extensive literature on the effect of military expenditures on economic growth yields conflicting results.However, a crucial issue that has not been investigated in this context is the possible effect of inequality. Theimpact of military expenditures on economic growth in Turkey has also received substantial attention. Yet, themajority of these studies are not constructed based on a structural model, but rather examine the causality betweenthe variables in question. Considering these two shortcomings in the literature and the lack of consistent results,this study attempts to provide further evidence for the relationship between military expenditures and economicgrowth for the case of Turkey by considering income inequality within an augmented Solow growth model. Ourfindings for the 1963–2008 period show that while income inequality has a positive impact on economic growth,military expenditures have no significant effect.
Keywords: Military expenditure; Growth; Income inequality; Human capital; Solow growth model
JEL Codes: C22, H56, O11
1. INTRODUCTION
The literature on military expenditure and economic growth is led by the seminal work ofBenoit (1973). Since then different growth models, namely the Feder-Ram (Biswas andRam 1986), the Deger-type model (Deger and Smith 1983; Deger 1986), the model ofBarro (1990), the augmented Solow growth model (Mankiw, Romer, and Weil 1992), andthe new macroeconomic model of Romer (2000) and Taylor (2000), have been adopted toexplain the impact of military spending on economic growth. Also, an immense number ofstudies attempt to investigate this relationship by utilizing causality tests. This extensiveliterature yields conflicting results about the relationship between military spending andeconomic growth.
When it comes to Turkey, it is also observed that a large number of studies, among whichthe majority are causality analyses, present conflicting results. Therefore, the main goal ofthis paper is to provide further evidence for this literature by means of a structural modelfor the case of Turkey. The study is relevant for two reasons. First, the paper attempts to
*Corresponding author: Department of Economics, Middle East Technical University, Ankara, Turkey.Email: [email protected]
© 2014 Taylor & Francis
Defence and Peace Economics, 2014http://dx.doi.org/10.1080/10242694.2014.925324
Dow
nloa
ded
by [
Uni
vers
ity o
f M
aine
- O
rono
] at
09:
37 1
7 Ju
ne 2
014
investigate the effect of military expenditure on economic growth in Turkey with an aug-mented Solow growth model for the first time. Secondly, the study aims to broaden thenexus between military expenditures and economic growth by extending the understandingof human capital stock by considering income inequality. In the next section, we brieflyreview the literature. Section 3 introduces data and method. Section 4 is reserved for theresults and discussion. Finally, in conclusion we summarize the findings.
2. LITERATURE SURVEY
An extensive literature has investigated the relationship between military expenditure andeconomic growth since the seminal work of Benoit (1973, 1978), which argues that the mil-itary expenditures have a positive impact on economic growth. The later studies that utilizeKeynesian, neoclassical, and structuralist models provide conflicting results on the issue fordifferent set of countries (inter alia Dunne 1996; Knight, Loayza, and Villanueva 1996;Smith 2000; Yakovlev 2007; Hou and Chen 2013). Dunne, Smith, and Willenbockel (2004)summarizes the results of this diverse literature by stating that there is ‘an insignificant ornegative impact of military spending on economic growth in developing countries and aclearer negative impact in developed economies, through military spending being at theexpense of investment rather than consumption’ (4).
There is a growing literature that examines the effect of military expenditures on eco-nomic growth in Turkey. Most of these studies (to the best of our knowledge except forSezgin 1997, 2001; Özsoy 2000; Sezgin 2001; Halıcıoğlu 2004; Özdemir and Bayar 2006)utilize causality analyses. As summarized in Table I, for different time periods there is a sin-gle study that found a negative relationship between military expenditures and economicgrowth (Dunne, Nikolaidou, and Vougas 2001), four studies that found no significant rela-tionship (Kollias 1997; Sekmen and Saribas 2007; Görkem and Işık 2008; Yılancı andÖzcan 2010), and a majority of them that suggest the existence of a positive relationshipand unidirectional causality, mostly running from military expenditure to economic growth.However, a major shortcoming of these studies that employ causality analyses is that sincethey do not construct a structural model to determine the direction of causality they investi-gate a statistical causality rather than a theoretical one (Dunne and Smith 2010).
Very few studies on Turkey are based on a structural model. Using the Feder-Ram model,Sezgin (1997) finds that there is a positive relationship between military expenditures andeconomic growth for the period of 1950–1993. However, adopting the same model, Özsoy(2000), for the period of 1950–1992, finds no significant relationship. Utilizing aDeger-type multi-equation model, Sezgin (2001) also finds a positive impact of militaryexpenditure on economic growth for the period of 1956–1994. Following up Atesoglu(2002) which adopted the new macroeconomic model of Romer (2000), and Taylor (2000),which replaces the standard IS-LM and AD-AS models, Halıcıoğlu (2004) also providesevidence that there is a positive relationship between the variables in question for not onlyfiscal policies but also for monetary policies on the national income, for the period of1950–2002. Finally, Özdemir and Bayar (2006) present a negative relationship in a multi-region dynamic CGE model.
There is only one study that deals with defence spending, economic growth, and incomeinequality together. However, in that study, Aksoğan and Elveren (2012) investigate theeffect of social expenditures, defence spending, and economic growth on income inequalityin a Johansen cointegration analysis for the period of 1970–2008. Yet, the paper does notdeal with the direct effect of military expenditures on economic growth per se.
2 Ü. TÖNGÜR AND A. Y. ELVEREN
Dow
nloa
ded
by [
Uni
vers
ity o
f M
aine
- O
rono
] at
09:
37 1
7 Ju
ne 2
014

TABLE I Literature on Military Expenditure-growth Link in Turkey
Causality-cointegration analyses
Study Time Period Method Findings
Özmucur (1996) 1924–1994 Granger causality and VAR Unidirectional causality from ME to
growth
Kollias (1997) 1954–1993 Granger causality No relationship between ME and growth
Sezgin (2000a) 1955–1994 Granger causality and ECM Positive impact of ME on growth
Sezgin (2000b) 1924–1996 Granger causality Unidirectional causality from ME to
growth
Dunne,
Nikolaidou,
and Vougas
(2001)
1960–1996 VAR and Granger Negative causality from ME to growth
Yıldırım and
Sezgin (2002)
1949–1994 VAR Positive impact of ME on growth
Dritsakis (2004) 1960–2001 Granger causality and Johansen
cointegration
Unidirectional causality from growth to
ME
Karagöl and
Palaz (2004)
1955–2000 Granger causality and Johansen
cointegration
Unidirectional causality from ME to
growth
Kalyoncu and
Yücel (2006)
1956–2003 Granger causality Unidirectional causality from growth to
ME
Sekmen and
Saribas (2007)
1974–2005 Granger causality and Johansen
cointegration
No significant relationship between ME
and growth
Erdogdu (2008) 1968–2004 VAR Positive impact of ME on growth
Görkem and Işık(2008)
1968–2006 VAR and Granger No causality between ME and growth
Özsoy (2008) 1933–2004 VAR Unidirectional causality from ME to
growth
Karagianni and
Pempetzoglu
(2009)
1949–2004 Non-linear Granger causality Unidirectional non-linear causality from
ME to growth
Şahin and
Çetinkaya
(2010)
01/2004–12/
2008
OLS, Granger causality and
Johansen cointegration tests
Positive relationship between ME and
growth
Yılancı andÖzcan (2010)
1950–2006 Gregory-Hansen cointegration tests
and Toda-Yamamato Granger
Causality test
No long-run relationship between ME
and GNP, unidirectional causality from
GNP to ME
Ozun and
Erbaykal
(2011)
1949–2006 Toda-Yamamato Granger Causality
test
Bilateral relationship between ME and
growth
With structural models
Study Time Period Method Findings
Sezgin (1997) 1950–1993 Feder-Ram model with human
capital
Positive impact on ME on growth
Özsoy (2000) 1950–1992 Feder-Ram model No significant impact of ME on growth
Sezgin (2001) 1956–1994 Deger type multi-equation model Positive impact of ME on growth
Halıcıoğlu (2004) 1950–2002 The New Macroeconomic Model Positive relationship between ME and
aggregate output
Özdemir and
Bayar (2006)
A multi region dynamic CGE
model
Negative impact of ME on growth
Source: Authors’ review, the review is limited to the studies that only focus on Turkey or Turkey and Greece.
THE IMPACT OF MILITARY SPENDING AND INCOME INEQUALITY 3
Dow
nloa
ded
by [
Uni
vers
ity o
f M
aine
- O
rono
] at
09:
37 1
7 Ju
ne 2
014

In this study, we adopt the augmented Solow growth model suggested by Mankiw,Romer, and Weil (1992) in order to investigate the possible relationship between militaryexpenditure and economic growth. Another novelty of this paper is that we incorporate payinequality as a proxy for income inequality (see Section 3 for an explanation on the inequal-ity index) by considering that both military expenditures and human capital stock might bedeterminants of economic growth, and that there is a crucial interaction between humancapital and inequality.
The growth-inequality nexus is one of the most crucial and controversial topics amongeconomists. The empirical studies provide inconclusive evidence. This short section aims atsketching the main lines of this immense literature. How inequality affects growth can beexplained in six ways in general (Barro 2000; Nissanke and Thorbecke 2010). First, anindividual’s savings rate increases with her income; that is, the marginal propensity to saveout of profit is higher than that out of wages, therefore, redistribution of income from poorto rich results in higher savings and higher investment in physical capital. Therefore, moreinequality stimulates economic growth. Second, since investment projects have large sunkcosts, a concentration of assets is a condition for higher investment rates. That is, higherinequality in terms of the distribution of wealth increases the probability to invest, which inturn enhances growth. Third, individual effort depends on the wage level and means-testedwelfare payments such that levies on labor income discourage work effort. Therefore, ifthere is equality among individuals in terms of earnings there will be no encouragement forone to make an effort that creates more output. In other words, higher income dispersion isa natural result of differing work efforts and this has positive effect on total output.
On the other hand, two theories point out the negative impact of inequality on growth.First, poor people have a tendency to invest less in human capital that offers relatively highrates of return. Therefore, in this case, a distortion in terms of the redistribution of wealthfrom rich to poor increases the average productivity of investment. In other words, from thispoint of view, lower inequality will promote economic growth. And, finally, according tothe new political economy of development theories (i.e. modern theories), inequality mayreduce economic growth because the existence of political and social instability leads togreater uncertainty and lower investment (Kanbur 2000), unproductive rent-seeking activi-ties, high transaction costs, and increased insecurity of property rights (Nissanke andThorbecke 2010, 798).
The Kuznets hypothesis, on the other hand, explains the same link from the oppositedirection (i.e. the growth-inequality link). The hypothesis states that at the outset ofeconomic growth, transformation from an agricultural to an industrial economy and theadoption of the new technologies favor a small number of people in the economy; but inthe due course of development, these new methods of production spread and the benefit ofgrowth is shared more evenly. That is, according to the Kuznets curve, growth causesincome inequality in the early stage of economic development, but then the distribution ofincome improves. Barro (2000) and later on in its updated and extended version Barro(2008) confirm that the Kuznets hypothesis is valid for a wide selection of countries.
Although it is showed that more unequal economies grow more slowly (inter alia Alesinaand Rodrik 1994; Persson and Tabellini 1994; Ravallion 1995; Perotti 1996; Garcia-Penalosaand Turnovsky 2006), it is argued that due to the lack of high quality data and comparabilityproblems this negative relationship is not robust (Ferreira 1999). For instance, usingadvanced econometric methods and a more comprehensive data-set Forbes (2000) found apositive relationship between inequality and growth along with some others (e.g. Li and Zou1998; Lundberg and Squire 2003). Castelló-Climent (2010) shows that while inequality has anegative effect on growth in low and middle income countries, the effect becomes positive
4 Ü. TÖNGÜR AND A. Y. ELVEREN
Dow
nloa
ded
by [
Uni
vers
ity o
f M
aine
- O
rono
] at
09:
37 1
7 Ju
ne 2
014
for higher income countries. In sum, an immense and fast growing literature on whetherinequality is harmful for growth or not has provided inconclusive evidence.
3. METHOD AND DATA
Most of the studies on the effect of military expenditures rely on strict theoretical frame-works. The Feder-Ram model (Biswas and Ram 1986), based on Feder’s (1983, 1986)model of the effects of exports on economic growth in developing countries, is a major neo-classical model with a single regression equation that allows a direct link from theoreticalmodel to econometric specification. However, this model has been criticized due to both itstheoretical and econometric problems (Dunne, Smith, and Willenbockel 2005). The Deger-type model (Deger and Smith 1983; Deger 1986), on the other hand, incorporates thedemand and supply side effects of military expenditures on economic growth by means ofsimultaneous equation models.
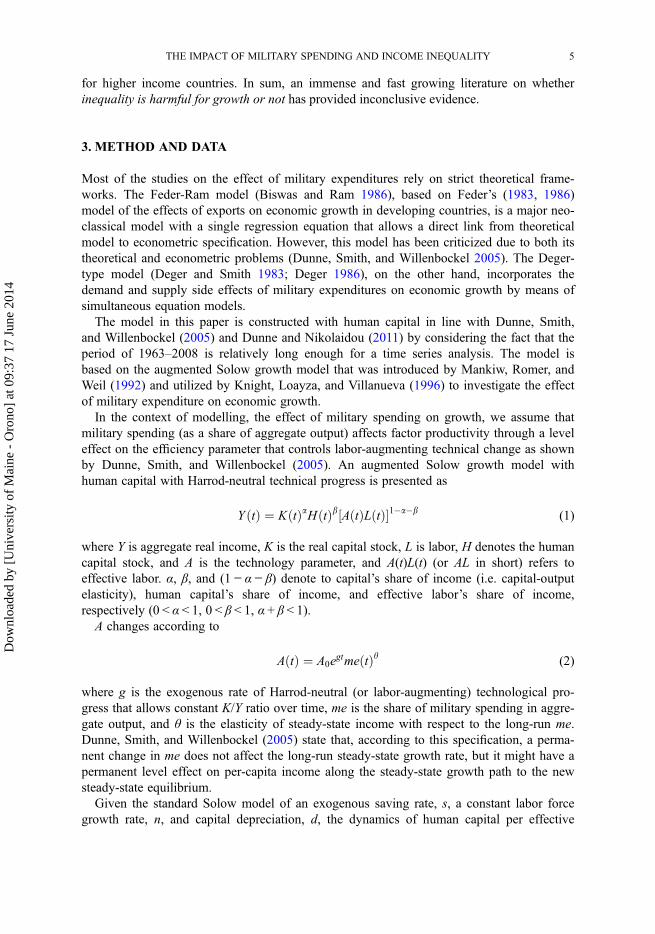
The model in this paper is constructed with human capital in line with Dunne, Smith,and Willenbockel (2005) and Dunne and Nikolaidou (2011) by considering the fact that theperiod of 1963–2008 is relatively long enough for a time series analysis. The model isbased on the augmented Solow growth model that was introduced by Mankiw, Romer, andWeil (1992) and utilized by Knight, Loayza, and Villanueva (1996) to investigate the effectof military expenditure on economic growth.
In the context of modelling, the effect of military spending on growth, we assume thatmilitary spending (as a share of aggregate output) affects factor productivity through a leveleffect on the efficiency parameter that controls labor-augmenting technical change as shownby Dunne, Smith, and Willenbockel (2005). An augmented Solow growth model withhuman capital with Harrod-neutral technical progress is presented as
Y ðtÞ ¼ KðtÞaHðtÞb AðtÞLðtÞ½ �1�a�b (1)
where Y is aggregate real income, K is the real capital stock, L is labor, H denotes the humancapital stock, and A is the technology parameter, and A(t)L(t) (or AL in short) refers toeffective labor. α, β, and (1 − α − β) denote to capital’s share of income (i.e. capital-outputelasticity), human capital’s share of income, and effective labor’s share of income,respectively (0 < α < 1, 0 < β < 1, α + β < 1).
A changes according to
AðtÞ ¼ A0egtmeðtÞh (2)
where g is the exogenous rate of Harrod-neutral (or labor-augmenting) technological pro-gress that allows constant K/Y ratio over time, me is the share of military spending in aggre-gate output, and θ is the elasticity of steady-state income with respect to the long-run me.Dunne, Smith, and Willenbockel (2005) state that, according to this specification, a perma-nent change in me does not affect the long-run steady-state growth rate, but it might have apermanent level effect on per-capita income along the steady-state growth path to the newsteady-state equilibrium.
Given the standard Solow model of an exogenous saving rate, s, a constant labor forcegrowth rate, n, and capital depreciation, d, the dynamics of human capital per effective
THE IMPACT OF MILITARY SPENDING AND INCOME INEQUALITY 5
Dow
nloa
ded
by [
Uni
vers
ity o
f M
aine
- O
rono
] at
09:
37 1
7 Ju
ne 2
014

worker (he =H/AL), and physical capital per effective worker (ke = K/AL) in the model areformulated as:
heðtÞ ¼ shyeðtÞ � ðnþ g þ dÞheðtÞ and keðtÞ ¼ skyeðtÞ � ðnþ g þ dÞkeðtÞ (3)
where sh and sk refer the shares of human and of physical capital investment in aggregateincome, ye refers Y/AL. Human capital is also assumed to depreciate at the rate d like physi-cal capital. The steady-state levels of physical and human capital stock and output (income)are:
k�e ¼ sbhs1�bk
nþ g þ d
" #1=ð1�a�bÞh�e ¼
s1�ah sak
nþ g þ d
� �1=ð1�a�bÞy�e ¼
sbhsak
ðnþ g þ dÞaþb
" #1=ð1�a�bÞ(4)
The transitory dynamics of income per effective worker in a neighborhood of the steadystate are approximated by
@ ln ye@t
¼ aþ b� 1ð Þðnþ g þ dÞ ln yeðtÞ � ln y�e� �
(5)
Then, this transitory dynamics of output per worker can be converted into a suitableform for empirical analysis
ln yðtÞ ¼ ez ln yðt � 1Þ þ ð1� ezÞ� lnA0 þ a
1� a� bln sk þ b
1� a� bln sh � aþ b
1� a� blnðnþ g þ dÞ
� �þ h lnmeðtÞ � ezh lnmeðt � 1Þ þ t � ðt � 1Þezð Þg (6)
where z = (α + β − 1)(n + g + d)Based on Equation (6), we can estimate the following model:
growtht ¼b0 þ b1 ln yt�1 þ b2 ln st þ b3 lnðnt þ g þ dÞþ b4 ln ht þ b5 lnmet þ b6 lnmet�1 þ et
(7)
where growth is log growth GDP per capita (or log growth GDP per labor force as alterna-tive). While there is a distinction between model of the level of output and model of thegrowth rate, the difference is not very important in practice as shown by Dunne, Smith, andWillenbockel (2005), Yakovlev (2007), Heo (2010), and Hou and Chen (2013). s is the pri-vate-sector savings ratio, using gross capital formation/GDP as a proxy in line with -interalia- Mankiw, Romer, and Weil (1992) and Yakovlev (2007). (nt + g + d) is the summationof labor force growth rate and 0.05, me is the share of military expenditures in GDP, and,finally, h is the human capital stock.
The data of military expenditures are obtained from SIPRI and NATO. GDP per capitaand gross capital formation as share of GDP are taken from the World Bank World Devel-opment Indicators data-set. Labor force data are obtained from the Ministry of Developmentof Turkey. Below are two other variables, human capital and inequality, which deserve amore detailed discussion.
6 Ü. TÖNGÜR AND A. Y. ELVEREN
Dow
nloa
ded
by [
Uni
vers
ity o
f M
aine
- O
rono
] at
09:
37 1
7 Ju
ne 2
014

3.1. Human Capital and Inequality
A novelty of this paper is to consider income inequality in the context of the human capitalstock. It is argued that in the early stages of the Industrial Revolution, the engine of eco-nomic growth was physical capital accumulation, so that inequality promoted developmentby directing resources toward individuals with a higher marginal propensity to save (Galorand Moav 2004; Galor 2011). However, with the seminal work of Becker (1967) econo-mists began to pay more attention to human capital. As human capital has become moreimportant in the development process, equality stimulated growth by alleviating adverseeffects of credit constraints on human capital accumulation (Galor 2011; Turnovsky 2011).Although larger accumulation of human capital is only possible if a larger part of societyshares it ‘inequality in the ownership of factors of production has generated an incentive forsome better-endowed agents to block the implementation of institutional changes and poli-cies that promote human capital formation, resulting in a suboptimal level of investment inhuman capital from a growth perspective’ (Galor 2011, 468).
Inequality deters growth by increasing fertility and reducing life expectancy (Dahan andTsiddon 1998; Kremer and Chen 2002; De la Croix and Doepke 2003; Moav 2005;Castelló-Climent and Doménech 2008; Castello-Climent 2011). Ceteris paribus higherinequality in the distribution of education causes both higher fertility rates and higher differ-ential fertility rates between lower and higher educated parents, which in turn lead to lessaccumulation of human capital and to a lower rate of economic growth Castello-Climent(2011).
The model introduced by Kremer and Chen (2002) shows a direct linkage betweenincome inequality and education level and fertility rate. Kremer and Chen construct theirmodel based on the assumption that the optimal fertility rate is a decreasing function ofwages because as household income increases the opportunity cost of rearing children risessince substitution effects outweigh income effects; this is mostly applicable to middle-income countries. Their model suggests that rich people are likely to have less but moreeducated children, and poor people are likely to have more but less educated children.1
Therefore, higher income inequality leads to higher fertility and education differentialsbetween poor and rich households, and the skilled-to-unskilled labor ratio falls. Based ontheir own model, the authors also empirically show the positive impact of inequality on fer-tility differentials. Adopting a similar model in line with Kremer and Chen (2002) and Dela Croix and Doepke (2003), Razak (2006) shows that fertility differentials adversely affectthe human capital stock, increasing inequality, and lowering the growth rate.
Tinbergen (1975) stated that inequality is ultimately determined by two opposing effectson the relative wage, while technology increases the demand for skilled labor, educationincreases its supply (cited in Eicher and Garcia-Penalosa 2001). Eicher and Garcia-Penalosa(2001) state that greater supplies of human capital lower the skill premium and inequalitydirectly and indirectly lead to more innovations that increase the demand for skilled workersto absorb new technologies into production. In this context, the authors argue that the ulti-mate outcomes of growth on inequality depend on social returns to education, the evolutionof the direct cost of education, and the elasticity of substitution in production betweenskilled and unskilled workers.
Within this framework, it can be argued that skill-biased technological change depreciateseffective human capital stock (i.e. by appreciating skilled labor more), while education addsto this stock at aggregate level. On the one hand, there has been a steady increase in
1See Duygan and Guner (2006) for some evidence for this argument in Turkey.
THE IMPACT OF MILITARY SPENDING AND INCOME INEQUALITY 7
Dow
nloa
ded
by [
Uni
vers
ity o
f M
aine
- O
rono
] at
09:
37 1
7 Ju
ne 2
014

education levels and a decline in the inequality of education levels across countries for thelast four decades (Castello-Climent and Domenech 2012), and on the other hand, changingtechnology has resulted in the use of ‘less labor with higher skill’ consistently. However,while there is decline in inequality in education levels across countries, there is an increasein income inequality within countries, a result of inequality in education opportunities andinequality in returns of different education levels. That is why it is more efficient not toconsider education alone but along with its result, inequality.
Therefore, we argue that using standard human capital variables, such as the schoolingrate, could be less informative in terms of the effect of the economic growth rate. We arguethat effective human capital stock, the outcome of skill-biased technological change, can bebest captured using the Theil pay inequality index. That is, we may consider pay inequalityas a measure for ‘effective human capital stock’ along with the standard human capitalvariables.
A novelty of this study is that based on the models by Eicher and Garcia-Penalosa(2001) and Kremer and Chen (2002), we define effective human capital stock as a functionof the overall schooling rate (education level) and income inequality, where the latter ismeasured by Theil pay inequality.2
h ¼ ðhci; ineqÞ ¼ b0 þ b1hci þ b2ineqþ b3hci � ineq (8)
where h denotes effective human capital, hc refers standard human capital stock variableswith i = schooling rate for age 15+, schooling rate for age 25+, and human capital index,and ineq stands for inequality represented by the Theil pay inequality index. Regarding theabove argument, human capital and income inequality can be considered together as thedeterminants of growth, and the interaction of these two variables is also controlled for inour regressions.
There is a vast literature on human capital and its measurement (Kwon 2009). Amongmany others such as the cost-based approach, where the stock of human capital is measuredby summing costs invested in one’s human capital, and the income-based approach, whereit is computed based on the returns which an individual obtains from a labor marketthroughout the investment in education, perhaps the most commonly used method is theoutput-based approach to measure the stock of human capital by considering ‘school enroll-ment rates’ as a proxy for human capital, suggested by Barro (1991) and Barro and Lee(1993). Two alternative measures for human capital,3 average schooling rates for age 15 +and age 25 + are provided by Barro and Lee (2013), and the third alternative variable,human capital index, is taken from the Penn World Tables.4
This paper incorporates pay/income inequality into the nexus of the military expenditure-growth relationship by utilizing the industrial pay inequality index as a proxy for incomeinequality for the first time. We acknowledge that manufacturing is just one part of overalleconomic activities, and therefore pay inequality and income inequality are not the samething. However, we consider manufacturing pay inequality to be an appropriate indicator of
2We acknowledge that our reduced form of the growth model prevent us from capturing specific dynamics of inter-action between inequality and human capital. However, such an investigation is out of scope of this paper. Themain aim of this paper is to understand better the effect of military expenditures on economic growth by consider-ing income inequality.3Schooling data from Barro and Lee (2013) are extrapolated into annual observations without distorting the originalseries behavior.4As defined in Penn World Tables 8.0, the human capital index is based on years of schooling by Barro and Lee(2010) and returns to education (Psacharopoulos 1994).
8 Ü. TÖNGÜR AND A. Y. ELVEREN
Dow
nloa
ded
by [
Uni
vers
ity o
f M
aine
- O
rono
] at
09:
37 1
7 Ju
ne 2
014

overall income inequality in line with Galbraith and Conceição (2001) and Galbraith andKum (2005).
Galbraith and Conceição (2001) and Galbraith and Kum (2005) show that manufacturingpay inequality measured by the between-group Theil’s T statistic is a robust indicator of thetrend of overall income inequality. In fact, after controlling for survey type and the share ofmanufacturing employment in a population, manufacturing sector’s pay inequality hasgreater consistency across time and countries than is shown using the Deininger and Squireinequality measure5 (Galbraith and Kum 2005).
The University of Texas Inequality Project (UTIP) computes the pay inequality index for167 countries for the 1963–2008 period. The Theil Index contains the between-group, TB,and the within-group component, TW (Theil 1972). Since the data are provided at an aggre-gate level, only the between group component, TB, is available, and can be stated asfollows:
TB ¼Xni¼1
pi
P
� � yi
l
�� ln yi
l
�� �(9)
where i indexes groups, pi is the population of group i, P is the total population, yi is theaverage wage in group i, and μ is the average wage of the entire population. When thevalue of index is 0 (zero), this represents perfect equality and the value increases as inequal-ity rises.
We utilize the pay inequality index provided by Elveren (2012), in which three indices ofpay inequality calculated by Theil T are combined. Elveren (2012) uses pay inequality inthe manufacturing sector calculated by UTIP based on UNIDO Industrial Statistics, namelyUTIP-UNIDO for the period of 1963–1979, one provided by Elveren and Galbraith (2009)based on the Annual Manufacturing Industry Statistics for the period of 1980–2001, and hisown calculation for the post-2002 period based on data provided by the TurkStat.6
4. RESULTS AND DISCUSSION
The paper employs the OLS method to investigate the effect of income inequality and mili-tary expenditures on economic growth in an augmented Solow growth model. A usual stepis to check whether there are some basic problems in the estimations. Particularly, weshould be concerned about non-stationarity and autocorrelation since we use time seriesdata. Granger and Newbold (1974) point out that estimation results using time series data
5Furthermore, the same authors note that, in fact, many major studies prefer considering pay inequality instead ofincome inequality since the latter has very sparse coverage, causing unrobust, and misleading results. In case ofTurkey, it is worth noting that Gini values are available only for four years before the 2000s. However, the reasonto utilize manufacturing pay inequality is beyond the lack of Gini values. Regarding post-2002 period in whichGini coefficients are available, the simple correlation coefficient between Gini values and Theil values is as high as0.777. Considering the fact that share of manufacturing in total employment was larger in previous decades, it isplausible to argue that the pay inequality has substantial explanatory power on income inequality. It is true thatthere exists a large informal economy in Turkey. However, as a matter of fact, this would strengthen our results asour pay inequality index presents the lower bound of ‘the actual’ pay inequality in the economy with a large infor-mal sector. Also, because of the way we incorporate inequality into the model, pay inequality is not supposed tomimic income inequality. The reason is that we are interested in the interaction between schooling rate and inequal-ity, in which the relationship between education level and wage income is more plausible than the one with non-wage income.6See Elveren (2012) and the UTIP for further discussion on the Theil Index and several case studies, http://utip.gov.utexas.edu.
THE IMPACT OF MILITARY SPENDING AND INCOME INEQUALITY 9
Dow
nloa
ded
by [
Uni
vers
ity o
f M
aine
- O
rono
] at
09:
37 1
7 Ju
ne 2
014
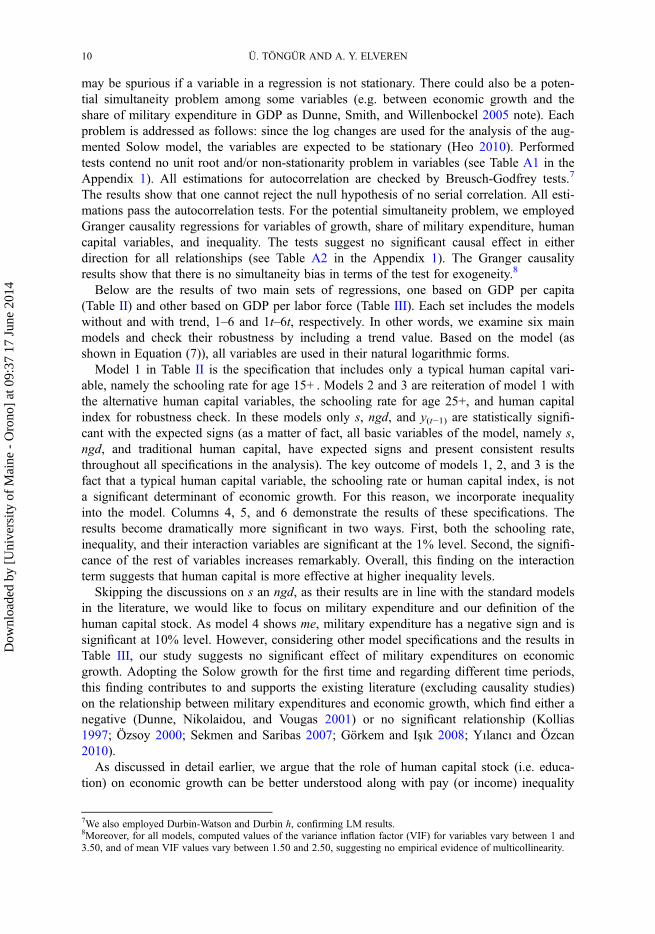
may be spurious if a variable in a regression is not stationary. There could also be a poten-tial simultaneity problem among some variables (e.g. between economic growth and theshare of military expenditure in GDP as Dunne, Smith, and Willenbockel 2005 note). Eachproblem is addressed as follows: since the log changes are used for the analysis of the aug-mented Solow model, the variables are expected to be stationary (Heo 2010). Performedtests contend no unit root and/or non-stationarity problem in variables (see Table A1 in theAppendix 1). All estimations for autocorrelation are checked by Breusch-Godfrey tests.7
The results show that one cannot reject the null hypothesis of no serial correlation. All esti-mations pass the autocorrelation tests. For the potential simultaneity problem, we employedGranger causality regressions for variables of growth, share of military expenditure, humancapital variables, and inequality. The tests suggest no significant causal effect in eitherdirection for all relationships (see Table A2 in the Appendix 1). The Granger causalityresults show that there is no simultaneity bias in terms of the test for exogeneity.8
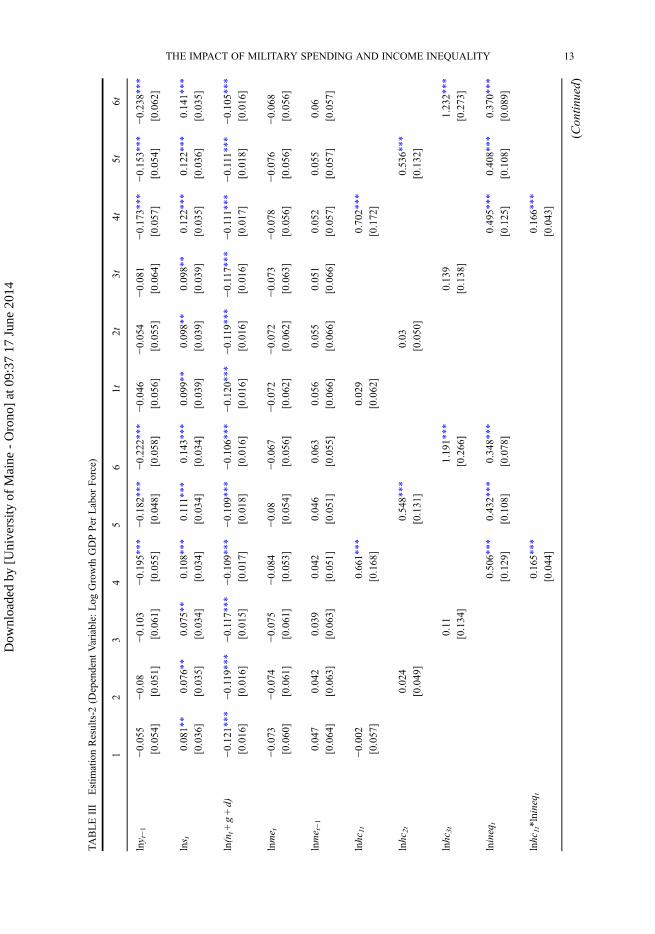
Below are the results of two main sets of regressions, one based on GDP per capita(Table II) and other based on GDP per labor force (Table III). Each set includes the modelswithout and with trend, 1–6 and 1t–6t, respectively. In other words, we examine six mainmodels and check their robustness by including a trend value. Based on the model (asshown in Equation (7)), all variables are used in their natural logarithmic forms.
Model 1 in Table II is the specification that includes only a typical human capital vari-able, namely the schooling rate for age 15+ . Models 2 and 3 are reiteration of model 1 withthe alternative human capital variables, the schooling rate for age 25+, and human capitalindex for robustness check. In these models only s, ngd, and y(t−1) are statistically signifi-cant with the expected signs (as a matter of fact, all basic variables of the model, namely s,ngd, and traditional human capital, have expected signs and present consistent resultsthroughout all specifications in the analysis). The key outcome of models 1, 2, and 3 is thefact that a typical human capital variable, the schooling rate or human capital index, is nota significant determinant of economic growth. For this reason, we incorporate inequalityinto the model. Columns 4, 5, and 6 demonstrate the results of these specifications. Theresults become dramatically more significant in two ways. First, both the schooling rate,inequality, and their interaction variables are significant at the 1% level. Second, the signifi-cance of the rest of variables increases remarkably. Overall, this finding on the interactionterm suggests that human capital is more effective at higher inequality levels.
Skipping the discussions on s an ngd, as their results are in line with the standard modelsin the literature, we would like to focus on military expenditure and our definition of thehuman capital stock. As model 4 shows me, military expenditure has a negative sign and issignificant at 10% level. However, considering other model specifications and the results inTable III, our study suggests no significant effect of military expenditures on economicgrowth. Adopting the Solow growth for the first time and regarding different time periods,this finding contributes to and supports the existing literature (excluding causality studies)on the relationship between military expenditures and economic growth, which find either anegative (Dunne, Nikolaidou, and Vougas 2001) or no significant relationship (Kollias1997; Özsoy 2000; Sekmen and Saribas 2007; Görkem and Işık 2008; Yılancı and Özcan2010).
As discussed in detail earlier, we argue that the role of human capital stock (i.e. educa-tion) on economic growth can be better understood along with pay (or income) inequality
7We also employed Durbin-Watson and Durbin h, confirming LM results.8Moreover, for all models, computed values of the variance inflation factor (VIF) for variables vary between 1 and3.50, and of mean VIF values vary between 1.50 and 2.50, suggesting no empirical evidence of multicollinearity.
10 Ü. TÖNGÜR AND A. Y. ELVEREN
Dow
nloa
ded
by [
Uni
vers
ity o
f M
aine
- O
rono
] at
09:
37 1
7 Ju
ne 2
014

TABLEII
Estim
ationResults-1
(Dependent
Variable:
Log
Growth
GDPPer
Capita)
12
34
56
1t2t
3t4t
5t6t
lny t−1
−0.097*
−0.12
0**
−0.159**
−0.257***
−0.233***
−0.26
8***
−0.085
−0.093*
−0.135**
−0.23
0***
−0.207***
−0.292***
[0.053
][0.055
][0.061
][0.054
][0.050
][0.060
][0.053
][0.053
][0.058
][0.056
][0.053
][0.064
]
lns t
0.087**
0.08
6**
0.087**
0.133***
0.135***
0.16
7***
0.103***
0.104***
0.107***
0.14
3***
0.142***
0.165***
[0.034
][0.034
][0.033
][0.031
][0.031
][0.032
][0.038
][0.038
][0.037
][0.033
][0.033
][0.033
]
ln(n
t+g+d)
−0.045***
−0.04
4***
−0.042***
−0.035**
−0.035**
−0.03
3**
−0.044***
−0.043***
−0.041***
−0.03
6***
−0.036***
−0.032**
[0.013
][0.013
][0.013
][0.013
][0.013
][0.012
][0.014
][0.014
][0.014
][0.013
][0.013
][0.012
]
lnme t
−0.078
−0.07
6−0.076
−0.084*
−0.081
−0.06
6−0.077
−0.075
−0.075
−0.07
9−0.078
−0.067
[0.059
][0.059
][0.059
][0.049
][0.050
][0.053
][0.061
][0.061
][0.061
][0.052
][0.052
][0.052
]
lnme t−1
0.05
0.04
80.045
0.057
0.06
0.07
90.058
0.057
0.056
0.06
50.066
0.076
[0.062
][0.061
][0.061
][0.048
][0.049
][0.052
][0.064
][0.064
][0.064
][0.053
][0.053
][0.053
]
lnhc
1t
0.026
0.688***
0.056
0.72
3***
[0.045
][0.156
][0.053
][0.166
]
lnhc
2t
0.04
20.564***
0.049
0.562***
[0.042
][0.127
][0.043
][0.129
]
lnhc
3t
0.169
1.15
5***
0.201*
1.192***
[0.109
][0.259
][0.113
][0.266
]
lnineq
t0.538***
0.459***
0.35
6***
0.52
9***
0.445***
0.382***
[0.126
][0.108
][0.080
][0.127
][0.109
][0.091
]
lnhc
1t*lnineq
t0.174***
0.17
4***
[0.043
][0.043
]
(Contin
ued)
THE IMPACT OF MILITARY SPENDING AND INCOME INEQUALITY 11
Dow
nloa
ded
by [
Uni
vers
ity o
f M
aine
- O
rono
] at
09:
37 1
7 Ju
ne 2
014

TABLEII
(Con
tinued)
12
34
56
1t2t
3t4t
5t6t
lnhc
2t*lnineq
t0.144***
0.141***
[0.035
][0.035
]
lnhc
3t*lnineq
t0.121***
0.12
8***
[0.029
][0.031
]
Trend
−0.022
−0.01
8−0.02
−0.022
−0.012
0.01
[0.015
][0.013
][0.014
][0.014
][0.012
][0.014
]
Con
stant
0.835
1.075*
1.147**
4.25
0***
3.759***
1.672***
0.961*
1.00
6*1.075**
4.230***
3.601***
1.80
1***
[0.517
][0.543
][0.427
][0.770
][0.678
][0.404
][0.548
][0.532
][0.408
][0.805
][0.679
][0.404
]
F-test
6.434***
6.88**
*2.75**
7.99
5***
7.756***
5.49**
*5.335***
5.59
2***
2.56**
7.122***
6.813***
4.82**
*
R2
0.276
0.288
0.303
0.48
70.497
0.550
0.300
0.30
60.326
0.507
0.504
0.55
4
Adj
R2
0.162
0.175
0.192
0.37
30.386
0.449
0.167
0.17
50.199
0.380
0.376
0.43
9
Breusch-G
odfrey
LM
0.567
0.701
1.098
0.00
50.031
0.029
0.591
0.64
61.021
0.107
0.172
0.00
8
Prob>chi2
(0.451
)(0.402
)(0.295
)(0.947
)(0.860
)(0.865
)(0.442
)(0.422
)(0.312
)(0.744
)(0.679
)(0.929
)
Note:
Robuststandard
errors
inbrackets.
***p
<0.01;**p<0.05;*p
<0.1.
12 Ü. TÖNGÜR AND A. Y. ELVEREN
Dow
nloa
ded
by [
Uni
vers
ity o
f M
aine
- O
rono
] at
09:
37 1
7 Ju
ne 2
014
TABLEIII
Estim
ationResults-2
(Dependent
Variable:
Log
Growth
GDPPer
Labor
Force)
12
34
56
1t2t
3t4t
5t6t
lny t−1
−0.055
−0.08
−0.103
−0.195***
−0.182***
−0.222***
−0.04
6−0.054
−0.08
1−0.173***
−0.153***
−0.23
8***
[0.054
][0.051
][0.061
][0.055
][0.048
][0.058
][0.056
][0.055
][0.064
][0.057
][0.054
][0.062
]
lns t
0.081**
0.07
6**
0.075**
0.108***
0.111***
0.143***
0.09
9**
0.098**
0.09
8**
0.122***
0.122***
0.14
1***
[0.036
][0.035
][0.034
][0.034
][0.034
][0.034
][0.039
][0.039
][0.039
][0.035
][0.036
][0.035
]
ln(n
t+g+d)
−0.121***
−0.119***
−0.117***
−0.109***
−0.109***
−0.106***
−0.12
0***
−0.119***
−0.117***
−0.111***
−0.111***
−0.10
5***
[0.016
][0.016
][0.015
][0.017
][0.018
][0.016
][0.016
][0.016
][0.016
][0.017
][0.018
][0.016
]
lnme t
−0.073
−0.07
4−0.075
−0.084
−0.08
−0.067
−0.07
2−0.072
−0.07
3−0.078
−0.076
−0.06
8
[0.060
][0.061
][0.061
][0.053
][0.054
][0.056
][0.062
][0.062
][0.063
][0.056
][0.056
][0.056
]
lnme t−1
0.047
0.04
20.039
0.042
0.046
0.063
0.05
60.055
0.05
10.052
0.055
0.06
[0.064
][0.063
][0.063
][0.051
][0.051
][0.055
][0.066
][0.066
][0.066
][0.057
][0.057
][0.057
]
lnhc
1t
−0.002
0.661***
0.02
90.702***
[0.057
][0.168
][0.062
][0.172
]
lnhc
2t
0.02
40.548***
0.03
0.536***
[0.049
][0.131
][0.050
][0.132
]
lnhc
3t
0.11
1.191***
0.13
91.23
2***
[0.134
][0.266
][0.138
][0.273
]
lnineq
t0.506***
0.432***
0.348***
0.495***
0.408***
0.37
0***
[0.129
][0.108
][0.078
][0.125
][0.108
][0.089
]
lnhc
1t*lnineq
t0.165***
0.166***
[0.044
][0.043
]
(Contin
ued)
THE IMPACT OF MILITARY SPENDING AND INCOME INEQUALITY 13
Dow
nloa
ded
by [
Uni
vers
ity o
f M
aine
- O
rono
] at
09:
37 1
7 Ju
ne 2
014

TABLEIII
(Contin
ued)
12
34
56
1t2t
3t4t
5t6t
lnhc
2t*lnineq
t0.137***
0.132***
[0.035
][0.035
]
lnhc
3t*lnineq
t0.120***
0.12
7***
[0.028
][0.031
]
Trend
−0.02
2−0.02
−0.02
2−0.026*
−0.015
0.00
7
[0.015
][0.014
][0.014
][0.014
][0.013
][0.014
]
Con
stant
0.288
0.57
30.627
3.586 ***
3.205***
1.216***
0.44
30.511
0.57
23.632***
3.000***
1.30
0***
[0.583
][0.572
][0.451
][0.855
][0.708
][0.425
][0.613
][0.581
][0.455
][0.875
][0.726
][0.431
]
F-test
16.6**
*18
.02***
6.53**
*11.94***
11.72***
8.24**
*15
.34***
16.0**
*5.85**
*10
.62***
10.06***
7.16**
*
R2
0.501
0.50
40.508
0.602
0.612
0.648
0.51
70.519
0.52
50.620
0.619
0.64
8
Adj
R2
0.423
0.42
60.430
0.514
0.526
0.568
0.12
60.428
0.43
60.522
0.521
0.55
8
Breusch-G
odfrey
LM
0.008
0.00
00.006
0.332
0.570
0.517
0.00
10.000
0.011
0.898
0.994
0.50
8
Prob>chi2
(0.930
)(0.988
)(0.938
)(0.565
)(0.450
)(0.472
)(0.973
)(0.996
)(0.916
)(0.343
)(0.319
)0.47
6
Note:
Robuststandard
errors
inbrackets.
***p
<0.01;**p<0.05;*p
<0.1.
14 Ü. TÖNGÜR AND A. Y. ELVEREN
Dow
nloa
ded
by [
Uni
vers
ity o
f M
aine
- O
rono
] at
09:
37 1
7 Ju
ne 2
014

in the economy. In other words, it can be argued that the conventional human capital vari-ables used in the literature may not be sufficiently explanatory in the context of economicgrowth. For instance, it is hard to capture the effect of the schooling rate which has steadypositive trends across the world on the growth performances, but in most countries is highlyvolatile. Our model provides some important findings regarding this argument. First of all,models 1, 2, and 3 present no significant effect of human capital on economic growth.However, considering inequality as a key interaction factor with education level, our resultsshow that all three variables (schooling rate, inequality and the interaction term) are highlysignificant and positive. A positive relationship between the overall education level and eco-nomic growth is evident in the literature. However, our findings, positive and significantsigns of inequality and its interaction with the education level, suggest that an increase inoverall education level has (also) an indirect effect on economic growth via income inequal-ity. In fact, some previous studies have made evident that a higher schooling rate does nothave an improving effect on income distribution, but rather that it is one major factor thatleads to higher income inequality in Turkey (Duygan and Guner 2006; Duman 2008;Aksogan and Elveren 2012). Therefore, this study sheds more light on the education-inequality-economic growth linkage in the Turkish case.
The general finding that income inequality has a positive impact on economic growth, onthe other hand, is in line with three general theoretical approaches (Barro 2000, Nissankeand Thorbecke 2010). First, the redistribution of income from poor to rich results in highersavings and higher investment in physical capital, which in turn stimulates economicgrowth. Second, a more skewed distribution of wealth is associated with a higher probabil-ity to invest, which in turn enhances growth. Third, as the individual effort depends on thewage level, higher income dispersion that results from differing work efforts has a positiveeffect on total output. At the sectoral level, therefore, higher inequality arises from produc-tivity differences between sectors, as the ones with higher productivity have a tendency tohave higher wages compared to the ones with lower productivity. That is, this suggests thatsome clusters in the manufacturing sector lead to growth along with inequality. In fact, thepositive interaction term in the regression emphasizes this linkage between human capitaland inequality.
Also, overall the findings are highly consistent with the general structure of the Turkisheconomy, in which export-led growth is made possible by suppressing wages, which in turncontributes to higher pay (income) inequality in the economy.
We reiterate the same analyses by considering GDP per labor force instead of GDP percapita in line with some major studies in the literature. Table III shows the results of thisset of regressions. In the same manner with Table II, we lay out three main specifications,(1–3), with single human capital stock variable, and extending the models by incorporatinginequality in following three models, (4–6). Finally, models 1t–6t include time trends. Theresults are highly consistent with Table II.
5. CONCLUSION
This study provides further evidence on the effect of military expenditures on economicgrowth in Turkey. There are two main motives for this paper. First, the literature on Turkeymostly consists of similar causality studies, while there are few works that are based on astructural model to the best of our knowledge. None of these studies adopts the augmentedSolow growth model, which has been utilized in some earlier studies in the field of defenceeconomics. Second, not just in the Turkish case but in general, the role of inequality has
THE IMPACT OF MILITARY SPENDING AND INCOME INEQUALITY 15
Dow
nloa
ded
by [
Uni
vers
ity o
f M
aine
- O
rono
] at
09:
37 1
7 Ju
ne 2
014

not been investigated in this nexus despite the crucial linkage between inequality andgrowth. The novelty of this paper is to incorporate inequality into the military expenditure-growth nexus by emphasizing the interaction between education, a usual human capital var-iable, and inequality. Acknowledging that traditional human capital variables, such as theschooling rate, can be more explanatory when it is considered along with its outcome,inequality. To this end, this paper also overcomes the lack of long-term inequality data byconsidering the manufacturing pay inequality index measured by Theil T statistic.
There are three major findings of this paper. First, adopting the augmented Solow growthmodel for the first time to examine the effect of military expenditures on economic growthfor the period of 1963–2008 in Turkey, the paper suggests no significant effect of militaryexpenditures on economic growth in Turkey (there exist only one – out of 24 model specifi-cations – significant negative relationship at 10% level). This finding is highly consistentwith the early studies with a strict theoretical framework. Second, regardless of model speci-fications, it is found that inequality has a highly significant positive impact on economicgrowth. This finding is also to some extent in line with the major studies in general literaturein Turkey that argue that economic growth which is driven by export-oriented sectors inwhich wages are suppressed comes with higher inequality. Third, the paper emphasizes theinteraction between human capital (i.e. education) and inequality in the context of economicgrowth in Turkey. Our findings present significant results of the impact of human capital oneconomic growth only when it is considered along with inequality. Further, our results onthe interaction term suggest that human capital is more effective at higher inequality levels.
Overall, this study is a modest attempt to contribute to the literature on the militaryexpenditure-economic growth nexus in Turkey by taking human capital and inequality intoaccount in an augmented Solow growth model. We acknowledge the challenge in thisattempt that the analysis is restricted to a single country and to the 1963–2008 period foryearly observations. In this sense, as a future research question, a panel data study for alarge number of countries to investigate this challenging topic might give some more robustand interesting results.
ACKNOWLEDGMENTS
We would like to thank two anonymous referees and the participants of EY InternationalCongress I, Department of Economics, Gazi University, Ankara, Turkey, 24–25 October2013 for their valuable comments. The usual disclaimer applies.
References
Aksoğan, G., and A. Y. Elveren. 2012. “Defence Expenditures, Education and Health Expenditures and IncomeInequality in Turkey, 1970–2008: An Econometric Analysis (in Turkish).” Sosyo Ekonomi 1: 263–280.
Alesina, A., and D. Rodrik. 1994. “Distributive Politics and Economic Growth.” The Quarterly Journal ofEconomics 109 (2): 465–490.
Atesoglu, H. S. 2002. “Defense Spending Promotes Aggregate Output in the United States Evidence from Cointe-gration Analysis.” Defence and Peace Economics 13 (1): 55–60.
Barro, R. J. 1990. “Government Spending in a Simple Model of Endogeneous Growth.” Journal of Political Econ-omy 98 (S5): S103–S26.
Barro, R. J. 1991. “Economic Growth in a Cross Section of Countries.” The Quarterly Journal of Economics 106(2): 407–443.
Barro, R. J. 2000. “Inequality and Growth in a Panel of Countries.” Journal of Economic Growth 5 (1): 5–32.Barro, R. J. 2008. Inequality and Growth Revisited. Asian Development Bank Regional Economic Integration
Working Paper no. 11.Barro, R. J., and J. W. Lee. 1993. “International Comparisons of Educational Attainment.” Journal of Monetary
Economics 32 (3): 363–394.
16 Ü. TÖNGÜR AND A. Y. ELVEREN
Dow
nloa
ded
by [
Uni
vers
ity o
f M
aine
- O
rono
] at
09:
37 1
7 Ju
ne 2
014
Barro, R. J., and J. W. Lee. 2010. A New Data Set of Educational Attainment in the Word, 1950–2010. NBERWorking Paper no. 15902.
Barro, R., and J. W. Lee. 2013. “Barro-Lee Educational Attainment Dataset.” http://www.barrolee.com/.Becker, G. S. 1967. Human Capital and the Personal Distribution of Income: An Analytical Approach. Ann Arbor,
MI: University Michigan Press.Benoit, E. 1973. Defence and Economic Growth in Developing Countries. Boston, MA: Lexington Books.Benoit, E. 1978. “Growth and Defense in Developing Countries.” Economic Development and Cultural Change 26
(2): 271–280.Biswas, B., and R. Ram. 1986. “Military Expenditures and Economic Growth in Less Developed Countries: An
Augmented Model and Further Evidence.” Economic Development and Cultural Change 34 (2): 361–372.Castelló-Climent, A. 2010. “Inequality and Growth in Advanced Economies: An Empirical Investigation.” The
Journal of Economic Inequality 8 (3): 293–321.Castelló-Climent, A. 2011. “Channels Through Which Human Capital Inequality Influences Economic Growth.”
Accessed May 29, 2014. http://iei.uv.es/docs/publicaciones/pdf/iei_1101.pdf.Castelló-Climent, A., and R. Doménech. 2008. “Human Capital Inequality, Life Expectancy and Economic
Growth.” The Economic Journal 118 (528): 653–677.Castello-Climent, A., and R. Domenech. 2012. “Human Capital and Income Inequality: Some Facts and Some
Puzzles.” Accessed April 14 2013. http://iei.uv.es/docs/wp_internos/RePEc/pdf/iei_1201.pdf.Dahan, M., and D. Tsiddon. 1998. “Demographic Transition, Income Distribution, and Economic Growth.” Journal
of Economic Growth 3 (1): 29–52.Deger, S. 1986. “Economic Development and Defense Expenditure.” Economic Development and Cultural Change
35 (1): 179–196.Deger, S., and R. Smith. 1983. “Military Expenditure and Growth in Less Developed Countries.” Journal of Con-
flict Resolution 27 (2): 335–353.De la Croix, D., and M. Doepke. 2003. “Inequality and Growth: Why Differential Fertility Matters.” American
Economic Review 93 (4): 1091–1113.Dritsakis, N. 2004. “Defense Spending and Economic Growth: An Empirical Investigation for Greece and Turkey.”
Journal of Policy Modeling 26 (2): 249–264.Duman, A. 2008. “Education and Income Inequality in Turkey: Does Schooling Matter?” Financial Theory and
Practice 32 (3): 369–385.Dunne, J. P. 1996. “Economic Effects of Military Spending in LDCs: A Survey.” In The Peace Dividend, edited by
Nils P. Gleditsch, A. Cappelen, O. Bjerkholt, R. Smith, and P. Dunne, 439–464. Amsterdam: North Holland.Dunne, J. P., and E. Nikolaidou 2011. “Defence Spending and Economic Growth in the EU15.” http://carecon.org.
uk/DPs/1102.pdfDunne, P., E. Nikolaidou, and D. Vougas. 2001. “Defence Spending and Economic Growth: A Causal Analysis for
Greece and Turkey.” Defence and Peace Economics 12 (1): 5–26.Dunne, J. P., and R. Smith. 2010. “Military Expenditure and Granger Causality: A Critical Review.” Defence and
Peace Economics 21 (5–6): 427–441.Dunne, P., R. Smith, and D. Willenbockel. 2004. “Theoretical and Econometric Issues in Analysing the Military
Expenditure-growth Nexus.” Accessed September 7, 2012. http://carecon.org.uk/Armsproduction/Papers/assagrpap.pdf
Dunne, P., R. Smith, and D. Willenbockel. 2005. “Models of Military Expenditure and Growth: A Critical Review.”Defence and Peace Economics 16 (6): 449–461.
Duygan, B., and N. Guner. 2006. “Income and Consumption Inequality in Turkey: What Role Does EducationPlay?” In The Turkish Economy: The Real Economy, Corporate Governance and Reform and StabilizationPolicy, edited by S. Altug and A. Filiztekin, 63–91. London: Routledge.
Eicher, Theo S., and C. Garcia-Pebalosa. 2001. “Inequality and Growth: The Dual Role of Human Capital inDevelopment.” Journal of Development Economics 66 (1): 173–197.
Elveren, A. Y. 2012. “Military Spending and Income Inequality: Evidence on Cointegration and Causality for Tur-key, 1963–2007.” Defence and Peace Economics 23 (3): 289–301.
Elveren, A. Y., and J. K. Galbraith. 2009. “Pay Inequality in Turkey in the Neo-liberal Era, 1980–2001.” EuropeanJournal of Comparative Economics 6 (2): 177–206.
Erdogdu, O. S. 2008. “Political Decision, Defence and Growth.” Defence and Peace Economics 19 (1): 27–35.Feder, G. 1983. “On Exports and Economic Growth.” Journal of Development Economics 12 (1–2): 59–73.Feder, G. 1986. “Growth in Semi-industrial Countries: A Statistical Analysis.” In Industrialization and Growth: A
Comparative Study, edited by H. Chenery, S. Robinson, and M. Syrquin, 263–282. New York: Oxford Univer-sity Press.
Ferreira, F. H. G. 1999. “Inequality and Economic Performance, a Brief Overview to Theories of Growth andDistribution.” http://www.uv.es/~mperezs/intpoleco/Lecturcomp/Distribucion%20Crecimiento/Distrib%20y%20crecimiento.pdf.
Forbes, K. J. 2000. “A Reassessment of the Relationship between Inequality and Growth.” American EconomicReview 90 (4): 869–887.
Galbraith, J. K., and P. Conceição. 2001. “Towards a New Kuznets Hypothesis: Theory and Evidence on Growthand Inequality.” In Inequality and Industrial Change: A Global View, edited by J. Galbraith and M. Berner,139–160. Cambridge: Cambridge University Press.
THE IMPACT OF MILITARY SPENDING AND INCOME INEQUALITY 17
Dow
nloa
ded
by [
Uni
vers
ity o
f M
aine
- O
rono
] at
09:
37 1
7 Ju
ne 2
014
Galbraith, J. K., and H. Kum. 2005. “Estimating the Inequality of Households Incomes: Toward a Dense andConsistent Global Data Set.” Review of Income and Wealth 51 (1): 115–143.
Galor, O. 2011. “Inequality, Human Capital Formation and the Process of Development.” In Handbook of theEconomics of Education. Vol. 4, edited by E. A. Hanushek, S. J. Machin, and L. Woessmann, 441–494.Amsterdam: North Hollan.
Galor, O., and O. Moav. 2004. “From Physical to Human Capital Accumulation: Inequality and the Process ofDevelopment.” Review of Economic Studies 71 (4): 1001–1026.
Garcia-Penalosa, C., and S. J. Turnovsky. 2006. “Growth and Income Inequality: A Canonical Model.” AccessedAugust 30, 2012. http://www.econ.washington.edu/user/sturn/garcia-turnovsky-et.pdf
Görkem, H., and S. Işık. 2008. “Türkiye’de Savunma Harcamaları Ve Ekonomik Büyüme Arasındaki İlişki [TheRelationship between Defence Spending and Economic Growth in Turkey].” Marmara Üniversitesi İ.İ.B.FDergisi 25 (2): 405–424.
Granger, C. W. J., and P. Newbold. 1974. “Spurious Regressions in Econometrics.” Journal of Econometrics 2: 111–120.Halıcıoğlu, F. 2004. “Defense Spending and Economic Growth in Turkey: An Empirical Application of New Mac-
roeconomic Theory.” Review of Middle East Economics and Finance 2 (3): 193–201.Heo, U. 2010. “The Relationship between Defense Spending and Economic Growth in the United States.” Political
Research Quarterly 63 (4): 760–770.Hou, N., and B. Chen. 2013. “Military Expenditure and Economic Growth in Developing Countries: Evidence
from System GMM Estimates.” Defence and Peace Economics 24 (3): 183–193.Kalyoncu, H., and F. Yücel. 2006. “An Analytical Approach on Defense Expenditure and Economic Growth: The
Case of Turkey and Greece.” Journal of Economic Studies 33 (5): 336–343.Kanbur, R. 2000. “Income Distribution and Development.” In Handbook of Income Distribution. Vol. 1, edited by
A. B. Atkinson and F. Bourguigon, 791–841. Amsterdam: North-Holland.Karagianni, S., and M. Pempetzoglu. 2009. “Defense Spending and Economıc Growth in Turkey: A Linear and
Non-linear Granger Causality Approach.” Defence and Peace Economics 20 (2): 139–148.Karagöl, E., and S. Palaz. 2004. “Does Defence Expenditure Deter Economic Growth in Turkey? A Cointegration
Analysis.” Defence and Peace Economics 15 (3): 289–298.Knight, M., N. Loayza, and D. Villanueva. 1996. The Peace Dividend: Military Spending Cuts and Economic
Growth. IMF Staff Papers, No. 1577.Kollias, C. 1997. “Defence Spending and Growth in Turkey 1954–1993: A Causal Analysis.” Defence and Peace
Economics 8 (2): 189–204.Kremer, M., and D. Chen. 2002. “Income Distribution Dynamics with Endogenous Fertility.” Journal of Economic
Growth 7 (3): 227–258.Kwon, D.-B. 2009. “Human Capital and Its Measurement.” The 3rd OECD World Forum on ‘Statistics, Knowledge and
Policy’ Charting Progress, Building Visions, Improving Life Busan, OECDWorld Forum, Korea, October 27–30.Li, H. Y., and H. F. Zou. 1998. “Income Inequality is not Harmful to Growth: Theory and Evidence.” Review of
Development Economics 2 (3): 318–334.Lundberg, M., and L. Squire. 2003. “The Simultaneous Evolution of Growth and Inequality.” The Economic Jour-
nal 113 (487): 326–344.Mankiw, N. G., D. Romer, and D. N. Weil. 1992. “A Contribution to the Empirics of Economic Growth.” The
Quarterly Journal of Economics 107 (2): 407–437.Moav, O. 2005. “Cheap Children and the Persistence of Poverty.” The Economic Journal 115 (500): 88–110.Nissanke, M., and E. Thorbecke. 2010. “Globalization, Poverty, and Inequality in Latin America: Findings from
Case Studies.” World Development 38 (6): 797–802.Özdemir, D., and A. Bayar. 2006. “The Impacts of Sectoral Demand for Military Expenditure on Peace Dividend:
A Case for Turkey and Greece.” International Conference on Human and Economic Resources, İzmir, Turkey.Özmucur, S. 1996. The Economics of Defense and the Peace Dividend in Turkey. Istanbul: Boğaziçi University Press.Özsoy, O. 2000. “The Defence Growth Relation: Evidence from Turkey.” In The Economics of Regional Security:
NATO, the Mediterranean, Southern Africa, edited by J. Brauer and K. Hartley, 139–159. Amsterdam: Har-wood Academic.
Özsoy, O. 2008. “Defence Spending and the Macroeconomy: The Case of Turkey.” Defence and Peace Economics19 (3): 195–207.
Ozun, A., and E. Erbaykal. 2011. Further Evidence on Defence Spending and Economic Growth in NATO Coun-tries. Koc University-TUSIAD Economic Research Forum Working Paper Series no. 1119.
Penn World Table 8.0. Accessed January 30, 2014. https://pwt.sas.upenn.edu/Perotti, R. 1996. “Growth, Income Distribution, and Democracy: What the Data Say.” Journal of Economic Growth
1 (2): 149–187.Persson, T., and G. Tabellini. 1994. “Is Inequality Harmful for Growth?” American Economic Review 84 (3): 600–621.Psacharopoulos, G. 1994. “Returns to Investment in Education: A Global Update.” World Development 22 (9):
1325–1343.Ravallion, M. 1995. “Growth and Poverty: Evidence for Developing Countries in the 1980s.” Economics Letters
48 (3–4): 411–417.Razak, N. A. A. 2006. “Income Inequality and Economic Growth.” Unpublished PhD Dissertation, Louisiana State
University.
18 Ü. TÖNGÜR AND A. Y. ELVEREN
Dow
nloa
ded
by [
Uni
vers
ity o
f M
aine
- O
rono
] at
09:
37 1
7 Ju
ne 2
014

Romer, P. M. 2000. “Keynesian Macroeconomics without the LM Curve.” Journal of Economic Perspectives 14(2): 149–170.
Şahin, A., and M. Çetinkaya. 2010. “New Evidence for Turkey on the Relationship between Defense Spending andAggregate Output.” European Journal of Social Science 13 (3): 436–461.
Sekmen, F., and H. Saribas. 2007. “Cointegration and Causality among Defense Expenditures, Economic Growthand Level of Exchange Rate in Turkey.” The Empirical Economics Letter 6 (3): 193–203.
Sezgin, S. 1997. “Country Survey X: Defence Spending in Turkey.” Defence and Peace Economics 8 (4): 381–409.Sezgin, S. 2000a. “Defence Expenditures and Economic Growth in Turkey and Greece: A Cointegration Analay-
sis.” Mugla Universitesi SBE Dergisi 1 (1): 1–12.Sezgin, S. 2000b. “A Causal Analysis of Turkish Defence Growth Relationships: 1924–1996.” Ankara University
Journal of Political Sciences 55 (2): 113–124.Sezgin, S. 2001. An Empirical Analysis of Turkey’s Defense-growth Relationship with a Multi Equation Model
(1956–1994). Defence and Peace Economics. Special Issue on Economic Aspects of Defense in Turkey andGreece.
Smith, R. P. 2000. “Defence Expenditure and Economic Growth.” In Making Peace Pay: A Bibliography on Disar-mament and Conversion, edited by N. P. Gleditsch, G. Lindgren, N. Mouhleb, S. Smith, and I. de Soysa,15–24. Laremont: Regina Books.
Taylor, J. B. 2000. “Teaching Modern Macroeconomics at the Principles Level.” American Economic Review 90(2): 90–94.
Tinbergen, J. 1975. Income Distribution: Analysis and Policies. North-Holland: Amsterdam.Theil, H. 1972. Statistical Decomposition Analysis: With Applications in the Social and Administrative Sciences.
Amsterdam: North Holland Publishing Company.Turnovsky, S. J. 2011. “The Accumulation of Human Capital and Income Inequality in a Two-sector Economy.”
Journal of Human Capital 5 (4): 418–452.Yakovlev, P. 2007. “Arms Trade, Military Spending, and Economic Growth.” Defence and Peace Economics 18
(4): 317–338.Yılancı, V., and Özcan, B. 2010. “Yapısal Kırılmalar Altında Türkiye İçin Savunma Harcamaları Ile GSMH
Arasındaki İlişkinin Analizi [Analyzing the Relationship Between Defense Expenditures and GNP for TurkeyUnder Structural Breaks].” C. Ü. İktisadi Ve İdari Bilimler Dergisi 11 (1): 21–33.
Yildirim, J., and S. Sezgin. 2002. “A System Estimation of the Defense-growth Relation in Turkey.” In Arming theSouth: The Economics of Military Expenditure, Arms Production and Arms Trade in Developing Countries,edited by J. Brauer and J. P. Dunne, 319–325. London: Palgrave Publishing.
APPENDIX 1
TABLE A1 Unit Root and Stationarity Tests
ADF Phillips-Perron DF-GLS KPSS
No trend
With
trend No trend
With
trend No trend
With
trend
No
trend
With
trend
Log growtht, GDP
per capita
−4.576*** −4.531*** −7.085*** −7.008*** −2.755*** −3.762** 0.0754 0.049
Log growtht, GDP
per labor force
−4.673*** −4.597*** −6.972*** −6.888*** −3.613*** −3.456** 0.0578 0.0361
lnst −2.761* −3.672** −3.521*** −3.620** −2.383** −2.941* 0.338 0.123*
ln(nt + g + d) −4.829*** −5.320*** −6.070*** −6.391*** −3.702*** −3.933*** 0.171 0.048
lnmet −3.530*** −3.620** −2.761* −3.945** −2.103* −3.476** 0.230 0.140
lnhc1t −2.550 −3.420** −3.733*** −3.284* −2.320* −3.450** 0.453* 0.019
lnhc2t −2.940** −3.240* −3.552*** −3.784** −2.560** −3.840*** 0.245 0.109
lnhc3t −3.120** −3.260* −2.850* −3.400* −2.782** −3.915** 0.331 0.136*
lnineqt −2.958** −3.850** −2.983** −4.341*** −2.298*** −2.879** 0.342 0.118
Note: Significance denoted by***at 1%, **at 5% and *at 10% level. Table reports the test statistics with the lag selected using theSchwarz’s Bayesian information criterion for each.
THE IMPACT OF MILITARY SPENDING AND INCOME INEQUALITY 19
Dow
nloa
ded
by [
Uni
vers
ity o
f M
aine
- O
rono
] at
09:
37 1
7 Ju
ne 2
014

TABLE A2 Granger Causality Tests
Note: growth (pc) and growth (plf) refer the log growth of GDP per capita and log growth of GDP per labor force, respectively.Corresponding p values in parentheses.
F χ2 F χ2
growth (pc) → lnme 0.68 (0.413) 0.73 (0.393) lnme → growth (pc) 0.28 (0.599) 0.30 (0.583)
growth (pc) → lnh1 0.80 (0.376) 0.86 (0.355) lnh1→ growth (pc) 0.21 (0.646) 0.23 (0.632)
growth (pc) → lnh2 1.16 (0.287) 1.24 (0.265) lnh2 → growth (pc) 0.11 (0.736) 0.12 (0.726)
growth (pc) → lnh3 0.81 (0.372) 0.87 (0.351) lnh3 → growth (pc) 0.13 (0.724) 0.13 (0.714)
growth (pc) → lnineq 1.81 (0.186) 1.94 (0.164) lnineq → growth (pc) 0.03 (0.873) 0.03 (0.867)
growth (plf) → lnme 0.61 (0.440) 0.65 (0.419) lnme → growth (plf) 0.01 (0.921) 0.01 (0.918)
growth (plf) → lnh1 0.34 (0.563) 0.37 (0.546) lnh1 → growth (plf) 0.00 (0.98) 0.00 (0.979)
growth (plf) → lnh2 0.32 (0.572) 0.35 (0.555) lnh2 → growth (plf) 0.02 (0.897) 0.02 (0.892)
growth (plf) → lnh3 0.37 (0.547) 0.40 (0.529) lnh3 → growth (plf) 0.01 (0.915) 0.01 (0.911)
growth (plf) → lnineq 2.14 (0.151) 2.29 (0.13) lnineq → growth (plf) 0.27 (0.607) 0.29 (0.591)
lnme → lnh1 1.45 (0.235) 1.55 (0.213) lnh1 → lnme 0.36 (0.551) 0.39 (0.534)
lnme → lnh2 1.58 (0.219) 3.56 (0.168) lnh2 → lnme 0.55 (0.462) 0.59 (0.442)
lnme → lnh3 0.58 (0.451) 0.62 (0.431) lnh3 → lnme 1.31 (0.260) 1.40 (0.237)
lnme → lnineq 1.89 (0.177) 2.30 (0.155) lnineq → lnme 0.84 (0.364) 0.9 (0.342)
lnh1 → lnineq 1.70 (0.159) 2.40 (0.194) lnineq → lnh1 0.94 (0.398) 2.13 (0.345)
lnh2 → lnineq 1.86 (0.126) 3.20 (0.113) lnineq → lnh2 0.09 (0.911) 0.21 (0.899)
lnh3 → lnineq 2.54 (0.118) 2.62 (0.108) lnineq → lnh3 2.45 (0.134) 2.48 (0.121)
20 Ü. TÖNGÜR AND A. Y. ELVEREN
Dow
nloa
ded
by [
Uni
vers
ity o
f M
aine
- O
rono
] at
09:
37 1
7 Ju
ne 2
014