Spending SeigniorageDo Central Banks Have a Governance Problem
27
Spending Seigniorage: Do Central Banks Have a Governance Problem? ALAIN IZE This paper reviews how central banks allocate seigniorage, based on systematic cross-country comparisons of their financial accounts. Central banks are classified as weak or strong, depending on their structural profitability. Weak central banks typically (although not exclusively) operate in smaller and less wealthy countries, lack independence from their governments, and are burdened by large nonperforming assets, compulsory transfers, and low capital. Notwithstanding their weak finances, these central banks tend to overspend with regard to their operating expenditures. Governance also appears to be a potential concern in many strong central banks, however, with operating expenditures often adjusting upward for high profitability and capital accumulation and downward for low profitability. Main policy implications are briefly reviewed. [JEL E58, G21, H11] IMF Staff Papers (2007) 54, 563–589. doi:10.1057/palgrave.imfsp.9450017 C entral banks’ exclusive right to issue currency gives them privileged access to seigniorage, effectively making them unregulated monopolies. In the past, the siphoning off of seigniorage to governments Alain Ize was an Area Chief in the Monetary and Financial Systems Department of the IMF at the time this paper was written. At present he is an IMF staff member advising the Financial Systems Unit of the Financial and Private Sector Development Vice-Presidency of the World Bank. The author is indebted to Nada Oulidi for assembling a very disparate set of central bank financial statements into a homogeneous data set and conducting the statistical analysis for this paper. Comments from participants in the weekly seminar of the Monetary and Financial Systems Department of the IMF are also gratefully acknowledged. IMF Staff Papers Vol. 54, No. 3 & 2007 International Monetary Fund 563
-
Upload
independent -
Category
Documents
-
view
3 -
download
0
Transcript of Spending SeigniorageDo Central Banks Have a Governance Problem

Spending Seigniorage: Do Central Banks Have aGovernance Problem?
ALAIN IZE�
This paper reviews how central banks allocate seigniorage, based on systematiccross-country comparisons of their financial accounts. Central banks areclassified as weak or strong, depending on their structural profitability. Weakcentral banks typically (although not exclusively) operate in smaller and lesswealthy countries, lack independence from their governments, and are burdenedby large nonperforming assets, compulsory transfers, and low capital.Notwithstanding their weak finances, these central banks tend to overspendwith regard to their operating expenditures. Governance also appears to be apotential concern in many strong central banks, however, with operatingexpenditures often adjusting upward for high profitability and capitalaccumulation and downward for low profitability. Main policy implicationsare briefly reviewed. [JEL E58, G21, H11]
IMF Staff Papers (2007) 54, 563–589. doi:10.1057/palgrave.imfsp.9450017
C entral banks’ exclusive right to issue currency gives them privilegedaccess to seigniorage, effectively making them unregulated
monopolies. In the past, the siphoning off of seigniorage to governments
�Alain Ize was an Area Chief in the Monetary and Financial Systems Department of theIMF at the time this paper was written. At present he is an IMF staff member advising theFinancial Systems Unit of the Financial and Private Sector Development Vice-Presidency ofthe World Bank. The author is indebted to Nada Oulidi for assembling a very disparate set ofcentral bank financial statements into a homogeneous data set and conducting the statisticalanalysis for this paper. Comments from participants in the weekly seminar of the Monetaryand Financial Systems Department of the IMF are also gratefully acknowledged.
IMF Staff PapersVol. 54, No. 3
& 2007 International Monetary Fund
563

(through quasi-fiscal expenditures, profit transfers, or subsidized financing)raised familiar issues of fiscal dominance and inflationary finance. In recentyears, substantial efforts have been made to weed out these linkages andenhance central banks’ independence, ensuring in particular that they arewell capitalized, remain financially strong, and are well protected frompressures to appropriate their resources to noncore uses, including for fiscal(or quasi-fiscal) purposes. Central banks’ charters have been reformed, directfinancing to governments prohibited, and quasi-fiscal expenditureseliminated. However, keeping seigniorage inside central banks (to build uptheir assets, cover the carrying costs of these assets, or cover operatingexpenses) has brought to the forefront issues of efficiency and governance.Is seigniorage spent ‘‘wisely’’? Do central banks have sufficient governancestandards and safeguards?
These concerns have intensified owing to the deteriorating financialposition of many central banks. On the one hand, seigniorage has followed aclear downward trend, reflecting both declining inflation and a decliningdemand for currency (Figure 1). On the other hand, the carrying cost offoreign reserves has tended to rise, reflecting an expanded accumulation ofreserves (Figure 2). Such trends have led to sustained losses and negativecapital in many central banks, triggering intense technical and politicaldebates about the need for (as well as the extent and modalities of ) centralbank recapitalizations (see Stella, 2005; and Ize, 2005).
This paper examines how central banks are allocating their shrinkingseigniorage. Based on recent central bank financial accounts and interest ratedata for a sample of 101 countries, it addresses the following issues:
� How much seigniorage is retained vs. how much is transferred? Ifretained, is seigniorage used to build up the central bank’s balance sheet,
Figure 1. World Inflation and Currency Demand, 1985–2003(Average of 101 countries)
0.0
Inflation
2.0
4.0
6.0
8.0
10.0
12.0
14.0
16.0
18.0
1985
1986
1987
1988
1989
1990
1991
1992
1993
1994
1995
1996
1997
1998
1999
2000
2001
2002
2003
5.05.25.45.65.86.06.26.46.66.87.07.27.47.67.88.0
Average Currency/GDP (right scale)
Source: IMF, International Financial Statistics.
Alain Ize
564

and, if so, which type of asset; or is it mainly used to cover its operatingexpenses?
� How can ‘‘poor’’ financial performance be explained? Is it purely areflection of weak balance sheets or does it also reflect larger operatingexpenditures? If the latter, does it reflect mainly structural factors (againstwhich central banks can do little), or does it also reflect poor governance?
The empirical literature that compares central banks’ expenditures is smallbut has grown rapidly, reflecting an enhanced awareness about theimportance of good governance in central banks. Fry, Goodhart, andAlmeida (1996) present a pioneering study, albeit limited to a relatively smallsample of 42 central banks and covering only specific aspects of governanceand management, such as the nature of central banks’ boards, the numberand characteristics of their staff, and the functions they perform. In a morerecent study McKinley and Banaian (2005) use a sample of 32 central banksto analyze the efficiency with which inputs (labor and capital) are used bycentral banks to produce outputs (a monetary policy quality index and somefinancial stability indices). Brione (2005) compares the staff costs of 28Organization for Economic Cooperation and Development (OECD) centralbanks and concludes that the very large differences across banks may be
Figure 2. International Reserves, 1985–2004(In percent of currency)
0
1
2
3
4
1985 1986 1987 1988 1989 1990 1991 1992 1993 1994 1995 1996 1997 1998 1999 2000 2001 2002 2003 2004
Weak central banks
Strong central banks
Full Sample
Source: IMF, International Financial Statistics.Note: See text for the definitions of strong and weak central banks.
DO CENTRAL BANKS HAVE A GOVERNANCE PROBLEM?
565

partly explained by the different functions they perform. Pedersen (2006)conducts a somewhat similar study for 21 industrial countries’ central banks.On the basis of a somewhat larger sample (66 central banks), GalanCamacho and Sarmiento Paipilla (2006) analyze the evolution of centralbanks’ staffing costs as a function of their operational functions and concludethat central banks face soft budgetary constraints.
This paper differs from the ones above in that it relies on publishedfinancial accounts and broad accounting concepts, rather than specificmanagement parameters. This approach allows for more comprehensivecoverage in terms of both countries and scope of analysis. It also allows for amore global economic analysis of central bank behavior, based on broadtrends in the data. The paper builds on a framework presented by Ize (2005),which identifies structural profits as a key concept to assess the sustainabilityof central banks’ financial performance and their need for capital. Thedownside of this broader approach, however, is that the scope of the paper ismore limited in terms of defining and measuring central bank efficiency.
I. A Cross-Sectional Look at Central Banks’ Financial Accounts
Income Statements
The first stage of analysis simply aggregates financial accounts across centralbanks.1 Table 1 presents a bird’s-eye view of income statements for thesample countries, expressed in terms of the sample means and (inparentheses) standard deviations. Currency is used as a scalar.2 Valuationchanges and all transitory revenues and expenditures are put together andclassified as ‘‘transitory net income.’’3 Net interest income and net other(structural) income are classified as ‘‘structural income.’’4
A few important features are worth noting. As expected, the meantransitory net income is very close to zero, while its standard deviation is verylarge. Indeed, the high standard deviation of retained profits is explainedmostly by the high volatility of valuation gains, as illustrated by a variancedecomposition (Table 3). Such volatility hinders the year-to-year comparisonof central bank performance, as well as its comparison across countries,particularly because many central banks do not clearly distinguish betweenstructural and transitory income in their published accounts. The lack of a
1The Appendix describes the data set used in this study.2Currency (rather than GDP) is a natural scalar for central banks. Because it is the only
fully market-driven source of seigniorage (unlike bank deposits at the central bank, thedemand for currency is entirely voluntary), one would expect it to play a central role in centralbanks’ accounts and be highly correlated with key accounting aggregates. Table 2 shows thatthis is indeed the case.
3Transitory net income includes realized and unrealized gains and losses on foreignexchange, securities, and fixed assets; net transfers to and from reserves; provisions and write-offs; and other extraordinary gains and losses.
4Net other structural income includes commissions and fees and other operating income.
Alain Ize
566

uniform reporting format further contributes to the opacity of theseaccounts. Unless efforts are made to clarify and standardize central banks’financial reporting, the switch to international accounting standards,
Table 1. Adjusted Income Statement(In percent of currency)
Full Sample Weak Central Banks Strong Central Banks
Structural income 6.32 �3.26 10.64
Net interest margin 5.80 �3.35 9.92
(13.95) (10.42) (13.43)
Other 0.51 0.09 0.72
(2.39) (2.83) (2.16)
Transitory income 0.25 5.92 �2.30
Valuation changes �0.14 4.02 �2.00
(17.07) (13.27) (18.32)
Other 0.39 1.91 �0.29
(4.99) (6.39) (4.10)
Operating expenditures 4.85 6.63 4.06
(6.04) (6.26) (5.81)
Transfers 2.53 2.26 2.65
(5.38) (8.48) (3.23)
Retained profits �0.81 �6.23 1.63
(18.35) (17.22) (18.45)
Source: Central bank.Note: This table presents the sample means and, in parentheses, standard deviations of the
main components of central banks’ income statements, expressed in percent of currency, forthe full sample and two subsamples of weak and strong central banks. Weak (strong) centralbanks have negative (positive) pretransfer structural profits, defined as net interest income plusother structural net income minus operating expenditures. Net other structural income includescommissions and fees and other operating income. Valuation changes include realized andunrealized gains and losses on foreign exchange, securities, and fixed assets. Other transitoryincome includes net transfers to and from reserves, provisions and writeoffs, and otherextraordinary gains and losses.
Table 2. Pairwise Correlations
O SI XF XG XB
C 0.82 0.91 0.37 0.97 �0.29
GDP 0.84 0.91 0.45 0.84 �0.23
Sources: IMF, International Financial Statistics; and central banks.Note: This table presents pairwise correlations between currency (C) and GDP, on the
one hand, and central banks’ operating expenditures (O), structural income (SI), and netclaims on foreigners (XF), governments (XG), and banks (XB), on the other hand. Net claims onthe nonfinancial private sector (excluding currency) are included with net claims on banks.
DO CENTRAL BANKS HAVE A GOVERNANCE PROBLEM?
567

whereby all valuation changes will be charged against profits, couldexacerbate this problem.5
A second important feature of Table 1 is that central banks’ operatingexpenditures nearly exhaust net interest income. In view of substantialtransfers, retained profits are, on average, negative. Central banks, as awhole, lost capital during 2003, the base year used for this study. To analyzewhether this loss reflects a generic problem resulting from decliningseigniorage, I divided the sample into a subsample of 60 strong centralbanks (SCBs), those with positive ‘‘structural pretransfer profits’’ (defined asnet interest income plus other structural net income minus operatingexpenditures), and 27 weak central banks (WCBs), those with negativestructural profits.
Clear differences between the two subsamples emerge. Unlike WCBs,SCBs accumulated capital. The poor performance of WCBs is explainedmainly by their much lower net interest income (it was in fact negative).Remarkably, however, WCBs are also afflicted by higher operatingexpenditures (they spent more than 50 per cent as much as SCBs did). Atfirst glance, the fact that WCBs spend more while earning less would suggestthat weak performance may be at least partly explained by poor governance.The fact that the average country governance index (measured on the basis ofthe KKM index)6 is lower for WCB countries would be consistent with this
Table 3. Variance Decomposition of Retained Profits
Net
Interest
Margin
Net
Other
Structural
Income
Valuation
Gains
and
Losses
Other
Transitory
Net
Income
Operating
Expenditures Transfers
Full sample 0.25 0.03 0.65 0.01 �0.02 0.08
Weak central banks 0.15 0.07 0.45 0.05 �0.02 0.30
Strong central banks 0.21 0.01 0.81 0.01 �0.04 0.01
Source: Central banks.Note: This table decomposes the variance of retained profits for the full sample and two
subsamples of central banks, using the income statement identity.
5The fact that a substantial number of central banks do not publish their incomestatements, or do not do so in a format that lends itself to meaningful analysis, furtherunderlines the urgent need for greater transparency and accountability.
6The KKM index is calculated as the average of aggregate indicators over six dimensionsof governance: voice, accountability, political stability, government effectiveness, regulatoryquality, and rule of law (higher values correspond to better governance). See Kaufmann,Kraay, and Mastruzzi (2003).
Alain Ize
568

hypothesis (Table 4). However, WCB countries are also, on average,structurally different from SCB countries. WCB countries are, on average,poorer and smaller (Table 4).7 Thus, further analysis is warranted to examineto what extent WCBs’ higher operating expenditures reflect genuinestructural differences, particularly those that might result from increasingreturns to scale.
It is also remarkable that, notwithstanding their negative structuralprofits, WCBs transferred nearly as much as did SCBs. Moreover, unlike forSCBs, transfers by WCBs explain a sizable fraction of the variance of theirretained profits (Table 3). The opposite is true for net interest income: Itexplains a higher share of the variance of retained profits for SCBs than forWCBs. This situation strongly suggests that WCBs, as a group, lackindependence. They are being forced to transfer profits that they do nothave.8 As a result, retained profits (what is left after the transfers) for themost part reflect the negative imprint of these transfers.
At the same time, WCBs benefited from windfall gains, in strong contrastwith SCBs, which incurred valuation losses. This contrast can be explained
Table 4. Key Economic and Social Indicators
Full Sample Weak Central Banks Strong Central Banks
(87 countries) (27 countries) (60 countries)
GDP per capita (US$) 11,139.00 5,651.00 13,335.00
Population (millions) 39.00 28.00 43.00
Inflation (percent) 5.19 9.49 3.46
KKM Index 0.39 �0.01 0.54
Source: World Bank, World Development Indicators.Note: This table presents key economic and social indicators for the full sample and two
subsamples of central banks. The KKM index is calculated as the average of aggregateindicators over six dimensions of governance: voice, accountability, political stability,government effectiveness, regulatory quality, and rule of law (higher values correspond tobetter governance). See Kaufmann, Kraay, and Mastruzzi (2003).
7There is, however, substantial dispersion within the two groups of central banks withregard to the economic environment in which they operate. The WCB group includes asignificant number of central banks from large, wealthy countries, whereas the SCB groupincludes a large number of central banks from smaller, poorer countries. Table 5 illustratesthis dispersion by indicating the number of central banks that are above (below) the mean ofthe average GDP per capita and population for the SCB (WCB) groups.
8Accounting practices may allow such transfers to take place in several ways. Inparticular, central banks often transfer unrealized valuation gains on their foreign exchangereserves without benefiting from transfers in the opposite direction when they experiencevaluation losses. In several of the countries in the sample, transfers from the revaluationreserve fund were made whether or not the central bank experienced gains during thatparticular year.
DO CENTRAL BANKS HAVE A GOVERNANCE PROBLEM?
569

largely by the fact that SCBs operate in a low-inflation environment in whichthe fluctuations of the U.S. dollar against other world currencies play apredominant role. During the base year of this study, most SCB currenciesappreciated against the U.S. dollar, which gave rise to valuation losses.Instead, WCBs operate under a much higher inflation environment, which,by generating a devaluation bias against the dollar (the main reservecurrency), enhances seigniorage through systematic valuation gains on dollarassets. Indeed, inflation in the WCB sample was nearly three times as high asthat in the SCB sample (Table 4).
Finally, it is also worth noting that whereas SCBs have nearlyinsignificant exceptional expenditures, WCBs report significant exceptionalincomes. Though such incomes are difficult to pin down and might be mostlycircumstantial, they might reflect (at least in some cases) efforts to dress upthe central banks’ accounts and limit their reported losses through ‘‘creativeaccounting.’’
Balance Sheets
Table 6 presents summarized balance sheets for the aggregate sample and thetwo subsamples (all data are again scaled down by currency). With regard tothe aggregate sample, some features are worth noticing. In particular,international reserve holdings account for the bulk of central bank assets(more than two-thirds). This fact points to the important role played bycentral banks in ensuring the external liquidity of their deposits, particularlythose of commercial banks against which central banks have large netliabilities. As a result, only about one-third of international reserves are‘‘financed’’ by unremunerated liabilities (currency and capital). The financingof the remaining two-thirds exposes central banks to a large potentialcarrying cost, because the interest rates on their foreign assets are generallybelow those of the liabilities they back, reflecting maturity, currency, orcountry risk premiums.
Table 5. Overlap between Weak Central Banks and Strong Central Banks
GDP per Capita Population
oUS$5,651 >US$13,335 o28 million >43 million
Weak central banks 22 4 21 5
Strong central banks 35 28 52 16
Source: World Bank, World Development Indicators.Note: This table shows the extent of overlap (in numbers of central banks) between the
two subsamples of central banks with regard to size (population) and income levels (GDP percapita).
Alain Ize
570

In the subsamples, important differences can be spotted: WCBs have (1)much higher foreign liabilities, (2) higher net claims on government, (3) bothlower claims on and lower liabilities to banks, and (4) much less capital. Theoverall picture that emerges is thus one in which WCBs are constrained to holdnearly as many international reserves as do SCBs but, in addition, need toprovide more financing to governments. Yet they have less capital and are lessprofitable. Thus, they finance these higher claims mainly through foreign debt.9
Bivariate Statistical Analysis
A simple bivariate statistical analysis between all variables in the income andbalance sheet accounts, as well as between some selected variables acrossthese accounts, completes this preliminary review of the data. The incomestatement (Table 7) has several interesting features:
� Retained profits are very strongly related to transitory net income forboth WCBs and SCBs. This suggests that most central banks avoidtransferring their valuation gains and other transitory windfalls.10
Table 6. Simplified Balance Sheet(In percent of currency)
Full Sample Weak Central Banks Strong Central Banks
Net claims 154.60 104.20 177.30
On foreigners 277.10 192.20 315.20
Assets 354.90 334.40 364.20
Liabilities �77.90 �142.20 �49.00
On government 50.70 92.20 32.00
Assets 134.10 173.80 116.30
Liabilities �83.40 �81.60 �84.30
On banks �173.10 �180.30 �169.90
Assets 103.20 33.20 134.70
Liabilities �276.30 �213.40 �304.60
Currency 100.00 100.00 100.00
Capital 54.70 4.20 77.40
Source: IMF, International Financial Statistics.Note: This table presents the means of main balance sheet components, expressed in
percent of currency. Noncurrency net claims on the nonfinancial private sector are included innet claims on banks.
9Part of this debt is with the IMF, which suggests that, through its programs, the IMFmay be partly filling up the capitalization gap of WCBs.
10In the case of the WCBs, a surprisingly negative association exists between transfers andtransitory income.
DO CENTRAL BANKS HAVE A GOVERNANCE PROBLEM?
571

� For WCBs, there is a strong negative association between retained profitsand transfers. This is consistent with the earlier finding that WCBs are(often) requested to transfer profits that they do not have.
� Operating expenditures are positively related to the net interest incomein all central banks, but the link is much stronger in SCBs. Thus,whereas high interest income translates mainly into higher operatingexpenditures, low (or negative) income primarily translates into low (ornegative) profits. This suggests that SCBs face soft budget constraintsthat allow the most profitable ones to raise their expenditures. On theother hand, for WCBs, the weaker link suggests that their attemptto restrain their operating expenditures is halfhearted and meets onlylimited success.
� Interestingly, there appears to be no strong link between capital andstructural profitability, or any other key income concept (albeit thet statistic between the interest margin and capital is mildly significant forSCBs). This lack of a strong link could be interpreted as an indicationthat central banks primarily transfer or spend their profits but do notsystematically retain them to increase their capital.
Table 7. Income Statement t-Tests for Weak and Strong Central Banks
Operating
Expenditures Transfers
Retained
Profits
Transitory Net
Income Capital
Weak central banks
Net interest income 2.3** �1.73 2.75** 1.88* 0.95
Operating
expenditures
0.09 �0.06 0.71 1.05
Transfers �6.79** �3.66** 1.17
Retained profits 10.82** �1.23
Transitory net
income
�0.71
Strong central banks
Net interest income 5.32** 0.68 2.66** �1.44 1.65
Operating
expenditures
0.23 1.28 0.39 0.47
Transfers �0.53 2.03** 1.01
Retained profits 9.72** 1.26
Transitory net
income
1.11
Sources: IMF, International Financial Statistics; and central banks.Note: *90 percent significance level, **95 percent significance level. This table presents
t-statistics for selected income statement items (plus capital) for the weak and strong centralbanks.
Alain Ize
572

Similar tests for the balance sheet account (Table 8) yielded the following results:
� Both WCBs and SCBs exhibit a very strong positive link between claimson government and foreign liabilities: They borrow abroad and on-lend togovernments.11 There is also a substantial link (mostly for SCBs) going in theopposite direction: Central banks invest abroad part of the funds they receiveas government deposits. These financial activities taking place in both
Table 8. Balance Sheet t-Tests for Weak and Strong Central Banks
Foreign
Assets
Claims on
Government
Claims
on
Banks
Foreign
Liabilities Currency
Bank
Deposits
Government
Deposits Capital
Weak central banks
Structural profits �1.73* �2.09** 1.84* �1.92* 1.79* �0.42 �3.75** 0.48
Foreign assets 0.07 �0.41 0.12 1.91* 2.54** 3.78** 1.32
Claims on
government
�0.21 10.44** 0.24 1.04 0.08 1.9*
Claims on banks �0.53 �0.02 3.13** �0.91 1.34
Foreign
liabilities
�0.32 0.31 �0.37 1.57
Currency 0.94 �1.17 �0.19
Bank deposits 0.49 0.83
Government
deposits
1.15
Strong central banks
Structural profits 1.53 3.11** �0.38 2.71** �0.01 �0.05 2.45** 1.16
Foreign assets �0.91 �1.31 �0.008 2.63** �0.55 10.9** 8.51**
Claims on
government
�0.09 10.3** 0.82 0.13 1.09 �0.15
Claims on banks �0.05 �0.67 26.26** �0.31 �0.45
Foreign liabilities 0.62 �0.15 0.88 0.04
Currency �0.36 0.47 0.74
Bank deposits 0.16 �0.56
Government
deposits
6.67**
Source: IMF, International Financial Statistics.Note: *90 percent significance level, **95 percent significance level. This table presents
t-statistics for selected balance sheet items (plus structural profits) for the two subsamples ofweak and strong central banks.
11When direct central financing to governments is not allowed, central banks can financegovernments by acquiring government paper in the secondary market.
DO CENTRAL BANKS HAVE A GOVERNANCE PROBLEM?
573
directions suggest that central banks play an important role as externalfinancial intermediaries for their governments.
� The intermediation that central banks conduct with commercial banksseems to be mainly domestic. Central banks that have higher bankdeposits also provide higher financing to banks. This link is particularlystrong in the case of SCBs. There are two possible explanations, one of abudgetary nature and the other monetary. By imposing (unremunerated)reserve requirements on banks and reinjecting these funds throughmarket-based instruments, central banks gain a spread that contributes totheir profitability. Maintaining commercial banks short in liquidity alsoallows central banks to have better control on interest rates. The fact thatstructural profits are unrelated to bank deposits suggests that the latterexplanation (enhancing monetary control) is mo’re plausible.
� In WCBs, structural profits are negatively related to both claims ongovernment and government deposits. In SCBs, the opposite holds. Inaddition, SCBs that have more government deposits also have highercapital. This suggests that being a banker to government is good business forSCBs, but bad business for WCBs. In the former case, central banks gainfrom the spread. In the latter case, central banks probably lose, becausemany of their claims on government are nonperforming. In addition, centralbanks that are more strongly linked to governments are more likely to berequested to assume costly quasi-fiscal responsibilities.
� More capitalized central banks have higher foreign assets. However, thisis true only for SCBs.
II. Sources and Uses of Seigniorage
Analytical Framework
Following this preliminary analysis of the data, an accounting decompositioncan throw further light on key differences between SCBs and WCBs withregard to sources and uses of seigniorage. Without loss of generality, acentral bank’s balance sheet can be expressed as
C þ K ¼ EXF þ XB þ XG; (1Þ
where C is currency issued; K is capital; XF, XB, and XG are the net claims onthe foreign sector, banks (and the private sector), and the public sector,respectively; and E is the nominal exchange rate against the U.S. dollar.12
Alternatively, domestic claims may be expressed as
XB þ XG ¼ B�D; (2Þ
where B and D are ‘‘net interest-bearing assets’’ (that is, performing assetsminus fully remunerated deposits and central bank debt issued at market
12Domestic claims are assumed to be all denominated in local currency.
Alain Ize
574

rates) and ‘‘net non-interest-bearing liabilities’’ (unremunerated depositsminus nonperforming assets), respectively.
With R and R�, r and r�, and p and pn representing the domestic and U.S.nominal interest rates, real interest rates, and inflation rates, respectively, thecentral bank’s income statement can be written as
OC ¼.K ¼ R� þ
.E
E
� �EXF þ RB� Z �O� T ; (3Þ
where OC is the International Accounting Standards definition of centralbank profits (inclusive of valuation gains and losses), Z is other netexceptional expenditures (such as provisions and write-offs on bad assets), Ois operating expenditures, and T is transfers to the treasury.
If B in Equation (3) is replaced using Equations (1) and (2), Equation (3)can be rewritten as
OC ¼ R� þ.E
E
� �EXF þ RðC þDþ K � EXFÞ � Z �O� T : (4Þ
Or, if OC is replaced with.K and Equation (1) is differentiated, the new
equation would be
RðC þDþ KÞ ¼ FEXF þ ðE.XF þ
.XG þ
.XB �
.CÞ þOþ Z þ T ; (5Þ
where F¼R�R� is the nominal interest rate premium. Using Equation (1) tocorrect Equation (5) for both domestic and foreign inflation (that is,expressing it in real terms) leads to
Rðcþ d þ kÞ ¼ ðjþ pÞEXF þ Eð.XF � p�XFÞ þ ð
.XG � pXGÞ
þ ð.XB � pXBÞ � ð
.C� pCÞ þ ðoþ zþ tÞ; (6Þ
where j¼ r�r� and e are the real interest rate premium and the real exchangerate, respectively.
Gathering all the domestic inflation terms, and using Equation (1),Equation (6) can be written as
Rðcþ d þ kÞ ¼ ðjexF þ pkÞ þ ðe .xF þ .xG þ .
xB � .cÞ þ ðoþ zþ tÞ; (7Þ
where the lowercase letters stand for domestic price-deflated magnitudes, inthe case of domestic-currency-denominated variables, and foreign price-deflated magnitudes, in the case of foreign-currency-denominated variables.The left-hand side of Equation (7) indicates that seigniorage originates fromthree sources: (1) currency, (2) net nonremunerated liabilities, and (3) capital.The right-hand side defines the uses of seigniorage and can also be dividedinto three terms: (1) balance sheet costs (the terms in the first parentheses),namely the carrying cost of international reserves and the user cost of capital;(2) the real accumulation of capital, which can take the form of increases inreal claims on foreigners (adjusted for foreign inflation) or increases in netreal claims on domestic residents (adjusted for domestic inflation); and (3)
DO CENTRAL BANKS HAVE A GOVERNANCE PROBLEM?
575

flow expenditures, namely operating expenditures, (net) exceptionalexpenditures, and transfers to the shareholder.13
Because d is not known, the term Rd is obtained as a residual. A positiveRd implies that the seigniorage gain derived from not (fully) remuneratingbank or government deposits more than offsets the seigniorage loss derivedfrom holding assets that are not fully performing (that is, that do not earn themarket rate of interest).
Interest Rates and Valuation Adjustments
Interest rates are obtained, when available, from yields on treasury bonds. Inthose cases in which only rates on short-term public debt (treasury bills) areavailable, the bond rate is obtained by adding to the bill rate the averagespread between the bond rate and the bill rate for those countries for whichdata are available for both. Table 9 sums up the interest rate data. As wouldbe expected, nominal interest rates and risk premiums are higher in WCBcountries, reflecting higher inflation. However, there is no significantdifference between SCBs and WCBs with regard to real interest rates andrisk premiums. Hence, WCBs do not appear to be penalized for their worsefinancial conditions.14
Table 9. Interest Rates and Risk Premiums
Full Sample Weak Central Banks Strong Central Banks
Nominal interest rate 9.31 13.05 7.73
Inflation 5.16 9.22 3.43
Nominal risk premium 7.21 10.95 5.62
Real interest rate 3.99 3.72 4.10
Real risk premium 4.15 3.88 4.26
Source: IMF, International Financial Statistics.Note: This table presents nominal and real interest rates and risk premiums for the sample
and subsamples of central banks. The interest rates are obtained, when available, from yieldson treasury bonds. When only rates on short-term public debt (treasury bills) are available, thebond rate is obtained by adding to the bill rate the average spread between the bond rate andthe bill rate for those countries for which data are available for both.
13An alternative presentation considers currency as ‘‘shadow’’ capital (see Stella, 1997). Inthis case, Equation (7) becomes R(cþ dþ k)þ .
c¼ (jexFþ pk)þ (e.xFþ .
xGþ .xB)þ (oþ zþ t).
Currency provides seigniorage through both the implied nominal return on its real balancesand the increase in its real demand.
14This finding is somewhat surprising. Though it is true that central banks can eventuallyclean up their financial position through a burst of inflation, one would nonetheless expectsuch a threat to be reflected in a higher risk premium. The lack of premium may reflect the factthat (i) most interest rates used in this study are associated with treasury liabilities, rather thancentral bank liabilities; (ii) the threat of future inflation is too diffuse in time to have asignificant impact on current rates; (iii) weak central banks are expected eventually to be
Alain Ize
576

To obtain the real changes in net foreign claims (that is, the change inforeign claims adjusted for exchange rate valuation effects and foreigninflation), assumptions about the currency composition of internationalreserves are needed. Because central banks do not make their foreign reservemanagement policies (or debt composition) public, I used weights based on amix of expert opinion and a study by Eichengreen and Mathieson (2000) (seeTable 10).
To estimate exchange rate valuation adjustments, I used the average oftwo opposite methods. The first method calculates price adjustments basedon beginning-of-year balances and volume changes based on end-of-yearbalances. The second method does the opposite.15 As shown in the Appendix,both methods provide a decomposition of price and quantity effects thatensures consistency between the income statement and the balance sheet. Toensure similar consistency, I carried out price adjustments (to deflate nominalmagnitudes into real magnitudes) following the same methodology.
Results
Table 11 shows the results of the seigniorage decomposition. For the sampleas a whole, highlights are as follows:
� On the source side of seigniorage, it is remarkable that unremunerateddeposits at the central bank generate more seigniorage than currency does.This finding underlines central banks’ high dependence on nonmarket-based income (mostly seigniorage on required reserves).
� However, on the user side of seigniorage, balance sheet costs, mainly thecarrying cost of international reserves, are also by far the dominating
Table 10. Foreign Reserves Currency Weights(In percent)
Dollar Euro Yen
Euro area countries 70 30
United States 50 50
All other countries 70 25 5
Source: Author’s estimates.Note: This table presents a rough estimate of the currency composition of central banks’
foreign reserves, based on expert opinions and a study by Eichengreen and Mathieson (2000).
recapitalized by their shareholder (that is, they benefit from an implicit governmentguarantee); or (iv) central banks’ financial condition is generally not well perceived in themarketplace, perhaps in part because of the opacity of their accounts and the fact that theirprofitability follows rules and dynamics that are different from those of commercial banks.
15The first method assumes that interest accrues only on initial balances; the secondmethod assumes it applies fully to final balances.
DO CENTRAL BANKS HAVE A GOVERNANCE PROBLEM?
577

element, accounting for nearly half of all seigniorage use. This findingsuggests that the cost of the liquidity service provided by central banksthrough their international reserve holdings is approximately covered bythe potential users of such services (the government and the financialsystem). Although there is no assurance that the level (and quality) of theservice provided is really that demanded by the users and that the costsharing between users is fair, the fact that on average users pay theassociated cost is on the whole reassuring.
� Operating expenditures account for a substantial additional chunk ofseigniorage use (about 25 percent), leaving only modest residualsavailable for capital accumulation (18 percent) and dividend transfersto the shareholder (12 percent).
� Remarkably, international reserve accumulation accounts for thebulk of net asset accumulation (this observation, based on flows,confirms the earlier similar observation, which was based on stocks).
Table 11. Seigniorage Decomposition
Full Sample Weak Central Banks Strong Central Banks
Seigniorage 19.97 14.66 22.36
Rc 8.64 12.09 7.09
Rk 2.3 �1.19 3.87
Rd 9.03 3.76 11.4
Balance sheet costs 9.4 10.74 8.79
jexF 8.16 10.47 7.11
pk 1.24 0.27 1.68
Expenditure flows 6.99 6.98 7.00
o 4.85 6.63 4.06
z �0.39 �1.91 0.29
t 2.53 2.26 2.65
Capital accumulation 3.58 �3.05 6.57
eDxF 20.58 26.84 17.77
DxG 4.28 �13.21 12.15
DxB �14.96 �10.11 �17.14
Dc �6.32 �6.57 �6.21
Sources: IMF, International Financial Statistics; and central banks.Note: This table provides an accounting identity decomposition of seigniorage, where c is
currency issued; k capital; xF, xB, and xG the net claims on the foreign sector, banks (and theprivate sector), and the public sector, respectively; d net non-interest-bearing liabilities(unremunerated deposits minus non-performing assets); e the real exchange rate against theU.S. dollar; o operating expenditures; t transfers to the treasury; z other net exceptionalexpenditures; R the (home) nominal interest rate; p (home) inflation; and f the real interest ratepremium.
Alain Ize
578

The increase in foreign assets is largely offset by a reduction of net claimson banks.16
Results for the two subsamples show very marked differences:
� With reference to the bottom line, WCBs lose (real) capital, whereasSCBs gain, which confirms the earlier result obtained on the basis ofconventional (nominal) accounting.17
� The main reason underlying the poorer financial conditions of WCBs istheir much lower capacity to produce and retain seigniorage, despite themuch higher inflation (hence a much higher seigniorage on currency). Thissurprising result follows from the fact that the higher seigniorage oncurrency is more than offset by the lower seigniorage on capital (Rk) andnet noninterest-bearing liabilities (Rd).
� The lower (indeed negative) seigniorage on capital is the logical outcome ofnegative profits leading over time to low or negative capital.
� As to the lower Rd, it can reflect either a higher proportion of remunerateddeposits or a higher proportion of nonperforming assets. The latter seemsmore logical; WCBs’ weaker finances are more likely to reflect their inabilityto obtain interest income on their assets than their inability to limit theirinterest payments on their deposits. Indeed, assuming that none of thedeposits is remunerated would lead to the conclusion that only 10 per cent ofWCB domestic assets are fully remunerated, compared with 66 per cent forSCBs. As a result, WCBs’ seigniorage income is effectively being siphonedoff by nonperforming assets.
� Notwithstanding equivalent real risk premiums and lower net foreign assets,WCBs face higher carrying costs of foreign reserves than do SCBs. Thissurprising result derives from the fact that risk premiums and net foreignassets are positively correlated for WCBs and negatively correlated for SCBs.For the latter, the negative correlation could reflect the fact that countrieswith higher international reserves are more stable and thus have lowerfunding costs. For the former, the causality could flow the other way;countries that are less stable (and thus pay higher premiums) increase theirreserves in an attempt to increase their stability and reduce their fundingcosts. This interpretation is consistent with the fact that, as was alreadyapparent in Figure 2, WCBs accumulate foreign assets at a much higher ratethan do SCBs.
16Although this increase in foreign assets could be viewed as an indication that centralbanks channel abroad much of the liquidity they obtain from banks, the bivariate testsconducted earlier do not seem to support this view.
17This rather bleak conclusion holds, however, only under a strict definition of capital. Ifcurrency is counted as ‘‘shadow capital,’’ WCBs still accumulated, as a group, some capital.Such an accumulation, which might be sufficient to stave off a downward spiral into debtunsustainability, would be consistent with the earlier finding that WCBs do not seem to facesubstantial penalties with regard to interest rate premiums. However, counting currency ascapital implicitly assumes that it will continue to be demanded. In view of rapidly evolvingpayment technologies, this assumption is clearly debatable.
DO CENTRAL BANKS HAVE A GOVERNANCE PROBLEM?
579
� Finally, it is also noteworthy that WCBs are able to accumulateinternational reserves despite their weak financial condition, owing to ahigh accumulation of liabilities with government.18 This reserveaccumulation capacity supports the hypothesis that WCBs are highlydependent on their governments and ‘‘bank’’ for them rather than fortheir commercial banks.
III. Central Banks’ Operating Expenditures
Demand vs. Supply Factors
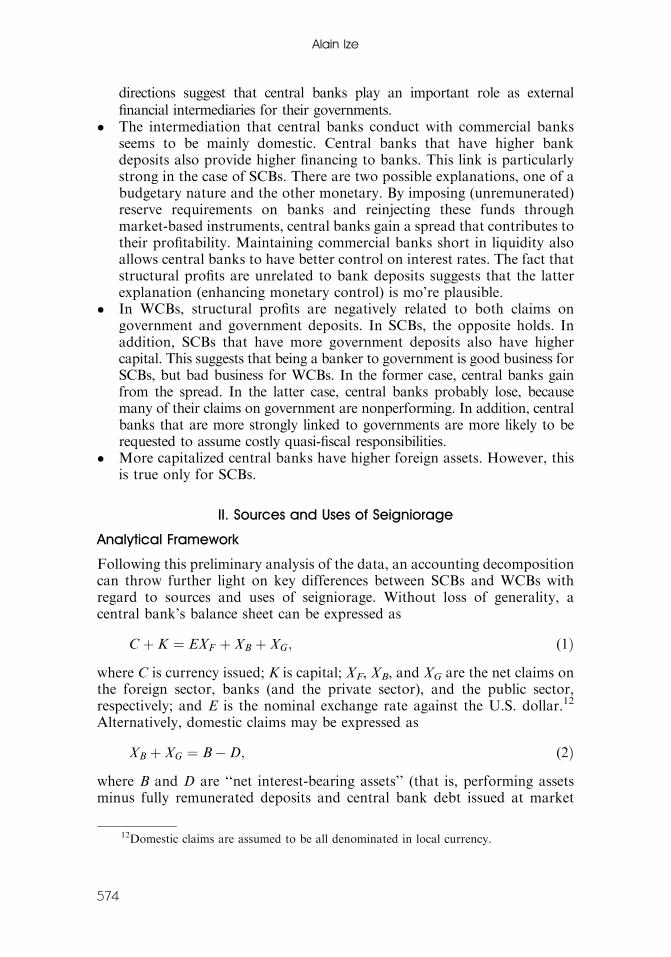
Central banks’ operating expenditures should reflect the volume of servicesthey provide and the price of these services. Central bank services can beclassified into two broad categories: those directly related to monetarymanagement (price and output stability) and those related to financial systemstability and development (supervision and payments). When central banksface a soft revenue constraint (which should be the case for SCBs), one wouldexpect the provision of central bank services to be determined strictly fromthe demand side (supply accommodating demand). Demand should rise withcountry size (possibly with increasing returns), per capita GDP (assumingcentral bank services are not inferior goods), the size of the financial sector,and the scope of central banks’ responsibilities (in particular, whether theyare responsible for financial supervision).
When central banks face a harder revenue constraint (presumably thecase of WCBs), one would expect supply factors to dominate (demandaccommodating supply). Relevant supply factors should include variables thatdetermine the availability of seigniorage (such as inflation, currency incirculation, or currency growth) or the cost of central bank services (mostlythe wage level of central bank staff). Variables that determine how wisely theseigniorage may be used (such as governance indices) could also affect theoutcome.
The very high (82 per cent) correlation between currency issuedand central banks’ operating expenditures would suggest, at first sight,that supply-side effects might dominate. To test whether this is indeedthe case and whether some central banks may be affected by ‘‘hard’’revenue constraints, the following two non-nested models are compared:On the demand side, regressors include population, per capita GDP,broad money (M2) over GDP (all variables in logs), and a multiplicativedummy for central banks that are responsible for banking supervision.On the supply side, regressors include (the log of) currency in circulation,the KKM governance index, and the average inflation rate over the past10 years.
18This flow observation confirms the observation made earlier based on the bivariatestatistical analysis of stocks.
Alain Ize
580

Results are reported in Table 12. Neither the financial depth variable inthe demand model nor the wage level or inflation variables in the supplymodel were significant (and hence are not shown in the table). Both modelsgive otherwise satisfactory results, with all variables having the appropriatesigns. In the demand model, there are very clear size and wealth effects.However, there are also clear increasing returns: A 10 percent increase incountry size or per capita income is reflected in only a 7.5 or 5.8 percentincrease, respectively, in operating expenditures. This confirms the earlierfinding that central banks in the smaller and poorer countries are more likelyto struggle financially than are those in large, wealthier countries, reflectingthe fixed costs of central banking. Similar increasing returns are present in thesupply model, with a 10 percent increase in currency issued translating intoonly a 7 percent increase in operating expenditures.
It is also noteworthy that the provision of supervisory services, thoughsignificant, has only a modest impact on central banks’ operatingexpenditures, increasing them by less than 2 percent. Similarly, thegovernance variable has a significant but modest impact, with animprovement in the KKM index from the worst to the best country in thesample reducing central banks’ operating expenditures by slightly more than1 percent.
To test whether there is a substantial difference between the twogroups of central banks, I estimated the two models for each subsample.Though financial depth has a significant impact on the operatingexpenditures of WCBs but not on those of SCBs, other effects are verysimilar.
The results of the model comparison for the aggregate sample, using theDavidson and Mackinnon’s (1981) J-statistics for non-nested models, appearin Table 13.19 They indicate that the demand model dominates the supplymodel, which is consistent with the numerical dominance of the SCBs in theoverall sample. This finding therefore suggests that central banks’ operatingexpenditures are driven, overall, by a soft budget constraint.
A reduced-form equilibrium model that combines and retains allsignificant demand and supply factors is shown in Table 12. On the basisof the residuals of the equilibrium model, an index of relative performance,pi, for central bank i is then derived as
pi ¼ 100ðedi � 1Þ; (8Þ
where di is the residual of the reduced-form regression. Thus, pi is thepercentage of over- or underspending of central bank i compared with itspeers.
The performance index, which is shown in Figure 3, indicates thatdifferences in performance are very large. The best performer spends more
19This test compares the relative significance of the predicted values of each model whenintroduced as a regressor in the other model. See Davidson and MacKinnon (1981).
DO CENTRAL BANKS HAVE A GOVERNANCE PROBLEM?
581

Table 12. Central Banks’ Operating Expenditures
VariablesFull Sample Strong Central Banks Weak Central Banks
Demand Supply Reduced form Demand Supply Reduced form Demand Supply Reduced form
Log (population) 0.76 0.61 0.74 0.55 0.86 0.86
�22.2** �7.24** �20.45** �5.43** �12.19** �3.3**
Log (GDP/Per Capita) 0.62 0.068 0.58 0.61 0.51 0.57 0.75
�14.93** �0.71 �5.67** �12.94** �3.88** �7.4** �3.12**
Bank supervision 0.01 0.01 0.008 0.007 0.03 0.03
�2.26* �1.93* �1.05 �0.95 �1.83* �1.41
Log (M2/GDP) �0.005 0.0004 0.78
(�0.16) �0.01 �3.3**
Log (currency) 0.67 0.15 0.67 0.19 0.7 �0.05
�19.52** (1.98)* �18.23** �2.07* �7.12** (�0.21)
KKM �0.41 �0.22 �0.09 �0.16 �0.41 �0.012
(�2.96)** �1.34 (�0.46) (�0.95) (�1.23) (�0.05)
Adjusted R-squared 0.54 0.83 0.88 0.89 0.85 0.9 0.91 0.81 0.87
Standard error of regression 0.54 0.63 0.53 0.51 0.59 0.49 0.46 0.69 0.58
Sum of squared residuals 26.91 36.95 25.32 16.4 22.39 15.06 4.87 10.9 7.03
Log likelihood �75.46 �90.39 �72.24 �48.33 �59.07 �45.39 �15.24 �26.07 �20.14
Durbin Watson 2 1.92 2.03 2.28 2 2.21 2.31 2.24 2.22
F-statistic 171.08 156.67 142.49 141.05 134.12 122.09 72.23 37.67 34.32
Source: IMF, International Financial Statistics; World Bank, World Development Indicators; and central banks.Note: *90 percent significance level. **95 percent significance level. This table presents non-nested supply and demand models of central banks’
operating expenditures. On the demand side, regressors include population, per capita GDP, M2 over GDP (all variables in logs), and a multiplicativedummy for central banks that are responsible for banking supervision. On the supply side, regressors include (the log of) currency in circulation, and theKKM governance index. A reduced-form equilibrium model that combines and retains all significant demand and supply factors is also shown.
Ala
inIze
582

Figure 3. Countries’ Ranking by Performance Index(In percent)
-100.00
0.00
100.00
200.00
300.00
400.00
500.00
600.00
* * * * ** * * * * * *** * * * *** **** * ***Weak Central Banks
Source: Central banks.
Table 13. Operating Expenditures: Model Comparison
Variables Model 1 Model 2
(Demand) (Supply)
Log (population) 0.59
(6.07)**
Log (GDP per capita) 0.48
(5.75)**
Bank supervision 0.02
(2.03)**
Log (o) (Model 2) 0.25
(1.90)*
Log (currency) 0.16
(1.90)*
KKM �0.09
(1.30)
Log (o) (Model 1) 0.79
(6.42)**
Constant �0.09 0.26
(0.13) (0.35)
Adjusted R-squared 0.88 0.88
Standard error of regression 0.53 0.53
Log likelihood �73.10 �72.80
Durbin Watson 1.97 2.01
Source: IMF, International Financial Statistics; World Bank, World DevelopmentIndicators; and central banks.
Note: *90 percent significance level. **95 percent significance level. This table presents theresults of a model comparison for the aggregate sample, using Davidson and MacKinnon’s(1981) J-statistic for non-nested models. Results indicate that the demand model dominates thesupply model.
DO CENTRAL BANKS HAVE A GOVERNANCE PROBLEM?
583

than three times less than the group average, whereas the worst performerspends more than five times more than the average. By itself, this finding isalready a clear indication that some central banks face soft budgetconstraints and governance issues.
This conclusion is further supported by the fact that WCBs tend to havelower expenditure performance indices. This can be seen in Figure 3, whereWCBs are grouped on the right-hand side of the chart. It is similarlyapparent from a scatter diagram between the expenditure performance indexand the ratio of structural profitability to currency (Figure 4) that the centralbanks with the highest level of spending tend to be the least profitable. Thisfinding clearly points in the direction of weak governance. With stronggovernance, financially weaker central banks should spend less (rather thanmore), reflecting efforts to restrain their operating expenditures.
IV. Conclusions
The above results tell two somewhat distinct, yet partly overlapping, stories.The typical WCB story is that of central banks in smaller and poorereconomies that have not been able yet to distance themselves from theirgovernments or that are still living the aftermath of past dependencies. Facedwith weak or volatile public budgets, these central banks exhibit limitedindependence. They are still used as sources of cheap or last-resort financing.They ‘‘bank’’ mostly for their government and are burdened with largenonperforming assets (possibly acquired as a result of quasi-fiscal activities orsupports to failing banks) and compulsory transfers that deeply underminetheir profitability. Though WCBs make up, in part, for their financial
Figure 4. Structural Income (SI) and Performance Index (PI)(in percent)
-120
-80
-40
0
40
80
-80 -40 0 40 80 120 160 200PI
SI
Alain Ize
584

difficulties by following looser monetary policies, the bulk of the adjustmenttakes place through their capital account, which shrinks over time.
Remarkably, the typical WCB also has higher operating expenses thandoes the typical SCB. Though these higher expenses are not the main reasonfor their poor financial health, the fact that WCBs’ weak finances do notseem to lead to efforts to limit them clearly raises questions as to theirgovernance. The fact that WCBs typically operate in countries with lowergovernance standards suggests that their weak governance and limitedfinancial independence may be reflections of the same underlying weaknessesin the institutional environment.
In contrast, the typical SCB operates in larger and wealthier economieswith lower inflation and better governance. Their finances are sound andtheir operating expenses substantially below those of the typical WCB.Nonetheless, the fact that SCBs’ operating expenses are strongly related totheir profitability (unlike dividend transfers) and vary widely across centralbanks operating under similar environments suggests that many SCBs do notfeel compelled to squeeze out every penny for their shareholders. Thus,governance concerns do not seem to be limited to WCBs.
This being said, it is also remarkable that operating expenses are moreclosely linked to demand factors than to supply factors. By itself, this findingsupports a more benign interpretation of central bank behavior, based on alimited perspective of public welfare rather than an outright lack of governance.Most SCBs try to fulfill their stability mandate as best they can, withoutquestioning whether the marginal dollar used in this quest would be betterused elsewhere in the public sector.
The fact that several WCBs operate in large, wealthy countries but SCBsinclude a large number of central banks from smaller, poorer countries is awarning against overgeneralizing the WCB-SCB stories depicted above,however. The variety of experiences suggests instead that good central bankgovernance is neither an automatic result of the environment in which centralbanks operate nor outside the reach of those central banks that operate inmore difficult environments. This underlines the importance of putting inplace good governance arrangements.
A number of preliminary policy implications may be inferred:
� This study does not undermine the need for promoting central bankindependence. Instead, the fact that central banks with more governanceproblems also seem to be the least independent, whereas moreindependent central banks seem, overall, to have better governance,strengthens the case for independence. At least in countries with sufficientgovernance standards, this fact should reduce concerns that giving centralbanks more independence will lead to a free-for-all increase in centralbanks’ expenditures. Indeed, allowing central banks to freely managetheir budget and set their wage scale is particularly essential at a timewhen many of them need to evolve toward a modern concept of centralbanking, with fewer, but more highly skilled, staff.
DO CENTRAL BANKS HAVE A GOVERNANCE PROBLEM?
585
� Independence goes hand in hand with accountability, however. Anessential prerequisite for accountability is transparency.20 As alreadynoted, for many of those central banks that do publish their financialaccounts, there is much room for improvement in making them moreeasily accessible and understandable. In particular, income statementsneed to clearly distinguish between transitory and permanent (structural)components. For those central banks that do not yet make their incomestatement public, it is, of course, high time to do so.
� Periodic reviews of central bank expenditures by governments (includingwith regard to the cost of reserve accumulation) might be a healthypractice to ensure that criteria for comparing the provision of publicgoods are sufficiently uniform across the public sector. As discussed in Ize(2005), central bank recapitalizations may provide good opportunities forsuch broad policy debates. Arrangements such as the one introducedrecently in New Zealand (whereby seigniorage income on currencybelongs to the state, but a share of it, negotiated with the treasury everyfive years, is retained by the central bank for its own funding) offerinteresting examples of more systematic stock-taking opportunities thatother central banks may wish to follow.
� In view of its implications for a healthy financial intermediation, centralbanks’ high dependence on seigniorage income arising fromunremunerated deposits, including bank deposits, is a source of concernlooking ahead. The fact that carrying international reserves on thebalance sheet is costly for many central banks provides, at least inprinciple, a justification for not paying the full market interest rate (thatis, not paying the risk premium) on funds deposited at the central bank(which should benefit from the liquidity associated with highinternational reserves). However, questions remain as to what is asocially desirable level of international reserves and whether bank users ortaxpayers in general should pay for their carrying cost.
� The role played by central banks as external financial intermediaries ofgovernments, mostly in lower-income countries, needs to be betteranalyzed and its potential benefits and pitfalls better assessed. Thoughthere are clear dangers for central banks’ financial health andindependence, increased access to external finance may also yield socialbenefits.
The conclusions above are subject to important caveats that reflect thelimitations of this study. In particular, the fact that the study rests on datafrom a single year (2003) and its conclusions are based purely on cross-sectional evidence raises issues of causality and hinders the distinctionbetween stable patterns and merely circumstantial occurrences. This problem
20One of the main merits of transparency is to allow for systematic peer comparisons. Byfacilitating studies such as this one, transparency provides the necessary benchmarking forcentral banks to have a clearer idea of where they stand and take appropriate action.
Alain Ize
586

is amplified by the fact that some of the conclusions in this paper are basedon simple averages. Though the aggregate sample was divided into two morehomogeneous subsamples and care was taken to eliminate clear outliers, thelarge standard deviations of many variables across the two subsamplesindicate that considerable heterogeneity remains. Thus, the risk remains thatsome of the results may be dominated by large deviations in a few of thecountries in the sample.21
In addition, assessing central bank output is inherently difficult, given thelack of counterfactual evidence for what economic performance would looklike in the absence of a central bank. This problem is amplified here by thefact that this study does not make any specific inferences about central bankefficiency in the traditional sense—that is, how much output is obtained for agiven input. Measuring the quality of central bank services is a particularlydifficult task. The performance index in this paper should thus be interpretedwith caution. Clearly, more analysis is needed to firm up the mainconclusions of the paper.
APPENDIX
Sample Countries
Information on income statements for 2003 (the base year for this study) was drawn from
central banks’ websites. Balance sheet information for 2002 and 2003 and all
macroeconomic indicators were drawn from International Financial Statistics (IFS).
Other items net were consolidated with capital. From the full universe of 184 IMF
member countries, a first selection was made to exclude those countries whose income
accounts were not published or were published in a language not easily accessible. Doing
so reduced the sample to 101 countries (Table A.1). The sample was reduced to 87
countries for the seigniorage study, after the elimination of those countries that (1) did
not have sufficiently detailed income statements (that would allow in particular to
identify net interest margins), (2) for which no interest rate data could be obtained, or (3)
for which the flows derived from the beginning-of-period and end-of-period balance sheet
information did not seem to be easily reconcilable with the income statement.
Valuation Adjustments
Consider the general balance sheet form
Kt ¼ EtX�t þ Xt; (A.1)
where Xt� and Xt stand for net foreign-currency-denominated assets and net local-
currency-denominated assets at time t, respectively; Kt is the central bank’s capital; and Et
is the exchange rate. If valuation adjustments are applied to beginning-of-period stocks,
21Overcoming these problems and identifying proper dynamics and causality patternswould require a panel analysis over a sufficiently long period (and, therefore, a much largerinvestment in the preparation of the data).
DO CENTRAL BANKS HAVE A GOVERNANCE PROBLEM?
587

profits can be expressed from the income statement as
DKt ¼ R�t þ
Et � Et�1
Et�1
� �Et�1X
�t�1 þ rt þ
Pt � Pt�1
Pt�1
� �Xt�1; (A.2)
where Rt� and rt are the nominal foreign interest rate and the real domestic interest rate,
respectively, and Pt is the domestic price level. But taking the first differences of Equation
(A.1) leads to
DKt ¼ ðEtX�t � Et�1X
�t�1Þ þ ðXt � Xt�1Þ; (A.3)
which can also be decomposed into price and volume effects as
DKt ¼EtðX�t � X�
t�1Þ þEt � Et�1
Et�1Et�1X
�t�1
þ PtXt
Pt� Xt�1
Pt�1
� �þ Pt � Pt�1
Pt�1Xt�1: ðA:4Þ
If Equations (A.2) and (A.4) are compared, it can immediately be seen that the
valuation adjustments are the same, making the income and balance sheet statements,
expressed in real terms, fully consistent.
Table A.1. Sample Countries
Argentina Denmark Kuwait Qatar�
Armenia El Salvador Kyrgyz Republic Romania
Australia Estonia Latvia Russia
Austria Fiji Lebanon Saudi Arabia�
Azerbaijan Finland Lesotho� Serbia�
The Bahamas France Lithuania Sierra Leone
Bahrain Georgia Luxembourg Singapore
Bangladesh Germany Macedonia, FYR Slovak Republic
Barbados Greece Madagascar Slovenia
Belarus Guatemala Malta� South Africa
Belgium Haiti Mauritius Spain
Belize Honduras Moldova Sweden
Bermuda Hungary Mongolia Switzerland
Bolivia Iceland Mozambique Tanzania
Bosnia and Herzegovina India Namibia� Thailand
Botswana� Indonesia Netherlands Tunisia
Brazil Iran, I.R. of New Zealand Turkey
Bulgaria Ireland Nicaragua Ukraine
Canada Israel Nigeria
Cayman Islands� Italy Norway
United Arab Emirates�
Chile Jamaica Oman
United Kingdom
Colombia Japan Pakistan
United States
Costa Rica Jordan Paraguay
Uruguay
Croatia Kazakhstan Peru
Cyprus Kenya Poland
Czech Republic Korea Portugal
�Countries excluded from the seigniorage study.
Alain Ize
588

A similar decomposition can be carried out for the income statement, based on end-
of-period stocks:
DKt ¼ R�t þ
Et � Et�1
Et
� �EtX
�t þ rt þ
Pt � Pt�1
Pt
� �Xt: (A.5)
And the first differences of Equation (A.1) can also be decomposed as
DKt ¼Et�1ðX�t � X�
t�1Þ þEt � Et�1
EtEtX
�t
þ Pt�1
PtXt � Xt�1
� �þ Pt � Pt�1
PtXt: ðA:6Þ
It can again be checked that Equations (A.5) and (A.6) are mutually consistent.
REFERENCESBrione, P., 2005, ‘‘Central Bank Staff Costs,’’ Central Banking Journal, Vol. 16, No. 2,
pp. 69–74.
Davidson, R., and J. MacKinnon, 1981, ‘‘Several Tests for Model Specification in thePresence of Alternative Hypotheses,’’ Econometrica, Vol. 49 (May), pp. 781–93.
Eichengreen, B., and D.J. Mathieson, 2000, ‘‘The Currency Composition of ForeignExchange Reserves: Retrospect and Prospect,’’ IMF Working Paper 00/131(Washington, International Monetary Fund).
Fry, M., C. Goodhart, and A. Almeida, 1996, Central Banking in Developing Countries:Objectives, Activities and Independence (New York, Routledge).
Galan Camacho, J.E., and M. Sarmiento Paipilla, 2006, Staff, Functions, and Staff Costsat Central Banks: An International Comparison with a Labor-Demand Model,Borradores de Economia (Bogota, Banco de la Republica).
Ize, A., 2005, ‘‘Capitalizing Central Banks: A Net Worth Approach,’’ IMF Staff Papers,Vol. 52 (September), pp. 289–310.
Kaufmann, D., A. Kraay, and M. Mastruzzi, 2003, ‘‘Governance Matters III:Governance Indicators for 1996–2002,’’ Policy Research Working Paper No. 3106(Washington, World Bank).
McKinley, V., and K. Banaian, 2005, ‘‘Central Bank Operational Efficiency: Meaningand Measurement,’’ in Central Bank Modernisation, ed. by Peter Nicholl and NeilCourtis (London, Central Banking Publications).
Pedersen, E.H., 2006, ‘‘Danmarks Nationalbank’s Operating Costs and Number ofEmployees in an International Comparison,’’ Working Paper No. 35 (Copenhagen,Danmarks Nationalbank).
Stella, P., 1997, ‘‘Do Central Banks Need Capital?’’ IMF Working Paper 97/83(Washington, International Monetary Fund).
———, 2005, ‘‘Central Bank Financial Strength, Transparency, and Policy Credibility,’’IMF Staff Papers, Vol. 52 (September), pp. 335–65.
DO CENTRAL BANKS HAVE A GOVERNANCE PROBLEM?
589