Habits of Inequality: A Radical View of Institutions and Inequality
Upload
independentCategory
view
4download
0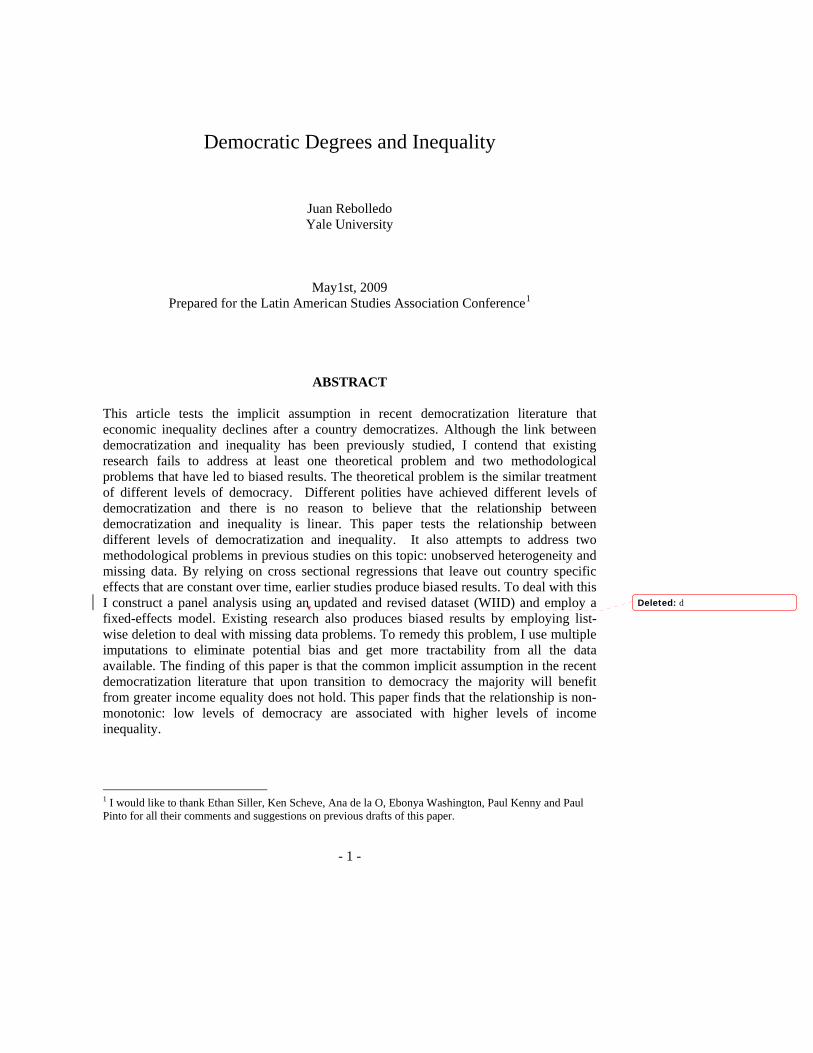
- 1 -
Democratic Degrees and Inequality
Juan Rebolledo Yale University
May1st, 2009 Prepared for the Latin American Studies Association Conference1
ABSTRACT This article tests the implicit assumption in recent democratization literature that economic inequality declines after a country democratizes. Although the link between democratization and inequality has been previously studied, I contend that existing research fails to address at least one theoretical problem and two methodological problems that have led to biased results. The theoretical problem is the similar treatment of different levels of democracy. Different polities have achieved different levels of democratization and there is no reason to believe that the relationship between democratization and inequality is linear. This paper tests the relationship between different levels of democratization and inequality. It also attempts to address two methodological problems in previous studies on this topic: unobserved heterogeneity and missing data. By relying on cross sectional regressions that leave out country specific effects that are constant over time, earlier studies produce biased results. To deal with this I construct a panel analysis using an updated and revised dataset (WIID) and employ a fixed-effects model. Existing research also produces biased results by employing list-wise deletion to deal with missing data problems. To remedy this problem, I use multiple imputations to eliminate potential bias and get more tractability from all the data available. The finding of this paper is that the common implicit assumption in the recent democratization literature that upon transition to democracy the majority will benefit from greater income equality does not hold. This paper finds that the relationship is non-monotonic: low levels of democracy are associated with higher levels of income inequality.
1 I would like to thank Ethan Siller, Ken Scheve, Ana de la O, Ebonya Washington, Paul Kenny and Paul Pinto for all their comments and suggestions on previous drafts of this paper.
Deleted: d

- 2 -
Social scientists have historically believed in an interwoven relationship between
democracy and inequality which can probably be traced back to Aristotle. The idea that
political factors might determine economic outcomes or that economic conditions will
influence the political status quo are an undeniable influence in both theories of
democratization and theories of inequality. Recently two new theories have attributed
inequality as the primary determinant of democratization, both assuming that
democratization is associated with a greater degree of redistribution. The literature trying
to substantiate the assumption of a negative effect of democracy on inequality is far from
reaching a consensus. In light of these new theories we must revisit the research on the
effect of democracy on inequality. I contend that the main problem with the existing
literature is the underlying assumption that all levels of democracy will have the same
effect on inequality.
The two new seminal works on democratization are Boix’s (2003) “Democracy
and Redistribution” and Acemoglu and Robinson’s (2006) “Economic Origins of
Dictatorship and Democracy”. Both of these theories treat democracy as an institution;
characterized by an enlargement of the franchise, democratization will give way to the
political dynamic suggested by Meltzer and Richard (1981) by which income will be
redistributed from the mean to the median voter.
- 3 -
In Boix (2003), transitions to democracy are products primarily of decreases in
income inequality2. The assumption of the model is that different political regimes have
different decision mechanisms which have distinct redistributive repercussions: autocracy
associated with low redistribution and democracy associated with high redistribution.
Boix (2003) assumes that under right-wing authoritarianism the tax implemented for
redistributive purposes is effectively zero chosen by the elite that controls wealth. In
democracies that tax rate is determined by simple majority rule in which the median voter
is a poor individual and will prefer a redistributive tax larger than zero that will be
increasing relative to the level of inequality. Individuals, who have specific economic
interests, will choose to support the political regime that will promote a redistributive
property that favors them. The poor citizenry (who are part of the majority) seek
redistribution and the rich elites seek to prevent such redistribution. The poor pressure for
democracy, for this will allow more redistribution, and the rich will decide whether to
allow democratization to take place subject to a relative cost comparison between
redistributing and repressing. If inequality is high, the rich will push to “restrict the
franchise to avoid redistributive consequences of a fully democratic system…” while on
the other hand “the least well-off individuals support a democracy, since it gives them a
chance to establish redistributive mechanisms”.3 Upon full enfranchisement
redistribution should decrease inequality. There is a clear prediction: ceteris paribus there
is a negative linear relationship between inequality and democracies.
2 The other key independent variables are capital mobility, popular mobilization capability and repression costs. 3 Boix, Carles Democracy and Redistribution (Cambridge: Cambridge University Press) 2003 pg. 57 and pg. 171 respectively
- 4 -
Boix (2003) does an econometric analysis to test his main hypothesis that lower
levels of inequality should be associated with higher probability of democratization. The
implication of his theory is,however, that upon democratization, the polity should
increase its redistribution mechanism and inequality should decrease; this is why the poor
seek it to begin with4. Boix (2003) indirectly tests his assumption by attempting to
establish a causal link between regime type and the size of the public sector. He does this
by using different measures of government expenditures as the dependent variable and a
dichotomous variable of regime type and electoral turnout as the main independent
variables. Support is found primarily for the claim that democracy interacted with
economic growth will produce higher levels of public spending than will autocracies.
The Acemoglu and Robinson (2006) story of democratization is centered on
power relationships. In this case individuals will choose the political system that will
allow them to impose their preferred policies. Democracies will allow individuals who
are part of the majority to impose their preferred policy (high redistribution) and non-
democracies allow individuals within the elite to impose their preferred policies (low
redistribution). The balance of power between the groups will determine the political
system. They summarize their theory as one in which “The citizens want democracy and
the elites want non-democracy, and the balance of political power between the groups
determines whether the society transits from non-democracy to democracy”.5 So the
natural question is: why do the majority support democracy and the elites support non-
4 It is true that in Boix (2003) the amount of redistribution could be lower than expected because of capital mobility, it would however still be bigger than zero, since “if it blocks the redistributive outcome preferred by the poor, it is simply a form of authoritarianism” pg. 15 5 Acemoglu and Robinson Economic Origins of Dictatorship and Democracy (Cambridge: Cambridge University Press, 2006) pg 23. It is however, as they themselves claim, a simplified version of their theory.
Deleted:
Deleted: own
- 5 -
democracies? As the title of the book suggests, the players involved are motivated by
their economic interests; the majority will prefer to democratize since it is in their
economic interest. The assumption made by the authors is that democracies represent the
preferences of the majority and the “transfer of political power to the majority typically
leads to social choices that the elite doesn’t like – for instance, higher taxes and greater
redistribution”. The assumption, once again, is that democracies are redistributive in
nature (this is why the poor want them and the rich fear them); they clearly posit that
upon democratization redistribution will increase as compared to non-democracies6.
It is important to note that for Acemoglu and Robinson (2006) there is an inverted
“U” relationship between inequality and the probability that a non-democracy will
democratize which contrasts with the linear relationship presented by Boix (2003). In
their story of relative power, the majority has power from its threat of revolution for
which it demands democratization. The elites compare the costs of preventing such a
revolution by either repression or democratization. Pressures for democratization are
faced with a dual effect of inequality: on one hand higher inequality increases the threat
of revolution by making the benefits of redistribution to the majority larger yet, on the
other hand, it also increases the relative cost of democracy for elites as opposed to
repression. Notice that both of these effects are contingent on the assumption that upon
democratization redistribution will occur and imply an economic cost to the elite and an
6 They do offer the caveat that democracies that impose “excessive” redistribution will make coups seem more attractive for the economic elite often resulting in the collapse of democracy.
Deleted: ,
- 6 -
economic benefit to the majority. From this dual effect they claim that the relationship
between the probability of regime transfer and income inequality is non-monotonic.7
Perhaps to better understand the relationship that exists between inequality and
level of democratization for these authors we must refer to their earlier work, Acemoglu
and Robinson (2002). In this paper they provide a political explanation for Kuznet’s
curve. In it they claim that economic development increases inequality (Kuznet’s curve)
which leads to political instability and eventually to democratization. The peak of the
inequality curve occurs (just?) before democratization, after which point the new political
institution successfully implements the necessary redistributive policies to reduce
inequality. This theory is consistent with Acemoglu and Robinson (2006) and still relies
on the assumption that democratization will bring about lower levels of inequality.
Inequality might increase as the franchise is enlarged but upon full enfranchisement
(democracy) inequality should decrease.
Though these books are concerned with democratization as their independent
variable and the way democratization comes about is quite different for each, it is still
evident that they are both premised on the assumption that democracies are inherently
more redistributive than non-democracies.8 This assumption is the main concern of this
7 The authors do present a series of determinants of democracy in addition to inequality. Though they emphasize that the two most relevant determinants are the costs of repression and the level of inequality. They also caveat that if democratization were to happen for other reasons which might imply “democracy will deliver few tangible reward, the citizens may revolt”. 8 It is important to reiterate that inequality is not the only determinant of political regime for either of the authors. In addition both of them caveat the expected level of redistribution upon democratization as potentially lower than expected due to a variety of intervening variables in the probability of democratization. Having said that, even though the argument is prepared to deal with perhaps lower levels
Deleted: instants

- 7 -
research paper. Such a research agenda has been plagued with identification problems in
the past which have led to a diverse set of conclusions; in this paper I intend to use a new
dataset and a better identification strategy to try to disentangle the possible effect of
democracy on inequality.
Why might we believe that in fact democracy should be associated with more
redistribution and a higher level of equality? The main argument associating lower
inequality to democracy is based on the notion that the power in a democracy lies with
the majority. When the income distribution in the population is highly unequal the
median voter (and hence a majority of the population) will prefer higher levels of
redistribution from the economically affluent minority to the poorer majority. A more
equal democratic society will continue to have high levels of redistribution in order to
maintain the status quo of equality. On the other hand, an authoritarian regime in which
power is concentrated in the affluent few does not need to concede to the interests of the
majority and only the minimum levels of redistribution to prevent revolution would be
observed. For the elites, their property rights are potentially more secure under an
autocrat of their own than under a democracy in which the poorer majority will
redistribute to their detriment.
The lack of consensus to test this theory is widely acknowledged (Reuveny and Li
2003, Decarolis 2003, Gradstein Milanovic and Ying, Sirowy Inkeles 1990, Simpson
1990, Gradstein and Milanovic 2004). The literature is divided between papers that find a
of redistribution than expected or at an extreme with dramatically low levels of redistribution, it still would face trouble if democratization increased the level of inequality.
Deleted: ,
Deleted: the
Deleted: s

- 8 -
significant negative relationship between democracy and inequality that would support
the assumptions in Boix and Acemoglu and Robinson, (Cutwright 1967, Hewitt 1977,
Muller 1988, Moon 1991, Rodrik 1998, Decarolis 2003) and those that find no significant
relationship (Bollen and Jackman 1985, Deninger and Squire 1996, Gasiorowki 1997,
Timmons 2008). A study by Gradstein, Milanovic and Ying (2001) finds no significant
relationship between democracy and inequality until they interact with religious views as
a proxy of ideology. Chong (2004) finds an inverted “U” relationship between autocracy
and democracy that theoretically peaks in inequality right before democratization which
supports Acemoglu and Robinson’s (2002) theory.9 Differences in their findings are
usually attributed to the quality of the data (particularly before Deninger and Squier
(1996)), the sample of countries used which sometimes is as low as 25, the time period
and model specification.
There are two main problems with the existing literature that this paper attempts
to address, one is substantive and the other is methodological. The substantive qualm is
that they treat all levels of democracy the same. Yet not all democracies are the same:
different polities have achieved different degrees of democratization. One possibility is
that low levels of democratization are associated with higher inequality. Several possible
explanations could exist for such (an?) increase in inequality; two possibilities are
presented below.
9 Because of Chong’s (2004) coding of democracy it is impossible to tell were exactly the inequality curve peaks. He is simply showing the existence of a non-monotonic relationship. Theoretically however, he does talk about inequality increasing “in the course” of democratization. He relies on Acemoglu and Robinson (2002) for a theoretical framework and reiterates that when inequality intensifies the elite will extend political rights to the masses.
Deleted: d
Deleted: ,
- 9 -
Polities have often managed to construct a democratic framework that satisfies
minimalist definitions of democracy were autocratic institutions persist to different
extents. Why should we assume that different degrees of democratization should have the
same constant effect on inequality? It is quite plausible that the remains of
authoritarianism in a democratic framework will cripple the degree to which the power is
equally distributed among the citizens (despite there being a full franchise and relatively
free political competition) and hence powerful elites could cripple attempts at
redistribution. If, for example, sub-national leaders have autocratic power over a
significant number of people, these powerful elites could use their autocratic power in a
democratic setting to ensure monopoly rents for themselves and their cronies which could
potentially increase the level of inequality as compared to before democratization.
Another possibility is that economically powerful interest groups formed shortly
after democratization entices corruption within the newly democratically-elected
representative to impose restrictions on competition in their industries. The consequence
of such restrictions to competition could imply monopoly rents for a few individuals and
increase inequality. Further democratic reforms in either of these cases could lead to less
income inequality.10 To get more tractability on this issue, this paper attempts to
distinguish the effects on inequality between low levels and high levels of democracy
from non-democracies. This paper does not try to attribute causality to a specific
mechanism particularly since a plurality of mechanisms could be at play.
10 My argument stands opposed to some theories that contend that it is a question of time rather than further reforms. See for example Chong and Calderon (2000)
Deleted: the
Deleted: quickly
Deleted: s
- 10 -
If low levels of democracy are associated with higher levels of inequality than
autocracies or high-leveled democracies, this would pose a problem for the Boix (2003)
and Acemoglu and Robinson (2006) theories in which the elites can make some
democratic concessions to appease redistribution demands. Why would the poor majority
favor democratization if it could make their situation worse off relative to the elites? If,
on the other hand, low levels of democracy are associated with lower levels of inequality
as opposed to non-democracies, their assumption would be corroborated.
The main methodological problem that has affected this literature stems from the
difficulty of collecting data on income inequality. Data sets on inequality are plagued
with missing values and even when the data is available its comparability between
countries is highly questionable. Even though the authors acknowledge such difficulties,
they still attempt to address the shortage of data by taking a sub-sample of nations for
which more information is available and doing cross-sectional studies. This identification
strategy is flawed and will produce biased estimators primarily on accounts of selection
bias, unobserved heterogeneity and missing data problems. Unobserved country
heterogeneity refers to country specific idiosyncrasies that are constant over time that are
correlated with both the level of democratization in a country and the level of inequality.
Such a problem would not be captured by cross-sectional studies. Since such country
specific unobservables are correlated with both the independent and dependent variables,
we would be violating the assumption of zero correlation between the error term and the
independent variables which would produce an omitted variable bias. Cross-sectional
- 11 -
studies also give us very little leverage to explore the dynamic effects that are contended
by both theories.
The problem is further accentuated by the acknowledged non-comparability of
inequality measured across countries. Cross-sectional studies directly compare the
inequality in a given county to the inequality in another county; this is highly problematic
and will produce biased estimators. Part of the observed differences in inequality levels
could be caused by simple reflection of measurement differences. This could also be a
problem within the country, this would mean that two measures of inequality within a
country for two different years are not comparable; this potential problem of inter-
country non-comparability is not addressed in this paper. Another big problem in this
literature is the way ithandles missing data. To remedy this problem what has been done
in this literature is list-wise deletion which at best implies a “loss of valuable information
and severe selection bias at worst”11. I contend that the missing data in not missing
completely at random (MCAR) but rather missing at random (MAR). If this were the
case, and not all the variables that could account for why the information is missing are
included, then the results are biased12. Within this spirit, selection bias is potentially
present when because of data problems countries are excluded from the analysis. To
address the issue of unobserved country heterogeneity I use a fixed-effect analysis on a
panel data which will allow for country specific effects as well as comparing levels of
inequality within a county and not across them. To address the issue of missing data I do
11 King et al. ‘Analyzing Incomplete Political Science Data: An alternative algorithm for Multiple Imputation” APSR 95 (2001): 49 12 Note that the other extreme (that some of the variables that can account for the missingness are not observable) we would have a more severe problem were the problem is non-ignorable.
Deleted: they
- 12 -
multiple imputation for the missing values which, under certain assumptions discussed
later in this article, produces unbiased estimators.13
In this paper I intend to show, by creating a series of dummy variables for degree
of democratization, that low levels of democracy have a positive effect on income
inequality. This conclusion brings into question that a majority of poor citizens seeking
redistribution would be content with some democratic concessions, since this will have
the opposite of the desired effect by creating greater income inequality. This paper
proceeds as follows: Section I discusses the data, in particular the dependent and
independent variables. Section II presents the research design; Section III presents the
evidence from the econometric analysis; and Section IV concludes with a discussion of
the implications and suggests an agenda for further research.
13 These are not the only problems with previous econometric exercises. Two other big problems are, the use of Polity as a proxy for democracies, and the possible reverse causality effect going from inequality to democracy. They are both addressed in the methodological section though there are still advances to be made in dealing with these issues.
Deleted: will
Deleted: of
- 13 -
I. The Data
Dependent Variable
The dependent variable in our model is income inequality. The measure of
income inequality used is the Gini coefficient, which is a measure of dispersion based on
the Lorenz curves. The Lorenz curve graphically represents the cumulative percentage of
income held by a cumulative percentage of the population ordered from poor to rich. This
is to say that a perfectly equal distribution would be characterized by a 45-degree line
from the origin. Unequal societies will be represented by Lorenz curves below the 45-
degree line. The Gini coefficient represents the area between the Lorenz curve and the
45-degree line, were a higher coefficient represents more income inequality.
Most recent studies that have used the Gini index have relied on the Deininger
and Squire (1997) data set. This research paper uses a broader and improved data set
composed by the United Nations University called the World Income Inequality Database
(WIDER)14. The WIDER dataset includes the Deininger and Squire (1997) data set
updated to 2004, in addition to a series of other measures of the Gini index. The data
covers the period 1960-2004 (an extension on previous studies that usually ended in
1995). The variable used is WIID2, a collection of all serious measures of Gini
coefficients in a country in a year, which is an updated version of WIID1. The criteria to
determine which Gini coefficients to use within WIID2 were as follows: only measures
14 http://www.wider.unu.edu/wiid/wiid.htm
Deleted: in
Deleted: ti
Deleted: corresponds for
Deleted: went up to

- 14 -
that had complete population and area coverage were used. The income sharing unit used
was either household or family and the unit of analysis had to be weighted by the number
of persons. Similarly to the Deininger and Squire (1997) data the WIDER database rates
the quality of the data entries. DS only divided the data into two types, whereas WIDER
does a more thorough job by dividing the data into four categories of quality; consistent
with their suggestion in the manual I limited the use of quality ratings to 1 and 2 only.
Where more than one Gini coefficient met all the criteria for a given country-year the
average of the two coefficients was used.
Even though a lot of progress has been made in creating datasets that reflect
income inequality in a given polity over time, there are still severe limitations to the data
available. There are two main issues: 1) the comparability of these measures between
countries and 2) missing data; many countries did not continue, or started late, decent
measures of income and earnings. In some country cases only one or two Gini coefficient
for the 44 years are available. To deal with the first problem country specific effects are
taken into account. Once fixed-effects are incorporated measurement inaccuracies should
no longer pose a problem as long as the errors are constant within a given country. To
deal with the second problem I use multiple imputation methods. A more thorough
discussion of both of these solutions is found in section II
Independent Variables
The key independent variable is the level of democracy. In this literature the most
common proxy for democracy level is the variable Polity2 from the POLITY IV project.
Deleted: were
Deleted: and
- 15 -
The index is created from two different measures on a scale of 1 to 10, one that measures
the autocratic characteristics and the other that measures the democratic characteristics.
Each of these measures is itself a composite of different components. The Polity2
measure is the difference between the democratic and the autocratic indices and hence
ranges between -10 and 10. It is quite discouraging to see that the Polity2 index is still
being used despite its obvious flaws as a proxy for democracy. Its limitations are pointed
out in papers such as Vreeland (2003) or Gleditsch and Ward (1997). Let me state three
of the problems with using such a measure. First, interpretation of the values of Polity IV
is extremely hard, how different is a democracy valued 3 from one valued at 4? Since the
index is the composite of so many variables can we really take a zero to mean minimum
democratization? Second, changes in levels of democracy over time are often
misrepresented by the many components that go into the Polity2 measure. If, for
example, a country looses a couple of points in one category but wins them in another no
change would be reflected in the index. Third, since Polity2 is composed of many
subcategories which to different degrees are subjective in nature the probability of having
measurement error is significantly increased. Measurement error in our independent
variable would imply that the assumption that ( , ) 0Corr x u =% were x x v= +% would be
violated. The implication of this type of measurement error is an attenuation bias (as well
as inconsistent) towards zero on the coefficient of the independent variable which might
explain the results of no relationship between inequality and democracy. For this reasons,
I will not be using this measure.

- 16 -
What would be a better measure of democracy? This paper does not attempt to
test and attribute among the different mechanisms through which democratization could
affect inequality. It is specifically concerned with the mechanisms implied by both Boix
(2003) and Acemoglu and Robinson (2006). In their account the institution of democracy,
because of its full enfranchisement, it includes the poor in decision making, which allows
for political entrepreneurs to run on redistributive platforms. The argument of why
democracy should have an impact on inequality is one based on representation of all
sectors of the population. In a functioning democracy with high inequality the poor will
use its overwhelming representation to impose redistribution programs. What I am
interested in measuring is how easy it is for political entrepreneurs to propose a
redistributive platform. In an autocracy we would expect it to be very hard verging on
impossible for political entrepreneurs of any ideology to participate in the political
process;by contrast, in a perfect democracy we would imagine that all competing
ideologies get a fair shot in the political process. Notice that in both theories of
democratization the idea of the enfranchisement of the poor is a key feature –this is what
brings about the redistribution; hence we are dealing with polities in which no
socioeconomic group is disenfranchised.
As a proxy for this idea of free political competition for votes I use the variable
PARCOMP form the Polity IV dataset. PARCOMP measures the competitiveness of
participation. PARCOMP measures “the extent to which alternative preferences for
policy and leadership can be pursued in the political arena.”15 The competitiveness of the
political system is measured in a five point scale ranging from a repressed political 15 Polity IV Project. User Manual
Deleted: ,
Deleted: of their
- 17 -
system (1) in which opposition to the governing elite is not permitted, to a competitive
political system (5) in which competition among different political groups is expected
and encouraged. This is obviously not a perfect measure; still I believe it to be far
superior than using the traditional Polity2 Score which is the most common measure in
this literature.16
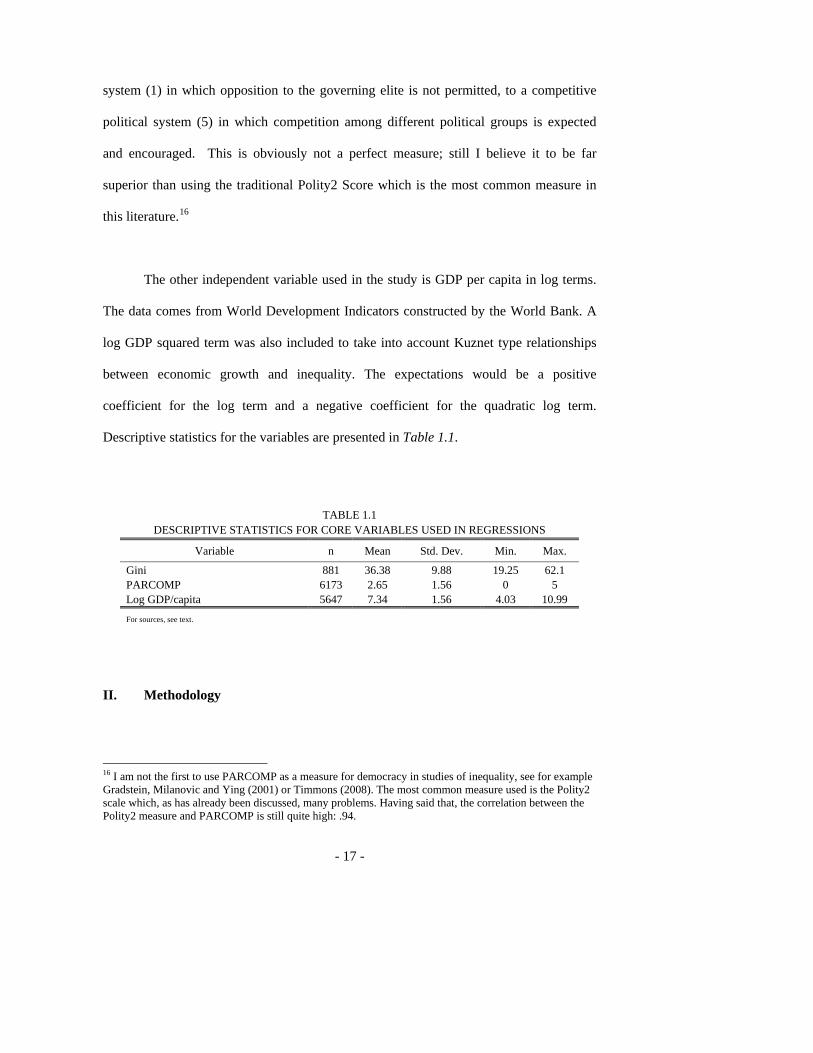
The other independent variable used in the study is GDP per capita in log terms.
The data comes from World Development Indicators constructed by the World Bank. A
log GDP squared term was also included to take into account Kuznet type relationships
between economic growth and inequality. The expectations would be a positive
coefficient for the log term and a negative coefficient for the quadratic log term.
Descriptive statistics for the variables are presented in Table 1.1.
TABLE 1.1
DESCRIPTIVE STATISTICS FOR CORE VARIABLES USED IN REGRESSIONS
Variable n Mean Std. Dev. Min. Max.
Gini 881 36.38 9.88 19.25 62.1 PARCOMP 6173 2.65 1.56 0 5 Log GDP/capita 5647 7.34 1.56 4.03 10.99
For sources, see text.
II. Methodology
16 I am not the first to use PARCOMP as a measure for democracy in studies of inequality, see for example Gradstein, Milanovic and Ying (2001) or Timmons (2008). The most common measure used is the Polity2 scale which, as has already been discussed, many problems. Having said that, the correlation between the Polity2 measure and PARCOMP is still quite high: .94.
- 18 -
The methodology used in this research paper was chosen to address both the
limitations of the data and other possible issues concerning the direction and timing of
causality. The first thing to notice is that we are dealing with an unbalanced panel of 169
countries. There is missing data for many country-years. The problem is that there could
be a strong correlation between those (awkward) that don’t present data and high levels
of income inequality which would generate biased estimators. Missing data can be
“missing” in one of three ways, missing completely at random (MCAR) which implies
what the name suggests, missing at random (MAR) which implies that there is a self-
selection of countries for which we don’t have values but can be predicted with other
control variables (which would cause selection bias), and nonignorable missing data (NI)
which means there is self-selection that depends on unobserved values. In the literature
missingness is usually dealt with by a combination of taking averages over periods longer
than a year (see for example Barro 2000 or Li and Reuveny 2003) and list-wise deletion.
All studies that I am aware of in this literature do ten year averages, the obvious problem
with the averages is that a lot of information is lost and assumptions of continuity are
made. In addition this often reduces their sample significantly to less than 90 or even 60
countries. If the data was MCAR, and list-wise deletion was used, then the missing data
would not generate a bias, though standard errors would be inefficient. However, it is
safe to assume that this is not the case, given that availability of information on inequality
is highly correlated with income level, and because regime type, undemocratic and poor
countries are more likely to be missing data which would imply there exists sample
selection.

- 19 -
To get a better sense of what the raw data looks like I have also included Figure
2.1. This figure plots for each country-5-year-average for which there is data, the
association between inequality (Gini) and the Polity Score.
2030
4050
605
year
ave
rage
Gin
i
-10 -5 0 5 105 year average Polity
Scatter Plot of Gini Coefficients against Polity Scores using 5 year averages
Figure 2.1
We can observe that there seems to be an inverse U shaped (or perhaps bowtie
shaped) pattern in the plot were the mid levels of the polity scale seem to be associated
with high levels of income inequality. It is important to note that there are far fewer
points along the medium levels of the polity score which is further evidence that the data
is not missing completely at random. This implies that whenever list-wise deletion has
been used the results are biased. To address this issue I will perform multiple imputations
of the missing values using Amelia17.
Amelia is a multiple imputation program that uses the observed data to generate
estimates of the missing data. It does this five times to create five distinct data sets. The
variance in the data sets reflects the uncertainty around the imputed values. Regressions
17 “multiple imputation will normally be better than, and almost always not worse than, listwise deletion” King et al (2001)
- 20 -
are carried out for each of the individual data set and then combined using the appropriate
procedure18 to reflect the uncertainty levels associated with the missing observations.
Having imputed the data gives us an extra advantage, the ability to use a Fixed-
Effects model. Although most of the existing literature has done its research treating the
data as cross-sectional, recognitions have been made that a panel model using Fixed
Effects would be preferable if enough of the right data were available. The fact that each
country’s social, political and economic histories differ and each has developed its own
idiosyncrasies makes me confident that there is an effect specific to each country that
both determines democracy and inequality that makes cross-sectional comparison biased.
In addition Fixed Effects are appealing when dealing with possible incompatibility of
different Gini reports across countries. An issue that has commonly been raised is that
Gini coefficients are not comparable across nations; the advantage of using fixed effects
is that even if there are discrepancy in measuring techniques across countries as long as it
is constant within countries, allowing the constant to vary would solve this issue.
The specification assumed is:
it it i ity x c uβ= + + (1)
where ity is the level of inequality in a given country at a particular point in time which is
determined by a vector itx of variables of that country at that given point in time and ic is
the individual country effect that is time constant and is correlated with ity . When using
OLS, ic becomes part of the error so if the assumption that the Corr(x,u)=0 is violated
18 miest procedure was used to combine the data sets. This procedure was developed by Kenneth Scheve.
Deleted: W

- 21 -
(and since we also assume that ic is a correlated with ity ) then our estimates would be
biased and inconsistent. By using Fixed Effects we allow the Cov(x,c)≠ 0. To get the
Fixed Effects we average over equation (1) to obtain:
i i i iy x c uβ= + + (2)
Now we can subtract equation (2) from equation (1) to get:
( )it i it i it iy y x x u uβ− = − + − (3)
where the ic has dropped out! This implies that, under the assumption that there is no
further within-country over time omitted variable problem, a pooled OLS regression on
equation (3) would not be biased since Corr(x,u)=0 would now hold.
Before proceeding I want to make clear the three main assumptions we are
making under this fixed effects model:
1. That the individual country effects ic are constant over time.
2. ( | , ) 0it i iE u x c = , once the individual country effects have been taken into account
there is strict exogeneity of the explanatory variables.
3. itx cannot include time-constant explanatory variables, they would be dropped
with c.
Another issue that must be dealt with comes directly from the democratization
literature we have been referring to, which is that inequality could be a determinant of the
level of democracy. This is a hard problem to deal with. To address this problem of
possible reverse causality, I have used the lagged value of the average of the last four
Deleted: Were
Deleted: o
- 22 -
PARCOMP values for a given polity as the key independent variable. It then becomes
impossible for inequality at time t to be a determinant of the level of democracy at prior
time periods. This is not an ideal solution; I still have the problem that inequality at time
t-2 could possibly be determining both the level of democratization at time t-1 and the
level of inequality at t. A better way to address the issue would be to instrument for
democratization. We would need to find a variable that affects the level of
democratization but not the level of inequality except through its effect on
democratization. However no such “good” instrument has been proposed in the previous
literature. One way to try to understand how big of a problem this poses is to include a
lead of our independent variable, level of democratization. These results are presented in
the appendix.
The combination of using the lagged variable average of the past 4 years gives us
an extra very intuitive advantage; it seems sensible to assume that if democracy does
have an effect on inequality it would not be instantaneous. A five year margin to see an
effect of democracy on inequality is more appealing. The possibility of a time contingent
effect of democracy is also captured in the extension which takes 5 and 10 year averages.
This paper posits that there is a different effect of low levels of democracy on
inequality than high levels of democracy or authoritarian governments. That even when
the polity is fully enfranchised if something is preventing political entrepreneurs from
presenting a platform equivalent to that of the median voter, inequality could increase
(awkward). There are two possible ways of trying to capture this effect. One way is to
Deleted: is
Deleted: ,
- 23 -
posit a non-linear relationship by adding a quadratic term of the democracy variable. The
second way of capturing what I am interested in is creating dummy variables out of the
political competition variable to represent autocracy, low and high levels of democracy.
Both methods are included. The expectation of this paper would be that having low levels
of democracy would be associated with higher levels of inequality. Autocracy will be
represented by the first two values of the political competition variable: repressed and
suppressed; low levels of democracy will be represented by the next two levels of
political competition that capture systems in which no group representing more than 20%
of the population is excluded from the political arena and there was no banning of a
political party that received at least 10% of the popular vote while factions and parochial
interests may still exist within the system; finally high levels of democracy will be
characterized by the highest value in the political competition scale.
This classification seems to be congruent with our expectations of levels of
democracy. It also shows how Boix’s dichotomous classification of democracy
(excludes) (these) different effects. For example, two countries that under our scheme
appear as autocracies would be Nicaragua before 1983 and Poland before 1988; (both)
also appear as autocracies in Boix’s classification. However, after those years Boix
considers both regimes democracies. Under this more precise classification we get that
Nicaragua since 1983 and Poland from 1989 to 2001 as low levels of democracy, and
Poland since 2001 as having high levels of democracy.
III. Evidence
Deleted: losses
Deleted: this
Deleted: ,
Deleted: all three

- 24 -
The main results that use the different methodologies proposed above are
presented in Tables 3.1 and 3.2. Table 3.1 displays four different regressions using the
original data set. In all the regressions the dummy variable Medium PARCOMP Scores is
excluded; this is our variable of interest. The expectation would be that both Low and
High PARCOMP Scores should be negative implying that low levels of democracy
(Medium PARCOMP Scores) are associated with higher levels of inequality. Column (1)
is an ordinary least squares regression which uses a one year lagged PARCOMP score as
the independent variable of interest. Both Low and High levels of PARCOMP have a
negative coefficient which is consistent with my expectations, however only the High
levels of PARCOMP are statistically significant. The findings so far could be consistent
with a linear relationship in which more democratization implies less inequality. A fixed
effects version of the same model is presented in column (2) to address the issues of
unobserved heterogeneity discussed in the previous section. The signs associated with the
coefficients do not change; however. it is very interesting to note that the significance
changed dramatically, in this specification Low levels are statistically significant while
High levels are not.
Deleted: ,
- 25 -
TABLE 3.1 INCOME INEQUALITY AND DEMOCRACY (1960-2004)
ORIGINAL DATASET Dependent Variable: Gini Coefficient OLS FE OLS FE (1) (2) (3) (4) Low PARCOMP Score -4.31 -1.60*** -4.56 -1.76*** (3.17) (0.63) (2.97) (0.56) High PARCOMP Score -9.98** -0.84 -8.59*** -0.70 (4.02) (0.76) (3.26) (0.67) Log GDP/capita 14.66 3.74 14.78 3.07 (8.85) (2.77) (9.33) (2.81) Log GDP/capita Squared -0.93* -0.42*** -0.97* -0.38*** (0.56) (0.17) (0.58) (0.17) Constant -11.85 37.02*** -14.09 39.46*** (35.49) (12.63) (37.82) 12.85) N 801 801 783 783 R squared 0.3548 0.2791 0.3558 0.285 Year Dummies YES YES YES YES Columns (1) and (2) use a one year lagged PARCOMP score Columns (3) and (4) use an average of the past 4 PARCOMP scores Columns (1) and (3) use robust standard errors clustered by country Level of statistical significance: *90 percent; **95 percent; ***99 percent
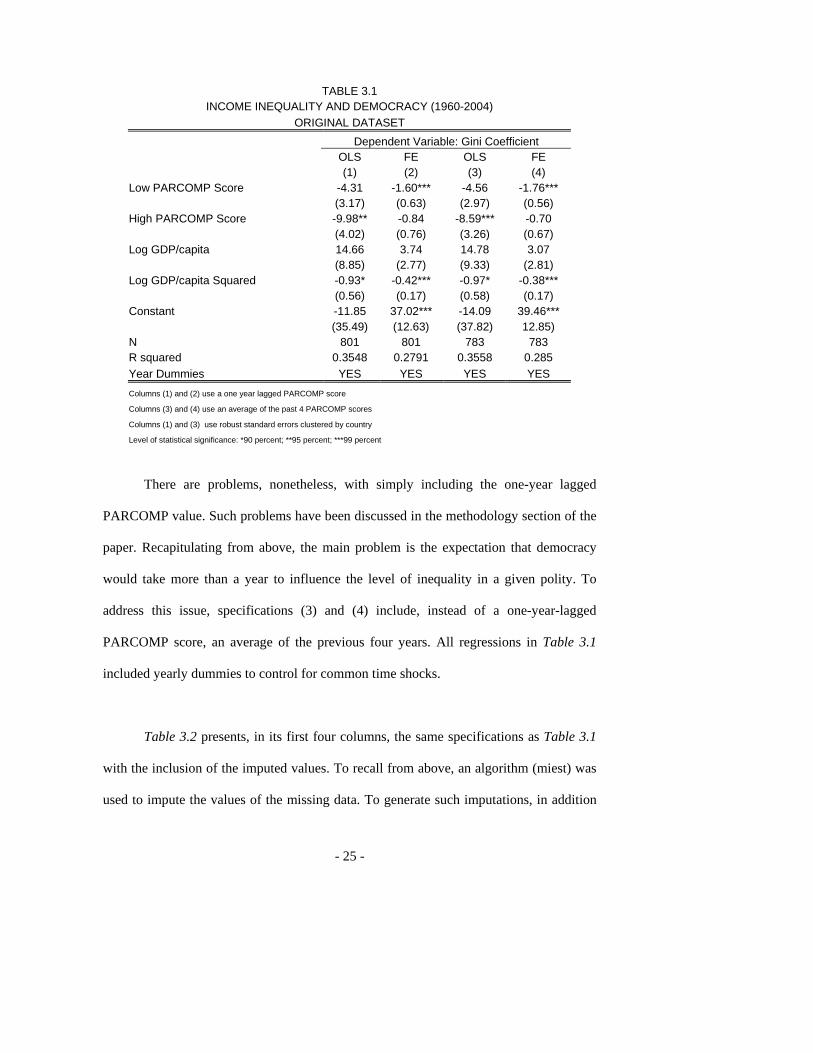
There are problems, nonetheless, with simply including the one-year lagged
PARCOMP value. Such problems have been discussed in the methodology section of the
paper. Recapitulating from above, the main problem is the expectation that democracy
would take more than a year to influence the level of inequality in a given polity. To
address this issue, specifications (3) and (4) include, instead of a one-year-lagged
PARCOMP score, an average of the previous four years. All regressions in Table 3.1
included yearly dummies to control for common time shocks.
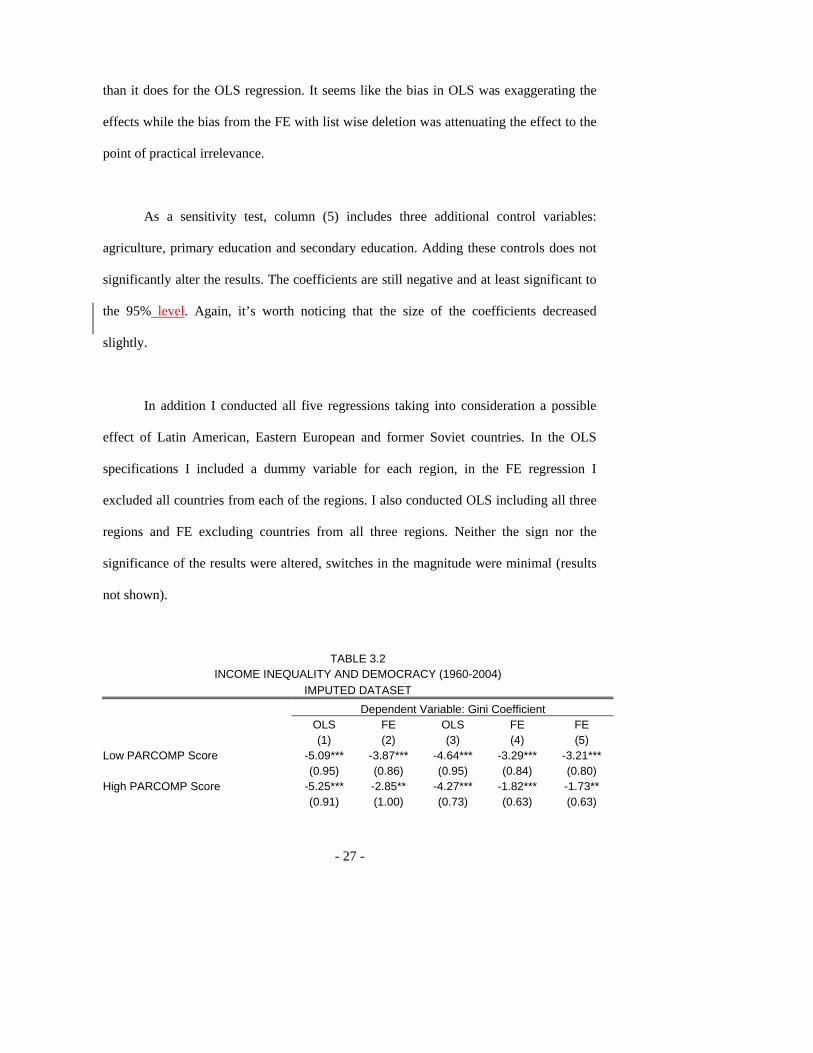
Table 3.2 presents, in its first four columns, the same specifications as Table 3.1
with the inclusion of the imputed values. To recall from above, an algorithm (miest) was
used to impute the values of the missing data. To generate such imputations, in addition
- 26 -
to the variables used in the regression analysis, other variables were included that help
predict the missing data19. An evaluation of the quality of the imputation is included in
the Appendix. Five different data sets were created, each with the same observed values
and different imputed values. Regressions were run on each of the five datasets and the
different coefficients and variances are combined. The coefficients are combined via a
simple arithmetic mean while the variance has to be adjusted for between sample
variations. The new estimations now include data from 168 countries. Columns (1) and
(2), which present the one-year lagged values of PARCOMP, still have negative
coefficients for both Low and High levels of PARCOMP but now both reach high
statistical significance. Columns (3) and (4), which present the four-year-average lagged
values of PARCOMP, also maintain their negative coefficients and they both gain
significance. It is worth noting that the values of the coefficient decrease as compared to
columns (1) and (2) respectively. For the reasons presented above I consider the core of
the argument to be best tested with the specification presented in column (4) of Table 3.2.
As I have said before, column (4) is a fixed effects regression that uses a four year lagged
value of PARCOMP as the key independent variable. The signs on both coefficients of
interest are as expected, negative. They both have levels of significance higher than 99%.
These results strongly suggest that low levels of democracy set the mechanism in place
for a larger level of inequality.
It is important to note that the results suggest that list wise deletion was producing
biased results. The bias, (understood to be ˆ( )E θ θ− ) has different direction for the FE
19 The other variables were polity score, agriculture, primary education, secondary education, political rights, civil rights, freedom house score, party registration and political competition.
Deleted: s
- 27 -
than it does for the OLS regression. It seems like the bias in OLS was exaggerating the
effects while the bias from the FE with list wise deletion was attenuating the effect to the
point of practical irrelevance.
As a sensitivity test, column (5) includes three additional control variables:
agriculture, primary education and secondary education. Adding these controls does not
significantly alter the results. The coefficients are still negative and at least significant to
the 95% level. Again, it’s worth noticing that the size of the coefficients decreased
slightly.
In addition I conducted all five regressions taking into consideration a possible
effect of Latin American, Eastern European and former Soviet countries. In the OLS
specifications I included a dummy variable for each region, in the FE regression I
excluded all countries from each of the regions. I also conducted OLS including all three
regions and FE excluding countries from all three regions. Neither the sign nor the
significance of the results were altered, switches in the magnitude were minimal (results
not shown).
TABLE 3.2 INCOME INEQUALITY AND DEMOCRACY (1960-2004)
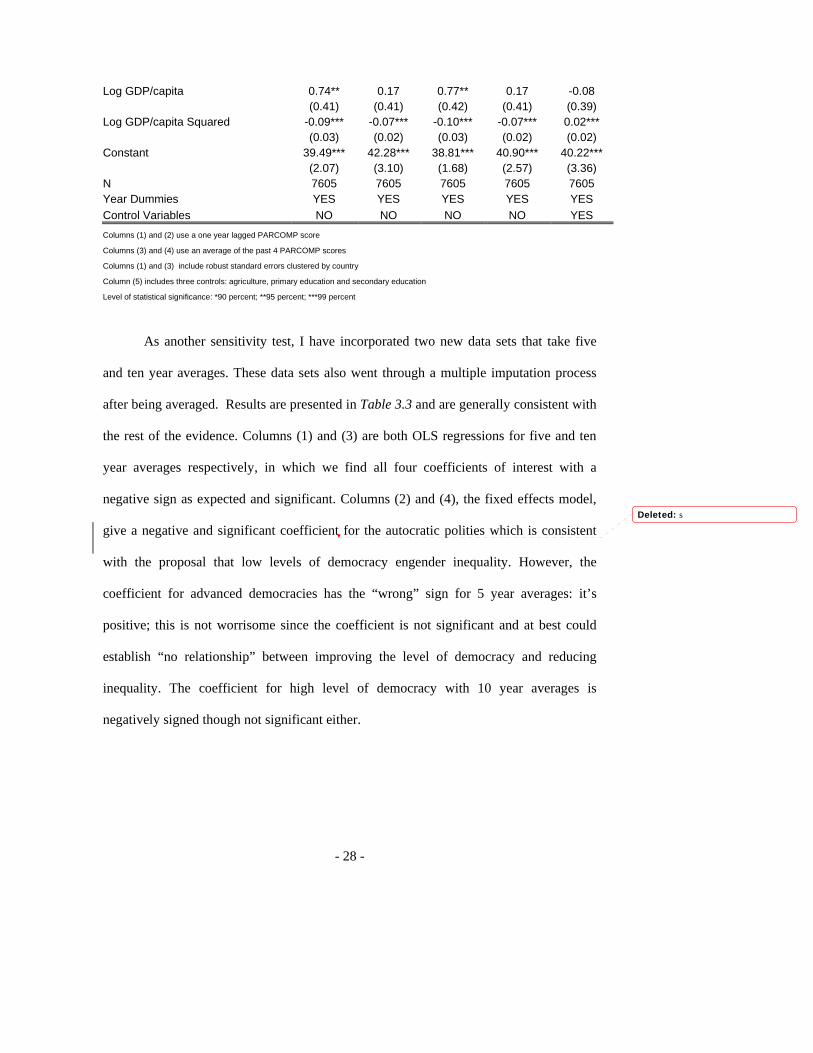
IMPUTED DATASET Dependent Variable: Gini Coefficient OLS FE OLS FE FE (1) (2) (3) (4) (5) Low PARCOMP Score -5.09*** -3.87*** -4.64*** -3.29*** -3.21*** (0.95) (0.86) (0.95) (0.84) (0.80) High PARCOMP Score -5.25*** -2.85** -4.27*** -1.82*** -1.73** (0.91) (1.00) (0.73) (0.63) (0.63)
- 28 -
Log GDP/capita 0.74** 0.17 0.77** 0.17 -0.08 (0.41) (0.41) (0.42) (0.41) (0.39) Log GDP/capita Squared -0.09*** -0.07*** -0.10*** -0.07*** 0.02*** (0.03) (0.02) (0.03) (0.02) (0.02) Constant 39.49*** 42.28*** 38.81*** 40.90*** 40.22*** (2.07) (3.10) (1.68) (2.57) (3.36) N 7605 7605 7605 7605 7605 Year Dummies YES YES YES YES YES Control Variables NO NO NO NO YES Columns (1) and (2) use a one year lagged PARCOMP score Columns (3) and (4) use an average of the past 4 PARCOMP scores Columns (1) and (3) include robust standard errors clustered by country Column (5) includes three controls: agriculture, primary education and secondary education Level of statistical significance: *90 percent; **95 percent; ***99 percent
As another sensitivity test, I have incorporated two new data sets that take five
and ten year averages. These data sets also went through a multiple imputation process
after being averaged. Results are presented in Table 3.3 and are generally consistent with
the rest of the evidence. Columns (1) and (3) are both OLS regressions for five and ten
year averages respectively, in which we find all four coefficients of interest with a
negative sign as expected and significant. Columns (2) and (4), the fixed effects model,
give a negative and significant coefficient for the autocratic polities which is consistent
with the proposal that low levels of democracy engender inequality. However, the
coefficient for advanced democracies has the “wrong” sign for 5 year averages: it’s
positive; this is not worrisome since the coefficient is not significant and at best could
establish “no relationship” between improving the level of democracy and reducing
inequality. The coefficient for high level of democracy with 10 year averages is
negatively signed though not significant either.
Deleted: s

- 29 -
TABLE 3.3 INCOME INEQUALITY AND DEMOCRACY (1960-2004)
IMPUTED DATASET - 5 AND 10 YEAR AVERAGES Dependent Variable: Gini Coefficient OLS FE OLS FE (1) (2) (3) (4) Low PARCOMP Score -5.51** -3.46** -6.02*** -3.83*** (1.52) (1.16) (1.08) (1.19) High PARCOMP Score -2.35** 0.42 -3.62** -0.93 (1.15) (0.86) (1.35) (2.43) Log GDP/capita 7.59*** 4.35** 3.95 1.55 (2.58) (2.00) (3.43) (3.41) Log GDP/capita Squared -0.58*** -0.36** -0.39 -0.26 (0.16) (0.12) (0.22) (0.21) Constant 16.55 26.28*** 36.23** 44.22** (10.28) (7.77) (13.84) (13.29) N 1521 1521 845 845 Year Dummies YES YES YES YES PARCOMP values are lagged one period Columns (1) and (2) use 5 year averages and columns (3) and (4) use ten year averages Column (1) and (3) include robust standard errors clustered by country Level of statistical significance: *90 percent; **95 percent; ***99 percent
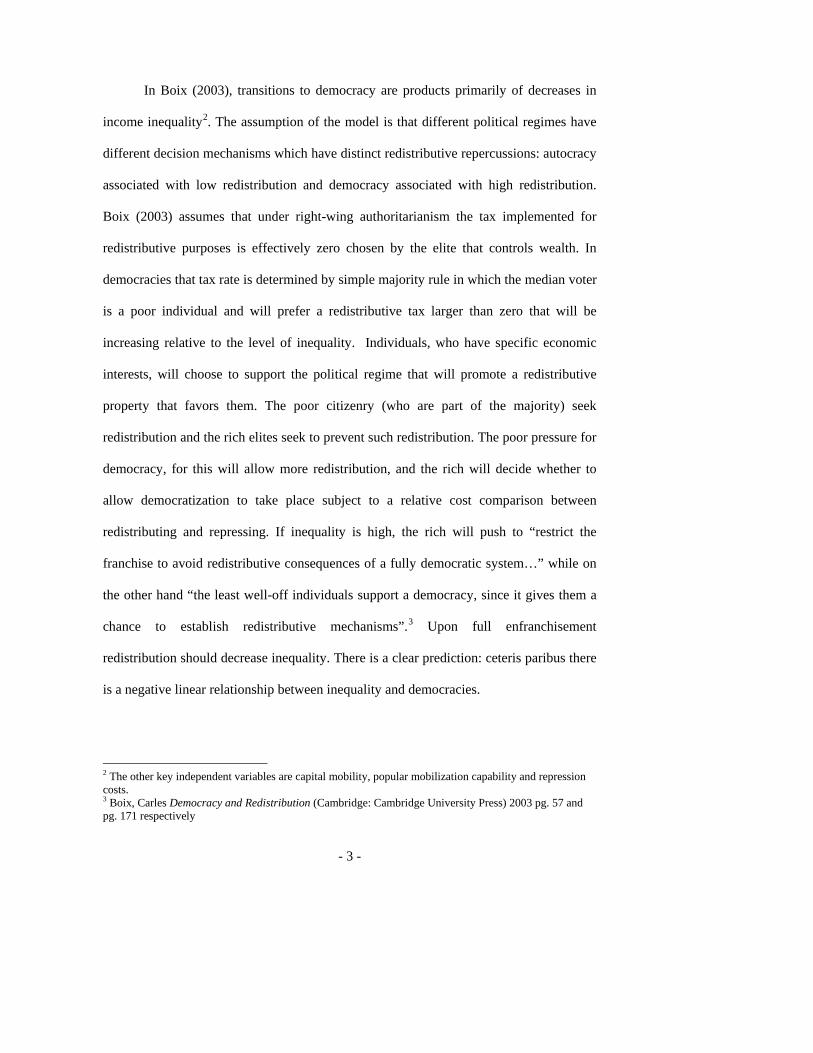
The last piece of evidence that I would like to present is to run a regression
including the value of PARCOMP and PARCOMP squared using a Fixed Effects model
on the imputed data. The idea of including PARCOMP squared is to allow for a nonlinear
- 30 -
relationship to exist. As an illustrative example I graphed the coefficients at the mean
value of GDP for the range of the PARCOMP variable. The PARCOMP variable as
originally coded goes from 0 to 5, however, after imputation we get values as high as
7.70. In Tables 3.1 and 3.2 this is not a problem since those scores are treated as High
PARCOMP Scores which would be scores equal to 5 at maximum. For this illustration,
and in order to take advantage of the imputed datasets, I have extended the value of
PARCOMP from 0 to 7.70. Figure 3.1 is a simulation of inequality levels for a poor
country (log GDP per capita of 7.34). As is clearly illustrated in the graph, inequality
increases in the area associated with low levels of democracy up to a level of PARCOMP
after which inequality begins to decrease.
Deleted: the max
Deleted: S

- 31 -
0 2 4 6
3334
3536
3738
Figure 3.1 Simulation Income Inequality and Democracy
Parcomp
Gin
i

- 32 -
IV. DISCUSSION
The most recent literature on democratization operates under the assumption that
democratizing reduces income inequality. The results of this research paper suggest that
this might not be the case for all classes of democracies and rather just for more advanced
democracies. This finding does not undermine the recent democratization literature but
rather develops a set of questions and issues that should be at the forefront of the research
agenda. It seems to me that part of the problem is that the mechanisms by which
democracy would reduce inequality have not come under sufficient scrutiny. The
assumption, based on the median voter theorem, is that redistribution will be chosen
democratically. What is then the means by which they redistribute, direct transfers,
education, or something else? It might be that the theory is correct in assuming that
democracy generates the demand for redistribution via an election, but the problem might
be that the supply of such redistribution (the actual policy) might be inefficient. Another
possibility is proposed by Roemer (1998) speaking generally of democracies, and
theorizing that, since elections are on platforms rather than issues, there exists another
cross cutting cleavage that divides those seeking redistribution and hence their demand is
not made. It seems perhaps like democracy sets the stage for the possibility of
redistribution but setting the stage is not enough. Much has been written about interest
group operation in democracies; perhaps in partial democracies they are able to extract
monopoly rents that they would have been prevented from doing so in either an
autocracy (where they didn’t exist) or in a consolidated democracy (where they can be
stopped). In this spirit further research should attempt to disentangle the mechanism by
Deleted: ,
- 33 -
which lower levels of democracy increase their levels of inequality. There must also be
further analysis as to why, if democracy was given as a concession to those seeking
redistribution, would they not upraise after democracy has failed to deliver?
A parallel effort should be made to improve the data available on both inequality
and measuring levels of democratization. Perhaps the contradictory results by different
scholars are more a technical issue of available data than a substantive discussion of
theoretical issues. Though this paper attempts to address some of these issues, better data
collection would be an even better solution. When more and better data becomes
available the findings of this paper should lead to analysis that allows for different effects
at different degrees of democracy.
Deleted: better
- 34 -
REFERENCES Acemoglu, Daron and James Robinson. Economic Origins of Dictatorship and Democracy. Cambridge: Cambridge University Press, 2006. Aghion, Philipe, Eve Caroli and Cecilia Garca-Penalosa. “Inequality and Economic Growth: The Perspective of the New Growth Theories” Journal of Economic Literature, December 1999. Barro, Robert. “Inequality and Growth in a Panel of Countries” Journal of Economic Growth, 5:5 32 2000 Birdsall, Nancy. “Life is Unfair: Inequality in the World” Foreign Policy, Summer 1998. Boix, Carles. Democracy and Redistribution. Cambridge: Cambridge University Press, 2003. Bollen, Kenneth and Robert Jackman. “Political Democracy and the Size Distribution of Income” American Sociological Review 46, 1985. Chong, Alberto. Inequality, Democracy and Persistance: Is there a Political Kuznets Curve? Economics and Politics 16(2), 2004 Chong, Alberto and Cesar Calderon. Institutional Quality and Income Distribution. Economic Development and Cultural Change 48, 2000 Cutright, Phillips. “Inequality a Cross-national Analysis” American Sociological Review 32, 1967 Decarolis, Francesco. “Economic Effects of Democracies: An Empirical Analysis”, Revista di Politica Economica, Nov-Dec 2003 Deninger, Klaus and Lyn Squire. “A New Dataset Measuring Income Inequality” The World Bank Economic Review 10, 1996. Gasiorowski, Mark. “Poltical Regimes and Industrial Wages: A Cross-national Analysis”. In M. Midlarski (Ed.) Inequality, Democracy and Economic Development, Cambridge: Cambridge University Press, 1997. Gradstein, Mark, Branko Milanovic and Yvonne Ying. “Democracy and Income Inequality: An Empirical Analysis” Policy Reaserch Working Paper 2561, 2001 Gradstein, Mark, and Branko Milanovic “Does Liberte=Egalite? A Survey of the Empirical Links Between Democracy and Inequality with some Evidence on the Transition Economies” Journal of Economic Surveys 18(4)
Formatted: German (Germany)
- 35 -
Reuveny, Rafael and Quan Li. “Economic Openness, Democracy and Income Inequality”, Comparative Political Studies, June 2003. Hewitt, Christopher. “The Effects of Political Democracy and Social Democracy on Equality in Industrial Societies: A Cross-national Comparison” American Sociological Review 42, 1977 Meltzer, Allan and Scott Richard. “A Rational Theory of the Size of Government” Journal of Political Economy 89 (5), 1981 Moon, Bruce. The Political Economy of Basic Human Needs, Ithaca: Cornell University Press, 1991. Muller, Edward. “Democracy, Economic Development and Income Inequality” American Sociological Review 53, 1988 Rodrik, Dani. “Democracies pay higher wages”, The Quarterly Journal of Economics, issue 3 1999 Roemer, John. “Why the Poor do not Expropriate the Rich: An Old Argument in New Garb” Journal of Public Economics, vol. 70 1998. Simpson, Miles. “Political Rights and Income Inequality: A Cross-national Test”, American Sociological Review, vol. 55 1990 Sirowy, Larry and Alex Inkeles. “The Effects of Democracy on Economic Inequality: A Review” Studies in Comparative International Development, Spring 1990. Timmons, Jeffrey. “Democracy and Inequality: An examination of labor markets and fiscal mechanisms” Working Paper, 2008
- 36 -
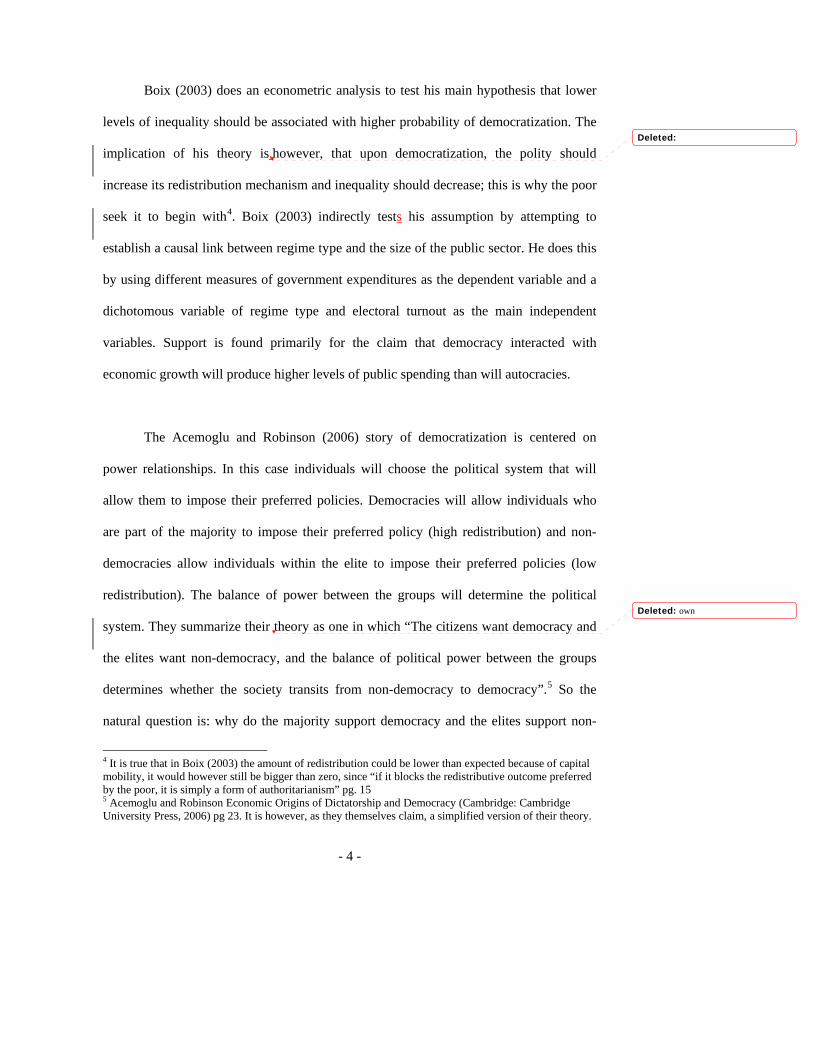
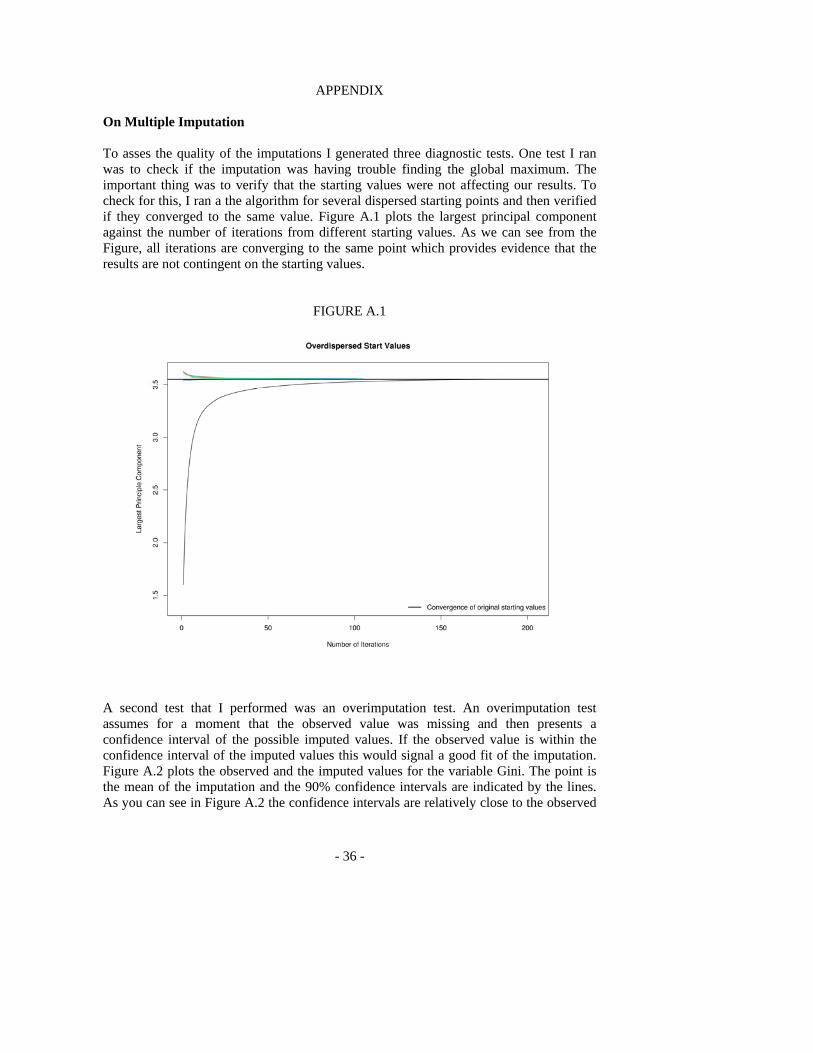
APPENDIX On Multiple Imputation To asses the quality of the imputations I generated three diagnostic tests. One test I ran was to check if the imputation was having trouble finding the global maximum. The important thing was to verify that the starting values were not affecting our results. To check for this, I ran a the algorithm for several dispersed starting points and then verified if they converged to the same value. Figure A.1 plots the largest principal component against the number of iterations from different starting values. As we can see from the Figure, all iterations are converging to the same point which provides evidence that the results are not contingent on the starting values.
FIGURE A.1
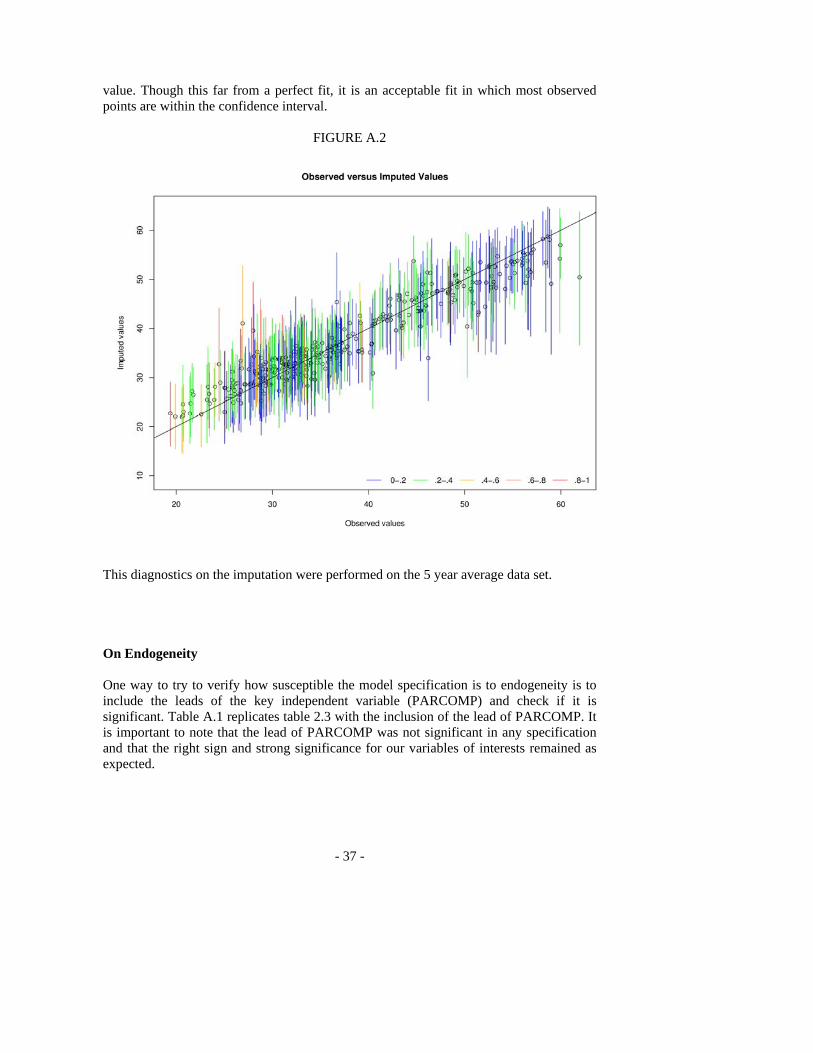
A second test that I performed was an overimputation test. An overimputation test assumes for a moment that the observed value was missing and then presents a confidence interval of the possible imputed values. If the observed value is within the confidence interval of the imputed values this would signal a good fit of the imputation. Figure A.2 plots the observed and the imputed values for the variable Gini. The point is the mean of the imputation and the 90% confidence intervals are indicated by the lines. As you can see in Figure A.2 the confidence intervals are relatively close to the observed
- 37 -
value. Though this far from a perfect fit, it is an acceptable fit in which most observed points are within the confidence interval.
FIGURE A.2
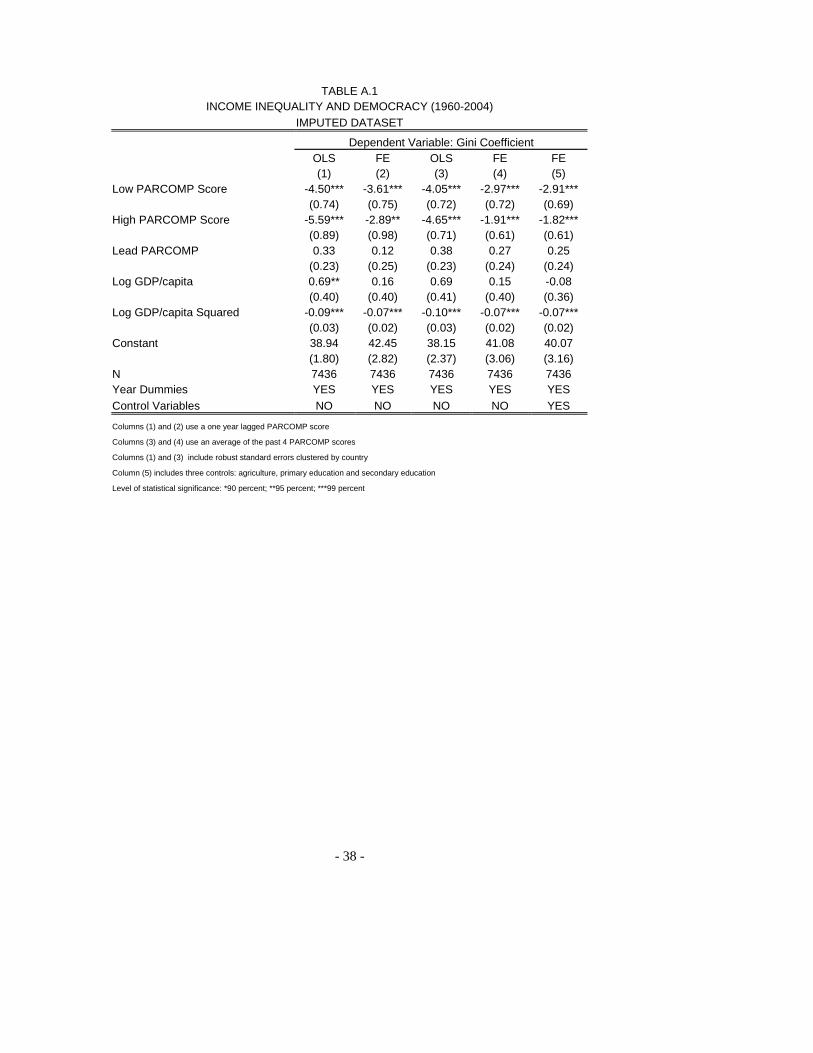
This diagnostics on the imputation were performed on the 5 year average data set. On Endogeneity One way to try to verify how susceptible the model specification is to endogeneity is to include the leads of the key independent variable (PARCOMP) and check if it is significant. Table A.1 replicates table 2.3 with the inclusion of the lead of PARCOMP. It is important to note that the lead of PARCOMP was not significant in any specification and that the right sign and strong significance for our variables of interests remained as expected.
- 38 -
TABLE A.1 INCOME INEQUALITY AND DEMOCRACY (1960-2004)
IMPUTED DATASET
Dependent Variable: Gini Coefficient OLS FE OLS FE FE (1) (2) (3) (4) (5) Low PARCOMP Score -4.50*** -3.61*** -4.05*** -2.97*** -2.91*** (0.74) (0.75) (0.72) (0.72) (0.69) High PARCOMP Score -5.59*** -2.89** -4.65*** -1.91*** -1.82*** (0.89) (0.98) (0.71) (0.61) (0.61) Lead PARCOMP 0.33 0.12 0.38 0.27 0.25 (0.23) (0.25) (0.23) (0.24) (0.24) Log GDP/capita 0.69** 0.16 0.69 0.15 -0.08 (0.40) (0.40) (0.41) (0.40) (0.36) Log GDP/capita Squared -0.09*** -0.07*** -0.10*** -0.07*** -0.07*** (0.03) (0.02) (0.03) (0.02) (0.02) Constant 38.94 42.45 38.15 41.08 40.07 (1.80) (2.82) (2.37) (3.06) (3.16) N 7436 7436 7436 7436 7436 Year Dummies YES YES YES YES YES Control Variables NO NO NO NO YES
Columns (1) and (2) use a one year lagged PARCOMP score Columns (3) and (4) use an average of the past 4 PARCOMP scores Columns (1) and (3) include robust standard errors clustered by country Column (5) includes three controls: agriculture, primary education and secondary education Level of statistical significance: *90 percent; **95 percent; ***99 percent
Copyright © 2022 FDOKUMEN