US regional and national cause-specific mortality and trends in income inequality: descriptive...
48
Demographic Research a free, expedited, online journal of peer-reviewed research and commentary in the population sciences published by the Max Planck Institute for Demographic Research Konrad-Zuse Str. 1, D-18057 Rostock · GERMANY www.demographic-research.org DEMOGRAPHIC RESEARCH SPECIAL COLLECTION 2, ARTICLE 8 PUBLISHED 16 APRIL 2004, PAGES 183-228 www.demographic-research.org/special/2/8/ DOI: 10.4054/DemRes.2004.S2.8 Descriptive Findings US regional and national cause-specific mortality and trends in income inequality: descriptive findings John Lynch, Sam Harper, George Davey Smith, Nancy Ross, Michael Wolfson, Jim Dunn The papers in this special collection were presented at the seminar "Determinants of Diverging Trends in Mortality", held at MPIDR, Rostock on 19-21 of June, 2002. The seminar was organized by the Max Planck Institute for Demographic Research and the Committee on Emerging Health Threats of the International Union for the Scientific Study of Population. Max Planck Institute for Demographic Research International Union for the Scientific Study of Population © 2004 Max-Planck-Gesellschaft.
Transcript of US regional and national cause-specific mortality and trends in income inequality: descriptive...
Demographic Research a free, expedited, online journal of peer-reviewed research and commentary in the population sciences published by the Max Planck Institute for Demographic Research Konrad-Zuse Str. 1, D-18057 Rostock · GERMANY www.demographic-research.org
DEMOGRAPHIC RESEARCH SPECIAL COLLECTION 2, ARTICLE 8 PUBLISHED 16 APRIL 2004, PAGES 183-228 www.demographic-research.org/special/2/8/ DOI: 10.4054/DemRes.2004.S2.8 Descriptive Findings
US regional and national cause-specific mortality and trends in income inequality: descriptive findings
John Lynch, Sam Harper, George Davey Smith,
Nancy Ross, Michael Wolfson, Jim Dunn
The papers in this special collection were presented at the seminar "Determinants of Diverging Trends in Mortality", held at MPIDR, Rostock on 19-21 of June, 2002. The seminar was organized by the Max Planck Institute for Demographic Research and the Committee on Emerging Health Threats of the International Union for the Scientific Study of Population.
Max Planck Institute for Demographic Research
International Unionfor the Scientific Study
of Population © 2004 Max-Planck-Gesellschaft.
Table of Contents
1 Introduction 184
2 The state of evidence linking income inequality tohealth
184
3 Part 1: Regional patterns of links between incomeinequality and mortality in the US
187
4 Part 2: Regional trends in cause-specific mortalityand income inequality
191
5 Part 3: National mortality trends and incomeinequality over the 20th century t
203
6 Conclusion 211
7 Acknowledgements 213
Reference list 214
Appendix 1 223
Appendix 2 228

Demographic Research – Special Collection 2: Article 8
-- Determinants of Diverging Trends in Mortality --
http://www.demographic-research.org 183
Descriptive Findings
US regional and national cause-specific mortality and trends inincome inequality: descriptive findings
John Lynch1
Sam Harper1
George Davey Smith2
Nancy Ross3
Michael Wolfson4
Jim Dunn5
Abstract
We examined the concordance of income inequality trends with 30-year US regionaltrends in cause-specific mortality and 100-year trends in heart disease and infantmortality. The evidence suggests that any links between income inequality andpopulation health trends is likely to be complex. The descriptive findings here implythat income inequality would have to be linked and de-linked across different timeperiods, with different exposures to generate the observed heterogeneous regional andnational levels and trends in different causes of death.
1 Department of Epidemiology, and Center for Social Epidemiology and Population Health, School
of Public Health, University of Michigan, USA2 Department of Social Medicine, University of Bristol, UK.3 Department of Geography, McGill University, Montreal, Canada4 Statistics Canada, Ottawa, Canada.5 University of Calgary, Canada.
Demographic Research – Special Collection 2: Article 8
-- Determinants of Diverging Trends in Mortality --
184 http://www.demographic-research.org
1. Introduction
Over the last 10 years, there are few issues that have captured the imagination of publichealth researchers and advocates more than whether the extent of income inequalitydrives levels of population health within and between wealthy countries. This researchtheme has coincided with a heightened awareness and concern over the extent ofincome inequality between the rich and poor within countries, and the gaping chasm ofinequality between rich and poor nations. In addition, there has been increased interestin understanding the capacity of environmental characteristics not conceptualized ormeasurable as characteristics of individuals - but rather as characteristics of places oraggregates of people - to affect the health of individuals (Diez-Roux 1998). Many so-called “contextual” health effects have been proposed (Pickett and Pearl 2001),including social capital and the extent of income inequality.
The idea that the unequal distribution of income in addition to the absolute amountof income might affect health has attracted contributions from scholars motivated by thehumanitarian potential of showing how health could be improved through greater equityand social justice (Wilkinson 1996). It is also an important idea because of its relevancefor wage and redistributive fiscal and tax policies. If one accepts the notion that incomeinequality is a determinant of population health then places that deliberately even outthe life chances of individuals by having a more egalitarian income distribution willproduce better overall health for their inhabitants. This is an appealing, intuitive, andpolicy relevant idea. Nevertheless, recent negative studies (Muller 2002; Shibuya,Hashimoto, and Yano 2002; Osler et al. 2002; Mellor and Milyo 2001; 2002; 2003;Deaton and Lubotsky 2003; McLeod et al. 2003; Messias 2003) have lead to questionsover the strength of the evidence (Lynch and Davey Smith 2002). Johan Mackenbachcommented that “… evidence for a correlation between income inequality and thehealth of the population is slowly dissipating” (Mackenbach 2002, p. 2).
2. The state of evidence linking income inequality to health
Where do we stand in the research program on income inequality and health? First, theoriginal international evidence is clearly questionable (Wilkinson 1992) and seemslikely to be an artifact of available data, but the association may be of importance forinternational differences in some infant and child health outcomes (Lynch et al. 2001).Second, while the aggregate level cross-sectional association between incomeinequality and health in the US seems solid, questions remain about both aggregate andcross-level confounding (Lynch, Harper, and Davey Smith in press). These issues havebeen examined in multilevel analyses (Subramanian, Blakely, and Kawachi 2003) and

Demographic Research – Special Collection 2: Article 8
-- Determinants of Diverging Trends in Mortality --
http://www.demographic-research.org 185
center around whether income inequality is a marker for other contextual characteristicsof regions, states or cities in the US (Mellor and Milyo 2003; Muller 2002; Deaton andLubotsky 2003), and/or whether it is confounded by compositional characteristics ofthese areas such as race/ethnicity and individual income (Deaton 2001; Subramanianand Kawachi in press). Third, the evidence suggests that the effects of incomeinequality on health differ within wealthy countries. There appear to be cross-sectionaleffects on health within the US, some inconsistent effects in the UK (Weich, Lewis, andJenkins 2002), but no effects have so far been seen within Canada, Australia, Denmark,Sweden, Japan, or New Zealand (Ross et al. 2000a; 2000b; Muller 2002; Shibuya,Hashimoto, and Yano 2002; Osler et al. 2002; McLeod et al. 2003; Messias 2003),although effects are beginning to be reported in less wealthy countries (Subramanian etal. in press).
The largely negative findings within wealthy nations other than the US may bebecause in those countries there has been more evenly distributed social investments inpublic health-relevant goods and services over time. As demonstrated in studies of USstates (Kaplan et al. 1996), higher income inequality is strongly associated with moreunequal distribution of many potentially powerful contemporary and historicaldeterminants of health (Lynch, Harper, and Davey Smith in press). Thus there is nonecessary link between income inequality and population health – it may depend on thecurrent and historical distribution of other health-relevant resources and exposures thatexist within a country and their correlation with income inequality. The distribution ofhealth-enhancing resources is affected by economic, social, political, and culturalhistory. For example, low ischemic heart disease (IHD) in southern Europe may berelated to high prevalence and low social inequality in healthy diets, while the relativelylow life expectancy of Danish women is likely related to the high prevalence and lowsocial inequality in smoking (Cavelaars et al. 2000). So in the first case, higher incomeinequality is associated with equitable distribution of an important determinant ofpopulation health (diet), while in the second, lower income inequality is correlated witha more even social distribution of another determinant of population health (smoking).Understanding how different countries generate particular patterns and trends inpopulation health will require historically and culturally contextualized explanations tounderstand their different configurations of population health determinants and howthese might be linked with income inequality (Kunitz 1994; Davey Smith, Gunnell, andBen-Shlomo 2001; Lynch 2000; Davey Smith and Egger 1996). Thus, it may not beincome inequality per se, that drives population health. Rather, what may be mostimportant is the current and historical links between income inequality and thedistribution of health-relevant resources and exposures, and how these links haveplayed out over the lifecourse of different birth cohorts (Davey Smith, Gunnell, andBen-Shlomo 2001; Davey Smith and Lynch in press). However, before dismissing the
Demographic Research – Special Collection 2: Article 8
-- Determinants of Diverging Trends in Mortality --
186 http://www.demographic-research.org
role of income inequality in affecting health in wealthy countries it is important to notethat most of the evidence has focused on mortality or life expectancy at birth (asynthetic measure derived from current age-specific mortality rates, and heavily drivenby infant mortality) as the measure of population health and it is possible that there areother important dimensions of health such as quality of life or psychological morbidityand malaise that are more strongly linked to income inequality.
This brief review of the evidence suggests that this research theme is at somethingof a crossroads (Lynch and Davey Smith 2002; Lynch, Harper, and Davey Smith inpress). We are left with the US evidence as being the most consistently in favour of alink between income inequality and population health. However, the bulk of thisevidence is cross-sectional in nature with the small number of studies introducing alongitudinal component showing mixed results (Kaplan et al. 1996; Blakely et al. 2000;Deaton and Paxson 2001; Mellor and Milyo 2001). Our goal in the current paper is toexpand the time-frame and examine evidence for longer-term influences of incomeinequality on mortality trends across regions of the US. The paper has three parts. First,we begin by presenting cross-sectional evidence of regional differences in theassociation between income inequality and mortality. Second, we present 30-yearregional trends in cause-specific mortality, and data on regional shifts in incomeinequality. Finally, we present 20th century national trends in income inequality and,then 100-year national trends in cause-specific mortality, in regard to regional andnational trends in income inequality. The premise is that if income inequality is indeedan important social determinant of population health, then its trends over time should insome ways be reflected in mortality trends. In other words, income inequality shouldleave a “population health footprint”. Furthermore, we are presenting cause-specificmortality trends, because etiological studies of the social determinants of health may bemost informative when examining more specific rather than more general outcomes,such as all-cause mortality or self-rated health. Different causes of death have distinctetiological pathways, so the mechanism through which a particular social exposure -such as income inequality - is linked to heart disease may be different than themechanism through which it is linked to homicide. This potentially importantmechanistic specificity is masked by examining general outcomes such as all-causemortality. Thus we use extensive graphs of cause-specific mortality trends throughoutthe paper and in Appendix 1.

Demographic Research – Special Collection 2: Article 8
-- Determinants of Diverging Trends in Mortality --
http://www.demographic-research.org 187
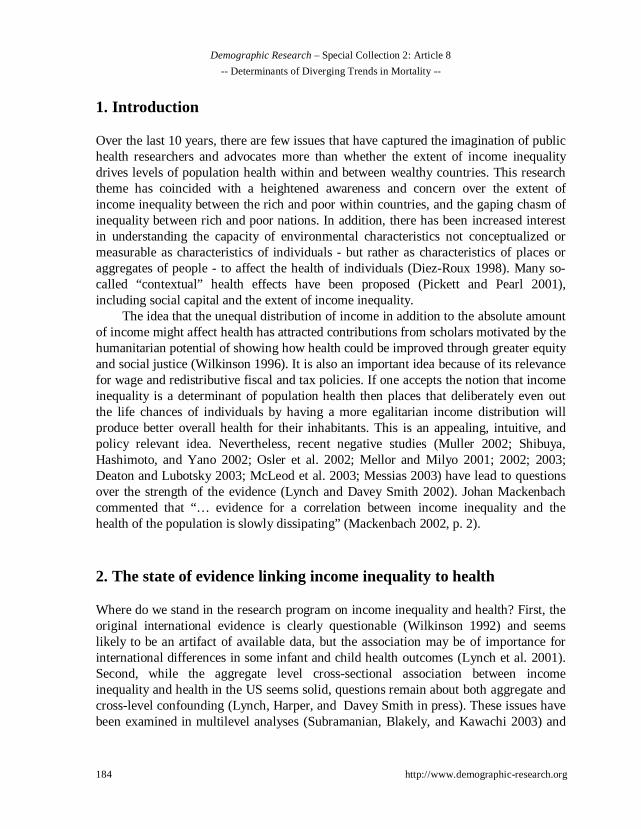
Source: Kaplan et al. (1996).
Figure 1: Median Income Share and Age-adjusted Mortality, US States, 1990
3. Part 1: Regional patterns of links between income inequality andmortality in the US
The first studies of US states showed an apparently strong regional pattern to the linkbetween income inequality and mortality. Figure 1 shows that the most unequal, highmortality states were predominantly in the Southern US. The analysis of USmetropolitan areas is somewhat less clear-cut but there is certainly some evidence thatmetropolitan areas in the south were in general more unequal and had higher mortality(Lynch et al. 1998). As shown in Figure 2, if we combine information on both lowaverage income and income inequality, the places that receive the “double-whammy” oflower average income and higher income inequality in 1990 were overwhelmingly inthe southern US.
LAMS
NY
KYAL WV
TX
TNAR
OK
NM
GA
FL
MO
CA
IL
AZ
MI
PA
SC
MA
NC
CT
MT
OH
NJVA
KS
CO
RI
SD
OR
NDMN
IDNE WA
NV
WY
IN
IA
ME
HI
MDDE
WI
AK
VT
UT
NH
650
700
750
800
850
900
950
1000
17 18 19 20 21 22 23 24
Income Share Held By Poorest 50% of Population
Ag
e-A
dju
sted
To
tal M
ort
alit
y
Demographic Research – Special Collection 2: Article 8
-- Determinants of Diverging Trends in Mortality --
188 http://www.demographic-research.org
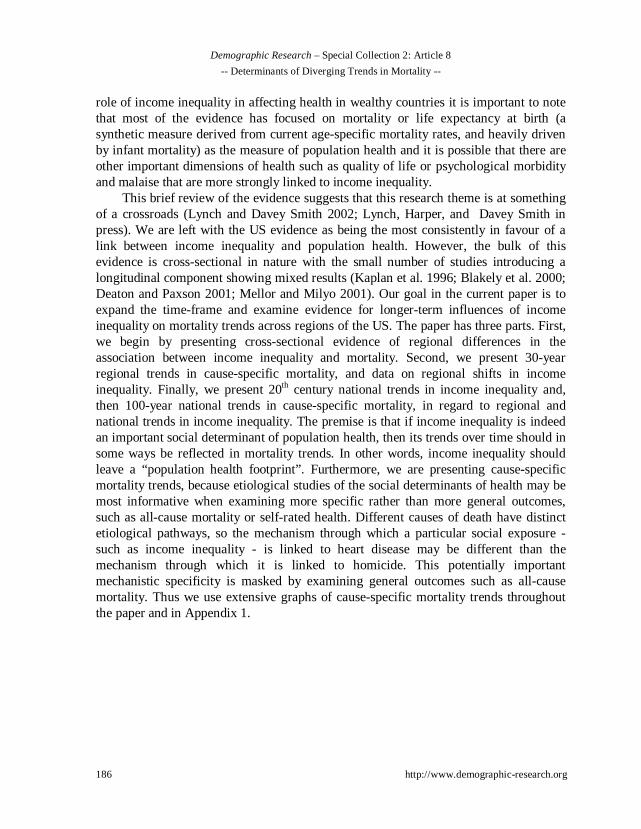
Source: Lynch et al. (1998).
Figure 2: Income Inequality and Per Capita Income, US Metro Areas, 1990
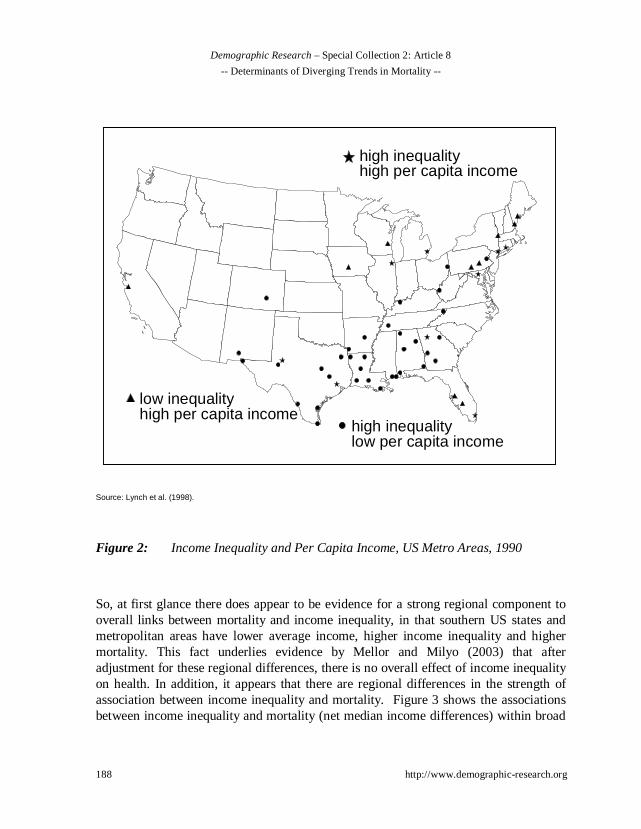
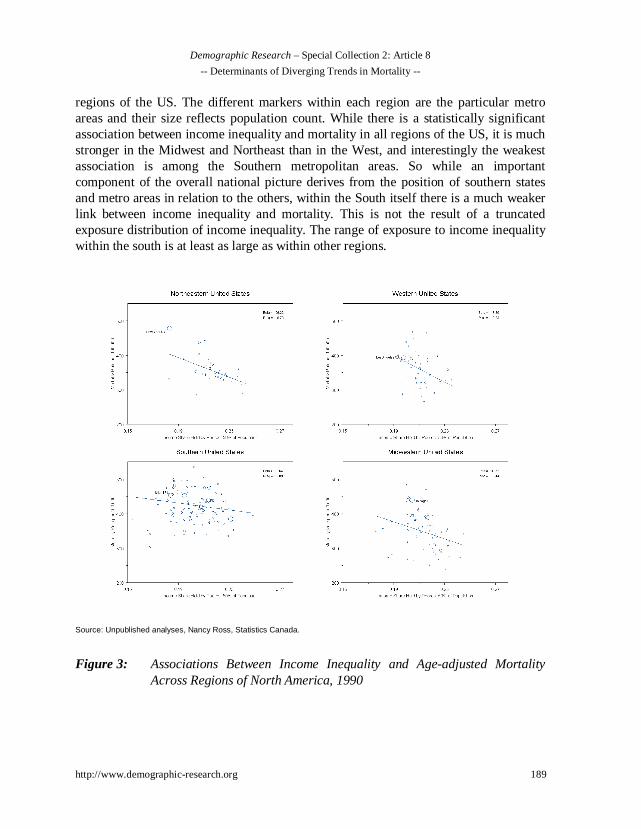
So, at first glance there does appear to be evidence for a strong regional component tooverall links between mortality and income inequality, in that southern US states andmetropolitan areas have lower average income, higher income inequality and highermortality. This fact underlies evidence by Mellor and Milyo (2003) that afteradjustment for these regional differences, there is no overall effect of income inequalityon health. In addition, it appears that there are regional differences in the strength ofassociation between income inequality and mortality. Figure 3 shows the associationsbetween income inequality and mortality (net median income differences) within broad
high inequalitylow per capita income
high inequalityhigh per capita income
low inequalityhigh per capita income
Demographic Research – Special Collection 2: Article 8
-- Determinants of Diverging Trends in Mortality --
http://www.demographic-research.org 189
regions of the US. The different markers within each region are the particular metroareas and their size reflects population count. While there is a statistically significantassociation between income inequality and mortality in all regions of the US, it is muchstronger in the Midwest and Northeast than in the West, and interestingly the weakestassociation is among the Southern metropolitan areas. So while an importantcomponent of the overall national picture derives from the position of southern statesand metro areas in relation to the others, within the South itself there is a much weakerlink between income inequality and mortality. This is not the result of a truncatedexposure distribution of income inequality. The range of exposure to income inequalitywithin the south is at least as large as within other regions.
Source: Unpublished analyses, Nancy Ross, Statistics Canada.
Figure 3: Associations Between Income Inequality and Age-adjusted MortalityAcross Regions of North America, 1990
Demographic Research – Special Collection 2: Article 8
-- Determinants of Diverging Trends in Mortality --
190 http://www.demographic-research.org
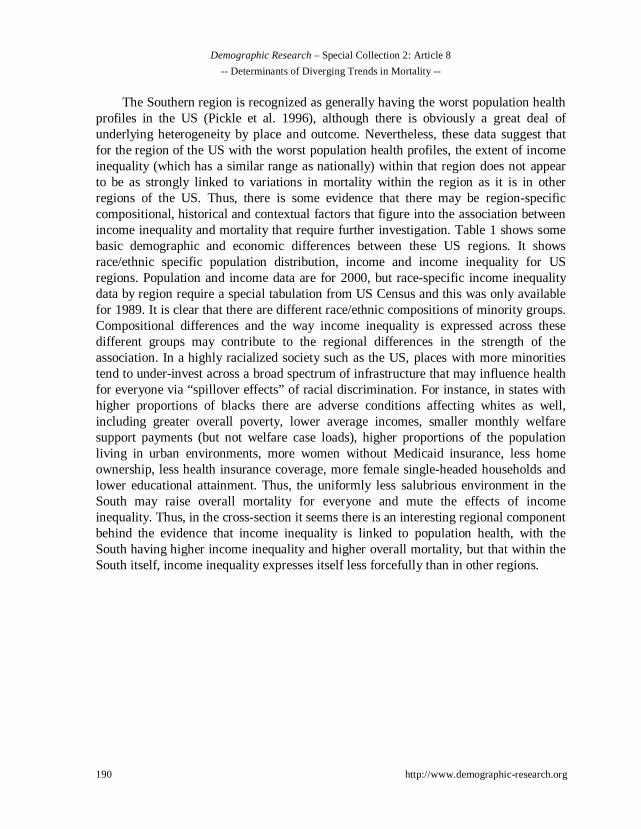
The Southern region is recognized as generally having the worst population healthprofiles in the US (Pickle et al. 1996), although there is obviously a great deal ofunderlying heterogeneity by place and outcome. Nevertheless, these data suggest thatfor the region of the US with the worst population health profiles, the extent of incomeinequality (which has a similar range as nationally) within that region does not appearto be as strongly linked to variations in mortality within the region as it is in otherregions of the US. Thus, there is some evidence that there may be region-specificcompositional, historical and contextual factors that figure into the association betweenincome inequality and mortality that require further investigation. Table 1 shows somebasic demographic and economic differences between these US regions. It showsrace/ethnic specific population distribution, income and income inequality for USregions. Population and income data are for 2000, but race-specific income inequalitydata by region require a special tabulation from US Census and this was only availablefor 1989. It is clear that there are different race/ethnic compositions of minority groups.Compositional differences and the way income inequality is expressed across thesedifferent groups may contribute to the regional differences in the strength of theassociation. In a highly racialized society such as the US, places with more minoritiestend to under-invest across a broad spectrum of infrastructure that may influence healthfor everyone via “spillover effects” of racial discrimination. For instance, in states withhigher proportions of blacks there are adverse conditions affecting whites as well,including greater overall poverty, lower average incomes, smaller monthly welfaresupport payments (but not welfare case loads), higher proportions of the populationliving in urban environments, more women without Medicaid insurance, less homeownership, less health insurance coverage, more female single-headed households andlower educational attainment. Thus, the uniformly less salubrious environment in theSouth may raise overall mortality for everyone and mute the effects of incomeinequality. Thus, in the cross-section it seems there is an interesting regional componentbehind the evidence that income inequality is linked to population health, with theSouth having higher income inequality and higher overall mortality, but that within theSouth itself, income inequality expresses itself less forcefully than in other regions.
Demographic Research – Special Collection 2: Article 8
-- Determinants of Diverging Trends in Mortality --
http://www.demographic-research.org 191
Table 1: Year 2000 Population Distribution1 and Median Income2 byRace/Ethnicity, and 1989 Income Inequality3 by Race/Ethnicity, USCensus Regions
Northeast Midwest South West
% US Population 19.0 22.9 35.6 22.5% White 79.1 85.0 74.1 72.0% Black 12.2 10.6 19.5 5.5% Hispanic4 9.8 4.9 11.6 24.3
Median Income (2000) 45,118 44,647 38,402 44,759White 47,205 46,617 40,879 44,592Black 30,426 30,053 29,778 36,975White/Black Difference 16,779 16,564 11,101 7,617White/Black Ratio 1.56 1.55 1.37 1.21
Income Inequality (Gini) 0.45 0.43 0.45 0.44Among Whites 0.44 0.42 0.44 0.44Among Blacks 0.46 0.48 0.46 0.44
Notes:1Source: US Census Bureau, Profiles of General Demographic Characteristics, 2000.2Source: US Census Bureau, Historical Income Tables from the Current Population Survey (2000 US dollars).3Source: Gini Coefficient - authors’ calculations based on special tabulation from 1990 US Census data. We did not have
Race/Ethnic specific income inequality by region for 2000 Census.4Note: Hispanics may be of any race.
4. Part 2: Regional trends in cause-specific mortality and incomeinequality
It is worth noting that in the history of research on income inequality and health therehave been very few studies that have included a longitudinal component (Blakely et al.2000; Kaplan et al. 1996; Mellor and Milyo 2003; Subramanian, Blakely, and Kawachi2003) and only one that has attempted to look at income inequality and mortality overthe long-term (Deaton and Paxson 2001). In analyses at the national level, Deaton andPaxson argued that neither trends in income nor income inequality showed muchresemblance to declining age-specific death rates in the US from 1950. Given theapparent importance of region to understanding the cross-sectional evidence in favourof links between income inequality and mortality, the next part of the paper examineswhether income inequality affects regional trends in cause-specific mortality. We havechosen to examine trends from 1968-1998, because these are the years during whichincome inequality has rapidly risen to post WW2 historic highs (Ryscavage 1999).
Within a broader conceptual framework, we have stressed the need to considertime lags between relevant exposures and outcomes (Davey Smith and Egger 1996;

Demographic Research – Special Collection 2: Article 8
-- Determinants of Diverging Trends in Mortality --
192 http://www.demographic-research.org
Davey Smith, Ben-Shlomo, and Lynch 2002; Leon 2001), and how our knowledge ofindividual-level risk factors might be profitably used to interpret temporal trends inpopulation health (Davey Smith, Gunnell, and Ben-Shlomo 2001; Kuh and DaveySmith 1993; Leon and Davey Smith 2000; Leon 2001). This so-called “lifecourseapproach” is beginning to be more fully articulated (Ben-Shlomo and Kuh 2002) andcan be applied at both the individual and population levels. While some of these ideasare not really new - techniques such as birth cohort analysis have been used for decades(Kermack, McKendrick, and McKinlay 1934; Susser and Stein 1962; MacMahon andTerry 1958)- it can be argued that modern epidemiology is dominated by theidentification of proximal (both biologically and temporally) risk factors for disease. Itis important however, that we not loose sight of the fact that one of our fundamentaltasks as epidemiologists is to understand why certain diseases wax and wane indifferent populations and population sub-groups over time. This involves understandingthe dynamic interplay of individual risk and population level trends in particulardiseases. Indeed, discussion and debate still occurs on the exact contributions ofdifferent factors to the 19th century transition from infectious to chronic diseases thatoccurred in wealthier countries (McKeown and Record 1962; Szreter 1988; 1994; 1997;2002; Colgrove 2002; Link and Phelan 2002); what factors explain the precipitous riseand equally impressive fall in coronary heart disease in many countries (Lawlor,Ebrahim, and Davey Smith 2001; Stallones 1980; Vartiainen et al. 1995; Vartiainen etal. 1994); and what the real contribution of traditional risk factors such as smoking,lipids and hypertension were to trends in heart disease and stroke (Magnus et al. 2001;Lawlor et al. 2002). A recent example are the discussions over the rise and fall of pepticulcer in the population – its association with Helicobacter Pylori infection and perhapsinteractions with other factors such as social stress and diet (Susser and Stein 2002;Marshall 2002; Sonnenberg, Cucino, and Bauerfeind 2002) (Langman 2002;Levenstein 2002; Davey Smith 2001). The point here is that there seems somethingrather fundamental about being able to link our knowledge of risk exposures at theindividual and social level with what we observe in population level health trends overtime. In this case we are interested in understanding regional mortality trends.
In thinking about how income inequality – a population-level characteristic –might be potentially linked to regional differences in health in the US we begin bydisplaying 30-year regional trends in some selected causes of death. There are 9designated census divisions in the US depicted in Figure 4, which, for the sake ofcontinuity, we will refer to as regions throughout the text.

Demographic Research – Special Collection 2: Article 8
-- Determinants of Diverging Trends in Mortality --
http://www.demographic-research.org 193
Source: US Department of Energy (http://www.eia.doe.gov/cneaf/electricity/epav1/figa1.html)
Figure 4: Standard US Census Regions
The figures present trends in age-adjusted all-cause mortality, ischaemic heart disease(IHD), stroke, lung, breast and prostate cancer, suicide, homicide and diabetes acrossthese 9 regions. For simplicity, we have combined male and female mortality, which ofcourse will conceal important differences in some causes of death, especially for IHDand lung cancer where there are significant generational differences in the sex-specifictrends. Additionally, we could have shown state-level trends or perhaps even differenttheoretically driven groupings of states, but for simplicity we chose to show the trendsin the 9 standard Census regions.
Demographic Research – Special Collection 2: Article 8
-- Determinants of Diverging Trends in Mortality --
194 http://www.demographic-research.org
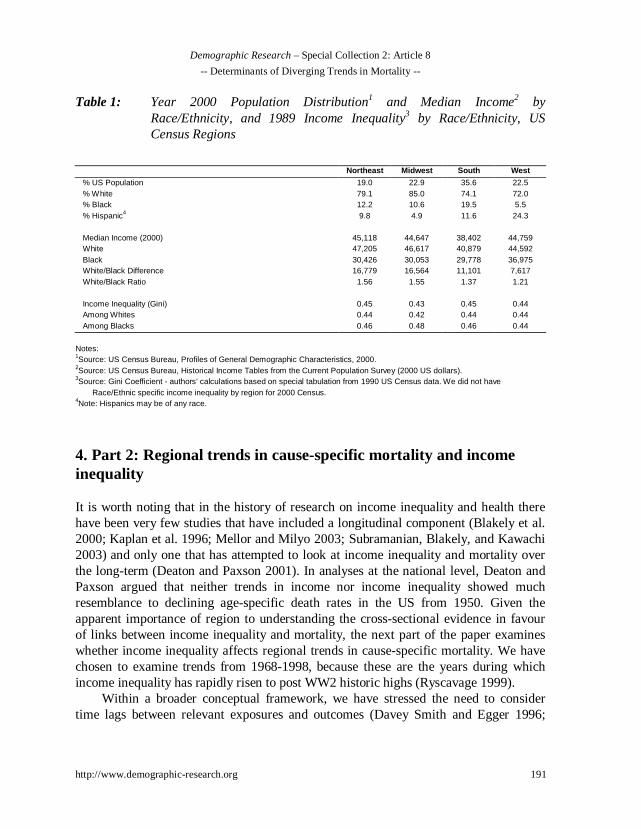
Source: Authors’ tabulations of the Compressed Mortality Files (National Center for Health Statistics 2000; 2001b; National Centerfor Health Statistics 2001b)
Figure 5: 30-Year Trends in Age-adjusted All-Cause Mortality, US Regions
Trends in all-cause mortality over the last 30 years (Figure 5) show that every region ofthe US has improved substantially, but with some widening of regional inequality,whereby there is now a larger absolute gap between the highest and lowest mortalityareas - the East-South-Central and Pacific regions. Between 1968 and 1998 absoluteregional differences increased from 168 to 198 deaths per 100,000 while relativeregional inequality, calculated as the ratio of the region with the highest to that with thelowest mortality, increased from 1.14 to 1.24. What is also striking about these trends isthe stability of the relative positions of the regions. The Pacific region has demonstratedthe healthiest mortality profile, and it has done that over 30 years, perhaps because of
600
700
800
900
1000
1100
1200
1300
1400
1968
1970
1972
1974
1976
1978
1980
1982
1984
1986
1988
1990
1992
1994
1996
1998
rate
per
100
,000
E N CENTRAL
E S CENTRAL
MID ATLANTIC
MOUNTAIN
NEW ENGLAND
PACIFIC
S ATLANTIC
W N CENTRAL
W S CENTRAL

Demographic Research – Special Collection 2: Article 8
-- Determinants of Diverging Trends in Mortality --
http://www.demographic-research.org 195
something in the context of the Pacific region and/or because of the composition of thepopulation in the Pacific region. In contrast the opposite is true in the East-South-Central region and as shown in Figure 2, this is the area with the highest concentrationsof higher income inequality and low per capita income. So these trend data suggest thatthe cross-sectional picture described above has some continuity. The southern regionhas lagged others for at least 30 years. This may be important in terms of lifecourseinfluences on different birth cohorts.
There is evidence of slower declines in all-cause mortality in the West and East-South-Central regions from the early 1980s that may coincide with the period ofwidening income inequality, but this region of the US is also where the links betweenincome inequality and mortality are weakest. So if rising income inequality is drivingthis slower decline, it does so in a region where the links between income inequalityand mortality are the weakest in the US. Another feature of these trends is that someregions such as the Middle Atlantic shifted relative position. Nevertheless, the over-riding impression is that knowing where a region started in 1968 tells you a lot aboutwhere it is likely to be relative to other regions 30 years later.
This relative stability in regional trends is also clear when examining cause-specific 30-year mortality trends. Figure 6 shows that the Middle Atlantic region hashad historically the highest levels of ischaemic heart disease (IHD) and the Mountainregion the lowest. In 1968, they differed by 186 IHD deaths per 100K, corresponding toa rate ratio of 1.5. Thirty years later they still hold those same positions but withnarrower absolute differences of 77 IHD deaths per 100K and similar relative inequalityof 1.6. However, within these relatively stable patterns, New England shows strongimprovements over 30 years, going from 3rd worst to 3rd best, while the West-South-Central reversed its declines in IHD in the late 1980s and for a period of about 3 yearsis the only region in the US to show increasing IHD death rates. So over 30 years thesetwo regions swap their relative positions.

Demographic Research – Special Collection 2: Article 8
-- Determinants of Diverging Trends in Mortality --
196 http://www.demographic-research.org
Source: Authors’ tabulations of the Compressed Mortality Files (National Center for Health Statistics 2000; 2001b). (National Centerfor Health Statistics 2001b)
Figure 6: 30-Year Trends in Age-adjusted IHD Mortality, US Regions
Stroke mortality - especially haemorrhagic stroke - has declined spectacularly since the1900s and that decline is still evident from 1968-1998 with especially steep declines upuntil the early 1980s, with the East-South-Central region experiencing declines of 50%in the 15 years between 1968 and 1983 (See Figure 1 in Appendix I). This is in starkcontrast to the generally slower declines in overall mortality and speaks to the value ofexamining trends in different causes. Now, cause-specific differences across regionaltrends also begin to emerge. For stroke, it is the Middle-Atlantic and New Englandregions that have had the historically lowest rates - almost the opposite pattern to IHD,
0
100
200
300
400
500
600
1968
1970
1972
1974
1976
1978
1980
1982
1984
1986
1988
1990
1992
1994
1996
1998
rate
per
100
,000
E N CENTRAL
E S CENTRAL
MID ATLANTIC
MOUNTAIN
NEW ENGLAND
PACIFIC
S ATLANTIC
W N CENTRAL
W S CENTRAL
Demographic Research – Special Collection 2: Article 8
-- Determinants of Diverging Trends in Mortality --
http://www.demographic-research.org 197
where the Middle Atlantic had the highest rates. What is also striking about the trendsin stroke is the narrowing of absolute regional inequality and despite the enormoussecular changes in stroke over time the relative positions of the US regions again stayrather stable.
However, this picture may be misleading as it is complicated by the underlyingheterogeneity in the outcome itself (Lawlor et al. 2002). It is possible that there aregeographic differences in the relative contributions of haemorrhagic and ischaemicstrokes to these trends. It would be interesting to know if there was higherconcentrations of haemorrhagic stroke in the south of the US, where rates havehistorically been highest and have disproportionately affected African-Americans.Studies within and across other countries have suggested that there is a strongcomponent of early-life socioeconomic disadvantage evident in the social group andgeographic distribution of haemorrhagic stroke (Hart and Davey Smith 2003). Thisopens the intriguing possibility that the historically higher stroke rates in the southernUS are related to factors associated with early-life deprivation of the African-Americanpopulation and their later susceptibility to haemorrhagic stroke.
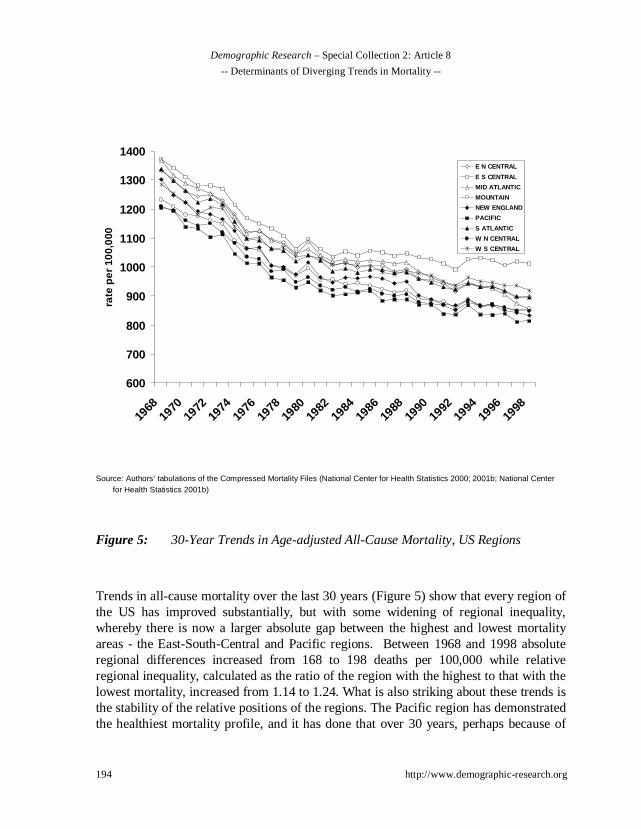
Source: Authors’ tabulations of the Compressed Mortality Files (National Center for Health Statistics 2000; 2001b).
Figure 7: 30-Year Trends in Age-adjusted Lung Cancer Mortality, US Regions
0
10
20
30
40
50
60
70
80
1968
1970
1972
1974
1976
1978
1980
1982
1984
1986
1988
1990
1992
1994
1996
1998
rate
per
100
,000
E N CENTRAL
E S CENTRAL
MID ATLANTIC
MOUNTAIN
NEW ENGLAND
PACIFIC
S ATLANTIC
W N CENTRAL
W S CENTRAL

Demographic Research – Special Collection 2: Article 8
-- Determinants of Diverging Trends in Mortality --
198 http://www.demographic-research.org
Figure 7 shows regional lung cancer mortality trends that demonstrate wideningregional inequality between 1968 and 1998. The overall increase follows the rise insmoking prevalence during World War 1, to its peak in the mid 1960s shown in Figure8. Increases in smoking map onto trends in lung cancer mortality for all regions given atime-lag of about 40 years. In 1968 (40-50 years after the first cohorts took up smokingin large numbers), Figure 8 shows there was a relatively tight clustering of lung cancerrates across regions, with the exceptions being substantially lower rates historicallyevident in Mountain and West-North-Central regions.
Source: Office on Smoking and Health (Office on Smoking and Health, National Center for Chronic Disease Prevention and HealthPromotion, Centers for Disease Control and Prevention 1999).
Figure 8: Historical Points in Annual Adult Per Capita Cigarette Consumption inthe US, 1900-1998
0
500
1000
1500
2000
2500
3000
3500
4000
4500
5000
1900
1905
1910
1915
1920
1925
1930
1935
1940
1945
1950
1955
1960
1965
1970
1975
1980
1985
1990
1995
2000
nu
mb
er
1st World Conference on Smoking and Health
Nicotine Medications Available Over the Counter
Master Settlement Agreement
Great Depression
End of WW II
1st Smoking Cancer Concern
Fairness Doctrine Messages on TV and Radio
Nonsmokers’ Rights Movement Begins
Federal Cigarette Tax Doubles
Surgeon General’s Report on Environmental Tobacco Smoke
1st Surgeon General’s Report
Broadcast Ad Ban 1st Great American
Smokeout

Demographic Research – Special Collection 2: Article 8
-- Determinants of Diverging Trends in Mortality --
http://www.demographic-research.org 199
Over 30 years the regional disparity in lung cancer, unlike stroke, has increasedwith the East-South-Central and South-Atlantic showing the largest increases in lungcancer mortality. These are also the main tobacco producing regions of the US.However, whatever was initially protective (contextual and compositional) for theuptake of smoking and of later lung cancer mortality in the Mountain and West-North-Central regions, it continued to generate the lowest rates of lung cancer over the next 30years. It is perhaps not coincidental that the East-South-Central and Mountain regionsalso have the highest and lowest IHD rates respectively, but of course the time lagsbetween smoking and lung cancer and smoking and IHD are different. It is alsoimportant to remember that these regional trends in lung cancer mortality may besensitive to race and sex-specific birth cohort effects associated with the differentialuptake and cumulative exposure to smoking (Strachan and Perry 1997). For instance,white males born in the decades immediately before and after World War I were thefirst to adopt smoking in large numbers, with smoking among women and minoritiesbecoming most prevalent in cohorts born around World War II (Escobedo andPeddicord 1996; Burns et al. 1997). Thus, divergent regional trends in lung cancermortality shown in Figure 7 may also reflect differential regional uptake and cessationof smoking by different population sub-groups. While it may be possible to speculatethat rising income inequality might have affected these regional patterns, it seems morelikely that a simpler explanation exists, related to the differing historical roles oftobacco use in the economies and cultures of these contrasting regions – the tobaccoproducing areas of the Southern US vs. the more religiously and socially conservativeMidwest and mountain areas.
Figures 2 to 5 in Appendix I show 30-year mortality trends for breast and prostatecancer, suicide and homicide. Note the regional heterogeneity by cause of death, withthe Mountain region having the lowest breast cancer rates but the highest prostatecancer and suicide rates. The initial regional differences in suicide remain in place overthe 30 year period from 1968-1998. Some of the strongest arguments in support of thetheory that greater income inequality produces worse population health have come fromanalyses of homicide. Inequality is postulated to engender negative emotions of distrustand hostility in individuals that lead to a breakdown of social cohesion (Wilkinson1996), which in turn affect homicide and violence, presumably within a relatively shorttime frame. Thus, there should be a relatively short lag between change in the exposureand trends in the outcome. These data suggest that any changes in income inequalitybetween 1968 and 1998 do not produce any obvious trend changes in homicidemortality in any region of the US. In some regions homicide is rather stable, while inothers it fluctuates throughout the time period that income inequality was consistentlyrising.
Demographic Research – Special Collection 2: Article 8
-- Determinants of Diverging Trends in Mortality --
200 http://www.demographic-research.org
Examination of these disease specific regional trends suggests there is a good dealof heterogeneity of trends across causes. The relative rankings of the regions by causealso shows no clear patterns, whether the secular trends are stable, increasing ordecreasing. Perhaps the most enduring impression is the cause-specific stability ofregional differences over time - in general, a region’s relative position in 1968 appearsto be the strongest determinant of its position in 1998. There are exceptions and it maybe interesting to examine some of the more dramatic shifts in regional trajectories overtime – such as the upturn in IHD deaths in the West–South–Central region in the early1980s, but the main pattern is one of relative regional stability. This suggests regionsget on trajectories for different causes of death that seem relatively stable over time.
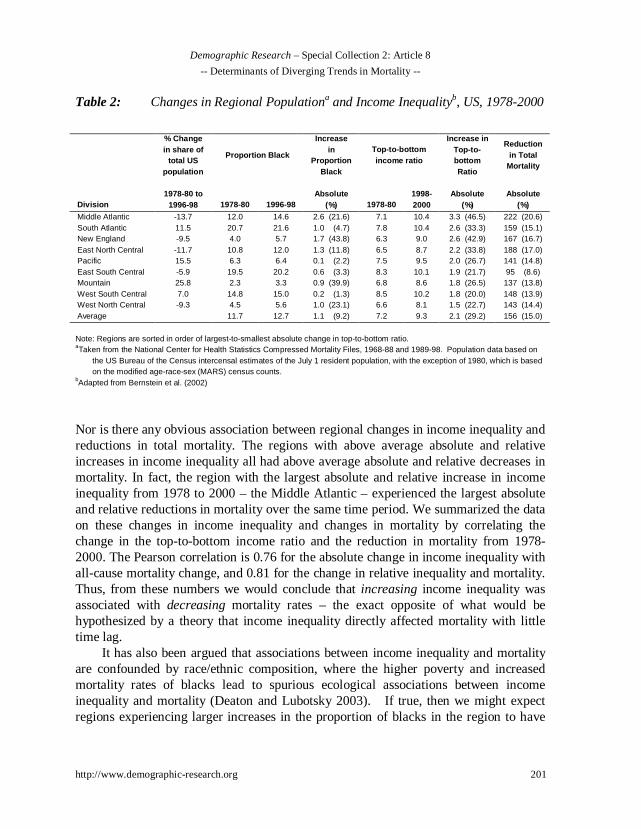
What can be said about the potential for income inequality to influence thesedisease specific trends? First, we chose to examine regional trends during the period1968-1998 because this is precisely the period when levels of income inequality rosesharply in the US - at least relative to post-war levels. The rise in income inequalityexperienced in the US as a whole from the mid-1960s onwards was evidenced in everystate and region to a greater or lesser extent. A recent report based on the CurrentPopulation Survey (CPS) by Bernstein et al. (2002), has shown some variability inchanges in income inequality, measured by the “top-to-bottom ratio” (incomes of thetop 20% vs. incomes for the bottom 20% of the population), across regions of the USfor the period 1978-2000, which corresponds to the period of the largest rise ininequality. As shown in Table 2, the largest increases in this measure of incomeinequality were observed down the eastern seaboard of the US - in the Middle andSouthern Atlantic states and New England. There is no obvious association between thestarting levels of income inequality in 1978 and the changes experienced over the next20 years. For instance, in 1978 New England had the lowest “top-to-bottom” ratio at 6.3and then experienced a large absolute and percentage increase to 9.0 (43%). In contrast,the highest levels of inequality in 1978 were in the West and East-South Central region(which generally has the poorest population health profiles), but they experienced someof the smallest increases from 1978-2000.
Demographic Research – Special Collection 2: Article 8
-- Determinants of Diverging Trends in Mortality --
http://www.demographic-research.org 201
Table 2: Changes in Regional Populationa and Income Inequalityb, US, 1978-2000
% Changein share of
total USpopulation
Proportion Black
Increasein
ProportionBlack
Top-to-bottomincome ratio
Increase inTop-to-bottomRatio
Reductionin Total
Mortality
Division1978-80 to
1996-98 1978-80 1996-98Absolute
(%) 1978-801998-2000
Absolute(%)
Absolute(%)
Middle Atlantic -13.7 12.0 14.6 2.6 (21.6) 7.1 10.4 3.3 (46.5) 222 (20.6)South Atlantic 11.5 20.7 21.6 1.0 (4.7) 7.8 10.4 2.6 (33.3) 159 (15.1)New England -9.5 4.0 5.7 1.7 (43.8) 6.3 9.0 2.6 (42.9) 167 (16.7)East North Central -11.7 10.8 12.0 1.3 (11.8) 6.5 8.7 2.2 (33.8) 188 (17.0)Pacific 15.5 6.3 6.4 0.1 (2.2) 7.5 9.5 2.0 (26.7) 141 (14.8)East South Central -5.9 19.5 20.2 0.6 (3.3) 8.3 10.1 1.9 (21.7) 95 (8.6)Mountain 25.8 2.3 3.3 0.9 (39.9) 6.8 8.6 1.8 (26.5) 137 (13.8)West South Central 7.0 14.8 15.0 0.2 (1.3) 8.5 10.2 1.8 (20.0) 148 (13.9)West North Central -9.3 4.5 5.6 1.0 (23.1) 6.6 8.1 1.5 (22.7) 143 (14.4)Average 11.7 12.7 1.1 (9.2) 7.2 9.3 2.1 (29.2) 156 (15.0)
Note: Regions are sorted in order of largest-to-smallest absolute change in top-to-bottom ratio.aTaken from the National Center for Health Statistics Compressed Mortality Files, 1968-88 and 1989-98. Population data based on
the US Bureau of the Census intercensal estimates of the July 1 resident population, with the exception of 1980, which is basedon the modified age-race-sex (MARS) census counts.
bAdapted from Bernstein et al. (2002)
Nor is there any obvious association between regional changes in income inequality andreductions in total mortality. The regions with above average absolute and relativeincreases in income inequality all had above average absolute and relative decreases inmortality. In fact, the region with the largest absolute and relative increase in incomeinequality from 1978 to 2000 – the Middle Atlantic – experienced the largest absoluteand relative reductions in mortality over the same time period. We summarized the dataon these changes in income inequality and changes in mortality by correlating thechange in the top-to-bottom income ratio and the reduction in mortality from 1978-2000. The Pearson correlation is 0.76 for the absolute change in income inequality withall-cause mortality change, and 0.81 for the change in relative inequality and mortality.Thus, from these numbers we would conclude that increasing income inequality wasassociated with decreasing mortality rates – the exact opposite of what would behypothesized by a theory that income inequality directly affected mortality with littletime lag.
It has also been argued that associations between income inequality and mortalityare confounded by race/ethnic composition, where the higher poverty and increasedmortality rates of blacks lead to spurious ecological associations between incomeinequality and mortality (Deaton and Lubotsky 2003). If true, then we might expectregions experiencing larger increases in the proportion of blacks in the region to have
Demographic Research – Special Collection 2: Article 8
-- Determinants of Diverging Trends in Mortality --
202 http://www.demographic-research.org
smaller reductions in mortality over time. Table 2 also presents data on the proportionblack in US regions from 1978-98. Similar to the trend for income inequality, theregion with the largest absolute increase in proportion black (Middle Atlantic) had thelargest total reduction in mortality – the exact opposite of what the racial compositionargument would predict, but of course this may depend on the age structure of in-migration. There also does not seem to be any relationship between changes inproportion black and changes in income inequality, a finding that has been replicated inother studies of the determinants of changes in income inequality among USmetropolitan areas (Madden 2000). In addition, there appears to be no systematicrelationship between initial proportion black and reduction in mortality. The regionwith the highest initial proportion black (South Atlantic, 20.7%) had a better-than-average absolute mortality reduction of 159 per 100,000, while the region with thesecond highest proportion black (East South Central, 19.5%) saw mortality reduced byonly 95 – the smallest reduction among all regions.
Knowing something about initial mortality conditions in a region seems to say alot about where that region will be 30 years later and implies that whateverdistinguishes the initial mortality differences between regions - which also differs bycause - to a large extent, still distinguishes them 30 years later. This is despite changesin the population composition that might occur through regional migration (Lynch,Harper, and Davey Smith in press). If it is the historical levels of income inequality thathelp determine the different starting mortality levels across regions, then it seems to doso cause-specifically, because the relative orderings of the regions differ according tocause of mortality. Nevertheless, if historical starting levels and changes in incomeinequality are important determinants of these mortality trends, it seems difficult tocome up with a straightforward hypothesis for how it could account for the differentsecular trends in disease, relative inter-regional stability over time, and theheterogeneity of the ordering of the regions by cause of death. There would appear tohave to be a number of different mechanisms and time lags involved in producing thesepatterns, which do not fit easily into a notion that levels of income inequality, per se,are driving all these cause-specific mortality trends. It seems already evident that thismay argue against any simple understanding of how income inequality, which hasincreased over this same time period across all US regions, may have expressed itself inthese mortality trends.
Demographic Research – Special Collection 2: Article 8
-- Determinants of Diverging Trends in Mortality --
http://www.demographic-research.org 203
5. Part 3: National mortality trends and income inequality over the20th century
The final part of these analyses broadens the time frame and focuses on the issue oftime lags between longer term national trends in income inequality and one of the mostimportant diseases of the 20th century – heart disease. As the analyses above suggest,regional differences in IHD appear rather stable over the 30 years between 1968 and1998 (with some exceptions noted above). In any event, the trend data on incomeinequality (shown in Table 2) suggest that if changes in regional income inequality doaffect regional mortality trends, the associations are complex, so the somewhat moresimple national data are a useful place to start, especially in trying to investigate timelags.
Heart disease is a potentially good example for this sort of trend analysis, becauseit is probably the most studied disease in human history and a great deal is known aboutits causes. It is important to remember however, that the category of “heart disease” iscomprised of a fairly diverse set of pathological entities with potentially disparatecausal mechanisms. The generic term of heart disease includes not only IHD, but alsocongestive heart failure, rheumatic heart disease, hypertensive heart disease, arrhythmiaand others. To make things even more complicated, the relative contributions of thesesub-components to the generic category of heart disease has changed over time.Nevertheless, it is reasonable to propose that the largest contributor to the 20th centuryepidemic of heart disease was IHD and that it is the major component of heart diseasefrom the 1950s to the present. Smoking, blood lipids and hypertension have emerged asthe three most recognized risk factors for IHD (Yusuf et al. 2001a; 2001b). While allthese relatively proximal factors clearly have complex social and biological antecedentsof their own, there is little doubt that they play a major role in contributing to IHD.
Figures 9 and 10 show the race and sex-specific rates of heart disease from 1900-1998. The designation for heart disease is broad because definitions and diagnoses havechanged over time (See Appendix 2 for ICD codes) so that it is virtually impossible toexamine long-term trends in IHD alone (National Center for Health Statistics 1978).Thus, the broad definition of heart disease that we are forced to use here, while notdirectly comparable to what we know today as IHD, does provide reasonablecomparability across time.

Demographic Research – Special Collection 2: Article 8
-- Determinants of Diverging Trends in Mortality --
204 http://www.demographic-research.org
Source: National Center for Health Statistics (2001a).
Figure 9: Race-specific Age-adjusted Heart Disease Mortality, US 1900-1998
Figure 9 shows that in some ways we have come full circle, so that current rates of heartdisease are now back to the levels observed at the turn of the century – 265 in 1900 and272 per 100,000 in 1998. However, we reiterate the importance of recognizing that thecomposition of the category of heart disease at the beginning of the century was verydifferent than at mid-century or at the millenium. Over the course of the century IHDbecame an increasingly important component of all heart disease, with rheumatic heartdisease declining in significance. The epidemic of IHD is one of the most prominentfeatures of population health in the 20th century, not just in the US but in many otherdeveloped nations as well (Yusuf et al. 2001a; 2001b). (2001b) While it is clear thattraditional risk factors such as smoking, high fat diet and hypertension, and advances inmedical care have played an important role in explaining this mortality trend (Lawlor,Ebrahim, and Davey Smith 2001), - especially the decline - we still do not know theprecise ways in which risk factors combined to produce the 20th century epidemic of
200
300
400
500
600
700
1900 1910 1920 1930 1940 1950 1960 1970 1980 1990
rate
per
100
,000
All racesWhiteNon-whiteBlack

Demographic Research – Special Collection 2: Article 8
-- Determinants of Diverging Trends in Mortality --
http://www.demographic-research.org 205
IHD (Kelleher, Harper, and Lynch 2003). Nevertheless, if income inequality is to beconsidered as a major determinant of population health in the 20th century, it has toaffect the century’s most common cause of death – heart disease.
Source: National Center for Health Statistics (2001a).
Figure 10: Age-adjusted Mortality Rates From Heart Disease by Sex, US 1900-1998
One important feature of Figure 9 is how the decline of heart disease has diverged forblacks and whites during the mid 1970s. From 1975 to 1990 the decline in rates of heartdisease for blacks was significantly slower than for whites – perhaps even stalling,potentially due to less progress in control of hypertension in the black population(Cooper et al. 2000). Nevertheless, even this is hard to match with simultaneous incomeinequality trends, which continued to rise after the 1990s, when the rates of decline forblacks and whites were virtually identical. Figure 10 clearly shows the increasing sex
0
100
200
300
400
500
600
700
800
1900 1910 1920 1930 1940 1950 1960 1970 1980 1990
rate
per
100
,000
0
0.2
0.4
0.6
0.8
1
1.2
1.4
1.6
1.8
2
mal
e:fe
mal
e ra
tio
female
male
male:female ratio
Demographic Research – Special Collection 2: Article 8
-- Determinants of Diverging Trends in Mortality --
206 http://www.demographic-research.org
ratio in heart disease from the rise of the epidemic in the 1920s. This has also beendocumented for other countries (Lawlor, Ebrahim, and Davey Smith 2001). Whatevercombination of factors caused the rapid increase in heart disease they did so in men to amuch greater extent than in women. This likely reflects different sex distributions of themain risk factors (Lawlor, Ebrahim, and Davey Smith 2001) and perhaps underlyingbiological differences in lipid metabolism. This means that if income inequality isimplicated in these changing sex ratios, then it would probably have to affect the sexdistributions of the risk factors, so that rising income inequality would be more potentin its effects on risk factors like smoking, hypertension and fat consumption for menthan for women. Given these race and sex-specific patterns of heart disease over thecentury, how do they coincide with trends in income inequality?
Source: National Center for Health Statistics (2001a); Plotnick et al. (2000).
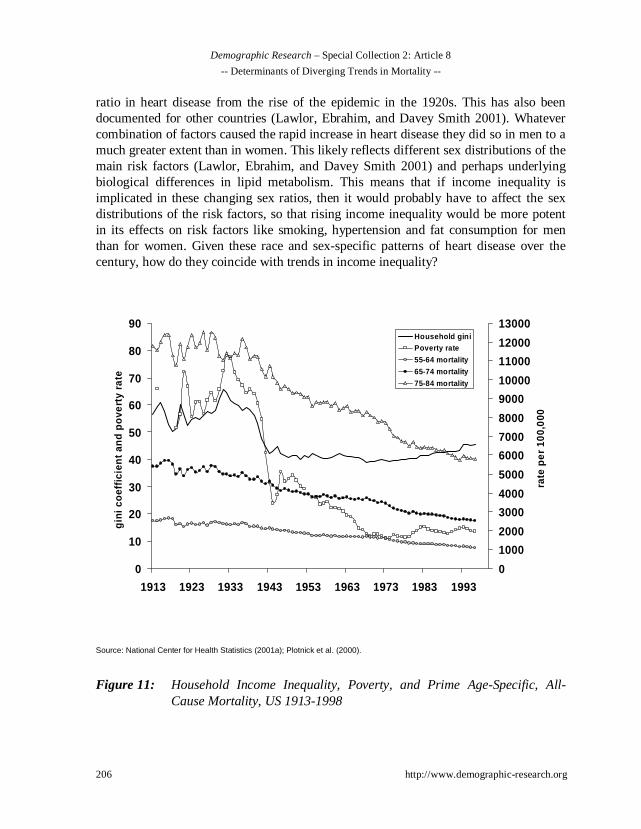
Figure 11: Household Income Inequality, Poverty, and Prime Age-Specific, All-Cause Mortality, US 1913-1998
0
10
20
30
40
50
60
70
80
90
1913 1923 1933 1943 1953 1963 1973 1983 1993
gin
i co
effi
cien
t an
d p
ove
rty
rate
0
1000
2000
3000
4000
5000
6000
7000
8000
9000
10000
11000
12000
13000
rate
per
100
,000
Household giniPoverty rate
55-64 mortality
65-74 mortality
75-84 mortality
Demographic Research – Special Collection 2: Article 8
-- Determinants of Diverging Trends in Mortality --
http://www.demographic-research.org 207
Figure 11 shows trends in poverty, income inequality (measured by the householdGini coefficient) and prime age mortality among 55-64, 65-74 and 75-84 year olds.Reliable income data became available in 1913 (Plotnick et al. 1998), and we note threeimportant features. First, the really big income inequality story in the 20th century seemsto be the rise during the inter-war period and the depression, followed by massivedeclines during and after World War II. Second, after World War II, income inequalityhas been relatively stable - at least as measured by the Gini coefficient relative to earlierperiods. Thus, the recent increases that have drawn so much academic and popularattention are rather modest compared to the huge declines witnessed after the late 1930sthat helped establish the advantageous economic conditions for the baby-boomgenerations. Perhaps this also has relevance for why changes in income inequality fromthe late 1960s appear to have no simple association with disease trends over the sametime period. This in no way trivializes the negative impacts of these more recentincreases in income inequality, but for our purpose here it is important to consider thatif income inequality does leave a “footprint” on population health, then these recentincreases were rather modest when tested against the historical record. Third, overalllong-term trends in prime age mortality seem relatively immune to the changes inincome inequality, although there is some evidence that the steeper mortality declinesthat occurred among those aged 75-84 and 65-74 coincided with the massive reductionsin income inequality beginning in the early 1930s. However, it is also important torecognize that this massive reduction in income inequality also coincided with hugedeclines in poverty and the establishment of other welfare state policies such as socialsecurity in 1935 (Piketty and Saez 2003). Thus, as we have argued elsewhere (Lynch etal. 2000; Lynch et al. 2001), income inequality is tightly linked to other aspects ofsocial policy and this may make it difficult to isolate its independent effects onpopulation health.
So, if we assume that income inequality does play an important role in determininglevels of population health, then it is the much larger changes from the 1930s to the mid1940s that should be discernible. Additionally, given the evidence on the rise of late19th century wealth inequality it seems reasonable to assume that income inequality wasalso rising during the later part of the 19th century (Lindert 2000). Turning now to heartdisease mortality trends, if a 30-35 year time-lag were imposed on the link betweenexposure to income inequality and heart disease mortality, it might be possible to builda story of how the rise from the late 19th century to a peak in the early 1930s, followedby massive declines up to the late 1940s affected the subsequent rise and fall in heartdisease.
Overlaying the trends in income inequality and heart disease (Figure 12) with a 35-year time lag shows that at least the decline in income inequality fits reasonably wellwith the decline in heart disease. We do not know precisely what happened to income

Demographic Research – Special Collection 2: Article 8
-- Determinants of Diverging Trends in Mortality --
208 http://www.demographic-research.org
inequality prior to 1913, but it is perhaps plausible that, as was the case in Britain, itrose during industrialization from the 1850s (Williamson 1985) and was relativelystable from 1890 to the 1920s when it peaked after the depression. If that is plausible,then one might be tempted to argue a case that a 35-year time lag fits these heart diseasetrend data reasonably well. Those who may wish to propose such a seemingly heroichypothesis would, however, also have to propose plausible mechanisms. In general, wehave argued against the usefulness of such meta-theoretical explanations for populationhealth phenomena (Davey Smith and Egger 1996; Lynch et al. 2001).
Source: National Center for Health Statistics (2001a); Plotnick et al. (2000)
Figure 12: Age-Adjusted Heart Disease Mortality 1900-1998 and Household IncomeInequality 1913-1996
10
20
30
40
50
60
70
1900 1910 1920 1930 1940 1950 1960 1970 1980 1990 2000
gin
i co
effi
cien
t
0
100
200
300
400
500
600
700
rate
per
100
,000
~35 years
heart disease
income inequality

Demographic Research – Special Collection 2: Article 8
-- Determinants of Diverging Trends in Mortality --
http://www.demographic-research.org 209
Nevertheless, it is worth at least exploring such a possibility. One place to start isto examine how long-term trends in income inequality align with the known risk factors(at least for the IHD component of heart disease) and ask how well income inequalityand heart disease trends are consistent with our knowledge of trends in the mainindividual-level risk factors for IHD – smoking, blood lipids and hypertension?
In Figure 13 we overlay smoking trends over the century, onto the heart diseasetrends and show that the effect of smoking on heart disease is rather immediate, in thatthere seems little or no time lag between the rapid rise of smoking in the population andthe equally steep increase in heart disease. Furthermore, it would be important toexamine sex-specific smoking trends, as men were much more likely to adopt smokingearlier and had higher rates of both smoking and heart disease throughout the epidemic.
Source: National Center for Health Statistics (2001a), Burns et al. (1997), Centers for Disease Control and Prevention (2002), U.S.Department of Agriculture (2001).
Figure 13: Age-Adjusted Heart Disease Mortality and Annual Adult Per CapitaCigarette Consumption, 1900-1998
0
100
200
300
400
500
600
700
1900 1910 1920 1930 1940 1950 1960 1970 1980 1990 2000
rate
per
100
,000
0
500
1000
1500
2000
2500
3000
3500
4000
4500
5000
per
cap
ita
con
sum
pti
onheart disease
cigarette consumption
Demographic Research – Special Collection 2: Article 8
-- Determinants of Diverging Trends in Mortality --
210 http://www.demographic-research.org
The same causal immediacy is not true for lung cancer, where there is aconsiderable time lag of 40 or more years between the exposure of different birthcohorts to smoking and the subsequent population yield in lung cancer mortality. Thereare three main processes implicated in heart disease – the development of atheroma,thrombo-embolic processes, and arrhythmia. While development of atheroma occursover time, smoking may operate through the thrombo-embolic and/or arrhythmicpathways, thus plausibly being able to almost instantaneously influence heart diseasegiven some underlying susceptibility - perhaps through the development of vulnerableatherosclerotic plaque - itself associated with blood lipids and haemostatic function. So,if rising income inequality caused people to smoke more and given that smoking mapsalmost directly onto heart disease trends - especially for men - the data here suggeststhat there would have to be a 30-35 year time lag between increased income inequalityand increases in smoking. This seems rather implausible. In fact, what these data dosuggest is that at the very time income inequality was dramatically falling, smoking wasdramatically increasing.
Thus, while it may be possible to attempt to build a case that long-term trends inincome inequality play some role in the rise and fall of heart disease, it seems unlikelythat it could plausibly work through the major established risk factors for IHD such assmoking. Proponents of the “relative deprivation” version of the income inequalityhypothesis (Lynch et al. 2000) have suggested two pathways for income inequality toaffect health – behaviors and stress. We have already shown that trends in incomeinequality do not map easily onto trends in smoking. That leaves dietary, hypertensionor the stress pathway to be explored but it is difficult to see how the stress pathwaycould be tested using historical trend data.
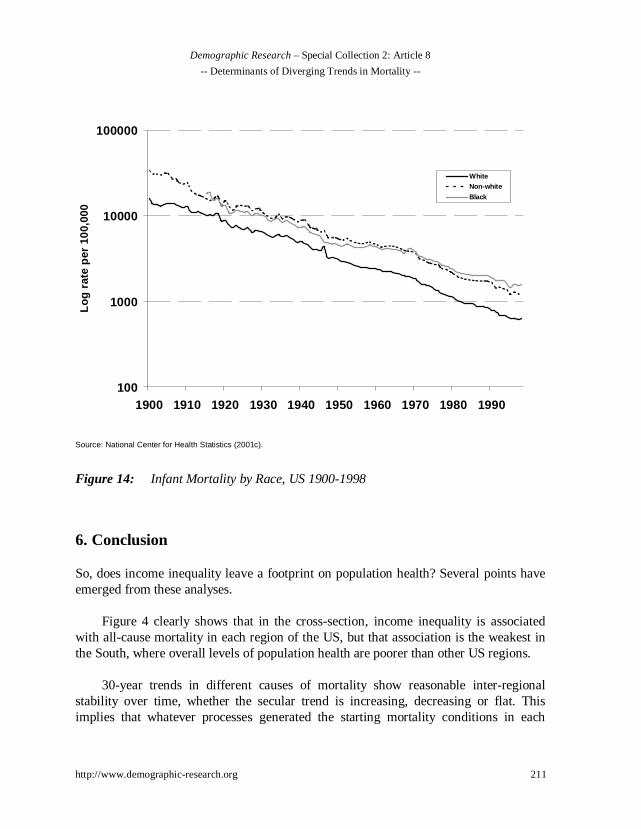
One final piece of evidence – several cross-sectional studies of income inequalityhave shown strong effects on infant and child health, perhaps because the time lagsbetween exposure and outcome may be relatively short (Kramer et al. 2001). So is thereany evidence that the long-term trends in income inequality affect infant mortalitytrends? Figure 14 shows 20th century trends in infant mortality by race/ethnic group.The Y-axis is on a logarithmic scale to overcome the distorting effect on contemporarytrends of very high infant mortality rates up until the 1920s. There is no clear linkbetween 100-year trends in income inequality and the inexorable decline in infantmortality in all race groups over the same time period. So even for a cause of death thathas been strongly linked to relative inequality in both national and international cross-sectional studies (Lynch et al. 1998; Lynch et al. 2001), and may be plausibly linked toproposed income inequality mechanisms that do not involve long time lags, thereappears to be no clear association between long-term trends in infant mortality andincome inequality trends.
Demographic Research – Special Collection 2: Article 8
-- Determinants of Diverging Trends in Mortality --
http://www.demographic-research.org 211
Source: National Center for Health Statistics (2001c).
Figure 14: Infant Mortality by Race, US 1900-1998
6. Conclusion
So, does income inequality leave a footprint on population health? Several points haveemerged from these analyses.
Figure 4 clearly shows that in the cross-section, income inequality is associatedwith all-cause mortality in each region of the US, but that association is the weakest inthe South, where overall levels of population health are poorer than other US regions.
30-year trends in different causes of mortality show reasonable inter-regionalstability over time, whether the secular trend is increasing, decreasing or flat. Thisimplies that whatever processes generated the starting mortality conditions in each
100
1000
10000
100000
1900 1910 1920 1930 1940 1950 1960 1970 1980 1990
Lo
g r
ate
per
100
,000
WhiteNon-white
Black

Demographic Research – Special Collection 2: Article 8
-- Determinants of Diverging Trends in Mortality --
212 http://www.demographic-research.org
region help set that region on a trajectory that is relatively stable over 30 years andhighlights the importance of an historical perspective on understanding populationhealth trends.
There is considerable heterogeneity in the relative positions of regions in regard todifferent causes of mortality. For instance, over 30 years, the Middle Atlantic region hasthe highest heart disease rates but the lowest stroke mortality rates.
Given the regional trends in income inequality, there appears no direct way thatincome inequality could explain both the initial levels and ordering of these regionalmortality differences, or their trends between 1968 and 1998. Any such explanationwould be further complicated by different time lags for different outcomes.
At the national level, massive declines in income inequality around World War IIappear somewhat reflected in steepening declines in mortality among 65-74 and 75-84year olds, but this is likely confounded by coincident changes in rates of old-agepoverty and the establishment of state sponsored welfare programs like social securityaimed at those over 65 years of age.
At the national level, 20th century trends in heart disease (although clearlycomprised of different sub-components at different historical periods, that havedifferent determinants) appear more compatible with what is known about trends in theestablished risk factors for ischaemic heart disease - such as smoking - than with trendsin income inequality or importantly, with how income inequality trends could be linkedwith trends in the major risk factors for IHD. In fact, smoking prevalence wasundergoing its steepest increase in precisely the same time period that incomeinequality witnessed its most dramatic fall of the 20th century.
At the national level, 20th century trends in infant mortality do not appear sensitiveto changes in income inequality.
The evidence that income inequality affects population health in the US is built oncross-sectional data. However, it appears difficult to reconcile either 30-year regionaldifferences in cause-specific mortality with regional patterns and trends in inequality, orwith 100-year national trends in income inequality, heart disease or infant mortality.This raises some potentially difficult issues that require further investigation. Forinstance, the data shown here illustrate how theories concerning the social determinantsof population health which are based on seemingly plausible cross-sectional or short-

Demographic Research – Special Collection 2: Article 8
-- Determinants of Diverging Trends in Mortality --
http://www.demographic-research.org 213
term prospective evidence, can fail to generate support when examined over longerperiods of time. The time trend data shown here force us to ask how we can reconcilethe fact that cross-sectionally in the US, geographic variation in income inequality hasbeen strongly linked to geographic variation in infant and child outcomes, homicide,heart disease and many other causes of death (Kaplan et al. 1996; Daly et al. 1998;Lynch et al. 2001; Kennedy, Kawachi, and Prothrow-Stith 1996; Kennedy et al. 1998;Kennedy et al. 1998; Szwarcwald et al. 1999). Yet, when examined here over longerperiods of time, such clear links are not evident.
We have raised more questions than supplied answers, but our purpose here was todescribe these trends and discuss the patterns in regard to the potential for incomeinequality to affect mortality trends regionally and nationally. We have attempted toshow the value of examining potential determinants of population health from anhistorically contextualized perspective that uses information gathered from individuallevel studies about known risk factors for different outcomes, to better comprehend therole of income inequality on mortality trends in the US. While the evidence presentedhere does not categorically exclude a role for income inequality in affecting levels ofpopulation health in the US, it does suggest that such effects cannot be reduced tosimple processes that operate across all contexts and in all time periods. The mainfinding is that, due to the sheer heterogeneity of secular and regional mortality levelsand trends, there seems little evidence for a unilateral mechanism linking incomeinequality to health. Thus, if income inequality does indeed drive population health, itimplies that income inequality would have to be linked and de-linked across differenttime periods, with different exposures to generate the observed heterogeneous trendsand levels in the causes of mortality shown here.
7. Acknowledgements
John Lynch and Sam Harper are supported by a grant from the Centers for DiseaseControl and Prevention (S1091). John Lynch and George Davey Smith are therecipients of a Robert Wood Johnson Investigators in Health Policy Award that helpedsupport this work. John Lynch is also supported by grants from the US NationalInstitutes of Health (RO1 HD35120-01A2; P50 HD38986-01). This chapter has alsobeen facilitated by the European Science Foundation Program on Health Variations, ofwhich John Lynch and George Davey Smith are members of the Lifecourse WorkingGroup.
Demographic Research – Special Collection 2: Article 8
-- Determinants of Diverging Trends in Mortality --
214 http://www.demographic-research.org
Reference list
Ben-Shlomo Y. and Kuh D. ( 2002). “A Life Course Approach to Chronic DiseaseEpidemiology: Conceptual Models, Empirical Challenges and InterdisciplinaryPerspectives.” Int J Epidemiol 31(2):285-93.
Bernstein J., Boushey H., McNichol E.C., and Zahradnik R. (2002). “Pulling Apart: aState-by-State Analysis of Income Trends.” Washington, DC: Center on Budgetand Policy Priorities.
Blakely T.A., Kennedy B.P., Glass R., and Kawachi I. (2000). “What Is the Lag TimeBetween Income Inequality and Health Status?” J Epidemiol Community Health54(4):318-19.
Burns D.M., Lee L., Shen L.Z., Gilpin E., Tolley H.D., Vaughn J., and Shanks T.G.(1997). “Cigarette Smoking Behavior in the United States.” In: Burns D.M.,Garfinkel L., and Samet J.M. Smoking and Tobacco Control Monograph 8:Changes in Cigarette-Related Disease Risks and Their Implications forPrevention and Control. Bethesda, MD: US Dept. of Health and HumanServices, National Cancer Institute, 1997, pp. 13-42.
Cavelaars A.E., Kunst A.E., Geurts J.J., Crialesi R., Grotvedt L., Helmert U., LahelmaE., Lundberg O., Matheson J., Mielck A., Rasmussen N.K., Regidor E., doRosario-Giraldes M., Spuhler T., and Mackenbach J.P. (2000). “EducationalDifferences in Smoking: International Comparison.” BMJ 320(7242):1102-7.
Centers for Disease Control and Prevention, Tobacco Information and PreventionSource. (2002). “Consumption Data” [Web Page]. Accessed 11 Sep 2002.Available athttp://www.cdc.gov/tobacco/research_data/economics/consump1.htm.
Colgrove J. (2002). “The McKeown Thesis: A Historical Controversy and Its EnduringInfluence.” Am J Public Health 92(5):725-29.
Cooper R., Cutler J., Desvigne-Nickens P., Fortmann S.P., Friedman L., Havlik R.,Hogelin G., Marler J., Mcgovern P., Morosco G., Mosca L., Pearson T., StamlerJ., Stryer D., and Thom T. (2000). “Trends and Disparities in Coronary HeartDisease, Stroke, and Other Cardiovascular Diseases in the United States :Findings of the National Conference on Cardiovascular Disease Prevention.”Circulation 102(25):3137-47.
Demographic Research – Special Collection 2: Article 8
-- Determinants of Diverging Trends in Mortality --
http://www.demographic-research.org 215
Daly M.C., Duncan G.J., Kaplan G.A., and Lynch J.W. (1998). “Macro-to-Micro Linksin the Relation Between Income Inequality and Mortality.” Milbank Q76(3):315-39.
Davey Smith G. and Lynch J.W. (in press). “Socioeconomic Differentials.” In: Kuh D.and Ben-Shlomo Y. A Lifecourse Approach to Chronic Disease Epidemiology.Oxford: Oxford University Press, in press.
Davey Smith G. (2001). “The Uses of ‘Uses of Epidemiology’.” Int J Epidemiol30(5):1146-55.
Davey Smith G., Ben-Shlomo Y., and Lynch J.W. (2002). “Lifecourse Approaches toInequalities in Coronary Heart Disease Risk.” In: Stansfield S. and Marmot M.Stress and the Heart: Psychosocial Pathways to Coronary Heart Disease.London: British Medical Journal Books, 2002, pp. 20-49.
Davey Smith G. and Egger M. (1996). “Commentary: Understanding It All–Health,Meta-Theories, and Mortality Trends.” BMJ 313(7072):1584-85.
Davey Smith G., Gunnell D., and Ben-Shlomo Y. (2001). “Life-Course Approaches toSocio-Economic Differentials in Cause-Specific Adult Mortality.” In: Leon D.A.and Walt G. Poverty, Inequality, and Health. New York: Oxford UniversityPress, 2001, pp. 88-124.
Deaton, A. (2001). “Relative Deprivation, Inequality, and Mortality.” Working Paper,Center for Health and Wellbeing, Princeton University.http://www.wws.princeton.edu/~rpds/Downloads/deaton_relative_deprivation.pdf.
Deaton A. and Lubotsky D. (2003). “Mortality, Inequality and Race in American Citiesand States.” Soc Sci Med 56(6):1139-53.
Deaton A. and Paxson C. (2001). “Mortality, Income, and Income Inequality OverTime in Britain and the United States.” NBER Working paper No.8534.Cambridge, MA: National Bureau of Economic Research.
Diez-Roux A.V. (1998). “Bringing Context Back Into Epidemiology: Variables AndFallacies in Multilevel Analysis.” Am J Public Health 88(2):216-22.
Escobedo L. and Peddicord J. (1996). “Smoking Prevalence in US Birth Cohorts: theInfluence of Gender and Education.” Am J Public Health 86(2):231-36.
Hart C.L. and Davey Smith G. (2003). “Relation Between Number of Siblings andAdult Mortality and Stroke Risk: 25 Year Follow Up of Men in theCollaborative Study.” J Epidemiol Community Health 57(5):385.
Demographic Research – Special Collection 2: Article 8
-- Determinants of Diverging Trends in Mortality --
216 http://www.demographic-research.org
Kaplan G.A., Pamuk E.R., Lynch J.W., Cohen R.D., and Balfour J.L. (1996).“Inequality in Income and Mortality in the United States: Analysis of Mortalityand Potential Pathways [Published Erratum Appears in BMJ 1996;312:1253].”BMJ 312(7037):999-1003.
Kelleher, C.C., Harper S., and Lynch J.W. (2003). “What Goes Up Must Come Down?Evidence for the Contribution of Migration, Social Deprivation and Life-CourseProcesses to the Rise and Fall of the Coronary Heart Disease Epidemic in theUnited States of America.” Unpublished manuscript .
Kennedy B.P., Kawachi I., Glass R., and Prothrow-Stith D. (1998). “IncomeDistribution, Socioeconomic Status, and Self Rated Health in the United States:Multilevel Analysis.” BMJ 317(7163):917-21.
Kennedy B.P., Kawachi I., and Prothrow-Stith D. (1996). “Income Distribution andMortality: Cross Sectional Ecological Study of the Robin Hood Index in theUnited States [Published Erratum Appears in BMJ 1996 May11;312(7040):1194].” BMJ 312(7037):1004-7.
Kennedy B.P., Kawachi I., Prothrow-Stith D., Lochner K., and Gupta V. (1998).“Social Capital, Income Inequality, and Firearm Violent Crime [PublishedErratum Appears in Soc Sci Med 1998 Nov;47(10):1637].” Soc Sci Med 47(1):7-17.
Kermack W.O., McKendrick A.G., and McKinlay P.L. (1934). “Death-Rates in GreatBritain and Sweden. Some Genral Regularities and Their Signifcance.” Lancet31:698-703 [Reprinted in Int J Epidemiol 2001;30:678-683].
Kramer M.S., Goulet L., Lydon J., Séguin L., McNamara H., Dassa C., Platt R.W.,Fong Chen M., Gauthier H., Genest J. Jr, Kahn S., Libman M., Rozen R., MasseA., Miner L., Asselin G., Benjamin A., Klein J., and Koren G. (2001). “Socio-Economic Disparities in Preterm Birth: Casual Pathways and Mechanisms.”Paediatr Perinat Epidemiol 15(Suppl 2):104-23.
Kuh D. and Davey Smith G. (1993). “When Is Mortality Risk Determined? HistoricalInsights into a Current Debate.” Social History of Medicine 6(1):101-23.
Kunitz, S. (1994). Disease and Social Diversity. New York: Oxford University Press.
Langman M. (2002). “Commentary: Peptic Ulcer, Susser and Stein and the CohortPhenomenon.” Int J Epidemiol 31(1):27-28.
Lawlor D.A., Ebrahim S., and Davey Smith G. (2001). “Sex Matters: Secular andGeographical Trends in Sex Differences in Coronary Heart Disease Mortality
Demographic Research – Special Collection 2: Article 8
-- Determinants of Diverging Trends in Mortality --
http://www.demographic-research.org 217
[Published Erratum Appears in BMJ 2002;325(7364):580.].” BMJ323(7312):541-45.
Lawlor D.A., Davey Smith G., Leon D., Sterne J., and Ebrahim S. (2002). “SecularTrends in Mortality by Stroke Subtype Over the Twentieth Century: Resolutionof the Stroke-Coronary Heart Disease Paradox?” Lancet 360(9348):1818-23.
Leon D.A. (2001). “Common Threads.” In: Leon D.A. and Walt G. Poverty, Inequalityand Health. Oxford: Oxford University Press, 2001, pp. 58-87.
Leon D.A. and Davey Smith G. (2000). “Infant Mortality, Stomach Cancer, Stroke, andCoronary Heart Disease: Ecological Analysis .” BMJ 320(7251):1705-6.
Levenstein S. (2002). “Commentary: Peptic Ulcer and Its Discontents.” Int J Epidemiol31(1):29-33.
Lindert P.H. (2000). “Three Centuries of Inequality in Britain and America.” In:Atkinson A.B. and Bourguignon F. Handbook of Income Distribution.Amsterdam: Elsevier, 2000, pp. 167-216.
Link B.G. and Phelan J.C. (2002). “McKeown and the Idea That Social Conditions AreFundamental Causes of Disease.” Am J Public Health 92(5):730-732.
Lynch J. (2000). “Income Inequality and Health: Expanding the Debate.” Soc Sci Med51(7):1001-5.
Lynch J., Davey Smith G., Hillemeier M., Shaw M., Raghunthan T., and Kaplan G.(2001). “Income Inequality, the Psychosocial Environment, and Health:Comparisons of Wealthy Nations.” Lancet 358:194-200.
Lynch J.W., Davey Smith G., Kaplan G.A., and House J.S. (2000). “Income Inequalityand Mortality: Importance to Health of Individual Income, PsychosocialEnvironment, or Material Conditions.” BMJ 320(7243):1200-1204.
Lynch J.W., Kaplan G.A., Pamuk E.R., Cohen R.D., Heck K.E., Balfour J.L., and YenI.H. (1998). “Income Inequality and Mortality in Metropolitan Areas of theUnited States.” Am J Public Health 88(7):1074-80.
Lynch J. and Davey Smith G. (2002). “Commentary: Income Inequality and Health: theEnd of the Story?” Int J Epidemiol 31(3):549-51.
Lynch J., Harper S., and Davey Smith G. (in press). “Plugging leaks and repellingboarders: where to next for the SS Income Inequality?” Int J Epidemiol.
Mackenbach J.P. (2002). “Income Inequality and Population Health.” BMJ324(7328):1-2.
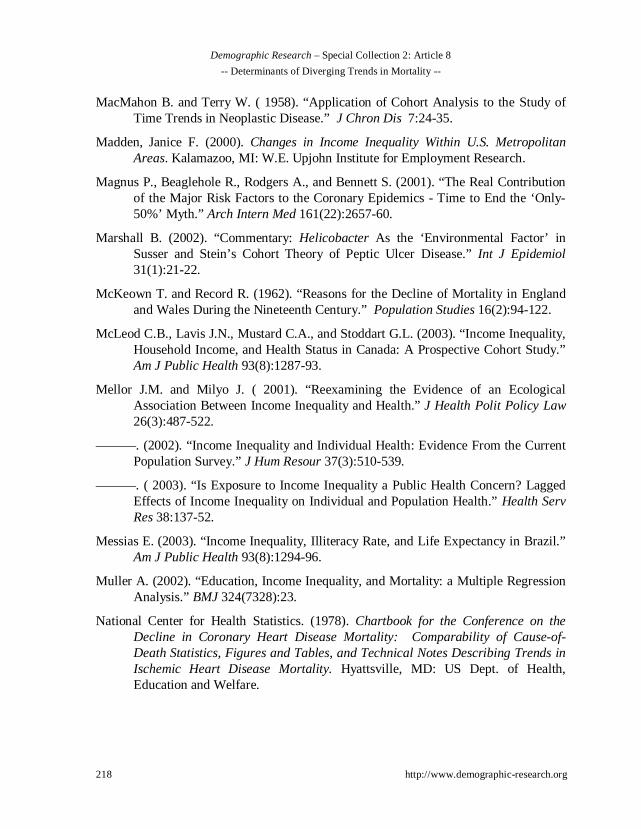
Demographic Research – Special Collection 2: Article 8
-- Determinants of Diverging Trends in Mortality --
218 http://www.demographic-research.org
MacMahon B. and Terry W. ( 1958). “Application of Cohort Analysis to the Study ofTime Trends in Neoplastic Disease.” J Chron Dis 7:24-35.
Madden, Janice F. (2000). Changes in Income Inequality Within U.S. MetropolitanAreas. Kalamazoo, MI: W.E. Upjohn Institute for Employment Research.
Magnus P., Beaglehole R., Rodgers A., and Bennett S. (2001). “The Real Contributionof the Major Risk Factors to the Coronary Epidemics - Time to End the ‘Only-50%’ Myth.” Arch Intern Med 161(22):2657-60.
Marshall B. (2002). “Commentary: Helicobacter As the ‘Environmental Factor’ inSusser and Stein’s Cohort Theory of Peptic Ulcer Disease.” Int J Epidemiol31(1):21-22.
McKeown T. and Record R. (1962). “Reasons for the Decline of Mortality in Englandand Wales During the Nineteenth Century.” Population Studies 16(2):94-122.
McLeod C.B., Lavis J.N., Mustard C.A., and Stoddart G.L. (2003). “Income Inequality,Household Income, and Health Status in Canada: A Prospective Cohort Study.”Am J Public Health 93(8):1287-93.
Mellor J.M. and Milyo J. ( 2001). “Reexamining the Evidence of an EcologicalAssociation Between Income Inequality and Health.” J Health Polit Policy Law26(3):487-522.
———. (2002). “Income Inequality and Individual Health: Evidence From the CurrentPopulation Survey.” J Hum Resour 37(3):510-539.
———. ( 2003). “Is Exposure to Income Inequality a Public Health Concern? LaggedEffects of Income Inequality on Individual and Population Health.” Health ServRes 38:137-52.
Messias E. (2003). “Income Inequality, Illiteracy Rate, and Life Expectancy in Brazil.”Am J Public Health 93(8):1294-96.
Muller A. (2002). “Education, Income Inequality, and Mortality: a Multiple RegressionAnalysis.” BMJ 324(7328):23.
National Center for Health Statistics. (1978). Chartbook for the Conference on theDecline in Coronary Heart Disease Mortality: Comparability of Cause-of-Death Statistics, Figures and Tables, and Technical Notes Describing Trends inIschemic Heart Disease Mortality. Hyattsville, MD: US Dept. of Health,Education and Welfare.
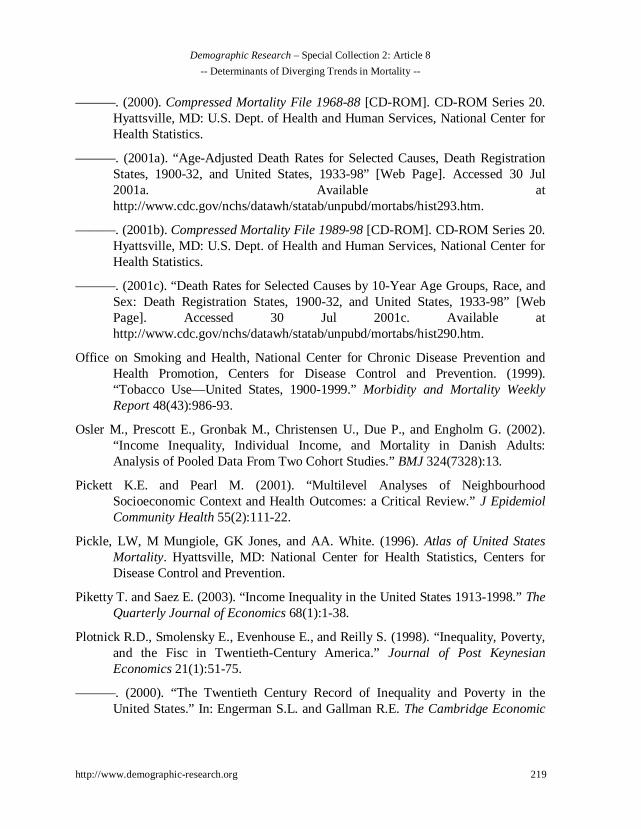
Demographic Research – Special Collection 2: Article 8
-- Determinants of Diverging Trends in Mortality --
http://www.demographic-research.org 219
———. (2000). Compressed Mortality File 1968-88 [CD-ROM]. CD-ROM Series 20.Hyattsville, MD: U.S. Dept. of Health and Human Services, National Center forHealth Statistics.
———. (2001a). “Age-Adjusted Death Rates for Selected Causes, Death RegistrationStates, 1900-32, and United States, 1933-98” [Web Page]. Accessed 30 Jul2001a. Available athttp://www.cdc.gov/nchs/datawh/statab/unpubd/mortabs/hist293.htm.
———. (2001b). Compressed Mortality File 1989-98 [CD-ROM]. CD-ROM Series 20.Hyattsville, MD: U.S. Dept. of Health and Human Services, National Center forHealth Statistics.
———. (2001c). “Death Rates for Selected Causes by 10-Year Age Groups, Race, andSex: Death Registration States, 1900-32, and United States, 1933-98” [WebPage]. Accessed 30 Jul 2001c. Available athttp://www.cdc.gov/nchs/datawh/statab/unpubd/mortabs/hist290.htm.
Office on Smoking and Health, National Center for Chronic Disease Prevention andHealth Promotion, Centers for Disease Control and Prevention. (1999).“Tobacco Use—United States, 1900-1999.” Morbidity and Mortality WeeklyReport 48(43):986-93.
Osler M., Prescott E., Gronbak M., Christensen U., Due P., and Engholm G. (2002).“Income Inequality, Individual Income, and Mortality in Danish Adults:Analysis of Pooled Data From Two Cohort Studies.” BMJ 324(7328):13.
Pickett K.E. and Pearl M. (2001). “Multilevel Analyses of NeighbourhoodSocioeconomic Context and Health Outcomes: a Critical Review.” J EpidemiolCommunity Health 55(2):111-22.
Pickle, LW, M Mungiole, GK Jones, and AA. White. (1996). Atlas of United StatesMortality. Hyattsville, MD: National Center for Health Statistics, Centers forDisease Control and Prevention.
Piketty T. and Saez E. (2003). “Income Inequality in the United States 1913-1998.” TheQuarterly Journal of Economics 68(1):1-38.
Plotnick R.D., Smolensky E., Evenhouse E., and Reilly S. (1998). “Inequality, Poverty,and the Fisc in Twentieth-Century America.” Journal of Post KeynesianEconomics 21(1):51-75.
———. (2000). “The Twentieth Century Record of Inequality and Poverty in theUnited States.” In: Engerman S.L. and Gallman R.E. The Cambridge Economic

Demographic Research – Special Collection 2: Article 8
-- Determinants of Diverging Trends in Mortality --
220 http://www.demographic-research.org
History of the United States. Cambridge: Cambridge University Press, 2000, pp.249-300 .
Ross N.A., Wolfson M.C., Dunn J.R., Berthelot J.-M., Kaplan G.A., and Lynch J.W.(2000a). “Income Inequality and Mortality in Canada and the United States: aCross-Sectional Assessment Using Census Data and Vital Statistics.” BMJ320:1200-1204.
———. (2000b). “Relation Between Income Inequality and Mortality in Canada and inthe United States: Cross-Sectional Assessment Using Census Data and VitalStatistics.” BMJ 320:898-902.
Ryscavage, Paul. (1999). Income Inequality in America: An Analysis of Trends.Armonk, NY: M.E. Sharpe.
Shibuya K., Hashimoto H., and Yano E. (2002). “Individual Income, IncomeDistribution, and Self-Rated Health in Japan: Cross Sectional Analysis ofNationally Representative Sample.” BMJ 324: 16-19.
Sonnenberg A., Cucino C., and Bauerfeind P. (2002). “Commentary: the UnresolvedMystery of Birth-Cohort Phenomena in Gastroenterology.” Int J Epidemiol31(1):23-26.
Stallones R.A. (1980). “The Rise and Fall of Ischemic Heart Disease.” Sci Am243(5):53-59.
Strachan D.P. and Perry I.J. (1997). “Time Trends.” In: Kuh D. and Ben-Shlomo Y. ALife Course Approach to Chronic Disease Epidemiology. Oxford: OxfordUniversity Press, 1997, pp. 201-19.
Subramanian S.V., Blakely T., and Kawachi I. (2003). “Income Inequality As a PublicHealth Concern: Where Do We Stand? Commentary on “Is Exposure to IncomeInequality a Public Health Concern?”.” Health Serv Res 38:153-67.
Subramanian S., Degaldo I., Jadue L., Vega J., and Kawachi I. (in press). “Incomeinequality and health: multilevel analysis of Chilean communities.” J EpidemiolCommunity Health.
Subramanian S. and Kawachi I. (in press). “The association between state incomeinequality and worse health is not confounded by race.” Int J Epidemiol.
Susser M. and Stein Z. (1962). “Civilisation and Peptic Ulcer.” Lancet 1(7221):115-9.
———. (2002). “Commentary: Civilization and Peptic Ulcer 40 Years on.” Int JEpidemiol 31(1):18-21.

Demographic Research – Special Collection 2: Article 8
-- Determinants of Diverging Trends in Mortality --
http://www.demographic-research.org 221
Szreter S. (1988). “The Importance of Social Intervention in Britain’s Mortality DeclineC.1850-1914: A Re-Interpretation of the Role of Public Health.” Social Historyof Medicine 1(1):1-39.
———. (1994). “Mortality in England in the Eighteenth and the Nineteenth Centuries:a Reply to Sumit Guha.” Social History of Medicine 7(2):269-82.
———. (1997). “Economic Growth, Disruption, Deprivation, Disease, and Death: onthe Importance of the Politics of Public Health for Development.” Pop Dev Rev23(4):693-728.
———. (2002). “Rethinking McKeown: The Relationship Between Public Health andSocial Change.” Am J Public Health 92(5):722-25.
Szwarcwald C.L., Bastos F.I., Viacava F., and de Andrade C.L. (1999). “IncomeInequality and Homicide Rates in Rio De Janeiro, Brazil.” Am J Public Health89(6):845-80.
U.S. Department of Agriculture, Economic Research Service. (2001). TBS-249.Washington: U.S. Department of Agriculture.
Vartiainen E., Puska P., Pekkanen J., Toumilehto J., and Jousilahti P. (1994). “Changesin Risk Factors Explain Changes in Mortality From Ischaemic Heart Disease inFinland.” BMJ 309(6946):23-27.
Vartiainen E., Sarti C., Tuomilehto J., and Kuulasmaa K. (1995). “Do Changes inCardiovascular Risk Factors Explain Changes in Mortality From Stroke inFinland?” BMJ 310(6984):901-4.
Weich S., Lewis G., and Jenkins S.P. (2002). “Income Inequality and Self Rated Healthin Britain.” J Epidemiol Community Health 56(6):436-41.
Wilkinson R.G. (1992). “Income Distribution and Life Expectancy.” BMJ304(6820):165-68.
———. (1996). Unhealthy Societies: The Afflictions of Inequality. London: Routledge.
Williamson, Jeffrey G. (1985). Did British Capitalism Breed Inequality? Boston, MA:Allen & Unwin.
Yusuf S., Reddy S., Ounpuu S., and Anand S. (2001a). “Global Burden ofCardiovascular Diseases: Part 1: General Considerations, the EpidemiologicTransition, Risk Factors, and Impact of Urbanization.” Circulation104(22):2746-53.

Demographic Research – Special Collection 2: Article 8
-- Determinants of Diverging Trends in Mortality --
222 http://www.demographic-research.org
———. (2001b). “Global Burden of Cardiovascular Diseases: Part 2: Variations inCardiovascular Disease by Specific Ethnic Groups and Geographic Regions andPrevention Strategies.” Circulation 104 (23):2855-64.

Demographic Research – Special Collection 2: Article 8
-- Determinants of Diverging Trends in Mortality --
http://www.demographic-research.org 223
Appendix 1
Source: Authors’ tabulations of the Compressed Mortality Files (National Center for Health Statistics 2000; 2001b).
Figure 1: 30-Year Trends in Age-adjusted Stroke Mortality, US Regions
0
50
100
150
200
250
1968
1970
1972
1974
1976
1978
1980
1982
1984
1986
1988
1990
1992
1994
1996
1998
rate
per
100
,000
E N CENTRAL
E S CENTRAL
MID ATLANTIC
MOUNTAIN
NEW ENGLAND
PACIFIC
S ATLANTIC
W N CENTRAL
W S CENTRAL

Demographic Research – Special Collection 2: Article 8
-- Determinants of Diverging Trends in Mortality --
224 http://www.demographic-research.org
Source: Authors’ tabulations of the Compressed Mortality Files (National Center for Health Statistics 2000; 2001b).
Figure 2: 30-Year Trends in Age-adjusted Breast Cancer Mortality, US Regions
0
5
10
15
20
25
30
1968
1970
1972
1974
1976
1978
1980
1982
1984
1986
1988
1990
1992
1994
1996
1998
rate
per
100
,000
E N CENTRAL
E S CENTRAL
MID ATLANTIC
MOUNTAIN
NEW ENGLAND
PACIFIC
S ATLANTIC
W N CENTRAL
W S CENTRAL
Demographic Research – Special Collection 2: Article 8
-- Determinants of Diverging Trends in Mortality --
http://www.demographic-research.org 225
Source: Authors’ tabulations of the Compressed Mortality Files (National Center for Health Statistics 2000; 2001b).
Figure 3: 30-Year Trends in Age-adjusted Prostate Cancer Mortality, US Regions
0
5
10
15
20
25
30
1968
1970
1972
1974
1976
1978
1980
1982
1984
1986
1988
1990
1992
1994
1996
1998
rate
per
100
,000
E N CENTRAL
E S CENTRAL
MID ATLANTIC
MOUNTAIN
NEW ENGLAND
PACIFIC
S ATLANTIC
W N CENTRAL
W S CENTRAL
Demographic Research – Special Collection 2: Article 8
-- Determinants of Diverging Trends in Mortality --
226 http://www.demographic-research.org
Source: Authors’ tabulations of the Compressed Mortality Files (National Center for Health Statistics 2000; 2001b; National Centerfor Health Statistics 2001b).
Figure 4: 30-Year Trends in Age-adjusted Suicide Mortality, US Regions
0
5
10
15
20
25
30
1968
1970
1972
1974
1976
1978
1980
1982
1984
1986
1988
1990
1992
1994
1996
1998
rate
per
100
,000
E N CENTRAL
E S CENTRAL
MID ATLANTIC
MOUNTAIN
NEW ENGLAND
PACIFIC
S ATLANTIC
W N CENTRAL
W S CENTRAL
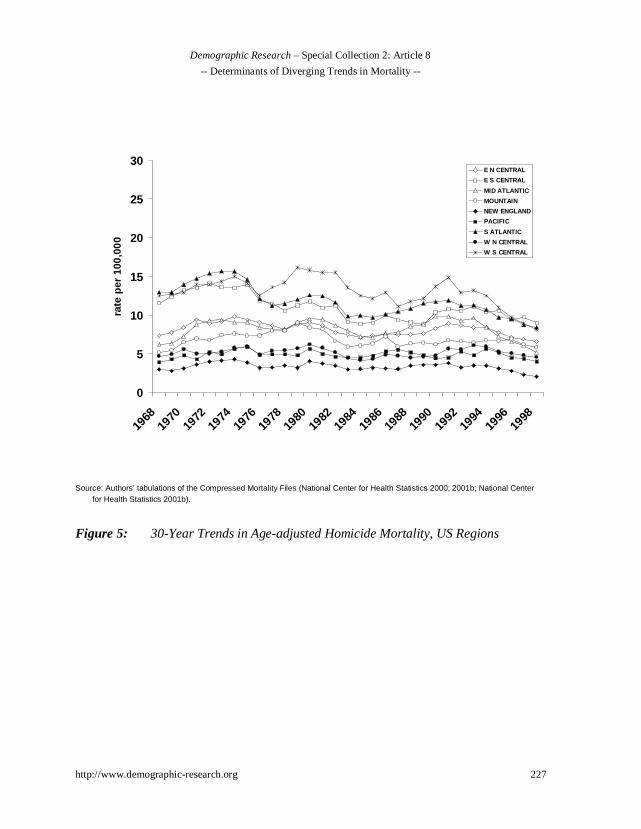
Demographic Research – Special Collection 2: Article 8
-- Determinants of Diverging Trends in Mortality --
http://www.demographic-research.org 227
Source: Authors’ tabulations of the Compressed Mortality Files (National Center for Health Statistics 2000; 2001b; National Centerfor Health Statistics 2001b).
Figure 5: 30-Year Trends in Age-adjusted Homicide Mortality, US Regions
0
5
10
15
20
25
30
1968
1970
1972
1974
1976
1978
1980
1982
1984
1986
1988
1990
1992
1994
1996
1998
rate
per
100
,000
E N CENTRAL
E S CENTRAL
MID ATLANTIC
MOUNTAIN
NEW ENGLAND
PACIFIC
S ATLANTIC
W N CENTRAL
W S CENTRAL

Demographic Research – Special Collection 2: Article 8
-- Determinants of Diverging Trends in Mortality --
228 http://www.demographic-research.org
Appendix 2
ICD-CodesDISEASES OF THE HEART
ICD Revision Years in use ICD Nos.First 1900-1909 (77-80)Second 1910-1920 (77-80)Third 1921-1929 (87-90)Fourth 1930-1938 (90-95)Fifth 1939-1948 (90-95)Sixth 1949-1957 (410-443)Seventh 1958-1967 (400-402, 410-443)Eighth 1968-1978 (390-398,402,404,410-429)Nineth 1979-1998 (390-398,402,404-429)