20 Years of Research on Socioeconomic Inequality and Children's—Unintentional Injuries...
24
Hindawi Publishing Corporation International Journal of Pediatrics Volume 2010, Article ID 819687, 23 pages doi:10.1155/2010/819687 Review Article 20 Years of Research on Socioeconomic Inequality and Children’s—Unintentional Injuries Understanding the Cause-Specific Evidence at Hand Lucie Laflamme, 1 Marie Hasselberg, 1 and Stephanie Burrows 2 1 Division of Global Health, Department of Public Health Sciences, Karolinska Institutet, Nobels v¨ ag 9, 171 76 Stockholm, Sweden 2 Centre de Recherche du Centre hospitalier de l’Universit´ e de Montr´ eal, 1301 Rue Sherbrooke Est, Montr´ eal, QC, Canada H2L 1M3 Correspondence should be addressed to Lucie Laflamme, lucie.lafl[email protected] Received 31 January 2010; Revised 18 May 2010; Accepted 4 June 2010 Academic Editor: M. Denise Dowd Copyright © 2010 Lucie Laflamme et al. This is an open access article distributed under the Creative Commons Attribution License, which permits unrestricted use, distribution, and reproduction in any medium, provided the original work is properly cited. Injuries are one of the major causes of both death and social inequalities in health in children. This paper reviews and reflects on two decades of empirical studies (1990 to 2009) published in the peer-reviewed medical and public health literature on socioeconomic disparities as regards the five main causes of childhood unintentional injuries (i.e., traffic, drowning, poisoning, burns, falls). Studies have been conducted at both area and individual levels, the bulk of which deal with road traffic, burn, and fall injuries. As a whole and for each injury cause separately, their results support the notion that low socioeconomic status is greatly detrimental to child safety but not in all instances and settings. In light of variations between causes and, within causes, between settings and countries, it is emphasized that the prevention of inequities in child safety requires not only that proximal risk factors of injuries be tackled but also remote and fundamental ones inherent to poverty. 1. Introduction Despite being regarded as highly preventable, injuries account for an increasing share of childhood mortality in the world [1, 2]. The most common causes of child mortality and morbidity by injury are road traffic crash, drowning, poisoning, burns, and falls. These injuries are unevenly distributed between countries [1, 3] and, within countries, between socioeconomic groups, to the detriment of the more disadvantaged families and communities. Reviews published throughout the years, be they focused on a specific childhood injury cause or setting [4–6] or covering several of them [7–11] strongly substantiate this notion. Injuries are in fact acknowledged as one of the causes of childhood mortality with the steepest socioeconomic gradient [1–15]. Despite this knowledge, in the medical and public health literature alone, a great deal of research is regularly published on socioeconomic disparities in childhood injury that specifically aims at measuring the magnitude of those differences. Some injury causes like traffic-related ones are frequently studied [2, 7–11], whereas others, like burns and drownings, receive far less attention. As this literature is highly descriptive in nature (as is the case for studies on socioeconomic differences in injuries in general), there is a paucity of studies on the mechanisms susceptible to generate those differences, which poses challenges to prevention work. Likewise, the reasons why differences exist in socioeconomic disparities across studies are seldom thoroughly addressed. Some of the reviews mentioned above that, inspired by lead authors on social inequalities in health, put forward key mechanisms that help understanding why socioeconomic disparities may arise [4, 9–11] but they deal with the “why differences exist” and “how to combat differences” questions in generic terms and they provide little insight regarding why socioeconomic differences vary both in magnitude and direction, either with increasing age or across settings. This paper proposes to move this discussion forward. It considers the five leading causes of child mortality and morbidity mentioned above, thus allowing a more accurate coverage of
Transcript of 20 Years of Research on Socioeconomic Inequality and Children's—Unintentional Injuries...
Hindawi Publishing CorporationInternational Journal of PediatricsVolume 2010, Article ID 819687, 23 pagesdoi:10.1155/2010/819687
Review Article
20 Years of Research on Socioeconomic Inequality andChildren’s—Unintentional Injuries Understandingthe Cause-Specific Evidence at Hand
Lucie Laflamme,1 Marie Hasselberg,1 and Stephanie Burrows2
1 Division of Global Health, Department of Public Health Sciences, Karolinska Institutet, Nobels vag 9, 171 76 Stockholm, Sweden2 Centre de Recherche du Centre hospitalier de l’Universite de Montreal, 1301 Rue Sherbrooke Est, Montreal, QC, Canada H2L 1M3
Correspondence should be addressed to Lucie Laflamme, [email protected]
Received 31 January 2010; Revised 18 May 2010; Accepted 4 June 2010
Academic Editor: M. Denise Dowd
Copyright © 2010 Lucie Laflamme et al. This is an open access article distributed under the Creative Commons AttributionLicense, which permits unrestricted use, distribution, and reproduction in any medium, provided the original work is properlycited.
Injuries are one of the major causes of both death and social inequalities in health in children. This paper reviews and reflectson two decades of empirical studies (1990 to 2009) published in the peer-reviewed medical and public health literature onsocioeconomic disparities as regards the five main causes of childhood unintentional injuries (i.e., traffic, drowning, poisoning,burns, falls). Studies have been conducted at both area and individual levels, the bulk of which deal with road traffic, burn, and fallinjuries. As a whole and for each injury cause separately, their results support the notion that low socioeconomic status is greatlydetrimental to child safety but not in all instances and settings. In light of variations between causes and, within causes, betweensettings and countries, it is emphasized that the prevention of inequities in child safety requires not only that proximal risk factorsof injuries be tackled but also remote and fundamental ones inherent to poverty.
1. Introduction
Despite being regarded as highly preventable, injuriesaccount for an increasing share of childhood mortality in theworld [1, 2]. The most common causes of child mortalityand morbidity by injury are road traffic crash, drowning,poisoning, burns, and falls. These injuries are unevenlydistributed between countries [1, 3] and, within countries,between socioeconomic groups, to the detriment of the moredisadvantaged families and communities. Reviews publishedthroughout the years, be they focused on a specific childhoodinjury cause or setting [4–6] or covering several of them[7–11] strongly substantiate this notion. Injuries are in factacknowledged as one of the causes of childhood mortalitywith the steepest socioeconomic gradient [1–15].
Despite this knowledge, in the medical and publichealth literature alone, a great deal of research is regularlypublished on socioeconomic disparities in childhood injurythat specifically aims at measuring the magnitude of thosedifferences. Some injury causes like traffic-related ones are
frequently studied [2, 7–11], whereas others, like burnsand drownings, receive far less attention. As this literatureis highly descriptive in nature (as is the case for studieson socioeconomic differences in injuries in general), thereis a paucity of studies on the mechanisms susceptibleto generate those differences, which poses challenges toprevention work. Likewise, the reasons why differencesexist in socioeconomic disparities across studies are seldomthoroughly addressed.
Some of the reviews mentioned above that, inspired bylead authors on social inequalities in health, put forward keymechanisms that help understanding why socioeconomicdisparities may arise [4, 9–11] but they deal with the “whydifferences exist” and “how to combat differences” questionsin generic terms and they provide little insight regardingwhy socioeconomic differences vary both in magnitude anddirection, either with increasing age or across settings. Thispaper proposes to move this discussion forward. It considersthe five leading causes of child mortality and morbiditymentioned above, thus allowing a more accurate coverage of
2 International Journal of Pediatrics
the whole age spectrum [1] and helping to highlight whetherand how socioeconomic disparities in injuries vary over agecategory and causes.
As a basis for the paper, we revisited and updated tworecent reviews commissioned by the World Health Organ-isation and conducted in sequence by our research team(see below). Here, we examine and reflect on two decadesof studies (1990 to 2009) on socioeconomic disparities ininjuries among children aged up to 18 years. The findingsare discussed in light of various conceptual approaches tothe understanding of the socioeconomic differences in healthand safety. Implications for preventive efforts are also raised.
2. Review Methods
2.1. Literature Search and Update. The source reviews [10,11] encompassed empirical studies on socioeconomic differ-ences in injuries published in the medical and public healthliterature during the period 1990–2006 and, in preparingthis paper, an additional three years were added (2007–2009). The articles initially sought for were original researcharticles that examined socioeconomic disparities in injuryrisk across socioeconomic groups—all ages and all injuriesin the first review [10] and unintentional injuries in childrenin the second one [11]. The articles were obtained througha literature search in the databases of SafetyLit and theNational Library of Medicine’s Medline. For the formerdatabase, all studies included under “social disparities” wereexamined for relevance. For the latter database, English,French, Swedish, and Danish language studies publishedbetween January 1990 and December 2009 were identifiedusing the keywords “injury or injuries or accident or acci-dents” in conjunction with “educational status or educationor social class or socioeconomic status or occupation orincome or social position or socioeconomic position orsocioeconomic context or social context or deprivation orsocioeconomic factors or socioeconomic characteristics orresidence characteristics or neighbourhood” and “infant orinfants or child or children or childhood or adolescent oradolescents or adolescence or youth”. Additional studies werealso identified from the reference lists in selected articles andin those of the reviews listed above.
It is important to note that, in the injury field, theSafetyLit database has both breadth (number of journalsincluded) and depth (coverage from each journal’s backfiles).In fact, it has been found that of five commonly useddatabases, EMBASE, PsycINFO, PubMed/Medline, SafetyLit,and Web of Science (including the Science Citation Indexand the Social Science Citation Index), the database withthe greatest breadth and depth of coverage for journalsthat publish articles in the injury prevention and safetypromotion (IPSP) field is SafetyLit [16]. The SafetyLitdatabase coverage includes all IPSP-relevant journals fromeach of the listed databases and, for the journals that arefound in the source lists of the other databases, a greaterdepth of coverage of backfile years. Further, the SafetyLitdatabase contains articles from journals that are not includedin any of the other listed databases.
2.2. Selection of Articles. Because of the wider scope ofthe original review, [10] and the change in focus in thesubsequent updates (second review [11] and the currentone), it is unfortunately not possible to specify the totalnumber of articles “originally” identified from the literaturesearches that deal with socioeconomic differences in child-hood injuries. As a consequence, we also cannot specify thenumber (or proportion) of them that meet the selectioncriteria presented below.
From the original literature searches, titles and abstractswere scanned for relevance independently by at least twoof the authors. Full papers were then obtained to checkfor further relevance and procede with data extraction (seebelow).
To be included in the current review, empirical studieswere retained when: 1. they examined the relationshipbetween socioeconomic status (SES) and injury at anindividual- or area-level as the primary research question,2. they considered one or several of the five major cause ofmortality and morbidity among children, 3. they concernedchildren aged up to 19 years, and 4. they included denom-inators (i.e., population data rather than only injury data)and assessments of significance between groups or areas (e.g.,testing for significance or providing confidence intervals).These latter criteria guaranteed a minimum level of strengthfor any single study and no further assessment of the qualityof evidence was applied. The age upper limit was relaxed fortraffic-related injuries as motor-vehicle driver (up to 24 yearsold).
Studies that were typically excluded are those considering“all injuries aggregated” (over 20 in a former review) [11] or“specific body parts” [10, 11] that lack both insight into theunderstanding of the phenomenon and useful informationon which to design intervention strategies and influencepolicy.
A data extraction form was devised and used to recorddetails from each study included. The details retained for thecurrent paper can be found in the results Tables 2 to 7. In caseof disagreement between the reviewers, consensus decisionswere reached.
3. Results
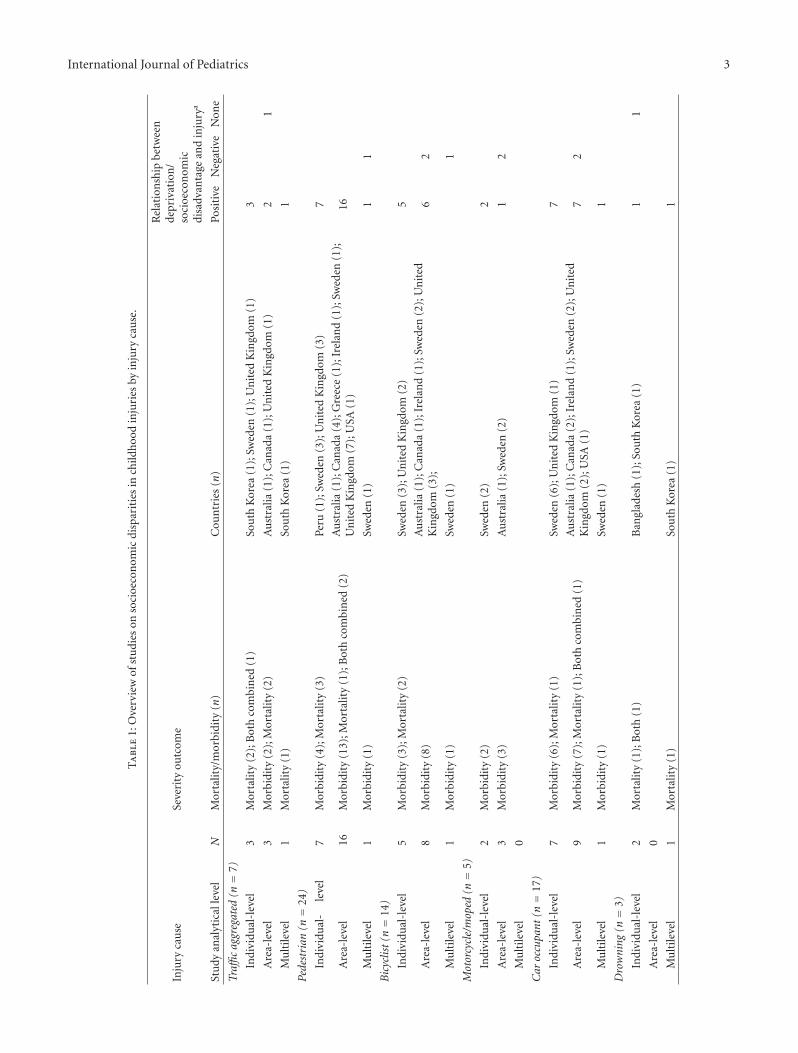
Table 1 presents an overview of the studies reviewed byinjury cause (traffic being split into four categories), severitylevel (mortality versus morbidity), country, and type ofrelationship between SES and injury. The majority of thestudies reviewed were conducted in high income countriesand focused on nonfatal outcomes. As the bulk of thosestudies considered boys and girls simultaneously, this aspectwill not be further reviewed in the remaining results.
3.1. Road Traffic Injuries. Road traffic injuries are by far themost studied cause of health disparities in the child injuryfield. The vast majority of these studies are from Europeancountries (26 out of 37 studies), and from Sweden and theUnited Kingdom in particular. Both area- and individual-based studies are represented as well as two multilevel ones.
International Journal of Pediatrics 3
Ta
ble
1:O
verv
iew
ofst
udi
eson
soci
oeco
nom
icdi
spar
itie
sin
child
hoo
din
juri
esby
inju
ryca
use
.
Inju
ryca
use
Seve
rity
outc
ome
Rel
atio
nsh
ipbe
twee
nde
priv
atio
n/
soci
oeco
nom
icdi
sadv
anta
gean
din
jury
a
Stu
dyan
alyt
ical
leve
lN
Mor
talit
y/m
orbi
dity
(n)
Cou
ntr
ies
(n)
Posi
tive
Neg
ativ
eN
one
Traffi
cag
greg
ated
(n=
7)
Indi
vidu
al-l
evel
3M
orta
lity
(2);
Bot
hco
mbi
ned
(1)
Sou
thK
orea
(1);
Swed
en(1
);U
nit
edK
ingd
om(1
)3
Are
a-le
vel
3M
orbi
dity
(2);
Mor
talit
y(2
)A
ust
ralia
(1);
Can
ada
(1);
Un
ited
Kin
gdom
(1)
21
Mu
ltile
vel
1M
orta
lity
(1)
Sou
thK
orea
(1)
1
Pede
stri
an(n=
24)
Indi
vidu
al-
leve
l7
Mor
bidi
ty(4
);M
orta
lity
(3)
Peru
(1);
Swed
en(3
);U
nit
edK
ingd
om(3
)7
Are
a-le
vel
16M
orbi
dity
(13)
;Mor
talit
y(1
);B
oth
com
bin
ed(2
)A
ust
ralia
(1);
Can
ada
(4);
Gre
ece
(1);
Irel
and
(1);
Swed
en(1
);U
nit
edK
ingd
om(7
);U
SA(1
)16
Mu
ltile
vel
1M
orbi
dity
(1)
Swed
en(1
)1
1
Bic
yclis
t(n=
14)
Indi
vidu
al-l
evel
5M
orbi
dity
(3);
Mor
talit
y(2
)Sw
eden
(3);
Un
ited
Kin
gdom
(2)
5
Are
a-le
vel
8M
orbi
dity
(8)
Au
stra
lia(1
);C
anad
a(1
);Ir
elan
d(1
);Sw
eden
(2);
Un
ited
Kin
gdom
(3);
62
Mu
ltile
vel
1M
orbi
dity
(1)
Swed
en(1
)1
Mot
orcy
cle/
mop
ed(n=
5)
Indi
vidu
al-l
evel
2M
orbi
dity
(2)
Swed
en(2
)2
Are
a-le
vel
3M
orbi
dity
(3)
Au
stra
lia(1
);Sw
eden
(2)
12
Mu
ltile
vel
0
Car
occu
pant
(n=
17)
Indi
vidu
al-l
evel
7M
orbi
dity
(6);
Mor
talit
y(1
)Sw
eden
(6);
Un
ited
Kin
gdom
(1)
7
Are
a-le
vel
9M
orbi
dity
(7);
Mor
talit
y(1
);B
oth
com
bin
ed(1
)A
ust
ralia
(1);
Can
ada
(2);
Irel
and
(1);
Swed
en(2
);U
nit
edK
ingd
om(2
);U
SA(1
)7
2
Mu
ltile
vel
1M
orbi
dity
(1)
Swed
en(1
)1
Dro
wni
ng(n=
3)
Indi
vidu
al-l
evel
2M
orta
lity
(1);
Bot
h(1
)B
angl
ades
h(1
);So
uth
Kor
ea(1
)1
1
Are
a-le
vel
0
Mu
ltile
vel
1M
orta
lity
(1)
Sou
thK
orea
(1)
1
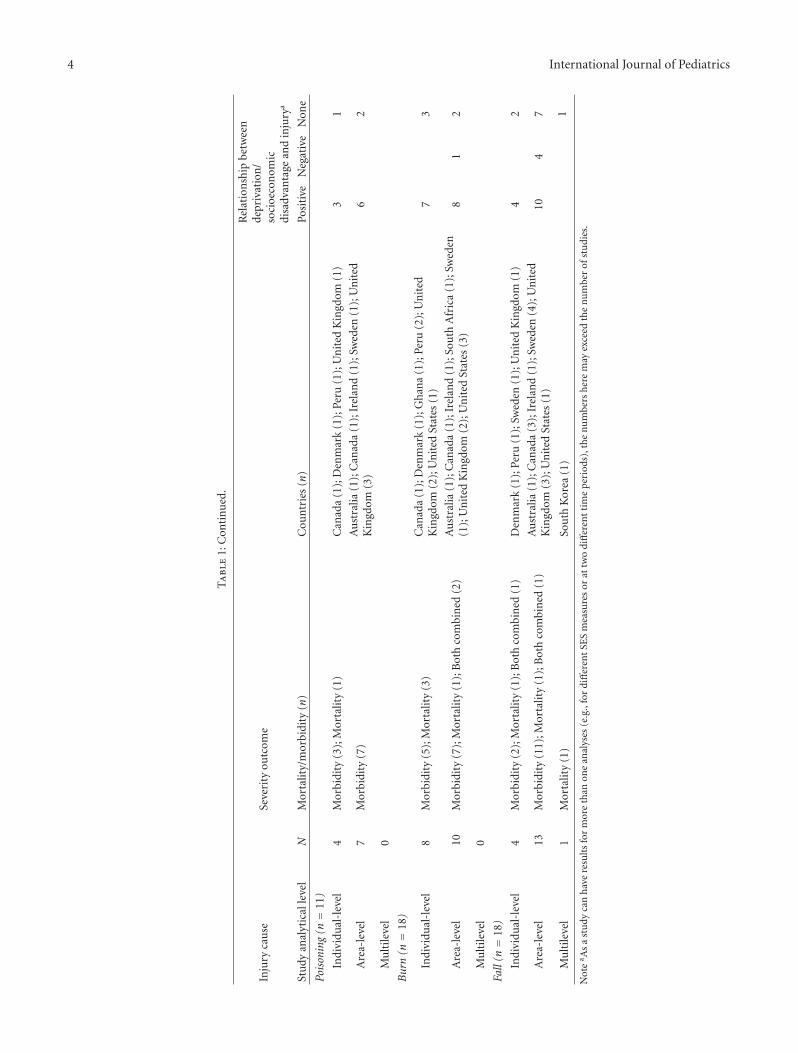
4 International Journal of Pediatrics
Ta
ble
1:C
onti
nu
ed.
Inju
ryca
use
Seve
rity
outc
ome
Rel
atio
nsh
ipbe
twee
nde
priv
atio
n/
soci
oeco
nom
icdi
sadv
anta
gean
din
jury
a
Stu
dyan
alyt
ical
leve
lN
Mor
talit
y/m
orbi
dity
(n)
Cou
ntr
ies
(n)
Posi
tive
Neg
ativ
eN
one
Pois
onin
g(n=
11)
Indi
vidu
al-l
evel
4M
orbi
dity
(3);
Mor
talit
y(1
)C
anad
a(1
);D
enm
ark
(1);
Peru
(1);
Un
ited
Kin
gdom
(1)
31
Are
a-le
vel
7M
orbi
dity
(7)
Au
stra
lia(1
);C
anad
a(1
);Ir
elan
d(1
);Sw
eden
(1);
Un
ited
Kin
gdom
(3)
62
Mu
ltile
vel
0
Bur
n(n=
18)
Indi
vidu
al-l
evel
8M
orbi
dity
(5);
Mor
talit
y(3
)C
anad
a(1
);D
enm
ark
(1);
Gh
ana
(1);
Peru
(2);
Un
ited
Kin
gdom
(2);
Un
ited
Stat
es(1
)7
3
Are
a-le
vel
10M
orbi
dity
(7);
Mor
talit
y(1
);B
oth
com
bin
ed(2
)A
ust
ralia
(1);
Can
ada
(1);
Irel
and
(1);
Sou
thA
fric
a(1
);Sw
eden
(1);
Un
ited
Kin
gdom
(2);
Un
ited
Stat
es(3
)8
12
Mu
ltile
vel
0
Fall
(n=
18)
Indi
vidu
al-l
evel
4M
orbi
dity
(2);
Mor
talit
y(1
);B
oth
com
bin
ed(1
)D
enm
ark
(1);
Peru
(1);
Swed
en(1
);U
nit
edK
ingd
om(1
)4
2
Are
a-le
vel
13M
orbi
dity
(11)
;Mor
talit
y(1
);B
oth
com
bin
ed(1
)A
ust
ralia
(1);
Can
ada
(3);
Irel
and
(1);
Swed
en(4
);U
nit
edK
ingd
om(3
);U
nit
edSt
ates
(1)
104
7
Mu
ltile
vel
1M
orta
lity
(1)
Sou
thK
orea
(1)
1
Not
ea A
sa
stu
dyca
nh
ave
resu
lts
for
mor
eth
anon
ean
alys
es(e
.g.,
for
diff
eren
tSE
Sm
easu
res
orat
two
diff
eren
tti
me
per
iods
),th
en
um
bers
her
em
ayex
ceed
the
nu
mbe
rof
stu
dies
.
International Journal of Pediatrics 5
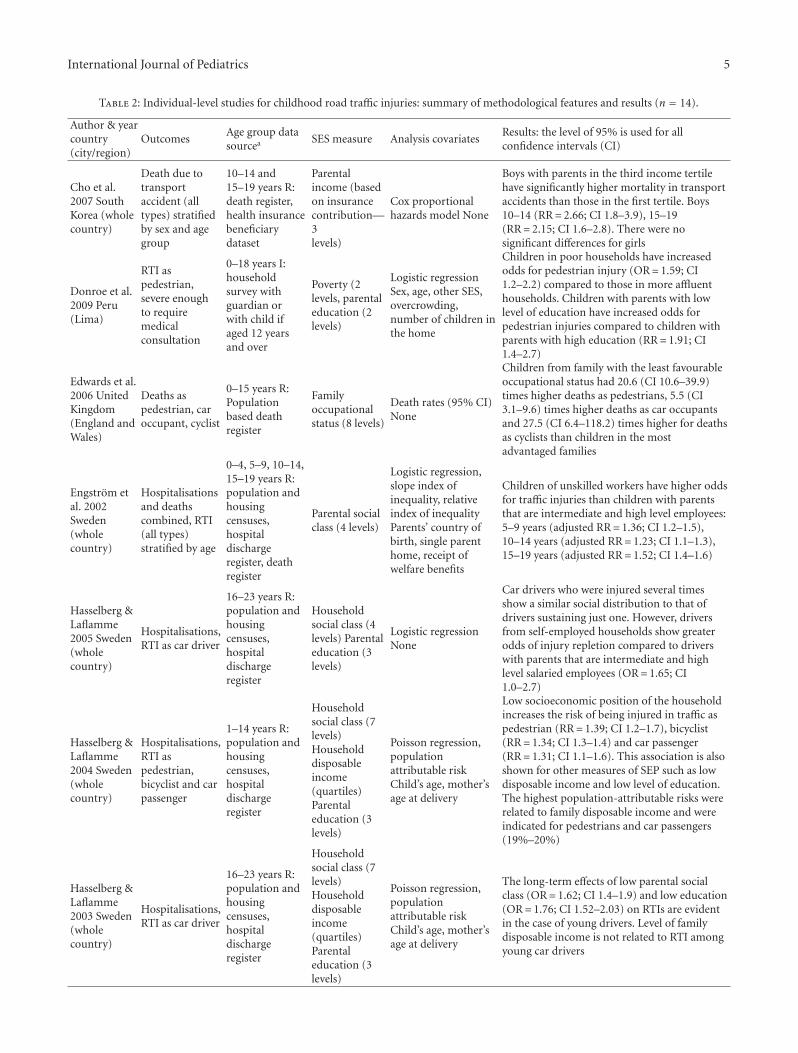
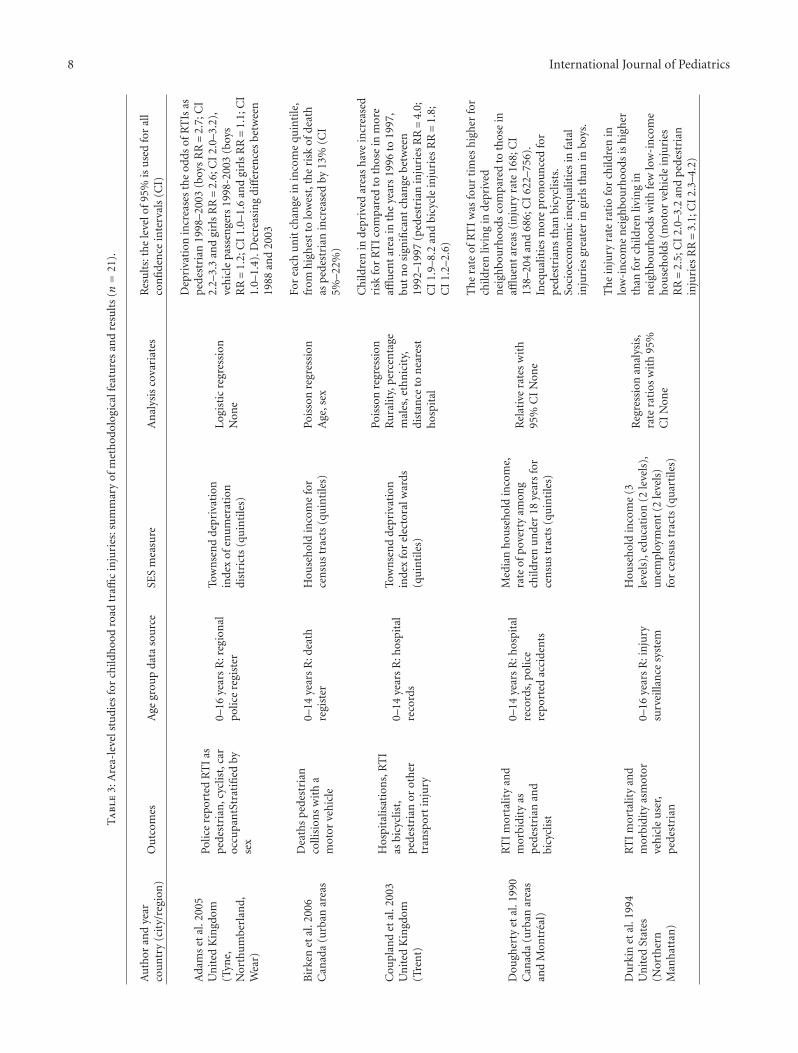
Table 2: Individual-level studies for childhood road traffic injuries: summary of methodological features and results (n = 14).
Author & yearcountry(city/region)
OutcomesAge group datasourcea SES measure Analysis covariates
Results: the level of 95% is used for allconfidence intervals (CI)
Cho et al.2007 SouthKorea (wholecountry)
Death due totransportaccident (alltypes) stratifiedby sex and agegroup
10–14 and15–19 years R:death register,health insurancebeneficiarydataset
Parentalincome (basedon insurancecontribution—3levels)
Cox proportionalhazards model None
Boys with parents in the third income tertilehave significantly higher mortality in transportaccidents than those in the first tertile. Boys10–14 (RR= 2.66; CI 1.8–3.9), 15–19(RR= 2.15; CI 1.6–2.8). There were nosignificant differences for girls
Donroe et al.2009 Peru(Lima)
RTI aspedestrian,severe enoughto requiremedicalconsultation
0–18 years I:householdsurvey withguardian orwith child ifaged 12 yearsand over
Poverty (2levels, parentaleducation (2levels)
Logistic regressionSex, age, other SES,overcrowding,number of children inthe home
Children in poor households have increasedodds for pedestrian injury (OR= 1.59; CI1.2–2.2) compared to those in more affluenthouseholds. Children with parents with lowlevel of education have increased odds forpedestrian injuries compared to children withparents with high education (RR= 1.91; CI1.4–2.7)
Edwards et al.2006 UnitedKingdom(England andWales)
Deaths aspedestrian, caroccupant, cyclist
0–15 years R:Populationbased deathregister
Familyoccupationalstatus (8 levels)
Death rates (95% CI)None
Children from family with the least favourableoccupational status had 20.6 (CI 10.6–39.9)times higher deaths as pedestrians, 5.5 (CI3.1–9.6) times higher deaths as car occupantsand 27.5 (CI 6.4–118.2) times higher for deathsas cyclists than children in the mostadvantaged families
Engstrom etal. 2002Sweden(wholecountry)
Hospitalisationsand deathscombined, RTI(all types)stratified by age
0–4, 5–9, 10–14,15–19 years R:population andhousingcensuses,hospitaldischargeregister, deathregister
Parental socialclass (4 levels)
Logistic regression,slope index ofinequality, relativeindex of inequalityParents’ country ofbirth, single parenthome, receipt ofwelfare benefits
Children of unskilled workers have higher oddsfor traffic injuries than children with parentsthat are intermediate and high level employees:5–9 years (adjusted RR= 1.36; CI 1.2–1.5),10–14 years (adjusted RR= 1.23; CI 1.1–1.3),15–19 years (adjusted RR= 1.52; CI 1.4–1.6)
Hasselberg &Laflamme2005 Sweden(wholecountry)
Hospitalisations,RTI as car driver
16–23 years R:population andhousingcensuses,hospitaldischargeregister
Householdsocial class (4levels) Parentaleducation (3levels)
Logistic regressionNone
Car drivers who were injured several timesshow a similar social distribution to that ofdrivers sustaining just one. However, driversfrom self-employed households show greaterodds of injury repletion compared to driverswith parents that are intermediate and highlevel salaried employees (OR= 1.65; CI1.0–2.7)
Hasselberg &Laflamme2004 Sweden(wholecountry)
Hospitalisations,RTI aspedestrian,bicyclist and carpassenger
1–14 years R:population andhousingcensuses,hospitaldischargeregister
Householdsocial class (7levels)Householddisposableincome(quartiles)Parentaleducation (3levels)
Poisson regression,populationattributable riskChild’s age, mother’sage at delivery
Low socioeconomic position of the householdincreases the risk of being injured in traffic aspedestrian (RR= 1.39; CI 1.2–1.7), bicyclist(RR= 1.34; CI 1.3–1.4) and car passenger(RR= 1.31; CI 1.1–1.6). This association is alsoshown for other measures of SEP such as lowdisposable income and low level of education.The highest population-attributable risks wererelated to family disposable income and wereindicated for pedestrians and car passengers(19%–20%)
Hasselberg &Laflamme2003 Sweden(wholecountry)
Hospitalisations,RTI as car driver
16–23 years R:population andhousingcensuses,hospitaldischargeregister
Householdsocial class (7levels)Householddisposableincome(quartiles)Parentaleducation (3levels)
Poisson regression,populationattributable riskChild’s age, mother’sage at delivery
The long-term effects of low parental socialclass (OR= 1.62; CI 1.4–1.9) and low education(OR= 1.76; CI 1.52–2.03) on RTIs are evidentin the case of young drivers. Level of familydisposable income is not related to RTI amongyoung car drivers
6 International Journal of Pediatrics
Table 2: Continued.
Author & yearcountry(city/region)
OutcomesAge group datasourcea SES measure Analysis covariates
Results: the level of 95% is used for allconfidence intervals (CI)
Hasselberg et al.2001 Sweden(whole country)
Hospitalisations,RTI aspedestrian,bicyclist, mopeduser, mc-user,car driver
2–24 years R:population andhousingcensuses,hospitaldischargeregister
Householdsocial class (7levels)
Logistic regression,populationattributable riskChild’s age, mother’sage at delivery
Children of unskilled workers havehigher odds for injuries as pedestrians(OR= 1.30; CI 1.1–1.5), bicyclists(OR= 1.34; CI 1.3–1.4), moped users(OR= 1.80; CI 1.6–2.0), motorcyclists(OR= 1.80; CI 1.6–2.0) and car drivers(OR= 1.75; CI 1.6–2.0)
Laflamme et al.2004 SwedenStockholmCounty
Hospitalisationsand deathscombined, RTIas protected andunprotectedroad user
0–19 years R:populationhousingcensuses,hospitaldischargeregister
Householdsocioeconomicstatus
Relative index ofinequality,Chi-squared test
Equalisation for older boys as bicycleusers (13–15 years RII= 1.64;0.9–3.0,16–18 years RII= 1.16; CI 0.5–2.7)
Laflamme &Engstrom 2002Sweden (wholecountry)
Hospitalisations,RTI aspedestrian,bicyclist, motorvehiclepassenger,motor vehicledriver
0–4, 5–9, 10–14,15–19 years R:populationhousingcensuses,hospitaldischargeregister
Householdsocioeconomicstatus (4 levels)
Regression analysisSex
Significantly higher odds for children(aged 5–9 and 15–19 years) of unskilledworkers for pedestrian injuries than forthose in higher socioeconomic groups(5–9 years RR= 2.33; CI 1.7–3.1, 15–19years RR1.55; CI 1.2–2.0
Murray 1998Sweden (wholecountry)
Police reportedtraffic accidentsamong youngmotor vehicledrivers
16–22 years R:national roadadministrationdatabase,population andhousing census
Social class (8levels), schoolachievement(based onschool marks intheschool-leavingcertificate)
T-test, difference ofproportions None
The school achievement and schoolattainment were lower among youngpeople involved in injuries compared to asample of young people not involved inRTIs (P < .001)
Roberts 1997UnitedKingdom(England andWales)
Death rates RTI(all types),cyclist andpedestrian in acollision withmotor vehicle
0–15 years R:death register
Social class offather (6 levels)
Poisson regressionNone
Children in social class V are more likelyto suffer traffic accidents compared tothose in social class I (motor vehicleaccidents, OR= 1.11; CI 1.1–1.2, cyclists,OR= 1.30; CI 1.2–1.4, pedestrian,OR= 1.47; CI 1.4–1.5)
Roberts &Power 1996UnitedKingdom(England andWales)
Death rates formotor vehicleaccidents andpedestrianaccidents.
0–15 years R:populationcensuses, deathregister
Social class ofthe father (6levels)
Poisson regressionNone
Children in disadvantaged families havemore RTI in both periods (1979–83 and1989–92) compared to children in moreadvantaged households (P = .001). Thedecline in mortality due to motor vehicleinjuries and pedestrian injuries wassmaller in the manual working class (23%decline; CI 16–28) than in the nonmanualworking class (34% decline; CI 24–43)
Zambon &Hasselberg 2006Sweden (wholecountry)
Police reportedroad trafficcrash as amotorcycledriver
16–23 years R:population andhousing census,hospitaldischargeregister, nationalroadadministrationdatabase
Householdsocial class (5levels)
Logistic regression,populationattributable risk
Low socioeconomic position increasesthe motorcycle injury risk of both minor(OR= 1.66; CI 1.5–1.9) and severe(OR= 1.64; CI 1.3–2.1) outcomes to anequal extent, without giving rise to ahigher risk of severe outcomes
Note aR=register; I=interview; Q=self-administered questionnaire.
International Journal of Pediatrics 7
3.2. All Road Users Combined. Six studies investigated roadtraffic injuries combined for all kinds of road users. All butone study [17] showed a positive relationship between levelof deprivation and road traffic injury [18–23]. A multilevelstudy from South Korea on young children up to 5 yearsshowed that deprivation has a clear positive relationship withmortality by transport-related causes [19]. Another studyfrom South Korea found that transport-related mortalityamong boys, 10–14 and 15–19 years, in families with lowincome were more than twice as high as the mortality amongtheir peers in families with higher income [20]. For girls,however, they did not observe any differences [20]. This ispartly supported by a study from Australia that showed anincreased mortality inequality for motor vehicle accidents forboys, 0–14 and 15–24 years, but for females only in the agegroup 15–24 years [21]. Swedish studies, on the other hand,found a similar social patterning for both sexes [22, 23].
3.3. Pedestrians. Pedestrian injuries are the most studiedtype of transport-related injury. The majority of the studiesare ecological and most of them examined nonfatal injuries.All studies show a positive relationship between individualsocioeconomic disadvantage or deprivation of the living areaand pedestrian injuries [24–45]. One of the studies observedthat the association between deprivation and increasedpedestrian casualties in England is stronger among childrenthan among older age groups [31]. Children in the mostdeprived areas have up to a four times higher risk forpedestrian injuries than children in the least deprived. [31,32] Additional studies from Canada and the US supportthis finding [27, 28, 30]. Similar findings were also reportedin a study from Greece where less wealthy towns havetwice as many pedestrian injuries compared to wealthierones,[37] and in Sweden (Stockholm) where poor areas haveapproximately 90% higher risk than the most affluent areasfor pedestrian injuries [46]. The study from Greece indicatesthat boys are disproportionately disadvantaged regardingpedestrian injuries when they reside in less wealthy towns[37].
3.4. Bicyclists. Individual-based studies from Sweden andthe United Kingdom show that children in families withlow socioeconomic position (measured in terms of parentalsocial class, education or disposable income) are at greaterrisk for bicycle injuries [18, 24, 33, 34, 45]. These findingsare in line with area-based studies from the United Kingdom,[26, 29, 32], Ireland [42] and Canada [27, 30] showing thatchildren from the most deprived areas have significantlyhigher risk for bicycle injuries than their peers from lessdeprived areas. In contrast with this, Swedish area-basedstudies show that contextual socioeconomic attributes ofthe living area are not significant for injuries sustained asbicyclists [46, 47].
3.5. Motorcyclists and Moped Users. Motorcycle injuries wereconsidered only in three studies, two from Sweden andone from Australia. The Swedish studies were based onindividual data and showed a positive relationship between
socioeconomic diadvantage and road traffic injuries asmotorcyclists [24, 48]. These findings are supported by anarea-based study from Australia showing that children inthe most disadvantaged quintile were more likely to behospitalized for motorcycle injuries than children in the leastdisadvantaged quintile [38]. Three Swedish studies focusedseparately on injuries among moped users. One individual-based study showed that children of unskilled workers havesignificantly higher odds for injuries as a moped user ascompared to children of intermediate and high-level salariedemployees [24] On the other hand, two area-based studiesfound that living in areas with higher levels of deprivationreduced the risk for moped injuries [39, 46].
3.6. Car Occupants. Area-based studies from Canada, Aus-tralia and the United Kingdom found that children fromthe most deprived areas have significantly higher risksfor injuries as car occupants than their peers from theleast deprived areas [29, 30, 38]. These results are in linewith a multilevel study from Sweden that showed that,after adjusting for compositional factors, there was stillunexplained area variability for injuries among motorvehicleriders [35]. Individual-based studies from Sweden and theUnited Kingdom showed that young people in the mostdisadvantaged families have an increased risk for injuries asa car driver compared to children in the most advantagedfamilies [24, 34, 49, 50].
3.7. Other Unintentional Injuries. Tables 5 (individual levelstudies), 6 (area level studies) and 7 (multilevel studies)describe the studies that have dealt with causes of injuriesother than road traffic-related ones. As the third column ofeach table indicates, most studies considered several causesat a time (sometimes including RTIs). In the text below, thecause specific results are presented.
3.8. Drowning. Drowning was considered in only threestudies. A study from Bangladesh, based on an individuallevel household survey, found greater socioeconomic dis-advantage was associated with greater drowning mortalityand morbidity among the under five [51]. In South Korea,two national-level studies showed conflicting results [19, 20].One, a multilevel study conducted among small children (0–5 years), found a positive relationship between area-leveldeprivation and risk of drowning, after adjustment for sexand individual level SES variables [19]. Considering olderchildren (10–14 and 15–19 years) and parental income as anindividual level indicator, the other Korean study found noevidence of mortality differences by income level for eithersex or age group [20].
3.9. Poisoning. Of the eleven studies that examined socioe-conomic disparities in poisoning injury, the majority areecological (n = 7) and all but one (England and Wales)[18] examined nonfatal injuries. Except for one from Peru,[43] all were conducted in high-income (mostly European)countries. None compares different age groups.
8 International Journal of Pediatrics
Ta
ble
3:A
rea-
leve
lstu
dies
for
child
hoo
dro
adtr
affic
inju
ries
:su
mm
ary
ofm
eth
odol
ogic
alfe
atu
res
and
resu
lts
(n=
21).
Au
thor
and
year
cou
ntr
y(c
ity/
regi
on)
Ou
tcom
esA
gegr
oup
data
sou
rce
SES
mea
sure
An
alys
isco
vari
ates
Res
ult
s:th
ele
velo
f95%
isu
sed
for
all
con
fide
nce
inte
rval
s(C
I)
Ada
ms
etal
.200
5U
nit
edK
ingd
om(T
yne,
Nor
thu
mbe
rlan
d,W
ear)
Polic
ere
port
edR
TI
aspe
dest
rian
,cyc
list,
car
occu
pan
tStr
atifi
edby
sex
0–16
year
sR
:reg
ion
alpo
lice
regi
ster
Tow
nse
nd
depr
ivat
ion
inde
xof
enu
mer
atio
ndi
stri
cts
(qu
inti
les)
Logi
stic
regr
essi
onN
one
Dep
riva
tion
incr
ease
sth
eod
dsof
RT
Isas
ped
estr
ian
1998
–200
3(b
oys
RR=
2.7;
CI
2.2–
3.3
and
girl
sR
R=
2.6;
CI
2.0–
3.2)
,ve
hic
lepa
ssen
gers
1998
-200
3(b
oys
RR=
1.2;
CI
1.0–
1.6
and
girl
sR
R=
1.1;
CI
1.0–
1.4)
.Dec
reas
ing
diff
eren
ces
betw
een
1988
and
2003
Bir
ken
etal
.200
6C
anad
a(u
rban
area
s
Dea
ths
ped
estr
ian
colli
sion
sw
ith
am
otor
veh
icle
0–14
year
sR
:dea
thre
gist
erH
ouse
hol
din
com
efo
rce
nsu
str
acts
(qu
inti
les)
Pois
son
regr
essi
onA
ge,s
ex
For
each
un
itch
ange
inin
com
equ
inti
le,
from
hig
hes
tto
low
est,
the
risk
ofde
ath
asp
edes
tria
nin
crea
sed
by13
%(C
I5%
–22%
)
Cou
plan
det
al.2
003
Un
ited
Kin
gdom
(Tre
nt)
Hos
pita
lisat
ion
s,R
TI
asbi
cycl
ist,
pede
stri
anor
oth
ertr
ansp
ort
inju
ry
0–14
year
sR
:hos
pita
lre
cord
s
Tow
nse
nd
depr
ivat
ion
inde
xfo
rel
ecto
ralw
ards
(qu
inti
les)
Pois
son
regr
essi
onR
ura
lity,
per
cen
tage
mal
es,e
thn
icit
y,di
stan
ceto
nea
rest
hos
pita
l
Ch
ildre
nin
depr
ived
area
sh
ave
incr
ease
dri
skfo
rR
TI
com
pare
dto
thos
ein
mor
eaffl
uen
tar
eain
the
year
s19
96to
1997
,bu
tn
osi
gnifi
can
tch
ange
betw
een
1992
–199
7(p
edes
tria
nin
juri
esR
R=
4.0;
CI
1.9–
8.2
and
bicy
cle
inju
ries
RR=
1.8;
CI
1.2–
2.6)
Dou
gher
tyet
al.1
990
Can
ada
(urb
anar
eas
and
Mon
trea
l)
RT
Im
orta
lity
and
mor
bidi
tyas
ped
estr
ian
and
bicy
clis
t
0–14
year
sR
:hos
pita
lre
cord
s,po
lice
repo
rted
acci
den
ts
Med
ian
hou
seh
old
inco
me,
rate
ofpo
vert
yam
ong
child
ren
un
der
18ye
ars
for
cen
sus
trac
ts(q
uin
tile
s)
Rel
ativ
era
tes
wit
h95
%C
IN
one
Th
era
teof
RT
Iw
asfo
ur
tim
esh
igh
erfo
rch
ildre
nliv
ing
inde
priv
edn
eigh
bou
rhoo
dsco
mpa
red
toth
ose
inaffl
uen
tar
eas
(in
jury
rate
168;
CI
138–
204
and
686;
CI
622–
756)
.In
equ
alit
ies
mor
epr
onou
nce
dfo
rpe
dest
rian
sth
anbi
cycl
ists
.So
cioe
con
omic
ineq
ual
itie
sin
fata
lin
juri
esgr
eate
rin
girl
sth
anin
boys
.
Du
rkin
etal
.199
4U
nit
edSt
ates
(Nor
ther
nM
anh
atta
n)
RT
Im
orta
lity
and
mor
bidi
tyas
mot
orve
hic
leu
ser,
ped
estr
ian
0–16
year
sR
:in
jury
surv
eilla
nce
syst
em
Hou
seh
old
inco
me
(3le
vels
),ed
uca
tion
(2le
vels
),u
nem
ploy
men
t(2
leve
ls)
for
cen
sus
trac
ts(q
uar
tile
s)
Reg
ress
ion
anal
ysis
,ra
tera
tios
wit
h95
%C
IN
one
Th
ein
jury
rate
rati
ofo
rch
ildre
nin
low
-in
com
en
eigh
bou
rhoo
dsis
hig
her
than
for
child
ren
livin
gin
nei
ghbo
urh
oods
wit
hfe
wlo
w-i
nco
me
hou
seh
olds
(mot
orve
hic
lein
juri
esR
R=
2.5;
CI
2.0–
3.2
and
ped
estr
ian
inju
ries
RR=
3.1;
CI
2.3–
4.2)
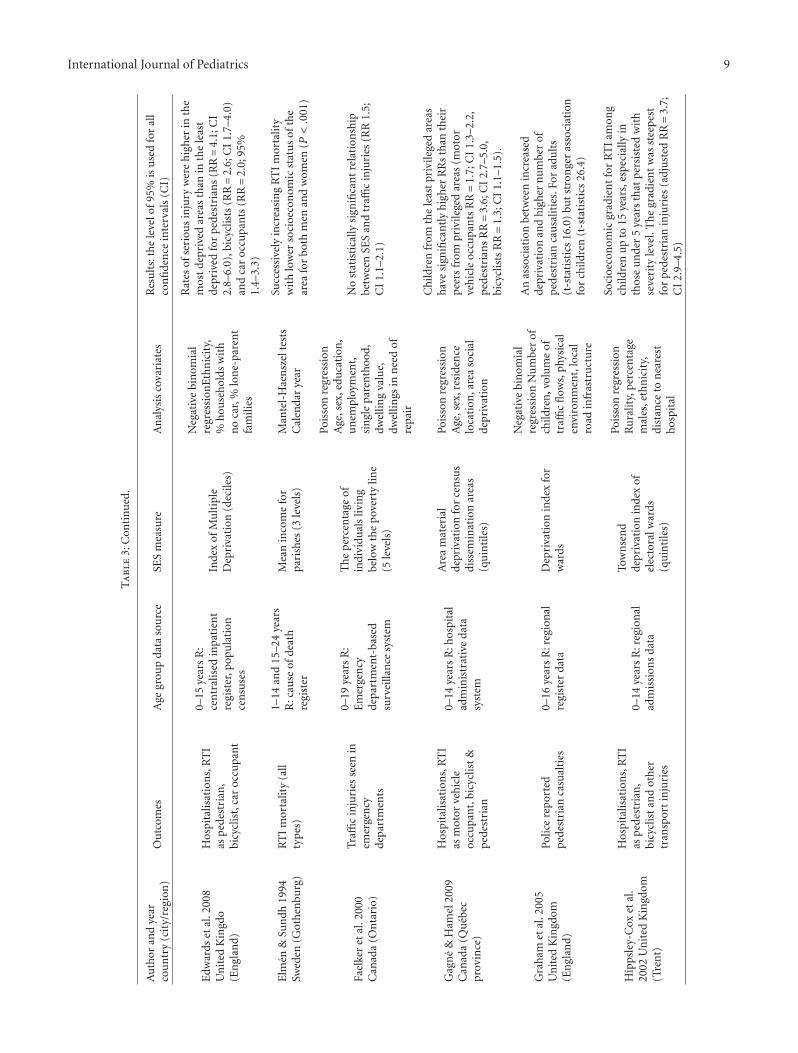
International Journal of Pediatrics 9
Ta
ble
3:C
onti
nu
ed.
Au
thor
and
year
cou
ntr
y(c
ity/
regi
on)
Ou
tcom
esA
gegr
oup
data
sou
rce
SES
mea
sure
An
alys
isco
vari
ates
Res
ult
s:th
ele
velo
f95%
isu
sed
for
all
con
fide
nce
inte
rval
s(C
I)
Edw
ards
etal
.200
8U
nit
edK
ingd
o(E
ngl
and)
Hos
pita
lisat
ion
s,R
TI
asp
edes
tria
n,
bicy
clis
t,ca
roc
cupa
nt
0–15
year
sR
:ce
ntr
alis
edin
pati
ent
regi
ster
,pop
ula
tion
cen
suse
s
Inde
xof
Mu
ltip
leD
epri
vati
on(d
ecile
s)
Neg
ativ
ebi
nom
ial
regr
essi
onE
thn
icit
y,%
hou
seh
olds
wit
hn
oca
r,%
lon
e-pa
ren
tfa
mili
es
Rat
esof
seri
ous
inju
ryw
ere
hig
her
inth
em
ost
depr
ived
area
sth
anin
the
leas
tde
priv
edfo
rp
edes
tria
ns
(RR=
4.1;
CI
2.8–
6.0)
,bic
yclis
ts(R
R=
2.6;
CI
1.7–
4.0)
and
car
occu
pan
ts(R
R=
2.0;
95%
1.4–
3.3)
Elm
en&
Sun
dh19
94Sw
eden
(Got
hen
burg
)R
TI
mor
talit
y(a
llty
pes
)
1–14
and
15–2
4ye
ars
R:c
ause
ofde
ath
regi
ster
Mea
nin
com
efo
rpa
rish
es(3
leve
ls)
Man
tel-
Hae
nsz
elte
sts
Cal
enda
rye
ar
Succ
essi
vely
incr
easi
ng
RT
Im
orta
lity
wit
hlo
wer
soci
oeco
nom
icst
atu
sof
the
area
for
both
men
and
wom
en(P
<.0
01)
Fael
ker
etal
.200
0C
anad
a(O
nta
rio)
Traffi
cin
juri
esse
enin
emer
gen
cyde
part
men
ts
0–19
year
sR
:E
mer
gen
cyde
part
men
t-ba
sed
surv
eilla
nce
syst
em
Th
ep
erce
nta
geof
indi
vidu
als
livin
gbe
low
the
pove
rty
line
(5le
vels
)
Pois
son
regr
essi
onA
ge,s
ex,e
duca
tion
,u
nem
ploy
men
t,si
ngl
epa
ren
thoo
d,dw
ellin
gva
lue,
dwel
lings
inn
eed
ofre
pair
No
stat
isti
cally
sign
ifica
nt
rela
tion
ship
betw
een
SES
and
traffi
cin
juri
es(R
R1.
5;C
I1.
1–2.
1)
Gag
ne
&H
amel
2009
Can
ada
(Qu
ebec
prov
ince
)
Hos
pita
lisat
ion
s,R
TI
asm
otor
veh
icle
occu
pan
t,bi
cycl
ist
&p
edes
tria
n
0–14
year
sR
:hos
pita
lad
min
istr
ativ
eda
tasy
stem
Are
am
ater
ial
depr
ivat
ion
for
cen
sus
diss
emin
atio
nar
eas
(qu
inti
les)
Pois
son
regr
essi
onA
ge,s
ex,r
esid
ence
loca
tion
,are
aso
cial
depr
ivat
ion
Ch
ildre
nfr
omth
ele
ast
priv
ilege
dar
eas
hav
esi
gnifi
can
tly
hig
her
RR
sth
anth
eir
pee
rsfr
ompr
ivile
ged
area
s(m
otor
veh
icle
occu
pan
tsR
R=
1.7;
CI
1.3–
2.2,
ped
estr
ian
sR
R=
3.6;
CI
2.7–
5.0,
bicy
clis
tsR
R=
1.3;
CI
1.1–
1.5)
.
Gra
ham
etal
.200
5U
nit
edK
ingd
om(E
ngl
and)
Polic
ere
port
edp
edes
tria
nca
sual
ties
0–16
year
sR
:reg
ion
alre
gist
erda
taD
epri
vati
onin
dex
for
war
ds
Neg
ativ
ebi
nom
ial
regr
essi
onN
um
ber
ofch
ildre
n,v
olu
me
oftr
affic
flow
s,ph
ysic
alen
viro
nm
ent,
loca
lro
adin
fras
tru
ctu
re
An
asso
ciat
ion
betw
een
incr
ease
dde
priv
atio
nan
dh
igh
ern
um
ber
ofpe
dest
rian
cau
salit
ies.
For
adu
lts
(t-s
tati
stic
s16
.0)
but
stro
nge
ras
soci
atio
nfo
rch
ildre
n(t
-sta
tist
ics
26.4
)
Hip
psle
y-C
oxet
al.
2002
Un
ited
Kin
gdom
(Tre
nt)
Hos
pita
lisat
ion
s,R
TI
asp
edes
tria
n,
bicy
clis
tan
dot
her
tran
spor
tin
juri
es
0–14
year
sR
:reg
ion
alad
mis
sion
sda
ta
Tow
nse
nd
depr
ivat
ion
inde
xof
elec
tora
lwar
ds(q
uin
tile
s)
Pois
son
regr
essi
onR
ura
lity,
per
cen
tage
mal
es,e
thn
icit
y,di
stan
ceto
nea
rest
hos
pita
l
Soci
oeco
nom
icgr
adie
nt
for
RT
Iam
ong
child
ren
up
to15
year
s,es
peci
ally
inth
ose
un
der
5ye
ars
that
per
sist
edw
ith
seve
rity
leve
l.T
he
grad
ien
tw
asst
eepe
stfo
rp
edes
tria
nin
juri
es(a
dju
sted
RR=
3.7;
CI
2.9–
4.5)
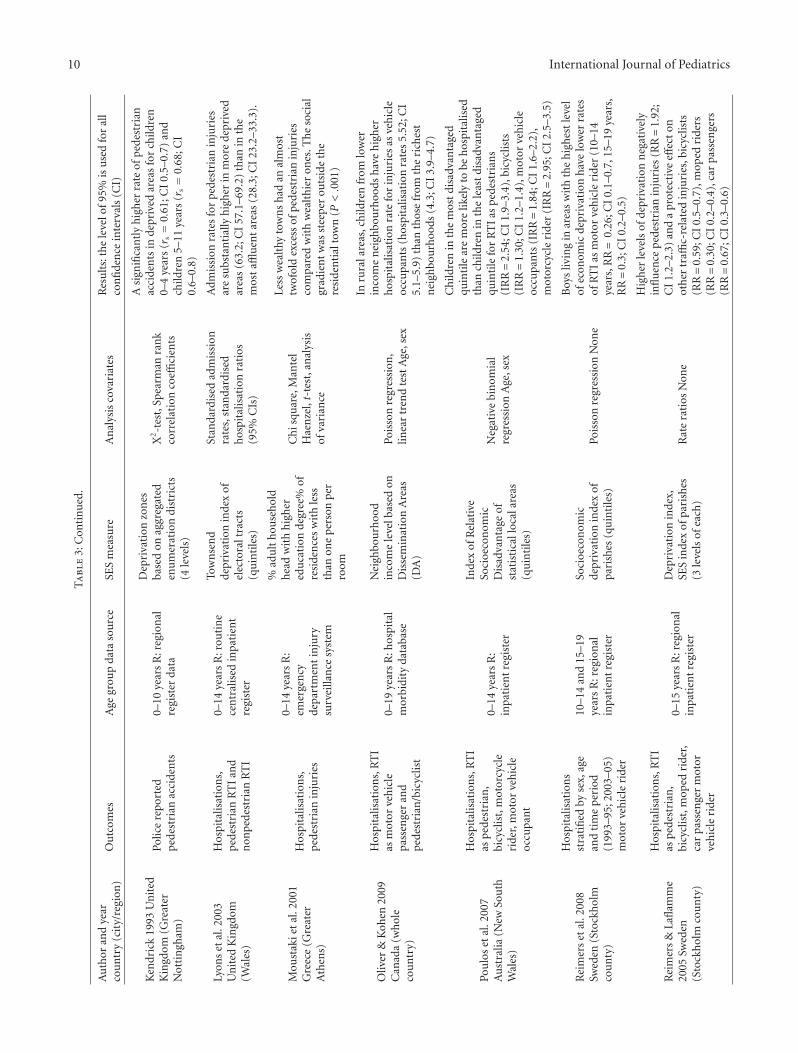
10 International Journal of PediatricsT
abl
e3:
Con
tin
ued
.
Au
thor
and
year
cou
ntr
y(c
ity/
regi
on)
Ou
tcom
esA
gegr
oup
data
sou
rce
SES
mea
sure
An
alys
isco
vari
ates
Res
ult
s:th
ele
velo
f95%
isu
sed
for
all
con
fide
nce
inte
rval
s(C
I)
Ken
dric
k19
93U
nit
edK
ingd
om(G
reat
erN
otti
ngh
am)
Polic
ere
port
edp
edes
tria
nac
cide
nts
0–10
year
sR
:reg
ion
alre
gist
erda
ta
Dep
riva
tion
zon
esba
sed
onag
greg
ated
enu
mer
atio
ndi
stri
cts
(4le
vels
)
X2-t
est,
Spea
rman
ran
kco
rrel
atio
nco
effici
ents
Asi
gnifi
can
tly
hig
her
rate
ofp
edes
tria
nac
cide
nts
inde
priv
edar
eas
for
child
ren
0–4
year
s(r
s=
0.61
;CI
0.5–
0.7)
and
child
ren
5–11
year
s(r
s=
0.68
;CI
0.6–
0.8)
Lyon
set
al.2
003
Un
ited
Kin
gdom
(Wal
es)
Hos
pita
lisat
ion
s,pe
dest
rian
RT
Ian
dn
onpe
dest
rian
RT
I
0–14
year
sR
:rou
tin
ece
ntr
alis
edin
pati
ent
regi
ster
Tow
nse
nd
depr
ivat
ion
inde
xof
elec
tora
ltra
cts
(qu
inti
les)
Stan
dard
ised
adm
issi
onra
tes,
stan
dard
ised
hos
pita
lisat
ion
rati
os(9
5%C
Is)
Adm
issi
onra
tes
for
pede
stri
anin
juri
esar
esu
bsta
nti
ally
hig
her
inm
ore
depr
ived
area
s(6
3.2;
CI
57.1
–69.
2)th
anin
the
mos
taffl
uen
tar
eas
(28.
3;C
I23
.2–3
3.3)
.
Mou
stak
iet
al.2
001
Gre
ece
(Gre
ater
Ath
ens)
Hos
pita
lisat
ion
s,pe
dest
rian
inju
ries
0–14
year
sR
:em
erge
ncy
depa
rtm
ent
inju
rysu
rvei
llan
cesy
stem
%ad
ult
hou
seh
old
hea
dw
ith
hig
her
edu
cati
onde
gree
%of
resi
den
ces
wit
hle
ssth
anon
ep
erso
np
erro
om
Ch
isqu
are,
Man
tel
Hae
nze
l,t-
test
,an
alys
isof
vari
ance
Less
wea
lthy
tow
ns
had
anal
mos
ttw
ofol
dex
cess
ofpe
dest
rian
inju
ries
com
pare
dw
ith
wea
lth
ier
ones
.Th
eso
cial
grad
ien
tw
asst
eepe
rou
tsid
eth
ere
side
nti
alto
wn
(P<.0
01)
Oliv
er&
Koh
en20
09C
anad
a(w
hol
eco
un
try)
Hos
pita
lisat
ion
s,R
TI
asm
otor
veh
icle
pass
enge
ran
dpe
dest
rian
/bic
yclis
t
0–19
year
sR
:hos
pita
lm
orbi
dity
data
base
Nei
ghbo
urh
ood
inco
me
leve
lbas
edon
Dis
sem
inat
ion
Are
as(D
A)
Pois
son
regr
essi
on,
linea
rtr
end
test
Age
,sex
Inru
rala
reas
,ch
ildre
nfr
omlo
wer
inco
me
nei
ghbo
urh
oods
hav
eh
igh
erh
ospi
talis
atio
nra
tefo
rin
juri
esas
veh
icle
occu
pan
ts(h
ospi
talis
atio
nra
tes
5.52
;CI
5.1–
5.9)
than
thos
efr
omth
eri
ches
tn
eigh
bou
rhoo
ds(4
.3;C
I3.
9–4.
7)
Pou
los
etal
.200
7A
ust
ralia
(New
Sou
thW
ales
)
Hos
pita
lisat
ion
s,R
TI
asp
edes
tria
n,
bicy
clis
t,m
otor
cycl
eri
der,
mot
orve
hic
leoc
cupa
nt
0–14
year
sR
:in
pati
ent
regi
ster
Inde
xof
Rel
ativ
eSo
cioe
con
omic
Dis
adva
nta
geof
stat
isti
call
ocal
area
s(q
uin
tile
s)
Neg
ativ
ebi
nom
ial
regr
essi
onA
ge,s
ex
Ch
ildre
nin
the
mos
tdi
sadv
anta
ged
quin
tile
are
mor
elik
ely
tobe
hos
pita
lised
than
child
ren
inth
ele
ast
disa
dvan
tage
dqu
inti
lefo
rR
TI
asp
edes
tria
ns
(IR
R=
2.54
;CI
1.9–
3.4)
,bic
yclis
ts(I
RR=
1.30
;CI
1.2–
1.4)
,mot
orve
hic
leoc
cupa
nts
(IR
R=
1.84
;CI
1.6–
2.2)
,m
otor
cycl
eri
der
(IR
R=
2.95
;CI
2.5–
3.5)
Rei
mer
set
al.2
008
Swed
en(S
tock
hol
mco
un
ty)
Hos
pita
lisat
ion
sst
rati
fied
byse
x,ag
ean
dti
me
per
iod
(199
3–95
;200
3–05
)m
otor
veh
icle
ride
r
10–1
4an
d15
–19
year
sR
:reg
ion
alin
pati
ent
regi
ster
Soci
oeco
nom
icde
priv
atio
nin
dex
ofpa
rish
es(q
uin
tile
s)Po
isso
nre
gres
sion
Non
e
Boy
sliv
ing
inar
eas
wit
hth
eh
igh
est
leve
lof
econ
omic
depr
ivat
ion
hav
elo
wer
rate
sof
RT
Ias
mot
orve
hic
leri
der
(10–
14ye
ars,
RR=
0.26
;CI
0.1–
0.7,
15–1
9ye
ars,
RR=
0.3;
CI
0.2–
0.5)
Rei
mer
s&
Lafl
amm
e20
05Sw
eden
(Sto
ckh
olm
cou
nty
)
Hos
pita
lisat
ion
s,R
TI
asp
edes
tria
n,
bicy
clis
t,m
oped
ride
r,ca
rpa
ssen
ger
mot
orve
hic
leri
der
0–15
year
sR
:reg
ion
alin
pati
ent
regi
ster
Dep
riva
tion
inde
x,SE
Sin
dex
ofpa
rish
es(3
leve
lsof
each
)R
ate
rati
osN
one
Hig
her
leve
lsof
depr
ivat
ion
neg
ativ
ely
infl
uen
cep
edes
tria
nin
juri
es(R
R=
1.92
;C
I1.
2–2.
3)an
da
prot
ecti
veeff
ect
onot
her
traffi
c-re
late
din
juri
es,b
icyc
lists
(RR=
0.59
;CI
0.5–
0.7)
,mop
edri
ders
(RR=
0.30
;CI
0.2–
0.4)
,car
pass
enge
rs(R
R=
0.67
;CI
0.3–
0.6)

International Journal of Pediatrics 11
Ta
ble
3:C
onti
nu
ed.
Au
thor
and
year
cou
ntr
y(c
ity/
regi
on)
Ou
tcom
esA
gegr
oup
data
sou
rce
SES
mea
sure
An
alys
isco
vari
ates
Res
ult
s:th
ele
velo
f95%
isu
sed
for
all
con
fide
nce
inte
rval
s(C
I)
Rei
mer
s&
Lafl
amm
e20
04Sw
eden
(Sto
ckh
olm
cou
nty
)
Hos
pita
lisat
ion
s,R
TI
asbi
cycl
ist,
mop
edri
der
10–1
9ye
ars
R:
rou
tin
ece
ntr
alis
edin
pati
ent
regi
ster
Mat
eria
ldep
riva
tion
,SE
S,an
dm
ult
i-et
hn
icit
yin
dice
sfo
rpa
rish
es(3
leve
lsof
each
)
Logi
stic
regr
essi
onN
one
Boy
sin
area
sw
ith
rela
tive
lyh
igh
erco
nce
ntr
atio
nof
soci
oeco
nom
icpr
ecar
iou
snes
san
dim
mig
ran
tco
nce
ntr
atio
nh
ave
redu
ced
risk
for
RT
Isas
bicy
clis
ts(O
R=
0.4;
CI
0.3–
0.5)
and
mop
edri
ders
(OR=
0.6;
CI
0.5–
0.8)
Silv
ersi
des
etal
.200
5Ir
elan
d(N
orth
and
Wes
tB
elfa
st
Inju
ries
seen
inem
erge
ncy
depa
rtm
ent
RT
Ias
pede
stri
an,b
icyc
list,
car
pass
enge
r
0–12
year
sR
:em
erge
ncy
depa
rtm
ent
regi
ster
Th
eN
oble
econ
omic
depr
ivat
ion
inde
xof
enu
mer
atio
ndi
stri
cts
(2le
vels
–m
ost
vers
us
leas
tde
priv
edar
eas)
Stu
den
t’st-
test
Non
e
Ch
ildre
nliv
ing
wit
hin
the
mos
tde
priv
edar
eas
wer
em
ore
likel
yto
bein
volv
edin
road
traffi
cin
juri
es,p
edes
tria
n(R
R=
1.32
;P<.7
6),b
icyc
le(R
R=
2.43
;P<.2
2),v
ehic
le(R
R=
2.88
;P<.2
3)
Turr
ell&
Mat
her
s20
01A
ust
ralia
(wh
ole
cou
ntr
y)
Mor
talit
ydu
eto
mot
orve
hic
letr
affic
acci
den
t
0–14
,15–
24ye
ars
R:
Dea
thre
gist
er
Inde
xof
rela
tive
soci
oeco
nom
icdi
sadv
anta
gefo
rst
atis
tica
lloc
alar
eas,
Gin
icoe
ffici
ent
Rat
era
tio
wit
h95
%C
I
Ch
ildre
nin
disa
dvan
tage
dar
eas
hav
ein
crea
sed
mor
talit
ydu
eto
mot
orve
hic
leac
cide
nts
for
mal
esin
both
age
grou
ps(0
–14
year
s,R
R=
2.49
;P<.0
01,1
5–24
year
s,R
R=
2.26
;P<.0
01)
and
for
fem
ales
(0–1
4ye
ars,
RR=
1.4;P<.0
01,
15–2
4ye
ars,
RR=
1.83
;P<.0
01)
12 International Journal of Pediatrics
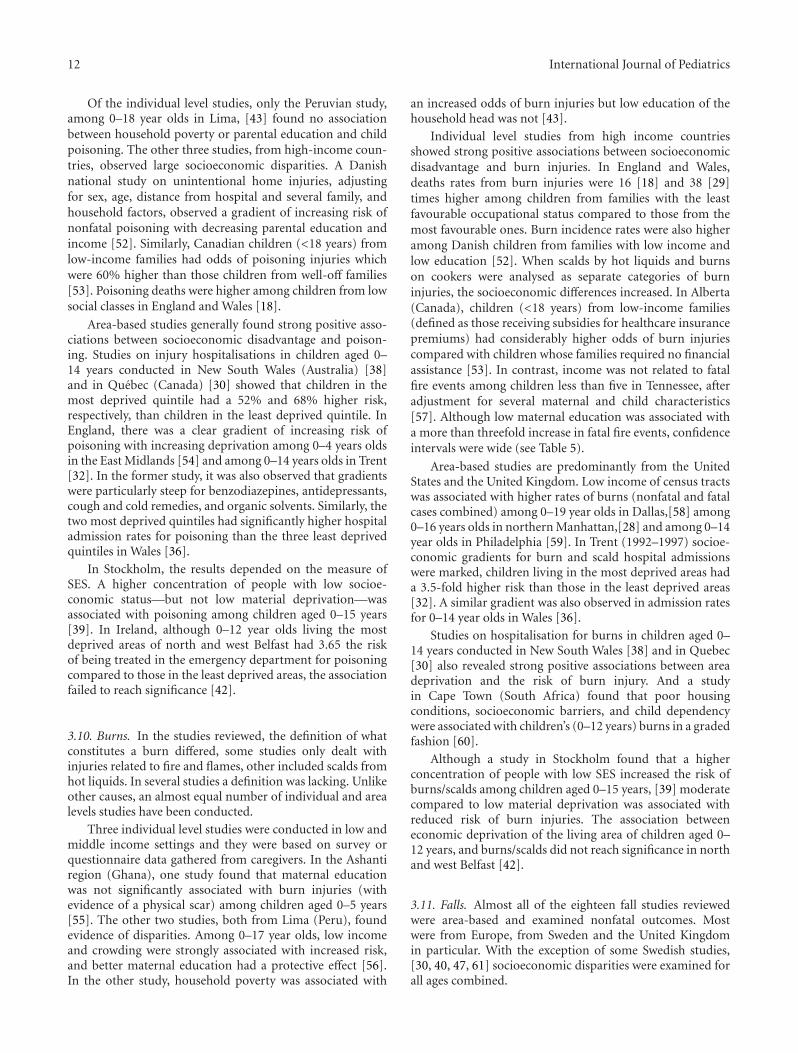
Of the individual level studies, only the Peruvian study,among 0–18 year olds in Lima, [43] found no associationbetween household poverty or parental education and childpoisoning. The other three studies, from high-income coun-tries, observed large socioeconomic disparities. A Danishnational study on unintentional home injuries, adjustingfor sex, age, distance from hospital and several family, andhousehold factors, observed a gradient of increasing risk ofnonfatal poisoning with decreasing parental education andincome [52]. Similarly, Canadian children (<18 years) fromlow-income families had odds of poisoning injuries whichwere 60% higher than those children from well-off families[53]. Poisoning deaths were higher among children from lowsocial classes in England and Wales [18].
Area-based studies generally found strong positive asso-ciations between socioeconomic disadvantage and poison-ing. Studies on injury hospitalisations in children aged 0–14 years conducted in New South Wales (Australia) [38]and in Quebec (Canada) [30] showed that children in themost deprived quintile had a 52% and 68% higher risk,respectively, than children in the least deprived quintile. InEngland, there was a clear gradient of increasing risk ofpoisoning with increasing deprivation among 0–4 years oldsin the East Midlands [54] and among 0–14 years olds in Trent[32]. In the former study, it was also observed that gradientswere particularly steep for benzodiazepines, antidepressants,cough and cold remedies, and organic solvents. Similarly, thetwo most deprived quintiles had significantly higher hospitaladmission rates for poisoning than the three least deprivedquintiles in Wales [36].
In Stockholm, the results depended on the measure ofSES. A higher concentration of people with low socioe-conomic status—but not low material deprivation—wasassociated with poisoning among children aged 0–15 years[39]. In Ireland, although 0–12 year olds living the mostdeprived areas of north and west Belfast had 3.65 the riskof being treated in the emergency department for poisoningcompared to those in the least deprived areas, the associationfailed to reach significance [42].
3.10. Burns. In the studies reviewed, the definition of whatconstitutes a burn differed, some studies only dealt withinjuries related to fire and flames, other included scalds fromhot liquids. In several studies a definition was lacking. Unlikeother causes, an almost equal number of individual and arealevels studies have been conducted.
Three individual level studies were conducted in low andmiddle income settings and they were based on survey orquestionnaire data gathered from caregivers. In the Ashantiregion (Ghana), one study found that maternal educationwas not significantly associated with burn injuries (withevidence of a physical scar) among children aged 0–5 years[55]. The other two studies, both from Lima (Peru), foundevidence of disparities. Among 0–17 year olds, low incomeand crowding were strongly associated with increased risk,and better maternal education had a protective effect [56].In the other study, household poverty was associated with
an increased odds of burn injuries but low education of thehousehold head was not [43].
Individual level studies from high income countriesshowed strong positive associations between socioeconomicdisadvantage and burn injuries. In England and Wales,deaths rates from burn injuries were 16 [18] and 38 [29]times higher among children from families with the leastfavourable occupational status compared to those from themost favourable ones. Burn incidence rates were also higheramong Danish children from families with low income andlow education [52]. When scalds by hot liquids and burnson cookers were analysed as separate categories of burninjuries, the socioeconomic differences increased. In Alberta(Canada), children (<18 years) from low-income families(defined as those receiving subsidies for healthcare insurancepremiums) had considerably higher odds of burn injuriescompared with children whose families required no financialassistance [53]. In contrast, income was not related to fatalfire events among children less than five in Tennessee, afteradjustment for several maternal and child characteristics[57]. Although low maternal education was associated witha more than threefold increase in fatal fire events, confidenceintervals were wide (see Table 5).
Area-based studies are predominantly from the UnitedStates and the United Kingdom. Low income of census tractswas associated with higher rates of burns (nonfatal and fatalcases combined) among 0–19 year olds in Dallas,[58] among0–16 years olds in northern Manhattan,[28] and among 0–14year olds in Philadelphia [59]. In Trent (1992–1997) socioe-conomic gradients for burn and scald hospital admissionswere marked, children living in the most deprived areas hada 3.5-fold higher risk than those in the least deprived areas[32]. A similar gradient was also observed in admission ratesfor 0–14 year olds in Wales [36].
Studies on hospitalisation for burns in children aged 0–14 years conducted in New South Wales [38] and in Quebec[30] also revealed strong positive associations between areadeprivation and the risk of burn injury. And a studyin Cape Town (South Africa) found that poor housingconditions, socioeconomic barriers, and child dependencywere associated with children’s (0–12 years) burns in a gradedfashion [60].
Although a study in Stockholm found that a higherconcentration of people with low SES increased the risk ofburns/scalds among children aged 0–15 years, [39] moderatecompared to low material deprivation was associated withreduced risk of burn injuries. The association betweeneconomic deprivation of the living area of children aged 0–12 years, and burns/scalds did not reach significance in northand west Belfast [42].
3.11. Falls. Almost all of the eighteen fall studies reviewedwere area-based and examined nonfatal outcomes. Mostwere from Europe, from Sweden and the United Kingdomin particular. With the exception of some Swedish studies,[30, 40, 47, 61] socioeconomic disparities were examined forall ages combined.
International Journal of Pediatrics 13
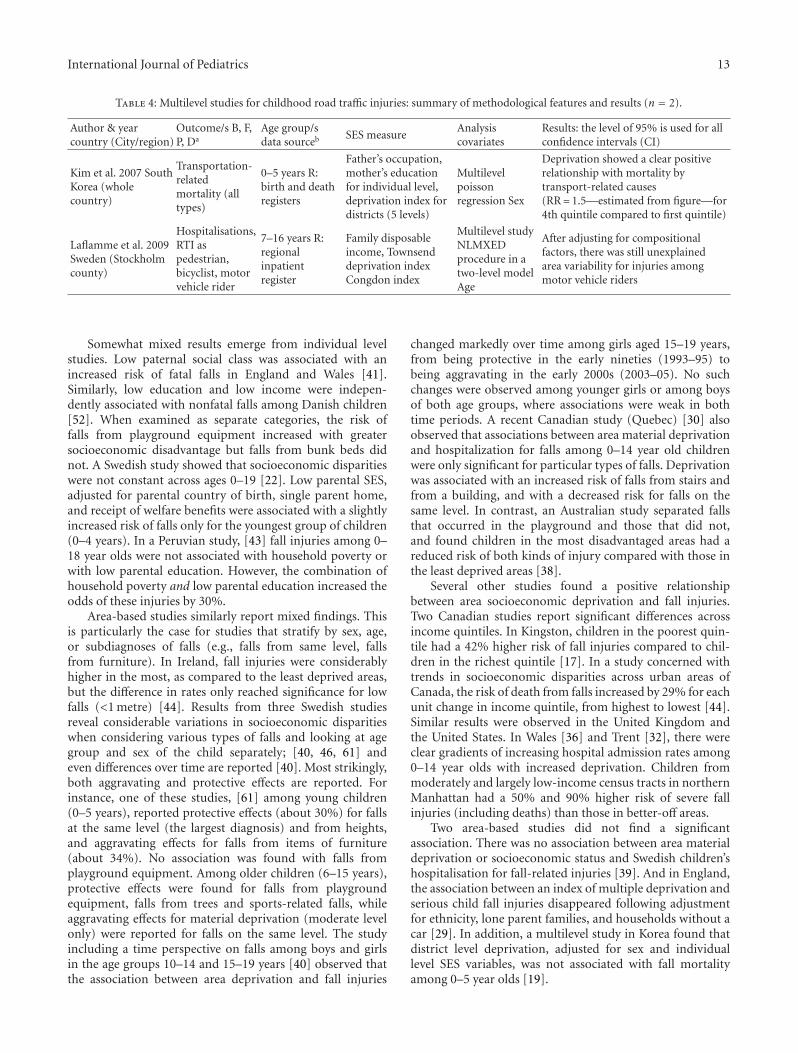
Table 4: Multilevel studies for childhood road traffic injuries: summary of methodological features and results (n = 2).
Author & yearcountry (City/region)
Outcome/s B, F,P, Da
Age group/sdata sourceb SES measure
Analysiscovariates
Results: the level of 95% is used for allconfidence intervals (CI)
Kim et al. 2007 SouthKorea (wholecountry)
Transportation-relatedmortality (alltypes)
0–5 years R:birth and deathregisters
Father’s occupation,mother’s educationfor individual level,deprivation index fordistricts (5 levels)
Multilevelpoissonregression Sex
Deprivation showed a clear positiverelationship with mortality bytransport-related causes(RR= 1.5—estimated from figure—for4th quintile compared to first quintile)
Laflamme et al. 2009Sweden (Stockholmcounty)
Hospitalisations,RTI aspedestrian,bicyclist, motorvehicle rider
7–16 years R:regionalinpatientregister
Family disposableincome, Townsenddeprivation indexCongdon index
Multilevel studyNLMXEDprocedure in atwo-level modelAge
After adjusting for compositionalfactors, there was still unexplainedarea variability for injuries amongmotor vehicle riders
Somewhat mixed results emerge from individual levelstudies. Low paternal social class was associated with anincreased risk of fatal falls in England and Wales [41].Similarly, low education and low income were indepen-dently associated with nonfatal falls among Danish children[52]. When examined as separate categories, the risk offalls from playground equipment increased with greatersocioeconomic disadvantage but falls from bunk beds didnot. A Swedish study showed that socioeconomic disparitieswere not constant across ages 0–19 [22]. Low parental SES,adjusted for parental country of birth, single parent home,and receipt of welfare benefits were associated with a slightlyincreased risk of falls only for the youngest group of children(0–4 years). In a Peruvian study, [43] fall injuries among 0–18 year olds were not associated with household poverty orwith low parental education. However, the combination ofhousehold poverty and low parental education increased theodds of these injuries by 30%.
Area-based studies similarly report mixed findings. Thisis particularly the case for studies that stratify by sex, age,or subdiagnoses of falls (e.g., falls from same level, fallsfrom furniture). In Ireland, fall injuries were considerablyhigher in the most, as compared to the least deprived areas,but the difference in rates only reached significance for lowfalls (<1 metre) [44]. Results from three Swedish studiesreveal considerable variations in socioeconomic disparitieswhen considering various types of falls and looking at agegroup and sex of the child separately; [40, 46, 61] andeven differences over time are reported [40]. Most strikingly,both aggravating and protective effects are reported. Forinstance, one of these studies, [61] among young children(0–5 years), reported protective effects (about 30%) for fallsat the same level (the largest diagnosis) and from heights,and aggravating effects for falls from items of furniture(about 34%). No association was found with falls fromplayground equipment. Among older children (6–15 years),protective effects were found for falls from playgroundequipment, falls from trees and sports-related falls, whileaggravating effects for material deprivation (moderate levelonly) were reported for falls on the same level. The studyincluding a time perspective on falls among boys and girlsin the age groups 10–14 and 15–19 years [40] observed thatthe association between area deprivation and fall injuries
changed markedly over time among girls aged 15–19 years,from being protective in the early nineties (1993–95) tobeing aggravating in the early 2000s (2003–05). No suchchanges were observed among younger girls or among boysof both age groups, where associations were weak in bothtime periods. A recent Canadian study (Quebec) [30] alsoobserved that associations between area material deprivationand hospitalization for falls among 0–14 year old childrenwere only significant for particular types of falls. Deprivationwas associated with an increased risk of falls from stairs andfrom a building, and with a decreased risk for falls on thesame level. In contrast, an Australian study separated fallsthat occurred in the playground and those that did not,and found children in the most disadvantaged areas had areduced risk of both kinds of injury compared with those inthe least deprived areas [38].
Several other studies found a positive relationshipbetween area socioeconomic deprivation and fall injuries.Two Canadian studies report significant differences acrossincome quintiles. In Kingston, children in the poorest quin-tile had a 42% higher risk of fall injuries compared to chil-dren in the richest quintile [17]. In a study concerned withtrends in socioeconomic disparities across urban areas ofCanada, the risk of death from falls increased by 29% for eachunit change in income quintile, from highest to lowest [44].Similar results were observed in the United Kingdom andthe United States. In Wales [36] and Trent [32], there wereclear gradients of increasing hospital admission rates among0–14 year olds with increased deprivation. Children frommoderately and largely low-income census tracts in northernManhattan had a 50% and 90% higher risk of severe fallinjuries (including deaths) than those in better-off areas.
Two area-based studies did not find a significantassociation. There was no association between area materialdeprivation or socioeconomic status and Swedish children’shospitalisation for fall-related injuries [39]. And in England,the association between an index of multiple deprivation andserious child fall injuries disappeared following adjustmentfor ethnicity, lone parent families, and households without acar [29]. In addition, a multilevel study in Korea found thatdistrict level deprivation, adjusted for sex and individuallevel SES variables, was not associated with fall mortalityamong 0–5 year olds [19].
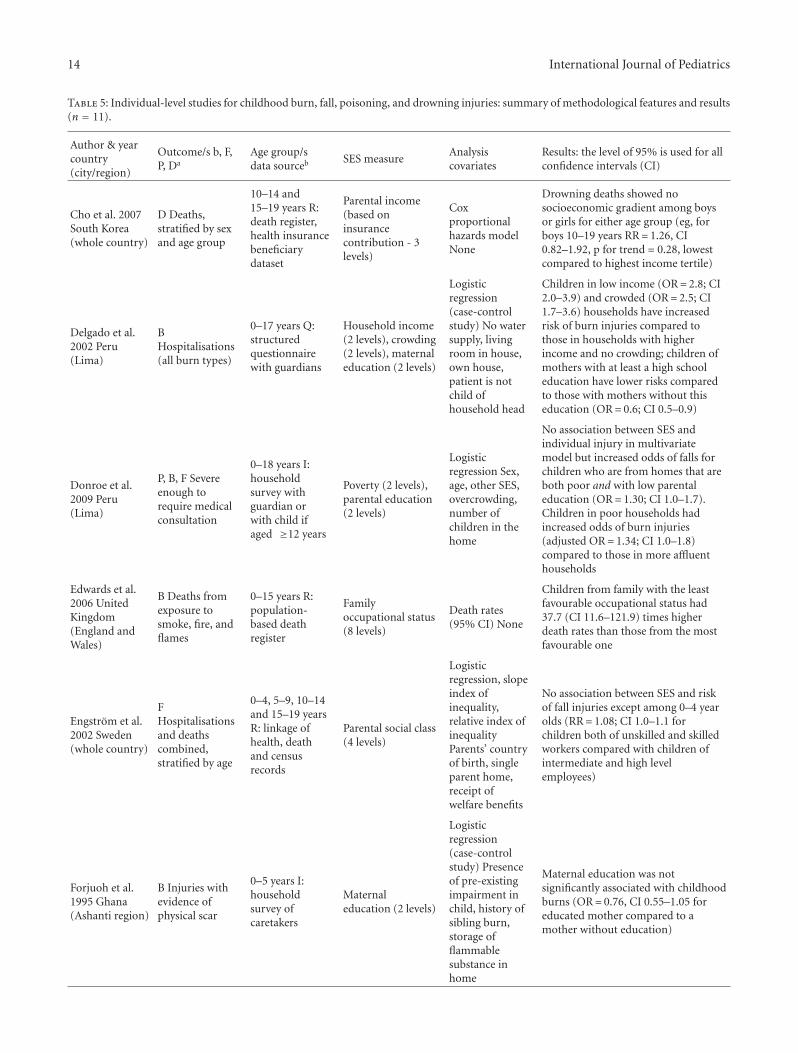
14 International Journal of Pediatrics
Table 5: Individual-level studies for childhood burn, fall, poisoning, and drowning injuries: summary of methodological features and results(n = 11).
Author & yearcountry(city/region)
Outcome/s b, F,P, Da
Age group/sdata sourceb SES measure
Analysiscovariates
Results: the level of 95% is used for allconfidence intervals (CI)
Cho et al. 2007South Korea(whole country)
D Deaths,stratified by sexand age group
10–14 and15–19 years R:death register,health insurancebeneficiarydataset
Parental income(based oninsurancecontribution - 3levels)
Coxproportionalhazards modelNone
Drowning deaths showed nosocioeconomic gradient among boysor girls for either age group (eg, forboys 10–19 years RR= 1.26, CI0.82–1.92, p for trend = 0.28, lowestcompared to highest income tertile)
Delgado et al.2002 Peru(Lima)
BHospitalisations(all burn types)
0–17 years Q:structuredquestionnairewith guardians
Household income(2 levels), crowding(2 levels), maternaleducation (2 levels)
Logisticregression(case-controlstudy) No watersupply, livingroom in house,own house,patient is notchild ofhousehold head
Children in low income (OR= 2.8; CI2.0–3.9) and crowded (OR= 2.5; CI1.7–3.6) households have increasedrisk of burn injuries compared tothose in households with higherincome and no crowding; children ofmothers with at least a high schooleducation have lower risks comparedto those with mothers without thiseducation (OR= 0.6; CI 0.5–0.9)
Donroe et al.2009 Peru(Lima)
P, B, F Severeenough torequire medicalconsultation
0–18 years I:householdsurvey withguardian orwith child ifaged ≥12 years
Poverty (2 levels),parental education(2 levels)
Logisticregression Sex,age, other SES,overcrowding,number ofchildren in thehome
No association between SES andindividual injury in multivariatemodel but increased odds of falls forchildren who are from homes that areboth poor and with low parentaleducation (OR= 1.30; CI 1.0–1.7).Children in poor households hadincreased odds of burn injuries(adjusted OR= 1.34; CI 1.0–1.8)compared to those in more affluenthouseholds
Edwards et al.2006 UnitedKingdom(England andWales)
B Deaths fromexposure tosmoke, fire, andflames
0–15 years R:population-based deathregister
Familyoccupational status(8 levels)
Death rates(95% CI) None
Children from family with the leastfavourable occupational status had37.7 (CI 11.6–121.9) times higherdeath rates than those from the mostfavourable one
Engstrom et al.2002 Sweden(whole country)
FHospitalisationsand deathscombined,stratified by age
0–4, 5–9, 10–14and 15–19 yearsR: linkage ofhealth, deathand censusrecords
Parental social class(4 levels)
Logisticregression, slopeindex ofinequality,relative index ofinequalityParents’ countryof birth, singleparent home,receipt ofwelfare benefits
No association between SES and riskof fall injuries except among 0–4 yearolds (RR= 1.08; CI 1.0–1.1 forchildren both of unskilled and skilledworkers compared with children ofintermediate and high levelemployees)
Forjuoh et al.1995 Ghana(Ashanti region)
B Injuries withevidence ofphysical scar
0–5 years I:householdsurvey ofcaretakers
Maternaleducation (2 levels)
Logisticregression(case-controlstudy) Presenceof pre-existingimpairment inchild, history ofsibling burn,storage offlammablesubstance inhome
Maternal education was notsignificantly associated with childhoodburns (OR= 0.76, CI 0.55–1.05 foreducated mother compared to amother without education)
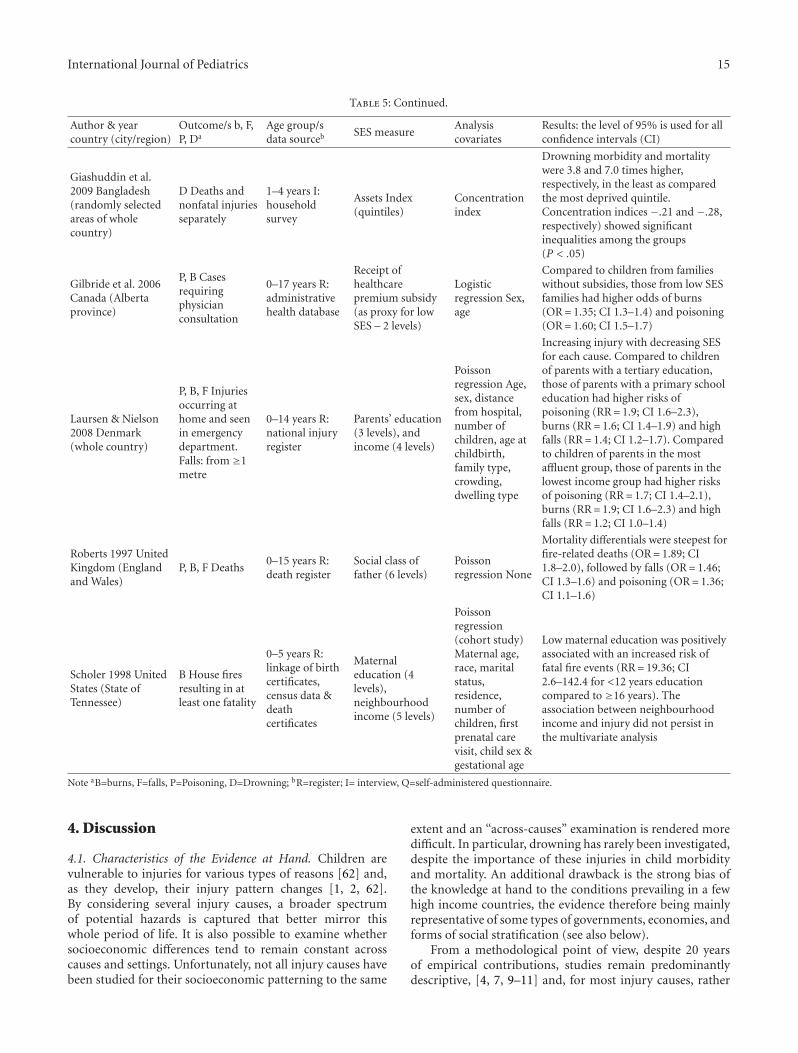
International Journal of Pediatrics 15
Table 5: Continued.
Author & yearcountry (city/region)
Outcome/s b, F,P, Da
Age group/sdata sourceb SES measure
Analysiscovariates
Results: the level of 95% is used for allconfidence intervals (CI)
Giashuddin et al.2009 Bangladesh(randomly selectedareas of wholecountry)
D Deaths andnonfatal injuriesseparately
1–4 years I:householdsurvey
Assets Index(quintiles)
Concentrationindex
Drowning morbidity and mortalitywere 3.8 and 7.0 times higher,respectively, in the least as comparedthe most deprived quintile.Concentration indices −.21 and −.28,respectively) showed significantinequalities among the groups(P < .05)
Gilbride et al. 2006Canada (Albertaprovince)
P, B Casesrequiringphysicianconsultation
0–17 years R:administrativehealth database
Receipt ofhealthcarepremium subsidy(as proxy for lowSES – 2 levels)
Logisticregression Sex,age
Compared to children from familieswithout subsidies, those from low SESfamilies had higher odds of burns(OR= 1.35; CI 1.3–1.4) and poisoning(OR= 1.60; CI 1.5–1.7)
Laursen & Nielson2008 Denmark(whole country)
P, B, F Injuriesoccurring athome and seenin emergencydepartment.Falls: from ≥1metre
0–14 years R:national injuryregister
Parents’ education(3 levels), andincome (4 levels)
Poissonregression Age,sex, distancefrom hospital,number ofchildren, age atchildbirth,family type,crowding,dwelling type
Increasing injury with decreasing SESfor each cause. Compared to childrenof parents with a tertiary education,those of parents with a primary schooleducation had higher risks ofpoisoning (RR= 1.9; CI 1.6–2.3),burns (RR= 1.6; CI 1.4–1.9) and highfalls (RR= 1.4; CI 1.2–1.7). Comparedto children of parents in the mostaffluent group, those of parents in thelowest income group had higher risksof poisoning (RR= 1.7; CI 1.4–2.1),burns (RR= 1.9; CI 1.6–2.3) and highfalls (RR= 1.2; CI 1.0–1.4)
Roberts 1997 UnitedKingdom (Englandand Wales)
P, B, F Deaths0–15 years R:death register
Social class offather (6 levels)
Poissonregression None
Mortality differentials were steepest forfire-related deaths (OR= 1.89; CI1.8–2.0), followed by falls (OR= 1.46;CI 1.3–1.6) and poisoning (OR= 1.36;CI 1.1–1.6)
Scholer 1998 UnitedStates (State ofTennessee)
B House firesresulting in atleast one fatality
0–5 years R:linkage of birthcertificates,census data &deathcertificates
Maternaleducation (4levels),neighbourhoodincome (5 levels)
Poissonregression(cohort study)Maternal age,race, maritalstatus,residence,number ofchildren, firstprenatal carevisit, child sex &gestational age
Low maternal education was positivelyassociated with an increased risk offatal fire events (RR= 19.36; CI2.6–142.4 for <12 years educationcompared to ≥16 years). Theassociation between neighbourhoodincome and injury did not persist inthe multivariate analysis
Note aB=burns, F=falls, P=Poisoning, D=Drowning; bR=register; I= interview, Q=self-administered questionnaire.
4. Discussion
4.1. Characteristics of the Evidence at Hand. Children arevulnerable to injuries for various types of reasons [62] and,as they develop, their injury pattern changes [1, 2, 62].By considering several injury causes, a broader spectrumof potential hazards is captured that better mirror thiswhole period of life. It is also possible to examine whethersocioeconomic differences tend to remain constant acrosscauses and settings. Unfortunately, not all injury causes havebeen studied for their socioeconomic patterning to the same
extent and an “across-causes” examination is rendered moredifficult. In particular, drowning has rarely been investigated,despite the importance of these injuries in child morbidityand mortality. An additional drawback is the strong bias ofthe knowledge at hand to the conditions prevailing in a fewhigh income countries, the evidence therefore being mainlyrepresentative of some types of governments, economies, andforms of social stratification (see also below).
From a methodological point of view, despite 20 yearsof empirical contributions, studies remain predominantlydescriptive, [4, 7, 9–11] and, for most injury causes, rather
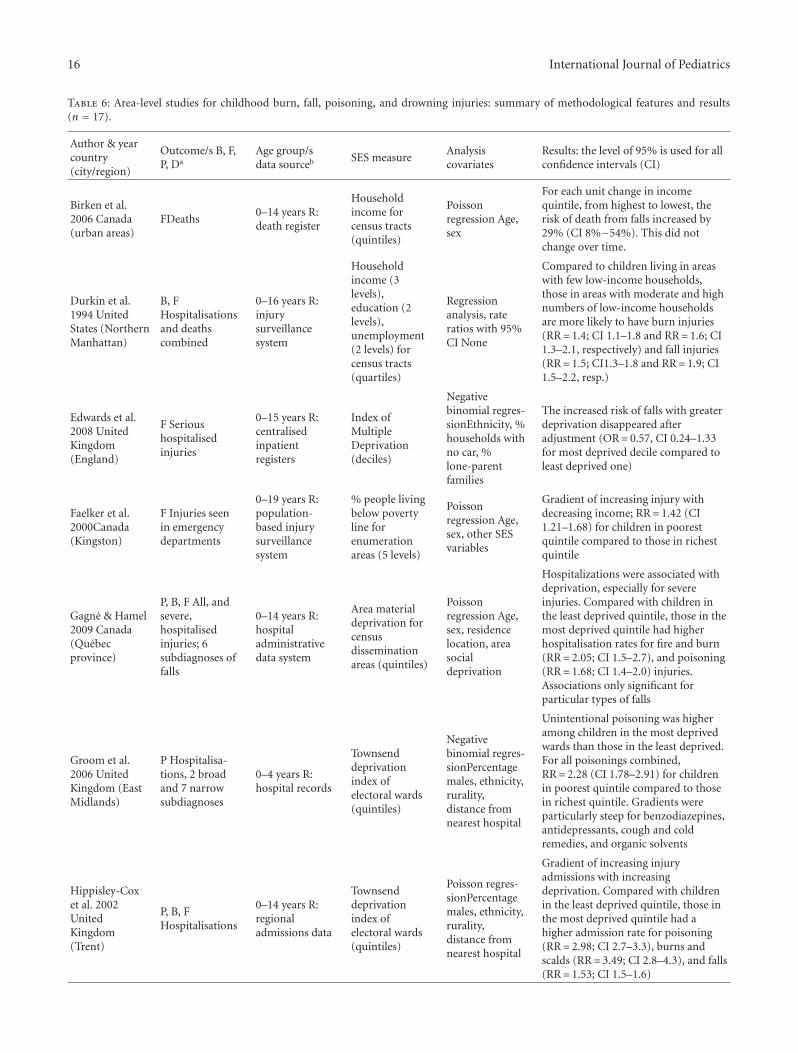
16 International Journal of Pediatrics
Table 6: Area-level studies for childhood burn, fall, poisoning, and drowning injuries: summary of methodological features and results(n = 17).
Author & yearcountry(city/region)
Outcome/s B, F,P, Da
Age group/sdata sourceb SES measure
Analysiscovariates
Results: the level of 95% is used for allconfidence intervals (CI)
Birken et al.2006 Canada(urban areas)
FDeaths0–14 years R:death register
Householdincome forcensus tracts(quintiles)
Poissonregression Age,sex
For each unit change in incomequintile, from highest to lowest, therisk of death from falls increased by29% (CI 8%−54%). This did notchange over time.
Durkin et al.1994 UnitedStates (NorthernManhattan)
B, FHospitalisationsand deathscombined
0–16 years R:injurysurveillancesystem
Householdincome (3levels),education (2levels),unemployment(2 levels) forcensus tracts(quartiles)
Regressionanalysis, rateratios with 95%CI None
Compared to children living in areaswith few low-income households,those in areas with moderate and highnumbers of low-income householdsare more likely to have burn injuries(RR= 1.4; CI 1.1–1.8 and RR= 1.6; CI1.3–2.1, respectively) and fall injuries(RR= 1.5; CI1.3–1.8 and RR= 1.9; CI1.5–2.2, resp.)
Edwards et al.2008 UnitedKingdom(England)
F Serioushospitalisedinjuries
0–15 years R:centralisedinpatientregisters
Index ofMultipleDeprivation(deciles)
Negativebinomial regres-sionEthnicity, %households withno car, %lone-parentfamilies
The increased risk of falls with greaterdeprivation disappeared afteradjustment (OR= 0.57, CI 0.24–1.33for most deprived decile compared toleast deprived one)
Faelker et al.2000Canada(Kingston)
F Injuries seenin emergencydepartments
0–19 years R:population-based injurysurveillancesystem
% people livingbelow povertyline forenumerationareas (5 levels)
Poissonregression Age,sex, other SESvariables
Gradient of increasing injury withdecreasing income; RR= 1.42 (CI1.21–1.68) for children in poorestquintile compared to those in richestquintile
Gagne & Hamel2009 Canada(Quebecprovince)
P, B, F All, andsevere,hospitalisedinjuries; 6subdiagnoses offalls
0–14 years R:hospitaladministrativedata system
Area materialdeprivation forcensusdisseminationareas (quintiles)
Poissonregression Age,sex, residencelocation, areasocialdeprivation
Hospitalizations were associated withdeprivation, especially for severeinjuries. Compared with children inthe least deprived quintile, those in themost deprived quintile had higherhospitalisation rates for fire and burn(RR= 2.05; CI 1.5–2.7), and poisoning(RR= 1.68; CI 1.4–2.0) injuries.Associations only significant forparticular types of falls
Groom et al.2006 UnitedKingdom (EastMidlands)
P Hospitalisa-tions, 2 broadand 7 narrowsubdiagnoses
0–4 years R:hospital records
Townsenddeprivationindex ofelectoral wards(quintiles)
Negativebinomial regres-sionPercentagemales, ethnicity,rurality,distance fromnearest hospital
Unintentional poisoning was higheramong children in the most deprivedwards than those in the least deprived.For all poisonings combined,RR= 2.28 (CI 1.78–2.91) for childrenin poorest quintile compared to thosein richest quintile. Gradients wereparticularly steep for benzodiazepines,antidepressants, cough and coldremedies, and organic solvents
Hippisley-Coxet al. 2002UnitedKingdom(Trent)
P, B, FHospitalisations
0–14 years R:regionaladmissions data
Townsenddeprivationindex ofelectoral wards(quintiles)
Poisson regres-sionPercentagemales, ethnicity,rurality,distance fromnearest hospital
Gradient of increasing injuryadmissions with increasingdeprivation. Compared with childrenin the least deprived quintile, those inthe most deprived quintile had ahigher admission rate for poisoning(RR= 2.98; CI 2.7–3.3), burns andscalds (RR= 3.49; CI 2.8–4.3), and falls(RR= 1.53; CI 1.5–1.6)
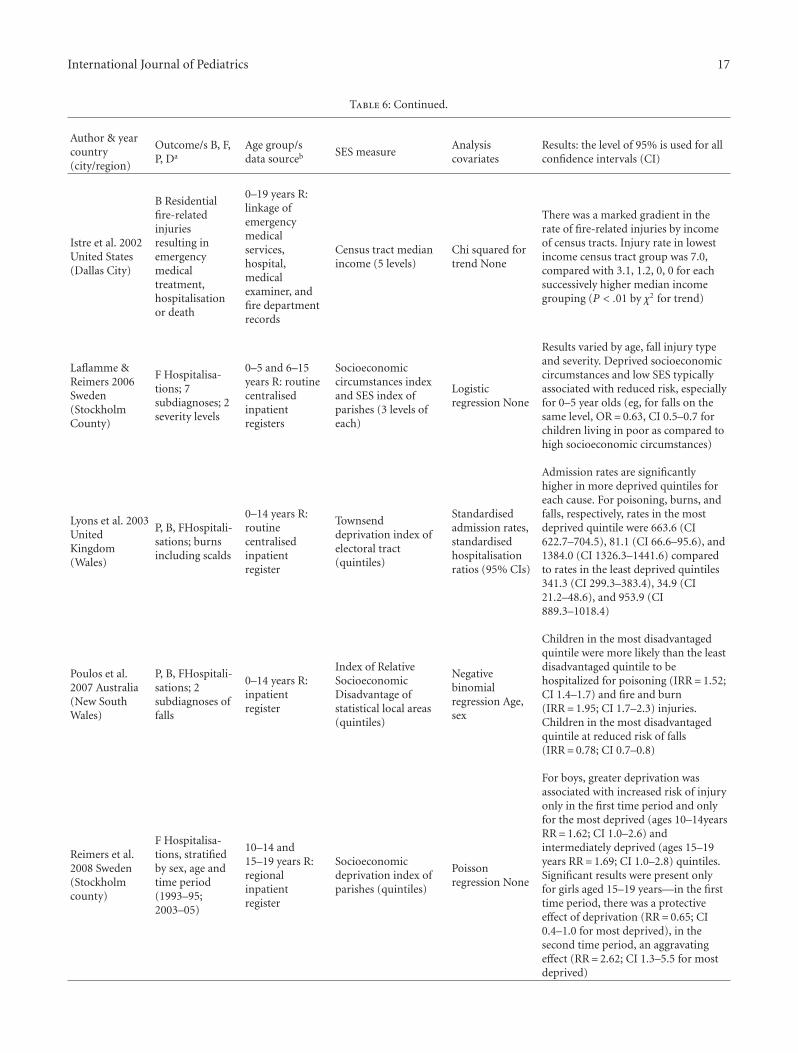
International Journal of Pediatrics 17
Table 6: Continued.
Author & yearcountry(city/region)
Outcome/s B, F,P, Da
Age group/sdata sourceb SES measure
Analysiscovariates
Results: the level of 95% is used for allconfidence intervals (CI)
Istre et al. 2002United States(Dallas City)
B Residentialfire-relatedinjuriesresulting inemergencymedicaltreatment,hospitalisationor death
0–19 years R:linkage ofemergencymedicalservices,hospital,medicalexaminer, andfire departmentrecords
Census tract medianincome (5 levels)
Chi squared fortrend None
There was a marked gradient in therate of fire-related injuries by incomeof census tracts. Injury rate in lowestincome census tract group was 7.0,compared with 3.1, 1.2, 0, 0 for eachsuccessively higher median incomegrouping (P < .01 by χ2 for trend)
Laflamme &Reimers 2006Sweden(StockholmCounty)
F Hospitalisa-tions; 7subdiagnoses; 2severity levels
0–5 and 6–15years R: routinecentralisedinpatientregisters
Socioeconomiccircumstances indexand SES index ofparishes (3 levels ofeach)
Logisticregression None
Results varied by age, fall injury typeand severity. Deprived socioeconomiccircumstances and low SES typicallyassociated with reduced risk, especiallyfor 0–5 year olds (eg, for falls on thesame level, OR= 0.63, CI 0.5–0.7 forchildren living in poor as compared tohigh socioeconomic circumstances)
Lyons et al. 2003UnitedKingdom(Wales)
P, B, FHospitali-sations; burnsincluding scalds
0–14 years R:routinecentralisedinpatientregister
Townsenddeprivation index ofelectoral tract(quintiles)
Standardisedadmission rates,standardisedhospitalisationratios (95% CIs)
Admission rates are significantlyhigher in more deprived quintiles foreach cause. For poisoning, burns, andfalls, respectively, rates in the mostdeprived quintile were 663.6 (CI622.7–704.5), 81.1 (CI 66.6–95.6), and1384.0 (CI 1326.3–1441.6) comparedto rates in the least deprived quintiles341.3 (CI 299.3–383.4), 34.9 (CI21.2–48.6), and 953.9 (CI889.3–1018.4)
Poulos et al.2007 Australia(New SouthWales)
P, B, FHospitali-sations; 2subdiagnoses offalls
0–14 years R:inpatientregister
Index of RelativeSocioeconomicDisadvantage ofstatistical local areas(quintiles)
Negativebinomialregression Age,sex
Children in the most disadvantagedquintile were more likely than the leastdisadvantaged quintile to behospitalized for poisoning (IRR= 1.52;CI 1.4–1.7) and fire and burn(IRR= 1.95; CI 1.7–2.3) injuries.Children in the most disadvantagedquintile at reduced risk of falls(IRR= 0.78; CI 0.7–0.8)
Reimers et al.2008 Sweden(Stockholmcounty)
F Hospitalisa-tions, stratifiedby sex, age andtime period(1993–95;2003–05)
10–14 and15–19 years R:regionalinpatientregister
Socioeconomicdeprivation index ofparishes (quintiles)
Poissonregression None
For boys, greater deprivation wasassociated with increased risk of injuryonly in the first time period and onlyfor the most deprived (ages 10–14yearsRR= 1.62; CI 1.0–2.6) andintermediately deprived (ages 15–19years RR= 1.69; CI 1.0–2.8) quintiles.Significant results were present onlyfor girls aged 15–19 years—in the firsttime period, there was a protectiveeffect of deprivation (RR= 0.65; CI0.4–1.0 for most deprived), in thesecond time period, an aggravatingeffect (RR= 2.62; CI 1.3–5.5 for mostdeprived)
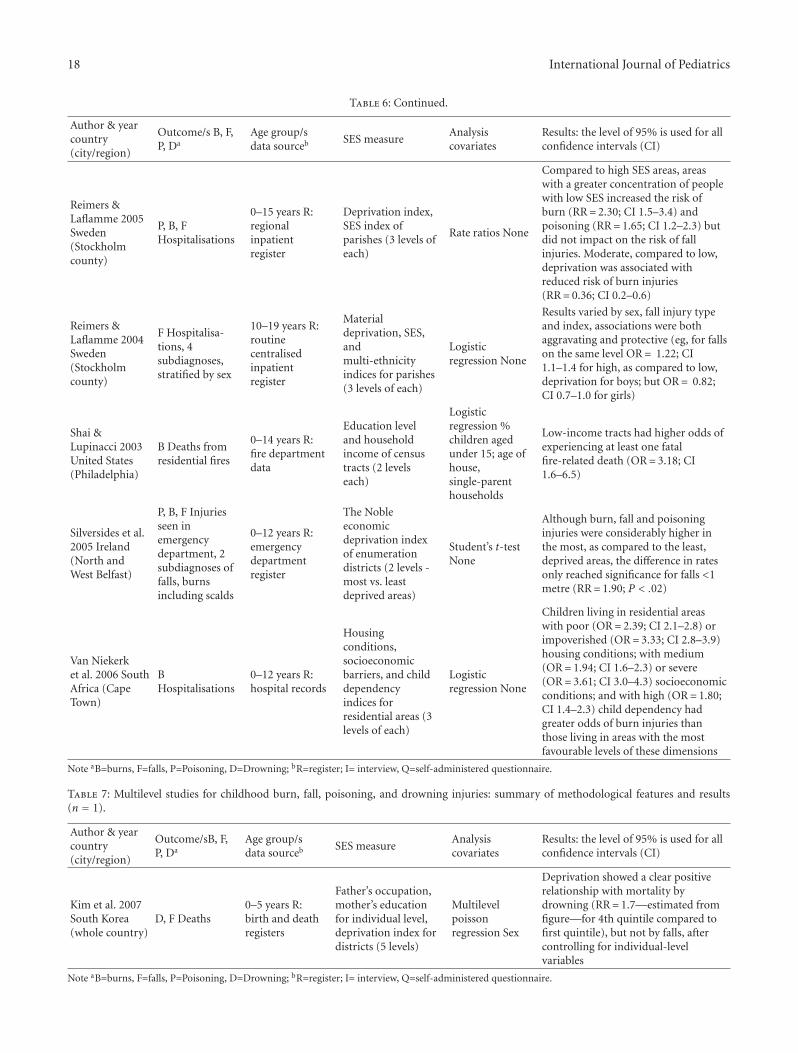
18 International Journal of Pediatrics
Table 6: Continued.
Author & yearcountry(city/region)
Outcome/s B, F,P, Da
Age group/sdata sourceb SES measure
Analysiscovariates
Results: the level of 95% is used for allconfidence intervals (CI)
Reimers &Laflamme 2005Sweden(Stockholmcounty)
P, B, FHospitalisations
0–15 years R:regionalinpatientregister
Deprivation index,SES index ofparishes (3 levels ofeach)
Rate ratios None
Compared to high SES areas, areaswith a greater concentration of peoplewith low SES increased the risk ofburn (RR= 2.30; CI 1.5–3.4) andpoisoning (RR= 1.65; CI 1.2–2.3) butdid not impact on the risk of fallinjuries. Moderate, compared to low,deprivation was associated withreduced risk of burn injuries(RR= 0.36; CI 0.2–0.6)
Reimers &Laflamme 2004Sweden(Stockholmcounty)
F Hospitalisa-tions, 4subdiagnoses,stratified by sex
10–19 years R:routinecentralisedinpatientregister
Materialdeprivation, SES,andmulti-ethnicityindices for parishes(3 levels of each)
Logisticregression None
Results varied by sex, fall injury typeand index, associations were bothaggravating and protective (eg, for fallson the same level OR= 1.22; CI1.1–1.4 for high, as compared to low,deprivation for boys; but OR= 0.82;CI 0.7–1.0 for girls)
Shai &Lupinacci 2003United States(Philadelphia)
B Deaths fromresidential fires
0–14 years R:fire departmentdata
Education leveland householdincome of censustracts (2 levelseach)
Logisticregression %children agedunder 15; age ofhouse,single-parenthouseholds
Low-income tracts had higher odds ofexperiencing at least one fatalfire-related death (OR= 3.18; CI1.6–6.5)
Silversides et al.2005 Ireland(North andWest Belfast)
P, B, F Injuriesseen inemergencydepartment, 2subdiagnoses offalls, burnsincluding scalds
0–12 years R:emergencydepartmentregister
The Nobleeconomicdeprivation indexof enumerationdistricts (2 levels -most vs. leastdeprived areas)
Student’s t-testNone
Although burn, fall and poisoninginjuries were considerably higher inthe most, as compared to the least,deprived areas, the difference in ratesonly reached significance for falls <1metre (RR= 1.90; P < .02)
Van Niekerket al. 2006 SouthAfrica (CapeTown)
BHospitalisations
0–12 years R:hospital records
Housingconditions,socioeconomicbarriers, and childdependencyindices forresidential areas (3levels of each)
Logisticregression None
Children living in residential areaswith poor (OR= 2.39; CI 2.1–2.8) orimpoverished (OR= 3.33; CI 2.8–3.9)housing conditions; with medium(OR= 1.94; CI 1.6–2.3) or severe(OR= 3.61; CI 3.0–4.3) socioeconomicconditions; and with high (OR= 1.80;CI 1.4–2.3) child dependency hadgreater odds of burn injuries thanthose living in areas with the mostfavourable levels of these dimensions
Note aB=burns, F=falls, P=Poisoning, D=Drowning; bR=register; I= interview, Q=self-administered questionnaire.
Table 7: Multilevel studies for childhood burn, fall, poisoning, and drowning injuries: summary of methodological features and results(n = 1).
Author & yearcountry(city/region)
Outcome/sB, F,P, Da
Age group/sdata sourceb SES measure
Analysiscovariates
Results: the level of 95% is used for allconfidence intervals (CI)
Kim et al. 2007South Korea(whole country)
D, F Deaths0–5 years R:birth and deathregisters
Father’s occupation,mother’s educationfor individual level,deprivation index fordistricts (5 levels)
Multilevelpoissonregression Sex
Deprivation showed a clear positiverelationship with mortality bydrowning (RR= 1.7—estimated fromfigure—for 4th quintile compared tofirst quintile), but not by falls, aftercontrolling for individual-levelvariables
Note aB=burns, F=falls, P=Poisoning, D=Drowning; bR=register; I= interview, Q=self-administered questionnaire.
International Journal of Pediatrics 19
than being conducted at the individual level (using measuressuch as maternal or paternal occupation, education, class orincome, and household economy), many studies are area-based (using measures such as neighbourhood deprivation,percentage of low income households, and percentage ofunemployed). The choice of observation unit is also verymuch country-dependant, with many studies from the UKfor instance being area-based while others from Swedenare individual-based. In the case of area-based studies, itcan be argued that, while designs of that kind are regardedas much weaker than individual level ones,[4] contextualand environmental modification (reducing exposure by e.g.,eliminating, modifying, or separating sources of danger)is regarded as a very powerful and effective measure forprimary injury prevention [10]. An earlier review [6] andsubsequent studies [19] also show that the living envi-ronment may play a role in childhood injury causation,independent of individual attributes.
An additional observation is the paucity of studies thatpresent data for boys and girls separately or for different agestrata. This is further discussed below.
4.2. Main Findings. Although differences in studies’ charac-teristics (e.g., method, sample size, setting, and age range)and methodology (e.g., data collection tools, relationshipcharacterization, and injury severity criteria) make compar-isons complicated, a number of observations nonethelessarise. As expected from previous reviews, [4–11] theretend to be substantial socioeconomic disparities in injuriesthroughout childhood and in all major causes of unin-tentional injuries. Interestingly also, the magnitude of thedifferences varies between causes and, within causes, betweencontexts as well as, when considered, between age groups.
4.3. Why is Lower Socioeconomic Status Associated withMore Unintentional Injuries? To explain the very existenceof socioeconomic differences in injuries, the notion of“fundamental causes” is useful [63]. The fundamental causestheory suggests that a range of resources susceptible toprotect one’s health and safety are socially distributed,implying that people of higher SES hold an advantagein warding off threats to their—and their offspring’s—wellbeing. The theory predicts that SES is more stronglyassociated with health outcomes for which prevention andtreatment measures are known, which largely applies tounintentional injuries [1, 2]. Poverty and material depriva-tion are acknowledged risk factors of child injuries, [1, 2, 7–11, 62] with two broad mechanisms contributing to this.One obvious one is that children from poor families andfrom more deprived areas are more exposed to a widerrange of hazards, [64] what Towner and colleagues call“proximate tier” [9] and others, differential exposure [10,11]. An additional mechanism is that their care provideror themselves lack the means to protect themselves in theirhome or in their community (e.g., the means to afford safeequipments or devices), differential vulnerability [9–11]. Ina recent review, Schwebel and Gaines have summarized thesituation in the following manner: “(. . .) in homes where
financial and temporal resources are limited, both tangible(e.g., smoke alarms, bicycle helments, and outlet covers) andintangible (e.g. parental supervision, parental teaching ofrules about safety) mechanisms to prevent child injury arelacking or inadequate.” ([62, Pages 246-247]) .
4.4. Why Are there Differences in Magnitude and Directionacross Studies? The theory of “fundamental causes” alsopredicts that the strength of the association between socioe-conomic status and health would vary across countries (orsettings) depending on how any given country (or setting)compensates for socioeconomic disparities. Compensationcan occur in many different ways that are meaningfulto combat socioeconomic inequality in health and safety.One is through social welfare policies that contribute toenhance either individual social mobility or individual livingcircumstances (e.g., housing and commuting conditions);thereby minimizing exposure in amount and in kind. Onecan also imagine that welfare policies render possible betterequity in care, which in turn can reduce injury lethalityand minimize differential consequences of those injuriessustained.
Child pedestrian injuries for instance are associated withvery steep social gradients in the UK, where only area-basedstudies have been conducted, and with negligible ones inSweden, where studies are predominantly individual-based.It is unclear whether area-based differences would also applyat the individual level in the UK (i.e., the ecological fallacycoming into play). To explain the situation in Sweden,one can mention the existence of “safety-for-all” measures[65, 66] that have long been on the agenda of the Swedishtransport sector (see a discussion in [10, 11]). But it is of notethat equity-oriented measures from outside the transportsector are also very likely to have contributed to buffer thenegative effect of lower SES, minimizing exposure disparitiesbetween socioeconomic groups. Measures with that potentialare for instance employment policies (for both men andwomen) combined with child care services, child accessto recreational environments (other than the street), andlimited distance to and from school for all. The latter reducesboth child exposure to traffic (in duration) and variability ofexposure across living areas.
It is a considerable knowledge gap that so few studieswere conducted in low/middle-income countries where theburden of injuries is far greater. The bulk of the evidenceat hand stems from high-income countries and, very often,countries from northern Europe. This, in combination withthe use of different indicators of SES between studies,impedes our ability to further explore how the currentempirical evidence supports the theory of fundamentalcauses.
Processes like globalisation, urbanisation, motorisation,and environmental change could negatively impact onchild safety and increase differences both between andwithin countries [67]. Additionally, in times of economicdifficulties, as is the case when working on this paper, somefactors are likely to exacerbate socioeconomic disparities.Of note is disturbed parental supervision, [68] previously
20 International Journal of Pediatrics
proposed as an explanation to increased infant mortalitydue to unintentional injuries in metropolitan California intime of economic recession. Also troubling is a reductionin individual insurance, such as that of insured motoristsor house owners and tenants. During a recession, less basicsocietal investment in safety in the form of for example,built-in safety, routine maintenance and reparation, andnon universal/restrictive access to trauma care will putadditional responsibility on individuals who are alreadyunder pressure.
4.5. Age-Based Differences in Socioeconomic Disparities.Whereas the above helps clarifying differences betweensettings or countries, it does not bring much light on age-based differences in disparities within similar settings. It ispossible that in an environment like the home, where smallchildren spend a great share of their time, the vulnerabilitiesinherent to poverty are more detrimental to them (giventheir development process and their dependency on theircaregivers) [2, 9]. As few studies have investigated thematter, it is difficult to draw conclusions. Nonetheless,studies indicate that, for an injury cause as common as falls,disparities are stonger in the younger children than in olderones—or disparities exist only in the young.
Because poverty exacerbates home injury risks in theyoung, it is possible that home safety interventions basedon the uptake of safe practices may not be fully adaptedto the situation of children from lower SES. But there areexamples of home safety education programs that havereached normative improvements—and some significantinjury reductions—even in resource poor households andneighborhoods that can inspire policy and practive [69–71].
West for his part has suggested that a process ofequalisation of socioeconomic differences in injury risksmay arise at school ages and be more pronounced for anumber of health outcomes, among which are unintentionalinjuries (accidents) [72]. West poses that during that periodof life, factors other than family, home background, andneighbourhood (i.e., class-related factors) come into playand counteract the impact of class-related ones; a processof “class-patterning equalisation” occurs [72, 73]. Amongother mechanisms, the school, peer group, and youth culturemay strongly impact on children’s life-style choices andbehaviours) [74–76]. The process would run from childhoodthrough to young adulthood but its impact is expected tobe at a maximum during early youth (in secondary school).Still, according to West, in the case of unintentional injuries,equalisation would be effected by means of similarity inthe activities pursued by young people from different socialbackgrounds in the school and peer-group contexts. To date,there has been very little support in the injury literature forthis representation.
Should further studies of the like be conducted, genderdifferences would definitely need to be taken into account.It is indeed unfortunate that so few studies investigatedwhether socioeconomic disparities are more detrimental toboys than to girls or even, whether sex differences appearhand in hand with the increasing age of the child. Whereas
we have known for a long time that boys have greaterinjury mortality and morbidity than girls, we do not knowhow the factors contributing to those differences are sociallydistributed—biology, cognition, socialization, and exposureopportunity [55].
4.6. Policy Implications—Preventing Injuries and ReducingSocioeconomic Disparities. Poorer chances of survival andpoor health, when generated by social processes to thedetriment of the less well-off, impede basic human rights[65, 66, 77]. Health inequities in child injury can bereduced—and avoided [64]. Sectoral examples of passivesafety dealing with physical exposures show that tacklingmaterial deprivation in the home through better housingconditions,[64, 78] or modifying the traffic environment [64,78–81] can do much to “level up” safety differentials betweenmembers of different social groups. Given that injuries arethe leading cause of death and disability among childrenworldwide, abatement strategies of the like that reduce injuryrisks for all children can only be welcomed.
One could posit that the more the injury cause variesacross socioeconomic groups (the theory of fundamentalcauses applying), the less likely it is that behaviouralinterventions will make a significant contribution to eitherdisparity or global risk reduction [10, 11, 71]. One eloquentexample of the problem arising with behavioural or safepractice campaigns is the case of burn injuries and fires inthe UK where socioeconomic disparities are huge and whereinterventions aiming at the installation of burn detectors inresources-poor areas, even if subsidised, all failed to achievetheir injury reduction goals [82]. The same reasoning couldapply to pedestrian injuries when the preventive measuresput forward rely on enhanced parental supervision [10, 70].
Although numerous interventions have been evaluatedand promoted as effective, few have been conducted thatassess whether those interventions are equally effective inall socioeconomic groups (or areas) or if they help reducedifferences between those groups. In other words, very fewinterventions have been evaluated for their potential inchildhood injury inequality reduction.
Below is a summary of interventions discussed thathave the potential to reduce both injury rates overall andsocioeconomic disparities in injuries. Several of them havebeen discussed in earlier policy documents and reviews [1, 2,9–11, 70, 71]
(i) Safety-oriented legislation or regulation that deter-mines minimum standards and conditions underwhich a number of activities cannot be performed orimposes safe behaviours and practices that would notbe largely adopted on a voluntary basis.
(ii) Level up the safety of the physical environment through“passive” safety measures can be achieved throughengineering and product development. It is a matterof “modifying”, “isolating”, “separating” or “eliminat-ing” the sources of danger.
International Journal of Pediatrics 21
(iii) Community-based prevention programmes that intendto tackle the safety level of communities by com-bining strategies like behavioural and environmentalchanges, in some instances together with enforcinglegislation and subsidies.
(iv) Home safety education and home visit programmesaiming at promoting safe practices in the home andalso for the prevention of both unintentional andintentional injuries.
(v) The creation of attractive places for recreation as thefewer off-street play areas that are offered, the morethe street environment becomes not only an area fortraffic but also one for recreation.
5. Conclusions
The literature on socioeconomic disparities in child injuriesis abundant but reviews are few. By reviewing the literatureon several childhood injury causes, a broader spectrum ofpotential hazards is captured that better mirror this wholeperiod of life. The findings at hand are biased to some causes(especially traffic-related injuries, burns and falls) and somehigh income countries. In the main, they offer support tothe notion that low SES is often greatly detrimental to childsafety. Injuries are highly preventable and socioeconomicdifferences in wealth need not be reflected in differencesin safety. Variations between causes and, within causes,between settings and countries suggest that the preventionof inequities in child safety needs not only that directmechanisms of injuries be tackled but also remote andfundamental ones inherent to poverty.
Acknowledgment
An earlier version of the results, excluding tables and with afocus on the European context was presented in a Europeanmeeting in September 2009 and included in the meetingreport [11].
References
[1] M. Peden, K. Oyegbite, J. Ozanne-Smith, et al., Eds., WorldReport on Child Injury Prevention, World Health Organization,Geneva, Switzerland, 2008.
[2] A. Harvey, E. Towner, M. Peden, H. Soori, and K. Bar-tolomeos, “Injury prevention and the attainment of child andadolescent health,” Bulletin of the World Health Organization,vol. 87, no. 5, pp. 390–394, 2009.
[3] D. Sethi, F. Racioppi, I. Baumgarten, and R. Bertollini,“Reducing inequalities from injuries in Europe,” Lancet, vol.368, no. 9554, pp. 2243–2250, 2006.
[4] L. Laflamme and F. Diderichsen, “Social differences in trafficinjury risks in childhood and youth—a literature review and aresearch agenda,” Injury Prevention, vol. 6, no. 4, pp. 293–298,2000.
[5] G. W. Evans, “The environment of childhood poverty,”American Psychologist, vol. 59, no. 2, pp. 77–92, 2004.
[6] R. Reading, R. Haynes, and E. D. Shenassa, “Neighborhoodinfluences on child injury risk,” Child, Youth, Environments,vol. 15, no. 1, pp. 165–185, 2005.
[7] M. MacKay, D. C. Reid, D. Moher, and T. Klasen, Sys-tematic Review of the Relationship between Childhood Injuryand Socioeconomic Status, CHEO Research Institute, Ottawa,Canada, 1999.
[8] C. S. Birken and C. Macarthur, “Socioeconomic status andinjury risk in children,” Paediatrics and Child Health, vol. 9,no. 5, pp. 323–325, 2004.
[9] E. Towner, T. Dowswell, G. Emington, M. Burkes, and J.Towner, Injuries in Children Aged 0–14 Years and Inequalities,Health Development Agency, London, UK, 2005.
[10] L. Laflamme, M. Hasselberg, and S. Burrows, SocioeconomicDifferences in Injury Risks. A Review of Findings and a Discus-sion of Potential Countermeasures, World Health Organization,Copenhagen, Denmark, 2009.
[11] L. Laflamme, M. Hasselberg, and S. Burrows, “The socialinequalities in health risks related to uninentional injuriesamong children,” in Environment and Health Risks: A Reviewof the Influence and Effects of Social Inequalities, pp. 76–104,2010.
[12] D. Sethi, E. Towner, J. Vincenten, M. Segui-Gomez, and F.Racioppi, European Report on Child Injury Prevention, WorldHealth Organization, Copenhagen, Denmark, 2008.
[13] V. M. Shkolnikov, D. A. Leon, S. Adamets, E. A. Andreev,and A. Deev, “Educational level and adult mortality in Russia:an analysis of routine data 1979 to 1994,” Social Science andMedicine, vol. 47, no. 3, pp. 357–369, 1998.
[14] Y. Fukuda, K. Nakamura, and T. Takano, “Cause-specificmortality differences across socioeconomic position of munic-ipalities in Japan, 1973–1977 and 1993–1998: increasedimportance of injury and suicide in inequality for ages under75,” International Journal of Epidemiology, vol. 34, no. 1, pp.100–109, 2005.
[15] P. Martikainen, T. M. Kauppinen, and T. Valkonen, “Effects ofthe characteristics of neighbourhoods and the characteristicsof people on cause specific mortality: a register based followup study of 252 000 men,” Journal of Epidemiology andCommunity Health, vol. 57, no. 3, pp. 210–217, 2003.
[16] D. W. Lawrence and L. Laflamme, “Using online databasesto find journal articles on injury prevention and safetypromotion research: key journals and the databases that indexthem,” Injury Prevention, vol. 14, no. 2, pp. 91–95, 2008.
[17] T. Faelker, W. Pickett, and R. J. Brison, “Socioeconomic differ-ences in childhood injury: a population based epidemiologicstudy in Ontario, Canada,” Injury Prevention, vol. 6, no. 3, pp.203–208, 2000.
[18] I. Roberts, “Cause specific social class mortality differentialsfor child injury and poisoning in England and Wales,” Journalof Epidemiology and Community Health, vol. 51, no. 3, pp. 334–335, 1997.
[19] M.-H. Kim, S. V. Subramanian, I. Kawachi, and C.-Y. Kim,“Association between childhood fatal injuries and socioeco-nomic position at individual and area levels: a multilevelstudy,” Journal of Epidemiology and Community Health, vol. 61,no. 2, pp. 135–140, 2007.
[20] H.-J. Cho, Y.-H. Khang, S. Yang, S. Harper, and J. W.Lynch, “Socioeconomic differentials in cause-specific mortal-ity among South Korean adolescents,” International Journal ofEpidemiology, vol. 36, no. 1, pp. 50–57, 2007.
[21] G. Turrell and C. Mathers, “Socioeconomic inequalities in all-cause and specific-cause mortality in Australia: 1985–1987 and
22 International Journal of Pediatrics
1995–1997,” International Journal of Epidemiology, vol. 30, no.2, pp. 231–239, 2001.
[22] K. Engstrom, F. Diderichsen, and L. Laflamme, “Socioeco-nomic differences in injury risks in childhood and adoles-cence: a nation-wide study of intentional and unintentionalinjuries in Sweden,” Injury Prevention, vol. 8, no. 2, pp. 137–142, 2002.
[23] H. Elmen and V. Sundh, “Mortality in childhood, youth andearly adulthood, social inequality in a Swedish city,” EuropeanJournal of Public Health, vol. 4, no. 4, pp. 274–280, 1994.
[24] M. Hasselberg, L. Laflamme, and G. Ringback Weitoft,“Socioeconomic differences in road traffic injuries duringchildhood and youth: a closer look at different kinds of roaduser,” Journal of Epidemiology and Community Health, vol. 55,no. 12, pp. 858–862, 2001.
[25] J. Adams, M. White, and P. Heywood, “Time trends insocioeconomic inequalities in road traffic injuries to children,Northumberland and Tyne and Wear 1988–2003,” InjuryPrevention, vol. 11, no. 2, pp. 125–126, 2005.
[26] C. Coupland, J. Hippisley-Cox, D. Kendrick, L. Groom, E.Cross, and B. Savelyich, “Severe traffic injuries to children,Trent, 1992-7: time trend analysis,” British Medical Journal,vol. 327, no. 7415, pp. 593–594, 2003.
[27] G. Dougherty, I. B. Pless, and R. Wilkins, “Social class and theoccurrence of traffic injuries and deaths in urban children,”Canadian Journal of Public Health, vol. 81, no. 3, pp. 204–209,1990.
[28] M. S. Durkin, L. L. Davidson, L. Kuhn, P. O’Connor, andB. Barlow, “Low-income neighborhoods and the risk ofsevere pediatric injury: a small- area analysis in NorthernManhattan,” American Journal of Public Health, vol. 84, no. 4,pp. 587–592, 1994.
[29] P. Edwards, J. Green, K. Lachowycz, C. Grundy, and I. Roberts,“Serious injuries in children: variation by area deprivation andsettlement type,” Archives of Disease in Childhood, vol. 93, no.6, pp. 485–489, 2008.
[30] M. Gagne and D. Hamel, “Deprivation and unintentionalinjury hospitalization in Quebec children,” Chronic Diseases inCanada, vol. 29, no. 2, pp. 56–69, 2009.
[31] D. Graham, S. Glaister, and R. Anderson, “The effects of areadeprivation on the incidence of child and adult pedestriancasualties in England,” Accident Analysis and Prevention, vol.37, no. 1, pp. 125–135, 2005.
[32] J. Hippisley-Cox, L. Groom, D. Kendrick, C. Coupland, E.Webber, and B. Savelyich, “Cross sectional survey of socioe-conomic variations in severity and mechanism of childhoodinjuries in Trent 1992-7,” British Medical Journal, vol. 324, no.7346, pp. 1132–1134, 2002.
[33] M. Hasselberg and L. Laflamme, “Children at risk in traffic:improvement potentials in the Swedish context,” Acta Paedi-atrica, vol. 93, no. 1, pp. 113–119, 2004.
[34] L. Laflamme and K. Engstrom, “Socioeconomic differencesin Swedish children and adolescents injured in road trafficincidents: cross sectional study,” British Medical Journal, vol.324, no. 7334, pp. 396–397, 2002.
[35] D. Kendrick, “Prevention of pedestrian accidents,” Archives ofDisease in Childhood, vol. 68, no. 5, pp. 669–672, 1993.
[36] R. A. Lyons, S. J. Jones, T. Deacon, and M. Heaven, “Socioe-conomic variation in injury in children and older people: apopulation based study,” Injury Prevention, vol. 9, no. 1, pp.33–37, 2003.
[37] M. Moustaki, E. Petridou, and D. Trichopoulos, “Person,time and place coordinates of pedestrian injuries: a study inAthens,” Acta Paediatrica, vol. 90, no. 5, pp. 558–562, 2001.
[38] R. Poulos, A. Hayen, C. Finch, and A. Zwi, “Area socioeco-nomic status and childhood injury morbidity in New SouthWales, Australia,” Injury Prevention, vol. 13, no. 5, pp. 322–327, 2007.
[39] A. Reimers and L. Laflamme, “Neighbourhood social andsocio-economic composition and injury risks,” Acta Paedi-atrica, vol. 94, no. 10, pp. 1488–1494, 2005.
[40] A. Reimers, A. Ponce de Leon, and L. Laflamme, “The area-based social patterning of injuries among 10 to 19 year oldsChanges over time in the Stockholm County,” BMC PublicHealth, vol. 8, article 131, 2008.
[41] I. Roberts and C. Power, “Does the decline in child injurymortality vary by social class? A comparison of class specificmortality in 1981 and 1991,” British Medical Journal, vol. 313,no. 7060, pp. 784–786, 1996.
[42] J. A. Silversides, A. Gibson, J. F. T. Glasgow, R. Mercer, and G.W. Cran, “Social deprivation and childhood injuries in Northand West Belfast,” Ulster Medical Journal, vol. 74, no. 1, pp.22–28, 2005.
[43] J. Donroe, R. H. Gilman, D. Brugge, M. Mwamburi, and D. A.J. Moore, “Falls, poisonings, burns, and road traffic injuries inurban peruvian children and adolescents: a community basedstudy,” Injury Prevention, vol. 15, no. 6, pp. 390–396, 2009.
[44] C. S. Birken, P. C. Parkin, T. To, and C. Macarthur, “Trendsin rates of death from unintentional injury among Canadianchildren in urban areas: influence of socioeconomic status,”Canadian Medical Association Journal, vol. 175, no. 8, pp. 867–868, 2006.
[45] P. Edwards, J. Green, I. Roberts, and S. Lutchmun, “Deathsfrom injury in children and employment status in family:analysis of trends in class specific death rates,” British MedicalJournal, vol. 333, no. 7559, pp. 119–121, 2006.
[46] A. Reimers and L. Laflamme, “Neighborhood social compo-sition and injury risks among pre-adolescent and adolescentboys and girls. A study in Stockholm Metropolitan,” Interna-tional Journal of Adolescent Medicine and Health, vol. 16, no. 3,pp. 215–227, 2004.
[47] L. Laflamme, M. Hasselberg, A.-M. Reimers, L. T. Cavalini,and A. Ponce de Leon, “Social determinants of child andadolescent traffic-related and intentional injuries: a multilevelstudy in Stockholm County,” Social Science and Medicine, vol.68, no. 10, pp. 1826–1834, 2009.
[48] F. Zambon and M. Hasselberg, “Socioeconomic differencesand motorcycle injuries: age at risk and injury severity amongyoung drivers. A Swedish nationwide cohort study,” AccidentAnalysis and Prevention, vol. 38, no. 6, pp. 1183–1189, 2006.
[49] M. Hasselberg and L. Laflamme, “Socioeconomic backgroundand road traffic injuries: a study of young car drivers inSweden,” Traffic Injury Prevention, vol. 4, no. 3, pp. 249–254,2003.
[50] A. Murray, “The home and school background of youngdrivers involved in traffic accidents,” Accident Analysis andPrevention, vol. 30, no. 2, pp. 169–182, 1998.
[51] S. M. Giashuddin, A. Rahman, F. Rahman et al., “Socioeco-nomic inequality in child injury in Bangladesh Implicationfor developing countries,” International Journal for Equity inHealth, vol. 8, article 7, 2009.
[52] B. Laursen and J. W. Nielsen, “Influence of sociodemographicfactors on the risk of unintentional childhood home injuries,”European Journal of Public Health, vol. 18, no. 4, pp. 366–370,2008.
[53] S. J. Gilbride, C. Wild, D. R. Wilson, L. W. Svenson, and D. W.Spady, “Socio-economic status and types of childhood injury
International Journal of Pediatrics 23
in Alberta: a population based study,” BMC Pediatrics, vol. 6,article 30, 2006.
[54] L. Groom, D. Kendrick, C. Coupland, B. Patel, and J.Hippisley-Cox, “Inequalities in hospital admission rates forunintentional poisoning in young children,” Injury Prevention,vol. 12, no. 3, pp. 166–170, 2006.
[55] S. N. Forjuoh, B. Guyer, D. M. Strobino, P. M. Keyl, M.Diener-West, and G. S. Smith, “Risk factors for childhoodburns: a case-control study of Ghanaian children,” Journal ofEpidemiology and Community Health, vol. 49, no. 2, pp. 189–193, 1995.
[56] J. Delgado, M. E. Ramırez-Cardich, R. H. Gilman et al., “Riskfactors for burns in children: crowding, poverty, and poormaternal education,” Injury Prevention, vol. 8, no. 1, pp. 38–41, 2002.
[57] S. J. Scholer, G. B. Hickson, E. F. Mitchel Jr., and W. A.Ray, “Predictors of mortality from fires in young children,”Pediatrics, vol. 101, no. 5, article E12, 1998.
[58] G. R. Istre, M. McCoy, D. K. Carlin, and J. McClain,“Residential fire related deaths and injuries among children:fireplay, smoke alarms, and prevention,” Injury Prevention, vol.8, no. 2, pp. 128–132, 2002.
[59] D. Shai and P. Lupinacci, “Fire fatalities among children:an analysis across Philadelphia’s census tracts,” Public HealthReports, vol. 118, no. 2, pp. 115–126, 2003.
[60] A. Van Niekerk, A. Reimers, and L. Laflamme, “Area character-istics and determinants of hospitalised childhood burn injury:a study in the city of Cape Town,” Public Health, vol. 120, no.2, pp. 115–124, 2006.
[61] L. Laflamme and A. Reimers, “Neighborhood social charac-teristics and fall injuries in children. An area-based study inStockholm County,” Sozial- und Praventivmedizin, vol. 51, no.6, pp. 355–362, 2006.
[62] D. C. Schwebel and J. Gaines, “Pediatric unintentional injury:behavioral risk factors and implications for prevention,”Journal of Developmental and Behavioral Pediatrics, vol. 28, no.3, pp. 245–254, 2007.
[63] A. E. Willson, “’Fundamental causes’ of health disparities:a comparative analysis of Canada and the United States,”International Sociology, vol. 24, no. 1, pp. 93–113, 2009.
[64] L. Laflamme, “Social inequalities in injury risks: knowledgeaccumulated and strategies for the future,” Report 1998:23,National Institute of Public Health, Stockholm, Sweden, 2001.
[65] M. Whitehead and G. Dahlgren, Levelling up (Part I): ADiscussion Paper on Concepts and Principles for Tackling SocialInequities in Health, Coll. Studies on Social and EconomicDeterminants of Population Health, no. 2, World HealthOrganization, Copenhagen, Denmark, 2006.
[66] M. Whitehead and G. Dahlgren, Levelling up (Part II): ADiscussion Paper on European Strategies for Tackling SocialInequities in Health, Coll. Studies on Social and EconomicDeterminants of Population Health, no. 3, World HealthOrganization, Copenhagen, Denmark, 2006.
[67] E. Towner and J. Towner, “Child injury in a changing world,”Global Public Health, vol. 4, no. 4, pp. 403–413, 2009.
[68] T. A. Bruckner, “Metropolitan economic decline and infantmortality due to unintentional injury,” Accident Analysis andPrevention, vol. 40, no. 6, pp. 1797–1803, 2008.
[69] D. Kendrick, C. Coupland, C. Mulvaney et al., “Home safetyeducation and provision of safety equipment for injuryprevention,” Cochrane Database of Systematic Reviews, vol. 24,no. 1, Article ID CD005014, 2007.
[70] T. Dowswell and E. Towner, “Social deprivation and theprevention of unintentional injury in childhood: a systematicreview,” Health Education Research, vol. 17, no. 2, pp. 221–237,2002.
[71] L. Laflamme, D. Sethi, C. Burrows, and M. Hasselberg,Addressing the Socioeconomic Safety Divide: A Policy Briefing,World Health Organization, Copenhagen, Denmark, 2009.
[72] P. West, “Health inequalities in the early years: is thereequalisation in youth?” Social Science and Medicine, vol. 44,no. 6, pp. 833–858, 1997.
[73] P. West and H. Sweeting, “Evidence on equalisation in healthin youth from the West of Scotland,” Social Science andMedicine, vol. 59, no. 1, pp. 13–27, 2004.
[74] S. Feldmann and G. Elliot, At the Threshold—The DevelopingAdolescent, Harvard University Press, Cambridge, Mass, USA,1993.
[75] W. Meeus, M. de Goede, W. Kox, and K. Hurrelmann, Eds.,Adolescence, Careers and Cultures, Walter de Gruyter, Berlin,Germany, 1992.
[76] R. K. Sibereisen and E. Todt, Eds., Adolescence in Context.The Impact of Family, School, Peers, and Work in Adjustment,Springer, New York, NY, USA, 1994.
[77] I. Kawachi, S. V. Subramanian, and N. Almeida-Filho, “Aglossary for health inequalities,” Journal of Epidemiology andCommunity Health, vol. 56, no. 9, pp. 647–652, 2002.
[78] R. Berfenstam, “Prevention of childhood accidents in Sweden.With special attention to the joint committee for preventionof accidents,” Acta Paediatrica Scandinavica, vol. 67, no. 275,pp. 88–95, 1979.
[79] R. Berfenstam, “Sweden’s pioneering child accident pro-gramme: 40 years later,” Injury Prevention, vol. 1, no. 2, pp.68–69, 1995.
[80] S. J. Jones, R. A. Lyons, A. John, and S. R. Palmer, “Trafficcalming policy can reduce inequalities in child pedestrianinjuries: database study,” Injury Prevention, vol. 11, no. 3, pp.152–156, 2005.
[81] J. M. Tester, G. W. Rutherford, Z. Wald, and M. W. Rutherford,“A matched case-control study evaluating the effectiveness ofspeed humps in reducing child pedestrian injuries,” AmericanJournal of Public Health, vol. 94, no. 4, pp. 646–650, 2004.
[82] C. DiGuiseppi, I. Roberts, A. Wade et al., “Incidence of firesand related injuries after giving out free smoke alarms: clusterrandomised controlled trial,” British Medical Journal, vol. 325,no. 7371, pp. 995–997, 2002.

Submit your manuscripts athttp://www.hindawi.com
Hindawi Publishing Corporationhttp://www.hindawi.com Volume 2013
Oxidative Medicine and Cellular Longevity
Hindawi Publishing Corporation http://www.hindawi.com Volume 2013Hindawi Publishing Corporation http://www.hindawi.com Volume 2013
The Scientific World Journal
International Journal of
EndocrinologyHindawi Publishing Corporationhttp://www.hindawi.com
Volume 2013
ISRN Anesthesiology
Hindawi Publishing Corporationhttp://www.hindawi.com Volume 2013
OncologyJournal of
Hindawi Publishing Corporationhttp://www.hindawi.com Volume 2013
PPARRe sea rch
Hindawi Publishing Corporationhttp://www.hindawi.com Volume 2013
OphthalmologyJournal of
Hindawi Publishing Corporationhttp://www.hindawi.com Volume 2013
ISRN Allergy
Hindawi Publishing Corporationhttp://www.hindawi.com Volume 2013
BioMed Research International
Hindawi Publishing Corporationhttp://www.hindawi.com Volume 2013
ObesityJournal of
Hindawi Publishing Corporationhttp://www.hindawi.com Volume 2013
ISRN Addiction
Hindawi Publishing Corporationhttp://www.hindawi.com Volume 2013
Hindawi Publishing Corporationhttp://www.hindawi.com Volume 2013
Computational and Mathematical Methods in Medicine
ISRN AIDS
Hindawi Publishing Corporationhttp://www.hindawi.com Volume 2013
Clinical &DevelopmentalImmunology
Hindawi Publishing Corporationhttp://www.hindawi.com
Volume 2013
Diabetes ResearchJournal of
Hindawi Publishing Corporationhttp://www.hindawi.com Volume 2013
Evidence-Based Complementary and Alternative Medicine
Volume 2013Hindawi Publishing Corporationhttp://www.hindawi.com
Hindawi Publishing Corporationhttp://www.hindawi.com Volume 2013
Gastroenterology Research and Practice
Hindawi Publishing Corporationhttp://www.hindawi.com Volume 2013
ISRN Biomarkers
Hindawi Publishing Corporationhttp://www.hindawi.com Volume 2013
MEDIATORSINFLAMMATION
of