Traffic Crash Injuries and Disabilities - World Bank Documents
260
1 Public Disclosure Authorized Public Disclosure Authorized Public Disclosure Authorized Public Disclosure Authorized
-
Upload
khangminh22 -
Category
Documents
-
view
2 -
download
0
Transcript of Traffic Crash Injuries and Disabilities - World Bank Documents

1
Pub
lic D
iscl
osur
e A
utho
rized
Pub
lic D
iscl
osur
e A
utho
rized
Pub
lic D
iscl
osur
e A
utho
rized
Pub
lic D
iscl
osur
e A
utho
rized

Traffic Crash Injuries and Disabilities: The Burden on Indian Society
© 2021 The World Bank
The study reflects the views of the World Bank and does not necessarily reflect the views of the Governments of the countries covered by the study. The findings of the study would, thus, not be binding on the countries covered by the study.
The boundaries, colours, denominations, and other information shown on any map in this work do not imply any judgment on the part of the World Bank concerning the legal status of any territory or the endorsement or acceptance of such boundaries.
RIGHTS AND PERMISSIONS The material in this work is subject to copyright. Because the World Bank encourages dissemination of its knowledge, this work may be reproduced, in whole or in part, for non-commercial purposes as long as full attribution to this work is given.
Any queries on rights and licenses, including subsidiary rights, should be addressed toWorld Bank Publications, The World Bank Group, 1818 H Street NW, Washington, DC20433, USA; fax: +1 (202) 522 2625; e-mail: [email protected]

3
TRAFFIC CRASH INJURIES AND DISABILITIES: THE BURDEN ON
INDIAN SOCIETY

Traffic Crash Injuries and Disabilities: The Burden on Indian Society

5
FOREWORD
CHAPTER 1 01Executive Summary
CHAPTER 2 09Introduction
CHAPTER 3 15 Research Methodology, Sample Design& Sample Coverage
CHAPTER 4 21Socio-Economic Impact of Road Crashes
CHAPTER 5 53Gendered Impact of Road Crashes
CHAPTER 6 63Psychological and Social Impact of Road Crashes
CHAPTER 7 75Impact of Road Crashes on Adolescents
CHAPTER 8 81Outcomes of the Insurance & Legal Compensation Process
CHAPTER 9 101Interactions with Institutions
CHAPTER 10 107Way Forward
Annexure & Appendix 125
TABLE OF CONTENTS

Traffic Crash Injuries and Disabilities: The Burden on Indian Society
FOREWORD
FO
RE
WO
RD Road crash deaths in India, which are the highest in the
world, are a burden on its demographic dividend and have a tangible impact on poverty. The disproportionate impact can be gauged by the fact that with only 1 percent of world’s vehicles, India accounts for 11 percent of all crash related deaths or expressed different, a crash death happening every four minutes. Crashes on India’s roads claim the lives of about 150,000 people and disable at least an additional 750,000 each year, large share of which are pedestrians and cyclists, mainly representing working age adults from the poorer strata of society.
Traffic literature has confirmed that road crash injuries and deaths have a profound long-term impact on income growth and welfare loss that further constrains the human capacity in emerging economies. A previous macroeconomic study by the World Bank on road safety indicated that reducing road traffic injuries in half could translate into an additional 15 to 22 percent of GDP per capita income growth over 24 years. This means in practice that, for a country like India, failing to meet the UN Sustainable Development Goal target to halving road deaths by 2020—this is, the cost of inaction—accrues to about 2 - 3 percent points in unrealized per capita GDP growth for low- and middle- income countries. More recent work carried out by the India Ministry of Road Transport and Highways (MoRTH) have presented figures that crash costs may be equivalent to 3.14 percent of the national GDP.
The impact of road injuries on economic productivity tells us only part of the story. Aside from their direct impact on

7
the income growth of a country, road traffic injuries also cause individual and social welfare losses that cannot be ignored. The poor in particular are largely vulnerable to the impact of road crashes. In a country like India, pedestrians, bicyclists and motorcyclists who mostly represent the poor income strata of the society also happen to have the least safety protection in the event of a traffic crash. They account for more than half the total road crash deaths. And among those unfortunate ones who are involved in a crash do not have adequate access to medical and social safety net and the burden of the crash is borne not only by the victim but by their entire households and immediate family. Such financial consequences of road traffic crashes and its impact on the poor makes this an impediment towards achieving World Bank’s goal of shared prosperity for the bottom 40 percent of the society.
While policymakers across sectors increasingly recognize road traffic injuries as a socioeconomic burden, there is limited evidence available in India which have purposely quantified the burden of road traffic injuries to the different demographics of the society. The present survey-based study commissioned by the World Bank and implemented by Save LIFE Foundation – a national NGO focused on road safety – presents a novel and unique perspective into this data gap. The results from the study showcase links between poverty, gender, and road user-type by analyzing primary data collected from four states in India – Uttar Pradesh, Bihar, Tamil Nadu and Maharashtra. The novelty of the analysis is, for the first time in India, the disproportionate financial impact due to road crash crashes faced by
low income households has been quantified along with providing insights into interactions of road crash victims and their families with systems, process and institutions like the police, insurance companies, and medical system.
Most importantly, this work reaffirms the importance of looking at road safety as a cross-cutting development issue for India. The emphasis being on improving India’s crash reporting system, post-crash emergency care and protocols, and a proactive insurance and compensation scheme aimed at providing financial relief to the vulnerable sections of the society. Achieving a sustained reduction in road traffic injuries would be a significant milestone for India’s socioeconomic development, with far-reaching benefits for economic growth, wellbeing, and public health.While this is the beginning of the journey, such research and findings would arm policymakers with the knowledge and data they need to design solutions that benefit the poor, create resilient economies, and save millions of lives.
Junaid Kamal AhmadCountry Director, IndiaWorld Bank

Traffic Crash Injuries and Disabilities: The Burden on Indian Society
CH
AP
TE
R 1
EXECUTIVE SUMMARY
• Globally, road crashes kill 1.35 millionpeopleandinjure50 million people every year; or more than 3000 persons every day.
• RoadTrafficInjuries(RTIs)arethe 8th leading cause of death globally and leading cause of death among children and young adults aged 5-29.
• There is ample evidence to suggest that RTIs affect the working age population most severely
ROAD CRASH STATISTICS
GLOBAL

2
Road crashes endanger the lives and livelihoods of millions of road users globally and in India (see Box 1). Owing to the epidemic of road crashes, in 2010, the United Nations General Assembly proclaimed 2011 – 2020 as the “Decade of Action for Road Safety” and the Sustainable Development Goals (SDGs) included two important targets on road safety. The risk of a road crash in low-income countries is three times higher than compared to that in high-income countries. Not only does it lead to untold and unaccounted for suffering and loss for victims and their families, but also, it drains the GDP of countries by claiming millions of economically productive young lives. The World Bank estimates the total cost of Road Traffic Injuries (RTIs) at $172 billion (INR 12.9 lakh crore) for the year 2016. While it is recognized that RTIs affect the developed and developing world in different ways, it also impacts poor households and disadvantaged sections of the population within developing countries differently.
World Bank commissioned a survey-based assessment study in association with the Save LIFE Foundation (SLF) to determine such differential impacts more objectively in India.
This study aims to capture the socioeconomic realities and nuances of road crashes at the sub-national level in India. It seeks to document inter-linkages between poverty, inequalities, road users, and road crash outcomes by analyzing data from four States in India, i.e., Uttar Pradesh, Bihar ,Tamil Nadu and Maharashtra. The four states have been selected on the basis of several criteria including demographic and geographical representation, magnitude of fatality burden and socio-economic parameters such as economic growth, poverty rate and social welfare. One state from each of the four geographical zones of the country were selected which cumulatively represents about one third of
• India tops the world in road crash deaths (WHO,2018), withmore than 400fatalities per day.
• India has 1% of the world’s vehicles but accounts for 11% of all road accident deaths and 6% of total road crashes(MoRTH,2018)
• In the last decade alone, road crashes have killed 1.3 million and injured over 5million in India.
INDIA

Traffic Crash Injuries and Disabilities: The Burden on Indian Society
total road crash deaths in the country. In terms of economic parameters, Maharashtra and Tamil Nadu are selected to represent High Capacity States (HCS) whereas Bihar and Uttar Pradesh are selected to represent Low Capacity States (LCS). The study quantifies the differential financial impact of RTIs on poor disadvantaged households by comparing a test sample of victims and their family members from Low-Income Households (LIH, i.e., the bottom 40% of the population by per capita income) with a control sample of High Income Households (HIH, i.e., the top 10% of the population in terms of per capita income). It also reveals the gendered and psychological impact of crashes, a subject that has been hitherto unacknowledged in previous studies. It sheds light on the interactions of road crash victims and their families with systems, processes and institutions such as the police, insurance companies and the medical care system at large. Further, this study also captures the level of understanding and awareness of truck drivers on the recently passed Motor Vehicles (Amendment) Act, 2019 and on insurance and compensation in the event of a crash. The study reveals that social hierarchies and realities like class, gender and geographical location largely determine road crash outcomes and the severity of their impact in India. It highlights the nature and extent of the disproportionate impact of road crashes in terms of fatalities and serious injuries among poor and rich households. It elaborates on how socioeconomic inequalities affect households and in turn contribute to widening that gap.
A multi-stage purposive sampling method was used to select the target respondents for this study. The key target groups include road crash victims/their family members who had undergone a serious injury or fatal crash, and truck drivers involved in a crash in the last 15 years (from January 2005 - July 2019). Both exploratory and descriptive research was included. While the quantitative surveys
covered over 2400 interviews with LIH, HIH and truck drivers, the qualitative part of the study included 3 Focus Group Discussions (FGDs) with women in Bihar and Uttar Pradesh and 8 in-depth interviews with adolescents.
Some of the key findings of the report are :
• Overall, the post-crash impact was more severe for LIH in Low Capacity States compared to HIH in High Capacity States.
• The incidence of fatality post-crash is higher among victims from LIH than HIH. As high as 44% of the households in rural areas reported at least one death after a road crash compared to 11.6% of households in urban areas. Similarly, LIH reported twice the numbers of deaths post-crash vis-à-vis HIH. Victims from LIH and rural areas are also twice more likely to suffer a disability after a crash than their HIH counterparts.
• The socio-economic burden of road crashes is disproportionately borne by poor households. The decline in total household income was sharper among LIH (75%) than HIH (54%). The severe impact of decline in income was highest among LIH in rural areas (56%) compared to LIH in urban areas (29.5%) and HIH rural (39.5%), and cases where victims died as well as where victims were males.
• The ability to cope with financial distress post crash was better for HIH than LIH. LIH were three times more likely to seek financial help than HIH. Debt rates were also almost three times higher among LIH compared to HIH. In addition to financial distress, poor households experience a deterioration in their quality
EXECUTIVE SUMMARY

4
of life accompanied by psychological suffering and emotional distress.
• Within households, women bear the brunt of caregiving activities post-crash, leading to a double burden of labour and mental load and exacerbated inequality of opportunities in returning to livelihoods and income generating tasks.
• Inequality in insurance coverage and delay in accessing compensation mars the quick recovery process for LIHs. Insurance coverage was significantly higher among HIH and households in urban areas vis-à-vis LIH and urban areas.
• Information asymmetry and poor awareness of legal compensation among LIH compounds their distress. Only less than a quarter of the LIH victims were aware of the compensation process and insurance clauses; just a handful of the victims availed of government compensation/ex gratia.
• Low rates of insurance coverage and poor awareness related to legal compensation processes among truck drivers. Only a fifth and two-fifths of truck drivers surveyed were covered under medical insurance and life insurance respectively at the time of the crash. Overall, two-thirds of truck drivers were not aware of third-party liability insurance. None of the drivers had applied/benefited from cashless treatment at the hospitals, Solatium Fund for hit and run case or ex-gratia schemes.
The above findings of the report highlight the need for immediate improvements in crash reporting, post-
crash emergency care and protocols, insurance and compensation systems. It presents an opportunity for development agencies working in the sector to prioritise their targets and budgets, and for policymakers and respective State Governments to mandate a complete policy overhaul of the existing system and implement sustainable, solution oriented, inclusive measures to improve their performance on road safety. The report provides related recommendations for policy reform under six key areas as follows:
1. Need for effective institutional mechanisms and awareness building.
There is a need to improve VRU safety especially for LIH in rural areas, who are most at risk in road crashes. There is also a need for the State Governments to ensure greater sensitisation and awareness among stakeholders, especially the police who are often reluctant to file FIRs.
2. Institutionalise post-crash emergency care and make health infrastructure & coverage more accessible & inclusive.
The Central Government should urgently implement the cashless treatment scheme under Section 162(2) of Motor Vehicle (Amendment) Act, 2019, reducing Out-of-Pocket-Expenses for LIH, increasing health insurance coverage and extending its scope to address post-crash disability and mental health effects.
3. Provide a Social Security Net for crash victims from LIH through State Support.
The Central and State Governments should introduce

Traffic Crash Injuries and Disabilities: The Burden on Indian Society
vocational and educational support for victims and their families through community programmes and special schemes for jobs, skilling &education. Comprehensive rehabilitation support also needs to be extended to crash victims especially those with post-crash disabilities.
4. Create an accessible legal framework for availing insurance and compensation for road crash victims.
The Central Government should create schemes to increase insurance coverage and penetration for LIH. Insurance agencies should broaden the scope of insurance policies by including rehabilitation and recovery of crash victims. Since most compensation payments take time to process, under Section 164A of MVAA 2019, the Central Government must make provisions to provide interim compensation to crash victims to provide for immediate relief. The comprehensive coverage of MCTAP needs to be ensured through better mechanisms for effective coordination.
5. Recognize the gendered impact of road crashes and address it through participative governance & special schemes for women
Central and State Governments should incentivize employment opportunities for women affected by road crashes. Steps could include: encouraging small businesses in work from home set up, providing low-interest loans and emergency cash transfers to post-crash turned female-headed households. Women from households who have lost the breadwinners in road crashes should also be automatically enrolled in the State Government’s employment database.
6. Strengthen post-crash support for children and young adults through state support.
State Governments should implement progressive provisions on child road safety under Sections 194B, 129 and 199A of the Motor Vehicles (Amendment) Act, 2019, framing a rigorous policy on child road safety and provide support for children and adolescents affected by road crashes. The State Government should ensure a minimum of three month moratorium on school fees for children impacted by road crashes from LIH.
The report provides detailed recommendations for strengthening institutional agencies to respond to the needs of VRUs and associated households. It lays out suggestions for States to strengthen their institutional capacities, to respond better to the challenges presented by road crashes and improve their performance, and to create efficient mechanisms for LIH to get access to legal and insurance-based compensation after a crash to mitigate their financial burden. These recommendations, if implemented, have the potential to significantly improve the lives of vulnerable road users and to create far-reaching positive road safety outcomes.
This study was initiated during the Covid-19 national lockdown period and has its limitations: it is limited to four States; it covers the financial impact on households for just the treatment period; it does not cover minor injury cases and their impact. It focuses on highlighting the differences in the short-term and long-term, direct and indirect impacts of road crashes on the victims and their households by comparing those having meagre resources and capacities to respond to a road crash (Low Income Households)
EXECUTIVE SUMMARY
6
with those having comparatively more resources and social capital to mitigate a sudden crisis (High Income Households).Additionally, this report was conceptualised as a sub-national study to understand the impact of road crashes from the perspective of specific demographics. Central and State governments to build on this by initiating studies at a more granular level (municipality, census tract or ward levels) to assess the impact of crashes. In addition, the analysis is based on self-reported data from victims and their family members, and as such may be susceptible to associated potential biases, although care has been taken to mitigate this wherever possible. The data has been validated by asking respondents different questions at different points of time and cross-verifying and triangulating the information provided by them through other qualitative methods (that use other data sources such as insurance service providers data, and data from other similar studies etc). Efforts were made to weed out any biases that might have crept into the data thorough quality checks and statistical data validation exercises. Due to the pandemic, the methodology also had to be revised by adopting a mix of face-to-face and telephonic interviews (with shorter questionnaires), and this may somewhat effect as well. It also needs to be stated that this is not a longitudinal study (i.e., looking at long-term impacts of road crashes). As such, this study could be a precursor to follow-on studies on road crash related disabilities to holistically assess its long-term impacts on victims and their households (that are done routinely worldwide). Nevertheless, a baseline mapping of road users via such state-specific assessments can help inform the choice, design, and sequencing of alternative policy options, which in turn can improve the lives of millions of road users in India.
We acknowledge the work being carried out by the Ministry of Road Transport and Highways (MORTH) to improve overall road safety in the country. The Ministry’s annual report on ‘Road Accidents in India’ is a valuable and rich resource for policy makers and researchers alike that provides detailed and comprehensive data on the causes, patterns, types and inter-state and global comparisons of road crashes in the country. Working across the 4Es of road safety, Engineering, Enforcement, Education and Emergency care; the Ministry is undertaking various initiatives that demonstrate its global commitment to reducing road crash fatalities by at least 50% by 2030. One such commendable initiative is the Integrated Road Accidents Database (IRAD) Project under World Bank Assistance that will help capture information in a more unified and holistic manner to facilitate formulation and execution of targeted programs.
The robust framework created by MoRTH for operationalising the MVAA, 2019 will go a long way in empowering states to strengthen their electronic enforcement and monitoring systems, automate and integrate all road safety databases through digitisation, provide speedier assistance to road crash victims, strengthen public transport and improve road user behaviour. We hope that the recommendations offered in this report would also help evolve the subordinate legislation/rules under the MVAA, 2019 to truly make it more inclusive and effective.

Traffic Crash Injuries and Disabilities: The Burden on Indian Society
Overall, the post-crash impact was more severe for LIH in Low Capacity States compared to HIH in High Capacity States.
The socio-economic burden of road crashes is disproportionately borne by poor households. Decline in total household income was sharper among LIH (75%) than HIH (54%). The severe impact of decline in income was highest among LIH in rural areas (56%) compared to LIH in urban areas (29.5%) and HIH rural (39.5%).
The incidence of fatality post-crash is higher among victims from LIH than HIH. As high as 44% of the households in rural areas reported at least one death after a road crash compared to 11.6% of households in urban areas. Similarly, LIH reported over twice the numbers of deaths post-crash vis-à-vis HIH. The risk of a victim undergoing disability after an crash was two times more likely among LIH inrural areas.1
LIH HIH
3
The ability to cope with financial distress post-crash was better for HIH than LIH. LIH were three times more likely to seek financial help than HIH. Debt rates were also almost three times higher among LIH compared to HIH after the crash.
4
In addition to financial distress, poor households experience a deterioration in their quality of life accompanied with psychological su�ering and emotional distress.
5 Within households, it is women who bear the brunt of caregiving activities, leading to a double burden of labour and mental load, exacerbated inequalities of opportunities in returning to livelihoods and income generating tasks.
6
Inequality in insurance coverage and delay in accessing compensation further mars the quick recovery process among LIH households. Insurance coverage was significantly higher among HIH and households in urban areas vis-à-vis LIH urban areas.
7
Information asymmetry and poor awareness on legal compensation among LIH: Only less than a quarter of the LIH victims were aware of the compensation process and insurance clauses. Only a handful of the victims availed government compensation/ex gratia.
8
Low rates of insurance coverage and poor awareness related to legal compensation processes among truck drivers: Overall, 2/3rd of the respondent truck drivers did not file an FIR after the crash. Only 40% of the truck drivers were covered under life insurance and 18% under medical insurance at the time of the crash. Overall, 2/3rd of the truck drivers were not aware of third-party liability insurance. None of the drivers said that they had applied/benefited from cashless treatment at the hospital, solatium fund for hit and run case or ex-gratia schemes.
9
2
54%
75%
OVERALL KEY FINDINGS

8
Overall, the post-crash impact was more severe for LIH in Low Capacity States compared to HIH in High Capacity States.
The socio-economic burden of road crashes is disproportionately borne by poor households. Decline in total household income was sharper among LIH (75%) than HIH (54%). The severe impact of decline in income was highest among LIH in rural areas (56%) compared to LIH in urban areas (29.5%) and HIH rural (39.5%).
The incidence of fatality post-crash is higher among victims from LIH than HIH. As high as 44% of the households in rural areas reported at least one death after a road crash compared to 11.6% of households in urban areas. Similarly, LIH reported over twice the numbers of deaths post-crash vis-à-vis HIH. The risk of a victim undergoing disability after an crash was two times more likely among LIH inrural areas.1
LIH HIH
3
The ability to cope with financial distress post-crash was better for HIH than LIH. LIH were three times more likely to seek financial help than HIH. Debt rates were also almost three times higher among LIH compared to HIH after the crash.
4
In addition to financial distress, poor households experience a deterioration in their quality of life accompanied with psychological su�ering and emotional distress.
5 Within households, it is women who bear the brunt of caregiving activities, leading to a double burden of labour and mental load, exacerbated inequalities of opportunities in returning to livelihoods and income generating tasks.
6
Inequality in insurance coverage and delay in accessing compensation further mars the quick recovery process among LIH households. Insurance coverage was significantly higher among HIH and households in urban areas vis-à-vis LIH urban areas.
7
Information asymmetry and poor awareness on legal compensation among LIH: Only less than a quarter of the LIH victims were aware of the compensation process and insurance clauses. Only a handful of the victims availed government compensation/ex gratia.
8
Low rates of insurance coverage and poor awareness related to legal compensation processes among truck drivers: Overall, 2/3rd of the respondent truck drivers did not file an FIR after the crash. Only 40% of the truck drivers were covered under life insurance and 18% under medical insurance at the time of the crash. Overall, 2/3rd of the truck drivers were not aware of third-party liability insurance. None of the drivers said that they had applied/benefited from cashless treatment at the hospital, solatium fund for hit and run case or ex-gratia schemes.
9
2
54%
75%
OVERALL KEY FINDINGS

Traffic Crash Injuries and Disabilities: The Burden on Indian SocietyPoverty And Social Impact Assessment Of Road Safety Outcomes
As the world navigates through the COVID-19 pandemic, the road crash pandemic continues to fester the socio-economic landscape in India. India tops the world in road crash deaths and injuries. It has 1% of the world’s vehicles but accounts for 11% of all road crash deaths, witnessing 53 road crashes every hour; killing 1 person every 4 minutes. In the last decade, 1.3 million (13 lakh) people have died and another 5 million (50 lakh) have been injured on Indian roads. Furthermore, 76.2% of people who are killed in road crashes are in their prime working-age, i.e. 18 – 45 years (MoRTH, 2018).
Globally, Road Traffic Injuries (RTIs) are the eighth leading cause of death (WHO, 2018). However, the road crash fatality rate is three times higher in low-income countries compared to high-income countries and statistics from India further reinforce this global trend. There is a distinct correlation between socio-economic status and road use patterns in Low- and Middle-Income Countries (LMIC)1 like India - “Poor people are more likely to be involved in a road traffic crash” (GRSP, 2018).
In a country like India, where vulnerable road users are forced to share space with other less vulnerable road users, the income level of an individual has a direct bearing on the mode of transport used. This in turn further determines the level of risk faced by a particular road user. For instance, daily wage workers and workers employed as casual laborers and/or in informal activities are more prone to be defined as VRUs compared to workers engaged in regular activities.2 It is no coincidence, then, that it is often the poor, especially male road-users of working age, that constitute the category of Vulnerable Road Users (VRUs)3 in India. VRUs bear a disproportionately large burden of road crashes and account for more than half of all road crash deaths and serious injuries in the country (WHO, 2018).
CH
AP
TE
R 2
INTRODUCTION

1010
RTIs have a profound long-term impact on income growth and welfare loss which further constrains the human capacity in emerging economies. The 2019 World Bank report “Guide for Road Safety Opportunities and Challenges: Low- and Middle-Income Countries Country Profiles” puts the road crash and serious injury cost estimate at 7.5% of India’s GDP i.e. INR 12.9 lakh crore ($166.43 billion) for the year 2016, which is more than twice the figure cited by the Government of India, i.e., 3% of GDP (Planning Commission, 2011), or INR 4.3 lakh crore ($58.19 billion). A recent study commissioned by the Ministry of Road Transport and Highways (MoRTH) estimates the socio-economic costs of road crashes at INR 1,47,114 crores in India i.e. equivalent to 0.77% of nation’s GDP.4 Considering the under reporting phenomenon and using the crash ratios for MoRTH crash numbers, the same study estimates the crash costs at INR 5,96,820 crores i.e. equivalent to 3.14%. At the individual level, road crash injuries and deaths impose a severe financial burden. They push entire (non-poor) households into poverty and the already poor into debt.
2.1 CURRENT ROAD SAFETY POLICY FRAMEWORK IN INDIA
The Motor Vehicle Act, 1988 has been the primary legislation governing road safety scenario in India for over 30 years till 2019. Over years, the Motor Vehicle Act became outdated and had limited impact. Even though it covers many aspects like licensing, registration of vehicles, setting standards for heavy motor vehicles, penalties for traffic offences etc, yet it was silent on some key issues like child road safety, or the safety of pedestrians and non-motorised users. Also,
1. Lower-middle-income economies are those in which 2019 GNI per capita was between $1,036 and $4,045.2. Definitions have been drawn from Employment-Unemployment Rounds of the NSSO3. VRUs are defined as pedestrians, cyclists, two-wheeler users and other non-motorized transport users.4. Socio-Economic Cost of Road Accidents in India” (September, 2020) DIMTS Ltd. in association with TRIPP-IIT Delhi, MoRTH
the lack of a centralised licensing system and proper standards for mandatory driver training had resulted in various ill practices like a person holding multiple licenses from different states. The fines levied under the Act were also not rationalised. There was a need for an overhaul of the transport sector and for a policy framework that would focus on improving road safety in the country.
Keeping in mind the need to bring about progressive changes through provisions like cashless treatment of road crash victims, electronic enforcement and monitoring and a higher deterrent against committing traffic offences, the Motor Vehicles (Amendment) Act, 2019 was introduced in Parliament on 9th August, 2016 and was passed after three years of public mobilisation and political advocacy.
On 1st September 2019, the Motor Vehicles (Amendment) Act, 2019 came into effect nationally, with the objective to create an enabling framework to improve road safety in India. The Act consists of a total of 93 Amendments including several provisions such as a scheme for cashless treatment of road crash victims, state involvement in making rules for movement of non- motorised transport, provisions for safety of children during commute, electronic monitoring and enforcement, and liability on road engineers and authorities for faulty road design and engineering. These provisions can substantially reduce road crash fatalities and alleviate the economic burden of road crashes in the country.

Traffic Crash Injuries and Disabilities: The Burden on Indian Society
The Act empowers the road users by providing certain key rights, including:
1. RIGHT TO LIFE
• Protection of Good Samaritans from any Criminal or Civil Liability :Section 134A protects a Good Samaritan from any civil or criminal action while providing emergency medical care or any sort of assistance to a road crash victim.
• Timely medical assistance/cashless treatment to road crash victims. The Centre has been given power to make schemes for helping road crash victims under the following sections: Section 162 (1) directs insurance companies to provide for treatment of all road crash victims including under the Golden Hour. Section 162 (2) gives powers to the Centre to make a scheme for cashless treatment of victims of crashes during golden hour (the first critical hour after a road crash). Additionally, it contains provisions for creation of a fund for such treatment. State Governments can also make rules for the cashless treatment of victims and can augment the coverage for cashless treatment under Section 164D of the Act.
2. RIGHTS OF VULNERABLE ROAD USERS
• The Act has special provisions to protect the rights of vulnerable road users such as pedestrians, cyclists, rickshaw pullers, hand drawn cart users, and animal drawn cart users. These road users generally belong
to economically weaker sections of society, and face larger exposure to road traffic injury in comparison with motorised transport users. Section 138(1A) in the Act empowers States to regulate activities of pedestrians and non-motorised road users in public places.
3. RIGHT TO SAFE ROADS
• 198A ensures that any designated authority, contractor, consultant or concessionaire responsible for the design or construction or maintenance of safety standards of roads shall comply with design, construction and maintenance standards.
• Section 215(B) sets up a National Road Safety Board for advising on all matters related to road safety and traffic management.
4. RIGHTS OF CHILDREN TO SAFE COMMUTE
MVAA, 2019 ensures safety of children through addressing key risk factors:
• Amendment to Section 129 of MVA, 1988 proposes that every child above the age of four years being carried on a motorcycle must wear a helmet.
• Section 194 B makes it mandatory for every child to be secured by a safety belt or a child-restraint system.
• Section 199A provides for adult accountability states
INTRODUCTION

12
that the guardian of the juvenile or owner of the vehicle shall be liable in case an offence has been committed by a Juvenile under this Act.
5. RIGHT TO SEEK REDRESSAL:
The Act provides right to seek insurance and settlement of claims within a reasonable time frame:
• Section 149 deals with settlement of claims by insurance companies and procedures to be followed. It provides for payment of compensation claim within a period of thirty days after acceptance of the offer by the claimant.
• Section 164 B constitutes a Central Motor Vehicles Crash Fund to provide compulsory insurance cover to all road users in the country.
The Motor Vehicles (Amendment) Act, 2019 has brought a multi-dimensional change to the road safety landscape in India. From improving access to emergency medical care to improving enforcement measures, the Act has prioritised improving safety of all road users, including the poor and vulnerable.
2.2 ABOUT THE TRAFFIC CRASH INJURY BURDEN ASSESSMENT
India has the third-largest number of poor people with
at least 53 million people living in extreme poverty5. RTIs further add additional financial stress due to exorbitant health costs, with just medicine related OOPE pushing 38 million people into poverty in 2011-12. (Selvaraj, Farooqui, & Karan, 2018) This study primarily aims to understand the socio-economic and gendered impacts of road crash outcomes on poor households, daily-wage, informal sector workers and its interplay with poverty. The study attempts to measure the economic impact of road crashes on households in four broad ways: direct financial costs of RTIs (the hospital costs, property damage, rehabilitation and other costs with a monetary value), indirect costs of RTIs (loss of quality of life and standard of living, compensation), insurance and compensation-related challenges, and geographic and demographic disparities in terms of habitation (urban vs rural) and gender. Gauging the awareness levels and accessibility of the insurance and compensation systems for road crash victims and their families is an important component of this study.
This is achieved by engaging two categories of respondents - a test sample of ‘Bottom 40 per cent of the population’ (hereafter referred as ‘Low Income Household’) and a control sample of ‘Top 10 per cent of the population’ (hereafter referred as ‘High Income Household’).
In terms of gender, road crashes impact women (differently) than men. 86% of the total road crash victims are male compared to 14% women (MoRTH, 2018). This complicates the post-crash care scenario in India with the burden of caregiving activities always almost falling on women within households. Thus, through structured FGDs, this study
5.. https://worldpoverty.io/map

Traffic Crash Injuries and Disabilities: The Burden on Indian Society
captures the lived experiences of women in households that are often pushed into poverty.
This study aims to fill a gap by further exploring the psychological and emotional impacts of road crashes among households which are often invisible and unacknowledged in academic literature and government policy. Mental health is a sensitive subject and plays out in different forms. Determining the psychological well-being post-crash is imperative to estimate the indirect costs associated with road crashes.
Apart from the two key sample groups of Low-Income Households (LIH) and High Income Households (HIH), this study aims to probe into the impact of road crashes on key vulnerable and high-risk individuals. One such category is adolescents aged 14-18 years. India’s productive potential is rising: Demographic transitions have led to rising worker-to-dependent ratio which will be a favourable 2.1 by 2050. The number of adolescents grew from 225 million in 2000 to 250 million in 2015 But the vast majority of youth are unemployed or in vulnerable, low paid informal jobs Hence, adolescents were identified to be a key cohort under the study. Their post-crash experiences are captured through structured In-depth Interviews (IDIs).
The other socio-economically marginalized and high-risk road user category is that of truck drivers. Out of the 1.5 lakh people killed in road crashes in the country every year, over 15,000 road crash victims are truck and lorry drivers alone, comprising 10% of the total deaths (MoRTH, 2018). In terms of vehicle category, trucks and lorries are involved in over 57,000 crashes in the country (MoRTH, 2018). Despite this, 93% of the truck drivers do not get any social security benefits such as provident fund, pension, life insurance, gratuity, etc. (SaveLIFE Foundation, 2020).
6. http://documents1.worldbank.org/curated/en/701191479977368846/pdf/110453-REVISED-PUBLIC-PSIAAR.pdf
Poor road safety outcomes and lack of institutional support intensify the challenges faced by truck drivers, especially in the post-COVID-19 world.
The World Bank commissioned this study in association with SaveLIFE Foundation (SLF) to determine the differential impacts of road crashes more objectively in India. Though originally the study study was developed as “an analytical approach used to assess the distributional, poverty-related and social impacts of policy reforms on various stakeholder groups” (World Bank, 2016)6, this study can be treated as a baseline assessment study to document the variation in impact of road crash outcomes on low- income and high-income households. Once the policy framework established under Motor Vehicles (Amendment) Act, 2019 is implemented, mid-term and end-term assessment studies can be undertaken to understand the impact of the interventions.
For this study, SLF further commissioned the survey to a Social and Market Research company, Marketing and Development Research Associates (MDRA) to assist in designing survey instruments and guidelines for qualitative research, administer telephonic and face to face surveys as well as conduct Focus Group Discussions (FGDs) and In-Depth Interviews (IDIs) for the Study; and prepare an analytical report based on outcomes of the survey
2.3 OBJECTIVES OF THE STUDY
The objective of the study is to analyze the socio-economic impacts of road crashes on vulnerable individuals and households below the poverty line, estimate collective economics losses resulting from gaps in the existing
INTRODUCTION

14
architecture, and inform the regulatory framework across high and low capacity states from a poverty and social impact perspective.
The specific sub-objectives of the study are :
To assess the distributional impact of road fatalities and crashes on the poor, specifically the LIH. The study tests whether poor road safety outcomes disproportionately affect poor families and individuals leading to exacerbated pre-existing inequalities. It also looks at outcomes in HCS and LCS and attempts to capture differences in outcomes.
To assess the extent of awareness on compensation and insurance and other provisions and reforms brought in through the Motor Vehicles Amendment Act, 2019 among high risk and marginalized road user category of Truck Drivers.
To map the procedural, legal, and social hurdles faced in claiming insurance and compensation money by road crash victims/families.
To assess the psychological and emotional impact of road crashes and fatalities on road crash victims and their families and how they cope with it.
To assess the gendered impact of road crashes among poor and rich families.
To assess the impact of road crash fatalities and crashes on vulnerable individuals like adolescents (14-18 years).
Through this assessment, we aim to generate ex-ante empirical evidence to identify and shape broad priority areas, including sectors and policy initiatives needed to create an enabling framework to support poor and marginalized households that bear the brunt of road traffic injuries. We do so by proposing a series of cost-effective policies and reforms that will focus on mitigation of the adverse impact of road traffic injuries. We hope to initiate a meaningful dialogue on the distributional impact of road crashes in India and to offer constructive measures to alleviate the cost burden on poor, vulnerable and high-risk groups of road users and their families.

Traffic Crash Injuries and Disabilities: The Burden on Indian Society
3.1 RESEARCH METHODOLOGY
This study utilizes qualitative and quantitative methodologies for estimating the economic and social impact of road crash outcomes. Using purposive sampling, a multi-pronged approach was adopted to assess the impact of road traffic injuries and fatalities on victims.
Based on the objectives of the study, the research methodology is divided into two phases:
PHASE-I: EXPLORATORY RESEARCH
A) DESK RESEARCH
Desk research was undertaken to review the various provisions in MVAA 2019 regarding road safety provisions and compensation to road crash victims. During this stage, various data sets were explored with an effort to create a database that would be most suitable to generate contact details of road crash victims – both from urban and rural areas.
B) PREPARATION OF SURVEY INSTRUMENTS
Draft survey instruments were prepared for each respondent category separately. Survey instruments (questionnaires and guidelines for FGDs and IDIs) were created and later fine-tuned post the feedback from the pilot.
C) PILOT SURVEY
Due to the National Lockdown mandated by the Central
CH
AP
TE
R 3
RESEARCH METHODOLOGY, SAMPLE DESIGN & SAMPLE COVERAGE

16
Government due to COVID-19, the pilot survey was conducted telephonically. The sampling design and survey instruments were tested with a small sample of 30 interviews. The pilot survey was carried out from May 7, 2020 -May 13, 2020.
D) POST-PILOT FINE-TUNING OF SURVEY INSTRUMENTS
As part of the revised sampling strategy, more detailed questionnaires were retained for face to face interviews and a slightly shorter version of the questionnaire was used for telephonic surveys. These survey instruments were translated into regional languages to enhance their comprehensibility.
PHASE-II: DESCRIPTIVE RESEARCH
The field survey was conducted between 19th June, 2020 – July 23, 2020. The following stages were covered in this phase of the study:
A) QUANTITATIVE RESEARCH:
The survey was conducted among respondent categories using structured questionnaires administered by experienced investigators. The respondents were approached via two sampling strategies:
Additionally, awareness levels about motor insurance, compensation and other provisions of the Motor Vehicles (Amendment) Act, 2019 (MVAA, 2019) was also tested among truck drivers.
B) QUALITATIVE RESEARCH - FGDS AND IDIS
Qualitative surveys were used to understand the perspective of the victim/victim’s family member regarding the impact of fatality/crash on their social condition as well as their emotional health. In-depth interviews were conducted among adolescents (aged 14-18) who have been survivors of a road crash or have lost a family member in a road crash. These interviews were conducted through a mix of video calls and face-to-face interviews.
Similarly, FGDs were conducted among women and men with participants who had either been involved in a road crash or their immediate family member was in a road crash. These FGDs were conducted in Patna (Bihar) and Lucknow (UP) by an experienced researcher and moderator with adequate precautions and adherence to social distancing protocols.
3.2 SAMPLING DESIGN
A multi-stage sampling procedure was adopted to select the target respondents for this study. The first unit of sampling was the State. Looking at the number of crashes during the last 15 years and the geographical location of states, the top 4 states were selected for conducting this survey, i.e. Uttar Pradesh in North India, Maharashtra in West India, Tamil Nadu in South India and Bihar in East India. Additionally, Maharashtra and Tamil Nadu represent High Capacity States (HCS) demonstrating a higher economic growth and better performance in Human Development indicators while Uttar Pradesh and Bihar represent Low Capacity States (LCS) demonstrating a sluggish economy, higher poverty rates and low levels of social and administrative progress.

Traffic Crash Injuries and Disabilities: The Burden on Indian Society
RESEARCH METHODOLOGY, SAMPLE DESIGN & SAMPLE COVERAGE
In the next stage of sampling, in each of the selected states, 4 districts were selected to find out relevant respondents. These districts were also selected based on the number of crashes and geographical location (diversity) in the state. The quantitative survey aimed at providing state-level point estimates to key aspects of economic and financial impacts on the families of road crash victims. Hence, at a 95% confidence interval and a 5% margin of error in the sample size was calculated using the following formula -
SS = Z2 * p*(1-p)
C2
where:Z = Z value (e.g. 1.96 at 95% confidence level)p = percentage picking a choice expressed as a decimal (since we do not have estimates of the p-value, we have taken it as 0.5 to maximize the sample to avoid any under-sampling)C = confidence interval, expressed as decimal (e.g., .05 = ±5) Using the above formula, the population, the number of road crash in each state during 2005-18 and other aspects of the target group, the sample size was calculated for each state.
During the field survey, purposive and snowball sampling was used to select an adequate number of respondents
from each state. After identification of respondents, a mix of telephonic and face to face surveys was conducted among road crash victims or their family members.
3.3 SAMPLE COVERAGE
A total number of 2,499 interviews (against the target sample of 2,400) were conducted across 4 states. Category wise, 1647 LIH, 432 HIH and 420 truck drivers were interviewed across 4 states7. In addition to the above, 3 FGDs and 8 IDIs were conducted among road crash victims/their family members. The summary table 3A.1 in the annex provides a snapshot of descriptive statistics about the participants. Statistically, a 95% confidence interval and a 5% margin of error in a sample size of 384 is sufficient to conduct multi variate analysis of the data. Thus, statistically each category (LIH, HIH and truck drivers) has an adequate sample size and the comparison between LIH and HIH is justified and stands valid for deriving conclusions. Further, for comparison purposes, the proportion figures have been quoted instead of absolute numbers.
3.4 PROFILE OF LOW INCOME AND HIGH-INCOME HOUSEHOLDS
The study was conducted among low -income and high-income households in 4 selected states across urban and
7. Out of total, 986 (47%) interviews among victims/ family members were conducted through face to face mode while remaining 1093 (53%) interviews were conducted telephonically. All interviews among truck drivers were conducted through face to face mode.

18
rural areas in 4 zones (East – Bihar, West – Maharashtra, North – Uttar Pradesh, South – Tamil Nadu).
As per the latest estimates (WB, 2015), the world’s 73.6 crore (736 million) people are living in extreme poverty (less than US$1.90 a day) with a poverty rate of 10%.
In the case of India (Census of India, 2011) about 21.9 per cent population of India is extremely poor and lives under the poverty line (as per Tendulkar committee). The poverty rate in rural areas is higher (25.7%) than the urban population (13.7%).
Further, 41% of road crashes were recorded in urban areas and 59% in rural areas. The proportion of persons killed in urban areas and rural areas was 34% and 66% respectively
For this study, LIH and HIH were defined based on income and ownership. The upper threshold pre-tax income of a LIH sample was taken as INR 13,450 per month per adult8. Similarly, for HIH category, the lower threshold pre-tax income of INR 50,000/- per month per adult was considered.
The Low Income Households’ test sample, comprising the bottom 40% of the population was selected keeping in mind standard models of population representation used globally by the United Nations (UN) and World Bank in its poverty related research. UN SDG target 10.1 aims for the income of the bottom 40 percent to be growing faster than
the national average by 2030. Progress is measured by the difference between growth in the consumption or income of the bottom 40 percent and growth in the consumption or income of the mean of the population as a whole.
After carefully analyzing the World Inequality Database (that aims to provide open and convenient access to the most extensive available database on the historical evolution of the world distribution of income and wealth, both within countries and between countries), the control sample of HIH was defined as comprising of the top 10% of the population in terms of income. Across the world, the income earned by the top 10 percent is often larger, sometimes much larger, than the share earned by the bottom 40. The ratio of the share of income between the top 10 percent and bottom 40 percent is known as the Palma ratio.
To monitor progress against its goal of boosting shared prosperity, the World Bank tracks growth in the consumption or income of the poorest 40 percent of the population in each country—the bottom 40 percent. Shared prosperity focuses on the poorest 40 percent of the population in each economy (the bottom 40) and is defined as the annualized growth rate of their mean household per capita income or their consumption.
This 40% and 10% population ratio is thus an important and useful development indicator for the World Bank to measure socio-economic impact in any given country, especially developing countries. It helps to juxtapose
8. https://wid.world/country/india/

Traffic Crash Injuries and Disabilities: The Burden on Indian Society
various socio-economic realities and highlights the widening gap amongst sections of the population more clearly. It also helps to make the data in this report more globally comparable with other nations.
On comparing the income profile of LIH and HIH categories at a global level while keeping all factors the same (World Inequality Database); LIH population of India that earn a pre-tax income of up to INR 13,500 per month per adult would be among the bottom 19% population globally (refer to Table 3A.2). Similarly, HIH population of India that earn pre-tax Income of INR 50,000 or above would be among the top 42% globally9.
71% of the LIH respondents were from rural areas, while for HIH, it was opposite as major proportion (82%) were from urban areas (Refer to Table 3A.4). This is very close to the actual distribution of poor population in rural (about 20%) and urban (about 80%) areas in India (as per Census 2011).
Based on income and self-declaration, every 2nd LIH surveyed was found below the poverty line. In each LIH, there were average 5.6 (median value = 5) members while the average size of HIH was 4.8 (median value = 4). Cognizance was taken of the fact that respondents might not disclose their real income during the surveys. To overcome this limitation, the surveyors visited the locality for more than half of the respondents surveyed and verified their range of income through these field visits. In case of telephonic surveys (53% of the total sample), the tallying was done with a verifiable database. Additionally, respondents were asked about their expenses at various
levels of the survey and their responses gave a fair indication of their household income. The framing of short pointed questions on whether the household had to borrow money/ sell or mortgage valuables and whether anyone in the family had to quit study/relocate, etc. helped in verifying their income-brackets.
A pre-testing of the methodology was conducted to finetune the approach and to ensure rigrous data collection. Among the LIH crash victims, 86.2% were male while 13.8% were female. Among HIH crash victims, such a proportion of males and females was 78.7% and 21.3% respectively.
Similarly, age-group wise, about every 2nd road crash victim from LIH was in the 26-45 yrs age bracket, whereas among HIH such proportion was about 64%. Across households, more than half of the all victims (54% for LIH and 64% for HIH belonged to the productive age group of 26-45 years. A probable reason is that most commute/travel is work related and hence the working age population is more prone to road crashes.
In terms of educational qualification, with ample facilities and resources for the HIH category, they were found to be more educated than the LIH victims. About two-third of HIH victims had at least completed graduation. While among LIH it was opposite, as about two-thirds of victims were educated only up to 12th standard and only one-fourth were either graduate or above. The link between educational qualifications and recovery to work has not been captured/established directly in this study. Though it can be said that
RESEARCH METHODOLOGY, SAMPLE DESIGN & SAMPLE COVERAGE
9. For more details see Annexure.

20
over 40% of the LIH victims were either unemployed or engaged in the agriculture or informal sector as unskilled labourers before the crash while 83% of the HIH victims were either self-employed or doing business or working in the formal sector as salaried employees. A combination of factors like higher educational levels, family savings to dip into and better social status did facilitate their early transition back to the workforce and previous learning levels. However, disability adds another dimension/layer of analysis that delays the process of resuming work or finding meaningful and well-paid work across households after the crash.
Most of the victims in LIH were engaged as unskilled labour/farmers in the agriculture sector or shop owner/ petty traders and about 4 out of 10 were engaged in businesses/ self-employed or working as salaried employees. On the other hand, over 8 out of 10 victims in HIH were engaged in businesses/ self-employed or working as salaried employees.

Traffic Crash Injuries and Disabilities: The Burden on Indian Society
CH
AP
TE
R 4
SOCIO-ECONOMIC IMPACTS OF ROAD CRASHES
INTRODUCTION
Road Traffic Injuries (RTIs) in India are closely interlinked with on-ground socioeconomic realities like class, gender and geographical location that often intersect and affect various sections of the population differently. This chapter highlights the disproportionate impact of road crashes among LIH and HIH in the four selected States by capturing the situated hierarchies and lived experiences of respondents, i.e., it discusses the differential impact of crashes among various States, male and female, poor and rich and urban and rural areas. The extent and degree of disproportionate economic impact among LIH and HIH is estimated by determining the direct and indirect costs borne by households after an crash. Direct costs are tangible, paid upfront and include medical expenses, property costs, vehicle costs etc. In contrast, indirect costs are hidden, often difficult to determine and are characterised by a deterioration in the standard of living, loss of productivity/income etc. The ability to mitigate risks associated with an crash and the capacity to respond to it also varies among poor and rich households. This chapter highlights that differential response among LIH and HIH w.r.t how they meet their financial burden after a crash.
KEY FINDINGS
The key findings of this chapter can be summarised under two broad points of inter-state variations in the impact

22
of road crashes among LIH and HIH households and the mechanisms used to cope with the sudden financial burden. Inter-state variations also include pointers on urban and rural disparities and how they further deepen the impact on households. The mechanisms to cope with socio-economic burden posed by road crashes highlight the differential abilities of LIH and HIH to deal with it.
INTER-STATE VARIATIONS
1. Decline in total household income was sharper across all States among LIH vis-a-vis HIH. A greater percentage of LIH across States reported borrowing money and selling land/mortgaging family assets to meet their financial expenses vis-à-vis HIH. For instance, In Tamil Nadu, 30% of the respondents from LIH reported selling/mortgaging assets compared to 10% of the respondents from HIH. In Maharashtra, 44% of LIH had to borrow money compared to 8% from HIH.
2. In the event of a crash, LIH are disproportionately affected in both Low Capacity States (LCS) and High Capacity States (HCS). However, the socio-economic impact on LIH in LCS is the most severe.
3. Resilience of households to deal with financial impact of road crashes was however most fragile in Tamil Nadu. The proportion of LIH respondents
who stated that they had to sell off or mortgage their assets, take up extra work, and avail for compensation from the insurance company and other parties involved in the crash in order to deal with their financial burden, was highest in Tamil Nadu. This could be because Tamil Nadu has the highest pendency of Motor Accident Claims Petition in India. With over one lakh fifty thousand pending cases, Tamil Nadu has almost double the pendency in comparison to the National level pendency10. Tamil Nadu also reported the highest number of married road crash respondents11. Additionally, the State also had the highest number of CWE respondents among all States (34%). Since it is mostly men getting involved in road crashes (79% of the victims in TN were male), it is highly probable that Tamil Nadu has the highest number of female headed household’s post-crash and therefore limited resilience to deal with financial burdens. While the State has performed well on gender reforms and access to maternal healthcare, it still lags behind in female labour force participation rate. On the work front, women have been leaving the labour force in large numbers since 2005 (WB, 2017)12. Women have slightly more casual-wage jobs than men in rural areas in the State.
4. Bihar had the lowest average costs borne by LIH across all expenditure heads except Out Of Pocket Expenses (OOPE) on treatment of the victim and amount paid to
10. https://njdg.ecourts.gov.in/njdgnew/?p=main/pend_dashboard11. 85% of the victims were married at the time of the crash.12. World Bank (2017). “Tamil Nadu – Gender”, July: http://documents1.worldbank.org/curated/en/154201504176664933/pdf/119264-BRI- P157572-Tamil-Nadu-Gender.pdf

Traffic Crash Injuries and Disabilities: The Burden on Indian Society
other parties involved in the crash. It was the opposite for Tamil Nadu where average costs were higher across most of the heads except for out of pocket expenses on treatment and legal/administrative expenses.
5. Among the LIH, Maharashtra and Tamil Nadu fared better with a higher survivability rate of 75% compared to UP and Bihar that showed a survivability rate of 53%.
6. The household income in HCS declined by 64% after the crash whereas it decreased by 78% among households from LCS.
7. Similarly, while living standards of the household deteriorated by 49% among HCS, it fell by 64% in LCS.
8. There was a wide contrast in proportion of LIH that availed of loans to deal with resulting financial burdens: 48% of LIH from Uttar Pradesh vis-a-vis 15% of the HIH from Tamil Nadu. Further, the ability to obtain a loan from institutional sources also depends on one’s socioeconomic status and makes the process of repayment more strenuous for poor households. 27% of the LIH in urban areas and 48% of the LIH in rural areas availed of loans to mitigate the financial crisis. A similar trend was noticed among HIH. 7% of HIH in urban areas and 30% of HIH in rural areas availed of loans, indicating greater financial stress among households in rural areas.
9. The highest expense among LIH on victims’ funerals was incurred in Tamil Nadu (Rs 42, 010) while the lowest amount was spent in Uttar Pradesh (Rs 12, 517).
10. Decline in living standards was drastic across all states with Bihar reporting the sharpest decline among LIH (73%) followed by Uttar Pradesh (72%).
11. In terms of the amount arranged to tide over the economic crisis, LIH from Maharashtra managed to raise the highest amounts whereas among HIH, a similar trend was observed in Tamil Nadu.
12. LIH in Uttar Pradesh (over 2.5 lakhs on an average) received the highest compensation from Government schemes at the central and local level followed by Maharashtra (around 1lakh average). The pendency of compensation cases in UP is one of the lowest in the country at 1.80% of total Original Civil Cases in UP13. Additionally, there has been extensive digitisation of Courts in India through the eCourts Mission. Most of the Courts including Motor Accident Compensation Tribunals (MACT) are part of the Case Information System (CIS) software under which courts have been provided flexibility to customize cause lists, mechanism for e payment etc. However, there is dearth of data on actual on-ground practices and how much has this system being implemented as district and taluka level.
SOCIO-ECONOMIC IMPACTS OF ROAD CRASHES
13. The National Judicial Data Grid was accessed on 29th October 2020 and the pendency rate is calculated till 28th October 2020.

24
VARIATIONS IN RURAL AND URBAN HOUSEHOLDS
1. The severe impact of decline in income was higher among rural households, and cases where victims died as well as where victims were males.
2. Income decline was the most severe for LIH rural households (56%) compared to LIH urban (29.5%) and HIH rural (39.5%). However, on comparison of the monthly household income and financial losses (expenditure and loss of income) due to road crashes, it was found that the loss among LIH was equivalent to about 7.6 months household income while among HIH it was equivalent to less than 1 month household income (0.84 month)14
3. The total average costs (direct and indirect costs combined) borne by HIH (Rs.1,98,042) after the crash was higher than the total costs borne by LIH (Rs.1,52,826).
4. Medical costs constituted a bulk of the total costs of LIH, i.e., Rs. 78,824 (52% of total costs) followed by loss of productivity/loss of income costs, i.e. Rs. 37, 572 (25% of total costs).
5. Across households, 34% of the respondents from urban areas said they had to borrow money after the
crash compared to 78% of respondents from rural areas.
6. Expenditure on OOPE in urban areas was higher compared to rural areas across households. Among the LIH in urban areas, OOPE was slightly higher at 66% of the total expense compared to 60% of the total expense among HIH in rural areas.
GENDER DIFFERENTIATED IMPACT
1. LIH respondents stated that in the absence of any steady primary source of income (especially in the case of death of a breadwinner), the women of the household often had to step up and take additional jobs to mitigate the financial burden. Further, the burden of non remunerative caregiving work mostly falls on females within the household after a crash. This is non quantifiable and does not come under the purview of economic activity.
2. Across household categories, the proportion of male Chief Wage Earners (CWE) was higher than female CWE; the number being higher among LIH. 50% of the women from LIH and 55% from HIH were CWE of the household before the crash whereas 81% of the men from LIH and 74% men from HIH were CWE before the crash.
14. Please note MHI was calculated by taking mid points of ranges.
Traffic Crash Injuries and Disabilities: The Burden on Indian Society
3. 31% of the female members in LIH were severely affected by the decline in household income after the crash compared to 53.5% of the male members. Among HIH, 18.5% of female members of the household were severely affected compared to 26.5% of the male members in the household.
4. The male (dead) victims’ contribution to household income was significantly higher than female victims’ (more than double) across both categories of households. For instance, among LIH, male (dead) victims contributed to 63.5% of the total monthly household income whereas female victims contributed to 29% of the same.
MECHANISMS TO COPE WITH FINANCIAL BURDEN
1. The financial crisis after an crash was more aggravating for LIH than HIH. Compared to HIH, LIH were three times more likely to seek financial help in order to cope with the financial burden post-crash
2. Higher debt among LIH - About 42% of the LIH respondents reported that their household underwent debt after borrowing money (through both formal and informal sources) to cope with the additional expenses after an crash, compared to 11% of respondents from HIH.
3. 24% of the LIH respondents said they had to sell/mortgage their assets (land, jewellery) to meet their daily expenses and repay their debt, compared to only 7% of the HIH respondents.
4. About 14% of LIH respondents reported taking up extra work to deal with the situation, compared to 4% of HIH respondents.
5. A higher percentage of respondents from LIH in rural locations opted for a loan (lenders, bank, relatives etc.), sold off/mortgaged their assets and took up extra work to cope with the financial burden than their counterparts in urban areas.
6. While LIH were more dependent on loans and selling off their assets to meet their expenses, they were less likely to receive compensation from insurance companies compared to HIH. Only 14% of the LIH received compensation from insurance companies compared to 24% of HIH respondents. The average amount of compensation received by LIH, i.e., Rs.89,215 was also less than the average amount received as compensation for HIH, i.e., Rs.1,62,562.
7. A higher percentage of respondents from HIH (90%) than that in LIH (70%) relied on their savings to meet their additional expenses post-crash. The amount of savings used to meet related expenses was also higher in the case of HIH (Rs.1,45,401) as compared to LIH (Rs. 92,060)
SOCIO-ECONOMIC IMPACTS OF ROAD CRASHES

26
4.1. DISPROPORTIONATE IMPACT ON VICTIMS’ SURVIVAL, EMPLOYMENT STATUS AND INCOME LEVEL
The socioeconomic realities and victim’s status in the hierarchy determines his/her chances of survival and speedier recovery. The financial impact of road crashes is often severe especially among LIH and can deeply impact victims and their families in terms of loss of employment and income, decline in productivity and lost opportunities.
One of the most significant findings of this study is that the survival rate post-crash was higher among victims from HIH compared to LIH : around 87.5% of the crash victims from HIH survived compared to 64% of the crash victims from LIH. The vast difference in road crash outcomes among victims from rich and poor households can be attributed to various factors like access to medical treatment immediately after the crash and the ability to afford long-term and effective post-crash care. The nature of the crash, and the risk assessment of the mode of transport used for commuting also influences the chances of survival/death among victims. The findings of this study confirm that the highest proportion of LIH victims from Uttar Pradesh and Bihar were at the time of the crash using a bicycle/ auto rickshaw/ commuting on foot as “VRUs”, thereby making them more susceptible to road crash linked mortality and morbidity. States especially LCS need to urgently spend more on VRU friendly infrastructure in rural areas that
prioritises their safety. State Governments should select districts with a high VRU crash rate and prioritise their safety through dedicated Annual Action Plans.

Traffic Crash Injuries and Disabilities: The Burden on Indian Society
TABLE 4.1: TABLE INDICATING HOUSEHOLD SPLIT OF ROAD CRASH OUTCOMES: LOCATION/HABITATION
Overall
Category(State, gender)
Male
Female
Male
Male
Male
Male
Female
Female
Female
Female
Bihar
Maharashtra
Tamil Nadu
Uttar Pradesh
Overall
Location / habitation
Urban
LIH HIH
Rural Total
LIH HIH LIH HIH
Died
Location / habitation
Urban
LIH HIH
Rural Total
LIH HIH LIH HIH
Survived
Location / habitation
Urban
LIH HIH
Rural Total
LIH HIH LIH HIH
57.5% 42.5% 93.9% 6.1% 79.2% 20.8% 56.4% 43.6% 92% 8% 73.6% 26.4% 66% 34% 96.2% 3.8% 91.7% 8.3%
93.3% 6.7% 75.4% 24.6% 73.8% 26.2% 97.6% 2.4% 94.3% 5.7%
88% 12.% 68.% 32% 52.8% 47.2% 93% 7% 86% 14%
88.9% 11.1% 68.4% 31.6% 77.8% 22.2% 98.2% 1.8% 96.2% 3.8%
91.3% 8.7% 71.7% 28.3% 91.7% 8.3% 98.2% 1.8% 97.5% 2.5%
77.8% 22.2% 55.7% 44.3% 50% 50% 98.3% 1.7% 93.8% 6.3%
97.4% 2.6% 74% 26% 54.2% 45.8% 100% 0% 91.9% 8.1%
98.2% 1.8% 74.9% 25.1% 70% 30% 100% 0% 96.7% 3.3%
92.3% 7.7% 69.9% 30.1% 42.9% 57.1% 100% 0% 82.6% 17.4%
88.1% 11.9% 79.2% 20.8% 93.8% 6.3% 80.2% 19.8% 82.4% 17.6%
88.1% 11.9% 81% 19% 100% 0% 88.7% 11.3% 90.5% 9.5%
88.2% 11.8% 76.3% 23.8% 83.3% 16.7% 66.7% 33.3% 69.2% 30.8%
94.4% 5.6% 71.2% 28.8% 56.4% 43.6% 99.5% 0.5% 92% 8%
94.3% 5.7% 74.5% 25.5% 58.6% 41.4% 99.3% 0.7% 92.3% 7.7%
95% 5% 56.6% 43.4% 50% 50% 100% 0% 91.4% 8.6%
60% 40% 95.1% 4.9% 80.9% 19.1%% 58.4% 41.6%
50.9% 49.1% 90.5% 9.5% 74.6% 25.4% 50.5% 49.5%
54.1% 45.9% 93.8% 6.3% 78.2% 21.8% 51.9% 48.1%
57.6% 42.4% 94.5% 5.5% 79.6% 20.4% 54.8% 45.2%
42.9% 57.1% 91.8% 8.2% 73.9% 26.1% 41.9% 58.1%
54% 46% 97.4% 2.6% 80.4% 19.6% 53.4% 46.6%
58.5% 41.5% 97.1% 2.9% 81.9% 18.1% 58.5% 41.5%
37.2% 62.8% 98.5% 1.5% 74.8% 25.2% 33.3% 66.7%
61.6% 38.4% 82.5% 17.5% 74.9% 25.1% 59.7% 40.3%
75.8% 24.2% 88.3% 11.7% 83% 17% 73.8% 26.2%
70.7% 29.3% 85.9% 14.1% 79.8% 20.2% 68.8% 31.2%
54.1% 45.9% 96.6% 3.4% 74.8% 25.2% 57.4% 42.6%
50.9% 49.1% 98.8% 1.2% 79.7% 20.3% 49.7% 50.3%
51.8% 48.2% 98.4% 1.6% 78.6% 21.4% 51.5% 48.5%
SOCIO-ECONOMIC IMPACTS OF ROAD CRASHES

28
Overall
Category(State, gender)
Male
Female
Male
Male
Male
Male
Female
Female
Female
Female
Bihar
Maharashtra
Tamil Nadu
Uttar Pradesh
Overall
Location / habitation
Urban
LIH HIH
Rural Total
LIH HIH LIH HIH
Died
Location / habitation
Urban
LIH HIH
Rural Total
LIH HIH LIH HIH
Survived
Location / habitation
Urban
LIH HIH
Rural Total
LIH HIH LIH HIH
57.5% 42.5% 93.9% 6.1% 79.2% 20.8% 56.4% 43.6% 92% 8% 73.6% 26.4% 66% 34% 96.2% 3.8% 91.7% 8.3%
93.3% 6.7% 75.4% 24.6% 73.8% 26.2% 97.6% 2.4% 94.3% 5.7%
88% 12.% 68.% 32% 52.8% 47.2% 93% 7% 86% 14%
88.9% 11.1% 68.4% 31.6% 77.8% 22.2% 98.2% 1.8% 96.2% 3.8%
91.3% 8.7% 71.7% 28.3% 91.7% 8.3% 98.2% 1.8% 97.5% 2.5%
77.8% 22.2% 55.7% 44.3% 50% 50% 98.3% 1.7% 93.8% 6.3%
97.4% 2.6% 74% 26% 54.2% 45.8% 100% 0% 91.9% 8.1%
98.2% 1.8% 74.9% 25.1% 70% 30% 100% 0% 96.7% 3.3%
92.3% 7.7% 69.9% 30.1% 42.9% 57.1% 100% 0% 82.6% 17.4%
88.1% 11.9% 79.2% 20.8% 93.8% 6.3% 80.2% 19.8% 82.4% 17.6%
88.1% 11.9% 81% 19% 100% 0% 88.7% 11.3% 90.5% 9.5%
88.2% 11.8% 76.3% 23.8% 83.3% 16.7% 66.7% 33.3% 69.2% 30.8%
94.4% 5.6% 71.2% 28.8% 56.4% 43.6% 99.5% 0.5% 92% 8%
94.3% 5.7% 74.5% 25.5% 58.6% 41.4% 99.3% 0.7% 92.3% 7.7%
95% 5% 56.6% 43.4% 50% 50% 100% 0% 91.4% 8.6%
60% 40% 95.1% 4.9% 80.9% 19.1%% 58.4% 41.6%
50.9% 49.1% 90.5% 9.5% 74.6% 25.4% 50.5% 49.5%
54.1% 45.9% 93.8% 6.3% 78.2% 21.8% 51.9% 48.1%
57.6% 42.4% 94.5% 5.5% 79.6% 20.4% 54.8% 45.2%
42.9% 57.1% 91.8% 8.2% 73.9% 26.1% 41.9% 58.1%
54% 46% 97.4% 2.6% 80.4% 19.6% 53.4% 46.6%
58.5% 41.5% 97.1% 2.9% 81.9% 18.1% 58.5% 41.5%
37.2% 62.8% 98.5% 1.5% 74.8% 25.2% 33.3% 66.7%
61.6% 38.4% 82.5% 17.5% 74.9% 25.1% 59.7% 40.3%
75.8% 24.2% 88.3% 11.7% 83% 17% 73.8% 26.2%
70.7% 29.3% 85.9% 14.1% 79.8% 20.2% 68.8% 31.2%
54.1% 45.9% 96.6% 3.4% 74.8% 25.2% 57.4% 42.6%
50.9% 49.1% 98.8% 1.2% 79.7% 20.3% 49.7% 50.3%
51.8% 48.2% 98.4% 1.6% 78.6% 21.4% 51.5% 48.5%

Traffic Crash Injuries and Disabilities: The Burden on Indian Society
UP and Bihar are one of the highest populated states and home to the largest proportion of poor in India. Further, both the states are comparatively less developed, and the level of education is also low. Based on several factors like proportion of urban population, literacy rate, poverty rate and per capita net State GDP, Bihar and Uttar Pradesh have been categorised as “Low Capacity States”, while Maharashtra and Tamil Nadu have been categorised as
TABLE 4.2: TABLE INDICATING HOUSEHOLD SPLIT OF ROAD CRASH OUTCOMES: VICTIMS WHO SURVIVED/DIED AFTER A ROAD CRASH FROM STATE, HABITATION AND GENDER LENS.
“High Capacity States”. All these factors contribute to differing levels of vulnerability and survivability of road users in crashes.
Overall, the victim survivability rate15 in high capacity states (77%) was found to be higher than that in low capacity states (61%). For instance, Uttar Pradesh (UP) registered the highest death rate among LIH. 50% of crash victims
SOCIO-ECONOMIC IMPACTS OF ROAD CRASHES
15. Survivability here refers to the ability of a road accident victim to remain alive/continue to live after an the accident. It depends on several factors like timely access to emergency care and the quality of care etc.
Died
SurvivedDied
Survived
Died
Survived
Died
Survived
Died
Survived
Died
Survived
Died
Survived
Died
Survived
Died
Survived
Died
Survived
LIHN-1647
BiharN-412
Uttar PradeshN-413
MaharashtraN-415
MaharashtraN-113
Tamil NaduN-407
Tamil NaduN-103
Uttar PradeshN-413
BiharN-115
HIHN-432
36.1%
43.2%
56.8%
30.1%
69.9%
50.4%
49.6%
20.6%
79.4%
17.8%
82.2%
6.1%
93.9%
63.9%
12.5%
87.5%
Overall
Low Survivability(53%) among LIH
High Survivability (75%) among HIH
90.3%
DiedSurvived
82.5%
9.7% 17.5%

30
from LIH in UP died after the crash compared to 18% of crash victims from HIH. Similarly, in Bihar, 43% of the victims from LIH died after the crash compared to about 6% of the victims from HIH. Among the LIH (refer to Table 4.2), Maharashtra and Tamil Nadu fared better with a higher survivability rate of 75% compared to UP and Bihar that showed a survivability rate of 53%.
Victims from rural areas were more likely to die in an crash while victims from urban areas were more likely to survive an crash. 46% of the LIH victims and 28% of the HIH victims from rural areas died post-crash whereas 87% of the LIH victims and as high as the 91% of the HIH victims from urban areas survived post-crash. The reasons for difference in survival rates of urban and rural crash victims can be explained by the better availability of tertiary care medical facilities and the accessibility (including distance) to emergency care in urban areas. The distribution of qualified health workers is skewed towards urban areas; 77.4% of all qualified workers are in urban areas, even though the urban population accounts for only 31% of the total population. The density of qualified health workers is 22.7 per 10,000 population in urban areas, as compared to 3.0 per 10,000 population in rural areas (WHO South-East Asia Journal of Public Health, 2016).
Due to serious injuries and disabilities accruing from an crash, the surviving victims experience a drastic change in their employment status and income levels. Many victims either lose their pre-crash jobs or face a sharp decline in their income post-crash. Respondents were asked details of the victims’ monthly earnings, i.e., pre crash, on resuming work post-crash and present earnings (as on 31st January 2020). Additionally, respondents were asked about the recovery period of victims and the time taken to resume their existing work or find a new job.
Before the crash, 82% of the victims from LIH and 86% of the victims from HIH were earning members of their family (Table 4.3). The proportion of male victims as earning members of the family was higher than female victims. Rural areas had more victims who were earning members of their family compared to urban areas.
Compared to pre-crash income levels, the monthly earnings of victims from LIH remained the same or reduced across all income brackets (refer to table 4.5). Nearly one-third (32%) of the victims from LIH experienced a decrease in their incomes on resuming work after the crash, compared to only one-fifth (22%) of the victims from HIH. 52% of the LIH victims continued to earn the same income compared to 73% of the HIH victims.
Even the proportion of unemployed or non-earning victims from LIH increased significantly after the crash. 18% of the respondents reported that the victim was a non-earning member of the household before the crash which increased to 27% after the crash. This proportion was later reduced to 22% as on 31st Jan 2020. In a sharp contrast to the data on LIH, among HIH, surveyed respondents said that the monthly earnings of victims were not impacted to a great extent, reducing only gradually across all income brackets (refer to Table 4.6). The non-earning members decreased from 14% before the crash to 11% on resuming work after the crash.
This indicates that road crashes cause greater financial shocks and income disruptions among victims from LIH compared to HIH. A plausible explanation for this is better placement in the job market, greater bargaining power and higher social standing enjoyed by victims from HIH. 41.5% of HIH victims were salaried employees whereas another 42% were doing business/were self-employed whereas a

Traffic Crash Injuries and Disabilities: The Burden on Indian Society
majority of the victims from LIH were either unemployed or working as unskilled labour/farmers in the agriculture sector. Working in the formal organized sector guarantees social security benefits and the extension of the social safety net to fall back upon in the event of a tragedy. Being involved or running a family business also helped the HIH victims dip into their savings reserve to make up for any losses owing to the crash. Moreover, unlike victims from poorer households who are struggling to make ends meet, victims from non-poor households can afford to halt work or take a break till their recovery is complete. This combined with good medical care hastens their recovery after a crash.
The severity of injuries and the quality of post-crash recovery plays a vital role in the rehabilitation of road crash victims. It is pertinent to note that a higher proportion of victims from both categories of households that had undergone any sort of disability received a lower salary/wage on resuming work after the crash compared to what they were earning earlier (refer to Table 4.8). Owing to disability, the decline in the monthly income of victims intensified further across households. Among LIH, the decline of income was 12% sharper for victims who underwent a disability post-crash vis-à-vis victims who did not. Similarly, among HIH, the decline in income was 25% lower than the previous income for victims who underwent any sort of disability compared to victims who did not. This indicates that irrespective of poor or rich households, disability adds another layer of disadvantage among road crash victims and cripples their life choices, putting them at a disadvantage in terms of job prospects and earning a decent income. In the absence of technological advancements, disability intensifies the impact of a road crash both at the individual and household level. 73.6% of the disabled in India are still outside the labour force (ILO,2011).16 Of these, those
with mental disability, disabled women and those in rural areas are most neglected (ILO, 2011). In the event of a road crash, PwD require medical rehabilitation and support services including counselling with regard to any technical assistance, equipment, wheelchairs, artificial limbs and so on which may be required. Additionally, once rehabilitated, PwD require vocational rehabilitation, equal educational and employment opportunities, protective and supportive socio-economic measures and the creation of a barrier-free environment to guarantee their vocational and social integration. PwD also require their legal rights to be determined by appropriate legislation. This can assure protection against discrimination, non-exclusion in social welfare, entrenched rights at the workplace, equal opportunities and accessibility to public places. The quota system that requires a certain percentage of employees to be PwD (followed by European countries and Japan) should be implemented at the State level. Fines may be levied on employers who fail to meet the prescribed quota. Further, States should also create self-employment opportunities for PwD through entrepreneurship drives and special employment schemes. The rights of the PwD arising from a road crash can be furthered within the legislative framework provided by the Rights of Persons with Disabilities Act, 2016 that replaces the Persons with Disabilities (Equal Opportunities, Protection of Rights and Full Participation) Act, 1995. The Act defines 21 types of disabilities and also addresses the needs of children with disabilities. Responsibility has been cast upon the state governments to take effective measures to ensure that PwD enjoy their rights equally with others. The progressive provisions of this act like reservation in higher education (not less than 5%), government jobs (not less than 4 %), reservation in allocation of land, poverty alleviation schemes (5% allotment) for people with benchmark disabilities should be effectively implemented by all States.
SOCIO-ECONOMIC IMPACTS OF ROAD CRASHES
16. Persons with Disability and The India Labour Market: Challenges and Opportunities’ ILO, 2011: https://www.youth4jobs.org/pdf/ilo-study-pwd.pdf

32
4.2. HABITATION & STATE-BASED VARIATIONS
Road crashes impact the entire household; not just the victim. About three-fourth (75%) of LIH respondents confirmed that their household income declined due to the crash compared to less than six-tenth (57%) of the HIH respondents. The financial impact on the household intensifies due to loss of income of the victim in case of an earning member. A higher proportion of LIH and HIH respondents reported a sharper decline in their household income in case the victim died (79%) compared to cases where the victim survived (72%). Apart from income loss, expenses like out of pocket medical expenditure on treatment of victims including hospitalization, medicine, etc. also aggravates the financial distress among households. The overall OOPE was higher for LIH (62%) than HIH (59%). LIH in urban areas reported a 6% higher OOPE than LIH in rural areas. Similarly, HIH in urban areas reported a 3% higher OOPE than HIH in rural areas.
On the question of borrowing money post-crash, there was a stark difference between LIH and HIH. Respondents from LIH were three times more likely to borrow money and sell/mortgage their family assets to cope with the financial burden post-crash. 42% of the LIH respondents stated they had to borrow money compared to 11% of the HIH respondents. In the absence of institutional and credible sources of financial support and lack of income, LIH were more likely to borrow money from informal sources like relatives/friends after an crash. Banks ask for proper documentation (that most LIH find difficult to produce) and take a longer time to approve loans as opposed to informal sources. Across households, 34% of the respondents from urban areas said they had to borrow money after the crash
compared to 78% of respondents from rural areas.
Similarly, 24% of the LIH respondents stated they had to sell/mortgage their family assets like land, jewellery etc to meet their financial expenses, compared to 7% of the respondents from HIH. Compared to urban areas, a higher percentage of LIH in rural locations opted for a loan (lenders, bank, relatives etc.), selling/mortgaging assets and taking up extra work, to cope with the financial burden. LIH in rural areas reported a slightly higher percentage (25%) of selling/mortgaging assets compared to urban areas (21%).
Similarly, 33% of the respondents from LIH said that they had to relocate for treatment either for more than 30 days or permanently after the crash compared to only 13% of the respondents from HIH. Relocation increases the cost of treatment and mounts additional costs on the household. Irrespective of the type of habitation (rural or urban), a higher percentage of LIH respondents said they had relocated after the crash compared to HIH.
Decline in total household income was sharper across all States among LIH vis-a-vis HIH. A greater percentage of LIH across States reported borrowing money and selling land/mortgaging family assets to meet their financial expenses vis-à-vis HIH. For instance, In Tamil Nadu, 30% of the respondents from LIH reported selling/mortgaging assets compared to 10% of the respondents from HIH. In Maharashtra, 44% of LIH had to borrow money compared to 8% from HIH.

Traffic Crash Injuries and Disabilities: The Burden on Indian Society
TABLE 4.3: TABLE INDICATING STATE-WISE URBAN-RURAL AND GENDER SPLIT OF FINANCIAL IMPACT ON HOUSEHOLD
Decline in total incomeof household
OOPE increased due tomedical treatment
Had to sell/ mortgagefamily assets
Had to borrow money(from anyone)
Had to relocate fortreatment for morethan 30 days
Had to sell/ mortgagefamily assets
Overall
LIH(N=1647)
Overall Urban Rural Urban Rural Male Bihar Maharashtra
LIH (N=1647) HIH (N=432)
Tamil Nadu Uttar Pradesh Bihar Maharashtra Tamil Nadu Uttar PradeshFemale Male Female
HIH(N=432) LIH (N=1647) HIH (N=432) LIH (N=1647) HIH (N=432)
Financial impacton the victim
household
74.8% 57.4% 65.1% 78.8% 55.1% 68.4% 77.4% 58.6% 60.9% 44.6% 79.4% 76.9% 59% 83.8% 66.10% 51.30% 47.60% 64.40%
62.6% 66.3% 53.3% 65.6% 72.2% 59.3% 35.9% 68.3%
22.8% 17.6% 30% 24.2% 10.4% 4.4% 10.7% 4%
43% 44.1% 31.2% 47.9% 11.3% 8% 14.6% 10.9%
24.8% 14% 13.8% 18.2% 17.4% 0.9% 1.9% 8.9%
24.8% 9.6% 11.1% 16.2% 14.8% 0.9% 1.9% 5.9%
62% 59.3% 66% 60.3% 59.8% 56.6% 62.1% 61.2% 61.5% 51.1%
23.6% 7.4% 20.7% 24.8% 5.1% 18.4% 24.4% 18.9% 7.4% 7.6%
41.6% 11.1% 26.6% 47.8% 7% 30.3% 43% 33% 12.4% 6.50%
17.7% 7.4% 18.5% 17.3% 6.2% 13.2% 18% 15.9% 8.2% 4.3%
15.4% 6% 14.5% 15.8% 4.5% 13.2% 15.5% 15% 6.2% 5.4%
SOCIO-ECONOMIC IMPACTS OF ROAD CRASHES

34
Decline in total incomeof household
OOPE increased due tomedical treatment
Had to sell/ mortgagefamily assets
Had to borrow money(from anyone)
Had to relocate fortreatment for morethan 30 days
Had to sell/ mortgagefamily assets
Overall
LIH(N=1647)
Overall Urban Rural Urban Rural Male Bihar Maharashtra
LIH (N=1647) HIH (N=432)
Tamil Nadu Uttar Pradesh Bihar Maharashtra Tamil Nadu Uttar PradeshFemale Male Female
HIH(N=432) LIH (N=1647) HIH (N=432) LIH (N=1647) HIH (N=432)
Financial impacton the victim
household
74.8% 57.4% 65.1% 78.8% 55.1% 68.4% 77.4% 58.6% 60.9% 44.6% 79.4% 76.9% 59% 83.8% 66.10% 51.30% 47.60% 64.40%
62.6% 66.3% 53.3% 65.6% 72.2% 59.3% 35.9% 68.3%
22.8% 17.6% 30% 24.2% 10.4% 4.4% 10.7% 4%
43% 44.1% 31.2% 47.9% 11.3% 8% 14.6% 10.9%
24.8% 14% 13.8% 18.2% 17.4% 0.9% 1.9% 8.9%
24.8% 9.6% 11.1% 16.2% 14.8% 0.9% 1.9% 5.9%
62% 59.3% 66% 60.3% 59.8% 56.6% 62.1% 61.2% 61.5% 51.1%
23.6% 7.4% 20.7% 24.8% 5.1% 18.4% 24.4% 18.9% 7.4% 7.6%
41.6% 11.1% 26.6% 47.8% 7% 30.3% 43% 33% 12.4% 6.50%
17.7% 7.4% 18.5% 17.3% 6.2% 13.2% 18% 15.9% 8.2% 4.3%
15.4% 6% 14.5% 15.8% 4.5% 13.2% 15.5% 15% 6.2% 5.4%

Traffic Crash Injuries and Disabilities: The Burden on Indian Society
While LIH were more dependent on loans and selling off assets to meet their expenses, they were less likely to receive compensation from insurance companies compared to HIH. One-fourth of HIH respondents (24%) said that they received compensation of about Rs.1,62,562 from insurance companies (including vehicle/ medical/ life insurance, etc.) whereas only 14% of LIH respondents said they received an average compensation of Rs.89,215. This gap highlights the asymmetry in insurance penetration and reach, and a skewed claims to coverage ratio among the rich and poor.
In terms of severity of decline in household income, every second respondent (50%) from LIH confirmed that their household underwent a severe impact whereas it was every fourth respondent (25%) among HIH who affirmed the same. Additionally, 41% of the respondents from HIH reported no impact on their household income compared to 24% of LIH respondents. Income decline was the most severe for LIH rural households (56%) compared to LIH urban (29.5%) and HIH rural (39.5%).
As part of this study, 61% of the surveyed households in low capacity States (UP, Bihar) and 46% in high capacity States (Maharashtra, TN) belonged to the BPL category. The average monthly household income of LIH in low capacity States (Rs.15,430) was found to be lower than that in high capacity States (Rs.24,702).
Overall, LIH are disproportionately affected in both Low Capacity States (LCS) and High Capacity States (HCS). However, the socio-economic impact on LIH in LCS is the most severe. For instance, the chance of survival of a LIH crash victim from low capacity states was only 53% while that from high capacity states was as high as 75%. Whereas the survivability rate was almost similar in case of HIH crash-victims from both categories of states (87% for victims from high capacity states and 88% for victims from low capacity states).
From the findings of the report its clear that across households, respondents in rural areas had to look at different mechanisms to cope with financial burden, this included borrowing money, taking a loan, selling, mortgaging assets and taking up extra work. The State Governments should ensure better implementation of social security schemes in rural areas to increase the resilience of households to cope with economic burden of road crashes. Additionally only 14% of LIH respondents received state compensation. Anecdotal evidence gathered through FGDs also points at reluctance of police officials to file FIRs in rural areas which further complicates the compensation process for them. State Governments should also address underreporting of crashes.
SOCIO-ECONOMIC IMPACTS OF ROAD CRASHES
17. The institutional capacity of states refers to the ability of states to respond to developmental challenges, the strength and resilience to take decisions and effectively implement them for better governance. Institutional capacity is a function of infrastructure, i.e., the better the quality of infrastructure, the higher is the preparedness of the State in meeting sudden challenges. A delay in making decisions also increases the cost and puts the State under greater pressure.18. Tamil Nadu ranks third in the country with a high score of 67 out of 100 followed closely by Maharashtra with a score of 64 (NITI Aayog’s Composite SDG India Index, 2019). This indicates that the States have crossed their half way mark in meeting the SDG targets for 2030. Compared to Tamil Nadu and Maharashtra, Uttar Pradesh scores 55 while Bihar scores 50 on the index. Tamil Nadu also scores the highest on the SDG goal of no poverty.

36
4.3. INSTITUTIONAL CAPACITY OF STATES 17
Maharashtra and Tamil Nadu are comparatively more economically advanced and urbanized states of India than the states of Uttar Pradesh and Bihar. The Low Capacity States of Bihar and Uttar Pradesh have historically experienced a sluggish growth rate and have had weak administrative and legal structures. Due to high poverty and a rampant law and order problem, their delivery mechanisms are weak and governance institutions and structures are underdeveloped. In terms of State performance on meeting the SDG goals18 and on Governance Performance Index (GPI)19, HCS perform better than LCS.
In the LCS, the development framework has to be Government-led since the private sector is weak and less developed. Expanding its institutional capacity and quality of service is the only way these states can catch up with the developed states. The per capita state GDP, share of urban population, share of adults (age 15+ years), and literacy rate are higher in Maharashtra and Tamil Nadu compared to UP and Bihar. At the same time, Bihar and UP are amongst the highest populated states and home to the largest proportion of poor in India (9.6 Crores). The poverty rates in Bihar (34%) and UP (29%) are significantly higher than the all India poverty rate of 22%. The proportion of
poor in urban as well as rural areas of UP and Bihar are comparatively higher than that in Maharashtra and Tamil Nadu. Also, the proportion of qualified health workers per 10,000 population and labour participation rate are comparatively low in Bihar and UP.
When it comes to framework for Road Safety, all four States have a Road Safety Policy with fixed targets20. Following a Public Interest Litigation (PIL) in 2012, Supreme Court of India appointed a Committee on Road Safety in 2014 in the case of S. Rajaseekaran Vs. UOI & Ors. W.P. ( C) 295 of 2012. The committee was formed to oversee the efforts of Central and State Governments to improve road safety. The Supreme Court Committee on Road Safety (SCCoRS) has been issuing directives to all states to create a standardised policy framework. SCCoRS has directed all States to formulate Road Safety Policies, Annual Action Plans, State Road Safety Councils, establish a Road Safety Fund and a Road Safety Cell.21,22
All four States under the purview of this study have constituted Road Safety Cells and Road Safety Councils. They have a Road Safety Fund and Action Plan as well. The Maharashtra Road Safety Cell was created last year and is supervised by the State Transport Commissioner. In Tamil Nadu, the cell has been reconstituted as a Lead Agency to assist the Joint Transport Commissioner (Road Safety)23. It comprises of 5 members, i.e., Inspector of Police, Assistant
19. The quality of governance as service delivery is measured using the overall Governance Performance Index (GPI). On the GPI, Tamil Nadu and Maharashtra have consistently featured in the top 10 best performing states whereas Bihar and Uttar Pradesh have held the slot for the worst performing states.20. http://morth-roadsafety.nic.in/index1.aspx?lsid=492&lev=2&lid=445&langid=121. https://transport.uk.gov.in/files/RoadSafetyDocs/24-09-2018.pdf 22. The Supreme Court recently appointed Mr. Justice Abhay Manohar Sapre, former Judge of this Court, as the Chairman of the aforesaid Committee on Road Safety vide Order 14-01-2020.23. Transport Commissionerate, Government of Tamil Nadu: https://tnsta.gov.in/roadsafety_legalagency.jsp

Traffic Crash Injuries and Disabilities: The Burden on Indian Society
Engineer, Highways, Office Superintendent, Medical Education, Deputy Director, IRT and Assistant Director, School Education. Besides acting as the Secretariat for the State Road Safety Council, the Cell notifies all the targets for reduction of crashes and draws the Annual Action Plan. Additionally, it manages the State Road Safety Fund and monitors all district level programmes on road safety. Further, the Tamil Nadu State Government under its Road Safety Mission has mandated the creation of Road Safety Cells in Chennai, Madurai and Coimbatore corporations.
In addition to all these functions, Road Safety Cells/Council should also be entrusted with the task to ensure that all States mandatorily publish their targets on road safety annually so that their performance can be measured against these targets. Additionally, their budgets should be reviewed by a relevant authority to maintain transparency and efficiency. Since High Capacity States have higher spending power and more effective institutional mechanisms to implement targets, a multi-level agency should be set up in every State to oversee road safety efforts and guide HCS in drawing out detailed plans.
Tamil Nadu, Maharashtra and Bihar have also seen a decline in road crash deaths over the last 4 quarters (since July 2020) with Tamil Nadu seeing a consistent drop in fatalities over the last 5 years. The state witnessed a 10%
decline in road crashes between 2018 and 2019 alone. The State’s efforts have been acknowledged by the Centre that has recently awarded it for ‘Best Performance in Road Safety’ One of the biggest reasons for an over 22% reduction in fatalities in Tamil Nadu between 2016-18 could be attributed to improved post-crash care in the State. Since VRUs are the most at risk especially in LCS, marginal improvement in post-crash emergency care and trauma services can go a long way in saving lives of road crash victims.
If we look at the pendency of Motor Accident Claims Petition (MACP) at national out level, over 8 lakh cases are pending at district and taluka level courts24. To put that in perspective, nationally, out of all original civil pending cases, 12.4 percent of the cases are MACP. As far as inter-state variations are concerned, Tamil Nadu has the highest pendency at 28.4% (1,54,847 cases) followed by Maharashtra (9.11%), Bihar (4.66%) and Uttar Pradesh (1.8%).
As far as Road Safety funding in concerned, Maharashtra State Government allocated 50 lakhs for publicity and education of road safety in its Annual Scheme 2019-2025. In terms of emergency health facilities, Maharashtra has over 930 ambulances and 23 District Hospitals as of date. The State Government has a State scheme for cashless and
24. https://njdg.ecourts.gov.in/njdgnew/?p=main/pend_dashboard25. https://plan.maharashtra.gov.in/Sitemap/plan/pdf/Annual%20Secheme%20(Departmentwise)%202019-20.pdf
SOCIO-ECONOMIC IMPACTS OF ROAD CRASHES

38
free treatment in designated hospitals.26 The Department of Medical Health & Family Welfare, Government of Uttar Pradesh has also issued detailed post-crash Guidelines for strengthening Trauma Care response system in the State through a sectoral approach (Trauma Care Guidelines for Road Traffic Injuries 2018-2025)27. The guidelines cover a wide range of topics like pre-hospital care, hospital care, rehabilitative care and establishing trauma centres in the vicinity of National Highways traversing through the State.
Looking at the data from the survey, compared to High Capacity States, a higher proportion of households in low capacity states reported an adverse impact due to crashes. This was indicated by decline in household income, living standard, food consumption, increase in OOPE on medical treatment and rising household debt.
26. https://www.hindustantimes.com/mumbai-news/maharashtra-approves-free-treatment-scheme-for-road-crash victims/story- FDPR09XLfM9eym8rDUq9lI.html27. http://uphssp.org.in/Tenders/Traumacareguidelines.pdf

Traffic Crash Injuries and Disabilities: The Burden on Indian Society
TABLE 4.4: TABLE INDICATING SUMMARY OF FINDINGS FOR HIGH AND LOW CAPACITY STATES
Particular
High Capacity States(Overall – LIH and HIH)
Low Capacity States (Overall – LIH and HIH)
LIH HIH LIH HIH
N 1038 1041
Female victims 20% 11%
BPL households 46% 61%
Avg. Monthly household income – LIH (INR) 24,702 15,430
Victims earning members of household before crash
86% 79%
Victim survived in crash77% 61%
75% 87% 53% 88%
Decline in household income after crash64% 78%
68% 50% 82% 65%
Living standard of household decreased due to crash
49% 64%
Increase in household OOPE on medical treatment 57% 65%
Increase in household debt due to crash (borrowed money)
32% 38%
Food consumption decreased after crash 34% 40%
SOCIO-ECONOMIC IMPACTS OF ROAD CRASHES

40
4.4. OUT OF POCKET EXPENDITURE (OOPE) AND TIME TAKEN TO GET BACK TO WORK
Direct financial costs are one of the major consequences of road crashes to be borne by victim households. These are tangible and can be quantified. These costs include medical costs, funeral costs, damage costs, rehabilitation costs, property costs and other such costs that have a monetary value. The five direct costs included for discussion in this section are medical costs, property/vehicle costs, legal and administrative costs, funeral costs, compensation cost and other additional costs. Indirect costs associated with crashes are often hidden and constitute a much larger cost burden than direct costs. These include job losses, productivity/income losses, reduced quality of life/decline in standard of living and even psychological impact. The loss in income, especially of a breadwinner of the family can be a crippling cost incurred on the household after a crash.
Overall, the total average costs (direct and indirect combined) borne by victim households was about Rs.1,52,339 for LIH victims. This was lower than the average costs recorded by respondents among HIH, i.e., Rs. 1,98,037. Owing to the high medical costs borne by road crash victims, especially from LIH that further pushes them into poverty and debt, the Centre has proposed a scheme for cashless treatment of road crash victims under Section 162 of the Motor Vehicles (Amendment), Act, 2019. A draft of the scheme suggests a cap of Rs 2.5 lakh for the victim’s treatment per crash and designates the National Health Authority as the nodal agency to implement the scheme under Pradhan Mantri Jan Arogya Yojana. Immediately implementing this scheme will help save a lot of lives during the crucial
golden hour. Some other States like Delhi, Odisha, Gujarat and Karnataka have also been running their own cashless assistance schemes. Though there is no standardization in terms of the cap offered on the cost of treatment, list of injuries covered and the funds available for the same. However, most State schemes cover treatment up to 48 hours after the crash except Maharashtra which covers treatment up to 72 hours. Under the Maharashtra State scheme, cashless and free treatment is provided up to 1.5 lakh per family per year.
Medical costs constituted a bulk of the total costs of LIH, i.e., Rs. 78,824 (52% of total costs) followed by loss of productivity/loss of income costs, i.e. Rs. 37, 572 (25% of total costs). Property damage is one of the key costs resulting from a road crash and refers to the damage caused to any personal/public property and to the vehicle involved in the crash. LIH incurred a lower property cost (average amount of Rs. 12,752, comprising 8% of the total income) than HIH (average amount of Rs. 28,845, comprising almost 15% of their total costs). The legal and administrative costs reported by LIH were higher compared to HIH. While LIH spent an average amount of Rs. 6,627 (4% of total costs), HIH spent an average amount of Rs. 5,629 (2.8% of the total costs) on legal and administrative costs incurred post-crash. The main heads under legal and administrative costs include police costs, costs of fire services and other emergency services (excluding transportation of casualties to hospital, which is part of medical costs), insurance costs, costs of legal cases resulting from road crashes, and costs of imprisonment etc (Wijnen et al, 2017).There is an urgent need to lower the OOPE for LIH by improving health infrastructure, especially in rural areas, investing in better training of manpower, making post-crash emergency care more accessible and efficient, ensuring more efficient penetration and coverage of LIH under health insurance.

Traffic Crash Injuries and Disabilities: The Burden on Indian Society
TABLE 4.5: TABLE INDICATING STATE WISE COMPARISON OF AVERAGE COSTS PAID BY VICTIM HOUSEHOLDS
SOCIO-ECONOMIC IMPACTS OF ROAD CRASHES
Gender wise Habitation wise
LIH (Rs.)
State wise
Urban Rural Bihar Maharashtra Tamil Nadu Uttar PradeshMale Female
Losses incurreddue to theroad crash
N
Total expenditure
Loss of income (victim & family members) during period of treatment
Loss of property/ vehicle etc. due to road crash
Out of pocket expenses on treatment of victim
Legal/ administrative/ compensation expenses including police, lawyer, etc.
Amount paid to other vehicle/ person involved in crash
Others (hospital visits, loss of belongings, food expenses, travel, etc.)
Gender wise Habitation wise
HIH (Rs.)
State wise
Urban Rural Bihar Maharashtra Tamil Nadu Uttar PradeshMale Female
Losses incurreddue to theroad crash
N
Total expenditure
Loss of income (victim & family members) during period of treatment
Loss of property/ vehicle etc. due to road crash
Out of pocket expenses on treatment of victim
Legal/ administrative/ compensation expenses including police, lawyer, etc.
Amount paid to other vehicle/ person involved in crash
Others (hospital visits, loss of belongings, food expenses, travel, etc.)
1420 227 482 1165 412 415 407 413
155950 131768 136767 159204 1,09,227 1,89,621 1,42,350 1,64,230
38,259 33,281 39,563 36,749 19,825 48,381 52,399 29,805
13,034 10,988 13,463 12,458 6,915 10,863 20,201 13,133
81,723 60,689 64,424 84,782 66,659 1,10,029 58,701 79,433
6,740 5,916 3,694 7,840 4,192 6,512 6,190 9,600
2,565 2,160 3,469 2,112 1,033 969 4,857 3,216
13,629 18,733 12,154 15,264 10,604 12,867 -- 29,042
340 92 356 76 115 113 103 101
197712 236354 222992 198189 1,47,156 1,62,907 2,49,081 2,30,800
79,159 61,465 74,316 80,422 68,957 73,885 1,13,340 45,699
30,999 20,886 28,681 29,616 28,496 19,331 40,097 28,414
64,278 46,424 59,871 63,309 27,083 68,221 74,913 75,110
5,899 4630 4,391 11,428 6,896 872 11,391 3,634
7,233 2949 5,699 9,234 12,224 598 9,340 2,943
10,143 100000 50,033 4,180 3,500 -- -- 75,000

42
Gender wise Habitation wise
LIH (Rs.)
State wise
Urban Rural Bihar Maharashtra Tamil Nadu Uttar PradeshMale Female
Losses incurreddue to theroad crash
N
Total expenditure
Loss of income (victim & family members) during period of treatment
Loss of property/ vehicle etc. due to road crash
Out of pocket expenses on treatment of victim
Legal/ administrative/ compensation expenses including police, lawyer, etc.
Amount paid to other vehicle/ person involved in crash
Others (hospital visits, loss of belongings, food expenses, travel, etc.)
Gender wise Habitation wise
HIH (Rs.)
State wise
Urban Rural Bihar Maharashtra Tamil Nadu Uttar PradeshMale Female
Losses incurreddue to theroad crash
N
Total expenditure
Loss of income (victim & family members) during period of treatment
Loss of property/ vehicle etc. due to road crash
Out of pocket expenses on treatment of victim
Legal/ administrative/ compensation expenses including police, lawyer, etc.
Amount paid to other vehicle/ person involved in crash
Others (hospital visits, loss of belongings, food expenses, travel, etc.)
1420 227 482 1165 412 415 407 413
155950 131768 136767 159204 1,09,227 1,89,621 1,42,350 1,64,230
38,259 33,281 39,563 36,749 19,825 48,381 52,399 29,805
13,034 10,988 13,463 12,458 6,915 10,863 20,201 13,133
81,723 60,689 64,424 84,782 66,659 1,10,029 58,701 79,433
6,740 5,916 3,694 7,840 4,192 6,512 6,190 9,600
2,565 2,160 3,469 2,112 1,033 969 4,857 3,216
13,629 18,733 12,154 15,264 10,604 12,867 -- 29,042
340 92 356 76 115 113 103 101
197712 236354 222992 198189 1,47,156 1,62,907 2,49,081 2,30,800
79,159 61,465 74,316 80,422 68,957 73,885 1,13,340 45,699
30,999 20,886 28,681 29,616 28,496 19,331 40,097 28,414
64,278 46,424 59,871 63,309 27,083 68,221 74,913 75,110
5,899 4630 4,391 11,428 6,896 872 11,391 3,634
7,233 2949 5,699 9,234 12,224 598 9,340 2,943
10,143 100000 50,033 4,180 3,500 -- -- 75,000

Traffic Crash Injuries and Disabilities: The Burden on Indian Society
SOCIO-ECONOMIC IMPACTS OF ROAD CRASHES
The compensation costs28 made up a minor chunk of the total costs among both LIH and HIH. While LIH paid Rs. 2,509 (1.6% of the total costs) as the average amount to the other party; HIH paid double the amount at Rs. 6,321 (3.2% of total costs). Under the purview of this study, other costs were included to be all other miscellaneous and additional costs incurred by households on travel, hospital visits, food expenses, and other arrangements during the victim’s treatment. LIH spent an average amount of Rs. 14,054 (9.2% of total costs) while HIH spent a slightly higher average amount of Rs. 21,375 (10.8% of total costs) on additional costs.
Overall, the average expense incurred on the victim’s funeral was Rs.22,242 (16% of the total costs) among LIH whereas the average costs incurred on the victim’s funeral among HIH households was 51,498 (23% of total costs), i.e., almost double the LIH costs. The highest expense among LIH on the victim’s funeral was incurred in Tamil Nadu (Rs 42, 010) while the lowest amount was spent in Uttar Pradesh (Rs 12, 517). It must be noted that in none of the cases funeral expenses were covered through insurance. Respondents among LIH were either not aware of this or did not claim funeral compensation under insurance.
A mixed-methodology study by Archana Kaushik estimated that on an average (across religious affiliations), about `8,000–`10,000 is the minimum amount spent only on cremation/burial of the deceased29. Additionally a large amount of money is spent on death rituals. The study concluded that the “expenditure on death rituals invariably
destabilises family budgets, especially among middle- and low-income households.” The interim compensation envisaged under Section 164A of the Motor Vehicles (Amendment) Act, 2019 should be implemented to ensure mechanism for quick compensation as direct credit in Aadhar linked bank accounts of the family member.
In terms of indirect costs, LIH incurred a 25% (Rs. 37, 572) loss in their household income owing to the inability to work/loss of employment whereas HIH incurred a loss of 38% (Rs. 75, 391). This made up the most significant cost for HIH followed by OOPE that comprised 30% of their total costs. Costs incurred due to loss of income was highest in Tamil Nadu among both HIH and LIH.
Bihar had the lowest average costs borne by LIH victim across all expenditure heads except out of pocket expenses on treatment of the victim and amount paid to other parties involved in the crash. It was the opposite for Tamil Nadu where average costs were higher across most of the heads except for out of pocket expenses on treatment and legal/administrative expenses. Property costs were highest among households in Tamil Nadu. Legal and administrative costs were highest among LIH in Uttar Pradesh. Among LIH, highest OOPE related costs were recorded for Maharashtra followed by Uttar Pradesh.
Out of pocket expenditure (OOPE) is the payment made directly by individuals at the point of service where the entire cost of the health good or service is not covered under any financial protection scheme. The out of pocket
28. Compensation costs refer to the amount paid by the victims/their families as compensation to the other party involved in the crash in case the crash happened due to the victim’s fault.29. https://www.epw.in/engage/article/can-you-afford-die-estimates-expenditure-rituals-and-impact-ecology

44
medical expenditure in India is over 62.4% of the overall cost of healthcare (FICCI-KPMG Report, 2017). This is an indicator of low government investment in healthcare and such expenditure is typically financed by household revenues (71%). The highest percentage of out of pocket health expenditure (52%) is made towards medicines (Rao, Nivedita, 2018, PRS). This is followed by private hospitals (22%), medical and diagnostic labs (10%), patient transportation, and emergency rescue (6%). 72% in rural and 68% in urban areas is spent on buying medicines for non-hospitalised treatment. The private sector provides more than 80% of outpatient care and 60% of inpatient care. Out of the total household expenditure, 45% is spent on outpatient care (including both general and special treatment) as compared to 35% on inpatient care. Due to high out of pocket healthcare expenditure, about 7% population is pushed below the poverty threshold every year (NSSO Survey, 2014).
Under this study, respondents were asked to provide an estimate of their household’s medical expenses after the crash. Medical costs cover the entire post-crash expenditure on the victim’s treatment. It includes the Out of Pocket Expenditure (OOPE) on hospitalisation costs, costs on medicines and other medical apparatus etc. The findings revealed that on an average, LIH spent a little more than half (52%) of all their income as out of pocket expenses on the victim’s treatment (hospitalisation, medicines, care). In terms of the average amount, out of pocket expenses on treatment of LIH victims accounted for Rs.78,824. On the other hand, HIH reported spending 30.5% of their household income, i.e., Rs.60,476 on the victim’s post-crash treatment and recovery.
The Central Government should notify and implement the scheme for cashless treatment of road crash victims under Section 162 of the Motor Vehicles (Amendment) Act’ 19. The cashless treatment scheme will help in alleviating the OOPE on victim’s treatment.
OOPE varies enormously by type of disease, health care provider (public/private), quality of care and geographical region. This study illustrates that OOPE related costs were higher among males than females. Additionally, expenditure on OOPE in urban areas was higher compared to rural areas among both households. Among the LIH in urban areas, OOPE was slightly higher at 66% of the total expense compared to 60% of the total expense among HIH in rural areas. Across both categories of households, a higher proportion of respondents (almost double) reported an increase in their OOPE in case the victim survived. Interestingly, among HIH, the highest OOPE related household costs were recorded in Bihar (72%) and the lowest were recorded in Tamil Nadu (35%).
Not only do LIH spend more on medical costs, victims from LIH also take double the time to recover from their injuries and resume work after an crash compared to victims from HIH. While victims from LIH took about 92 days, i.e. 3 months to resume work, victims from HIH took 43 days, i.e., about 1.5 months to return to their jobs. Similarly, victims from LIH also took nearly double the time to find a new job after the crash compared to victims from HIH. While victims from LIH took 107 days to assume a new job, victims from HIH took 65 days for the same.

Traffic Crash Injuries and Disabilities: The Burden on Indian Society
“He received the salary for that month but for 5-6 months he was
on a complete bed rest. All the load fell upon me.”
- Female FGD Respondent
30. Chief Wage Earner refers to a person who contributes the maximum to the monthly expenses of the household.
4.5. GENDER-DIFFERENTIATED TRENDS AND IMPACTS
While road fatalities continue to be disproportionately higher among male road users, the consequences of a road crash create an unfavourable impact among the female members of a household. It helps us better conceptualise the impact of road crashes on women, especially from poor households in the framework of functioning and capabilities (Sen and Nussbaum). Functionings are ‘beings and doings’, that is, various states of human beings and activities that a person can undertake. Capabilities are a person’s real freedoms or opportunities to achieve functionings. According to the capability approach, functionings and capabilities are constitutive of a person’s core being and can be used as the best yardstick to evaluate one’s well-being and freedom (Sen, 1992). These beings and doings together hold what makes a life valuable. Road crashes can be conceptualised as a sudden unforeseen assault on capabilities and functionings that curtails the freedom of victims to realise their best optimal potential and live a dignified life. Crashes not only derail the lives of the victims but they also jeopardise the realizations and potential of family members of victims, coercing them into untold misery and suffering.
In case the sole breadwinner of the household expires post-crash or a key earning member suffers serious injuries and hospitalisation, the burden of running the household falls on the shoulders of female members.
SOCIO-ECONOMIC IMPACTS OF ROAD CRASHES
Out of the 1724 crash victims identified as earning members of the household by the respondents of this study, 1353 were identified as Chief Wage Earners of the household30, i.e., almost 79% of all crash victims were the Chief Wage Earners (CWE) of their households. 78% of the LIH victims were CWE whereas 71% of the HIH victims were CWE. Across household categories, the proportion of men reported as the Chief Wage Earners was significantly higher than women, men from LIH being the highest. 50% of the women from LIH and 55% from HIH were CWE of the household before the crash whereas 81% of the men from LIH and 74% men from HIH were CWE before the crash. Uttar Pradesh had the highest number of CWE as victims (80%) from LIH while Maharashtra had the highest CWE as

46
victims from HIH (78%).
The involvement of the CWE in the crash affects the household’s financial status adversely, especially among LIH. The severe impact of decline in income was higher among rural households, and cases where victims had died as well as where victims were males. 31% of the female members in LIH were severely affected by the decline in household income after the crash whereas 53.5% of the male members were severely affected by the same. Among HIH, 18.5% of female members of the household were severely affected compared to 26.5% of the male members. Income decline was severe for rural LIH rural (56%) compared to urban HIH (29.5%) and rural HIH (39.5%).
As per survey findings, the contribution of LIH victims (60%) who succumbed to their injuries after the crash to the total household income was a little higher than that of the victims belonging to HIH (57%). State-wise, the highest contribution of victims was reported from LIH in Maharashtra (64%) while the lowest was reported from LIH in Tamil Nadu (56%).
The male (dead) victims’ contribution to household income was significantly higher than female victims’ (more than double) across both categories of households. For instance, among LIH, male (dead) victims contributed to 63.5% of the total monthly household income whereas female victims contributed to 29% of the same. Similarly, the contribution of victims from rural areas to the total household income was higher than the victims living in urban areas across
both household types; the highest being among HIH rural households (69%).
Along with income, the pattern of (surviving) victims’ contribution to household income was also examined. Respondents were asked to report the victims’ contribution to the household’s total income pre-crash, on resuming work after the crash and the current status as on 31st Jan 2020. Among LIH, while victims were contributing 56% of the total household income before the crash, their share was reduced by 10% after the crash with 46% of the surviving victims contributing to total household income on resuming work. With a reduction in monthly income, the contribution to total household income was also reduced among the LIH. An almost similar trend was observed across all the States with Uttar Pradesh registering the sharpest decline.
During the survey, LIH respondents had stated that in case of the victim being the breadwinner of the family, other family members had to shoulder responsibility for the sudden unforeseen expenses. In many cases, they had to arrange for loans from lenders/banks/relatives or sell/mortgage assets like land, jewellery, etc. to manage household expenses. LIH respondents also stated that in the absence of any steady primary source of income, the women of the household often had to step up and take additional jobs to mitigate the financial burden.
Women and labour can be used interchangeably. Women who enter the labour market for remunerative work often

Traffic Crash Injuries and Disabilities: The Burden on Indian Society
“It was a tough period and hard task. We had to wake up early in the morning. We had to look after the children and provide for the medicines. In fact, we had to do everything
all alone”
- FGD Respondent, Patna.
“No, I started doing this (stitching) after the crash as the person, from whom I borrowed money at the time of the crash, started asking for money. I had to take a micro finance loan and since I had to repay it, I had to take up stitching work. I took
around Rs.30,000 and with interest gave back around Rs
36,000.”
- FGD Respondent
also perform additional household labour in developing countries. Caregiving is an unacknowledged undervalued activity predominantly undertaken by women within households. This includes nursing and looking after the daily needs of an injured person or dependent within the household, cooking for them, administering medicines to them, making their bed, assisting them to clean up etc. In terms of economic value, these activities are non-remunerative in nature and add to the double burden of work for women and also lead to time-poverty.
This section was thus an attempt to highlight the gendered impact of road crashes that is mostly underreported
and unacknowledged within research studies and policy making. States need to acknowledge that gender responsive reporting and monitoring is essential to evaluate the impact of road crashes on women. WHO also recommends that “Gender differences in the social and economic consequences of temporary and/or permanent disability resulting from injury have to be taken into account when planning rehabilitation services” (WHO, 2002). To ensure rehabilitation services as well as adequate support to either women road crash victims or families which are left to deal with loss of male breadwinner, gender disaggregated data at state and district level would be imperative to create gender responsive post-road crash safety nets.
SOCIO-ECONOMIC IMPACTS OF ROAD CRASHES

48
4.6. DIFFERENTIAL ABILITY TO COPE/ RESPOND TO A FINANCIAL CRISIS POST-CRASH - LIH VS HIH
Road crashes alter the socio-economic realities of families both in the short and long run. Road crashes chronically lower the Quality of Life (QoL), as measured by pain/discomfort during usual activities, mobility, self-care, and mental issues. The main cost item related to serious road injuries is loss of opportunities to participate in market production due to disability or sick leave. It includes the loss of productivity and loss in income due to not being able to work. During the study, the loss in income/productivity and other additional costs were self-reported by the respondents in terms of an average estimate while the standard of living costs were determined based on a qualitative assessment of the responses collected from respondents among both households.
The loss in income was self-reported by respondents on the basis of days of work they had to forsake during treatment/recovery post-crash care. This also includes the income forsaken of the family member/s accompanying the victim to the hospital for treatment or looking after him/her at home, thus not being able to report to work. In terms of average loss of income reported by the respondents during the period of treatment, including that of the victim and family member(s), the average loss was estimated to be Rs.37,572 for LIH, i.e., 25% of their total costs. While it was estimated to be Rs. 75, 291 for HIH, i.e., 39% of the total costs. It’s also important to note that for HIH, loss
of income is the biggest component while looking at total costs. OOPE further adds to the burden for both LIH & HIH and drives them into financial distress.
Economic resources, including both cash and noncash income, determine the economic well-being of households. Cash income is the most widely employed measure of household economic well-being, but it excludes considerable amounts of resources received in a noncash form (Smeeding, 1993). These include health care, housing, education, child care, transportation, food, and other subsidies from governments or from other third parties (i.e., employers), and in-kind transfers received from relatives, friends and others in the form of food, clothing and/or shelter (Smeeding, 1993). Standard of living under the purview of this study has been defined as the level of wealth, comfort goods, material goods and necessities required to live a comfortable and fulfilling life; it includes non-cash resources that make a good life.
Nearly two-third (63.5%) of the respondents from LIH said that their family had undergone a deterioration in their living standards after the crash compared to less than three out of ten (29%) respondents from HIH who confirmed the same. An adverse impact on the living standard was confirmed by a higher proportion of respondents in cases where victims had died as well as where victims were male earning members of the family. Bihar reported the sharpest decline in living standards among LIH (73%) followed by Uttar Pradesh (72%). The decline was consistently low across all States for LIH (50% and above). Similarly, among HIH, Bihar again recorded the highest decline in living standards (40%) followed by Tamil Nadu (35%).
Traffic Crash Injuries and Disabilities: The Burden on Indian Society
SOCIO-ECONOMIC IMPACTS OF ROAD CRASHES
Financial impact on the living standards of poor victims and their families (LIH) is more severe than those for rich victims and their families (HIH). Lack of financial resources leads to poor households making many compromises in terms of food consumption levels and cutting down on everyday items, even essentials to make ends meet. Financial distress affects the quality of life and can lead to health complications, depression, sleeping problems and other health issues among the victim/family. Among LIH, 38.5% of the respondents reported a severe deterioration in their living standards after the crash while among HIH, only 13% of the respondents said the same. Around 69% of the respondents from HIH chose the option “none”, i.e., they did not witness any change in their living standards and could comfortably tide over the post-crash situation.
To cope with the excessive financial burden caused due to the crash, various mechanisms are used by victims/their family members to tide over the crisis. Mechanisms such as availing of loans, selling assets or taking up extra additional work by household members, dipping into family savings, etc. are exercised by victims and/or their family members. This section examines such mechanisms and contrasts the differences in which they are used by members of poor and rich households. The findings reveal that compared to HIH, LIH were three times more likely to seek financial help in order to cope with the financial burden post-crash. They took mostly informal loans from close friends/relatives, sold/mortgaged their family assets (land, jewellery, motor-vehicle) to meet their expenses.
About 42% of LIH reported that their household underwent debt after borrowing money (through both formal and informal sources), compared to 11% of respondents from HIH. The average value of loans taken by LIH was Rs. 99,850. Similarly, about one-fourth of the LIH (24%) sold/
mortgaged their assets to meet their daily expenses and repay their debt, compared to only 7% of HIH. At the same time, about 14% of LIH reported taking up extra work to deal with the situation, compared to 4% of HIH.
Compared to urban areas, a higher percentage of LIH in rural locations availed a loan, sold/mortgaged their assets and took up extra work, to cope with the financial burden. In the absence of institutional and credible sources of financial support and lack of income, LIH were more likely to borrow money from relatives/friends. Banks usually ask for proper documentation (that most LIH find difficult to produce) and take a longer time to approve loans as opposed to informal sources. 48% of the LIH in Uttar Pradesh availed for a loan to deal with the financial burden while 15% of the HIH from Tamil Nadu did so, exposing a wide contrast between the households. The ability to take a loan from institutional sources also depends on one’s socioeconomic status and further makes the process of repayment more strenuous for poor households.
Compared to other states, the highest proportion LIH from Tamil Nadu sold/mortgaged their assets, took on extra work and received compensation from the insurance company as well as other parties involved in the crash to deal with their financial burden. While LIH were more dependent on loans and selling off assets to meet their expenses, they were less likely to receive compensation from insurance companies compared to HIH. One-fourth of HIH (24%) received compensation of about Rs.1,62,562 from insurance companies (including vehicle/ medical/ life insurance, etc.) while only 14% of LIH received an average compensation of Rs.89,215. This gap highlights the asymmetry in insurance penetration and compensation claims by the rich and poor. Though merely increasing insurance coverage is also not enough. There exists

50
an information asymmetry on awareness of insurance scheme and its benefits, Health insurance coverage in India particularly remains poor because the private health insurance industry is still at a nascent stage, the pool of people who are able and willing to pay for insurance is low, and insurance premiums are high. Further because LIH, especially in rural India, have limited access to healthcare services such as doctors and hospitals, they are less likely to buy health insurance. Additionally, insurance policies need to be made more comprehensive and inclusive by including mental health and rehabilitative care for road crash victims under its scope.
A higher percentage of respondents from HIH said they relied on their savings to meet their additional expenses post-crash. While about 7 out of 10 LIH dipped into their family savings (averaging at Rs.92,065), as high as 9 out of 10 HIH households used their family savings (averaging at Rs.1,45,401) to meet the additional expenses.
In terms of the amount arranged to tide over the economic crisis, LIH from Maharashtra managed to raise the highest amount whereas among HIH, a similar trend was observed in Tamil Nadu. Interestingly, LIH in Uttar Pradesh (over 2.5 lakhs on an average) received the highest compensation from Government schemes at the central and local level followed by Maharashtra (around 1lakh average). The lowest government compensation was received by LIH in Bihar (44,000). LIH in Maharashtra (1.8 lakhs) received the highest compensation from insurance companies followed by Uttar Pradesh (around 1.4 lakhs). HIH in Uttar Pradesh reported the highest compensation amount at around 4 lakhs followed by Bihar (2.3 lakhs).

Traffic Crash Injuries and Disabilities: The Burden on Indian Society
SOCIO-ECONOMIC IMPACTS OF ROAD CRASHES
TABLE 4.6: TABLE INDICATING MECHANISMS TO COPE WITH FINANCIAL BURDEN - LIH VS HIH
41.8% Rs.99,850
43.2%Rs.1,01,927
33%Rs.82,880
27.0% Rs. 85,874
47.9% Rs.1,03,107
43.2% Rs. 96,874
44.1% Rs.1,27,421
31.4% Rs. 74,024
48.2% Rs. 93,771
11.1% Rs. 92,218
12.4%Rs. 92,294
6.5%Rs. 91,683
7.0% Rs. 1,20,004
30.3% Rs. 62,015
11.3% Rs. 30,881
8.0% Rs. 1,34,444
14.6% Rs. 1,15,333
10.9% Rs. 98,636
7.4%Rs. 81,920
7.6%Rs. 50,143
5.1% Rs. 1,01,444
18.4% Rs. 40,929
10.4% Rs. 19,083
4.4% Rs. 44,000
10.7% Rs. 1,40,909
4.0% Rs. 1,00,000
4.1%Rs. 19,214
3.3%Rs. 16,667
0.8% Rs. 16,667
18.4% Rs. 19,214
8.7% Rs. 5,000
0.9% Rs. 20,000
4.9% Rs. 44,800
1.0% Rs. 25,000
2.9%Rs. 60,900
1.1%Rs. 1,500
1.1% Rs. 25,750
9.2% Rs. 72,500
7.0% Rs. 57,375
0.9% Rs. 1,500
1.0% Rs. 1,00,000
1.0% Rs. 50,000
2.9%Rs. 11,900
2.2%Rs. 12,000
0.8% Rs. 22,000
11.8% Rs. 8,556
7.8% Rs. 3,111
0.9% Rs. 15,000
1.0% Rs. 50,000
1.0% Rs. 50,000
10.9%Rs. 99,484
5.4%Rs. 18,020
6.5% Rs. 57,222
25.0% Rs. 1,29,205
10.4% Rs. 17,917
5.3% Rs. 1,13,333
20.4% Rs. 1,24,571
3.0% Rs. 86,667
4.4%Rs. 45,287
2.2% Rs. 54,388
9.2% Rs. 34,886
7.0% Rs. 25,288
3.5% Rs. 63,000
2.9% Rs. 75,000
26.2%Rs.1,81,319
16.3%Rs. 51,267
22.8% Rs. 1,89,844
30.3% Rs. 66,478
17.4% Rs. 2,32,450
31.9% Rs. 31,706
25.2% Rs. 89,846
21.8% Rs. 3,99,091
7.4% Rs. 74,969
3.9% Rs. 18,765
24.1% Rs. 1,62,562
2.5% Rs. 55,500
3.5% Rs. 45,287
2.8% Rs. 11,917
9.7% Rs. 89,786
23.7% Rs.98,608
14.4% Rs.5,475
OverallGender wise Habitation wise
LIH [N=1647] Yes % and Average amount (Rs.)
State wise
Urban Rural Bihar Maharashtra Tamil Nadu Uttar PradeshMale Female
Arrangements to cope-up
with the financial burden
OverallGender wise Habitation wise
HIH [N=432] Yes % and Average amount in (Rs.)
State wise
Urban Rural Bihar Maharashtra Tamil Nadu Uttar PradeshMale Female
Arrangements to cope-up
with the financial burden
Arranged a loan (lenders, bank, relatives, etc.)
Sold/ mortgage assets (land, jewellery, motor vehicle etc.)
Took on extra work by household members (monthly extra earning)
Compensation from the insurance company (including vehicle/ life insurance, etc.)
Received compensation under schemes (govt., local authorities, funeral expense, etc.)
Received compensation from employer
Dependent was provided job by employer/ govt. (monthly income)
Received compensation from other party involved in a road crash
Spent from family savings
14.1% Rs.89,215
8.3% Rs.1,20,478
6.0% Rs.52,729
6.3% Rs.54,253
4.0%Rs. 37,667
7.5% Rs. 20,147
5.3% Rs. 71,648
8.7% Rs. 31,414
6.3% Rs. 79,692
5.2% Rs. 50,076
3.6% Rs. 60,867
8.7% Rs.1,27,411
5.7% Rs.54,346
5.4% Rs. 50,981
9.5% Rs. 1,36,757
13.1% Rs. 44,019
4.3% Rs. 1,04,222
5.2% Rs. 45,333
10.7% Rs. 2,56,830
13.8% Rs.95,753
16.3% Rs.54,581
16.4% Rs. 99,009
13.2% Rs. 84,190
11.9% Rs. 84,239
7.2% Rs. 1,80,483
29.0% Rs. 53,203
8.7% Rs. 1,37,967
15.6% Rs.5,359
6.6% Rs.7,200
11.8% Rs. 5,414
15.5% Rs. 5,494
17.2% Rs. 4,201
12.3% Rs. 4,539
19.4% Rs. 7,384
8.7% Rs. 5,125
24.4%Rs.1,03,034
19.4%Rs.63,807
21.0% Rs. 51,228
24.8% Rs.1,15,167
22.8% Rs. 1,07,468
17.6% Rs. 1,43,566
30.2% Rs. 49,033
24.2% Rs. 1,18,440
3.2% Rs.7,721
3.3% Rs.7,309
2.2% Rs. 11,600
4.6% Rs. 6,623
2.6% Rs. 8,527
7.3% Rs. 4,957
0.5% Rs. 16,500
2.2% Rs. 11,222
2.7% Rs. 10,800
9.8% Rs.64,572
9.2% Rs.70,301
13.7% Rs. 40,361
13.3% Rs. 31,007
8.4% Rs. 86,492
10.2% Rs. 19,778
5.3% Rs. 1,69,000
21.6% Rs. 47,852
2.4% Rs. 1,70,100
74.7% Rs.92,065
74%Rs.93,818
79.3%Rs. 81,833
87.3% Rs. 94,251
69.5% Rs.90,930
67.0% Rs.70,509
82.2% Rs. 96,487
77.9% Rs.110195
71.9% Rs.87,671
91.9% Rs. 1,45,401
90%Rs. 1,53,170
98.9%Rs. 1,19,279
93.8% Rs. 1,44,517
82.9% Rs. 1,50,089
87.8% Rs. 1,25,813
96.5% Rs. 1,32,450
94.2% Rs. 1,87,374
89.1% Rs. 1,37,832

52
41.8% Rs.99,850
43.2%Rs.1,01,927
33%Rs.82,880
27.0% Rs. 85,874
47.9% Rs.1,03,107
43.2% Rs. 96,874
44.1% Rs.1,27,421
31.4% Rs. 74,024
48.2% Rs. 93,771
11.1% Rs. 92,218
12.4%Rs. 92,294
6.5%Rs. 91,683
7.0% Rs. 1,20,004
30.3% Rs. 62,015
11.3% Rs. 30,881
8.0% Rs. 1,34,444
14.6% Rs. 1,15,333
10.9% Rs. 98,636
7.4%Rs. 81,920
7.6%Rs. 50,143
5.1% Rs. 1,01,444
18.4% Rs. 40,929
10.4% Rs. 19,083
4.4% Rs. 44,000
10.7% Rs. 1,40,909
4.0% Rs. 1,00,000
4.1%Rs. 19,214
3.3%Rs. 16,667
0.8% Rs. 16,667
18.4% Rs. 19,214
8.7% Rs. 5,000
0.9% Rs. 20,000
4.9% Rs. 44,800
1.0% Rs. 25,000
2.9%Rs. 60,900
1.1%Rs. 1,500
1.1% Rs. 25,750
9.2% Rs. 72,500
7.0% Rs. 57,375
0.9% Rs. 1,500
1.0% Rs. 1,00,000
1.0% Rs. 50,000
2.9%Rs. 11,900
2.2%Rs. 12,000
0.8% Rs. 22,000
11.8% Rs. 8,556
7.8% Rs. 3,111
0.9% Rs. 15,000
1.0% Rs. 50,000
1.0% Rs. 50,000
10.9%Rs. 99,484
5.4%Rs. 18,020
6.5% Rs. 57,222
25.0% Rs. 1,29,205
10.4% Rs. 17,917
5.3% Rs. 1,13,333
20.4% Rs. 1,24,571
3.0% Rs. 86,667
4.4%Rs. 45,287
2.2% Rs. 54,388
9.2% Rs. 34,886
7.0% Rs. 25,288
3.5% Rs. 63,000
2.9% Rs. 75,000
26.2%Rs.1,81,319
16.3%Rs. 51,267
22.8% Rs. 1,89,844
30.3% Rs. 66,478
17.4% Rs. 2,32,450
31.9% Rs. 31,706
25.2% Rs. 89,846
21.8% Rs. 3,99,091
7.4% Rs. 74,969
3.9% Rs. 18,765
24.1% Rs. 1,62,562
2.5% Rs. 55,500
3.5% Rs. 45,287
2.8% Rs. 11,917
9.7% Rs. 89,786
23.7% Rs.98,608
14.4% Rs.5,475
OverallGender wise Habitation wise
LIH [N=1647] Yes % and Average amount (Rs.)
State wise
Urban Rural Bihar Maharashtra Tamil Nadu Uttar PradeshMale Female
Arrangements to cope-up
with the financial burden
OverallGender wise Habitation wise
HIH [N=432] Yes % and Average amount in (Rs.)
State wise
Urban Rural Bihar Maharashtra Tamil Nadu Uttar PradeshMale Female
Arrangements to cope-up
with the financial burden
Arranged a loan (lenders, bank, relatives, etc.)
Sold/ mortgage assets (land, jewellery, motor vehicle etc.)
Took on extra work by household members (monthly extra earning)
Compensation from the insurance company (including vehicle/ life insurance, etc.)
Received compensation under schemes (govt., local authorities, funeral expense, etc.)
Received compensation from employer
Dependent was provided job by employer/ govt. (monthly income)
Received compensation from other party involved in a road crash
Spent from family savings
Arranged a loan (lenders, bank, relatives, etc.)
Sold/ mortgage assets (land, jewellery, motor vehicle etc.)
Took on extra work by household members (monthly extra earning)
Compensation from the insurance company (including vehicle/ life insurance, etc.)
Received compensation under schemes (govt., local authorities, funeral expense, etc.)
Received compensation from employer
Dependent was provided job by employer/ govt. (monthly income)
Received compensation from other party involved in a road crash
Spent from family savings
14.1% Rs.89,215
8.3% Rs.1,20,478
6.0% Rs.52,729
6.3% Rs.54,253
4.0%Rs. 37,667
7.5% Rs. 20,147
5.3% Rs. 71,648
8.7% Rs. 31,414
6.3% Rs. 79,692
5.2% Rs. 50,076
3.6% Rs. 60,867
8.7% Rs.1,27,411
5.7% Rs.54,346
5.4% Rs. 50,981
9.5% Rs. 1,36,757
13.1% Rs. 44,019
4.3% Rs. 1,04,222
5.2% Rs. 45,333
10.7% Rs. 2,56,830
13.8% Rs.95,753
16.3% Rs.54,581
16.4% Rs. 99,009
13.2% Rs. 84,190
11.9% Rs. 84,239
7.2% Rs. 1,80,483
29.0% Rs. 53,203
8.7% Rs. 1,37,967
15.6% Rs.5,359
6.6% Rs.7,200
11.8% Rs. 5,414
15.5% Rs. 5,494
17.2% Rs. 4,201
12.3% Rs. 4,539
19.4% Rs. 7,384
8.7% Rs. 5,125
24.4%Rs.1,03,034
19.4%Rs.63,807
21.0% Rs. 51,228
24.8% Rs.1,15,167
22.8% Rs. 1,07,468
17.6% Rs. 1,43,566
30.2% Rs. 49,033
24.2% Rs. 1,18,440
3.2% Rs.7,721
3.3% Rs.7,309
2.2% Rs. 11,600
4.6% Rs. 6,623
2.6% Rs. 8,527
7.3% Rs. 4,957
0.5% Rs. 16,500
2.2% Rs. 11,222
2.7% Rs. 10,800
9.8% Rs.64,572
9.2% Rs.70,301
13.7% Rs. 40,361
13.3% Rs. 31,007
8.4% Rs. 86,492
10.2% Rs. 19,778
5.3% Rs. 1,69,000
21.6% Rs. 47,852
2.4% Rs. 1,70,100
74.7% Rs.92,065
74%Rs.93,818
79.3%Rs. 81,833
87.3% Rs. 94,251
69.5% Rs.90,930
67.0% Rs.70,509
82.2% Rs. 96,487
77.9% Rs.110195
71.9% Rs.87,671
91.9% Rs. 1,45,401
90%Rs. 1,53,170
98.9%Rs. 1,19,279
93.8% Rs. 1,44,517
82.9% Rs. 1,50,089
87.8% Rs. 1,25,813
96.5% Rs. 1,32,450
94.2% Rs. 1,87,374
89.1% Rs. 1,37,832

Traffic Crash Injuries and Disabilities: The Burden on Indian Society
SOCIO-ECONOMIC IMPACTS OF ROAD CRASHES
31. India ranks 145th among 195 countries on the Global Healthcare Access and Quality Index (HAQ) created by the Global Burden of Disease Index study (Lancet, 2016). While the global average per capita spending on healthcare is $822, the WHO estimates India’s per capita health expenditure per year to be $63 that translates to Rs 4,200 (WHO, 2018). Unfortunately, post-accident emergency healthcare is not given the attention or resources it deserves in a country that witnesses over 400 road vtv in a day. Among the poorest households, 90% do not have private or government health insurance. While richer households fare better, coverage among them also remains poor as 67% of urban households lack insurance (NSS, MoSPI, 75th Round Social Consumption in India Survey, July 2017-June 2018).
6-POINT POLICY RECOMMENDATIONS:
1. Differentiated Support for VRUs, especially from Rural LIH.
The findings of the study show linkages between VRUs, LIH and road crash outcomes, indicating the need to invest more in VRU friendly infrastructure that prioritises their safety especially in rural areas. State Governments should select districts with a high VRU crash rate and prioritise their safety through dedicated Annual Action Plans.
2. Urgent need to lower the OOPE for LIH.
Out of Pocket Expenses (OOPE) is the most significant direct cost borne by victim families among LIH. The risk of catastrophic expenditure is inversely proportional to increasing income per capita, i.e., it is significantly larger for those belonging to lower-income quartiles than for those belonging to the highest income quartile.
The Central Government needs to urgently notify the scheme for cashless treatment of road crash victims and publicize the Good Samaritan Law in order to save more lives during the critical golden hour. Currently, the Centre has proposed such a scheme under Section 162 of the Motor Vehicles (Amendment), Act, 19. The proposed scheme suggests a cap of Rs 2.5 lakh for the victim’s treatment per crash and designates the National Health Authority as the nodal agency to implement the scheme under Pradhan Mantri Jan Arogya Yojana.
The lack of infrastructure at the primary level, lack
of awareness on life-saving protocols among local communities and first responders, low doctor-patient ratio and inefficient emergency management increases the costs for post-crash care. There is an urgent need to lower the OOPE for LIH by improving health infrastructure, especially in rural areas, investing in better training of manpower, making post-crash emergency care more accessible and efficient, ensuring more efficient penetration and coverage of LIH under health insurance.31
3. Make insurance policies more inclusive by covering for rehabilitation and recovery of road crash victims.
Additionally, insurance schemes should also account for the mental health impact of road crashes on victims and design more progressive policies. Establish a neuro-spinal Rehab centre at the District level for all States. Merely increasing insurance coverage is not enough as not all those who are enrolled know about the scheme or its benefits, not all the poor are covered, and not everyone has access to healthcare. Health insurance coverage in India remains poor because the private health insurance industry is still at a nascent stage, the pool of people who are able and willing to pay for insurance is low, and insurance premiums are high. Further because LIH, especially in rural India, have limited access to healthcare services such as doctors and hospitals, they are less likely to buy health insurance.
4. Better Gender Disaggregated Data.
Gender responsive reporting and monitoring is essential to evaluate the impact of road crashes on women. WHO also recommends that “Gender differences in the social and economic consequences of temporary and/or permanent

54
disability resulting from injury have to be taken into account when planning rehabilitation services” (WHO, 2002). To ensure rehabilitation services as well as adequate support to either women road crash victims or families which are left to deal with loss of male breadwinner, gender disaggregated data at state and district level would be imperative to create gender responsive post-road crash safety nets.
To ensure rehabilitation services as well as adequate support to either women road crash victims or families which are left to deal with loss of male breadwinner, gender disaggregated data at state and district level would be imperative to create gender responsive post-road crash safety nets. This can be achieved by conducting gender-disaggregated rapid surveys with commuters, bus conductors and public transport officials to assess their awareness and perceptions of sexual harassment in urban public spaces.
Additionally, States can also conduct universal accessibility and women’s safety audits to assess the quality of urban transport infrastructure (bus and IPT stops, trains stations, terminals and interchanges) using the indicators and service level benchmarks identified by agencies like Safetypin and evaluate gaps. States can also assess the feeder roads/services in providing last mile connectivity.
5. Mandatory publishing of Real-Time Data, Road Safety Targets by every State to ensure Planned, Targeted Spending
It should be made mandatory for all States to publish their targets on road safety annually so that their performance
can be measured against these targets. Additionally, their budgets should be reviewed by a relevant authority to maintain transparency and efficiency. Since High Capacity States have higher spending power and more effective institutional mechanisms to implement targets, a multi-level agency should be set up in every State to oversee road safety efforts and guide HCS in drawing out detailed plans.
6. Sensitisation among the media and police for greater reporting on crash cases and filing of FIRs.
Road safety educational programmes need to be enhanced for the education and sensitisation of targeted sections. For instance, the WHO Media Fellowship offers reporters a curriculum to help make their reporting around road crashes more nuanced. A similar model needs to be replicated at State level to ensure in-depth comprehensive and science-based coverage.
High levels of underreporting of crashes and the poor state of post-crash care exacerbates the problem of estimating the cost of road crashes among LMICs (WB, 2020). The invisibility of indirect costs further adds to the difficulty in estimating an accurate and fair compensation amount to be awarded to victims by the court and governments.

Traffic Crash Injuries and Disabilities: The Burden on Indian Society
CH
AP
TE
R 5
GENDERED IMPACT OF ROAD CRASHES
As per the Accidental Deaths and Suicides (ADSI) in India 2019 report, 1,54,732 people were killed and 4,39,262 people were injured in 4,37,396 road crashes in India in 2019. Out of this, 14.31% (22,143) were women. Out of the total 22,143 female victims over 60% women died in rural areas. Similarly, over 60% of the women were also injured in rural areas. The fact that the majority of female road crashes happened in rural areas highlights the exposure to risk on rural roads.
Even though crash victims are predominantly male, ‘the impact on household livelihood due to death or injury places significantly more burden on women’ (Turner & Fletcher, 2008). This is due to multiple reasons. The burden of care disproportionately falls on the woman which further causes time poverty for women. Additionally, women also have to cope up with ‘loss of significant male income’. Considering the nature of Indian society, prevalence of patriarchy and gender-based stereotypes, the need to map the linkages between gender, road safety and poverty is important. Since the majority of male road crash victims also die on rural roads, understanding and addressing the impact of these linkages in rural areas is even more important.
In the context of the current COVID-19 pandemic, the impact of socio-economic vulnerabilities on women has further deteriorated their position at household and state-level. “COVID-19 has led to a sharp rise in unequal burden

56
of unpaid care work, depletion of household assets, income shocks and liquidity constraints, decline in female labour force participation, and significant impacts on health and nutrition, exacerbated by existing inequities in health access.”
Its therefore even more pertinent to understand the impact of road crashes on households from a gender perspective. There has been a data bias towards the male point of view and experience in research generally (Perez, 2019) and this is also true for the issue area of road safety. For a comprehensive perspective on the impact of road crashes on women their ‘lived experiences’ were documented through female-only focus group discussions. Respondents’ perceptions on solutions as well as institutional benefits were also captured.
As part of the study, two focus group discussions were conducted with women. Since both Bihar & UP are one of the poorest states in India, and lag behind Maharashtra & Tamil Nadu in crucial human development outcomes such as health and nutrition, education, food security as well as gender development indices, FGDs were conducted in the capital cities of Uttar Pradesh and Bihar with LIH respondent group. Most of the women were middle aged (in their 30s and 40s) and were mostly housewives. Most of them had experienced the crash of a male member of the family (husband or brother- in- law) and in cases where
the victim suffered serious injuries were directly involved in caregiving activities.
“Being a woman, we face a lot of problems. Whether a man meets with an crash or a woman, it is the woman who has to handle everything. From household
activities to serving the patient. In case the woman herself is the
victim, then the whole house gets disturbed as the men are not able to handle household
chores and caregiving.”
- FGD Respondent Patna

Traffic Crash Injuries and Disabilities: The Burden on Indian Society
FGD participants were probed to discuss various aspects related to the post-crash situation. As per data from the field for the quantitative survey for this study, out of the total sample covered, 85% of road crash victims (deaths and serious injuries) were male.
Being head of households or chief wage earners, men contribute a major share in household earnings. In case of a fatality or serious injury, households not only experience unexpected loss of income, but the responsibility also shifts to the female members of the household. These temporary Female Headed Households (FHH) are more vulnerable and need better social support. These recently turned, FHH experience the sudden shock of income dip and are pushed into further poverty. Following key areas emerged from the FGDs with women:
5.1 FINANCIAL IMPACT OF THE CRASH ON THE HOUSEHOLD
FGD participants shared that their families were not financially strong to bear the additional expenses due to the road crash . Most of the participants agreed that the medical bills created a financial drain which further impacted the economic condition of their household. This was echoed by respondents with the cases of death as well as serious injury.
Due to the loss of regular income and sudden financial shock, households were forced to take formal loans or borrow money from relatives or friends. One participant
whose brother eventually died after months of treatment, narrated how and it took them eventually two years to repay the money they had borrowed from relatives and neighbours.
In cases of severe injuries, the financial burden did not end with the discharge of the victim from hospital, rather medical expenses related to victims’ recovery continued and included costs related to medicines, recommended food/ diet, transportation for doctor/ hospital visits, doctor consultation fee, etc. The financial shock created by the expenses related to the victims’ medical treatment also permeated other spheres of their family life.
Women also found it difficult to arrange the school fee for their children. Some participants also mentioned that initially, they had to arrange money by mortgaging gold jewellery.
GENDERED IMPACT OF ROAD CRASHES
“We reduced our expenses on unnecessary things such as
clothes, going on a vacation or going to parties but we couldn’t cut our expenses on daily needs
like food and medicines”.
- FGD Respondent Bihar

58
When the elder brother died, the younger brother had to pay for
regular household expenses despite his income being low. He had two
daughters, so he had to ask one of his daughters to drop out of school due to
the financial crisis.
- FGD Respondent, Lucknow
5.2 SOCIAL IMPACT ON THE HOUSEHOLD
Taking social impact into consideration, participants shared how the crash impacted their social life. The experiences were different for women who reported a road crash death. For example, one of the respondents mentioned that her sister in law moved to her parents’ house after the death of her husband in a road crash. This was to provide better education to the children. In fact, a lot of women spoke about the support they received from their maternal house in terms of monetary support as well as load-sharing.
The crash also impacted children’s education. Since there wasn’t enough money to pay school fees, in many cases children had to either delay school admission or had to completely drop out of school.
Changes in the food, clothes and lifestyle choices were reported by most of the participants during discussion. Their households had to compromise on food choices as well as other discretionary expenses related to entertainment, celebrating festivals etc.
5.3 DIRECT IMPACT OF ROAD CRASH ON WOMEN
One of the biggest impacts which women reported is “time poverty32”. Respondents reported spending most of their time on caregiving activities and household chores. Some of the respondents had to also take up a job as well and that led to further time poverty.
32. Time Poverty is defined as working long hours and having no choice to do otherwise. An individual is time poor if he/she is working long hours and is also monetary poor, or would fall into monetary poverty if he/she were to reduce his/her working hours below a given time poverty line.https://elibrary.worldbank.org/doi/abs/10.1596/1813-9450-4961
“Husband got injured and then the entire burden fell upon my
shoulders. I can never forget that time. My husband used to feel
irritated with me post the crash. So, I had to raise my kids look after their education and well-
being, on my own”
- FGD Respondent, Bihar

Traffic Crash Injuries and Disabilities: The Burden on Indian Society
This was further validated through the quantitative survey. The role of family members for caregiving activities was examined. Overall, across both the categories (LIH & HIH), at-least 7 out of 10 respondents mentioned that the female
GENDERED IMPACT OF ROAD CRASHES
TABLE 5.1: VICTIM CARE BY FAMILY MEMBERS – OVERALL | [N, LIH=569, HIH-269, ALL FIGURES IN PERCENT]
0 20 40 60 80 100
Uttar Pradesh (N-136)
Tamil Nadu (N-200)
Maharashtra (N-109)
Bihar (N-124)
0 20 40 60 80 100
Uttar Pradesh (N-49)
Tamil Nadu (N-62)
Maharashtra (N-79)
Bihar (N-79)
0 20 40 60 80 100
Rural (N-223)
Urban (N-346)
Habitation Type (N-569)
0 20 40 60 80 100
Female (N-96)
Male (N-473)
Victim Gender (N-569)
0 20 40 60 80 100
Female (N-57)
Male (N-212)
Victim Gender (N-269)
OverallN-569
OverallN-269LIH HIHMale Member
Female member
Self
Male MemberFemale member
Self
26.6% 64.5% 8.9%
23.9% 73.4% 2.8%
16% 81% 3%
27.9% 68.4% 3.7%
22.7% 72.9% 4.4%
24% 72.5% 3.5%
20.6% 73.5% 5.8%
0 20 40 60 80 100
Rural (N-20)
Urban (N-249)
Habitation Type (N-269) 21.9% 76.2% 1.9%
21.7% 76.3% 2%
25% 75%
22.7% 72.9% 4.4%
18.8% 77% 4.2%
41.7% 53.1% 5.2%
21.9% 76.2% 1.9%
16.5% 81.6% 1.9%
42.1% 56.1% 1.8%
25.3% 72.2% 2.5%
17.7% 79.7% 2.5%
30.6% 67.7% 1.6%
12.2% 87.8%
22.7% 21.9%
72.9% 76.2%
1.9%4.4%
member of the household took care of the victim, cooked all the meals in the household and took care of the daily needs of the victim and the rest of the household.

60
Even for outside chores like buying medicines and taking the victim to doctor, there wasn’t a huge gap between men and women sharing responsibilities. Across LIH and HIH respondent groups approximately 40% respondents mentioned that women took care of these aspects as well.
The second fundamental impact was on women’s physical and mental health. Many respondents mentioned facing a variety of health issues for which they sought continuous
M: Have you received any compensation from the government’s side or any other insurance amount?
R: NO. (emphasis original) After the crash, it was very difficult for us to decide who to look after - the husband who is injured, or our children or
whether to pursue the offending party at fault.
- FGD Respondent Lucknow
medical advice and medication.
The third area of impact for women was their capacity to access institutional support. A few respondents mentioned that they wanted to seek compensation, however, amidst conflicting priorities, the perceptions and the barriers to access the system and seek compensation seemed insurmountable. This sentiment was echoed by participants in both UP and Bihar.

Traffic Crash Injuries and Disabilities: The Burden on Indian Society
to increase women’s employment by encouraging entrepreneurship among women. (Niti Aayog, 2019). Women participants also reiterated this. They suggested simple business models like packaging,baking, pickle making as something that would help them monetarily without leaving the house. Women also preferred a model where they could earn daily or weekly income instead of monthly payments.
4. Ensuring quality of care at the hospital.
Many respondents spoke about authorities with mistrust. A few participants suggested that there should be a mechanism to ensure quality of care at hospitals and that the treatment of the road crash victims should be made free in government and private hospitals, especially for poor families. They further suggested that awareness on these rights should be raised amongst the general public. Since most of the women who either die or are injured in road crashes are in rural areas, Accredited Social Health Activists (ASHA) workers33 can be trained to provide information on various government schemes for road crash victims and their families.
5. Foster Women’s Participation in Local Road Safety Governance Frameworks.
Women’s participation in planning and decision making at local road safety governance frameworks including State Road Safety Council and District Road Safety Committee should be ensured. Adequate female representation shall
6-POINT POLICY RECOMMENDATIONS
1. Emergency cash transfers to vulneable female headed households:
As part of PM Garib Kalyan Yojana the Government has already implemented the “Unconditional Emergency Cash Transfer” (UECT) to women during the current COVID-19 crisis. (IWWAGE, 2020) The state governments can use a similar framework of UECT to give Aadhar linked DBT to recently turned FHHs. More vulnerable FHHs should be prioritised. The time frame of the emergency cash transfer should be standardised.
2. Monetary schemes for low interest loans:
During the FGD, many participants suggested schemes for low interest or no interest loans to support regular household expenses. The women suggested that the low interest loan should be easily accessible without much paperwork.
3. Provide Schemes to incentivize work from home small business. Enrol women who have lost the breadwinner of their families in a road into the employment database to facilitate their job search.
State Governments can also float schemes to support these women in running small home businesses. NITI Aayog also recommended this strategy to mitigate the declining female labour force participation rates in India. It has proposed
33. ASHA workers are the government’s recognised health workers who are usually the first point of contact in rural India, where there is often limited or no direct access to healthcare facilities.
GENDERED IMPACT OF ROAD CRASHES

62
not only ensure Gender responsive monitoring, reporting and budgeting, but will also create opportunities for women to be trained for various roles including as paramedics, backend operators for electronic enforcement architecture and other systems which will be created to ensure road safety.
6. Standardisation of Compensation for Non-Working Women.
The MACT has often taken a very conservative view on compensation for “house-wives”. In Sher Singh vs. Raghubir Singh (2004), the Tribunal assessed the dependency of the family on the housewife at as low as Rs. 600 per month. The Tribunal concluded that the ‘services rendered by the deceased woman could be replaced by hiring a servant at the salary of Rs. 600/- per month.’ This logic is highly fallacious. The unpaid work done by women in households cannot be quantified by comparing it to the work done by a domestic help. This approach to compute the compensation by relying upon the minimum wages payable to a skilled worker has also been criticised by various members of Judiciary. In Arun Kumar Agarwal vs. National Insurance Company (2006), the Supreme Court also stated, “It is not possible to quantify any amount in lieu of the services rendered by the wife/mother to the family. The term `services’ is required to be given a broad meaning and must be construed by taking into account the loss of personal care and attention given by the deceased to her children as a mother and to her husband as a wife. The Bombay High Court in the case of Rambhau & Ors Vs
The Oriental Insurance Co & Ors (2007), in its judgment dated 17th September 2020 directed Oriental Insurance to pay Rs. 8,22,000/- along with interest at the rate of 6% per annum as compensation for the woman’s death. The Court while computing the amount considered various factors such as loss of love and affection, funeral expenses, household work and other such factors. Therefore in light of the subjective interpretation, it is of utmost importance that the Central Government issues guidelines to set a definite criteria for determination of compensation payable to the dependents of a non-earning housewife/mother to remove subjectivities and ensure that family members or the disabled women (in case of serious injuries) receive appropriate compensation.
7. Set-up/Strengthen Safety Response Cell in coordination with the police and health departments to respond to victims of sexual exploitation and harassment.
MoRTH can also incentivize select states to create a network of CSOs and service providers who can work with the State Road Safety Cells to strengthen preventive approaches.

Traffic Crash Injuries and Disabilities: The Burden on Indian Society
Road Crash deaths and serious injuries have diverse impacts on the victims and their families. While many studies have documented the impact of road crash outcomes on victims, the impact of the crash at the household level is an understudied area. Death of a family member due to a road crash can have serious social and mental health impact on the rest of the family. Serious injuries on the other hand, impacts the quality of life of the whole household including the victim. This chapter examines the psychological, health and associated impact of mortality and morbidity due to road crashes.
KEY FINDINGS
• 50% of LIH and 1/4th of HIH category respondents stated “depression” among their family members due to the impact of the road crash; this was higher in cases where fatalities were reported.
• Impact on sleeping pattern was found among around three-fourth (72.8%) of poor category (LIH) respondents while among richer counterparts (HIH), it was about six-tenth (60.7%).
• A significant difference was found in the proportion of LIH (64%) and HIH (29%) respondents that have confirmed that their living standard has deteriorated since the crash.
• Over 1/3rd of LIH respondents (38%) stated that members of their families suffered from health
CH
AP
TE
R 6
PSYCHOLOGICAL AND SOCIAL IMPACT OF ROAD CRASHES

64
34. The respondents were asked to self-evaluate their mental health and therefore undiagnosed cases, where respondents ‘felt’ depressed were also considered. Further the questionnaires were translated in Hindi and other vernacular languages and the respondents were asked if they felt “low or sad without any reason”
complications after the crash, while it was about 21% for HIH category.
• Among those who survived road crashes, three out of ten (29.5%) victims from poor families (LIH) suffered disability, while among the victims from rich families (HIH) the percentage was 7.7%
• Among those who returned to previous occupation, LIH victims took 92 days while HIH victims took 43 days. And to find a new job, LIH victims took 107 days and HIH victims took 65 days.
• Pre- crash, about 6.6 percent of LIH victims were unemployed, while such proportion was increased by about 11 percent and accounted for 18% on resuming work after the crash.
• In terms of impact on household, compared to HIH category (27%), a significant proportion of LIH respondents (43.9%) confirmed change in working patten of family after crash.
The financial impact of road crashes on LIH respondents is disproportionate and more severe in comparison to road crash impact on HIH respondents. A broad overview of the responses on various aspects of psychological, emotional and social impact suggests that poor families suffer more. Out of the total sample, about 42 percent victims shared their first-hand experience while 58 percent respondents were family members who responded on behalf of family members as well as the whole household.
6.1. MENTAL HEALTH ISSUES AMONGST THE HOUSEHOLD
In order to understand the impact of road crashes on the mental health of victims and their family members, respondents were asked about mental health of household members. A direct question about anyone in their family suffering from depression34 was asked.
Overall, close to half (48.5%) of LIH respondents stated that their family members suffered from depression due to the impact of the road crash, while about one-fourth (26.2%) HIH respondents stated the same.
The respondents from Bihar & Uttar Pradesh reported a higher percentage than Maharashtra and Tamil Nadu. Further in the LIH category, a higher proportion of respondents (75%) stated depression in their family where the victim had died compared to where the victim sustained serious injuries (43.2%).
Similarly, in cases amongst LIH families where the road crash victim was an earning member of the family, depression was reported by 50% of the respondents. However, in the case of HIH respondents the proportions were 30 percent. This again demonstrates that depression could be more related to financial impacts on the family due to crashes.
Further, overall, over one-third of LIH respondents (38%) stated that members of their families suffered from health

Traffic Crash Injuries and Disabilities: The Burden on Indian Society
PSYCHOLOGICAL AND SOCIAL IMPACT OF ROAD CRASHES
complications, while such proportion of respondents was about 21 percent for HIH category. Category-wise, two trends were observed amongst both LIH and HIH category respondents: respondents reported more adverse impact in cases of death and compared to non-earning members, more complications were reported when road crash victims were earning members of the family.
Motor vehicle crashes can result in ‘significant post-traumatic psychiatric morbidity’. The psychological impact of road crashes is an understudied area and the data on the subject is extremely fragmented or non-existent. Academic and other institutions should analyse the trends for psychological distress due to road crashes in India. The Ministry of Health and Family Welfare should also update the National Mental Health Policy (NMHP) notified in 2014. NMHP acknowledges the linkage between poverty and mental health however it does not categorise crash victims as “Vulnerable Population”. The state government should also ensure implementation of NMHP right from Primary Health Care level.
6.2. DIP IN NUTRITION AMONGST HOUSEHOLD MEMBERS
With respect to change in dietary habits/ food intake, about 44 percent respondents in LIH category stated that there was a negative change in the dietary habits of the household members after the crash. Compared to LIH category, such impact was lower amongst HIH respondents where one-fourth of respondents (24.3%) confirmed the same.
During Focus Group Discussions, respondents also mentioned that after the crash certain food items were prescribed to the victims, however due to lack of financial
resources, they could not afford the same over a long time. Ensuring better nutritional intake for victims impacted the nutritional intake of children since they were not able to provide them with certain food categories like dairy and animal protein.
6.3. IMPACT ON LIVING STANDARD OF VICTIMS’ HOUSEHOLD
Road crash outcomes and their consequences affect victims and their families both in short and long term. This includes wage loss, loss of employment, financial hardships, reduced quality of life and negative impact on the functioning of the whole family. During the survey, respondents were probed about the social impact of road crashes.
A significant difference was found in the proportion of LIH and HIH respondents reporting decline in their living standards.
While close to two-third (63.5%) of poor families (LIH) reported decline in living standard, less than three out of ten (29.4%) rich families (HIH) have faced such consequences.
The impact on living standard was confirmed by a higher proportion of respondents where road crash victims died as well as where victims were male earning members of the family. In order to understand the severity of impact on the household, respondents were asked to rate the level of impact on 3-point scale i.e. ‘Severe’, ‘Moderate’ and ‘None’.The proportion of those who said there was a severe decrease in living standard were almost three times (38.5%) more in poor families. Further, compared to male respondents, more female respondents have confirmed the same.
0 20 40 60 80 100
Uttar Pradesh (N-163)
Tamil Nadu (N-245)
Maharashtra (N-127)
Bihar (N-146)
0 20 40 60 80 100
Uttar Pradesh (N-62)
Tamil Nadu (N-73)
Maharashtra (N-87)
Bihar (N-83)
0 20 40 60 80 100
Rural (N-287)
Urban (N-394)
Habitation Type (N-681)
0 20 40 60 80 100
Female (N-108)
Male (N-573)
Victim Gender (N-681)
0 20 40 60 80 100
Female (N-61)
Male (N-244)
Victim Gender (N-305)
OverallN-681
OverallN-305LIH HIHYes
No
DK/CS
YesNo
DK/CS
37% 56.2% 6.8%
22% 78%
34.3% 65.7%
55.2% 37.4% 7.4%
37.6% 59.2% 3.2%
32.7% 63.2% 4.1%
44.3% 53.7% 2.1%
0 20 40 60 80 100
Rural (N-31)
Urban (N-274)
Habitation Type (N-305) 21.3% 76.4% 2.3%
19.3% 78.1% 2.6%
38.7% 61.3%
37.6% 59.2% 3.2%
38.7% 57.6% 3.7%
31.5% 67.6% 0.9%
21.3% 76.4% 2.3%
21.3% 76.2% 2.5%
21.3% 77% 1.6%
16.9% 78.3% 4.8%
24.1% 75.9%
35.6% 64.4%
6.5% 88.7% 4.8%
37.6%21.3%
59.2%76.4%
2.3%3.2%

66
TABLE 6.1: TABLE INDICATING STATE- WISE, HABITATION- WISE, AND GENDER- WISE DETAILS ON WHETHER HOUSEHOLD MEMBERS/ VICTIM DEVELOPED HEALTH ISSUES DUE TO ROAD CRASH [ALL FIGURES IN PERCENT]
0 20 40 60 80 100
Uttar Pradesh (N-163)
Tamil Nadu (N-245)
Maharashtra (N-127)
Bihar (N-146)
0 20 40 60 80 100
Uttar Pradesh (N-62)
Tamil Nadu (N-73)
Maharashtra (N-87)
Bihar (N-83)
0 20 40 60 80 100
Rural (N-287)
Urban (N-394)
Habitation Type (N-681)
0 20 40 60 80 100
Female (N-108)
Male (N-573)
Victim Gender (N-681)
0 20 40 60 80 100
Female (N-61)
Male (N-244)
Victim Gender (N-305)
OverallN-681
OverallN-305LIH HIHYes
No
DK/CS
YesNo
DK/CS
37% 56.2% 6.8%
22% 78%
34.3% 65.7%
55.2% 37.4% 7.4%
37.6% 59.2% 3.2%
32.7% 63.2% 4.1%
44.3% 53.7% 2.1%
0 20 40 60 80 100
Rural (N-31)
Urban (N-274)
Habitation Type (N-305) 21.3% 76.4% 2.3%
19.3% 78.1% 2.6%
38.7% 61.3%
37.6% 59.2% 3.2%
38.7% 57.6% 3.7%
31.5% 67.6% 0.9%
21.3% 76.4% 2.3%
21.3% 76.2% 2.5%
21.3% 77% 1.6%
16.9% 78.3% 4.8%
24.1% 75.9%
35.6% 64.4%
6.5% 88.7% 4.8%
37.6%21.3%
59.2%76.4%
2.3%3.2%

Traffic Crash Injuries and Disabilities: The Burden on Indian Society
TABLE 6.2: TABLE INDICATING STATE-WISE, HABITATION- WISE, AND GENDER- WISE DETAILS ON WHETHER THE FOOD CONSUMPTION OF HOUSEHOLD MEMBERS OF THE VICTIM HAS DECREASED
0 20 40 60 80 100
Uttar Pradesh (N-163)
Tamil Nadu (N-245)
Maharashtra (N-127)
Bihar (N-146)
0 20 40 60 80 100
Uttar Pradesh (N-62)
Tamil Nadu (N-73)
Maharashtra (N-87)
Bihar (N-83)
0 20 40 60 80 100
Rural (N-287)
Urban (N-394)
Habitation Type (N-681)
0 20 40 60 80 100
Female (N-108)
Male (N-573)
Victim Gender (N-681)
0 20 40 60 80 100
Female (N-61)
Male (N-244)
Victim Gender (N-305)
OverallN-681
OverallN-305LIH HIHYes
No
DK/CS
YesNo
DK/CS
41.8% 54.8% 3.4%
34.6% 63.8% 1.6%
43.7% 55.5% 0.8%
54.6% 39.9% 5.5%
44.2% 53.2% 2.6%
45.7% 51.8% 2.5%
42.2% 55% 2.8%
0 20 40 60 80 100
Rural (N-31)
Urban (N-274)
Habitation Type (N-305) 24.3% 69.8% 5.9%
23.7% 70.1% 6.2%
29% 67.7% 3.2%
44.2% 53.2% 2.6%
45.7% 51.5% 2.8%
36.1% 62% 1.9%
24.3% 69.8% 5.9%
25.4% 69.3% 5.3%
19.7% 72.1% 8.2%
21.7% 67.5% 10.8%
29.9% 69% 1.1%
35.6% 64.4%
6.5% 80.6% 12.9%
44.2%24.3%
53.2%69.8%
5.9%2.6%
PSYCHOLOGICAL AND SOCIAL IMPACT OF ROAD CRASHES

68
6.4. DISABILITY DUE TO ROAD CRASH
This section of the report looks at the social impact of road crashes on households and specifically focuses on cases of serious injuries. This part of the survey was conducted amongst the respondents who reported to have either survived the road crash themselves or family members who were speaking on behalf of a victim who suffered serious injuries.
Among those who survived the road crash, about three out of ten (29.5%) respondents from poor families (LIH) reported undergoing disability. Amongst (HIH respondents 7.7% reported disability. The vulnerability of poor families was four times higher than those from rich families probably due to the lack of safe mode of transport at the time of crash.
Amongst the LIH category, proportion of victims that have undergone any sort of disability was higher in rural areas (39%) compared to urban areas (15%). Almost the same trend was seen for the HIH category as well.
0 20 40 60 80 100
Uttar Pradesh (N-163)
Tamil Nadu (N-245)
Maharashtra (N-127)
Bihar (N-146)
0 20 40 60 80 100
Uttar Pradesh (N-62)
Tamil Nadu (N-73)
Maharashtra (N-87)
Bihar (N-83)
0 20 40 60 80 100
Rural (N-287)
Urban (N-394)
Habitation Type (N-681)
0 20 40 60 80 100
Female (N-108)
Male (N-573)
Victim Gender (N-681)
0 20 40 60 80 100
Female (N-61)
Male (N-244)
Victim Gender (N-305)
OverallN-681
OverallN-305LIH HIHYes
No
DK/CS
YesNo
DK/CS
41.8% 54.8% 3.4%
34.6% 63.8% 1.6%
43.7% 55.5% 0.8%
54.6% 39.9% 5.5%
44.2% 53.2% 2.6%
45.7% 51.8% 2.5%
42.2% 55% 2.8%
0 20 40 60 80 100
Rural (N-31)
Urban (N-274)
Habitation Type (N-305) 24.3% 69.8% 5.9%
23.7% 70.1% 6.2%
29% 67.7% 3.2%
44.2% 53.2% 2.6%
45.7% 51.5% 2.8%
36.1% 62% 1.9%
24.3% 69.8% 5.9%
25.4% 69.3% 5.3%
19.7% 72.1% 8.2%
21.7% 67.5% 10.8%
29.9% 69% 1.1%
35.6% 64.4%
6.5% 80.6% 12.9%
44.2%24.3%
53.2%69.8%
5.9%2.6%

Traffic Crash Injuries and Disabilities: The Burden on Indian Society
TABLE 6.3: TABLE INDICATING THE STATE- WISE, HABITATION- WISE, AND GENDER- WISE DETAILS ON WHETHER THE VICTIM WAS AFFLICTED WITH A DISABILITY
LIH HIH
0 10 20 30 40 50
Female (N-168)
Male (N-884)
Victim Gender (N-1052)
Rural (N-634)
Urban (N-418)
Habitation Type (N-1052)
Uttar Pradesh (N-205)
Tamil Nadu (N-323)
Maharashtra (N-290)
Bihar (N-234)
Overall (N-1052) 29.5 % 7.7%
42.3 % 17.6 %
30.3 % 5.9 %
14.6 % 4.7 %
37.1 %0 %
29.5 % 7.7 %
14.8 % 6.2 %
39.1 % 16.4 %
29.5 % 7.7 %
31.7 % 8.5 %
17.9 % 4.7 %
PSYCHOLOGICAL AND SOCIAL IMPACT OF ROAD CRASHES

70
The respondents who reported disability were further probed the severity of disability, type of disability and the need for assistance. Respondents were asked if the road crash victims have undergone any sort of disability required on-going mobility assistance i.e. wheelchair, walking frames etc. Overall, about 6 out of 10 respondents in LIH (64%) and HIH (62%) category require on-going mobility assistance.
Among the respondents (N=339) that reported victim disability a follow up question was asked to ascertain the severity of the disability. About four out of ten (39%) LIH respondents stated that road crash victims suffered from serious disabilities while among HIH category, such proportion was about one in five (20.7%).
In the LIH category, Bihar has the highest proportion of victims that have undergone serious/permanent disability (45.5%), followed by Maharashtra and Uttar Pradesh. Gender wise, a higher proportion of male victims (51%) suffered from serious/permanent disability than female victims (33%). For cases where victims had sustained serious disability (N=121), respondents were further asked about the type of disability. Overall, about two-third of LIH victims survived amputation of a limb followed by brain injury (22%).
According to 2011 census, nearly 50% of the disability burden is borne by one of the five States namely Uttar Pradesh (15.5%), Maharashtra (11.05%), Bihar (8.69%), Andhra Pradesh (8.45%), and West Bengal (7.52%)35. Bihar
government also launched Bihar State Disability Pension Scheme to cover those persons with disabilities who are not covered under the Indira Gandhi National Disability Pension Scheme (IGNDPS). Additionally Bihar Government has also launched, Mukhyamantri Viklang Shashaktikaran Yojna – “SAMBAL- An Integrated Scheme for PwDs”, to protect & promote the rights of PwDs. SAMBAL was approved in 2012 and has three major components to empower PwDs - Educational Rehabilitation, Economic Rehabilitation and Social Rehabilitation.
6.5. PROCESS OF REHABILITATION OF THE VICTIM
This section analyses the rehabilitation process of the victims back into their pre-crash social and work life. This section covers aspects such as return to previous occupation, days taken for recovery, change in occupation etc.
All the respondents who reported that they themselves or the victim survived the road crashes were further probed on whether they/ victim could return to the previous occupation/ educational institution after the crash. Overall, three-fourth of LIH respondents and 90% of HIH respondents confirmed that the victims returned to their previous occupation/ educational institution after the crash.
35. Censuse 2011, MoSPI: https://censusindia.gov.in/census_and_you/disabled_population.aspx

Traffic Crash Injuries and Disabilities: The Burden on Indian Society
Gender-wise, compared to men, less proportion of women victims returned to their previous profession after the crash. Profession wise, about one-fourth of LIH students could not return to studies after the crash.
Respondents (N=1142) were asked a follow up question about the average time they had taken to return to the previous occupation. Among LIH category, the average time taken to rejoin the previous occupation was about 92 days (about 3 months) whereas it was 43 days (about 1.5 months) amongst HIH category.
Amongst HIH category the average number of days it took to return to work is significantly less (nearly less than half in most of the cases). This is a direct indicator of disproportionate impact of road crashes on LIH category. State-wise, the highest time was taken by LIH victims of Bihar and HIH victims of Uttar Pradesh to return back to their previous occupation. Comparatively, lowest time was taken by victims of Tamil Nadu across both the categories.
Habitation wise, urban victims took less time than rural victims to return to the previous occupation after the crash. Similarly, gender-wise, men victims took a longer time to return to the previous occupation than women victims.
Those respondents who informed that crash victims could not return to their previous occupation (N=288) were further
explored if the victims could find a new job. The time taken to find the job after the crash was also captured. Out of total, about 36 percent of respondents confirmed that victims of their household found a job. Further those victims that have found a new job (N=104) were further asked about the time they had taken to find a new job. Overall, on an average LIH category victim took about 107 days to find a new job from the day of the crash whereas it was about 65 days in case of HIH victims.
This marked disparity between the two categories indicates that victims in the LIH category faced more difficulty in getting a new job post-crash. This might be also because of better social integration and support systems available for the HIH category.
6.6. CHANGES IN EMPLOYMENT STATUS
The comparison of the victims’ employment status at three different times – a) pre-crash, b) on resuming work after the crash and c) current (as on 31st Jan 2020) was also done. Respondents were asked to mention the occupation of victims during these phases.
Pre- crash, about 6.6 percent of victims were unemployed, while such proportion increased by about 11 percent and
PSYCHOLOGICAL AND SOCIAL IMPACT OF ROAD CRASHES

72
accounted for 18 percent on resuming work after the crash. Further, this proportion reduced to 14.4 percent as on 31st Jun 2020. This increase in unemployment could be understood due to injuries and disabilities among victims after crashes.
Among LIH category, the highest proportion of victims were salaried employees’ pre-crash (33.5%), on resuming work after crash this reduced (28.3%), whereas a slight increase was observed in the current scenario to 33 percent (as on 31st Jan 2020). A similar trend was observed in occupations like agriculture labourer/ farmer and petty trader/ shop owners.
A decline was observed in sectors like farming and skilled and unskilled manual labour. This indicates that the labour-intensive jobs are more difficult to resume post-crash simply due to the injuries, disabilities, and nature of the job where more physical strength is required, which resulted in more unemployment.
6.7. OCCUPATIONAL IMPACT AT THE HOUSEHOLD LEVEL
Respondents were also probed on factors such as a change in working pattern of household members, additional jobs
taken by household members and dropping out of school due to financial constraints.Compared to the HIH category (27%), a significant difference was observed among the LIH category where a higher proportion of respondents (43.9%) stated that the working pattern of household members changed due to road crash. While about 14 % of LIH respondents acknowledged that someone in their household had to take up additional jobs/ shifts because of a road crash, a smaller 4% of HIH respondents acknowledged the same regarding their families. In cases where the victim had died due to an crash, more respondents confirmed the same.
Further, as high as one in five (20%) respondents of LIH category have mentioned that someone in their household had to give up education due to the crash. Again, such a proportion of respondents among the HIH category was only 5 percent. In cases where the crash victim was male and the earning member of the family, a higher proportion of respondents had to give up education.
In rural habitations, such changes were more prevalent than in urban habitations, amongst both the categories (LIH and HIH).

Traffic Crash Injuries and Disabilities: The Burden on Indian Society
6-POINT POLICY RECOMMENDATIONS:
1. Integrating Road Crash Victims as a special category in Social Security Schemes.
Policymakers need to acknowledge the interplay between road crashes and various social hierarchies of class, gender, location that intersect to render certain disadvantaged groups more vulnerable to the shocks of crashes. The spatial context and lived experiences of poor households makes it harder for them to respond to the harsh impact of road crashes, pushing them into a vicious cycle of debt and suffering. Therefore, all existing social security schemes should recognize victims of road crashes as a special category that needs Government support at various levels.
2. Comprehensive Rehabilitation Support.
Injury caused by crashes is the 3rd largest cause of disability. According to a report by NIMHANS, ‘nearly 100% of the severely injured, 50% of the moderately injured and 10-20% of the mildly injured will have lifelong disabilities’. In India there are multiple structural, social and economic barriers to accessing Rehabilitation. The Central and State Ministers of Social Welfare and Empowerment should create comprehensive programmes for rehabilitation of crash victims. Similarly, District Road Safety Committees should also maintain a database of people in each district
who should receive such care and support them through community based programmes.
3. Mental Health Support
Motor vehicle crashes can result in ‘significant post-traumatic psychiatric morbidity’. The psychological impact of road crashes is an understudied area and the data on the subject is extremely fragmented or non-existent. Academic and other institutions should analyse the trends for psychological distress due to road crashes in India. The Ministry of Health and Family Welfare should also update the National Mental Health Policy (NMHP) notified in 2014. NMHP acknowledges the linkage between poverty and mental health however it does not categorise crash victims as “Vulnerable Population”. The state government should also ensure implementation of NMHP right from Primary Health Care level. State Governments should also conduct awareness drives on already existing schemes like – ‘KIRAN 24x7 Mental Health Rehabilitation Helpline. Most importantly, mental health of road crash victims should be covered under health insurance.
4. Access to Upskilling and Jobs.
The National Skill Development Corporation (NSDC) can undertake a special programme to upskill crash victims from rural areas. The programme can set up specific
PSYCHOLOGICAL AND SOCIAL IMPACT OF ROAD CRASHES

74
targets of skilling 1 million people for the next 5 years and so on. Most rural poor are injured in road crashes, this is also validated by the 2011 census data as 71% of India’s 26.8 million Persons with Disability (PwD) live in rural India. Out of the total population of PwD, about 15 million are male and 11.8 million, female. Poor households have a lesser ability to respond to road crashes and find it difficult to mitigate their financial burden in the event of an unforeseen emergency. Since the impact is more severe on LIH than HIH. Ministry of Social Welfare and Empowerment, Ministry of Small and Medium Enterprises, Ministry of Skill Development and Ministry of Agriculture should create priority programs for upskilling of PwD in rural areas and also create specific programs for female PwD in rural areas.
5. Support to Continue Education.
Throughout FGDs and IDIs many respondents stated the impact of crash on Education with many male respondents having to leave education to support the household financially. Ministry of Education should create specific schemes to ensure children from households that have been impacted due to road crashes can continue their education. Indian Training Institutes (ITIs) impart skills in various vocational trades to meet the skilled manpower
requirements in the country. An automatic enrolment policy should be created at the district level for road crash victims or their family members who had to dropout of schools or forsake education owing to a road crash.
6. Improving access to emergency medical care.
There is a need to publicize emergency numbers and create more awareness around it. 112 has been declared a pan-India emergency helpline number for immediate assistance services for police, fire, health and women. People in rural areas have poor access to medical facilities. Primary Care and Secondary Care infrastructure and resources in rural areas are inadequate to provide proper care to victims of road crashes. The Central and State Governments should ensure placement of adequate number of Basic Life Support (BLS) and (ALS) ambulances with life support equipment, and a trained paramedic. Each district should be equipped with a secondary trauma care facility with infrastructure and resources for initial evaluation, resuscitation, stabilization and initiation of transfer to a higher-level trauma care facility.

Traffic Crash Injuries and Disabilities: The Burden on Indian Society
CH
AP
TE
R 7
IMPACT OF ROAD CRASHES ON ADOLESCENTS
The most common cause of death among children is unintentional injury, and the most common cause of unintentional injury is related to road crashes36. Children in India are exposed to the risk of road crashes on multiple occasions while commuting to schools- in private vehicles, in public transport vehicles, and as pedestrians. In 2018, 23 school children died when their school bus fell into a deep gorge in Nurpur in Himachal Pradesh. A similar crash occurred on 5th August 2019, where 10 children were killed when their school bus fell into a gorge in Tehri Garhwal
Since 2008, over 55,000 children have lost their lives in road crashes in India and a large majority of these are adolescents. Every day around 42 children including 31 adolescents die in road crashes in India with a 10% contribution to the total road crash deaths. Most of these deaths happen near schools and colleges.
To understand the qualitative aspects of the financial, social and psychological impact of road fatalities/ injuries on adolescents, In-Depth Interviews (IDI) were conducted with adolescents.
IDIs were conducted among adolescents (aged between 14-18 years) across Uttar Pradesh, Bihar, Tamil Nadu, and Maharashtra. Overall 8 adolescents were selected and interviewed. Respondents were probed on different aspects of the crash and its impact on them as an individual as well as the impact on their household.

76
7.1. IMPACT ON ADOLESCENTS AS INDIVIDUALS
Road Crashes devastate families. Other than financially draining the family and tearing apart the familial fabric, road crashes also take a toll on the mental health of family members. Many studies have pointed out that “Psychiatric symptoms and disorder are frequent after road crash injury. Post-traumatic symptoms are common and disabling.” (Mayou R., et al., 1993). Most of the respondents spoke about the emotional impact of road crashes on them and their families. In this chapter, we attempt to highlight some key areas of impact.
One of the IDI’s respondents, Shivam (name changed), was just 12 years old when his teenage brother who was riding a bicycle was killed in a road crash near their house in 2016. As per Shivam, his brother was lying on the road
“An uncle (neighbour) … took me along with him and on the way, he
told me, ‘Imagine you never had any brother’.”
- IDI Respondent, Uttar Pradesh
“I used to keep thinking about my mom’s crash. I found it difficult to concentrate on anything else. Like when I used to sit down to study...I
would see flashes of that day and its aftermath. “
- IDI Respondent Maharashtra
for 30 minutes before he was taken to the hospital. Even though the Police were there, they waited for his mother to arrive and arrange transport. Throughout the interview, he often used the words “sadness”, “emptiness” to describe his feelings after his brother’s death.
Like Pinky, (name changed) most of the respondents also spoke about the impact of the crash on their education. For many respondents, the impact was both direct and indirect. Pinky was not able to find time to study since she played the role of primary caregiver for her injured mother as well as she cooked for the whole family. These additional responsibilities meant she had less ‘study time’. She was also not able to ‘focus’ while studying and that impacted her education as well.
36. https://mhrd.gov.in/sites/upload_files/mhrd/files/statistics-new/ESAG-2018.pdf

Traffic Crash Injuries and Disabilities: The Burden on Indian Society
Another respondent from Tamil Nadu mentioned that since his father couldn’t take off from work, and they needed the money, he missed his school twice every week for a month till his mother recuperated.
The other aspect in which education got affected was due to non-payment or late submission of school fees. A couple of respondents mentioned that due to their dire financial situation, their parents couldn’t pay school fees on time. One respondent even mentioned how the school penalized him by asking him to stand outside the examination hall, since his parents couldn’t pay the school fee on time and as a result, he had to drop a year.
7.2. IMPACT ON SOCIAL LIFE OF ADOLESCENTS
After analyzing the respondent transcripts, another common area of impact that emerged is the impact road crash outcomes have on respondents’ social life as well as the time available for playing with friends. Irrespective of the road crash outcome, respondents mentioned that post-crash, either they couldn’t find time to go out and play or their friends weren’t keen to play with them. Another reason for curtailing time spent outside with friends was to ensure that no unnecessary expenses were incurred.
M:Were there any changes in the time you spent with friends?
R: Like we used to play with our friends; so, it all stopped completely. I have not played cricket for almost 4 years now.
- IDI Respondent, UP
7.3. IMPACT ON THE HOUSEHOLD AS REPORTED BY ADOLESCENTS
Adolescents were also probed on their understanding of the financial impact the crash had on their family. While most of them were unaware of the exact costs incurred, they spoke about the impact on their lifestyle as well as the social impact of the crash on the household.
Respondents narrated different ways in which the crash impact ed their quality of life. Since their family had to incur expenses on treatment, they were forced to reduce
IMPACT OF ROAD CRASHES ON ADOLESCENTS

78
“I stopped buying clothes. Mother asked me to stop as we had to cut down on our expenses. I felt bad, I
never thought I would have to see such days.”
“My mother always stored extra provisions. However, she stopped
buying extra provisions. We had to give more fruits and vegetables to father, but we were not able to do that, it took more
time for his recovery.)
- IDI Respondent, Tamil Nadu
R: I left school in the 9th standard.
M: Why? You did not like school?
R: I liked it. But I did not go due to the financial situation in the house.
- IDI Respondent Maharashtra
the quantity and quality of food consumed. This was narrated by different respondents and it affected their food consumption as well as the food consumption of the family.
Respondents also spoke about the compromises they had to make. For some, it manifested in less money for
buying clothes. For others, it manifested more acutely. One respondent narrated how he had to leave school due to the financial situation at home
Many respondents articulated the characteristics of intra-family dynamics after the crash with the use of words like “sadness”, “strange” and “fear”. Concerning dynamics with the rest of the community, most of the respondents had positive experiences barring a couple who spoke about hesitant relatives.
Additionally, most of the female adolescent respondents conveyed how they had to support the household with cooking and other caregiving activities. This meant that

Traffic Crash Injuries and Disabilities: The Burden on Indian Society
IMPACT OF ROAD CRASHES ON ADOLESCENTS
They (Government Hospital) were not treating him (her father) and they said that (police)case has to be filed. Only after that, they will treat him. He was bleeding ... In such a case, they have
all the facilities but still they didn’t treat my father. They gave me cotton and asked me to clean the blood. I didn’t
like it at all.
- IDI Respondent from Tamil Nadu
they had less time for studies or leisure activities.
Two respondents, one from UP and one from Tamil Nadu, also spoke about the apathy of government stakeholders. The respondent from UP spoke about how the police failed to take his brother to the hospital or call the ambulance. His brother had to wait at the crash site for 30 minutes before being taken to hospital.
The respondent from Tamil Nadu spoke about the lack of care received at Government Hospital and how her father’s treatment was delayed since the hospital waited for the police case to be registered.
Even though other respondents did not have such experience, many mentioned that their families moved to a private hospital to receive better quality of care. This has also been validated by the quantitative survey. 69.8% of the LIH respondents were not attended immediately at the hospital, in comparison, only 37.9% of HIH respondents were not attended to immediately.
6-POINT POLICY RECOMMENDATIONS:
1. Enactment and Implementation of Child Road Safety provisions in MVAA, 2019
MVAA, 2019 has provisions for mandating the use of Child Helmets, Child Restraints and also penalizes juvenile driving. These sections should be notified by the Central Government under the Central Motor Vehicle Rules and the State Governments should ensure that effective implementation. The Enforcement agencies should also ensure enforcement of child safety provisions.
2. Educational Institute based Support System.
Children and adolescents who are impacted by a road crash directly or indirectly should be provided support from the State. Since the main institution of interaction for them are schools, the education department can ensure access to qualified child therapists. Since road crashes impact nutritional intake of household members, the State

80
Government can also create a better mechanism to monitor their calorie intake and ensure they get adequate nutrition through the School Mid-Day Meal Scheme.
3 Support for Payment of School Fees for Children from Vulnerable Families.
In the IDIs, adolescents mentioned that financial constraints due to road crash led to either late admission or dropping out of school completely to support their family financially. This was stressed more by male adolescent participants. The State Government should ensure that children from vulnerable families don’t have to leave school due to financial constraints. Since almost 80% of adolescents who die in road crashes are male, the Government should ensure that this policy is gender neutral.
4. Ensuring Safe School Zones
Considering around 9% of all road crashes in India are reported near schools and colleges it’s imperative to ensure that all road owning agencies ensure that children and adolescents are safe while commuting on roads. Urban Local Bodies (ULB) and Rural Local Bodies (RLB) in villages should create safe school zones by slowing down vehicles by design and improving infrastructure by providing walkable pavements, safe crossings etc. The Union Government should also prescribe standards for this under Section 198A of MVAA, 2019.
5. Enacting Rules on Safe Transport to School
Governments should address safety issue faced by children while commuting to school by making rules regarding school buses, vans, auto rickshaws and other means of transport, for safe transportation of school children.
In 2018, over 4500 children died in road crash deaths in the 4 surveyed states out of which over half the deaths happened in UP. Rules around school transport should be formulated by State Governments to help safeguard children. Standardization of rules for all school transport including personally organized transport will ensure that children coming from poor families don’t have to be in overcrowded personally organized transport to cut costs. This is important since parents around 70% of parent respondents from Mumbai, Chennai and Lucknow admitted that their children travel in overcrowded personally organized vehicles. (SaveLIFE, 2019)
6. Issuance of Child Road Safety Policy.
State Governments as part of their State Road Safety Policy, Annual Action Plan and Road Safety Fund should prioritize road safety for children and adolescents. The State Government should standardize rules for safety of children by issuing a child road safety policy. They should highlight information for parents and guardians in local languages. Concrete measures should be budgeted and made part of State Road Safety Annual Action Plan.

Traffic Crash Injuries and Disabilities: The Burden on Indian Society
CH
AP
TE
R 8
OUTCOMES OF THE INSURANCE & LEGAL COMPENSATION PROCESS
Legal37 and insurance-based38 compensation can be considered as an instrument of social policy and one of the tools to provide a social safety net for those involved in a road crash. However, in India insurance coverage is quite low and as a consequence, RTI victims frequently do not receive adequate compensation. Long procedural delays are another common cause of insurance-related problems.
Even though MVAA, 2019 mandates the compulsory requirement of third-party, no-fault insurance, a high percentage of vehicles are still not insured. In many instances, payments are made only after lengthy judicial processes, and not when the funds are needed for medical and other costs. Even in cases where vehicles are properly insured, compensation payments are commensurately low and usually insufficient to cover medical treatment and other personal costs.
Therefore, as part of this Study, an evaluation of the effectiveness of the legal and insurance compensation framework has been mapped by capturing experiences of LIH, HIH victims and truck drivers. Truck drivers have a unique trait as a road user- they constitute one of the biggest victim categories as well as offending category road users. They often undertake long arduous and unsafe journeys on Indian roads and still have abysmal social security conditions and low insurance coverage. The lack of

82
awareness of the compensation process makes it difficult for them to file claims and receive adequate compensation in the event of a road crash.
FINDINGS
1. Overall, the insurance coverage of HIHs (in terms of the motor vehicle, medical, life insurance) was higher compared to LIHs at the time of the crash.
• Motor vehicle insurance - 43% of vehicles from LIH and 65% vehicles from HIH covered.
• Medical insurance - 1/5th of LIH victims and 1/3rd HIH victims were covered under medical insurance.
• Life insurance - As high as 3/4th of HIH victims were covered under life insurance at the time of crash whereas LIH victims accounted for only 18%.
2. Similarly, a higher proportion of HIH victims/family members availed insurance (motor vehicle, medical, life insurance) compared to the LIHs.
• Motor vehicle insurance - About 14% of LIH and 31% of HIH victims/household members availed motor insurance compensation after the crash.
• Medical insurance - 7.5% of LIH and 17% HIH victims availed medical insurance.
• Life insurance - slightly higher for HIH at 4.2% compared to 3.8% among LIH.
3. About 11% of LIH and 8% of HIH victims/family members availed compensation under ex-gratia. Among those that availed compensation under ex-gratia (N=219), just over half of the LIH victims (52%) and one-fourth (25%) of HIH victims received the eligible compensation.
4. 70% of respondents of LIH and 63% of HIH were not aware of compensation clauses and schemes in the event of a road crash.
5. Only 21 % of the LIH in urban areas availed motor third party insurance , whereas 31.7% of the HIH residing in urban areas availed motor vehicle insurance. However, this proportion is still larger than the proportion of LIH that availed compensation in rural areas. Only 11% of the LIH availed motor vehicle insurance compensation, whereas 25% of HIH availed motor vehicle insurance compensation.
6. Time taken for receiving compensation from motor vehicle, medical, and life insurance was higher for urban areas than for rural areas for both LIH & HIH. The only exception was motor vehicle insurance, where high income
37. Legal Compensation is the amount payable by the owner of the motor vehicle or the authorised insurer, or the Central Government (in hit and run motor accident cases), in case of death or grievous hurt due to accident arising out of the use of motor vehicles. Such amount is payable to the legal heirs ,or nominee, or the victim, as the case may be. Legal compensation for road accidents involving motor vehicles is adjudicated by MACT as established under the Motor Vehicles Act, 1988. Appeal lies in the High Court and then the Supreme Court.38. Insurance-based Compensation is defined as the amount paid by an insurance company to the insured person to cover for the bodily injuries, deaths, or property damage caused by a road crash.

Traffic Crash Injuries and Disabilities: The Burden on Indian Society
urban households received compensation sooner than high income rural households.
7. A mere 6.1% of the LIH in rural areas availed medical insurance compensation, whereas 26.3% of the HIH residing in rural areas availed medical insurance compensation.
8. Over half of the respondents in LIH and HIH categories (56%) said that they had not filed any case under MACT after the crash. 38% of the LIH respondents stated that they did not feel the need to file a case under MACT followed by those who did not want to be involved in legal hassles (31%)
9. Overall, 2/3rd of the respondent truck drivers did not file an FIR after the crash. It was highest in Bihar (95%) and lowest in Tamil Nadu (56%).
10. Over 9 out of 10 surveyed truck drivers had motor vehicle insurance at the time of the crash: 47% were covered under comprehensive insurance & 25% under third party liability insurance.
11. Only 40% of the truck drivers were covered under life insurance and 18% under medical insurance at the time of the crash.
12. Overall, 2/3rd of the truck drivers were not aware of
third-party liability insurance.
13. None of the drivers said that they had applied/benefited from cashless treatment at the hospital, solatium fund for hit and run case or ex-gratia schemes.
PART A: HOUSEHOLD LEVEL
8.1: INSURANCE AND COMPENSATION AMONG LIH AND HIH
The following section discusses the variations in insurance claims among LIH and HIH further filtered by gender, geography and habitation.
Overall, insurance coverage (life, vehicle, medical) is lower for LIH victims compared to victims from HIH39. 7 out of 10 victims from LIH are not covered under any insurance policy. Further, the coverage is higher among urban households vis-à-vis rural households for all insurance policy types. More male victims are covered under insurance policies as opposed to female victims irrespective of LIH or HIH; the contrast being the sharpest in the case of life insurance policy where there is a 10% difference among male and female victims.
39. The question on insurance coverage was covered in the telephonic surveys. The N for coverage and availed, received compensation is different and thus they cannot be compared.
OUTCOMES OF THE INSURANCE & LEGAL COMPENSATION PROCESS

84
In general, there is a huge difference in the proportion of victims from LIH and HIH covered under a life insurance policy. While three-fourth of HIH victims (77%) were covered under life insurance at the time of the crash, only 17.5% of the LIH victims were covered under the same. 38% of the victims in Bihar were covered under life insurance, followed by Maharashtra (18%) and Tamil Nadu (8%) (Table 8A.2).
The coverage for medical insurance is almost double for rich households compared to poor households. The coverage of medical insurance among LIH was as low as 7% in Uttar Pradesh and 8% in Maharashtra (Table 8A.3).
57% of the respondents from LIH said that the victims were not covered under motor vehicle insurance compared to 35% of the respondents from HIH40. Even though third-party insurance coverage has been made compulsory for all motorized vehicles (except State and Central Government vehicles) under Section 146 of the MVAA, 19, the numbers across both types of households reveal a gap in motor vehicle insurance penetration and reach; that gap being wider for victims from LIH.
Nearly 58% of the LIH respondents stated that the victim’s vehicle was insured under Third Party Liability Insurance while 28% mentioned that it was insured under Comprehensive Insurance cover41. Among LIH, Bihar
reported the highest proportion of victim vehicles covered under insurance (63%) compared to Uttar Pradesh that recorded the lowest proportion of vehicle insurance coverage (25%) (Table 8A.4). However, among the HIH, 8 out of 10 respondents in Maharashtra stated that the victim vehicle was insured at the time of the crash, followed by two-thirds in Uttar Pradesh (Table 8A.4). Further, a majority of the LIH victims were covered under third party insurance (58%) while another 28% were covered under comprehensive insurance (Table 8A.5).
It is important to note that victims that had their vehicles insured were mostly educated till the graduate or postgraduate level. This indicates the role that literacy plays in insurance coverage. Lack of formal education disincentivizes the poor from availing any sort of insurance due to the strenuous paperwork and procedures involved therein.
Since more victims from LIH use two-wheelers to commute, the burden falls disproportionately on them after an crash, more so if they are unlikely to be covered by insurance. In terms of vehicle usage (refer to Table 5A.1), the respondents revealed that about 65% of victims were using motorized two-wheelers at the time of the crash while 11% of them were commuting by cars. 48% of those riding two-wheelers at the time of the crash were not covered under vehicle
40. Motor vehicle insurance being an essential instrument that covers policyholders in case of financial losses due to crash or related damages. The two major types of motor vehicle insurance are Comprehensive Insurance Policy and Third Part Liability or Limited Insurance. The policy premium for Comprehensive Insurance covers both third party liabilities and one’s damages, injuries and losses to any vehicles, passengers and other property.41. Comprehensive vehicle insurance is more expensive than third party insurance because it covers a wide gamut of damages.

Traffic Crash Injuries and Disabilities: The Burden on Indian Society
insurance whereas 59% of those using cars were insured under motor vehicle insurance.
In general, due to lack of awareness, excessive documentation, delay in receiving payments/compensation, and several other factors, people tend not to claim insurance compensation after an crash. As per our survey findings, the proportion of claims to coverage under various insurance instruments including a motor vehicle, medical and life insurance remains low, more so for LIH.
There is a need to increase the insurance coverage by increasing accessibility and affordability of insurance products to poor households.
Receiving a fair and adequate amount as compensation under the policy, based on the merits of the case, is an undeniable and unquestionable right that the victims possess. However, among the respondents who confirmed that they/the victim had filed for insurance (N=361), about 35% of the respondents from LIH and 40% from HIH said they had received less than the promised amount as compensation. Further, respondents from LIH in Bihar said that they almost took over a year on an average to receive the compensation amount under motor vehicle insurance (Table 8.1).
8.2: AWARENESS OF INSURANCE AND COMPENSATION AFTER THE CRASH AND MAPPING OF COMPENSATION PROCESS UNDER MACT
Overall, 7 out of 10 (70%) respondents from LIH and 63% from HIH stated that they were not aware of any compensation clauses and schemes run by the Indian Government42. This is a major gap in terms of accessing these schemes. In the absence of concrete information , LIH miss out on their chances of availing these schemes. As low as 11% of LIH victims and 8% HIH victims/family members availed compensation under ex-gratia (Table 8.20). The low rates could be indicative of low awareness levels amongst LIH about these schemes and highlight the need to conduct strategic awareness programmes for these households. Among those that availed compensation under ex-gratia (N=219), just over half of the LIH victims (52%) and one-fourth (25%) of HIH victims received the eligible compensation.
In terms of time taken, LIH victims received their compensation in about 13.7 months while HIH victims received it in about 20.1 months. The delay in receiving
OUTCOMES OF THE INSURANCE & LEGAL COMPENSATION PROCESS
42. The Government takes responsibility for certain instances of road accidents and offers compensation to the kin of victims by establishing a fund at the central or state level. For instance, under the MVAA, 19, those killed in a hit-and-run cases qualify for government compensation.
Ex-gratia compensation is given mostly by the Government (State or Central) or local authorities in some instances in the event of a crash. It is given to the victims/their families in case the victim either dies in the crash or survives with severe injuries. Ex-gratia is majorly provided to those victims who are not financially capable of bearing the expense in the near future, i.e., if the victim survives with any sort of disability and cannot resume work. Or if a family loses their sole bread earner in a crash. Regarding payment, ex gratia is done voluntarily from a sense of moral obligation rather than the giver recognizing any liability or legal obligation or requirement.

86
government compensation makes it difficult for LIH households to recover their losses and pay for the immediate costs. HIH are usually not dependent on the compensation money for their survival and are financially prepared for follow-ups and court procedures. They can often afford lawyers and are in no hurry to receive the amount. This is not the case for LIH households where waiting for more than a year to receive the eligible compensation can jeopardize livelihood and survival chances.
The delay in disbursing compensation often frustrates the very purpose of seeking redress. However, from 2009, at the instance of Justice J R Midha of the Delhi High Court and subsequently approved by the Supreme Court of India, various reforms have been introduced in the scheme of adjudication of motor crash claims.
The modified Procedure43 that is now in force, has created a better implementation mechanism for motor crash compensation law and claimants can get compensation within 120 days of the crash. The Supreme Court of India further directed all States to implement the Claims Tribunal Agreed Procedure vide order dated 13th May 2016 in the case of Jai Prakash Vs. M/S. National Insurance Co. SLP (C) No 11801-11804/2005. In this case, the Hon’ble Supreme Court directed that the Claims Tribunal Agreed Procedure be implemented through the Motor Crash Claims Tribunals
43. TThe Claims Tribunal Agreed Procedure was formulated vide order dated 21st December 2009 in the case of Rajesh Tyagi v. Jaibir Singh, IV (2010) ACC 859. As per the Procedure, motor accident claims resulting in death and/or injuries, are settled in a time bound manner within 90 to 120 days. The Procedure which came into effect on 2nd April 2010 provided the following: Investigation by Police and DAR: The police to carry out complete investigation and submit a Detailed Accident Report (DAR) to MACT within 30 days of the accident. Computation by Insurance Company: The Insurance Company to compute the compensation within 30 days thereafter and inform the Tribunal. Acceptance of Claim: If the amount offered by the Insurance Company is fair and acceptable to the claimant, it shall be paid within 30 days. Award by Tribunal: If the offer is not acceptable or the Tribunal finds that the offer is not fair, the Tribunal shall pass an award within 30 days.
Thus the claimant shall get the award amount within 90 to 120 days of the accident.
in coordination with the Legal Service Authorities as well as the Director General of Police of the respective States.
The Delhi High Court further modified the Claims Tribunal Agreed Procedure vide order dated 12th December 2014. Post which, the Supreme Court directed all States to implement the Modified Claims Tribunal Agreed Procedure (MCTAP) vide order dated 06th November 2017 in the case of Jai Prakash Vs. M/S. National Insurance Co.
The Delhi High Court also formulated the Motor Accident Claims Annuity Deposit Scheme (MACAD Scheme) vide order dated 01st May 2018, for ensuring receipt of compensation in the safe hands of victims & kin of victims and for disbursement of compensation amount. The Delhi High Court then directed 21 banks to appoint a nodal officer for implementation of MACAD Scheme, vide order dated 07th December 2018.
The Delhi High Court further modified the Claims Tribunal Agreed Procedure vide order dated 07th December 2018. The Supreme Court in its judgment dated 05th March 2019 in the case of M.R. Krishna Murthi vs. The New India Assurance Co. Ltd., SLP (C) No 31521-31522 of 2017, noted that “there was no proper implementation of the Claims Tribunal Agreed Procedure by the Claims Tribunals at all India level in terms of the directions of the Supreme Court”

Traffic Crash Injuries and Disabilities: The Burden on Indian Society
in Jai Prakash Vs. M/S. National Insurance Co. (Supra). The Supreme Court further directed the following:
• NALSA should take up the matter and monitor the same in coordination and co-operation with the various High Courts.
• The State Judicial Academies should sensitize the Presiding Officers of Claims Tribunal, Senior Police Officers of the State Police as well as Insurance Company for implementation of the Claims Tribunal Agreed Procedure.
• The Supreme Court also directed the Claims Tribunals in the entire country to implement MACAD Scheme contained in the order dated 07th December, 2018 and directed the twenty one banks to implement the same on all India basis.
However the implementation has been debatable. During the survey, respondents were asked if they knew about the MACT, whether they had filed a case and their experience through the process etc. Over half of the respondents in LIH and HIH categories (56%) said that they had not filed any case under MACT after the crash. However, one-fourth of respondents from LIH and one-fifth of the respondents from HIH stated otherwise. Almost, 6 out of 10 respondents
from LIH had not filed a case under MACT across all states except Tamil Nadu, where such a proportion was nearly 40%.
Further, (in table 8A.7) the proportion of LIH respondents who had filed cases under MACT was significantly higher (about 3 times) for road crashes where victims had died (44%) compared to cases where victims had survived (13.5%).
An open- ended unaided question was asked to understand the reasons for not filing cases under MACT. 38% of the LIH respondents stated that they did not feel the need to file a case under MACT followed by those who did not want to be involved in legal hassles (31%). 11% said they had a lack of knowledge about FIR and legal proceedings while 8% mentioned their inability to afford a lawyer/fee to file a case with MACT. The LIH respondents also mentioned that immediately after the crash, they were in a rush to manage monetary help required for medical expenses and thus could not even think of filing a case. Similarly, over half of the HIH respondents did not want to get into legal hassles, followed by those who did not feel the need to file a case (31%). Around 6% of the respondents said they had settled the case outside the court.
The High Court of Judicature at Madras in its recent
OUTCOMES OF THE INSURANCE & LEGAL COMPENSATION PROCESS

88
Judgment dated 23rd September 2020 in the case of Manager Vs. Shanmugam & Anr ( C.M.A.No.2854 of 2016) further stated that, “The MCTAP directed to be implemented by the Hon’ble Supreme Court …has not taken off in Tamil Nadu. No systemic change appears to have been brought about by the online platform by establishment of any specific procedure… There is no pre-litigation exercise by making use of the online facility initiated by the concerned authorities/ parties. As observed by this Hon’ble Court in the order dated 16.03.2020, the Insurance Companies still await the filing of claims before the Tribunal and the trial and adjudication still takes considerable length of time.”
These findings point at the systematic intervention required by State Legal Service Authorities to support the LIH to navigate the legal system. The Supreme Court in a Civil Appeal No. 2476-2477 of 2019 had also directed that NALSA should NALSA should monitor the adoption of MCTAP in coordination and cooperation with various High Courts. Even the Delhi High Court in its initial order had felt that the DSLSA could play a significant role in the settlement of crash cases. Thus, it had directed the Police, in FAO 842/2003 titled “Rajesh Tyagi & Ors. Vs. Jaibir Singh & Ors.”, that it would place a copy of the Accident Information Report along with the FIR not only before the Motor Accident Claims Tribunals but also before the DSLSA so that DSLSA can intervene whenever settlement
was getting difficult and legal aid is being provided in the cases where it is required. This role should be taken up by all State Legal Service Authorities specifically prioritising victims from LIH.

Traffic Crash Injuries and Disabilities: The Burden on Indian Society
TABLE 8.1: INSURANCE AND COMPENSATION OVERVIEW: CLAIMS FILED AND COMPENSATION RECEIVED
MO
TOR
VEH
ICLE
INSU
RAN
CE C
OM
PEN
SATI
ON Availed [N=1647]
Category (State, habitation,
gender) Availed [N=432]Received eligible compensation [N=229]
LIH HIH
Received eligiblecompensation [N=132]
Avg. time taken(months) [N=148]
Avg. time taken(months) [N=79]
MED
ICAL
INSU
RAN
CE C
OM
PEN
SATI
ON
Availed [N=1647]
Category (State, habitation,
gender) Availed [N=432]Received eligible compensation [N=229]
LIH HIH
Received eligiblecompensation [N=132]
Avg. time taken(months) [N=148]
Avg. time taken(months) [N=79]
OverallBiharMaharashtraTamil NaduUttar Pradesh
Habitation TypeUrbanRural
Victim GenderMaleFemale
13.9% 10.7% 9.2% 28.5%7.5%
13.9% 21% 11%
13.9% 13.5% 16.3%
OverallBiharMaharashtraTamil NaduUttar Pradesh
Habitation TypeUrbanRural
Victim GenderMaleFemale
7.5% 8.7%2.4% 17.4%1.7%
7.5% 11% 6.1%
7.5% 7.7% 6.2%
16.9% 20.9% 19.5% 16.5% 9.9%
16.9% 14.9% 26.3%
16.9% 19.4%7.6%
2.7 2.6 2.4 2.4 4
2.7 2.8 2.5
2.7 2.8 2
74%45.8%81.8%94.1%90%
74%66%95%
74%72.7%85.7%
2.52.83.42.2 3.7
2.52.82.2
2.52.52.4
79%69.4%70%88.7%42.9%
79%83%76.1%
79%78.2%85.7%
30.6% 21.7% 38.1% 32% 30.7%
30.6% 31.7% 25%
30.6% 32.6% 22.8%
7 12.6 10.5 3.9 11.1
7 7.1 6.9
7 7.6 4.2
7.3 17.6 3.1 6.4 10.3
7.3 6.9 8.9
7.3 8.1 3.4
64.6%59.1%55.3%75.9%41.9%
64.6%64.4%64.8%
64.6%63%73%
59.8%48%76.7%66.7%38.7%
59.8%54.9%89.5%
59.8%58.6%66.7%
LIFE
INSU
RAN
CE C
OM
PEN
SATI
ON
Availed [N=1647]
Category (State, habitation,
gender) Availed [N=432]Received eligible compensation [N=229]
LIH HIH
Received eligiblecompensation [N=132]
Avg. time taken(months) [N=148]
Avg. time taken(months) [N=79]
OverallBiharMaharashtraTamil NaduUttar Pradesh
Habitation TypeUrbanRural
Victim GenderMaleFemale
3.8% 4.1% 2.7% 2.5% 5.8%
3.8% 2.3% 4.4%
3.8% 4.2%1.3%
4.2%4.3%--1.9% 10.9%
4.2%3.9%5.3%
4.2%5.3%--
4.24.54.13.84.1
4.25.14
4.24.16
5.34.4--55.9
5.35.64.3
5.35.3--
77.4%76.5%81.8%40%91.7%
77.4%81.8%76.5%
77.4%79.7%33.3%
77.8%100%--50%72.7%
77.80%78.6%75%
77.8%77.80%--
OUTCOMES OF THE INSURANCE & LEGAL COMPENSATION PROCESS

90
MO
TOR
VEH
ICLE
INSU
RAN
CE C
OM
PEN
SATI
ON Availed [N=1647]
Category (State, habitation,
gender) Availed [N=432]Received eligible compensation [N=229]
LIH HIH
Received eligiblecompensation [N=132]
Avg. time taken(months) [N=148]
Avg. time taken(months) [N=79]
MED
ICAL
INSU
RAN
CE C
OM
PEN
SATI
ON
Availed [N=1647]
Category (State, habitation,
gender) Availed [N=432]Received eligible compensation [N=229]
LIH HIH
Received eligiblecompensation [N=132]
Avg. time taken(months) [N=148]
Avg. time taken(months) [N=79]
OverallBiharMaharashtraTamil NaduUttar Pradesh
Habitation TypeUrbanRural
Victim GenderMaleFemale
13.9% 10.7% 9.2% 28.5%7.5%
13.9% 21% 11%
13.9% 13.5% 16.3%
OverallBiharMaharashtraTamil NaduUttar Pradesh
Habitation TypeUrbanRural
Victim GenderMaleFemale
7.5% 8.7%2.4% 17.4%1.7%
7.5% 11% 6.1%
7.5% 7.7% 6.2%
16.9% 20.9% 19.5% 16.5% 9.9%
16.9% 14.9% 26.3%
16.9% 19.4%7.6%
2.7 2.6 2.4 2.4 4
2.7 2.8 2.5
2.7 2.8 2
74%45.8%81.8%94.1%90%
74%66%95%
74%72.7%85.7%
2.52.83.42.2 3.7
2.52.82.2
2.52.52.4
79%69.4%70%88.7%42.9%
79%83%76.1%
79%78.2%85.7%
30.6% 21.7% 38.1% 32% 30.7%
30.6% 31.7% 25%
30.6% 32.6% 22.8%
7 12.6 10.5 3.9 11.1
7 7.1 6.9
7 7.6 4.2
7.3 17.6 3.1 6.4 10.3
7.3 6.9 8.9
7.3 8.1 3.4
64.6%59.1%55.3%75.9%41.9%
64.6%64.4%64.8%
64.6%63%73%
59.8%48%76.7%66.7%38.7%
59.8%54.9%89.5%
59.8%58.6%66.7%
LIFE
INSU
RAN
CE C
OM
PEN
SATI
ON
Availed [N=1647]
Category (State, habitation,
gender) Availed [N=432]Received eligible compensation [N=229]
LIH HIH
Received eligiblecompensation [N=132]
Avg. time taken(months) [N=148]
Avg. time taken(months) [N=79]
OverallBiharMaharashtraTamil NaduUttar Pradesh
Habitation TypeUrbanRural
Victim GenderMaleFemale
3.8% 4.1% 2.7% 2.5% 5.8%
3.8% 2.3% 4.4%
3.8% 4.2%1.3%
4.2%4.3%--1.9% 10.9%
4.2%3.9%5.3%
4.2%5.3%--
4.24.54.13.84.1
4.25.14
4.24.16
5.34.4--55.9
5.35.64.3
5.35.3--
77.4%76.5%81.8%40%91.7%
77.4%81.8%76.5%
77.4%79.7%33.3%
77.8%100%--50%72.7%
77.80%78.6%75%
77.8%77.80%--

Traffic Crash Injuries and Disabilities: The Burden on Indian Society
TABLE 8.2: STATE-WISE SPLIT: VICTIM/NOMINEE FACED DIFFICULTIES IN ACCESSING COMPENSATION
0 20 40 60 80 100
Uttar Pradesh (N-413)
Tamil Nadu (N-407)
Maharashtra (N-415)
Bihar (N-412)
0 20 40 60 80 100
Uttar Pradesh (N-101)
Tamil Nadu (N-103)
Maharashtra (N-113)
Bihar (N-115)
0 20 40 60 80 100
Female (N-227)
Male (N-1420)
Victim Gender (N-1647)
0 20 40 60 80 100
Female (N-92)
Male (N-340)
Victim Gender (N-432)
0 20 40 60 80 100
Rural (N-1165)
Urban (N-482)
Habitation Type (N-1647)
0 20 40 60 80 100
Female (N-76)
Male (N-356)
Habitation Type (N-432)
OverallN-1647
OverallN-432LIH HIHYes
No
NADK/CS
YesNo
NADK/CS
15.5% 6.3% 71.6% 6.6%
14.7% 9.4% 73.5% 2.4%
9.8% 11.3% 78.4% 0.5%
18.2% 13.1% 56.7% 12.1%
14.6% 10% 70% 5.4%
15.4% 10.1% 68.9% 5.6%
9.7% 9.3% 77.1% 4%
14.6% 10% 70% 5.4%
8.7% 8.7% 76.1% 6.4%
17% 10.6% 67.5% 5%
8.3% 10.2% 75.7% 5.8%
7.3% 8.1% 78.1% 6.5%
13.2% 19.7% 64.5% 2.6%
8.3% 10.2% 75.7% 5.8%
8.8% 11.2% 73.5% 6.5%
6.5% 6.5% 83.7% 3.3%
8.7% 8.7% 63.5% 19.1%
6.2% 8.8% 84.1% 0.9%
5.8% 10.7% 83.5%
12.9% 12.9% 72.3% 2%
14.6% 8.3%
10%10.2%
75.7%70%
5.4% 5.8%
OUTCOMES OF THE INSURANCE & LEGAL COMPENSATION PROCESS

92
TABLE 8.3: FILED CASE IN MACT AFTER THE ROAD CRASH
0 20 40 60 80 100
Uttar Pradesh (N-413)
Tamil Nadu (N-407)
Maharashtra (N-415)
Bihar (N-412)
0 20 40 60 80 100
Uttar Pradesh (N-101)
Tamil Nadu (N-103)
Maharashtra (N-113)
Bihar (N-115)
0 20 40 60 80 100
Female (N-227)
Male (N-1420)
Victim Gender (N-1647)
0 20 40 60 80 100
Female (N-92)
Male (N-340)
Victim Gender (N-432)
0 20 40 60 80 100
Rural (N-1165)
Urban (N-482)
Habitation Type (N-1647)
0 20 40 60 80 100
Female (N-76)
Male (N-356)
Habitation Type (N-432)
OverallN-1647
OverallN-432LIH HIHYes
No
DK/CS
YesNo
DK/CS
23.8% 59.7% 16.5%
24.8% 65.3% 9.9%
17.7% 39.6% 42.8%
31.7% 60.8% 7.5%
24.5% 56.4% 19.1%
25.8% 54.9% 19.3%
16.3% 66.1% 17.6%
24.5% 56.4% 19.1%
16.6% 62.9% 20.5%
27.8% 53.7% 18.5%
20.4% 56% 23.6%
17.7% 60.4% 21.9%
32.9% 35.5% 31.6%
20.4% 56% 23.6%
21.2% 56.8% 22.1%
17.4% 53.3% 29.3%
17.4% 60% 22.6%
20.4% 69.9% 9.7%
19.4% 23.3% 57.3%
24.8% 69.3% 5.9%
24.5% 20.4%
56.4% 56%
23.6%19.1%

Traffic Crash Injuries and Disabilities: The Burden on Indian Society
FIG 8.1: REASONS FOR NOT FILING CASE WITH MACT [OPEN-ENDED, ALL FIGURES IN PERCENT]
B40 (N-929)
T10 (N-242)
0 10 20 30 40 50 60
Others
Other vehicle ran andcouldn't be identified
To avoid work/ study lossdue to court hearings
Out of court settlementwas done
Unable to hire/afford lawyer/ fee
Lack of knowledge aboutFIR and legal proceedings
Did not want to getinto legal hassles
Did not feel needof filing case
38.1% 31%
31.4% 51.2%
11.1% 2.9%
7.5% 2.1%
4.1% 5.8%
3.7% 2.5%
3.6% 1.2%
2% 3.3%
OUTCOMES OF THE INSURANCE & LEGAL COMPENSATION PROCESS

94
To address the issue of legal and procedural hassles, the Supreme Court in its judgment dated 05th March 2019 in the case of M.R. Krishna Murthi vs. The New India Assurance Co. Ltd., (Civil Appeal No. 2476-2477 of 2019) further recommended that “the Government (should) examine the feasibility of setting up the Motor Accident Mediation Authority (MAMA) in every district by making necessary amendments in the Motor Vehicles Act itself.”
PART B: TRUCK DRIVERS
Truck drivers form the backbone of the economy, controlling 67% of India’s freight and logistics sector (Road Transport Year Book 2015-16). Out of the 1.5 lakh people killed in road crashes in the country, 15,000 of the total (10%) road crash victims are truck and lorry drivers (MoRTH, 2018). In terms of vehicle category, trucks and lorries are involved in over 57,000 crashes (MoRTH, 2018). It is not surprising then that 61.5% of the truck drivers feel unsafe driving on roads (SaveLIFE Foundation, 2020). The living conditions of truck drivers are abysmal with no standardization in wages, lack of social security and incentives to complete a trip on time. 53% of the truck drivers earn a meagre income of Rs.10,000-Rs.20,000 per month. 93% of truck drivers do not get any social security benefits such as provident fund, pension, health insurance, life insurance, gratuity, etc (SaveLIFE Foundation, 2020). Three-fourth of the fleet owners have confirmed that their trucks were involved in road crashes and listed “getting insurance claim for vehicle
repair” as among the top 5 challenges they face when their trucks are involved in crashes (SaveLIFE Foundation, 2020).
Out of the 420 respondent truck drivers surveyed as part of this study, 58% of them stated that they were involved in road crashes where they had sustained injuries. In Maharashtra, 96% of the respondents had been injured in a road crash whereas the proportion was less than 50% among the other three surveyed States. Among the respondents who said that they had experienced injuries in the crash (N=244), about 50% of them were severely injured while the other half (50%) had sustained minor injuries. Nearly 47% of the respondents stated that they were admitted to a hospital for treatment.
One of the biggest challenges in claiming compensation after an crash for truck drivers has been the under-reporting of the crash and non- filing of FIRs. Overall, about two-thirds (66%) of truck drivers hadn’t filed an FIR after the crash. State wise (refer to Table 5A.11), only 2.5% of the truck drivers from Bihar reported filing an FIR after the crash, followed by Uttar Pradesh (27%), Maharashtra (42%) and Tamil Nadu (44%).
The most significant and concerning finding of this study is that despite having a high rate of crashes and sustaining injuries, none of the respondent truck drivers had applied/benefited from any Government run scheme for compensation after the road crash. They had neither laid claim to or benefited from any Government scheme like

Traffic Crash Injuries and Disabilities: The Burden on Indian Society
cashless treatment at hospitals, solatium fund for hit-and-run cases, or any other ex-gratia schemes at the central or state level.
8.3 PERSONAL INJURY INSURANCE AND COVERAGE AT THE TIME OF THE CRASH
The process of claiming insurance is fraught with challenges for vulnerable groups like truck drivers who often hail from LIH and disadvantaged sections of society. Truck drivers from Maharashtra stated they had to go through certain hassles during the claim proceedings and received late approval for their claims filed. Overall, more than half the truck drivers (54.5%) said that they were not covered under any sort of personal injury insurance44, whereas nearly 40% were covered under life insurance and 18% under medical insurance. Over 8 out of 10 respondents (87%) in Tamil Nadu had filed a claim for insurance for personal injuries while in Bihar, such a proportion was as low as 13.5%. It must be noted that while the coverage of personal injury insurance was highest in Bihar, the proportion of claims was lowest, whereas for Tamil Nadu it was directly proportional.
8.4 AWARENESS REGARDING “INSURANCE OF MOTOR VEHICLE AGAINST THIRD PARTY RISKS” AND OTHER RELATED ASPECTS
According to MVAA 2019, it is compulsory for drivers to have third-party insurance in order to get coverage for their own liability and the damage caused to the third party w.r.t bodily injury/death or vehicle. It is important to note that despite the Government bringing in progressive changes in the MVAA, 19 listed above, about two-third of the respondents were not aware/somewhat aware of third-party liability insurance, while about one-third stated otherwise (refer to Table 5A.19). Only 36% of the truck drivers said they were fully aware of the fact that third party insurance had been made mandatory under the MVAA, 19.
Interestingly, awareness about third-party liability insurance was directly related to the driving experience of the respondents, i.e., respondents with more driving experience seemed to be more aware of it. Also, those drivers who had experienced a crash seemed to be more aware (49%) of the clause than those who had not (13%). At the State level, less than one-fifth of truck drivers were aware of third-party liability insurance except for Maharashtra where nearly 8 out of 10 truck drivers were aware of it.
44. Personal accident insurance is a policy that can reimburse medical costs, provide compensation in case of disability or death caused by accidents, depending upon the nature of the disability.
OUTCOMES OF THE INSURANCE & LEGAL COMPENSATION PROCESS

96
There remains a confusion and misunderstanding among truck drivers on the definition of third party insurance and what it includes. Nearly two-third of the respondents said that third party insurance covers the other party involved in the crash, followed by nearly 13% who said that the insured gets compensation as cover while 8% said that the insuree can claim compensation on death, severe injury and damaged vehicle. In terms of the nature and scope of coverage under third party insurance, 7 out of 10 respondents mentioned that it covers for death, injury, and property damage. Similarly, almost 27% stated that it covers only property damage, while 25% stated it included only for injury/disability. Only 4% of the respondents thought that it included only death under its purview.
About one-third of the respondents stated that they were ‘not aware’ of the compensation process, including time limitation for filing the case before the Claims Tribunal and deputation of an officer by the insurer for settlement of the claim. Almost, a similar proportion of respondents were not aware of the inclusion of khalasi or attendant under third party insurance coverage under MVAA, 2019.
This lack of awareness across respondent categories has emerged as a trend throughout the study. Information asymmetry and poor literacy levels often deter the poor from filing claims. Even if the claims are filed, the proportion
of compensation received is not adequate and the delays in awarding compensation make the process unfavourable. Government schemes are also not well publicized among the poor and do not offer immediate relief after a road crash.

Traffic Crash Injuries and Disabilities: The Burden on Indian Society
TABLE 8.4: AWARENESS OF MOTOR THIRD PARTY LIABILITY INSURANCE-RELATED ASPECTS AT STATE
NA SA FA NA SA FA NA SA FA NA SA FA
Bihar (N=101) Maharashtra (N=113) Tamil Nadu (N=100) Uttar Pradesh (N=106)CATEGORY
The purchase of Motor Third party liability insurance is compulsory and you may be fined by the Police if vehicle is uninsured 2%
3%
2%
5%
5%
5%
20.8%
10.9%
11.9%
5.3%
9.7%
13.3%
13.3%
9.7%
17.7%
17.7%
23%
27.4%
53%
50%
26%
46%
54%
26%
50%
55%
45%
33%
31.1%
30.2%
47.2%
28.3%
35.8%
43.4%
45.3%
55.7%
53%
50%
26%
46%
54%
26%
50%
55%
45%
40.6%
31.1%
34.9%
34.9%
43.4%
40.6%
36.8%
35.8%
29.2%
79.2%
69.3%
71.3%
69.3%
72.3%
66.3%
63.4%
64.4%
71.3%
15%
31.9%
19.5%
27.4%
35.4%
26.5%
31%
37.2%
24.8%
79.6%
58.4%
67.3%
59.3%
54.9%
55.8%
51.3%
39.8%
47.8%
18.8%
27.7%
26.7%
25.7%
22.8%
28.7%
15.8%
24.8%
16.8%
31%
33%
55%
38%
30%
47%
33%
28%
38%
26.4%
37.7%
34.9%
17.9%
28.3%
23.6%
19.8%
18.9%
15.1%
If the vehicle UNINSURED, you/ owner may be personally liable to pay for injuries caused to others if you are at fault for crash
Motor Third Party liability insurance provides compensation to other peoplefor their injuries if the crash is your fault
Motor Third Party liability insurance does not provide compensation forinjuries you incur if the crash is your fault
If someone else is a fault for an crash & you incur injuries, you may be ableto claim compensation from the insurer the vehicle is insured with
The time limitation for filing of cases for compensation for injuries before theClaims Tribunal is 6 months from the date of the crash
In case of road crash, insurance company is liable to designate an officerto help you with the process of settlement of your claim
The compensation you are eligible to receive may be reduced if you breach a traffic law
Along with driver, truck attendant (khalasi) is also covered for benefits under third party insurance under MVAA, 2019
OUTCOMES OF THE INSURANCE & LEGAL COMPENSATION PROCESS

98
NA SA FA NA SA FA NA SA FA NA SA FA
Bihar (N=101) Maharashtra (N=113) Tamil Nadu (N=100) Uttar Pradesh (N=106)CATEGORY
The purchase of Motor Third party liability insurance is compulsory and you may be fined by the Police if vehicle is uninsured 2%
3%
2%
5%
5%
5%
20.8%
10.9%
11.9%
5.3%
9.7%
13.3%
13.3%
9.7%
17.7%
17.7%
23%
27.4%
53%
50%
26%
46%
54%
26%
50%
55%
45%
33%
31.1%
30.2%
47.2%
28.3%
35.8%
43.4%
45.3%
55.7%
53%
50%
26%
46%
54%
26%
50%
55%
45%
40.6%
31.1%
34.9%
34.9%
43.4%
40.6%
36.8%
35.8%
29.2%
79.2%
69.3%
71.3%
69.3%
72.3%
66.3%
63.4%
64.4%
71.3%
15%
31.9%
19.5%
27.4%
35.4%
26.5%
31%
37.2%
24.8%
79.6%
58.4%
67.3%
59.3%
54.9%
55.8%
51.3%
39.8%
47.8%
18.8%
27.7%
26.7%
25.7%
22.8%
28.7%
15.8%
24.8%
16.8%
31%
33%
55%
38%
30%
47%
33%
28%
38%
26.4%
37.7%
34.9%
17.9%
28.3%
23.6%
19.8%
18.9%
15.1%
If the vehicle UNINSURED, you/ owner may be personally liable to pay for injuries caused to others if you are at fault for crash
Motor Third Party liability insurance provides compensation to other peoplefor their injuries if the crash is your fault
Motor Third Party liability insurance does not provide compensation forinjuries you incur if the crash is your fault
If someone else is a fault for an crash & you incur injuries, you may be ableto claim compensation from the insurer the vehicle is insured with
The time limitation for filing of cases for compensation for injuries before theClaims Tribunal is 6 months from the date of the crash
In case of road crash, insurance company is liable to designate an officerto help you with the process of settlement of your claim
The compensation you are eligible to receive may be reduced if you breach a traffic law
Along with driver, truck attendant (khalasi) is also covered for benefits under third party insurance under MVAA, 2019

Traffic Crash Injuries and Disabilities: The Burden on Indian Society
6- POINT POLICY RECOMMENDATIONS
1. Comprehensive Implementation of MCTAP
A Director level official should be appointed by MoRTH for ensuring compliance with all Supreme Court & High Court judgments including but not limited to judgment on MCTAP. Further, an advisory should be sent to JS Centre-State Coordination for implementation of these judgments. The Supreme Court in its judgment dated 05th March 2019 in the case of M.R. Krishna Murthi vs. The New India Assurance Co. Ltd., SLP (C) No 31521-31522 of 2017, noted that there was no proper implementation of the Claims Tribunal Agreed Procedure by the Claims Tribunals at all India level. Even though the Supreme Court directed NALSA to ensure implementation in coordination and cooperation with various High Courts, yet, the implementation has been weak. The National Road Safety Board, which will be created under the Motor Vehicles Amendment Act, 2019, can be the main coordinating agency to ensure proper implementation of the MCTAP.
2. Issuance of Notification under MVAA,2019 to standardise protocol between MACT, Police and Insurance Company
For effective and efficient implementation of online DAR is important to ensure no delay in compensation being awarded to claimants. The standardization of this process will ensure that all crash documents, vehicular records, compliance with statutory provisions in regard
to use of vehicles, details of victims, family members and other aspects are shared with the tribunal as quickly and efficiently as possible. The notification should also direct the use of Crime and Criminal Tracking Network and Systems (CCTNS) by Police as well as Tribunals as the formal electronic to share files and information including FIRs and DARs.
3. Mechanism for Interim Compensation The MVAA,2019 also mandates a Motor Vehicle Accident Fund to be set up by the Central Government (Section 164B) for giving interim compensation to victims of road crashes under Section 164 A. The Central Government can also establish a Motor Accidents Mediation Authority (MAMA) in every district to provide fixed interim compensation as direct credit to Aadhaar linked bank accounts. MAMA can also take over pre-litigation procedures from MACT.
The Union Govt must fix an amount that can be transferred immediately as interim compensation pending adjudication of the compensation claim. The recommended range of amount is INR 2-5 lakhs in case of death and INR 50,000 for injury.
4. Ensuring coordination between MAMA, State Road Safety Council (SRSC), and State Legal Services Authority (SLSA)
An effective institutional mechanism needs to be put in place to ensure smooth coordination between the relevant agencies. Appointment of a 3-member team at
OUTCOMES OF THE INSURANCE & LEGAL COMPENSATION PROCESS

100
the State level could include officials from the Health, Law and Transport departments respectively. MVAA,19 has brought in certain progressive changes in the insurance and compensation process to make it more victim-friendly. The Act has simplified the claims process to benefit the claimants by reducing the litigation period, which currently runs into years. To further increase coordination and ensure real-time monitoring of implementation, the Central Government should create a policy framework to ensure efficient coordination between MAMA, SRSC and SLSA.
5. Increasing Awareness about MCTAP and other Compensation Schemes
This can be achieved through the Government mandating General Insurance Corporation (GIC) to set up a dedicated helpline number for LIH. Other insurance companies can contribute to this and the number can be linked to the hospital database of LIH.
Information asymmetry and poor literacy levels often deter the poor from filing claims. Even if the claims are filed, the proportion of compensation received is not adequate and the delays in awarding compensation make the process unfavourable. Government schemes are also not well publicized among the poor and do not offer immediate relief after a road crash.
6. Inserting Technology to ensure Insurance Coverage
Inserting technology to increase accessibility and affordability of insurance products to poor households
should be incentivised. Government should encourage companies to create low-price, micro- insurance products with LIH in mind. For example, Medical insurance provides coverage only for hospitalization, pre-specified ailments and crashes, for a pre-specified amount while health insurance provides a comprehensive coverage against hospitalization expenses, pre-hospitalization and post-hospitalization expenses and ambulance charges. An insurance product designed to ensure pay-out on losing “one-month of work due to ill-health” would help create an interim-safety net for the entire household. Also IRDA should ensure that insurance agencies create mechanisms for simple claim settlement.

Traffic Crash Injuries and Disabilities: The Burden on Indian Society
CH
AP
TE
R 9
INTERACTIONS WITH INSTITUTIONS
According to the WHO, 50% road crashes victims die in the first 15 minutes and the rest can be saved by providing basic life support during the “Golden Hour”. It therefore becomes imperative to provide proper initial care to road crash victims within the first hour of the crash. During the survey, respondents were probed about their interaction with key stakeholders, i.e. Police and health workers.
Overall (combining LIH and HIH categories), among the victims that survived, 55 percent were admitted in hospital for more than a day, while 13 percent were discharged within 24 hours. Out of those who did not survive, 15 percent died at the scene, 7 percent died on the way to hospital, 9 percent died within 30 days from the crash.
KEY FINDINGS
1. Almost all victims of HIH category (98%) were transferred to hospital while among LIH category 89 percent; 1/3rd of victims transferred in ambulances.
2. 2/3rd of LIH victims and 8 out of 10 HIH victims were admitted to hospital for treatment. Further, the average time any LIH victim stayed in hospital was nearly 20 days whereas it was approximately 10 days for HIH category.
3. Reporting of crashes to police was higher among LIH respondents (54%) compared to HIH category respondents (43%).

102
4. Almost half of LIH respondents (48%) filed FIR while 41% of HIH respondents did the same. Compared to survival cases, the proportion of FIR filing was significantly higher (over 2 times) when a road crash victim died.
9.1. INTERACTIONS WITH THE MEDICAL SYSTEM
Majority of the victims were transferred to hospital. Almost all victims of HIH category (98%) were transferred to a hospital while amongst LIH category 89 percent were transferred to a hospital.
Overall, in the majority of the cases victims were shifted through private vehicles followed by ambulances and public vehicles such as auto/ taxi etc. State-wise, in case of Tamil Nadu, highest proportion of victims were transferred to hospital in ambulances while lowest in Bihar.
With a mandate to reduce the mortality and morbidity of trauma patients in Tamil Nadu, the State Government launched “Tamil Nadu Accident and Emergency care Initiative (TAEI)” programme in 2016 to improve emergency medical services in trauma cases.45
Further, victims that were transferred through ambulance were asked about the response time. Overall (combining
LIH and HIH categories), it was found that ambulances did not arrive at the crash location within 15 minutes in 55 percent cases while it took more than half an hour in about 14 percent cases.
However, state-wise, more than half of respondents of Tamil Nadu said that the ambulance arrived at the crash location within 15 minutes.
Across states, a higher proportion of victims were taken to private hospitals compared to government hospitals. On deeper analysis, it was observed that cases where victims survived in road crashes, mostly were taken to private hospitals (LIH-67%, HIH-87%); while the cases where victims died (immediately or later on), most were transferred to government hospitals (LIH-55%, HIH-56%). An inclination towards private hospitals amongst both categories could be due to the perception of better emergency facilities, even when private hospitals can be more expensive, especially for the LIH category.
Overall, compared to the LIH category, a higher proportion of HIH category victims were admitted to any hospital. Among LIH category, nearly two-third of victims were admitted to hospital while among HIH category four out of five victims were admitted.
The percentage of victims that were admitted to hospital among HIH category was higher than LIH category in both
45. https://www.dropbox.com/sh/mnahgopoj4bcw1g/AACz_FcdzK2VMdIbjv0ewIuFa?dl=0&preview=TAEI+Manual+2018+09+10.pdf

Traffic Crash Injuries and Disabilities: The Burden on Indian Society
urban and rural areas. A significant difference was observed in LIH (66%) and HIH (84%) category in rural areas. On further enquiry, it was found that the average time any LIH victim stayed in hospital was nearly 20 days whereas it was approximately 10 days for HIH category.
Among both the categories (LIH and HIH), almost half of the respondents reported that the victims were not attended by the hospital staff (doctor/ nurse) immediately on reaching the hospital.In Tamil Nadu, 12 percent LIH respondents said that it took more than half an hour for the hospital staff to attend to the victim. Similarly, one-fourth of HIH respondents of Bihar mentioned that hospital staff took more than half an hour to attend the victim after reaching the hospital.
9. 2. PREVALENCE OF DISCRIMINATORY PRACTICES IN THE MEDICAL SYSTEM
Overall, nearly 7 percent of respondents mentioned that they had faced discrimination/ prejudice by the hospital officials/ staff among both LIH and HIH categories. The highest proportion of Bihar respondents from both LIH (13.2%) and HIH (21.9%) categories experienced discrimination by the hospital staff, which was comparatively higher than other states. Further, respondents that have faced discrimination/ prejudice at hospitals were asked an open-ended question
regarding types of discrimination they have faced. The most prevalent form of discrimination/ prejudice by the hospital staff among LIH category was not attending victims immediately by hospital staff on reaching hospital (69.8%) followed by the cases where victims were even denied admission in hospital (13.2%).While HIH category respondents reported that the hospital staff made excuses to treat the victim and asked to take them to other hospitals (55.2%).
9.3. INTERACTIONS WITH POLICE SYSTEM
To understand the victims’ / family members’ experience with the police and legal system, they were explored on aspects such as FIR filing, adherence to road safety laws, assistance by police officials etc.
As per the Motor Vehicles Act 1988 and the Motor vehicles (Amendment) Act, 2019 wearing a helmet for motorized two-wheeler users and seatbelt for motorized four-wheeler users is compulsory. In order to understand usage of safety devices while riding/ driving, respondents were asked if the victims were wearing such protective devices.
Overall, the proportion of victims that wore helmet or seatbelt at the time of crash was lower among LIH compared to HIH category. Among LIH, one-third of victims were wearing helmets while only 5 percent were wearing seatbelts at the
INTERACTION WITH INSTITUTIONS

104
time of crash. In the HIH category about half of the victims were wearing helmets while about one-fifth were wearing seatbelts. Compared to urban areas, it was observed that seatbelt/ helmet usage was more prevalent in rural areas which was almost twice the urban areas.
Respondents were probed on whether they had intimated the crash to the police. Overall, case reporting to the police was found higher among LIH respondents compared to HIH respondents.
Over half of the respondents from the LIH category (54%) reported the road crash to the police whereas, 43% of HIH respondents reported crashes to the police.
Also, overall (both LIH & HIH), more than 8 out of 10 respondents reported the crash to the police where the victim had died while in case of serious injuries about one-third of road crashes were reported to the police.
Additionally, respondents were asked if FIR of the crash was filed. Overall, close to half of LIH respondents had not filed the FIR of the crash while over 50 percent amongst HIH category respondents did not file the FIR.Also, overall, three-fourth of LIH respondents filed FIR where the victim had died. Similarly, 90% of HIH respondents filed FIR in case of road crash death.
Those respondents who admitted to not filing the FIR were asked an open-ended unaided question to know the
possible reasons for the same. 46 percent LIH respondents said they did not feel the need of filing FIR followed by one-fourth of respondents that did not want to get into legal hassle and 8 percent respondents that were afraid of police harassment. Few others mentioned that they were afraid of police asking for bribes (3.6%) and few mentioned police declining to file the FIR (2.3%).
Similarly, half of the HIH respondents did not file the FIR saying they did not want to get into legal hassle followed by one-third that mentioned they did not feel the need for the same.
“After hitting us, he hit the pedal. We could barely note the
vehicle registration number. The policeman asked us for the vehicle registration number for
filing the FIR”
- Male FGD Participant, Lucknow

Traffic Crash Injuries and Disabilities: The Burden on Indian Society
During FGDs, many respondents mentioned that since the crash was a hit and run case and the vehicle could not be identified or they could not note the vehicle number, therefore the FIR couldn’t be filed, since the police wanted to know the offender. Also, many female respondents admitted to not being aware of the process and the need for filing FIR.
Respondents that filed FIR (N=970) were further asked if police officials were helpful/ cooperative during the FIR process. Overall, about 18.3 percent respondents of LIH category stated that police were not helpful/ cooperating with them while among HIH category it was about 11.7 percent. State-wise, over one-third LIH respondents of Bihar and close to one-fourth LIH respondents of Uttar Pradesh stated that they were not assisted by police during the FIR process. In the HIH category, one-third respondents of Bihar and 18 percent of Maharashtra did not receive police assistance during the FIR process.
6-POINT POLICY RECOMMENDATIONS
1. Sensitization and Training of Police on rights of Road Crash Victims and other Road Users.
Police Officials at the level of Investigation Officer and
above should be trained and sensitized on the rights of bystanders, road crash victims and their family members. The police should not entangle road users in procedural hassles. Many FGD participants also mentioned police reluctance in filing FIRs in Hit and Run cases. Police should be trained to support road crash victims and their families. Since police is one of the key stakeholders in terms of enforcing rules under MVAA, 19, good practices of certain States can be standardised across the country and made a norm. For instance, the DGP’s ‘Fortnightly Crime Review Meeting’ should also include a review of Road Crash Cases in the State.
2. Raising Awareness and reducing Information Barriers.
The Government should also raise awareness amongst poor and uneducated households on their rights as road user as well as in case of a road crash. In case of an crash the State Government should provide advice during the MACT claim process. Insurance agencies and IRDAI should also reach people through BTL activities to reduce information barriers.
3. Additional Support to vulnerable people, including women under Proposed Cashless Treatment Scheme under Section 162 of MVAA,2019
INTERACTION WITH INSTITUTIONS

106
Many respondents in FGDs and IDIs stated that they didn’t receive proper medical care at the hospital. While the Ministry of Road Transport and Highways (MoRTH) and National Health Agency will operationalize the Cashless crash scheme, the State Government should create Grievance Redressal Mechanism to ensure healthcare service providers in the State don’t deny treatments to victims.
4. Setting Clear Roles and Responsibilities for District Road Safety Committees
All State Governments have created a District Road Safety Committee under Section 215(3) of the Motor Vehicles Act, 1988. This was done in 2018 under the instructions of the Supreme Court Committee on Road Safety under Writ Petition (Civil) No. 295 of 2012. However, the roles and responsibilities of the District Road Safety Committee is not standardized. Their roles and responsibilities should be measurable, reportable and verifiable. The Action Taken Reports should be submitted digitally to the State and the Central Government.
5. Grievance Redressal Mechanism
There should be a grievance redressal helpline number for all cases of medical negligence. The number should
be managed by the State Health Services and the helpline number should be publicised at all hospitals.
6. Ensuring Coordination between different stakeholders.
The proposed National Road Safety Board (NRSB) under Section215(B) of the MVAA, 2019 should be constituted immediately to ensure coordination between different stakeholders. A strong, independent and technically competent NRSB would also serve as primary centre for ensuring data analysis and data driven policy changes. NRSB can also supervise and monitor efforts of all State Governments to achieve various road safety related indicators as well as create mechanisms to engage with road users throughout the country.
The Officiating Secretary of the State Road Safety Authority/Board should be entrusted with the responsibility to maintain coordination among all relevant stakeholders. The appointment of a specific member from NRSB at the National level can be done for the same.

Traffic Crash Injuries and Disabilities: The Burden on Indian Society
CH
AP
TE
R 1
0WAY FORWARD
This report presents a rigorous analysis on the socio-economic impact of RTIs on poor households and disadvantaged sections amongst road users in India. It highlights the significant differences in the short-term and long-term; direct and indirect impacts of crashes on victims and their households by comparing among Low Income and High Income Households. Key findings indicate that children and adolescents are particularly at risk, as are truck drivers due to their long commutes; women bear a greater and disproportionate burden of road crashes. Outcomes are also significantly different for households in Low Capacity States vis-à-vis households in High Capacity States and urban areas. As such, government interventions may need to focus more on LIH from rural areas and Low Capacity States, who are more severely affected It needs to be stated that this is not a longitudinal study. A follow up study would enhance the value of the perspectives offered here and would help in capturing the overall impact of crashes better. Globally, disability has been studied over longer periods of time and it is important to conduct more studies in the future to assess its holistic impact.
Favourable signs of Government Action have emerged with the recent enactment of the Motor Vehicles (Amendment) Act, 2019 and the rules being framed under it by MoRTH. If implemented fully and urgently by all states, the proposed changes could pave the way for a positive turnaround of the road safety situation in India. Under relevant MVAA 2019 provisions, this report suggests that government support systems need to be created and social safety nets extended to poor households to mitigate their financial burden and cope with the sudden fallout of a road crash. The legal system needs to be sensitised towards the predicament of

108
poor victims and their families in the event of a crash and the rights of road crash victims to commensurate and timely compensation needs to be institutionalised. In addition, emergency medical care needs to be improvised and strengthened to ensure greater chances of survival among VRUs/LIH victims. The gendered impact of road crashes needs to be acknowledged: women’s participation in road safety reforms should be increased and special state-run programmes and schemes need to be implemented at the state level to provide them immediate relief.
The report emphasises the need to tailor road safety initiatives according to the socio-economic status of road users, as RTIs in India especially affect VRUs, most of whom are poor. It identifies key areas needing immediate improvements and provides some key policy recommendations for the central and state Governments for alleviating RTI-related suffering of VRUs, adolescents and women. These policy reforms have been grouped under the following six key themes:
I. Enhance effectiveness of institutional mechanisms and awareness building
II. Institutionalise post-crash emergency care and make health infrastructure & coverage more accessible & inclusive
III. Provide Social Security nets for crash victims from LIH
IV. Create an accessible legal framework for availing insurance and compensation by road crash victims
V. Address the disproportionate gender impact of RTIs through participative governance & special schemes for women
VI. Strengthen post-crash support for children and young adults through state support
Improving road safety performance at the national and state level calls for a long-term vision, an integrated framework and sustained efforts from all stakeholders. Implementing the six thematic recommendations above in a sustainable way will require strengthening of institutions, ensuring inter-agency coordination, sanctioning dedicated budgets, and building the institutional capacity of states, especially low capacity states.
This report provides a template to assess and inform reforms based on actual ground situation. This template could be used by Central and State Governments to embed the methodology used in the study to help policy makers evolve customized road safety policies and action plans. Similar or adapted assessmentstudies could be replicated in more states with differential capacities (perhaps under the proposed MoRTH’s State Support Scheme for Road Safety) to highlight gaps and areas of regulatory reform. This can be more effective and beneficial for undertaking targeted efforts and focused interventions.

Traffic Crash Injuries and Disabilities: The Burden on Indian Society
1. DIFFERENTIATED SUPPORT FOR VRUS, ESPECIALLY FROM RURAL LIH The interlinkages between VRUs, LIH and road crash outcomes, indicate the need to invest more in VRU friendly infrastructure that prioritizes their safety especially in rural areas. State Governments should select districts with a high VRU crash rate and prioritize their safety through dedicated Annual Action Plans.
The findings of this study reveal that 83% of LIH victims were VRUs. Further, income decline was most severe for LIH rural households (56%) compared to LIH urban (29.5%) and HIH rural (39.5%).
2. MANDATORY PUBLISHING OF ROAD SAFETY TARGETS BY EVERY STATE ANDPLANNED,TARGETEDSPENDINGBYHIGHCAPACITYSTATES(HCS)
It should be made mandatory for all States to publish their targets on road safety annually so that their performance can be measured against these targets. Additionally, their budgets should be reviewed by a relevant authority to maintain transparency and efficiency. Since High Capacity States have higher spending power and more effective institutional mechanisms to implement targets, a multi-level agency should be set up in every State to oversee road safety efforts and guide HCS in drawing out detailed plans.
3. SENSITISATION AMONG THE MEDIA FOR GREATER REPORTING ON CRASH CASES
Road safety educational programmes need to be enhanced for the education and sensitisation of targeted sections. For instance, the WHO Media Fellowship offers reporters a curriculum to help make their reporting around road crashes more nuanced. A similar model needs to be replicated at State level to ensure in-depth comprehensive and science-based coverage.
THEME ONE: Enhance effectiveness of institutional mechanisms and awareness building
Below is a quick snapshot of policy implications/recommendations along six broad themes:
WAY FORWARD

110
4. SENSITIZATION AND TRAINING OF POLICE ON RIGHTS OF ROAD CRASH VICTIMS AND OTHER ROAD USERS
Police Officials at the level of Investigation Officer and above should be trained and sensitized on the rights of bystanders, road crash victims and their family members.
Police should be trained to support road crash victims and their families. Since police is one of the key stakeholders in terms of enforcing rules under MVAA, 19, good practices of certain States can be standardised across the country and made a norm. For instance, the DGP led fortnightly crime reviews can be made a routine practice across States to ensure better training of police
The police should not entangle road users in procedural hassles. About 18.3% respondents of LIH category and 11.7% from HIH category stated that police were not helpful/cooperating with them. Many FGD participants also mentioned police reluctance in filing FIRs in Hit and Run cases.
5. SETTING CLEAR ROLES AND RESPONSIBILITIES FOR DISTRICT ROAD SAFETY COMMITTEES
All State Governments have created a District Road Safety Committee under Section 215(3) of the Motor Vehicles Act, 1988. This was done in 2018 under the instructions of the Supreme Court Committee on Road Safety under Writ Petition (Civil) No. 295 of 2012. However, the roles and responsibilities of the District Road Safety Committee is not standardized. Their roles and responsibilities should be measurabWWle, reportable and verifiable. The Action Taken Reports should be submitted digitally to the State and the Central Government.
6. ENSURING COORDINATION BETWEEN DIFFERENT STAKEHOLDERS
The Officiating Secretary of the State Road Safety Authority/Board shall be entrusted with the responsibility to maintain coordination among all relevant stakeholders. The appointment of a specific member from NRSB at the National level can be done for the same.The proposed National Road Safety Board (NRSB) under Section215(B) of the MVAA, 2019 should be constituted to ensure coordination between different stakeholders. A strong, independent and technically competent NRSB would also serve as primary centre for ensuring data analysis and data driven policy changes. NRSB can also supervise and monitor efforts of all State Governments to achieve various road safety related indicators as well as create mechanisms to engage with road users throughout the country.

Traffic Crash Injuries and Disabilities: The Burden on Indian Society
7. RAISING AWARENESS AND REDUCING INFORMATION BARRIERS.
The Government should raise awareness amongst poor and uneducated households on their rights as road users as well as planning their next steps in case of a road crash. For instance, State Governments should create awareness of cashless treatment schemes, emergency numbers and other support schemes being run for crash victims. They should also provide advice during the MACT claim process. Insurance agencies and IRDA should also reach people through BTL activities to reduce information barriers.
70% of respondents of LIH and 63% of HIH were not aware of compensation clauses and schemes in the event of a road crash.
WAY FORWARD

112
8. URGENT NEED TO LOWER THE OOPE FOR LIH The lack of infrastructure at the primary level, lack of awareness on life-saving protocols among local communities and first responders, low coverage and inadequate compensation, low doctor-patient ratio and inefficient emergency management increases the costs for post-crash care. There is an urgent need to lower the OOPE for LIH by improving health infrastructure, especially in rural areas, investing in better training of manpower, making post-crash emergency care more accessible and efficient, ensuring more efficient penetration and coverage of LIH under health insurance.
The risk of catastrophic expenditure is inversely proportional to increasing income per capita, i.e., it is significantly larger for those belonging to lower-income quartiles than for those belonging to the highest income quartile. Out of Pocket Expenses (OOPE) was the most significant direct cost borne by victim families among LIH. The overall OOPE was higher for LIH (62%) than HIH (59%). LIH spent a little more than half (52%) of all their income (Rs.78,824) as OOPE on the victim’s treatment (hospitalisation, medicines, care) compared to HIH that spent 30.5% of their household income, i.e., Rs.60,476 on the victim’s post-crash treatment and recovery. A mere 6.1% of the LIH in rural areas availed medical insurance compensation, whereas 26.3% of the HIH residing in rural areas availed medical insurance compensation.
9. STATES NEED TO URGENTLY IMPLEMENT THE SCHEME FOR CASHLESS TREATMENT OF ROAD CRASH VICTIMS AND PUBLICIZE THE GOOD SAMARITANLAW
In order to save more lives during the critical golden hour. Currently, the Centre has floated such a scheme for cashless treatment of road crash victims under Section 162 of the Motor Vehicles (Amendment), Act, 2019. The proposed scheme suggests a cap of Rs 2.5 lakh for the victim’s treatment per crash and designates the National Health Authority as the nodal agency to implement the scheme under Pradhan Mantri Jan Arogya Yojana.
None of the truck drivers surveyed said that they had applied/benefited from cashless treatment at the hospital, or ex-gratia schemes. Across states, a higher proportion of victims were taken to private hospitals compared to government hospitals which can prove to be more expensive, especially for LIH.
THEME TWO: Institutionalize post-crash emergency care and make health infrastructure & coverage more accessible & inclusive

Traffic Crash Injuries and Disabilities: The Burden on Indian Society
10. ADDITIONAL SUPPORT TO VULNERABLE PEOPLE, INCLUDING WOMEN UNDER PROPOSED CASHLESS TREATMENT SCHEME UNDER SECTION 162 OF MVAA,2019
Many respondents in FGDs and IDIs stated that they didn’t receive proper medical care at the hospital. While the Ministry of Road Transport and Highways (MoRTH) and National Health Agency will operationalize the Cashless crash scheme, the State Government should create Grievance Redressal Mechanism to ensure healthcare service providers in the State don’t deny treatments to victims.
During the FGD, women participants mentioned the need for cashless treatment of road crash victims in all government and private hospitals, especially for poor families.
11. ENSURING QUALITY OF CARE AT THE HOSPITAL
Many respondents spoke about authorities with mistrust. A few participants suggested that there should be a mechanism to ensure quality of care at hospitals and awareness on these rights should be raised amongst the general public. The quality of care can be ensured for every patient by observing scientific protocols and safe best practices, reducing waiting time and unnecessary delays, being responsive to patient needs, avoiding waste and following equitable and non-discriminatory standards.Hospitals should establish measurable benchmarks to monitor outcomes and follow up on these standards and practices. Since most of the women who either die or are injured in road crashes are in rural areas, Accredited Social Health Activists (ASHAs) can be entrusted with the task of spreading awareness on the rights of patients, information about government run health schemes and ensuring that victims get proper rehabilitation and after-care post an crash.
12. MAKE INSURANCE POLICIES MORE INCLUSIVE BY COVERING FOR REHABILITATION AND RECOVERY OF ROAD CRASH VICTIMS. ADDITIONALLY, INSURANCE SCHEMES SHOULD ALSO ACCOUNT FOR THE MENTAL HEALTH IMPACT OF ROAD CRASHES ON VICTIMS AND DESIGN MORE PROGRESSIVE POLICIES. ESTABLISH A NEURO-SPINAL REHAB CENTRE AT THE DISTRICT LEVEL FOR ALL STATES.
Merely increasing insurance coverage is not enough as not all those who are enrolled know about the scheme or its benefits, not all the poor are covered, and not everyone has access to healthcare. Health insurance coverage in India remains poor because the private health insurance industry is still at a nascent stage, the pool of people who are able and willing to pay for insurance is low, and insurance premiums are high. Further because LIH, especially in rural India, have limited access to healthcare services such as doctors and hospitals, they are less likely to buy health insurance.
WAY FORWARD

114
13. MENTAL HEALTH SUPPORT
Motor vehicle crashes can result in ‘significant post-traumatic psychiatric morbidity’. The psychological impact of road crashes is an understudied area and the data on the subject is extremely fragmented or non-existent. Academic and other institutions should analyse the trends for psychological distress due to road crashes in India.The Ministry of Health and Family Welfare should also update the National Mental Health Policy (NMHP) notified in 2014. NMHP acknowledges the linkage between poverty and mental health however it does not categorise crash victims as “Vulnerable Population”. The state government should also ensure implementation of NMHP right from Primary Health Care level. State Governments should also conduct awareness drives on already existing schemes like – ‘KIRAN 24x7 Mental Health Rehabilitation Helpline. Most importantly, mental health of road crash victims should be covered under health insurance.
The police should not entangle road users in procedural hassles. About 18.3% respondents of LIH category and 11.7% from HIH category stated that police were not helpful/cooperating with them. Many FGD participants also mentioned police reluctance in filing FIRs in Hit and Run cases.
14. IMPROVING ACCESS TO EMERGENCY MEDICAL CARE. THERE IS A NEED TO PUBLICIZE EMERGENCY NUMBERS AND CREATE MORE AWARENESS AROUND IT. 112 HAS BEEN DECLARED A PAN-INDIA EMERGENCY HELP LINE NUMBER for immediate assistance services for police, fire, health and women.
People in rural areas have poor access to medical facilities. Primary Care and Secondary Care infrastructure and resources in rural areas are inadequate to provide proper care to victims of road crashes. The Central and State Governments should ensure placement of adequate numbers of Basic Life Support (BLS) and (ALS) ambulances with life support equipment, and a trained paramedic. Each district should be equipped with a secondary trauma care facility with infrastructure and resources for initial evaluation, resuscitation, stabilization and initiation of transfer to a higher-level trauma care facility.
15. GRIEVANCE REDRESSAL MECHANISM:
There should be a grievance redressal helpline number at all hospitals to be published and managed by the State Health Services for aggrieved victims and their families to complaint and be heard. This will ensure hospitals act with responsibility.
Nearly 7% of the respondents mentioned that they had faced discrimination/ prejudice by the hospital officials/staff among both LIH and HIH categories.The types of discrimination included victims being denied admission and not attending to the victims immendiately on arrival at the hospital.

Traffic Crash Injuries and Disabilities: The Burden on Indian Society
16. INTEGRATING ROAD CRASH VICTIMS AS A SPECIAL CATEGORY IN SOCIAL SECURITY SCHEMES Policymakers need to acknowledge the interplay between road crashes and various social hierarchies of class, gender, location that intersect to render certain disadvantaged groups more vulnerable to the shocks of crashes. The spatial context and lived experiences of poor households makes it harder for them to respond to the harsh impact of road crashes, pushing them into a vicious cycle of debt and suffering. Therefore, all existing social security schemes should recognize victims of road crashes as a special category that needs Government support as various levels.
17. COMPREHENSIVE REHABILITATION SUPPORT. A REHAB FACILITY SHOULDBESETUPINEVERYDISTRICT.
Injury caused by crashes is the 3rd largest cause of Disability. According to a report by NIMHANS, ‘nearly 100% of the severely injured, 50% of the moderately injured and 10-20% of the mildly injured will have lifelong disabilities’.
In India, there are multiple structural, social and economic barriers to accessing Rehabilitation. The Central and State Ministers of Social Welfare and Empowerment should create comprehensive programmes for rehabilitation of crash victims. Similarly, District Road Safety Committees should also maintain a database of people in each district who should receive such care and support them through community based programmes.
Among those who survived the road crash, about three out of ten (29.5%) respondents from poor families (LIH) reported undergoing disability. Further, about 6 out of 10 respondents in LIH (64%) and HIH (62%) category required on-going mobility assistance. In terms of time taken to resume work after an crash, the result was more severe for HIH than LIH. Among the LIH, the average time taken to rejoin the previous occupation was about 92 days (about 3 months) whereas it was 43 days (about 1.5 months) amongst HIH category. Overall, LIH category victims took about 107 days to find a new job from the day of the crash whereas it was about 65 days in case of HIH victims.
THEME THREE: Provide a social security net for crash victims from LIH through state support
WAY FORWARD

116
18. ACCESS TO UPSKILLING AND JOBS.
The National Skill Development Corporation (NSDC) can undertake a special programme to upskill crash victims from rural areas. The programme can set up specific targets of skilling 1 million people for the next 5 years and so on. The NSDC can tie up with other NGOs for this purpose.
Most rural poor are injured in road crashes, this is also validated by the 2011 census data as 71% of India’s 26.8 million Persons with Disability (PwD) live in rural India. Out of the total population of PwD, about 15 million are male and 11.8 million, female. Poor households have a lesser ability to respond to road crashes and find it difficult to mitigate their financial burden in the event of an unforeseen emergency. Since the impact is more severe on LIH than HIH, the Ministry of Social Welfare and Empowerment, Ministry of Small and Medium Enterprises, Ministry of Skill Development and Ministry of Agriculture should create priority programs for upskilling of PwD in rural areas and also create specific programs for female PwD in rural areas.
19. SUPPORT TO CONTINUE EDUCATION.
Throughout FGDs and IDIs many respondents stated the impact of crashes on Education with many male respondents having to leave education to support the household financially.The Ministry of Education should create specific schemes to ensure children from households that have been impacted due to road crashes can continue their education.
Indian Industrial Institutes (ITIs) impart skills in various vocational trades to meet the skilled manpower requirements in the country. An automatic enrolment policy should be created at the district level for road crash victims or their family members who had to drop out of schools or forsake education owing to a road crash.
As high as one in five (20%) respondents of LIH category have mentioned that someone in their household had to give up education due to the crash. Such a proportion of respondents among the HIH category was only 5 percent.

Traffic Crash Injuries and Disabilities: The Burden on Indian Society
20. COMPREHENSIVE IMPLEMENTATION OF MCTAP A Director level official should be appointed by MoRTH for ensuring compliance with all Supreme Court & High Court judgments including but not limited to judgment on MCTAP. Further, an advisory should be sent to JS Centre-State Coordination for implementation of these judgments. The Supreme Court in its judgment dated 05th March 2019 in the case of M.R. Krishna Murthi vs. The New India Assurance Co. Ltd., SLP (C) No 31521-31522 of 2017, noted that there was no proper implementation of the Claims Tribunal Agreed Procedure by the Claims Tribunals at all India level. Even though the Supreme Court directed NALSA to ensure implementation in coordination and cooperation with various High Courts, yet, the implementation has been weak. The National Road Safety Board, which will be created under the Motor Vehicles Amendment Act, 2019, can be the main coordinating agency to ensure proper implementation of the MCTAP.
21. ISSUANCE OF NOTIFICATION UNDER SECTION 164C OF THE MVAA, 2019 TO STANDARDIZE PROTOCOLS BETWEEN MACT, POLICE AND INSURANCECOMPANY
For effective and efficient implementation of online DAR is important to ensure no delay in compensation being awarded to claimants. The standardization of this process will ensure that all crash documents, vehicular records, compliance with statutory provisions in regard to use of vehicles, details of victims, family members and other aspects are shared with the tribunal as quickly and efficiently as possible. The notification should also direct the use of Crime and Criminal Tracking Network and Systems (CCTNS) by Police as well as Tribunals as the formal electronic to share files and information including FIRs and DARs
22. ISSUANCE OF NOTIFICATION UNDER SECTION 164C OF THE MVAA, 2019 TO STANDARDIZE PROTOCOLS BETWEEN MACT, POLICE AND INSURANCE COMPANY
For effective and efficient implementation of online DAR is important to ensure no delay in compensation being awarded to claimants. The standardization of this process will ensure that all crash documents, vehicular records, compliance with statutory provisions in regard to use of vehicles, details of victims, family members and other aspects are shared with the tribunal as quickly and efficiently as possible. The notification should also direct the use of Crime and Criminal Tracking Network and Systems (CCTNS) by Police as well as Tribunals as the formal electronic to share files and information including FIRs and DARs
THEME FOUR: Create an accessible legal framework for road crash victims to avail insurance and compensation
WAY FORWARD

118
23. MECHANISM FOR INTERIM COMPENSATION
Interim compensation becomes crucial for the survival of poor households in the event of an crash.The MVAA,2019 mandates a Motor Vehicle Accident Fund to be set up by the Central Government (Section 164B) for giving immediate relief to victims of road crashes under Section 164 A. The Central Government can also establish a Motor Accidents Mediation Authority (MAMA) in every district to provide fixed interim compensation as direct credit to Aadhaar linked bank accounts. MAMA can also take over pre-litigation procedures from MACT. The Union Govt must fix an amount that can be transferred immediately as interim compensation pending adjudication of the compensation claim. The recommended range of amount is INR 2-5 lakhs in case of death and INR 50,000 for injury.
23% of the victims/nominees had to attend court for claiming compensation. 13% of the respondents said they faced hurdles/difficulties in accessing the money. 25% of the respondents surveyed took more than 6 months to receive any financial help/relief. Additionally, the time taken for receiving compensation from motor vehicle, medical, and life insurance was higher for urban areas than for rural areas for both LIH & HIH.
24. INCREASING AWARENESS ABOUT MCTAP AND OTHER COMPENSATION SCHEMES
Information asymmetry and poor literacy levels often deter the poor from filing claims. Even if the claims are filed, the proportion of compensation received is not adequate and the delays in awarding compensation make the process unfavourable. Government schemes are also not well publicized among the poor and do not offer immediate relief after a road crash. This can be achieved through the Government mandating General Insurance Corporation (GIC) to set up a dedicated helpline num-ber for LIH. Other insurance companies can contribute to this and the number can be linked to the hospital database of LIH.
70% of respondents of LIH and 63% of HIH were not aware of compensation clauses and schemes in the event of a road crash.

Traffic Crash Injuries and Disabilities: The Burden on Indian Society
25. INSERTING TECHNOLOGY TO ENSURE INSURANCE COVERAGE:
Inserting technology to increase accessibility and affordability of insurance products to poor households should be incentivised. Government should encourage companies to create low-price, micro- insurance products with LIH in mind. For example, Medical insurance provides coverage only for hospitalization, pre-specified ailments and crashes, for a pre-specified amount while health insurance provides a comprehensive coverage against hospitalization expenses, pre-hospitalization and post-hospitalization expenses and ambulance charges. An insurance product designed to ensure pay-out on losing “one-month of work due to ill-health” would help create an interim-safety net for the entire household. Also IRDA should ensure that insurance agencies create mechanisms for simple claim settlement.
Overall, the insurance coverage of HIHs (in terms of the motor vehicle, medical, life insurance) was higher compared to LIHs at the time of the crash.
WAY FORWARD

120
26. BETTER GENDER DISAGGREGATED DATA
Gender responsive reporting and monitoring is essential to evaluate the impact of road crashes on women.46 WHO also recommends that “Gender differences in the social and economic consequences of temporary and/or permanent disability resulting from injury have to be taken into account when planning rehabilitation services” (WHO, 2002). To ensure rehabilitation services as well as adequate support to either women road crash victims or families which are left to deal with loss of male breadwinner, gender disaggregated data at state and district level would be imperative to create gender responsive post-road crash safety nets.
The risk of catastrophic expenditure is inversely proportional to increasing income per capita, i.e., it is significantly larger for those belonging to lower-income quartiles than for those belonging to the highest income quartile. Out of Pocket Expenses (OOPE) was the most significant direct cost borne by victim families among LIH. The overall OOPE was higher for LIH (62%) than HIH (59%). LIH spent a little more than half (52%) of all their income (Rs.78,824) as OOPE on the victim’s treatment (hospitalisation, medicines, care) compared to HIH that spent 30.5% of their household income, i.e., Rs.60,476 on the victim’s post-crash treatment and recovery. A mere 6.1% of the LIH in rural areas availed medical insurance compensation, whereas 26.3% of the HIH residing in rural areas availed medical insurance compensation.
27. EMERGENCY CASH TRANSFERS TO VULNERABLE FEMALE HEADED HOUSEHOLDS
As part of PM Garib Kalyan Yojana the Government has already implemented the “Unconditional Emergency Cash Transfer” (UECT) to women during the current COVID-19 crisis. (IWWAGE, 2020) The state governments can use a similar framework of UECT to give Aadhar linked DBT to recently turned FHHs. More vulnerable FHHs should be prioritised. The time frame of the emergency cash transfer should be standardised.
Across household categories, the proportion of male Chief Wage Earners (CWE) was higher than female CWE; the number being higher among LIH. 50% of the women from LIH and 55% from HIH were CWE of the household before the crash whereas 81% of the men from LIH and 74% men from HIH were CWE before the crash. 31% of the female members in LIH were severely affected by the decline in household income after the crash compared to 53.5% of the male members.
THEME FIVE: Address the disproportionate gender impact of RTIs through participative governance & special schemes for women
46. Findings from a 2011 Gallup Poll surveying 143 countries showed that there is a worldwide gap between the sense of safety felt by men and by women, and that this gap was more pronounced in high and middle-income countries where physical safety has increased with economic and social development. Similarly, a 2014 study in the United States found that many people changed their behaviour as a result of harassment: 47% of women and 32% of men started constantly assessing their surroundings, and 31% of women opted to go out in a group or with another person instead of alone.

Traffic Crash Injuries and Disabilities: The Burden on Indian Society
28. MONETARY SCHEMES FOR LOW INTEREST LOANS:
During the FGD, many participants suggested schemes for low interest or no interest loans to support regular household expenses. The women suggested that the low interest loan should be easily accessible without much paperwork.
29. SCHEMES TO INCENTIVIZE WORK FROM HOME SMALL BUSINESS. WOMEN WHO HAVE LOST THE BREADWINNER OF THEIR FAMILY IN A ROAD CRASH SHOULD BE ENROLLED INTO THE EMPLOYMENT DATABASE TO MAKE THEIR JOB SEARCH EASIER.
State Governments can float schemes to support these women in running small home businesses. Niti Aayog also recommended this strategy to mitigate the declining female labour force participation rates in India. It has proposed to increase women’s employment by encouraging entrepreneurship among women. (Niti Aayog, 2019). Women participants also reiterated this. They suggested simple business models like packaging, baking, pickle making as something that would help them monetarily without leaving the house. Women also preferred a model where they could earn daily or weekly income instead of monthly payments.
Besides caregiving, LIH respondents stated that in the absence of any steady primary source of income (especially in the case of death of a breadwinner), the women of the household often had to step up and take additional jobs to mitigate the financial burden. Across households, 40% of the women participants reported a change in their working patterns while around 11% said they took up extra work after the crash.
30. WOMEN’S PARTICIPATION IN LOCAL ROAD SAFETY GOVERNANCE FRAMEWORKS.
Women’s participation in planning and decision making at local road safety governance frameworks including State Road Safety Council and District Road Safety Committee should be ensured. Adequate female representation shall not only ensure Gender responsive monitoring, reporting and budgeting, but will also create opportunities for women to be trained for various roles including as paramedics, backend operators for electronic enforcement architecture and other systems which will be created to ensure road safety.
WAY FORWARD

122
31. STANDARDISATION OF COMPENSATION FOR NON-WORKING WOMEN
The MACT has often taken a very conservative view on compensation for “house-wives”. In Sher Singh vs. Raghubir Singh (2004), the Tribunal assessed the dependency of the family on the housewife at as low as Rs. 600 per month. The Tribunal concluded that the ‘services rendered by the deceased woman could be replaced by hiring a servant at the salary of Rs. 600/- per month.’ This logic is highly fallacious. The unpaid work done by women in households cannot be quantified by comparing it to the work done by a domestic help. This approach to compute the compensation by relying upon the minimum wages payable to a skilled worker has also been criticised by various members of Judiciary. In Arun Kumar Agarwal vs. National Insurance Company (2006), the Supreme Court also stated, “It is not possible to quantify any amount in lieu of the services rendered by the wife/mother to the family… the term `services’ is required to be given a broad meaning and must be construed by taking into account the loss of personal care and attention given by the deceased to her children as a mother and to her husband as a wife. The Bombay High Court in the case of Rambhau & Ors Vs The Oriental Insurance Co & Ors (2007), in its judgment dated 17th September 2020 directed Oriental Insurance to pay Rs. 8,22,000/- along with interest at the rate of 6% per annum as compensation for the woman’s death. The Court while computing the amount considered various factors such as loss of love and affection, funeral expenses, household work and other such factors. Therefore in light of the subjective interpretation, it is of utmost importance that the Central Government issues guidelines to set a definite criteria for determination of compensation payable to the dependents of a non-earning housewife/mother to remove subjectivities and ensure that family members or the disabled women (in case of serious injuries) receive appropriate compensation.

Traffic Crash Injuries and Disabilities: The Burden on Indian Society
32. ENACTMENT AND IMPLEMENTATION OF CHILD ROAD SAFETY PROVISIONS IN MVAA, 2019
MVAA, 2019 has provisions for mandating the use of Child Helmets, Child Restraints and also penalizes juvenile driving. These sections should be notified by the Central Government under the Central Motor Vehicle Rules and the State Governments should ensure that effective implementation. The Enforcement agencies should also ensure enforcement of child safety provisions.
33. EDUCATIONAL INSTITUTE BASED SUPPORT SYSTEM. CHILDREN AND ADOLESCENTS WHO ARE IMPACTED BY A ROAD CRASH DIRECTLY OR INDIRECTLY SHOULD BE PROVIDED SUPPORT FROM THE STATE.
Since the main institution of interaction for them are schools, the education department can ensure access to qualified child therapists. Since road crashes impact nutritional intake of household members, the State Government can also create a better mechanism to monitor their calorie intake and ensure they get adequate nutrition through the School Mid-Day Meal Scheme.
34. SUPPORT FOR PAYMENT OF SCHOOL FEES FOR CHILDREN FROM VULNERABLE FAMILIES.
In the IDIs, adolescents mentioned that financial constraints due to road crashes led to either late admission or dropping out of school completely to support their family financially. This was stressed more by male adolescent participants. The State Government should ensure this by enacting a moratorium on payment of school fees for at least 3 months so that the children from vulnerable families don’t have to leave school due to financial constraints. Since almost 80% of adolescents who die in road crashes are male, the Government should ensure that this policy is gender neutral.
THEME SIX: Strengthen post-crash support for children and young adults through state support
WAY FORWARD

124
35. ENSURING SAFE SCHOOL ZONES
Considering around 9% of all road crashes in India are reported near schools and colleges it’s im-perative to ensure that all road owning agencies ensure that children and adolescents are safe while commuting on roads. Urban Local Bodies (ULB) and Rural Local Bodies (RLB) in villages should cre-ate safe school zones by slowing down vehicles by design and improving infrastructure by providing walkable pavements, safe crossings etc. The Union Government should also prescribe standards for this under Section 198A of MVAA, 2019.
36. ENACTING RULES ON SAFE TRANSPORT TO SCHOOL
Governments should address safety issue faced by children while commuting to school by making rules regarding school buses, vans, auto rickshaws and other means of transport, for safe transportation of school children.
In 2018, over 4500 children died in road crash deaths in the 4 surveyed states out of which over half the deaths happened in UP. Rules around school transport should be formulated by State Governments to help safeguard children. Standardization of rules for all school transport including personally organized transport will ensure that children coming from poor families don’t have to be in overcrowded personally organized transport to cut costs. This is important since parents around 70% of parent respondents from Mumbai, Chennai and Lucknow admitted that their children travel in overcrowded personally organized vehicles. (SaveLIFE, 2019)
37. ISSUANCE OF CHILD ROAD SAFETY POLICY
State Governments as part of their State Road Safety Policy, Annual Action Plan and Road Safety Fund should prioritize road safety for children and adolescents. The State Government should stan-dardize rules for safety of children by issuing a child road safety policy. They should highlight informa-tion for parents and guardians in local languages. Concrete measures should be budgeted and made part of the State Road Safety Annual Action Plan..

Traffic Crash Injuries and Disabilities: The Burden on Indian Society
AN
NE
XU
RE
&
AP
PE
ND
IXANNEXURE & APPENDIX
ANNEXURE 3A

126
3A.1
: TAB
LE IN
DIC
ATIN
G A
SN
APSH
OT
OF
DES
CRIP
TIVE
STA
TIST
ICS
ABO
UT
THE
PART
ICIP
ANTS
.
Part
icul
ars
Biha
rM
ahar
asht
raTa
mil
Nad
uU
ttar P
rade
shTo
tal
Part
icip
ants
(#, %
) in
HIH
"115
, (26
.6)"
"113
, (26
.2)"
"103
, (23
.8)"
"101
, (23
.4)"
"432
, (10
0)"
Aver
age
mon
thly
hou
seho
ld in
com
e fo
r HIH
(IN
R)2,
99,1
302,
01,1
062,
04,6
122,
32,6
732,
35,4
17
Part
icip
ants
(#, %
) in
LIH
"412
, (25
.0)"
"415
, (2
5.2)
""4
07,
(24.
7)"
"413
, (25
.1)"
"164
7, (1
00)"
Aver
age
mon
thly
hou
seho
ld in
com
e fo
r LIH
(IN
R)15
,637
17,4
2232
,125
15,2
2420
,058
Part
icip
ants
(#, %
) as
truc
k dr
iver
s"1
01, (
24.0
)""1
13, (
26.9
)""1
00, (
23.8
)""1
06, (
25.2
)""4
20, (
100)
"
Aver
age
mon
thly
inco
me
from
driv
ing
prof
essi
on fo
r tr
uck
driv
ers
(INR)
20,7
4317
,013
27,8
5015
,991
20,2
32
% o
f fem
ale
vict
ims
13.9
16.5
22.7
8.4
15.3
% o
f vic
tims
belo
w 1
8 ye
ars
5.3
1.9
0.2
3.9
2.8
% o
f vic
tims
over
60
year
s4.
26.
42.
44.
34.
3
#, %
with
maj
or c
rash
inju
ry"(3
42),
64.9
""(3
92),
74.2
""(4
08),
80.0
""(2
88),
56.0
""(1
430)
, 68.
8"
#, %
cra
sh d
eath
s"(1
85),
35.1
""(1
36),
25.8
""(1
02),
20.0
""(2
26),
44.0
""(6
49),
31.2
"
#, %
fully
reco
vere
d af
ter i
njur
y"(2
18),
63.7
""(2
96),
75.5
""(3
11),
76.2
""(2
03),
70.5
""(1
028)
, 71.
9"
#, %
reco
vere
d w
ith s
ome
disa
bilit
y"(1
18),
34.5
""(9
4), 2
4.0"
"(51)
, 12.
5""(7
6), 2
6.4"
"(339
), 23
.7"
#, %
hav
e lo
ng te
rm m
obili
ty d
isab
ility
"(76)
, 64.
4""(5
6), 5
9.6"
"(39)
, 76.
5""(4
4), 5
7.9"
"(215
), 63
.4"
% o
f vic
tims
resi
ding
in u
rban
are
as39
.342
.440
.239
.340
.3
% o
f vic
tims
who
wer
e ch
ief w
age
earn
er"1
38, (
26.2
)""1
07, (
20.3
)""1
79, (
35.1
)""1
61, (
31.3
)""5
85, (
28.1
)"
% o
f vic
tims
as p
edes
tria
ns/c
yclis
ts22
.610
10.6
18.9
15.5
% o
f vic
tims
as ri
ding
a m
otor
cycl
e55
.281
.162
.461
.765
.1
% o
f vic
tims
in a
pas
seng
er c
ar9.
95.
724
.510
.712
.6
% o
f vic
tims
in o
ther
mod
es (a
utos
, bus
es, t
ruck
s)12
.33.
22.
58.
86.
7
% o
f vic
tims
whe
re c
rash
hap
pene
d on
(Exp
ress
way
&
NH
)21
.414
.512
.624
.917
.8
% o
f vic
tims
whe
re c
rash
hap
pene
d on
(S
H, C
ity/ d
istr
ict/
mun
icip
ality
road
s)66
.877
.185
.859
.673
.5
% o
f vic
tims
whe
re c
rash
hap
pene
d on
rura
l roa
ds
(Vill
age
road
s)11
.88.
41.
615
.68.
6
% o
f vic
tims
who
die
d at
sce
ne19
.516
.34.
321
.415
.4
% o
f vic
tims
whe
re c
rash
FIR
was
file
d40
41.3
60.6
45.1
46.7
% o
f vic
tims
who
rece
ived
med
ical
trea
tmen
t /
tran
sfer
red
to h
ospi
tal
83.5
93.8
96.9
89.5
90.9
Aver
age
estim
ated
med
ical
cos
t (IN
R)58
,023
1,01
,081
61,9
7678
,584
75,0
11
% o
f vic
tims
who
rece
ived
any
fina
ncia
l com
pens
atio
n/re
lief w
ithin
6 m
onth
s67
.483
.390
48.1
75.4

Traffic Crash Injuries and Disabilities: The Burden on Indian Society
3A.3: FIGURE INDICATING AN OVERVIEW OF THE RESEARCH METHODOLOGY
3A.2: TABLE INDICATING INCOME LEVELS FOR (LIH) AND (HIH) IN INDIA AND GLOBALLY
RESEARCH METHODOLOGY
Exploratory Research
Desk Research
Discussion WithWorld Bank
Piloting & Pre-Testing
[Test Sample]Bottom 40% Poor
Men & women groups
Adolescents
Truck Drivers
[Control Sample]Top 10% RichFinalization Of
Instruments
Quantitative Survey - Interviews Among Victims Or Victim’s
Family
Preparation Of Survey Instruments
Qualitative Survey - Fgds & Idis Among Victims Or Victim’s Family Member
Descriptive Research
ANNEXURE 3A
S.N. Country Pre-tax income of INR 13,500 per adult per month Pre-tax income of INR 50,000 per adult per month
1 India Bottom 40% Top 10%
2 World Bottom 19% Top 42%
[United Nations Sustainable Development Goals 10.1; World Inequality Database]

128
3A.4: TABLE INDICATING THE STATE- WISE LIST OF SAMPLE SIZE
3A.5: TABLE INDICATING THE SAMPLE SIZE FOR QUANTITATIVE SURVEY
S.N. States DistrictsNo. of road crashes in
India (2005-2018)Appropriate Sample
Size (Calculated)Achieved State-wise
Sample Size
1 Bihar Begusarai, Gaya, Muzaffarpur, Patna 1,24,176 383 527
2 Maharashtra"Mumbai,
Nagpur, Pune, Solapur"8,74,647 384 528
3 Tamil NaduChennai, Coimbatore, Madurai,
Tiruchirappalli8,90,640 384 516
4 Uttar Pradesh Agra, Lucknow, Meerut, Varanasi 4,11,791 384 514
Sample Size for Quantitative Survey
S.N. StateVictim/ Victim’s Family
members (LIH Test Sample)
Victim/ Victim’s Family members (HIH Control
Sample)Truck Drivers Grand Total
1 Bihar 412 115 101 628
2 Maharashtra 415 113 113 641
3 Tamil Nadu 407 103 100 610
4 Uttar Pradesh 413 101 106 620
Total 1647 432 420 2499

Traffic Crash Injuries and Disabilities: The Burden on Indian Society
ANNEXURE 4A
Change in LIH
victim’s income
Category (pre-crash, post crash, current)
NNot
earningUp to
Rs. 5,000
Rs. 5,001 to
Rs. 10,000
Rs. 10,001 to
Rs. 20,000
Rs 20,001 to
Rs.30,000
Rs. 30,001 to
Rs.50,000
More than Rs.50,000
Pre-crash 1052 18.20% 8.70% 24.20% 21.40% 8.30% 9.00% 10.20%
On resuming work after crash
1052 27.40% 8.90% 22.20% 17.30% 6.10% 8.20% 9.90%
Current (as on 31 Jan 2020)
1052 22.40% 7.70% 20.10% 22.40% 13.20% 10.00% 4.20%
Change in HIH
victim’s income
Category (pre-crash, post crash, current)
NNot
earningUp to
Rs.50,000Rs.50,000 to
Rs.1 Lakh
Rs.1 Lakh to Rs.2 Lakh
Rs.2 Lakh to Rs.4 Lakh
More than Rs. 4 Lakh
Pre-crash 378 14.00% 30.20% 37.30% 16.10% 1.90% 0.50%
On resuming work after crash
378 11.10% 36.80% 34.70% 14.60% 2.40% 0.60%
Current (as on 31 Jan 2020)
378 9.00% 24.90% 41.80% 20.60% 3.20% 0.60%
4A.1: TABLE INDICATING THE CHANGE IN THE MONTHLY INCOME OF VICTIMS ON RESUMING WORK AFTER THE CRASH
4A.2: TABLE INDICATING HABITATION- WISE, AND GENDER-WISE DETAILS ON THE DECLINE IN THE VICTIM’S HOUSEHOLD INCOME
Category (Habitation, gender)
LIH HIH
N Severe Moderate None N Severe Moderate None
Habitation Type 1647 50.40% 25.40% 24.20% 432 24.80% 34.30% 41.00%
Urban 482 37.10% 29.50% x33.40% x 21.60% 35.40% 43.00%
Rural 1165 55.90% 23.70% 20.40% 76 39.50% 28.90% 31.60%
Victim Gender 1647 50.40% 25.40% 24.20% 432 24.80% 34.30% 41.00%
Male 1420 53.50% 24.90% 21.60% 340 26.50% 35.90% 37.60%
Female 227 31.30% 28.20% 40.50% 92 18.50% 28.30% 53.30%

130
4A.3: TABLE INDICATING THE STATE- WISE, HABITATION- WISE AND GENDER- WISE SPLIT OF EARNING STATUS OF VICTIMS (BEFORE CRASH)
4A.4: TABLE INDICATING THE IMPACT OF THE VICTIM’S DISABILITY ON SALARY / WAGE
Category (State, habitation, gender)
LIH HIH
N Yes No N Yes No
Overall 1647 82.10% 17.90% 432 85.90% 14.10%
Bihar 412 76.70% 23.30% 115 87.80% 12.20%
Maharashtra 415 81.70% 18.30% 113 75.20% 24.80%
Tamil Nadu 407 91.90% 8.10% 103 96.10% 3.90%
Uttar Pradesh 413 78.50% 21.50% 101 85.10% 14.90%
Habitation Type 1647 82.10% 17.90% 432 85.90% 14.10%
Urban 482 78.60% 21.40% 356 85.10% 14.90%
Rural 1165 83.60% 16.40% 76 89.50% 10.50%
Victim Gender 1647 82.10% 17.90% 432 85.90% 14.10%
Male 1420 85.60% 14.40% 340 90.30% 9.70%
Female 227 60.80% 39.20% 92 69.60% 30.40%
Disability
LIH HIH
NYes, almost
the sameNo, lower
than previousNA N
Yes, almost the same
No, lower than previous
NA
Overall 1052 51.90% 31.90% 16.20% 378 73.00% 22.00% 5.00%
Underwent disability 310 27.10% 40.30% 32.60% 29 48.30% 44.80% 6.90%
No disability 692 61.60% 28.80% 9.70% 336 75.00% 19.90% 5.10%
DK/CS 50 72.00% 24.00% 4.00% 13 76.90% 23.10% 0.00%

Traffic Crash Injuries and Disabilities: The Burden on Indian Society
4A.5: TABLE INDICATING THE AVERAGE LOSSES DUE TO ROAD CRASH AS WELL AS THE PROPORTION RECOVERED THROUGH INSURANCE
Losses incurred due to road crash
LIH [N=1647] HIH [N=432]
Avg. loss of income/ expenditure
% recovered/ to be recovered from
insurances
Avg. loss of income/ expenditure
% recovered/ to be recovered from insurances
Total expenditure Rs.1,52,339 12.60% Rs.1,98,037 23.70%
Loss of income (victim & family members) during
period of treatment
Rs. 37,57219.70%
Rs.75,39128.40%
24.70% 38.10%
Loss of property/ vehicle etc. due to road crash
Rs. 12,7529.90%
Rs.28,84525.20%
8.40% 14.60%
Out of pocket expenses on treatment of victim
Rs. 78,82415.50%
Rs.60,47630.60%
51.70% 30.50%
Legal/ administrative/ compensation expenses
including police, lawyer, etc.
Rs. 6,6275.30%
Rs.5,6296.60%
4.30% 2.80%
Compensation cost to other vehicle/ person involved
in crash
Rs. 2,5092.40%
Rs.6,321)6.00%
1.60% 3.20%
OthersRs. 14,054
22.80%Rs.21,375
45.50%9.20% 10.80%
ANNEXURE 4A

132
4A.6: TABLE INDICATING THE STATE- WISE DETAILS THE PROPORTION OF LOSSES THAT HAVE BEEN RECOVERED/ARE DUE TO BE RECOVERED FROM INSURANCE
Type of losses incurred due to road crash
Proportion Recovered
LIH HIH
Bihar Maharashtra Tamil NaduUttar
PradeshBihar Maharashtra Tamil Nadu
Uttar Pradesh
N 412 415 407 413 115 113 103 101
Overall recovery 11.00% 8.00% 22.30% 8.10% 25.40% 15.30% 27.90% 14.80%
Loss of income (victim & family members) during
period of treatment13.10% 10.40% 47.20% 8.40% 29.40% 18.50% 52.00% 14.10%
Loss of property/ vehicle etc. due to road crash
7.80% 4.90% 20.20% 6.80% 20.40% 22.80% 30.20% 28.30%
Out of pocket expenses on treatment of victim
10.70% 8.80% 34.90% 8.00% 21.80% 32.40% 45.70% 23.30%
Legal/ administrative/ compensation expenses
including police, lawyer, etc.5.60% 2.60% 6.10% 6.90% 10.20% 1.10% 7.10% 8.10%
Compensation cost to other vehicle/ person
involved in crash4.10% 0.90% 3.10% 1.50% 14.20% 2.10% 4.30% 2.50%
Others 24.90% 20.70% -- 16.70% 56.50% -- -- 12.50%

Traffic Crash Injuries and Disabilities: The Burden on Indian Society
4A.8: TABLE INDICATING THE CORRELATION BETWEEN THE EARNING STATUS OF THE VICTIM AND THE DECLINE IN STANDARD OF LIVING OF THE HOUSEHOLD
4A.9: TABLE INDICATING STATE- WISE RESPONSES ON WHETHER THE LIVING STANDARD OF THE HOUSEHOLD DETERIORATED AFTER THE CRASH
Living standardhas decreased
LIH HIH
N Yes No DK/CS N Yes No DK/CS
Impact of crash 1647 63.50% 35.20% 1.30% 432 29.40% 68.50% 2.10%
Survived 1052 58.60% 40.30% 1.10% 378 28.60% 69.00% 2.40%
Died 595 72.30% 26.20% 1.50% 54 35.20% 64.80% 0.00%
Earning status of Victim
1647 63.50% 35.20% 1.30% 432 29.40% 68.50% 2.10%
Earning member 1353 66.90% 32.00% 1.10% 371 32.90% 65.20% 1.90%
Non-earning member 294 48.00% 50.00% 2.00% 61 8.20% 88.50% 3.30%
StateLIH HIH
Total Yes No DK/CS Total Yes No DK/CS
Overall 1647 63.50% 35.20% 1.30% 432 29.40% 68.50% 2.10%
Bihar 412 73.30% 25.70% 1.00% 115 40.00% 53.00% 7.00%
Maharashtra 415 49.40% 50.60% -- 113 24.80% 75.20% --
Tamil Nadu 407 59.00% 39.60% 1.50% 103 35.00% 65.00% --
Uttar Pradesh 413 72.40% 24.90% 2.70% 101 16.80% 82.20% 1.00%
ANNEXURE 4A
4A.7: TABLE INDICATING THE STATE- WISE DETAILS ON THE AVERAGE EXPENSES INCURRED ON THE FUNERAL OF THE CRASH VICTIM
StateLIH HIH
N Avg. N Avg.
Overall 595 Rs.22,242 54 Rs.51,498
Bihar 178 Rs.28,490 7 Rs.89,071
Maharashtra 125 Rs.16,244 11 Rs.71,182
Tamil Nadu 84 Rs.42,010 18 Rs.61,722
Uttar Pradesh 208 Rs.12,517 18 Rs.14,633

134
4A.10: TABLE INDICATING THE HABITATION, GENDER, AND STATE PROFILE OF VICTIMS WHO WERE CHIEF WAGE EARNERS
4A.11: TABLE INDICATING THE HABITATION- WISE AND GENDER- WISE SPLIT FOR AVERAGE MONTHLY CONTRIBUTION OF THE DECEASED VICTIMS TO THE TOTAL HOUSEHOLD INCOME
Category (Habitation, gender)
LIH HIH
N Yes No N Yes No
Habitation Type 1353 77.80% 22.20% 371 70.60% 29.40%
Urban 379 75.20% 24.80% 303 70.60% 29.40%
Rural 974 78.90% 21.10% 68 70.60% 29.40%
Victim Gender 1353 77.80% 22.20% 371 70.60% 29.40%
Male 1215 81.00% 19.00% 307 73.90% 26.10%
Female 138 50.00% 50.00% 64 54.70% 45.30%
Overall 1353 77.80% 22.20% 371 70.60% 29.40%
Bihar 316 74.10% 25.90% 101 66.30% 33.70%
Maharashtra 339 79.40% 20.60% 85 77.60% 22.40%
Tamil Nadu 374 77.50% 22.50% 99 71.70% 28.30%
Uttar Pradesh 324 80.20% 19.80% 86 67.40% 32.60%
LIH
Category (habitation, gender)
N Not earningUp to
Rs. 5,000Rs. 5,001 to Rs. 10,000
Rs. 10,001 to Rs. 20,000
Rs. 20,001 to Rs. 30,000
More than Rs.30,000
Habitation Type 595 17.30% 22.70% 27.70% 20.80% 5.70% 5.70%
Urban 64 28.10% 10.90% 17.20% 20.30% 15.60% 7.80%
Rural 531 16.00% 24.10% 29.00% 20.90% 4.50% 5.50%
Victim Gender 595 17.30% 22.70% 27.70% 20.80% 5.70% 5.70%
Male 536 13.60% 22.80% 29.90% 21.80% 6.20% 5.80%
Female 59 50.80% 22.00% 8.50% 11.90% 1.70% 5.10%
HIH
Category (habitation, gender)
N Not earningUp to
Rs.50,000Rs.50,000 to
Rs.1 LakhMore than Rs.1 Lakh
Habitation Type 54 14.80% 59.30% 16.70% 9.30%
Urban 33 21.20% 51.50% 15.20% 12.20%
Rural 21 4.80% 71.40% 19.00% 4.80%
Victim Gender 54 14.80% 59.30% 16.70% 9.30%
Male 47 6.40% 63.80% 19.10% 10.70%
Female 7 71.40% 28.60% -- --

Traffic Crash Injuries and Disabilities: The Burden on Indian Society
4A.12: TABLE INDICATING THE GENDER- WISE DETAILS ON THE CHANGE IN MONTHLY CONTRIBUTION TO HOUSEHOLD INCOME POST CRASH
LIH
Category (pre- crash,
post-crash, current)N
Not earning
Up to Rs. 5,000
Rs. 5,001 to
Rs. 10,000
Rs. 10,001 to
Rs. 20,000
Rs. 20,001 to
Rs. 30,000
Rs. 30,001 to
Rs. 50,000
More than Rs.50,000
Pre-crash_Victim Gender
1052 18.20% 8.70% 24.20% 21.40% 8.30% 9.00% 10.20%
Male 884 14.90% 8.40% 26.70% 23.90% 8.80% 8.00% 9.30%
Female 168 35.10% 10.70% 11.30% 8.30% 5.40% 14.30% 14.90%
On resuming work after crash_Victim Gender
1052 27.40% 8.90% 22.20% 17.30% 6.10% 8.20% 9.90%
Male 884 24.30% 9.40% 24.50% 19.20% 6.30% 7.40% 8.80%
Female 168 43.50% 6.50% 10.10% 7.10% 4.80% 12.50% 15.50%
Current (as on 31 Jan 2020)_Victim Gender
1052 22.40% 7.70% 20.10% 22.40% 13.20% 10.00% 4.20%
Male 884 19.30% 8.00% 22.10% 24.50% 12.30% 9.30% 4.40%
Female 168 38.70% 6.00% 9.50% 11.30% 17.90% 13.70% 3.00%
HIH
Category (pre- crash, post- crash,
current)N
Not earning
Up to Rs.50,000
Rs.50,000 to
Rs.1 Lakh
Rs.1 Lakh to
Rs.2 Lakh
Rs.2 Lakh to
Rs.4 Lakh
More than Rs. 4 Lakh
Pre-crash 378 14.00% 30.20% 37.30% 16.10% 1.90% 0.50%
Male 293 10.20% 30.70% 39.90% 16.00% 2.40% 0.70%
Female 85 27.10% 28.20% 28.20% 16.50% 0.00% 0.00%
On resuming work after crash
378 11.10% 36.80% 34.70% 14.60% 2.40% 0.60%
Male 293 6.10% 38.20% 37.50% 14.30% 3.10% 0.60%
Female 85 28.20% 31.80% 24.70% 15.30% 0.00% 0.00%
Current (as on 31 Jan 2020) 378 9.00% 24.90% 41.80% 20.60% 3.20% 0.60%
Male 293 4.40% 24.90% 44.00% 21.80% 4.10% 0.60%
Female 85 24.70% 24.70% 34.10% 16.50% 0.00% 0.00%
ANNEXURE 4A

136
4A.13: TABLE INDICATING STATE-WISE RESPONSES ON THE MAJOR INVESTMENT ON VICTIMS THAT COULD NOT BE RECOVERED DUE TO THE ROAD CRASH
StateLIH HIH
N Yes Avg. Investment N Yes Avg. Investment
Overall 1647 5.90% Rs.43,036 432 6.70% Rs.80,172
Bihar 412 10.00% Rs.32,488 115 10.40% Rs.27,083
Maharashtra 415 3.90% Rs.52,156 113 1.80% Rs.1,55,000
Tamil Nadu 407 3.70% Rs.37,800 103 3.90% Rs.2,58,750
Uttar Pradesh 413 6.10% Rs.57,640 101 10.90% Rs.59,545
4A.14: TABLE INDICATING A SUMMARY OF DEMOGRAPHIC AND POVERTY PROFILE OF STATES
High Capacity States Low Capacity States
Particular Maharashtra Tamil Nadu Bihar Uttar Pradesh
Population - 2011
Total population (in crore) 11.2 7.2 10.4 20
Urban share 45% 48% 11% 22%
Share of adults ( age 15+) 75% 76% 63% 63%
Education – 2011
Literacy rate 83% 80% 64% 70%
Poverty and inequality – 2012
Poor (in crores) 2 0.9 3.6 6
Poverty rate (BPL)
All 17% 12% 34% 29%
Rural 24% 16% 34% 30%
Urban 9% 7% 31% 26%
Income and growth – 2018
Net State Domestic Product at Current Prices (in INR crore) 21,39,378 13,15,577 4,45,942 12,24,672
Per Capita Net State Domestic Product at Current Prices (in INR)
1,76,102 1,71,583 38,631 55,456
(Mean = 1,73,842) (Mean = 47,043)
Jobs - 2012
Labour force participation rate 58% 60% 45% 53%
Workers by wage-type
Self-employed 47% 32% 53% 64%
Salaried 27% 26% 6% 11%
Casual wage 27% 43% 42% 25%
Health workforce - 2012
Qualified health workers per 10,000 population 16.8 12.5 1.5 7.8
[Source: Census of India, World Bank and WHO]

Traffic Crash Injuries and Disabilities: The Burden on Indian Society
6A.1: TABLE INDICATING WHETHER THE VICTIM/ HOUSEHOLD MEMBERS SUFFERED FROM DEPRESSION DUE TO THE ROAD CRASH
6A.2: TABLE INDICATING THE SEVERITY OF DEPRESSION BETWEEN LIH AND HIH
Category (Habitation, gender, state, crash outcome on victim, earning status of victim)
LIH HIH
N Yes No DK/CS N Yes No DK/CS
Habitation Type 681 48.50% 48.80% 2.80% 305 26.20% 72.50% 1.30%
Urban 394 40.10% 57.60% 2.30% 274 23.70% 74.80% 1.50%
Rural 287 59.90% 36.60% 3.50% 31 48.40% 51.60% 0.00%
Victim Gender 681 48.50% 48.80% 2.80% 305 26.20% 72.50% 1.30%
Male 573 51.10% 45.90% 3.00% 244 27.50% 71.30% 1.20%
Female 108 34.30% 63.90% 1.90% 61 21.30% 77.00% 1.60%
Overall 681 48.50% 48.80% 2.80% 305 26.20% 72.50% 1.30%
Bihar 146 52.70% 45.20% 2.10% 83 33.70% 61.40% 4.80%
Maharashtra 127 40.20% 59.10% 0.80% 87 3.40% 96.60% --
Tamil Nadu 245 40.80% 58.40% 0.80% 73 50.70% 49.30% --
Uttar Pradesh 163 62.60% 29.40% 8.00% 62 19.40% 80.60% --
Overall 681 48.50% 48.80% 2.80% 305 26.20% 72.50% 1.30%
Survived 569 43.20% 53.60% 3.20% 269 23.00% 75.50% 1.50%
Died 112 75.00% 24.10% 0.90% 36 50.00% 50.00% 0.00%
Overall 681 48.50% 48.80% 2.80% 305 26.20% 72.50% 1.30%
Earning member 551 50.30% 46.80% 2.90% 263 30.00% 68.80% 1.10%
Non-earning member 130 40.80% 56.90% 2.30% 42 2.40% 95.20% 2.40%
Outcome of crash on victim
LIH HIH
N Yes No DK/CS N Yes No DK/CS
Overall 681 48.50% 48.80% 2.80% 305 26.20% 72.50% 1.30%
Survived 569 43.20% 53.60% 3.20% 269 23.00% 75.50% 1.50%
Died 112 75.00% 24.10% 0.90% 36 50.00% 50.00% 0.00%
ANNEXURE 6A

138
6A.3: TABLE INDICATING HABITATION- WISE, GENDER- WISE AND STATE- WISE DATA ON WHETHER THE VICTIM/ HOUSEHOLD MEMBER WITH MENTAL AILMENT REQUIRED FORMAL MEDICAL CONSULTATION
6A.4: TABLE INDICATING THE STATE- WISE, HABITATION- WISE AND GENDER- WISE RESPONSES ON WHETHER THERE IS A CHANGE IN THE SLEEPING PATTERN OF HOUSEHOLD MEMBERS
Category (Habitation gender, state)
LIH HIH
N Yes No DK/CS N Yes No DK/CS
Habitation Type 256 70.70% 27.30% 2.00% 65 78.50% 21.50% --
Urban 129 68.20% 28.70% 3.10% 53 73.60% 26.40% --
Rural 127 73.20% 26.00% 0.80% 12 100.00% -- --
Victim Gender 256 70.70% 27.30% 2.00% 65 78.50% 21.50% --
Male 222 72.50% 26.10% 1.40% 52 82.70% 17.30% --
Female 34 58.80% 35.30% 5.90% 13 61.50% 38.50% --
Overall 256 70.70% 27.30% 2.00% 65 78.50% 21.50% --
Bihar 54 64.80% 33.30% 1.90% 14 42.90% 57.10% --
Maharashtra 28 85.70% 10.70% 3.60% 21 100.00% -- --
Tamil Nadu 84 70.20% 28.60% 1.20% 26 76.90% 23.10% --
Uttar Pradesh 90 70.00% 27.80% 2.20% 4 100.00% -- --
Category (State, habitation, gender)
LIH HIH
NYes,
difficulty in sleeping
Sometimes, difficulty in
sleeping
No, sleep well
NYes,
difficulty in sleeping
Sometimes, difficulty in
sleeping
No, sleep well
Overall 681 34.50% 38.30% 27.20% 305 16.70% 43.90% 39.30%
Bihar 146 30.10% 43.20% 26.70% 83 18.10% 66.30% 15.70%
Maharashtra 127 24.40% 36.20% 39.40% 87 6.90% 44.80% 48.30%
Tamil Nadu 245 32.70% 42.40% 24.90% 73 38.40% 35.60% 26.00%
Uttar Pradesh 163 49.10% 29.40% 21.50% 62 3.20% 22.60% 74.20%
Habitation Type 681 34.50% 38.30% 27.20% 305 16.70% 43.90% 39.30%
Urban 394 35.50% 32.50% 32.00% 274 15.70% 43.80% 40.50%
Rural 287 33.10% 46.30% 20.60% 31 25.80% 45.20% 29.00%
Victim Gender 681 34.50% 38.30% 27.20% 305 16.70% 43.90% 39.30%
Male 573 35.60% 37.70% 26.70% 244 16.40% 44.70% 38.90%
Female 108 28.70% 41.70% 29.60% 61 18.00% 41.00% 41.00%

Traffic Crash Injuries and Disabilities: The Burden on Indian Society
6A.5: TABLE INDICATING THE RESPONSES ON WHETHER THE LIVING STANDARD OF HOUSEHOLD DECREASED DUE TO THE CRASH
Category (crash impact on victim, earning status of victim,
state, habitation, gender)
LIH HIH
N Yes No DK/CS N Yes No DK/CS
Impact of crash 1647 63.50% 35.20% 1.30% 432 29.40% 68.50% 2.10%
Survived 1052 58.60% 40.30% 1.10% 378 28.60% 69.00% 2.40%
Died 595 72.30% 26.20% 1.50% 54 35.20% 64.80% 0.00%
Earning status of Victim 1647 63.50% 35.20% 1.30% 432 29.40% 68.50% 2.10%
Earning member 1353 66.90% 32.00% 1.10% 371 32.90% 65.20% 1.90%
Non-earning member 294 48.00% 50.00% 2.00% 61 8.20% 88.50% 3.30%
Overall 1647 63.50% 35.20% 1.30% 432 29.40% 68.50% 2.10%
Bihar 412 73.30% 25.70% 1.00% 115 40.00% 53.00% 7.00%
Maharashtra 415 49.40% 50.60% -- 113 24.80% 75.20% --
Tamil Nadu 407 59.00% 39.60% 1.50% 103 35.00% 65.00% --
Uttar Pradesh 413 72.40% 24.90% 2.70% 101 16.80% 82.20% 1.00%
Habitation Type 1647 63.50% 35.20% 1.30% 432 29.40% 68.50% 2.10%
Urban 482 50.40% 46.90% 2.70% 356 28.70% 69.10% 2.20%
Rural 1165 68.90% 30.40% 0.70% 76 32.90% 65.80% 1.30%
Victim Gender 1647 63.50% 35.20% 1.30% 432 29.40% 68.50% 2.10%
Male 1420 64.60% 34.00% 1.30% 340 31.20% 66.50% 2.40%
Female 227 56.40% 42.70% 0.90% 92 22.80% 76.10% 1.10%
ANNEXURE 6A

140
6A.7: TABLE INDICATING THE HABITATION- WISE, GENDER- WISE, AND STATE- WISE RESPONSES ON THE TYPE OF PERMANENT DISABILITY
Category (Habitation, gender,
state)
LIH HIH
NPara/
QuadriplegiaAcquired
Brain InjuryAmputation
of a limbSevere burns
Other NAcquired
Brain InjuryAmputation
of a limb
Habitation Type 121 8.30% 22.30% 65.30% 2.50% 1.70% 6 50.00% 50.00%
Urban 21 14.30% 28.60% 47.60% 9.50% 0.00% 5 60.00% 40.00%
Rural 100 7.00% 21.00% 69.00% 1.00% 2.00% 1 0.00% 100.00%
Victim Gender 121 8.30% 22.30% 65.30% 2.50% 1.70% 6 50.00% 50.00%
Male 113 8.00% 21.20% 66.40% 2.70% 1.80% 5 60.00% 40.00%
Female 8 12.50% 37.50% 50.00% 0.00% 0.00% 1 0.00% 100.00%
Overall 121 8.30% 22.30% 65.30% 2.50% 1.70% 6 50.00% 50.00%
Bihar 45 8.90% 11.10% 71.10% 6.70% 2.20% 4 25.00% 75.00%
Maharashtra 37 5.40% 21.60% 73.00% -- -- 2 100.00% --
Tamil Nadu 14 21.40% 57.10% 21.40% -- -- -- -- --
Uttar Pradesh 25 4.00% 24.00% 68.00% -- 4.00% -- -- --
6A.6: TABLE INDICATING THE HABITATION- WISE, GENDER- WISE, AND STATE- WISE RESPONSES ON WHETHER VICTIMS REQUIRED MOBILITY ASSISTANCE
Victims required mobility assistanceLIH HIH
N Yes N Yes
Habitation Type 310 63.50% 29 62.10%
Urban 62 82.30% 20 55.00%
Rural 248 58.90% 9 77.80%
Victim Gender 310 63.50% 29 62.10%
Male 280 63.90% 25 68.00%
Female 30 60.00% 4 25.00%
Overall 310 63.50% 29 62.10%
Bihar 99 62.60% 19 73.70%
Maharashtra 88 61.40% 6 33.30%
Tamil Nadu 47 78.70% 4 50.00%
Uttar Pradesh 76 57.90% -- --

Traffic Crash Injuries and Disabilities: The Burden on Indian Society
6A.8: TABLE INDICATING HABITATION- WISE, GENDER- WISE, AND STATE- WISE RESPONSES ON WHETHER THE VICTIM RETURNED TO PREVIOUS OCCUPATION/SCHOOL AFTER THE CRASH
Category (Habitation, gender, state)
LIH HIH
N Yes No N Yes No
Habitation Type 1052 75.70% 24.30% 378 91.50% 8.50%
Urban 418 84.90% 15.10% 323 91.30% 8.70%
Rural 634 69.60% 30.40% 55 92.70% 7.30%
Victim Gender 1052 75.70% 24.30% 378 91.50% 8.50%
Male 884 76.50% 23.50% 293 93.20% 6.80%
Female 168 71.40% 28.60% 85 85.90% 14.10%
Overall 1052 75.70% 24.30% 378 91.50% 8.50%
Bihar 234 67.10% 32.90% 108 89.80% 10.20%
Maharashtra 290 66.90% 33.10% 102 85.30% 14.70%
Tamil Nadu 323 92.00% 8.00% 85 97.60% 2.40%
Uttar Pradesh 205 72.20% 27.80% 83 95.20% 4.80%
ANNEXURE 6A

142
6A.9: TABLE INDICATING STATE- WISE, HABITATION- WISE, AND GENDER- WISE RESPONSES ON AVERAGE NUMBER OF DAYS THAT THE VICTIM TOOK TO RETURN TO PREVIOUS OCCUPATION/SCHOOL
Category (State, habitation, gender)
LIH HIH
N Avg. days N Avg. days
Overall 796 92 346 43
Bihar 157 134 97 46
Maharashtra 194 122 87 45
Tamil Nadu 297 33 83 25
Uttar Pradesh 148 129 79 56
Habitation Type 796 92 346 43
Urban 355 58 295 43
Rural 441 121 51 45
Victim Gender 796 92 346 43
Male 676 101 273 45
Female 120 45 73 36

Traffic Crash Injuries and Disabilities: The Burden on Indian Society
6A.10: TABLE INDICATING HABITATION- WISE, GENDER- WISE, AND STATE- WISE RESPONSES ON AVERAGE NUMBER OF DAYS THAT THE VICTIM TOOK TO FIND A NEW JOB FROM THE DAY OF CRASH
Category (Habitation, gender, state)
LIH HIH
N Avg. days N Avg. days
Habitation Type 91 107 13 65
Urban 36 63 11 69
Rural 55 135 2 43
Victim Gender 91 107 13 65
Male 75 119 10 79
Female 16 47 3 18
Overall 91 107 13 65
Bihar 28 40 4 29
Maharashtra 20 189 8 84
Tamil Nadu 21 120 1 60
Uttar Pradesh 22 105 -- --
ANNEXURE 6A

144
6A.11: TABLE INDICATING STATE- WISE, HABITATION- WISE, AND GENDER- WISE RESPONSES ON THE SEVERITY OF DISABILITY
Category (State, habitation, gender)
LIH HIH
NSerious
disabilityPartial
disabilityTemporary disability
NSerious
disabilityPartial
disabilityTemporary disability
Overall 310 39.00% 39.70% 21.30% 29 20.70% 58.60% 20.70%
Bihar 99 45.50% 29.30% 25.30% 19 21.10% 63.20% 15.80%
Maharashtra 88 42.00% 55.70% 2.30% 6 33.30% 50.00% 16.70%
Tamil Nadu 47 29.80% 19.10% 51.10% 4 -- 50.00% 50.00%
Uttar Pradesh 76 32.90% 47.40% 19.70% -- -- -- --
Habitation Type 310 39.00% 39.70% 21.30% 29 20.70% 58.60% 20.70%
Urban 62 33.90% 43.50% 22.60% 20 25.00% 60.00% 15.00%
Rural 248 40.30% 38.70% 21.00% 9 11.10% 55.60% 33.30%
Victim Gender 310 39.00% 39.70% 21.30% 29 20.70% 58.60% 20.70%
Male 280 40.40% 38.60% 21.10% 25 20.00% 64.00% 16.00%
Female 30 26.70% 50.00% 23.30% 4 25.00% 25.00% 50.00%

Traffic Crash Injuries and Disabilities: The Burden on Indian Society
Chan
ge in
the
occu
patio
n of
vic
tim (L
IH)
NU
nem
ploy
edH
ouse
wife
Agric
ultu
re
Labo
rer/
Far
mer
Labo
rer/
ski
lled
wor
ker/
un
skill
ed w
orke
r
Petty
trad
er/
shop
ow
ner
Busi
ness
men
/ se
lf-em
ploy
ed
Sala
ried
empl
oyee
(P
vt/ G
ovt)
Stud
ent
Retir
ed
Pre
cras
h- H
abita
tion
split
1052
6.70
%3.
60%
11.5
0%20
.40%
9.10
%7.
30%
33.5
0%7.
30%
0.60
%
Urb
an41
88.
40%
4.30
%1.
90%
17.0
0%10
.30%
10.3
0%39
.50%
7.70
%0.
70%
Rura
l63
45.
50%
3.20
%17
.80%
22.7
0%8.
40%
5.40
%29
.50%
7.10
%0.
50%
Pre
cras
h- V
ictim
Gen
der
1052
6.70
%3.
60%
11.5
0%20
.40%
9.10
%7.
30%
33.5
0%7.
30%
0.60
%
Mal
e88
47.
00%
0.00
%12
.50%
21.8
0%9.
80%
7.70
%33
.60%
7.20
%0.
50%
Fem
ale
168
4.80
%22
.60%
6.60
%13
.70%
5.40
%5.
40%
32.7
0%7.
70%
1.20
%
On
resu
min
g w
ork
afte
r cr
ash
1052
17.8
0%3.
70%
10.3
0%17
.40%
8.70
%8.
20%
28.3
0%5.
10%
0.70
%
Urb
an41
811
.70%
4.30
%1.
40%
17.4
0%10
.50%
11.5
0%35
.90%
6.20
%1.
00%
Rura
l63
421
.80%
3.30
%16
.10%
17.3
0%7.
40%
6.00
%23
.30%
4.40
%0.
50%
On
resu
min
g w
ork
afte
r cr
ash-
Vict
im G
ende
r10
5217
.80%
3.70
%10
.30%
17.4
0%8.
70%
8.20
%28
.30%
5.10
%0.
70%
Mal
e88
418
.80%
0.00
%11
.20%
18.8
0%9.
20%
8.30
%28
.50%
4.80
%0.
60%
Fem
ale
168
12.5
0%23
.20%
5.40
%9.
50%
6.00
%7.
70%
27.4
0%7.
10%
1.20
%
Curr
ent (
as o
n 31
Jan
20
20)-
Hab
itatio
n10
5214
.40%
3.50
%11
.30%
16.6
0%9.
10%
7.90
%33
.00%
3.40
%0.
80%
Urb
an41
88.
10%
3.80
%1.
90%
16.8
0%9.
80%
11.0
0%43
.50%
3.80
%1.
20%
Rura
l63
418
.50%
3.30
%17
.50%
16.6
0%8.
70%
5.80
%26
.00%
3.20
%0.
50%
Curr
ent (
as o
n 31
Jan
20
20)-
Vic
tim G
ende
r10
5214
.40%
3.50
%11
.30%
16.6
0%9.
10%
7.90
%33
.00%
3.40
%0.
80%
Mal
e88
414
.90%
0.00
%12
.40%
17.9
0%9.
70%
8.10
%33
.00%
3.20
%0.
70%
Fem
ale
168
11.3
0%22
.00%
5.40
%10
.10%
6.00
%6.
50%
32.7
0%4.
80%
1.20
%
6A.1
2: T
ABLE
IND
ICAT
ING
TH
E CH
ANG
E IN
TH
E O
CCU
PATI
ON
OF
VICT
IMS
FO
R LI
H
ANNEXURE 6A

146
Chan
ge in
occ
upat
ion
of v
ictim
(Pre
cra
sh)
NU
nem
ploy
edH
ouse
wife
Farm
erBu
sine
ssm
en /
self-
empl
oyed
Sala
ried
empl
oyee
(P
vt/ G
ovt)
Stud
ent
Oth
ers
Pre
cras
h-H
abita
tion
378
4.20
%2.
90%
1.30
%42
.30%
41.5
0%6.
60%
1.10
%
Urb
an32
34.
60%
2.50
%1.
20%
44.3
0%39
.60%
6.80
%0.
90%
Rura
l55
1.80
%5.
50%
1.80
%30
.90%
52.7
0%5.
50%
1.80
%
Pre
cras
h-Vi
ctim
Gen
der
378
4.20
%2.
90%
1.30
%42
.30%
41.5
0%6.
60%
1.10
%
Mal
e29
34.
10%
0.00
%1.
70%
48.1
0%39
.20%
5.80
%1.
00%
Fem
ale
854.
70%
12.9
0%0.
00%
22.4
0%49
.40%
9.40
%1.
20%
On
resu
min
g w
ork
afte
r cra
sh-
Hab
itatio
n37
83.
40%
3.20
%1.
10%
45.0
0%42
.10%
4.00
%1.
40%
Urb
an32
32.
80%
2.80
%1.
20%
47.1
0%41
.20%
4.00
%0.
90%
Rura
l55
7.30
%5.
50%
0.00
%32
.70%
47.3
0%3.
60%
3.60
%
On
resu
min
g w
ork
afte
r cra
sh-
Vict
im G
ende
r37
83.
40%
3.20
%1.
10%
45.0
0%42
.10%
4.00
%1.
40%
Mal
e29
33.
40%
0.00
%1.
40%
51.5
0%40
.30%
2.40
%1.
00%
Fem
ale
853.
50%
14.1
0%0.
00%
22.4
0%48
.20%
9.40
%2.
40%
Curr
ent (
as o
n 31
Jan
202
0)-
Hab
itatio
n37
82.
60%
2.90
%1.
30%
46.6
0%42
.30%
2.90
%1.
40%
Urb
an32
32.
20%
2.80
%0.
90%
48.9
0%40
.90%
3.10
%1.
20%
Rura
l55
5.50
%3.
60%
3.60
%32
.70%
50.9
0%1.
80%
1.80
%
Curr
ent (
as o
n 31
Jan
202
0)-V
ictim
G
ende
r37
82.
60%
2.90
%1.
30%
46.6
0%42
.30%
2.90
%1.
40%
Mal
e29
32.
00%
0.00
%1.
40%
53.2
0%39
.90%
2.00
%1.
40%
Fem
ale
854.
70%
12.9
0%1.
20%
23.5
0%50
.60%
5.90
%1.
20%
6A.1
3: T
ABLE
IND
ICAT
ING
TH
E CH
ANG
E IN
TH
E O
CCU
PATI
ON
OF
VICT
IMS
FOR
HIH

Traffic Crash Injuries and Disabilities: The Burden on Indian Society
Category (state, habitation, gender)
Change in working pattern of household members
Someone in household had to take up additional jobs/shifts
Someone in household had to give up study
LIH [N=1647]
HIH [N=432]
LIH [N=1647]
HIH [N=432]
LIH [N=1647]
HIH [N=432]
Overall 43.90% 26.60% 14.20% 3.90% 20.00% 4.90%
Bihar 43.40% 33.00% 16.50% 8.70% 30.60% 11.30%
Maharashtra 42.70% 23.00% 12.30% 0.90% 9.90% --
Tamil Nadu 43.20% 35.00% 19.40% 4.90% 13.30% 3.90%
Uttar Pradesh 46.20% 14.90% 8.70% 1.00% 26.40% 4.00%
Habitation Type 43.90% 26.60% 14.20% 3.90% 20.00% 4.90%
Urban 36.90% 25.00% 11.20% 0.80% 11.60% 2.20%
Rural 46.80% 34.20% 15.50% 18.40% 23.50% 17.10%
Victim Gender 43.90% 26.60% 14.20% 3.90% 20.00% 4.90%
Male 44.40% 25.90% 15.40% 4.10% 20.80% 5.90%
Female 40.50% 29.30% 6.60% 3.30% 15.00% 1.10%
6A.14: TABLE INDICATING THE STATE- WISE, HABITATION- WISE, AND GENDER- WISE DETAILS OF THE OCCUPATIONAL IMPACT ON HOUSEHOLDS DUE TO THE CRASH
ANNEXURE 6A

148

Traffic Crash Injuries and Disabilities: The Burden on Indian Society
ANNEXURE 8A
8A.1: TABLE INDICATING THE TYPE OF VEHICLE USED BY THE VICTIM, WHICH WAS INVOLVED IN CRASH
State N M2W Car Bicycle 3W Pedestrian Others
LIH
Overall 1647 64.90% 7.40% 6.20% 3.70% 12.20% 5.60%
Bihar 412 51.90% 3.20% 10.20% 8.00% 18.20% 8.50%
Maharashtra 415 79.50% 4.30% 2.90% 1.20% 9.20% 2.90%
Tamil Nadu 407 66.10% 17.20% 3.40% 1.20% 8.40% 3.70%
Uttar Pradesh 413 62.00% 5.10% 8.20% 4.40% 13.10% 7.30%
HIH
Overall 432 66.00% 25.90% 0.90% 2.10% 3.70% 1.30%
Bihar 115 67.00% 23.50% 1.70% 4.30% -- 3.50%
Maharashtra 113 86.70% 9.70% 0.90% 0.90% 1.80% --
Tamil Nadu 103 47.60% 44.70% -- 1.00% 5.80% 1.00%
Uttar Pradesh 101 60.40% 27.70% 1.00% 2.00% 7.90% 1.00%

150
8A.2: TABLE INDICATING THE STATE- WISE AND HABITATION-WISE DETAILS ON LIFE INSURANCE COVERAGE OF THE VICTIM
Category (state,habitation, gender)
LIH HIH
N Yes No DK/CS N Yes No DK/CS
Total 681 17.50% 76.70% 5.90% 305 77.40% 22.30% 0.30%
Bihar 146 38.40% 54.80% 6.80% 83 85.50% 14.50% --
Maharashtra 127 18.10% 77.20% 4.70% 87 87.40% 12.60% --
Tamil Nadu 245 8.20% 90.60% 1.20% 73 50.70% 49.30% --
Uttar Pradesh 163 12.30% 74.80% 12.90% 62 83.90% 14.50% 1.60%
Habitation Type 681 17.50% 76.70% 5.90% 305 77.40% 22.30% 0.30%
Urban 394 19.50% 74.10% 6.30% 274 81.40% 18.20% 0.40%
Rural 287 14.60% 80.10% 5.20% 31 41.90% 58.10% --
Victim Gender 681 17.50% 76.70% 5.90% 305 77.40% 22.30% 0.30%
Male 573 19.20% 74.50% 6.30% 244 79.10% 20.50% 0.40%
Female 108 8.30% 88.00% 3.70% 61 70.50% 29.50% --

Traffic Crash Injuries and Disabilities: The Burden on Indian Society
ANNEXURE 8A
8A.3: TABLE INDICATING THE STATE- WISE AND HABITATION-WISE DETAILS ON MEDICAL INSURANCE COVERAGE OF THE VICTIM
8A.4: TABLE INDICATING THE STATE- WISE AND HABITATION- WISE DETAILS ON VEHICLE INSURANCE COVERAGE OF THE VICTIM’S VEHICLE
Category (State, habitation, gender)
LIH HIH
N Yes No DK/CS N Yes No DK/CS
Overall 681 20.90% 69.90% 9.30% 305 33.80% 61.60% 4.60%
Bihar 146 28.80% 54.10% 17.10% 83 22.90% 68.70% 8.40%
Maharashtra 127 7.90% 85.80% 6.30% 87 49.40% 50.60% --
Tamil Nadu 245 32.20% 66.90% 0.80% 73 30.10% 67.10% 2.70%
Uttar Pradesh 163 6.70% 76.10% 17.20% 62 30.60% 61.30% 8.10%
Habitation Type 681 20.90% 69.90% 9.30% 305 33.80% 61.60% 4.60%
Urban 394 21.60% 69.00% 9.40% 274 33.60% 63.10% 3.30%
Rural 287 19.90% 71.10% 9.10% 31 35.50% 48.40% 16.10%
Victim Gender 681 20.90% 69.90% 9.30% 305 33.80% 61.60% 4.60%
Male 573 21.80% 68.60% 9.60% 244 36.10% 59.40% 4.50%
Female 108 15.70% 76.90% 7.40% 61 24.60% 70.50% 4.90%
Category (State, habitation)
LIH HIH
N Yes No DK/CS NA N Yes No DK/CS NA
Overall 681 42.90% 33.80% 12.30% 11.00% 305 64.90% 23.60% 7.90% 3.60%
Bihar 146 63.00% 18.50% 6.20% 12.30% 83 61.40% 16.90% 20.50% 1.20%
Maharashtra 127 48.00% 38.60% 5.50% 7.90% 87 81.60% 16.10% 1.10% 1.10%
Tamil Nadu 245 40.00% 44.50% 6.50% 9.00% 73 47.90% 43.80% 4.10% 4.10%
Uttar Pradesh 163 25.20% 27.60% 31.90% 15.30% 62 66.10% 19.40% 4.80% 9.70%
Habitation Type 681 42.90% 33.80% 12.30% 11.00% 305 64.90% 23.60% 7.90% 3.60%
Urban 394 48.20% 31.00% 11.70% 9.10% 274 67.90% 21.20% 7.70% 3.30%
Rural 287 35.50% 37.60% 13.20% 13.60% 31 38.70% 45.20% 9.70% 6.50%

152
8A.5: TABLE INDICATING STATE- WISE DETAILS ON THE TYPE OF MOTOR VEHICLE INSURANCE FOR VICTIM’S VEHICLE
8A.6: TABLE INDICATING HABITATION- WISE, GENDER, WISE AND STATE- WISE RESPONSES ON WHETHER THE VICTIM/NOMINEE HAD TO ATTEND COURT FOR COMPENSATION
State
LIH HIH
NThird party insurance (Liability)
Comprehensive insurance
DK/CS NThird party insurance (Liability)
Comprehensive insurance
DK/CS
Overall 292 57.90% 28.40% 13.70% 198 49.00% 39.40% 11.60%
Bihar 92 54.30% 39.10% 6.50% 51 23.50% 58.80% 17.60%
Maharashtra 61 60.70% 14.80% 24.60% 71 69.00% 26.80% 4.20%
Tamil Nadu 98 64.30% 33.70% 2.00% 35 37.10% 57.10% 5.70%
Uttar Pradesh 41 46.30% 12.20% 41.50% 41 56.10% 22.00% 22.00%
Visited court for compensation
LIH HIH
N Yes No NA DK/CS N Yes No NA DK/CS
Habitation Type 1647 24.70% 56.90% 13.60% 4.80% 432 17.80% 62.70% 14.40% 5.10%
Urban 482 17.00% 60.40% 16.80% 5.80% 356 15.20% 64.00% 15.70% 5.10%
Rural 1165 27.90% 55.50% 12.30% 4.40% 76 30.30% 56.60% 7.90% 5.30%
Victim Gender 1647 24.70% 56.90% 13.60% 4.80% 432 17.80% 62.70% 14.40% 5.10%
Male 1420 25.80% 56.30% 13.30% 4.60% 340 19.40% 60.00% 15.00% 5.60%
Female 227 18.10% 60.80% 15.40% 5.70% 92 12.00% 72.80% 12.00% 3.30%
Overall 1647 24.70% 56.90% 13.60% 4.80% 432 17.80% 62.70% 14.40% 5.10%
Bihar 412 21.40% 54.60% 17.20% 6.80% 115 14.80% 56.50% 12.20% 16.50%
Maharashtra 415 24.10% 56.10% 17.80% 1.90% 113 15.00% 57.50% 26.50% 0.90%
Tamil Nadu 407 20.90% 66.10% 11.50% 1.50% 103 15.50% 76.70% 6.80% 1.00%
Uttar Pradesh 413 32.40% 50.80% 7.70% 9.00% 101 26.70% 61.40% 10.90% 1.00%

Traffic Crash Injuries and Disabilities: The Burden on Indian Society
ANNEXURE 8A
8A.7: TABLE INDICATING THE RESPONSES ON WHETHER THE VICTIM/ HOUSEHOLD MEMBERS FILED CASES IN MACT
8A.8: TABLE INDICATING THE STATE- WISE RESPONSES ON THE STATUS OF THE CASE IN MACT
8A.9: TABLE INDICATING THE STATE- WISE RESPONSES ON WHETHER VICTIM/HOUSEHOLD MEMBERS VISITED MACT FOR HEARING
Impact of crash on victim
LIH HIH
N Yes No DK/CS N Yes No DK/CS
1647 24.50% 56.40% 19.10% 432 20.40% 56.00% 23.60%
Survived 1052 13.50% 67.20% 19.30% 348 17.70% 60.80% 21.40%
Died 595 44.00% 37.30% 18.70% 54 38.90% 22.20% 38.90%
StateLIH HIH
N On-going N On-going
Overall 404 50.20% 88 35.20%
Bihar 98 59.20% 20 45.00%
Maharashtra 103 45.60% 23 13.00%
Tamil Nadu 72 47.20% 20 45.00%
Uttar Pradesh 131 48.90% 25 40.00%
StateLIH HIH
N Yes N Yes
Overall 404 79.20% 88 71.60%
Bihar 98 71.40% 20 55.00%
Maharashtra 103 74.80% 23 60.90%
Tamil Nadu 72 79.20% 20 70.00%
Uttar Pradesh 131 88.50% 25 96.00%

154
8A.10: TABLE INDICATING THE STATE- WISE RESPONSES ON WHETHER VICTIM/FAMILY MEMBERS SPENT ON LITIGATION
8A.11: TABLE INDICATING THE VEHICLE SIZE, EDUCATION LEVELS, AND STATE-WISE DETAILS OF TRUCK DRIVERS WHO FILED AN FIR
StateLIH HIH
N Yes N Yes
Overall 99 55.60% 50 64.00%
Bihar 36 63.90% 11 63.60%
Maharashtra 16 68.80% 13 15.40%
Tamil Nadu 31 29.00% 10 80.00%
Uttar Pradesh 16 75.00% 16 93.80%
Size of vehicle N Yes No DK/CS
Overall 244 32.80% 66.40% 0.80%
Medium Motor Vehicle (B/w 7.5-12 tons) 117 29.10% 70.10% 0.90%
Heavy Motor Vehicle (Exceed 12 tons) 112 32.10% 67.00% 0.90%
Trailer 15 66.70% 33.30%
Education level N Yes No DK/CS
Overall 244 32.80% 66.40% 0.80%
Illiterate or Educated till 5th Class 34 50.00% 50.00%
Middle school (up to Class 8th) 74 33.80% 63.50% 2.70%
Secondary school (up to Class 10th) 83 31.30% 68.70%
Senior secondary school (up to Class 12th) & above 53 22.60% 77.40%
State N Yes No DK/CS
Overall 244 32.80% 66.40% 0.80%
Bihar 40 2.50% 95.00% 2.50%
Maharashtra 108 41.70% 58.30% --
Tamil Nadu 48 43.80% 56.30% --
Uttar Pradesh 48 27.10% 70.80% 2.10%

Traffic Crash Injuries and Disabilities: The Burden on Indian Society
ANNEXURE 8A
8A.12: TABLE INDICATING THE EDUCATIONAL LEVELS OF TRUCK DRIVERS WHO FILED AN INSURANCE CLAIM
8A.13: TABLE INDICATING THE STATE- WISE INSURANCE AMOUNT RECEIVED BY TRUCK DRIVERS/ FLEET OWNERS
8A.14: TABLE INDICATING THE STATE- WISE PERSONAL INJURY INSURANCE COVERAGE OF TRUCK DRIVER AT THE TIME OF THE CRASH
Education vs. filed claim for insurance N Yes No
Overall 221 45.20% 54.80%
Illiterate 5 40.00% 60.00%
Did not complete primary education 3 100.00%
Primary school (up to Class 5th) 23 52.20% 47.80%
Middle school (up to Class 8th) 64 51.60% 48.40%
Secondary school (up to Class 10th) 76 44.70% 55.30%
Senior secondary school (up to Class 12th) 33 24.20% 75.80%
Diploma 4 75.00% 25.00%
Graduate/college and above 13 61.50% 38.50%
State N None Life Insurance Medical Insurance
Overall 244 54.50% 40.20% 18.00%
Bihar 40 27.50% 70.00% 22.50%
Maharashtra 108 51.90% 40.70% 20.40%
Tamil Nadu 48 68.80% 25.00% 25.00%
Uttar Pradesh 48 68.80% 29.20% 2.10%
State Claim amount
Overall (N=63) Rs.66,524
Tamil Nadu Rs.97,069
Bihar Rs.50,000
Maharashtra Rs.40,182
Uttar Pradesh --
[Multiple Responses]

156
8A.15: FIGURE INDICATING TYPE OF INSURANCE COVERAGE AMONG TRUCK DRIVERS
8A.16: TABLE INDICATING THE IMPACT OF THE MVAA ON COMPLIANCE WITH VEHICLE INSURANCE REQUIREMENTS AT STATE LEVEL
8A.17: TABLE INDICATING THE AWARENESS LEVELS ON THIRD PARTY LIABILITY INSURANCE WITH RESPECT TO CRASH EXPERIENCE AND DRIVING EXPERIENCE
COMPREHENSIVE INSURANCE
OVERALL (N = 221)
BIHAR (N = 37)
MAHARASHTRA (N = 94)
TAMIL NADU (N = 45)
UTTAR PRADESH (N = 45)
THIRD PARTY INSURANCE (LABILITY) DK/CS
46.6%
8.1%
59.6%
77.8%
20.0%
14.9%
17.8%
24.4%
25.5%
4.4%
55.6%
59.5% 32.4%
24.9% 28.5%
State N Yes, Definitely Yes, to some extent Not at all
Overall 420 36.40% 56.40% 7.10%
Bihar 101 15.80% 80.20% 4.00%
Maharashtra 113 38.10% 49.60% 12.40%
Tamil Nadu 100 57.00% 41.00% 2.00%
Uttar Pradesh 106 34.90% 55.70% 9.40%
Crash experience vs. awareness of Third party liability insurance N Yes No DK/ CS
Overall 420 34.00% 40.70% 25.20%
Yes 244 49.20% 31.60% 19.30%
No 176 13.10% 53.40% 33.50%
Driving experience vs. awareness of Third party liability insurance N Yes No DK/CS
Overall 420 34.00% 40.70% 25.20%
More than 10 yrs. 136 49.30% 30.90% 19.90%
6-10 yrs. 144 46.50% 33.30% 20.10%
2-5 yrs. 134 11.90% 56.70% 31.30%
Less than 2 yrs. 6 0.00% 83.30% 16.70%
[Figures in percent]

Traffic Crash Injuries and Disabilities: The Burden on Indian Society
ANNEXURE 8A
8A.18: TABLE INDICATING THE TRUCK DRIVER’S AWARENESS LEVELS ABOUT COVERAGE UNDER THIRD PARTY INSURANCE
8A.19: TABLE INDICATING THE AWARENESS ON MOTOR THIRD PARTY LIABILITY INSURANCE OF TRUCK DRIVERS ON VARIOUS ASPECTS
State N All of these Only Property Damage Only Injury/ Disability Only Death
Overall 143 69.90% 27.30% 25.20% 4.20%
Bihar 20 95.00% 5.00% 5.00% 5.00%
Maharashtra 88 56.80% 39.80% 38.60% 5.70%
Tamil Nadu 17 94.10% -- 5.90% --
Uttar Pradesh 18 83.30% 16.70% -- --
Aspect related to third party insuranceNot
AwareSomewhat
AwareFully
Aware
The purchase of Motor Third-party liability insurance is compulsory, and you may be fined by the Police if the vehicle is uninsured
22.90% 40.70% 36.40%
If the vehicle you are driving is UNINSURED, you (or the owner) may be personally liable to pay for injuries caused to others if you are at fault
23.10% 41.00% 36.00%
Motor Third Party liability insurance provides compensation to other people for their injuries if the crash is your fault
17.90% 44.30% 37.90%
Motor Third Party liability insurance does not provide compensation for injuries you incur if the crash is your fault
27.60% 41.90% 30.50%
If someone else is at fault for an crash and you incur injuries, you may be able to claim compensation from the insurer the vehicle is insured with
23.80% 45.00% 31.20%
The compensation you are eligible to receive may be reduced if you breach a traffic law
21.20% 44.50% 34.30%
Along with driver, truck attendant (khalasi) is also covered for benefits under third party insurance under MVAA, 2019
32.60% 40.70% 26.70%
The time limitation for filing of cases for compensation for injuries before the Claims Tribunal is 6 months from the date of the crash
33.30% 41.20% 25.50%
In case of road crash, insurance company is liable to designate an officer to help you with the process of settlement of your claim
35.00% 40.20% 24.80%
[N=420, All figures in percent]

158
8A.20: TABLE INDICATING THE STATE- WISE AND GENDER-WISE RESPONSES ON WHETHER VICTIMS OR THE FAMILIES HAVE RECEIVED ELIGIBLE COMPENSATION FROM GOVERNMENT / LOCAL AUTHORITIES
8A.21: TABLE INDICATING THE STATE- WISE AWARENESS LEVELS OF COMPENSATION CLAUSES AND SCHEMES IN THE EVENT OF AN CRASH
Category (State, gender)
LIH HIH
N AvailedReceived eligible
compensation (N=183)
Avg. time taken (months)
(N=95)N Availed
Received eligible compensation
(N=36)
Avg. time taken (months)
(N=9)
Overall 1647 11.10% 51.90% 13.7 432 8.30% 25.00% 20.1
Bihar 412 14.60% 50.00% 9 115 18.30% 33.30% 22.6
Maharashtra 415 6.00% 52.00% 11.2 113 2.70% 33.30% 12
Tamil Nadu 407 10.10% 39.00% 9.4 103 7.80% -- --
Uttar Pradesh 413 13.80% 63.20% 20.4 101 4.00% 25.00% 11
Victim Gender 1647 11.10% 51.90% 13.7 432 8.30% 25.00% 20.1
Male 1420 11.60% 52.10% 14 340 8.80% 26.70% 21.4
Female 227 7.90% 50.00% 11 92 6.50% 16.70% 10
StateLIH HIH
N Yes No DK/CS N Yes No DK/CS
Overall 681 22.90% 70.00% 7.00% 305 25.20% 63.30% 11.50%
Bihar 146 32.20% 54.80% 13.00% 83 16.90% 61.40% 21.70%
Maharashtra 127 17.30% 81.10% 1.60% 87 20.70% 74.70% 4.60%
Tamil Nadu 245 31.40% 66.10% 2.40% 73 28.80% 69.90% 1.40%
Uttar Pradesh 163 6.10% 81.00% 12.90% 62 38.70% 41.90% 19.40%

Traffic Crash Injuries and Disabilities: The Burden on Indian Society
9A.1: TABLE INDICATING STATE- WISE DETAILS ON THE MODE OF TRANSPORT USED TO TRANSFER THE VICTIM TO THE HOSPITAL
9A.2: TABLE INDICATING STATE- WISE DETAILS OF THE REACTION TIME OF THE AMBULANCE TO ARRIVE AT CRASH LOCATION
State N Ambulance Police vehicle Private vehicle Public vehicleNot transferred
to hospitalDK/CS
LIH
Overall 1647 30.60% 6.60% 31.10% 20.70% 7.80% 3.20%
Bihar 412 15.30% 5.30% 32.30% 26.70% 18.90% 1.50%
Maharashtra 415 24.10% 3.90% 48.90% 16.40% 1.70% 5.10%
Tamil Nadu 407 62.20% 2.00% 6.10% 25.80% 3.90% --
Uttar Pradesh 413 21.30% 15.30% 36.60% 14.30% 6.50% 6.10%
HIH
Overall 432 33.30% 3.20% 36.10% 25.50% 1.60% 0.20%
Bihar 115 8.70% 7.80% 58.30% 24.30% 0.90% --
Maharashtra 113 23.90% 0.90% 34.50% 36.30% 3.50% 0.90%
Tamil Nadu 103 79.60% -- 3.90% 16.50% -- --
Uttar Pradesh 101 24.80% 4.00% 45.50% 23.80% 2.00% --
State N Within 15 minutes 16-30 mins 31-45 mins Beyond 45 mins DK/CS
LIH
Overall 504 44.80% 31.30% 9.10% 5.40% 9.30%
Bihar 63 44.40% 19.00% 6.30% 15.90% 14.30%
Maharashtra 100 32.00% 27.00% 7.00% 10.00% 24.00%
Tamil Nadu 253 54.90% 37.20% 7.90% -- --
Uttar Pradesh 88 30.70% 28.40% 17.00% 8.00% 15.90%
HIH
Overall 144 45.80% 36.80% 9.00% 4.90% 3.50%
Bihar 10 40.00% 30.00% -- 20.00% 10.00%
Maharashtra 27 22.20% 48.10% 18.50% 7.40% 3.70%
Tamil Nadu 82 56.10% 32.90% 9.80% 1.20% --
Uttar Pradesh 25 40.00% 40.00% -- 8.00% 12.00%
ANNEXURE 9A

160
9A.3: TABLE INDICATING STATE- WISE DETAILS ON THE TYPE OF HOSPITAL THAT THE VICTIM WAS ADMITTED TO
9A.4: TABLE INDICATING THE STATE- WISE, HABITATION- WISE, AND GENDER- WISE PROPORTION OF VICTIMS ADMITTED TO HOSPITALS
State
LIH HIH
N Govt Pvt N Govt Pvt
Overall 681 36.60% 63.40% 305 18.40% 81.60%
Bihar 146 34.20% 65.80% 83 14.50% 85.50%
Maharashtra 127 34.60% 65.40% 87 6.90% 93.10%
Tamil Nadu 245 36.70% 63.30% 73 27.40% 72.60%
Uttar Pradesh 163 39.90% 60.10% 62 29.00% 71.00%
Category (State, habitation, gender)LIH HIH
N Yes N Yes
Overall 1519 68.10% 425 81.60%
Bihar 334 68.30% 114 78.10%
Maharashtra 408 75.70% 109 89.00%
Tamil Nadu 391 68.50% 103 71.80%
Uttar Pradesh 386 59.30% 99 87.90%
Habitation Type 1519 68.10% 425 81.60%
Urban 472 73.30% 350 81.10%
Rural 1047 65.70% 75 84.00%
Victim Gender 1519 68.10% 425 81.60%
Male 1306 68.40% 334 82.90%
Female 213 66.20% 91 76.90%

Traffic Crash Injuries and Disabilities: The Burden on Indian Society
9A.5: TABLE INDICATING STATE-WISE, HABITATION-WISE, AND GENDER-WISE DETAILS ON CRASHES REPORTED TO POLICE
9A.6: TABLE INDICATING STATE- WISE, HABITATION- WISE, AND GENDER- WISE DETAILS ON WHETHER AN FIR WAS FILED AFTER THE CRASH
Category (State, habitation, gender)
LIH HIH
N Yes No DK/CS N Yes No DK/CS
Overall 1647 54.30% 43.20% 2.60% 432 43.10% 53.20% 3.70%
Bihar 412 47.80% 48.10% 4.10% 115 28.70% 60.00% 11.30%
Maharashtra 415 48.40% 50.40% 1.20% 113 23.90% 76.10% --
Tamil Nadu 407 72.00% 27.00% 1.00% 103 70.90% 28.20% 1.00%
Uttar Pradesh 413 49.20% 47.00% 3.90% 101 52.50% 45.50% 2.00%
Habitation Type 1647 54.30% 43.20% 2.60% 432 43.10% 53.20% 3.70%
Urban 482 42.50% 54.80% 2.70% 356 39.00% 57.30% 3.70%
Rural 1165 59.10% 38.40% 2.50% 76 61.80% 34.20% 3.90%
Victim Gender 1647 54.30% 43.20% 2.60% 432 43.10% 53.20% 3.70%
Male 1420 55.10% 42.30% 2.70% 340 43.80% 51.80% 4.40%
Female 227 49.30% 48.90% 1.80% 92 40.20% 58.70% 1.10%
Category (State, habitation, gender)
LIH HIH
N Yes No DK/CS N Yes No DK/CS
Overall 1647 48.00% 47.70% 4.30% 432 41.40% 50.70% 7.90%
Bihar 412 43.00% 51.50% 5.60% 115 29.60% 58.30% 12.20%
Maharashtra 415 45.80% 52.50% 1.70% 113 24.80% 75.20% --
Tamil Nadu 407 59.20% 35.90% 4.90% 103 66.00% 15.50% 18.40%
Uttar Pradesh 413 44.30% 50.60% 5.10% 101 48.50% 50.50% 1.00%
Habitation Type 1647 48.00% 47.70% 4.30% 432 41.40% 50.70% 7.90%
Urban 482 37.10% 57.70% 5.20% 356 36.80% 54.80% 8.40%
Rural 1165 52.50% 43.50% 3.90% 76 63.20% 31.60% 5.30%
Victim Gender 1647 48.00% 47.70% 4.30% 432 41.40% 50.70% 7.90%
Male 1420 49.20% 46.50% 4.30% 340 42.10% 50.30% 7.60%
Female 227 41.00% 54.60% 4.40% 92 39.10% 52.20% 8.70%
ANNEXURE 9A

162
9A.7: TABLE INDICATING STATE- WISE, HABITATION - WISE, AND GENDER- WISE DETAILS ON WHETHER THE VICTIMS/ HOUSEHOLD MEMBERS RECEIVED ASSISTANCE BY POLICE DURING THE FIR PROCESS
9A.8: TABLE INDICATING THE STATE- WISE TRENDS IN THE TIME TAKEN TO ATTEND TO THE VICTIM AT HOSPITAL
Assistance of police during the FIR process
LIH HIH
N Yes No DK/CS N Yes No DK/CS
Overall 791 78.10% 18.30% 3.50% 179 84.40% 11.70% 3.90%
Bihar 177 56.50% 35.60% 7.90% 34 58.80% 32.40% 8.80%
Maharashtra 190 83.20% 12.10% 4.70% 28 78.60% 17.90% 3.60%
Tamil Nadu 241 92.50% 7.10% 0.40% 68 97.10% 2.90% --
Uttar Pradesh 183 74.90% 23.00% 2.20% 49 87.80% 6.10% 6.10%
Habitation Type 791 78.10% 18.30% 3.50% 179 84.40% 11.70% 3.90%
Urban 179 92.70% 6.10% 1.10% 131 80.90% 13.70% 5.30%
Rural 612 73.90% 21.90% 4.20% 48 93.80% 6.30% --
Victim Gender 791 78.10% 18.30% 3.50% 179 84.40% 11.70% 3.90%
Male 698 78.40% 18.20% 3.40% 143 84.60% 11.90% 3.50%
Female 93 76.30% 19.40% 4.30% 36 83.30% 11.10% 5.60%
State NImmediately on
reaching hospitalWithin 10-30
mins31-60 mins Beyond 60 mins DK/ CS
LIH
Overall 1519 50.00% 32.00% 4.90% 2.00% 11.10%
Bihar 334 58.70% 25.70% 3.90% 4.20% 7.50%
Maharashtra 408 60.30% 27.70% 1.20% 0.70% 10.00%
Tamil Nadu 391 38.10% 48.60% 12.00% 0.50% 0.80%
Uttar Pradesh 386 43.50% 25.10% 2.60% 3.10% 25.60%
HIH
Overall 425 53.60% 34.60% 4.90% 3.80% 3.10%
Bihar 114 32.50% 40.40% 11.40% 13.20% 2.60%
Maharashtra 109 59.60% 30.30% 3.70% 0.90% 5.50%
Tamil Nadu 103 50.50% 47.60% 1.00% -- 1.00%
Uttar Pradesh 99 74.70% 19.20% 3.00% -- 3.00%

Traffic Crash Injuries and Disabilities: The Burden on Indian Society
9A.9: TABLE INDICATING STATE- WISE TRENDS ON WHETHER ANY DISCRIMINATION/PREJUDICE WAS FACED BY THE HOSPITAL STAFF
9A.10: TABLE INDICATING STATE- WISE RESPONSES ON WHETHER SOMEONE KNOWN WAS WORKING AS FIRST AID STAFF AT MEDICAL FACILITY/ HOSPITAL
9A.11: TABLE INDICATING STATE- WISE RESPONSES ON WHETHER THE VICTIM/ HOUSEHOLD MEMBER WAS HELPED BY SOMEONE KNOWN DURING THE TREATMENT OF THE VICTIM
StateLIH HIH
N Yes No DK/CS N Yes No DK/CS
Overall 1519 7.00% 83.50% 9.50% 425 6.80% 87.50% 5.60%
Bihar 334 13.20% 75.40% 11.40% 114 21.90% 64.90% 13.20%
Maharashtra 408 1.50% 92.90% 5.60% 109 0.90% 97.20% 1.80%
Tamil Nadu 391 11.00% 81.80% 7.20% 103 1.00% 97.10% 1.90%
Uttar Pradesh 386 3.40% 82.10% 14.50% 99 2.00% 92.90% 5.10%
StateLIH HIH
N Yes N Yes
Overall 660 28.60% 299 20.70%
Bihar 134 24.60% 83 25.30%
Maharashtra 126 9.50% 83 3.60%
Tamil Nadu 240 55.00% 73 47.90%
Uttar Pradesh 160 7.50% 60 5.00%
StateLIH HIH
N Yes N Yes
Overall 188 92.60% 62 79.00%
Bihar 33 87.90% 21 47.60%
Maharashtra 12 83.30% 3 100.00%
Tamil Nadu 131 95.40% 35 100.00%
Uttar Pradesh 12 83.30% 3 33.30%
ANNEXURE 9A

164
9A.12: TABLE INDICATING STATE-WISE RESPONSES ON WHETHER ROAD SAFETY PRECAUTIONS WERE TAKEN BY VICTIM DURING THE ROAD CRASH
State
LIH HIH
NWearing helmet
Wearing seatbelt
Not wearing helmet/ seatbelt
NA NWearing helmet
Wearing seatbelt
Not wearing helmet/ seatbelt
NA
Overall 1647 36.80% 5.00% 36.10% 22.10% 432 49.10% 20.40% 23.80% 6.70%
Bihar 412 35.20% 3.40% 25.00% 36.40% 115 53.90% 22.60% 17.40% 6.10%
Maharashtra 415 36.10% 2.90% 47.70% 13.30% 113 73.50% 7.10% 15.90% 3.50%
Tamil Nadu 407 32.70% 9.30% 45.00% 13.00% 103 17.50% 27.20% 48.50% 6.80%
Uttar Pradesh 413 43.10% 4.60% 26.60% 25.70% 101 48.50% 25.70% 14.90% 10.90%

Traffic Crash Injuries and Disabilities: The Burden on Indian Society
9A.1
3: T
ABLE
IND
ICAT
ING
STA
TE-
WIS
E, H
ABIT
ATIO
N-
WIS
E, A
ND
GEN
DER
- W
ISE
INFO
RMAT
ION
ON
IMPA
CT O
F TH
E CR
ASH
Cate
gory
(S
tate
, ha
bita
tion,
ge
nder
)
LIH
HIH
N
Died at the scene
Died while being transported to hospital
Discharged from hospital within 24 hrs
Hospitalized for more than 1 day
Died in hospital within 30 days from crash
Died after 30 days from the crash
N
Died at the scene
Died while being transported to hospital
Discharged from hospital within 24 hrs
Hospitalized for more than 1 day
Died in hospital within 30 days from crash
Died after 30 days from the crash
Ove
rall
1647
18.4
0%8.
00%
13.4
0%50
.50%
8.90
%0.
90%
432
4.20
%2.
80%
13.4
0%74
.10%
5.10
%0.
50%
Biha
r41
224
.30%
7.80
%12
.90%
43.9
0%10
.40%
0.70
%11
52.
60%
1.70
%10
.40%
83.5
0%1.
70%
--
Mah
aras
htra
415
19.3
0%3.
40%
2.90
%67
.00%
6.30
%1.
20%
113
5.30
%3.
50%
5.30
%85
.00%
0.90
%--
Tam
il N
adu
407
5.40
%5.
70%
33.7
0%45
.70%
8.80
%0.
70%
103
--3.
90%
35.0
0%47
.60%
13.6
0%--
Utta
r Pr
ades
h41
324
.50%
15.3
0%4.
60%
45.0
0%9.
90%
0.70
%10
18.
90%
2.00
%4.
00%
78.2
0%5.
00%
2.00
%
Hab
itatio
n Ty
pe16
4718
.40%
8.00
%13
.40%
50.5
0%8.
90%
0.90
%43
24.
20%
2.80
%13
.40%
74.1
0%5.
10%
0.50
%
Urb
an48
25.
60%
3.70
%22
.20%
64.5
0%3.
70%
0.20
%35
64.
80%
2.00
%13
.50%
77.2
0%2.
00%
0.60
%
Rura
l11
6523
.70%
9.80
%9.
80%
44.6
0%11
.00%
1.10
%76
1.30
%6.
60%
13.2
0%59
.20%
19.7
0%--
Vict
im
Gen
der
1647
18.4
0%8.
00%
13.4
0%50
.50%
8.90
%0.
90%
432
4.20
%2.
80%
13.4
0%74
.10%
5.10
%0.
50%
Mal
e14
2019
.20%
8.20
%11
.50%
50.7
0%9.
50%
0.80
%34
04.
40%
2.60
%11
.50%
74.7
0%6.
20%
0.60
%
Fem
ale
227
13.7
0%6.
60%
25.1
0%48
.90%
4.80
%0.
90%
923.
30%
3.30
%20
.70%
71.7
0%1.
10%
--
ANNEXURE 9A

166

Traffic Crash Injuries and Disabilities: The Burden on Indian Society
As per United Nations SDG 10.1 goals, bottom 40 percent of the country’s population in terms of income is being monitored.
As per the World Inequality Database (https://wid.world/country/india/), using the income distribution simulator (see fig 1 below) it was estimated that pre-tax annual income of INR 1,61,400 Per Adult is the threshold income of bottom 40% of the population of India. This translates to INR 13,450 per month per adult.
Hence for this survey, this income to be taken as the threshold per capita income for the test sample (to be termed as “bottom-40” henceforth).
All households with per capita (adult) monthly income (pre-tax) up to INR 13,450 would be considered as target respondents.
Similarly, using the same simulator (see fig 2 below) it was estimated that any adult with annual pre-tax income of INR 6,00,000/- or above would be considered among the top-10 % of the population in India. This converts to INR 50,000/- per month.
Hence for survey among control sample, households having per capita pre-tax monthly income of INR 50,000/- or above would be selected (to be termed as “top-10” henceforth).
All the enumerators would be provided a table wherein they can convert the household income based on number of adults in the household to decide whether the household can be interviewed or not.
METHODOLOGY NOTE:
The World Inequality Database (WID.world) aims to provide open and convenient access to the most extensive available database on the historical evolution of the world distribution of income and wealth, both within countries and between countries.
The estimates are based on a combination of sources used at the national level (including tax receipts, household surveys and national accounts), fiscal data coming from taxes on income, inheritance and wealth data and wealth rankings. The calculations are based on national income (NI), i.e. GDP minus consumption of fixed capital (capital depreciation) plus net foreign income. [https://wid.world/methodology/#library-others]
POVERTY BASED ON DR. C. RANGARAJAN RE-PORT:
As per Dr. Rangarajan report the new poverty line is when monthly per capita consumption expenditure of Rs.972 in rural areas and Rs.1,407 in urban areas in 2011-12 (i.e. Rs. 47 per day for urban areas). The inflation rate in India between March 2012 and March 2019 was 53.73%, which translates into a total increase of Rs.756. This means that Rs.1,407 rupees in March 2012 are equivalent to Rs.2,163 in March 2019. The average monthly inflation rate between these periods was 0.51% In consideration of this study, households under poverty line would be determined based on monthly household income and number of members in household.
APPENDIX 1: PROPOSED DEFINITION FOR LIH (BOTTOM 40) AND BPL

168
FIG 1: THRESHOLD MONTHLY INCOME OF BOTTOM-40% OF POPULATION
FIG 2: THRESHOLD MONTHLY INCOME OF TOP-10% OF POPULATION

Traffic Crash Injuries and Disabilities: The Burden on Indian Society
The impact of road crash on victims varies depending on various factors such as victim’s demographic and socio-economic profile (age, gender, educational qualification, household income, etc.). This chapter presents summary of the demographic, professional and economic profile of victims. The road crash victims were segregated into two key categories i.e. LIH (from poor families) and HIH (from rich families).
4.1 GENDER OF VICTIMSGender wise, travel habits and road usage of males differ from females to a large extent. Males being prime users of the roads in the form of drivers, pedestrians, cyclists, passengers, etc. more likely to get killed or seriously injured in crashes than women. During survey about 86 percent of road crash victims of LIH category were males while among the HIH category such proportion was about 79 percent.
TABLE 4.2: AGE-GROUP OF ROAD CRASH VICTIMS AT THE TIME OF CRASH
TABLE 4.1: GENDER OF ROAD CRASH VICTIMS
[All figures in %]
[All figures in %]
4.2 AGE-GROUP OF VICTIMS AT THE TIME OF ROAD CRASHA majority of the victims covered in the survey were from young and middle working age groups. Among LIH category
Age-group of the road crash victim N 14-18 yrs. 18-25 yrs. 26-35 yrs. 36-45 yrs. 46-60 yrs. More than 60 yrs.
LIH
Overall 1647 4.9 20.5 29.3 24.3 16.7 4.3
Bihar 412 8.0 25.7 26.9 21.6 12.9 4.9
Maharashtra 415 3.4 18.8 28.9 24.1 18.3 6.5
Tamil Nadu 407 0.7 10.6 29.7 31.2 25.3 2.5
Uttar Pradesh 413 7.5 26.9 31.5 20.3 10.4 3.4
HIH
Overall 432 0.7 16.4 39.6 24.1 14.8 4.4
Bihar 115 1.7 27.8 55.7 9.6 3.5 1.7
Maharashtra 113 -- 10.6 27.4 37.2 18.6 6.2
Tamil Nadu 103 -- 9.7 37.9 32.0 18.4 1.9
Uttar Pradesh 101 1.0 16.8 36.6 17.8 19.8 7.9
APPENDIX 2: ROAD CRASH VICTIM PROFILE
victims, overall maximum number (53.6%) of victims were in the age-group of 26-45 years. Similarly, among HIH category, overall highest proportion of victims (64%) were from the age-group of 26-45 years. The probable reason is that most commuting/ travel happens due to work/ occupation and 26-45 age-groups are more prone to crashes.
Road crash victim genderLIH HIH
N Male Female N Male Female
Overall 1647 86.2 13.8 432 78.7 21.3
Bihar 412 87.1 12.9 115 82.6 17.4
Maharashtra 415 85.5 14.5 113 76.1 23.9
Tamil Nadu 407 79.4 20.6 103 68.9 31.1
Uttar Pradesh 413 92.7 7.3 101 87.1 12.9

170
4.3 EDUCATIONAL QUALIFICATION OF VICTIMS AT THE TIME OF ROAD CRASH
In terms of education, about two-third (66.2%) of the HIH category victims were graduate or post graduate at the
Highest education of victim at the time of road
crashN
Up to 5th Class
Up to 8th Class
Up to 10th Class
Up to 12th Class
Diploma Graduate Postgraduate
LIH
Overall 1647 21.0 13.1 17.9 15.2 8.1 21.3 3.5
Bihar 412 31.1 15.0 16.0 16.7 4.6 16.3 0.2
Maharashtra 415 18.0 12.5 23.9 16.1 7.2 17.8 4.3
Tamil Nadu 407 7.3 7.4 12.0 12.0 17.9 37.6 5.7
Uttar Pradesh 413 27.1 17.4 19.4 16.0 2.7 13.6 3.9
HIH
Overall 432 3.0 3.9 4.6 10.4 11.8 52.5 13.7
Bihar 115 -- 1.7 5.2 12.2 13.9 62.6 4.3
Maharashtra 113 6.2 6.2 7.1 9.7 10.6 38.1 22.1
Tamil Nadu 103 -- 3.9 4.9 10.7 18.4 45.6 16.5
Uttar Pradesh 101 6.0 4.0 1.0 8.9 4.0 64.4 11.9
TABLE 4.3: EDUCATIONAL QUALIFICATION OF ROAD CRASH VICTIMS [All figures in %]
time of crash. Almost, similar trend was observed across states where highest proportion of HIH victims was either graduate or post graduate at the time of crash.
On the other hand, only one-fourth (24.8%) of victims from LIH category were graduate or above at the time of crash.

Traffic Crash Injuries and Disabilities: The Burden on Indian Society
TABLE 4.4: VICTIMS OCCUPATION AT THE TIME OF CRASH – LIH
TABLE 4.5: VICTIMS OCCUPATION AT THE TIME OF CRASH – HIH
[N=1647, All figures in %]
[N=432, All figures in %]
4.4 OCCUPATION OF VICTIMS AT THE TIME OF CRASH Occupation profile wise, among LIH category, the highest proportion of victims covered was salaried employees
LIH victims occupation
at the time of crash
Unemployed HousewifeAgriculture
Laborer/ Farmer
Laborer/ skilled
worker/ unskilled worker
Petty trader/ shop
owner
Businessmen/ self-employed
Salaried employee
(Pvt/ Govt)Retired Student
Overall 6.3 3.6 14.3 21.1 8.4 7.5 30.7 0.8 7.2
Bihar 9.0 4.4 12.6 20.4 10.9 5.6 26.5 1.0 9.7
Maharashtra 4.1 3.6 26.5 15.2 7.2 6.0 27.7 0.5 9.2
Tamil Nadu 3.4 2.9 4.7 18.7 9.3 12.8 46.2 1.2 0.7
Uttar Pradesh 8.5 3.6 13.3 30.0 6.3 5.8 22.8 0.5 9.2
(30.7%) at the time of crash followed by victims that were laborer/ skilled or unskilled workers (21.1%), agriculture laborer/ farmer (14.3%), etc.
Among HIH category, most victims (42%) were businessmen/ self-employed at the time of crash and almost similar proportion of victims (41%) were salaried employees (Pvt/ govt.).
HIH victims occupation at the time of crash
Unemployed Housewife FarmerBusinessmen/ self-employed
Salaried employee
(Pvt/ Govt)Student Others
Overall 4.6 3.5 1.6 42.1 41.0 5.8 1.4
Bihar 7.8 0.9 1.7 54.8 30.4 3.5 0.9
Maharashtra 8.8 8.0 0.9 34.5 39.8 7.1 0.9
Tamil Nadu 0.0 1.9 0.0 19.4 75.7 1.9 1.0
Uttar Pradesh 1.0 3.0 4.0 59.4 18.8 10.9 3.0
APPENDIX 2: ROAD CRASH VICTIM PROFILE

172
4.5 INCOME OF VICTIMS AT THE TIME OF CRASH
In terms of monthly income at the time of crash, most of the victims from LIH households (25%) were earning between Rs.5,000 to Rs.10,000 followed by victims that
were earning between Rs.10,001 to Rs.20,000. About 18 percent of victims from LIH households were not earning at all.
State wise, except Tamil Nadu, highest proportion of victims were earning between Rs.5,000 to Rs.10,000 at the time of crash.
TABLE 4.6: VICTIMS INCOME AT THE TIME OF CRASH – LIH
TABLE 4.7: VICTIMS INCOME AT THE TIME OF CRASH – HIH
[N=1647, All figures in %]
[N=432, All figures in %]
LIH victims monthly income at the time of crash
Not earning
Up to Rs. 5,000
Rs. 5,001 to Rs. 10,000
Rs. 10,001 to
Rs. 20,000
Rs. 20,001 to
Rs. 30,000
Rs. 30,001 to
Rs. 50,000
Rs. 50,001 to
Rs. 75,000
Rs. 75,001 to
Rs. 1,00,000
Overall 17.9 13.8 25.5 21.2 7.3 7.7 4.8 1.8
Bihar 23.3 20.4 28.2 20.1 5.8 1.7 -- 0.5
Maharashtra 18.3 17.8 30.8 21.4 5.8 3.1 2.7 --
Tamil Nadu 8.1 1.5 10.3 17.4 14.0 25.1 16.7 6.9
Uttar Pradesh 21.5 15.3 32.4 25.7 3.9 1.2 -- --
Compared to LIH household victims, lesser proportion of HIH household victims were not earning at the time of crash. Among HIH household victims, one-third of victims
were earning between Rs.50,000 to Rs.1 Lakh per month and almost similar proportion of HIH household victims was earning up to Rs.50,000 per month.
HIH victims monthly income at the time of crash
Not earningUp to
Rs.50,000Rs.50,000 to
Rs.1 LakhRs.1 Lakh to
Rs.2 LakhRs.2 Lakh to
Rs.4 LakhRs.4 Lakh to
Rs.6 Lakh
Overall 14.1 33.8 34.7 14.6 2.3 0.5
Bihar 12.2 42.6 37.4 4.3 1.7 1.7
Maharashtra 24.8 37.2 29.2 8.8 -- --
Tamil Nadu 3.9 33.0 30.1 32.0 1.0 --
Uttar Pradesh 14.9 20.8 42.6 14.9 6.9 --

Traffic Crash Injuries and Disabilities: The Burden on Indian Society
TABLE 4.8: MARITAL STATUS OF THE VICTIM AT THE TIME OF ROAD CRASH [All figures in %]
4.6 MARITAL STATUS OF VICTIM AT THE TIME OF ROAD CRASH
Overall, about 7 out of 10 victims from both LIH and HIH category were married and rest were single.
Marital status of the victim
LIH HIH
N Married Single N Married Single
Overall 1647 69.7 30.3 432 74.1 25.9
Bihar 412 66.0 34.0 115 65.2 34.8
Maharashtra 415 63.6 36.4 113 72.6 27.4
Tamil Nadu 407 85.7 14.3 103 90.3 9.7
Uttar Pradesh 413 63.7 36.3 101 69.3 30.7
APPENDIX 2: ROAD CRASH VICTIM PROFILE

174
TABLE 4.9: AVERAGE HOUSEHOLD SIZE (MEAN VALUE)
4.7 AVERAGE HOUSEHOLD SIZE
The average household size of respondents in LIH segment was 5.6 which consisted of 3.8 adult members (above 18 years of age) and 1.8 members below 18 years of age.
Average household size (Mean value)
NNo. of adult members above 18 yrs. of age
No. of members below 18 yrs. of age
Total members
LIH
Overall 1647 3.8 1.8 5.6
Bihar 412 4.2 2.3 6.4
Maharashtra 415 3.8 1.3 5.1
Tamil Nadu 407 3.1 1.1 4.2
Uttar Pradesh 413 4.2 2.4 6.6
HIH
Overall 432 3.4 1.4 4.8
Bihar 115 3.6 2.0 5.6
Maharashtra 113 3.1 1.0 4.1
Tamil Nadu 103 3.1 1.1 4.2
Uttar Pradesh 101 3.7 1.4 5.1
The median values of number of adult members was 3, number of members below 18 years was 2 and total members in household was 5.

Traffic Crash Injuries and Disabilities: The Burden on Indian Society
A1 PROFILE OF ROAD CRASH VICTIM During the survey, victims or their family members were explored about the various details of the road crash. Demographic and professional profile or victim, details of the crash such as time date, type of vehicles involved etc. were collected. The road crash victims were segregated into two key categories i.e. LIH (from poor families) and HIH (from rich families).
Year of crashLIH HIH
N 2005-09 2010-14 2015-19 N 2005-09 2010-14 2015-19
Overall 1647 9.4 20.4 70.2 432 3.7 17.1 79.2
Bihar 412 8.5 24.5 67.0 115 6.1 13.0 80.9
Maharashtra 415 13.3 19.5 67.2 113 6.2 12.4 81.4
Tamil Nadu 407 6.6 15.0 78.4 103 1.0 16.5 82.5
Uttar Pradesh 413 9.0 22.5 68.5 101 1.0 27.7 71.3
TABLE A1: YEAR OF ROAD CRASH [All figures in %]
A1.1 YEAR OF ROAD CRASH
Overall, higher proportion of the respondents was covered where crashes happened during 2015-19. Among LIH, seven out of ten crashes happened in 2015-19 while in the case of HIH eight out of ten crashes happened during 2015-19.
Almost similar trend was seen across all states where the maximum number of respondents/ family members experienced crashes during 2015-19.
APPENDIX 3: RESPONDENT PROFILE (DEMOGRAPHIC & PROFESSIONAL) – LIH & HIH

176
TABLE A2: GENDER OF ROAD CRASH VICTIMS [All figures in %]
A1.2 GENDER OF VICTIMS
Overall, higher proportion of males were victims of road crashes. In the LIH category, over 8 out of 10 were male
victims of road crashes while among the HIH category it was about 78 percent.
Almost similar trend was seen across all states where the maximum number of road crash victims were males.
Road crash victim genderLIH HIH
N Male Female N Male Female
Overall 1647 86.2 13.8 432 78.7 21.3
Bihar 412 87.1 12.9 115 82.6 17.4
Maharashtra 415 85.5 14.5 113 76.1 23.9
Tamil Nadu 407 79.4 20.6 103 68.9 31.1
Uttar Pradesh 413 92.7 7.3 101 87.1 12.9

Traffic Crash Injuries and Disabilities: The Burden on Indian Society
A1.3 AGE-GROUP OF VICTIMS AT THE TIME OF ROAD CRASH
Considering the age-group of the respondents from the LIH group, overall maximum number of victims (29%) were in the age-group of 26-35 years followed by 36-45 yrs. (24%).
TABLE A3: AGE-GROUP OF ROAD CRASH VICTIMS [All figures in %]
Age-group of the road crash victim
N 14-18 yrs. 18-25 yrs. 26-35 yrs. 36-45 yrs.46-60
yrs.More than 60
yrs.
LIH
Overall 1647 4.9 20.5 29.3 24.3 16.7 4.3
Bihar 412 8.0 25.7 26.9 21.6 12.9 4.9
Maharashtra 415 3.4 18.8 28.9 24.1 18.3 6.5
Tamil Nadu 407 0.7 10.6 29.7 31.2 25.3 2.5
Uttar Pradesh 413 7.5 26.9 31.5 20.3 10.4 3.4
HIH
Overall 432 0.7 16.4 39.6 24.1 14.8 4.4
Bihar 115 1.7 27.8 55.7 9.6 3.5 1.7
Maharashtra 113 10.6 27.4 37.2 18.6 6.2
Tamil Nadu 103 9.7 37.9 32.0 18.4 1.9
Uttar Pradesh 101 1.0 16.8 36.6 17.8 19.8 7.9
Thus, more than half of respondents (53.6%) were in the age-group of 26-45 years.
Similarly, among the HIH category, overall, highest proportion of victims (40%) was from the age-group of 26-35 years followed by 36-45 yrs. (24%). Thus about two-third (64%) of victims were in the age-group of 26-45 years.
APPENDIX 3: RESPONDENT PROFILE (DEMOGRAPHIC & PROFESSIONAL) – LIH & HIH

178
TABLE A4: EDUCATIONAL QUALIFICATION OF ROAD CRASH VICTIMS [All figures in %]
A1.4 EDUCATIONAL QUALIFICATION OF VICTIMS AT THE TIME OF ROAD CRASH
In terms of education of LIH category victims, around 21 percent were graduate and almost similar proportion of
victims were educated up to 5th class followed by victims educated till 10th standard (18%).
Among the HIH category, more than half of the victims were graduate followed by post-graduate (14%).
Education of victim at the time of road crash
NUp to 5th
ClassUp to 8th
ClassUp to 10th
ClassUp to 12th
ClassDiploma Graduate Postgraduate
LIH
Overall 1647 21.0 13.1 17.9 15.2 8.1 21.3 3.5
Bihar 412 31.1 15.0 16.0 16.7 4.6 16.3 0.2
Maharashtra 415 18.0 12.5 23.9 16.1 7.2 17.8 4.3
Tamil Nadu 407 7.3 7.4 12.0 12.0 17.9 37.6 5.7
Uttar Pradesh 413 27.1 17.4 19.4 16.0 2.7 13.6 3.9
HIH
Overall 432 3.0 3.9 4.6 10.4 11.8 52.5 13.7
Bihar 115 -- 1.7 5.2 12.2 13.9 62.6 4.3
Maharashtra 113 6.2 6.2 7.1 9.7 10.6 38.1 22.1
Tamil Nadu 103 -- 3.9 4.9 10.7 18.4 45.6 16.5
Uttar Pradesh 101 6.0 4.0 1.0 8.9 4.0 64.4 11.9

Traffic Crash Injuries and Disabilities: The Burden on Indian Society
A1.5 MARITAL STATUS OF VICTIMS AT THE TIME OF ROAD CRASH
Overall, about 7 out of 10 victims from both LIH and HIH category were married and rest were single. State-wise,
Marital status of the victim LIH HIH
N Married Single N Married Single
Overall 1647 69.7 30.3 432 74.1 25.9
Bihar 412 66.0 34.0 115 65.2 34.8
Maharashtra 415 63.6 36.4 113 72.6 27.4
Tamil Nadu 407 85.7 14.3 103 90.3 9.7
Uttar Pradesh 413 63.7 36.3 101 69.3 30.7
TABLE A5: MARITAL STATUS OF THE VICTIM AT THE TIME OF ROAD CRASH [All figures in %]
highest victims of Tamil Nadu were married while lowest were from Uttar Pradesh.
A2.1 ROAD TYPE WHERE CRASH HAPPENED
Road type wise, the maximum number of crashes occurred on city/ district/ municipality roads followed by national highways/ expressways
Category wise, 56 percent crashes among LIH and 64
percent crashes among HIH category occurred on city/ district/municipal roads.
Based on crashes reported, the proportion of death cases was higher on national highways/ state highways, while survival cases were higher on city/ district/ municipality roads, probably because of the speed of the vehicles.
A2 ROAD CRASH DETAILS
APPENDIX 3: RESPONDENT PROFILE (DEMOGRAPHIC & PROFESSIONAL) – LIH & HIH

180
Type of road on which crash happened
NNational Highway/
ExpresswayState
HighwayCity/ District/
Municipality roadsVillage road
LIH
Overall 1647 18.1 15.4 55.9 10.6
Bihar 412 25.3 17.8 41.1 15.8
Maharashtra 415 11.0 18.1 62.2 8.7
Tamil Nadu 407 13.5 13.9 70.6 2.0
Uttar Pradesh 413 24.0 13.5 42.3 20.2
HIH
Overall 432 17.4 14.4 63.9 4.3
Bihar 115 14.5 32.5 48.2 4.8
Maharashtra 113 19.5 3.4 69.0 8.0
Tamil Nadu 103 9.6 8.2 82.2 --
Uttar Pradesh 101 27.4 12.9 56.5 3.2
TABLE A6: ROAD TYPE WHERE CRASH HAPPENED [All figures in %]

Traffic Crash Injuries and Disabilities: The Burden on Indian Society
A2.2 VEHICLES INVOLVED IN THE CRASH
With respect to the type of vehicle involved in the crash, overall, about 6 out of 10 crashes happened while victims were riding motorized two-wheelers.
The higher proportion of LIH victims that were involved in the crash were using roads/highways as pedestrians (12.2%), followed by those who were using cars (7.4%) and bicycles (6.2%)
Among HIH category victims, after M2Ws one-fourth of crashes occurred when victims were using cars.
Victim vehicle type involved in crash
N M2W Car Bicycle 3W Pedestrian Others
LIH
Overall 1647 64.9 7.4 6.2 3.7 12.2 5.6
Bihar 412 51.9 3.2 10.2 8.0 18.2 8.5
Maharashtra 415 79.5 4.3 2.9 1.2 9.2 2.9
Tamil Nadu 407 66.1 17.2 3.4 1.2 8.4 3.7
Uttar Pradesh 413 62.0 5.1 8.2 4.4 13.1 7.3
HIH
Overall 432 66.0 25.9 0.9 2.1 3.7 1.3
Bihar 115 67.0 23.5 1.7 4.3 -- 3.5
Maharashtra 113 86.7 9.7 0.9 0.9 1.8 0.0
Tamil Nadu 103 47.6 44.7 -- 1.0 5.8 1.0
Uttar Pradesh 101 60.4 27.7 1.0 2.0 7.9 1.0
TABLE A7: TYPE OF VEHICLE INVOLVED IN CRASH – VICTIM VEHICLE [All figures in %]
APPENDIX 3: RESPONDENT PROFILE (DEMOGRAPHIC & PROFESSIONAL) – LIH & HIH

182
TABLE A8: TYPE OF VICTIM VEHICLE WISE IMPACT OF CRASH (SURVIVED) [All figures in %]
Also, impact of the crash (survived) was measured based on type of vehicle victims were using at the time of crashes. It was found that about 8 out of 10 victims survived when they were travelling in cars (79.5%) followed by motorized two wheelers users (75.3%).
Comparatively, the proportion of survived victims was low while they were traveling through non-motorized transport
– Bicycle (55%) and when they were using three-wheelers (47%).
Across LIH and HIH categories, lowest proportion of road victims survived while they was using road as pedestrian.
Victim vehicle type wise impact of crash (survived) Overall LIH Survived HIH Survived
N 2079 1647 432
Overall 68.8 63.9 87.5
Car 79.5 73.0 86.6
M2W (Motorcycle/ Scooter/ Scooty) 75.3 71.1 90.9
Bicycle 54.7 53.9 75.0
3W/ Cycle or Battery Rickshaw 47.1 41.0 88.9
Pedestrian 42.9 43.3 37.5
Others 41.8 39.1 83.3
Further, in terms of other offending vehicles involved in the crash, overall, slightly over one-fourth of victims from the LIH category were riding M2Ws, followed by truck/lorry/tractor and then car.
A higher proportion of trucks /lorries /tractors was involved in crashes in Bihar (28.9%) and Uttar Pradesh (27.8%), while M2Ws in Maharashtra (37.8%) and Cars in Tamil Nadu (29%).
Among HIH category respondents, about 32 percent were using M2Ws, followed by Cars (29.4%), trucks/ lorries/ tractors (12%). Car as another offending vehicle during the crash was mentioned by highest proportion of respondents in Bihar (24.3%), Tamil Nadu (28.2%), and Uttar Pradesh (37.6%), and M2W in Maharashtra (55.8%).

Traffic Crash Injuries and Disabilities: The Burden on Indian Society
Other offending vehicle involved in
crashN M2W
Truck/ lorry/
TractorCar None 3W
Bus/ Minibus
Taxi Others
LIH
Overall 1647 25.8 22.0 20.9 6.9 4.6 6.7 5.8 7.5
Bihar 412 20.6 28.9 11.2 9.2 10.4 3.9 5.3 10.4
Maharashtra 415 37.8 16.1 21.2 8.4 2.4 4.8 2.2 7.0
Tamil Nadu 407 21.4 15.0 29.0 4.9 3.7 11.1 14.7 0.2
Uttar Pradesh 413 23.2 27.8 22.5 4.8 1.7 7.0 1.2 11.6
HIH
Overall 432 31.7 12.0 29.4 1.9 10.4 5.1 7.6 1.9
Bihar 115 24.3 7.0 24.3 0.9 23.5 7.0 10.4 2.6
Maharashtra 113 55.8 6.2 28.3 4.4 1.8 0.9 0.9 1.8
Tamil Nadu 103 17.5 17.5 28.2 1.0 5.8 10.7 18.4 1.0
Uttar Pradesh 101 27.7 18.8 37.6 1.0 9.9 2.0 1.0 2.0
TABLE A9: TYPE OF VEHICLE INVOLVED IN THE CRASH – OTHER OFFENDING VEHICLE [All figures in %]
APPENDIX 3: RESPONDENT PROFILE (DEMOGRAPHIC & PROFESSIONAL) – LIH & HIH

184
TABLE A10: WAYS IN WHICH ROAD/ VEHICLE USED BY THE VICTIM [All figures in %]
A2.3 WAYS IN WHICH VEHICLE/ ROAD USED BY THE VICTIM AT THE TIME OF CRASH
Respondents were asked about the way in which victims were using vehicle/ road at the time of crash. Overall, higher proportion of victims were using roads while driving/ riding vehicle.
In terms of habitation, higher proportion of victims in urban areas were driving/ riding vehicles, while in the case of rural
areas higher proportion of victims were using the roads as passenger/ pillion rider or pedestrian.
Overall, from the LIH category, over two-third of victims were either driving/ riding the vehicle, one-fifth were using as passengers/ pillion riders, and about 12 percent as a pedestrian.
Similarly, among the HIH category, 8 out of 10 victims were using the road as driver/ rider while about one-sixth were using as passenger/ pillion riders.
Road/ vehicle usage as
LIH HIH
NDriver/ Rider
Passenger/ Pillion
Pedestrian NDriver/ Rider
Passenger/ Pillion
Pedestrian
Overall 1647 67.2 20.6 12.2 432 80.8 15.5 3.7
Bihar 412 52.2 29.6 18.2 115 75.7 24.3 --
Maharashtra 415 68.2 22.7 9.2 113 85.0 13.3 1.8
Tamil Nadu 407 83.8 7.9 8.4 103 84.5 9.7 5.8
Uttar Pradesh 413 64.9 22.0 13.1 101 78.2 13.9 7.9

Traffic Crash Injuries and Disabilities: The Burden on Indian Society
A3. RESPONDENT PROFILE
Out of all the respondents, about 42 percent were victims themselves while in 58 percent cases close family members were interviewed.
A3.1 RESPONDENTS POSITION IN HOUSEHOLD
Among both the categories, most of the respondents were either head of the households or chief wage earners. 28 percent LIH and 31 percent HIH respondents were other most affected members of the household.
Position in household
LIH HIH
N HoH CWE Other* N HoH CWE Other*
Overall 1647 45.7 26.3 28.1 432 33.6 35.2 31.3
Bihar 412 45.1 23.8 31.1 115 15.7 34.8 49.6
Maharashtra 415 48.7 20.0 31.3 113 54.0 21.2 24.8
Tamil Nadu 407 47.7 33.7 18.7 103 45.6 40.8 13.6
Uttar Pradesh 413 41.2 27.8 31.0 101 18.8 45.5 35.6
TABLE A11: RESPONDENTS POSITION IN HOUSEHOLD [All figures in %]
A3.2 GENDER WISE
Gender wise, one-fourth of respondents in LIH category were females while and one-third in HIH category were females. Highest proportion of females was covered in Tamil Nadu.
APPENDIX 3: RESPONDENT PROFILE (DEMOGRAPHIC & PROFESSIONAL) – LIH & HIH

186
Gender of respondentLIH HIH
N Male Female N Male Female
Overall 1647 74.5 25.5 432 66.9 33.1
Bihar 412 76.0 24.0 115 69.6 30.4
Maharashtra 415 78.6 21.4 113 73.5 26.5
Tamil Nadu 407 63.4 36.6 103 51.5 48.5
Uttar Pradesh 413 79.9 20.1 101 72.3 27.7
TABLE A12: GENDER OF RESPONDENTS
TABLE A13: AGE-GROUP OF RESPONDENTS
[All figures in %]
[All figures in %]
A3.3 AGE GROUP WISE
Age-group wise, most of the respondents were from the age-group of 26-35 years followed by 36-45 years across both the categories.
Age group N 18-25 yrs. 26-35 yrs. 36-45 yrs. 46-60 yrs. More than 60 yrs.
LIH
Overall 1647 18.5 36.0 25.5 17.0 3.0
Bihar 412 26.2 34.2 21.4 14.3 3.9
Maharashtra 415 21.4 34.7 25.1 15.4 3.4
Tamil Nadu 407 4.7 37.1 35.1 22.9 0.2
Uttar Pradesh 413 21.5 38.0 20.6 15.5 4.4
HIH
Overall 432 15.5 44.9 28.2 10.6 0.7
Bihar 115 27.8 57.4 12.2 2.6 --
Maharashtra 113 13.3 31.9 38.9 13.3 2.7
Tamil Nadu 103 5.8 41.7 39.8 12.6 --
Uttar Pradesh 101 13.9 48.5 22.8 14.9 --

Traffic Crash Injuries and Disabilities: The Burden on Indian Society
A3.4 EDUCATION WISE
Education wise, about 18 percent LIH respondents were educated till primary level followed by senior secondary level (17%) and secondary level (16%). While in case of HIH category, about two-third of respondents were graduate or above.
Highest Education of Respondent
NUp to
Primary Class
Middle school
Secondary school
Senior secondary
school Diploma
Graduate/ college and
above
Post-graduate/ University
LIH
Overall 1647 18.1 12.0 15.8 16.8 7.7 25.0 4.7
Bihar 412 26.9 12.6 15.5 19.4 5.1 20.1 0.2
Maharashtra 415 12.3 11.8 21 22.4 6.7 20.5 5.3
Tamil Nadu 407 4.2 7.1 9.1 9.8 16.5 45.2 8.1
Uttar Pradesh 413 28.8 16.2 17.7 15.3 2.4 14.5 5.1
HIH
Overall 432 0.7 2.5 3.9 10.4 11.3 56.0 15.0
Bihar 115 -- -- 6.1 11.3 15.7 63.5 3.5
Maharashtra 113 0.9 3.5 4.4 15.9 10.6 42.5 22.1
Tamil Nadu 103 -- 1.0 1.9 7.8 14.6 52.4 22.3
Uttar Pradesh 101 2.0 5.9 3.0 5.9 4.0 66.3 12.9
TABLE A14: EDUCATION OF RESPONDENTS [All figures in %]
APPENDIX 3: RESPONDENT PROFILE (DEMOGRAPHIC & PROFESSIONAL) – LIH & HIH

188
TABLE A15: OCCUPATION OF RESPONDENTS [All figures in %]
A3.5 OCCUPATION WISE
Occupation wise most of LIH respondents were labour (skilled/ unskilled)/ shop owners (27.5%) followed by salaried employees (Pvt./ Govt.) (27%), farmers/ agriculture laborer (20%).
Among HIH category, about 8 out of 10 respondents were either business/ self-employed or salaried employees (Pvt. Govt.).
Occupation of respondent
N Unemployed HousewifeFarmer/
Agri laborer
Unskilled/ skilled
worker/ shop owner
Businessmen/ self-employed
Salaried employee
(Pvt/ Govt)
Retired/ Student
LIH
Overall 1647 5.9 9.7 20.4 27.5 7.3 27.0 2.2
Bihar 412 8.7 9.0 18.0 29.4 6.3 25.7 2.9
Maharashtra 415 7.0 6.0 35.5 18.8 5.1 24.6 3.2
Tamil Nadu 407 1.2 14.3 3.6 26.2 11.8 42.5 0.2
Uttar Pradesh 413 6.5 9.7 24.2 35.6 6.3 15.3 2.4
HIH
Overall 432 3.0 10.9 1.2 -- 42.1 40.7 2.1
Bihar 115 6.1 5.2 1.7 -- 44.3 42.6 --
Maharashtra 113 3.5 8.0 -- -- 41.6 40.7 6.2
Tamil Nadu 103 -- 11.7 -- -- 26.2 62.1 --
Uttar Pradesh 101 2.0 19.8 3.0 -- 56.4 16.8 2.0

Traffic Crash Injuries and Disabilities: The Burden on Indian Society
A3.6 BPL STATUS OF HOUSEHOLD
The BPL status of the household was recorded based on the reporting of the respondents. However, cases where respondents were not aware of the same, BPL status was determined based on monthly household income and
number of members in household. Households having per capita income below Rs.2,163 were considered as BPL. Based on above, during survey a little higher than half of respondents (53.1%) were covered from BPL households while remaining were from non-BPL.
BPL status of victim household N Yes No
Overall 1647 53.1 46.9
Bihar 412 65.3 34.7
Maharashtra 415 40.2 59.8
Tamil Nadu 407 51.1 48.9
Uttar Pradesh 413 55.7 44.3
TABLE A16: BPL STATUS OF LIH HOUSEHOLDS [All figures in %]
APPENDIX 3: RESPONDENT PROFILE (DEMOGRAPHIC & PROFESSIONAL) – LIH & HIH

190
TABLE A17: AVERAGE HOUSEHOLD SIZE (MEAN VALUE)
A3.7 AVERAGE HOUSEHOLD SIZE
The average household size of respondents in LIH segment was 5.6 which consisted 3.8 adult members (above 18 years of age) and 1.8 members below 18 years of age.
The median values of no. of adult members was 3, number of members below 18 years was 2 and total members in household was 5.
Average household size (Mean value)
NNo. of adult members above 18 yrs. of age
No. of members below 18 yrs. of age
Total members
LIH
Overall 1647 3.8 1.8 5.6
Bihar 412 4.2 2.3 6.4
Maharashtra 415 3.8 1.3 5.1
Tamil Nadu 407 3.1 1.1 4.2
Uttar Pradesh 413 4.2 2.4 6.6
HIH
Overall 432 3.4 1.4 4.8
Bihar 115 3.6 2.0 5.6
Maharashtra 113 3.1 1.0 4.1
Tamil Nadu 103 3.1 1.1 4.2
Uttar Pradesh 101 3.7 1.4 5.1

Traffic Crash Injuries and Disabilities: The Burden on Indian Society
TABLE B2: AGE-GROUP OF TRUCK DRIVERS
TABLE B1: SAMPLE COVERAGE
[All figures in %]
The truck drivers were interviewed across Bihar, Maharashtra, Tamil Nadu and Uttar Pradesh to understand their awareness about MVAA and Motor third party liability insurance, compensation and experience of road crashes. The respondents selected for the interview were truck drivers of Medium Motor Vehicles, Heavy Motor Vehicles and Trailers. This section contains demographic and professional profile of truck drivers.
B1. DEMOGRAPHIC PROFILE OF TRUCK DRIVERS
A total sample of 420 truck drivers was covered in 4 states: each state containing about one-fourth of respondents.
Sample coverage N Percentage
Overall 420 --
Bihar 101 24%
Maharashtra 113 27%
Tamil Nadu 100 24%
Uttar Pradesh 106 25%
B1.1 AGE-GROUP WISE
Age group-wise, overall, 46 percent drivers were in the age group of 26-40 years, while close to 3 out of 10 drivers were in the age group of 36-45 years.
Age Group N 18-25 yrs. 26-35 yrs. 36-45 yrs. 46-60 yrs. > 60 yrs.
Overall 420 8.6 45.5 31.9 13.3 0.7
Bihar 101 9.9 69.3 19.8 1.0 --
Maharashtra 113 6.2 46.9 31.0 15.0 0.9
Tamil Nadu 100 -- 30.0 49.0 21.0 --
Uttar Pradesh 106 17.9 35.8 28.3 16.0 1.9
APPENDIX 4: RESPONDENT PROFILE (DEMOGRAPHIC & PROFESSIONAL) – TRUCK DRIVERS

192
B1.2 EDUCATIONAL QUALIFICATION WISE
Educational qualification wise, overall 36 percent of truck drivers were educated up to secondary level followed by middle level (29%), senior secondary level (15%). Very few were educated above senior secondary level. More than 43 percent of truck drivers have not passed class 10th.
Education qualification
N IlliterateNot completed
primary Up to
Class 5th
Up to Class 8th
Up to Class 10th
Up to Class 12th
DiplomaGraduate &
above
Overall 420 3.1 1.0 9.8 29.3 36.2 14.8 1.4 4.5
Bihar 101 0.0 0.0 4.0 25.7 51.5 13.9 0.0 5.0
Maharashtra 113 1.8 1.8 15.0 32.7 33.6 12.4 1.8 0.9
Tamil Nadu 100 0.0 0.0 3.0 38.0 34.0 13.0 3.0 9.0
Uttar Pradesh 106 10.4 1.9 16.0 20.8 26.4 19.8 0.9 3.8
TABLE B3: EDUCATIONAL QUALIFICATION OF TRUCK DRIVERS [All figures in %]
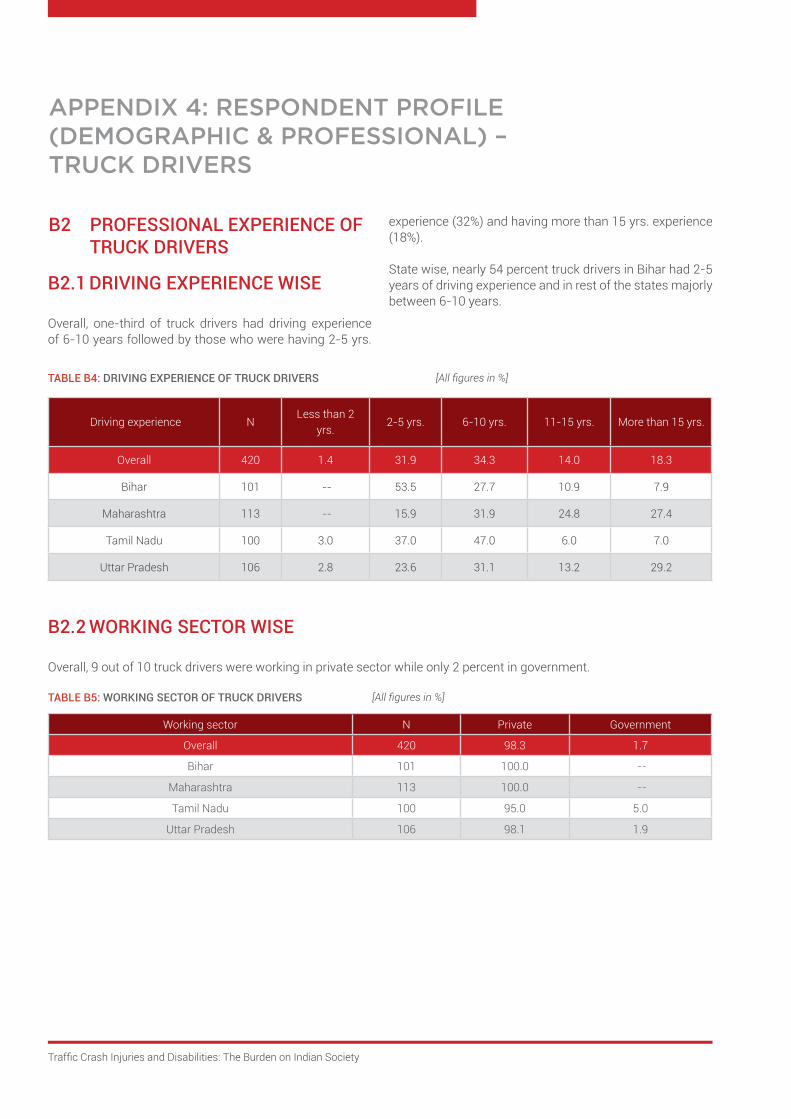
Traffic Crash Injuries and Disabilities: The Burden on Indian Society
B2 PROFESSIONAL EXPERIENCE OF TRUCK DRIVERS
experience (32%) and having more than 15 yrs. experience (18%).
State wise, nearly 54 percent truck drivers in Bihar had 2-5 years of driving experience and in rest of the states majorly between 6-10 years.
Driving experience NLess than 2
yrs.2-5 yrs. 6-10 yrs. 11-15 yrs. More than 15 yrs.
Overall 420 1.4 31.9 34.3 14.0 18.3
Bihar 101 -- 53.5 27.7 10.9 7.9
Maharashtra 113 -- 15.9 31.9 24.8 27.4
Tamil Nadu 100 3.0 37.0 47.0 6.0 7.0
Uttar Pradesh 106 2.8 23.6 31.1 13.2 29.2
TABLE B4: DRIVING EXPERIENCE OF TRUCK DRIVERS
TABLE B5: WORKING SECTOR OF TRUCK DRIVERS
[All figures in %]
[All figures in %]
B2.2 WORKING SECTOR WISE
Overall, 9 out of 10 truck drivers were working in private sector while only 2 percent in government.
Working sector N Private Government
Overall 420 98.3 1.7
Bihar 101 100.0 --
Maharashtra 113 100.0 --
Tamil Nadu 100 95.0 5.0
Uttar Pradesh 106 98.1 1.9
B2.1 DRIVING EXPERIENCE WISE
Overall, one-third of truck drivers had driving experience of 6-10 years followed by those who were having 2-5 yrs.
APPENDIX 4: RESPONDENT PROFILE (DEMOGRAPHIC & PROFESSIONAL) – TRUCK DRIVERS

194
B2.3 VEHICLE OWNERSHIP TYPE
Overall, 8 out of 10 trucks were owned by fleet owners/ company while about 12 percent were self-owned trucks.
State wise, majorly trucks were owned by fleet owners except Tamil Nadu where about one-fourth truck drivers have their own trucks.
Vehicle ownership N Self-Owned Owned by fleet owner/ company
Overall 420 12.4 87.6
Bihar 101 3.0 97.0
Maharashtra 113 16.8 83.2
Tamil Nadu 100 26.0 74.0
Uttar Pradesh 106 3.8 96.2
TABLE B6: VEHICLE OWNERSHIP WISE
TABLE B7: INCOME FROM TRUCK DRIVING PROFESSION
[All figures in %]
[All figures in %]
B2.4 INCOME FROM TRUCK DRIVING PROFESSION
Overall, nearly 47 percent truck drivers had an income of Rs.10,000- Rs. 20,000, followed by 29 percent having from
Rs.20,000 to Rs.30,000.
State wise, major proportion of truck drivers’ income was in between Rs. 10,000 to Rs. 20,000.
Income from truck driving profession
NRs. 5,001 to
10,000Rs. 10,001 to
20,000Rs. 20,001 to
30,000Rs. 30,001 to
50,000Rs. 50,001 to
75,000
Overall 420 12.9 47.1 29.3 8.1 2.6
Bihar 101 2.0 46.5 46.5 5.0 --
Maharashtra 113 25.7 46.9 22.1 3.5 1.8
Tamil Nadu 100 3.0 33.0 33.0 22.0 9.0
Uttar Pradesh 106 18.9 61.3 17.0 2.8 --

Traffic Crash Injuries and Disabilities: The Burden on Indian Society
TABLE B8: STRUCTURE OF MONTHLY BENEFITS OF TRUCK DRIVERS
TABLE B9: SETTLEMENT OF PENALTIES
[All figures in %]
[All figures in %]
B2.5 STRUCTURE OF MONTHLY BENEFITS
Overall, 6 out of 10 truck drivers were paid on monthly basis and rest 31 percent on trip basis. Only 8 percent truck drivers were paid on the basis of driving hours.
Across states, over half the truck drivers were paid on monthly basis, except Tamil Nadu where 54 percent truck drivers were paid trip wise and 24 percent based on driving hours.
Structure of monthly benefits N Monthly Salary Trip wise Number of Driving Hours
Overall 420 61.2 30.7 8.1
Bihar 101 87.1 7.9 5.0
Maharashtra 113 76.1 23.0 0.9
Tamil Nadu 100 22.0 54.0 24.0
Uttar Pradesh 106 57.5 38.7 3.8
B2.6 SETTLEMENT OF PENALTIES
Overall, more than three-fourth truck drivers confirmed that the settlement of penalties was done by the owner or company, 13 percent truck drivers settled penalties by
themselves and 11 percent drivers shared by both driver and owner.
State wise, majority of truck drivers mentioned that the settlement of penalties was done by their owner/ company.
Settlement of penalties NOwner/ Company
pays for itSettled by the driver from his
salaryShared by both driver and
owner
Overall 420 76.7 12.9 10.5
Bihar 101 74.3 9.9 15.8
Maharashtra 113 57.5 27.4 15.0
Tamil Nadu 100 91.0 5.0 4.0
Uttar Pradesh 106 85.8 7.5 6.6
APPENDIX 4: RESPONDENT PROFILE (DEMOGRAPHIC & PROFESSIONAL) – TRUCK DRIVERS

196
B2.7 DRIVING SCHEDULE (PER DAY AND PER MONTH)
Overall, truck drivers drive 9.9 hours per day and 22.1 days a month. State wise, truck drivers in Uttar Pradesh drive maximum 11 hours a day followed by Bihar.
In terms of driving per month, Maharashtra truck drivers drive about 24 days a month followed by Uttar Pradesh. Least driving schedule (per day and per month) was recorded for truck drivers of Tamil Nadu.
Driving schedule Avg. hours’ drive/ day Avg. days’ work/ month
Overall 9.9 22.1
Bihar 10.0 21.8
Maharashtra 9.4 24.1
Tamil Nadu 9.1 20.0
Uttar Pradesh 11.0 22.3
TABLE B10: VEHICLE OWNERSHIP
TABLE B11: TYPE OF TRUCK CATEGORY
[N=420, All figures in mean]
[All figures in mean]
B2.8 TYPE OF TRUCK WISE
Truck type wise, overall, about half of the truck drivers covered were driving heavy motor vehicles (exceed 12
tons) while about 45 percent were driving medium motor/ good vehicles (between 7.5-12 tons).
Across states, at-least half of the truck drivers were driving heavy motor vehicle expect Bihar where such proportion was about 42.6 percent.
Type of truck category NMedium Motor Vehicle (B/w
7.5-12 tons)Heavy Motor Vehicle
(Exceed 12 tons)Trailer
Overall 420 45.7 50.2 4.0
Bihar 101 56.4 42.6 1.0
Maharashtra 113 40.7 50.4 8.8
Tamil Nadu 100 43.0 57.0 --
Uttar Pradesh 106 43.4 50.9 5.7
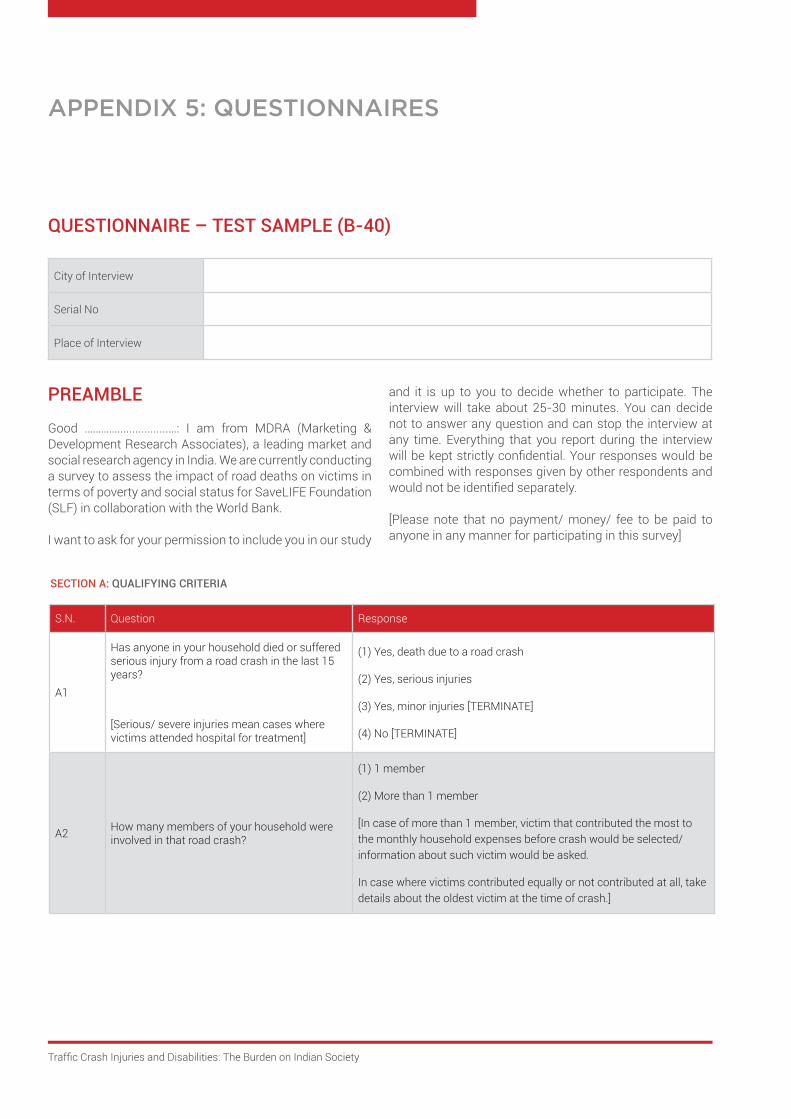
Traffic Crash Injuries and Disabilities: The Burden on Indian Society
S.N. Question Response
A1
Has anyone in your household died or suffered serious injury from a road crash in the last 15 years?
[Serious/ severe injuries mean cases where victims attended hospital for treatment]
(1) Yes, death due to a road crash
(2) Yes, serious injuries
(3) Yes, minor injuries [TERMINATE]
(4) No [TERMINATE]
A2 How many members of your household were involved in that road crash?
(1) 1 member
(2) More than 1 member
[In case of more than 1 member, victim that contributed the most to the monthly household expenses before crash would be selected/ information about such victim would be asked.
In case where victims contributed equally or not contributed at all, take details about the oldest victim at the time of crash.]
QUESTIONNAIRE – TEST SAMPLE (B-40)
PREAMBLE
Good ………….................…: I am from MDRA (Marketing & Development Research Associates), a leading market and social research agency in India. We are currently conducting a survey to assess the impact of road deaths on victims in terms of poverty and social status for SaveLIFE Foundation (SLF) in collaboration with the World Bank.
I want to ask for your permission to include you in our study
SECTION A: QUALIFYING CRITERIA
APPENDIX 5: QUESTIONNAIRES
City of Interview
Serial No
Place of Interview
and it is up to you to decide whether to participate. The interview will take about 25-30 minutes. You can decide not to answer any question and can stop the interview at any time. Everything that you report during the interview will be kept strictly confidential. Your responses would be combined with responses given by other respondents and would not be identified separately.
[Please note that no payment/ money/ fee to be paid to anyone in any manner for participating in this survey]

198
A3Did road crash victim (as selected in A2) involve in more than 1 crash in last 15 years where serious/ severe injuries were sustained.
(1) Yes
(2) No
[If Yes, information about the latest crash would be taken]
A4What was the impact of the road crash on the victim?
(1) Died at the scene
(2) Died while being transported to hospital
(3) Taken to hospital & discharged within 24 hrs.
(4) Had to be admitted in the hospital for more than 1 day
(5) Died in hospital within 30 days from the crash
(6) Died after 30 days from the crash
A5 When did the road crash happen?
(1) Before Jan 2005 [TERMINATE]
(2) Between Jan 2005 - July 2019 [CONTINUE]
(3) After July 2019 [TERMINATE]
A6 Crash victim’s relation with respondent
(1) Self [GO TO A8]
(2) Parent/ Grand parent
(3) Son/ Daughter
(4) Uncle/ Aunt
(5) Nephew/ Niece
(6) Spouse
(7) Sibling
(8) Father/ Mother-in-law
(9) Brother/ Sister-in-law
(10) Son/ Daughter-in law
(11) Others (specify): _____________________
A7Did you use to live with the victim when the road crash happened?
(1) Yes [CONTINUE]
(2) No [TERMINATE]
A8
How do you term yourself in your household?
[A group of people staying together under the same roof and sharing food from a common kitchen is called a Household. Persons living in hostels or messes and taking food from a common kitchen do not constitute a household.]
(1) Head of the Household
[HoH is the person (either male or female) that takes key decision in the household]
(2) Chief Wage Earner
[Chief wage earner is the person (either male or female) who contributes the most to the household expenses]
(3) Other most affected member of the household
[Member of the household that was most impacted due to crash after HoH and CWE]

Traffic Crash Injuries and Disabilities: The Burden on Indian Society
A9What was your age when the road crash happened?
(1) Less than 14 yrs. [TERMINATE]
(2) More than 14 yrs. [CONTINUE]
A10Please provide following information about your household members (as on 31 Jan 2020).
Number
1 Number of adult members above 18 yrs. of age
2 Number of members below 18 yrs. of age
3 Total household members
A11
Income: Please look at this card and tell me which income group best indicates Total Monthly Household Income. [SHOW CARD] (as on 31 Jan 2020).
[Please include all the income/ receipts of every member of the household from all sources such as job, profession, wages, rent, pension, gratuity, etc.]
(1) Up to Rs. 5,000
(2) Rs. 5,001 to Rs. 10,000
(3) Rs. 10,001 to Rs. 20,000
(4) Rs. 20,001 to Rs. 30,000
(5) Rs. 30,001 to Rs. 50,000
(6) Rs. 50,001 to Rs. 75,000
(7) Rs. 75,001 to Rs. 1,00,000
(8) More than Rs. 1,00,000
A12
Based on the table provided in the annexure, is respondent eligible for the survey?
[Use the table provided at the end to check the eligibility of the respondent for the survey]
(1) Yes [CONTINUE]
(2) No [TERMINATE]
A13
Is your household a BPL household?
[Use the table provided at the end to check and validate the BPL status of household]
(1) Yes
(2) No
APPENDIX 5: QUESTIONNAIRES

200
SECTION B: RESPONDENT PROFILE
S.N. Question Response
B1 Respondent Name
B2 Phone Number
B3 Address
B4 City
B5 State
(1) Bihar (2) Maharashtra (3) Tamil Nadu (4) Uttar Pradesh
B6 Location of habitation(1) Urban(2) Rural
B7 Gender(1) Male (2) Female
B8 What was your age on last birthday? Mention age: _____________ years.
B9 Highest Education of Respondent
(1) Illiterate(2) Literate with no formal education(3) Did not complete primary education (4) Primary school (up to Class 5th) (5) Middle school (up to Class 8th)(6) Secondary school (up to Class 10th)(7) Senior secondary school (up to Class 12th)(8) Diploma(9) Graduate/college and above(10) Postgraduate/ University(11) Other (Specify): ____________________
B10 Occupation of respondent (1) Unemployed(2) Housewife(3) Agricultural Laborer(4) Other Laborer(5) Farmer(6) Unskilled worker(7) Petty trader/ shop owner (8) Skilled worker(9) Businessmen/ self-employed (10) Salaried employee (Pvt/ Govt)(11) Retired(12) Other (Specify): ________________

Traffic Crash Injuries and Disabilities: The Burden on Indian Society
SECTION C: ROAD CRASH DETAILS
S.N. Question Response
C1When did road crash happen? (Mention date, month and year)
___________________ [DD/MM/YYYY]
C2 Where did the road crash happen? City/ location Name: _________________
C3Type of city/ location where road crash happened
(1) Within the city of victim residence
(2) Other city
C4 Type of road on which crash happened
(1) Expressway
(2) National Highway
(3) State Highway
(4) City/ District/ Municipality roads
(5) Village road
(6) Other (specify): _____________________
C5
Type of vehicles involved in the road crash [MENTION CODE]
[POST CODES]
Personal vehicles
(1) M2W - Motorcycle/ Scooter/ Scooty
(2) Car
(3) Bicycle
Commercial vehicles
(4) Taxi
(5) Three-wheeler/ Cycle-Rickshaw/ Battery Rickshaw
(6) Bus/ Minibus
(7) Truck/ lorry/ Tractor
Others
(8) Pedestrian
(9) None
(10) DK/ CS
(11) Others (specify): _______________________
(1) Victim vehicle: _____________________
(2) Other offending vehicle: ______________
APPENDIX 5: QUESTIONNAIRES

202
C6 In which way victim was using vehicle/ road at the time of crash.
(1) Driver/ Rider
(2) Passenger/ Pillion
(3) Pedestrian
(4) Others: __________________
C7Which vehicle was at fault at the time of the road crash?
(1) Victim’s vehicle /vehicle in which victim was travelling
(2) Other vehicle
(3) DK/CS
C8 Was the victim wearing helmet or seatbelt during the road crash?
(1) Yes, wearing helmet [2 wheeler users]
(2) Yes, wearing seatbelt [4 wheeler users]
(3) Not wearing helmet/ seatbelt
(4) Not applicable
C9How was the victim transferred to the hospital?
(1) Ambulance
(2) Police vehicle
(3) Private vehicle
(4) Public vehicle (auto/ taxi/ etc.)
(5) Not transferred to hospital [GO TO C19]
(6) DK/CS
(7) Others (specify): _________________
C10 [IF RESPONSE IS 1] Approx. time from crash ambulance took to arrive at crash location?
(1) Within 15 minutes
(2) 16-30 mins
(3) 31-45 mins
(4) Beyond 45 mins
(4) DK/CS
C11 Which hospital was the victim taken to?
(1) Govt.
(2) Private
(3) Others (specify): ____________
C12 Was the victim admitted to the hospital? (1) Yes
(2) No
(3) DK/CS
C13[IF YES] How long did victim had to stay in hospital?
_______________________________days

Traffic Crash Injuries and Disabilities: The Burden on Indian Society
C14On reaching hospital, how long it took before a doctor/ nurse attended to the injury?
(1) Immediately on reaching hospital
(2) Within 10-30 mins
(3) 31-60 mins
(4) Beyond 60 mins
(5) DK/ CS
C15Did the victim face any discrimination or prejudice by hospital officials/ staff?
(1) Yes
(2) No
(3) DK/CS
C16
[IF YES], What kind of harassment/ prejudice did the victim/ attendant/ family face? [RECORD VERBATIM]
______________________________________________________________________________________________
______________________________________________________________________________________________
POSTCODES
(1) Victim was not attended immediately at hospital
(2) Asked to wait for police before attending victim
(3) Made excuses and asked to take the victim to other hospital
(4) Denied admission of victim to the hospital
(5) Asked for money for treatment
(6) Others (specify): ___________________________________
C17
Among your acquaintances/ friends/ relatives, does anybody work as a medical/ first aid staff at a medical facility or hospital?
(1) Yes
(2) No [GO TO C19]
C18Were they of any help during the treatment of the victim?
(1) Yes
(2) No
C19 Was this road crash reported to the police?
(1) Yes
(2) No
(3) DK/CS
C20 Was a FIR filed after the road crash?
(1) Yes
(2) No
(3) DK/CS
C21[IF YES TO C20] Were the police officials helpful/ cooperative during the process?
(1) Yes
(2) No
(3) DK/CS
APPENDIX 5: QUESTIONNAIRES

204
C22
[IF NO TO C20] What were the reasons for not filing FIR? [RECORD VERBATIM]
______________________________________________________________________________________________
______________________________________________________________________________________________
______________________________________________________________________________________________
POSTCODES
(1) Was afraid of police harassment
(2) Did not want to get into legal hassles
(3) Fear of being asked to pay bribe
(4) Did not feel need of filing FIR
(5) Police official declined to file FIR
(6) Others (specify): ___________________________________
C23
Did you/ your family or offending vehicle user file any case under Motor Accident Claims Tribunal (MACT) after the road crash?
(1) Yes
(2) No [GO TO C27]
(3) DK/CS [GO TO NEXT SECTION D]
C24Did you/ your family members have to visit court for hearings?
(1) Yes, Mention how many times: _________
(2) No
(3) DK/CS
C25 Did you spend any money on litigation?
(1) Yes
(2) No
(3) DK/CS
C26 Is the case still ongoing in the courts?(1) Yes
(2) No
[IF NO TO C23], what were the reasons for not filing case? [RECORD VERBATIM]
______________________________________________________________________________________________
______________________________________________________________________________________________
______________________________________________________________________________________________
(1) Out of court settlement was done
(2) Unable to hire/ afford lawyer/ fee
(3) Did not want to get into legal hassles
(4) Did not feel need of filing case
(5) To avoid work/ study loss due to court hearings
(6) Others (specify): ___________________________________

Traffic Crash Injuries and Disabilities: The Burden on Indian Society
SECTION D: ROAD CRASH VICTIM PROFILE
S.N. Question Response
ASK D1-D3 IF RESPONDENT IS OTHER THAN ROAD CRASH VICTIM
D1 Gender of the road crash victim(1) Male
(2) Female
D2 Age of victim at the time of road crash Mention age: _____________ years.
D3 Highest Education of victim at the time of road crash
(1) Illiterate(2) Literate with no formal education(3) Did not complete primary education (4) Primary school (up to Class 5th) (5) Middle school (up to Class 8th)(6) Secondary school (up to Class 10th)(7) Senior secondary school (up to Class 12th)(8) Diploma(9) Graduate/college and above(10) Postgraduate/ University(11) Other (Specify): ____________________
D4 Marital status of the victim at the time of road crash(1) Married
(2) Single (Unmarried/ separated/ divorced/ wid-owed)
D5 Was the victim earning member of the household before road crash?(1) Yes(2) No [GO TO D7]
D6Was the victim chief wage-earning member [the person who contrib-uted maximum to the household monthly expenses] of the household before road crash?
(1) Yes
(2) No
D7 Did the victim survive after road crash?(1) Yes survived [GO TO D11](2) No, died due to road crash [GO TO D8]
D8What was the monthly income of victim before road crash? [SHOW CARD & MENTION CODE]
(1) Not earning
(2) Up to Rs. 5,000
(3) Rs. 5,001 to Rs. 10,000
(4) Rs. 10,001 to Rs. 20,000
(5) Rs. 20,001 to Rs. 30,000
(6) Rs. 30,001 to Rs. 50,000
(7) Rs. 50,001 to Rs. 75,000
(8) Rs. 75,001 to Rs. 1,00,000
(9) More than Rs. 1,00,000
APPENDIX 5: QUESTIONNAIRES

206
D9What was the approx. monthly contribution of victim in household total income before road crash?
_________________________%
D10
What was the occupation of victim before road crash? [MENTION CODE]
Pre-crash occupation: ________________
[POST CODES]
(1) Unemployed
(2) Housewife
(3) Agricultural Laborer
(4) Other Laborer
(5) Farmer
(6) Unskilled worker
(7) Petty trader/ shop owner
(8) Skilled worker
(9) Businessmen/ self-employed
(10) Salaried employee (Pvt/ Govt)
(11) Retired
(12) Student
(13) Other (Specify): _________
ASK IF ROAD Crash VICTIM SURVIVED, ELSE GO TO NEXT SECTION
D11
Pre-crash, post-crash & current monthly income of road crash victim [SHOW CARD & MENTION CODE]
[POST CODES](1) Not earning(2) Up to Rs. 5,000(3) Rs. 5,001 to Rs. 10,000(4) Rs. 10,001 to Rs. 20,000(5) Rs. 20,001 to Rs. 30,000(6) Rs. 30,001 to Rs. 50,000(7) Rs. 50,001 to Rs. 75,000(8) Rs. 75,001 to Rs. 1,00,000(9) More than Rs. 1,00,000
(1) Pre crash: Rs. __________________/ month
(2) On resuming work after crash: Rs. ________________________/ month
(3) Current (as on 31 Jan 2020): Rs. ______________________/ month
D12What was the monthly contribution of victim in household total in-come?
(1) Pre crash: _______________________%
(2) On resuming work after crash: ____________%
(3) Current (as on 31 Jan 2020): ___________%
D13Pre-crash, post-crash and current occupation of road crash victim. [TAKE CODES FROM D10]
(1) Pre crash: _________________________(2) On resuming work after crash: ________(3) Current (as on 31 Jan 2020): ___________
D14Did the road crash victim return to his previous occupation/ school on resuming work after crash?
(1) Yes
(2) No [GO TO D16]
D15After how many days road crash victim returned to his regular work/ school?
_________________ days

Traffic Crash Injuries and Disabilities: The Burden on Indian Society
D16 IF NOT RETURNED TO PREVIOUS OCCUPATION, how many days did it take to find a new job from the day of crash?
(1) _________________ days
(2) NA
D17On resuming work after crash, did victim maintain the same salary/ wage as it was before the crash?
(1) Yes, almost the same (2) No, lower than previous(3) NA
D18 Whether the victim underwent any sort of disability? (1) Yes
(2) No [GO TO D22]
(3) DK/CS [GO TO D22]
D19Whether the victim requires ongoing mobility assistance (e.g. wheelchair, walking frame, etc.)
(1) Yes(2) No (3) DK/CS
D20 What was the severity of crash victim disability? (1) Serious disability (Traumatic Brain Injury, ampu-tation, quadriplegic, etc.)
(2) Partial disability (some functional loss but still can-do regular work) [GO TO D22]
(3) Temporary disability; recovered [GO TO D22]
D21 What type of serious disability did victim sustain?
(1) Para/ Quadriplegia(2) Acquired Brain Injury(3) Amputation of a limb (e.g. hand/foot/arm/leg)(4) Permanent Blindness(5) Severe burns(6) Others (specify): ______________________
D22 Majorly, who took care of the victim after the crash? (1) Male member of the family
(2) Female member of the family
(3) Self
(4) Anyone else (specify) _________________
D23 Majorly, who bought all the medicines to the recovering victim?
(1) Male member of the family(2) Female member of the family(3) Self(4) Anyone else (specify) _________________
D24 Majorly, who cooked all the meals in the household and took care of the daily needs of the victim?
(1) Male member of the family
(2) Female member of the family
(3) Self
(4) Anyone else (specify) _________________
D25Who accompanied the victim to the hospital/ doctor most of the time?
(1) Male member of the family(2) Female member of the family(3) None(4) Anyone else (specify) _________________
APPENDIX 5: QUESTIONNAIRES

208
SECTION E: ROAD CRASH VICTIM PROFILE
SECTION F: FINANCIAL/ SOCIAL IMPACT FOR THE HOUSEHOLD
S.N. Question Response
E1 Has any member of household suffered from depression (cue: feeling low/ sad without any reason) due to impact of the road crash?
(1) Yes(2) No(3) DK/CS
E2 Has any household member developed any health issues/ complica-tions due to the aforesaid road crash?
(1) Yes
(2) No
(3) DK/CS
E3[IF YES] Has suffering member of the household taken medical (doctor) consultation in this regard?
(1) Yes(2) No(3) DK/CS
E4 Has there been any change in the sleep pattern of any member of household since the road crash?
(1) Yes, difficulty in sleeping
(2) Sometimes; difficulty in sleeping
(3) No, sleep well
E5Has there been any change in dietary habits/ food intake of any family member post the road crash?
(1) Yes(2) No(3) DK/CS
F1 As a result of road crash, what were the key impacts on your household
A Financial impact
1 Decline in total income of household (1) Yes (2) No (3) DK/CS
2 Out of pocket expenses increased due to medical treatment (1) Yes (2) No (3) DK/CS
3 Had to sell/ mortgage some family assets (e.g. property, jewelry, vehicle, etc.)
(1) Yes (2) No (3) DK/CS
4 Had to borrow money (from anyone) (1) Yes (2) No (3) DK/CS
5 Had to relocate for treatment for more than 30 days (1) Yes (2) No (3) DK/CS
6 Any household member had to relocate permanently (1) Yes (2) No (3) DK/CS

Traffic Crash Injuries and Disabilities: The Burden on Indian Society
B Occupational impact
7 Change in working pattern of household members (1) Yes (2) No (3) DK/CS
8 Someone in household had to take up additional jobs/shifts (1) Yes (2) No (3) DK/CS
9 Someone in household had to give up study (1) Yes (2) No (3) DK/CS
C Social impact
10 Living standard has decreased (1) Yes (2) No (3) DK/CS
11 Victim had to be accompanied by someone (1) Yes (2) No (3) DK/CS
12 Food consumption has decreased (1) Yes (2) No (3) DK/CS
F2If survived, how many months did victim take for recovery (fit for work) after road crash?
____________________ months
Impact of road crash consequences on household w.r.t?
1 Decline in household income (1) Severe (2) Moderate (3) None
2 Living standard has decreased (1) Severe (2) Moderate (3) None
3 Food consumption has decreased (1) Severe (2) Moderate (3) None
4 Emotional impact on household (1) Severe (2) Moderate (3) None
SECTION G: INSURANCE & COMPENSATION W.R.T THE VICTIM
S.N. Question Response
G1Was the vehicle in/ on which victim was traveling insured at the time of road crash?
(1) Yes(2) No(3) DK/CS(4) Not Applicable
G2 [IF YES] Which type of MOTOR VEHICLE insurance? (1) Third party insurance (Liability)
(2) Comprehensive insurance
(3) DK/ CS
(4) Others (specify): _____________________
APPENDIX 5: QUESTIONNAIRES

210
G3Was the other vehicle (colliding vehicle) involved in the crash insured?
(1) Yes, insured(2) No, uninsured(3) Hit and run case(4) DK/CS
G4 Was the victim covered under MEDICAL INSURANCE at the time of road crash?
(1) Yes
(2) No
(3) DK/CS
G5 Was the victim covered under LIFE INSURANCE at the time of road crash?
(1) Yes(2) No(3) DK/CS
G6 Did you/ your household member claim insurance after the road crash? [MULTIPLE RESPONSE POSSIBLE]
(1) Yes, Motor vehicle insurance(2) Yes, Medical insurance(3) Yes, Life insurance(4) None (5) DK/CS
G7Were you/ victim aware of compensation clauses and schemes in the event of a road crash?
(1) Yes(2) No(3) DK/CS
G8 Type of schemes availed/ got compensation under the following
Authority Availed Received eligible/ promised compensation
Compensation received in (after crash)
1Government/ local authorities (ex-gratia)
(1) Yes(2) No [GO TO G8.2]
(1) Yes(2) No [GO TO G8.2]
_________ months
2 Motor vehicle insurance (1) Yes
(2) No [GO TO G8.3]
(1) Yes
(2) No [GO TO G8.3]
_________ months
3 Medical insurance(1) Yes(2) No [GO TO G8.4]
(1) Yes(2) No [GO TO G8.4]
_________ months
4 Life insurance (1) Yes
(2) No [GO TO G9]
(1) Yes
(2) No [GO TO G9]
_________ months
G9Did victim/ nominee claiming compensation had to attend court?
(1) Yes(2) No(3) Not Applicable(4) DK/CS
G10 Did victim/ nominee face any hurdles/ difficulties in ac-cessing the compensation money?
(1) Yes
(2) No
(3) Not Applicable
(4) DK/CS

Traffic Crash Injuries and Disabilities: The Burden on Indian Society
Loss of income/ expenditure due to road crash and recovery
Particular Total loss of income/ expenditure
[Mention amount]
Proportion of amount recovered/ due to be recovered from insurances
Loss of income during the period of treatment including victim and family members income (members that attending victim)
Rs. ________________ ____________%
Loss of property/ vehicle etc. due to road crash Rs. ________________ ____________%
Out of pocket expenses on treatment of victim including hospitalization, medicine, and related expenses
Rs. ________________ ____________%
Legal/ administrative/ compensation expenses including police, lawyer, etc.
Rs. ________________ ____________%
Compensation cost to other vehicle/ person involved in crash
Rs. ________________ ____________%
Other expenses (specify): ______________________________ Rs. ________________ ____________%
What did you do/ get to cope up with the financial burden due to road crash?
Arranged a loan (lenders, bank, relatives, etc.)
(1) Yes (2) No Amount borrowed: Rs. ___________________
Sold/ mortgage assets (land, jewelry, motor vehicle etc.)
(1) Yes (2) No Amount received: Rs. _______________________
Took on extra work by household members
(1) Yes (2) No Monthly extra earning: Rs. ________________
Compensation from insurance com-pany (including vehicle/ life insur-ance, etc.)
(1) Yes (2) No Total amount: Rs. ________________________
Received compensation under schemes (govt., local authorities, funeral expenses, etc.)
(1) Yes (2) No Total amount: Rs. ________________________
Received compensation from em-ployer
(1) Yes (2) No Total amount: Rs. ________________________
Dependent was provided job by employer/ govt.
(1) Yes (2) No Monthly income: Rs. _____________________
Received compensation from other party involved in road crash
(1) Yes (2) No Total amount: Rs. ________________________
APPENDIX 5: QUESTIONNAIRES

212
Others (specify): ________________ (1) Yes (2) No Total Amount: Rs. ________________________
Was any major financial investment made on victim within 1 year prior to crash that could not be recovered? [e.g. Education fees/ donation, busi-ness set-up, organ transplant, etc.]
(1) Yes (2) No Total investment: Rs. ____________________
G14If road crash victim died due to road crash, how much expenses incurred on the funeral?
Total expense Rs. _______________________
G15 Did the insurance cover any of the funeral expenses?(1) Yes [What percentage: _________%](2) No
G16Please provide following details about household [where victim survived]
Before crash(Rs.)
On resuming work after crash (Rs.)
Current (as on 31 Jan 2020)(Rs.)
1
Average total monthly HOUSEHOLD INCOME from all sources (Approx.) [Please include all the income/ receipts of every member of household from all sources such as job, profession, wages, rent, pension, gratuity, etc.]
____________ ____________ ____________
2 Average total monthly household expenses on all items (Approx.)
____________ ____________ ____________
3 Total number of members in the household ____________ ____________ ____________
SECTION H: PERCEPTIONS OF RESPONDENT ON ROAD SAFETY
S.N. Question Response
H1According to you what is the level of impact of road crashes on the society?
(1) Severe
(2) Major
(3) Moderate
(4) Minor
(5) Insignificant
H2 Do you feel safe while commuting on the roads? (1) Always
(2) Mostly
(3) Sometimes
(4) Rarely
(5) Never
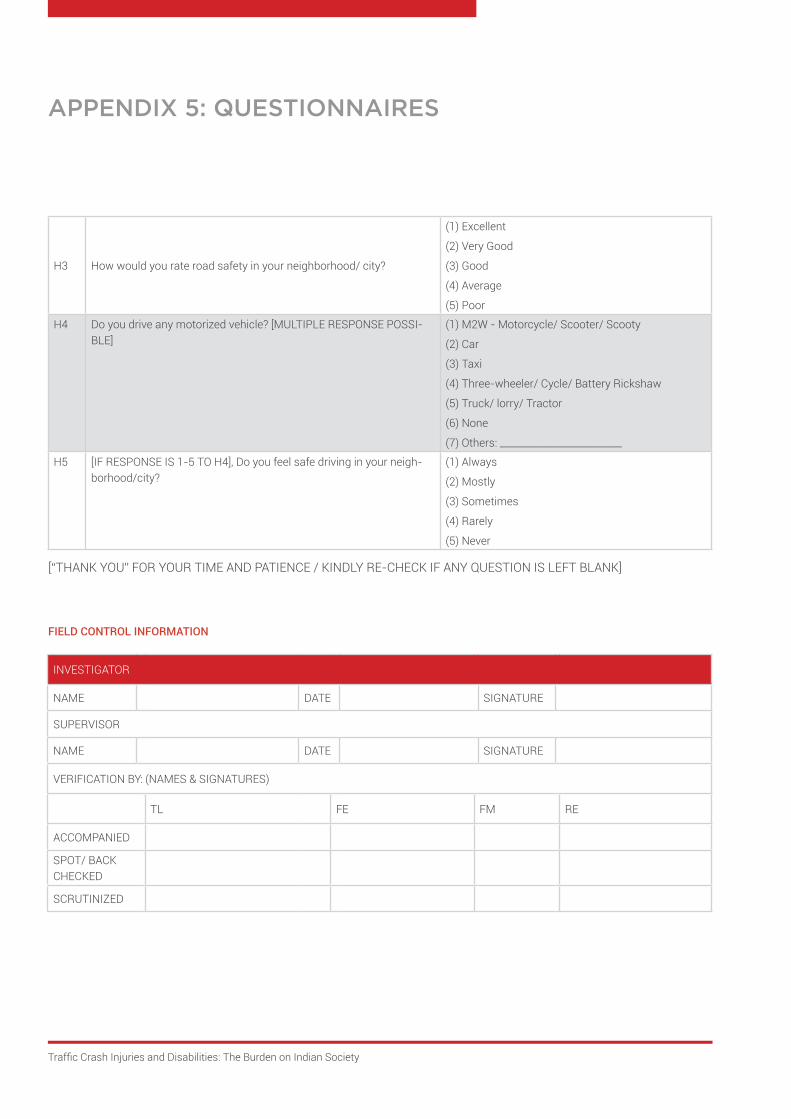
Traffic Crash Injuries and Disabilities: The Burden on Indian Society
FIELD CONTROL INFORMATION
[“THANK YOU” FOR YOUR TIME AND PATIENCE / KINDLY RE-CHECK IF ANY QUESTION IS LEFT BLANK]
INVESTIGATOR
NAME DATE SIGNATURE
SUPERVISOR
NAME DATE SIGNATURE
VERIFICATION BY: (NAMES & SIGNATURES)
TL FE FM RE
ACCOMPANIED
SPOT/ BACK CHECKED
SCRUTINIZED
H3 How would you rate road safety in your neighborhood/ city?
(1) Excellent
(2) Very Good
(3) Good
(4) Average
(5) Poor
H4 Do you drive any motorized vehicle? [MULTIPLE RESPONSE POSSI-BLE]
(1) M2W - Motorcycle/ Scooter/ Scooty
(2) Car
(3) Taxi
(4) Three-wheeler/ Cycle/ Battery Rickshaw
(5) Truck/ lorry/ Tractor
(6) None
(7) Others: _________________________
H5 [IF RESPONSE IS 1-5 TO H4], Do you feel safe driving in your neigh-borhood/city?
(1) Always
(2) Mostly
(3) Sometimes
(4) Rarely
(5) Never
APPENDIX 5: QUESTIONNAIRES

214
[SELECTION CRITERIA FOR TEST SAMPLE & BPL STATUS]
Use the following table to check the eligibility of respondent for the survey based on
- Monthly Household Income (MHI)
- Number of adult members in household.
Consider the highest value of the range of the coded response of A11 and number of adult members as per A10.1 to check eligibility. If the total MHI is below the eligibility range, provide response in A12 and proceed.
Total number of adult members in household
Monthly Household Income A13. BPL household having MHI below
1 Up to Rs.13,500 Up to Rs.2,163
2 Up to Rs.27,000 Up to Rs.4,326
3 Up to Rs.40,500 Up to Rs.6,489
4 Up to Rs.54,000 Up to Rs.8,652
5 Up to Rs.67,500 Up to Rs.10,815
6 Up to Rs.81,000 Up to Rs.12,978
7 Up to Rs.94,500 Up to Rs.15,141
8 Up to Rs.1,08,000 Up to Rs.17,304
9 Up to Rs.1,21,500 Up to Rs.19,467
10 Up to Rs.1,35,000 Up to Rs.21,630

Traffic Crash Injuries and Disabilities: The Burden on Indian Society
SECTION A: QUALIFYING CRITERIA
S.N. Question Response
A1
Has anyone in your household died or suffered serious injury from a road crash in the last 15 years?
[Serious/ severe injuries mean cases where victims attended hospital for treatment]
(1) Yes, death due to a road crash
(2) Yes, serious injuries
(3) Yes, minor injuries [TERMINATE]
(4) No [TERMINATE]
A2 How many members of your household were involved in that road crash?
(1) 1 member
(2) More than 1 member
[In case of more than 1 member, victim that contributed the most to the monthly household expenses before crash would be selected/ information about such victim would be asked.
In case where victims contributed equally or not contributed at all, take details about the oldest victim at the time of crash.]
QUESTIONNAIRE – CONTROL SAMPLE (T-10)
PREAMBLE
Good ……….....……: I am from MDRA (Marketing & Development Research Associates), a leading market and social research agency in India. We are currently conducting a survey to assess the impact of road deaths on victims in terms of poverty and social status for SaveLIFE Foundation (SLF) in collaboration with the World Bank.
I want to ask for your permission to include you in our study
City of Interview
Serial No
Place of Interview
and it is up to you to decide whether to participate. The interview will take about 25-30 minutes. You can decide not to answer any question and can stop the interview at any time. Everything that you report during the interview will be kept strictly confidential. Your responses would be combined with responses given by other respondents and would not be identified separately.
[Please note that no payment/ money/ fee to be paid to anyone in any manner for participating in this survey]
APPENDIX 5: QUESTIONNAIRES
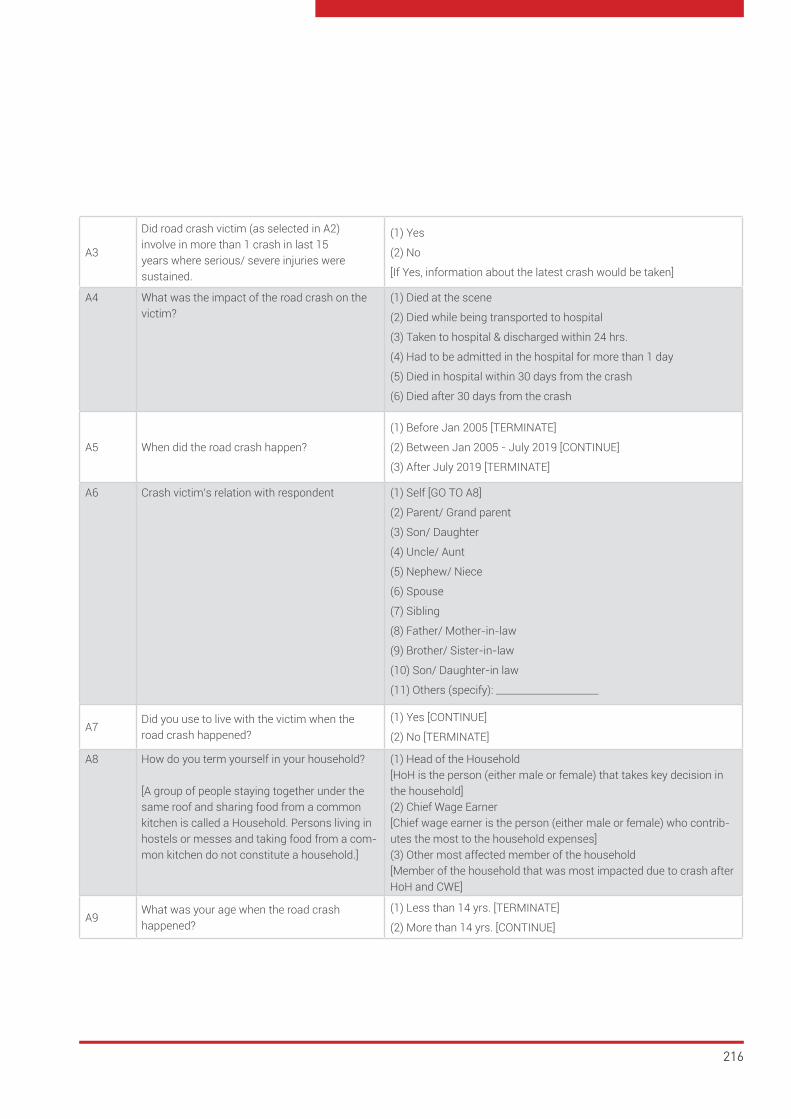
216
A3
Did road crash victim (as selected in A2) involve in more than 1 crash in last 15 years where serious/ severe injuries were sustained.
(1) Yes
(2) No
[If Yes, information about the latest crash would be taken]
A4 What was the impact of the road crash on the victim?
(1) Died at the scene
(2) Died while being transported to hospital
(3) Taken to hospital & discharged within 24 hrs.
(4) Had to be admitted in the hospital for more than 1 day
(5) Died in hospital within 30 days from the crash
(6) Died after 30 days from the crash
A5 When did the road crash happen?
(1) Before Jan 2005 [TERMINATE]
(2) Between Jan 2005 - July 2019 [CONTINUE]
(3) After July 2019 [TERMINATE]
A6 Crash victim’s relation with respondent (1) Self [GO TO A8]
(2) Parent/ Grand parent
(3) Son/ Daughter
(4) Uncle/ Aunt
(5) Nephew/ Niece
(6) Spouse
(7) Sibling
(8) Father/ Mother-in-law
(9) Brother/ Sister-in-law
(10) Son/ Daughter-in law
(11) Others (specify): _____________________
A7Did you use to live with the victim when the road crash happened?
(1) Yes [CONTINUE]
(2) No [TERMINATE]
A8 How do you term yourself in your household?
[A group of people staying together under the same roof and sharing food from a common kitchen is called a Household. Persons living in hostels or messes and taking food from a com-mon kitchen do not constitute a household.]
(1) Head of the Household [HoH is the person (either male or female) that takes key decision in the household](2) Chief Wage Earner [Chief wage earner is the person (either male or female) who contrib-utes the most to the household expenses](3) Other most affected member of the household [Member of the household that was most impacted due to crash after HoH and CWE]
A9What was your age when the road crash happened?
(1) Less than 14 yrs. [TERMINATE]
(2) More than 14 yrs. [CONTINUE]

Traffic Crash Injuries and Disabilities: The Burden on Indian Society
A10Please provide following information about your household members (as on 31 Jan 2020).
Number
1Number of adult members above 18 yrs. of age
2 Number of members below 18 yrs. of age
3 Total household members
A11 Income: Please look at this card and tell me which income group best indicates Total Monthly Household Income. [SHOW CARD] (as on 31 Jan 2020).
[Please include all the income/ receipts of every member of the household from all sources such as job, profession, wages, rent, pension, gratuity, etc.]
(1) Less than Rs.50 thousand [TERMINATE]
(2) Rs.50 thousand to Rs.1 Lakh
(3) Rs.1 Lakh to Rs.2 Lakh
(4) Rs.2 Lakh to Rs.4 Lakh
(5) Rs.4 Lakh to Rs.6 Lakh
(6) Rs.6 Lakh to Rs.10 Lakh
(7) Rs.10 Lakh to Rs.15 Lakh
(8) More than Rs.15 Lakh
A12
Based on the table provided in the annexure, is respondent eligible for the survey?
[Use the table provided at the end to check the eligibility of the respondent for the survey]
(1) Yes [CONTINUE]
(2) No [TERMINATE]
SECTION B: RESPONDENT PROFILE
S.N. Question Response
B1 Respondent Name
B2 Phone Number
B3 Address
B4 City
B5 State (1) Bihar
(2) Maharashtra
(3) Tamil Nadu
(4) Uttar Pradesh
APPENDIX 5: QUESTIONNAIRES

218
SECTION C: ROAD CRASH DETAILS
B6 Location of habitation (1) Urban
(2) Rural
B7 Gender (1) Male
(2) Female
B8 What was your age on last birthday? Mention age: _____________ years.
B9 Highest Education of Respondent (1) Illiterate
(2) Literate with no formal education
(3) Did not complete primary education
(4) Primary school (up to Class 5th)
(5) Middle school (up to Class 8th)
(6) Secondary school (up to Class 10th)
(7) Senior secondary school (up to Class 12th)
(8) Diploma
(9) Graduate/college and above
(10) Postgraduate/ University
(11) Other (Specify): ____________________
B10 Occupation of respondent (1) Unemployed
(2) Housewife
(3) Farmer
(4) Businessmen/ trader/ self-employed
(5) Salaried employee (Pvt/ Govt)
(6) Retired
(7) Other (Specify): ________________
S.N. Question Response
C1When did road crash happen? (Mention date, month and year)
___________________ [DD/MM/YYYY]
C2 Where did the road crash happen? City/ location Name: _________________
C3Type of city/ location where road crash happened
(1) Within the city of victim residence(2) Other city
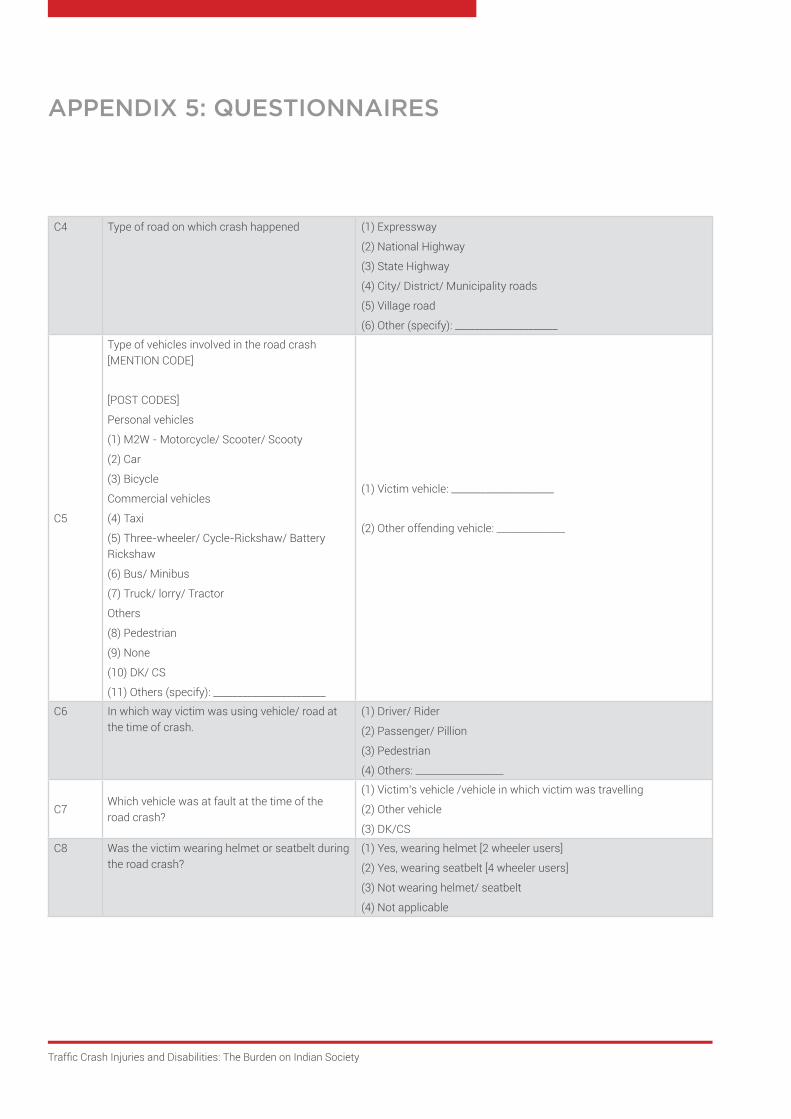
Traffic Crash Injuries and Disabilities: The Burden on Indian Society
C4 Type of road on which crash happened (1) Expressway
(2) National Highway
(3) State Highway
(4) City/ District/ Municipality roads
(5) Village road
(6) Other (specify): _____________________
C5
Type of vehicles involved in the road crash [MENTION CODE]
[POST CODES]
Personal vehicles
(1) M2W - Motorcycle/ Scooter/ Scooty
(2) Car
(3) Bicycle
Commercial vehicles
(4) Taxi
(5) Three-wheeler/ Cycle-Rickshaw/ Battery Rickshaw
(6) Bus/ Minibus
(7) Truck/ lorry/ Tractor
Others
(8) Pedestrian
(9) None
(10) DK/ CS
(11) Others (specify): _______________________
(1) Victim vehicle: _____________________
(2) Other offending vehicle: ______________
C6 In which way victim was using vehicle/ road at the time of crash.
(1) Driver/ Rider
(2) Passenger/ Pillion
(3) Pedestrian
(4) Others: __________________
C7Which vehicle was at fault at the time of the road crash?
(1) Victim’s vehicle /vehicle in which victim was travelling
(2) Other vehicle
(3) DK/CS
C8 Was the victim wearing helmet or seatbelt during the road crash?
(1) Yes, wearing helmet [2 wheeler users]
(2) Yes, wearing seatbelt [4 wheeler users]
(3) Not wearing helmet/ seatbelt
(4) Not applicable
APPENDIX 5: QUESTIONNAIRES

220
C9 How was the victim transferred to the hospital?
(1) Ambulance
(2) Police vehicle
(3) Private vehicle
(4) Public vehicle (auto/ taxi/ etc.)
(5) Not transferred to hospital [GO TO C19]
(6) DK/CS
(7) Others (specify): _________________
C10[IF RESPONSE IS 1] Approx. time from crash ambulance took to arrive at crash location?
(1) Within 15 minutes
(2) 16-30 mins
(3) 31-45 mins
(4) Beyond 45 mins
(4) DK/CS
C11 Which hospital was the victim taken to?
(1) Govt.
(2) Private
(3) Others (specify): ____________
C12 Was the victim admitted to the hospital?
(1) Yes
(2) No
(3) DK/CS
C13[IF YES] How long did victim had to stay in hospital?
____________________ days
C14On reaching hospital, how long it took before a doctor/ nurse attended to the injury?
(1) Immediately on reaching hospital
(2) Within 10-30 mins
(3) 31-60 mins
(4) Beyond 60 mins
(5) DK/ CS
C15Did the victim face any discrimination or prejudice by hospital officials/ staff?
(1) Yes
(2) No
(3) DK/CS

Traffic Crash Injuries and Disabilities: The Burden on Indian Society
C16 [IF YES], What kind of harassment/ prejudice did the victim/ attendant/ family face? [RECORD VERBATIM]
_______________________________________________________________________________________________________________________
_______________________________________________________________________________________________________________________
_______________________________________________________________________________________________________________________
POSTCODES
(1) Victim was not attended immediately at hospital
(2) Asked to wait for police before attending victim
(3) Made excuses and asked to take the victim to other hospital
(4) Denied admission of victim to the hospital
(5) Asked for money for treatment
(6) Others (specify): ___________________________________
C17Among your acquaintances/ friends/ relatives, does anybody work as a medical/ first aid staff at a medical facility or hospital?
(1) Yes
(2) No [GO TO C19]
C18 Were they of any help during the treatment of the victim?
(1) Yes(2) No
C19 Was this road crash reported to the police?
(1) Yes
(2) No
(3) DK/CS
C20 Was a FIR filed after the road crash? (1) Yes
(2) No
(3) DK/CS
C21[IF YES TO C20] Were the police officials helpful/ cooperative during the process?
(1) Yes
(2) No
(3) DK/CS
C22 [IF NO TO C20] What were the reasons for not filing FIR? [RECORD VERBATIM]
_______________________________________________________________________________________________________________________
_______________________________________________________________________________________________________________________
_______________________________________________________________________________________________________________________
POSTCODES
(1) Was afraid of police harassment
(2) Did not want to get into legal hassles
(3) Fear of being asked to pay bribe
(4) Did not feel need of filing FIR
(5) Police official declined to file FIR
(6) Others (specify): ___________________________________
APPENDIX 5: QUESTIONNAIRES

222
C23Did you/ your family or offending vehicle user file any case under Motor Accident Claims Tribunal (MCAT) after the road crash?
(1) Yes
(2) No [GO TO C27]
(3) DK/CS [GO TO NEXT SECTION D]
C24Did you/ your family members have to visit court for hearings?
(1) Yes, Mention how many times: _________
(2) No
(3) DK/CS
C25 Did you spend any money on litigation?
(1) Yes
(2) No
(3) DK/CS
C26 Is the case still ongoing in the courts?(1) Yes
(2) No
[IF NO TO C23], what were the reasons for not filing case? [RECORD VERBATIM]
_____________________________________________________________________________________________________________________
_____________________________________________________________________________________________________________________
_____________________________________________________________________________________________________________________
(1) Out of court settlement was done
(2) Unable to hire/ afford lawyer/ fee
(3) Did not want to get into legal hassles
(4) Did not feel need of filing case
(5) To avoid work/ study loss due to court hearings
(6) Others (specify): ___________________________________
SECTION D: ROAD CRASH VICTIM PROFILE
S.N. Question Response
ASK D1-D3 IF RESPONDENT IS OTHER THAN ROAD CRASH VICTIM
D1 Gender of the road crash victim(1) Male
(2) Female
D2 Age of victim at the time of road crash Mention age: _____________ years.

Traffic Crash Injuries and Disabilities: The Burden on Indian Society
D3Highest Education of victim at the time of road crash
(1) Illiterate
(2) Literate with no formal education
(3) Did not complete primary education
(4) Primary school (up to Class 5th)
(5) Middle school (up to Class 8th)
(6) Secondary school (up to Class 10th)
(7) Senior secondary school (up to Class 12th)
(8) Diploma
(9) Graduate/college and above
(10) Postgraduate/ University
(11) Other (Specify): ____________________
D4Marital status of the victim at the time of road crash
(1) Married
(2) Single (Unmarried/ separated/ divorced/ widowed)
D5Was the victim earning member of the household before road crash?
(1) Yes
(2) No [GO TO D7]
D6
Was the victim chief wage-earning member [the person who contributed maximum to the household monthly expenses] of the household before road crash?
(1) Yes
(2) No
D7 Did the victim survive after road crash?(1) Yes survived [GO TO D11]
(2) No, died due to road crash [GO TO D8]
D8What was the monthly income of victim before road crash? [SHOW CARD & MENTION CODE]
(1) Not earning
(2) Up to Rs.50,000
(3) Rs.50,000 to Rs.1 Lakh
(4) Rs.1 Lakh to Rs.2 Lakh
(5) Rs.2 Lakh to Rs.4 Lakh
(6) Rs.4 Lakh to Rs.6 Lakh
(7) Rs.6 Lakh to Rs.10 Lakh
(8) Rs.10 Lakh to Rs.15 Lakh
(9) More than Rs.15 Lakh
D9What was the approx. monthly contribution of victim in household total income before road crash?
_________________________%
APPENDIX 5: QUESTIONNAIRES

224
D10
What was the occupation of victim before road crash? [MENTION CODE]
[POST CODES]
(1) Unemployed
(2) Housewife
(3) Farmer
(4) Businessmen/ trader/ self-employed
(5) Salaried employee (Pvt/ Govt)
(6) Retired
(7) Student
(8) Other (Specify): ________________
Pre-crash occupation: ________________
ASK IF ROAD Crash VICTIM SURVIVED, ELSE GO TO NEXT SECTION
D11
Pre-crash, post-crash & current monthly income of road crash victim [SHOW CARD & MENTION CODE]
[POST CODES]
(1) Not earning
(2) Up to Rs.50,000
(3) Rs.50,000 to Rs.1 Lakh
(4) Rs.1 Lakh to Rs.2 Lakh
(5) Rs.2 Lakh to Rs.4 Lakh
(6) Rs.4 Lakh to Rs.6 Lakh
(7) Rs.6 Lakh to Rs.10 Lakh
(8) Rs.10 Lakh to Rs.15 Lakh
(9) More than Rs.15 Lakh
(1) Pre crash: Rs. __________________/ month
(2) On resuming work after crash: Rs. ______/ month
(3) Current (as on 31 Jan 2020): Rs. _____/ month
D12What was the monthly contribution of victim in household total income?
(1) Pre crash: _______________________%
(2) On resuming work after crash: _______%
(3) Current (as on 31 Jan 2020): ___________%
D13Pre-crash, post-crash and current occupation of road crash victim. [TAKE CODES FROM D10]
(1) Pre crash: _________________________
(2) On resuming work after crash: ________
(3) Current (as on 31 Jan 2020): ___________

Traffic Crash Injuries and Disabilities: The Burden on Indian Society
D14Did the road crash victim return to his previous occupation/ school on resuming work after crash?
(1) Yes
(2) No [GO TO D16]
D15After how many days road crash victim returned to his regular work/ school?
_________________ days
D16IF NOT RETURNED TO PREVIOUS OCCUPATION, how many days did it take to find a new job from the day of crash?
(1) _________________ days
(2) NA
D17On resuming work after crash, did victim maintain the same salary/ wage as it was before the crash?
(1) Yes, almost the same
(2) No, lower than previous
(3) NA
D18 Whether the victim underwent any sort of disabil-ity?
(1) Yes
(2) No [GO TO D22]
(3) DK/CS [GO TO D22]
D19Whether the victim requires ongoing mobility assistance (e.g. wheelchair, walking frame, etc.)
(1) Yes
(2) No
(3) DK/CS
D20 What was the severity of crash victim disability?
(1) Serious disability (Traumatic Brain Injury, amputation, quadriple-gic, etc.)
(2) Partial disability (some functional loss but still can-do regular work) [GO TO D22]
(3) Temporary disability; recovered [GO TO D22]
D21 What type of serious disability did victim sustain?
(1) Para/ Quadriplegia
(2) Acquired Brain Injury
(3) Amputation of a limb (e.g. hand/foot/arm/leg)
(4) Permanent Blindness
(5) Severe burns
(6) Others (specify): ______________________
D22Majorly, who took care of the victim after the crash?
(1) Male member of the family
(2) Female member of the family
(3) Self
(4) Anyone else (specify) _________________
APPENDIX 5: QUESTIONNAIRES

226
D23Majorly, who bought all the medicines and administered medicines to the recovering victim?
(1) Male member of the family
(2) Female member of the family
(3) Self
(4) Anyone else (specify) _________________
D24Majorly, who cooked all the meals in the household and took care of the daily needs of the victim?
(1) Male member of the family
(2) Female member of the family
(3) Self
(4) Anyone else (specify) _________________
D25Who accompanied the victim to the hospital/ doctor most of the time?
(1) Male member of the family
(2) Female member of the family
(3) None
(4) Anyone else (specify) _________________
SECTION E: PSYCHOLOGICAL/ EMOTIONAL IMPACT ON HOUSEHOLD
S.N. Question Response
E1Has any member of household suffered from depression (cue: feeling low/ sad without any reason) due to impact of the road crash?
(1) Yes
(2) No
(3) DK/CS
E2Has any household member developed any health issues/ complications due to the aforesaid road crash?
(1) Yes
(2) No
(3) DK/CS
E3[IF YES] Has suffering member of the household taken medical (doctor) consultation in this regard?
(1) Yes
(2) No
(3) DK/CS
E4Has there been any change in the sleep pattern of any member of household since the road crash?
(1) Yes, difficulty in sleeping
(2) Sometimes; difficulty in sleeping
(3) No, sleep well
E5Has there been any change in dietary habits/ food intake of any family member post the road crash?
(1) Yes
(2) No
(3) DK/CS

Traffic Crash Injuries and Disabilities: The Burden on Indian Society
SECTION F: FINANCIAL/ SOCIAL IMPACT FOR THE HOUSEHOLD
F1 As a result of road crash, what were the key impacts on your household
A Financial impact
1 Decline in total income of household (1) Yes (2) No (3) DK/CS
2Out of pocket expenses increased due to medical treatment
(1) Yes (2) No (3) DK/CS
3Had to sell/ mortgage some family assets (e.g. property, jewelry, vehicle, etc.)
(1) Yes (2) No (3) DK/CS
4 Had to borrow money (from anyone) (1) Yes (2) No (3) DK/CS
5 Had to relocate for treatment for more than 30 days (1) Yes (2) No (3) DK/CS
6Any household member had to relocate permanently
(1) Yes (2) No (3) DK/CS
B Occupational impact
7 Change in working pattern of household members (1) Yes (2) No (3) DK/CS
8Someone in household had to take up additional jobs/shifts
(1) Yes (2) No (3) DK/CS
9 Someone in household had to give up study (1) Yes (2) No (3) DK/CS
C Social impact
10 Living standard has decreased (1) Yes (2) No (3) DK/CS
11 Victim had to be accompanied by someone (1) Yes (2) No (3) DK/CS
12 Food consumption has decreased (1) Yes (2) No (3) DK/CS
F2If survived, how many months did victim take for recovery (fit for work) after road crash?
____________________ months
APPENDIX 5: QUESTIONNAIRES

228
SECTION G: INSURANCE & COMPENSATION W.R.T THE VICTIM
Impact of road crash consequences on household w.r.t?
1 Decline in household income (1) Severe (2) Moderate (3) None
2 Living standard has decreased (1) Severe (2) Moderate (3) None
3 Food consumption has decreased (1) Severe (2) Moderate (3) None
4 Emotional impact on household (1) Severe (2) Moderate (3) None
S.N. Question Response
G1Was the vehicle in/ on which victim was traveling insured at the time of road crash?
(1) Yes
(2) No
(3) DK/CS
(4) Not Applicable
G2 [IF YES] Which type of MOTOR VEHICLE insurance?
(1) Third party insurance (Liability)
(2) Comprehensive insurance
(3) DK/ CS
(4) Others (specify): _____________________
G3Was the other vehicle (colliding vehicle) involved in the crash insured?
(1) Yes, insured
(2) No, uninsured
(3) Hit and run case
(4) DK/CS
G4Was the victim covered under MEDICAL INSURANCE at the time of road crash?
(1) Yes
(2) No
(3) DK/CS
G5Was the victim covered under LIFE INSURANCE at the time of road crash?
(1) Yes
(2) No
(3) DK/CS

Traffic Crash Injuries and Disabilities: The Burden on Indian Society
G6Did you/ your household member claim insurance after the road crash? [MULTIPLE RESPONSE POSSIBLE]
(1) Yes, Motor vehicle insurance
(2) Yes, Medical insurance
(3) Yes, Life insurance
(4) None
(5) DK/CS
G7Were you/ victim aware of compensation clauses and schemes in the event of a road crash?
(1) Yes
(2) No
(3) DK/CS
G8 Type of schemes availed/ got compensation under the following
Authority AvailedReceived eligible/ promised compensation
Compensation received in (after crash)
1Government/ local authorities (ex-gratia)
(1) Yes
(2) No [GO TO G8.2]
(1) Yes
(2) No [GO TO G8.2]_________ months
2 Motor vehicle insurance(1) Yes
(2) No [GO TO G8.3]
(1) Yes
(2) No [GO TO G8.3]_________ months
3 Medical insurance(1) Yes
(2) No [GO TO G8.4]
(1) Yes
(2) No [GO TO G8.4]_________ months
4 Life insurance(1) Yes
(2) No [GO TO G9]
(1) Yes
(2) No [GO TO G9]_________ months
G9Did victim/ nominee claiming compensation had to attend court?
(1) Yes
(2) No
(3) Not Applicable
(4) DK/CS
G10Did victim/ nominee face any hurdles/ difficulties in accessing the compensation money?
(1) Yes
(2) No
(3) Not Applicable
(4) DK/CS
G11 Loss of income/ expenditure due to road crash and recovery
APPENDIX 5: QUESTIONNAIRES
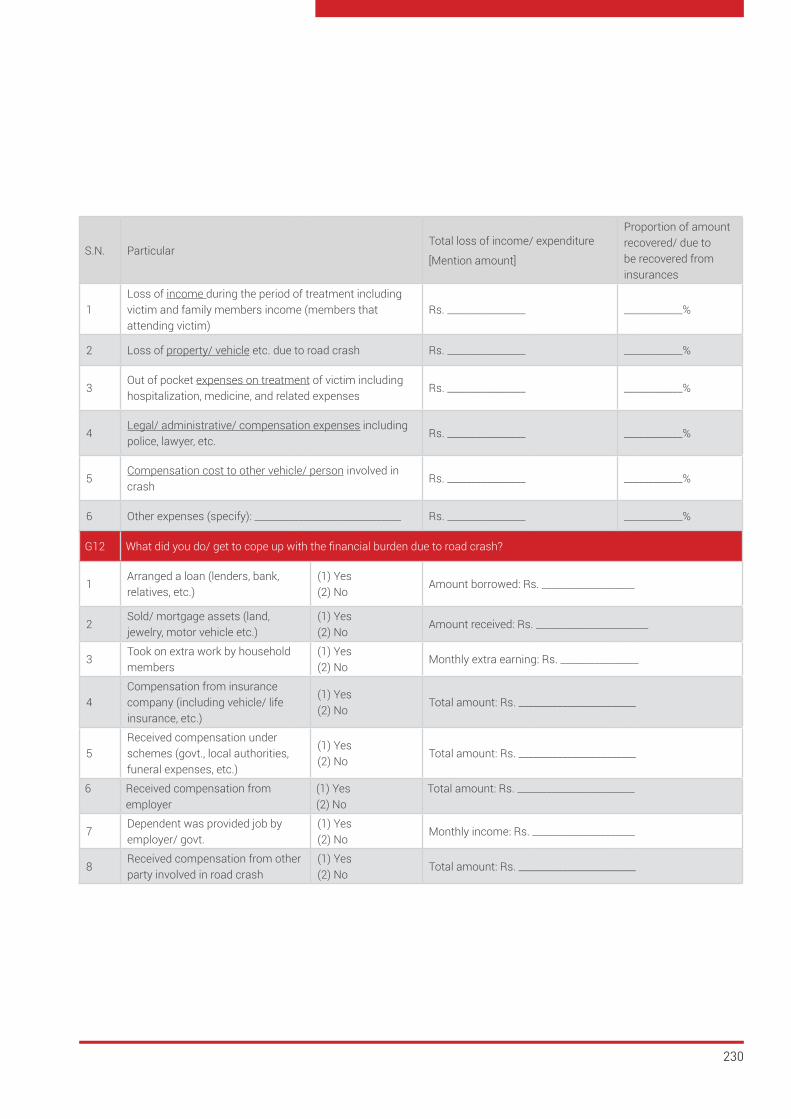
230
S.N. ParticularTotal loss of income/ expenditure
[Mention amount]
Proportion of amount recovered/ due to be recovered from insurances
1Loss of income during the period of treatment including victim and family members income (members that attending victim)
Rs. ________________ ____________%
2 Loss of property/ vehicle etc. due to road crash Rs. ________________ ____________%
3Out of pocket expenses on treatment of victim including hospitalization, medicine, and related expenses
Rs. ________________ ____________%
4Legal/ administrative/ compensation expenses including police, lawyer, etc.
Rs. ________________ ____________%
5Compensation cost to other vehicle/ person involved in crash
Rs. ________________ ____________%
6 Other expenses (specify): ______________________________ Rs. ________________ ____________%
G12 What did you do/ get to cope up with the financial burden due to road crash?
1Arranged a loan (lenders, bank, relatives, etc.)
(1) Yes (2) No
Amount borrowed: Rs. ___________________
2Sold/ mortgage assets (land, jewelry, motor vehicle etc.)
(1) Yes (2) No
Amount received: Rs. _______________________
3Took on extra work by household members
(1) Yes (2) No
Monthly extra earning: Rs. ________________
4Compensation from insurance company (including vehicle/ life insurance, etc.)
(1) Yes (2) No
Total amount: Rs. ________________________
5Received compensation under schemes (govt., local authorities, funeral expenses, etc.)
(1) Yes (2) No
Total amount: Rs. ________________________
6 Received compensation from employer
(1) Yes (2) No
Total amount: Rs. ________________________
7Dependent was provided job by employer/ govt.
(1) Yes (2) No
Monthly income: Rs. _____________________
8Received compensation from other party involved in road crash
(1) Yes (2) No
Total amount: Rs. ________________________

Traffic Crash Injuries and Disabilities: The Burden on Indian Society
9 Others (specify): ________________(1) Yes (2) No
Total Amount: Rs. ________________________
G13
Was any major financial investment made on victim within 1 year prior to crash that could not be recovered? [e.g. Education fees/ donation, business set-up, organ transplant, etc.]
(1) Yes (2) No
Total investment: Rs. ____________________
G14If road crash victim died due to road crash, how much expenses incurred on the funeral?
Total expense Rs. _______________________
G15 Did the insurance cover any of the funeral expenses?(1) Yes [What percentage: ___________________%]
(2) No
G16Please provide following details about household [where victim survived]
Before crash
(Rs.)On resuming work after crash (Rs.)
Current (as on 31 Jan 2020)
(Rs.)
1
Average total monthly HOUSEHOLD INCOME from all sources (Approx.) [Please include all the income/ receipts of every member of household from all sources such as job, profession, wages, rent, pension, gratuity, etc.]
____________ ____________ ____________
2Average total monthly household expenses on all items (Approx.)
____________ ____________ ____________
3 Total number of members in the household ____________ ____________ ____________
SECTION H: PERCEPTIONS OF RESPONDENT ON ROAD SAFETY
S.N. Question Response
H1According to you what is the level of impact of road crashes on the society?
(1) Severe
(2) Major
(3) Moderate
(4) Minor
(5) Insignificant
H2 Do you feel safe while commuting on the roads?
(1) Always
(2) Mostly
(3) Sometimes
(4) Rarely
(5) Never
APPENDIX 5: QUESTIONNAIRES

232
H3How would you rate road safety in your neighborhood/ city?
(1) Excellent
(2) Very Good
(3) Good
(4) Average
(5) Poor
H4Do you drive any motorized vehicle? [MULTIPLE RESPONSE POSSIBLE]
(1) M2W - Motorcycle/ Scooter/ Scooty
(2) Car
(3) Taxi
(4) Three-wheeler/ Cycle/ Battery Rickshaw
(5) Truck/ lorry/ Tractor
(6) None
(7) Others: _________________________
H5[IF RESPONSE IS 1-5 TO H4], Do you feel safe driving in your neighborhood/city?
(1) Always
(2) Mostly
(3) Sometimes
(4) Rarely
(5) Never
[“THANK YOU” FOR YOUR TIME AND PATIENCE / KINDLY RE-CHECK IF ANY QUESTION IS LEFT BLANK]
FIELD CONTROL INFORMATION
NOTE: NO QUESTIONNAIRE WILL BE ACCEPTED WITHOUT COMPLETE FIELD CONTROL INFORMATION AND/ OR UNSIGNED AS AND WHERE APPLICABLE.
INVESTIGATOR
NAME DATE SIGNATURE
SUPERVISOR
NAME DATE SIGNATURE
VERIFICATION BY: (NAMES & SIGNATURES)
TL FE FM RE
ACCOMPANIED
SPOT/ BACK CHECKED
SCRUTINIZED

Traffic Crash Injuries and Disabilities: The Burden on Indian Society
[SELECTION CRITERIA FOR TEST SAMPLE]
Use the following table to check the eligibility of respondent for the survey based on
- Monthly Household Income (MHI)
- Number of adult members in household.
Consider the highest value of the range of the coded response of A11 and number of adult members as per A10.1 to check eligibility. If the total MHI is above the eligibility range, provide response in A12 and proceed.
Total number of adult members in household Monthly Household Income
1 More than 50,000
2 More than 1 Lakh
3 More than 1.5 Lakh
4 More than 2 Lakh
5 More than 2.5 Lakh
6 More than 3 Lakh
7 More than 3.5 Lakh
8 More than 4 Lakh
9 More than 4.5 Lakh
10 More than 5 Lakh
APPENDIX 5: QUESTIONNAIRES

234
SECTION A: RESPONDENT PROFILE
S.N. Question Response
A1 Respondent Name
A2 Phone Number
A3
What was your age on last birthday?
[READ OUT AND RECORD]
________________ years
A4 Highest Education of Respondent
(1) Illiterate
(2) Literate with no formal education
(3) Did not complete primary education
(4) Primary school (up to Class 5th)
(5) Middle school (up to Class 8th)
(6) Secondary school (up to Class 10th)
(7) Senior secondary school (up to Class 12th)
(8) Diploma
(9) Graduate/college and above
(10) Postgraduate/ University
(11) Other (Specify): __________________
QUESTIONNAIRE FOR TRUCK DRIVERS
PREAMBLE
Good ……………: I am from MDRA (Marketing & Development Research Associates), a leading market research agency in India. We are currently conducting a survey to understand the awareness of Truck Drivers about compensation (in the event of crash) and related provisions of the Motor Vehicle Amendment Act, 2019 for SaveLIFE Foundation (SLF) in collaboration with the World Bank.
I want to ask for your permission to include you in our study
City of Interview
Serial No
Place of Interview
and it is up to you to decide whether to participate. The interview will take about 10-15 minutes. You can decide not to answer any question and can stop the interview at any time. Everything that you report during the interview will be kept strictly confidential. Your responses would be combined with responses given by other respondents and would not be identified separately.
[Please note that no payment/ money/ fee to be paid to anyone in any manner for participating in this survey]

Traffic Crash Injuries and Disabilities: The Burden on Indian Society
A5
Please look AT THIS CARD and tell me which income group best indicates your monthly income from truck driving profession?
[SHOW CARD]
(1) Up to Rs. 5,000
(2) Rs. 5,001 to Rs. 10,000
(3) Rs. 10,001 to Rs. 20,000
(4) Rs. 20,001 to Rs. 30,000
(5) Rs. 30,001 to Rs. 50,000
(6) Rs. 50,001 to Rs. 75,000
(7) Rs. 75,001 to Rs. 1,00,000
(8) More than Rs. 1,00,000
A6Since how long you have been in the truck driving profession?
(1) Less than 2 yrs.
(2) 2-5 yrs.
(3) 6-10 yrs.
(4) 11-15 yrs.
(5) More than 15 yrs.
A7 Which sector do you work in?
(1) Private
(2) Government
(3) Others ______________________
A8 Who owns the truck you drive?(1) Self-owned
(2) Owned by fleet owner/ company
A9 Base City (from where you operate trucks)___________________________
A10On an average, how many hours do you drive in a typical day (out of 24 hrs.)?
___________________________ hours
A11On an average, how many days do you work in a month?
___________________________ days
A12 What type of truck (category of truck) do you drive generally? [Mention category of truck based on Gross Vehicle Weight]
(1) Medium Motor Vehicle (B/w 7.5-12 tons)(2) Heavy Motor Vehicle (Exceed 12 tons)(3) Trailer
A13On what basis are monetary benefits provided to you by the truck company or owner?
(1) Monthly Salary
(2) Number of Driving Hours
(3) Trip wise
(4) Other (specify): __________________
APPENDIX 5: QUESTIONNAIRES

236
SECTION B: AWARENESS ABOUT MVAA & ROAD SAFETY RELATED ASPECTS
S.N. Question Response
B1I would like to ask you regarding a few aspects of motor vehicle and workers act. Before this survey began were you aware of following:
Fully AwareSomewhat Aware
Not Aware
a
AWARENESS OF MOTOR THIRD PARTY LIABILITY INSURANCE:
Motor Third Party Liability insurance covers your liability for injuries (and property damage to a limited extent) to others caused in an crash that is your fault. Additional coverage to include loss or damage to your own vehicle can be purchased as an add-on to Third Party Liability insurance, and is commonly called Comprehensive insurance
1The purchase of Motor Third party liability insurance is compulsory and you may be fined by the Police if vehicle in uninsured
3 2 1
2If the vehicle you are driving is UNINSURED, you (or the owner) may be personally liable to pay for injuries caused to others if you are at fault for the crash
3 2 1
3Motor Third Party liability insurance provides compensation to other people for their injuries if the crash is your fault
3 2 1
4Motor Third Party liability insurance does not provide compensation for injuries you incur if the crash is your fault
3 2 1
5If someone else is a fault for an crash and you incur injuries, you may be able to claim compensation from the insurer the vehicle is insured with
3 2 1
6The compensation you are eligible to receive may be reduced if you breach a traffic law
3 2 1
7Along with driver, truck attendant (khalasi) is also covered for benefits under third party insurance under MVAA, 2019
3 2 1
A14In case of enforcement violations, who pays for the penalties?
(1) Settled by the driver from his salary
(2) Owner /Company pays for it
(3) Shared by both driver and owner
(4) Other (specify): __________________

Traffic Crash Injuries and Disabilities: The Burden on Indian Society
8The time limitation for filing of cases for compensation for injuries before the Claims Tribunal is 6 months from the date of the crash
3 2 1
9 In case of road crash, insurance company is liable to designate an officer to help you with the process of settlement of your claim
3 2 1
b AWARENESS ABOUT THE CHANGES UNDER MVAA CHANGES
10The motor vehicle act has been amended in 2019 and came into force from 1st September 2019
3 2 1
11 The fines for traffic violations have been increased 3 2 1
12If the application for driving license renewal is made after 3 years from the date of expiry of license, then the licensing authority may refuse to renew
3 2 1
13Provision for protection of Good Samaritans from unnecessary trouble or harassment from civil or criminal proceedings
3 2 1
14The provision for cashless emergency medical treatment of crash victim injuries during the “golden hour”
3 2 1
15The increased compensation for hit and run cases is INR 2 lakhs for death and INR 50,000 for grievous hurt under MVAA, 2019?
3 2 1
16Lumpsum compensation available for death and grievous injury, without the need to prove fault of another party (this is an alternate to proceeding with an injury claim against a third party or their insurer)
3 2 1
B2Do you think with MVAA 2019 amendments would help in implementation of compliance w.r.t REGISTRATION of vehicle?
(1) Yes, definitely
(2) Yes, to some extent
(3) Not at all
B3Do you think with MVAA 2019 amendments would help in implementation of compliance w.r.t LICENSING?
(1) Yes, definitely
(2) Yes, to some extent
(3) Not at all
B4Do you think with MVAA 2019 amendments would help in implementation of compliance w.r.t INSURANCE REQUIREMENTS?
(1) Yes, definitely
(2) Yes, to some extent
(3) Not at all
B5Do you think MVAA 2019 would improve safe driving behaviour among truck drivers?
(1) Yes, definitely
(2) Yes, to some extent
(3) Not at all
B6Do you support the increased fines for traffic violations like drunk driving, over speeding, distracted driving, non-usage of seat belts etc.?
(1) Yes
(2) No
(3) DK/CS
APPENDIX 5: QUESTIONNAIRES

238
B7 Do you feel safe driving on the roads? (1) Always (2) Sometimes(3) Never
B8
[IF RESPONSE IS 2, 3] What are the reasons for feeling unsafe on the roads? [RECORD VERBATIM]
_______________________________________________________________________________________________________________________
_______________________________________________________________________________________________________________________
_______________________________________________________________________________________________________________________
B9 Are you aware of third-party insurance cover?
(1) Yes
(2) No [GO TO NEXT SECTION]
(3) DK/CS [GO TO NEXT SECTION]
B10
[IF YES], what is your understanding of third-party insurance? Explain. [RECORD VERBATIM]
_______________________________________________________________________________________________________________________
______________________________________________________________________________________________________________________
_______________________________________________________________________________________________________________________
B11
According to you, what all does third-party insurance cover?
[MULTIPLE RESPONSE POSSSIBLE]
(1) Death
(2) Injury/ Disability
(3) Property Damage
(4) All of above
(5) Other (specify): ___________
SECTION C: INSURANCE COVERAGE AND COMPENSATION
S.N. Question Response
C1 Is your vehicle insured under motor vehicle insurance?(1) Yes
(2) No [GO TO C3]
C2
Type of vehicle insurance [Motor Third Party Liability insurance covers your liability for injuries (and property damage to a limited extent) to others caused in an crash that is your fault. Additional coverage to include loss or damage to your own vehicle can be purchased as an add-on to Third Party Liability insurance, and is commonly called Comprehensive insurance]
(1) Third party insurance (Liability)
(2) Comprehensive insurance
(3) DK/ CS
(4) Others (specify): ____________________
C3
[IF RESPONSE TO C1 IS 2], What are the reasons for not having vehicle insurance? [RECORD VERBATIM]
_____________________________________________________________________________________________________________________________
_____________________________________________________________________________________________________________________________
_____________________________________________________________________________________________________________________________

Traffic Crash Injuries and Disabilities: The Burden on Indian Society
C4 When did you last renew your vehicle insurance? [month & year] ________________________ [MM/YYYY]
C5 Who paid the vehicle insurance premium amount mostly?
(1) Fleet Owner
(2) Driver
(3) Others (specify): __________
C6Are you aware of the process of claiming insurance from the insurance company in the event of a crash?
(1) Yes(2) No(3) DK/CS
SECTION D: PERSONAL ROAD CRASH EXPERIENCE
S.N. Question Response
D1While driving your truck, have you ever been involved in a road crash where you sustained injuries?
(1) Yes
(2) No [END THE INTERVIEW]
D2When did the most recent road crash happen? [Ask for the details of latest crash]
(1) Date: ___________ [DD/MM/YYYY]
(2) Time: __________ [24 HRS. FORMAT]
D3 Where did crash happen?(1) City Name: ____________________
(2) State Name: ___________________
D4 Was an FIR filed after the road crash?
(1) Yes
(2) No
(3) DK/CS
D5 Type of road on which crash happened
(1) Expressway
(2) National Highway
(3) State Highway
(4) City/ District/ Municipality roads
(5) Village road
(6) Other (specify): _________________
D6 Impact of the crash to self
(1) Serious injury (attended hospital and admitted or treated at hospital)
(2) Minor injury (not requiring hospital treatment)
APPENDIX 5: QUESTIONNAIRES

240
D7 Did you visit hospital after crash and were you admitted for treatment?
(1) Visited hospital for treatment but not admitted
(2) Admitted to hospital for treatment
(3) Not visited hospital
D8 Impact of the crash to others party involved in crash
(1) Fatal crash (where victim died)
(2) Serious injury (attended hospital and admitted or treated at hospital)
(3) Minor injury (not requiring hospital treatment)
(4) No Injury
(5) DK/CS
D9 VEHICLE INSURANCE DETAILS
1 Was your vehicle insured at the time of crash?(1) Yes
(2) No [GO TO D10]
2Type of insurance with which your vehicle was insured at the time of crash
(1) Third party insurance (Liability)
(2) Comprehensive insurance
(3) DK/ CS
(4) Others (specify): ________________
3Did you/ your fleet owner claim insurance for personal injury after the crash?
(1) Yes
(2) No [GO TO D10]
4 Was your claim approved by the insurance company?(1) Yes
(2) No [GO TO D10]
5 What was the total claim amount?(1) Rs. _______________________
(2) DK/CS
D10COMPENSATION TO/ FROM OTHER PARTY [OTHER THAN FROM AN INSURER]
1 Was the other vehicle/ party involved in crash covered under insurance?
(1) Yes, insured
(2) No, uninsured
(3) Hit and run case
(4) DK/CS
2 Who was at the fault during crash?(1) Other party involved in crash
(2) Self [GO TO D10.8]
3Did you receive any compensation for personal injury from other party, who was not an insurer, involved in the crash?
(1) Yes: Rs. _________ (mention amount)
(2) No [GO TO D11]

Traffic Crash Injuries and Disabilities: The Burden on Indian Society
4 How many days did it take for the payment to be accessed? __________________________days
5 Did you face any challenges/ difficulties in accessing the money?(1) Yes
(2) No
6 Did you have to visit court for claiming compensation?(1) Yes
(2) No
7 How would you rate the compensation claim process?
(1) Easy
(2) Moderate
(3) Difficult
8Did you/ fleet owner have to pay any compensation to other party involved in the crash for injuries they sustained?
(1) Yes: Rs. __________ (mention amount)
(2) No
D11 OTHER INSURANCES DETAILS
1Were you covered under any other personal injury insurance at the time of crash (other than Motor Vehicle Insurance)?
[MULTIPLE RESPONSES POSSIBLE]
(1) Medical Insurance
(2) Life Insurance
(3) Other (specify): __________________
(4) None [GO TO D12]
2 Did you claim insurance?(1) Yes
(2) No [GO TO D12]
3 Did you face any problems with your insurance company/ official?(1) Yes
(2) No
4
[IF YES], What type of problems did you face? [RECORD VERBATIM]
_____________________________________________________________________________________________________________________________
_____________________________________________________________________________________________________________________________
D12 GOVERNMENT SCHEMES
1Did you apply for/ benefit from any road crash scheme run by the Government after your crash?
(1) Yes
(2) No [END THE INTERVIEW]
2
Type of schemes you applied for/ benefited from
[MULTIPLE RESPONSE POSSSIBLE]
(1) Cashless treatment at hospital
(2) Solatium fund for hit and run case
(3) Ex-gratia
(4) Others (specify): __________________
3 How much total amount/ benefit did you receive? Rs. ______________________
4 How many days did it take for the payment to be processed? __________________________days
[“THANK YOU” FOR YOUR TIME AND PATIENCE / KINDLY RE-CHECK IF ANY QUESTION IS LEFT BLANK]
APPENDIX 5: QUESTIONNAIRES

242
FIELD CONTROL INFORMATION
NOTE: NO QUESTIONNAIRE WILL BE ACCEPTED WITHOUT COMPLETE FIELD CONTROL INFORMATION AND/ OR UNSIGNED AS AND WHERE APPLICAB
INVESTIGATOR
NAME DATE SIGNATURE
SUPERVISOR
NAME DATE SIGNATURE
VERIFICATION BY: (NAMES & SIGNATURES)
TL FE FM RE
ACCOMPANIED
SPOT/ BACK CHECKED
SCRUTINIZED

Traffic Crash Injuries and Disabilities: The Burden on Indian Society
BIBLIOGRAPHY
Abertis Foundation.2019. The Impact of Road Traffic Accidents with Child Victims. by Dr. Alexander Grous. https://www.abertis.com/media/news/2019/12/12/Abertis_Informe%20LSE_EN_M7.pdf
ADB Technical Assistance. 2005. “Socioeconomic Impact of Road Accidents.” https://www.adb.org/sites/default/files/project-document/69005/tar-stu-38081.pdf.
Anand, Sudhir, and Victoria Fan. 2016. “The Health Workforce in India.” https://www.who.int/hrh/resources/16058health_workforce_India.pdf.
Azad, Yashovardhan “The Motor Vehicles Act is a good first step. Now, bring in more reforms.” Hindustan Times(New Delhi), July 01, 2020. https://www.hindustantimes.com/analysis/the-motor-vehicles-act-is-a-good-first-step-now-bring-in-more-reforms/story-elaetuCv6f2oTC8Nq4P2uJ.html.
Bardasi, Elena, and Quentin Wodon. 2013. “Working Long Hours and Having No Choice: Time Poverty in Guinea.” Policy Research Working Papers. https://elibrary.worldbank.org/doi/abs/10.1596/1813-9450-4961.
Bora, Bhaswati, Vishrut Landge, Bahuguna Dalai. 2018. “Socio-Economic Costing of Road Traffic Accidents: Evidence from Nagpur.” Current Science 114(06):1275Doi: 10.18520/cs/v114/i06/1275-1283
CDC (Centres for Disease Control and Prevention) .2019. “Road Traffic Injuries and Deaths—A Global Problem.” National Centre for Injury Prevention and Control. https://www.cdc.gov/injury/features/global-road-safety/index.html.
“Chennai: Doctor’s Testimony Frees Life Convict.”
Deccan Chronicle(Chennai), March 30, 2016.https://www.deccanchronicle.com/nation/current-affairs/300316/chennai-doctor-s-testimony-frees-life-convict.html
Delhi State Legal Services Authority. 2019. “Motor Accident Claims Annuity Deposit (MACAD) Scheme.” https://dslsa.org/2019/02/21/motor-accident-claims-annuity-deposit-macad-scheme/.
Department of Environmental Protection,West Virginia. 2020. “Mact Neshap Standards.” http://dep.wv.gov/daq/Air%20Toxics/Pages/MACTNESHAPStandards.aspx.
Dutta, Anisha “Govt. Plans Scheme for Cashless Treatment of Accident Victims.” Hindustan Times(New Delhi), July 01, 2020. https://www.hindustantimes.com/india-news/govt-plans-scheme-for-cashless-treatment-of-accident-victims/story-bTTxCYZVmAR4BrlrugCLhJ.html.
BIBLIOGRAPHY

244
Global Road Safety Partnership. 2018. “Poverty & Road Safety.” A GRSP Positioning Paper. Hosted by International Red Cross and Red Crescent Societies. https://www.grsproadsafety.org/wp-content/uploads/New-Fact-Poverty-PDF.pdf.
Gopinath, Bamini et al., 2017. “Overview of Findings from A 2-Year Study[...].” BMC Research Notes 10(1):76. Government of India, Ministry of Human Resource Development. 2018. Educational Statistics at A Glance.https://mhrd.gov.in/sites/upload_files/mhrd/files/statistics-new/ESAG-2018.pdf.
Government of India, Ministry of Road Transport and Highway Transport Research Wing. 2019. Road Accidents in India - 2018. https://morth.nic.in/sites/default/files/Road_Accidednt.pdf.
Government of India, Planning Commission. 2001. Working Group on Road Accidents Injury Prevention And Control.
Gururaj, G. 2014. “Growing Burden and Impact of Road Accidents in India: Need for a Safe Systems Approach.” International Journal of Vehicle Safety 7:No.3/4. Gururaj, G et al.,2000. “Underreporting of Road Traffic Injuries in Bangalore: Implications for Road Safety Policies and Programs.” New Delhi, India, March 5-8. Hours, Martin et al., 2013. “Outcomes One Year After A Road Accident: Results from The ESPARR Cohort.” Accident Analysis & Prevention 50:92-102.
Huang,Lanying. 2016. “Identifying Risk Factors for Household Burdens of Road Traffic Fatalities[...].”BMC Public Health: https://www.ncbi.nlm.nih.gov/pmc/articles/PMC5129609/.
India Legal. 2019. “Set Up Motor Accident Mediation Authority in Every District of India, SC Directs Centre.” https://www.indialegallive.com/constitutional-law-news/supreme-court-news/set-up-motor-accident-mediation-authority-in-every-district-of-india-sc-directs-centre/.
ICFJ (International Centre for Journalist). 2020. “2020 Road Safety Fellows.” https://www.icfj.org/our-work/2020-road-safety-fellows.
IWWAGE (Initiative For What Works To Advance Women And Girls In The Economy ). 2020. Gender in Focus by Soumya Kapoor. https://iwwage.org/wp-content/uploads/2020/08/IWWAGE-Gender-Focus-com.pdf
Jagnoor, J. et al., 2019. “Mortality and Health-Related Quality of Life Following Injuries and Associated Factors[...].” Injury Prevention.
Joyita. 2013. “Poverty Estimation in India.” The PRS Legislative Research (Blog), August 5, 2013. https://www.prsindia.org/theprsblog/poverty-estimation-india.
Julliard, Catherine et al., 2010. “Socioeconomic Impact of Road Traffic Injuries in West Africa: Exploratory Data from Nigeria.” British Medical Journal 16(6).
Traffic Crash Injuries and Disabilities: The Burden on Indian Society
Kant, Amitabh. 2019. SDG India Index Report by NITI Aayog. https://niti.gov.in/sites/default/files/SDG-India-Index-2.0_27-Dec.pdf.
Karan, Anup, Habib Hasan Farooqui, and Sakthivel Selvaraj. 2018. “Quantifying the Financial Burden of Households[...]. ” BMJ Journals. https://bmjopen.bmj.com/content/8/5/e018020.info.
Khayesi, Meleckidzedeck. 2020. “Vulnerable Road Users or Vulnerable Transport.” Frontiers In Sustainable Cities Journals.
Khosla, Chhaya. 2018. “Motor Vehicles Amendment Act, 2019.” https://www.magzter.com/article/Education/FLAIR-TALK/Motor-Vehicles-Amendment-Act-2019.
Krishna, P. 2004. “Raghubir Singh v Sher Singh (Suit No. 287 of 1977).” 4 May. https://indiankanoon.org/doc/532584/.
Law Circa. 2019. “Overview of New Motor Vehicle Amendment Act,2019.” https://lawcirca.com/overview-of-new-motor-vehicle-amendment-act-2019/.
M.,Richmond, Marc et al.,(2005). “Estimation of Socio- Economic Costs of Road Accidents in Manila.” Journal of the Eastern Asia Society for Transportation Studies 6: 3183 – 3198. Madras High Court. 2020. “Manager v Shanmugam (C.M.A.No.2854 of 2016), Madras.” 23 September. https://indiankanoon.org/doc/168174314/.
Mayou, R., B. Bryant.2002. “Outcome 3 years after a road traffic accident.” Psychological medicine 32(4): 671-675.
Mayou, R, B. Bryant, and R. Duthie. 2011. “Psychiatric Consequences of Road Traffic Accidents.” h t t p s : / / w w w. n c b i . n l m . n i h . g o v / p m c / a r t i c l e s /PMC1678958/.
Ministry of Transport, New Zealand. 2019. Social Cost of Road Accidents and Injuries 2018 Update. Ministry of Transport.
Mirzoev, Tolib, and Sumit Kane. 2018. “Key Strategies to Improve Systems for Managing Patient Complaints Within Health Facilities – What Can We Learn from The Existing Literature?” https://www.ncbi.nlm.nih.gov/pmc/articles/PMC5912438/.
Namji, Jung, Sul Jaehoon. 2014. Handbook of Measuring Socio-economic Consequences of Traffic Accidents by Korea Transport Institute.
Nantulya, M, Vinand, Michael R Reich. 2003. “Equity Dimensions of Road Traffic Injuries in Low-And Middle-Income Countries.” Injury Control And Safety Promotion, 10(1-2):13-20.
NCRB (National Crime Records Bureau). 2019. Accidental Deaths and Suicides (ADSI). https://ncrb.gov.in/en/accidental-deaths-suicides-india-adsi.
BIBLIOGRAPHY

246
NSSO (National Sample Survey Office). 2011. Household Healthcare Utilization & Expenditure in India. State Factsheets by Ministry of Health and Family Welfare, Government of India.
NITI Aayog (National Institution for Transforming India). 2019. Women Transforming India. https://niti.gov.in/women-transforming-india.
Pal, Anagh “Out-Of-Pocket Expenses in Healthcare in India Stands at 62 Percent.” Outlook India, December 18, 2017. https://www.outlookindia.com/outlookmoney/insurance/out-of-pocket-expenses-in-healthcare-in-india-stands-at-62-per-cent-report-2554.
Parkinson, Frances. 2013. “Spectrum and Cost of Road Traffic Accidents.” Thesis submitted to the University of KwaZulu-Natal, Durban.
Perez, Caroline Criado. 2019. “The Deadly Truth About A World Built for Men – From Stab Vests to Car Accidents.”
The Guardian, February 23,2019. https://www.theguardian.com/lifeandstyle/2019/feb/23/truth-world-built-for-men-car-accidents. Piccinelli, M et al.,(1999). “Anxiety and Depression Disorders 5 years after Severe Injuries: A Prospective Follow-Up Study.” Journal of Psychosomatic Research 46(5):455-64
Planning Commission, GOI. (2001). Working Group on Road Accidents Injury Prevention AndControl. Government of India.
Raveendran, R. 2009. “Jai Prakash v M/S. National Insurance Co. & Ors (No. 11801-11804 of 2005), Andhra Pradesh.” https://indiankanoon.org/doc/49727603/.
Reddy, G. M. et al., 2009. “Extent and Determinants of Cost of Road Traffic Injuries in An Indian City.” Indian Journal of Medical Sciences, 63(12): 549-556.
Rittenhouse, Katelyn, Brian Gross, and Frederick B. Rogers. 2014. “The Golden Hour in Trauma: Dogma or Medical Folklore?”. Injury 46(4). https://www.researchgate.net/publication/265853223_The_Golden_Hour_in_Trauma_Dogma_or_Medical_Folklore.
Rocco, Lorenzo et al.,2014. “Non-Communicable Disease in The MENA Region: Socioeconomic Inequalities and Economic Consequences.” Paper exclusive for the World Bank. Roy, Sutirtha Sinha; 2020. “Poverty & Equity Brief, South Asia- India.” https://databank.worldbank.org/data/download/poverty/33EF03BB-9722-4AE2-ABC7-AA2972D68AFE/Global_POVEQ_IND.pdf.
Rumi, Faryal. “Road Accident Fatalities Up 14.8% in Bihar. “Times of India(Patna), October 13, 2019 . https://timesofindia.indiatimes.com/city/patna/road-accident-fatalities-up-14-8-in-state/articleshow/71558898.cms.
Safety Cube. 2015. Costs Related to Serious Road Injuries. D 7.3 of H2020,Loughborough,UK. https://www.safetycube-project.eu/wp-content/uploads/SafetyCube-D7.3-Costs-related-to-serious-road-injuries.pdf.

Traffic Crash Injuries and Disabilities: The Burden on Indian Society
SaveLIFE Foundation. 2018. National Factsheet: Road Accident Statistics 2018. SLF. SaveLIFE Foundation. 2018. Economic Impact of Road Accidents in India. SLF.
SaveLIFE Foundation. 2020. Status of Truck Drivers in India. https://savelifefoundation.org/wp-content/uploads/2020/02/design-single-page-27th-feb-2020.pdf. Singhvi, G. 2010. “Arun Kumar Agrawal & Anr v National Insurance Co. Ltd & Ors (No.5843), U.P.” 22 July. https://indiankanoon.org/doc/1546729/.
Sivakumar, B., Sikha P, and Dr. K.Krishnamurthy. 2015. “Underestimation of Road Traffic Accident Cost in Developing Countries- A Study from India”
Smeeding, M. et al., 1993. Poverty, Inequality, and Family Living Standards Impacts Across Seven Nations: The Effect of Non-Cash Subsidies for Health, Education and Housing. Review of Income and Wealth, Series 39. http://www.roiw.org/1993/229.pdf.
Thomas et al., 2004. “The Involvement and Impact of Road Accidents on the Poor: Bangladesh and India Case Studies.” TRL Limited for GRSP.
“Toll-Free Mental Health Rehabilitation Helpline ‘Kiran’ Launched in 13 Languages.” The Statesman (New Delhi), 8 September, 2020. https://www.thestatesman.com/india/24x7-toll-free-mental-health-rehabilitation-helpline-kiran-launched-13-languages-1502922716.html.
Tripathi, P et al., 2017. “Cost of Injury Care in India: Cross- Sectional Analysis of National Sample Survey 2014.” British Medical Journal, Injury Prevention: 2017-042318. Utanaka, Ahmad & Widyastuti, Hera. (2018). Traffic Accident Cost Analysis Using Willingness-to-pay Method in Surabaya. Advances in Engineering Research(186).
Wang, Shiyong, Patricio Marquez, and John Langenbrunner. 2011. “Toward a Healthy and Harmonious Life in China: Stemming the Rising Tide of Non-Communicable Diseases.” World Bank.
Washington,DC, National Highway Traffic Safety Administration.2014. The Economic and Societal Impact of Motor Vehicle Accidents, 2010 by Blincoe, L. J. et al.
Wells, Thomas. 2012. “Sen’s Capability Approach.” Internet Encyclopaedia of Philosophy. https://iep.utm.edu/sen-cap/.
Wijnen, Wim, Henk L. Stipdonk. 2016. “Social Costs of Road Accidents: An International Analysis.” Accident Analysis & Prevention(94): 97-106. WHO (World Health Organisation). 2020. WHO South-East Asia Journal of Public health. https://www.who.int/southeastasia/publications/who-south-east-asia-journal-of-public-health.
WHO (World Health Organisation), Deptt. of Gender and Women’s Health. 2020. Gender Traffic. https://docu.tips/documents/gender-traffic-5c1310cf93182.
BIBLIOGRAPHY

248
World Bank. 2020. Guide for Road Safety Opportunities and Challenges. http://documents1.worldbank.org/curated/en/447031581489115544/pdf/Guide-for-Road-Safety-Opportunities-and-Challenges-Low-and-Middle-Income-Country-Profiles.pdf.
WHO (World Health Organisation). 2011. “Chapter 4: Rehabilitation.” https://www.who.int/disabilities/world_report/2011/chapter4.pdf?ua=1.
WHO (World Health Organization). 2018. Global Status Report on Road Safety 2018. https://www.who.int/violence_injury_prevention/road_safety_status/2018/en/.
WHO (World Health Organisation). 2019. The Power of Cities: Tackling Noncommunicable Diseases and Road Traffic Injuries. https://www.who.int/ncds/publications/tackling-ncds-in-cities/en/
World Inequality Database. 2015. India-World Inequality Database. https://wid.world/country/india/.

Traffic Crash Injuries and Disabilities: The Burden on Indian Society
NOTES

250

Traffic Crash Injuries and Disabilities: The Burden on Indian Society
NOTES

SaveLIFE Foundation D-10, First Floor, Nizamuddin East New Delhi - 110013, IndiaTelephone: 011 410 91 911Email: [email protected]
www.savelifefoundation.org
savelifefoundation
@savelifeindia
The World Bank1818 H Street, NW Washington, DC 20433 USATel : (202) 473-1000Email: [email protected]
www.worldbank.org
worldbank
@worldbank

![[Treating frostbite injuries]](https://static.fdokumen.com/doc/165x107/633ff39332b09e4bae09a1b5/treating-frostbite-injuries.jpg)