Comparison between Fenton oxidation process and electrochemical oxidation for PAH removal from an...
18
ORIGINAL PAPER Comparison between Fenton oxidation process and electrochemical oxidation for PAH removal from an amphoteric surfactant solution Lan-Huong Tran • Patrick Drogui • Guy Mercier • Jean-Franc ¸ois Blais Received: 10 October 2009 / Accepted: 27 March 2010 / Published online: 16 April 2010 Ó Springer Science+Business Media B.V. 2010 Abstract The decomposition of polycyclic aromatic hydrocarbons in a creosote oily solution and in synthetic solutions containing naphthalene and pyrene was investi- gated in the presence of an amphoteric surfactant using electrooxidation by comparison to Fenton oxidation pro- cess. Electrolysis was carried out using a parallelepipedic electrolytic 1.5-L cell containing five anodes (expanded titanium covered with ruthenium) and five cathodes (stainless steel) alternated in the electrode pack, whereas Fenton oxidation process was carried out in 500 mL Erlenmeyer glass-flasks in which H 2 O 2 and Fe 2? were added. Using electrochemical oxidation, the sum concen- tration of 16 polycyclic aromatic hydrocarbons investi- gated could be optimally diminished by up to 80–82% by applying a current density of 9.23 mA cm -2 and a pH of 4.0 or 7.0 for 90-min reaction period. By comparison, the best yield (46%) of Fenton oxidation process for polycyclic aromatic hydrocarbons degradation was recorded by using H 2 O 2 /Fe 2? molar ratio of 11.0 and a pH of 4.0. Keywords Polycyclic aromatic hydrocarbon Electrochemical degradation Fenton oxidation Hydroxyl radical Ruthenium oxide electrode Surfactant Abbreviations ACA Acenaphtene ACN Acenaphtylene ANT Anthracene AOP Advanced oxidation process AOPs Advanced oxidation processes BAA Benzo(a)anthracene BAP Benzo(a)pyrene BJK Benzo(b,j,k)fluoranthene BPR Benzo(ghi)perylene CAS Cocoamidopropyl hydroxysultaı ¨ne CHR Chrysene CMC Critical micelle concentration COD Chemical oxygen demand COS Creosote oily solution DAN Dibenzo(a,h)anthracene DOC Dissolved organic carbon FLE Fluoranthene FLU Fluorene GC Gas chromatograph INP Indeno(1,2,3-c,d)pyrene MEN 2-Methyl naphtalene MS Mass spectrometer MSR Molar solubilization ratio NAP Naphthalene NIST National Institute of Standards and Technology PAH Polycyclic aromatic hydrocarbons PHE Phenanthrene PVA Polyvinyl alcohol PYR Pyrene SIFIS Selected ion and full ion scanning Ti/BDD Titanium covered with boron doped diamond Ti/RuO 2 Titanium covered with ruthenium oxide TOC Total organic carbon L.-H. Tran P. Drogui G. Mercier J.-F. Blais (&) Institut national de la recherche scientifique (Centre Eau, Terre et Environnement), Universite ´ du Que ´bec, 490 rue de la Couronne, Quebec, QC G1K 9A9, Canada e-mail: [email protected] L.-H. Tran e-mail: [email protected] P. Drogui e-mail: [email protected] G. Mercier e-mail: [email protected] 123 J Appl Electrochem (2010) 40:1493–1510 DOI 10.1007/s10800-010-0128-4
-
Upload
independent -
Category
Documents
-
view
2 -
download
0
Transcript of Comparison between Fenton oxidation process and electrochemical oxidation for PAH removal from an...
ORIGINAL PAPER
Comparison between Fenton oxidation processand electrochemical oxidation for PAH removalfrom an amphoteric surfactant solution
Lan-Huong Tran • Patrick Drogui •
Guy Mercier • Jean-Francois Blais
Received: 10 October 2009 / Accepted: 27 March 2010 / Published online: 16 April 2010
� Springer Science+Business Media B.V. 2010
Abstract The decomposition of polycyclic aromatic
hydrocarbons in a creosote oily solution and in synthetic
solutions containing naphthalene and pyrene was investi-
gated in the presence of an amphoteric surfactant using
electrooxidation by comparison to Fenton oxidation pro-
cess. Electrolysis was carried out using a parallelepipedic
electrolytic 1.5-L cell containing five anodes (expanded
titanium covered with ruthenium) and five cathodes
(stainless steel) alternated in the electrode pack, whereas
Fenton oxidation process was carried out in 500 mL
Erlenmeyer glass-flasks in which H2O2 and Fe2? were
added. Using electrochemical oxidation, the sum concen-
tration of 16 polycyclic aromatic hydrocarbons investi-
gated could be optimally diminished by up to 80–82% by
applying a current density of 9.23 mA cm-2 and a pH of
4.0 or 7.0 for 90-min reaction period. By comparison, the
best yield (46%) of Fenton oxidation process for polycyclic
aromatic hydrocarbons degradation was recorded by using
H2O2/Fe2? molar ratio of 11.0 and a pH of 4.0.
Keywords Polycyclic aromatic hydrocarbon �Electrochemical degradation � Fenton oxidation �Hydroxyl radical � Ruthenium oxide electrode � Surfactant
Abbreviations
ACA Acenaphtene
ACN Acenaphtylene
ANT Anthracene
AOP Advanced oxidation process
AOPs Advanced oxidation processes
BAA Benzo(a)anthracene
BAP Benzo(a)pyrene
BJK Benzo(b,j,k)fluoranthene
BPR Benzo(ghi)perylene
CAS Cocoamidopropyl hydroxysultaıne
CHR Chrysene
CMC Critical micelle concentration
COD Chemical oxygen demand
COS Creosote oily solution
DAN Dibenzo(a,h)anthracene
DOC Dissolved organic carbon
FLE Fluoranthene
FLU Fluorene
GC Gas chromatograph
INP Indeno(1,2,3-c,d)pyrene
MEN 2-Methyl naphtalene
MS Mass spectrometer
MSR Molar solubilization ratio
NAP Naphthalene
NIST National Institute of Standards and
Technology
PAH Polycyclic aromatic hydrocarbons
PHE Phenanthrene
PVA Polyvinyl alcohol
PYR Pyrene
SIFIS Selected ion and full ion scanning
Ti/BDD Titanium covered with boron doped diamond
Ti/RuO2 Titanium covered with ruthenium oxide
TOC Total organic carbon
L.-H. Tran � P. Drogui � G. Mercier � J.-F. Blais (&)
Institut national de la recherche scientifique (Centre Eau,
Terre et Environnement), Universite du Quebec, 490 rue de la
Couronne, Quebec, QC G1K 9A9, Canada
e-mail: [email protected]
L.-H. Tran
e-mail: [email protected]
P. Drogui
e-mail: [email protected]
G. Mercier
e-mail: [email protected]
123
J Appl Electrochem (2010) 40:1493–1510
DOI 10.1007/s10800-010-0128-4

1 Introduction
NAP, PYR and other PAHs are ubiquitous pollutants that
are very persistent in the environment due to their resis-
tance to biological degradation, namely for PAH that
consist of two or more rings [1, 2]. PAHs are generated
whenever organic material (e.g., petroleum, coal, tobacco,
wood) are combusted, burned, or cooked. Creosote is one
of the important sources of PAH release in the environ-
ment. Creosote is a distillate of coal tar [3] and it is an
excellent fungicide and insecticide [4]. It is commonly
used as wood preservative. Creosote-treated woods are
widely used as railway sleepers, telephone and power pole
and as exterior wood for use in garden [5–8]. Ikarashi et al.
[8] reported that creosote contaminated sites have been
identified in Canada, United States, Greenland, Denmark,
Sweden and the United Kingdom.
The removal of PAH from water is a difficult task due to
their low solubility (Table 1), and refractory character but
it can be achieved through some treatment methods, such
as chemical advanced oxidation processes (AOPs) [2, 9–
11], electrochemical oxidation [12, 13] or biological oxi-
dation using microorganisms [14, 15]. AOPs are often used
for PAH degradation [9, 11]. The aim of AOPs (including,
O3/H2O2, UV/O3, UV/H2O2, H2O2/Fe2?) is to produce
hydroxyl radical (OH*), a very powerful oxidant capable of
oxidising a wide range of organic compounds with one or
more double bonds. Among the AOPs, the Fenton oxida-
tion process (H2O2/Fe2? system) represents the most
common and simple AOP, which is often employed for the
treatment of wastewaters from various industries [11, 16,
17]. This process is generally conducted in very acidic
medium (pH 2–3) to prevent iron salts precipitation [2, 18].
The hydroxyl radicals formed degrade organic compounds
either by hydrogen abstraction or by hydroxyl addition [2].
An optimal oxidation of the organic can be obtained when
the system is applied in presence of an excess of hydrogen
peroxide. Tang and Huang [19] have reported a H2O2/Fe2?
molar ratio of 10:1 to allow for the best degradation of
organic pollutants.
Electrochemical oxidation treatment can also be used
for PAH degradation. This type of technology has been
widely applied for the treatment of different effluents
(textile effluents [20], landfill leachate [21, 22], olive oil
wastewater and domestic sewage sludge [23], tannery
effluent [24, 25] using different electrode materials. The
interest of using electrochemical oxidation is based on its
capability of reacting on the pollutants by using both direct
and indirect effect of electrical current [21, 26]. Direct
oxidation may be achieved through mineralization with
hydroxyl radical (OH*) produced by dimensionally stable
anodes having high oxygen overvoltage, such as SnO2,
PbO2 and IrO2 [27–29]. In fact, OH* radicals are
exclusively generated on the anode electrodes from the
oxidation of water and organic compounds can be com-
pletely transformed or degraded by reaction with adsorbed
OH* radicals. Indirect oxidation can be achieved through
electrochemical generation of a mediator in solution (such
as, HClO, HBrO, H2O2, H2S2O8, and others) to convert
toxic organics to a less harmful product by using graphite
or noble metal anodes [26, 30, 31].
Researchers from the Institut National de la Recherche
Scientifique du Quebec, INRS-ETE (Centre for Water,
Earth and Environment) have developed a physicochemical
process for extraction of PAH from aluminium wastes [32,
33] and contaminated soils [34, 35]. The process consists in
treating industrial wastes using an amphoteric surfactant
(CAS) in a flotation cell of Denver type containing 9.1% of
pulp density of contaminated waste. The extraction stage
allowed recovering a foam concentrate (foam suspension)
strongly loaded with PAH, which must be treated before
discharge. Therefore, research has focused on a comple-
mentary treatment using either Fenton oxidation process or
electrochemical oxidation in treating PAH-containing
synthetic solution. The most effective process could be
then used in conjunction with the physicochemical process
described above for PAH extraction from wastes.
This study was carried out to compare Fenton oxidation
process and electrochemical oxidation to determine the
most cost-effective process in treating COS strongly loaded
with PAH. COS has been used in this study as a model
solution containing PAH. Subsequently, NAP and PYR
synthetic solutions were individually treated to treatment in
order to determine the nature of the intermediate products
and to elucidate the plausible mechanism of the electro-
chemical transformation of NAP and PYR.
2 Materials and methods
2.1 Creosote oily solution (COS)
Commercially-available creosote used in this study was
provided by Stella-Jones Inc. (Montreal, QC, Canada). It
was comprised of 50% (v/v) of creosote and 50% (v/v) of
petroleum hydrocarbons. The creosote effluent was pre-
pared in a 100 mL glass-tank containing 30 g of oily-cre-
osote in which 1 g of an amphoteric surfactant (CAS,
Chemron, Ohio) was added. Some important characteristics
of the CAS surfactant are shown in Table 2. Conditioning
was carried out by mixing with a Teflon-covered stirring
bar at a speed of 750 rpm for a period of time of 24 h. At
the end of the conditioning stage, the suspension was
transferred into a 20 L polypropylene tank containing 10 L
of distilled water (final concentration = 3.0 g creosote
L-1). The resulting suspension constituted the synthetic
1494 J Appl Electrochem (2010) 40:1493–1510
123

creosote oily solution (COS), which was then settled for at
least 24 h in order to separate the insoluble and suspended
solids from liquid before electrochemical and chemical
oxidation.
2.2 Preparation of individual NAP and PYR solutions
NAP and PYR analytical grade reagents (99% purity) were
obtained from Laboratoire Mat (Beauport, QC, Canada).
The first set of experiments consisted to determine the best
way of solubilizing NAP and PYR, respectively using the
CAS. For that, individual NAP and PYR solutions were
prepared in screw-capped Erlenmeyer flasks containing
0.1 g of NAP and PYR, respectively, in which 0.02–8.15 g
of CAS surfactant and 300 mL distilled water were added
(0.08–27.2 g L-1 of CAS). The mixture was then agitated
in a gyratory shaking system (Lab-line, model 3520) at
250 rpm for 24 h at room temperature (around 22 �C). At
Table 1 Physical and chemical properties of PAH identified in the creosote [47]
PAH Parameters
Abbreviation Molecular
structure
Number of
aromatic rings
Molecular
weight
(g mol-1)
Aqueous
solubility
(25 �C, mg L-1)
Naphthalene NAP C10H8 2 128 31.7
2-Methyl naphtalene MEN C11H10 2 142 24.6
Acenaphtylene ACN C12H8 3 152 3.93
Acenaphtene ACA C12H10 3 154 1.93
Fluorene FLU C13H10 3 166 1.83
Phenanthrene PHE C14H10 3 178 1.20
Anthracene ANT C14H10 3 178 0.076
Fluoranthene FLE C16H10 4 202 0.23
Pyrene PYR C16H10 4 202 0.077
Benzo(a)anthracene BAA C18H12 4 228 0.0094
Chrysene CHR C18H12 4 228 0.0018
Benzo(b,j,k)fluoranthene BJK C20H12 5 252 0.0015
Benzo(a)pyrene BAP C20H12 5 252 0.0016
Dibenzo(a,h)anthracene DAN C22H14 5 278 0.0005
Indeno(1,2,3-c,d)pyrene INP C20H12 6 276 0.062
Benzo(ghi)perylene BPR C20H12 6 276 0.0003
Table 2 Characteristics of the CAS surfactant [48, 49]
Cocoamidopropyl hydroxysultaıne (CAS)
Molecular structure
Formula CH3(CH2)13–N(OH)–(CH2)3–N?(CH3)2–CH2–CHOH–CH2SO3-
MWa (g mol-1) 452
Density (g mL-1) 1.11
CMCb (mol L-1) 5 9 10-5
Biodegradability (%) 96%
a Molecular weightb Critical micelle concentration
J Appl Electrochem (2010) 40:1493–1510 1495
123

the end of the conditioning stage, the suspension was fil-
trated Whatman No. 5 membranes (2.5 lm pore diameter,
Whatman International Ltd, Maidstone, England) under
vacuum in order to separate the insoluble and suspended
particles from the suspension. The filtrate was then
recovered for analysis of NAP and PYR concentrations.
For electrochemical treatment, individual NAP and PYR
synthetic solutions were also prepared using the same
procedure by imposing 8.15 g of CAS surfactant in the
presence of 0.1 g of NAP and PYR, respectively, and
300 mL distilled was added. After agitation and vacuum
filtration of the suspension, the filtrate was then transferred
into a tank and diluted to 2.0 L of distilled water (final
concentration of CAS = 4.1 g L-1). These synthetic NAP
and PYR solutions were agitated for a 30 min before
electrochemical treatment. The initial concentrations of
NAP and PYR were 106 and 54 mg L-1, respectively.
2.3 Fenton oxidation
Experiments were conducted at room temperature in 500 mL
Erlenmeyer glass-flasks, covered with aluminum foil to avoid
any photolytic degradation. All the experiments were done in
duplicate. For all assays, a working volume of 250 mL of COS
was used. COS was mixed by a magnetic agitator using a
Teflon-covered stirring bar at 200–300 rpm. Initial pH was
adjusted between 2 and 9 using sulphuric acid (H2SO4,
5 mol L-1) or sodium hydroxide (NaOH, 2 mol L-1).
Sodium hydroxide and sulphuric acid were analytical grade
reagents and supplied by Fisher Scientific. The ferrous iron
and hydrogen peroxide solutions, freshly prepared in stock
concentrations, were successively added. Ferrous iron was
added as FeSO4�7H2O (Laboratoire Mat, Beauport, QC,
Canada). A stock solution (15 g Fe2? L-1) was prepared with
milli-Q water at a pH 2 to avoid ferrous ions precipitation. A
fixed concentration of 0.90 g Fe2? L-1 (1.7 mol Fe2? L-1)
was imposed during the tests, while various concentrations of
hydrogen peroxide were tested. Hydrogen peroxide was pro-
vided by Fisher Scientific (H2O2, 30% v/v). The stock solution
of H2O2 was also prepared with prepared milli-Q water at a
concentration of 50 g H2O2 L-1. Hydrogen peroxide con-
centrations varied from 0.06 to 0.60 g L-1 (1.7–
17.6 mol L-1), while H2O2/Fe2? molar ratios ranged between
1.1 and 11. Time zero was sampled just before the addition of
hydrogen peroxide to the COS. The Fenton’s reaction was
then started upon addition of H2O2. At the end of the treatment
(after 60 min of agitation), an aliquot (250 mL) was with-
drawn and conditioned before residual PAH analysis.
2.4 Electrochemical oxidation
Electrochemical oxidation of PAH in synthetic solution
was carried out in a batch electrolytic cell made of acrylic
material with a dimension of 12 cm (width) 9 12 cm
(length) 9 19 cm (depth) (Fig. 1). The electrode sets
(anode and cathode) consisted of ten parallel plates of
metal with a distance inter-electrode of 1 cm. Five anodes
and five cathodes alternated in the electrode pack. The
electrodes were placed in stable position and submerged in
COS. The anodes were made of expanded titanium (Ti)
covered with ruthenium oxide (RuO2), each one having a
solid surface area of 65 cm2 and a void area of 45 cm2. The
cathodes were made of stainless steel plates (SS, 316L) of
10 cm width and 11 cm height. The electrodes were placed
2 cm from the bottom of the cell. Mixing in the cell was
achieved by a Teflon-covered stirring bar installed between
the set of electrodes and the bottom of the cell. For all tests,
a working volume of 1.5 L was used. The anodes and
cathodes were connected, respectively to the positive and
negative outlets of a DC power supply Xantrex XFR 40-70
(Aca Tmetrix, Mississauga, ON, Canada). During the set of
electrochemical oxidation experiments an addition of
sodium sulphate (0.5 g Na2SO4 L-1) was necessary to
increase the electrical conductivity. The electrochemical
cells were operated under galvanostatic conditions, with
current densities varying from 4.0 to 13 mA cm-2 applied
for 90 min. Current was held constant for each run. The
influence of pH values ranging from 2.0 to 9.0 was tested.
Between two tests, electrolytic cell (including the elec-
trodes) was cleaned with 5% (v/v) nitric acid solution for at
least 30 min and then rubbed with a sponge and rinsed with
tap water.
2.5 Extraction and purification procedure
After application of Fenton and electrochemical oxidation
processes in the synthetic solutions, the residual PAH
contents were separated from the aqueous suspensions by
extraction and purification on a solid phase using poly-
propylene-cartridges (Enviro-Clean sorbents, United
Chemical Technology Inc.) before analyses. The Enviro-
Clean polypropylene-cartridge was successively condi-
tioned by rinsing with 10 mL of dichloromethane (99.9%
ACS reagent, EMD chemicals Inc., USA), 10 mL of
methanol (99.8% reagent, Fisher Scientific, Canada) and
10 mL of distilled water. Subsequently, 250 mL of samples
(treated and untreated synthetic solutions) containing
10 mL of methanol were loaded onto the cartridge where
they are entirely filtered drip. PAH retained on the poly-
propylene-cartridge were then eluted with 10 mL of
dichloromethane. After elution, the sample was transferred
into a filter containing anhydrous MgSO4 (EMD chemicals
Inc., USA) in order to eliminate all traces of water, fol-
lowed by evaporation of dichloromethane using a rotary
evaporator (Buchi Rotavapor-R, Rico Instrument Co.). The
extraction solution was diluted with dichloromethane, and
1496 J Appl Electrochem (2010) 40:1493–1510
123

a series of diluted solution (1 9 10 9 100) was prepared
before analyses.
2.6 Gas chromatographic analysis
PAHs were quantified using a Perkin Elmer 500 gas
chromatograph (GC) on a VF-5MS-FS column (0.25 mm
diameter, 30 m long and 0.25 lm film thickness) coupled
to a Perkin Elmer Clarus 500 series mass spectrometer
detector operated with a mass range between m/z 50 and
450. The GC column temperature was programmed as
follows: it was first maintained at 80 �C for 2 min, then
heated at a rate of 15 �C min-1 up to 220 �C and then
heated at a rate of 5 �C min-1 up to 320 �C, after which it
was held at this temperature for 5 min. The injection
temperature was maintained at 250 �C. The carrier gas was
helium and column flow was maintained at 2.0 mL/min. A
PAH mixture containing 16 PAHs at a concentration of
1 000 mg L-1 in dichloromethane-benzene (3:1) (Supelco,
Canada) was used as a PAH standard.
2.7 Formation of oxidation by-products
For identification of by-products formed during PAH oxi-
dation, due to the low sensitivity of the detectors used, pre-
concentration of the aqueous solution was performed by
solid-phase extraction onto polypropylene-cartridges
(Enviro-Clean sorbents, United Chemical Technology Inc).
Cartridges were conditioned successively with 10 mL ali-
quots of dichloromethane, methanol and milli-Q water and
PAH were eluted with 10 mL dichloromethane. The
obtained fractions were analyzed using a Perkin Elmer 500
gas chromatograph (GC) coupled to a mass spectrometer
(MS) equipped with a simultaneous Selected ion and full
ion scanning (SIFIS). It is worth noting that by-products
were only identified while treating NAP and PYR synthetic
solution by means of electrochemical oxidation process.
Full scan ion monitoring is by far the most prevalent mode
of operation often used for semi-volatile organic compound
detection. Indeed, by-products from NAP and PYR oxi-
dation were identified in full scans mode and by using the
help of National Institute of Standards and Technology
(NIST) library. It covers the necessary mass range and
provides classical spectra that can be library searched for
positive identification.
2.8 Analytical techniques
The pH was determined using a pH-meter (Fisher Acumet
model 915) equipped with a double-junction Cole-Palmer
electrode with Ag/AgCl reference cell. A conductivity
meter (Oakton Model 510) was used to determine the ionic
conductivity of the effluent. The temperature of treated-
effluent was monitored using a thermo-meter (Cole-Parmer
model Thermo scientific Ertco). COD was determined by
Hach COD method.
2.9 Cost assessment
The economic study included chemical and energy con-
sumption. The energy consumed was estimated at a cost of
0.06 US$ kWh-1, which corresponded to the cost in the
province of Quebec (Canada). The electrolyte (Na2SO4
industrial grade) provided by Laboratoire Mat (Beauport,
QC, Canada) was estimated at a cost of 0.30 US$ kg-1.
Unitary costs of 1,600 US$ t-1 H2O2 and 100 US$ t-1
FeSO4.7H2O were also considered for Fenton reagents. The
total cost was evaluated in terms of U.S. dollars spent per
cubic meter of treated solution (US$ m-3).
3 Results and discussion
3.1 PAH oxidation in COS using Fenton oxidation
Experiments were first conducted using Fenton oxidation in
COS. Results obtained for different experiments are shown
in Table 3 and compared to the initial solution (i.e., no
reagent addition). 16 PAH were investigated in the creosote
solution and were comprised of different number of aro-
matic rings (2-, 3-, 4-, 5- and 6-ring PAH). The lowest
residual concentration of PAH in solution was obtained
while imposing a H2O2/Fe2? ratio of 11.0 with a percent-
age of PAH degradation of 44.7%. The residual total PAH
concentrations decreased while increasing H2O2/Fe2? ratio.
It can also be seen that 3-ring PAH (ACN, ACA, FLU,
PHE and ANT) were present in the highest residual
Fig. 1 Electrolytic cell
J Appl Electrochem (2010) 40:1493–1510 1497
123

concentration with the percentage of degradation ranging
from 7.4 to 42%. By comparison, the yields of degradation
of the 4-ring PAH (FLE, PYR, BAA and CHR) ranged
between 6.0 and 40%, whereas 5.3 to 44% were recorded
with 2-ring PAH (NAP and MEN). The yields of degra-
dation of the 5-ring PAH (BJK, BAP and DAN) ranged
between 4.7 and 58%. The lowest yields of PAH degra-
dation from creosote were recorded for 6-ring PAH (INP
and BPR) with the percentage ranging from 1.2 to 30%.
Using a H2O2/Fe2? ratio of 11.0, the rates of PAH degra-
dation (around 40–44%) were quite similar regardless of
the number of aromatic rings (2-, 3- and 4-ring PAH) by
considering only the compounds present in the highest
concentration in creosote solution. The highest yields of
PAH degradation recorded at a high H2O2/Fe2? ratio of 11
were quite similar to those obtained by Flotron et al. [2]
while studying Fenton’s reagent process for removal of
sorbed PAH from soil, sludge and sediment samples. They
studied the oxidation system in the presence of hydrogen
peroxide (i.e., H2O2/Fe2? = 10), and 60% of benzo[a]-
pyrene was degraded; H2O2/Fe2? = 10 values being the
theoretically optimal ratio according to Tang and Huang
(1996). The treatment cost was estimated to 1.28 $ m-3
(including only the chemical costs, H2O2 and FeSO4) with
this chemical ratio.
To investigate the effect of initial pH on the removal
efficiency, initial pH of the COS was adjusted between 2
and 9 using H2SO4 and NaOH. In addition, a control assay
was carried out without pH adjustment (original pH was
around 5.8). During these assays, the H2O2/Fe2? ratio was
maintained at 11.0 and a retention time of 60 min. The
results are shown in Table 4. It was found that COS having
an initial pH close to pH 4.0 was more favorable for PAH
reduction (PAH removal of 49% were recorded), compared
to 42% recorded with the original pH or with an initial pH
of 9.0. This is consistent with the results of Goel et al. [11]
while oxidizing NAP using Fenton’s oxidation process.
The best results (NAP removal of 99%) were obtained at a
pH 4.0 in the presence of 30 mg Fe2? L-1 and a concen-
tration of hydroxide peroxide varying between 10 and
12 mg L-1. The efficiency of the process depended
strongly on the composition of effluent and the concen-
tration of pollutants. In the case of Goel et al. [11], author
used a synthetic NAP solution (only two aromatic rings)
with an initial concentration of 9.8 ± 1.5 mg NAP L-1.
By comparison, COS submitted to chemical oxidation
contained different types of aromatic rings (two to six
aromatic rings) and the initial concentration of total PAH
varied from 340 to 360 mg L-1 (35–37 times higher than
that tested by Goel et al. [11]). This is one of the reasons
for which the rates of PAH removal were lower than that
receded by Goel et al. [11].
3.2 PAH oxidation in COS using electrochemical
oxidation
We compared Fenton oxidation process to electrochemical
treatment using Ti/RuO2 anodes. Residual PAH concen-
tration and PAH removal were examined as a function of
current density. The residual PAH concentrations (80–
111 mg L-1) recorded at the end of the treatment were
lower than those measured using Fenton’s oxidation pro-
cess (209–340 mg L-1). The yields of PAH degradation
increased with current density until 9.23 mA cm-2 and
then remained quite stable at 12.3 mA cm-2. Using a
current density of 9.23 mA cm-2, the rates of PAH deg-
radation (around 81–84%) were quite similar regardless of
the number of aromatic rings (2-, 3-, 4-, 5- and 6-ring
PAH). The rates of electrochemical degradation of PAH
in COS were approximately two times higher than that
recorded while applying Fenton’s chemical oxidation
process using a H2O2/Fe2? ratio of 11. This can be
explained by two main factors. Firstly, the anodic oxida-
tion of pollutant occurs heterogeneously. Most of PAH
compound are hydrophobic compounds so that they can
be easily adsorbed on the anode electrode surface and
then be effectively oxidized there. Secondly, in our
experimental conditions, electrochemical treatment using
Ti/RuO2 anode and operated at a current density of
9.23 mA cm-2 was probably more effective in producing
hydroxyl radical than Fenton’s oxidation process operated
at H2O2/Fe2? ratio of 11.0. Likewise, electrochemical
system provides a constant supply of hydroxyl radicals
versus Fenton’s process in which H2O2 is added only
once. However, the treatment cost of electrochemical
treatment (5.11 US$ m-3) operated at the optimal current
density of 9.23 mA cm-2 was four times higher than that
(1.28 US$ m-3) recorded while applying Fenton’s oxida-
tion process using H2O2/Fe2? molar ratio of 11.0. The
removal efficiency at four different initial pH values (2.0,
4.0, 7.0, and 9.0) was also investigated. During these
assays, the current density was maintained at
9.23 mA cm-2 and a retention time of 90 min was
imposed. The results are shown in Table 4. It was found
that COS having an initial pH close to the neutral value
(pH 7.0) was more favorable for PAH reduction (PAH
removal of 81 and 84% were recorded, respectively). This
is consistent with the results of Yavuz and Kaporal [36]
while oxidizing phenol using ruthenium mixed metal
oxide electrode. They reported that electrooxidation
around pH 7.0 was more effective in removing phenol,
compared to pH 3.0 and pH 11.0. However, one study
showed that the pH effect is not significant while oxi-
dizing orange II dye on Ti/BDD anode at a current density
imposed of 200 mA m-2 [37].
1498 J Appl Electrochem (2010) 40:1493–1510
123

3.3 NAP and PYR solubilization in CAS solution
The first set of experiments consisted to determine the best
way of solubilizing NAP and PYR (analytical grade
reagents), respectively using an amphoteric surfactant
(CAS). Different molar concentrations of CAS (0.08–
27.1 g L-1) were tested with a constant amount of NAP
(0.1 g) and PYR (0.1 g) added in the reactor during the
tests. The results are shown in Fig. 2. At low concentra-
tions of CAS (\2.5 g L-1), the NAP and PYR solubility
remained very low (PAH concentration almost below
detection limit). This can be attributed to the fact that, the
amount of CAS was not sufficient to reach the critical point
to initiate micelle formation (Critical micelle concentra-
tion, CMC), 2.5 g L-1 and subsequent micelle–PAH
complex formation allowing an effective PAH solubiliza-
tion. However, when the CAS concentration increased
from 5.0 to 27 g L-1, the micelle formation increased and
the concentration of both (NAP and PYR) increased line-
arly. The concentration of NAP increased with a relatively
high slope compared to that recorded for PYR. For the
same concentration of CAS, NAP was more solubilized
than PYR. It is well-known that, as the number of aromatic
of PAH increases, the solubility in solution decreases. This
is one the reason for which PYR (4-ring PAH) was less
solubilized than NAP (2-ring PAH). It can be interesting to
calculate the MSR and compared to the values with those
obtained under different experimental conditions. The
molar solubilisation ratio (MSR) can be defined as follows
[38]:
Table 3 Comparison between Fenton oxidation and electrochemical oxidation during the treatment of creosote oily solution
PAH Fenton oxidation Electrochemical oxidation
Initial H2O2/Fe2? molar ratios Initial Current densities (mA cm-2)
1.1 2.2 4.4 6.6 11.0 4.62 6.15 9.23 12.30
2-ring PAH
NAP (mg L-1) 27.5 26.4 25.8 17.4 16.4 14.2 70.1 21.7 21.7 13.6 11.5
MEN (mg L-1) 30.2 28.2 27.8 25.2 27.8 17.8 53.7 13.0 11.6 8.83 7.30
Sum (mg L-1) 57.7 54.6 53.6 42.6 44.2 32.0 124 34.7 33.3 22.4 18.8
3-ring PAH
ACN (mg L-1) 2.26 2.12 2.08 1.20 1.08 1.02 3.02 1.52 1.08 0.68 0.66
ACA (mg L-1) 32.4 32.4 32.0 28.6 24.2 16.0 57.1 12.2 11.1 9.40 9.59
FLU (mg L-1) 39.6 33.3 32.2 24.2 22.6 19.4 38.8 9.87 10.1 9.51 9.12
PHE (mg L-1) 67.7 57.3 56.8 44.3 43.3 39.6 84.4 22.4 21.9 17.7 18.2
ANT (mg L-1) 92.1 91.6 88.4 90.8 91.4 59.0 15.3 4.09 4.21 2.95 3.63
Sum (mg L-1) 234 217 211 189 183 135 199 50.1 48.4 40.2 41.2
4-ring PAH
FLE (mg L-1) 36.8 34.0 32.4 31.8 35.2 24.8 40.5 10.7 10.6 8.42 8.99
PYR (mg L-1) 16.9 16.1 16.2 12.0 13.0 8.40 31.5 8.55 8.07 5.91 5.53
BAA (mg L-1) 3.91 3.80 3.46 2.48 2.49 2.32 6.02 2.29 2.28 1.26 1.76
CHR (mg L-1) 5.92 5.80 5.67 3.90 3.60 2.40 8.31 2.26 2.48 1.78 1.94
Sum (mg L-1) 63.5 59.7 57.7 50.2 54.3 37.9 86.3 23.8 23.4 17.4 18.2
5-ring PAH
BJK (mg L-1) 2.93 2.80 2.60 1.80 2.00 1.22 5.86 1.43 1.37 1.25 1.24
BAP (mg L-1) 4.76 4.54 4.28 3.89 3.56 1.95 2.23 0.62 0.55 0.47 0.49
DAN (mg L-1) 0.11 0.091 0.09 0.08 0.08 0.075 1.09 0.28 0.25 0.20 0.21
Sum (mg L-1) 7.80 7.43 6.97 5.77 5.64 3.24 9.18 2.33 2.17 1.92 1.94
6-ring PAH
INP (mg L-1) 1.12 0.98 0.96 0.81 0.82 0.76 0.17 0.08 0.06 0.05 0.05
BPR (mg L-1) 0.58 0.51 0.55 0.46 0.41 0.42 0.43 0.17 0.16 0.08 0.08
Sum (mg L-1) 1.70 1.49 1.51 1.27 1.23 1.18 0.60 0.25 0.22 0.13 0.13P
PAH (mg L-1) 365 340 331 289 288 209 418 111 108 82.1 80.4
Degradation (%) – 7.3 9.6 26.9 27.9 44.7 – 73.5 75.7 82.1 81.6
Costs($ m-3) 0.41 0.51 0.70 0.89 1.28 1.84 3.34 5.11 8.78
J Appl Electrochem (2010) 40:1493–1510 1499
123

MSR ¼ CO � CO;CMC
CS � CCMCð1Þ
where ‘‘CO’’ is the molar concentration of organic
compound in surfactant solution, ‘‘CS’’ is the surfactant
concentration at which CO is evaluated, and ‘‘CO,CMC’’ is
molar concentration of organic at CCMC. The MSR can
be determined from the slope of solubility curve beyond
the CMC when concentration is expressed in molarities.
MSR values of NAP and PYR obtained for CAS are
0.176 and 0.033, respectively, in the investigated range
of 0.08–27.2 g CAS L-1. The MSR value for NAP was
five times higher than that recorded for PYR, confirming
the relatively high solubility of NAP compared to
PYR.
3.4 Effectiveness of electrooxidation in treating
synthetic NAP and PYR solutions
Experiments were carried out using the electrolytic cell
described in Fig. 1 at a current density of 9.23 mA cm-2
for different treatment time (30, 60, 90 and 180 min). The
rates of NAP and PYR degradation were obtained by
subtracting the residual concentration from the initial value
recorded in solution and the resulting operation was divi-
ded by the same initial concentration of NAP and PYR,
respectively. Figure 3 shows time course changes in the
normalized concentration of NAP and PYR. The initial
NAP and PYR concentrations imposed during these tests
were 106 mg L-1 and 54 mg L-1, respectively. Residual
NAP and PYR concentration decreased rapidly over
Table 4 Influence of initial pH during the treatment of COS using either Fenton oxidation or electrochemical oxidation
PAH Fenton oxidationa Electrochemical oxidationb
Initial pH adjustment Initial pH adjustment
2.6 4.0 5.8 7.0 9.0 2.0 4.0 7.0 9.0
2-ring PAH
NAP (mg L-1) 25.3 7.81 6.23 8.81 8.26 12.2 72.4 14.1 13.0 10.9 16.7
MEN (mg L-1) 32.5 17.8 17.5 18.4 21.5 20.4 69.0 11.3 9.70 7.88 13.7
Sum (mg L-1) 57.8 25.6 23.7 27.2 29.7 32.6 141 25.4 22.7 18.8 30.4
3-ring PAH
ACN (mg L-1) 2.10 0.93 0.85 1.08 0.96 1.01 3.25 0.78 0.76 0.59 0.83
ACA (mg L-1) 58.0 23.2 23.4 24.2 29.4 26.8 75.3 11.9 11.9 9.19 14.3
FLU (mg L-1) 40.0 17.8 18.1 19.9 20.6 20.8 50.1 11.7 10.5 9.48 12.0
PHE (mg L-1) 67.6 37.6 38.6 46.8 34.4 39.2 113 22.4 24.6 17.3 22.7
ANT (mg L-1) 12.3 5.09 5.23 5.73 7.19 6.32 13.3 2.36 2.25 2.06 2.91
Sum (mg L-1) 180 84.6 86.2 97.7 92.6 94.1 255 49.1 50.0 38.6 52.8
4-ring PAH
FLE (mg L-1) 36.9 24.4 23.6 25.4 29.3 25.7 55.1 13.4 10.9 8.34 12.5
PYR (mg L-1) 36.8 17.3 17.2 17.4 23.3 18.8 35.4 9.49 7.65 6.50 8.81
BAA (mg L-1) 11.2 5.49 5.50 6.65 5.89 6.21 7.94 1.26 1.29 1.41 2.24
CHR (mg L-1) 5.90 5.21 4.80 5.81 5.49 5.65 9.70 2.35 2.09 2.34 2.92
Sum (mg L-1) 90.8 52.4 51.1 55.3 64.0 56.4 108 26.5 21.9 18.6 26.5
5-ring PAH
BJK (mg L-1) 6.21 3.60 3.20 4.41 3.95 3.20 4.94 1.24 1.41 0.58 1.55
BAP (mg L-1) 4.82 2.73 2.41 2.82 2.51 2.92 1.56 0.26 0.26 0.19 0.27
DAN (mg L-1) 1.12 0.65 0.45 0.57 0.69 0.55 1.00 0.25 0.24 0.23 0.34
Sum (mg L-1) 12.2 6.98 6.06 7.80 7.15 6.67 7.50 1.75 1.91 1.00 2.16
6-ring PAH
INP (mg L-1) 0.12 0.08 0.08 0.07 0.08 0.08 0.30 0.06 0.05 0.04 0.07
BPR (mg L-1) 0.61 0.39 0.39 0.44 0.43 0.38 0.30 0.08 0.05 0.06 0.06
Sum (mg L-1) 0.73 0.47 0.47 0.51 0.51 0.46 0.60 0.14 0.10 0.10 0.13P
PAH (mg L-1) 342 170 168 189 194 190 513 103 96.7 77.1 112
Degradation (%) – 45.9 48.9 41.5 40.1 42.0 – 78.4 80.2 83.6 75.7
1500 J Appl Electrochem (2010) 40:1493–1510
123

90 min of the treatment and then remained quite stable
until the end of experiment (Fig. 3). NAP concentration
decreased from 106 to 22 mg L-1 after 90 min, which
corresponded to 79% of NAP removal. By comparison,
PYR concentration varied from 54 to 14 mg L-1, which
corresponded to 74% of PYR degradation. The rates of
PYR and NAP degradation while treating individually
NAP and PYR solutions were quite similar to those
recorded in COS, 69-84% and 72-82%, respectively. The
reaction order and the rate constant of NAP and PYR can
be determined by plotting Ln (C/C0) against time (t)
(Fig. 3). The experimental data of NAP are fitted well to
first-order kinetics (with correlation coefficients of 0.97)
predicting a linear variation with elapsed time (t) of the
-Ln (C/C0) (Eq. 2). However, the data of PYR did not fit
well to first order kinetic (with correlation coefficients of
0.78).
�LnC
C0
� �
¼ k:t ð2Þ
where ‘‘C0’’ and ‘‘C’’ represent, respectively the initial and
residual NAP or PYR concentration in the bulk solution and
‘‘k’’ is the first-order rate coefficient. The reaction rate con-
stants for NAP degradation was 0.015 min-1. It is interesting
to compare the reaction rate constant of NAP degradation in
synthetic solution with those obtained by others authors
under different experimental conditions. The reaction rate
constant of organic compound degradation has been deter-
mined by Kim et al. [39] while studying electrochemical
oxidation of polyvinyl alcohol (PVA) using titanium coated
with ruthenium oxide (Ti/RuO2). The constant rate
decreased from 0.0162 min-1 to 0.0021 min-1 while
increasing initial PVA concentration from 33 to
2400 mg L-1, using a current density of 1.34 mA cm-2 and
0.61 g Cl- L-1. The smaller the initial PVA concentration,
the faster it could be removed from solution by anodic oxi-
dation. The kinetic rate constant was the same order of
magnitude in the present study and in the study carried out by
Kim et al. [39] for low concentration of pollutants.
The effectiveness of the electrooxidation system was
also evaluated by measuring the residual COD concentra-
tion in the solution throughout the course of the treatment.
Figure 4 shows time course changes in the normalized
COD concentration while treating synthetic NAP and PYR
solutions. The initial COD concentration of NAP and PYR
solutions during these assays were 1188 mg L-1 and
1271 mg L-1. For both solutions, COD decreased in the
same fashion. At the end of the treatment (after 180 min),
the COD reduction was 46% using either NAP or PYR
synthetic solution. The results are also summarized in
Table 4. The relatively low yield of COD removal (46%)
compared to 94 and 80% of NAP and PYR degradation,
indicated that only a small fraction of pollutants were
completely oxidized into water and carbon dioxide, the
majority of the pollutants being transformed into small
molecules that consume oxygen in the treated-solution. In
our experimental conditions, direct anodic oxidation was
Fig. 2 Solubilization of NAP and PYR by CAS surfactant: (filledcircle) NAP; (open circle) PYR
Fig. 3 Degradation kinetics of NAP and PYR in CAS solutions
during electrochemical treatment operated at 9.23 mA cm-2; Initial
NAP = 106 mg L-1; Initial PYR = 54 mg L-1: (filled circle) NAP;
(open circle) PYR
J Appl Electrochem (2010) 40:1493–1510 1501
123

CAS - initial
0.00E+00
1.00E+08
2.00E+08
3.00E+08
4.00E+08
5.00E+08
6.00E+08
7.00E+08
Retention time (minutes)ab
un
dan
ce
CAS - 60min
0.00E+00
2.00E+08
4.00E+08
6.00E+08
8.00E+08
1.00E+09
1.20E+09
1.40E+09
1.60E+09
1.80E+09
Retention time (minutes)
abu
nd
ance
(C-1)
(C-2)
(C-3)
(C-4)
(C-5)
(C-6)
CAS - 90 min
0.00E+00
2.00E+08
4.00E+08
6.00E+08
8.00E+08
1.00E+09
1.20E+09
1.40E+09
1.60E+09
1.80E+09
4 6 8 10 12 14 16
4 6 8 10 12 14 16
4 6 8 10 12 14 16
Retention time (minutes)
Ab
ou
nd
ance (C-1)
(C-3)
(C-5)
(C-2) (C-4)(C-6)
Fig. 4 Chromatograms extracts
obtained before, during
(60 min) and after (90 min) by
CAS electrooxidation. Current
density = 9.23 mA cm-2;
[Na2SO4] = 0.5 mg L-1;
[CAS] = 1 g L-1
Table 5 Composition residual concentration (mg L-1) depending on the reaction time
Matrixes Parameters Electrochemical treatment (min) Removal (%)
0 30 60 90 180
NAP ? CAS NAP 106 62.5 58.4 21.8 6.64 94
COD 1188 994 991 737 643 46
Cl- 57.8 54.3 51.5 48.5 41.0 29
PYR ? CAS PYR 54.1 29.0 24.8 13.8 10.6 80
COD 1271 980 922 818 690 46
Cl- 56.1 50.6 47.9 45.4 37.0 34
CAS COD 1095 916 904 859 821 25
Cl- 55.9 50.0 49.5 47.2 40.8 27
1502 J Appl Electrochem (2010) 40:1493–1510
123

the predominant reaction. However, indirect oxidation may
have taken place owing to the presence of chloride ions
measured in the synthetic solutions. As it can be seen from
Table 5, chloride ions were originated from CAS solution.
Chloride concentration varied from the initial value around
56-58 mg L-1 to the final values varying from 37 to
41 mg L-1 (27–34% of chloride consumption) owing
probably to chloride ions oxidation at the anode (Ti/RuO2)
electrodes to chlorine gas. The chlorine gas reacts imme-
diately with water to form hypochlorous acid (HClO) [40,
41].
In general, the oxidation of chloride ion can be observed
on DSA, such as Ti/RuO2 [40]. In dilute chloride solution,
a parallel reaction occurs on such anode electrode con-
comitant with the formation of chlorine, i.e., hydroxyl
radical and oxygen evolution reactions. Likewise, from
Table 5, it can also be seen that, 25% of COD was removed
while only CAS solution was submitted to electrolysis. It is
also possible from Table 5 to make approximate calcula-
tions and see whether or not the non-degradable COD was
from CAS while electrolyzing individual NAP and PYR
solutions. For instance, an initial COD concentration of
1271 mg L-1 was recorded while the mixture comprised of
PYR and CAS was prepared. By comparison, when CAS
solution was prepared alone, an initial COD concentration
of 1095 mg L-1 was measured. Thus, in the PYR ? CAS
matrix, 14% of COD was due to PYR compound, whereas
86% was attributed to CAS alone. The percentage of PYR
contribution to the COD measurement was estimated by
subtracting the COD concentration of the PYR ? CAS
matrix from the COD concentration of the CAS solution
divided by the total COD of the mixture comprised of PYR
and CAS. At the end of electro-oxidation treatment of
PYR ? CAS matrix, a residual COD concentration of
690 mg L-1 was recorded, 14% of this value being
attributed to PYR alone (97 mg L-1) versus 86% for CAS
(mainlib) ç Dodecalactone50 60 70 80 90 100 110 120 130 140 150 160 170 180 190
0
50
100
55
60
69
85
100
110128
162
O O
(replib) Tetradecanoic acid50 70 90 110 130 150 170 190 210 230 250
0
50
100
55
60
73
87
97 115
129
143
157
171
185
199
228
OH
O
(C-2)(C-1)
(replib) 2(3H)-Furanone, 5-heptyldihydro-50 70 90 110 130 150 170 190 210
0
50
100
5569
85
100114
128
OO
(replib) n-Hexadecanoic acid50 70 90 110 130 150 170 190 210 230 250 270
0
50
100
55
60
73
8397
115129
143 157 171 185 213227
256
OH
O
(C-4)(C-3)
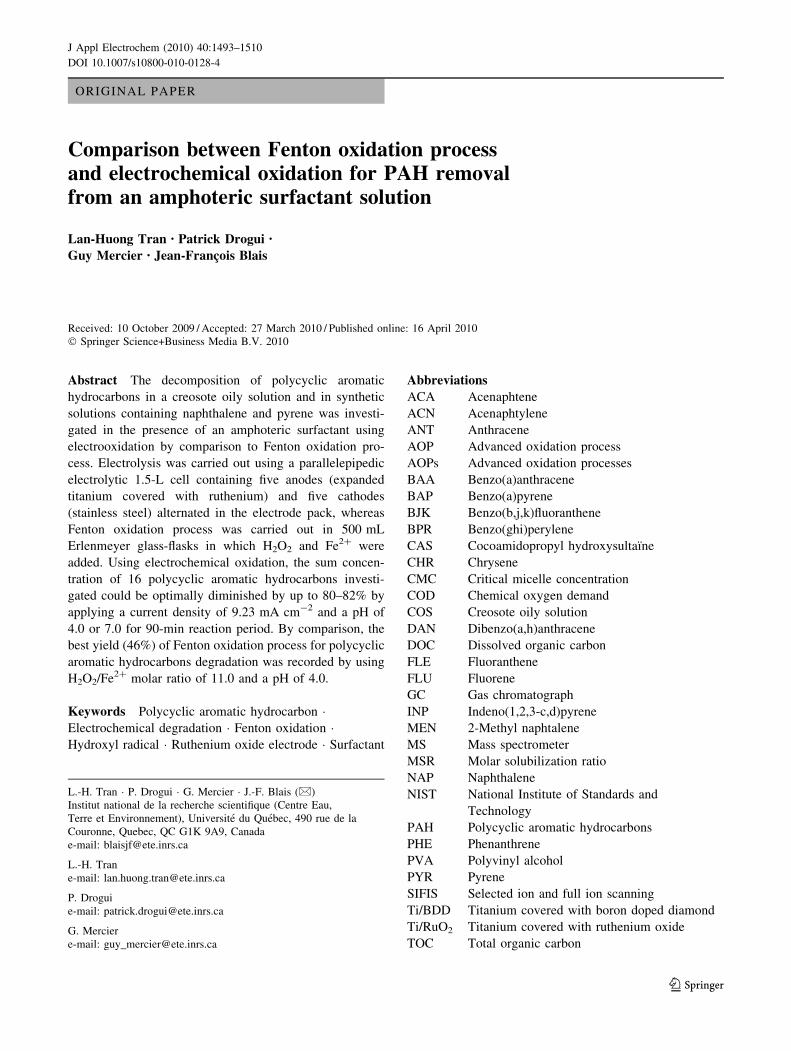
Fig. 5 Mass spectra of some by-products of CAS electrooxidation
J Appl Electrochem (2010) 40:1493–1510 1503
123
alone (593 mg L-1). Consequently, most of the non-
degradable COD was from CAS. For NAP ? CAS matrix,
the same trend can be observed.
Degradation of surfactant (anionic and cationic surfac-
tant) using electrochemical technology has been also car-
ried out by Lissens et al. [41] and Panizza et al. [42]. Direct
anodic oxidation of sodium dodecyl benzene sulfonate and
hexadecyltrimethyl ammonium chloride has been studied
using BDD electrode in batch electrolysis mode operated at
a current density of 4 mA cm-2. 83% TOC removal has
been recorded for sodium dodecyl benzene sulfonate by
Lissens et al. [41], whereas 68% of TOC removal has been
measured for the hexadecyltrimethyl ammonium chloride
surfactant.
3.5 By-products formation
Our intention is to follow the formation of some by-prod-
ucts, and possibly identify some chemical structures while
treating synthetic solutions containing NAP and PYR,
0.00E+00
1.00E+08
2.00E+08
3.00E+08
4.00E+08
5.00E+08
6.00E+08
7.00E+08
8.00E+08
9.00E+08
1.00E+09
Retention time (minutes)
Ab
un
dan
ce
(F)(NAP)
(a)
(b)
(F)
(F) (CAS)(F) (CAS)
(CAS)
(NAP initial)
0.00E+00
1.00E+08
2.00E+08
3.00E+08
4.00E+08
5.00E+08
6.00E+08
7.00E+08
8.00E+08
9.00E+08
1.00E+09
Retention time (minutes)
Ab
and
ance
NAP(A-2)
(A-1)
(A-3)
(F)
(F)
(A-4) (CAS)
(CAS)(F)
(NAP - 60 min)
0.0E+00
1.0E+08
2.0E+08
3.0E+08
4.0E+08
5.0E+08
6.0E+08
7.0E+08
8.0E+08
9.0E+08
1.0E+09
4 5 6 7 8 9 10 11 12 13 14
4 5 6 7 8 9 10 11 12 13 14
4 5 6 7 8 9 10 11 12 13 14
Retention time (minutes)
Ab
un
dan
ce
NAP
(A-1)
(A-2)
(A-3)
(F)
(F)
(A-4) (F)(CAS)
(CAS)
(NAP - 90 min)
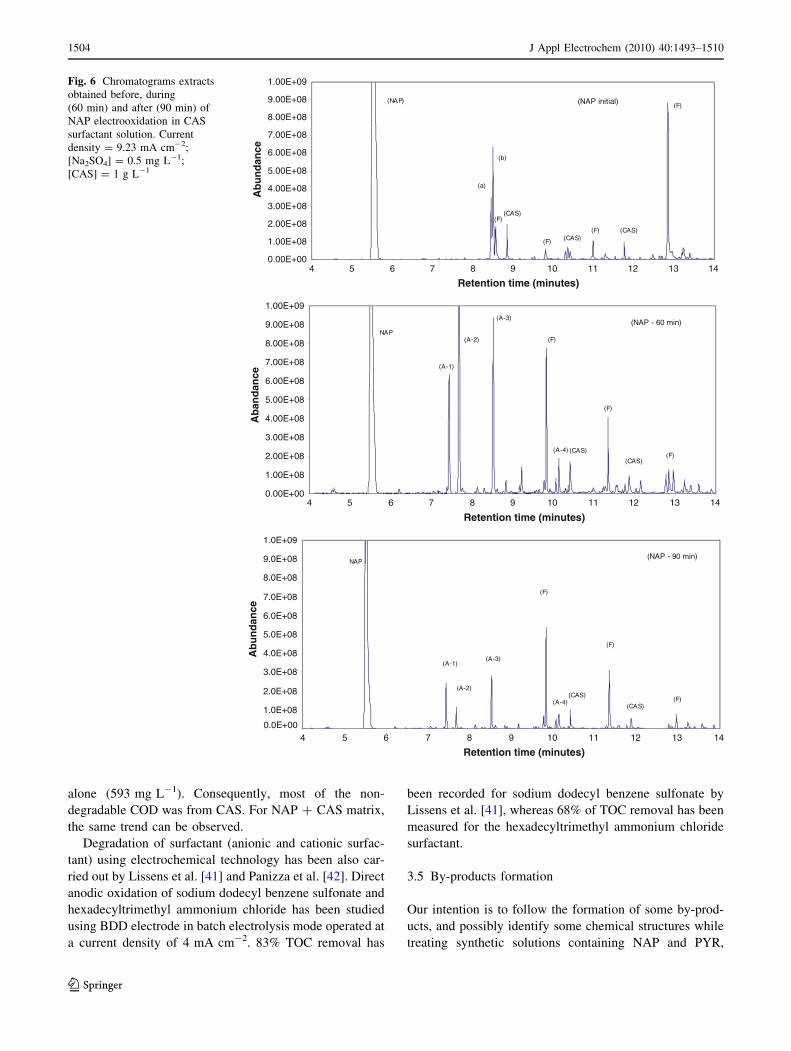
Fig. 6 Chromatograms extracts
obtained before, during
(60 min) and after (90 min) of
NAP electrooxidation in CAS
surfactant solution. Current
density = 9.23 mA cm-2;
[Na2SO4] = 0.5 mg L-1;
[CAS] = 1 g L-1
1504 J Appl Electrochem (2010) 40:1493–1510
123

respectively. The first tests were carried out in order to
verify if the CAS was oxidized during electrolysis. The
electrolysis cell was operated at a current density of
9.23 mA cm-2 though 90 min of treatment in the presence
of 0.5 g Na2SO4 L-1 with initial pH adjustment around 6.4
(to have the same initial conditions while electrolysing
NAP and PYR synthetic solution). The GC–MS results of
the intermediate products for CAS are presented in Figs. 4
and 5. After 60 min of electrolysis, four important peaks
(C-1, C-2, C-3 and C-4) appeared in the gas chromatogram
and represented the intermediate products. They were
analyzed in detail by mass spectroscopy (Fig. 5). These
components C-1, C-2, C-3 and C-4, respectively corre-
sponded to n-hexadecanoic acid, decanenitrile, 1-dode-
canethiol, and furanone, 5-dodecyldihydro (by comparison
of mass spectra with those of NIST mass spectra library). It
could be seen that the concentration of these four inter-
mediates increased during the first 60 min of the electro-
oxidation process, and then decreased with
electrooxidation time, after 90 min of treatment. They all
drop to a very low concentration. It can be concluded that
all these four intermediates were generated during the
initial steps and when the electrooxidation process pursued,
they were gradually oxidized. Likewise, some compounds
such as furanone (having low molecular weight) appeared
during electrolysis.
Subsequently, a synthetic solution containing NAP was
electrolysed and the formation of some by-products was
identified. A typical GC pattern of dichloromethane
extract, containing residual NAP and various reaction
intermediates present in the electrolysed solution after 60
and 90 min is shown in Fig. 6, where compound related to
the starting pollutant show retention time in the range 5–
14 min. Among the peaks observed, some corresponded to
single products, whereas others were subjected to inter-
ference and required MS identification and monitoring. The
identified results for NAP electro-degradation depend on
reaction time (0, 60 and 90 min). The analysis of the initial
NAP (before electrolysis) shows several peaks ((a) (b) (F)
(CAS) and (NAP) peaks) identified and characterized in
Table 6. By comparison, the peaks (A-1) (A-2) (A-3), and
(A-4) in the gas chromatogram were the intermediate
products and were analyzed in detail by mass spectroscopy
(see Fig. 7) after 60 and 90 min of period of electrolysis.
These components (A-1) (A-2) (A-3), and (A-4), respec-
tively corresponded to chloronaphthalene, 1,4 naphthalen-
edione, 1,4-naphthoquinone and 2-ethoxyquinoline (by
comparison of mass spectra with those of NIST mass
spectra library). A list of identified compounds together
with their observed relative abundance in the extract is
given in Table 6. From the gas chromatogram, it could be
seen that these four intermediates increased to a relatively
high concentration during the first 60 min of the electro-
oxidation process, and then decreased with electrooxida-
tion time, after 90 min of treatment. They all drop to a very
low concentration. It can be concluded that all these four
intermediates were generated during the initial steps and
when the electrooxidation process pursued, they were
gradually oxidized. From Table 6, it can be seen that
naphthoquinone was one of the main by-products generated
during electrooxidation process. Similar results have been
recorded while studying oxidative degradation processes of
Table 6 By-products of NAP electrooxidation identified by GC–MS
Products RTa MWb Peaks Abundance (min)
0 60 90
Naphthalene 5.54 128 52 9 108 38 9 108 23 9 108
Chloronaphthalene 7.43 162 (A-1) 6.3 9 108 2.4 9 108
1,4-naphthalenedione 7.68 158 (A-2) 14 9 108 1.2 9 108
2-naphthol 8.46 144 (a) 3.5 9 108 \107 \107
1-naphthol 8.50 144 (b) 6.4 9 108 \107 \107
1,4-naphthoquinone 2,3-oxide 8.52 174 (A-3) 9.4 9 108 2.7 9 108
Undecanoic acid 8.86 186 (CAS) 2.0 9 108 \107 \107
Furanone 9.83 85 (F) 0.5 9 108 7.7 9 108 5.4 9 108
2-Ethoxyquinoline 10.15 173 (A-4) 1.9 9 108 0.8 9 108
Decanamide 10.42 143 (CAS) 1.7 9 108 1.0 9 108
Octanamide,N,N-dimethyl 10.98 171 (CAS) 1.0 9 108 \107 \107
Furanone 11.35 85 (F) 4.0 9 108 3.1 9 108
Tetradecanamide 11.87 198 (CAS) 1.1 9 108 1.0 9 108 0.5 9 108
Furanone 12.96 85 (F) 8.8 9 108 1.2 9 108 0.8 9 108
a Retention time (min)b Molecular weight
J Appl Electrochem (2010) 40:1493–1510 1505
123

NAP using both photoinduced in Fe(III) solution and
photocatalyzed by Q-TiO2 colloids [43]. The primary
degradation intermediates (2-formylcinnamaldehyde, 1,2-
naphthoquinone, 1,4-naphtoquinone, 1-naphthol, 2-naph-
thol) were the same regardless of the photocatalysis system
used. Another study showed that naphthoquinone was
formed as intermediate product while treating NAP syn-
thetic solution using indirect electrooxidation process
where a mediator (CeIII/CeIV) is electrochemically gener-
ated to carry out the oxidation of the pollutant [44].
The GC-MS results of the intermediate products for
PYR are presented in Fig. 8 and Table 7. The peaks (B-1)
(B-2), and (B-3) in the gas chromatogram were the inter-
mediate products and were analyzed by mass spectroscopy
(Fig. 9). These components (B-1) (B-2), and (B-3),
respectively corresponded to chloropyrene, benzo[c]cinn-
oline-2 chloro and sulfonyl-bis (2-nitriloxidophenyl),
which were determined in conformity with NIST mass
spectra library. The intermediates increased to a relatively
high concentration at the start of the electrooxidation
experiment, and then decreased with time, after 90 min of
period of treatment. In particular, chloropyrene (B-2) drop
to a very low concentration. It can be concluded that
chloropyrene was generated during the initial steps and
when the electrooxidation process pursued, it was gradu-
ally oxidized. PYR degradation was also studied by Wen
et al. [45] by using photocatalytic oxidation technique
where PYR was preadsorbed on TiO2. According to these
authors, the ring-open reaction, hydroxylation and ketolysis
occurred to produce some intermediate products (such as
4-oxapyrene-5-one, 1,6 or 1,8 pyrenediones, 4,5-phenan-
threnedialdhyde and cyclopenta[def]phenanthrene). These
intermediates were different to those recorded in the
present study while treating PYR synthetic solution.
(replib) 1,4-Naphthalenedione50 60 70 80 90 100 110 120 130 140 150 160 170
0
50
100
50
66
76
86 98
102
130
158
O
O
(A-1) (A-2)
(mainlib) Naphth[2,3-b]oxirene-2,7-dione, 1a,7a-dihydro-50 70 90 110 130 150 170 190 210
0
50
100
50
63
7689
105
118129
146
158
174
O
O
O
(mainlib) 2-Ethoxyquinoline50 70 90 110 130 150 170 190 210
0
50
100
51
57
63
75
84
89
101
117
129145
158
173
N O
(A-3) (A-4)
(replib) Naphthalene, 1-chloro-50 60 70 80 90 100 110 120 130 140 150 160 170 180
0
50
100
50
63
75
81
87101
127
162
Cl
Fig. 7 Mass spectra of components (A-1) (A-2) (A-3) and (A-4) produced by NAP electrooxidation
1506 J Appl Electrochem (2010) 40:1493–1510
123

PYR - initial
0.00E+00
5.00E+08
1.00E+09
1.50E+09
2.00E+09
Retention time (minutes)ab
un
dan
ce
PYR
(F)
PYR - 60 min
0.00E+00
5.00E+08
1.00E+09
1.50E+09
2.00E+09
Retention time (minutes)
abu
nd
ance PYR
(B-2)
(F)
(F)
(F)
(u) (CAS) (B-3)(B-1)
PYR - 90 min
0.00E+00
5.00E+08
1.00E+09
1.50E+09
2.00E+09
4 6 8 10 12 14 16 18
4 6 8 10 12 14 16
4 6 8 10 12 14 16
Retention time (minutes)
abu
nd
ance
PYR
B-2
(F) (F)
(u)(CAS)
(F)
)3-B()1-B(
Fig. 8 Chromatograms extracts
obtained before, during
(60 min) and after (90 min)
of PYR electrooxidation in CAS
surfactant solution. Current
density = 9.23 mA cm-2;
[Na2SO4] = 0.5 mg L-1;
[CAS] = 1 g L-1
Table 7 By-products of PYR electrooxidation identified by GC-MS
Products RT MW Peaks Abundance (min)
0 60 90
Furanone 9.83 85 (F) 16 9 108 8.7 9 108
Unknown 10.06 99 (u) 1.5 9 108 1.5 9 108
Furanone 11.34 85 (F) 8.0 9 108 8.6 9 108
Hexadecanoic acid 11.77 (CAS) 1.6 9 108 1.1 9 108
Furanone 12.95 (F) 2.9 9 108 3.1 9 108
Pyrene 13.23 PYR 11.6 9 109 10.8 9 108 2.3 9 108
Benzo(c)cinnoline, 2-chloro 13.58 (B1) 0.2 9 108 0.2 9 108
Chloropyrene 15.34 (B2) 19.8 9 108 6.7 9 108
Sulfonyl-bis (2-nitriloxidophenyl) 16.53 (B3) 0.7 9 108 0.3 9 108
J Appl Electrochem (2010) 40:1493–1510 1507
123

3.6 Proposed mechanisms of NAP and PYR
degradation
Based on the found primary intermediates, reaction path-
ways of the NAP degradation can be proposed (Fig. 10).
Firstly, hydroxyl radical produced on anode electrode
reacts with NAP and leads to the formation of 1,4-naph-
thalenedione (A-2). Subsequently, 1,4-naphthalenedione
is oxidized by hydroxyl radical and 1,4-naphthoquinone
(A-3) is formed. Naphtoquinone compounds should con-
secutively transform via next attacks of hydroxyl radical
into further intermediates, including ring-opened struc-
tures. The subsequent oxidation of the ring-opened struc-
ture may results in fully oxidized reaction products and
leads to the formation of carbon dioxide (CO2). This
hypothesized of CO2 formation is based on the results
described elsewhere [46]. In the previous study, the per-
formance of the electrolytic cell has been evaluated by the
measurements of both DOC and TOC while treating
synthetic solution containing various concentration of
PAH. The yields of DOC and TOC removal were 62% and
27%, respectively. The relatively low yield of TOC
removal (27%) compared to 62% of COD removal, indi-
cated that only a small fraction of PAH was completely
oxidized into water and carbon dioxide, the majority of the
pollutants being transformed into small molecules that
reduce the oxygen demand in the treated-solution relative
to the achieve removal of the original compounds. Another
pathway of NAP degradation proposed in the Fig. 10 is
based on the possibility of the formation of hypochlorous
acid (generated via chloride ion oxidation at the anode)
during electrolysis, which can then react with NAP to form
chloronaphthalene (A-1), followed by rearomatization and
formation of 2-ethoxyquinoline (A-4). Ethoxyquinoline
should be subsequently transformed via next attacks of
hydroxyl radical into further intermediates, including ring-
opened structures. On the other hand, NAP could be
directly oxidized into ethoxyquinoline (A-4). According to
(mainlib) Benzo[c]cinnoline, 2-chloro-50 70 90 110 130 150 170 190 210 230
0
50
100
5062
75
87
93
99 125
151 186
214
Cl
NN
(mainlib) 1-Chloropyrene50 70 90 110 130 150 170 190 210 230 250
0
50
100
50 6274
87
100
118
150 174
200
236
Cl
(B-1) (B-2)
(mainlib) Sulfonyl, bis(2-nitriloxidophenyl)-50 70 90 110 130 150 170 190 210 230 250
0
50
100
50
63
69
76
87
98
104
126
150
174
184
195
212
220
240
O O
N
S
NO
O
(B-3)
Fig. 9 Mass spectra of components (B-1) (B-2) and (B-3) produced by PYR electrooxidation
1508 J Appl Electrochem (2010) 40:1493–1510
123

the primary intermediates found during electrolysis of PYR
solution, reaction pathways of the PYR degradation can
also be proposed. Chloropyrene (B-2) is generated owing
to hypochlorous acid reaction with PYR, followed by
rearomatization and formation of benzo(c)cinnoline,
2-chloro (B-1). Benzo(c)cinnoline, 2-chloro can then be
oxidized by hydroxyl radical to form sulfonyl-bis (2-ni-
triloxidophenyl) (B-3), which should be consecutively
transformed into further intermediates, including ring-
opened structures.
4 Conclusions
This study has shown the possibility to use an electro-
chemical technique to oxidize efficiently PAH from COS
and from NAP and PYR synthetic solutions in comparison
to traditional Fenton oxidation process. Using electro-
chemical oxidation, the sum of PAH concentrations for 16
PAHs investigated in COS could be optimally diminished
up to 80–82% by imposing a current density of
9.23 mA cm-2 and a pH of 4.0 or 7.0 for 90-min reaction
period in the electrolysis cell. By comparison, the best
yield (46%) of Fenton oxidation process for PAH
degradation in COS was recorded while imposing H2O2/
Fe2? molar ratio of 11.0 (with 1.7 mol Fe2? L-1) and a pH
of 4.0. Individual NAP and PYR solutions were then oxi-
dized electrochemically in order to monitor the formed
intermediates. The rates of PYR and NAP degradation
while treating individually NAP and PYR solutions were
quite similar to those recorded in COS (79% of NAP
removal and 74% of PYR removal). NAP is mainly
transformed via direct oxidation. Naphthalenedione and
naphtoquinone are successively formed through the oxi-
dation induced by hydroxyl radicals and naphtoquinone
should consecutively transform into further intermediates,
including ring-opened structures. During oxidation of PYR
solution, PYR is mainly transformed to chloropyrene fol-
lowed by rearomatization and formation of benzo(c)cinn-
oline, 2-chloro. Benzo(c)cinnoline, 2-chloro is then be
oxidized by hydroxyl radical to form sulfonyl-bis (2-ni-
triloxidophenyl). The electro-oxidation technique could
form the basis of a process capable of removing refractory
organic compounds such as PAHs from many wastes and
wastewaters (creosote effluent, petroleum effluent, alumi-
num industry wastes and soil wastes, etc.). However, in
view of verifying the effect of treatment time on Fenton
oxidation process and with the aim of confirming the most
cost-effective process for treating COS (electro-oxidation
versus Fenton oxidation), additional experiments using
response surface methodology (RSM) should be used.
Acknowledgments Sincere thanks are extended to the Canada
Research Chairs and to the National Sciences, Engineering Research
Council of Canada and Filter Innovations Inc. for their financial to
this study.
References
1. Sigman ME, Schuler PF, Ghosh MM, Dabestani RT (1998)
Environ Sci Technol 32:3980
2. Flotron V, Delteil C, Pedellec Y, Camel V (2005) Chemosphere
59:1427
3. USEPA (1984) Creosote—special review position. Document 2/
3. U.S. Environmental Protection Agency, Washington, DC
4. Betts WD (1990) Information about coal-tar creosote for wood.
Proceedings of the international tar conference, Paris, France
5. Gouvernment of Canada (1993) Matieres residuaires impregnees
de creosote. Loi Canadienne sur la protection de l’environne-
ment, liste des substances d’interet prioritaire. Report No. En 40-
215/13-F, Ottawa, Ontario, Canada (in French)
6. Engwall MA, Pignatello JJ, Grasso D (1999) Water Res 33:1151
7. Becker L, Matuschek G, Lenoir D, Kettrup A (2001) Chemo-
sphere 42:301
8. Ikarashi Y, Kaniwa M, Tsuchiya T (2006) Chemosphere 60:1279
9. Trapido M, Veressinina Y, Munter R (1995) Environ Technol
16:729
10. Beltran F, Gonzalez M, Rivas FJ, Alvarez P (1998) Water Air
Soil Pollut 105:685
11. Goel RK, Flora JRV, Ferry J (2003) Water Res 37:891
(A)
(B)
Fig. 10 NAP (a) and PYR (b) electrooxidation pathways in the
presence of CAS
J Appl Electrochem (2010) 40:1493–1510 1509
123
12. Stichnothe H, Keller A, Thiming J, Lohmann N, Calmano W
(2002) Acta Hydrochimica Hydrobiologica 30:87
13. Panizza M, Zolezzi M, Nicolella C (2006) J Chem Technol
Biotechnol 81:225
14. Romero MC, Cazau MC, Giorgieri S, Arambarri AM (1998)
Environ Pollut 101:355
15. Juhasz AL, Naidu R (2000) Int Biodeterior Biodegrad 45:57
16. Lin SH, Lo CC (1997) Water Res 31:2050
17. Kang YW, Hwang KY (2000) Water Res 34:2786
18. Kuo WG (1992) Water Res 26:8801
19. Tang WZ, Huang CP (1996) Environ Technol 17:1371
20. Wang A, Qu J, Liu H, Ge J (2004) Chemosphere 55:1189
21. Martinez-Huitle CA, Ferro S (2006) Chem Soc Rev 35:1324
22. Deng Y, Englehardt JD (2007) Waste Manag 27:380
23. Morao A, Lopes A, De Amorin MTP, Goncalves IC (2004)
Electrochim Acta 49:1587
24. Rao NN, Somasekhar KM, Kaul SN, Szpyrkowicz L (2001)
J Chem Technol Biotechnol 76:1124
25. Panizza M, Cerisola G (2004) Environ Sci Technol 38:5470
26. Drogui P, Blais JF, Mercier G (2007) Recent Patent Eng 1:257
27. Comninellis C, Pulgarin C (1991) J Appl Electrochem 21:703
28. Comninellis C (1994) Electrochim Acta 39:1857
29. Panizza M, Cristina C, Cerisola G (2000) Water Res 34:2601
30. Rajeshwar K, Ibanez J (1997) Environmental electrochemistry—
fundamentals and applications in pollution abatement. Academic
Press, San Diego, CA
31. Drogui P, Elmaleh S, Rumeau M, Bernard C, Rambaud A (2001)
J Appl Electrochem 31:877
32. Bongo G, Mercier G, Drogui P, Blais JF (2008) Environ Technol
29:479
33. Chartier M, Dhenain A, Mercier G, Blais JF, Drogui P, Bongo G
(2008) Canada Patent pending, No 2,631,092
34. Mercier G, Blais JF, Chartier M (2007) J Environ Eng Sci 6:53
35. Mouton J, Mercier G, Blais JF (2009) Water Air Soil Pollut 197:381
36. Yavuz Y, Caporal AS (2006) J Hazard Mater B136:296
37. Chen X, Chen G (2006) Sep Purif Technol 48:45
38. Edwards DA, Luthy RG, Liu Z (1991) Environ Sci Technol
25:127
39. Kim S, Kim T, Park C (2003) Desalination 155:49
40. Matskevich ES, Slipchenko AV (1993) Zh Prikl Khim 66:1493
41. Lissens G, Pieters J, Verhaege M, Pinoy L, Verstraete W (2003)
Electrochim Acta 48:1655
42. Panizza M, Delucchi M, Cerisola G (2005) J Appl Electrochem
35:357
43. Hykrodova L, Jirkovsky J, Mailhot G, Bolte M (2000) J Photo-
chem Photobiol A Chem 151:181
44. Lund H, Hammerich O (2001) Organic electrochemistry. Marcel
Dekker Inc., NewYork, NY, p 1185
45. Wen S, Zhao J, Sheng G, Fu J, Peng P (2003) Chemosphere
50:111
46. Tran LH, Drogui P, Mercier G, Blais JF (2009) J Hazard Mater
164:1118
47. Latimer JS, Zheng J (2003) In: Douben PET (ed) PAH: an eco-
toxicological perspective. Wiley, London, England
48. Yeung KKC, Lucy CA (1997) Anal Chem 69:3435
49. Lucy CA, Tsang JSW (2000) Talanta 50:1283
1510 J Appl Electrochem (2010) 40:1493–1510
123