
High Concentrate Studies with Beef Cattle
47
Chapter 01: Introduction 1.1 Rationale of the study: Migration is considered as the movement of people from one geographical region to another, which may be on temporary or permanent basis. People migrate based on the prevailing conditions and the reasons for it vary from one person to another depending on the situation that brought about the decision. Migration is a selective process affecting individuals or families with certain economic, social, educational and demographic characteristics. Migration occurs as a response to economic development as well as social, cultural, environmental and political factors and effects on areas of origin as well as destination. People tend to move away from a place due to need to employment opportunity, escape violence, political instability, drought, congestion in various dimensions and suspected or real persecution. Also, adverse physical conditions such as flood, landslide (erosion and earthquake) and soil infertility contribute largely to the reasons why people leave one environment for another. Over the last decade, the landscape of Bangladesh has changed remarkably. The countryside is no longer confined to food production but is now a source of labor for urban areas. However, the linkages between migration and development are not straightforward. In the light of the changes sweeping through rural Bangladesh, the links between migration and development need to be re-examined. Today, rural-urban
Transcript of High Concentrate Studies with Beef Cattle

Chapter 01: Introduction
1.1 Rationale of the study:Migration is considered as the movement of people from one
geographical region to another, which may be on temporary or
permanent basis. People migrate based on the prevailing
conditions and the reasons for it vary from one person to
another depending on the situation that brought about the
decision. Migration is a selective process affecting
individuals or families with certain economic, social,
educational and demographic characteristics. Migration occurs
as a response to economic development as well as social,
cultural, environmental and political factors and effects on
areas of origin as well as destination. People tend to move
away from a place due to need to employment opportunity,
escape violence, political instability, drought, congestion in
various dimensions and suspected or real persecution. Also,
adverse physical conditions such as flood, landslide (erosion
and earthquake) and soil infertility contribute largely to the
reasons why people leave one environment for another. Over the
last decade, the landscape of Bangladesh has changed
remarkably. The countryside is no longer confined to food
production but is now a source of labor for urban areas.
However, the linkages between migration and development are
not straightforward. In the light of the changes sweeping
through rural Bangladesh, the links between migration and
development need to be re-examined. Today, rural-urban

migration is one of the most important modes of migration
which exist in the society. This study therefore investigated
those factors that are not only associated with the rural to
urban migration but also urban to rural migration.
Specifically, this study investigated factors associated with
movement of people from rural to town areas and urban to rural
areas and the socio-economic characteristics of the migrants.
1.2 Scope and Limitation of the study:In this research, internal migration pattern for Bangladesh
would be depicted. This study would not include international
migration for analysis. The study intends to illustrate the
pattern of population movement from district to district and
intra-district.
The study would list some important determinants of migration
that could have influence on the migration pattern or
migration decision. Moreover, the study would develop a
relationship between migration and its determinants. Depending
on which the study would also provide some general policies.
The scope of the study has been constricted mainly for data
limitation. Data of migration is not available especially at
upazila and union level. The information collected from
secondary sources is not up to date for the study. All the
variables that have influence on the migration pattern could
not be incorporated. So, depending on the data availability
and importance, explanatory variables of migration have been
selected.

1.3 Present state of the problem:
A study of migration is key importance in regional
development. The importance of internal migration and intra-
migration in the process of socio-economic development can
hardly exaggerated, as both are interrelated elements of
development. It would seem that Researcher and concerning
government authority in developing countries are more eagerly
aware of this than those in developed countries. Since they
consistently mention that they consider issues of internal
migration and population distribution to be even more
important (Begum, 2004).
At present, Bangladesh is experiencing significant amount of
rural-urban migration due to socio economic instability. Urban
areas become unable to provide basic service and facilities to
the migrated people. Rural areas also have failed to provide
employment opportunities and improved basic facilities (Oakil,
2007).
Population census, literature review and sample surveys are
the main sources of information on internal migration for our
study. Sample survey provides a means of obtaining current
information as well as their past information through
questionnaire survey. Besides, survey data on rural-urban
migration obtained through direct questions have some definite
advantages over migration data from other sources. This study
is based on a small scale survey of Gabtoli Upazila in Bogra
district due to limited time and resources. To identify the
reason why local and non-local people wants to migrate to
other places from their origin, 210 local people and 140 non-
local people had been surveyed. This study examined the socio
economic status of migrants and their reasons for migration.
1. Case Studies on rural to urban migration
Rural people desire and need to migrate for several reasons.
They want to live autonomously political risk-free life, get a
job or business, get proper education and provide better
educational facilities to their family members. In some cases
they want to get better living facilities what is not
available in rural areas. Growth rate of urban area is more
than rural area, so people of less developed area want to
migrate in urban areas.
1.1.1 Abdus Sattar from Tezopara,Gabtoli,Bogra
Abdus Sattar is a farmer living with his family in Tezopara.
Moreover, he has a stationary shop. He was a former Union
Parishad Member. He is an activist of Bangladesh Awami League.
During the period of BNP government, he faced a lot of
political harassments. His house and Stationary shop was
reaved by the oppositions. Then, for safety issue of his and

Selection of the Project Topic
Formulation of vision and objectives
Literature review
Selection of the study area
Conceptual framework
his family members, he was migrated from Tezopara to Bogra
sadar. In the mean time, he managed a job as a worker in a
shop factory. His earnings were too low to support his family.
After the change of government, he came back and started his
previous job. After migration, his views about life style are
changed. Now he wants to migrate to Bogra sadar for better
educational facility of his children.
1.1.2 Ruhul Amin from Tezopara, Gabtoli,Bogra
Ruhul Amin was a construction labor, worked in Dubai. He was
born in a poor family. After the completion of S.S.C exam, he
searched jobs, but he could not manage a single job. Then he
tried to get loan from bank to start a small business, but he
also failed to collect loan from the bank. After that, his
family sold their all agricultural land to send him Dubai to
earn money. He spent 10 years in Dubai and become proficient
to upgrade his family's economic condition. Now, he returned
from Dubai and started business in Gabtoli upazilla. Now, His
younger brother, Al-amin lived in Dubai who worked as a labor
and give economic support to his family.
Ch Methodology:

Preparation of Co-ordination schema
Preparation of draft questionnaire
Data collection
Pilot surveyPreparation of final questionnaire
Selection of target group
Primary data collection
Secondary data collection
Simple random sampling
Stratified sampling
Data analysis and interpretation
Final presentation
Final report
Non -local people
Local people
1.4 Methodology:
To achieve the objectives, the study follows the shown
Methodology.The flow chart of the methodology has been shown
and described below:
1.4.1 Selection of the project Topic:
At first a topic based on required facilities for
decentralized activity centre development in rural areas of
bangladesh was selected.
1.4.2 Formulation of vision and objectives:
For attaining the visions, 3 relevant objectives was selected.
Total study has been formulated to fulfill these objectives.
1.4.3 Selection of the study area:
We selected Gabtoli upazila as our study area. It is situated
in Bogra district. We surveyed non local people at gabtoli
upazila. To survey local people we selected Tezopara village
at Rameswarpur union.
1.4.4 Literature review:
Literature review of our study can be categorized into two
parts. First of all we conducted a study to collect the
generalized information about migration from different
research work, projects, thesis etc. Then we collected socio-
economic and demographic information about our study area.
1.4.5 Selection of target group:

On the basis of the objectives, target population for the
study was classified into two different groups:
Local people.
Non local people.
Local people denotes the permanent residents of the study area
and non local people denotes the people who have migrated into
the study area for job purpose (the selection criteria for
“local” and “non-local” are used here for only the our study
purpose).
1.4.6 Preparation of Co-ordination schema
For the accomplishment of our objectives, we prepared a co-
ordination schema containing relevant simple and complex
variables.
1.4.7 Preparation of draft questionnaire
Based on co-ordination schema, we prepare two different draft
questionnaires for local and non-local target groups.
1.4.8 Pilot survey
For checking the validity of questionnaires, we conducted
pilot survey with a local and non-local people of our study
area over phone (due to time constrains).
1.4.9 Preparation of final questionnaire
After completion of pilot survey, we remoulded the draft
questionnaire and ultimately prepared the final
questionnaires.
1.4.10 Data collection:
We collected both primary and secondary data. Primary data
was collected for local and non local people and secondary
data was collected for generalized information about study
area.
1.4.10.1 Primary data collection:
Primary data was collected by interviewing both the local and
non local people. Here, local people were selected through
simple random sampling method. Non local people were selected
through stratified sampling method. We categorized non local
people into government officials, non government officials,
medical officials, government and non government staff. Sample
size for the whole study was 50. Among them 30 samples for
local people and 20 samples for non-local people were
selected. Among 20 non local samples we surveyed 5 government
officials, 5 non government officials, 3 medical officials and
7 government and non government staffs.
1.4.10.2 Secondary data collection:
Secondary data was collected from websites.
1.4.11 Conceptual Framework:

A conceptual frame work was prepared to conduct the whole
study in a planned way with information gained from various
data sources.
1.4.12 Data analysis and interpretation:
At first dummy table containing hypothesis and their analysis
tool was prepared. For analyzing data we used different
statistical tool. Then we interpreted the result.
1.4.13 Final presentation:
After that the summary of the report was presented through a
formal presentation.
1.4.14 Final report:
After the coordination of all the information, the final
report was prepared and submitted to the course teachers.

Chapter 04: Literature reviewThis chapter summarizes some studies related to migration that
helped in developing concepts and to have a clear
understanding of work procedure for this project. As the study
comprises of some stages, literature review is required in
each of them. Consultation of literature work has been proved
helpful in selection of project topic, formulation of
objectives, conceptual framework etc.
Initially this chapter introduces some general notions,
theories and consequences of migration followed by the
statistical analysis systems used in relevant books, thesis
papers, web documents and articles for the study.
4.1 General notions and theories of migration:
4.1.1 General concepts:
Human migration is the movement of people from one place to
another for the purpose of taking up permanent or semi-
permanent residence, usually across a political boundary.
Generally migration is of two types: Internal and
International migration Whereas internal migration includes
rural to urban, urban to rural, intra and inter urban and
rural migration (Anonymous, n.d.)
Mahbub (1997) in his research gave a greater emphasis on the
form of movement. The study rigorously analyzed the growing

connection and linkage between urban and rural areas. By
analyzing six villages in three districts, he found that
movement of people in future would be dominated by lower
classes of people in the society. He found that low-income to
lower-middle income people are highly mobile and lowest and
middle income people are least mobile ( Mahbub ,1997).
Afsar (2005) in his paper "Bangladesh: Internal migration and
pro-poor policy" discussed migration as a way of poverty
reduction. In her another study she depicts the nexus between
internal migration and development for Bangladesh. In the
course of investigating pattern and trend of internal
migration, this study focus on migrants characteristics,
problem faced by migrants, consequences of migration etc. She
explained their profound disparity in income distribution and
service delivery between space, class and gender. According to
herself, rural people who migrated to urban areas often
benefited more than non-migrant because of their innovative,
risk taking and desperate nature. The benefits include higher
or regular income, gain in wealth, greater access to public
services and education (Afsar, 2005).
4.1.2 Theories of Migration:
There are different theories which seek to understand who
migrates and why. Todaro's push-pull theory models the forces
acting on individuals; a new economic of labor migration
approach to family decision-making explains migration as a
strategy to diversify risk, or co-insurance. Other theories
look at the types of networks that develop, using an actor-
network approach where structure and power emerge and upon
agents, migrant identities are an important explanatory factor
in this approach(Waddinggton,2003). Following are some
theories of migration:
Ravenstein’s laws of Migration:
Human migration can be described by using certain laws of
social science. Ravenstein’s proposal on migration is helpful
to understand human behavior with respect to migration. The
laws are:
Most migrants travel minimum distances and with
increasing distance the numbers of migrations decrease.
Migration rate depends on industrials and commercial
development, transportation improvements. The direction
of migration is from agricultural area to central
industrial and commercial area.
Harris-Todaro Model:
The issues related to rural urban migration can be described
by the Harris-Todaro Model. This a economic model. The main
result of the model is that the migration decision is based on
expected income variation between rural and urban areas. If
expected urban income exceeds expected rural income, then
there is a possibility of huge amount of rural to urban
migration.
4.1.3 Consequences of migration:

In the 21st century, migration and its management have
increasingly been identified as one of the major challenges
for local, regional and national governance. Internal
migration brings economic development to origin areas, as the
same time it also threats the local labor markets.
Accessibility to basic services to the destination areas is
not also ensured. Urban-industrial development policies have
induced rural-to-urban migration. Because of growing
unemployment and pressure on public services, such migration
has been lately viewed as a demographic-development problem.
Moreover, villages have not been still acquainted with the
facilities that are required to attract urban to rural
migrants there. This also gives birth to a serious downbeat
outcome of urban to rural migration in recent days. Moreover a
clear understanding of migration behavior still remains as a
theoretical problem (Shrestha, 1996).
It is generally believed that migration to the cities has
somewhat negative impacts on rural areas; not only does it
tend to draw away their more dynamic members; it also diverts
national investment toward the towns. This is evident in the
way in which the 23 out of 44 country interim poverty
Reduction strategy papers (IPRSP) and PRSP mention that
migration deal with it. Seventeen PRSP mentioned migration as
a cause of degradation of rural and urban ecological
resources. Some draw casual links between the spread of
HIV/AIDS and crime with rural -urban migration (Waddinton,
2003).

4.2 Statistical analysis system:
In Bangladesh, economics resources are few and wealth is used
as a factor of social stratification. Chowdhury (1978) from
the study of "Social stratification of Meherpur village"
depicted a relationship between income and land ownership. A
certain correlation is established between income level and
land ownership pattern of Muslim people. Low income groups are
landless laborers and migrate to urban areas for their
livelihood (Chowdhury, 1978).
To justify our hypothesis that people with lower income in
villages migrate more frequently in urban areas, we can
established a correlation between income level and migration
status of people. It is also possible to develop a
relationship between income level and housing structure.
Mahbub (1997) in his research used frequency distribution
analysis to explain that rate of migration of rural people
with high social status is lower than the poor. This tends to
suggest that permanent departure from the rural areas is
deeply associated with socio-economic condition of the people.
As the wealth of rich farmers is enough for their financial
solvency, they are not willing to migrate to urban areas
(Mahbub, 1997).
Thus Frequency distribution tool can be used to justify our
hypothesis that rate of migration of the rural rich people is
lower than the poor.
S. P. Sekar (2013) observed from the study “Rural to Urban
Migration in an Indian Metropolis: Case Study Chennai City”

that people who were migrated from their origin traveled the
distance ranging from 150 to 300 km (S. P. Sekar, 2013).
In this way, it is possible to develop our hypothesis that
most of the non local people migrate ranging from 150 to 300
km.
Hossain (2001) used multivariate logistic regression model to
analyze household data. Land ownership, occupation, education,
number of adult people and family size were attributed as the
independent variables. Hossain showed that the majority of
migrants were young people and the reason behind their
migration is education level (Hossain , 2001).
This tool can be used to rationalize our hypothesis that
willingness of migration depends on the income and education
level of rural people.
According to Arup Mitra (2008), there exists a proportional
variation in between expected job and income of the rural
people. The coefficient of determinant test helps to explain
the relationship between these two variables (Arup Mitra,
2008).
By using this tool it can be explained that whether expected
job opportunities can meet the expected income of the local
people.
This study covers both the field of rural to urban and urban
to rural migration. In Bangladesh, particularly rural to urban
migration pays a vital role in the rapid growth of urban
population. This rapid growth ultimately results in uneven

spatial distribution of population where a large number of
migrants live in the urban slums and squatters where the basic
amenities of life are scares. On the contrary in case of urban
to rural migration the migrants usually do not feel comfort to
live there. One of the main reasons behind this
dissatisfaction is that, the places where they are transferred
for job purposes cannot meet themselves with required
facilities.
Chapter 05: Data analysis
This chapter introduces relevant analysis of database to
fulfill the objectives. Initially the analysis for local
people is introduced followed by the analysis for non local.
In this study, the database is analyzed on the basis of some
selected hypothesis with the help of relevant statistical
tools. From the analysis of the data, it becomes possible to
identify the migration patterns of inter districts and outer
districts.
5.1 Analysis for local people:
5.1.1 Relationship among age, level of education and
willingness of migration of the respondent:

Fig-1: Bar chart showing relationship between age group and (Source: Field survey,
<15 15-25 25-35 35-45 45-50 >550
20
40
60
80
100
120
0 619 18 21 23
100
12
24 26 29 1712
24 20 17 2747
7 14 17 10
24 22 23 10 13
4 2 3
Bar chart showing relationship between age group and education level
otherspost GraduateGraduateHSCSSCPrimaryIlliterate
Age of the respondentPerc
enta
ge o
f ed
ucat
ion
leve
l

From fig- 2, it is comprehensible that most of the people
within age group of 15-25 and 25 -35 are willing to migrate to
other places. Again in fig- 1, the distribution of level of
education corresponding to different age group of people is
shown. From this chart it is clear that level of education of
most of the people within age group 15-25 (about 47%) is H.S.C
and within 25-35 (about 48%) are S.S.C and H.S.C. These
analyses concluded to an interesting finding that majority of
the people who are willing to migrate are not illiterate. From
our study, it is found that people within age group 15-35 and
with education level of S.S.C and H.S.C are more willing to
migrate than the others.
Fig-2: Bar chart showing relationship between age group with (Source: Field survey,
15-25 25-35 35-45 45-50 >55020406080 75.00
63.6450.00
23.8133.33
25.00 36.36 50.00 76.19 66.67
Bar chart showing relationship between age group with willingness of migration of the
respondent
YESNO
Age of the RespondentPerc
enta
ge o
f re
spon
dent

5.1.2. Relationship between level of education and level of
income of the respondent:
As the value of Pearson coefficient of correlation between
income range and level of education is highly positively
correlated. So it is possible to analyze the data correlating
these two variables. From fig-3, it is found that the level of
education of most of the people with mean income (3000-5000)
is primary. The mean income range of the people of our study
area is 3000-5000.
Table 1: Statistics measures of income distribution andeducation level
Correlation Co-efficient ofcorrelation
Standard Error
Pearson's R .286 .062Spearman Correlation .297 .064
5.1.3. Relationship between level of income and willingness of migration:
Fig-3: Bar chart showing relationship between age group and (Source: Field survey,
(Source: Field survey,

As the value of Pearson coefficient of correlation between
income range and willingness of migration is highly positively
correlated. From analysis it is found that people with mean
and below mean income are more interested to migrate. It is
also found that people with excessively high income are less
interested to migrate.
5.1.4. Checking of variability of income:
From table-2, it is found that the value of skewness of the
income data of the respondent is 0.656. It denotes that the
data is positively skewed. So it occurs when there exists some
excessive large values in the data sets. But as the value of
skewness is near to zero then there exists a negligible amount
of large income group in our study area. Again from the
perspective of Kurtosis, it can be said that the Kurtosis of
Fig-4: Bar chart showing relationship between income and
income data is leptokurtic. Most of the income value is
congested near mode income of the income database. So from
these analysis it can be said that there is no or negligible
amount of disproportion in the income level of the people.
Table 1: Statistics measures of income distribution Number of
cases (N)
Std.Deviation
Skewness KurtosisStatistic
Std.Error
Statistic
Std.Error
21
0
1.472 .656 .168
.279
.334
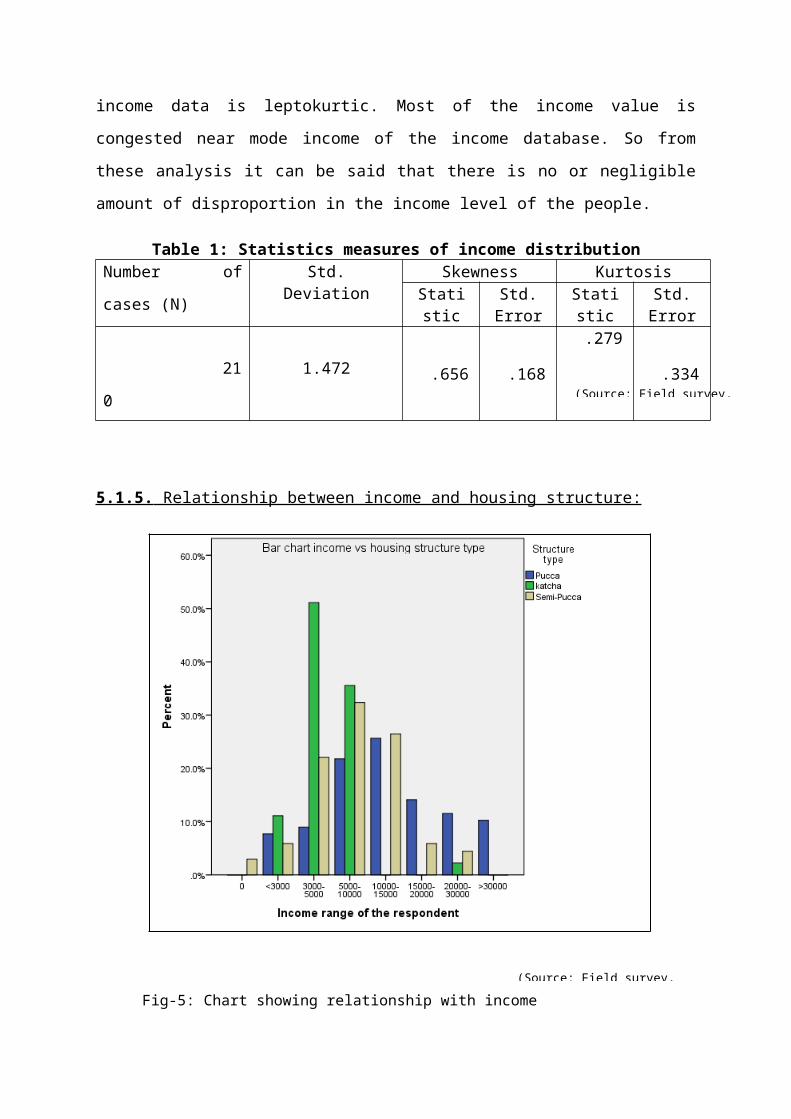
5.1.5. Relationship between income and housing structure:
Fig-5: Chart showing relationship with income and housing structure
(Source: Field survey,
(Source: Field survey,

Main reason of urban and rural migration is income
opportunities. People with lower income enjoyed fewer amounts
of basic needs. From the above graph it can be shown that
people with lower income group reside mostly in kutcha house.
People of this group who live in pucca house mostly live in
their son’s house.
5.1.6. Relationship between experience of migration and willingness of migration:
The study also suggests that the people with experience of
migration are less interested in migration than the people
without experience. That means people who are not aware of the
consequences of migration are more willing to migrate. From
the below cross tabulation, it can be said that 57% of people
with past experience of migration are not willing to migrate.
On the other hand 49.4% people without past experience are
willing to migrate.
Table-3: Cross tabulation between experience andwillingness of migration Experience of Migration whether
interested tomigrate
Total
yes noYes Count 22 29 51
% within Experience of Migration
43.1% 56.9% 100.0%
% within whether interested to migrate
22.0% 26.6% 24.4%

% of Total 10.5% 13.9% 24.4%
NoCount 78 80 158% within Experience of Migration
49.4% 50.6% 100.0%
% within whether interested to migrate
78.0%73.4%
75.6%
% of Total 37.3% 38.3% 75.6%Count 100 109 209
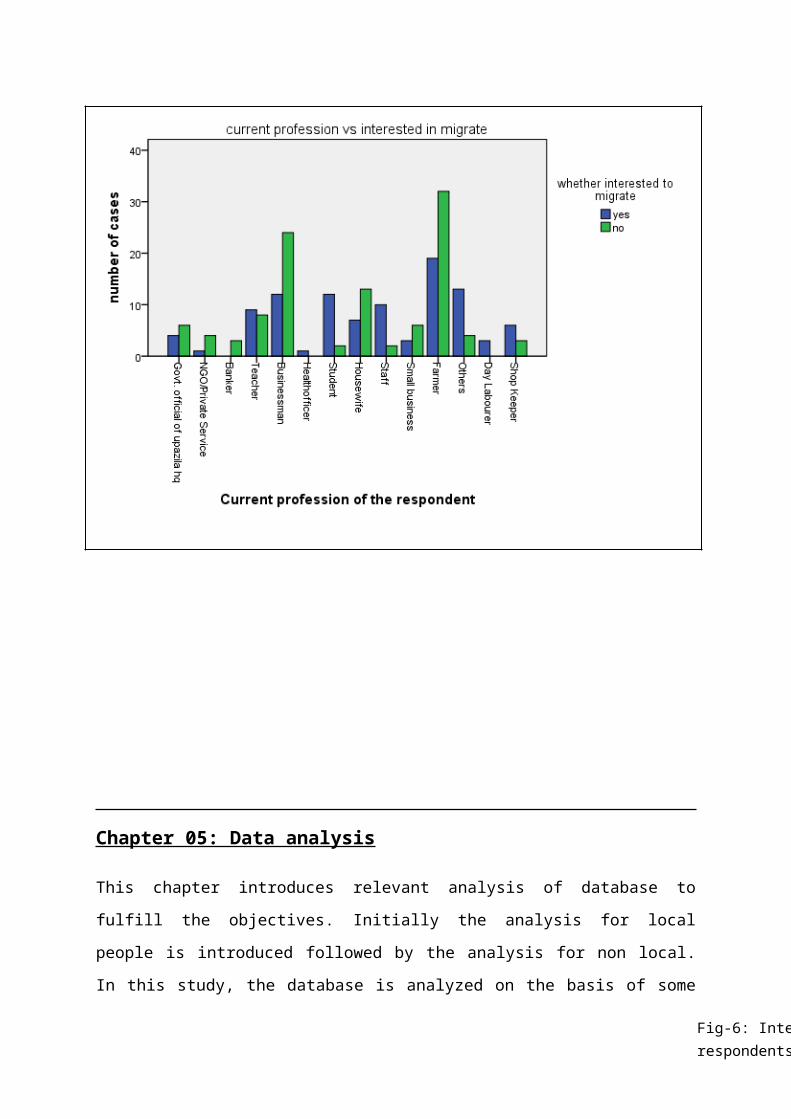
5.1.7 Relationship between Profession and interested in migration.
People migrate mostly for the better income opportunity. Day
laborer and landless farmer migrate to urban areas for better
job. As, the respondents are mostly farmer in profession their
percentage is very high in both interested and not interested.
People working as a staff interested in migration as they have
less opportunities living here. Educational qualities in rural
areas are not good so students are more willing to migrate. On
the other hand, businessmen are not willing to migrate as they
have business there. Mostly people with higher educational
level like teacher are highly interested in migrate.
(Source: Field survey,
Chapter 05: Data analysis
This chapter introduces relevant analysis of database to
fulfill the objectives. Initially the analysis for local
people is introduced followed by the analysis for non local.
In this study, the database is analyzed on the basis of some
Fig-6: Interested in migration depends on the profession ofrespondents

selected hypothesis with the help of relevant statistical
tools. From the analysis of the data, it becomes possible to
identify the migration patterns of inter districts and outer
districts.
5.2 Analysis for Non-local people:
5.2.1 Relationship among income range(Less than 10, 0000) and
willingness of migration without family of the respondent:
From fig-1, It can be said that most of the respondents whose
income less than 10,000 taka are not willing to migrate with
family. From the chart, it is also clear that only 16.70 % of
total respondent (having income less than 10,000 taka per
month) are willing to migrate with their family. This analysis
concluded to an interesting finding that majority of the
people with
lower
income is
single
migrant. Because of low level income, they are not able to
accommodate their family in a new place. So, family members of
migrants remain in their origin.
Yes NoWhether interested to
migrate
0%
20%
40%
60%
80%
100%
Bar chart showing relationship between income range (less than
10000) and willingness of migration
income range less than 10000
Perc
enta
ge

5.2.2 Relationship among tenure type and willingness of
migration of the non-local respondents:
From this analysis, it is found that most of the non-local
government employees prefer to stay in quarter than the tenant
house. As the quality and rent of the quarter is not
reasonable so they have to stay as a tenant. From the analysis
it is found that the people who are not willing to migrate
stated their required tenure type as a quarter and the people
who are willing to migrate among which 40.90% stated their
tenure type as a quarter.
Fig-1: Bar chart showing relationship between income range with willingness of migration of the respondent
(Source: Field survey,
Yes No0%
10%
20%
30%
40%
50%
60%50.00%
45.50%
0.091
0
40.90%
54.50%
Realationship between required tenure type and willingness to migrate
OwnerTenantQuarter
Whether interested to migrate
Percentage
Tenure type required
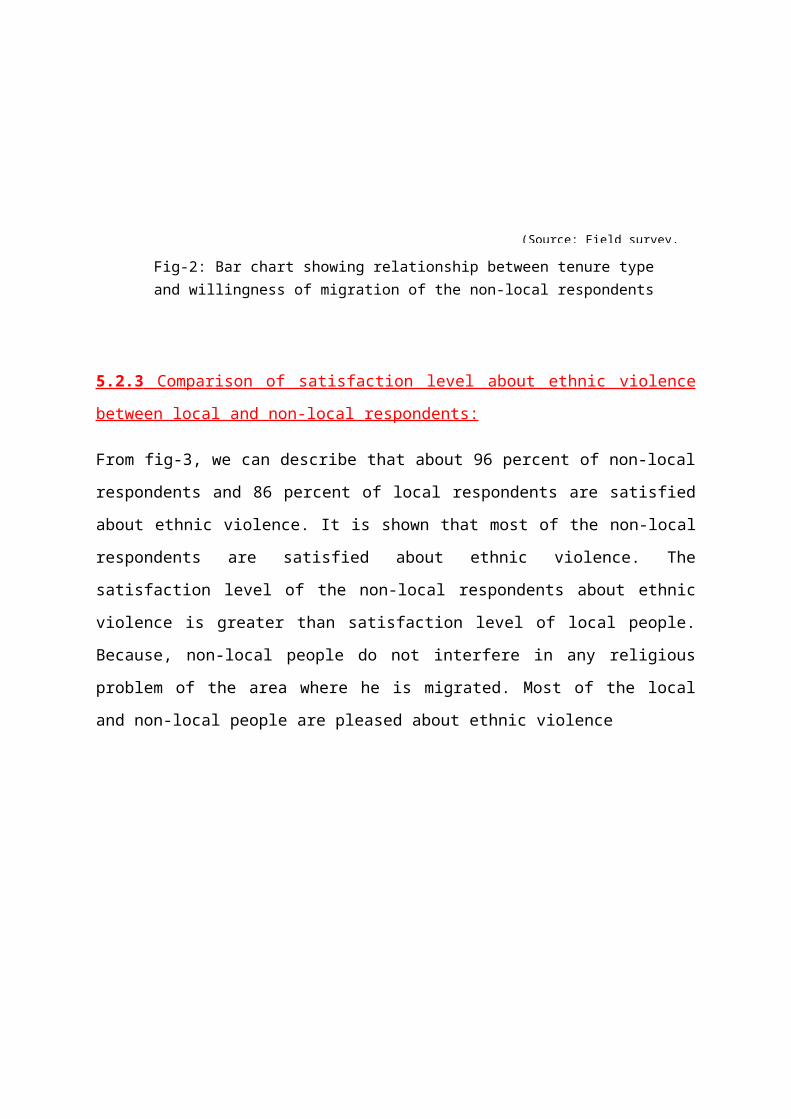
5.2.3 Comparison of satisfaction level about ethnic violence
between local and non-local respondents:
From fig-3, we can describe that about 96 percent of non-local
respondents and 86 percent of local respondents are satisfied
about ethnic violence. It is shown that most of the non-local
respondents are satisfied about ethnic violence. The
satisfaction level of the non-local respondents about ethnic
violence is greater than satisfaction level of local people.
Because, non-local people do not interfere in any religious
problem of the area where he is migrated. Most of the local
and non-local people are pleased about ethnic violence
Fig-2: Bar chart showing relationship between tenure type and willingness of migration of the non-local respondents
(Source: Field survey,

Non local Local0%10%20%30%40%50%60%70%80%90%100% 96.20%
86.60%
3.80%13.40%
Chart showing comparison of satisfaction level about ethnic
violence between local and non local
Satisfied
Ethnic violence
Percentage
5.2.4. Comparison of satisfaction level about political
violence between local and non-local respondents :
It is revealed that, the overall satisfaction level about
political violence is better in our study areas. The
satisfaction level of the non-local respondents about
political violence is greater than satisfaction level of local
people. Because, non-local people do not interfere in
political problem of the area where he is migrated. Most of
the cases, we see that the reason of their migration to the
rural area is only for job. Non-local people have no influence
in political affair where he has migrated.
Fig-3: Bar Chart showing comparison of satisfaction level about ethnic violence between local and non local
(Source: Field survey,

Non local Local0%
20%
40%
60%
80%
100%86.60%
78.60%
13.40%21.40%
Chart showing comparison of satisfaction level about political violence between
loacl and no local
Satisfied Not satisfied
Political violence
Percentage
5.2.5 . Satisfaction level of Non local people about existing
facilities:
From the literature review, it is found that the non local
people are not willing to stay in rural areas as the community
facilities are not at satisfaction level. From the below
table, it is found that the non local people are satisfied
with housing facilities, water supply, gas supply,
electricity and sanitation. For the study, we assume a rule of
thumb that if the satisfaction level for individual facility
is more than 60% than non local are satisfied with that
facility. If we use the rule of thumb, then it is found that
the non local are not satisfied with the frequency of load
Fig-4: Bar Chart showing comparison of satisfaction level about ethnic violence between local and non local
(Source: Field survey,

shedding, emergency medical facilities, shopping center,
community center, school and college.
Facilities Satisfied
(Percentage)
Not satisfied
(Percentage)
Housing facilities 92.9 7.1Water supply 63.6 36.4Arsenic level 91.4 8.6Gas supply 67.9 32.1Electricity 87.9 12.1Sanitation 74.3 25.7Frequency of load
shedding
44.3 55.7
Hospital (regular) 65.3 34.7Hospital
(emergency)
30.2 69.8
Shopping center 52.9 47.1Community center 41.4 58.6School 42.3 57.7
Table: Satisfaction level of Non local people about existing facilities.
(Field survey, 2014)
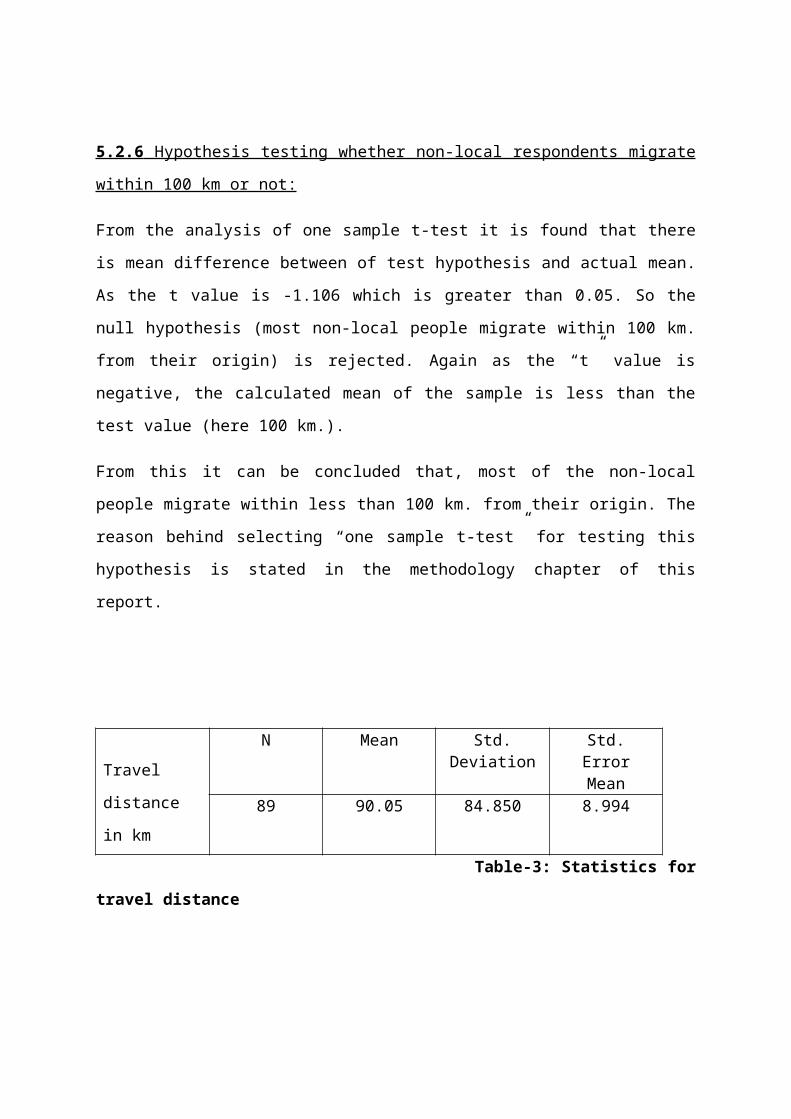
5.2.6 Hypothesis testing whether non-local respondents migrate
within 100 km or not:
From the analysis of one sample t-test it is found that there
is mean difference between of test hypothesis and actual mean.
As the t value is -1.106 which is greater than 0.05. So the
null hypothesis (most non-local people migrate within 100 km.
from their origin) is rejected. Again as the “t” value is
negative, the calculated mean of the sample is less than the
test value (here 100 km.).
From this it can be concluded that, most of the non-local
people migrate within less than 100 km. from their origin. The
reason behind selecting “one sample t-test” for testing this
hypothesis is stated in the methodology chapter of this
report.
Travel
distance
in km
N Mean Std.Deviation
Std.ErrorMean
89 90.05 84.850 8.994
Table-3: Statistics for
travel distance

Table-3: One sample “t” test for
travel distance
Travel
distance
in km
Test Value = 100
t-value Degree offreedom
Mean difference
-1.106 88 -9.947
5.2.7 Prioritizing facilities for non-local respondents:
From the analysis of priorities given by non-local people
(Fig-1), it is found that about---percent people prioritize it
as top priority. This analysis is done by cumulating
priorities against each facility declared for prioritizing to
the non-local respondents. The facility, against which the
cumulative value is highest, is recognized as the top priority
as the scores are assigned to the priority value in reverse
order. (e.g.: The first priority is given score value of 10).
From the analysis it is found that the basic problems facing
for which the non-local people are not satisfied to stay are
identified. These can be the underlying sequence at which
facilities are to be provided to the study area to attract the
non-local people to stay there.
(Field survey, 2014)
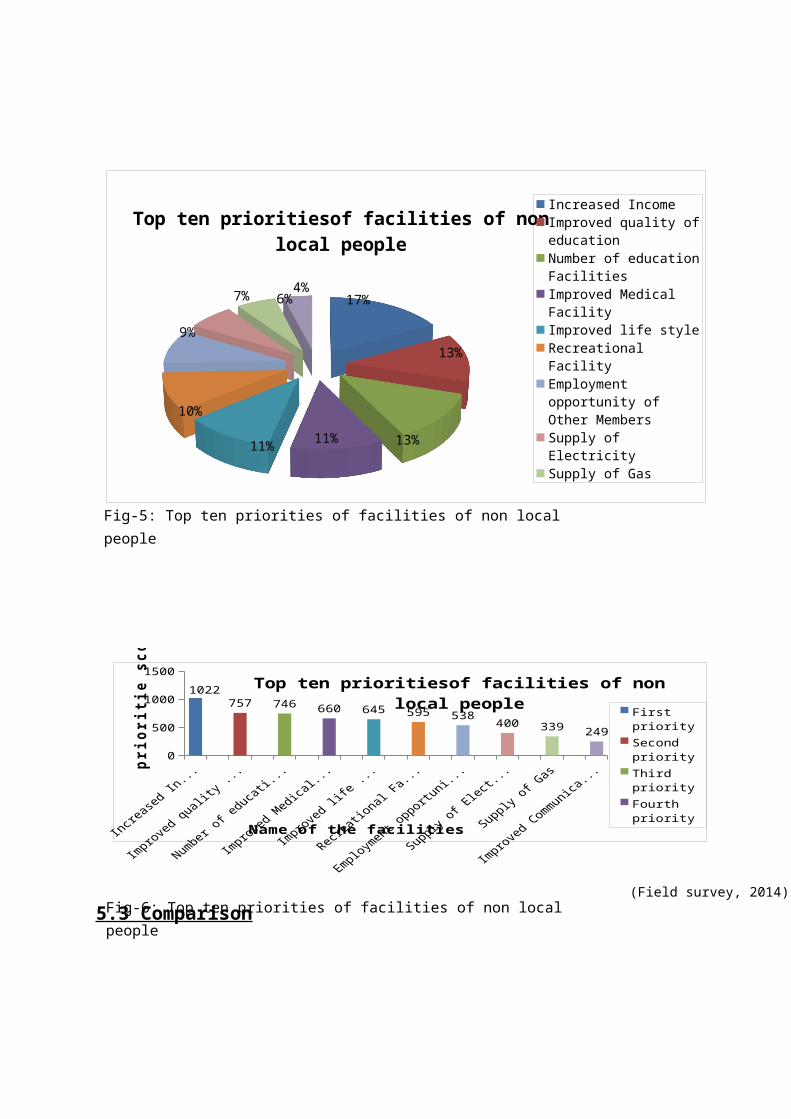
5.3 ComparisonFig-6: Top ten priorities of facilities of non local people
Fig-5: Top ten priorities of facilities of non local people
(Field survey, 2014)
17%
13%
13%11%11%
10%
9%
7% 6%4%
Top ten prioritiesof facilities of non local people
Increased IncomeImproved quality of education Number of education FacilitiesImproved Medical FacilityImproved life styleRecreational FacilityEmployment opportunity of Other MembersSupply of ElectricitySupply of Gas
0
500
1000
15001022
757 746 660 645 595 538 400 339 249
Top ten prioritiesof facilities of non local people First
prioritySecond priorityThird priorityFourth priority
Name of the facilities
prio
riti
e sc
ore

5.3.1 . Comparison of top most priority between of local and
non–local people.
From table, it is shown that though the top most priority of
local and non local people are same, there is difference in
their priority value. Local people prioritize “Increased
income facility” more than the non local people. So, it can be
concluded that facility of increased income is more important
for local people than the non local for controlling migration.
Table-3: Top priorities of local andnon–local people
Respondent Top
priorities
Cumulative
scores
Percentage
among total
scoreLocal Increased
Income1459 19%
Non local Increased
Income1022 17%
5.3.2 . Comparison of priorities of community facilities
between of local and non–local people.
0%
5%
10%
15%
0.03 0.09 0.09 0.02
0.080.1 0.11
0.01
Priorities of community facilities for local and non local people
Local people priority percentageNon local people priority percentage
Facility name
perc
enta
ge o
f pr
iori
ty

In the case of community facilities, the priority is different
for local and non local people. Here priorities for 4
different types of community facilities are analyzed. From the
analysis it is found that non local people prioritize
educational (both number and quality) and recreational
facility more than the local people. But the result is reverse
in case of improved sanitation facility. So it can be
concluded that educational facility (both number and quality)
is required for local and non local people. But as
recreational facility is more requisite for non local people,
so in the sequence of providing this facility non local will
be facilitated first with the facility.
Table-3: Comparison of priorities of community
facilities
Facility
name
Local people priority
percentage
Non local people
priority
percentageRecreational
facility
3% 8%
Number of education
Facilities9% 10%
Improved quality of
education
9% 11%
Improved Sanitation 2% 1%
(Source: Field survey,

Chapter 06: Reflection on findings and conclusion
This chapter has introduced the summary of findings of all
chapters of the study. From these findings some general
recommendations are made. These recommendations are based on
some theoretical concepts and analysis carried under this
study. Initially this chapter introduces findings of the study
followed by some general recommendations.
6.1 Major findings of the study:
1. This study showed that most of the migrants are aged
within the range of 15-25 and 25 -35 years. Again, a most
important finding of the study was that most of the
people of these age groups are literate and migrate
mainly for study purpose.
2. This study showed that there is no or negligible amount
of disproportion in the income level of the people but
there is a huge gap between lowest and highest level of
income.
3. It is observed from the study that people with mean
(3000-5000 BDT) and below mean income are more interested
to migrate than the others. It is also found that people
with excessively high income are less interested to
migrate.
4. The study used one sample t-test to estimate that most of
the non local people mainly migrated within 100 km from
their origin.
5. It is found from the study that majority of the people
with lower income is single migrant.
6. This study concluded to an interesting finding that most
of the non-local government employees prefer to stay in
quarter than the tenant house. But the conditions of the
quarter force them to reside in tenant house.
6.2 General findings of the study:
6.2.1 General findings for local residents:

1. This study used Pearson co efficient of correlation to
estimate the relationship between income and education
level of local respondent. This study estimated that
people with lower income have low level of education. It
is also found that the mean income of the local people of
the study area is in the range of 3000-5000 (BDT).
2. It is also found from the study that people with lower
income reside in kutcha house. More than 50% people with
low income reside in kutcha house.
3. The study suggests that the people with previous
experience of migration are less interested in migration
than the people without any experience of migration.
4. This study showed that the day laborers and landless
farmers are more willing to migrate than other people.
6.2.2 General findings for non-local residents:
1. This study demonstrates that the non local people are
satisfied with existing housing facilities, water supply,
gas supply, electricity and sanitation. But they are not
satisfied with the frequency of load shedding, emergency
medical facilities, shopping center, community center,
school and college.
2. The study found from the comparison of the satisfaction
level of local and non local about the ethnic and
political violence that non local are more satisfied than
the local people.

3. The study used Priority index to find that income
opportunity is the most important prioritized factor for
both the local and non local people. Then, improved
quality of the education is the second important priority
for the non local people.
4. From the study, it is instituted that non local people
prioritize educational (both number and quality) and
recreational facility more than the local people.
5. It is found from the study that there is a slight
difference in the level of satisfaction about medical
facilities between local and non local people.
6.3 Recommendations:
6.3.1 Recommendation for discouraging migration of local people
Decentralization of income opportunities
Decentralization of facilities from urban to rural areas can
play a vital role in remoulding both the rural urban migration
flow and pattern. Specifically it indicates the promotion of
rural growth centers in small rural areas. Revitalization of
rural economy can be ensured through some approaches such as
rural industrialization, diversification of agriculture,
promotion of non agricultural employment opportunity etc as
affirmed in the study of Friedman and Douglass (see literature
review). In the study of Kamrunnahar, she stated that people
prioritized job problem as their most important problem and

lack of education as their second most important problem (it
is also depicted in literature review chapter). This finding
also matches our study. It was found that such urban
decentralization had been fairly successful in Republic of
korea, kuba, India, Malaysia and Japan (Begum, 2004).
Relocation of higher educational facilities
This study suggests creating provision for higher educational
facilities (Universities, colleges) in districts where
population pressure is relatively low. To redirect the
migrated students from central area to other districts
university can play a vital role. As one of the major
findings of our study is that most of the local people migrate
for higher educational purpose in the town, so the even and
proper distribution of higher educational institution
throughout the country can discourage rural urban migration to
a considerable amount.
D Implementing concept of “Compact Township”
The concept of Compact Township may be implemented in the
development of small urban centers. These small and compact
urban centers would absorb willing migrants there and would
reduce the congestion and adverse impact of rural-urban
migration on central town. It can also be an important means
of solving short term problem generated in the urban areas due
to migration. Similar concepts had also been used in Srilanka
(Haque, 2000).

Reducing imbalance in income and employment opportunities
On the basis of Todaro model (see literature review), it can
be recommended that imbalances in urban- rural employment
opportunities and income distribution need to be reduced. The
differences in the wage of employment in rural and urban areas
are a major determinant of rural urban migration. The larger
the probability of finding a job in the urban areas, the
higher the rate of migration. By creating new income
opportunity (on the basis of expected and existing job
opportunity of local people) and increasing wage rate in rural
areas can reduce rural urban migration to a handsome amount.
Introducing modern technology and providing training
Introducing modern technology and giving training to young
adult and in the same time creates technology based employment
opportunity especially for the young people can resolve the
higher migration rate of young people from rural areas
(Adewale, 2003).
Government steps to decrease migration
Government may discourage rural to urban migration strongly by
introducing the necessary facilities that would trim down
migration. In India, every state government is committed to
giving employment preference to persons born in the state or
who have resided there for a specified length of time. In
Malaysia, people are provided with special right to education,
employment and land in contrast to ethnic Chinese (Begum,

2004). Similarly government of Bangladesh may take necessary
step to ensure education, employment and other basic needs to
reduce migration.
Some general regulations for discouraging migration
Some kind of regulation may be implemented in the urban
centers to limit rural to urban migration. These regulations
may be in the form of removal of sidewalk hawkers, marginal
workers and beggar from city streets and creating suitable job
opportunity for them in their origin. This will reduce total
rate of rural urban migration and disproportion in income
distribution. These regulations have already implemented in
Indonesia and have brought away fruitful result (Waddington,
2003, cited in Oakil, 2007).
6.3.2 Recommendation for discouraging migration of non local people
Improving the qualities of the government quarters
From the study it is found that most of the non local people
are interested to live in government quarter. So, the
condition of the quarter must be livable. If the condition of
the quarter is better than the tenant house, non local
respondents will not willing to migrate. So, it can be a major
way to keep non local in rural areas.

Enhancing social security
Political violence in Bangladesh is one of the major problems
for which urban-rural migration takes place. From the study it
is depicted that the satisfaction level of non local about
political violence is more than the local people. Again,
people both local and non local are not satisfied with the
social security. So, social security must be ensured. Some
steps to enhance the social security must be taken.
Improving existing community facilities in the rural
areas
Rural areas are deprived of the urban amenities like shopping
center, community center, recreational facilities. From the
study it can be shown that non local are not satisfied with
the frequency of load shedding, emergency medical facilities,
shopping center, community center and the number of school and
college. So, to keep the non local in rural areas these
facilities must be provided in sufficient level.
Strategies regarding transfer of government and non
government employees
The study showed that the non local respondents mainly
migrated within 100 km. This study is mainly suggests that non
local people who are transferred to the rural areas should be
from the adjacent districts. Because people who are

transferred to a distant place from their origin are more
willing to migrate (previously depicted in literature review
chapter).
Enhancing medical facilities
Local people are more deprived of medical facilities than the
non local people. Government officials, medical officers and
other non local easily get regular medical facilities where
local people do not get the regular facilities quite easily.
So, medical facilities must be increased to provide sufficient
services for both the local and non local people.
However, this study has tried to provide with some general
recommendation based on some theoretical concepts and analysis
carried under this study. It was not possible to give concrete
explanation of policy implication. Because, national policy
regarding migration and migrants are almost absent. Rural
development, though effective and most acceptable policy, is
the only policy that has been given greatest consideration.
Again there is no application of direct policy or urban
dispersal policy (Oakil, 2007).
6.4 Conclusion
Migration is one of the vital forces that contribute to fast
urbanization generally associated with higher levels of
efficiency and expansion. Migration is a root and outcome of

socio-economic alteration. Rural-urban migration currently
becomes a common fact and the situation is not in control.
This study covers both the field of rural to urban and urban
to rural migration. In Bangladesh, particularly rural to urban
migration pays a vital role in the rapid growth of urban
population. This rapid growth ultimately results in uneven
spatial distribution of population where a large number of
migrants live in the urban slums and squatters where the basic
amenities of life are scarce. On the contrary in case of urban
to rural migration the migrants usually do not feel comfort to
live there. One of the main reasons behind this
dissatisfaction is that, the places where they are transferred
for job purposes cannot meet themselves with required
facilities.
Finally this study will be helpful for Government to realize
the real situation and priority of implementation and for
policy maker to make problem free policy for rural and urban
development. Further research can be conducted on this issue
in a large scale to find out not only causes of migration but
also the priority based solution in rural-urban migration.

References:
1. Adewale, J. G (2003) “Socio-Economic Factors Associated
with Urban-Rural Migration in Nigeria: A Case Study of
Oyo State, Nigeria”, Ladoke Akintola University of
Technology, Ogbomosho, Nigeria, 2004.
2. Begum, K.N. (2004) “FACTORS AFFECTING THE INTERNAL
MIGRATION TO DHAKA CITY”, Unpublished MURP thesis, URP,
BUET.
3. Haque, A. (2000) “Compact Township: A Critical
Overview” Journal of Asian Affairs 22(2), 50-56.
4. Mitra, A. (2008) “Rural to Urban Migration: A District
Level Analysis for India”,
http://ir.ide.go.jp/dspace/bitstream/2344/729/3/ARRIDE_
Discussion_No.137_mitra.pdf, accessed on 5-03-2014.
5. Oakil, A.T. (2007) “AN ANALYSIS OF INTERNAL MIGRATION
IN BANGLADESH”, Unpublished MURP thesis, URP, BUET.
6. Anonymous(n.d),http://www.nationalgeographic.com/
xpeditions/lessons/09/g68/migration guidestudent.pdf,
accessed on 5-03-2014.
7. Afsar, R. (2005), "Bangladesh: Internal migration and
pro poor policy" Paper published at regional conference
on migration and development in Asia, 14-16 march 2005,
lanzhou, china.

8. Chowdhury, R.H (1978), "Determinants and consequences
of rural out migration: evidence from some villages of
Bangladesh" oriental geographer, 22 (1).
9. Hossain, M.Z, (2001), "Rural-urban migration in
Bangladesh: a micro-level study" Paper presented at
UISSP conference, August 20-24, 2001, Brazil,
http://www. iussp.org/Brazil
2001/s20/s28_p02_hossain.pdf, accessed on 5-03-2014.
10. Mahbub, A.Q.M, (1997), Mobility behavior of working
people in Bangladesh urban studies programme, Dhaka,
Bangladesh.
11. Shrestha, N. R (1996), " Institutional policies and
migration behavior: A selective review", theories of
migration Cohen, R. (ed), Edward elgar publishing
limited, UK.
12. S.P.Sekar, (2013), Rural to Urban Migration in an
Indian Metropolis: Case Study
ChennaiCity,http://www.iosrjournals.org/iosr-jhss/paper
s/Vol6-issue3/F0633235.pdf, accessed on 5-03-2014.
13. Waddington, C.(2003), "National policy and internal
migration", Paper presented at regional conference on
migration and development in Asia, 14-16 march 2005,
lanzhou, China.
14.