Annual Beef Bulletin 2020.pdf - Agricultural Research Council
Upload
independentCategory
view
1download
0
ANALYSIS OF BEEF MARKETING IN RIVERS STATE:
ALLWELL OGBANGA.
RIVERS STATE UNIVERSITY OF SCIENCE AND TECHNOLOGY, NKPOLU, PORTHARCOURT, NIGERIA.
December 1999.
ABSTRACT:
This study was designed to describe the activities involved in the marketing of beef, the various channels through which beef flows to the ultimate consumer, the problems associated with beefmarketing; and analysis of the structure of beef market and marketing margin earned by beef sellers.
Information for this work was collected through the use of structured questionnaire administered to traders in addition to oral interviews with beef sellers in three major central markets in the study area. A total of 110 beef sellers were sampled. The data from the 110 beef sellers were analyzed by means of frequency tables, percentage graphs, ratio, gini coefficient and Lorenz curve and budgetary analysis.
The study reveals the monthly retail margin of the beef sellers to be ₦800.00 or 16.0% of the mean value of beef purchased by retailers, while the wholesale margin is ₦1, 700.00 or 24.29% of the mean value of beef purchase by the wholesalers monthly.
Analysis reveals certain basic problems such as transportation, storage, financing, uniform grades and standards, market information as they affect the free flow of the product.

The study further reveals the producers’ market, wholesalers’ retailer market and the entire market were of a structure that could be described as monopolistic competition.
The study has also revealed that there are five principal channels or routes through which beef flows from the producer to the final consumer in Rivers state. The major channels of distribution was however observed to be
I. Producer Consumers
II. Producers Retailers Consumers
III. Producers Wholesalers Retailers Consumers
IV. Producers Agents Retailers Consumers
V. Producers Agents Wholesalers Retailers Consumers
Based on these problems and marketing margin, some useful suggestion and recommendations were rendered in view of the available resources in the economy and state in particular.
1. To facilitate the exchange function in beef market, it is suggested that the Nigerian Standard organization in collaboration with the appropriate government agency in thestate should evolve an acceptable standard for selling beefin the state.
2. The government should construct and maintain feeder roads that link the producers of beef with all parts of the city;this will help reduce the high transport fare paid by the traders in conveying the commodities from one part of the state to another.
3. Market in which beef are sold should be equipped with the inbuilt storage and preservation facilities for storage and

preservation of beef. This will reduce the huge losses incurred through poor storage techniques.
CHAPTER ONE:
Introduction: Background information:
Beef is a major source of animal protein in Nigeria particular for urban consumers-owing to the perennial drought which occurs in the Northern parts of the country, the traditional source of beef –domestic supply of beef falls short of domestic demand. Consequently, the market price of beef is such that the commodityis beyond the reach of the average Nigerian couple with the shortfall in beef supply is an inefficient marketing system.
The importance of beef in the diet of Nigeria is increasing due to pollution of water by industries and factories which leads to decrease in fish population, the traditional source of protein for Nigeria. Beef and fish are close substitutes, so the consumption requirement for beef and its products depends greatlyon the extent to which the requirement for fish products is met.
Agricultural products are usually homogenous, in fact there are considerable variations in quality and some form of grading is necessary before they can be offered for sales. Beef is a typicalexample of such products. It is highly perishable and thus need careful handling and storage to prevent deterioration.
Beef marketing encompass all the processes and services involved in moving the products from the farms where they are produced to the thousands of consumers located in the urban and rural areas. This marketing of beef products does not imply physical movementsof goods to the point where they are wanted but include putting

them in the form the consumers want them and at that place and time they want them.
It then implies that the current high prices of beef in the market are partially due to an inefficient marketing system, and that improvement in the system could help reduce prices. Although, the level of inefficiency of the prevailing marketing system has not been empirically determined in Rivers State still,it’s for this reason that the study of this nature is considered very important.
1.2 PROBLEM STATEMENT:
Beef and fish are major sources of animal protein in the diets ofthe people of Rivers. Even though beef is generally argued to contain higher quality protein, people of the State prefer the consumption of fish more than beef. There are several reasons that account for this,(1)Rivers state is a major coast line producer of fish so will consume more fish,(2)the price of beef by unit cost appear to be higher than that of fish i.e. The priceof beef is higher than fish so people prefer to consume fish thanbeef
It is a known fact that fish and beef are close substitutes as a result if the price of beef increased demand for it will fall in relation to fish. The high price of beef in Rivers State has beenattributed to several factors among which is the uncompetitive nature of the beef market, others are shortage of beef through the distribution channel and the inefficiency in performing the marketing functions.
However, there has not been any empirical evidence to confirm or disprove the forgoing generally held notions. Hence the need to

undertake any empirical analysis of the marketing system for beefin Rivers State in order to asses among other things the nature of beef market.
Thus effort will therefore be geared towards the evaluation of the marketing system with a view to identifying and suggesting possible solutions to these problems.
1.3 OBJECTIVES OF THE STUDY:This study aims at presenting a descriptive and analytical picture of the different channels of beef marketing, specifically; it is designed to achieve the following specific objectives, that is:
1. Describing the various marketing functions performed by beeftraders.
2. Describing the marketing channel for beef in Rivers State.
3. Determining the structure of the market for beef in Rivers State.
4. Estimate market margins earned by beef traders in Rivers State.
5. Highlighting the problems of beef marketing and to suggest possible solutions to the problems.
1.4 JUSTIFICATION FOR THE STUDY:
Beef production and marketing are important economic activities from which a lot had been expected from the point of view of providing employment, higher per capita income, self reliance in basic production and provision of industrial raw materials. Even for traders with sufficient capital, output frequently is too small to justify the necessary sales force; thus there is often agap between the producers and the consumers. The marketing

arrangement for distribution of beef through the channels seek tocomplete the communication cycle between the producers and consumers, it then implies that the current high prices of beef in the market are partially due to an inefficient marketing system and improvement in the marketing system will help reduce prices. Although, the level of inefficiency of the prevailing marketing system has not been empirically determined in Rivers State. However, the marketing channel had been identified as a price determinant.
It is for this reason that the study of this nature is consideredvery important and worthwhile. Result obtained from the study would be useful to policy makers, Government, beef producers, distributors and consumers.
1.5 SCOPE AND LIMITATION OF THE STUDY:
The study covers twelve out of twenty-three Local Government Areas in Rivers State, these Local Government Areas are carefullyselected, due to the high beef consumption rate in these areas. The Local Government Areas are Port Harcourt City, Obio/Akpor, Okrika, Asari-toru, Ogba/Egbema/Ndoni, Bonny, Ahoda East, Ikwere,Eleme, Gokana, Khana and Opobo/Nkoro. For the purpose of this study, Port-Harcourt, the major study area was divided into distinct zone, namely: The Trans Amadi and the Diobu/Town areas from where some abattoir (including two central abattoirs) were selected. This study focus on description of the marketing functions performed in the course of selling beef, examining the margins associated with such functions, and analysis of structureof the beef market in the state.
1.5.1. LIMITATION:
First, the limitation to the study (survey) is the low education level and attitude of most traders in the market, because they thought the information collected would be used to assess their

tax payment, with this most of them refused to be interviewed. Even after the explanation and showing ones identity as a studentresearcher. Also the high cost of transportation due to lack of fuel causes some limitation to the study in cause of travelling from one local government area to the next. In order to obviate the effect of the above mentioned constraints, some remedial actions were taken, these include carefully choosing twelve out of the twenty-three local government areas and reducing the number of abattoir and consequently the number of beef sellers. Also coming down as low as possible to the traders level. That is, the illiterate ones were spoken to according to their standard, through interpretation and make sure they understood the purpose of the study by using a language they will understandeasily.
1.6 ORGANIZATION OF THE STUDY:
The project consists of five chapters. The first chapter deals onintroduction. This comprises statement of the problem, objectivesof the study, justification for the study, scope and limitation of the study and the organization of the study; while the second chapter is devoted to the Review of Relevant Literature. The third and fourth chapters respectively deal on Research Methodology and the Study Area. It comprises the study area, sources of data, sampling method, sample frame and sample size, method of data collection and analytical techniques, and analysisof data, result and discussion while the fifth chapter dwells on the summary, conclusion and recommendation.
CHAPTER TWO:
REVIEW OF RELEVANT LITERATURE:

The structure of a market determines what type produce and in what quantities it pays producers and sells. The importance of beef in the diet of Nigerians is increasing due to pollution of water by industries factories which have led to decrease in fish population, the traditional sources of protein for Nigerian, Fabiyi (1985). Beef and Fish are close substitutes Sysoev (1970), this shows that beef and fish can be mutually substituted, and that the population requirement for beef and its products depends greatly on extent to which the requirement for fish products are met. Agricultural products are usually homogenous, in fact there are considerable variations in quality and some form of grading is necessary before they can be offered for sales Baker (1974). Beefis a typical example of such product. It is highly perishable andthus need careful handling and storage to prevent deterioration.
Market in order words, constitutes the bridge between production and consumption, the activities involved in crossing that bridge constitutes marketing. Marketing means different things to different people. Kohls (1980) defined marketing of food stuffs as the performance of all business activities involved in the flow of food products and services from the point of initial agricultural production until they are in the hands of the consumers. He further stated that it could be thought of as the connecting link-the bridge between specialized food producer and consumer. Brech (1963) defined marketing as the process of determining consumers demand for a product or services motivatingits sale and distributing it into ultimate consumption at a profit Kotler (1972) defined marketing as the set of human activities directed at facilitating and consummating exchange. Abbott (1957) defines marketing as the performance of all economic activities involved in the flow of goods and services from the point of production to the ultimate consumer. Dittoh andAdegeye (1982) state that the activities involved in marketing include assembling, transportation, processing, storage and

financing. For smooth flow of products from the point of initial production to the final consumer, a host of supporting economic activities commonly called marketing functions and services need to be performed; these including assembling, transportation, processing, standardization and grading, financing, market information, pricing and exchange. Baker (1976), have observed that buying and selling as two aspects of same transactions involved agreement of price and transfer of title ,provision of time and place of delivery and method of payment.
Assembling as a marketing function involves bringing together small quantities of commodities from where they are produced to acentral place from where they can be conveyed to the market (Dittoh 1985). Transportation which is the physical movement of commodities from one location to another during all phase as of marketing also plays an important role in beef marketing. Abbott and Makeham (1979) said that inadequate transport facilities are largely responsible for the slow increase in marketing efficiencyand for continuing subsistence farming in many areas.
The deficient communication limits the range of marketing and confined sales to near by consumers. This prevents the growth of specialized marketing agencies as well as the development of moreefficient procedures under the stimulus of competition. Talabi and Makanjuola (1977) expressed the view that inefficiency, lack of storage facilities, non-equitable and steep fluctuation in supply and prices are common characteristics of good marketing system in Nigeria. Those short-comings have been acclaimed to result in waste of between 20% and 30% annually. They argued thatpoor handling and lack of essential facilities have resulted in poor quality of product presented for sale.
The promotional function of marketing informs the public of the availability of goods and services and their wants--- satisfying qualities. It seeks to complete the communication cycle between those engaged in production and those engaged in consumption. The

need for product promotion exist in both surplus and scarcity conditions (Owah 1979) (Kohl 1972) said that financing is a very important ancillary service in beef marketing, this is because other marketing services like transportation, storage, processing, etc. need some form of capital if they are to be performed well.
Agricultural marketing encompasses all the processes and servicesinvolved in moving food and farm products from the thousands of scattered farms where they are produced to the thousands of consumers located in the urban and rural areas. This agriculturalmarketing of food and farm product does not only imply physical movement of goods to the point where they are wanted but also includes putting them in the form consumers want them and at the time and place they want them. Marketing therefore refers to the creation of form, time, place and possession utilities. Abbott and Markeham (1960) observed that marketing of agricultural products begins at the farm when the farmer plans his production to meet specific demands and market prospects. The products when produced cannot usually go direct to the consumer first; it is likely to be located at some distance from the place of consumption. Also agricultural production is generally seasonal which consumption is regular and continuous throughout the year. Thus, storage required adjust supply to demand. Finally, the farmer expects payment when his products leave his possession. Some financial management must be made to overall the various stages until the retailer sells the products to the consumer. It is marketing which provides those services between production andconsumption. According to Fiser (1984), the best of marketing services is the incidence of a change in the changes associated with marketing an agricultural product. Smith (1973) thus observed that marketing cost are made up of two components, firstis instantaneous margin over space and through market channel time after the agricultural products has gone into the distribution system. The second component is the rise between

harvest or production months, and the beginning of the next production.
The route through which a commodity passes on its way from the point of production to the point of ultimate consumption is the marketing channel (Allison-Oguru 1992).
Marketing channel could either be single-stage or multi-stage. Itis said to be single-stage channel when the commodity flows between the producer (or seller) and the ultimate consumer. But it is said to be multi-stage channel when the commodity flows between at least one link between the producer (seller) and consumer.
Marketing channel have been said to be the sequence of intermediaries and markets through which goods pass en route fromproducers to consumers. Michael (1974) define marketing channel as a “bridging gap” between producers and consumers. Olukosi and Isitor (1990) sees the channel as intermediaries between the two ends (producer and consumer), they further said these intermediaries are known as middlemen, and could be individuals or business organization that specialize in performing the various marketing function involved in the purchase or sale of goods as they are moved from producers to consumers. Nwokoye (1981) said that the task of distribution is to make goods physically available to buyers. This bridges the gaps of space and time between production and use or consumption. He defined a distribution channel as the combination of institution through which a seller markets his products to the ultimate buyer. By institution he means middlemen like wholesalers, retailers and agents.
Moro (1994) said that marketing channels are intermediaries and markets through which products pass from producers to consumers. He further stated that the first essential thing in the market channel is the identification of the producers for any particular

commodity, the scope of the commodity distribution will constitute the market area, with the market area, one may or may not find producer, that when a raw material source is found within the Country, the producer will be included in the marketing channel. But Abbott and Makeham (1979) said a major marketing channel is often made up of many smaller channels in parallel.
As Abbott and Makeham (1979) continue to analyze the marketing function and services, they said that the various ways of lookingat the functions and services involved in marketing. One way would stress the successive phase of concentration and distribution, another the stage of assembly, wholesale and retailthey further went on to say that the nature of the tasks and responsibilities involved in the marketing appear most clearly inthe following; finding a layer and transferring ownership, assembly and storage; sorting, packing and processing, providing the finance for marketing and taking the risks; and finally assortment and presentation to consumers.
Station and Further (1987) further buttress the argument by saying that distribution channel is a system often with very independent part, that may be conflict. To work effectively, a distribution channel must be well designed and well managed. Theyfurther observed that five channels are widely used in marketing of consumer products. These channels are as follows:
Producer Consumer (shortest channel)
Producer Retailer Consumer
Producer Wholesaler Retailer Consumer
Producer Agent Retailer Consumer
Producer Agent Wholesaler Retailer Consumer

The channel has also been identified as a price determinant. Dupeand Abbott (1978) maintain that the determinant of price in the marketing system cannot be attributed to the channel only, but a combination of other factors.
Marketing channels could be classified as either centralized or decentralized. A centralized marketing channel for agricultural product is one in which the farmer’s products are brought together in large central market and terminal markets. The commodities are purchased by processors or wholesalers from commission men or brokers who act as the farmer’s selling agent. The decentralized channel involves the processor or wholesalers purchase either directly from the farmer or at small production means as selling points Kohls and Downey (1987)
Marketing structure are those characteristics of market that influence the behaviour and performance of firms that sell in themarket (Lipsey 1989) But Olukosi and Isitor (1990) see market structure as those characteristics of a market which seem to influence strategically the nature of competition and pricing within the market. While Tomek and Robinson (1972) see market structure as the number and size of distribution of buyers and sellers, the degree of product differentiation and the ease of entry of new firm into an industry. In other words, it is a set-up of the market which comprises those organizational characteristics of a market which influence the nature of competition and pricing within the market.
The market structure can also be said as a determinant of what type of product and in what quantities it pays producers to produce and sell them.
These characteristics indicate how market is structured. In considering the structure of the market, one is interested to know if the market is a monopolistic competition, perfect competition, Oligopoly or purely monopoly.

Marketing margin can be referred to as the difference between theprice paid to the first seller and that paid by the buyer of a commodity. Tomek and Robinson (1972) is the difference between the price at the retail level and that at the farm gate level.
Moro (1994) defined marketing margin as a difference between the price paid by consumers and that obtained by producers, or as theprice of a collection of marketing services which is outcome of the demand for the supply of such services. He went on to explainthat it is simply a difference between the primary and derived demand curved for a particular product. Also primary demand is determined by the response of the ultimate consumers. Olukosi andIsitor (1990) defined marketing margin as the difference in prices paid for a commodity at different stages of the marketing system. Kohls and Uhls (1980) defined it as the differences between the price paid to the producer and that paid by the finalconsumer which are generally expressed in cash or as a percentageof the price paid by the consumers. It is made up of individual margins obtained by intermediaries who actually assume ownership of a product and then resell it, together with specific charges for marketing services rendered.
Marketing margin according to Adeyenu (1973) consist of the cost of performing such marketing function as transportation, storage and processing. They are the same as the returns of all factors of distribution involved in marketing. In other words, marketing margin for a particular commodity is the difference between what the consumer pays for the final product and the amount the producer receives.
Marketing margins as proportions of consumers’ price are often used to assess market performance. Marketing margin is used to determine the percentage of consumer’s spending which reaches theproducer and their effect on producer’s production plan. For example, where the assumption would be that the reflection of price changes to the producer is rapid.

Margin finally can be said to differ among products, because marketing services differ changes in margins may be depicted as resulting from shifts in the supply or demand relation for services.
CHAPTER THREE:
THE STUDY AREA AND RESEARCH METHODOLOGY:
3.1 THE STUDY AREA:
The study took place in twelve Local Government Areas of Rivers State. Rivers state is one of the Coastline States in Nigeria, ofWest Africa’s coast bordering the Atlantic Ocean. It covers an estimated area of 20,000 km2 and lies within the rain forest beltof Nigeria between longitude 6.10
and 7.50 (degree) east and latitude 40 and 60 (degree) north, one-third of the area of the state is covered mostly with swamps with small arable land north and east of the Niger Delta (1998 current Nigeria Map showing FCT, 36 states 774 Local Government Areas and their headquarters). The traditional occupation of people is fishing and farming. The farming activities of the state are geared toward the production of food crops such ac cassava, yam, maize, rice, plantain, cocoyam etc.
The animal husbandry is carried out on extensive basis. The main classes of animal reared by farmers in the state are fowl, poultry, goat, duck, sheep and pigs. Cattle rearing are alien to the agricultural practices in the state due to limitation caused by trypanosomiasis. The largest beef market in the state are located in Port Harcourt and Obio/Akpor Local Government Area, because of the strategic position of Port Harcourt and Obio/AkporLocal Government Area, it has been an area of considerable economic importance and potential man power. It is also an area

of industrial growths; it therefore serves as a good commercial centre that attracts both business men and women.
Finally, Port-Harcourt and Obio/Akpor is made up of three centralurban markets namely; Trans-Amadi abattoir market, Eastern Bye-pass abattoir market and the Rumuodomaya abattoir markets.
3.2 RESEARCH METHOLOGY:
3.2.1 SAMPLING FRAME:
This consist of retailers and wholesalers of beef in the three urban market in Port-Harcourt and Obio/Akpor and eleven semi-urban market in Okrika, Asari-Toru, Bonny, Ahoda East, Ikwerre, Eleme, Gokana, Khana, Opobo/Nkoro and Ogba/Egbema/Ndoni Local Government Area of Rivers State.
The three urban central market includes: Trans-Amadi abattoir market, Eastern Bye-pass abattoir and the Rumuodomaya abattoir market while the semi-urban markets the Okrika Island abattoir, Buguma abattoir market , Isokpo abattoir market, Eleme abattoir market, Bori abattoir, Bodo city abattoir market, Opobo abattoir market, Omoku abattoir market and Okwuzi abattoir market.
The three urban central markets studied in Port Harcourt and Obio-Akpor are:
3.2.1.1TRANS-AMADI ABATTOIR MARKET:
This market is located along the most industrialized part of PortHarcourt. This market is classified under central urban market because it is an urban consumption centre which receives a significant portion of its supplies from primary market.
3.2.1.2 EASTERN BYE PASS ABATTOIR MARKET:
This is another market which functions daily and is located alongthe Eastern part of the city. Because of the location of this

market it services the majority of Port Harcourt dwellers by supplying the consumers with their ultimate needs.
3.2.1.3 RUMUODUMAYA ABATTOIR MARKET:
This is also a urban central market which performs some functionsas the other two markets.
3.3 SOURCE AND TYPE OF DATA:
The data used for the research work were obtained from two main sources namely: primary and secondary sources.
The primary source includes information gathered through the administered questionnaires and oral interviews with the retailers and wholesalers of beef in selected markets in the state. The method was supplemented with personal observation of beef traders in the process of selling their beef.
The secondary sources include those information obtained from journals, textbooks and other relevant literature that deals on agricultural marketing, conference paper, etc.
The data consist of personal characteristics of beef producers, middlemen, and retailers such as age, sex, educational backgroundand marital status. Others includes the price determination, unitof sales of beef quantity sold per month, marketing functions performed by beef sellers, problem(s) encountered in beef marketing and solutions to such problem(s)
3.4 SAMPLING METHOD AND SAMPLE SIZE:
3.4.1 THE SAMPLING METHOD:
A three stage sampling technique was employed in selecting the beef the sellers studied. The first two stages involved purposiveselection of the local government areas and market within the local government areas on basis of preponderance of beef

marketing activities. This is because beef is not sold in all local government areas or all markets in a local government.
The third and final stages in the sampling process involved the random selection of retailers and wholesalers of beef in the market so chosen. This system is modified in the sense that, in course of sampling at intervals one or two traders did not allow or grant interview, which means starting with the next trader that will be chosen at random and again chosen at intervals of one space. This system was adopted to ensure that the laws of probability do apply and bias in data collection is greatly reduced.
3.4.2 SAMPLE SIZE:
The sample size is made up of one hundred and ten beef sellers selected from three urban central market in Port Harcourt and Obio/Akpor as well as eleven semi-urban markets in Okrika, Asari-Toru, Bonny, Ahoda East, Ikwere, Eleme, Gokana, Khana, Opobo/Nkoro, Ogba/Egbema/Ndoni Local Government Area of Rivers State.
One market was selected per Local Government Area expect Port Harcourt and Ogba/Egbema Ndoni where three and two markets respectively were chosen. This is due to the observed high rate of beef purchase in these markets. The number of beef traders waschosen according to the number of beef traders in each market of the Local Government Area.

TABLE 1
NUMBER OF MARKET AND BEEF STUDIES:
Source: Market Survey December 1998
L.G.A ABARTTOIRMARKET
NUMBER OFSELLERS
PortHarcourt
Trans-Amadi 14
Eastern bye-pass
14
Obio/Akpor Rumuodomaya 10
Okrika Okrika 9
Asari-Toru Buguma 8
Bonny Bonny 7
Ahoada East Upata 8
Ikwere Isokpo 4
Eleme Eleme 7
Gokana Bodo 7
Khana Bori 5
Opobo/Nkoro Opobo 6
Ogba/
Egbema/Ndoni
Omoku 7
Okwuzi 4
TOTAL 14 110

Source: Market Survey, December, 1998.
3.5 METHOD OF DATACOLLECTION:
Cross-sectional data were collected through personnel interview using questionnaire and augmented with observation. The questionnaire was administered to the beef sellers in three urbanabattoir markets in Port Harcourt and Obio/Akpor and the eleven semi-urban abattoir markets in Okrika, Asari-toru, Bonny, Ahoda East, Ikwerre, Eleme, Gokana Khana, Opobo/Nkoro and Ogba/Egbema/Ndoni local government area. In the process, the literate traders were allowed to fill the questionnaires by themselves while the illiterate ones were interviewed orally.
3.6 ANALYTIC TECHNIQUES:
The data from the 110 sellers surveyed were analyzed by means of simple descriptive statistical tools like mean, range frequency table and percentage, as well as the use of gini coefficient and Lorenz curve. Budgetary analyses were employed in analyzing marketing margins.
3.6.1 GINI COEFFICIENT AND LORENZ CURVE:
The Lorenz curve and gini coefficient are the two conventional analytical tools employed in determining the structure of a market. The Lorenz curve is a graph depicting the variance of thesize distribution of sales revenue from perfect equality. The curve is obtained by plotting the cumulative percentage of each category of distributors of beef arranged in order from the smallest to the largest against the cumulative percentage of

their earning from beef. The extent to which a Lorenz curve swings from the line of equal distribution is a measure of the degree of imperfection or non-competitiveness in the market (Kalio, 1987).
Gini coefficient on the other hand is a more precise measure of the degree of inequality of sales revenue. It is an aggregate numerical measure with value ranging from zero (perfectequality) to one (perfect inequality). A Gini Coefficient of 0 implies perfect equality while a coefficient of 1 means perfect inequality and, therefore, higher is the level of concentration and vice versa in a market.
It is usually determined by subtracting the sum of the product ofcumulative percentage of sellers and the cumulative percentage oftheir sales revenue from one. This was used to analyze the marketstructure.
3.6.2 MARKETING MARGIN:
Marketing margin is the analytical tool used to determine the price paid by the consumer and that obtained by the producer at the Farm gate. It is also the difference in price of a commodity at different stages of the marketing system. That is, it consistsof the cost of performing such marketing functions as transportation, storage and processing.
Marketing margin is used to determine the percentage of consumer’s spending which reaches the producer and their effect on the producer’s production plan. It is made up of individual margins obtained by intermediaries who actually assume ownership of a product and then resell it, by adding charges for marketing services rendered.

Marketing margin differ among products because marketing servicesdiffer, the changes in margins may be depicted due to shifts in the supply or demand relation for services.
3.6.3 MARKET BEHAVIOUR:
This is used to describe the physical functions of the traders, such as transportation, storage, pricing, and exchange and financing.
The price of beef is determined by haggling and bargaining and also depends on expenses and demand. The difference in price formation by any three participants is that the producer slightlymonopolizes the beef market, so determines when he is going to sell his cows. The wholesaler who buys in bulk and stores also slightly controls how much to sell his beef, while the retailer who buys in small quantities only determine price by adding all his expenses and then haggle with the consumers.
The beef traders association represents the outmost of the traders to government, she also try to reduce the expenses incurred by the traders; this is done by leaving buses or lorriesat low cost for the traders to transport their beefs; hire or rent cool rooms to her members. She negotiates with the government on the amount or rent of the stall. The association has a lay down rules and regulations that prevent new members from acting easily even if they meet all the requirements, association also partially determine the price of beef by formingco-operative societies. The co-operatives buy bulk cows from producers in northern Nigeria, so making the commodity available to their members at cheaper price.
CHAPTER FOUR:ANALYSIS OF DATA, RESULT AND DISCUSSION:
4.1 SOCIO-ECONOMIC CHARACTERISTICS OF THE RESPONDENTS:

The percentage distribution of the trader’s sex, age and the level of education were studied as the socio-economic characteristics of the traders.
TABLE 2
4.1.1 SEX DISTRIBUTION OF THE TRADERS SURVEYED:
Sex Number ofRespondents
% Number ofRespondents
MALE
FEMALE
90
20
81.82
18.18
TOTAL 110 100
Source: Market surveyed, December, 1998.
The above table clearly indicates the sex distribution of the traders involved in the marketing of beef in Port-Harcourt and Obio/Akpor metropolis and the other selected 10 Local Government Areas of Rivers State.
Out 110 traders interviewed, 90 (81.82%) were males, while 20 (18.18%) were females. This result indicates that males dominate in the sales of beef in Rivers State. This is attributable to thetedious or herculean nature of the trade. Although, some men interviewed, specifically, the retailers acknowledged the fact that their wives assist them in the business. While some of the women refused to be interviewed directly as the owners of the business.
Majority of the female traders are found in Port-Harcourt and Obio/Akpor Local Government Areas, while in order Local Government Areas they are sparsely located or are not seen at all. This can also be attributed to the Herculean in transportingthe beef from the urban areas to the rural areas.

Number of
TABLE 3
4.1.2 AGE DISTRIBUTION OF THE TRADER SURVEYED:
Rangersof AgeGroup
Number ofRespondent
% Number ofRespondent
10-25years
25-40 “
40-55 “
55-70 “
70 andabove
15
55
35
4
1
13.64
50.00
31.82
3.64
0.91
Total 110 100
Source: Market surveyed, December, 1998.
The table indicates the age group of traders in Port Harcourt andObio/Akpor and the other selected 10 Local Government Areas of Rivers State. Out if the 110 traders interviewed 55(50.00%) of the total respondents fall within the age group of 25-40years. Itwas observed that people within this age group dominate the beef trade. And 35(31.82%) of the total respondent that fall within the age group of 40-55 follow closely. While the last were those that fall within the range of 70 and above which is then followedby 4(3.64%) of the total respondent that fall within the age group of 55-70. And finally the 15(13.64%) which fall within the range of 10-35years is the third highest respondent
FIGURE 1
60

50
40
30
20
10
0
10-25 25-40 40-55 55-70 70-above
Sources: Market Survey September, 1998.
From the bar chart, the margin between those within the range of 25 to 40 and the rest is very conspicuous, indicating the highestage distribution of the traders.
TABLE 4
4.1.3 EDUCATIONAL DISTRI BUTION OF TRADER SURVEY:
LEVEL OFEDUCATION
NO. OFRESPONDENTS
% NO. OFRESPONDENTS
NEVER ATTENDED SCHOOL
ATTENDED ADULT SCHOOL
ATTENDED PRIMARY SCHOOL
ATTENDED
15
5
60
13.64
4.55
54.55

SECONDARY SCHOOL
OTHERS
25
5
22.73
4.55
TOTAL 110 100
Source: Market surveyed, December, 1998.
The educational qualification of the beef traders surveyed was another interesting aspect of the study. It was observed that themajority of the traders fell under those that attended primary school and they have the highest percentage 54.55% representing half of the total respondents, those that attend secondary schoolfollowed, representing the second highest percentage of 22.73%of the total respondents. Finally, the least of them are those that attended other school and those that attended adult school, each representing 4.55% of the total respondents. Although so many of the beef sellers could read or write, the overall educational qualification of the traders interviewed was quite low.
TABLE 5
4.2 DISTRIBUTION OF PARTICIPANT
TRADING BUSINESS:
Types ofParticipants
Number of Respondents
% Number ofRespondents
PRODUCERSWHOLESALERS
COMMISSION AGENTS
RETAILERS
228
5
80
1.8220.91
4.55
72.73
TOTAL 110 100

Source: Market surveyed, December, 1998.
Table 5 clearly indicates the main categories of participants in the beef market in selected Local Government Areas of Rivers State.It is obvious from the table that the retailers are the largest group among the other groups. These groups buy in small amount and quantity, and sell directly to the consumers.
They are found in all rural and urban market in the state where beef is sold. They represent 72.73% which is more than half of the total percentage of the total respondent.
The wholesalers perform one the most important functions in assembling bulk beef, transportation and grading of beef. There are two categories of wholesalers identified in beef distribution, those that buy from the producer and slaughter for sale and those that buy bulk slaughtered beef and resale for profit. The wholesalers represent a total of 20.91% of the total respondent.
The commission agents are the people that mediate between urban butcher and/or wholesaler and retailer in semi urban and rural areas. They link the rural and urban traders together in order tobuy and sell their beefs respectively and in the process they collect their commission. They represent a total of 4.55% of the total respondents.

The producers are the real farmers that own the cattle; they carry some of their cattle from north to south for grazing and market. These sets of people represent only 1.82% of the total respondent of the beef traders.
TABLE 6
4.3 SOURCE OF CAPITAL FOR BEEF TRADERS:
Source of Capital
Number of Respondents
% Number ofRespondents
Bank loan 2 1.82
Personal saving
70 63.64
From family source
20 18.18
Borrow from local Money lenders
12 10.91
others 6 5.45
Total 110 10
Source: Market Survey December 1998
The table shows the different sources in which traders obtained their capital in the selected Local Government Areas in Rivers State. From the study, out of the 110 traders interviewed 70 (63.64) obtain their capital from personal saving. They representmore than half of the total percentage of the total respondent atthe highest source. They are closely followed by those that obtained their capital from family sources, which is represented as 18.18% of the total respondent.
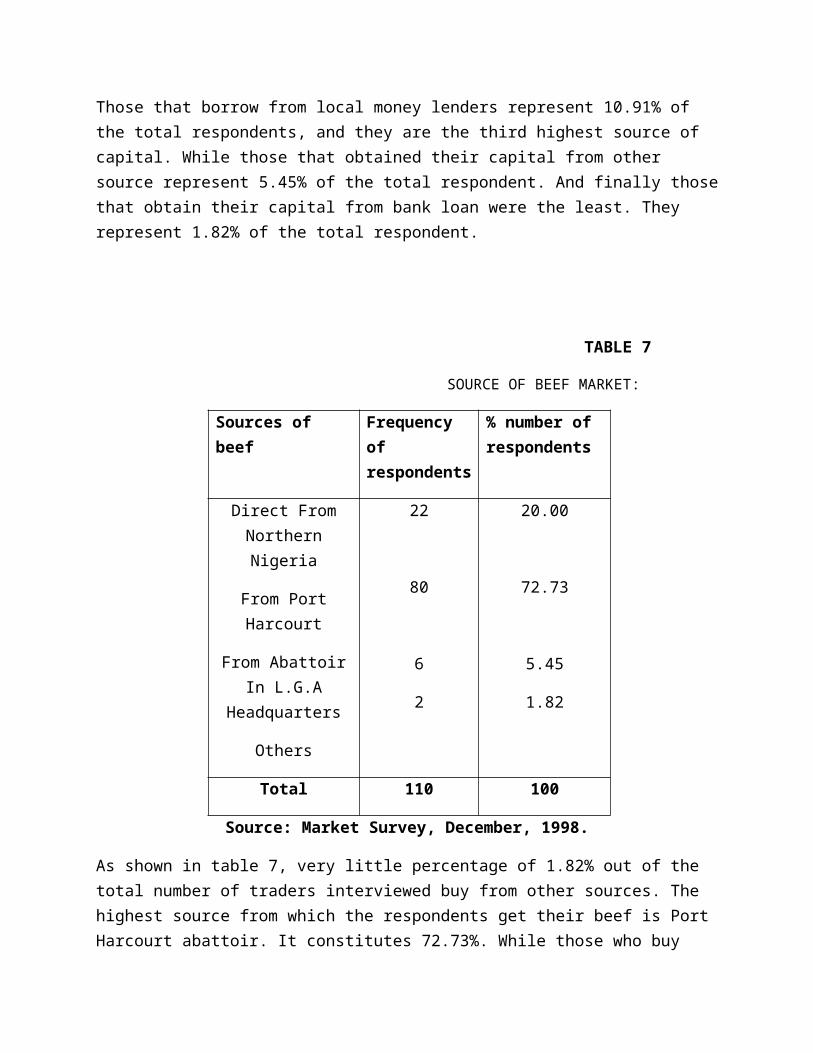
Those that borrow from local money lenders represent 10.91% of the total respondents, and they are the third highest source of capital. While those that obtained their capital from other source represent 5.45% of the total respondent. And finally thosethat obtain their capital from bank loan were the least. They represent 1.82% of the total respondent.
TABLE 7
SOURCE OF BEEF MARKET:
Sources of beef
Frequency of respondents
% number of respondents
Direct FromNorthernNigeria
From PortHarcourt
From AbattoirIn L.G.A
Headquarters
Others
22
80
6
2
20.00
72.73
5.45
1.82
Total 110 100
Source: Market Survey, December, 1998.
As shown in table 7, very little percentage of 1.82% out of the total number of traders interviewed buy from other sources. The highest source from which the respondents get their beef is Port Harcourt abattoir. It constitutes 72.73%. While those who buy

directly from the producers (Northern Nigeria) are the second, representing 20.00%. Finally, the least in the table above are those that buy from their local government headquarters representing 5.45% the total buyers
4.5 THE BASIC PHYSICAL FUNCTION:
The beef sellers in the state perform the following marketing function: Transportation, butchering, storage, pricing, and exchange, and financing.
4.5.1 TRANSPORTATION:
Transportation system is one of the marketing systems it is primarily concerned with delivery of beef to the place needed andaccounts for a large proportion of the marketing cost. Below is the distribution of the mode of beef transportation in the study area.
Table 8
MODE OF BEEF TRANSPORTATION (WHOLESALERS):
Means Number of respondents
% number of respondents
Rail
Lorries
Trailers
1
12
10
0
4.35
52.17
43.48
00.00

Cars
Total 23 100.00
Source: Market Survey, December, 1998
From the study, it is shown that Lorries and trailers are the main vehicles through which live cattle from northern Nigeria areconveyed to Port Harcourt. These two means of transportation are represented as 52.17% and 43.48% respectively, While other dealers convey them through rail and non from the car. They are represented as 4.35% and 00.00% respectively
TABLE 9:
MODE OF BEEF TRANSPORTATION (RETAILERS):
MEANS NUMBER OF RESPONDENTS
% NUMBER OF RESPONDENTS
Lorries
Cars
Buses
Wheel Barrows
12
20
14
34
15.00
25.00
17.50
42.50
TOTAL 80 100
SOURCES: Market Survey, December, 1998
From the study, it is clearly shown that wheelbarrow is the greatest means of transporting beef within the market. It represents 42.50% of the total transportation means used by the

retailers. Cars consist 25.00 as the second highest means of transportation used by the retailers. Wholesalers and retailers who sell beef within close distance from the abattoir convey their already slaughtered beef to the market by means of cars.
Buses constitute 17.50% of the total transportation means. Some wholesalers and retailers use buses as their means of transportation. Lorries and bergs account for only 15.00% of the total transportation means. Butchers with outlet Port Harcourt, says Bonny and Asari-turu, convey the live cattle ear market for slaughter and sale at those riverine local governments areas by means of bergs. For outlet in the up land areas by means of the state like Okrika, Ahoda, Eleme, Ikwerre, Gokana, Khana, butchersconvey live cattle’s ear market for slaughter and sale there by means of Lorries.
4.5.2 STORAGE AND PRESERVATION:
Storage of beef is very necessary to reduce waste which may result from spoilage and to ensure a continuous stock of the product.
Live cattle awaiting slaughter is usually kept in a fenced area or paddock. But slaughter beef that are not purchased at the end of the day are preserved in cold stores, home refrigerator, consumed or smoked.
TABLE 10
MODE OF PRESERVATION OF UNSOLD BEEF:

SOURCES: Market Survey, December, 1998
From the study, it is shown that out of the 110 beef sellers studied 80 (72.73%) claimed that they usually have some unsold beef at the end of the day’s business. 51(63.75%) people claimed that they preserve their unsold beef in their home fridge, while 22 claimed that preserved their unsold beef by consuming them, this represent 27.50%. only traders claimed that they preserve their unsold beef in a cold store representing 8.75%, and nobody claimed to smoke his unsold beef.
4.5.3 PRICING AND EXCHANGING:
Pricing is the process agreeing on price of the commodity and theeventual transfer of title to the buyer after the agreed price has been paid. In organized markets, the price attached to a commodity is usually based on weight, size, quality, etc. of the commodity. No bargaining is necessary.
However, in the beef market studied, it was observed that the price formation was affected through bargaining or haggling almost all the time.
For example, of the 110 beef sellers surveyed 90 (81.82%) arrivedat the price at which they sell their beef through the process ofbargaining and haggling, only 20 (18.18%) arrived at the price
MODE OF PRESERVATION
NO. OF RESPONDENT
% NO. OF RESPONDENTS
Home Fridge
Smoking
Consumed
Cold Storage
51
--
22
7
63.75
--
27.50
8.75
TOTAL 80 100

through weighting. It was observed that the 20 beef sellers that fixed price of beef on the basis of weight are wholesalers, who sell to companies, hotels and other individuals.
Exchange and delivery of beef was observed to take place on the spot immediately the buyer pays the agreed amount of money. Delivery of beef to the home of the buyer as practiced in developed countries does not obtain in the distribution system studied.
4.5.4 FINANCING:
Majority of the beef sellers claimed to have obtained their capital from source outside the banking industry. For example, ofthe 110 beef sellers studied only 2 (1.82%) obtain capital through loans, 70 (63.64%) obtain investment capital from own saving, 20 (18.18%) obtain capital through family help, while theremaining 12 (10.91%) obtain capital through borrowing from localunder. Finally 6 (5.54%) obtain through other sources. (Table 6)
FIGURE 2
4.6.0 THE MARKETING CHANNEL AND EXCHANGE PATTERN:
F=I40 HEAD OF COWS
CATTLE PRODUCERS
WHOLESALERS
c=10.000kg 30.200kg E= 40,200KG
B=5.200kg 40.000kg D=15,000KG
=49.0000kg A= 2 HEADS OF COWS
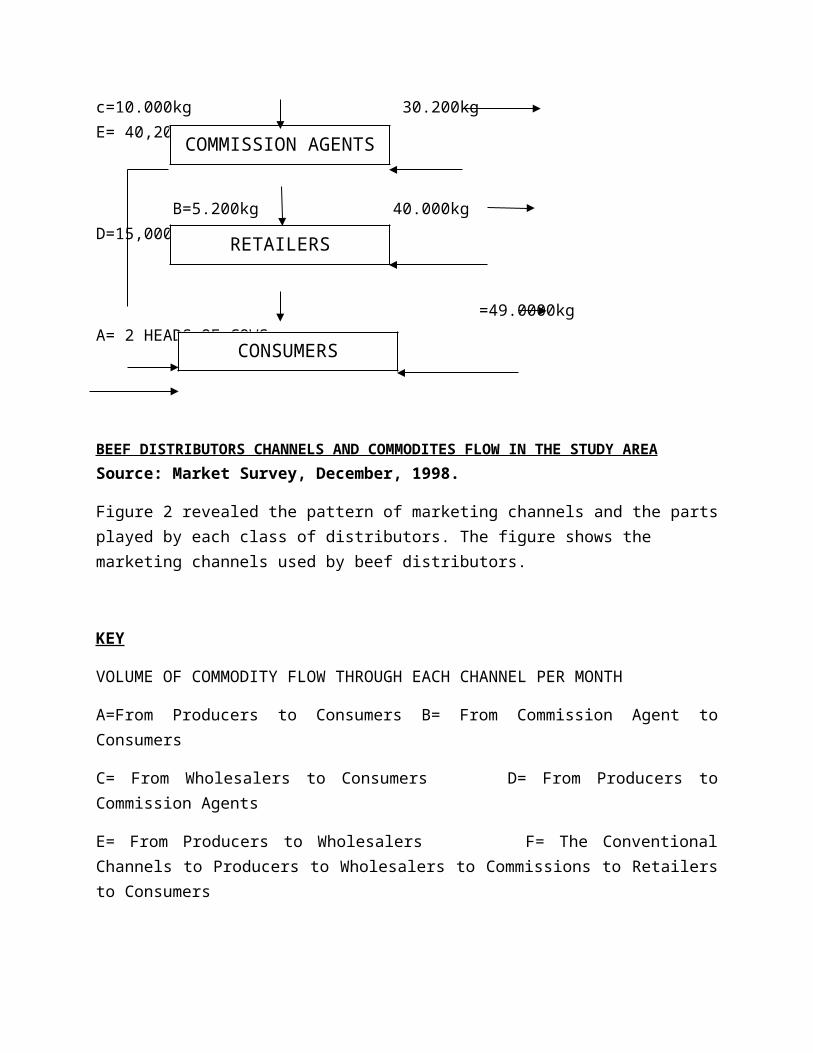
BEEF DISTRIBUTORS CHANNELS AND COMMODITES FLOW IN THE STUDY AREA Source: Market Survey, December, 1998.
Figure 2 revealed the pattern of marketing channels and the partsplayed by each class of distributors. The figure shows the marketing channels used by beef distributors.
KEY
VOLUME OF COMMODITY FLOW THROUGH EACH CHANNEL PER MONTH
A=From Producers to Consumers B= From Commission Agent toConsumers
C= From Wholesalers to Consumers D= From Producers toCommission Agents
E= From Producers to Wholesalers F= The ConventionalChannels to Producers to Wholesalers to Commissions to Retailersto Consumers
COMMISSION AGENTS
RETAILERS
CONSUMERS
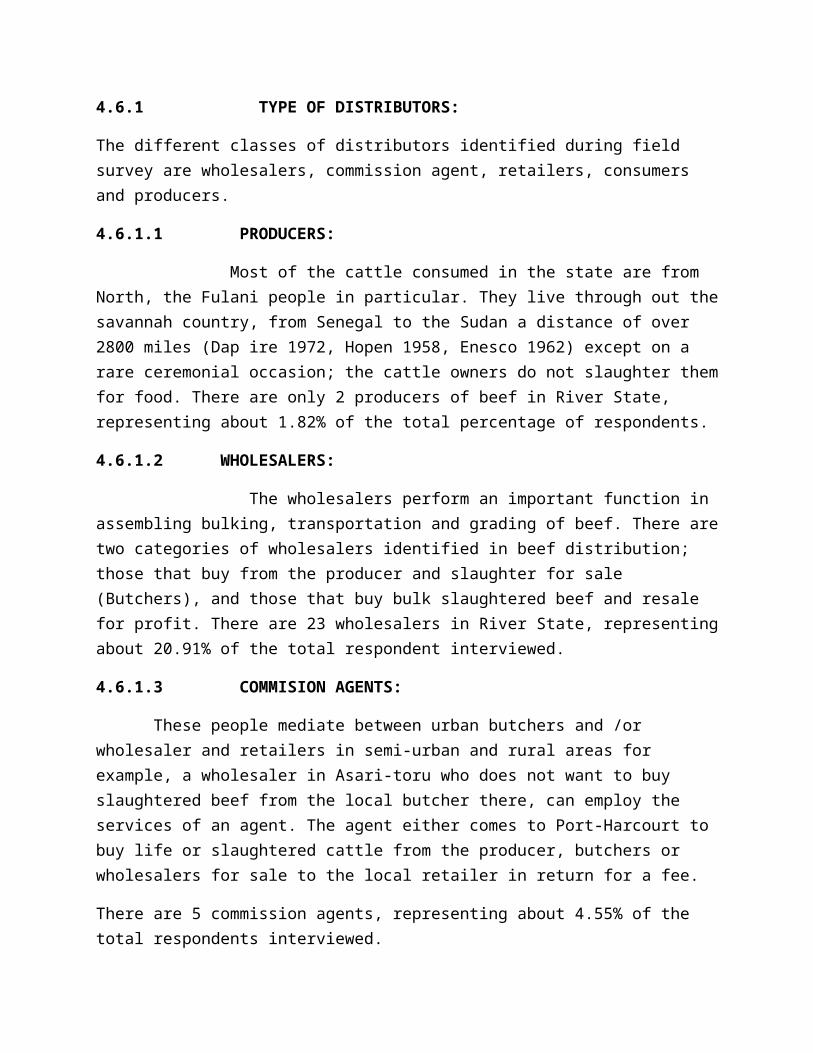
4.6.1 TYPE OF DISTRIBUTORS:
The different classes of distributors identified during field survey are wholesalers, commission agent, retailers, consumers and producers.
4.6.1.1 PRODUCERS:
Most of the cattle consumed in the state are from North, the Fulani people in particular. They live through out thesavannah country, from Senegal to the Sudan a distance of over 2800 miles (Dap ire 1972, Hopen 1958, Enesco 1962) except on a rare ceremonial occasion; the cattle owners do not slaughter themfor food. There are only 2 producers of beef in River State, representing about 1.82% of the total percentage of respondents.
4.6.1.2 WHOLESALERS:
The wholesalers perform an important function in assembling bulking, transportation and grading of beef. There aretwo categories of wholesalers identified in beef distribution; those that buy from the producer and slaughter for sale (Butchers), and those that buy bulk slaughtered beef and resale for profit. There are 23 wholesalers in River State, representingabout 20.91% of the total respondent interviewed.
4.6.1.3 COMMISION AGENTS:
These people mediate between urban butchers and /or wholesaler and retailers in semi-urban and rural areas for example, a wholesaler in Asari-toru who does not want to buy slaughtered beef from the local butcher there, can employ the services of an agent. The agent either comes to Port-Harcourt to buy life or slaughtered cattle from the producer, butchers or wholesalers for sale to the local retailer in return for a fee.
There are 5 commission agents, representing about 4.55% of the total respondents interviewed.

4.6.1.4 RETAILERS:
The market structure for beef distributors indicates competitiveness at the retail end.
These groups buy in small amount and quality, and sell directly to the consumers, they are found in all rural and urban market inthe state where beef is sold.
There were more beef retailers than any other type of beef distributors in the markets, which is there are 80 respondents, representing 72.73% of the total respondents interviewed.
4.6.1.5 CONSUMERS:
These are persons and organization that buy beef not only for thepurpose of resale but for the purpose of consumption. They are the ultimate users; the persons or organizations that derive from, time and place utility from beef as a commodity, they include individuals and organizations like Hotel, Restaurant, School, Clubs, Association etc.
4.6.1.6 EXCHANGE POINT:
The physical points at which titles to the beef change hands are of important. An examination of various exchange points at different levels of marketing systems reveals that beef sales takes place in the rural market, more often in the town or urban market like Trans - Amadi or zoo abattoir, Rumuodomaya abattoir and eastern bye pass abattoir.
4.7 STRUCTURE OF THE BEEF MARKET:
TABLE 11
DISTRIBUTION OF BEEF SELLERS BY SIZE OF AVERAGE DAILY SALES:
Sales range Absolutefrequenc
Relative frequency

y (%)
Under1,00.00
1001-3000
3001-5000
5000 andabove
-
11
80
19
-
10.00
72.73
17.27
Total 110 100.00
Source: Market survey, December, 1998
The study reveals that the marketing of beef in Rivers State is carried out by many traders, but few control a major share of thecommodity sold in the market. This implies a monopolistic type ofmarket structure. Consequently, the few large traders collude in order to influence either the market price of beef or the quantity of its supply to the market.
From the study, out of the 110 traders none obtain daily sales revenue under ₦1,000, but 11 (10.00%) obtain daily sales revenue between ₦1,001 and ₦3,000.
80(72.73%) obtain sales revenue between ₦3,001 and ₦5,000 while the remaining 19 (17.27%) obtain sales revenue between ₦5,000 andabove. This implies that sixty percent of the traders control more than eighty percent of the total daily sales revenue in the market. These sixty percent of traders together monopolize the market for beef in the state.
4.7.1 MARKET STRUCTURE FOR BEEF WHOLESALERS:
TABLE 12

DISTRIBUTIONS OF BEEF WHOLESALERS BY SIZE OF AVERAGE DAILY SALES:
Salesranges(N)
Frequency
Relativefrequenc
y
(X)
%Cumulati
vefrequenc
y
Totalvaluedailysales(N)
%Totalsales
% ofcumulative
sales(Y)
XY
1001-3000
6 0.2609 0.2609 2700 0.1875 0.1875 0.0489
3001-5000
8 0.3478 0.6087 3950 0.2743 0.4618 0.1606
5000 and above
9 0. 3913 1.0000 7750 0.5382 1.0000 0.3913
Total 23 1.0000 1.8696 14,400 1.000 16493 0.6008
GINI COEFFICIENT = 1-0.6008 0.3992 ≈0.4
FIGURE 3

0
100
90
80
70
60
50
40
30
20
10
0 10 20 30 40 50 60 70 80 9
CUMUL
ATIVE PE
RCEN
TAGE
OF SA
LES
0
CUMULATIVE PERCENTAGE OF TRADERS
LORENZ CURVE
The market structure for the wholesalers of beef shows that out of 23 wholesalers interviewed, 6 (26.09%) made daily revenue of between ₦1,001-₦3,000 with total volume of sales ₦2,700 (18.75%),8(34.78%) obtain sales revenue of between ₦3,001-₦5,000 with total volume of sales ₦3,950 (27.43%), 9,(39.13%) obtain sales revenue of between ₦5,000 and above with total volume of sales of₦7,750(53.82%).
The Lorenz curve of figure 3, describe a situation in which a large percentage of wholesalers account for a large shareof all business activities in the market

4.7.2 MARKET STRUCTURE FOR BEEF RETAILERS
TABLE 13
DISTRIBUTIONS OF BEEF RETAILERS BY SIZE OF AVERAGE DAILY SALES:
SALES RANGE (N)
FREQUENCY
RELATIVE FREQUENCY (X)
%TOTAL
CUMULATIVE
FREQUENCY
TOTAL VALUE OF DAILY SALES
% OF TOTAL SALES
% CUMULATIVE OF SALES
XY
1,001-3,000
3,001-5,000
5000 and above
4
71
5
0.0500
0.8875
0.0625
0.0500
0.9375
1.0000
1,000
3,480
5,800
0.0973
O.3385
0.5642
0.0973
0.4358
1.0000
0.0047
0.3868
0.0625
TOTAL 80 1.0000 1.9875 10280 1.0000
1.5331 0.4540
GINI COEFFICIENT= 1-4540 =0.5460 ≈0.55

FIGURE 4
0
100
90
80
70
60
50
40
30
20
10
0 10 20 30 40 50 60 70 80 9
CUMUL
ATIVE PE
RCEN
TAGE
OF SA
LES
0 CUMULATIVE PERCENTAGE OF TRADERS
LORENZ CURVE

The market structure for the retailers of beef shows that out of 80 retailers interviewed 4 (05.00%) made daily sales revenue between ₦1,001-₦3,000 with a total volume of sales of ₦1,000 (09.73%); 71(88.75%) obtain sales revenue between ₦3,001-₦5,000 with total volume of sales of ₦3,480 (33.85%) 5(06.25) obtain sales revenue between ₦5,800 (56.42%).
4.7.3 THE MARKET STRUCTURE FOR BEEF
TABLE 14 MARKET STRUCTURE FOR BEEF BY SIZE OF AVERAGEDAILY SALES
SALESRANGES
FREQUENCY
RELATIVE
FREQUENCY(X)
%CUMULATIVE
FREQUENCY
TOTALVALUEDAILYSALES
%TOTALSALES
% OFCUMULATIVESALES(Y)
XY
1001-3000
3001-5000
5000andabove
11
80
19
0.1000
0.7273
0.1727
0.1000
0.8273
1.0000
2700
4500
8750
0.1693
0.2821
0.5486
0.1693
0.4514
1.0000
0.0169
0.3283
0.1727
TOTAL 110 1.0000 1.9273 15950 1.0000 1.6207 0.5179
GINI COEFICIENT= 1-0.5179
=0.4821 ≈ 0.48

FIGURE 5

CUMULATIVE PERCENTAGE OF TRADERS
LORENZ CURVE
The market structure for the entire beef traders shows that out of the 110 beef traders interviewed 11(10.00%) made daily revenuebetween #1,00-#3,000 with total volume of sales of 2,700(16.093%), 80(72.73%), 19(17.77%) obtains sales revenue between #5,000mand above with a total volume of sales of #8,750(84.86%).
The Lorenz curve of figure 4, describes a situation in which a large percentage of retailers account for a share of business activities in the market.
The level of concentration in the beef market is illustrated empirically in table 12 and 13 on the basis of the information

contained in this table; the gini coefficient was estimated to be0.40 and 0.51. This implies that the beef market in Rivers State was concentrated. It can therefore be argued that beef market in the state is in structure.
4.8.0 PRICES AND MARGIN:
4.8.1 PRICES:
The pricing realized by the beef traders depend on the period of the year and the locality. In Rivers State the price of beef is higher during the Christmas, Easter and any other important festive period; this is due to the high demand of beef for the festive celebration. The price formation for beef was observed atthe producers, wholesalers and retailers levels.
4.8.2 PRICE AT THE PRODUCER’S LEVEL:
Despite the large number of middlemen (wholesalers and retailers)like in the food crops, the producers also sell most of their produce directly to the consumers in the urban and rural markets,where they obtain the full retail price. Consequently the producer’s share of the consumer’s expenditure is fairly high.
4.8.3 PRICE AT WHOLESALER’S LEVEL:
The wholesalers are the second largest participant handling beef distribution. The wholesalers covered by this study were of opinion that distance from the supply source, storage etc. were important factors in the wholesalers price formation. The fartheraway the source is from the consuming market, the higher the transportation costs.
Wholesaler’s price is from after prolonged bargaining both with producers and retailers. Pricing at the whole sale level is quitecompetitive since producer can sell directly to the retailers andconsumers.

4.8.4 PRICE AT RETAILER’S LEVEL
Compared with the retail price levels, it was observed that between retailers, price variation is not high, because the beef sold is homogenous. The analysis on the factors influencing selling prices shows that buying price is the major factor; it isdone by bargaining or haggling.
4.8.5 MARKETING MARGINS
The result of the analysis of wholesale and retail mar grin reveal that the wholesale margin is higher than the retail margin. Wholesale gross marketing margin for beef sellers studiedmonthly is estimated at 2,000.00 while the net wholesale marketing mar grins #1,700.00 (Table 14). In terms of percentage,the net wholesale marketing mar grin is 24.29% of the main value of beef sold monthly. It implies that for every #100.00 beef purchased by the retailers, the wholesalers earn 24.29.
TABLE 14 ESTIMATED GROSS AND NET MONTHLY WHOLESALE
MARKETING MARGIN FOR BEEF
TRANSACTION SUB-TOTAL (N) TOTAL (N)
Mean Value of Beef
Purchased by wholesalers per month 7,000.00
Mean value of sales by wholesalers per month -9,000.00
Monthly gross wholesale marketing margin 2,000.00
LESS COST OF MARKETING

Transportation - N150.00
Storage/preservation - N50.00
Stall fee N100.00
TOTAL N300.00
Monthly net wholesale marketing margin N1, 700.00
Monthly net mar grin as percentage of mean value of beef purchased - 24.29% Source: Market Survey, December, 1998.
The gross and net retail monthly margins have been estimated at N1, 000.00 and N800.00 respectively (Table15).
In terms of percentage, the net retail marketing is 16.00% of themean value of beef sold monthly. It implies that every N100 of beef purchased by the consumers, the retailer gets about N16.00
TABLE 15: ESTIMATED GROSS AND NET MONTHLY RETAIL
MARKETING MARGIN OF BEEF
TRANSACTION SUB-TOTAL (N) TOTAL (N)
Mean value of beef purchased by retailer monthly 5,000.00

Mean value of monthly sales by retailer 6,000.00
Monthly gross retailer marketing Margin 11,000.00
LESS COST OF MARKETING
Transportation 80.00 storage/Preservation 20.00 Stall fee 100.00 TOTAL 200.00
Monthly net retail marketing margin N800.00 Net retail margin as a percentage of mean value of monthly beef purchase 16.0% Source: Market survey, December, 1998.
From the forgoing results, it can be argued that the wholesaler and retails margin in the beef distribution system in the State is this confirming the assertion by beef of consumers. High priceof beef in the market can therefore be attributed to the activities of middle men wholesalers and retailers as their net margins are high. It can therefore be argued that in addition to supply shortage high prices of beef in the State is due primarilyto high margins earned by beef sellers in the State.
4.9.0 PROBLEMS OF BEEF MARKETING:

The following have been identified as a major militating against effective and efficient marketing system of beef in the study areas.
4.9.1 THE INADEQUACY OF STORAGE FACILITIES:
Storage facilities in the market have suffered a great deal of neglect. Lack of good storage equipment makes it extremely difficult for traders to stop the deteriorating rate of beef in the market.
The current method of storage and preservation of beef by beef sellers is inefficient; most of the beef sellers do not have deepfreezers to preserve the left over after the day’s sales neither are there enough cold room at strategic location throughout the cities where sellers can preserve their beef for reasonable fee. As a result, beef retailers in particulars, out of fear of loosing their beef through spoilage, try to spoil them at a give-away price during the hours of the day. Others reserve the left –over for family consumption while yet others who deep freezers athome preserve their beef in deep freezers. Besides the daily fluctuation in prices of beef caused by the lack of storage and preservation facilities, the quality of the commodity also diminishes with the passage of time owing to poor handling.
This leads to inefficiency in the method of handling beef.
4.9.2 POOR TRANSPORTATION FACILITIES:
Transport facilities are another majors militating against beef marketing. Transportation cost has been identified as another responsible factor for the high price in beef marketing. This problem of transport is two fold. It is either that the roads arebad or there are not enough vehicles to use in conveying the products from one part of the city to another. In most cases, as it with places, the roads are seasonal, or they may not be there at all. As a result, beef sellers incur huge transportation cost

which would have been smaller were transportation facilities and network to be adequate. This limitations to the cost of marketingand thereby inflates the retail price of beef in the market.
4.9.3 INADEQUATE FINANCING:
Marketing of beef is a business and therefore requires huge supply of capital to ensure continuity and high pay off. The traders lack financial backing due o lack of collateral and largescale marketing that would attribute it the interest of the lenders. There are problems in obtaining loans from the financialinstitution. This therefore makes the traders poor and can be seen from the quantity and size of business. They therefore lack capital for business expansion.
4.9.4 LACK OF ADEQUATE MARKET INFORMATION:
There can be no efficiency in any marketing system without an adequate flow of marketing information between the buyers and theseller as far as beef marketing is concerned. Marketing information dissemination is mostly verbal and this gives room for information distortion and there cannot effect any remarkablechange.
4.9.5 LACK OF UNIFORM GRADES AND STANDARDS:
Standardization and grading of beef as a marketing or service is poorly done. Yet these function or services help to facilitate the process of marketing since they make it possible for beef to be presented in form, lots of beef traders in Rivers State do notgrade their beef on the basis of any commonly accepted standard. As a result, beef of the same quality could be sold for the same or adjoining traders at different prices. Prices which do not reflect any differences in product quality. Consequently beef traders have some room within which to exploit innocent consumerswith poor bargaining power. This contributes to inefficiency in the marketing system for beef.

CHAPTER FIVE:
SUMMARY, CONCLUSION AND RECOMMENDATION:
5.1 SUMMARY
This study was designed to describe the channels through which beef focus from the point of production to the end-user; determine the structure; and to estimate the marketing margin andhence the performance of the marketing system.
Other types of data studied were personal characteristics of beefsellers such as age, sex, educational, marital, status, analytical tools like percentage, frequency table, main range, gini coefficient and Lorenz curve analyzing the data.
The study has shown that the product and sale of beef was dominated by males. Majority of the producers and sellers were within the age range of 25-40 years; majority of the sellers attended primary school. The retailers dominate the beef destination chart, while in the case of financial, majority started with personal saving.
The study also revealed that there are five principal channels orroutes through which beef flows from the point of production to the end users. These channels include;
1. Producers Consumers
2. Producers Retailers Consumers
3. Producers Wholesalers Retailers Consumers
4. Producers Agents Retailers Consumers

5. Producers Agents Wholesalers Retailers Consumers
The study has also shown that while the wholesalers obtained daily net marketing margin of ₦1,700 or 24.29% of mean value of beef purchase, the retailers obtained ₦800.00 or 16.00% of the mean value of the beef purchased, which could be described as fair.
In the analysis of the market structure, the producer market, wholesalers market, the retailer market, and entire market were monopolistic competitive in structure.
However, in the analysis of attitude of the participants, no exclusionary tactics were revealed, and majority of beef sellers fix price individually. A good number of marketing functions wereobserved to ne performed by the traders. These functions are killing, washing, carrying, storage, transportation, pricing and exchange.
Finally, among the problems affecting the marketing system are lack of storage facilities, lack of capital, high cost of transportation and the deplorable conditions of most roads.
5.2 CONCLUSION:
In the study, it has been shown that beef marketing activities are carried out by several sellers, of which no group of sellers completely control the price or quantity supply, as a result the market structure for beef in the State can be argued as fairly competitive, but the margin earned by the beef sellers are high. It then follows that the high price of beef in the state cannot be attributed to uncompetitive nature of the market as generally believed but to other factors such as the shortage of beef in the distribution channel, lack of transportation and storage facilities and other functions perform by beef trader. However, the trade has been revealed to be profitable and some

recommendation has been made which if strictly implemented will improve the production and marketing of beef in Rivers State.
5.3 RECOMMENDATION:
Having examined the various bottle-neck associated with the marketing of beef in River State.
1. In order to facilitate the exchange function in beef market, it is suggested
that the Nigerian standard organization in collaboration with the appropriate government agency inthe state evolve acceptable standards for selling beef in the state in general and in Port-Harcourt in particular if they have not already done so, if there are any existing standards then the appropriate agencies of government should embark on popularization of such standard and ensure their enforcement.
2. The problem of beef transportation which result is in a very wide
seasonal fluctuation of price paid to the producers bythe consumers and which conceal possible financial benefits whichcan be controlled through Government intervention. The governmentcan do this by providing an efficient transportation system through the construction and maintenance of feeder roads to link the producer of beef with all parts of the city. This will help reduce the high transport fare paid by the traders in conveying the commodities from one part of the state to another.
3. Adequate storage facilities are specially needed to reduce the huge losses in curved through poor storage techniques. Market in which beef are sold should be equipped withthe inbuilt storage and preservation of beef. The availability ofthe facilities are expected to cement the spatially and

temporally separated market thereby lending to lower average prices of beef between places and time.
4. In order to avoid a situation which existing beef sellers union and association grow into colossal monopolies to continue dictating either the price of beef or the quantity ofit supplied, it is suggested that government keeps the activitiesof such union and association under strict surveillance.
REFERENCES:
Abbott, J.C (1973), Marketing problems and improvement programmesF.A.O
Marketing Guide No.1 Rome
Abbott, J.C and Markeham, T.P (1960), Agricultural Economic and Marketing In The Tropic Editor Longman Group Limited London (p.54)
Abbot, J.C (1979) Marketing Problems and improvement Programmes F.H.O Rome (p.51).
Adegeye, A.J and Dittoh, J.S (1982), Essentials of Agricultural Economics. Centre for Agricultural and Rural Development (CARD) University of Ibadan.
Adeyokumo, T.O (1973), “The Marketing of Foodstuffs Trade Association in Ibadan”. Building of Rural Economics and Sociology Vol. 4 CARD. Ibadan.
Allison-Oguru, E.A (1992) “Analysis of Marketing Channels and Margins of Beef in Rivers State”. Paper presented at the 8th Annual Conference of the Farm Management Association of Nigeria (FAMAN) Help at the auditorium of the Nigerian Agip OilCompany, Port-Harcourt. August 24-26-1992.
Baker J.W (1981), Marketing management and Farmers” Journal of Agricultural Economics Society published by theAgricultural Economics. The university college of Wales Aberystiryth
Bishop C. F and Tousssint, W.D (1958) introduction to Agricultural Economics Analysis. John Willey and son New York.
Elvy,B.H (1982) Marketing made simple. Heinerman publishers London McGrawHill international Book co.
Komolafe, M.F Adgbola A.A L A and Ashaye, T L (1980) Agriculturalscience for West Africa Schools and College second Edition African Education publishers (NIGERIA)
Kohls R.L and Joseph, N.U (1980) Marketing Agricultural Products.5th edition Macmillan Publishing Co. Inc. New York.
Lipsey, R.G (1980) An Introduction to Positive Economics 4th edition Weldenfield and Nicolson.
National Conference on Beef Production Kaduna Nig. July 27-20 (1982)
Ogoinwu, W (1979) A Social Survey of Port-Harcourt, Heinemann Educational Books (Nigeria) Ltd Ibadan (p.40).
Okorie, A. (1980) Agricultural Marketing and Storage in the 4th National Development of Agriculture, Federal Department of Agriculture Lagos.
Henderson and Poole, (1991), Principles of Economics 1st edition D.C Health

Riotson, C (1980) Agricultural Economics- Principles and Policy. Granada Publishing Limited. Technical books division Erogmore, St Atlans Thert A5 2nf.
Stonier AW and Hague D C (1982). A Textbook of Economic Theory 5 Edition Longman Group Limited London.
Webster C.C and Wilson P N(1980) Agriculture in the tropic. 2 nd edition. The English Language Book and Longman Group Limited.
Wetham E H (1972) Agricultural Marketing in Africa Oxford University Press London (p.52)
Breech E.F.L. (1953) Principal of management, 6th Edition Oxford University Press London.
Kohls R.L. and Uhls J.N. (1987) Marketing Agriculture Products, Marc Macmillan Press Ltd, New York.
Kohls R.L. and Downey-N (1987) Marketing of Agricultural Products, (5 th Edition) Macmillan Press Ltd, London.
Kotler P. (1972) Marketing Management (2nd Edition) Prentice Hall. Inc Engleewood Cliffs, New Jresey.
Olukosi J.O. and Isitor, S.U.(1990). Introduction to AgriculturalMarketing and price. Principles and Application. Living Book series G.U. publication, F.C.t. Abuja.
Tomek N.G and Robinson E.L. (1972). Agricultural Product Prices. Cornell University Press Ithaca.
Adebeye A.J. Dittoh J.S. (1982) Essential of Agricultural Economics, Ibadan University Press Ibadan.

Fabiyi. Y. L (1985) Demand for fish in Calabar Cross River State Nigeria. In Proceeding of the 4th annual conference of the Fisheries Society of Nigeria.(FACON) Port Harcourt November 26-29 Pp 62-70.
Copyright © 2022 FDOKUMEN