Is Livestock Marketing Channel Utilisation Influenced by Marketing Orientations of Beef Farmers ?
22
1 Is Livestock Marketing Channel Utilisation Influenced by Marketing Orientations of Beef Farmers ? D. Davies, J. Eddison, S. Cullinane and J. Kirk. Seale-Hayne Faculty of Agriculture, Food and Land Use, University of Plymouth, Newton Abbot, Devon TQ12 6NQ. Major changes have occurred in recent years to alter fundamentally the distribution of meat and livestock in the UK. These changes have been brought about by a range of social and economic pressures, technological advances and legislative controls. All of these changes may impinge on aggregate marketing channel utilisation. Significant pressures are facing channel members across the meat and supply chain from livestock producer to retailer. However, very little is known about farm marketing behaviour and strategic groupings of beef producers in relation to the channels they select. If farmers are to secure quality and price advantages and exploit new marketing opportunities it is essential to gain a better understanding of the choice criteria and the linkages between farm/farmer types in relation to the channels that producers select. Strategic group studies empirically identify groups of firms within an industry which follow similar strategies. The investigation of strategic groups within the agribusiness sector has been identified as an important area for future research, however, there appears to have been little research examining strategic groups of livestock farmers at the farm business level. A livestock marketing survey of beef finishers was conducted in 1998. The results identified that farmers can be classified into three strategic groups following distinctive marketing strategies which influence the level of aggregate channel utilisation. This paper examines the factors affecting meat and livestock distribution within the UK and presents a multivariate statistical analysis of strategic groups profiling the business and management characteristics associated with each distinctive marketing strategy . 1.0 Introduction In this paper the results of a strategic group analysis of the marketing behaviour of 268 lowland beef producers is reported. It is shown that there are significant differences between patterns of strategic behaviour adopted by beef farmers. The marketing, management, and personal characteristics associated with each distinctive strategic focus are described. The research implications of the results are discussed in relation to aggregate channel utilisation. 2.0 Agricultural Marketing in Context Agricultural economists have traditionally taken the view that marketing is a process that occurs after the product leaves the farm gate or with change of ownership. McLeay, Martin and Zwart (1993) suggest that this view: "..... implies that farmer marketing decisions are frequently limited to sales decisions and production planning is excluded from the marketing process... most detailed studies have only examined individual elements of the marketing process such as timing, method of sale, and have often been used to identify one optimal solution.... this implicitly assumes that farmers should follow one pattern of strategic behaviour." Farm management specialists often view production as the cornerstone of farm management with supporting functions of record keeping, financial analysis and planning. This assumes that farm management has evolved from production economics with a financial support function. Marketing decisions are excluded from the process as is a mechanism to facilitate an interactive strategic approach to managing a farm business (McLeay et al 1993, Royer 1995, den Ouden, Dijhuizen, Huirne, Ruud and Zuurbier 1996, McLeay and Zwart 1996) In the business literature, the different strategies that businesses should follow have been classified in studies of strategic taxonomies and typologies. The two most widely referenced typologies are Porter's generic strategies (Porter, 1980) and Miles and Snow's (Miles and Snow 1978) strategic typologies.
Transcript of Is Livestock Marketing Channel Utilisation Influenced by Marketing Orientations of Beef Farmers ?
1
Is Livestock Marketing Channel Utilisation Influenced by Marketing Orientations of Beef Farmers ?
D. Davies, J. Eddison, S. Cullinane and J. Kirk. Seale-Hayne Faculty of Agriculture, Food and Land Use, University of Plymouth, Newton Abbot, Devon TQ12 6NQ. Major changes have occurred in recent years to alter fundamentally the distribution of meat and livestock in the UK. These changes have been brought about by a range of social and economic pressures, technological advances and legislative controls. All of these changes may impinge on aggregate marketing channel utilisation. Significant pressures are facing channel members across the meat and supply chain from livestock producer to retailer. However, very little is known about farm marketing behaviour and strategic groupings of beef producers in relation to the channels they select. If farmers are to secure quality and price advantages and exploit new marketing opportunities it is essential to gain a better understanding of the choice criteria and the linkages between farm/farmer types in relation to the channels that producers select. Strategic group studies empirically identify groups of firms within an industry which follow similar strategies. The investigation of strategic groups within the agribusiness sector has been identified as an important area for future research, however, there appears to have been little research examining strategic groups of livestock farmers at the farm business level. A livestock marketing survey of beef finishers was conducted in 1998. The results identified that farmers can be classified into three strategic groups following distinctive marketing strategies which influence the level of aggregate channel utilisation. This paper examines the factors affecting meat and livestock distribution within the UK and presents a multivariate statistical analysis of strategic groups profiling the business and management characteristics associated with each distinctive marketing strategy . 1.0 Introduction In this paper the results of a strategic group analysis of the marketing behaviour of 268 lowland beef producers is reported. It is shown that there are significant differences between patterns of strategic behaviour adopted by beef farmers. The marketing, management, and personal characteristics associated with each distinctive strategic focus are described. The research implications of the results are discussed in relation to aggregate channel utilisation. 2.0 Agricultural Marketing in Context Agricultural economists have traditionally taken the view that marketing is a process that occurs after the product leaves the farm gate or with change of ownership. McLeay, Martin and Zwart (1993) suggest that this view: "..... implies that farmer marketing decisions are frequently limited to sales decisions and production planning is excluded from the marketing process... most detailed studies have only examined individual elements of the marketing process such as timing, method of sale, and have often been used to identify one optimal solution.... this implicitly assumes that farmers should follow one pattern of strategic behaviour." Farm management specialists often view production as the cornerstone of farm management with supporting functions of record keeping, financial analysis and planning. This assumes that farm management has evolved from production economics with a financial support function. Marketing decisions are excluded from the process as is a mechanism to facilitate an interactive strategic approach to managing a farm business (McLeay et al 1993, Royer 1995, den Ouden, Dijhuizen, Huirne, Ruud and Zuurbier 1996, McLeay and Zwart 1996) In the business literature, the different strategies that businesses should follow have been classified in studies of strategic taxonomies and typologies. The two most widely referenced typologies are Porter's generic strategies (Porter, 1980) and Miles and Snow's (Miles and Snow 1978) strategic typologies.
2
Porter (1980) outlines three conceptual typologies that firms may use to gain a sustainable competitive advantage: cost leadership, differentiation and focus strategies. Porter (1980) suggests that any of the three generic strategies may be successful depending on the resources available to the business, the business' distinctive competencies and non controllable environmental factors. Miles and Snow (1978) categorise firms into four broad types that differ on the basis of adaptive behaviour and general strategic orientation. The four types are: defenders, businesses who engage in little or no product market development, competing primarily on the basis of price, quality delivery or service; prospectors, who pioneer new products or market development; analysers who make fewer innovations than prospectors but are more dynamic than defenders. These three are expected to enjoy success whilst reactors, who do not develop a stable coherent strategy are perceived to be failures. The key dimension underlying the typology is thus the degree of innovation in product or market development. The nature of farm firms and the environment in which they operate means that existing business typologies are unlikely to be able to describe adequately the strategic behaviour of farm businesses. For example, it could be argued that the nature of commodity goods makes it difficult for agricultural producers to differentiate their products, while the small scale and often fragmented nature of farming enterprises impeded the acquisition of economies of scale required for overall cost leadership. Whilst 'marketing' is technically a management function of identifying, anticipating and satisfying consumer requirements profitably, the MLC (1980) suggest it is unlikely that many livestock producers would view their businesses in these terms and rather view the marketing function primarily as a method of sale. However, livestock production involves decisions on type of stock, method and timing of sales, price and payment. Production and marketing policies need to be integrated to maximise the margin between costs and returns. Marketing decisions must take account of the need to produce livestock which yields carcasses of weights and qualities preferred by buyers. Producers have to balance the potential of improving market returns against the possibility of increased production and marketing costs. Production can be planned to take advantage of seasonal peaks in prices; conversely, selling when prices are seasonally low may be justified by savings in production costs. The need to maintain a steady cashflow by regular marketing throughout the year may be a major factor, particularly for intensive livestock enterprises. Additional feed costs and marketing specifications for stock or carcasses within certain weight ranges limit the time stock can be retained on the farm (MLC 1980, Bullen 1984). Some producers avoid commitments that predetermine the method and time of selling, preferring the flexibility to feed livestock for early slaughter or hold them back to heavier weights and choose the method of sale nearer the time of slaughter. There may also be additional costs that farmers may farmers take into account e.g. time, social and opportunity costs. This would suggest that farmer marketing decisions should not merely be limited to sales decisions but should encompass the whole marketing process. Mitchell (1975) suggested that the way farmers view their businesses depends on their personal aspirations, objectives and goals and producers' decisions are influenced by the relative importance they attach to their selling and producing roles. These two extreme positions can be identified as the production-orientated farmer and the marketing-orientated farmer. The production-orientated farmer regards the major part of his business as being concerned with the product he wishes to produce and believes that most profit accrues from time devoted to production, seeking simplicity in marketing arrangements i.e. selling the produce at the end. In contrast, the marketing-orientated farmer will endeavour to produce products which can be profitably sold giving due consideration to the likelihood of profit before production is undertaken. This view may well be outdated. Whilst the marketing concept as suggested may not be embraced by the majority of livestock producers, there is an increasing awareness by many producers that strategic planning is necessary for the survival of the business. Marketing can be seen to have increasing relevance to many livestock producers involved in vertically co-ordinated activities as a result of
3
changes in the food sector. This may well provide opportunities for farmers to adopt the marketing concept (Royer 1995, Ritson, 1997a, Ritson 1997b, McLeay et al 1996). There is evidence that producers, whether they are aware of it or not, actually embrace the marketing concept. For example, BSE has forced producers to think about quality, traceability and animal welfare issues in general influencing many farmers to join farm assurance schemes as a marketing tool to overcome traceability difficulties in order to sell their stock. Most farm level studies of strategic management have attempted to prescribe formal strategic planning models similar to those of large businesses when there is little evidence to suggest that these techniques will assist farmers to satisfy their objectives (Marion 1986, Harling and Quail 1990, Mcleay et al 1993, McLeay et al 1996). While it is often considered that strategy is a hierarchal process, the strategic management process at farm level may follow a more entrepreneurial mode. Little is know about the strategic management process of farmers, in particular strategic decisions or strategic alternatives in relation to marketing and channels of distribution. Marion (1986), Westgren, Sonka and Litzenberg (1988), Dobson and Akridge (1989) and Sonka and Hudson (1990) suggest that research opportunities exist for identifying strategic groups within the agribusiness sector in relation to competitive performance and characteristics of these groups. Very few agricultural strategic group studies appear to have been undertaken in Europe. Kuhl and Kuhl (1990) clustered German farmers into groups who have changed their product line, farm areas and work force over a ten year period, Feka, Xouris and Tsiotras (1997) clustered agri-business companies in the Greek dairy industry based on competitive strategies and Ohlmer, Olson and Brehmer (1998) clustered Swedish farmers in relation to their decision making processes. However, these studies did not attempt to operationalise the components of the farm business strategy process or examine the implications of strategic groups at farm business level. As a consequence further research is necessary to investigate the strategic dimension underlying farm business strategy and to identify and categorise the different strategies that farmers follow, thus enhancing the understanding of farm business marketing and the impacts on channel utilisation.
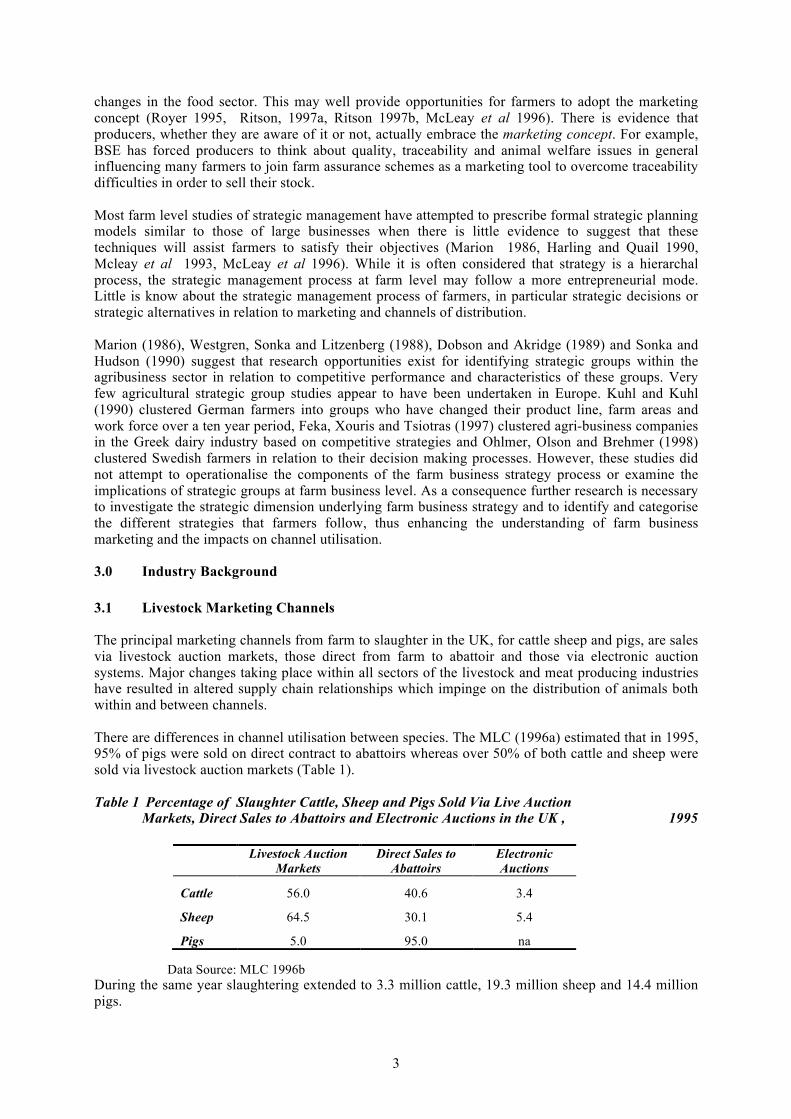
3.0 Industry Background 3.1 Livestock Marketing Channels The principal marketing channels from farm to slaughter in the UK, for cattle sheep and pigs, are sales via livestock auction markets, those direct from farm to abattoir and those via electronic auction systems. Major changes taking place within all sectors of the livestock and meat producing industries have resulted in altered supply chain relationships which impinge on the distribution of animals both within and between channels. There are differences in channel utilisation between species. The MLC (1996a) estimated that in 1995, 95% of pigs were sold on direct contract to abattoirs whereas over 50% of both cattle and sheep were sold via livestock auction markets (Table 1). Table 1 Percentage of Slaughter Cattle, Sheep and Pigs Sold Via Live Auction Markets, Direct Sales to Abattoirs and Electronic Auctions in the UK , 1995
Data Source: MLC 1996b During the same year slaughtering extended to 3.3 million cattle, 19.3 million sheep and 14.4 million pigs.
Livestock Auction Markets
Direct Sales to Abattoirs
Electronic Auctions
Cattle 56.0 40.6 3.4
Sheep 64.5 30.1 5.4
Pigs 5.0 95.0 na
4
Traditionally, livestock were sold at weekly markets and seasonal and annual fairs all over the country and in the early fourteenth century there may have been between 2,000 and 2,500 markets in England (Everitt 1967). More recently, the number of livestock markets has been in decline, so that by 1940 there were 554 in England and Wales, falling to 235 in 1993 (The Livestock Auctioneers' Association 1993, Jones and Steele 1995) and to 194 in 1998 (The Livestock Auctioneers' Association 1998). For prime stock, viz. animals destined for slaughter and subsequent human consumption, 173 markets are currently operating with the remainder used for sales of other classes of livestock. In England, 129 prime stock markets are currently operating with an additional 17 markets for other classes of livestock. Within the South West, there are 31 prime stock markets and 5 others. Historically, the fragmented nature of ruminant livestock production and the large number of farms involved in the production process has been a major reason for the dominance livestock auction markets. In recent years there has been the emergence of strategic alliances as food retailers recognise the importance of providing consumers with quality assurances to reduce the levels of uncertainty within the supply chain (Loader and Hobbs 1996). Direct sales from farm to abattoir are indicative of both vertical and horizontal linkages between producers, processors and retailers and have been more prevalent in the pig and poultry sectors than in either ruminant sector. There is now evidence that these linkages are developing in both the beef and sheep sectors with the emergence of producer clubs, assurance schemes and co-ordinated marketing groups. This has largely been driven by the requirements of the Food Safety Act 1990, under which retailers are obliged to demonstrate “due diligence” in their procurement of livestock necessitating full traceability and quality assurance from farm to consumer. These concerns have been voiced by the UK retail sector: “...auction markets are in danger of being declared a "no buy" area by powerful supermarket companies as they prepare to meet supply chain audits demanded by the 1992 (sic) Food Act... Supermarket buyers say auction markets have a poor welfare image - but their biggest objection is the way animals sold under the hammer lose their identity” (Agra Europe 1991). One supermarket buyer was quoted as saying: “This means we have to know where our animals have come from and how they were managed. This cannot be done through the auction system. As soon as we can establish a network of three cornered quality assurance partnerships with farm-groups, abattoirs and ourselves, we will refuse to handle any auction animals” (Agra Europe 1991). Electronic auction systems, introduced into this country in 1989 (Grega and Ray 1992), employ a variety of technological mechanisms to link buyers and sellers with bidding conducted on a deadweight basis or liveweight and grade assessment with premia and deductions on slaughter. There are currently four electronic auctioneering organisations operating in the UK but penetration has been slow and market share remains limited despite what Graham (1997) refers to as persuasive “economic logic for electronic auctions over physical auctions”. This “economic logic” is judged to confer benefits to auctioneers, buyers and sellers. For example, since animals remain on the farm until being transferred to the abattoir, no capital investment is required by auctioneers for physical market sites. Livestock assessment is, however, required, incurring an additional labour cost. For buyers, trading time is reduced and the need to employ buyers to assess stock in the field is removed. For sellers, trading time and transport costs are reduced and, because competitive bidding is retained, the oligopsonistic power of the major abattoirs and multiple retailers is reduced. Although evidence is scant, the changes within the abattoir and retail sectors in recent years may have been particularly influential in reducing sales via livestock auction markets and limiting the growth of sales via electronic auctions.
5
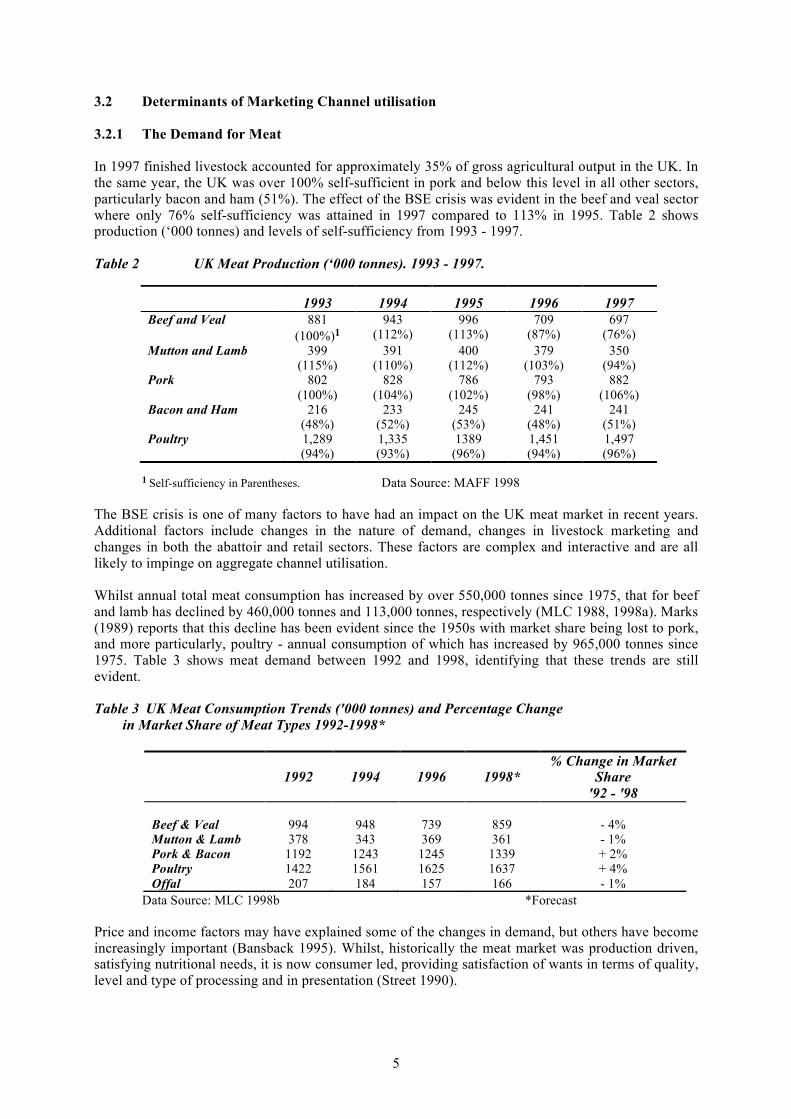
3.2 Determinants of Marketing Channel utilisation 3.2.1 The Demand for Meat In 1997 finished livestock accounted for approximately 35% of gross agricultural output in the UK. In the same year, the UK was over 100% self-sufficient in pork and below this level in all other sectors, particularly bacon and ham (51%). The effect of the BSE crisis was evident in the beef and veal sector where only 76% self-sufficiency was attained in 1997 compared to 113% in 1995. Table 2 shows production (‘000 tonnes) and levels of self-sufficiency from 1993 - 1997. Table 2 UK Meat Production (‘000 tonnes). 1993 - 1997.
1 Self-sufficiency in Parentheses. Data Source: MAFF 1998 The BSE crisis is one of many factors to have had an impact on the UK meat market in recent years. Additional factors include changes in the nature of demand, changes in livestock marketing and changes in both the abattoir and retail sectors. These factors are complex and interactive and are all likely to impinge on aggregate channel utilisation. Whilst annual total meat consumption has increased by over 550,000 tonnes since 1975, that for beef and lamb has declined by 460,000 tonnes and 113,000 tonnes, respectively (MLC 1988, 1998a). Marks (1989) reports that this decline has been evident since the 1950s with market share being lost to pork, and more particularly, poultry - annual consumption of which has increased by 965,000 tonnes since 1975. Table 3 shows meat demand between 1992 and 1998, identifying that these trends are still evident. Table 3 UK Meat Consumption Trends ('000 tonnes) and Percentage Change in Market Share of Meat Types 1992-1998*
Data Source: MLC 1998b *Forecast Price and income factors may have explained some of the changes in demand, but others have become increasingly important (Bansback 1995). Whilst, historically the meat market was production driven, satisfying nutritional needs, it is now consumer led, providing satisfaction of wants in terms of quality, level and type of processing and in presentation (Street 1990).
1993 1994 1995 1996 1997 Beef and Veal 881
(100%)1 943
(112%) 996
(113%) 709
(87%) 697
(76%) Mutton and Lamb 399
(115%) 391
(110%) 400
(112%) 379
(103%) 350
(94%) Pork 802
(100%) 828
(104%) 786
(102%) 793
(98%) 882
(106%) Bacon and Ham 216
(48%) 233
(52%) 245
(53%) 241
(48%) 241
(51%) Poultry 1,289
(94%) 1,335 (93%)
1389 (96%)
1,451 (94%)
1,497 (96%)
1992
1994
1996
1998*
% Change in Market Share
'92 - '98 Beef & Veal
994
948
739
859
- 4%
Mutton & Lamb 378 343 369 361 - 1% Pork & Bacon 1192 1243 1245 1339 + 2% Poultry 1422 1561 1625 1637 + 4% Offal 207 184 157 166 - 1%
6
Demographic and social changes, including an increase in the number of one-person households, increases in the number of working women and the decline in traditional family meals have influenced the growth in demand of convenience and versatile foods (Key Note 1995). The ability of the pig and poultry sectors to respond to these changes, with the development of co-ordinated production and marketing strategies, has led to the presentation of commodities with the consistent quality characteristics required by the consumer. In contrast, the beef and sheep sectors have not responded as effectively to changes in the nature of demand. Both sectors remain more fragmented than the pig and poultry industries and the resulting products are less consistent and of variable quality. Food safety issues have influenced demand in a number of areas in recent years. The March 1996 announcement of a possible connection between BSE in cattle and Creutzfeld Jacob Disease in humans exacerbated the decline in demand for beef. There was a transitory decrease of 70% (MLC 1997) but annual national consumption has now returned to 95% of pre-announcement levels (MLC 1998b). Further examples of the influence of food safety concerns include the 1997 E. coli 0157:H7 food poisoning outbreak in Scotland, the 1991 publicity about Salmonella in the national poultry flock and the precipitation of EU legislation banning of the use of growth promoting hormones in meat production (Gunthorpe, Ingham and Palmer 1995). Dietary advice promoting white meat and advocating a reduction in intake of animal fats has also been influential in the decline in demand for red meat (Gunthorpe et al. 1995). The UK government has recognised consumer concerns with regard to meat safety, and in early 1998, announced a new initiative in the form of Assured British Meat to provide consumers with the assurance that meat and meat products are safe and wholesome. The move came as the Government prepared to outline its plans for a new Food Standards Agency to Parliament. Animal welfare issues have become increasingly important (Eastwood 1995, Hughes 1995) and consumer concerns about production methods, transportation systems and slaughtering operations have affected demand and dictated change within the livestock and meat production industries. For example, livestock sourced from auction markets are excluded from attaining Freedom Food status under the RSPCA welfare codes (RSPCA 1996a, 1996b, 1996c). 3.2.2 The Retail Sector Changes within the retail sector, with increasing dominance of the multiples, have also undoubtedly affected both distribution channel utilisation and the demand for meat. During the 1960s there were approximately 33,000 retail butchers in the UK. By 1998, the number had fallen to approximately 10,500 (MLC 1998c; National Federation of Meat and Food Retailers 1998). Household purchases of meat have increasingly been made from supermarkets, following the trend away from traditional meat cuts to convenience products. Between 1992 and 1997 the supermarkets’ share of household purchases increased from 50.1% to 69.9% at the expense of all other outlets (Table 4). Gunthorpe et al. (1995) indicate that this trend is likely to continue and the MLC (1996b) suggest that if this rate of growth is sustained the multiple retailers will command 75% of market share by 2000. This shift to meat purchases from the supermarkets has inevitably brought meat into closer competition with substitutes, including ready-made meals containing meat as a minority component (Bansback 1995). The effect is likely to influence aggregate demand and that of different meat types even further .
7
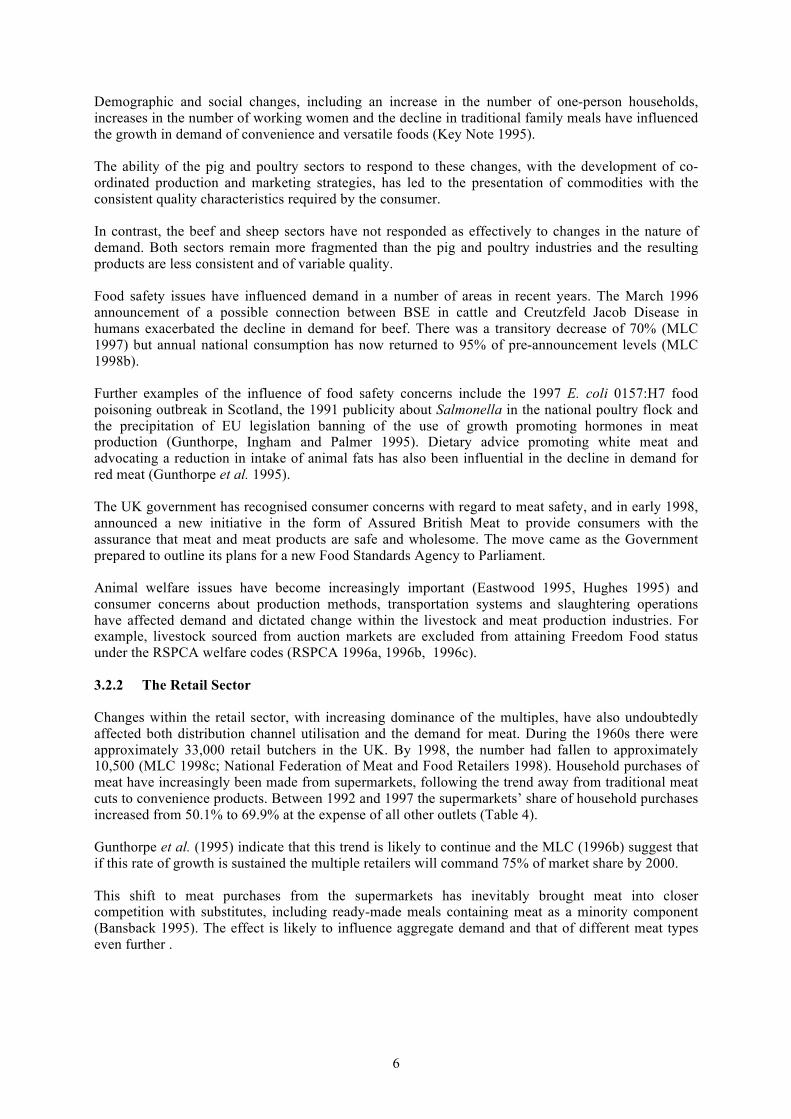
Table 4 Household Purchases of Meat by Volume (Percentage) by Source of Purchase 1993 - 1997
Data Sources: Key Note 1995; MLC 1995;1998a. Three way partnerships between retailers, abattoirs and farms have emerged with the aim of integrating supply chain control in order to reduce the transaction costs associated with livestock procurement (Barry, Sonka and Lajili 1992). Additionally, the major retail multiples have introduced producer club and other loyalty schemes to ensure a greater continuity of supply, quality assurance and traceability. Livestock producers joining such schemes are required to adhere to prescriptive practices which cover all aspects of production i.e. animal welfare, feeding regimes, carcass attributes and housing. Retail multiples insist that producers are members of farm assured schemes and many have gone a step further by implementing their own welfare codes and practices. Such partnerships, have not only affected livestock distribution from farm to slaughter but have also affected the slaughtering and meat processing industry. 3.2.3 The Slaughtering Industry Changes within the slaughtering industry have also exerted influence on distribution channel utilisation. Abattoir numbers have fallen substantially in recent years and by March 1998, 448 plants remained in Great Britain - less than 24% of the number in 1972. The introduction of the Single European Market at the end of 1992 was accompanied by EU wide legislation governing abattoirs. This was incorporated into national law by The Fresh Meat (Hygiene and Inspection) Regulations 1995 and all plants were required to achieve EU approved status by January 1996. Permanent derogations to parts of the legislation were extended those abattoirs supplying local trade only and slaughtering less than 1,000 ELU1,2pa. Thus, the industry has now become formally polarised with those plants with Full Throughput Approval, permitted to trade throughout the EU and with no legislative restrictions on throughput, and those with Low Throughput Approval, permitted to trade only locally and restricted to throughputs of 1,000 ELU a year. Of the 360 abattoirs remaining in England in 1998, 196 were Full Throughput Approved and 164 were Low Throughput Approved, including 1 mobile slaughterhouse. There are 59 abattoirs in the South West, 34 Full Throughput Approved and 25 Low Throughput Approved (MLC 1999). In 1997, the MLC (1998c) estimated that 69% of cattle, over 70% of sheep and almost 88% of pigs were slaughtered in Full Throughput Approved abattoirs. Slaughtering in England in 1997 extended to 1.4 million cattle, 10.7 million sheep and 13.1 million pigs and abattoirs in the South West accounted for 21% of cattle, 19% of sheep and 11% of pig slaughtering. It is known that there is considerable movement of both store and slaughter livestock throughout the country (for example, see Davies, 1 1 ELU = 1 soliped, 1 adult bovine animal, 2 other bovine animals, 3 deer, 5 swine over 100kg liveweight, 7 other swine, 10 sheep or 4 goats or 20 lambs or piglets under 15kg liveweight. 2 The Fresh Meat (Hygiene and Inspection) (Amendment) Regulations 1995 (SI 1995/3189) includes the provision that throughputs in Low Throughput Approved plants may be increased to 1,500ELUpa. However, in practice no plants have been permitted to do so because no mechanism is in place to permit full compliance with the conditions required.
1993 1995 1997
Butchers 24.5 18.9 16.2
Co-ops 3.4 2.5 2.2
Supermarkets 55.3 65.1 69.9
Independent Grocers 2.2 1.4 1.0
Freezer Centres 6.7 5.7 5.2
Others 7.9 6.4 5.5
8
Murray, Cullinane, Eddison and Kirk 1998) but no definitive data are available. Therefore, movement of animals within and between regions cannot be quantified. However, examination of breeding livestock numbers does give some indication of production levels and, as stated above, 25% of the national beef breeding herd, 22% of the national sheep breed flock and 14% of the pig breeding herd were in the South West in 1997. Comparison of these data with slaughtering levels for the three species in the South West suggests that these was a net loss from the region of over 55,000 cattle, 400,000 sheep and 500,000 pigs before slaughter. The slaughtering industry is characterised by low margins and high volume (Key Note 1995) and the MLC (1994) have reported significant over capacity since the 1980s, which has been exacerbated recently by abattoirs increasing capacity in the process of upgrading to EU Approved status. In January 1996 the MLC (1996a) suggested a managed programme designed to remove 1.8 million ELU of capacity by voluntary, compensated closures financed by levies paid by remaining abattoirs. However, the BSE crisis provided a temporary reprieve for the industry because of the Over Thirty Months Scheme and no further action was taken. The industry over capacity is expected to become evident again and market forces are predicted to precipitate the closure of the less viable Full Throughput Approved abattoirs. Low Throughput Approved abattoirs may also be under threat because of the increasing domination of the multiple retailers and reduction of meat sales directed through other outlets. 4.0 Methodology Due to the limited understanding of the dimensions underpinning farm business strategy, the study was empirically rather than conceptually based and examined strategic groups and their marketing implications at the farm level. To conduct an empirical analysis it was necessary to collect primary data that described the attitudes of individual farmers toward strategic and marketing variables. An approach to strategic group analysis that is commonly used in the strategic management literature, is to identify strategic groups by measuring the differences between firms over a number of strategic variables. Then to categorise the businesses into groups on the basis of similarities and differences in these variables, and to develop profiles of strategic group members with the assistance of statistical tests (Harrigan 1985, McGee and Thomas 1986 Douglas and Rhee 1989, Lawless and Finch 1989, McLeay et al 1996). Marketing and strategic variables were identified after surveying literature from the business and agricultural marketing, farm management, agricultural economics and strategic management disciplines. Attention was also given to existing conceptually based frameworks including Porter's (1980) generic strategies, Miles and Snow's (1978) strategic typologies, Mitchell's livestock typologies (1975) and McLeay, Martin and Zwart's (1996) arable typologies as a starting point for identifying appropriate variables. Taxonomic classifications of strategy including strategic group studies were also reviewed; and because it is necessary to have a detail knowledge of the industry being studied to select the appropriate variables, this was followed by interviews with farm management academics, farmers, and rural surveyors. A number of different types of variables were identified. Some of these related to strategic activity and were used as inputs for factor and cluster analysis. Other were used to develop profiles of strategic group members. The eight page questionnaire contained 42 attitudinal questions where respondents were asked to answer on a five point Likert scale, the extent to which they were involved in various strategic and marketing practices and their attitudes towards non environmental factors. Similar questions were used to detect the perceived importance of 18 information sources and 10 information types, while additional questions identified farm and farmer characteristics, sales methods and environmental factors.
9
The farm survey, having been pre-tested and piloted, was despatched in 1998 to 962 lowland beef finishers based on a sample derived from the National Farmer's Union database. The effective response rate was 32.17%. The survey was funded with an RICS Education Trust Award. In this study factor analysis was used to reduce strategic variables to a smaller more focused set of strategic dimensions. Factor scores were then subjected to cluster analysis (hierarchic and non hierarchic methods) in order to group farm businesses with similar patterns of strategic behaviour. Discriminant analysis was then performed to predict cluster membership and to assess if reasonable discrimination had been achieved between the identified groups. Finally one way analysis of variance and chi-square tests of independence were used to identify inter cluster differences and develop group profiles. The purpose of these analyses was to discover the complexity of decision making in relation to channel utilisation. They were not intended to operationalise specific generic competitive strategies such as cost leadership or differentiation since there is very little a priori knowledge of farmer business decision making in relation to livestock distribution. 5.0 Identification of Marketing Channels The selection of marketing channels by beef and sheep finishers use is not necessarily a straightforward choice between livestock market or direct to abattoir. Indeed many choices exist and a wide combination of channel utilisation has been identified in this study. Twenty marketing channels were identified from the survey comprising six direct channels and a further fifteen multiple channels of two or more. For analysis purposes, channel selection was categorised into five categories, Table 5. It must be noted that three channel selections have been omitted from the sample: Electronic Auctions, Private Sales and Livestock Dealers accounting for 5.1% (n = 19) . As there is appears to be little market penetration via these channels, it was decided to omit these channels and concentrate on the main channels selected.
Table 5 Categorisation of Beef Marketing Channels
Categorisation of the five groups reveal that group marketing selection via producer clubs and co-operatives accounted for 42.17 % in both direct and multi-channel selection suggesting the increasing importance of channels associated with preferred supplier relationships. It may also suggest that
Category Marketing Channels Utilisation % LMARKET
Direct Sales to Livestock Market
23.51
GMS
Direct Sales to Abattoir via Group Marketing Schemes 13.81
ABATTOIR Direct Sales to Abattoir 7.84 MULTI- LM
Livestock Market and Abattoir Livestock Market and Private Sales Livestock Market and Livestock Dealer Livestock Market and Electronic Auction and Abattoir Livestock Market and Abattoir and Private Sales
26.49
MULTI-GMS n=268
Group Marketing Schemes (GMS) and Livestock Market GMS and Livestock Market and Abattoir GMS and Livestock Market and EA GMS and Private Sales GMS and Abattoir GMS and Livestock Dealer and Abattoir GMS and Livestock Dealer and Livestock Market GMS and Electronic Auction
28.36
10
animals passing through these channels are of a higher quality than those passing through the livestock market system, or that in the case of Multi-GMS and Multi-LM (abattoir or EA associated livestock), quality livestock is sold via GMS or ABATTOIR with poorer livestock sold via the livestock market system. It serves to illustrate the levels of competition between market channels i.e. the emergence of a two channel system of sales via the livestock market or abattoir sectors in both direct and multi-channel selection indicating the erosion of traditional spot market transactional arrangements and increased vertical co-ordination via preferred supplier relationships. However, it provides no understanding as to why farmers select particular channels. 6.0 Strategic Group Analysis: Results and Discussion The discussion of the results is divided into five parts: derivation of underlying strategic dimensions, identification of strategic groups, an assessment of the discriminatory power of the strategic variables, a profile of strategic groups and finally the effect on channel utilisation. 6.1 Derivation of Underlying Strategic Dimensions In the first phase of the analysis, twenty four key attitude variables relating to various aspects of marketing strategy activity were selected after an examination of the correlation matrix and subjected to principle components analysis. A varimax rotation (orthogonal method) was conducted and the standard criteria of an eigenvalue = 1 ( factors = 7) and scree test (factors = 7) were used as guidelines to determine the number of factors in the first rotations (Tabachnick and Fidell 1989, Malhotra 1993, Hair, Anderson, Tathham and Black 1998) . These were followed by several different trial rotations where factor interpretability was compared. The cut off point for interpretation of loading scores was conservatively high at 0.60 or above [Tabachnick and Fidell (1989) suggest that loadings in excess of 0.60 are very good and those over 0.71 are excellent]. The latent root variables (underlying strategic dimensions) were subsequently named to reflect the strategic dimension that they represent. Seven highly interpretable and distinct factors explaining 65.1% of total variance appeared to give the best representation of the underlying relationship among the selected variables. The sorted and subsequently named factor loadings are presented in Table 6. Table 6 Description of Strategic Dimensions
Underlying Strategic Dimensions 1. Market Knowledge Awareness of financial returns from selling to different marketing outlets Involvement in off farm marketing activities Detailed knowledge of distribution channels Understand detailed market requirements for the livestock production
5. Differentiation Produce niche market livestock Have specialist knowledge, equipment or facilities that other farmers do not have. Own or manage facilities that are normally owned by middlemen further down the distribution chain.
2. Production Planning Plan production decisions by continually monitoring market price Simultaneously plan production and sales decisions Plan production to coincide with seasonal fluctuations
6. Quality and Traceability Focus Increase farm business success by producing quality livestock sold by formal or informal contract Being able to trace livestock back to source is essential to farm business operation.
3. Consumer and Buyer Orientation Increase profitability by satisfying the buyers of my produce Increase business success by understanding the needs and wants of the final consumer.
7. Cost Focus Have the lowest possible input costs Concern with budgeting and planning to obtain the lowest possible costs Aware of the exact costs and returns for livestock produced
4. Channel Flexibility Deal with a minimum number of marketing outlets to maintain good business relationships.
11
6.2 Identification of Strategic Groups After completion of the factoring procedure, the factor scores (mean 0 and standard deviation of 1) for each farmer (268 cases) were saved for subsequent cluster analysis in accordance with the procedure recommended by Punj and Stewart (1983). A three cluster solution was deemed the most meaningful as this solution was highly interpretable and appeared to have external validity. The three clusters (based on the cluster means for the derived factor scores and the cluster sizes) were named according to the business strategy that the groups appeared to follow. Mean factor scores and standard deviations for farmers in each strategic group with each strategic dimension and the results from ANOVA tests are presented in Table 7. High mean scores indicate that a particular dimension is important to a business. Table 7 Characteristics of Three Strategic Groups Derived from Cluster Analysis 1
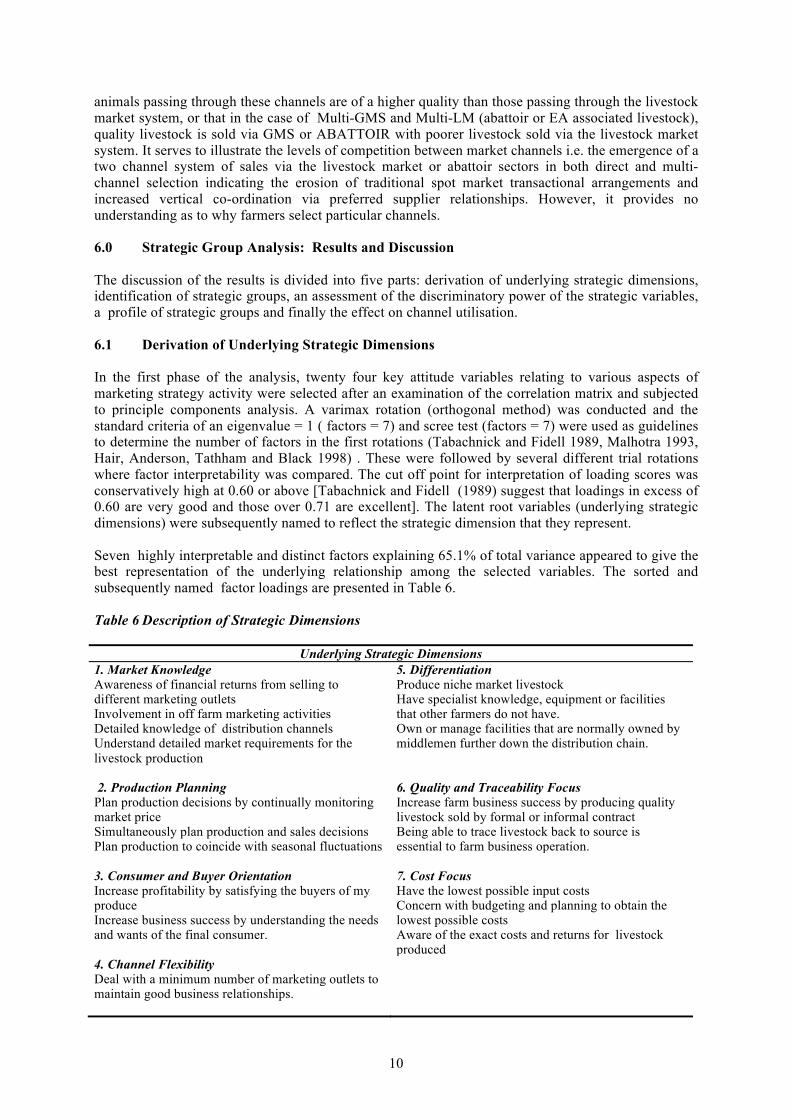
1 Means are reported in standard test with Standard Deviations in Italics 2 P values: * p<0.05, ** p<0.01 and *** p<0.001 6.3 Identification and Description of Strategic Groups This section describes the identified and named strategic groups based on the derived factor scores and subsequent clustering procedure. A graphical presentation of the derived variables by strategic groups are presented in Figures 1-3. 6.3.1 Buyer Orientation Strategy This group contains 114 farmers, 42.5%, of the sample. Cluster members score highly, as on strategic dimensions associated with channel flexibility, quality and traceability, cost and market knowledge. This would suggest that this group of farmers are concerned with producing quality slaughterstock as they have a good knowledge of the market requirements in terms of carcase conformation, recognise the need for traceability and efficiency of production. They minimise the number of channels to which
Strategic Groups Tukey HSB Test2 Strategic Dimensions 1 2 3 F Ratio F Prob 1-2 1-3 2-3
Market Knowledge
0.5051 0.8335
-0.5823 0.6869
0.2408 1.3015
47.39
0.0001 *** ***
Production Planning -0.0552 1.0057
0.0166 0.9927
0.1125 1.0194
0.43 0.6481
Consumer & Buyer Orientation
-0.3675 0.9205
0.2990 0.9470
0.1925 1.0499
14.98 0.0001
*** **
Channel Flexibility 0.1696 0.9495
-0.2353 0.9234
0.1980 1.2220
5.79 0.0035
* *
Differentiation -0.4316 0.4918
-0.2647 0.4322
2.0423 0.8335
338.99 0.0001 * *** ***
Quality and Traceability Focus
0.3786 0.8007
-.03673 .9283
-.0235 1.3022
17.96 0.0001 ***
Cost Focus 0.3053 0.9437
-0.3415 0.9417
.1147 1.0252
13.42 0.0001 *** *
Numbers of Businesses (n=268)
114
115
39
12
they sell by contract, which may indicate a level of vertical co-ordination. This may indicate that they seek simplicity in their marketing arrangements by dealing with a minimum number of marketing channels but are aware of the costs and requirements associated with different marketing channels. The low loading scores on production planning and consumer/buyer orientation and differentiation indicates that this strategic group is primarily concerned with the efficiency of production and selling by contract into preferred supplier relationships and may indicate that they are slow to respond to consumer demand. Figure 1 Strategic Dimensions Associated with Buyer Orientation Strategy
Market Knowledge
Consumer/Buyer Orientation
Cost Focus
Differentiation
Production Planning
Quality/ Traceability
Channel Flexibility
-0.5 -0.4 -0.3 -0.2 -0.1 0 0.1 0.2 0.3 0.4 0.5 0.6
Buyer Orientation Strategy
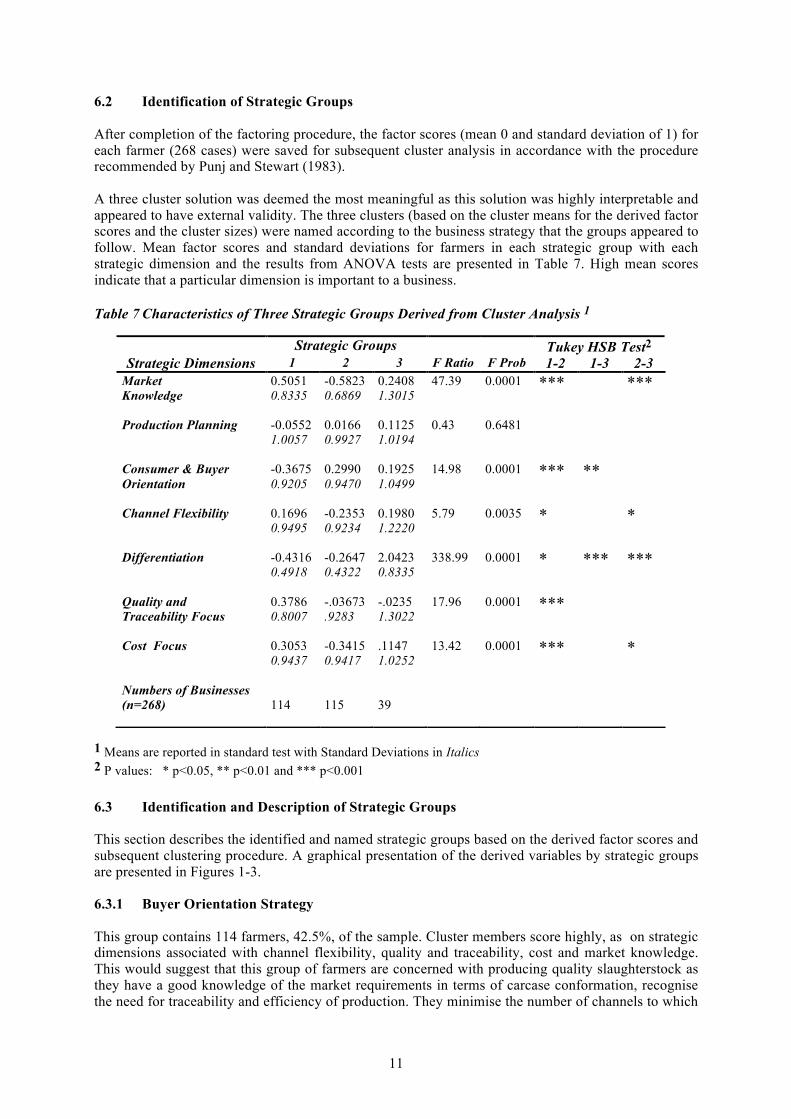
6.3.2 Selling Orientation Strategy The second cluster accounts for 115 farmers, 43.0%, of the sample. Cluster members score highly on only two strategic dimensions : consumer and buyer orientation and production planning. This would suggest that they have a perception that they increase their profitability by meeting the needs and want of buyers and final consumers whilst planning their production to a limited degree. However, these group members score low on the attributes required to meet consumer and buyer orientation .i.e. low scores on market knowledge and quality and traceability. Members are not concerned with channel loyalty this may be because they produce livestock which meets minimum market requirements and are chasing markets to sell to gain short term advantages. They may also view beef production as a minor enterprise in their overall farming operation and view their strategy as simply producing and selling livestock to provide additional income. Figure 2 Strategic Dimensions Associated with Selling Orientation Strategy
Market Knowledge
Consumer/Buyer Orientation
Cost Focus
Differentiation
Production Planning
Quality/ Traceability
Channel Flexibility
-0.6 -0.5 -0.4 -0.3 -0.2 -0.1 0 0.1 0.2 0.3
Selling Orientation Strategy
13
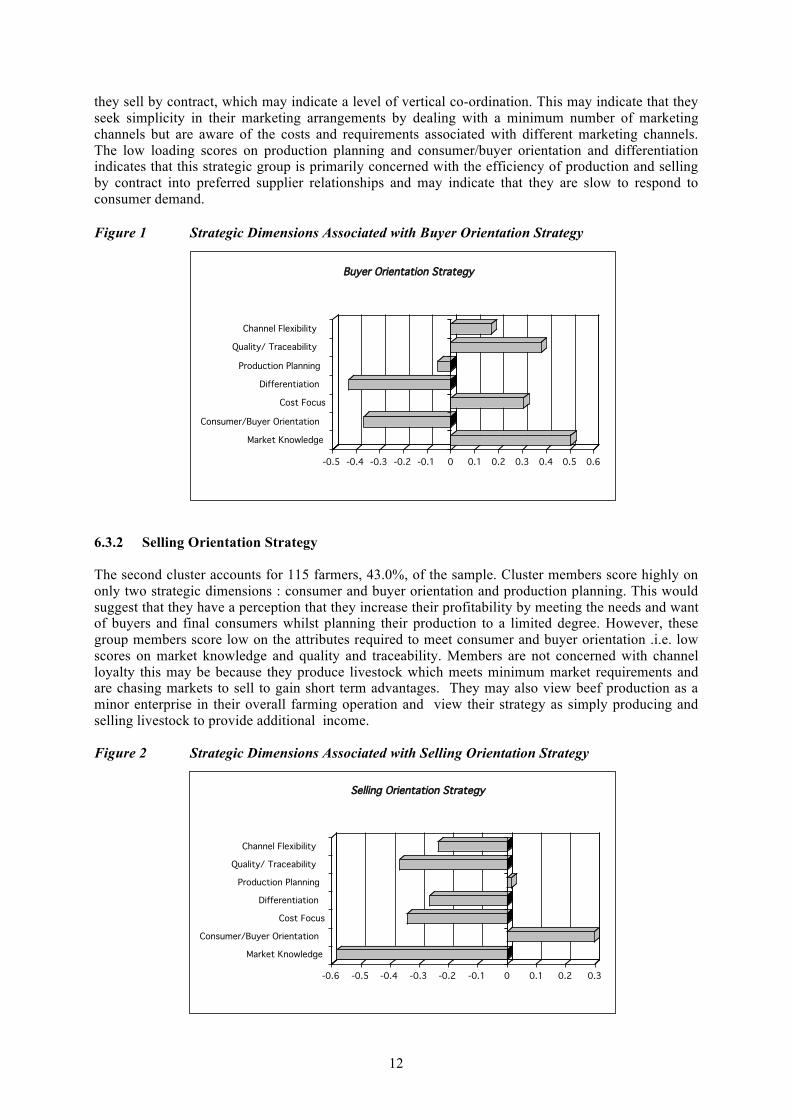
6.3.3 Differentiation Strategy Differentiators, the smallest strategic group of 39 members, accounts for 14.5% of the sample. Member's scores are significantly higher than other businesses on the strategic dimension relating to differentiation suggesting that these farmers are likely to differentiate by producing niche livestock, use specialist knowledge or facilities that other producers do not have, and own or manage facilities that are normally owned by middlemen further down the distribution chain. They score positively on all dimensions except those associated with quality and traceability, this may be because this particular dimension is not an important function of the farm business since they can satisfy this requirement by rearing their own replacements and selling via their own developed markets. Differentiators are likely to have good market knowledge and understand the need to meet consumer and buyers needs whilst maintaining a cost efficient production strategy by planning and budgeting at production level. They also have a low level of channel flexibility to maintain good relationships with their customers. Figure 3 Strategic Dimensions Associated with Differentiation Strategy
Market Knowledge
Consumer/Buyer Orientation
Cost Focus
Differentiation
Production Planning
Quality/ Traceability
Channel Flexibility
-0.5 0 0.5 1 1.5 2 2.5
Differentiation Strategy
6.4 Assessing the Discriminatory Power of the Strategic Variables A stepwise discriminant analysis was conducted on 268 cases to determine whether the seven identified strategic variables could predict cluster membership and discriminate between the strategic groups. The discriminating power of the variables were evaluated by several criteria: (a) Wilk's lambda, (b) variance explained, I2 (Peterson and Mahajan 1976), and (c) percentage correctly classified (Hair et al 1998). Box's M test statistic was evaluated to test the null hypotheses of the equality of covariance matrices across the three groups. For the full model, the following statistic was obtained: Box's M = 58.52, approx. F = 1.33; df = 45473.4, p>0.05 suggesting that there was no departure from the null hypothesis. The overall Wilk's lambda was significant, Λ= 0.105, χ2 = 592.15, df = 12, p<0.0001, indicating that six strategic dimensions (predictors) discriminated across the three strategic groups. In addition, the residual Wilk's lambda was significant, Λ= 0.402, χ2 = 238.961, df = 5, p<0.0001. indicating that the predictors discriminated significantly across the three strategic groups after partialling out the effects of the first discriminant function. The total amount of variance explained by the first function for differences between the groups accounts for 65.66% of variance with the second function accounting for 34.34%; furthermore I2 explains 89.41% of the variance in the clusters suggesting that the six predictors acting as a set not only possess relatively large discriminatory power, but can predict cluster membership to 98.88%.
14
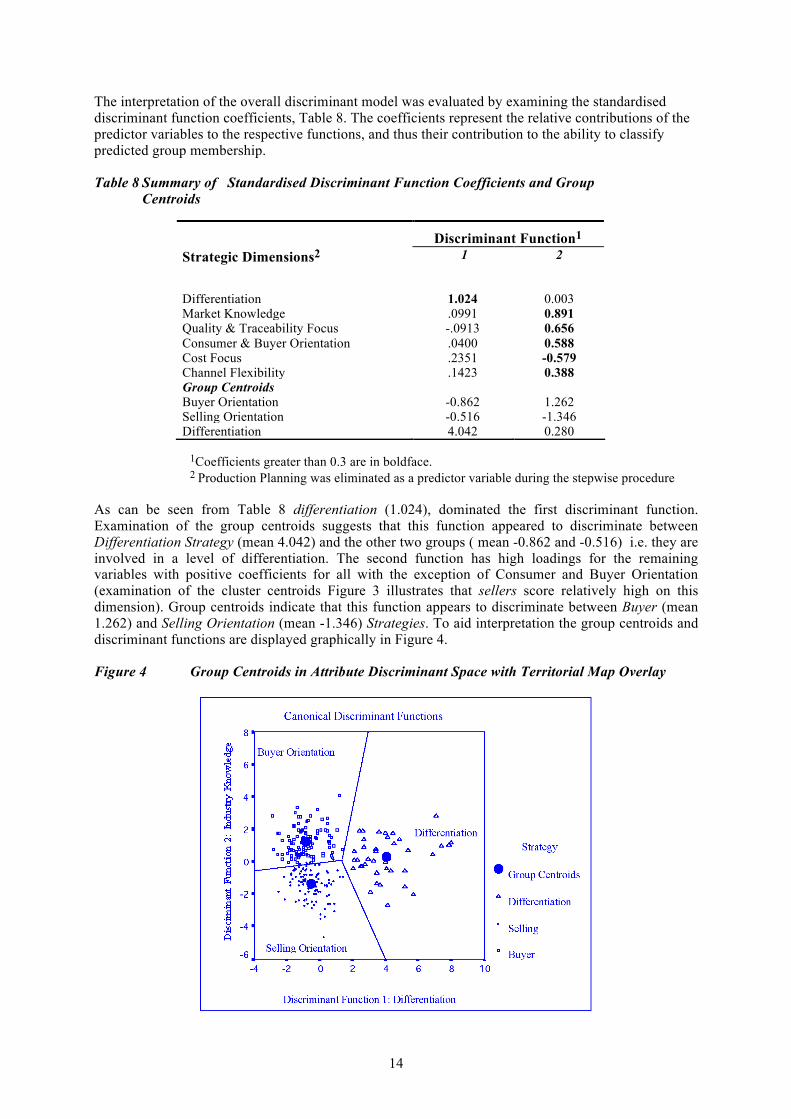
The interpretation of the overall discriminant model was evaluated by examining the standardised discriminant function coefficients, Table 8. The coefficients represent the relative contributions of the predictor variables to the respective functions, and thus their contribution to the ability to classify predicted group membership. Table 8 Summary of Standardised Discriminant Function Coefficients and Group Centroids
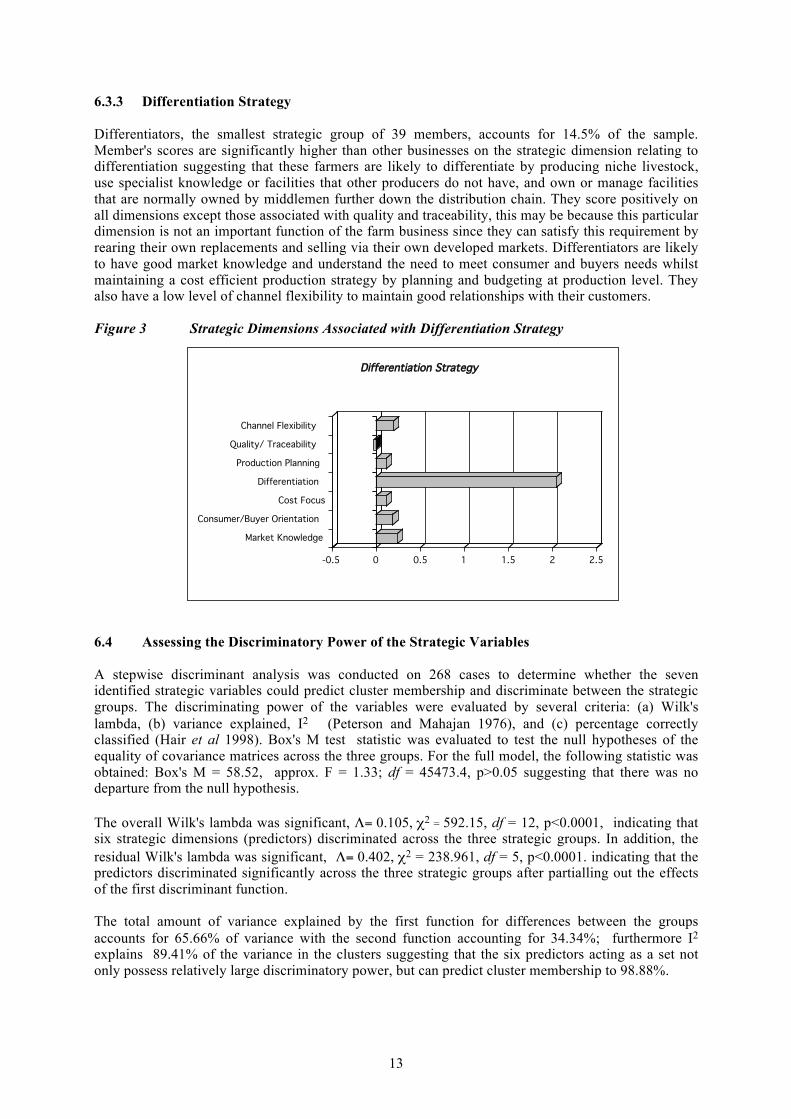
1Coefficients greater than 0.3 are in boldface. 2 Production Planning was eliminated as a predictor variable during the stepwise procedure As can be seen from Table 8 differentiation (1.024), dominated the first discriminant function. Examination of the group centroids suggests that this function appeared to discriminate between Differentiation Strategy (mean 4.042) and the other two groups ( mean -0.862 and -0.516) i.e. they are involved in a level of differentiation. The second function has high loadings for the remaining variables with positive coefficients for all with the exception of Consumer and Buyer Orientation (examination of the cluster centroids Figure 3 illustrates that sellers score relatively high on this dimension). Group centroids indicate that this function appears to discriminate between Buyer (mean 1.262) and Selling Orientation (mean -1.346) Strategies. To aid interpretation the group centroids and discriminant functions are displayed graphically in Figure 4. Figure 4 Group Centroids in Attribute Discriminant Space with Territorial Map Overlay
Discriminant Function1 Strategic Dimensions2 1
2
Differentiation 1.024 0.003 Market Knowledge .0991 0.891 Quality & Traceability Focus -.0913 0.656 Consumer & Buyer Orientation .0400 0.588 Cost Focus .2351 -0.579 Channel Flexibility .1423 0.388 Group Centroids Buyer Orientation -0.862 1.262 Selling Orientation -0.516 -1.346 Differentiation 4.042 0.280

15
On the basis of the results, the first function might represent a Differentiation dimension while the second function might represent an Industry Knowledge dimension. It is certainly clear from Figure 4 that not only has discrimination been achieved between the three identified groups but that the six predictor variables were able accurately predict cluster membership reinforcing the findings of the cluster analysis and signifying the stability of the three cluster solution. 6.5 Profiling of Strategic Groups In the survey a considerable amount of detailed information was collected on the personal and management characteristics of the individual farmers. These were not used in the clustering analysis. In this section the intergroup differences in personal and farming characteristics are discussed. The results of chi-square analysis indicate that there are differences in farm sizes between the groups, with farmers following a differentiation strategy having the largest land (121 ha+) and highest percentage of land allocation to beef production ( in excess of 75%) and are consequently associated with larger herd size (75+ animals). This group was followed by buyer orientation members, who were associated with larger farms and herd size although land allocation was largely associated with up to 50%, this may indicate that these farmers employ more intensive management practices than the other two groups. Seller members were associated with medium-large farms (81-120 ha), but more likely to be associated with smaller herds (25-49 animals) and consequently less land allocated to the beef enterprise. There were no significant differences with regard to age. Consequently, cross tabulation of farming experience revealed no significant differences, with the average age and farming experience across the three groups being 41-50 years and 25-30 years respectively. However, there did appear to be intergroup differences between the level of education achieved, with differentiators strongly associated with a level of higher education (HND, degree and postgraduate study). Buyers, although strongly associated with secondary education, were associated with a level of further education (National Diploma study), whilst sellers were predominantly associated with secondary education. The financial characteristics of the farmers were analysed by examining strategic group members' levels of debt servicing and gross farm income earned from beef production. Chi-square statistics indicate that there are no differences in debt servicing requirements. However, differentiators derived a higher percentage of farm income from beef production (75%+), with buyers associated with 25-49% and sellers 0-25%. Farmers were asked if they occupied positions of more responsibility than normal voting members in a farming organisation and if they owned or managed non-farm businesses. Chi-square analysis revealed that a high proportion of differentiators were involved in both farm and non-farm related organisations. A relatively high proportion of buyers were also likely to be associated with farming organisation involvement, however unlike differentiators they limit their business activities directly related to the farm. Further chi-square analysis revealed that both buyers and differentiators were more likely to produce the carcass requirements sought by livestock procurers. Buyers were more likely to produce a higher percentage of high quality carcasses (EU, 1-2) and differentiators were more likely to consistently produce average quality carcasses (R0+, 3-4H) whilst sellers were more likely to produce carcasses of unknown grading and may suggest that they only meet minimum market requirements. Farmers following differentiation and buyer orientation strategies spent more time working away in farm related marketing activities than sellers, this may be explained by their vertical co-ordination involvement. Table 9 indicates that both differentiators and buyers are significantly involved in vertically co-ordinated activities (group marketing membership), and would suggest that these two groups do not regard the farm gate as the boundary of the business.
16
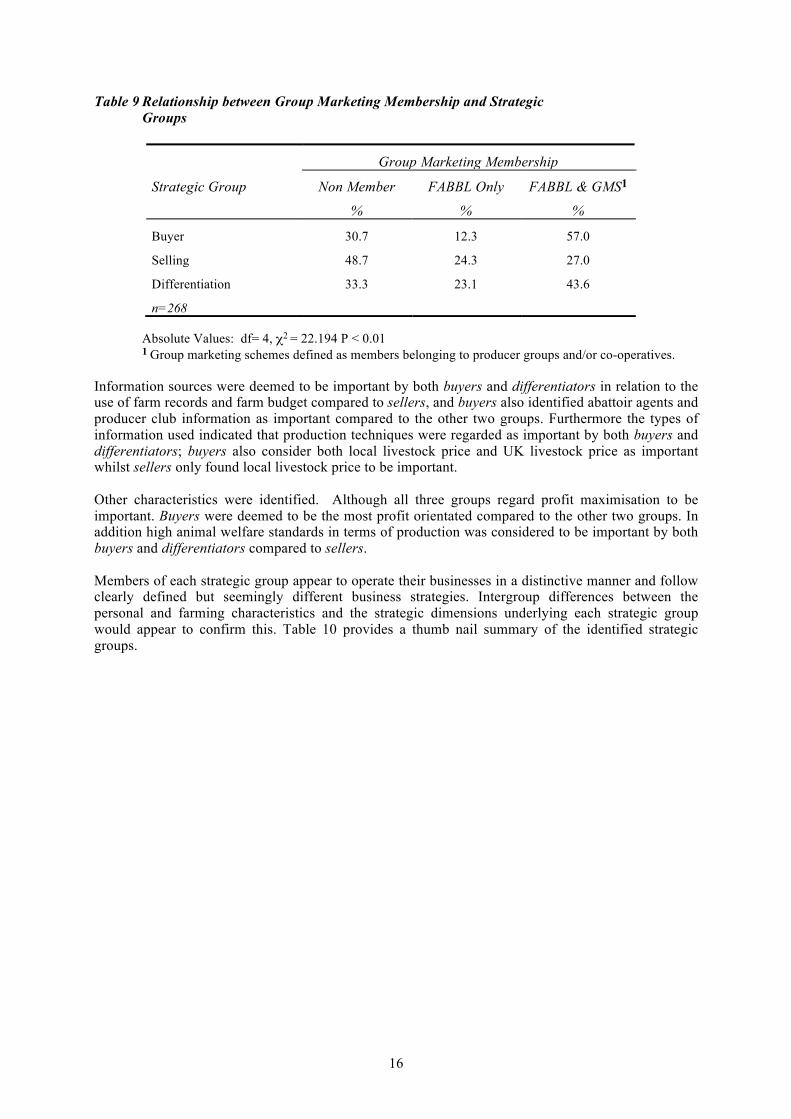
Table 9 Relationship between Group Marketing Membership and Strategic Groups
Absolute Values: df= 4, χ2 = 22.194 P < 0.01 1 Group marketing schemes defined as members belonging to producer groups and/or co-operatives. Information sources were deemed to be important by both buyers and differentiators in relation to the use of farm records and farm budget compared to sellers, and buyers also identified abattoir agents and producer club information as important compared to the other two groups. Furthermore the types of information used indicated that production techniques were regarded as important by both buyers and differentiators; buyers also consider both local livestock price and UK livestock price as important whilst sellers only found local livestock price to be important. Other characteristics were identified. Although all three groups regard profit maximisation to be important. Buyers were deemed to be the most profit orientated compared to the other two groups. In addition high animal welfare standards in terms of production was considered to be important by both buyers and differentiators compared to sellers. Members of each strategic group appear to operate their businesses in a distinctive manner and follow clearly defined but seemingly different business strategies. Intergroup differences between the personal and farming characteristics and the strategic dimensions underlying each strategic group would appear to confirm this. Table 10 provides a thumb nail summary of the identified strategic groups.
Group Marketing Membership
Strategic Group Non Member
%
FABBL Only
%
FABBL & GMS1
%
Buyer 30.7 12.3 57.0
Selling 48.7 24.3 27.0
Differentiation
n=268
33.3 23.1 43.6
17
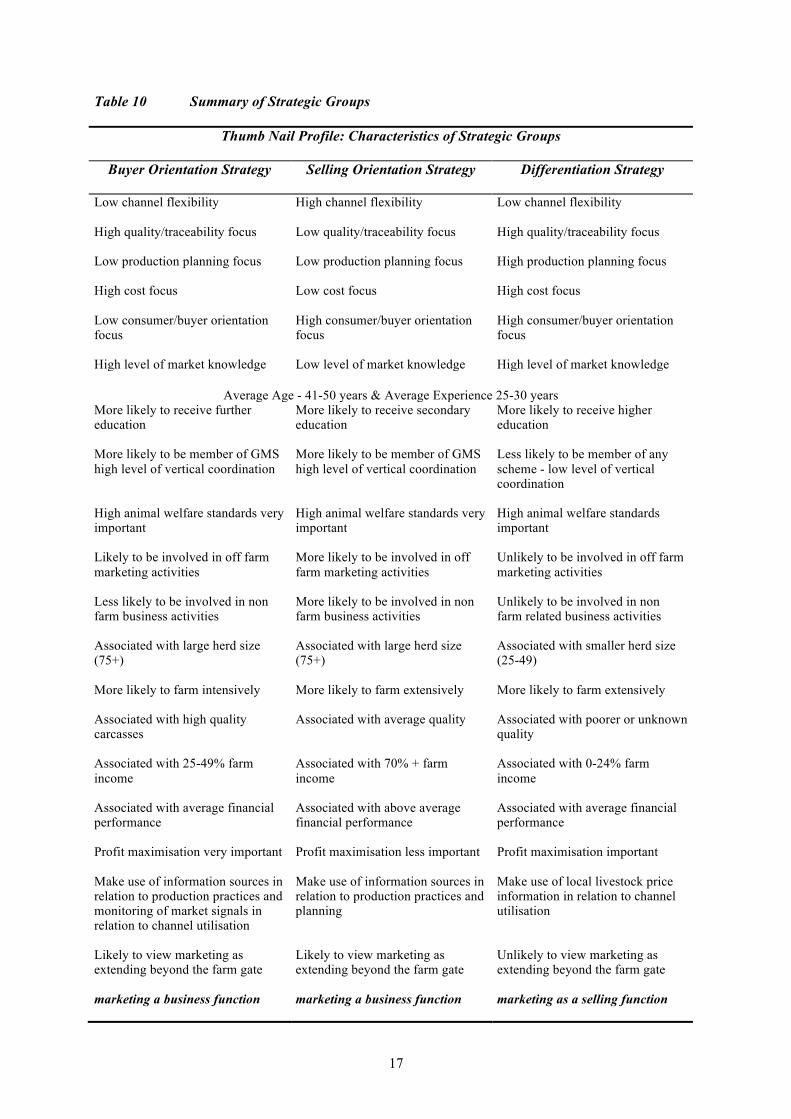
Table 10 Summary of Strategic Groups
Thumb Nail Profile: Characteristics of Strategic Groups
Buyer Orientation Strategy Selling Orientation Strategy Differentiation Strategy
Low channel flexibility High quality/traceability focus Low production planning focus High cost focus Low consumer/buyer orientation focus High level of market knowledge
High channel flexibility Low quality/traceability focus Low production planning focus Low cost focus High consumer/buyer orientation focus Low level of market knowledge
Low channel flexibility High quality/traceability focus High production planning focus High cost focus High consumer/buyer orientation focus High level of market knowledge
Average Age - 41-50 years & Average Experience 25-30 years
More likely to receive further education More likely to be member of GMS high level of vertical coordination High animal welfare standards very important Likely to be involved in off farm marketing activities Less likely to be involved in non farm business activities Associated with large herd size (75+) More likely to farm intensively Associated with high quality carcasses Associated with 25-49% farm income Associated with average financial performance Profit maximisation very important Make use of information sources in relation to production practices and monitoring of market signals in relation to channel utilisation Likely to view marketing as extending beyond the farm gate marketing a business function
More likely to receive secondary education More likely to be member of GMS high level of vertical coordination High animal welfare standards very important More likely to be involved in off farm marketing activities More likely to be involved in non farm business activities Associated with large herd size (75+) More likely to farm extensively Associated with average quality Associated with 70% + farm income Associated with above average financial performance Profit maximisation less important Make use of information sources in relation to production practices and planning Likely to view marketing as extending beyond the farm gate marketing a business function
More likely to receive higher education Less likely to be member of any scheme - low level of vertical coordination High animal welfare standards important Unlikely to be involved in off farm marketing activities Unlikely to be involved in non farm related business activities Associated with smaller herd size (25-49) More likely to farm extensively Associated with poorer or unknown quality Associated with 0-24% farm income Associated with average financial performance Profit maximisation important Make use of local livestock price information in relation to channel utilisation Unlikely to view marketing as extending beyond the farm gate marketing as a selling function
18
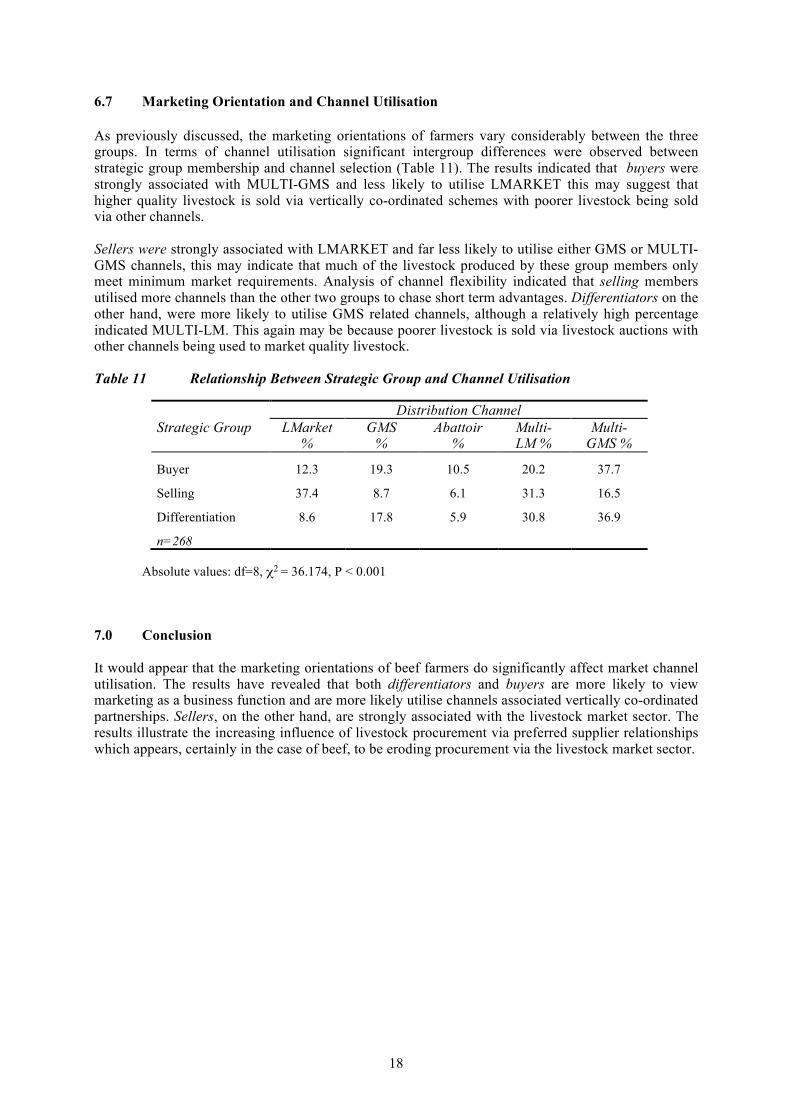
6.7 Marketing Orientation and Channel Utilisation As previously discussed, the marketing orientations of farmers vary considerably between the three groups. In terms of channel utilisation significant intergroup differences were observed between strategic group membership and channel selection (Table 11). The results indicated that buyers were strongly associated with MULTI-GMS and less likely to utilise LMARKET this may suggest that higher quality livestock is sold via vertically co-ordinated schemes with poorer livestock being sold via other channels. Sellers were strongly associated with LMARKET and far less likely to utilise either GMS or MULTI-GMS channels, this may indicate that much of the livestock produced by these group members only meet minimum market requirements. Analysis of channel flexibility indicated that selling members utilised more channels than the other two groups to chase short term advantages. Differentiators on the other hand, were more likely to utilise GMS related channels, although a relatively high percentage indicated MULTI-LM. This again may be because poorer livestock is sold via livestock auctions with other channels being used to market quality livestock. Table 11 Relationship Between Strategic Group and Channel Utilisation
Absolute values: df=8, χ2 = 36.174, P < 0.001 7.0 Conclusion It would appear that the marketing orientations of beef farmers do significantly affect market channel utilisation. The results have revealed that both differentiators and buyers are more likely to view marketing as a business function and are more likely utilise channels associated vertically co-ordinated partnerships. Sellers, on the other hand, are strongly associated with the livestock market sector. The results illustrate the increasing influence of livestock procurement via preferred supplier relationships which appears, certainly in the case of beef, to be eroding procurement via the livestock market sector.
Distribution Channel Strategic Group LMarket
% GMS
% Abattoir
% Multi- LM %
Multi-GMS %
Buyer 12.3 19.3 10.5 20.2 37.7
Selling 37.4 8.7 6.1 31.3 16.5
Differentiation
n=268
8.6 17.8 5.9 30.8 36.9

19
References Agra Europe. (1991). UK Supermarkets want meat husband warranty. Agra Europe. 10 May 1991, N5-N6. Bansback, R. (1995). Towards a Broader Understanding of Meat Demand. Agricultural Economics Society Conference Proceedings. Agricultural Economics Society. Cambridge. Barry, P. J., Sonka, S. T. and Lajili, K. (1992). Vertical Coordination, Financial Structure and the Changing Theory of the Firm. American Journal of Agricultural Economics. 74, 1219-1225. Bullen, A. M. (1984). Selling Livestock - By Liveweight or Deadweight ? Farm Management. 5, (5), 169-174. Davies, D. H.; Murray, K.; Cullinane, S. L.; Eddison, J. C. and Kirk, J. A. (1998). Is poor animal welfare a valid reason to preclude procurement of livestock via auction markets ? Proceedings of the 1998 Rural Practice Research Conference of the Royal Institution of Chartered Surveyors. RICS Publications, London. den Ouden, M., Dijkhuizen, A. A., Huirne, P.; Ruud, B. M. and Zuurbier, P. J .P. (1996). Vertical Cooperation in Agricultural Production Marketing Chains, with Special Reference to Product Differentiation in Pork. Agribusiness. 12, (3), 277-290. Dobson, W. D. and Akridge, J. T. (1989). Establishing Agribusiness Research Priorities and Coordinating Agribusiness Research. Agribusiness. 5, (4), 315-333. Douglas, S. P. and Rhee, D. K. (1989). Examining Generic Competitive Strategy Types in U.S. and European Markets. Journal of International Business Studies. Fall, 437-463. Eastwood, P. M. (1995). Farm Animal Welfare, Europe and the Meat Manufacturer. British Food Journal. 97, (9), 4-11. Everitt, A. (1967). The Marketing of Agricultural Produce. In: Thirsk, J. The Agrarian History of England and wales 1500-1640, Cambridge University Press, Cambridge. 919. Feka, V.; Xouris, D. and Tsiotras, G. (1997). Mapping Strategic Groups: An International Example. Journal of Business and Industrial Marketing. 12, (1), 66-72. Graham, I. (1997). Electronic Livestock Auctions in the UK. http:// omni.bus.ed.ac.uk/ehja36/papers/auction/livestock.html. Grega, L., & and Ray, J. (1992). Electronic Marketing of Livestock in the UK. Farm Management. 8, (3), 113-124. Gunthorpe, M., Ingham, M. and Palmer M. (1996). The Meat Industry. In: Strak, J. and Morgan, W., The UK Food and Drink Industry, EuroPA and Associates, Northborough. 209-252. Hair, J. F., Anderson, R. E., Tatham, R. L. and Black, W. C. (1998). Multivariate Data Analysis. Prentice-Hall International. London. Harling, K., and Quail, P. (1990). Exploring a General Management Approach to Farm Management. Agribusiness. 6, (5), 425-441. Harrigan, K. R. (1985). An application of clustering for strategic group analysis. Strategic Management Journal. 6, 55-73.
20
Hughes, D. (1995). Animal Welfare: the consumer and the food industry. British Food Journal. 97, (10), 3-7. Jones, J.V.H., Steele, J. (1995). An Assessment of the Factors Behind the Rationalisation of Livestock Auction Markets. Farm Management. 9, (2), 66-75. Key Note. (1995). Meat and Meat Products - 1995 Market Report. Key Note. Hampton. 83. Kuhl, R. and Kuhl, J. (1990). Adjustments of Farm Organisation to Changing Structural Requirements. Proceedings from the 23rd Symposium of the EAAE - Managing Long Term Directions of the Farm Firm. Wissenschaftverflag Vauk Kiel KG Germany. Lawless, M., and Finch. L. (1989). Choice and Determinism: A Test of Hrebiniak and Joyce's Framework Work on Strategy Environment Fit. Strategic Management Journal. 10, 351-365. Loader, R and Hobbs, J. (1996). The hidden costs and benefits of BSE. British Food Journal. 98, (11), 26-35. MAFF. (1998). Personal Communication. Malhotra, N., K. (1993). Marketing Research - An Applied Orientation. Prentice-Hall International. London. 857. Marion, B. (1986). Interrelationships of Market Structure, Competitive Behaviour and Market Firm Performance: The State of Knowledge and Some Research Opportunities. Agribusiness. 2, (4), 443-453. Marks, H.F. (1989). A Hundred Years of British Food and Farming: A Statistical Survey. Taylor and Francis. London. 210. McGee, J. and Thomas, H. (1986). Strategic Groups: Theory, Research and Taxonomy. Strategic Management Journal. 7, 141-160. McLeay, F., Martin, S. and Zwart, T. (1996). Farm Business Marketing Behaviour and Strategic Groups in Agriculture. Agribusiness. 12, (4), 339-351. Mcleay, F. and Zwart, T. (1993). Agricultural Marketing and Farm Management Strategies. Australian Agribusiness Review. 1, (1), 80-98. Miles, R.E. and Snow, C. (1978). Organisational Strategy, Structure and Process. McGraw-Hill. New York. Mitchell, G.F. (1975). The Influence of Market Intelligence on Farmers Livestock Market Decisions. Department of Economics. University of Bristol. 74. MLC. (1980). Livestock Marketing Methods. MLC. Milton Keynes. 53. MLC. (1988). Meat Demand Trends. Rep. No. 5/88. Milton Keynes. MLC. (1994). The Abattoir Sector in Great Britain. MLC. Milton Keynes. 83. MLC. (1995). A Pocketful of Meat Facts. MLC. Milton Keynes. MLC. (1996a). Meat Demand Trends. Rep. N. 2/96. MLC. Milton Keynes. MLC. (1996b). Personal Communication.
21
MLC. (1997). Personal Communication. MLC. (1998a). Personal Communication. MLC. (1998b). Meat Demand Trends. Rep. No. 98/1. MLC. Milton Keynes. MLC. (1998c). Personal Communication. MLC. (1999). Personal Communication. Ohlmer, B., Olson, K. and Brehmer, B. (1998). Understanding farmers' decision making processes and improving managerial assistance. Agricultural Economics. 18, 273-290. Peterson, R. A. and Mahajan, V. (1976). Practical Significance and Partitioning Variance in Discriminant Analysis. Decision Sciences. 7, 649-658. Porter, M. E. (1980). Competitive Strategy. The Free Press. New York. 396. Punj, G., and Stewart, D. (1983). Cluster Analysis in Marketing Research: Review and Suggestions for Application. Journal of Marketing Research. 20, (May 1983), 134-148. National Federation of Meat and Food Retailers. (1998). Personal Communication. Ritson, C. (1997a). Presidential Address - Marketing and Agriculture. Agricultural Economics Society Conference Proceedings. Agricultural Economics Society. Edinburgh. Ritson, C. (1997b). Food Marketing and Agricultural Marketing: The Scope of the Subject of Agro-Food Marketing. In: Padberg, D. I., Ritson, C. and Albisu, L. M., Agro-Food Marketing, CAB International, Wallingford. 11-26. Royer, J.S. (1995). Potential for Cooperative Involvement in Vertical Coordination and Value Added Activities. Agribusiness. 11, (5), 473-481. RSPCA. (1996a). Freedom Food: The RSPCA Welfare Standards for Beef Cattle. Rep. No. Version 5. RSPCA, Horsham RSPCA. (1996b). Freedom Food: The RSPCA Welfare Standards for Pigs. Rep. No. Version 2. RSPCA, Horsham RSPCA. (1996c). Freedom Food: The RSPCA Welfare Standards for Sheep. Rep. No. Version 4. RSPCA, Horsham Livestock Auctioneers' Association and The Institute of Auctioneers and Appraisers in Scotland. (1993). A Directory of Livestock Auction Markets in England, Wales and Scotland. Livestock Auctioneers Association. Coventry. 66. Livestock Auctioneers' Association and The Institute of Auctioneers and Appraisers in Scotland. (1998). A Directory of Livestock Auction Markets in England, Wales and Scotland. Livestock Auctioneers Association. Coventry. 66. Sonka, S. T. and Hudson, M. A. (1990). Research Issues and opportunities Affecting the Competitiveness of Agribusiness Firms. Agribusiness. 6, (2), 87-96. Street, P.R. (1990). A System View of Commercial Supply and Marketing Links. In: Jones, J. G. W. and Street, P. R., Systems Theory Applied to Agriculture and The Food Chain, Elsevier Applied Science, London. 159-203.

22
Tabachnick, B. G. and Fidell, L. S. (1989). Using Multivariate Statistics. Harper Collins. New York. 748. Westgren, R. E., Sonka, S. T. and Litzenberg, K. K. (1988). Strategic Issue Identification among Agribusiness Firms. Agribusiness. 4, (1), 25-37.