
Marketing Value-Based Marketing Marketing Strategies for Corporate Growth and Shareholder Value
385
Transcript of Marketing Value-Based Marketing Marketing Strategies for Corporate Growth and Shareholder Value

Value-BasedMarketing
Marketing Strategies for CorporateGrowth and Shareholder Value
Peter Doyle
A John Wiley and Sons, Ltd., Publication


Value-BasedMarketing

Value-BasedMarketing
Marketing Strategies for CorporateGrowth and Shareholder Value
Peter Doyle
A John Wiley and Sons, Ltd., Publication
Second edition copyright 2008 by John Wiley & Sons, LtdThe Atrium, Southern GateChichester, West Sussex PO19 8SQEngland
E-mail (for orders and customer service enquiries): [email protected] our Home Page on http://www.wiley.com
Original edition published by John Wiley & Sons Ltd in 2000. This edition updated for John Wiley & Sons Ltd by Laura Mazurwith the permission of Sylvia Doyle and with the agreement of an expert Advisory Board.
All Rights Reserved. No part of this publication may be reproduced, stored in a retrieval system, or transmitted, in any form or byany means, electronic, mechanical, photocopying, recording, scanning or otherwise, except under the terms of the Copyright,Designs and Patents Act 1988 or under the terms of a licence issued by the Copyright Licensing Agency, 90 Tottenham CourtRoad, London, W1P, UK without the permission in writing of the publisher.
Other Wiley Editorial Offices
John Wiley & Sons, Inc., 111 River Street, Hoboken, NJ 07030, USA
Jossey-Bass, 989 Market Street, San Francisco, CA 94103-1741, USA
WILEY-VCH Verlag GmbH, Boschstr. 12, D-69469 Weinheim, Germany
John Wiley & Sons Australia Ltd, 42 McDougall Street, Milton, Queensland 4064, Australia
John Wiley & Sons (Asia) Pte Ltd, 2 Clementi Loop #02-01, Jin Xing Distripark, Singapore 129809
John Wiley & Sons (Canada) Ltd, 6045 Freemont Blvd, Mississauga, Ontario M9W 1L1, Canada
Wiley also publishes its books in a variety of electronic formats. Some content that appearsin print may not be available in electronic books.
Library of Congress Cataloging-in-Publication Data
Doyle, Peter, 1943 June 23-2003Value-based marketing : marketing strategies for corporate growth and shareholder value / Peter Doyle. – 2nd ed.
p. cm.Includes bibliographical references and index.ISBN 978-0-470-77314-7 (cloth)
1. Marketing–Management. 2. Corporations–Valuation. I. Title.HF5415.13.D59 2008658.8–dc22
2008032150
British Library Cataloguing in Publication Data
A catalogue record for this book is available from the British Library
ISBN 978-0-470-77314-7
Typeset in 9.5/13pt Gill Sans Light by Laserwords Private Limited, Chennai, IndiaPrinted and bound in Great Britain by Scotprint, Haddington, Scotland
Contents
Preface . . . . . . . . . . . . . . . . . . . . . . . . . . . . . . . . . . . . . . . . . . . . . . . . . . . . . . . . ix
About the Author . . . . . . . . . . . . . . . . . . . . . . . . . . . . . . . . . . . . . . . . . . . . . xiii
PART IPrinciples of Value Creation
1 Marketing and Shareholder Value . . . . . . . . . . . . . . . 3
Introduction and objectivesManaging in the twenty-first centuryMeasuring success: shareholder valueMarketing’s lost influenceMarketing’s new opportunityThe shareholder value principleChallenges to shareholder valueAccounting-based performance measuresThe changing role of marketingSummary
2 The Shareholder Value Approach . . . . . . . . . . . . . . . 36
Introduction and objectivesPrinciples of valuationShareholder valueEconomic value addedFinancial value driversMarketing value driversOrganisational value driversMarketing applications of shareholder valueLimitations of shareholder value analysisSummary
3 The Marketing Value Driver . . . . . . . . . . . . . . . . . . . . . 73
Introduction and objectivesA new definition of marketingCreating customer valueBuilding the differential advantageBuilding relationships with customersImplementing relationship marketing
vi CONTENTS
Organisational requirementsThe customer-focused organisationSummary
4 The Growth Imperative . . . . . . . . . . . . . . . . . . . . . . . . . . 105
Introduction and objectivesMarketing, growth and shareholder valuePathways to growthDeveloping a growth strategySummary
PART IIDeveloping High-Value Strategies
5 Strategic Position Assessment . . . . . . . . . . . . . . . . . . . 151
Introduction and objectivesAn overviewAssessing the current positionExplaining the current positionProjecting the future of the businessImplications of the strategic position assessmentThe value-based planStrategic objectivesSummary
6 Value-Based Marketing Strategy . . . . . . . . . . . . . . . . 189
Introduction and objectivesWhy strategic marketing plans?Corporate level planningBusiness unit planningThe planning processSummary
PART IIIImplementing High-Value Strategies
7 Building Brands . . . . . . . . . . . . . . . . . . . . . . . . . . . . . . . . . . 227
Introduction and objectivesThe role of intangible assetsThe role of the brandBrands and shareholder valueHow to build brandsIssues in brandingOrganising the brand portfolio
CONTENTS vii
Valuing the brandSummary
8 Pricing for Value . . . . . . . . . . . . . . . . . . . . . . . . . . . . . . . . . 262
Introduction and objectivesPrice and shareholder valuePricing principlesSetting the priceAdapting prices to customers and productsChanging the pricePrice managementSummary
9 Value-Based Communications . . . . . . . . . . . . . . . . . . . 300Introduction and objectivesCommunications and shareholder valueCommunications and customersDeveloping a communications strategyAllocating across communications channelsValuing communications strategiesSummary
10 Value-Based Marketing in the Digital Age. . . . . . 325
Introduction and objectivesThe growth and development of the InternetDrivers of change in the new economyCreating value through the webImplications for marketing strategyBuilding the brand on the InternetFuture perspectivesSummary
Glossary . . . . . . . . . . . . . . . . . . . . . . . . . . . . . . . . . . . . . . . . . . . . . . . . . . . . . . 350
The Advisory Board . . . . . . . . . . . . . . . . . . . . . . . . . . . . . . . . . . . . . . . . . 351
Index. . . . . . . . . . . . . . . . . . . . . . . . . . . . . . . . . . . . . . . . . . . . . . . . . . . . . . . . . . 355

Preface
This book is aimed at senior management – marketing, finance, operations managers, and indeed all those withresponsibility for the economic performance of their businesses. It is also intended for use on advanced marketingcourses on MBA and similar level management programmes.
THE OBJECTIVES
The goals of the book are ambitious – they are no less than to redefine the purpose of marketing and how its contri-bution should be measured. The result of this redefinition is a concept of marketing that is more practical and morerelevant to the objectives of today’s top management. Specifically, it is argued that the purpose of marketing is to con-tribute to maximising shareholder value and that marketing strategies must be evaluated in terms of how much valuethey create for investors. This concept, which is called value-based marketing, does not overthrow the existing bodyof marketing knowledge. On the contrary, it makes it more relevant and practical by giving it greater clarity and focus.
Many senior managers have noticed a paradox in how firms perceive marketing. On the one hand, every chiefexecutive and mission statement puts marketing at the very top of the agenda. Getting closer to customers andmeeting their needs is seen as the cornerstone of building a world-class company. A market orientation is regardedas the essential coordinating focus for all the disciplines and processes of the business. At the same time, marketingprofessionals, marketing departments and marketing education are not highly regarded. Few chief executives arefrom a marketing background, most companies do not have a marketing director on the board, and marketingqualifications are often not treated seriously. One leading consulting firm has called marketing departments ‘amillstone around an organisation’s neck’.
What accounts for this paradox of marketing being paramount but market professionals being disregarded? Themain problem is that the marketing discipline has rarely been clear what its objectives are. Most strategy proposalsemanating from marketing staff justify investments in advertising or marketing, in terms of increasing consumerawareness, sales volume or market share. But most boards of directors are sceptical that such measures have anyclear relation to the firm’s long-run profitability. Marketing managers rarely see the necessity of linking marketingspending to the financial value of the business. Given today’s enormous pressures on top managers to generatehigher returns to shareholders, it is hardly surprising that the voice of marketing gets disregarded. The situation willnever be resolved until marketing professionals learn to justify marketing strategies in relevant financial terms.
If managers can show that marketing will increase returns to shareholders, marketing will obtain a much morepreeminent role in the board rooms of industry. The discipline itself will also obtain more respect for its greaterrigour and direction. The purpose of this book is to demonstrate how marketing creates value for shareholdersand to provide managers with the practical tools for developing and evaluating marketing strategies using modernshareholder value analysis.
MARKETING AND SHAREHOLDER VALUE
That the central task of management is to maximise shareholder value has for some time been virtually unanimouslyaccepted by top managers in the USA and the UK, and increasingly in continental Europe and Asia. Shareholder
x PREFACE
returns grow when a company increases its dividends or when its share price rises. Outside top management, theidea of running a business to maximise shareholder value remains controversial. But today’s managers know thatunless they do this, their jobs will become vulnerable, the business will be put at risk and new capital will be difficult toobtain. In competitive capital markets, earning returns that shareholders regard as acceptable is a necessity for survival.
Much of the controversy surrounding maximising shareholder returns occurs because the concept is misunderstood.It is most misunderstood among managers. Managers confuse maximising shareholder value with maximising profits.The two are completely different. Maximising profits is about short-term management: cutting costs, reducinginvestment and downsizing. It is totally antithetical to developing long-term marketing strategies and buildingworld-class businesses. By contrast, shareholder value is a long-term concept; it is about building businesses that last.Despite what managers believe, investors see through short-term tactics that temporarily boost profits. Often shareprices actually fall when companies announce cuts in spending on marketing and less ambitious long-term goals.
Value-based marketing is founded on shareholder value analysis – a well-accepted body of financial theory andset of techniques. Shareholder value analysis states that the value of a business is increased when managers makedecisions that increase the discounted value of all future cash flows. We show in this book that shareholder valueoffers enormous opportunities to marketing. First, it enables the purpose of marketing in commercial firms to beclearly defined. Its purpose is to build intangible assets that increase shareholder returns. Second, it explains howmarketing strategies need to be evaluated: they are worth pursuing if they increase the net present value of thefirm’s long-term cash flow. Third, rigorously exploring the effects on shareholder value makes it harder for boardsto make arbitrary cuts in marketing budgets and similar measures to boost short-term earnings.
The most important contribution of value-based marketing is to make the shareholder value concept more useful.While more and more chief executives are espousing that their job is to maximise shareholder value, all too often it hasbecome associated with cutting costs and downsizing. In many companies shareholder value has become an account-ing tool rather than a general management concept. What many executives have not understood is that shareholdervalue is more about growth and grasping new market opportunities than reducing expenses. All the companies thathave created the greatest value for shareholders in the past decade – Nokia, GE, Cisco and Procter & Gamble – havebeen market-led, high-growth companies. As we show in the book, creating shareholder value is really about iden-tifying emerging opportunities, putting together marketing strategies that can enable firms to rapidly obtain criticalmass, and building lasting relationships with customers. Shareholder value is not built in accounting departments.
THE STRUCTURE OF THE BOOK
The book is in three parts. Part 1 presents the principles of value creation. The first chapter explains thecurrent weaknesses of professional marketing and why its contribution to business performance is disappointing.Chapter 2 presents the theory of shareholder value and shows how these financial principles relate to marketingstrategy. Chapter 3 shows why marketing is the principal driver of financial value. Chapter 4 explores why growth isso important to creating shareholder value and how managers can organise to accelerate growth. Part 2 focuses onhow to develop strategies that lead to value-creating growth. Chapter 5 explains how to assess the current positionof the business and its prospects. Chapter 6 leads on to developing value-based marketing strategies for current andnew businesses.
The final part of the book examines how to implement these new high-value strategies. Chapter 7 looks atintangible assets and the role of the brand in building shareholder value. Chapter 8 re-examines pricing from a value
PREFACE xi
perspective and shows how the current theory of pricing often leads to decisions that are too short-term in theirorientation. Chapter 9 explores the role of advertising and marketing investments in creating long-term value andhow to decide on how much should be spent. The final chapter looks at the implications of the digital age onvalue-based marketing.
Readers will quickly become aware that this is not a ‘one-minute manager’ type book. It is a rigorous presentationof some of the most challenging ideas in modern management. It asks the reader to grapple and integrate currentwork not just from marketing, but also from finance, economics, strategy and information systems. The text is fullyreferenced with the most influential research and papers. The ideas in this book are so important that it is hoped thereader will feel the challenge is worth taking up. Managers need to be technically accomplished if they are to contributeeffectively to the development of their businesses in our rapidly changing world. The aim has been to write this bookin a readable style and to include many examples to keep it highly practical and close to the issues in the real world.
This is the second edition of this book. The ideas are still fresh and the analysis still rigorous. The only changes madehave been to update case studies where relevant and add new references. It has been done with the guidance ofan expert advisory board of acclaimed academics overseeing the editing and updating of the text.
The Advisory Board
Tim Ambler, Senior Fellow, London Business School
Michael J. Baker, Professor Emeritus, Strathclyde Business School
Tony Cram, Programme Director for Business Strategy and Market Innovation, Ashridge Business School
Susan Hart, Dean of Strathclyde Business School
Jean-Claude Larreche, holder of the Alfred H. Heineken Chair at INSEAD
Malcolm McDonald, Emeritus Professor, Cranfield University School of Management and Honorary Professor atWarwick Business School
John Saunders, Professor of Marketing, Aston Business School
Veronica Wong, Professor of Marketing and Director of the Diversity, Knowledge and Innovation ResearchProgramme at Aston Business School
The Editor
Laura Mazur
ACKNOWLEDGEMENTS
Many people have influenced this book. During my fifteen happy years at the University of Warwick I have benefitedfrom the ideas of many of my colleagues including John McGee, Andrew Pettigrew, John Saunders, Howard Thomas

xii PREFACE
and Robin Wensley. At the London Business School I learned from the wisdom of Andrew Ehrenberg and KenSimmonds. At INSEAD I worked fruitfully with Jean-Claude Larreche and Marcel Corstjens. At Stanford University Iwas impressed by the work of my colleagues David Montgomery and V. Srinivasan. At Bradford University I workedwith Dave Cook, Ian Fenwick, Graham Hooley, Davis Jobber, Jim Lynch and Paul Michelle. My initial interest inmarketing models was stimulated during my PhD studies at Carnegie-Mellon University, where I benefited from thesupervision of Richard Cyert and the teaching of Nobel laureates Herbert Simon and Robert Lucas.
Most of all, the book reflects what I have learned from my consulting work. In particular, the book is influenced bythe cooperation of managers from the following client organisations:
3M Dixons OgilvyAccenture Hewlett Packard PhilipsAstraZeneca IBM PricewaterhouseCoopersBritish Airways ICI Saatchi & SaatchiBMP DDB Omnicom Johnson & Johnson SafewayBP-Amoco J. Walter Thompson ShellBritish Telecom KPMG TescoCabinet Office Marks & Spencer UnileverCadbury-Schweppes Mars Wal-MartCoca-Cola Nestle WH Smith
Novartis Woolworths
Finally, my deepest thanks are to my wife Sylvia and our sons, Ben and Hugo, who provided me with the supportand encouragement to complete this book.
About the author
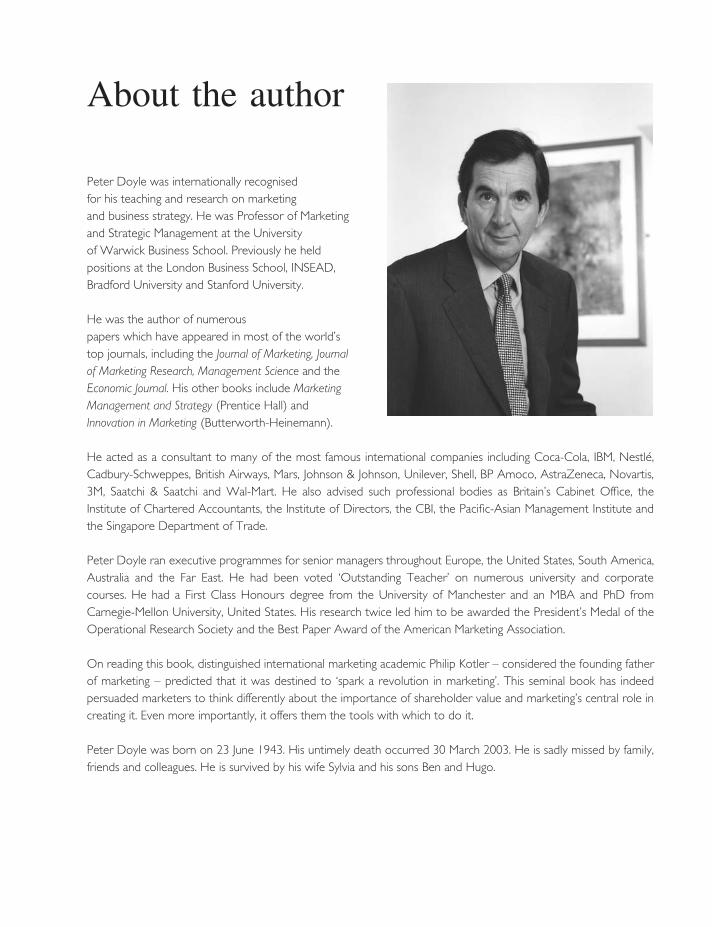
Peter Doyle was internationally recognisedfor his teaching and research on marketingand business strategy. He was Professor of Marketingand Strategic Management at the Universityof Warwick Business School. Previously he heldpositions at the London Business School, INSEAD,Bradford University and Stanford University.
He was the author of numerouspapers which have appeared in most of the world’stop journals, including the Journal of Marketing, Journalof Marketing Research, Management Science and theEconomic Journal. His other books include MarketingManagement and Strategy (Prentice Hall) andInnovation in Marketing (Butterworth-Heinemann).
He acted as a consultant to many of the most famous international companies including Coca-Cola, IBM, Nestle,Cadbury-Schweppes, British Airways, Mars, Johnson & Johnson, Unilever, Shell, BP Amoco, AstraZeneca, Novartis,3M, Saatchi & Saatchi and Wal-Mart. He also advised such professional bodies as Britain’s Cabinet Office, theInstitute of Chartered Accountants, the Institute of Directors, the CBI, the Pacific-Asian Management Institute andthe Singapore Department of Trade.
Peter Doyle ran executive programmes for senior managers throughout Europe, the United States, South America,Australia and the Far East. He had been voted ‘Outstanding Teacher’ on numerous university and corporatecourses. He had a First Class Honours degree from the University of Manchester and an MBA and PhD fromCarnegie-Mellon University, United States. His research twice led him to be awarded the President’s Medal of theOperational Research Society and the Best Paper Award of the American Marketing Association.
On reading this book, distinguished international marketing academic Philip Kotler – considered the founding fatherof marketing – predicted that it was destined to ‘spark a revolution in marketing’. This seminal book has indeedpersuaded marketers to think differently about the importance of shareholder value and marketing’s central role increating it. Even more importantly, it offers them the tools with which to do it.
Peter Doyle was born on 23 June 1943. His untimely death occurred 30 March 2003. He is sadly missed by family,friends and colleagues. He is survived by his wife Sylvia and his sons Ben and Hugo.

PART 1PART 1Principles of Value Creation
1. Marketing and Shareholder Value
2. The Shareholder Value Approach
3. The Marketing Value Driver
4. The Growth Imperative

1Marketing andShareholder Value
‘If you are not willing to own a stock for 10 years don’t even think about it for 10 minutes.’Warren Buffett, Berkshire Hathaway Annual Report
INTRODUCTION AND OBJECTIVES
In recent years creating shareholder value has become the overarching goal for the chief executives of more andmore major companies. As we shall see, both theoretically and empirically the case for managers choosing strategiesthat maximise shareholder value is almost unchallengeable. Those companies which have achieved this suggest thatthere should be no conflict between marketing and shareholder value.
The illusion of conflict has occurred because many managers have confused maximising shareholder value andmaximising profitability. The two are completely different. Maximising profitability is short-term and invariably erodesa company’s long-term market competitiveness. It is about cutting costs and shedding assets to produce quickimprovements in earnings. By neglecting new market opportunities and failing to invest, such strategies destroyrather than create economic value. Strategies aimed at maximising shareholder value are different. They focus onidentifying growth opportunities and building competitive advantage. They punish short-term strategies that destroyassets and fail to capitalise on the company’s core capabilities.
By the time you have completed this chapter, you will be able to:
❍ Describe the new marketing challenges faced by today’s managers
❍ Understand the central role of shareholder value
❍ Assess why marketing has too little influence in the board room
❍ Recognise why marketing is the bedrock of shareholder value analysis
❍ Identify how the profession and discipline of marketing need to change to make it more relevant to topmanagement
The next section discusses the striking new challenges of the information age: global markets, changing industrialstructures, the information revolution and rising consumer expectations. It is shown how these changes havefar-reaching implications for the strategies and organisations of all businesses. This leads to a discussion of theshareholder value concept and the market-to-book ratio as measures of the success of a business.
A major problem for marketing is that it has not been integrated with the modern concept of financial value creation.This has handicapped the ability of marketing managers to contribute to top management decision-making. Yet
4 MARKETING AND SHAREHOLDER VALUE
marketing-led growth is at the heart of value creation. Without effective marketing, the shareholder value conceptbecomes little more than another destructive technique gearing management to rationalisation and short-termprofits. Value-based marketing is presented as a new approach, which integrates marketing directly into the processof creating value for shareholders and thereby for all stakeholders. Value-based marketing makes the shareholderconcept more valuable and marketing more effective.
MANAGING IN THE TWENTY-FIRST CENTURY
The enormous changes in the global market environment explain today’s pressures for greater managementeffectiveness. Competitive capitalism is Darwinian in nature. Businesses succeed when they meet the wants ofcustomers more effectively than their competitors. Corporate profitability depends primarily on the company’sability to offer products and services which customers choose to pay for. But what products and services customersregard as attractive is a function of the market environment. What is an appealing computer, retail store or bankingservice today will not be tomorrow. Technological change, new competition and changing wants make yesterday’ssolutions obsolete and create the opportunity for new answers.
The result is that most companies do not usually last very long. De Geus calculated that the average life expectancyof a Western company is well below 20 years.[1] The period over which a successful firm can maintain a profitablecompetitive advantage is usually even shorter. Normally any innovation in product, services or processes is quicklycopied and the surplus profit is competed away. Even where a company endures and grows, its true profitabilitynormally erodes. Studies show that the average company does not maintain a return above its cost of capital formore than seven or eight years.[2]
While the period over which the average business is successful is short, there are companies that do better. Thereare a few examples of companies that have survived and maintained successful economic performance over amuch longer period. Currently examples would include GE, Coca-Cola, Nike and Hewlett-Packard. But quotingexamples of excellent companies is a hazardous venture. Great companies have a tendency to go belly-up whenthe environment changes fundamentally. Few leaders have the perspicacity, courage or capabilities to overturn thestrategies, systems and organisation which created their past achievement.
ENVIRONMENTAL CHANGE
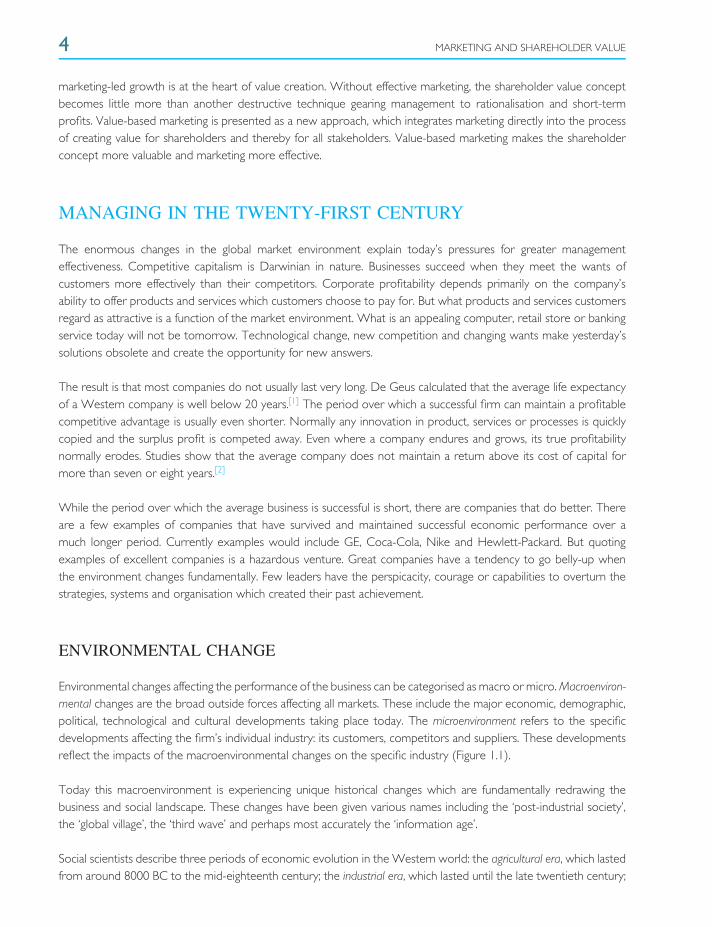
Environmental changes affecting the performance of the business can be categorised as macro or micro. Macroenviron-mental changes are the broad outside forces affecting all markets. These include the major economic, demographic,political, technological and cultural developments taking place today. The microenvironment refers to the specificdevelopments affecting the firm’s individual industry: its customers, competitors and suppliers. These developmentsreflect the impacts of the macroenvironmental changes on the specific industry (Figure 1.1).
Today this macroenvironment is experiencing unique historical changes which are fundamentally redrawing thebusiness and social landscape. These changes have been given various names including the ‘post-industrial society’,the ‘global village’, the ‘third wave’ and perhaps most accurately the ‘information age’.
Social scientists describe three periods of economic evolution in the Western world: the agricultural era, which lastedfrom around 8000 BC to the mid-eighteenth century; the industrial era, which lasted until the late twentieth century;
MANAGING IN THE TWENTY-FIRST CENTURY 5
Globaleconomy
Demographics
Naturalenvironment
Social-culturalThe macro-environment
The micro- environment
Technology
• customers• competitors
• suppliers
Political-legal
Figure 1.1 The Business Environment
and finally what we will call the information age, which began in the 1960s and will last for decades to come.[3] Thesedates are of course approximate and overlapping. The first era was based on agriculture, with physical labour beingthe driver of any wealth that was achieved. This eventually gave way to the second era sparked by the industrialrevolution, when machinery replaced muscle power, and factories replaced agriculture as the dominant employer,leading to an enormous growth in both agricultural and industrial productivity.
While the agricultural era lasted for over two thousand years, the industrial age lasted only two hundred. The1960s began to see the end of the industrial era and the beginning of the new information age. Employment inmanufacturing began to drop in all the advanced countries and the service sector became the new focus for growth.Blue-collar workers who operated equipment in crowded factories were increasingly replaced by white-collarworkers working individually or in small teams using computers and scientific knowledge in office environments.Today, information technology has replaced factories and machine power as the source of productivity growth andcompetitiveness.
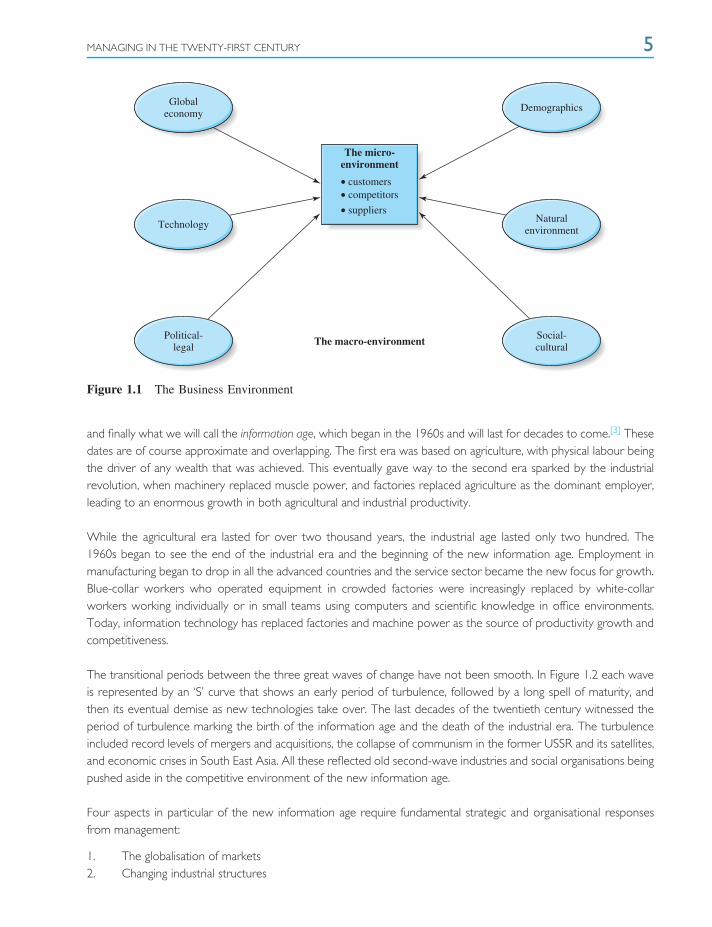
The transitional periods between the three great waves of change have not been smooth. In Figure 1.2 each waveis represented by an ‘S’ curve that shows an early period of turbulence, followed by a long spell of maturity, andthen its eventual demise as new technologies take over. The last decades of the twentieth century witnessed theperiod of turbulence marking the birth of the information age and the death of the industrial era. The turbulenceincluded record levels of mergers and acquisitions, the collapse of communism in the former USSR and its satellites,and economic crises in South East Asia. All these reflected old second-wave industries and social organisations beingpushed aside in the competitive environment of the new information age.
Four aspects in particular of the new information age require fundamental strategic and organisational responsesfrom management:
1. The globalisation of markets2. Changing industrial structures
6 MARKETING AND SHAREHOLDER VALUE
Liv
ing
stan
dard
s
Periods of turbulence
Agricultural age8000 BC – 1750
Industrial age1750 – 1960
Time
Information age1960 – ?
Figure 1.2 The Three Waves of Economic Change
3. The information revolution4. Rising customer expectations
THE GLOBALISATION OF MARKETS
The new information age has seen a dramatic shift to global markets and competition. Across more and moreindustries, firms that are not building global operations and marketing capabilities are losing out. Recent decades haveseen an enormous growth of international trade in goods, services and capital. The General Agreement on Tariffs andTrade (GATT) and its successor organisation the World Trade Organization (WTO) have been the means of nego-tiating a general lowering of barriers to trade between countries and an opening up of markets. The stimulus to thisliberalisation of trade has been experience. Governments have seen, often painfully, that protecting home industriesand markets from competition does not work. It only leads to higher inflation, lower economic growth and domesticcompanies lacking the levels of efficiency and entrepreneurial skills ever to be internationally competitive. Otherstimuli to the globalisation of markets and competition have been faster and cheaper transportation and a continuingtelecommunications revolution that has made global communications cheap, simple and effective. Finally, the barriersto participation in world trade have often come down dramatically. Today any business can open an Internet website and market to customers from the other side of the world, just as easily as to its customers around the corner.
The result has been the emergence of new transnational companies organised to maximise the opportunities tobe gained from the new global market-place and to minimise the costs of serving it. Companies like Microsoft, GE,Intel, Merck, IBM, Starbucks and McDonald’s are selling in all the key markets. Their supply chains are equally global,with materials and components sourced from the cheapest locations, assembly and logistics organised from themost effective regional bases, and research and development located where relevant knowledge is most accessible.
In most sectors, small domestically-orientated companies lack the economies of scale to remain competitive overthe longer run. The scale economies of the transnational companies lie not so much in manufacturing costs but ininformation and knowledge. Focused transnationals like Intel, Apple, Dell and Cisco win out because they can affordto spend more on research and development, on building brands, on information technology and on marketing.Once new opportunities are identified they can also marshal the resources that are necessary to capitalise anddevelop the market.
MANAGING IN THE TWENTY-FIRST CENTURY 7
CHANGING INDUSTRIAL STRUCTURES
The information age is changing the nature of the profit opportunities available to businesses. Many markets thatwere once at the very heart of the economy have ceased to offer profit opportunities for Western firms. Othernew markets are rapidly emerging that offer enormous profit opportunities to companies that can move fast anddecisively to capitalise on them.
Manufacturing industries can be divided into two types. One type comprises traditional industries such as textiles,coal mining, heavy chemicals, steel and auto manufacturing, which are relatively labour intensive and make heavy useof raw materials. These industries are relocating rapidly to the developing countries, which have a comparative costadvantage. Such industries also generally suffer the problem of substantial excess manufacturing capacity becausethese new countries have invested too aggressively in seeking to gain market shares. The result has been fallingprices and very poor returns on investment.
The second type of industries are the information- and knowledge-based ones such as pharmaceuticals, com-munications equipment, electronics and computers, aerospace and biotechnology. Here labour costs are typicallyless than five per cent of total costs. Most of the costs are information-related: research, design, development,testing, marketing, customer service and support. These are where the profit and growth opportunities occur forinformation-age companies. Contrary to the popular view, in most Western countries, manufacturing output hasnot declined in recent decades. What has changed is the switch away from traditional labour-intensive industries tothose that are information-based. Second, there has been a sharp decline in manufacturing employment – notablyblue-collar work, as these jobs have been automated or moved to the developing countries.
Overall employment has been maintained in information-age countries by the rapid growth of the service sector.Service-sector output has been growing at least twice as fast as manufacturing output in recent decades. In advancedcountries services now account for two-thirds of economic output. As living standards continue to rise consumersspend relatively more on services rather than on goods. Health, education, travel, financial services, entertainmentand restaurants are all growth markets. Informational technology has also become a massive service industry.Another reason why this will continue is that the output of information-based manufacturing industries is increasinglydistributed in service form. For example, pharmaceutical companies or book publishers, rather than exporting drugsor books, will license the rights to produce them. Many items such as music and news are already being downloadedfrom the Internet rather than bought in the form of a physical product such as a CD.
THE INFORMATION REVOLUTION
Rapid scientific and technological changes continue to radically reshape many industries. But the most dramaticand far-reaching changes of the current era result from the revolution in information technology. Initiated by thedevelopment of the mainframe and the personal computer in the 1960s and 1970s, its full implications only reallybecame apparent in the 1990s with the explosion in use of the Internet. By 2001, only a decade after the emergenceof the World Wide Web, a fundamental change in business and society had occurred – a critical mass of people,over 200 million, at home and at work, were able to communicate electronically with one another at essentially zerocost, using universal, open standards. By the end of 2007, that number had multiplied exponentially to over 1.3 billion.
The Internet, together with the emergence of broadband cellular radio networks, has created an explosion inconnectivity that is revolutionising almost every aspect of business. First, it changes the firm’s internal value chain – the
8 MARKETING AND SHAREHOLDER VALUE
way people inside the business organise to design, produce, market, deliver and support its products and services.In the past, businesses had to organise through hierarchies and bureaucracy because information was expensive,difficult and slow to obtain. Today, intranets, which instantly and costlessly connect individuals within companiesfor the exchange of information, make obsolete the need for hierarchical functions. Instead cross-functional teamsand informal networking are encouraged, which in turn facilitate flatter, lower-cost organisational structures, fasterresponses and better customer service.
Second, the information revolution has changed the way the business works with its suppliers. Where partnershipsare important, information technology can make them much closer. Extranets, which connect companies to eachother, can seamlessly integrate buyer and seller into a virtual business. A typical example is the jeans maker, Levi.Over the Internet it continuously obtains information on the sizes and styles of its jeans being sold by its majorretailers. Levi then electronically orders more fabric for immediate delivery from the Milliken Company, its fabricsupplier. Milliken, in turn, relays an order for more fibre to Du Pont, its fibre supplier. In this way the partners takeout cost throughout the supply chain, minimise inventory holding and have up-to date information to enable themto respond quickly to changes in consumer demand.
In a similar way, when the bar code of a Procter & Gamble (P&G) product passes across a Wal-Mart scanner, thatinformation is immediately relayed to P&G, which invoices the retailer and makes another, which, in turn, is relayedto the distribution centre. This process has saved Wal-Mart millions of dollars in administration expenses.
On the other hand, where buyers see price as more important than partnerships, the widespread availability ofinformation undermines the suppliers’ relationships with customers. For example, component buyers can posttheir purchasing requirements on Internet bulletin boards and invite bids from anybody inclined to respond. Theinformation revolution has increased the information available to buyers and reduced the cost of switching suppliers.In general, the bargaining power of buyers has been radically increased.
Finally, the information revolution has significantly changed the nature of marketing and the marketing mix (see box,‘Traditional Marketing Meets the Information Revolution’). Traditionally buyers chose suppliers for both the qualitiesof the products and the information they supplied. For example, retailers like Toys ‘R’ Us or PC World prosperedby offering shoppers a wider selection of merchandise. But such formats are now undermined by search engineson the Internet, which can offer consumers much more choice than any store. This has created many new hugebusiness opportunities for companies able to exploit the informational advantage of the Internet. These includespecialist facilitators like Google which assist consumers in their search for information. Others have reconfiguredthe traditional industry chain to capitalise on electronic communications. Among the most successful in the late1990s was Amazon.com, which in only four years created the world’s biggest book retailing operation, and whichhad net sales of almost $15 billion by the end of 2007. Its business has broadened significantly beyond books, andincludes third parties selling a range of different products and services globally over the Net.
Traditional Marketing Meets the Information Revolution
For two centuries Encyclopaedia Britannica was one of the strongest and best-known brands in the world. Its largesales force successfully encouraged middle-class parents to view purchase of the 32-volume set of encyclopaediasas offering a genuine advantage for their children. Then the home computer and the CD-ROM came along. By theearly 1990s Britannica’s sales were collapsing.

MANAGING IN THE TWENTY-FIRST CENTURY 9
What went wrong? First the emerging information age changed consumer behaviour. Now parents who wanted todo the right thing for their children bought them a computer rather than printed encyclopaedias. Once Microsoftand others launched CD-ROM versions of encyclopaedias, the game was lost. The cost of producing a CD-ROM wasabout £1; the cost of producing a printed set of encyclopaedias was around £250. The result was that Microsoft’sEncarta could sell at £50 or even be given away free; a set of Encyclopaedia Britannica sold at between £1300and £2200. Worse, because of its high cost, Britannica needed an expensive direct sales force to sell the product.The cheap CD-ROM versions were almost impulse items, which could be sold through computer shops or marketedto manufacturers for bundling with new computer sales. Finally, children liked computers and CD-ROMS more; aCD-ROM was easier and more fun to use than searching through a formidable set of 32 large books.
When the threat became obvious, Britannica brought out its own CD-ROM, but to avoid undercutting its sales force itcharged £755. Not surprisingly, its sales continued to decline. Finally, in 1997 the company recognised the issue, thesales force was disbanded and, under new ownership, the company sought to rebuild the business around the Internet.
The company now offers its extensive information in a variety of formats, including the original print versions,DVD packages, the online site, which also offers daily features, updates and links to news reports, and a mobileversion. However, its pre-eminence continues to be challenged by other online encyclopaedias, such as Encarta andWikipedia – even though the latter might seem to lack the authority of its older rival since it is written collaborativelyby volunteers within certain editorial rules.
Britannica’s real problem was that its management – like many others – failed to recognise the implications ofthe information era. The information revolution has made traditional strategies obsolete, destroyed barriers to entryand stimulated new competitors with dramatically lower cost structures and more effective marketing systems.Management recognised too late that its sales force had become an expensive liability and that the computerhad become the real competitor. The complacency of Britannica’s management is not unique. It is a predicamentthat a host of major companies have faced in such industries as cars, insurance, travel, financial services and majorsectors of retailing and distribution.
Contrast this with Yellow Pages – now called Yell – which didn’t make the same mistake as Britannica and wasin the forefront of putting its data into electronic formats alongside the more traditional print version. The result isthat Yell remains one of the top organisations in its sector.
Sources: Philip B. Evans and Thomas S. Wurster, Strategy and the new economics of information, Harvard BusinessReview, September/October, 1997, 70–83; The Economist, Encyclopaedias on CD-ROM, 17 February 1996,p. 67; New York Times, Start Writing the Eulogies for Printed Encyclopedias, 23 March 2008.
In many markets, information technology has led to disintermediation – the elimination of agents between thesupplier and the consumer. Buyers have found that they no longer need retailers, agents or brokers; they can buy atlower cost, and more conveniently, directly from the manufacturer over the telephone or, increasingly, the Internet.Companies like Dell in computers and Direct Line in insurance rapidly grew to market leadership by exploitingthis strategic window. When the seller deals directly with end consumers the opportunity is then created to builddatabases which record learning about individual consumer wants and buying behaviour. The seller can then createadded value by tailoring messages and even products for individual consumers. The information revolution hasthus begun to change marketing from mass communications and standardised brands to one-to-one customisedmarketing. For the innovators this has offered the opportunity for higher profit margins, greater loyalty and a biggershare of the customer’s spending.[4]
10 MARKETING AND SHAREHOLDER VALUE
RISING CUSTOMER EXPECTATIONS
The information age has brought a marked rise in customer expectations. Buyers have grown to expect higherquality, competitive prices, and better and faster service. The most important causes have been the globalisation ofcompetition and the deregulation of markets. Once markets were opened up to today’s aggressive internationalcompetitors, companies that lacked a customer orientation or that had inefficient cost structures were soon introuble. The new wave of Japanese exporters such as Sony, Toyota and Matsushita in the 1960s showed Westerncompanies the new standards of quality required to stay competitive. Concepts like kaisen (continuous incrementalimprovement), Total Quality Management (TQM) and such schemes as the US Baldridge Awards and the EuropeanISO 9000 certification had real effects in raising quality standards. During the 1970s and 1980s major excesscapacity became a characteristic of more and more industries – for example, cars, steel, chemicals, electrical goods,agricultural products and banking. This further shifted the priority to gaining customer preference in hypercompetitivemarkets. Finally, the explosion of information technology gave management new tools for serving customers better:tools to continuously monitor customer needs and to improve the internal processes and supply chains that wouldenable them to meet, and indeed exceed, customer expectations.
Initially the response to meeting customer needs better was market segmentation. Companies brought out anincreasing number of product variants to meet the diverse needs of their customers. Nike had 347 types of runningshoe, Procter & Gamble had 207 brands and sizes of detergent, United Distillers introduced nine line extensions ofits Johnnie Walker brand of scotch whisky, credit card companies offered green, blue, gold and platinum versions,each with minor differences in the service offering, and so on. Media too became more segmented: mass-circulationnewspapers and magazines were replaced by a proliferating array of specialists. Digital technology also facilitated anexplosive growth in the number of radio and television channels.
The problem with market segmentation was that it was expensive and limited in effectiveness. More variants meanthigher manufacturing costs and spiralling inventory levels leading to lower profits and asset turnover. By 2000, theinformation revolution was beginning to offer a better alternative – mass customisation. Media and products couldbe tailored to the individual customer and made to order, using modern high technology communications andmanufacturing systems. Information technology allows companies to record all the information they obtain fromconsumers through their personal, written, telephone or Internet communications with the company. Creating adatabase allows companies to learn about the buying behaviour and preferences of customers and to communicateindividually and directly with them. Direct marketing creates the opportunity for a dialogue, allowing a precisespecification of the customer’s wants.
Dell Computer Corporation was one of the pioneers in showing how direct marketing could be allied to a fastresponse supply chain to produce customised products delivered to the customer’s door 48 hours after the order.[5]
For the customer one-to-one marketing offers a precise fit to his or her individual requirements. For the supplier itmeans higher margins and lower investment requirements.
STRATEGIC AND ORGANISATIONAL IMPLICATIONS
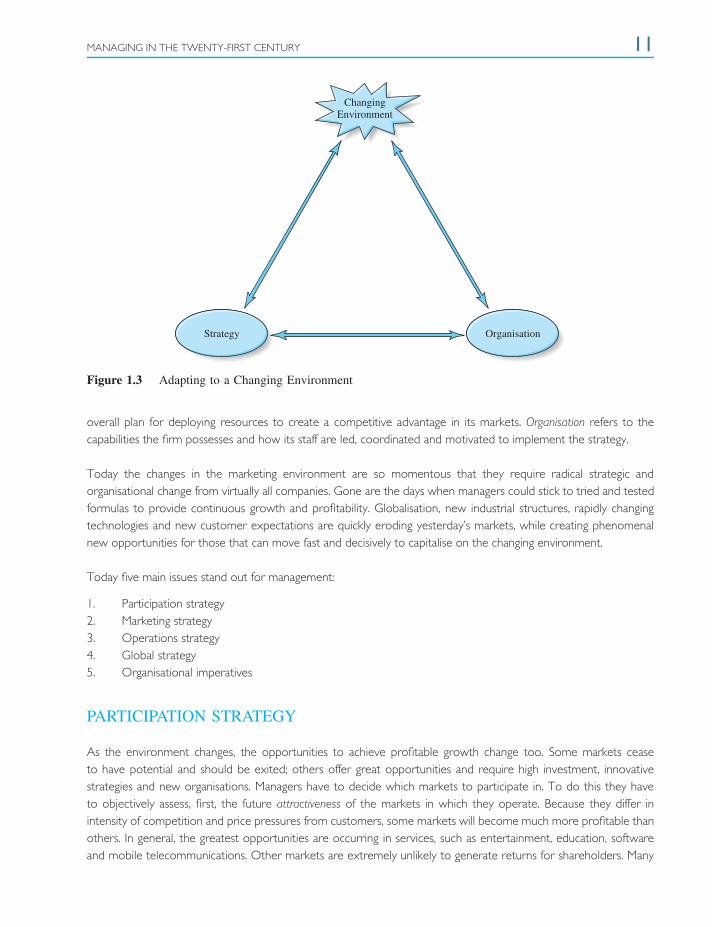
Companies survive only if they can adapt to this rapidly changing environment (Figure 1.3). This changing environmentdetermines what products and services customers will find attractive. It also determines the technologies that willbe available for companies to produce and market these products and services. By strategy we mean the business’s
MANAGING IN THE TWENTY-FIRST CENTURY 11
ChangingEnvironment
Strategy Organisation
Figure 1.3 Adapting to a Changing Environment
overall plan for deploying resources to create a competitive advantage in its markets. Organisation refers to thecapabilities the firm possesses and how its staff are led, coordinated and motivated to implement the strategy.
Today the changes in the marketing environment are so momentous that they require radical strategic andorganisational change from virtually all companies. Gone are the days when managers could stick to tried and testedformulas to provide continuous growth and profitability. Globalisation, new industrial structures, rapidly changingtechnologies and new customer expectations are quickly eroding yesterday’s markets, while creating phenomenalnew opportunities for those that can move fast and decisively to capitalise on the changing environment.
Today five main issues stand out for management:
1. Participation strategy2. Marketing strategy3. Operations strategy4. Global strategy5. Organisational imperatives
PARTICIPATION STRATEGY
As the environment changes, the opportunities to achieve profitable growth change too. Some markets ceaseto have potential and should be exited; others offer great opportunities and require high investment, innovativestrategies and new organisations. Managers have to decide which markets to participate in. To do this they haveto objectively assess, first, the future attractiveness of the markets in which they operate. Because they differ inintensity of competition and price pressures from customers, some markets will become much more profitable thanothers. In general, the greatest opportunities are occurring in services, such as entertainment, education, softwareand mobile telecommunications. Other markets are extremely unlikely to generate returns for shareholders. Many
12 MARKETING AND SHAREHOLDER VALUE
of the old labour- and raw-material intensive industries such as textiles, steel and heavy chemicals fall into thiscategory. Second, managers need to assess their competitive potential. With today’s fierce global competition, unlessa business can create a differential advantage, in terms of either low total cost or a superior product or service thatcan command a price premium from customers, it will not earn an adequate return.
MARKETING STRATEGY
The information revolution is making obsolete the marketing strategies of many traditional industry leaders. Itdestroys barriers to entry and transforms the structure of many industries. What is the role of a branch networkwhen customers can bank more conveniently on the web? Who needs retailers and distributors when you can selldirect to consumers? Every aspect of marketing comes up for renewal.
The customer and product mix needs to be strategically reappraised. The information revolution has increased theneed for firms to focus. Many firms have too many low-value customers who do not want long-term relationships.They also often have too many products bundled together by the classic informational logic of one-stop shopping. Butone-stop shopping loses its premium for customers once information is readily available. Specialists can then generallyoffer lower prices or superior service by focusing their operations around a single product or customer group.
Pricing strategies also need reviewing. The globalisation of markets, the euro currency and information technologyhave all made prices more transparent and comparable. Businesses not offering value to customers are seeingtheir market shares eroding at accelerating rates. The information revolution is having its most dramatic impacts onpromotion and distribution strategies. The company’s web site is increasingly becoming both the first port of callfor customers looking for information and a crucial source of knowledge about customers for the company. Morefundamentally, the Internet offers more and more companies of all sizes the opportunity to eliminate intermediariesand deal with consumers directly.
OPERATIONS STRATEGY
To implement a new marketing strategy requires the firm to create an operations strategy capable of delivering it.Companies need to construct a supply chain that can produce the right goods and services, at the right price, in theright place, at the right time. With today’s global competition and rising customer expectations, this right strategyusually means low prices, rapid delivery, reliable quality and up-to-date technology.
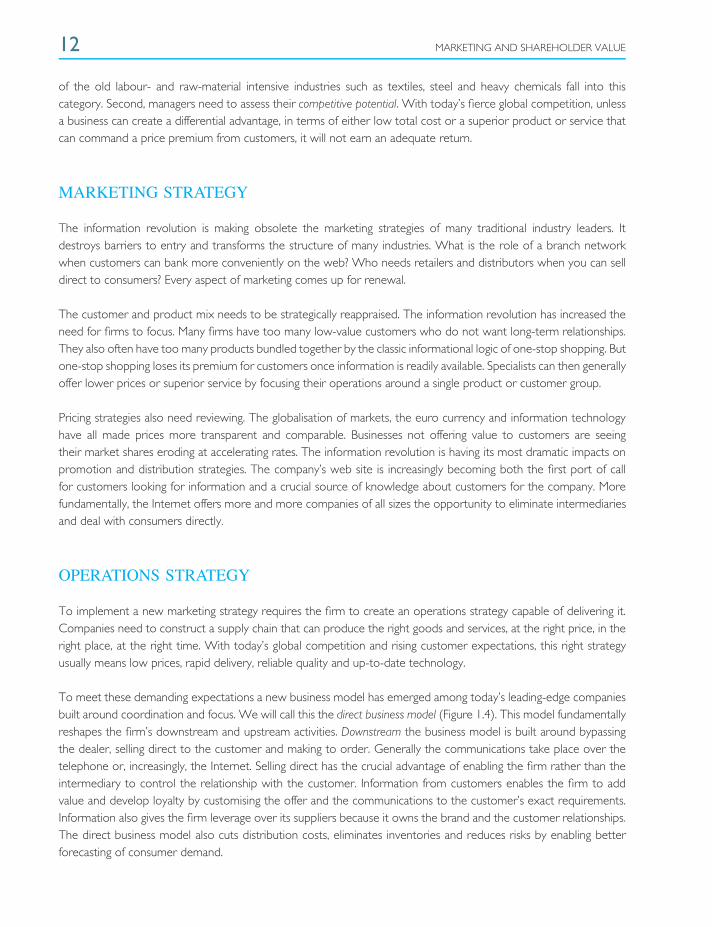
To meet these demanding expectations a new business model has emerged among today’s leading-edge companiesbuilt around coordination and focus. We will call this the direct business model (Figure 1.4). This model fundamentallyreshapes the firm’s downstream and upstream activities. Downstream the business model is built around bypassingthe dealer, selling direct to the customer and making to order. Generally the communications take place over thetelephone or, increasingly, the Internet. Selling direct has the crucial advantage of enabling the firm rather than theintermediary to control the relationship with the customer. Information from customers enables the firm to addvalue and develop loyalty by customising the offer and the communications to the customer’s exact requirements.Information also gives the firm leverage over its suppliers because it owns the brand and the customer relationships.The direct business model also cuts distribution costs, eliminates inventories and reduces risks by enabling betterforecasting of consumer demand.

MANAGING IN THE TWENTY-FIRST CENTURY 13
Traditional model: value chain with transactions between independent parties
Direct business model: eliminates distributors
Virtual integration: develops direct model further by using IT to integrate supply chain partners and customers
Suppliers
Suppliers
Upstream Downstream
Manufacturer
Manufacturer
Distributionchannels
Customers
Customers
Suppliers Manufacturer Customers
Figure 1.4 The Evolution of a New Business Model
Upstream the model is built around close cooperation with suppliers. Manufacturing and logistics is outsourcedto a carefully selected set of partners. These suppliers are linked electronically to the firm and treated like aninternal department. Instead of vertical integration – control and coordination through ownership – we have virtualintegration – control and coordination through information. This reduces the assets required to support rapidgrowth, minimises financial risk and maximises flexibility. It frees the management to focus on what adds most valuetoday – delivering solutions and systems to customers. The direct business model creates genuine value throughcustomer focus, supplier partnerships, mass customisation and just-in-time manufacturing.
GLOBAL STRATEGY
In today’s connected world, every company now needs a global strategy. Industries are globalising at a rush andcompanies that are not leading, or at least participating, in the new alliances, are becoming non-viable. Manufacturingtended to globalise first but now services are following rapidly. For example, a series of mega-mergers in the 1990sglobalised accounting, financial services and most of the advertising industry into a small number of huge globalgroups. Regional and global groupings have also emerged in telecommunications, banking, contract services andmany other areas.
In business-to-business markets – to which most companies belong – the pressure to globalise comes from theircustomers, which operate across the world. Procter & Gamble and IBM want suppliers and business partners thatcan interface with their own far-flung geographical operations. The opportunity to spread the costs and lever theinvestments in research, development and technology also favours global players. Finally, being dependent on a singlecountry market leaves today’s local player highly vulnerable. Strategically it is in a weak position to counter-attack

14 MARKETING AND SHAREHOLDER VALUE
against a strong global player moving into its market and being willing to cross-subsidise its entry from profits earnedin other markets.
As in most areas of business today, there are big advantages in speed and decisiveness when it comes to globalstrategy. The longer management prevaricates, the fewer the options are available and the higher the price thathas to be paid.
ORGANISATIONAL IMPERATIVES
To implement new strategies requires new organisations. What is different about organisations in the informationage? First, employees are different. Blue-collar workers have given way to knowledge professionals. Part-timers andwomen make up an increasing proportion of the staff. The skills of the new knowledge workers make them lessdependent on the company and more mobile. Motivating them requires different work environments and incentivesfrom the past. Second, information and communications technology now permits new and more effective ways forpeople within the firm to relate to one another and to relate to others in the supply chain.
Finally, the new strategies ushered in by the information age require different responses from staff. A customerorientation becomes more important since more of the staff are now directly involved in providing customer serviceand customising products and solutions. The priority consumers now give to convenience and speed of responsedemands much greater empowerment and commitment from staff. The pressure on prices and the need to providegreater shareholder value also drive management to seek higher productivity and better utilisation of assets.
The direction of organisational changes is clear. Delayering has been one major move. Information technologyhas enabled companies to reduce the number of levels of middle management, providing for greater customerorientation, lower costs and faster response. Second, enhanced connectivity is breaking down functional barrierswithin firms, permitting a much greater use of cross-functional teams, which again makes for faster response andgreater customer focus. The same forces have increased the flow of information between firms, facilitating moreeffective networks to lever the firm’s capabilities with those of its business partners. The final change has beena greater focus on shareholder value. Investors are putting much more pressures on managers either to deliversuperior returns or return the cash to shareholders.
The implications of the changing environment for strategy and organisation – and hence for the firm’s ability toachieve longer term growth and profitability – can be summarised in five principles:
1. Strategy must fit the environment. Companies can remain competitive only when they have products andservices which today’s customers regard as offering superior value. Perceived value is shaped by the changingmacro- and microenvironments within which the firm and its customers operate.
2. Successful strategies erode. Winning formulas eventually lose out because the environment changes.Competitors copy successful products and processes. Changing tastes and new technologies make yesterday’ssuccesses obsolete.
3. Effectiveness is more important than efficiency. Old formulas cannot be preserved by downsizing andcost reduction. Innovative solutions have a way of coming down in costs to offer superior value across alldimensions of value. Success in the information age is about renewal rather than retrenchment.

MEASURING SUCCESS: SHAREHOLDER VALUE 15
4. Speed and decisiveness. Being first mover when new opportunities occur can carry great advantages. Withno direct competition it is much easier to demonstrate a competitive advantage. But being first is notsufficient; the innovator has to create a critical mass in terms of market share. This requires managersdecisively shifting resources out of yesterday’s businesses into the new opportunities
5. Organisational adaptation. Creating these dynamic, customer-orientated businesses that will be required forthe new millennium requires leadership and organisational transformation of a high order.
MEASURING SUCCESS: SHAREHOLDER VALUE
The value of a company measures the views of professional investors about the ability of management to masterthis changing market environment. When a company is seen to be in an attractive market, pursuing a strategy thathas a good chance of building a sustainable competitive advantage, then the value of the company rises (see, box‘Shareholder Values Reflect Perceptions of Winning Strategies’). An attractive market and a winning formula shouldmean that the company will be able to earn a return on its investment above the cost of capital. In this situationmanagement finds it easy to attract outside funds, to make acquisitions and to grow.
Shareholder Values Reflect Perceptions of Winning Strategies
In the late 1990s investors became alert to the potential impact of the Internet on many businesses. CharlesSchwab, a leading US stockbroker, also saw the opportunity. In 1998 it launched a global online dealing service tothe public. In the following 12 months it was rewarded by a trebling of its market capitalisation. Investors reactedenthusiastically to the potential attractiveness of the market and to the decisiveness of Schwab management. By2007 it was managing approximately $1.3 trillion for more than seven million individual and institutional clientsthrough the telephone, wireless devices, the Internet and physical offices.
In 1990 nobody had heard of Vodafone, a subsidiary of a British electrical contracting company, Racal. In thefollowing years Vodafone aggressively entered and developed the emerging mobile telephone market, first inthe UK then overseas. Its share price soared. By 2007, thanks to a raft of acquisitions around the world, it was theworld’s largest global operator with a stock market value of almost £100 billion.
The stock market clearly recognises that some markets have much greater prospects for generating corporateearning in the future than others. CMG, a small Dutch start-up specialising in computer services, was floated onthe stock market at the end of 1995 with a market capitalisation of £185 million. So impressed were investors bythe attractiveness of the industry and CMG’s strategy that three years later its market value had soared 16-fold to£2 billion. In 2002 it then merged with the UK’s Logica. Logica is a major international force in IT and businessservices, employing around 40 000 people across 41 countries.
In 2000 Amazon.com, the Internet book retailer, had been going for five years. It had never yet made any profit,but it was valued at $20 billion – more than all the other US booksellers together. Following the dot.com collapse,its value then dropped: in 2004 it was valued at $14 billion, for example. However, by 2008 it had risen again, to$34 billion.
16 MARKETING AND SHAREHOLDER VALUE
Contrast these examples with conglomerates such as GEC, Hanson and BTR, which, in the 1980s, had emergedthrough a series of acquisitions to become among Europe’s largest companies. All three were characterised byfinancial and strategic conservatism. Investments had to break even within two years and managers were evaluatedagainst quarterly profitability goals. The result was that none developed significant new products, entered newmarkets or generated a competitive advantage. A decade later the share values of all three had collapsed, BTRwas acquired, and GEC and Hanson were broken up.
When investors perceive a company to be stuck in unattractive markets and to be lacking a competitive advantage,they naturally do not want to invest. The value of the company then declines, making the company difficult to attractresources and making it prone to being acquired.
The value of a company is increased by making the business better. But even if the company performs well, it couldstill be too small to remain independent. It may be worth more to a larger company with global ambitions than itis as a stand-alone business. Good companies as well as bad companies get bought. The difference is that in theformer case shareholders are well rewarded in the higher price that the acquirer has to pay. If managers want tobe able to control their own destiny in today’s global economy – to remain independent – the company has to getbigger as well as getting better.
The stock market’s judgement on the expected financial performance of a company is reflected in its market-to-bookratio.[6] (see box, ‘Definition of Shareholder Value’). The main determinant of market value is the ability ofmanagement to seize profitable investment opportunities. Company size can be measured by its book value – theaccounting value of its equity. The market capitalisation is simply the product of these two components. For example,a market-to-book ratio of 3 and a book value of £10 billion means a market capitalisation of £30 billion.
Definition of Shareholder Value
Shareholder value is created by rising share prices and/or dividends but there are exceptions. If a company buys backits own shares, the individual share price should increase but shareholder wealth is unaffected because the shareprice times the number of shares stays the same. Likewise, a share price rise may be ephemeral due to rumoursor the rise in the market as a whole or otherwise unrelated to the improvement in the underlying business, which iswhat the shareholder value method of evaluation is trying to track. So in practice we look internally to examine, asa measure of shareholder value increase, the economic value added (EVA) which is defined as the net profit aftertax less Weighted Average Cost of Capital (WACC) times capital invested. (EVA is discussed in Chapter 2.)
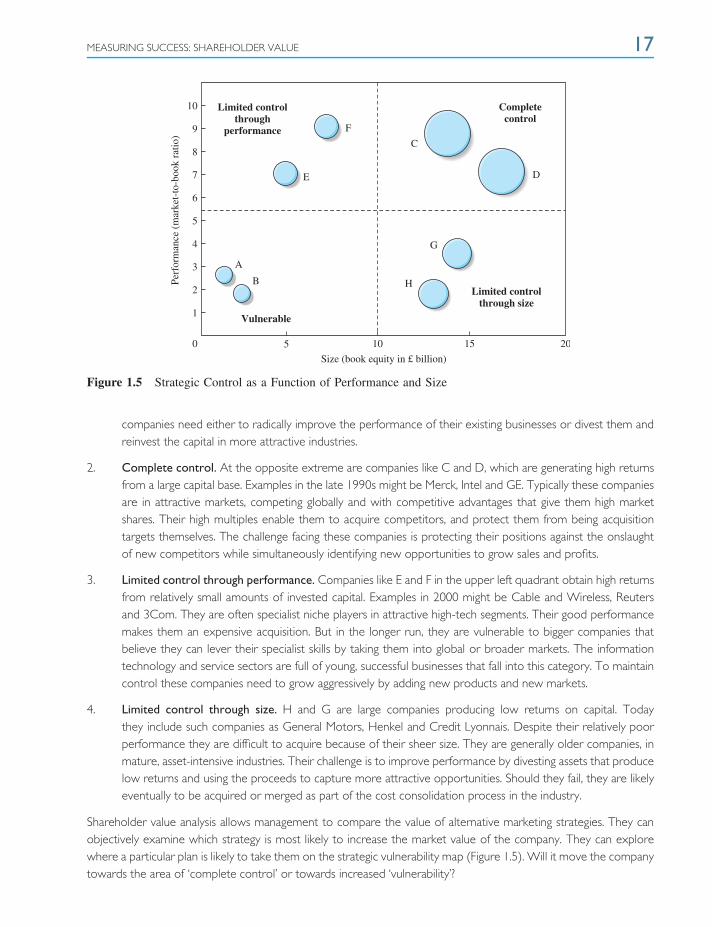
The implications of this can be seen in Figure 1.5. The management consultants, McKinsey suggest that companiescan be mapped into four groups:[7]
1. Vulnerable. Companies like A and B, using relatively small amounts of financial capital and generatingrelatively low returns, are vulnerable to acquisition. These are often businesses that have been left in mature,unattractive industries and are still focused on the domestic market. They are commonly taken over by largercompetitors that can generate higher returns from the same asset base. To have a future, these vulnerable
MEASURING SUCCESS: SHAREHOLDER VALUE 17
0 5 10
Size (book equity in £ billion)
15 20
1
2
A
B
Vulnerable
Limited controlthrough
performance
Completecontrol
Limited control through size
C
D
H
G
E
F
Perf
orm
ance
(m
arke
t-to
-boo
k ra
tio)
3
4
5
6
7
9
8
10
Figure 1.5 Strategic Control as a Function of Performance and Size
companies need either to radically improve the performance of their existing businesses or divest them andreinvest the capital in more attractive industries.
2. Complete control. At the opposite extreme are companies like C and D, which are generating high returnsfrom a large capital base. Examples in the late 1990s might be Merck, Intel and GE. Typically these companiesare in attractive markets, competing globally and with competitive advantages that give them high marketshares. Their high multiples enable them to acquire competitors, and protect them from being acquisitiontargets themselves. The challenge facing these companies is protecting their positions against the onslaughtof new competitors while simultaneously identifying new opportunities to grow sales and profits.
3. Limited control through performance. Companies like E and F in the upper left quadrant obtain high returnsfrom relatively small amounts of invested capital. Examples in 2000 might be Cable and Wireless, Reutersand 3Com. They are often specialist niche players in attractive high-tech segments. Their good performancemakes them an expensive acquisition. But in the longer run, they are vulnerable to bigger companies thatbelieve they can lever their specialist skills by taking them into global or broader markets. The informationtechnology and service sectors are full of young, successful businesses that fall into this category. To maintaincontrol these companies need to grow aggressively by adding new products and new markets.
4. Limited control through size. H and G are large companies producing low returns on capital. Todaythey include such companies as General Motors, Henkel and Credit Lyonnais. Despite their relatively poorperformance they are difficult to acquire because of their sheer size. They are generally older companies, inmature, asset-intensive industries. Their challenge is to improve performance by divesting assets that producelow returns and using the proceeds to capture more attractive opportunities. Should they fail, they are likelyeventually to be acquired or merged as part of the cost consolidation process in the industry.
Shareholder value analysis allows management to compare the value of alternative marketing strategies. They canobjectively examine which strategy is most likely to increase the market value of the company. They can explorewhere a particular plan is likely to take them on the strategic vulnerability map (Figure 1.5). Will it move the companytowards the area of ‘complete control’ or towards increased ‘vulnerability’?
18 MARKETING AND SHAREHOLDER VALUE
The key to economic value creation is the company’s ability to achieve or maintain competitive advantage in achanging market environment. The inputs into the valuation process are the assumptions about future sales growth,margins and investments that follow from any marketing strategy. For example:
A major European airline believed that deregulation would inevitably lead to greater price competition asnew ‘no-frills’ airlines entered the market. Companies such as Virgin, Ryanair, Easyjet and others had alreadyannounced big expansion plans. The airline’s review of the industry led it to conclude that its recent marketshare losses would accelerate unless a new strategy was developed.
Management eventually identified three alternative marketing strategies. The parity strategy involved seekingto hold market share by reducing prices towards the level of the new competitors. A major cost reductionexercise would run alongside this plan. The premium strategy would refocus the airline around businessand first-class passengers. It would include a switch to smaller aeroplanes, with fewer seats for economypassengers. The dual-brand strategy envisaged the launch of an entirely new airline codenamed ‘Merit’. Meritwould be positioned as a no-frills discount airline that would match or even undercut the prices of the newcompetitors. Here the aim would be to achieve market leadership in both the regular and the discountsectors.
Management made detailed projections of sales, profit margins and investment requirements under the threestrategies. On the basis of this analysis they calculated the shareholder value added with each alternative:
Alternative strategy Shareholder value added1. Parity strategy –£40 million2. Premium strategy +£70 million3. Dual-brand strategy +£185 million
Faced with the analysis, the board of directors had no hesitation in accepting management’s radical strategyof dual branding and the new airline was launched ten months later. The parity strategy was demonstratedto be disastrous because, while it stopped the erosion of market share, it led to a huge decline in profitabilityper passenger. The premium strategy did create value but it was inferior to dual branding because of theeffect of the decline in passengers carried.
The board believed that shareholder value analysis had proved its worth. It challenged management toidentify and develop new strategies. It encouraged them to think radically, which was necessary with rapidenvironmental changes increasingly making the status quo a non-viable strategic option. Finally, it provideda criterion for rationally and objectively evaluating strategic choices. All too often in the past, key decisionshad been made on the basis of subjective judgements, marketing ‘hype’ or political wrangling, which hadsubsequently proved to be wrong.
MARKETING’S LOST INFLUENCE
In today’s information age marketing professionals should have become more important in the top councilsof business. First, the central issue facing all firms now is understanding and adapting to rapidly changingmarkets – globalisation, new competition, rising customer expectations and the implications of the informationrevolution on how companies market. Second, marketing, rather than production, skills have become the key tocreating competitive advantage. More and more leading branded goods companies follow the lead of the likes ofCoca-Cola, Dell, Nike, Levi’s and Armani in outsourcing all their manufacturing to outside suppliers, often in the

MARKETING’S LOST INFLUENCE 19
developing countries. Others, like GE and IBM, see their future not in selling products, but in providing servicesthat offer tailored solutions to the needs of individual customers. Third, marketing performance is the root sourceof shareholder value. The firm’s opportunity to create cash is based first and foremost on its ability to create acompetitive advantage that will enable it to attract and retain customers paying satisfactory prices.
But rather than gaining in influence, marketing professionals, whose expertise is in identifying these marketopportunities and building customer relationships, appear to have little influence in the board rooms of industry. Asurvey by the Chartered Institute of Marketing, for example, found that only 17 per cent of the chief executivesof Britain’s FTSE 100 companies had experience in a marketing job, with 34 per cent coming from finance, 29 percent rising up the ranks from operations and 19 per cent from general management. Only 14 per cent of thosecompanies had marketing represented on the board.[8] Another study in 2008 of chief executives, financial andmarketing directors found a harmful lack of a common understanding of the role of marketing.[9]
Why does the lack of marketing professionalism in the board room matter? It matters because top managers will lackexpert guidance on how their customers and competitors’ strategies are changing. New market opportunities andthreats are unlikely to be recognised speedily and, once recognised, acted upon decisively. If senior management arenot focusing on customers and markets, it will mean that other issues fill the agenda. Evidence suggests that managersbecome preoccupied with short-term budgets, operating rather than strategic issues, and, when difficulties arise,retrenchment rather than renewal. Such myopia is, in the long run, antithetical to genuine value-creating strategies.[10]
Several factors account for this paradox of the growing importance of marketing with the lack of influence ofmarketing professionals in top management. Of fundamental importance has been the failure of the marketingdiscipline to incorporate the concept of shareholder value.[11] As a result there is no criteria for judging thesuccess of a marketing strategy or comparing alternatives. This in turn means it is difficult to accept marketingrecommendations on product policy, pricing, promotions or, indeed, any element of the marketing mix. All toooften marketing managers think a strategy is sensible if it increases sales or market share.[12] But astute top managersknow that strategies to maximise market share will very rarely make economic sense. More sophisticated marketingmanagers will be tempted to use projected profits or return on investment to rationalise their marketing proposals.Unfortunately, this approach has the opposite bias and leads to an under-investment in marketing and a failure tocapitalise on opportunities. Modern marketing has not incorporated current strategic valuation techniques and hasconsequently become marginalised in many board rooms. The marketing discipline lacks the framework for engagingin the strategic debate.
Because the link between marketing strategy and shareholder value has not been made, boards have tended to lookat two other more transparent strategies. One has been cost reduction – sometimes disguised by more appealingnames such as reengineering, downsizing or right sizing. Unfortunately, in a time of rapid market change, such actionsare invariably only palliatives at best. The other common remedy has been acquisition. Acquisitions have brokenall records in recent years. They have been seen as a way of generating value by adding top-line growth and bypermitting a reduction in average costs. But, again, the evidence is that three out of four acquisitions fail to add valuefor the acquiring company.[13] Excessive bid premiums, cultural differences between the businesses and a failure torejuvenate the company’s marketing orientation appear to be the major weaknesses.
The failure to place marketing strategy at the centre of the corporate agenda cannot be laid solely at the doorof the marketing profession. Financial management has also failed to bridge the marketing–finance interface. Topmanagement still focuses on company accounts that measure only the historical cost of assets and omit internallydeveloped brands and other intangible assets. Yet these marketing assets are now by far the most important sources
20 MARKETING AND SHAREHOLDER VALUE
of shareholder value. The market-to-book ratios for the Fortune 500 average over 4, implying that over 75 percent of the value of these companies lies in their brands and other marketing-based intangibles. (Note, however,that if a company has hyped its shares – such as Enron – the share price may not be backed by assets, tangible orintangible.) Companies whose goal is maximising shareholder value need a framework for placing the developmentand management of marketing assets at the centre of their planning processes. It is these marketing assets – brands,market knowledge and customer and partner relationships – that have become the key generators of long-termprofits in today’s information age.
MARKETING’S NEW OPPORTUNITY
Shareholder value analysis has become the new standard because of increasing realisation of the defects ofconventional accounting. As we shall see, accounting profits encourage an excessively short-term view of business.They also encourage an under-investment in information-based assets – staff, brands, and customer and supplierrelationships. In today’s information age, the accounting focus only on tangible assets makes little sense now thatthese intangible assets are the overwhelming source of value creation. Shareholder value analysis (SVA) can avoidboth these biases. But to achieve its potential, SVA needs marketing. Similarly, marketing needs SVA if it is to makea real contribution to strategy.
SHAREHOLDER VALUE NEEDS MARKETING
SVA is tautological without a marketing strategy. The shareholder value principle is that a business should berun to maximise the return on the shareholders’ investment. SVA provides a tool for calculating the shareholdervalue added from any given growth, profit and investments projections. But what drives these growth, profit andinvestment requirements is outside the financial model. SVA does not address how managers can develop strategiesthat can accelerate growth, increase profit margins and lever investments. These are the objectives of marketingstrategy. For example, returning to the earlier airline problem, SVA was able to identify which of the three strategiespresented was best, but developing the innovative dual-branding plan came solely from an understanding of themarket dynamics and a creative approach to serving different customer segments.
The heart of SVA is that economic value is created only when the business earns a return on investment thatexceeds its cost of capital. From economic theory we know that in competitive markets this will only occur when ithas a differential advantage in cost or product superiority. Without a unique advantage, competition will drive profitsdown to the cost of capital. Creating shareholder value is then essentially about building a sustainable competitiveadvantage – a reason why customers should consistently prefer to buy from one company rather than others.Marketing provides the tools for creating this competitive advantage. These are frameworks for researching andanalysing customer needs, techniques for competitive analysis, and systems for measuring and enhancing consumerpreference. Effective marketing input allows SVA to be dynamic and growth-orientated. Without it, SVA is static,merely focusing on ways of reducing costs and assets to produce a temporary fillip to cash flow.
The inputs to the SVA model are largely estimates about marketing variables. Key inputs are future sales volumesand prices. The other inputs are costs, investments and the cost of capital. Each of these variables depends on careful
MARKETING’S NEW OPPORTUNITY 21
analysis and projections of the market. As with all models, the lesson is ‘garbage in, garbage out’. Poor judgementsabout the future behaviour of customers and competitors will make worthless any conclusions from SVA.
SVA only deals with the latter stages of strategic planning. Any decision problem has four steps: (1) perceiving aneed to change, (2) identifying alternative courses of action, (3) evaluating the options and (4) making the choice.SVA only provides answers for the last two steps. It does not provide for the continuing analysis of the firm’smarkets and technologies that is needed to alert management to emerging problems and opportunities. Nor doesit suggest alternative strategies – these have to be discovered elsewhere. For example, SVA is not going to alertmanagement to identify great new product or distribution ideas. These are most likely to be generated by staff whoare close to customers. Just as marketing needs to be augmented to include developments in finance, so financeneeds to be extended and broadened to include developments in marketing.
MARKETING NEEDS SHAREHOLDER VALUE
SVA is a great opportunity for marketing professionals. Traditional accounting, by focusing on short-term profitsand ignoring intangible assets, marginalises marketing. In contrast, SVA can bring to the fore the real value driversin today’s globally competitive markets. First, SVA roots marketing in a central role in the board-room process ofstrategy formulation. The language of the modern board is finance. Actions have to be justified in terms of theirability to increase the financial value of the business. In the past marketing has not been able to measure andcommunicate to other disciplines the financial value created by marketing activities. This has resulted in marketingprofessionals being undervalued and sidelined. SVA offers marketing a direct way to show how marketing strategiesincrease the value of the firm. It provides the framework and language for integrating marketing more effectivelywith the other functions in the business.
Second, SVA provides marketing with a stronger theoretical base. Traditionally, marketing has tended to seeincreasing customer loyalty and market share as ends in themselves. But today, top management requires thatmarketing view its ultimate purpose as contributing to increasing shareholder value. No longer can marketers affordto rely on the untested assumption that increases in customer satisfaction and share will translate automatically intohigher financial performance. This dilemma suggests a reformulation of the marketing discipline as about developingand managing intangible assets – customer and channel relationships and brands – to maximise economic value.[14]
We call this value-based marketing. This view of marketing is theoretically appealing and also places marketingactivities in a pivotal role in the strategy formulation process.
Third, SVA encourages profitable marketing investments. Conventional accounting has treated marketing expen-ditures as costs rather than investments in intangible assets. Because the long-term profit streams generated bysuch investments are ignored, marketing in many businesses is underfunded. SVA, however, is future-orientated; itencourages the long-term effects of marketing expenditures to be explicitly estimated. Brand-building investmentsthat would be discouraged under conventional accounting procedures because they reduce current profits areshown as value-creating under SVA.
Finally, SVA penalises arbitrary cuts in marketing budgets. Management have found marketing budgets an easy targetwhen they need to improve short-term profits. For example, cutting brand support will normally boost profitabilitywithout significantly affecting sales in the short run. The fact that such policies invariably lead to longer-term erosion
22 MARKETING AND SHAREHOLDER VALUE
in market share and price premiums has been ignored. SVA gives marketing management the tool to demonstratethat these short-term cuts destroy rather than build value. Informed shareholders are likely to react to ad hoc cutsin brand support by reducing the market value of the company.
THE SHAREHOLDER VALUE PRINCIPLE
In the past fifteen years or so more and more leading companies have shifted to adopt shareholder value asthe criterion for evaluating strategies and the performance of their managers. This criterion asserts that businessstrategies should be judged by the economic returns they generate for shareholders, as measured by dividends andincreases in the company’s share price.
Companies that adopt the shareholder value approach accept two assumptions drawn from modern financialtheory.[15] The first is that the primary obligation of managers is to maximise the returns for ordinary shareholdersof the business. Managers are agents whose task is to act in the interests of the principals – the shareholders withfinancial ownership rights over the business. The second assumption is about how this is achieved in practice. Thisstates that the stock market value of the company’s shares is based on investors’ expectations of the cash-generatingabilities of the business. This then leads to the definition of the task of management as about developing strategiesthat maximise the value of these cash flows over time. A company generates cash, i.e. creates value, when its salesexceed its costs (including capital costs).
SVA calculates the total value of a strategy by discounting these cash flows. Discounting reflects that money has atime value. Because cash can earn interest, cash received today is worth more than the same amount received ayear or more in the future. Discounting also allows for risk. To take greater risks, investors demand the promise ofhigher returns. Risk is reflected in the cost of capital used in the discounting formula. The idea of discounting cashflows (DCF) is not new; indeed, it has been the standard for evaluating capital projects for years. But it was notuntil the 1980s that firms began seriously using DCF for broader strategic planning purposes. It then began to beconsidered for evaluating marketing strategies.
SVA seeks to identify those strategies that create shareholder value. The stock market’s judgement on the expectedfinancial performance of a company is reflected in its market-to-book ratio (see Figure 1.5). If the market value ofthe shares exceeds the book value of the firm, it has created value. This ratio is a useful insight for measuring howsuccessful management has been in maximising shareholder value.
To evaluate a new strategy proposed by the management team, the future effects of this strategy must be separatedfrom the results of past strategies and investments. The current share price reflects both the values derived fromthese past decisions as well as shareholders’ expectations about what the current management team will do. Tojudge the current strategy we need to focus on the incremental effect on shareholder value. The essence of theshareholder value approach is that managers create value when their strategy generates a greater economic returnthan their cost of capital. The cost of capital is what investors would expect to earn if they invested the funds ontheir own, in businesses with a similar degree of risk.
WHY SHAREHOLDER VALUE?
The spread of value-based management and SVA has been triggered by the changes brought in by the informationage. One is the enormous growth of equity markets around the world caused by economic expansion and the

CHALLENGES TO SHAREHOLDER VALUE 23
declining role of government investment in industry. While government investment is motivated by complex politicalconcerns, the objectives of private equity investors are much simpler and clearer. Private investors expect thepension, insurance and mutual funds that invest their money to maximise their performance. This in turn causes thefund managers to increasingly demand value from the companies they invest in.
The modern shareholder value movement started in the USA and the UK but, with the globalisation of trade andcapital flows, it is sweeping into other major countries. Companies are now competing internationally not only forcustomers but also for capital. The most important criterion for attracting equity capital is its expected economicreturn. The information revolution is also making markets more efficient. Computers and modelling software makeit much quicker to run SVA methodology and test the implications of a company’s strategic thinking. The quantityand quality of information available to investors have also increased exponentially in recent years. Finally, thesophistication of modern telecommunications means that money can now travel around the world in seconds. Allthese trends mean that managers have come under increasing scrutiny from the people whose money they are using.
Companies that do not manage for value find capital more difficult and costly to obtain, handicapping theirgrowth potential. They also become vulnerable more quickly. Non-executive shareholders and fund managers havebecome notably more proactive in removing top management when they fail to create value for shareholders. Thehigh-profile collapse of once well-regarded companies such as Enron and WorldCom and the dot.com implosionin the early part of the century have made them even more vigilant. Finally, acquisition is a potent threat. Whena weak market-to-book ratio indicates a ‘value gap’, i.e. a difference between the value of the company if it wereoperated to maximise shareholder value and its current value, an invitation appears for an acquirer to bid for it andreplace the existing management.
CHALLENGES TO SHAREHOLDER VALUE
Recall that value-based planning is based on two premises: one is the philosophical assertion that the primaryobjective of managers is to maximise the returns for shareholders; the other is the technical assumption thatthe market value of the company is based on investors’ expectations of discounted future cash flows. The latterassumption will be explored in Chapter 2, when the more technical aspects of SVA are presented. Here therationale of the first premise is discussed.
Many writers have pointed out that a company has social and environmental responsibilities and that shareholdersare not the only stakeholders in the business.[16] It is argued that in seeking to maximise shareholder value managersignore these social responsibilities and fail to balance the different stakeholder interests. That these stakeholdersmay have interests which conflict with those of shareholders is clear. It is also true that they often have longer-termrelationships with the company than its shareholders. Today’s shareholders are normally financial investors ratherthan individuals with emotional and long-term personal ties to the business. These other stakeholders fall into thefollowing groups:
❍ Employees. The legitimacy of the claims of employees lies in the long-term commitment many of themmake to the firm. In today’s information age companies, their special skills also represent intangible assetsthat are generally more important in creating value than the traditional balance-sheet items. Theobjectives of employees are normally a combination of employment security, compensation and jobsatisfaction. Each of these, but particularly security, can conflict sharply with a strategy based onmaximising shareholder value. In rapidly changing markets, value-based management will unfortunatelyoften dictate closure or disposals of businesses.
24 MARKETING AND SHAREHOLDER VALUE
❍ Managers. The separation of ownership and control in the twentieth century increased the ability of topmanagers to pursue interests that were not aligned to those of shareholders. Managers have often seengrowth and short-term profits as more closely linked to personal rewards in terms of salaries and prestigethan shareholder value. Managers too are typically more risk averse in searching for opportunities thanshareholders would wish. If the company invests in a risky project, shareholders can always balance the riskby portfolio diversification. Managers, however, have their jobs on the line, and so are hurt more by failure.
❍ Customers. Without customer value there can be no shareholder value. Even the most focused financialmanager understands that the source of a company’s long-term cash flow is its satisfied customers. Manymanagers, especially those with a marketing background, have therefore gone on to argue thatmaximising customer satisfaction should be the primary goal. The problem is that providing customersatisfaction does not automatically lead to shareholder value. Delighting customers with lower prices thancompetitors or superior quality and features cannot provide a sustainable advantage if the cost ofdelivering all this (including the cost of capital) exceeds the price they are paying. The unconstrainedmaximisation of customer satisfaction certainly conflicts with a shareholder value orientation.
❍ Suppliers. Today’s virtually integrated companies are clearly dependent upon the cooperation andcommitment of their network of suppliers. Competition has moved on from competition between individualcompanies to competition between networks. Suppliers in these networks want long-term security,predictability and satisfactory margins. Again, value management in today’s volatile markets will mean thatthe firm cannot guarantee these relationships. Changing technologies, evolving consumer needs and newsources of supply will bring conflicts between the aspirations of traditional suppliers for stability and theambitions of shareholders for value.
❍ Community. The local and national communities where the firm is located will also have interests in thefirm’s behaviour. Social responsibilities can be divided into those arising from what the firm does to thesociety, and what it can do for it. The former are the negative impacts – pollution and environmentaldamage – which arise as by-products of the firm’s activities, and which communities increasingly wantstopped. The latter are tasks which communities often want businesses to take on, such as preservingemployment, helping minorities or improving schooling. Social impacts are caused by, and are theresponsibility of, the firm. Social problems, on the other hand, are dysfunctions of society. Acceptingresponsibility for these social problems can bring sharp conflicts with the goal of maximising shareholdervalue.
There are a number of objections to the claims made by advocates of corporate social responsibility and theinterests of alternative stakeholders. The most fundamental is that social responsibilities are not the job of business.In a market-based economy that recognises the rights of private property, the only social responsibility of businessis to create shareholder value, and to do so legally and with integrity. Managers have neither the expertise nor thepolitical legitimacy to decide what is in the public interest. Such choices in our society are the function of electedgovernments. If the government is unwilling to ask voters to bear the costs of its social goals, why should a companyask its customers, employees and shareholders to pay through higher prices, lower wages or reduced returns?
Fortunately, there are strong market incentives for value-maximising firms to take into account other stakeholderinterests. Crucial is the need to attract, retain and motivate the new ‘knowledge workers’ whose specialist skillsand efforts determine the firm’s ultimate competitiveness.[17] Shareholder interest dictates that the firm offerscompetitive salaries and safe and attractive working conditions. Similarly, it would be suicidal in today’s competitivemarkets not to be dedicated to satisfying customers. Investing in market research, new product development, qualityand customer service are central to value management. Sustainability in its broadest sense is also a major concern.
CHALLENGES TO SHAREHOLDER VALUE 25
However, when top management eschews shareholder value as the primary goal in favour of ‘balancing the interestsof stakeholders’ the company’s strategy loses clarity and focus (see box, ‘Getting the Stakeholder Balance Right’).
Management can be lured into making investments for reasons of prestige or public relations. They hold on tobusiness units that have no chance of generating economic returns or go on to make ill-considered diversifications.When this occurs a ‘value gap’ begins to emerge, eventually precipitating a takeover, with all the unpleasantconsequences for employees, managers and the community.
Getting the Stakeholder Balance Right
For his book, The Committed Enterprise, Hugh Davidson carried out in-depth interviews with 125 leaders ofhigh-calibre organisations in for-profit as well as in not-for-profit organisations in Europe and the USA. He foundthat long-term successful organisations actively aligned their stakeholders. He quotes a typical CEO comment: ‘Toachieve value for shareholders, you must have very satisfied customers and employees’ and notes robust linkagesare increasingly being established between customer commitment, employee motivation and shareholder value. Tomanage what can be conflicting stakeholder needs, however, organisational leaders need to unite then throughstrong vision and value and recognise how they are changing. He found that the long-term successful organisationswere committed from post room to board room to assuring the alignment of stakeholder values and had embeddedprocesses for this purpose.
Hugh Davidson, The Committed Enterprise, Butterworth-Heinemann, 2006 (second reprint).
In the long term, shareholder value is the best strategy for all stakeholders. Ultimately all their claims depend onthe firm’s ability to generate sufficient cash to meet them. This in turn depends on the firm’s competitiveness. Theshare price reflects the firm’s competitiveness. The market value of a company is based on the most informedestimates of its ability to create a competitive advantage and to achieve profitable growth in its markets. Goalswhich undermine this focus increase costs, misallocate investment and reduce the ability of the firm to compete.While in the short run, employees or managers might be better off, in today’s global markets, the non-optimal useof resources is not sustainable, as will become evident in the firm’s declining profits and growth performance. Allstakeholders are vulnerable when managements fail to create shareholder value.
Many critics of value management forget who shareholders are. Often they are demonised as a small group ofwealthy, self-serving individuals set apart from ordinary people. Certainly for the USA and the UK, nothing couldbe further from the truth. One in three households owns shares directly or through unit trusts in the UK, rathermore in the USA. But virtually every household owns shares indirectly through pension funds and other institutionalsavings. These institutions own 50 per cent of all shares in the USA and 80 per cent in the UK and Japan. Almosteveryone now is affected by the market value of shares. Losses, whether due to poor management or incurred inthe pursuit of other stakeholder interests, come out of the pockets of employees, pensioners and other individualswith savings. As governments around the world shift pension and social security provision from the public sectorto individuals, shareholders become even more ‘us’ rather than ‘them’. Self-interest increasingly pressures businessexecutives and fund managers to maximise shareholder value.
There are two other fundamental and related criticisms of the shareholder value objective. The first is that it doesnot motivate staff to achieve high performance. The second criticism is that it is not operational – it does not tellemployees and managers what to do at a practical level. There are several reasons why maximising shareholder

26 MARKETING AND SHAREHOLDER VALUE
value may not be aspirational. One is that few of the staff will normally be significant shareholders themselves.Another is that they cannot see a direct link between their own specific jobs and the share prices of the companyas a whole. Third, share prices often move as a result of macroeconomic factors and market forces unrelated to theperformance of management.
Operationally, the problem is that, as noted earlier, while value-based management provides a criterion for strategiesto be selected and evaluated, it does not say how these strategies can be constructed. Before a strategy can beput forward for SVA, a method for identifying the need for strategic change must exist. Then there must be aprocess of constructing strategic options that have prospects of creating competitive advantage and enabling thebusiness to generate cash flows that exceed costs including the cost of capital. If these two prior processes arenot well understood SVA can easily become over-focused on downsizing – getting rid of non-performing businessunits – rather than on exploiting growth opportunities.
To motivate staff and operationalise SVA, managements need a deep understanding of what the value drivers ofthe business will be in the future. This is why value management should not be thought of as a financial technique:it depends on all the knowledge and skills within the firm. This understanding can be called a theory of the business.It is a set of assumptions about what operations will be necessary for the firm to build and sustain a competitiveadvantage in the industry. These assumptions fall under five headings (Figure 1.6). The first is called the environmental
Environmental analysis: 1. What are the key market and technological changes? 2. What opportunities and problems do they present?
Shareholder returns:dividends, capital gains
Shareholder value analysis:discounted operational cash flows
Market analysis: Identifying opportunities
Analysing needs and wants Competitor analysis
Operations analysis: Managing the value chain
Building supply chains Achieving speed and reponsiveness
Budgeting model Performance measures
Financial ratios Targets
Organisational model: vision, skills, motivation, systems, structures
Figure 1.6 Shareholder Returns and the Theory of Business

ACCOUNTING-BASED PERFORMANCE MEASURES 27
assessment. It reflects management’s analysis of those key developments in the global economy, technology, changingindustrial structures and customer expectations that will shape its markets in the future. Changes in this environmentshould be the triggers that alert managers to the need to reformulate their own business strategy and capabilityrequirements.
The second set of assumptions is contained in the firm’s marketing model. This contains managers’ analysis of whichcustomers the firm can most profitably target and knowledge about what their wants are. It also contains the analysisof the competition: what strategies competitors are likely to follow, what their strengths and weaknesses are, andwhat capabilities are needed to create a competitive advantage. Next is the operations model, which contains theanalysis of the best way to structure the firm’s value chain to produce and deliver products and service to customers.Then comes the budgeting model which contains the key financial ratios management will use to monitor marketingand operations performance. Finally, and of vital importance, is the organisation model, which puts together people,leadership, vision and the skills to implement the strategy.
It is only with such a theory of the business that managers can use shareholder value to generate successful growthstrategies. And, in an era of low inflation and relatively low overall GNP growth, it is only those companies that canachieve consistent growth that will create substantial increases in shareholder value. A well-grounded understandingof the fundamental value generators also allows managers to overcome the motivational and operational limitationsof SVA. It can assign objectives, tasks and resources to measures of marketing, operations and financial performancethat automatically lead to increases in shareholder value.
ACCOUNTING-BASED PERFORMANCE MEASURES
PROBLEMS WITH EARNINGS
In spite of the acceptance, in principle, that the task of management is to maximise returns for shareholders, mostcompanies and fund managers still have not adopted value-based management. Accounting earnings rather thancash flows still form the basis for evaluating performance and valuing businesses. The financial press and analysts’reports consistently focus on short-term earnings, earnings per share and price earnings ratios. Despite the clearcontrary evidence, the belief still persists that good earnings growth will lead to a parallel growth in the marketvalue of the company’s shares. Similarly, managers erroneously believe that if they concentrate on improving returnon investment (earnings divided by assets) and return on equity (earnings divided by the book value of shareholderfunds), the share price will automatically follow.
There are four reasons why earnings are a poor measure of performance compared to changes in shareholdervalue. First, unlike cash flow, which underpins SVA, accounting earnings are arbitrary and easily manipulated bymanagement. Different, equally acceptable, accounting methods lead to quite different earnings figures. Prominentexamples include alternative ways to compute the cost of goods sold (LIFO versus FIFO), different methods ofdepreciating assets, and the various choices in accounting for mergers and acquisitions. Different countries havedifferent accounting regulations too, so international companies are frequently quoting different earnings on differentstock markets. Not surprisingly, the flexibility of reporting procedures gives management ample opportunity tomanipulate reported earnings for their own purposes – opportunities which are commonly taken.[18] But howevermanagers choose to report profits, none of their manipulations or adjustments have any effect on the company’scash flow or economic value. While profits are an opinion, cash is a fact.
28 MARKETING AND SHAREHOLDER VALUE
The second problem with accounting profits is that, unlike cash flow, they exclude investments. A growing businesswill invariably have to invest more in working and fixed capital, so that it could easily have positive earnings, but cashcould be draining away. On the other hand, depreciation is deducted in the calculation of earnings even though itdoes not involve any cash outlay. So for a mature business with assets still being depreciated, earnings could wellunderstate cash flows.
Third, earnings ignore the time value of money. This means that even consistent earnings growth can reduceshareholder returns. The economic value of any investment is the discounted value of the anticipated cash flows.The discounting procedure recognises that money has a time value – money today is worth more to investors thana money return tomorrow. Consequently, shareholder value will increase only if the company earns a return onthe new investment which exceeds the cost of capital used in the discounting process. Taking a simple example,suppose a company has current earnings (and cash flow) of £20 million and a cost of capital of 10 per cent. Itdecides to invest £25 million to increase the future levels of earnings by 10 per cent. Unfortunately, while profitsand cash flow rise by an agreeable £2 million, the shareholder value of the company falls. This is because whenthe increased annual cash flow is discounted, it is valued at only £20 million, or £5 million less than the originalinvestment. Shareholders could have done better investing the money themselves elsewhere.
Finally, and perhaps most crucial from a strategic viewpoint, profits produce a short-term managerial focus. Risingearnings can easily disguise a decline in shareholder value because earnings ignore the future implications of currentactivities. For example, earnings can quickly be boosted by cutting advertising or customer service levels. In theshort run this is beneficial, but in the long run it will erode the company’s market share, future earnings andshareholder value. Similarly, many activities that lower short-term earnings such as investing in brands and buildingcustomer relationships can increase long-term cash flows and shareholder value. The focus on short-term earningsdiscourages growth-orientated strategies that increase long-term competitiveness and shareholder value. Taking allthese problems into account, it is not surprising that there is little or no statistical correlation between earnings pershare growth and total shareholder return as measured by dividends and share price appreciation.
PROBLEMS WITH RETURN ON INVESTMENT
Seeking to link earnings to levels of investment, managers routinely measure performance by looking at return onassets (ROA) and return on equity (ROE). The former tends to be used at the business unit level, the latter atthe corporate level. Unfortunately, since both use earnings in the numerator, they are subject to all the previousweaknesses, plus some additional ones.
The main new problem is that assets are valued in an equally arbitrary way to earnings. Different, but equallyvalid, depreciation procedures or capitalisation policies, will lead to different valuations of both assets and equity.With today’s information-age companies the implications of the capitalisation problem are striking. The growingimportance of knowledge-based companies makes intangible assets far larger than physical assets. But these intangibleassets such as brand names, patents, R&D, training and customer loyalty, do not normally appear on the balancesheet. One implication is that it is impossible to use ROA or ROE to evaluate different types of company. Forexample, pharmaceutical companies and businesses with strong brands would have higher ROAs than traditionalmanufacturing businesses even if their economic returns were identical, because the assets of the former do notappear in the denominator. As companies gradually invest more in knowledge and less in physical assets, it alsomakes comparing a company’s ROA overtime a dubious indication of performance.
THE CHANGING ROLE OF MARKETING 29
Studies show that ROA generally overstates the true return on investment.[19] The bias is greater for maturecompanies. Mature companies will often have higher ROAs than growth companies because depreciation policiesand inflation will have tended to lower the net book value of their assets. Such figures then often deter managementfrom moving away from declining businesses because they wrongly believe that ROA is correlated with value. Onlywhen SVA is conducted using estimates of future cash flows can it be seen that the growth businesses are oftenimmensely more valuable, and that there is often an inverse correlation between ROA and shareholder value added.
Turning to return on equity, this has all the above problems plus another one. ROE is calculated as ROA factoredby gearing – the proportion of assets financed by debt rather than equity. Provided that it earns more than thecost of borrowing, more debt increases the ROE. Even if the amount of debt exceeds the optimal level, furtherborrowings increase ROE even while the value of the company declines due to increased financial risk.
The Problems with Return on Capital
Many fashionable techniques for judging corporate performance are variations of return on capital. While admirablein theory, all suffer from the weakness that, to calculate a return, one first needs to know the value of a company’sassets, and historic book values are often irrelevant. Hence, one sees elaborate adjustments: goodwill write-offs andaccumulated depreciation may be added back, the replacement cost of assets can be used or the price originallypaid can be adjusted in line with inflation. All the wizardry is fair enough. But it can come at the expense ofclear thinking about how to use return on capital in assessing performance . . . Such adjustments can simply divertattention from the fact that return on capital employed is not a useful measure for judging operating performance.
Source: The Lex column, Financial Times, 2 January 1997.
Managers and analysts use accounting earnings presumably because they are easy to calculate. But earnings, and allthe various valuation measures (P-E ratios, EPS) and performance standards (ROI, ROA, ROE) which utilise them,are subject to fundamental practical, conceptual and empirical weaknesses (see box, ‘The Problems with Returnon Capital’). Practically their measurement is arbitrary and subjective. Conceptually they are inappropriate becausethey do not measure changes in value. Earnings are the result of past decisions; value changes are based on futurecash flows. Empirically, earnings-based measures do not predict changes in the returns accruing to shareholders.Shareholder value analysis works because it overcomes all three weaknesses. It is fact-based, conceptually robust andhighly predictive of actual changes in the market value of businesses. And, unlike accounting numbers, shareholdervalue calculations are unaffected by the shift from industrial companies to knowledge-based companies built aroundintangible assets.
THE CHANGING ROLE OF MARKETING
The centrality of marketing in creating growth and shareholder value suggests a new role for marketing both asa discipline and a function (Table 1.1). Traditionally, marketing has been seen as about satisfying the needs ofcustomers more effectively than competitors. The assumption has been that if the company satisfied its customersand won market share, positive financial results would automatically follow. Unfortunately, top management knows

30 MARKETING AND SHAREHOLDER VALUE
Table 1.1 The Changing Role of Marketing
Past Today
Objective of marketing Create customer value Create shareholder value
Marketing strategy Increase market share Develop and manage marketing assets
Assumptions Positive market performance leads topositive financial performance
Marketing strategies need to be tested invalue terms
Contribution Knowledge of customers, competitorsand channels
Knowledge of how to lever marketing toincrease shareholder value
Focus of marketing Marketing orientation General management
Skills of marketing Specialist Specialist + general
Advocacy Importance of understanding customers Marketing’s role in creating shareholdervalue
Concept of assets Tangible Intangible
Rationale Improves profits Increases shareholder value
Performance measures Market share, customer satisfaction,return on sales and positive cash flow
Shareholder value: discounted cash flows
that this is not necessarily true. Marketing expenditures, like any other resources, can be wasted, and satisfiedcustomers are not necessarily profitable ones. The concept of marketing that will make it more effective in today’sboard room is one of contributing to the creation of shareholder value. It can be defined as follows:
Marketing is the management process that seeks to maximise returns to shareholders by developing relationships withvalued customers and creating a competitive advantage.
This new concept of marketing shifts it from being a specialist activity to an integral part of the general managementprocess. Where in the past marketing managers were seen as experts on customers, channels and competitors,today they should be seen as experts on how marketing and growth can increase shareholder value. To do this,marketers need to extend their skill base to add expertise in modern financial planning techniques. In the past,marketers have often allowed themselves to be trapped by accounting-orientated management into seeking tojustify their marketing strategies in terms of improving immediate earnings. Such a short-term approach is invariablydestructive because marketing is primarily about creating and managing assets. Investments in brands and customerrelationships – like research and development – rarely pay off in the period in which they occur. They are made togenerate and defend cash flows, often for many years ahead. Familiarity with shareholder value analysis has becomean essential tool for demonstrating that marketing produces an economic return.
TECHNOLOGY AND THE RESHAPING OF MARKETING
Marketing, like other business disciplines, has to adapt to changing technology. Indeed, the history of marketing canbe viewed as a stepwise evolution to a changing technological environment. Over the past century there havebeen three changes in the orientation of marketing: distribution, selling and brand management. The Internet isconsolidating the fourth stage of marketing’s evolution: marketing as managing individual relationships with customers.
THE CHANGING ROLE OF MARKETING 31
MARKETING AS DISTRIBUTION
At the beginning of the twentieth century, when marketing began to emerge as a subject of interest, technology wasstill shaped by the industrial revolution. The companies that succeeded were those that could lever vast amountsof capital to build huge factories that employed mass production techniques turning out standardised products intheir millions. Companies that perfected this technology, like Ford, General Motors, Westinghouse and ICI, becamethe giants of the era. The mass production of standardised products resulted in scale economies that allowed thesecompanies to offer cheap products that small craft-based businesses producing customised products could not match.
In his marketing textbook, Kotler called this business focus the production concept.[20]
The production concept holds that consumers will favor those products that are widely available and low in cost. Managersof production-oriented organizations concentrate on achieving high production efficiency and wide distribution coverage.
In this era, the task of marketing was to arrange distribution to enable the products to be shipped to as broad amarket as possible. It involved logistics and supply chain management, dealing with suppliers and creating an effectivechannel to get the goods to the consumer.
MARKETING AS SELLING
In the post-War years the problem began to change. Advances in production technology and the industrialisationof the developing countries began to make mass production too successful. Increasing production capacity led togreater competition and declining prices and profit margins. In addition, rising income levels led to customers wantingmore than just basic, standardised products. At this stage the priority of firms began to shift from production toselling. Kotler defined this business focus as the selling concept.
The selling concept holds that consumers and businesses, if left alone, will ordinarily not buy enough of the organization’sproducts. The organization must, therefore, undertake an aggressive selling and promotions effort.
In this period, the role of marketing was to organise this aggressive selling effort. Advertising and selling techniquesbecame powerful tools for increasing the appeal of the company’s products.
MARKETING AS BRAND MANAGEMENT
During the 1960s, there was an increasing appreciation that a better way of growing the business was not relying onincreasingly aggressive and expensive selling and advertising, but instead researching what customers really wanted.The focus began to shift from ‘selling what the company produced’ to ‘producing what the customer wanted’. Thisled on to the era of branding. Here companies researched the market, grouped customers into market segmentssharing similar needs, and designed and positioned brands to these segments. Such companies as Procter & Gambleand Unilever professionalised this brand management concept.
The brand management concept holds that the key to meeting its organizational goals consists of the company beingmore effective than competitors in developing brands that create, deliver, and communicate customer value to its chosentarget market segments.
32 MARKETING AND SHAREHOLDER VALUE
The focus of marketing in this era was on market research, segmentation, positioning and brands. The arrival ofcomputers and the development of databases allowed increasingly sophisticated techniques for tracking and profilingmarkets. Until well into the 1990s this concept represented the state of the art in marketing. Yet the technology atthe time left marketing with one fundamental weakness: most companies had no direct interaction with individualconsumers. A Procter & Gamble brand manager knew nothing about an individual consumer even if it was oneof the company’s most important and loyal users. At most, the manager knew the average needs of a marketsegment – though this could include several million customers. As a result, brands were a compromised solution,which would meet the needs of some customers and not others. At its core, the brand concept retained a productrather than a customer focus.
MARKETING AS MANAGING INDIVIDUAL CUSTOMER RELATIONSHIPS
In the mid-1990s the Internet brought in technologies which promised to overcome these compromises and usherin a new, more powerful marketing concept. It offered the opportunity to efficiently build relationships with individualconsumers that allowed companies to precisely meet their needs with customised products and services. The firstbreakthrough was the opportunity for individual communication and interaction between company and consumerthat the Net offered. This enabled companies to learn about individual needs and to rank customers by importance.Unlike a Procter & Gamble manager, one from Dell or First Direct is armed with detailed information when talkingwith a customer.
The second breakthrough was the emergence of mass customisation, where companies could make individual ratherthan standardised products and services. Again, this was facilitated by Internet technology, which fostered a shiftfrom the inflexible vertically integrated company to the flexible network, or hub-and-spoke organisation. Here, thecustomer’s order over the Internet is immediately transferred to the company’s component suppliers through itsextranet, who begin building the individualised modules. Information technology then coordinates the modules intoa customised product that is quickly despatched.
These new ‘virtually integrated’ companies offer speed, customisation and economies in cost and assets thattraditional companies cannot match. The new marketing concept has been called the individual marketing concept.
The individual marketing concept holds that the key to effective marketing is to use interactive communications to developindividual relationships with consumers based on providing superior value through personalised products and services.
The new marketing concept treats each consumer as unique and aims to match his or her specific requirements.If the company is doing this job well, the consumer will have very little reason to move. Indeed, moving away fromthe relationship will be unattractive because of the switching costs resulting from another company having to learnabout their needs. Individual marketing also enables the firm to acquire detailed information about the value of eachcustomer. The lifetime value of a customer is defined as the discounted net present value of all future cash flowgenerated by dealings with the individual. A company has a portfolio of customers. It is the increase in the value ofthe portfolio that is the best measure of how a company is performing.
Table 1.2 summarises the evolution of marketing to the present concept of building value through individualcustomer relationships.
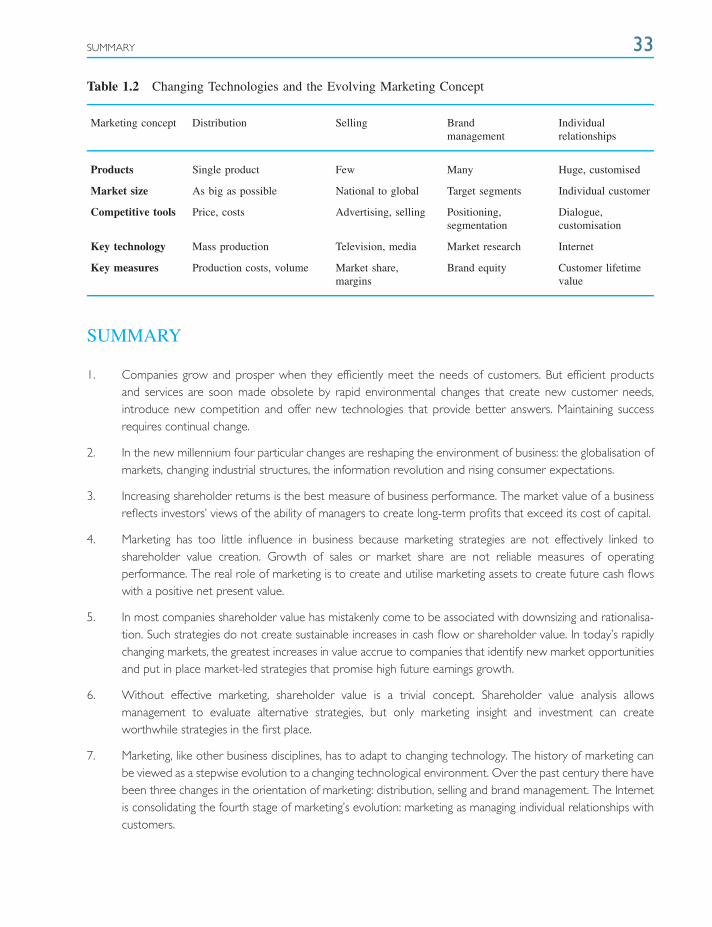
SUMMARY 33
Table 1.2 Changing Technologies and the Evolving Marketing Concept
Marketing concept Distribution Selling Brandmanagement
Individualrelationships
Products Single product Few Many Huge, customised
Market size As big as possible National to global Target segments Individual customer
Competitive tools Price, costs Advertising, selling Positioning,segmentation
Dialogue,customisation
Key technology Mass production Television, media Market research Internet
Key measures Production costs, volume Market share,margins
Brand equity Customer lifetimevalue
SUMMARY
1. Companies grow and prosper when they efficiently meet the needs of customers. But efficient productsand services are soon made obsolete by rapid environmental changes that create new customer needs,introduce new competition and offer new technologies that provide better answers. Maintaining successrequires continual change.
2. In the new millennium four particular changes are reshaping the environment of business: the globalisation ofmarkets, changing industrial structures, the information revolution and rising consumer expectations.
3. Increasing shareholder returns is the best measure of business performance. The market value of a businessreflects investors’ views of the ability of managers to create long-term profits that exceed its cost of capital.
4. Marketing has too little influence in business because marketing strategies are not effectively linked toshareholder value creation. Growth of sales or market share are not reliable measures of operatingperformance. The real role of marketing is to create and utilise marketing assets to create future cash flowswith a positive net present value.
5. In most companies shareholder value has mistakenly come to be associated with downsizing and rationalisa-tion. Such strategies do not create sustainable increases in cash flow or shareholder value. In today’s rapidlychanging markets, the greatest increases in value accrue to companies that identify new market opportunitiesand put in place market-led strategies that promise high future earnings growth.
6. Without effective marketing, shareholder value is a trivial concept. Shareholder value analysis allowsmanagement to evaluate alternative strategies, but only marketing insight and investment can createworthwhile strategies in the first place.
7. Marketing, like other business disciplines, has to adapt to changing technology. The history of marketing canbe viewed as a stepwise evolution to a changing technological environment. Over the past century there havebeen three changes in the orientation of marketing: distribution, selling and brand management. The Internetis consolidating the fourth stage of marketing’s evolution: marketing as managing individual relationships withcustomers.

34 MARKETING AND SHAREHOLDER VALUE
REVIEW QUESTIONS
1. What are the characteristics of the information age, and how do these affect business?2. How does the ‘direct business model’ contrast with the traditional business model?3. What does the market-to-book value ratio indicate?4. How does marketing contribute to a more effective shareholder value orientation?5. What are the weaknesses of traditional, accounting-based measures of performance?6. How can marketing managers use the shareholder value concept?
NOTES ON CHAPTER 1
[1] Arie de Geus, The Living Company, Boston, MA: Harvard Business School Press, 1997.
[2] Andrew Black, Philip Wright and John E. Bachman, In Search of Shareholder Value, London: Pitman, 1998.
[3] See, for example, Jeremy Hope and Tony Hope, Competing in the Third Wave, Boston: Harvard Business SchoolPress, 1997; Peter Drucker, Managing in a Time of Great Change, Harmondsworth: Penguin Books, 1995.
[4] Don Peppers and Martha Rogers, Enterprise One-to-One, New York: Doubleday, 1997.
[5] Joan Magretta, The power of virtual integration: an interview with Dell Computer’s Michael Dell, HarvardBusiness Review, March/April, 1998, 72–85.
[6] The glossary contains a definition of the key financial terms used in the book.
[7] Lowell L. Bryan, Timothy G. Lyons and James Rosenthal, Corporate strategy in a globalizing world: the marketcapitalization imperative, McKinsey Quarterly, no. 3, 1998, 6–19.
[8] Chartered Institute of Marketing, September 2006.
[9] Deloitte, Marketing in 3D, January 2008.
[10] For a timely discussion of this, see Tim Ambler, Marketing and the Bottom Line, 2nd edn, FT/Prentice Hall, 2003.
[11] See Malcolm McDonald, Brian D. Smith and Keith Ward, Marketing Due Diligence, Butterworth-Heinemann,2007.
[12] See Leslie Butterfield (ed.), Excellence in Advertising, Oxford: Butterworth-Heinemann, 1999, pp. 268–271.
[13] David Harding and Sam Rovit, Mastering the Merger, Harvard Business School Press, 2004.
[14] Rajendra K. Srivastava, Tasadduq A. Shervani and Liam Fahey, Market-based assets and shareholder value: aframework for analysis, Journal of Marketing, 62, 1998, 2–18.
[15] Richard A. Brearley and Stewart C. Myers, Principles of Corporate Finance, 4th edn, New York: McGraw-Hill,1999.
[16] Whether directors should focus on anything other than shareholders is much debated. For example, see TimAmbler and Andrea Wilson, The problems of stakeholder theory, Business Ethics, 4 (1 January), 1995. Republishedin Business Law: Principles, Cases and Policies, M. Roszkowski, Harper Collins, 1997.
[17] Peter F. Drucker, Management Challenges for the 21st Century, Oxford: Butterworth Heinemann, 1999,pp. 133–160.

NOTES ON CHAPTER 1 35
[18] Terry Smith, Accounting for Growth: Stripping the Camouflage from Company Accounts, 2nd edn, London: Century,1996.
[19] Alfred Rappaport, Creating Shareholder Value, 2nd edn, New York: Free Press, 1998.
[20] Philip Kotler, Marketing Management, 10th edn, Englewood Cliffs, NJ: Prentice Hall, 2000, pp. 17–20.)
2The Shareholder ValueApproach
‘Of the five business deadly sins, the first and easily the most common is the worship of high profitmargins.’
Peter F. Drucker
INTRODUCTION AND OBJECTIVES
Value-based marketing is not primarily about numbers and making complex calculations. It consists of three mainelements. First, it is a set of beliefs about the objectives of marketing. The basic belief is that the primary task ofmarketing is to develop strategies that will maximise returns for shareholders. Second, it is a set of principles forchoosing marketing strategies and making marketing decisions that are consistent with these beliefs. These principlesare based on estimating the future cash flow associated with a strategy to calculate the shareholder value added.Finally, it is a set of processes that ensure that marketing develops, selects and implements a strategy that is consistentwith these beliefs and principles. These processes concern management of the financial, marketing and organisationalvalue drivers of the business. The financial value drivers are those key ratios that have the most significant impacton shareholder value. The marketing drivers are the customer-orientated plans necessary to drive improvement inthe financial ratios. The organisational value drivers are the core capabilities, systems and leadership styles neededto create and implement the shareholder value orientation in the business.
Chapter 1 explained the belief in value-based marketing. This chapter explores the principles of value-basedmarketing. The remaining chapters examine in detail the processes of building a shareholder value approach andthe significance of marketing and growth.
By the time you have read this chapter, you will be able to:
❍ Describe the principles of shareholder value
❍ Understand how to value different marketing strategies
❍ Identify the financial, marketing and organisational value drivers of the business
❍ Explain how marketing strategies affect shareholder value
❍ Determine whether a growth strategy will increase value
❍ Assess the problems and limitations in operationalising shareholder value analysis
This chapter contains some challenging technical material. The ideas will be unfamiliar to most marketing managers.But there is nothing here that cannot be mastered by anyone willing to spend time on the material. The
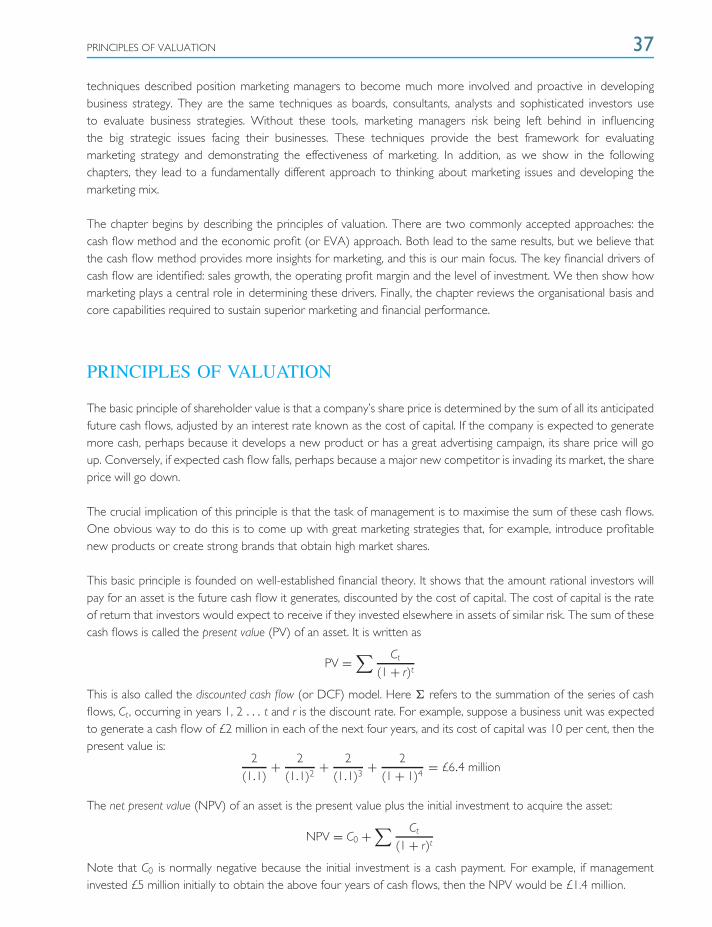
PRINCIPLES OF VALUATION 37
techniques described position marketing managers to become much more involved and proactive in developingbusiness strategy. They are the same techniques as boards, consultants, analysts and sophisticated investors useto evaluate business strategies. Without these tools, marketing managers risk being left behind in influencingthe big strategic issues facing their businesses. These techniques provide the best framework for evaluatingmarketing strategy and demonstrating the effectiveness of marketing. In addition, as we show in the followingchapters, they lead to a fundamentally different approach to thinking about marketing issues and developing themarketing mix.
The chapter begins by describing the principles of valuation. There are two commonly accepted approaches: thecash flow method and the economic profit (or EVA) approach. Both lead to the same results, but we believe thatthe cash flow method provides more insights for marketing, and this is our main focus. The key financial drivers ofcash flow are identified: sales growth, the operating profit margin and the level of investment. We then show howmarketing plays a central role in determining these drivers. Finally, the chapter reviews the organisational basis andcore capabilities required to sustain superior marketing and financial performance.
PRINCIPLES OF VALUATION
The basic principle of shareholder value is that a company’s share price is determined by the sum of all its anticipatedfuture cash flows, adjusted by an interest rate known as the cost of capital. If the company is expected to generatemore cash, perhaps because it develops a new product or has a great advertising campaign, its share price will goup. Conversely, if expected cash flow falls, perhaps because a major new competitor is invading its market, the shareprice will go down.
The crucial implication of this principle is that the task of management is to maximise the sum of these cash flows.One obvious way to do this is to come up with great marketing strategies that, for example, introduce profitablenew products or create strong brands that obtain high market shares.
This basic principle is founded on well-established financial theory. It shows that the amount rational investors willpay for an asset is the future cash flow it generates, discounted by the cost of capital. The cost of capital is the rateof return that investors would expect to receive if they invested elsewhere in assets of similar risk. The sum of thesecash flows is called the present value (PV) of an asset. It is written as
PV =∑ Ct
(1 + r)t
This is also called the discounted cash flow (or DCF) model. Here � refers to the summation of the series of cashflows, Ct , occurring in years 1, 2 . . . t and r is the discount rate. For example, suppose a business unit was expectedto generate a cash flow of £2 million in each of the next four years, and its cost of capital was 10 per cent, then thepresent value is:
2(1.1)
+ 2(1.1)2
+ 2(1.1)3
+ 2(1 + 1)4
= £6.4 million
The net present value (NPV) of an asset is the present value plus the initial investment to acquire the asset:
NPV = C0 +∑ Ct
(1 + r)t
Note that C0 is normally negative because the initial investment is a cash payment. For example, if managementinvested £5 million initially to obtain the above four years of cash flows, then the NPV would be £1.4 million.
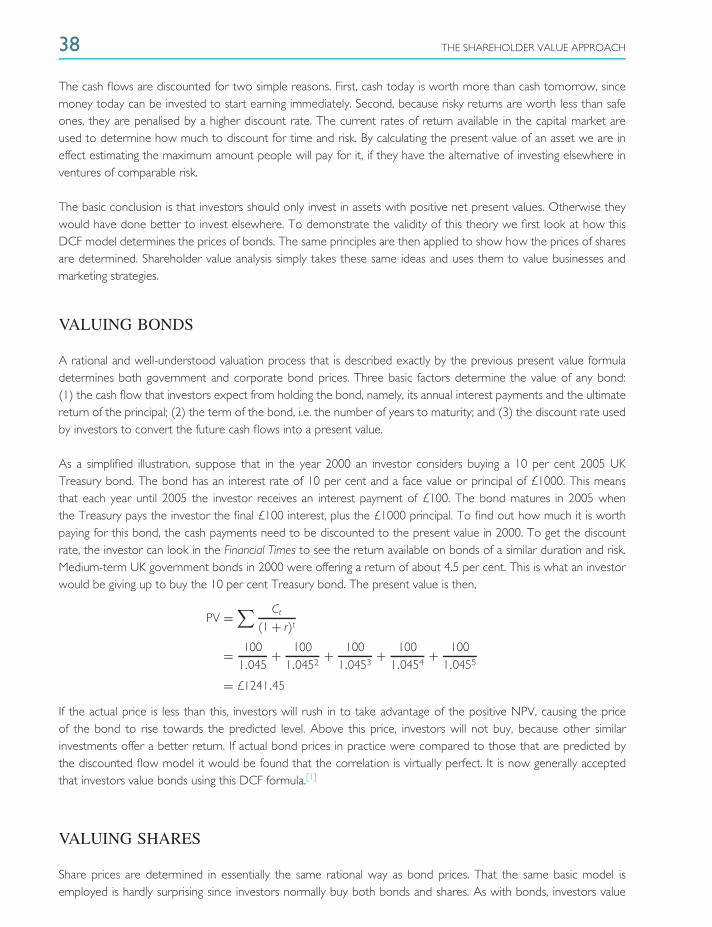
38 THE SHAREHOLDER VALUE APPROACH
The cash flows are discounted for two simple reasons. First, cash today is worth more than cash tomorrow, sincemoney today can be invested to start earning immediately. Second, because risky returns are worth less than safeones, they are penalised by a higher discount rate. The current rates of return available in the capital market areused to determine how much to discount for time and risk. By calculating the present value of an asset we are ineffect estimating the maximum amount people will pay for it, if they have the alternative of investing elsewhere inventures of comparable risk.
The basic conclusion is that investors should only invest in assets with positive net present values. Otherwise theywould have done better to invest elsewhere. To demonstrate the validity of this theory we first look at how thisDCF model determines the prices of bonds. The same principles are then applied to show how the prices of sharesare determined. Shareholder value analysis simply takes these same ideas and uses them to value businesses andmarketing strategies.
VALUING BONDS
A rational and well-understood valuation process that is described exactly by the previous present value formuladetermines both government and corporate bond prices. Three basic factors determine the value of any bond:(1) the cash flow that investors expect from holding the bond, namely, its annual interest payments and the ultimatereturn of the principal; (2) the term of the bond, i.e. the number of years to maturity; and (3) the discount rate usedby investors to convert the future cash flows into a present value.
As a simplified illustration, suppose that in the year 2000 an investor considers buying a 10 per cent 2005 UKTreasury bond. The bond has an interest rate of 10 per cent and a face value or principal of £1000. This meansthat each year until 2005 the investor receives an interest payment of £100. The bond matures in 2005 whenthe Treasury pays the investor the final £100 interest, plus the £1000 principal. To find out how much it is worthpaying for this bond, the cash payments need to be discounted to the present value in 2000. To get the discountrate, the investor can look in the Financial Times to see the return available on bonds of a similar duration and risk.Medium-term UK government bonds in 2000 were offering a return of about 4.5 per cent. This is what an investorwould be giving up to buy the 10 per cent Treasury bond. The present value is then,
PV =∑ Ct
(1 + r)t
= 1001.045
+ 1001.0452
+ 1001.0453
+ 1001.0454
+ 1001.0455
= £1241.45
If the actual price is less than this, investors will rush in to take advantage of the positive NPV, causing the priceof the bond to rise towards the predicted level. Above this price, investors will not buy, because other similarinvestments offer a better return. If actual bond prices in practice were compared to those that are predicted bythe discounted flow model it would be found that the correlation is virtually perfect. It is now generally acceptedthat investors value bonds using this DCF formula.[1]
VALUING SHARES
Share prices are determined in essentially the same rational way as bond prices. That the same basic model isemployed is hardly surprising since investors normally buy both bonds and shares. As with bonds, investors value

PRINCIPLES OF VALUATION 39
shares by discounting expected future cash flows. However, with shares there are three important differences thatmake estimating the price people should pay more complicated.
First, bonds have a legal obligation to pay a specified amount of cash in the future. Ordinary shares carry no suchobligation – the amount they can pay depends on how well the business does. Consequently, the cash flows theyoffer investors have to be estimated. If the company is not issuing or repurchasing its shares, the cash paid toinvestors is the dividend. Hence the discounted cash flow model applied to shares is called the dividend discountmodel. Investors’ expectations about cash flow will be based on their views of the attractiveness of the company’smarkets and the effectiveness of the strategies pursued by management. The more optimistic they are about thecompany’s future competitiveness, the higher the anticipated cash flow, and, therefore the higher the valuation ofthe company’s shares. Conversely, the gloomier they are about its markets and the quality of the management, thelower the expected cash flow and the lower will be the share price.
A second important difference is that while bonds normally specify a definite duration over which payments will bemade, shares, on the other hand, have no termination date. Consequently share values have to be determined bydiscounting the forecast cash flows over an infinite period – assuming that there is no reason to expect the businessto close its operations. As we shall see, in practice this means investors explicitly forecasting cash flows over somereasonable forecast horizon, say, five to ten years ahead, and then estimating the remaining cash flows over thepost-forecast period in the form of a ‘continuing’ value.
Third, while the discount rate for bonds is directly observable in the market, the cost of capital for discountingcompany cash flows has to be estimated. It is a function of three factors: the risk-free rate of return (normallytaken as the yield on longer term government bonds), the market risk premium (the extra amount to be made onaverage by investing in equities as compared to risk-free government bonds), and the specific riskiness attached tothe company’s shares. On average, for both the UK and the USA, the market risk premium has been between 5and 6 per cent over the past 50 years. So if the yield on 10-year government bonds is 4.5 per cent, this suggests acost of capital averaging 10 per cent, 1 or 2 points higher for more volatile businesses, and lower for steadier ones.
The return shareholders obtain normally comes in two forms: (1) cash dividends and (2) capital gains or losses onthe shares. The value of a share is then the discounted value of forecast dividends plus the discounted value of theshare at the end of the forecast period. The general share price formula for estimating the value of a share, P0 is then:
P0 =h∑
t=1
DIVt
(1 + r)t+ Ph
(1 + r)h
The first expression is the sum of the discounted dividends from year 1 to year h. The second expression is theshare price at some time, h, in the future. Note that the share price, Ph , is valued by a buyer as the sum of theanticipated discounted dividends in the future years after h, plus the share price at some further future period ahead,and so on. Since in principle companies have an infinite life, the ultimate share price can be many decades in thefuture. This means that the discounted value of the terminal share price will approach zero.[2] For example, a shareworth £20 fifty years on is only worth 17 pence today, assuming a discount rate of 10 per cent, i.e. £20 divided by(1 + 0.1)50. Consequently, the terminal share price can be ignored and today’s share price can be expressed simplyas the present value of all future cash dividends,
P0 =∞∑
t=1
DIVt
(1 + r)t
The discounted cash flow formula for the present value of a share is identical to that for any other asset. This isbecause dividends per share are the same as cash flow per share, i.e. Cash flow = revenue – costs – investments.

40 THE SHAREHOLDER VALUE APPROACH
By definition, what is not reinvested in the business is paid out as dividends. Therefore another way of valuing shares,which produces an identical figure, is to use forecasts of per share revenues, costs and investment:
P0 =∞∑
t=1
(cash flow per share)t
(1 + r)t
Empirical studies have shown that this discounted cash flow formula is generally a good predictor of actual shareprices. Typically the correlation coefficient between predicted and actual share prices is about 0.8.[3]
This is no accident: investment managers and equity analysts have increasingly shifted to cash flow models forestimating share values.[4] The above model calculates a ‘warranted’ or implied share value. If the actual share priceis below the implied value then this discount forms the basis for a ‘buy’ recommendation. Where the actual shareprice is at a premium to the implied value then the shares look poor value and are likely to be sold.
The model also demonstrates that the ‘City’ is not short-term orientated. The value of a share is determined byforecasting dividends over an indefinite time period. Near-term earnings generally explain only a small proportionof the share price. For the major stocks, forecast dividends in the next five years only account for an average of 20per cent of the market value of the share price.
Still, many marketing managers are not convinced that the stock market takes a long-term view. They point, inparticular, to the excessive attention given to quarterly earnings figures. But the attention to current earningsannouncements does not contradict the model. Short-term earnings do not themselves have much impact onthe share price. However, they may lead investors to reconsider their longer-term forecasts of cash flows. Cashflow consists of earnings less the amount reinvested in the business. Changes in earnings therefore do have a bigeffect on cash flows. If managers fail to deliver earnings according to expectations in the short term, it may leadinvestors to question the long-term strategy. To optimise their investment portfolios, investors continually probe forinformation about the long-term prospects of the companies whose shares they hold. Earnings announcements arean important source of information for investors making and revising long-term forecasts. But shareholder value isnot determined by short-term earnings; it is determined by discounting long-term expected cash flow. If marketingcan convincingly present strategies that promise long-term growth in cash flow, there is plenty of evidence that thiswill be rewarded by a rapid rise in the company’s market value.
SHAREHOLDER VALUE
Marketing is central to creating shareholder value. The shareholder value approach used to evaluate marketingstrategies employs exactly the same model as investors use to value shares. A marketing strategy makes sense if itis likely to enhance the value of the business. The approach starts with the recognition that the economic value ofa business, like any other asset, is determined by discounting forecast cash flow by the cost of capital. A marketingstrategy then needs to demonstrate that it can increase this discounted cash flow.
The first step in applying the model is to identify the financial value drivers that determine cash flow. There are threefinancial drivers that executives need to manage:
1. Sales growth
2. After-tax operating profit margin
3. Investment requirements
SHAREHOLDER VALUE 41
As we shall see, it is not just the level of cash flow that is important but also its timing, duration and riskiness. Cashflow that occurs early is worth more than that occurring later, because money is discounted. Marketing strategiesthat create enduring cash flows – perhaps by building strong brands – are worth more than strategies that promoteonly short-term gains. Finally, marketing strategies that are very risky are worth less, because the cash flows they areexpected to create are discounted with a higher cost of capital. In other words, to invest in a high-risk marketingstrategy, investors will want the expectation of higher cash flow.
These financial value drivers are the objectives managers pursue. But to achieve faster sales growth, higherprofit margins and to make good investment decisions they need strategies (see Figure 2.1). Marketing strategiesfocus on selecting attractive markets and creating a differential advantage. A marketing advantage is built on themarketing assets the firm has developed: its marketing knowledge, its brands, the loyalty of its customers andits strategic relationships with channel partners. These we term the marketing value drivers of the business. Manyexecutives in embracing shareholder value have not understood that strong marketing value drivers are essentialto achieve financial performance. Finally, to develop and implement these strategies the firm needs organisationalvalue drivers. These are the core capabilities – the skills, systems, motivation and leadership – to be operationallyeffective.
KEY CONCEPTS
To show how shareholder value is built we need some definitions.[5] The total value of a firm or business unit iscalled its corporate or enterprise value. It consists of the amount belonging to the holders of its debt and equity. Theequity portion of the enterprise value is the shareholder value. That is:
Enterprise value = Debt + Shareholder value
Rearranging the equation, we can express shareholder value as:
Shareholder value = Enterprise value − Debt
So to calculate the shareholder value of a business, its total or enterprise value must be calculated first, and thenthe value of its debt must be subtracted. It is usual to divide the calculation of enterprise value into two basiccomponents:
1. Forecast period value. This is the present value of cash flow from the business’s operations during theforecast or planning period – normally the first 5–10 years.
2. Continuing value. This is the estimate of the present value of the cash flows that the business generatesafter the forecast period.
To be more complete and precise, for practical purposes, analysts need to add a third component, other investments.Many businesses own securities and other investments that are outside their normal operations. Income from theseassets is excluded from the calculation of operational cash flows and their market values are shown separately.Enterprise value can then be written in terms of the three components as:
Enterprise value = Present value of cash flow from operations during forecast period
+ Continuing value
+ Other investments

42 THE SHAREHOLDER VALUE APPROACH
Sales growth
1. Level ofcash flow
2. Timing
3. Duration
Marketselection
Differentialadvantage
4. Risk
Investment
Marketingknowledge
Strong brands
Customerloyalty
Strategicrelationships
Skills
Systems
Leadership
Motivation
Corecapabilities
Operatingmargin
SHAREHOLDERVALUE
• Dividends• Capital growth
FinancialValue Drivers
MarketingValue Drivers
OrganisationalValue Drivers
Figure 2.1 The Drivers of Value in a Business
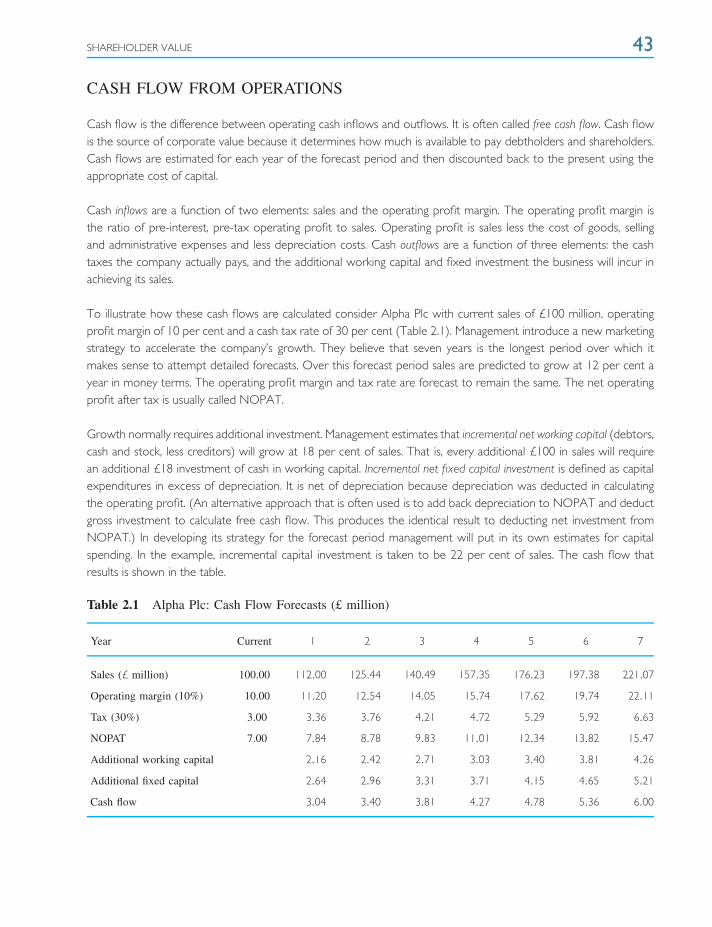
SHAREHOLDER VALUE 43
CASH FLOW FROM OPERATIONS
Cash flow is the difference between operating cash inflows and outflows. It is often called free cash flow. Cash flowis the source of corporate value because it determines how much is available to pay debtholders and shareholders.Cash flows are estimated for each year of the forecast period and then discounted back to the present using theappropriate cost of capital.
Cash inflows are a function of two elements: sales and the operating profit margin. The operating profit margin isthe ratio of pre-interest, pre-tax operating profit to sales. Operating profit is sales less the cost of goods, sellingand administrative expenses and less depreciation costs. Cash outflows are a function of three elements: the cashtaxes the company actually pays, and the additional working capital and fixed investment the business will incur inachieving its sales.
To illustrate how these cash flows are calculated consider Alpha Plc with current sales of £100 million, operatingprofit margin of 10 per cent and a cash tax rate of 30 per cent (Table 2.1). Management introduce a new marketingstrategy to accelerate the company’s growth. They believe that seven years is the longest period over which itmakes sense to attempt detailed forecasts. Over this forecast period sales are predicted to grow at 12 per cent ayear in money terms. The operating profit margin and tax rate are forecast to remain the same. The net operatingprofit after tax is usually called NOPAT.
Growth normally requires additional investment. Management estimates that incremental net working capital (debtors,cash and stock, less creditors) will grow at 18 per cent of sales. That is, every additional £100 in sales will requirean additional £18 investment of cash in working capital. Incremental net fixed capital investment is defined as capitalexpenditures in excess of depreciation. It is net of depreciation because depreciation was deducted in calculatingthe operating profit. (An alternative approach that is often used is to add back depreciation to NOPAT and deductgross investment to calculate free cash flow. This produces the identical result to deducting net investment fromNOPAT.) In developing its strategy for the forecast period management will put in its own estimates for capitalspending. In the example, incremental capital investment is taken to be 22 per cent of sales. The cash flow thatresults is shown in the table.
Table 2.1 Alpha Plc: Cash Flow Forecasts (£ million)
Year Current 1 2 3 4 5 6 7
Sales (£ million) 100.00 112.00 125.44 140.49 157.35 176.23 197.38 221.07
Operating margin (10%) 10.00 11.20 12.54 14.05 15.74 17.62 19.74 22.11
Tax (30%) 3.00 3.36 3.76 4.21 4.72 5.29 5.92 6.63
NOPAT 7.00 7.84 8.78 9.83 11.01 12.34 13.82 15.47
Additional working capital 2.16 2.42 2.71 3.03 3.40 3.81 4.26
Additional fixed capital 2.64 2.96 3.31 3.71 4.15 4.65 5.21
Cash flow 3.04 3.40 3.81 4.27 4.78 5.36 6.00
44 THE SHAREHOLDER VALUE APPROACH
We can summarise the determinants of cash flow (or free cash flow), then, as:
CASH IN: determined by:
1. Sales growth
2. Operating profit marginless
CASH OUT: determined by:
3. Cash tax
4. Incremental working capital
5. Incremental fixed investment
COST OF CAPITAL
As noted earlier, it is not just the level of cash flow generated by a marketing strategy that counts but also its timingand the risks involved. To take into account the time value of money and the risks attached to different strategies,future cash flows have to be discounted by the appropriate cost of capital. The central concept of finance is thatinvestments yielding returns greater than the cost of capital will create shareholder value, while those yielding lesswill decrease it. Calculating the cost of capital has to take into account that capital to finance the business comesfrom two sources – debt and equity. Each has a different cost so the two have to be weighted.
Calculating the cost of the debt component is relatively straightforward. Again, it is based on the cost of new debtnot historic debt. It is also the after-tax cost that is calculated since interest on debt is tax deductible. If a companyhas some publicly quoted debt, for example a corporate bond, the current cost of debt can be obtained directlyby looking at market prices and yield quotes. When this information is not directly available it has to be estimated.One way is to look at the yield on debt of companies in a related sector and to use a rating agency such as Moody’sor Standard and Poor’s to estimate a premium or discount to the published yield figure.
The second component of the cost of capital, the cost of equity, is more difficult to estimate. The cost of equity isthat expected return which will attract investors to purchase or hold the company’s shares instead of those of othercompanies. This expected return will vary with the specific risk attached to the company’s shares. Conceptually, thecost of equity can be divided into two components: a risk-free rate and an equity risk premium. The risk-free rate isusually taken to be the return on long-term government bonds.
The equity risk premium that has to be added to this is in two parts. First, there is the general or market riskpremium – the amount by which the average return on shares exceeds the risk-free rate. This varies considerablyover time, but has averaged around 5–6 per cent. Next, there is the specific risk attached to the shares of aparticular company. This is called the beta coefficient. If the company’s shares are more volatile than the average,the beta coefficient exceeds 1.0. This means the equity risk premium will be above 5 per cent (e.g. a beta of 1.2would mean an equity premium of 5 × 1.2 = 6 per cent). If it is less volatile, then the coefficient is less than 1.0,leading to a lower premium. Financial service companies regularly calculate these coefficients from data on pastshare movements and publish them for interested parties.
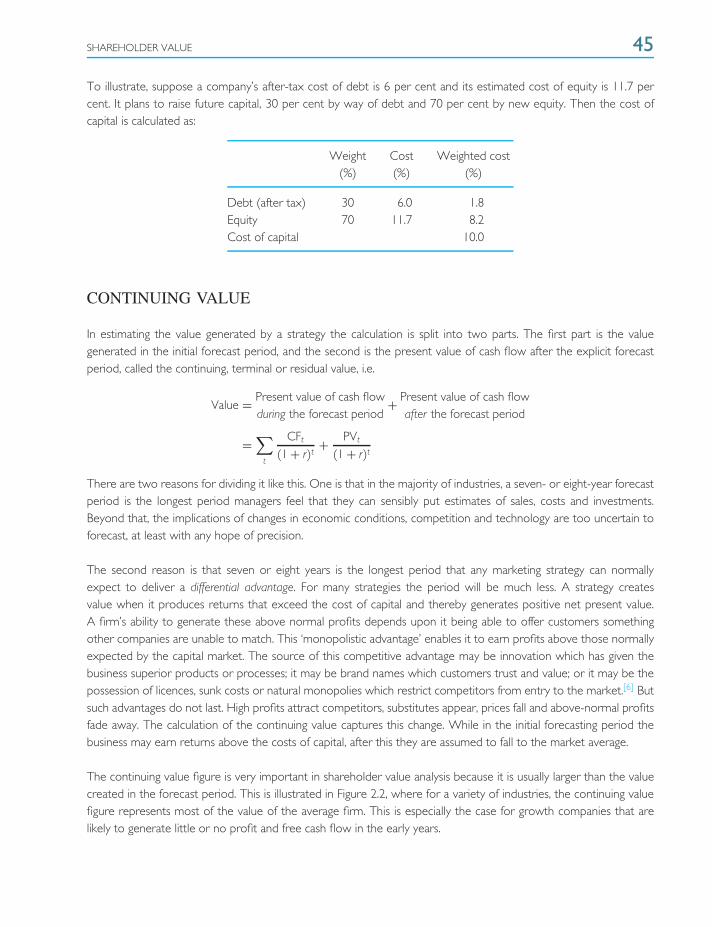
SHAREHOLDER VALUE 45
To illustrate, suppose a company’s after-tax cost of debt is 6 per cent and its estimated cost of equity is 11.7 percent. It plans to raise future capital, 30 per cent by way of debt and 70 per cent by new equity. Then the cost ofcapital is calculated as:
Weight Cost Weighted cost(%) (%) (%)
Debt (after tax) 30 6.0 1.8Equity 70 11.7 8.2Cost of capital 10.0
CONTINUING VALUE
In estimating the value generated by a strategy the calculation is split into two parts. The first part is the valuegenerated in the initial forecast period, and the second is the present value of cash flow after the explicit forecastperiod, called the continuing, terminal or residual value, i.e.
Value = Present value of cash flowduring the forecast period
+ Present value of cash flowafter the forecast period
=∑
t
CFt
(1 + r)t+ PVt
(1 + r)t
There are two reasons for dividing it like this. One is that in the majority of industries, a seven- or eight-year forecastperiod is the longest period managers feel that they can sensibly put estimates of sales, costs and investments.Beyond that, the implications of changes in economic conditions, competition and technology are too uncertain toforecast, at least with any hope of precision.
The second reason is that seven or eight years is the longest period that any marketing strategy can normallyexpect to deliver a differential advantage. For many strategies the period will be much less. A strategy createsvalue when it produces returns that exceed the cost of capital and thereby generates positive net present value.A firm’s ability to generate these above normal profits depends upon it being able to offer customers somethingother companies are unable to match. This ‘monopolistic advantage’ enables it to earn profits above those normallyexpected by the capital market. The source of this competitive advantage may be innovation which has given thebusiness superior products or processes; it may be brand names which customers trust and value; or it may be thepossession of licences, sunk costs or natural monopolies which restrict competitors from entry to the market.[6] Butsuch advantages do not last. High profits attract competitors, substitutes appear, prices fall and above-normal profitsfade away. The calculation of the continuing value captures this change. While in the initial forecasting period thebusiness may earn returns above the costs of capital, after this they are assumed to fall to the market average.
The continuing value figure is very important in shareholder value analysis because it is usually larger than the valuecreated in the forecast period. This is illustrated in Figure 2.2, where for a variety of industries, the continuing valuefigure represents most of the value of the average firm. This is especially the case for growth companies that arelikely to generate little or no profit and free cash flow in the early years.
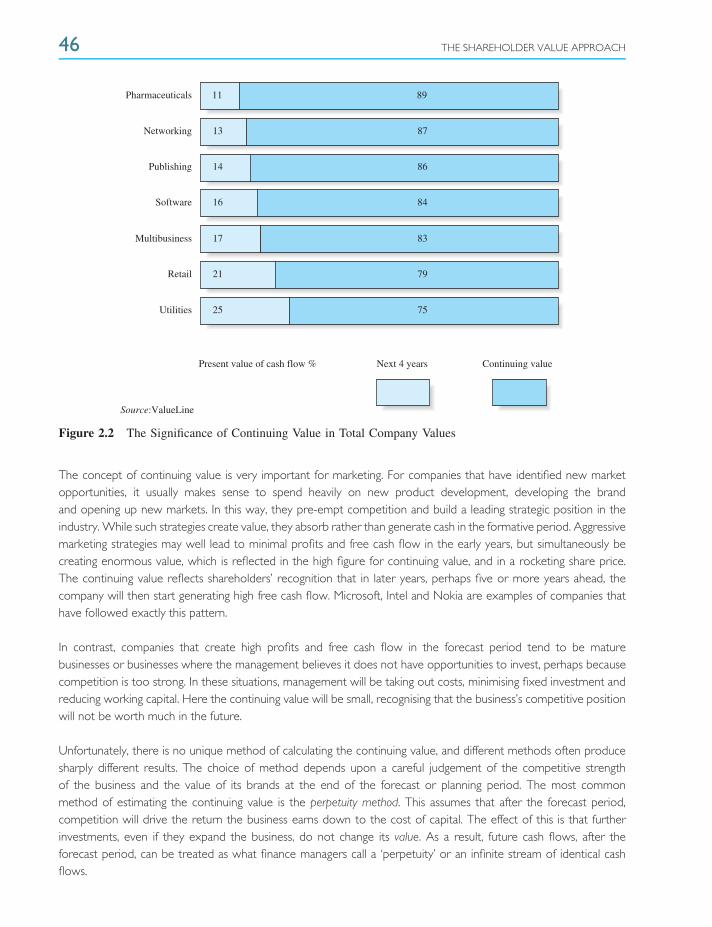
46 THE SHAREHOLDER VALUE APPROACH
Source:ValueLine
Pharmaceuticals
Networking 13
Publishing 14
Software
Multibusiness
16
17
Retail 21
Utilities 25
11
87
86
84
83
79
75
89
Present value of cash flow % Next 4 years Continuing value
Figure 2.2 The Significance of Continuing Value in Total Company Values
The concept of continuing value is very important for marketing. For companies that have identified new marketopportunities, it usually makes sense to spend heavily on new product development, developing the brandand opening up new markets. In this way, they pre-empt competition and build a leading strategic position in theindustry. While such strategies create value, they absorb rather than generate cash in the formative period. Aggressivemarketing strategies may well lead to minimal profits and free cash flow in the early years, but simultaneously becreating enormous value, which is reflected in the high figure for continuing value, and in a rocketing share price.The continuing value reflects shareholders’ recognition that in later years, perhaps five or more years ahead, thecompany will then start generating high free cash flow. Microsoft, Intel and Nokia are examples of companies thathave followed exactly this pattern.
In contrast, companies that create high profits and free cash flow in the forecast period tend to be maturebusinesses or businesses where the management believes it does not have opportunities to invest, perhaps becausecompetition is too strong. In these situations, management will be taking out costs, minimising fixed investment andreducing working capital. Here the continuing value will be small, recognising that the business’s competitive positionwill not be worth much in the future.
Unfortunately, there is no unique method of calculating the continuing value, and different methods often producesharply different results. The choice of method depends upon a careful judgement of the competitive strengthof the business and the value of its brands at the end of the forecast or planning period. The most commonmethod of estimating the continuing value is the perpetuity method. This assumes that after the forecast period,competition will drive the return the business earns down to the cost of capital. The effect of this is that furtherinvestments, even if they expand the business, do not change its value. As a result, future cash flows, after theforecast period, can be treated as what finance managers call a ‘perpetuity’ or an infinite stream of identical cashflows.
SHAREHOLDER VALUE 47
Using the perpetuity method, the present value (at the end of the forecast period) is calculated by dividing the netoperating profit after tax by the cost of capital:
Perpetuity terminal value = NOPATCost of capital
To calculate the present value of the terminal value this figure has to be discounted back over the appropriatenumber of years. For example, if the net operating profit at the end of a seven-year forecasting period is £8 millionand the cost of capital is 10 per cent, then the perpetuity continuing value is £80 million and the present value ofthis continuing value is £80 million divided by (1 + 0.1)7 or £41 million.
There are a variety of other methods to calculate continuing values.[7] Some companies use the perpetuity withinflation method. This adapts the standard perpetuity model by assuming operating profits after the forecast periodgrows at the rate of inflation. In periods of inflation this will give a higher estimate of the continuing value. Thechoice of which of the two to use depends upon whether managers believe the firm will have the ability to raiseprices in the long term alongside inflation. This will depend upon industry conditions, the business’s position in themarket and the organisation’s ability to maintain its competitiveness over the longer run.
Another common approach to estimating terminal values is the price/eamings (P/E) ratio method. Here one looksup the average P/E ratio for mature companies in similar types of industry and uses this to multiply net operatingprofit in the terminal year. For example, if the net profit was projected as £8 million in the seventh year and theaverage P/E was 11, the continuing value would be £88 million and its present value £45 million. An alternative isthe market-to-book (M/B) ratio method. This calculates continuing value by multiplying the projected book value ofassets by an average M/B ratio for similar companies. So if the book value of assets in the terminal year is projectedto be £60 million and the average M/B ratio is 1.5, the continuing value is estimated at £90 million.
Both these methods can be criticised. Book value nowadays is a poor measure of the real value of a company’sassets. Inflation and intangible assets such as patents and brands mean market values are often substantially higher.Inflation and arbitrary accounting choices also often bias earnings. Finally, in choosing ratios, finding a sample of trulysimilar companies is no simple task. On the other hand, calculating continuing values always depends on judgement.Essentially the purpose of value analysis is to estimate market value – to estimate what investors would pay for abusiness. When you can observe what they actually pay for similar companies, that is valuable evidence. P/E andM/B ratios can act as common sense checks to test the validity of more scientific methods of valuation.
ILLUSTRATION
Now that the key financial components of shareholder value analysis – cash flow from operations, cost of capitaland terminal value – have been reviewed we can demonstrate the complete methodology. Table 2.2 utilises theinformation about projected cash flows drawn from the sales growth, operating margin, tax and capital requirementssummarised in Table 2.1. The discount factor is 1/(1 + r)t where r is the weighted cost of capital (10 per cent) andt is the year in question. Multiplying by this factor discounts future cash flows to their present value. The continuingvalue is calculated for each year using the perpetuity method. For example, the continuing value at the end of year1 is computed as follows:
NOPATCost of capital
= 7.840.1
= £78.4 million
To bring the £78.4 million back to the present value it is multiplied by the appropriate discount factor, 0.909, toobtain £71.27 million.
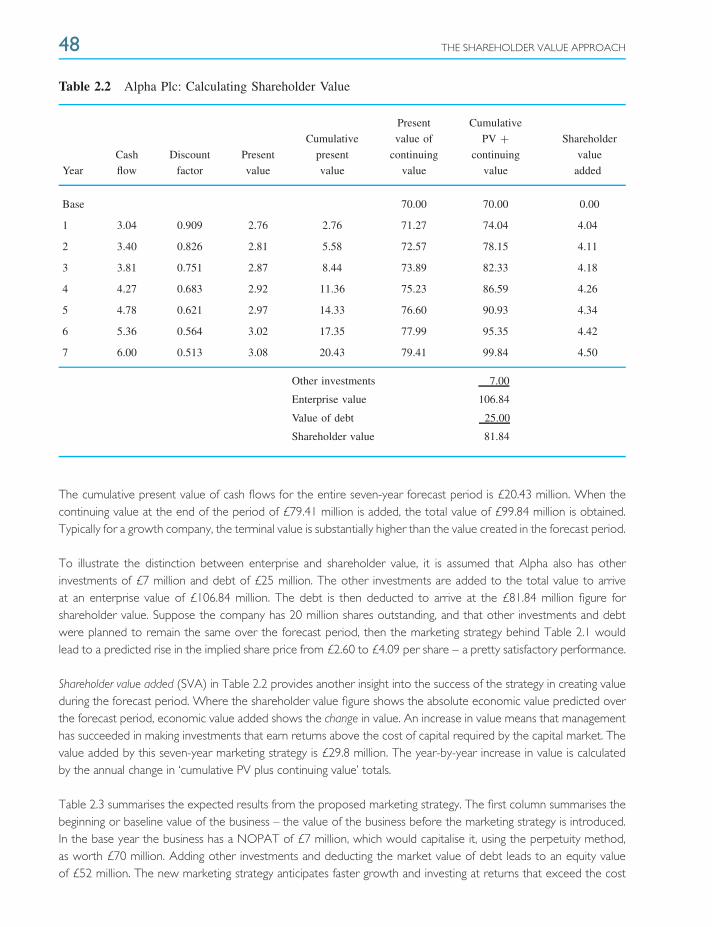
48 THE SHAREHOLDER VALUE APPROACH
Table 2.2 Alpha Plc: Calculating Shareholder Value
Present Cumulative
Cumulative value of PV + Shareholder
Cash Discount Present present continuing continuing value
Year flow factor value value value value added
Base 70.00 70.00 0.00
1 3.04 0.909 2.76 2.76 71.27 74.04 4.04
2 3.40 0.826 2.81 5.58 72.57 78.15 4.11
3 3.81 0.751 2.87 8.44 73.89 82.33 4.18
4 4.27 0.683 2.92 11.36 75.23 86.59 4.26
5 4.78 0.621 2.97 14.33 76.60 90.93 4.34
6 5.36 0.564 3.02 17.35 77.99 95.35 4.42
7 6.00 0.513 3.08 20.43 79.41 99.84 4.50
Other investments 7.00
Enterprise value 106.84
Value of debt 25.00
Shareholder value 81.84
The cumulative present value of cash flows for the entire seven-year forecast period is £20.43 million. When thecontinuing value at the end of the period of £79.41 million is added, the total value of £99.84 million is obtained.Typically for a growth company, the terminal value is substantially higher than the value created in the forecast period.
To illustrate the distinction between enterprise and shareholder value, it is assumed that Alpha also has otherinvestments of £7 million and debt of £25 million. The other investments are added to the total value to arriveat an enterprise value of £106.84 million. The debt is then deducted to arrive at the £81.84 million figure forshareholder value. Suppose the company has 20 million shares outstanding, and that other investments and debtwere planned to remain the same over the forecast period, then the marketing strategy behind Table 2.1 wouldlead to a predicted rise in the implied share price from £2.60 to £4.09 per share – a pretty satisfactory performance.
Shareholder value added (SVA) in Table 2.2 provides another insight into the success of the strategy in creating valueduring the forecast period. Where the shareholder value figure shows the absolute economic value predicted overthe forecast period, economic value added shows the change in value. An increase in value means that managementhas succeeded in making investments that earn returns above the cost of capital required by the capital market. Thevalue added by this seven-year marketing strategy is £29.8 million. The year-by-year increase in value is calculatedby the annual change in ‘cumulative PV plus continuing value’ totals.
Table 2.3 summarises the expected results from the proposed marketing strategy. The first column summarises thebeginning or baseline value of the business – the value of the business before the marketing strategy is introduced.In the base year the business has a NOPAT of £7 million, which would capitalise it, using the perpetuity method,as worth £70 million. Adding other investments and deducting the market value of debt leads to an equity valueof £52 million. The new marketing strategy anticipates faster growth and investing at returns that exceed the cost
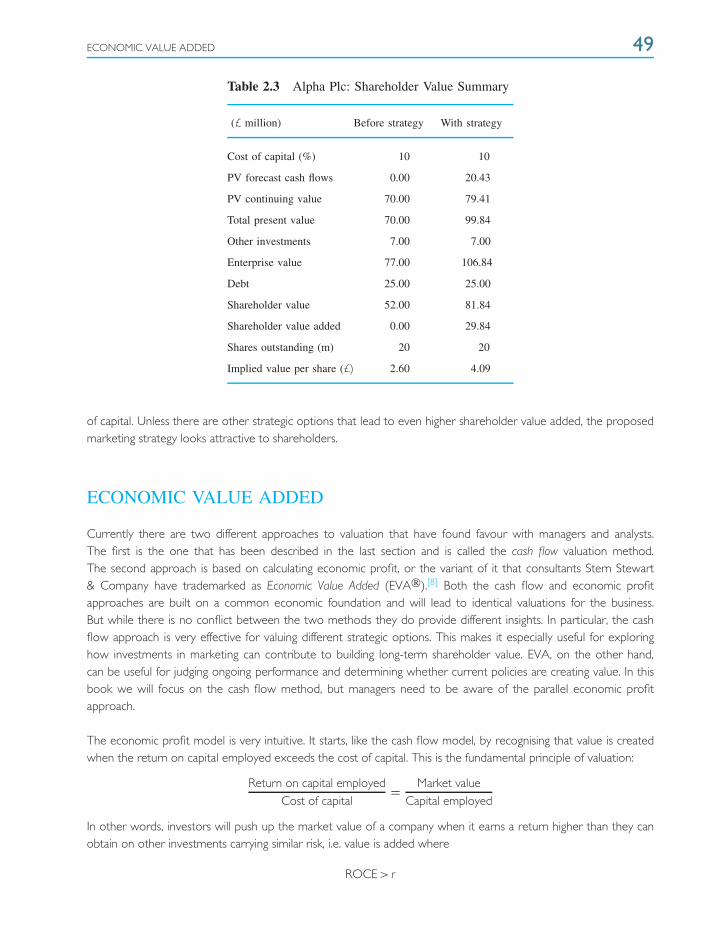
ECONOMIC VALUE ADDED 49
Table 2.3 Alpha Plc: Shareholder Value Summary
(£ million) Before strategy With strategy
Cost of capital (%) 10 10
PV forecast cash flows 0.00 20.43
PV continuing value 70.00 79.41
Total present value 70.00 99.84
Other investments 7.00 7.00
Enterprise value 77.00 106.84
Debt 25.00 25.00
Shareholder value 52.00 81.84
Shareholder value added 0.00 29.84
Shares outstanding (m) 20 20
Implied value per share (£) 2.60 4.09
of capital. Unless there are other strategic options that lead to even higher shareholder value added, the proposedmarketing strategy looks attractive to shareholders.
ECONOMIC VALUE ADDED
Currently there are two different approaches to valuation that have found favour with managers and analysts.The first is the one that has been described in the last section and is called the cash flow valuation method.The second approach is based on calculating economic profit, or the variant of it that consultants Stern Stewart& Company have trademarked as Economic Value Added (EVA).[8] Both the cash flow and economic profitapproaches are built on a common economic foundation and will lead to identical valuations for the business.But while there is no conflict between the two methods they do provide different insights. In particular, the cashflow approach is very effective for valuing different strategic options. This makes it especially useful for exploringhow investments in marketing can contribute to building long-term shareholder value. EVA, on the other hand,can be useful for judging ongoing performance and determining whether current policies are creating value. In thisbook we will focus on the cash flow method, but managers need to be aware of the parallel economic profitapproach.
The economic profit model is very intuitive. It starts, like the cash flow model, by recognising that value is createdwhen the return on capital employed exceeds the cost of capital. This is the fundamental principle of valuation:
Return on capital employedCost of capital
= Market valueCapital employed
In other words, investors will push up the market value of a company when it earns a return higher than they canobtain on other investments carrying similar risk, i.e. value is added where
ROCE > r
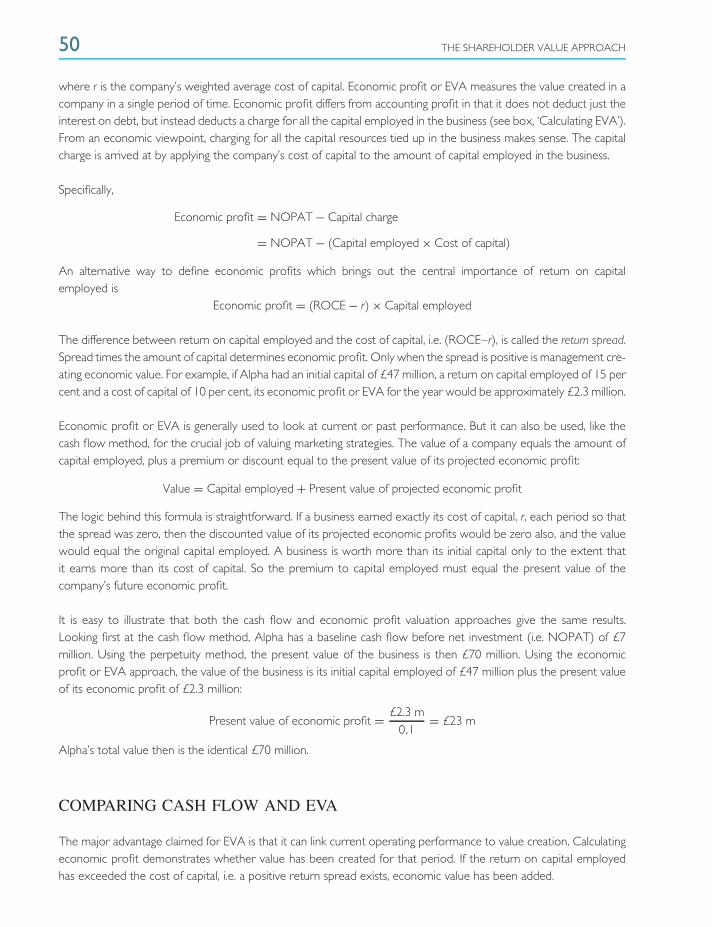
50 THE SHAREHOLDER VALUE APPROACH
where r is the company’s weighted average cost of capital. Economic profit or EVA measures the value created in acompany in a single period of time. Economic profit differs from accounting profit in that it does not deduct just theinterest on debt, but instead deducts a charge for all the capital employed in the business (see box, ‘Calculating EVA’).From an economic viewpoint, charging for all the capital resources tied up in the business makes sense. The capitalcharge is arrived at by applying the company’s cost of capital to the amount of capital employed in the business.
Specifically,
Economic profit = NOPAT − Capital charge
= NOPAT − (Capital employed × Cost of capital)
An alternative way to define economic profits which brings out the central importance of return on capitalemployed is
Economic profit = (ROCE − r) × Capital employed
The difference between return on capital employed and the cost of capital, i.e. (ROCE–r), is called the return spread.Spread times the amount of capital determines economic profit. Only when the spread is positive is management cre-ating economic value. For example, if Alpha had an initial capital of £47 million, a return on capital employed of 15 percent and a cost of capital of 10 per cent, its economic profit or EVA for the year would be approximately £2.3 million.
Economic profit or EVA is generally used to look at current or past performance. But it can also be used, like thecash flow method, for the crucial job of valuing marketing strategies. The value of a company equals the amount ofcapital employed, plus a premium or discount equal to the present value of its projected economic profit:
Value = Capital employed + Present value of projected economic profit
The logic behind this formula is straightforward. If a business earned exactly its cost of capital, r, each period so thatthe spread was zero, then the discounted value of its projected economic profits would be zero also, and the valuewould equal the original capital employed. A business is worth more than its initial capital only to the extent thatit earns more than its cost of capital. So the premium to capital employed must equal the present value of thecompany’s future economic profit.
It is easy to illustrate that both the cash flow and economic profit valuation approaches give the same results.Looking first at the cash flow method, Alpha has a baseline cash flow before net investment (i.e. NOPAT) of £7million. Using the perpetuity method, the present value of the business is then £70 million. Using the economicprofit or EVA approach, the value of the business is its initial capital employed of £47 million plus the present valueof its economic profit of £2.3 million:
Present value of economic profit = £2.3 m0.1
= £23 m
Alpha’s total value then is the identical £70 million.
COMPARING CASH FLOW AND EVA
The major advantage claimed for EVA is that it can link current operating performance to value creation. Calculatingeconomic profit demonstrates whether value has been created for that period. If the return on capital employedhas exceeded the cost of capital, i.e. a positive return spread exists, economic value has been added.
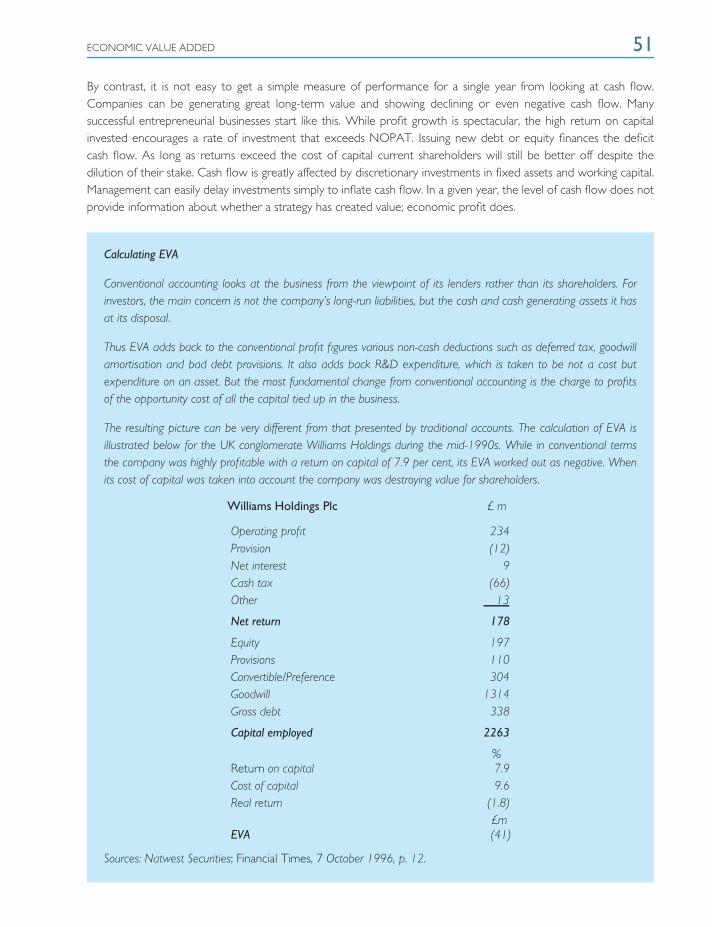
ECONOMIC VALUE ADDED 51
By contrast, it is not easy to get a simple measure of performance for a single year from looking at cash flow.Companies can be generating great long-term value and showing declining or even negative cash flow. Manysuccessful entrepreneurial businesses start like this. While profit growth is spectacular, the high return on capitalinvested encourages a rate of investment that exceeds NOPAT. Issuing new debt or equity finances the deficitcash flow. As long as returns exceed the cost of capital current shareholders will still be better off despite thedilution of their stake. Cash flow is greatly affected by discretionary investments in fixed assets and working capital.Management can easily delay investments simply to inflate cash flow. In a given year, the level of cash flow does notprovide information about whether a strategy has created value; economic profit does.
Calculating EVA
Conventional accounting looks at the business from the viewpoint of its lenders rather than its shareholders. Forinvestors, the main concern is not the company’s long-run liabilities, but the cash and cash generating assets it hasat its disposal.
Thus EVA adds back to the conventional profit figures various non-cash deductions such as deferred tax, goodwillamortisation and bad debt provisions. It also adds back R&D expenditure, which is taken to be not a cost butexpenditure on an asset. But the most fundamental change from conventional accounting is the charge to profitsof the opportunity cost of all the capital tied up in the business.
The resulting picture can be very different from that presented by traditional accounts. The calculation of EVA isillustrated below for the UK conglomerate Williams Holdings during the mid-1990s. While in conventional termsthe company was highly profitable with a return on capital of 7.9 per cent, its EVA worked out as negative. Whenits cost of capital was taken into account the company was destroying value for shareholders.
Williams Holdings Plc £ m
Operating profit 234Provision (12)Net interest 9Cash tax (66)Other 13
Net return 178
Equity 197Provisions 110Convertible/Preference 304Goodwill 1314Gross debt 338
Capital employed 2263
%Return on capital 7.9Cost of capital 9.6Real return (1.8)
£mEVA (41)
Sources: Natwest Securities; Financial Times, 7 October 1996, p. 12.
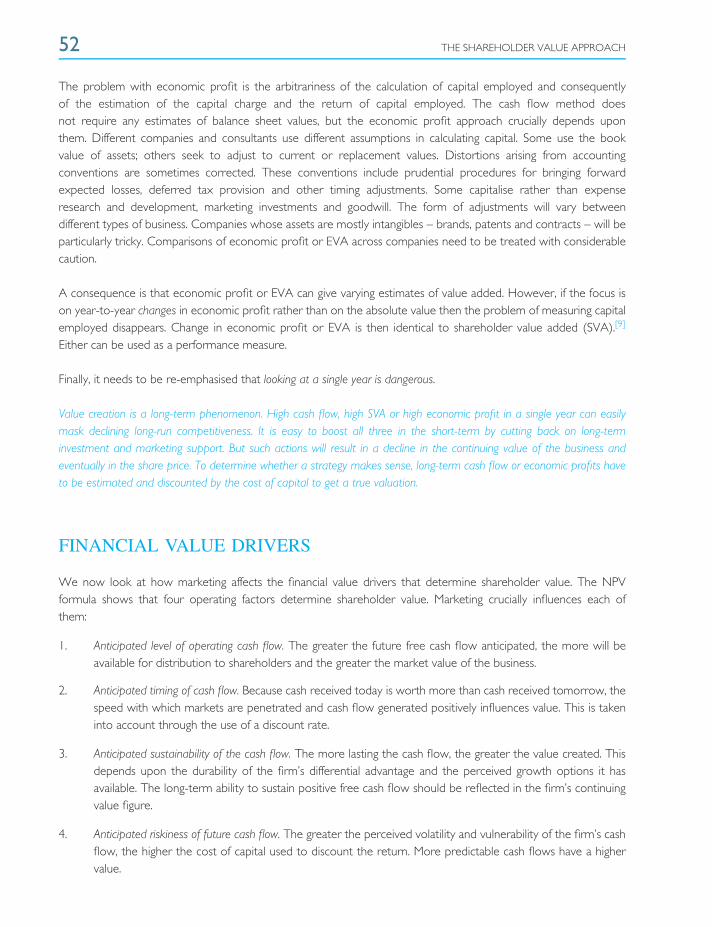
52 THE SHAREHOLDER VALUE APPROACH
The problem with economic profit is the arbitrariness of the calculation of capital employed and consequentlyof the estimation of the capital charge and the return of capital employed. The cash flow method doesnot require any estimates of balance sheet values, but the economic profit approach crucially depends uponthem. Different companies and consultants use different assumptions in calculating capital. Some use the bookvalue of assets; others seek to adjust to current or replacement values. Distortions arising from accountingconventions are sometimes corrected. These conventions include prudential procedures for bringing forwardexpected losses, deferred tax provision and other timing adjustments. Some capitalise rather than expenseresearch and development, marketing investments and goodwill. The form of adjustments will vary betweendifferent types of business. Companies whose assets are mostly intangibles – brands, patents and contracts – will beparticularly tricky. Comparisons of economic profit or EVA across companies need to be treated with considerablecaution.
A consequence is that economic profit or EVA can give varying estimates of value added. However, if the focus ison year-to-year changes in economic profit rather than on the absolute value then the problem of measuring capitalemployed disappears. Change in economic profit or EVA is then identical to shareholder value added (SVA).[9]
Either can be used as a performance measure.
Finally, it needs to be re-emphasised that looking at a single year is dangerous.
Value creation is a long-term phenomenon. High cash flow, high SVA or high economic profit in a single year can easilymask declining long-run competitiveness. It is easy to boost all three in the short-term by cutting back on long-terminvestment and marketing support. But such actions will result in a decline in the continuing value of the business andeventually in the share price. To determine whether a strategy makes sense, long-term cash flow or economic profits haveto be estimated and discounted by the cost of capital to get a true valuation.
FINANCIAL VALUE DRIVERS
We now look at how marketing affects the financial value drivers that determine shareholder value. The NPVformula shows that four operating factors determine shareholder value. Marketing crucially influences each ofthem:
1. Anticipated level of operating cash flow. The greater the future free cash flow anticipated, the more will beavailable for distribution to shareholders and the greater the market value of the business.
2. Anticipated timing of cash flow. Because cash received today is worth more than cash received tomorrow, thespeed with which markets are penetrated and cash flow generated positively influences value. This is takeninto account through the use of a discount rate.
3. Anticipated sustainability of the cash flow. The more lasting the cash flow, the greater the value created. Thisdepends upon the durability of the firm’s differential advantage and the perceived growth options it hasavailable. The long-term ability to sustain positive free cash flow should be reflected in the firm’s continuingvalue figure.
4. Anticipated riskiness of future cash flow. The greater the perceived volatility and vulnerability of the firm’s cashflow, the higher the cost of capital used to discount the return. More predictable cash flows have a highervalue.
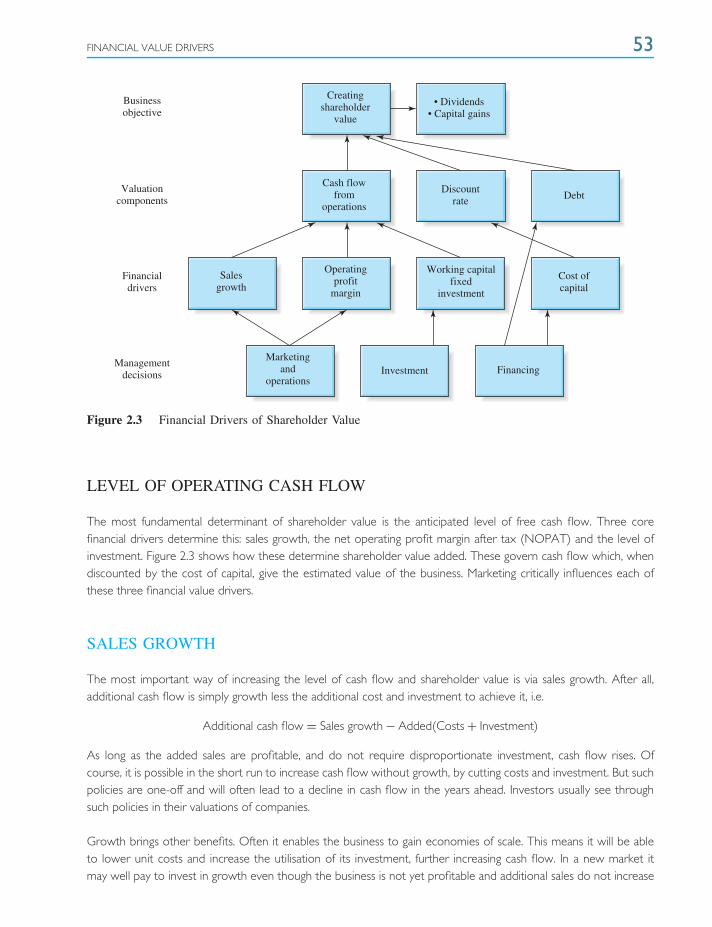
FINANCIAL VALUE DRIVERS 53
Businessobjective
Valuationcomponents
Financialdrivers
Managementdecisions
Creatingshareholder
value
Cash flowfrom
operations
Salesgrowth
Operatingprofit
margin
Working capitalfixed
investment
Discountrate Debt
• Dividends• Capital gains
Cost ofcapital
Marketingand
operationsInvestment Financing
Figure 2.3 Financial Drivers of Shareholder Value
LEVEL OF OPERATING CASH FLOW
The most fundamental determinant of shareholder value is the anticipated level of free cash flow. Three corefinancial drivers determine this: sales growth, the net operating profit margin after tax (NOPAT) and the level ofinvestment. Figure 2.3 shows how these determine shareholder value added. These govern cash flow which, whendiscounted by the cost of capital, give the estimated value of the business. Marketing critically influences each ofthese three financial value drivers.
SALES GROWTH
The most important way of increasing the level of cash flow and shareholder value is via sales growth. After all,additional cash flow is simply growth less the additional cost and investment to achieve it, i.e.
Additional cash flow = Sales growth − Added(Costs + Investment)
As long as the added sales are profitable, and do not require disproportionate investment, cash flow rises. Ofcourse, it is possible in the short run to increase cash flow without growth, by cutting costs and investment. But suchpolicies are one-off and will often lead to a decline in cash flow in the years ahead. Investors usually see throughsuch policies in their valuations of companies.
Growth brings other benefits. Often it enables the business to gain economies of scale. This means it will be ableto lower unit costs and increase the utilisation of its investment, further increasing cash flow. In a new market itmay well pay to invest in growth even though the business is not yet profitable and additional sales do not increase
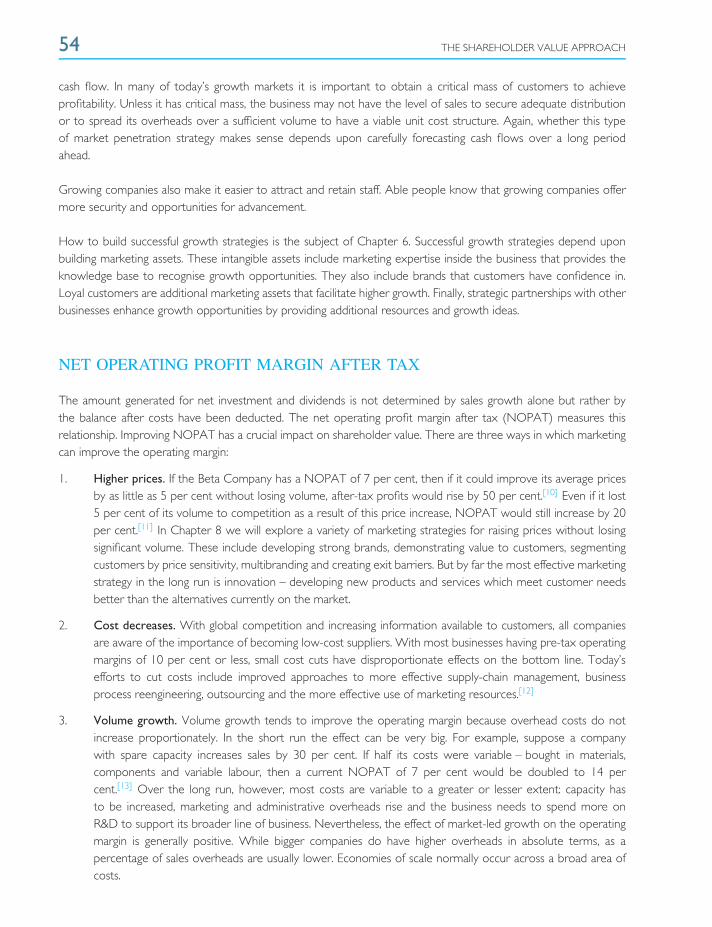
54 THE SHAREHOLDER VALUE APPROACH
cash flow. In many of today’s growth markets it is important to obtain a critical mass of customers to achieveprofitability. Unless it has critical mass, the business may not have the level of sales to secure adequate distributionor to spread its overheads over a sufficient volume to have a viable unit cost structure. Again, whether this typeof market penetration strategy makes sense depends upon carefully forecasting cash flows over a long periodahead.
Growing companies also make it easier to attract and retain staff. Able people know that growing companies offermore security and opportunities for advancement.
How to build successful growth strategies is the subject of Chapter 6. Successful growth strategies depend uponbuilding marketing assets. These intangible assets include marketing expertise inside the business that provides theknowledge base to recognise growth opportunities. They also include brands that customers have confidence in.Loyal customers are additional marketing assets that facilitate higher growth. Finally, strategic partnerships with otherbusinesses enhance growth opportunities by providing additional resources and growth ideas.
NET OPERATING PROFIT MARGIN AFTER TAX
The amount generated for net investment and dividends is not determined by sales growth alone but rather bythe balance after costs have been deducted. The net operating profit margin after tax (NOPAT) measures thisrelationship. Improving NOPAT has a crucial impact on shareholder value. There are three ways in which marketingcan improve the operating margin:
1. Higher prices. If the Beta Company has a NOPAT of 7 per cent, then if it could improve its average pricesby as little as 5 per cent without losing volume, after-tax profits would rise by 50 per cent.[10] Even if it lost5 per cent of its volume to competition as a result of this price increase, NOPAT would still increase by 20per cent.[11] In Chapter 8 we will explore a variety of marketing strategies for raising prices without losingsignificant volume. These include developing strong brands, demonstrating value to customers, segmentingcustomers by price sensitivity, multibranding and creating exit barriers. But by far the most effective marketingstrategy in the long run is innovation – developing new products and services which meet customer needsbetter than the alternatives currently on the market.
2. Cost decreases. With global competition and increasing information available to customers, all companiesare aware of the importance of becoming low-cost suppliers. With most businesses having pre-tax operatingmargins of 10 per cent or less, small cost cuts have disproportionate effects on the bottom line. Today’sefforts to cut costs include improved approaches to more effective supply-chain management, businessprocess reengineering, outsourcing and the more effective use of marketing resources.[12]
3. Volume growth. Volume growth tends to improve the operating margin because overhead costs do notincrease proportionately. In the short run the effect can be very big. For example, suppose a companywith spare capacity increases sales by 30 per cent. If half its costs were variable – bought in materials,components and variable labour, then a current NOPAT of 7 per cent would be doubled to 14 percent.[13] Over the long run, however, most costs are variable to a greater or lesser extent: capacity hasto be increased, marketing and administrative overheads rise and the business needs to spend more onR&D to support its broader line of business. Nevertheless, the effect of market-led growth on the operatingmargin is generally positive. While bigger companies do have higher overheads in absolute terms, as apercentage of sales overheads are usually lower. Economies of scale normally occur across a broad area ofcosts.

FINANCIAL VALUE DRIVERS 55
INVESTMENT
Managers invest in tangible assets like equipment and stocks, and also in intangible assets such as brands, customerrelationships, market research and training. Reducing investment produces an immediate jump in cash flow. But inthe long run, such actions can be extremely counterproductive. The purpose of investment is to increase long-rungrowth and cash flow. The golden rule is that investment creates value if the net present value of the cash flowis positive. Or, expressing it in equivalent economic profit terms, investment creates value if the return on theinvestment exceeds the cost of capital.
As long as the return on new investment exceeds the cost of capital, investment increases shareholder value. This isillustrated in Table 2.4. Here a company earns a return on new investment of 20 per cent. Under the first scenarioit invests 25 per cent of its profits; under the second it invests 35 per cent. With the conservative investmentstrategy, it has a higher cash flow over the first 8 years, and, indeed, over the whole of the 10-year planning period,the present value of the forecast cash flow is greater. Under the high-investment strategy, however, annual cashflow overtakes in year 9, and then the lead continually widens. For the reader who cares to work out the result ona spreadsheet, assuming an 11 per cent cost of capital, the high investment strategy generates a significantly greatershareholder value. This is reflected in the greater continuing value figure in year 10.[14]
Managers need to avoid wasteful investment in both tangible and intangible assets. However, as the exampleillustrates, not investing sufficiently in profitable marketing opportunities is equally value destroying.
The threshold margin is a useful tool for marketing managers. It shows the relationshhip between the three driversof cash flow: growth, margin and investment requirements. The threshold margin is the pre-tax operating profitmargin necessary to finance value-creating growth. It is the minimum pre-tax operating profit margin on additionalsales necessary to maintain shareholder value. It is calculated as:[15]
Threshold margin = (Incremental investment rate) × (Cost of capital)(1 + Cost of capital) (1 − tax rate)
Table 2.4 Cash Flow Projections with High and Low Investment Levels
25% Investment rate 35% Investment rate
Year NOPAT Investment Cash Flow NOPAT Investment Cash flow
1 100.0 25.0 75.0 100.0 35.0 65.0
2 105.0 26.3 78.8 107.0 37.5 69.6
3 110.3 27.6 82.7 114.5 40.1 74.4
4 115.8 28.9 86.8 122.5 42.9 79.6
5 121.6 30.4 91.2 131.1 45.9 85.2
6 127.6 31.9 95.7 140.3 49.1 91.2
7 134.0 33.5 100.5 150.1 52.5 97.5
8 140.7 35.2 105.5 160.6 56.2 104.4
9 147.7 36.9 110.8 171.8 60.1 111.7
10 155.1 38.8 116.3 183.8 64.3 119.5

56 THE SHAREHOLDER VALUE APPROACH
Using the example of the Alpha company, the incremental investment rate totals 40 per cent, the cost of capital is10 per cent and the tax rate is 30 per cent. Substituting into the formula gives:
Threshold margin = 40% × 10%1.1 × 0.7
= 5.2%
If the additional growth marketing is planning to generate gives an operating margin of over 5.2 per cent, then valueis created. The threshold margin depends on the additional working and fixed capital necessary to finance growth,the cost of capital and the tax rate. The higher these are, the higher the margin that is required on additional sales.
This is illustrated below:
Threshold Margins for Varying Rates of Investment and Costs of Capital
Incremental investment per £ of sales (%)
Cost of capital (%) 30 40 50 60
8 3.2 4.2 5.3 6.310 3.9 5.2 6.5 7.812 4.6 6.1 7.7 9.2
In Alpha’s case, since managers believe they can get an operating margin of 10 per cent, then value is clearly goingto be created. The difference between actual (or expected) margin and threshold margin is called the thresholdspread. In the Alpha illustration the spread is 4.8 per cent. The size of the threshold margin is a key determinant ofvalue creation. More specifically, the value created by a strategy (SVA) in a given period t, is given by the followingequation:
Shareholder valueadded (SVA)
= (Incremental sales in period t) (Threshold spread in t) (1 − tax rate)
(Cost of capital) (1 + Cost of capital)t−1
For example, using the above equation on Alpha for year 2 we have
SVA = £13.44 × 4.8% × (1 − 0.30)0.1 × (1 + 0.1)1
= £4.11 million
This is exactly the same figure as calculated earlier using the cash flow method (Table 2.2).
TIMING OF OPERATING CASH FLOW
Besides the amount of cash flow a marketing strategy generates, its timing also affects the value that is created.For example, if the cost of capital is 10 per cent, £10 million free cash flow received at the end of the first yearof a product’s launch has a value of £9.09 million; if it is not received until year 3, the value is only £7.51 million.Marketing strategies to accelerate cash flow therefore create shareholder value. There are several ways marketingcan accelerate cash flow:
❍ Faster new product development. Many companies are redesigning their new product developmentprocesses to reduce the time from initial idea to final launch. Methods include using cross-functional teams,conducting development processes in parallel rather than in series, and cutting out unnecessary steps.[16]
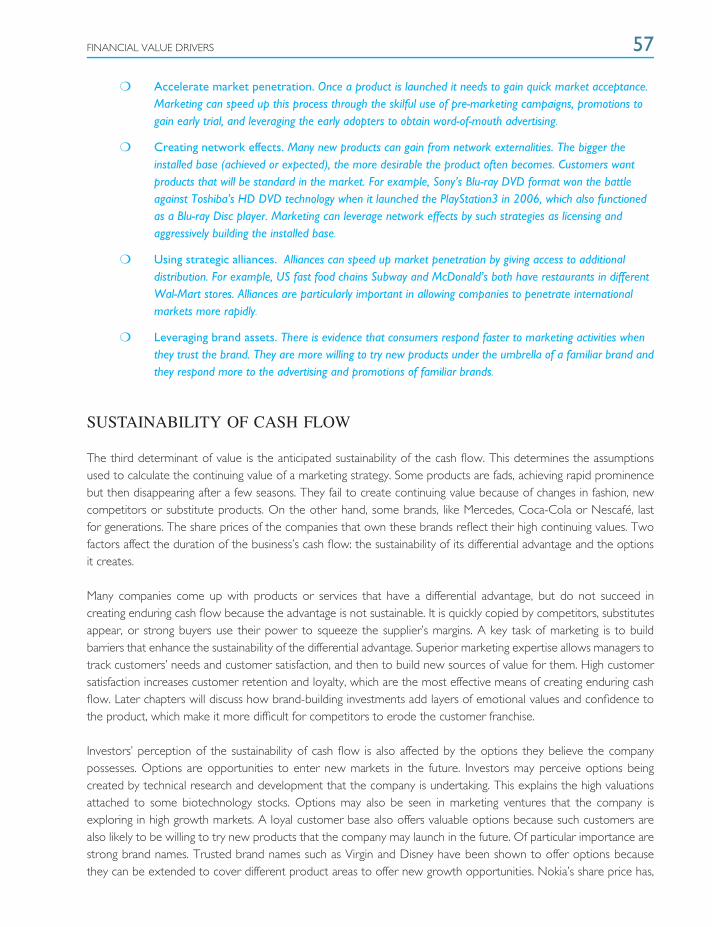
FINANCIAL VALUE DRIVERS 57
❍ Accelerate market penetration. Once a product is launched it needs to gain quick market acceptance.Marketing can speed up this process through the skilful use of pre-marketing campaigns, promotions togain early trial, and leveraging the early adopters to obtain word-of-mouth advertising.
❍ Creating network effects. Many new products can gain from network externalities. The bigger theinstalled base (achieved or expected), the more desirable the product often becomes. Customers wantproducts that will be standard in the market. For example, Sony’s Blu-ray DVD format won the battleagainst Toshiba’s HD DVD technology when it launched the PlayStation3 in 2006, which also functionedas a Blu-ray Disc player. Marketing can leverage network effects by such strategies as licensing andaggressively building the installed base.
❍ Using strategic alliances. Alliances can speed up market penetration by giving access to additionaldistribution. For example, US fast food chains Subway and McDonald’s both have restaurants in differentWal-Mart stores. Alliances are particularly important in allowing companies to penetrate internationalmarkets more rapidly.
❍ Leveraging brand assets. There is evidence that consumers respond faster to marketing activities whenthey trust the brand. They are more willing to try new products under the umbrella of a familiar brand andthey respond more to the advertising and promotions of familiar brands.
SUSTAINABILITY OF CASH FLOW
The third determinant of value is the anticipated sustainability of the cash flow. This determines the assumptionsused to calculate the continuing value of a marketing strategy. Some products are fads, achieving rapid prominencebut then disappearing after a few seasons. They fail to create continuing value because of changes in fashion, newcompetitors or substitute products. On the other hand, some brands, like Mercedes, Coca-Cola or Nescafe, lastfor generations. The share prices of the companies that own these brands reflect their high continuing values. Twofactors affect the duration of the business’s cash flow: the sustainability of its differential advantage and the optionsit creates.
Many companies come up with products or services that have a differential advantage, but do not succeed increating enduring cash flow because the advantage is not sustainable. It is quickly copied by competitors, substitutesappear, or strong buyers use their power to squeeze the supplier’s margins. A key task of marketing is to buildbarriers that enhance the sustainability of the differential advantage. Superior marketing expertise allows managers totrack customers’ needs and customer satisfaction, and then to build new sources of value for them. High customersatisfaction increases customer retention and loyalty, which are the most effective means of creating enduring cashflow. Later chapters will discuss how brand-building investments add layers of emotional values and confidence tothe product, which make it more difficult for competitors to erode the customer franchise.
Investors’ perception of the sustainability of cash flow is also affected by the options they believe the companypossesses. Options are opportunities to enter new markets in the future. Investors may perceive options beingcreated by technical research and development that the company is undertaking. This explains the high valuationsattached to some biotechnology stocks. Options may also be seen in marketing ventures that the company isexploring in high growth markets. A loyal customer base also offers valuable options because such customers arealso likely to be willing to try new products that the company may launch in the future. Of particular importance arestrong brand names. Trusted brand names such as Virgin and Disney have been shown to offer options becausethey can be extended to cover different product areas to offer new growth opportunities. Nokia’s share price has,
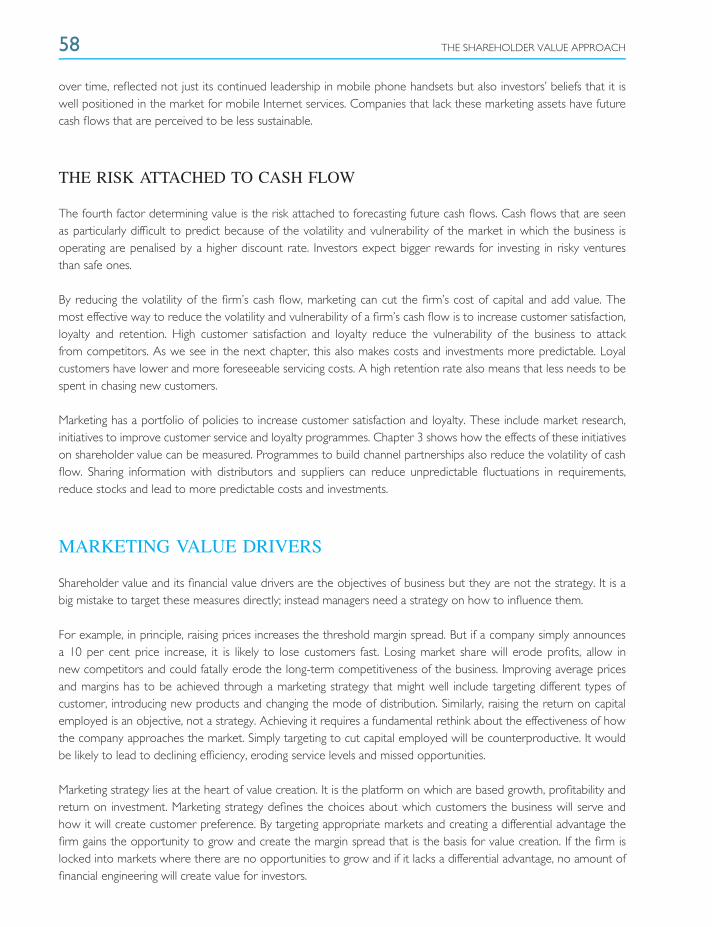
58 THE SHAREHOLDER VALUE APPROACH
over time, reflected not just its continued leadership in mobile phone handsets but also investors’ beliefs that it iswell positioned in the market for mobile Internet services. Companies that lack these marketing assets have futurecash flows that are perceived to be less sustainable.
THE RISK ATTACHED TO CASH FLOW
The fourth factor determining value is the risk attached to forecasting future cash flows. Cash flows that are seenas particularly difficult to predict because of the volatility and vulnerability of the market in which the business isoperating are penalised by a higher discount rate. Investors expect bigger rewards for investing in risky venturesthan safe ones.
By reducing the volatility of the firm’s cash flow, marketing can cut the firm’s cost of capital and add value. Themost effective way to reduce the volatility and vulnerability of a firm’s cash flow is to increase customer satisfaction,loyalty and retention. High customer satisfaction and loyalty reduce the vulnerability of the business to attackfrom competitors. As we see in the next chapter, this also makes costs and investments more predictable. Loyalcustomers have lower and more foreseeable servicing costs. A high retention rate also means that less needs to bespent in chasing new customers.
Marketing has a portfolio of policies to increase customer satisfaction and loyalty. These include market research,initiatives to improve customer service and loyalty programmes. Chapter 3 shows how the effects of these initiativeson shareholder value can be measured. Programmes to build channel partnerships also reduce the volatility of cashflow. Sharing information with distributors and suppliers can reduce unpredictable fluctuations in requirements,reduce stocks and lead to more predictable costs and investments.
MARKETING VALUE DRIVERS
Shareholder value and its financial value drivers are the objectives of business but they are not the strategy. It is abig mistake to target these measures directly; instead managers need a strategy on how to influence them.
For example, in principle, raising prices increases the threshold margin spread. But if a company simply announcesa 10 per cent price increase, it is likely to lose customers fast. Losing market share will erode profits, allow innew competitors and could fatally erode the long-term competitiveness of the business. Improving average pricesand margins has to be achieved through a marketing strategy that might well include targeting different types ofcustomer, introducing new products and changing the mode of distribution. Similarly, raising the return on capitalemployed is an objective, not a strategy. Achieving it requires a fundamental rethink about the effectiveness of howthe company approaches the market. Simply targeting to cut capital employed will be counterproductive. It wouldbe likely to lead to declining efficiency, eroding service levels and missed opportunities.
Marketing strategy lies at the heart of value creation. It is the platform on which are based growth, profitability andreturn on investment. Marketing strategy defines the choices about which customers the business will serve andhow it will create customer preference. By targeting appropriate markets and creating a differential advantage thefirm gains the opportunity to grow and create the margin spread that is the basis for value creation. If the firm islocked into markets where there are no opportunities to grow and if it lacks a differential advantage, no amount offinancial engineering will create value for investors.

MARKETING VALUE DRIVERS 59
The main elements of marketing strategy can be summarised in four steps. The first step is taken at the group level;the other three are formulated at the level of the business unit.
CHOICE OF MARKETS
Most companies operate a portfolio of businesses – different industry sectors, technologies, countries or distributionchannels. At the corporate level, the board has to decide which of these businesses it wants to be in and whatpriority they should have. Some of its business units may be in markets that do not have the potential to provideopportunities for growth or earn operating margins that exceed the threshold level. Others may offer tremendousopportunities but are not receiving sufficient investment and priority.
The mistake of many financially driven companies is to make this review static rather than dynamic. A staticreview focuses on the current profitability of the business units rather than their ability to create long-term value.Management must understand the need for continual change and evolution in today’s rapidly changing environment.If the company is to survive it must move into new products, technologies, markets and distribution channels. Tocreate value it must structure its portfolio dynamically. This means building a portfolio of three types of businessunits (Figure 2.4).
1. Today’s businesses. These are the core business units that should be generating the bulk of today’s profitsand cash flow. Usually they have only modest growth potential left. The management goals will be high levelsof current profitability and cash flow. The strategy is to extend and defend the core businesses throughincremental extension, updating and cost reduction. Those businesses that are not generating economicprofit should be quickly fixed or divested.
2. Tomorrow’s businesses. These are the company’s emerging stars: new businesses that are alreadydemonstrating their ability to win profitable customers and grow. The success of these businesses is likely tobe already having a major impact on the share price as investors recognise their long-term cash generatingpotential. The task here is to invest in the marketing infrastructure to capture and defend the marketopportunities against competitors.
Prof
it
Tomorrow’s businesses
Today’s businesses
Options for growth
Time (years)
Figure 2.4 Building the Sustainable Business
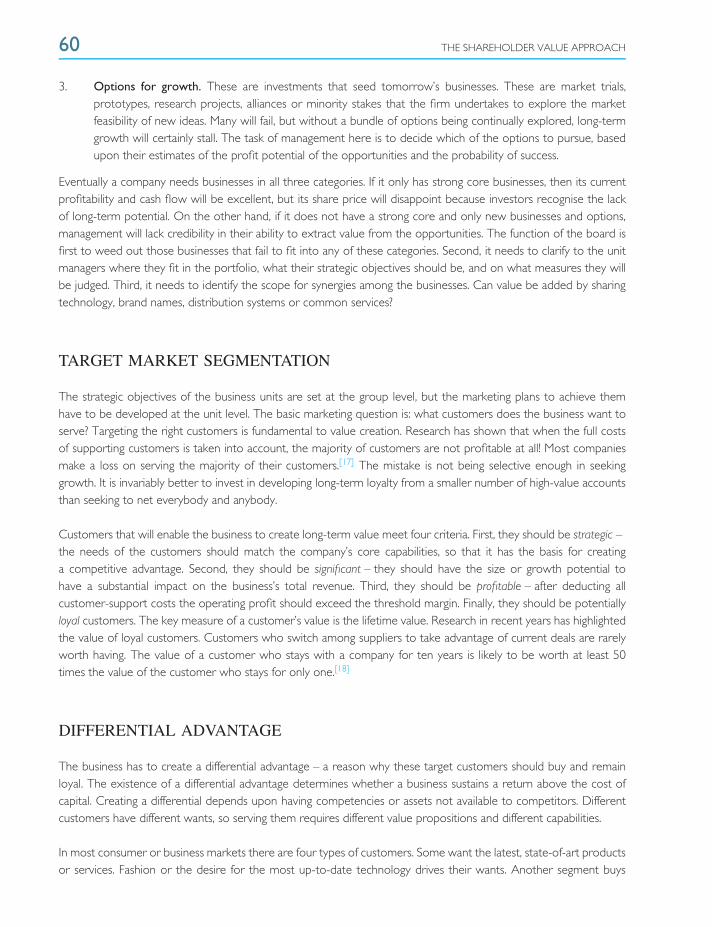
60 THE SHAREHOLDER VALUE APPROACH
3. Options for growth. These are investments that seed tomorrow’s businesses. These are market trials,prototypes, research projects, alliances or minority stakes that the firm undertakes to explore the marketfeasibility of new ideas. Many will fail, but without a bundle of options being continually explored, long-termgrowth will certainly stall. The task of management here is to decide which of the options to pursue, basedupon their estimates of the profit potential of the opportunities and the probability of success.
Eventually a company needs businesses in all three categories. If it only has strong core businesses, then its currentprofitability and cash flow will be excellent, but its share price will disappoint because investors recognise the lackof long-term potential. On the other hand, if it does not have a strong core and only new businesses and options,management will lack credibility in their ability to extract value from the opportunities. The function of the board isfirst to weed out those businesses that fail to fit into any of these categories. Second, it needs to clarify to the unitmanagers where they fit in the portfolio, what their strategic objectives should be, and on what measures they willbe judged. Third, it needs to identify the scope for synergies among the businesses. Can value be added by sharingtechnology, brand names, distribution systems or common services?
TARGET MARKET SEGMENTATION
The strategic objectives of the business units are set at the group level, but the marketing plans to achieve themhave to be developed at the unit level. The basic marketing question is: what customers does the business want toserve? Targeting the right customers is fundamental to value creation. Research has shown that when the full costsof supporting customers is taken into account, the majority of customers are not profitable at all! Most companiesmake a loss on serving the majority of their customers.[17] The mistake is not being selective enough in seekinggrowth. It is invariably better to invest in developing long-term loyalty from a smaller number of high-value accountsthan seeking to net everybody and anybody.
Customers that will enable the business to create long-term value meet four criteria. First, they should be strategic –the needs of the customers should match the company’s core capabilities, so that it has the basis for creatinga competitive advantage. Second, they should be significant – they should have the size or growth potential tohave a substantial impact on the business’s total revenue. Third, they should be profitable – after deducting allcustomer-support costs the operating profit should exceed the threshold margin. Finally, they should be potentiallyloyal customers. The key measure of a customer’s value is the lifetime value. Research in recent years has highlightedthe value of loyal customers. Customers who switch among suppliers to take advantage of current deals are rarelyworth having. The value of a customer who stays with a company for ten years is likely to be worth at least 50times the value of the customer who stays for only one.[18]
DIFFERENTIAL ADVANTAGE
The business has to create a differential advantage – a reason why these target customers should buy and remainloyal. The existence of a differential advantage determines whether a business sustains a return above the cost ofcapital. Creating a differential depends upon having competencies or assets not available to competitors. Differentcustomers have different wants, so serving them requires different value propositions and different capabilities.
In most consumer or business markets there are four types of customers. Some want the latest, state-of-art productsor services. Fashion or the desire for the most up-to-date technology drives their wants. Another segment buys
MARKETING VALUE DRIVERS 61
primarily on the basis of low price and convenience. Quality might be important but they are unwilling to paypremium prices. Customers in a third segment want to express themselves through their purchases or want theassurance that brands provide. Finally, some are willing to pay more for a customised service that understands theirspecific wants and is willing to tailor-make solutions.
Each segment requires a different type of differential advantage and set of competencies to operationalise it.Differentiation for the first segment needs to be based on product leadership. Such companies as Apple, Intel and3M have shown how capabilities in innovation and speed to market can deliver high margin growth. On the otherhand, if a business is going to compete by offering low prices and customer convenience it has to differentiate itselfby operational excellence. Such companies as Toyota, Wal-Mart and First Direct have shown that this depends onhigh levels of efficiency in processes that drive down costs, reduce investment requirements and tightly managethe supply chain. Differentiation in the third segment depends upon building brand superiority – creating emotionalvalues that competitors cannot match. Companies such as Coca-Cola, Disney, Procter & Gamble and Virgin haveshown the power of this type of strategy to generate shareholder value. Here the competencies lie in marketingresearch and strong and consistent communications.
Perhaps the fastest growing segment in today’s information age is those customers wanting customised service.Information technology makes it possible to store data on the needs and buying behaviour of individual customersand to communicate directly on a one-to-one basis. New technology in production also makes it possible totailor-manufacture products. Here the differentiation strategy is termed customer intimacy.[19] Profits and growthcome from building loyalty through long-term, in-depth relationships aimed at improving the customer’s performanceand satisfaction levels.
Businesses have to focus on one differentiation strategy because each requires different competencies andoperational processes. The appropriate value proposition is the one that matches the needs of the target customersegment. Yet, while the business must excel in one dimension to create a differential advantage, the others cannotbe neglected. Customers today are increasingly demanding. They are conditioned to expect competitive prices,faster service and more innovative products. For example, while customers will not expect the same levels oftechnology or service from a price-orientated supplier as they would from a premium company, they do expectreasonable standards in these other dimensions. Rising customer expectations also mean that what is a great offertoday will not be tomorrow. To sustain a successful position the business must be continually improving its businessmodel faster than the competition.
MARKETING MIX
The marketing mix is the set of operating decisions that the firm makes to gain and retain target customers andpursue its differential advantage. It is often called the four, or five, Ps. The first P refers to the products the firm willoffer. This includes decisions about the variety of products, brand names, quality, design, packaging and guarantees.People refers to the service and support the firm offers customers. Price concerns not only decisions about the listprice but also discounts, allowances and credit terms. Promotion concerns advertising, sales force, direct marketing,web sites, PR and sales promotions. Place refers to how the firm distributes its offer, and includes choices aboutchannels, coverage, locations, transport and stock levels.
The key point about the marketing mix is that all the decisions are derived from earlier choices about strategicobjectives, target customers and the differential advantage. For example, if the business unit is targeted for rapid

62 THE SHAREHOLDER VALUE APPROACH
growth, management may be more aggressive in pricing and invest more in product variety, promotion anddistribution. It may be prepared to sacrifice near-term cash flow for market share gains. The reverse will bethe orientation for a mature business where current profitability and cash flow are the objectives. The targetcustomers and differential advantage also shape decisions. Distribution and promotional decisions are governed bythe characteristics and usage patterns of customers. The business will want to sell through distribution channelsthat fit the customer and promote through vehicles that they will use. Similarly, the differential advantage isthe primary determinant of the opportunity to gain premium prices. In competitive markets, the firm will onlybe able to charge higher prices if customers believe its offer to be significantly better value than those ofcompetitors.
ORGANISATIONAL VALUE DRIVERS
Achieving the objective of creating shareholder value requires a strategy – choosing high-value customers, formulatinga differential advantage and planning an appropriate marketing mix. But it also requires the right organisation – havingthe capabilities and culture to operationalise the strategy. In most situations organisational capabilities and cultureare more important than strategy. Looking at successful and less successful competitors in an industry at certaintimes – for example, Sony and Philips; Google and Yahoo!; BMW and Jaguar; Coca-Cola and Pepsi; Disney andColumbia – the real differences are not in their strategy but in how they have implemented it.
Delivering strategy depends upon the core competencies of the business. Core competencies comprise a set ofskills and expertise that enable a business to deliver exceptional value to customers. Sony’s product leadershipin consumer electronics is based on its early mastery in miniaturisation. Google’s leadership in search enginetechnology is based on its initial understanding of how to rank findings according to relevance. SingaporeAirlines’ success in service is based on skills in selecting, training and motivating staff. Toyota’s success withlow-cost, high-quality cars is based on its operational excellence in supply chain management and manufacturing.But it is more than just competencies that determine whether a business generates value – it is also aboutthe culture and attitudes of people in the organisation. These determine whether competencies are appliedappropriately.
IBM in the 1980s, for example, had outstanding competencies. It was at the forefront of computer technology, ithad brilliant staff across all areas of the business, and had exceptional access to major customers. But it lacked theorganisational drive to adapt to a changing environment and to deliver value to shareholders. The result was acollapse in its market share and in its share price.
The right form of organisation varies by market and over time. Competing successfully in high-value services such asmanagement consultancy requires different capabilities and culture from basic industries such as steel or commoditychemicals. The former is about customised service and an intimate knowledge partnership between client andconsultant; the latter is about organising to minimise production cost and meet delivery requirements.
In the past, major companies such as General Motors, Unilever, Siemens and Shell were about mass productionand mass marketing. There was a high level of vertical integration from raw material to final distribution. Companieswere organised hierarchically with information going up and head office decisions coming down. Employees werespecialists; they worked in production, design or sales and interacted vertically with their boss or with theirsubordinates. This type of hierarchical structure was seen as the best way of harnessing economies of scale andexpertise in the company.
ORGANISATIONAL VALUE DRIVERS 63
The information age has changed all this. Intensifying global competition has forced companies to reshape theirorganisations to cut overhead costs and to provide for faster response to changes in market requirements. Risingcustomer expectations have led to an increasing demand for customised solutions rather than mass-producedproducts. Information technology has facilitated much faster and more direct ways of interacting among staff sharingresponsibility for meeting customer needs. Finally, professional knowledge rather than capital resource has becomethe key source of competitive advantage. Unlike capital, knowledge is diffused throughout the organisation inthe information individuals and groups have of technology, processes, supplier capabilities and customers’ needs.Attracting, retaining and motivating knowledge workers is now recognised as much more difficult than utilisingfinancial and physical capital.
INTERNAL NETWORKS
Increasingly, information-age companies are shifting from vertical hierarchies to horizontal, cross-functional teams.These teams have responsibility not for functional inputs, but for the key processes that add value for customers.Typically these processes are about new product development, operations, and customer service and support.Employees no longer communicate through formal hierarchies but use multiple, informal networks to connect withothers who have knowledge which may be valuable to the process. Properly used, these internal networks cutoverheads, speed processes and motivate knowledge workers by giving them responsibility and trust.
EXTERNAL NETWORKS
External networks have grown in importance alongside internal ones. The increasing need for knowledge aboutnew products, new markets and new processes and for combining different technologies makes it difficult fororganisations, however sophisticated, to operate autonomously. Networks – alliances, partnerships, joint venturesand outsourcing – have become the way to harness the disparate range of expertise and economic resourcesnecessary to compete in today’s changing markets. Many of today’s fast-moving companies see the entrepreneurialtask as being two-fold. First, they have to identify emerging opportunities in the market; second, they have to puttogether a network of companies with the collective set of capabilities to capitalise on the opportunity.
In the past companies aimed at vertical integration – performing for themselves as many of the processes as possiblefrom raw material supply to final delivery. Networks, however, allow companies to unbundle their business andfocus only on those particular activities where they have unique capabilities to add value. Increasingly, competitionis not between individual companies but between networks.
THE 7-S FRAMEWORK
One of the most useful ways of auditing the effectiveness of the company’s organisational value drivers is the7-S framework developed by the McKinsey consulting firm (Figure 2.5).[20] The firm’s analysis suggests that thesedrivers are essential for long-term performance. At the heart of the successful organisation is a set of shared valuesor vision that unites, challenges and gives direction to all the people working there. At British Airways it used tobe to create ‘the world’s favourite airline’. Under the dynamic leadership of Lord King, the whole organisationwas motivated to achieving this goal. Under subsequent, more financially-driven management, British Airways hasbecome a much-maligned airline. Shared values are not financial goals but the motivational drivers that make theformer achievable.
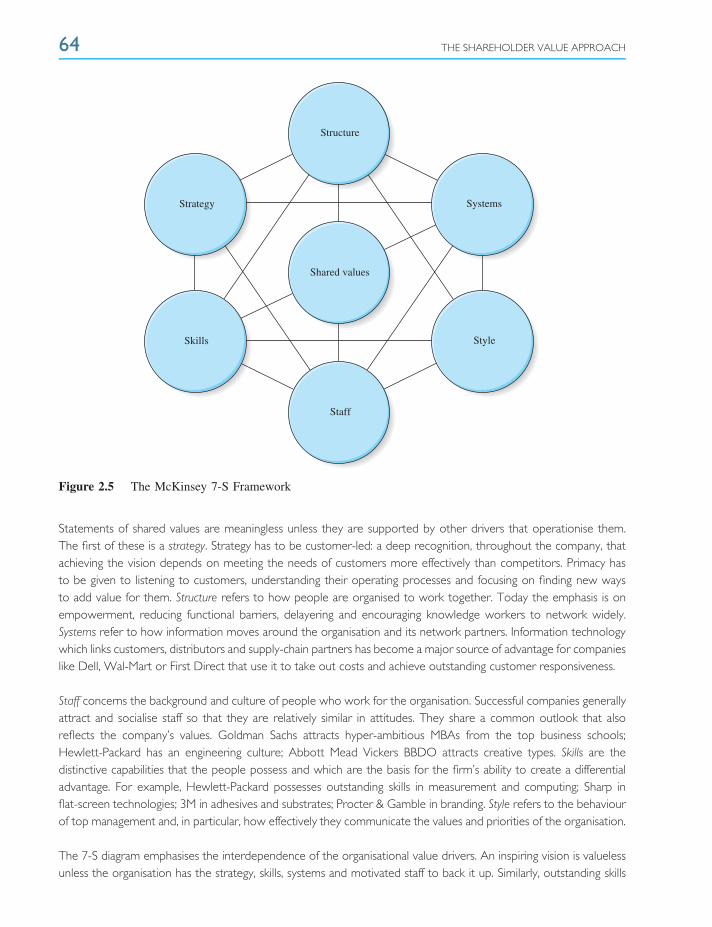
64 THE SHAREHOLDER VALUE APPROACH
Structure
Strategy
Skills
Shared values
Staff
Style
Systems
Figure 2.5 The McKinsey 7-S Framework
Statements of shared values are meaningless unless they are supported by other drivers that operationise them.The first of these is a strategy. Strategy has to be customer-led: a deep recognition, throughout the company, thatachieving the vision depends on meeting the needs of customers more effectively than competitors. Primacy hasto be given to listening to customers, understanding their operating processes and focusing on finding new waysto add value for them. Structure refers to how people are organised to work together. Today the emphasis is onempowerment, reducing functional barriers, delayering and encouraging knowledge workers to network widely.Systems refer to how information moves around the organisation and its network partners. Information technologywhich links customers, distributors and supply-chain partners has become a major source of advantage for companieslike Dell, Wal-Mart or First Direct that use it to take out costs and achieve outstanding customer responsiveness.
Staff concerns the background and culture of people who work for the organisation. Successful companies generallyattract and socialise staff so that they are relatively similar in attitudes. They share a common outlook that alsoreflects the company’s values. Goldman Sachs attracts hyper-ambitious MBAs from the top business schools;Hewlett-Packard has an engineering culture; Abbott Mead Vickers BBDO attracts creative types. Skills are thedistinctive capabilities that the people possess and which are the basis for the firm’s ability to create a differentialadvantage. For example, Hewlett-Packard possesses outstanding skills in measurement and computing; Sharp inflat-screen technologies; 3M in adhesives and substrates; Procter & Gamble in branding. Style refers to the behaviourof top management and, in particular, how effectively they communicate the values and priorities of the organisation.
The 7-S diagram emphasises the interdependence of the organisational value drivers. An inspiring vision is valuelessunless the organisation has the strategy, skills, systems and motivated staff to back it up. Similarly, outstanding skills
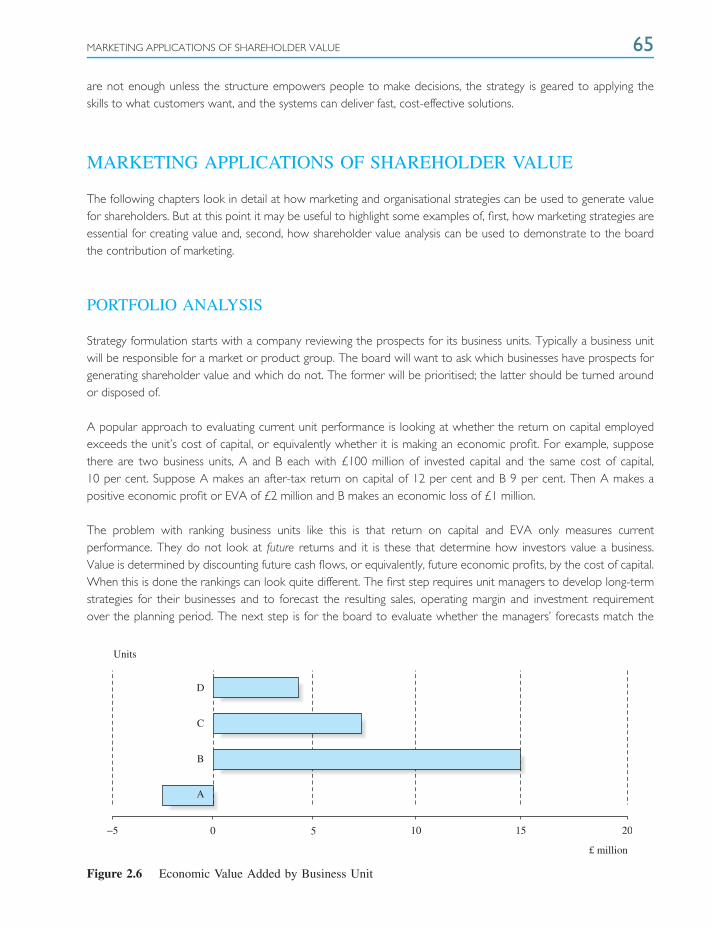
MARKETING APPLICATIONS OF SHAREHOLDER VALUE 65
are not enough unless the structure empowers people to make decisions, the strategy is geared to applying theskills to what customers want, and the systems can deliver fast, cost-effective solutions.
MARKETING APPLICATIONS OF SHAREHOLDER VALUE
The following chapters look in detail at how marketing and organisational strategies can be used to generate valuefor shareholders. But at this point it may be useful to highlight some examples of, first, how marketing strategies areessential for creating value and, second, how shareholder value analysis can be used to demonstrate to the boardthe contribution of marketing.
PORTFOLIO ANALYSIS
Strategy formulation starts with a company reviewing the prospects for its business units. Typically a business unitwill be responsible for a market or product group. The board will want to ask which businesses have prospects forgenerating shareholder value and which do not. The former will be prioritised; the latter should be turned aroundor disposed of.
A popular approach to evaluating current unit performance is looking at whether the return on capital employedexceeds the unit’s cost of capital, or equivalently whether it is making an economic profit. For example, supposethere are two business units, A and B each with £100 million of invested capital and the same cost of capital,10 per cent. Suppose A makes an after-tax return on capital of 12 per cent and B 9 per cent. Then A makes apositive economic profit or EVA of £2 million and B makes an economic loss of £1 million.
The problem with ranking business units like this is that return on capital and EVA only measures currentperformance. They do not look at future returns and it is these that determine how investors value a business.Value is determined by discounting future cash flows, or equivalently, future economic profits, by the cost of capital.When this is done the rankings can look quite different. The first step requires unit managers to develop long-termstrategies for their businesses and to forecast the resulting sales, operating margin and investment requirementover the planning period. The next step is for the board to evaluate whether the managers’ forecasts match the
Units
A
B
C
D
−5 0 5 10 15 20
£ million
Figure 2.6 Economic Value Added by Business Unit
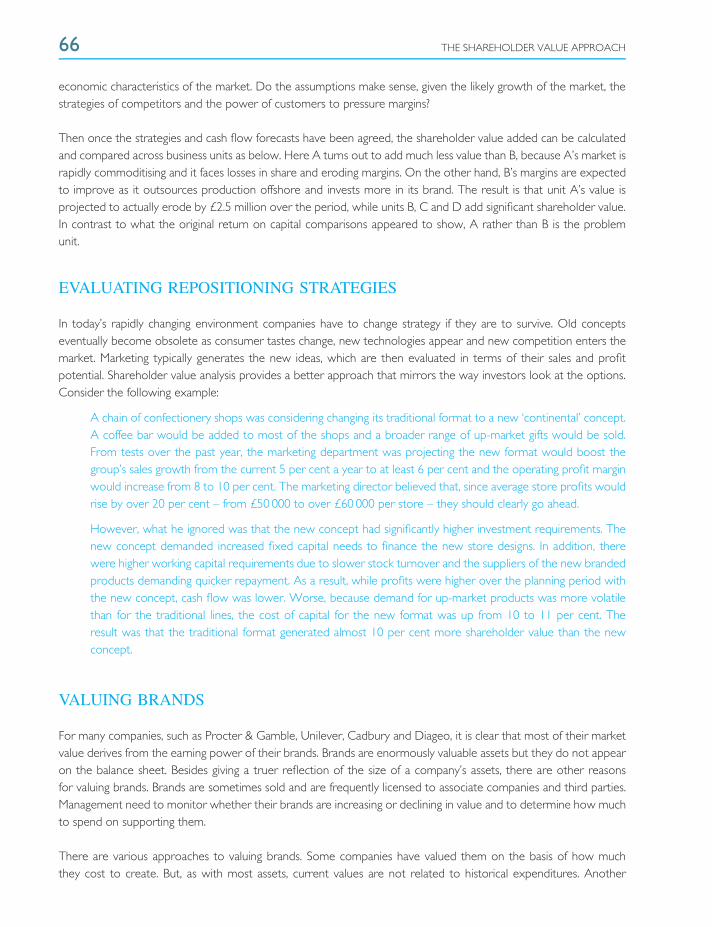
66 THE SHAREHOLDER VALUE APPROACH
economic characteristics of the market. Do the assumptions make sense, given the likely growth of the market, thestrategies of competitors and the power of customers to pressure margins?
Then once the strategies and cash flow forecasts have been agreed, the shareholder value added can be calculatedand compared across business units as below. Here A turns out to add much less value than B, because A’s market israpidly commoditising and it faces losses in share and eroding margins. On the other hand, B’s margins are expectedto improve as it outsources production offshore and invests more in its brand. The result is that unit A’s value isprojected to actually erode by £2.5 million over the period, while units B, C and D add significant shareholder value.In contrast to what the original return on capital comparisons appeared to show, A rather than B is the problemunit.
EVALUATING REPOSITIONING STRATEGIES
In today’s rapidly changing environment companies have to change strategy if they are to survive. Old conceptseventually become obsolete as consumer tastes change, new technologies appear and new competition enters themarket. Marketing typically generates the new ideas, which are then evaluated in terms of their sales and profitpotential. Shareholder value analysis provides a better approach that mirrors the way investors look at the options.Consider the following example:
A chain of confectionery shops was considering changing its traditional format to a new ‘continental’ concept.A coffee bar would be added to most of the shops and a broader range of up-market gifts would be sold.From tests over the past year, the marketing department was projecting the new format would boost thegroup’s sales growth from the current 5 per cent a year to at least 6 per cent and the operating profit marginwould increase from 8 to 10 per cent. The marketing director believed that, since average store profits wouldrise by over 20 per cent – from £50 000 to over £60 000 per store – they should clearly go ahead.
However, what he ignored was that the new concept had significantly higher investment requirements. Thenew concept demanded increased fixed capital needs to finance the new store designs. In addition, therewere higher working capital requirements due to slower stock turnover and the suppliers of the new brandedproducts demanding quicker repayment. As a result, while profits were higher over the planning period withthe new concept, cash flow was lower. Worse, because demand for up-market products was more volatilethan for the traditional lines, the cost of capital for the new format was up from 10 to 11 per cent. Theresult was that the traditional format generated almost 10 per cent more shareholder value than the newconcept.
VALUING BRANDS
For many companies, such as Procter & Gamble, Unilever, Cadbury and Diageo, it is clear that most of their marketvalue derives from the earning power of their brands. Brands are enormously valuable assets but they do not appearon the balance sheet. Besides giving a truer reflection of the size of a company’s assets, there are other reasonsfor valuing brands. Brands are sometimes sold and are frequently licensed to associate companies and third parties.Management need to monitor whether their brands are increasing or declining in value and to determine how muchto spend on supporting them.
There are various approaches to valuing brands. Some companies have valued them on the basis of how muchthey cost to create. But, as with most assets, current values are not related to historical expenditures. Another

MARKETING APPLICATIONS OF SHAREHOLDER VALUE 67
approach is based on estimating the royalty rate that would have to be paid if the company had to license thebrand. Unfortunately, detailed royalty rates are not easily obtainable. The approach that is now increasingly used isthe standard shareholder value approach. The brand value is calculated by discounting back to the net present valueexcess net earnings attributable to the brand.
This involves three steps. First, free cash flow is projected for a 5–10-year forecast period. Second, the percentageof this cash flow that can be attributed to the brand is estimated. Third, this brand cash flow is then discounted bythe cost of capital, to give the value of the brand.[21]
EVALUATING ADVERTISING EFFECTIVENESS
Advertising agencies and brand managers tend to justify the effectiveness of advertising by looking at changes inawareness or attitudes to the brand. But to financially orientated board members there is little connection betweenthese qualitative measures and the share price. They are unconvinced by arguments saying that advertising isnecessary or that postponing or reducing it will do harm.
Accountants often challenge marketing management to justify advertising by showing how it increases profits in thebudget for next year. But this is a trap marketing needs to avoid. Advertising rarely increases short-term profits.Indeed, cutting advertising generally increases profits in the short-run. Brand-building advertising is an investmentand, as with any investment, its effectiveness should be based on whether it increases long-term discounted cashflow or economic profits.
To do this marketing needs to identify the effects of advertising on sales over the planning period. After-tax cashflow or economic profits have then got to be discounted to their present value. Whether value is created is thendetermined by comparing the shareholder value with and without advertising. Let us look at an actual example.[22]
Between 1996 and 1998 Orange Plc, a new UK mobile phone operator, spent £44 million on brand-orientatedadvertising. To estimate its effect on shareholder value, the first task was to estimate the impact of the advertisingon sales over the planning period. Revenue growth in telecoms is a function of the number of subscribers attracted,the number retained from year to year, and the average amount spent. An econometric model was used to isolatethe effect of advertising on these variables from the other factors affecting them, such as distribution, competitiveactivity, price, and seasonal and market trends. Cash flow for each year and the continuing value were then projectedand discounted by the cost of capital.
The results are summarised in Table 2.5 (on page 68). Shareholder value was estimated to have increased by nearly£3 billion as a result of the advertising strategy and the implied share price almost doubled. Faced with such acomprehensive case, and presented in the same format as investors employ to evaluate strategy, the case for theeffectiveness of the advertising campaign was hard to resist and the principles it illustrates still resonate.
ACQUISITIONS
The past decade has seen an enormous growth in the number of acquisitions. These have been triggered byderegulation, excess capacity in many industries and the drive to achieve global economies of scale. But makingan acquisition can be a gamble and the evidence suggests that most acquisitions fail to add value for the acquirer.

68 THE SHAREHOLDER VALUE APPROACH
Table 2.5 Orange Plc: Shareholder Value Summary
(£ million) No advertising With advertising
Cost of capital (%) 9 9
PV forecast cash flows 328 1035
PV continuing value 4172 6396
Total present value 4500 7431
Other investments 459 459
Enterprise value 4959 7890
Debt 1616 1571
Shareholder value 3343 6319
Shareholder value added 1198 1198
Shares outstanding (m) 80 80
Implied value per share (£) 2.79 5.28
Determining whether an acquisition is likely to make sense employs the same type of analysis used to evaluate anyother strategy.
An acquisition adds value if the price paid is less than the maximum acceptable purchase price. The maximumacceptable price is the stand-alone value of the prospect plus the value of any synergies that are likely to arise fromcombining the two companies. The stand-alone value will be the market value, if the potential acquisition is publiclytraded (provided no anticipated take-over premium has become impounded in the market price). The value of anysynergies is calculated by projecting the cash flow of the prospect taking into account any benefits from the lowercosts or enhanced differentiation that the company would gain from being combined with the acquirer. When thepresent value of the forecast and terminal value cash flows are added, the implied value per share can be calculatedand this is the maximum acceptable price. If the company can be bought for less than this, value is expected to becreated.
LIMITATIONS OF SHAREHOLDER VALUE ANALYSIS
The essence of the shareholder value approach is that managers should be evaluated on their ability to developstrategies that earn returns greater than their cost of capital. The advantages of this approach are that itmaximises the value of the firm for investors and creates the cash flow to enable it to meet the claims of otherstakeholders – employees, suppliers and the community. It is superior to traditional accounting approaches in that itavoids the short-termism inherent in targeting earnings, ROI or payback criteria. In an age where intangibles – brands,skills, customer and supplier relationships – are the primary assets, accounting or book value has little use for valuingbusinesses.
But like any technique, managers need to be aware of the assumptions and approximations needed to applyshareholder value analysis to real-world problems. Incorrect assumptions and inadequate estimates of the required
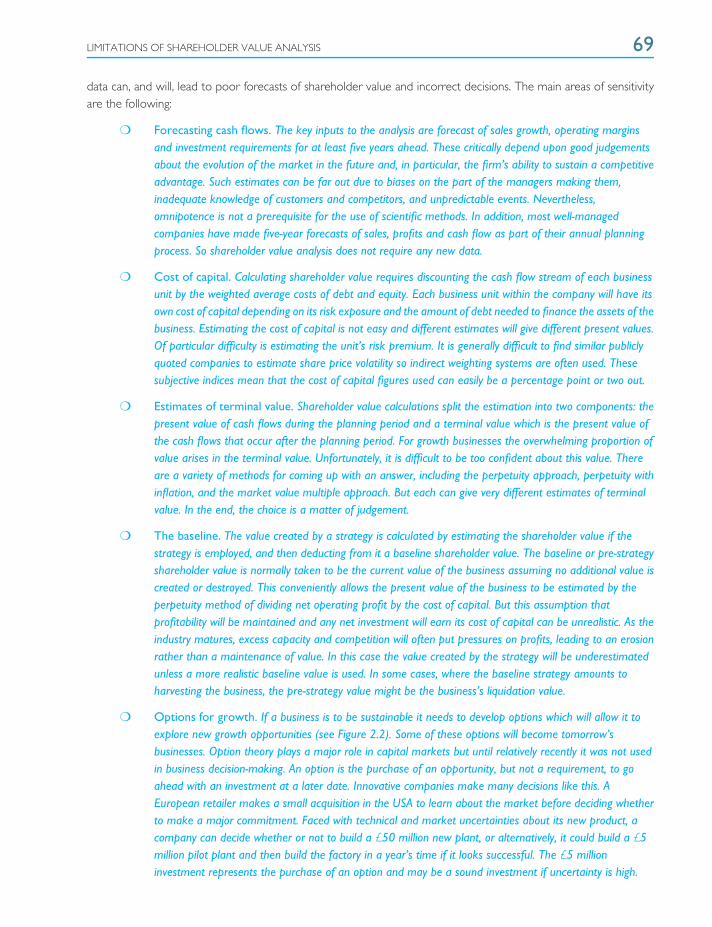
LIMITATIONS OF SHAREHOLDER VALUE ANALYSIS 69
data can, and will, lead to poor forecasts of shareholder value and incorrect decisions. The main areas of sensitivityare the following:
❍ Forecasting cash flows. The key inputs to the analysis are forecast of sales growth, operating marginsand investment requirements for at least five years ahead. These critically depend upon good judgementsabout the evolution of the market in the future and, in particular, the firm’s ability to sustain a competitiveadvantage. Such estimates can be far out due to biases on the part of the managers making them,inadequate knowledge of customers and competitors, and unpredictable events. Nevertheless,omnipotence is not a prerequisite for the use of scientific methods. In addition, most well-managedcompanies have made five-year forecasts of sales, profits and cash flow as part of their annual planningprocess. So shareholder value analysis does not require any new data.
❍ Cost of capital. Calculating shareholder value requires discounting the cash flow stream of each businessunit by the weighted average costs of debt and equity. Each business unit within the company will have itsown cost of capital depending on its risk exposure and the amount of debt needed to finance the assets of thebusiness. Estimating the cost of capital is not easy and different estimates will give different present values.Of particular difficulty is estimating the unit’s risk premium. It is generally difficult to find similar publiclyquoted companies to estimate share price volatility so indirect weighting systems are often used. Thesesubjective indices mean that the cost of capital figures used can easily be a percentage point or two out.
❍ Estimates of terminal value. Shareholder value calculations split the estimation into two components: thepresent value of cash flows during the planning period and a terminal value which is the present value ofthe cash flows that occur after the planning period. For growth businesses the overwhelming proportion ofvalue arises in the terminal value. Unfortunately, it is difficult to be too confident about this value. Thereare a variety of methods for coming up with an answer, including the perpetuity approach, perpetuity withinflation, and the market value multiple approach. But each can give very different estimates of terminalvalue. In the end, the choice is a matter of judgement.
❍ The baseline. The value created by a strategy is calculated by estimating the shareholder value if thestrategy is employed, and then deducting from it a baseline shareholder value. The baseline or pre-strategyshareholder value is normally taken to be the current value of the business assuming no additional value iscreated or destroyed. This conveniently allows the present value of the business to be estimated by theperpetuity method of dividing net operating profit by the cost of capital. But this assumption thatprofitability will be maintained and any net investment will earn its cost of capital can be unrealistic. As theindustry matures, excess capacity and competition will often put pressures on profits, leading to an erosionrather than a maintenance of value. In this case the value created by the strategy will be underestimatedunless a more realistic baseline value is used. In some cases, where the baseline strategy amounts toharvesting the business, the pre-strategy value might be the business’s liquidation value.
❍ Options for growth. If a business is to be sustainable it needs to develop options which will allow it toexplore new growth opportunities (see Figure 2.2). Some of these options will become tomorrow’sbusinesses. Option theory plays a major role in capital markets but until relatively recently it was not usedin business decision-making. An option is the purchase of an opportunity, but not a requirement, to goahead with an investment at a later date. Innovative companies make many decisions like this. AEuropean retailer makes a small acquisition in the USA to learn about the market before deciding whetherto make a major commitment. Faced with technical and market uncertainties about its new product, acompany can decide whether or not to build a £50 million new plant, or alternatively, it could build a £5million pilot plant and then build the factory in a year’s time if it looks successful. The £5 millioninvestment represents the purchase of an option and may be a sound investment if uncertainty is high.
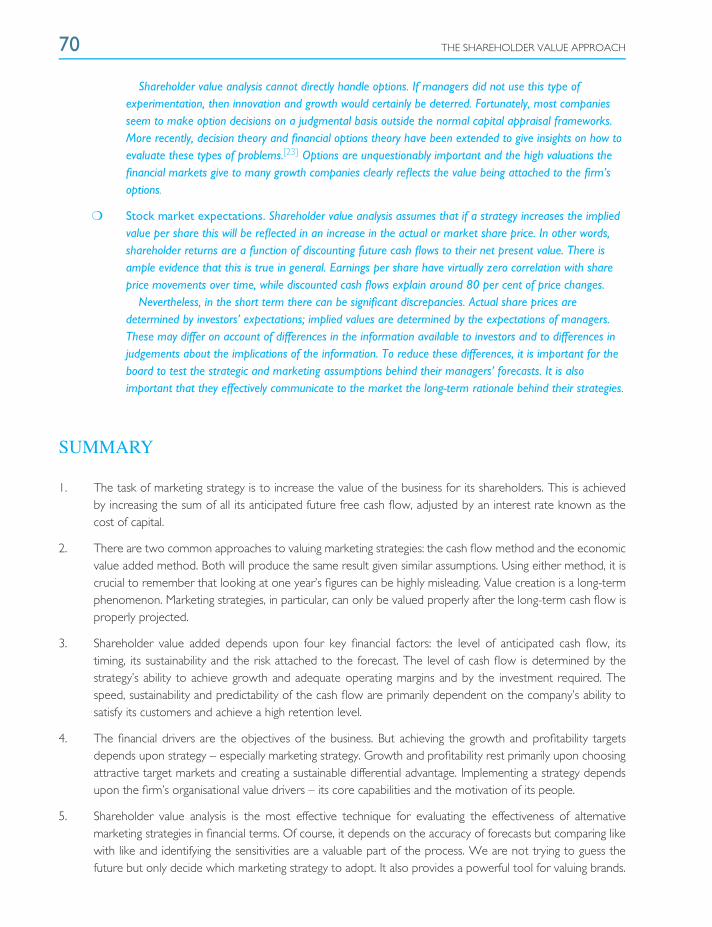
70 THE SHAREHOLDER VALUE APPROACH
Shareholder value analysis cannot directly handle options. If managers did not use this type ofexperimentation, then innovation and growth would certainly be deterred. Fortunately, most companiesseem to make option decisions on a judgmental basis outside the normal capital appraisal frameworks.More recently, decision theory and financial options theory have been extended to give insights on how toevaluate these types of problems.[23] Options are unquestionably important and the high valuations thefinancial markets give to many growth companies clearly reflects the value being attached to the firm’soptions.
❍ Stock market expectations. Shareholder value analysis assumes that if a strategy increases the impliedvalue per share this will be reflected in an increase in the actual or market share price. In other words,shareholder returns are a function of discounting future cash flows to their net present value. There isample evidence that this is true in general. Earnings per share have virtually zero correlation with shareprice movements over time, while discounted cash flows explain around 80 per cent of price changes.
Nevertheless, in the short term there can be significant discrepancies. Actual share prices aredetermined by investors’ expectations; implied values are determined by the expectations of managers.These may differ on account of differences in the information available to investors and to differences injudgements about the implications of the information. To reduce these differences, it is important for theboard to test the strategic and marketing assumptions behind their managers’ forecasts. It is alsoimportant that they effectively communicate to the market the long-term rationale behind their strategies.
SUMMARY
1. The task of marketing strategy is to increase the value of the business for its shareholders. This is achievedby increasing the sum of all its anticipated future free cash flow, adjusted by an interest rate known as thecost of capital.
2. There are two common approaches to valuing marketing strategies: the cash flow method and the economicvalue added method. Both will produce the same result given similar assumptions. Using either method, it iscrucial to remember that looking at one year’s figures can be highly misleading. Value creation is a long-termphenomenon. Marketing strategies, in particular, can only be valued properly after the long-term cash flow isproperly projected.
3. Shareholder value added depends upon four key financial factors: the level of anticipated cash flow, itstiming, its sustainability and the risk attached to the forecast. The level of cash flow is determined by thestrategy’s ability to achieve growth and adequate operating margins and by the investment required. Thespeed, sustainability and predictability of the cash flow are primarily dependent on the company’s ability tosatisfy its customers and achieve a high retention level.
4. The financial drivers are the objectives of the business. But achieving the growth and profitability targetsdepends upon strategy – especially marketing strategy. Growth and profitability rest primarily upon choosingattractive target markets and creating a sustainable differential advantage. Implementing a strategy dependsupon the firm’s organisational value drivers – its core capabilities and the motivation of its people.
5. Shareholder value analysis is the most effective technique for evaluating the effectiveness of alternativemarketing strategies in financial terms. Of course, it depends on the accuracy of forecasts but comparing likewith like and identifying the sensitivities are a valuable part of the process. We are not trying to guess thefuture but only decide which marketing strategy to adopt. It also provides a powerful tool for valuing brands.
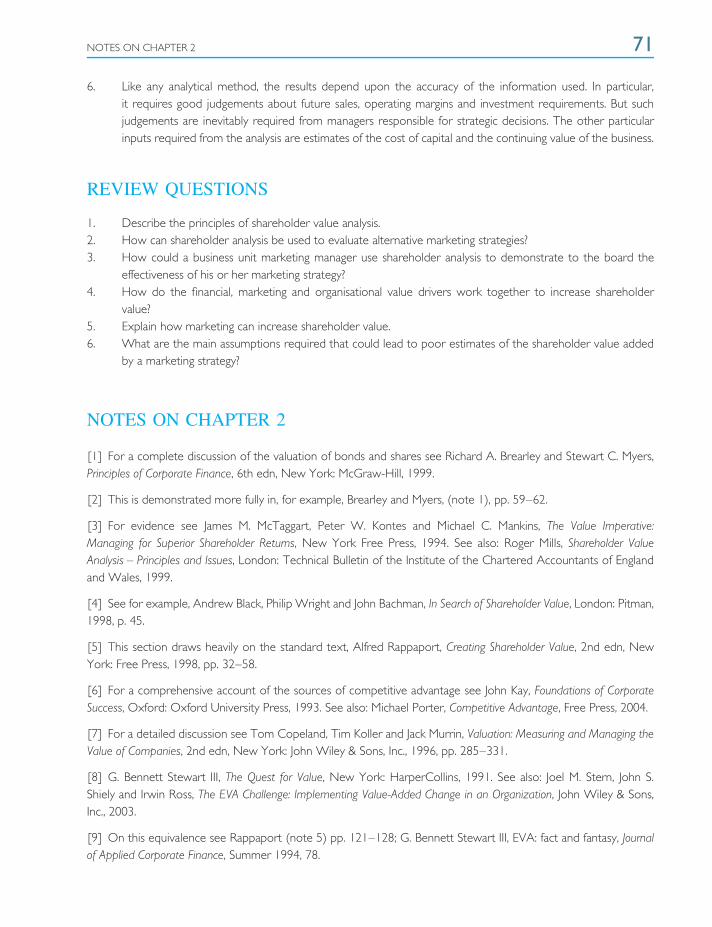
NOTES ON CHAPTER 2 71
6. Like any analytical method, the results depend upon the accuracy of the information used. In particular,it requires good judgements about future sales, operating margins and investment requirements. But suchjudgements are inevitably required from managers responsible for strategic decisions. The other particularinputs required from the analysis are estimates of the cost of capital and the continuing value of the business.
REVIEW QUESTIONS
1. Describe the principles of shareholder value analysis.2. How can shareholder analysis be used to evaluate alternative marketing strategies?3. How could a business unit marketing manager use shareholder analysis to demonstrate to the board the
effectiveness of his or her marketing strategy?4. How do the financial, marketing and organisational value drivers work together to increase shareholder
value?5. Explain how marketing can increase shareholder value.6. What are the main assumptions required that could lead to poor estimates of the shareholder value added
by a marketing strategy?
NOTES ON CHAPTER 2
[1] For a complete discussion of the valuation of bonds and shares see Richard A. Brearley and Stewart C. Myers,Principles of Corporate Finance, 6th edn, New York: McGraw-Hill, 1999.
[2] This is demonstrated more fully in, for example, Brearley and Myers, (note 1), pp. 59–62.
[3] For evidence see James M. McTaggart, Peter W. Kontes and Michael C. Mankins, The Value Imperative:Managing for Superior Shareholder Returns, New York Free Press, 1994. See also: Roger Mills, Shareholder ValueAnalysis – Principles and Issues, London: Technical Bulletin of the Institute of the Chartered Accountants of Englandand Wales, 1999.
[4] See for example, Andrew Black, Philip Wright and John Bachman, In Search of Shareholder Value, London: Pitman,1998, p. 45.
[5] This section draws heavily on the standard text, Alfred Rappaport, Creating Shareholder Value, 2nd edn, NewYork: Free Press, 1998, pp. 32–58.
[6] For a comprehensive account of the sources of competitive advantage see John Kay, Foundations of CorporateSuccess, Oxford: Oxford University Press, 1993. See also: Michael Porter, Competitive Advantage, Free Press, 2004.
[7] For a detailed discussion see Tom Copeland, Tim Koller and Jack Murrin, Valuation: Measuring and Managing theValue of Companies, 2nd edn, New York: John Wiley & Sons, Inc., 1996, pp. 285–331.
[8] G. Bennett Stewart III, The Quest for Value, New York: HarperCollins, 1991. See also: Joel M. Stern, John S.Shiely and Irwin Ross, The EVA Challenge: Implementing Value-Added Change in an Organization, John Wiley & Sons,Inc., 2003.
[9] On this equivalence see Rappaport (note 5) pp. 121–128; G. Bennett Stewart III, EVA: fact and fantasy, Journalof Applied Corporate Finance, Summer 1994, 78.
72 THE SHAREHOLDER VALUE APPROACH
[10] Assume initial sales are 100, costs are 90 and the cash tax rate is 30 per cent. With a 5 per cent sales increaseand volume unchanged, sales rise to 105, costs stay the same, pre-tax profits rise from 10 to 15, and NOPAT from7 to 10.5.
[11] Working on the same example, assume that half its costs are variable. With a 5 per cent volume loss on thenew price, sales slip to 99.75, variable costs drop from 45 to 42.75, then pre-tax profit increases from 10 to 12 andNOPAT from 7 to 8.4.
[12] See for example, Michael Hammer and James Champy, Reengineering the Corporation, London: Brealey, 1993.
[13] Here sales rise from 100 to 130, variable costs increase from 45 to 58.5, fixed costs remain unchanged at 45,pre-tax profits go from 10 to 26.5 and NOPAT from 7 to 18.6 or to 14 per cent of sales.
[14] Under the low-investment strategy the present value of the continuing value is £754 million and the shareholdervalue is £1287 million. Under the high-investment strategy the continuing value is £894 million and the shareholdervalue is £1393 million.
[15] For detailed development of threshold margin see Rappaport, (note 5) pp. 51–55. Rappaport calls the figureused here the incremental threshold margin.
[16] George Stalk and Thomas M. Hout, Competing Against Time, New York: Free Press, 1990.
[17] Robin Cooper and R.S. Kaplan, The Design of Cost Management Systems, Englewood Cliffs, NJ: Prentice Hall,1991.
[18] See the very influential research of Frederick F. Reichheld, The Loyalty Effect: The Hidden Forces behind Growth,Profits and Lasting Value, Boston, MA: Harvard Business School Press, 1996, 2001. See also, Frederick F. Reichheld,Loyalty Rules: How Today’s Leaders Build Lasting Relationships, Boston, MA: Harvard Business School Press, 2003.
[19] Fred Wiersema, Customer Intimacy, London: HarperCollins, 1998. For a parallel discussion see Don Peppersand Martha Rogers, Enterprise One-to-One, New York, Doubleday, 1997. See also: Peppers and Rogers: ManagingCustomer Relationships: A Strategic Framework, John Wiley & Sons, Inc., 2004.
[20] For a fuller description see Richard Tanner Pascale, Managing on the Edge, London: Viking, 1990, pp. 37–50.
[21] For a detailed review of brand valuation methods see David Haigh, Brand Valuation: A Review of Current Practice,London: Institute of Practitioners in Advertising, 1996.
[22] This case is described in a paper written by the advertising agency, WCRS, ‘The FTSE’s Bright, the FTSE’sOrange: how advertising enhanced Orange PLC shareholder value’, published in the IPA Advertising EffectivenessAwards 1998, London: NTC Publications, 1999.
[23] For an introduction to option theory in business see Thomas E. Copeland and Philip T. Keenan, How much isflexibility worth? McKinsey Quarterly, no. 2, 1998, 38–49.
3The Marketing Value Driver
‘Increased customer loyalty is the single most important driver of long-term financial performance.’Dave Illingworth, Lexus US
INTRODUCTION AND OBJECTIVES
This chapter looks at what managers need to know about marketing in today’s information age. Marketing is aboutmeeting customers’ needs and developing their trust and loyalty. Only by creating such relationships can the firmachieve profitable growth and shareholder value. The starting point for successful marketing is understanding theneeds of customers and developing a proposition that they will regard as offering superior value. The next step is todevelop a service that customers will trust and want to continue to do business with. All this in turn depends uponhaving built within the organisation a level of skills, capabilities and commitment that enables the firm to deliversuperior value than competitors.
In the past marketing was less important. High profitability could be achieved by operating in regulated markets,controlling scarce production resources or distribution channels, or acquiring and rationalising poorly performingbusinesses. But now with deregulation, global competition and the information revolution transforming communi-cations and distribution, such opportunities are fast disappearing. Growth and profitability are increasingly based onthe firm’s ability at marketing.
This chapter looks at how successful marketing drives growth, profitability and shareholder returns. By the time youhave read this chapter, you will be able to:
❍ Define marketing in terms of shareholder value
❍ Understand how delivering value to customers is the basis for creating shareholder value
❍ Explain the significance of the firm’s differential advantage
❍ Understand the increasing importance of measures of customer satisfaction, loyalty and trust in modernbusinesses
❍ Describe the essential requirements for delivering customer value
The chapter conceptualises value-based marketing in terms of four major steps. The first step is developing a deepunderstanding of the customer’s needs, operating procedures and decision-making processes. This provides theessential information for determining what is of most value to customers. The second step is formulating valuepropositions that meet the needs of customers and create a differential advantage – propositions that are superiorto the offers of competitors. The third step is moving from successful transactions with customers to building
74 THE MARKETING VALUE DRIVER
long-term relationships with them, whereby they continue to buy again and again. This entails developing a level ofloyalty and trust based upon satisfaction and confidence with the supplier’s commitment. Finally, managers have tounderstand that delivering superior value to customers requires more than just a customer focus: it also requiressuperior knowledge, skills, systems and marketing assets. Management has to invest and maintain a superior resourcebase from which great products and services can be produced to make superior marketing a reality.
A NEW DEFINITION OF MARKETING
Marketing has not had the impact on top management that its importance merits. Chapter 1 showed that this waslargely due to it having objectives that were not aligned to management’s central goal of maximising shareholdervalue. Chapter 2 went on to demonstrate how shareholder value analysis provides a powerful tool for proving theeffectiveness of marketing. This concept of value-based marketing leads to a new definition of the field that will beamplified in this chapter. The new definition is:
Marketing is the management process that seeks to maximise returns to shareholders by developing and implementingstrategies to build relationships of trust with high-value customers and to create a sustainable differential advantage.
This defines the objective of marketing in the business enterprise and the strategies that contribute to it. Theobjective is to maximise returns to the owners of the business, as measured by its long-term dividend streamand capital growth. The specific contribution of marketing lies in the formulation of strategies to choose the rightcustomers, build relationships of trust with them, and create a differential advantage.
Choosing the right customers is important because some customers do not offer the potential to create value,either because the costs of serving them exceed the benefits they generate, or because the company does not havethe appropriate bundle of skills to serve them effectively. It wants long-term relationships with its chosen customersbecause loyal customers make possible faster and more profitable growth. A firm’s ability to earn a return above thecost of capital depends upon it maintaining a differential advantage – a reason why target customers perceive thefirm as offering superior value to competitors. A strategy to create a differential advantage is based on understandingthe needs of customers and the strategies of competitors.
CREATING CUSTOMER VALUE
Top management needs to be deeply committed to marketing because marketing drives growth and shareholdervalue. The essential idea of marketing is offering customers superior value. By delivering superior value to customers,management in turn can deliver superior value to shareholders. Indeed this formula – customer value createsshareholder value – is the fundamental principle of capitalism. In a free-enterprise system individual consumerschoose how to spend their money. In turn firms compete with one another to attract the patronage of customers.Firms making offers that do not appeal to customers go out of business because they do not generate the cash flowto pay their suppliers of materials, labour and capital.
MEETING CUSTOMER NEEDS
The marketing approach to creating customer value is based on three principles. First, it recognises that in choosingbetween competing companies, the customer will select the offer that he or she perceives to be of best value.
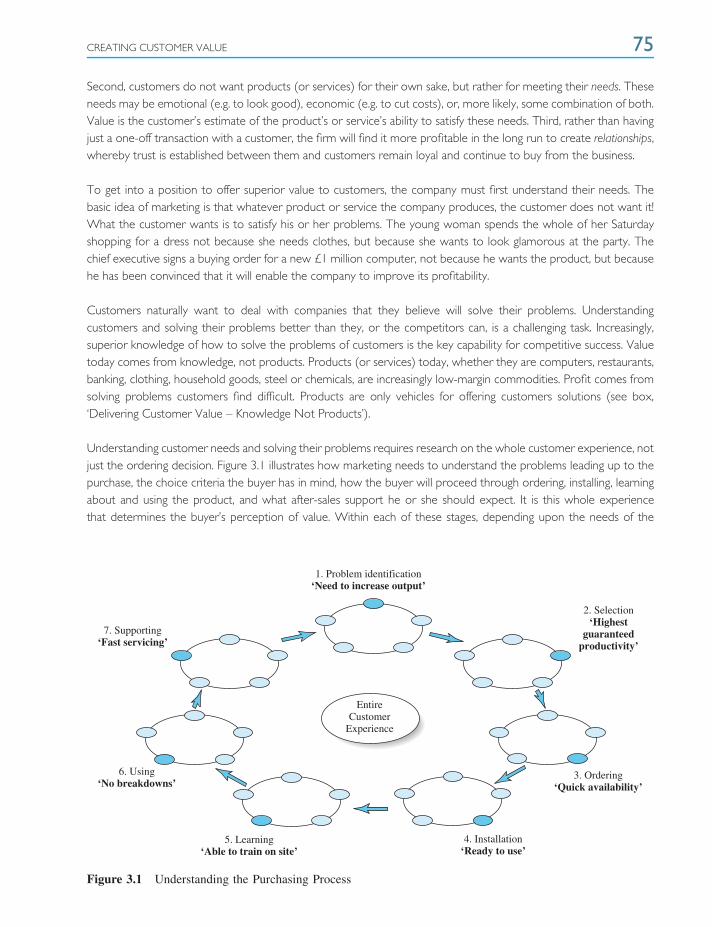
CREATING CUSTOMER VALUE 75
Second, customers do not want products (or services) for their own sake, but rather for meeting their needs. Theseneeds may be emotional (e.g. to look good), economic (e.g. to cut costs), or, more likely, some combination of both.Value is the customer’s estimate of the product’s or service’s ability to satisfy these needs. Third, rather than havingjust a one-off transaction with a customer, the firm will find it more profitable in the long run to create relationships,whereby trust is established between them and customers remain loyal and continue to buy from the business.
To get into a position to offer superior value to customers, the company must first understand their needs. Thebasic idea of marketing is that whatever product or service the company produces, the customer does not want it!What the customer wants is to satisfy his or her problems. The young woman spends the whole of her Saturdayshopping for a dress not because she needs clothes, but because she wants to look glamorous at the party. Thechief executive signs a buying order for a new £1 million computer, not because he wants the product, but becausehe has been convinced that it will enable the company to improve its profitability.
Customers naturally want to deal with companies that they believe will solve their problems. Understandingcustomers and solving their problems better than they, or the competitors can, is a challenging task. Increasingly,superior knowledge of how to solve the problems of customers is the key capability for competitive success. Valuetoday comes from knowledge, not products. Products (or services) today, whether they are computers, restaurants,banking, clothing, household goods, steel or chemicals, are increasingly low-margin commodities. Profit comes fromsolving problems customers find difficult. Products are only vehicles for offering customers solutions (see box,‘Delivering Customer Value – Knowledge Not Products’).
Understanding customer needs and solving their problems requires research on the whole customer experience, notjust the ordering decision. Figure 3.1 illustrates how marketing needs to understand the problems leading up to thepurchase, the choice criteria the buyer has in mind, how the buyer will proceed through ordering, installing, learningabout and using the product, and what after-sales support he or she should expect. It is this whole experiencethat determines the buyer’s perception of value. Within each of these stages, depending upon the needs of the
7. Supporting‘Fast servicing’
6. Using‘No breakdowns’
5. Learning‘Able to train on site’
4. Installation‘Ready to use’
3. Ordering‘Quick availability’
1. Problem identification‘Need to increase output’
2. Selection‘Highest
guaranteedproductivity’
EntireCustomer
Experience
Figure 3.1 Understanding the Purchasing Process

76 THE MARKETING VALUE DRIVER
individual buyer, there will be one or two critical interfaces between buyer and seller that will drive the customer’sperception of value and the decision of whether or not to buy again. These may be the supplier’s willingness to pullout all the stops when the customer needs fast repairs to the equipment, or their ability to put together effectivetraining for the customer’s operatives. These are often called moments of truth. Detailed knowledge of this processand management of these moments of truth are the foundations for a strategy to deliver customer value and createcompetitive advantage.
Delivering Customer Value – Knowledge Not Products
Commoditisation is a problem facing many suppliers today. This was certainly true for a leading producer ofindustrial sewing thread facing increasing competition from new low-priced entrants. It received a demand fromone of its largest customers, for a 20 per cent price cut. The customer was a China-based contract manufacturerfor two of the leading US sports shoe companies.
Rather than lose the business, the company sent in a team of experts to analyse the productivity of the customer’soperations. It discovered that sewing thread accounted for only 2 per cent of its operating costs, but sewing activitiesaccounted for at least 50 per cent of total costs. That is, most of the labour and machinery was absorbed institching operations.
Returns from customers for faulty products too were invariably due to poor stitching. The customer’s operatingstatement is shown below. The team discovered that a major productivity problem was breaks in the thread duringsewing operations. Such breaks resulted in lost output, wasted labour and materials, and lost machine time. Theteam found that thread breaks could be substantially reduced by better machine maintenance, improved operatortraining and the introduction of alternative sewing patterns.
Operating costs per 1 million shoes
% $000Costs 100 10 000
Raw materials 35 3 500Thread 2 200Labour 30 3 000Returns 10 1 000Depreciation 7 700Overheads 16 1 600
Profit 15 1 725
The customer’s operating margin was 15 per cent. The company showed its customer that while a 20 per cent cutin the thread price would improve profits by only 2 per cent, a realignment of the sewing operation could reducetotal operating costs by at least 7 per cent – improving its operating profits by over 40 per cent.
The customer was so impressed by the supplier’s knowledge of sewing operations that the business was renegotiated.The company was appointed its customer’s ‘business partner’ and paid a fee for managing the sewing operations.Instead of being paid for metres of thread, it was paid for its knowledge in improving customer productivity. It wasa win–win situation: the customer made substantial gains in productivity; the supplier retained the account at asignificantly higher margin.
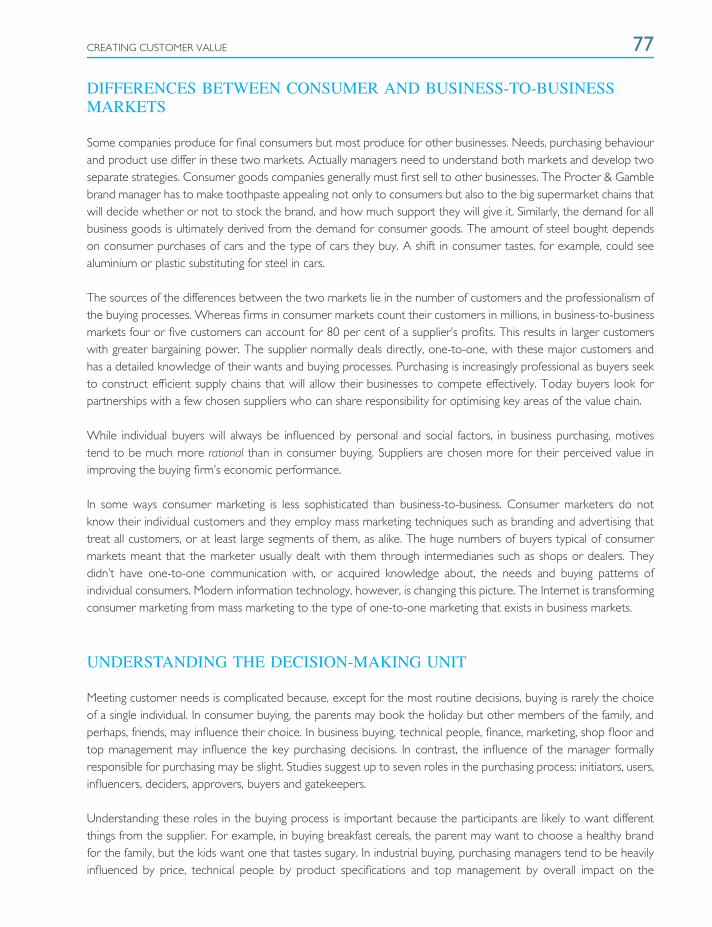
CREATING CUSTOMER VALUE 77
DIFFERENCES BETWEEN CONSUMER AND BUSINESS-TO-BUSINESSMARKETS
Some companies produce for final consumers but most produce for other businesses. Needs, purchasing behaviourand product use differ in these two markets. Actually managers need to understand both markets and develop twoseparate strategies. Consumer goods companies generally must first sell to other businesses. The Procter & Gamblebrand manager has to make toothpaste appealing not only to consumers but also to the big supermarket chains thatwill decide whether or not to stock the brand, and how much support they will give it. Similarly, the demand for allbusiness goods is ultimately derived from the demand for consumer goods. The amount of steel bought dependson consumer purchases of cars and the type of cars they buy. A shift in consumer tastes, for example, could seealuminium or plastic substituting for steel in cars.
The sources of the differences between the two markets lie in the number of customers and the professionalism ofthe buying processes. Whereas firms in consumer markets count their customers in millions, in business-to-businessmarkets four or five customers can account for 80 per cent of a supplier’s profits. This results in larger customerswith greater bargaining power. The supplier normally deals directly, one-to-one, with these major customers andhas a detailed knowledge of their wants and buying processes. Purchasing is increasingly professional as buyers seekto construct efficient supply chains that will allow their businesses to compete effectively. Today buyers look forpartnerships with a few chosen suppliers who can share responsibility for optimising key areas of the value chain.
While individual buyers will always be influenced by personal and social factors, in business purchasing, motivestend to be much more rational than in consumer buying. Suppliers are chosen more for their perceived value inimproving the buying firm’s economic performance.
In some ways consumer marketing is less sophisticated than business-to-business. Consumer marketers do notknow their individual customers and they employ mass marketing techniques such as branding and advertising thattreat all customers, or at least large segments of them, as alike. The huge numbers of buyers typical of consumermarkets meant that the marketer usually dealt with them through intermediaries such as shops or dealers. Theydidn’t have one-to-one communication with, or acquired knowledge about, the needs and buying patterns ofindividual consumers. Modern information technology, however, is changing this picture. The Internet is transformingconsumer marketing from mass marketing to the type of one-to-one marketing that exists in business markets.
UNDERSTANDING THE DECISION-MAKING UNIT
Meeting customer needs is complicated because, except for the most routine decisions, buying is rarely the choiceof a single individual. In consumer buying, the parents may book the holiday but other members of the family, andperhaps, friends, may influence their choice. In business buying, technical people, finance, marketing, shop floor andtop management may influence the key purchasing decisions. In contrast, the influence of the manager formallyresponsible for purchasing may be slight. Studies suggest up to seven roles in the purchasing process: initiators, users,influencers, deciders, approvers, buyers and gatekeepers.
Understanding these roles in the buying process is important because the participants are likely to want differentthings from the supplier. For example, in buying breakfast cereals, the parent may want to choose a healthy brandfor the family, but the kids want one that tastes sugary. In industrial buying, purchasing managers tend to be heavilyinfluenced by price, technical people by product specifications and top management by overall impact on the
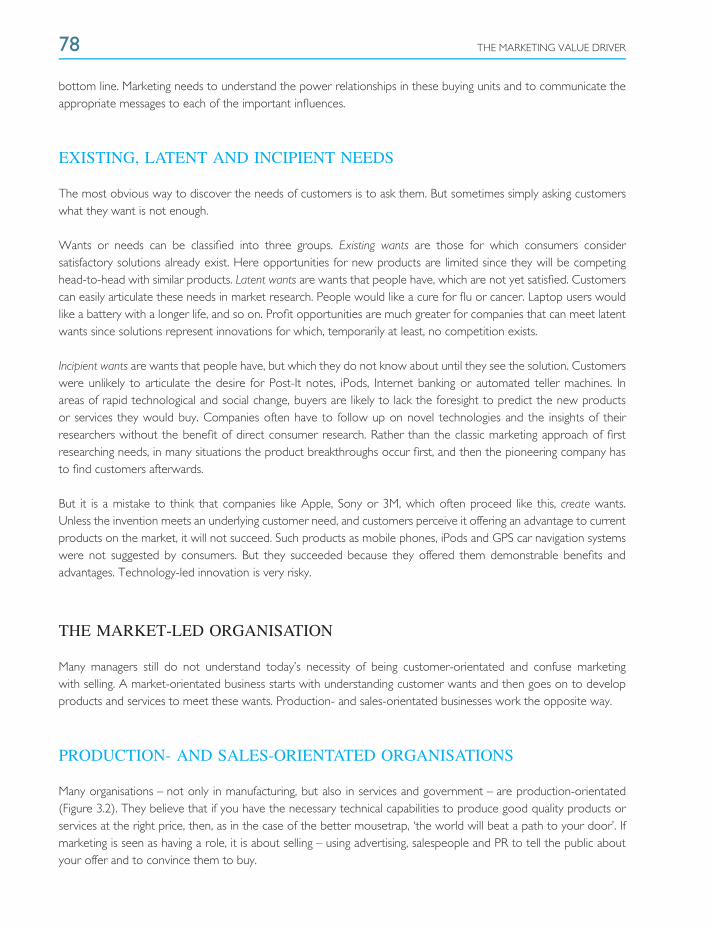
78 THE MARKETING VALUE DRIVER
bottom line. Marketing needs to understand the power relationships in these buying units and to communicate theappropriate messages to each of the important influences.
EXISTING, LATENT AND INCIPIENT NEEDS
The most obvious way to discover the needs of customers is to ask them. But sometimes simply asking customerswhat they want is not enough.
Wants or needs can be classified into three groups. Existing wants are those for which consumers considersatisfactory solutions already exist. Here opportunities for new products are limited since they will be competinghead-to-head with similar products. Latent wants are wants that people have, which are not yet satisfied. Customerscan easily articulate these needs in market research. People would like a cure for flu or cancer. Laptop users wouldlike a battery with a longer life, and so on. Profit opportunities are much greater for companies that can meet latentwants since solutions represent innovations for which, temporarily at least, no competition exists.
Incipient wants are wants that people have, but which they do not know about until they see the solution. Customerswere unlikely to articulate the desire for Post-It notes, iPods, Internet banking or automated teller machines. Inareas of rapid technological and social change, buyers are likely to lack the foresight to predict the new productsor services they would buy. Companies often have to follow up on novel technologies and the insights of theirresearchers without the benefit of direct consumer research. Rather than the classic marketing approach of firstresearching needs, in many situations the product breakthroughs occur first, and then the pioneering company hasto find customers afterwards.
But it is a mistake to think that companies like Apple, Sony or 3M, which often proceed like this, create wants.Unless the invention meets an underlying customer need, and customers perceive it offering an advantage to currentproducts on the market, it will not succeed. Such products as mobile phones, iPods and GPS car navigation systemswere not suggested by consumers. But they succeeded because they offered them demonstrable benefits andadvantages. Technology-led innovation is very risky.
THE MARKET-LED ORGANISATION
Many managers still do not understand today’s necessity of being customer-orientated and confuse marketingwith selling. A market-orientated business starts with understanding customer wants and then goes on to developproducts and services to meet these wants. Production- and sales-orientated businesses work the opposite way.
PRODUCTION- AND SALES-ORIENTATED ORGANISATIONS
Many organisations – not only in manufacturing, but also in services and government – are production-orientated(Figure 3.2). They believe that if you have the necessary technical capabilities to produce good quality products orservices at the right price, then, as in the case of the better mousetrap, ‘the world will beat a path to your door’. Ifmarketing is seen as having a role, it is about selling – using advertising, salespeople and PR to tell the public aboutyour offer and to convince them to buy.
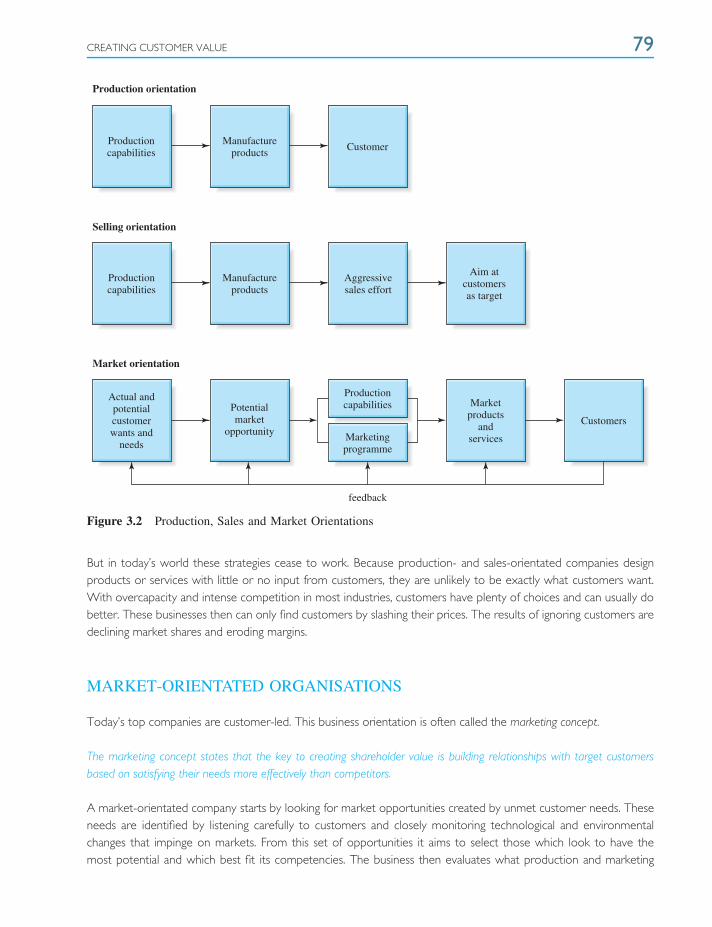
CREATING CUSTOMER VALUE 79
feedback
Market orientation
Selling orientation
Production orientation
Productioncapabilities
Productioncapabilities
Manufactureproducts
Aggressivesales effort
Manufactureproducts
Customer
Aim atcustomersas target
Actual andpotentialcustomerwants and
needs
Potentialmarket
opportunity
Productioncapabilities
Marketingprogramme
Marketproducts
andservices
Customers
Figure 3.2 Production, Sales and Market Orientations
But in today’s world these strategies cease to work. Because production- and sales-orientated companies designproducts or services with little or no input from customers, they are unlikely to be exactly what customers want.With overcapacity and intense competition in most industries, customers have plenty of choices and can usually dobetter. These businesses then can only find customers by slashing their prices. The results of ignoring customers aredeclining market shares and eroding margins.
MARKET-ORIENTATED ORGANISATIONS
Today’s top companies are customer-led. This business orientation is often called the marketing concept.
The marketing concept states that the key to creating shareholder value is building relationships with target customersbased on satisfying their needs more effectively than competitors.
A market-orientated company starts by looking for market opportunities created by unmet customer needs. Theseneeds are identified by listening carefully to customers and closely monitoring technological and environmentalchanges that impinge on markets. From this set of opportunities it aims to select those which look to have themost potential and which best fit its competencies. The business then evaluates what production and marketing
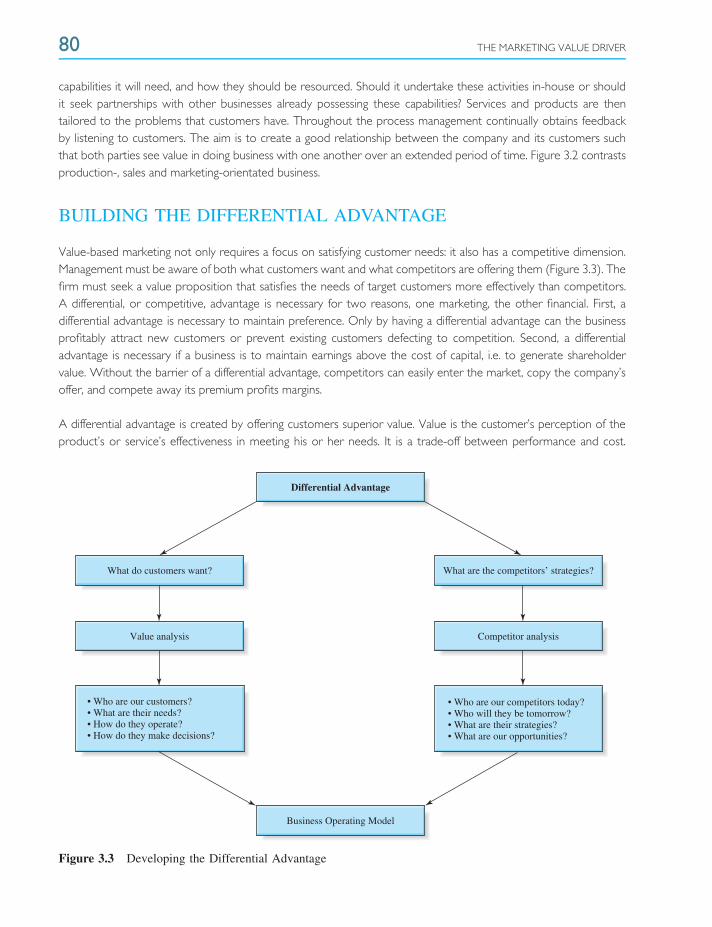
80 THE MARKETING VALUE DRIVER
capabilities it will need, and how they should be resourced. Should it undertake these activities in-house or shouldit seek partnerships with other businesses already possessing these capabilities? Services and products are thentailored to the problems that customers have. Throughout the process management continually obtains feedbackby listening to customers. The aim is to create a good relationship between the company and its customers suchthat both parties see value in doing business with one another over an extended period of time. Figure 3.2 contrastsproduction-, sales and marketing-orientated business.
BUILDING THE DIFFERENTIAL ADVANTAGE
Value-based marketing not only requires a focus on satisfying customer needs: it also has a competitive dimension.Management must be aware of both what customers want and what competitors are offering them (Figure 3.3). Thefirm must seek a value proposition that satisfies the needs of target customers more effectively than competitors.A differential, or competitive, advantage is necessary for two reasons, one marketing, the other financial. First, adifferential advantage is necessary to maintain preference. Only by having a differential advantage can the businessprofitably attract new customers or prevent existing customers defecting to competition. Second, a differentialadvantage is necessary if a business is to maintain earnings above the cost of capital, i.e. to generate shareholdervalue. Without the barrier of a differential advantage, competitors can easily enter the market, copy the company’soffer, and compete away its premium profits margins.
A differential advantage is created by offering customers superior value. Value is the customer’s perception of theproduct’s or service’s effectiveness in meeting his or her needs. It is a trade-off between performance and cost.
What do customers want?
Value analysis
• Who are our customers?• What are their needs?• How do they operate?• How do they make decisions?
• Who are our competitors today?• Who will they be tomorrow?• What are their strategies?• What are our opportunities?
Business Operating Model
Competitor analysis
What are the competitors’ strategies?
Differential Advantage
Figure 3.3 Developing the Differential Advantage
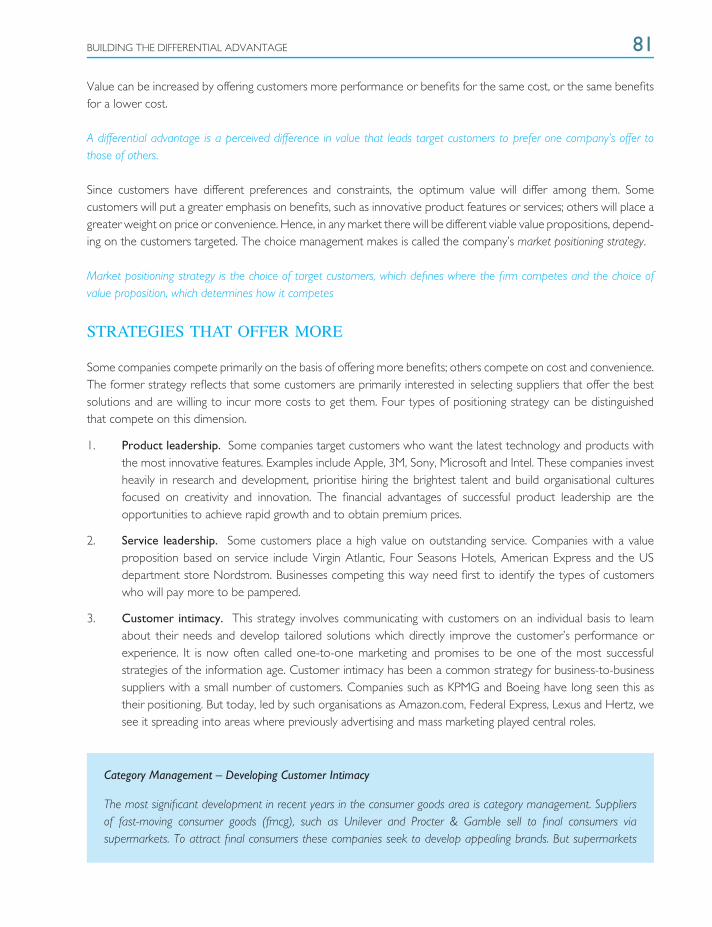
BUILDING THE DIFFERENTIAL ADVANTAGE 81
Value can be increased by offering customers more performance or benefits for the same cost, or the same benefitsfor a lower cost.
A differential advantage is a perceived difference in value that leads target customers to prefer one company’s offer tothose of others.
Since customers have different preferences and constraints, the optimum value will differ among them. Somecustomers will put a greater emphasis on benefits, such as innovative product features or services; others will place agreater weight on price or convenience. Hence, in any market there will be different viable value propositions, depend-ing on the customers targeted. The choice management makes is called the company’s market positioning strategy.
Market positioning strategy is the choice of target customers, which defines where the firm competes and the choice ofvalue proposition, which determines how it competes
STRATEGIES THAT OFFER MORE
Some companies compete primarily on the basis of offering more benefits; others compete on cost and convenience.The former strategy reflects that some customers are primarily interested in selecting suppliers that offer the bestsolutions and are willing to incur more costs to get them. Four types of positioning strategy can be distinguishedthat compete on this dimension.
1. Product leadership. Some companies target customers who want the latest technology and products withthe most innovative features. Examples include Apple, 3M, Sony, Microsoft and Intel. These companies investheavily in research and development, prioritise hiring the brightest talent and build organisational culturesfocused on creativity and innovation. The financial advantages of successful product leadership are theopportunities to achieve rapid growth and to obtain premium prices.
2. Service leadership. Some customers place a high value on outstanding service. Companies with a valueproposition based on service include Virgin Atlantic, Four Seasons Hotels, American Express and the USdepartment store Nordstrom. Businesses competing this way need first to identify the types of customerswho will pay more to be pampered.
3. Customer intimacy. This strategy involves communicating with customers on an individual basis to learnabout their needs and develop tailored solutions which directly improve the customer’s performance orexperience. It is now often called one-to-one marketing and promises to be one of the most successfulstrategies of the information age. Customer intimacy has been a common strategy for business-to-businesssuppliers with a small number of customers. Companies such as KPMG and Boeing have long seen this astheir positioning. But today, led by such organisations as Amazon.com, Federal Express, Lexus and Hertz, wesee it spreading into areas where previously advertising and mass marketing played central roles.
Category Management – Developing Customer Intimacy
The most significant development in recent years in the consumer goods area is category management. Suppliersof fast-moving consumer goods (fmcg), such as Unilever and Procter & Gamble sell to final consumers viasupermarkets. To attract final consumers these companies seek to develop appealing brands. But supermarkets
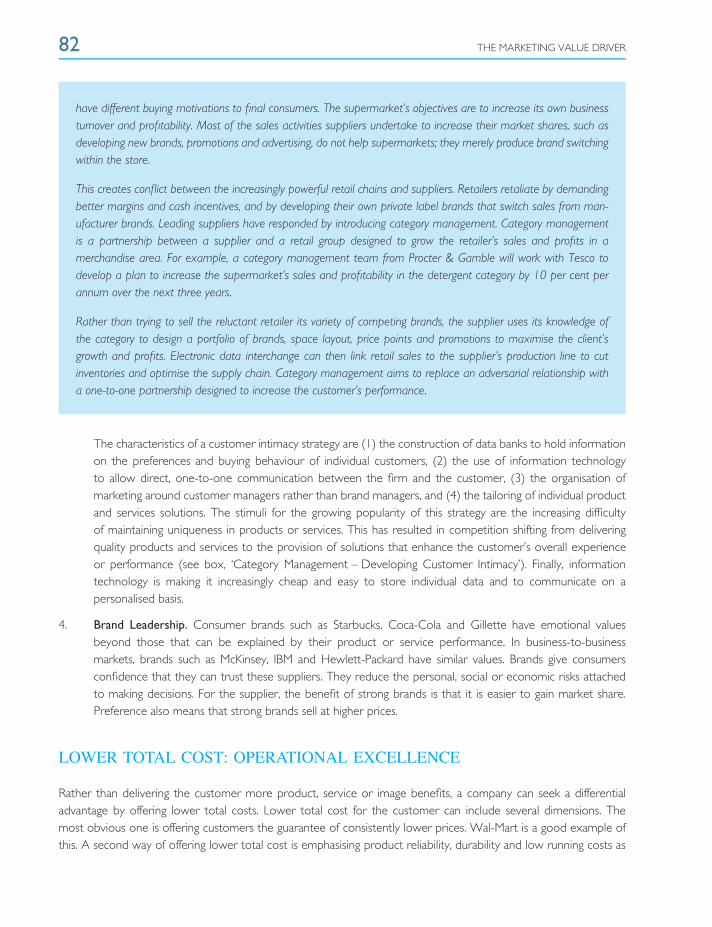
82 THE MARKETING VALUE DRIVER
have different buying motivations to final consumers. The supermarket’s objectives are to increase its own businessturnover and profitability. Most of the sales activities suppliers undertake to increase their market shares, such asdeveloping new brands, promotions and advertising, do not help supermarkets; they merely produce brand switchingwithin the store.
This creates conflict between the increasingly powerful retail chains and suppliers. Retailers retaliate by demandingbetter margins and cash incentives, and by developing their own private label brands that switch sales from man-ufacturer brands. Leading suppliers have responded by introducing category management. Category managementis a partnership between a supplier and a retail group designed to grow the retailer’s sales and profits in amerchandise area. For example, a category management team from Procter & Gamble will work with Tesco todevelop a plan to increase the supermarket’s sales and profitability in the detergent category by 10 per cent perannum over the next three years.
Rather than trying to sell the reluctant retailer its variety of competing brands, the supplier uses its knowledge ofthe category to design a portfolio of brands, space layout, price points and promotions to maximise the client’sgrowth and profits. Electronic data interchange can then link retail sales to the supplier’s production line to cutinventories and optimise the supply chain. Category management aims to replace an adversarial relationship witha one-to-one partnership designed to increase the customer’s performance.
The characteristics of a customer intimacy strategy are (1) the construction of data banks to hold informationon the preferences and buying behaviour of individual customers, (2) the use of information technologyto allow direct, one-to-one communication between the firm and the customer, (3) the organisation ofmarketing around customer managers rather than brand managers, and (4) the tailoring of individual productand services solutions. The stimuli for the growing popularity of this strategy are the increasing difficultyof maintaining uniqueness in products or services. This has resulted in competition shifting from deliveringquality products and services to the provision of solutions that enhance the customer’s overall experienceor performance (see box, ‘Category Management – Developing Customer Intimacy’). Finally, informationtechnology is making it increasingly cheap and easy to store individual data and to communicate on apersonalised basis.
4. Brand Leadership. Consumer brands such as Starbucks, Coca-Cola and Gillette have emotional valuesbeyond those that can be explained by their product or service performance. In business-to-businessmarkets, brands such as McKinsey, IBM and Hewlett-Packard have similar values. Brands give consumersconfidence that they can trust these suppliers. They reduce the personal, social or economic risks attachedto making decisions. For the supplier, the benefit of strong brands is that it is easier to gain market share.Preference also means that strong brands sell at higher prices.
LOWER TOTAL COST: OPERATIONAL EXCELLENCE
Rather than delivering the customer more product, service or image benefits, a company can seek a differentialadvantage by offering lower total costs. Lower total cost for the customer can include several dimensions. Themost obvious one is offering customers the guarantee of consistently lower prices. Wal-Mart is a good example ofthis. A second way of offering lower total cost is emphasising product reliability, durability and low running costs as
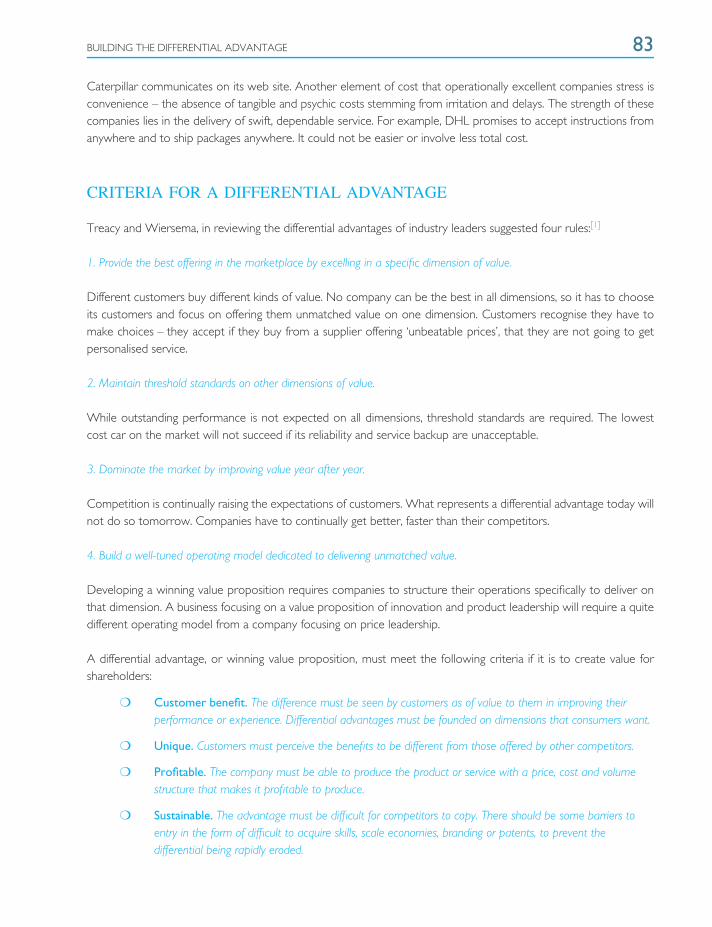
BUILDING THE DIFFERENTIAL ADVANTAGE 83
Caterpillar communicates on its web site. Another element of cost that operationally excellent companies stress isconvenience – the absence of tangible and psychic costs stemming from irritation and delays. The strength of thesecompanies lies in the delivery of swift, dependable service. For example, DHL promises to accept instructions fromanywhere and to ship packages anywhere. It could not be easier or involve less total cost.
CRITERIA FOR A DIFFERENTIAL ADVANTAGE
Treacy and Wiersema, in reviewing the differential advantages of industry leaders suggested four rules:[1]
1. Provide the best offering in the marketplace by excelling in a specific dimension of value.
Different customers buy different kinds of value. No company can be the best in all dimensions, so it has to chooseits customers and focus on offering them unmatched value on one dimension. Customers recognise they have tomake choices – they accept if they buy from a supplier offering ‘unbeatable prices’, that they are not going to getpersonalised service.
2. Maintain threshold standards on other dimensions of value.
While outstanding performance is not expected on all dimensions, threshold standards are required. The lowestcost car on the market will not succeed if its reliability and service backup are unacceptable.
3. Dominate the market by improving value year after year.
Competition is continually raising the expectations of customers. What represents a differential advantage today willnot do so tomorrow. Companies have to continually get better, faster than their competitors.
4. Build a well-tuned operating model dedicated to delivering unmatched value.
Developing a winning value proposition requires companies to structure their operations specifically to deliver onthat dimension. A business focusing on a value proposition of innovation and product leadership will require a quitedifferent operating model from a company focusing on price leadership.
A differential advantage, or winning value proposition, must meet the following criteria if it is to create value forshareholders:
❍ Customer benefit. The difference must be seen by customers as of value to them in improving theirperformance or experience. Differential advantages must be founded on dimensions that consumers want.
❍ Unique. Customers must perceive the benefits to be different from those offered by other competitors.
❍ Profitable. The company must be able to produce the product or service with a price, cost and volumestructure that makes it profitable to produce.
❍ Sustainable. The advantage must be difficult for competitors to copy. There should be some barriers toentry in the form of difficult to acquire skills, scale economies, branding or patents, to prevent thedifferential being rapidly eroded.
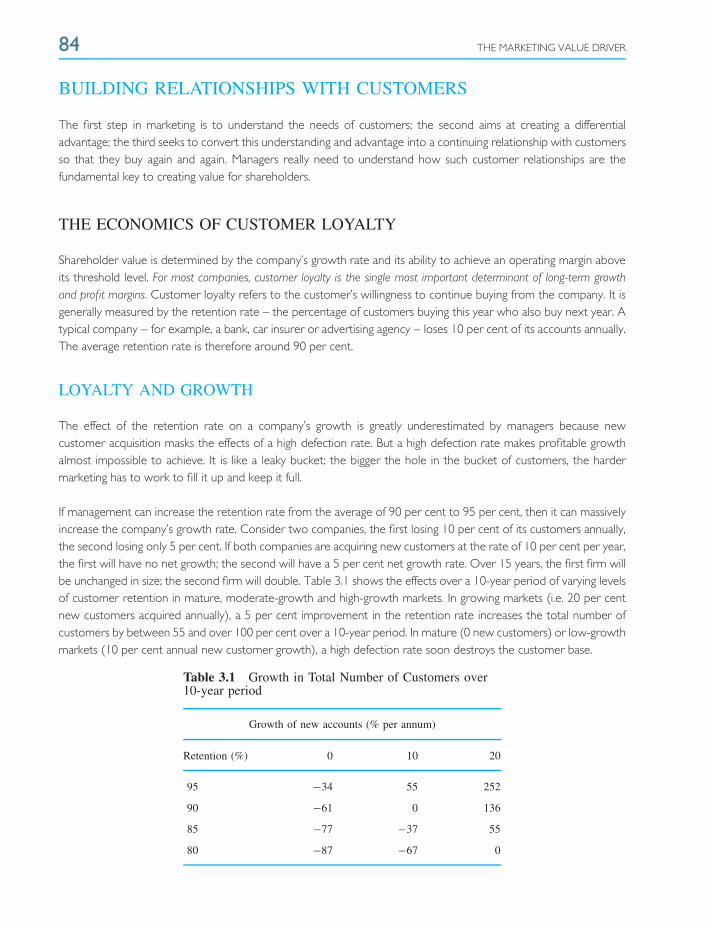
84 THE MARKETING VALUE DRIVER
BUILDING RELATIONSHIPS WITH CUSTOMERS
The first step in marketing is to understand the needs of customers; the second aims at creating a differentialadvantage; the third seeks to convert this understanding and advantage into a continuing relationship with customersso that they buy again and again. Managers really need to understand how such customer relationships are thefundamental key to creating value for shareholders.
THE ECONOMICS OF CUSTOMER LOYALTY
Shareholder value is determined by the company’s growth rate and its ability to achieve an operating margin aboveits threshold level. For most companies, customer loyalty is the single most important determinant of long-term growthand profit margins. Customer loyalty refers to the customer’s willingness to continue buying from the company. It isgenerally measured by the retention rate – the percentage of customers buying this year who also buy next year. Atypical company – for example, a bank, car insurer or advertising agency – loses 10 per cent of its accounts annually.The average retention rate is therefore around 90 per cent.
LOYALTY AND GROWTH
The effect of the retention rate on a company’s growth is greatly underestimated by managers because newcustomer acquisition masks the effects of a high defection rate. But a high defection rate makes profitable growthalmost impossible to achieve. It is like a leaky bucket: the bigger the hole in the bucket of customers, the hardermarketing has to work to fill it up and keep it full.
If management can increase the retention rate from the average of 90 per cent to 95 per cent, then it can massivelyincrease the company’s growth rate. Consider two companies, the first losing 10 per cent of its customers annually,the second losing only 5 per cent. If both companies are acquiring new customers at the rate of 10 per cent per year,the first will have no net growth; the second will have a 5 per cent net growth rate. Over 15 years, the first firm willbe unchanged in size; the second firm will double. Table 3.1 shows the effects over a 10-year period of varying levelsof customer retention in mature, moderate-growth and high-growth markets. In growing markets (i.e. 20 per centnew customers acquired annually), a 5 per cent improvement in the retention rate increases the total number ofcustomers by between 55 and over 100 per cent over a 10-year period. In mature (0 new customers) or low-growthmarkets (10 per cent annual new customer growth), a high defection rate soon destroys the customer base.
Table 3.1 Growth in Total Number of Customers over10-year period
Growth of new accounts (% per annum)
Retention (%) 0 10 20
95 −34 55 252
90 −61 0 136
85 −77 −37 55
80 −87 −67 0
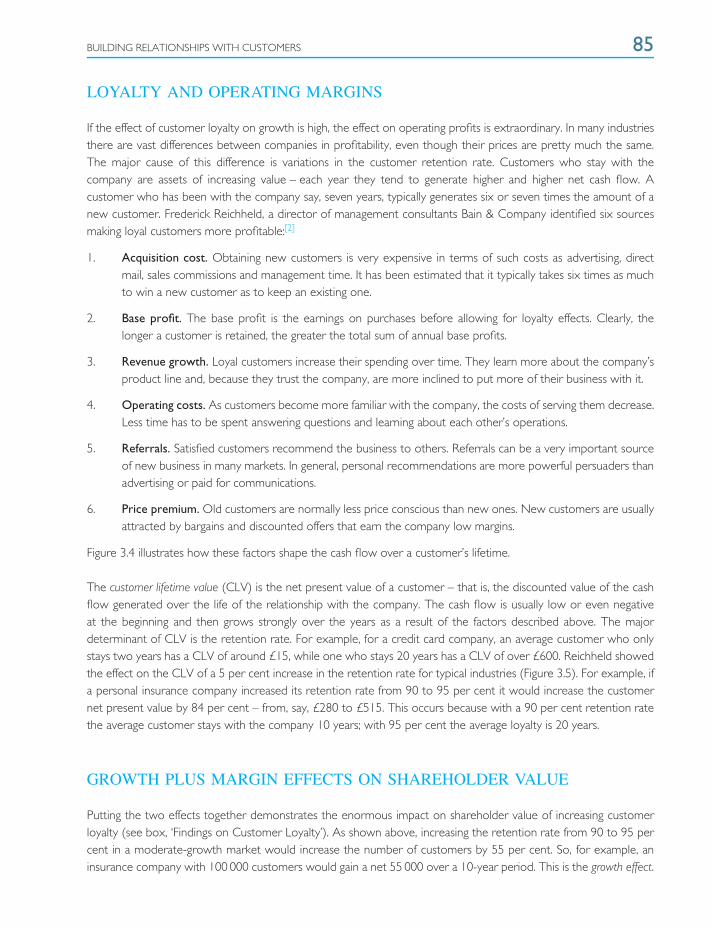
BUILDING RELATIONSHIPS WITH CUSTOMERS 85
LOYALTY AND OPERATING MARGINS
If the effect of customer loyalty on growth is high, the effect on operating profits is extraordinary. In many industriesthere are vast differences between companies in profitability, even though their prices are pretty much the same.The major cause of this difference is variations in the customer retention rate. Customers who stay with thecompany are assets of increasing value – each year they tend to generate higher and higher net cash flow. Acustomer who has been with the company say, seven years, typically generates six or seven times the amount of anew customer. Frederick Reichheld, a director of management consultants Bain & Company identified six sourcesmaking loyal customers more profitable:[2]
1. Acquisition cost. Obtaining new customers is very expensive in terms of such costs as advertising, directmail, sales commissions and management time. It has been estimated that it typically takes six times as muchto win a new customer as to keep an existing one.
2. Base profit. The base profit is the earnings on purchases before allowing for loyalty effects. Clearly, thelonger a customer is retained, the greater the total sum of annual base profits.
3. Revenue growth. Loyal customers increase their spending over time. They learn more about the company’sproduct line and, because they trust the company, are more inclined to put more of their business with it.
4. Operating costs. As customers become more familiar with the company, the costs of serving them decrease.Less time has to be spent answering questions and learning about each other’s operations.
5. Referrals. Satisfied customers recommend the business to others. Referrals can be a very important sourceof new business in many markets. In general, personal recommendations are more powerful persuaders thanadvertising or paid for communications.
6. Price premium. Old customers are normally less price conscious than new ones. New customers are usuallyattracted by bargains and discounted offers that earn the company low margins.
Figure 3.4 illustrates how these factors shape the cash flow over a customer’s lifetime.
The customer lifetime value (CLV) is the net present value of a customer – that is, the discounted value of the cashflow generated over the life of the relationship with the company. The cash flow is usually low or even negativeat the beginning and then grows strongly over the years as a result of the factors described above. The majordeterminant of CLV is the retention rate. For example, for a credit card company, an average customer who onlystays two years has a CLV of around £15, while one who stays 20 years has a CLV of over £600. Reichheld showedthe effect on the CLV of a 5 per cent increase in the retention rate for typical industries (Figure 3.5). For example, ifa personal insurance company increased its retention rate from 90 to 95 per cent it would increase the customernet present value by 84 per cent – from, say, £280 to £515. This occurs because with a 90 per cent retention ratethe average customer stays with the company 10 years; with 95 per cent the average loyalty is 20 years.
GROWTH PLUS MARGIN EFFECTS ON SHAREHOLDER VALUE
Putting the two effects together demonstrates the enormous impact on shareholder value of increasing customerloyalty (see box, ‘Findings on Customer Loyalty’). As shown above, increasing the retention rate from 90 to 95 percent in a moderate-growth market would increase the number of customers by 55 per cent. So, for example, aninsurance company with 100 000 customers would gain a net 55 000 over a 10-year period. This is the growth effect.
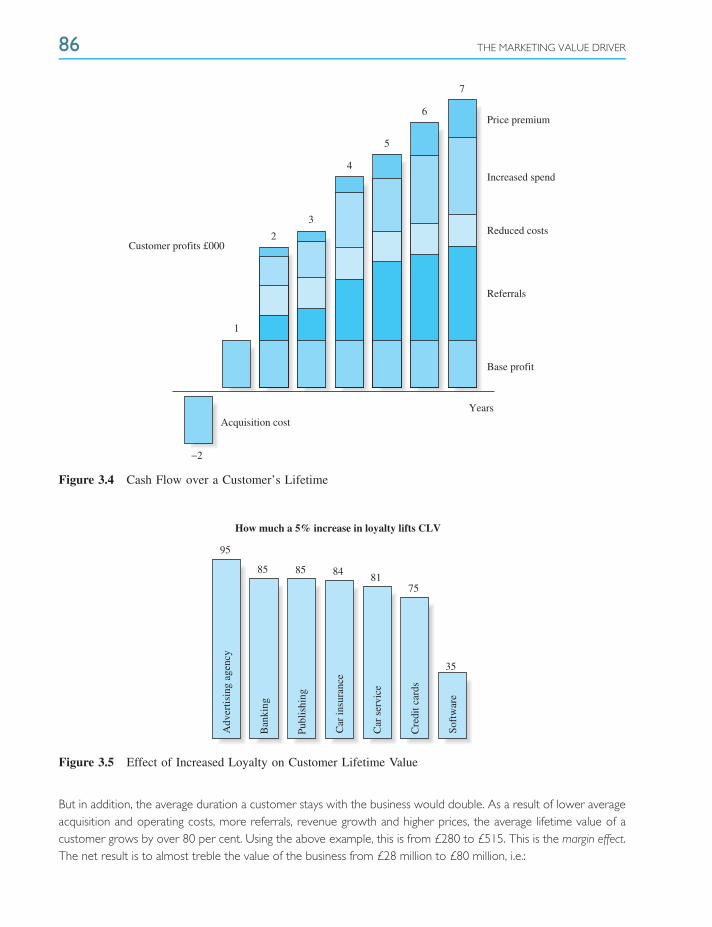
86 THE MARKETING VALUE DRIVER
1
2
−2
Customer profits £000
3
Acquisition costYears
4
5
6
7
Price premium
Increased spend
Reduced costs
Referrals
Base profit
Figure 3.4 Cash Flow over a Customer’s Lifetime
Adv
ertis
ing
agen
cy
Ban
king
Publ
ishi
ng
Car
insu
ranc
e
Car
ser
vice
Cre
dit c
ards
Soft
war
e
35
7581
8585
95
84
How much a 5% increase in loyalty lifts CLV
Figure 3.5 Effect of Increased Loyalty on Customer Lifetime Value
But in addition, the average duration a customer stays with the business would double. As a result of lower averageacquisition and operating costs, more referrals, revenue growth and higher prices, the average lifetime value of acustomer grows by over 80 per cent. Using the above example, this is from £280 to £515. This is the margin effect.The net result is to almost treble the value of the business from £28 million to £80 million, i.e.:
BUILDING RELATIONSHIPS WITH CUSTOMERS 87
Value with 90 per cent retention:Customers 100 000Average CLV £280
Business value £28 million
Value with 95 per cent retentionCustomers 155 000Average CLV £515
Business value £80 million
Given the importance of customer loyalty on shareholder value, it is striking how few companies measure retentionrates. Without such information, managers do not know the lifetime value of their customers and miss crucialopportunities to increase their company’s growth and profitability.
Findings on Customer Loyalty
❍ Loyal customers are assets. A customer that generates a cash flow of £1000 for a supplier in itsfirst year is likely to have a net present value (customer lifetime value) of around £50 000 ifretained as a satisfied customer over 10 years.
❍ Loyal customers are more profitable. They buy more of the company’s products, are less costlyto serve, are less sensitive to price and bring in new customers.
❍ Winning new customers is costly. It costs up to six times as much to win a new customer as toretain an existing one. These are the costs of researching, advertising, selling and negotiatingwith new prospects.
❍ Increasing customer retention. The average company loses 10 per cent of its customers annually.Increasing customer retention by as little as 5 per cent can double the lifetime value ofcustomers.
❍ ‘Highly satisfied’ customers repurchase. They are six times more likely to remain loyal thancustomers who merely rate themselves ‘satisfied’. Highly satisfied customers (‘apostles’) tellothers about the company.
❍ Dissatisfied customers (increasingly called vigilantes) tell others.[3] It is estimated that, on average,dissatisfied customers tell 14 others. So if losing a single customer represents the loss of anasset with a lifetime value of say, £10 000, this might just be the tip of the iceberg. The totalvalue lost might be 14 times as great.
❍ Most dissatisfied customers do not complain. While they tell their colleagues, only around 4 percent bother to complain. For every complaint received, another 26 customers will have hadproblems, and about 6 will have serious ones.
❍ Satisfactory resolution of complaints increases loyalty. When complaints are resolved to thecustomer’s satisfaction, these customers tend to be more loyal than those who neverexperienced a problem in the first place.
❍ Few customers defect due to poor product performance. Only 14 per cent defect for productreasons; two-thirds leave because they find service people indifferent or inaccessible.
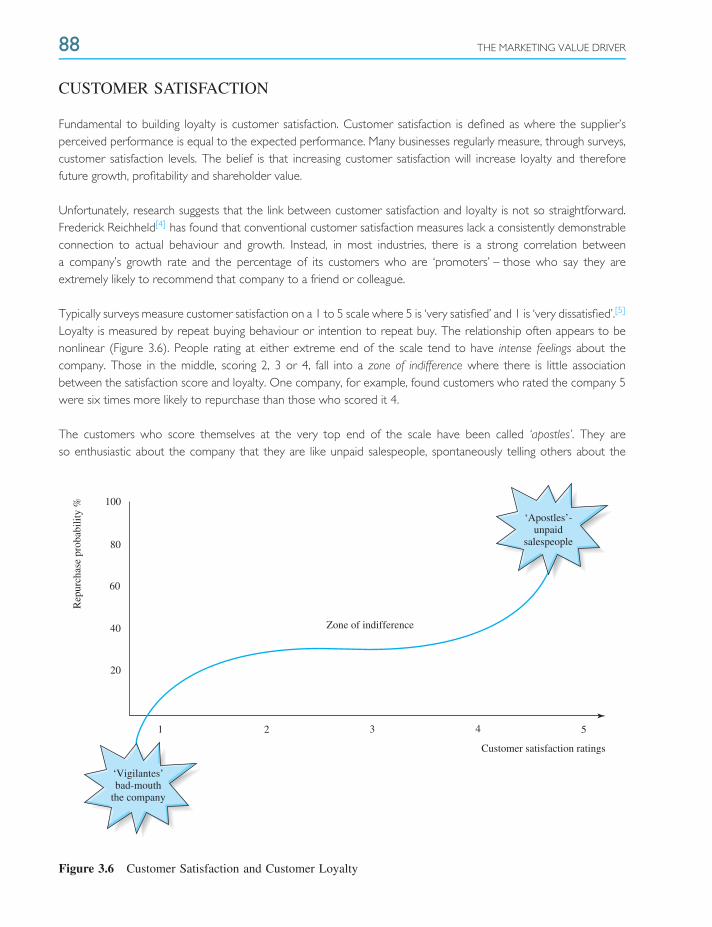
88 THE MARKETING VALUE DRIVER
CUSTOMER SATISFACTION
Fundamental to building loyalty is customer satisfaction. Customer satisfaction is defined as where the supplier’sperceived performance is equal to the expected performance. Many businesses regularly measure, through surveys,customer satisfaction levels. The belief is that increasing customer satisfaction will increase loyalty and thereforefuture growth, profitability and shareholder value.
Unfortunately, research suggests that the link between customer satisfaction and loyalty is not so straightforward.Frederick Reichheld[4] has found that conventional customer satisfaction measures lack a consistently demonstrableconnection to actual behaviour and growth. Instead, in most industries, there is a strong correlation betweena company’s growth rate and the percentage of its customers who are ‘promoters’ – those who say they areextremely likely to recommend that company to a friend or colleague.
Typically surveys measure customer satisfaction on a 1 to 5 scale where 5 is ‘very satisfied’ and 1 is ‘very dissatisfied’.[5]
Loyalty is measured by repeat buying behaviour or intention to repeat buy. The relationship often appears to benonlinear (Figure 3.6). People rating at either extreme end of the scale tend to have intense feelings about thecompany. Those in the middle, scoring 2, 3 or 4, fall into a zone of indifference where there is little associationbetween the satisfaction score and loyalty. One company, for example, found customers who rated the company 5were six times more likely to repurchase than those who scored it 4.
The customers who score themselves at the very top end of the scale have been called ‘apostles’. They areso enthusiastic about the company that they are like unpaid salespeople, spontaneously telling others about the
1 2 3 4 5
Customer satisfaction ratings
‘Vigilantes’bad-mouth
the company
Zone of indifference
‘Apostles’-unpaid
salespeople
20
40
60
80
100
Rep
urch
ase
prob
abili
ty %
Figure 3.6 Customer Satisfaction and Customer Loyalty
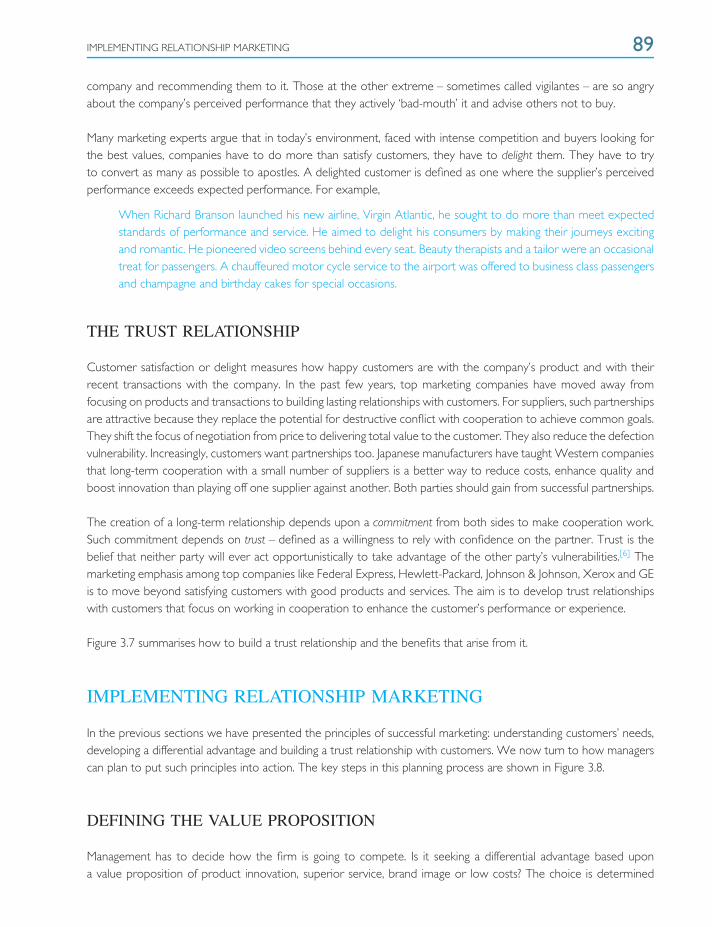
IMPLEMENTING RELATIONSHIP MARKETING 89
company and recommending them to it. Those at the other extreme – sometimes called vigilantes – are so angryabout the company’s perceived performance that they actively ‘bad-mouth’ it and advise others not to buy.
Many marketing experts argue that in today’s environment, faced with intense competition and buyers looking forthe best values, companies have to do more than satisfy customers, they have to delight them. They have to tryto convert as many as possible to apostles. A delighted customer is defined as one where the supplier’s perceivedperformance exceeds expected performance. For example,
When Richard Branson launched his new airline, Virgin Atlantic, he sought to do more than meet expectedstandards of performance and service. He aimed to delight his consumers by making their journeys excitingand romantic. He pioneered video screens behind every seat. Beauty therapists and a tailor were an occasionaltreat for passengers. A chauffeured motor cycle service to the airport was offered to business class passengersand champagne and birthday cakes for special occasions.
THE TRUST RELATIONSHIP
Customer satisfaction or delight measures how happy customers are with the company’s product and with theirrecent transactions with the company. In the past few years, top marketing companies have moved away fromfocusing on products and transactions to building lasting relationships with customers. For suppliers, such partnershipsare attractive because they replace the potential for destructive conflict with cooperation to achieve common goals.They shift the focus of negotiation from price to delivering total value to the customer. They also reduce the defectionvulnerability. Increasingly, customers want partnerships too. Japanese manufacturers have taught Western companiesthat long-term cooperation with a small number of suppliers is a better way to reduce costs, enhance quality andboost innovation than playing off one supplier against another. Both parties should gain from successful partnerships.
The creation of a long-term relationship depends upon a commitment from both sides to make cooperation work.Such commitment depends on trust – defined as a willingness to rely with confidence on the partner. Trust is thebelief that neither party will ever act opportunistically to take advantage of the other party’s vulnerabilities.[6] Themarketing emphasis among top companies like Federal Express, Hewlett-Packard, Johnson & Johnson, Xerox and GEis to move beyond satisfying customers with good products and services. The aim is to develop trust relationshipswith customers that focus on working in cooperation to enhance the customer’s performance or experience.
Figure 3.7 summarises how to build a trust relationship and the benefits that arise from it.
IMPLEMENTING RELATIONSHIP MARKETING
In the previous sections we have presented the principles of successful marketing: understanding customers’ needs,developing a differential advantage and building a trust relationship with customers. We now turn to how managerscan plan to put such principles into action. The key steps in this planning process are shown in Figure 3.8.
DEFINING THE VALUE PROPOSITION
Management has to decide how the firm is going to compete. Is it seeking a differential advantage based upona value proposition of product innovation, superior service, brand image or low costs? The choice is determined
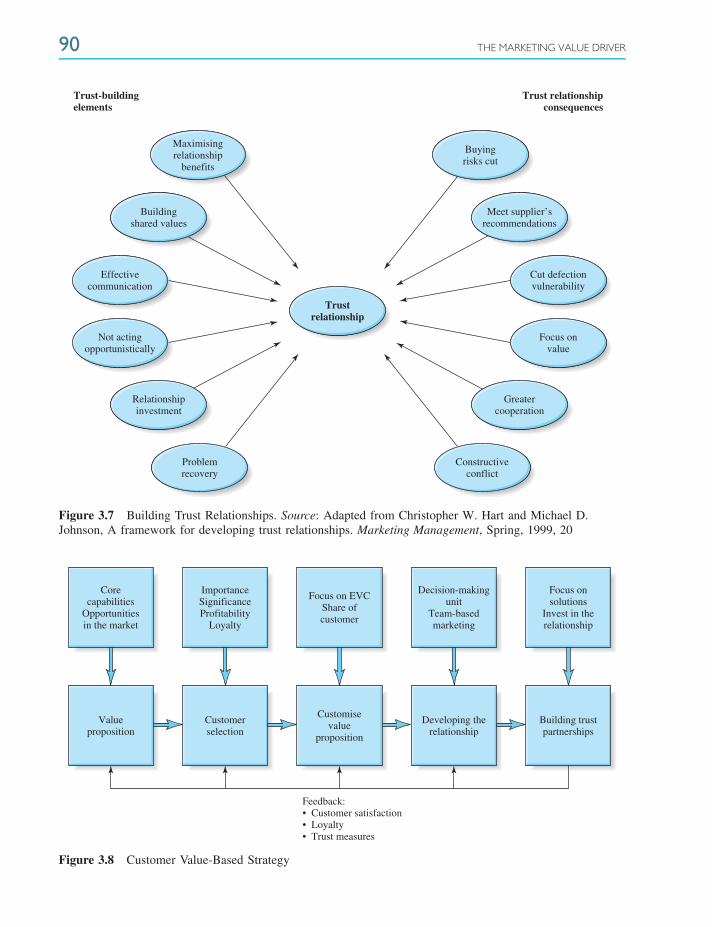
90 THE MARKETING VALUE DRIVER
Trust-buildingelements
Maximisingrelationship
benefits
Buildingshared values
Effectivecommunication
Not actingopportunistically
Relationshipinvestment
Problemrecovery
Trust relationshipconsequences
Trustrelationship
Constructiveconflict
Greatercooperation
Focus onvalue
Cut defectionvulnerability
Meet supplier’srecommendations
Buyingrisks cut
Figure 3.7 Building Trust Relationships. Source: Adapted from Christopher W. Hart and Michael D.Johnson, A framework for developing trust relationships. Marketing Management, Spring, 1999, 20
Corecapabilities
Opportunitiesin the market
ImportanceSignificanceProfitability
Loyalty
Focus on EVCShare ofcustomer
Decision-makingunit
Team-basedmarketing
Focus onsolutions
Invest in therelationship
Valueproposition
Customerselection
Customisevalue
proposition
Developing therelationship
Building trustpartnerships
Feedback:• Customer satisfaction• Loyalty• Trust measures
Figure 3.8 Customer Value-Based Strategy
IMPLEMENTING RELATIONSHIP MARKETING 91
by two key factors. The first is the firm’s core capabilities – its unique combination of skills, assets and partnershiprelationships with customers and suppliers. These determine what the firm can do well. For example, a businessis unlikely to be able to create a differential advantage based upon product innovation if it lacks a research anddevelopment base and experience in being first to market. Similarly, a firm today is not going to be competitive asa low-cost operator unless it has optimised the efficiency of each component of its supply chain.
The second determinant of the value proposition is the opportunities in the market. The value proposition has tomatch the wants of the customers. Of course, markets are segmented: some customers will want superior products,others will be more interested in services or low costs. But some market segments will offer more opportunitiesthan others. The firm will need to research the size of the key customer segments, their growth, the amount ofcompetition, average operating margins and investment requirements. It can then identify the profit potential ofalternative value propositions.
SELECTING CUSTOMERS
In today’s increasingly competitive markets, successful marketing is about focusing on key customers. Many companiesare willing to do business with any customer willing to spend. Such companies end up with large numbers ofunprofitable small accounts. They fail to develop the sophisticated partnering skills big accounts expect and so endup with low margins, big overheads and high customer turnover. Numerous studies have shown that the 80:20rule – 20 per cent of customers account for 80 per cent of the profits – is typical. Professors Cooper and Kaplan ofthe Harvard Business School suggested, in fact, that the situation is often much worse. Using activity-based costingthey found that in most companies, 80 per cent of customers were unprofitable. They proposed the 20:225 rule,which stated that in many companies 20 per cent of customers account for 225 per cent of the profits. This ofcourse means that 80 per cent lose 125 per cent of profits!
To select customers who will have a high lifetime value for the company, four criteria need to be used:[7]
1. Strategic importance. Strategic importance has three dimensions. The company should seek customers whodesire its value proposition and so fit its core capabilities. Second, customers are strategically important ifthey are expected to grow, either because they are in fast growth markets or because they have strongcompetitive advantages. Finally, a customer can be important if it is an opinion leader. These lead customerscan open the door to other customers who are influenced by them.
2. Customer significance. Significance refers to the percentage of total revenue and gross profit the customeraccounts for. For example, is the customer in the top 10 per cent of accounts? Size is not always correlatedwith profitability. Some large accounts demand big discounts and onerous levels of servicing, which shrink theoperating profit they generate. But size should be significant. Big customers should offer more opportunities,they are very difficult to replace, and their loss can have a devastating impact on the business.
3. Customer profitability. The main reason why the majority of companies carry such a long tail of accountsis that they do not measure customer profitability. At best they measure contribution (revenue less variablecosts). But contribution massively overestimates account profitability. Additional customers require moreadministrative support, warehousing, sales support, distribution and financing costs. Some firms employactivity-based costing, which attempts to charge costs to products, channels and customers for the resourcesthey consume. When such estimates are made management is usually shaken by the losses that unfocusedgrowth has brought. This inevitably leads to a strategy to refocus on the handful of profitable accounts andto make the others profitable or get rid of them.

92 THE MARKETING VALUE DRIVER
4. The loyalty coefficient. If the company wants to create long-term partnerships, it needs to identify customerswho would be interested in such a commitment. Some customers are inherently more loyal than others. Inbusiness-to-business markets, some purchasers are spot buyers, focused solely on price, and they will switchfrom month to month according to which supplier is offering the best deal. For most companies, the lifetimevalue of these customers is very low. In consumer markets, too, some types of customer are inherently moreloyal than others. In financial services, for example, there are striking variations in loyalty by demographicand social characteristics. In car insurance, loyalty is higher for married people, for homeowners rather thanrenters, and for those living in rural areas. In the credit card industry in the 1990s, for example, MBNA, nowpart of the Bank of America, became a very profitable company by avoiding mass marketing its cards andinstead focusing its promotion on those specific professional groups with the highest loyalty coefficients.
CUSTOMISING THE VALUE PROPOSITION
Value-based marketing is about developing solutions that improve the customer’s performance. The focus, in today’sinformation age, is from doing a small amount of business with a large number of customers, to a large amount ofbusiness with a smaller number of high-value customers. This allows the firm to add value by customising the solution.
MOVING UP THE VALUE LADDER
Developing trust relationships with customers is based fundamentally on offering them value. Value is defined asimproving the customer’s performance or experience. Many companies do not offer value; they sell the productsor services their company produces. Rather than understanding the customer’s needs, the salespeople try to sellthe features of their product, its quality or the services that accompany it. Such companies are production- orsales-orientated rather than market-led.
In most industries, competition leads to an evolution of value propositions (Figure 3.9). At the initial stage of theproduct life cycle the innovator wins customers on the basis of its successful new product or service. It is uniqueand, if successful, offers customers benefits that are superior to the old solutions. But soon competitors copy theinnovation, allowing customers to choose among a variety of suppliers. The effect of competition is to reduce pricesand margins. Suppliers then seek to avoid margin erosion by emphasising value propositions typically based on thequality of their products and then the services that are offered to support them. But over time these distinctionserode. Usually there will be a number of suppliers, all offering products of acceptable quality, and with similar supportand service. Buyers then increasingly focus on price, and the margins of suppliers sink towards the threshold levelwhere, at best, they are earning just the opportunity cost of capital.
Leading companies recognise that in the longer run, there is little profit to be made from selling products andservices (see box, ‘Companies Shift from Products to Solutions’). The real returns are made from solving customers’problems. We call this EVC, which in business markets normally means economic value to the customer. Economicvalue to the customer is created where the supplier finds ways of improving the customer’s profitability by helping thecustomer increase sales, reduce costs, raise prices or lower its investment requirements. In consumer markets, EVCcan mean emotional value to the customer. Emotional value to the customer is created where the supplier enhancesthe customer’s experience by helping the individual obtain greater social, personal or psychological satisfaction. (EVCis discussed in detail in Chapter 8.) The fifth and final step on the value ladder is where the supplier can transform
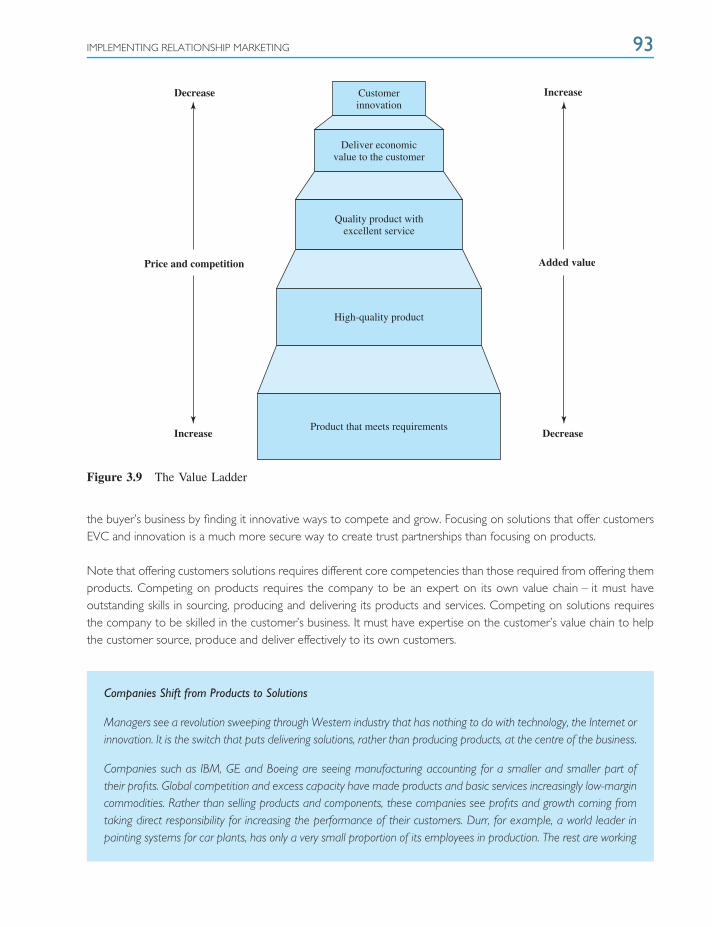
IMPLEMENTING RELATIONSHIP MARKETING 93
Decrease
Price and competition
Increase
Added value
DecreaseIncrease
Customerinnovation
Deliver economicvalue to the customer
Quality product withexcellent service
High-quality product
Product that meets requirements
Figure 3.9 The Value Ladder
the buyer’s business by finding it innovative ways to compete and grow. Focusing on solutions that offer customersEVC and innovation is a much more secure way to create trust partnerships than focusing on products.
Note that offering customers solutions requires different core competencies than those required from offering themproducts. Competing on products requires the company to be an expert on its own value chain – it must haveoutstanding skills in sourcing, producing and delivering its products and services. Competing on solutions requiresthe company to be skilled in the customer’s business. It must have expertise on the customer’s value chain to helpthe customer source, produce and deliver effectively to its own customers.
Companies Shift from Products to Solutions
Managers see a revolution sweeping through Western industry that has nothing to do with technology, the Internet orinnovation. It is the switch that puts delivering solutions, rather than producing products, at the centre of the business.
Companies such as IBM, GE and Boeing are seeing manufacturing accounting for a smaller and smaller part oftheir profits. Global competition and excess capacity have made products and basic services increasingly low-margincommodities. Rather than selling products and components, these companies see profits and growth coming fromtaking direct responsibility for increasing the performance of their customers. Durr, for example, a world leader inpainting systems for car plants, has only a very small proportion of its employees in production. The rest are working
94 THE MARKETING VALUE DRIVER
at the customers’ premises operating the equipment and guaranteeing cost and quality targets. Castrol, a leaderin industrial lubricant, offers its automotive customers a range of business services such as database management,aftersales consultancy and training.
Companies are positioning themselves as consultants, designing total solutions that will enable customers toincrease their profits. They are also offering partnerships to deliver these results and give customers peace of mind.Boeing has set up a division to offer the airlines total fleet servicing. At IBM services now account for well overhalf of revenues. GE also gets over half its profits from servicing customers rather than selling products. Such atransformation requires a complete mindset change – from focusing on internal efficiency to understanding whatdrives the effectiveness of the customer’s business.
FROM MARKET SHARE TO CUSTOMER SHARE
Earlier approaches emphasised brands, mass marketing and market share. Today’s strategies focus on one-to-onemarketing, partnerships and customised solutions. Rather than building market share by attracting large numbers ofsmall customers, the new emphasis is on gaining a bigger share of the business of large customers.
The advantages of the share-of-customer strategy are:
1. Since they are existing customers they are already qualified on the selection criteria of strategic importance,significance, profitability and loyalty coefficient.
2. Experience with them will mean that they are low risk, there are no acquisition costs and they should be lesscostly to serve.
3. Since they are familiar, the supplier should understand their needs, know how they like to purchase andknow their key personnel.
4. Since the basis of a trust relationship is already established, the customer should be more willing to considerproposals aimed at increasing its performance.
By contrast, the blunderbuss approach to growing market share by attracting new accounts leads to a large numberof small customers, most of which have little potential. The net result is that focusing on a share-of-customerapproach usually generates more profitable growth.
DEVELOPING AND CONSOLIDATING RELATIONSHIPS
Partnerships are not built between companies but between individual managers. Trust and confidence in thecapabilities and commitment of the supplier have to be developed on a person-to-person basis.
THE DECISION-MAKING UNIT AGAIN
In business-to-business marketing, top management, middle management and the purchasing department all have arole in the development of customer partnerships. Normally companies do not sell directly to top management. But
ORGANISATIONAL REQUIREMENTS 95
top management does control the purse strings, and their agreement is necessary before significant new investmentscan be made. The purchasing department is of course directly involved in buying arrangements. But the problemwith purchasing executives is that they are generally transaction-orientated. Their focus is on getting the best dealin terms of price, product features and payment terms. Because they do not have profit responsibility, they are lessinterested in initiating performance-based partnerships.
The most useful focus for initiating partnerships is middle management, defined here as the heads of business unitprofit centres and functional departments. The former are evaluated by their profit performance; the latter by theirability to reduce costs. These managers have the primary incentive to respond positively to suppliers who have thecapabilities and commitment to generate continuing proposals to increase the performance of their businesses. Theyhave the most to gain. They are also in the best position to make proposals to top management to get funding forsupply partnerships. When business unit heads are convinced that their suppliers can become partners to generateEVC for them, these managers become allies in winning the support of the top management.
TEAM-BASED MARKETING
Developing partnerships generally requires a team-based approach from the company. Only a cross-functional teamwill have the expertise to put together a comprehensive plan to boost the customer’s performance. Technical staffwill be needed to understand the customer’s operations, logistics people will be required to review the supplychain, development and marketing will be involved in putting together the offer, and financial staff in assessingthe benefits to both parties. Teams also create an across-the-board commitment to the partnership. A successfulongoing relationship will depend on positive interactions between the businesses at many levels.
A team approach is also necessary in initiating the partnership. While the focus will be on the client’s business unitmanager, others in the decision-making unit cannot be neglected. Good communications need to be maintainedwith the purchasing management to align them to the objectives of the partnership. Top management also has to bebrought alongside. Typically there will be multi-level communications: sales and purchasing people will be meeting,marketing will be leading the expert team negotiating with business unit management, and top management of thetwo companies will be in communication with one another developing trust and confidence.
CONSOLIDATING TRUST PARTNERSHIPS
Figure 3.7 suggests ways in which trust relationships are developed and consolidated. They can be divided into threetypes of initiatives. First, a partnership arrangement should be judged on its ability to deliver successful solutionsfor customers. Second, both parties need to invest time in understanding each other’s businesses. Third, becauseproblems and perceived breakdowns in trust are inevitably going to occur, it is important to have in place servicerecovery strategies that provide for investigating difficulties and resolving them to the satisfaction of both parties.
ORGANISATIONAL REQUIREMENTS
Managers cannot create a market orientation overnight. The organisation needs to have in place the assetsand capabilities to provide unique value to customers. For example, Sony’s ability to develop a successful valueproposition based on product leadership rests on heavy investment and deep-rooted skills in microelectronics and
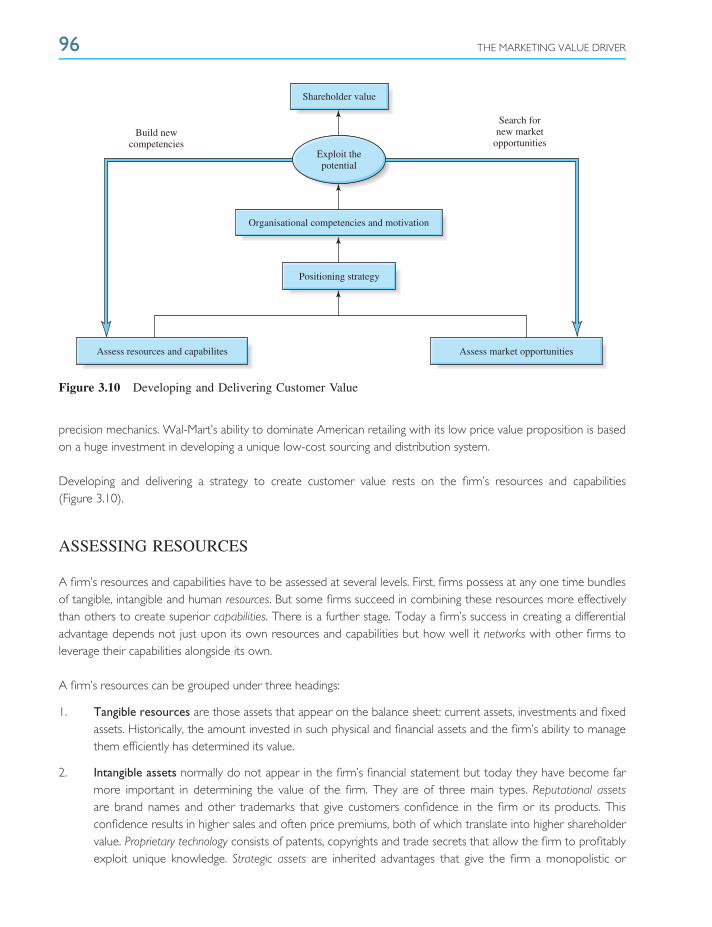
96 THE MARKETING VALUE DRIVER
Shareholder value
Build newcompetencies
Search fornew market
opportunitiesExploit thepotential
Positioning strategy
Organisational competencies and motivation
Assess resources and capabilites Assess market opportunities
Figure 3.10 Developing and Delivering Customer Value
precision mechanics. Wal-Mart’s ability to dominate American retailing with its low price value proposition is basedon a huge investment in developing a unique low-cost sourcing and distribution system.
Developing and delivering a strategy to create customer value rests on the firm’s resources and capabilities(Figure 3.10).
ASSESSING RESOURCES
A firm’s resources and capabilities have to be assessed at several levels. First, firms possess at any one time bundlesof tangible, intangible and human resources. But some firms succeed in combining these resources more effectivelythan others to create superior capabilities. There is a further stage. Today a firm’s success in creating a differentialadvantage depends not just upon its own resources and capabilities but how well it networks with other firms toleverage their capabilities alongside its own.
A firm’s resources can be grouped under three headings:
1. Tangible resources are those assets that appear on the balance sheet: current assets, investments and fixedassets. Historically, the amount invested in such physical and financial assets and the firm’s ability to managethem efficiently has determined its value.
2. Intangible assets normally do not appear in the firm’s financial statement but today they have become farmore important in determining the value of the firm. They are of three main types. Reputational assetsare brand names and other trademarks that give customers confidence in the firm or its products. Thisconfidence results in higher sales and often price premiums, both of which translate into higher shareholdervalue. Proprietary technology consists of patents, copyrights and trade secrets that allow the firm to profitablyexploit unique knowledge. Strategic assets are inherited advantages that give the firm a monopolistic or
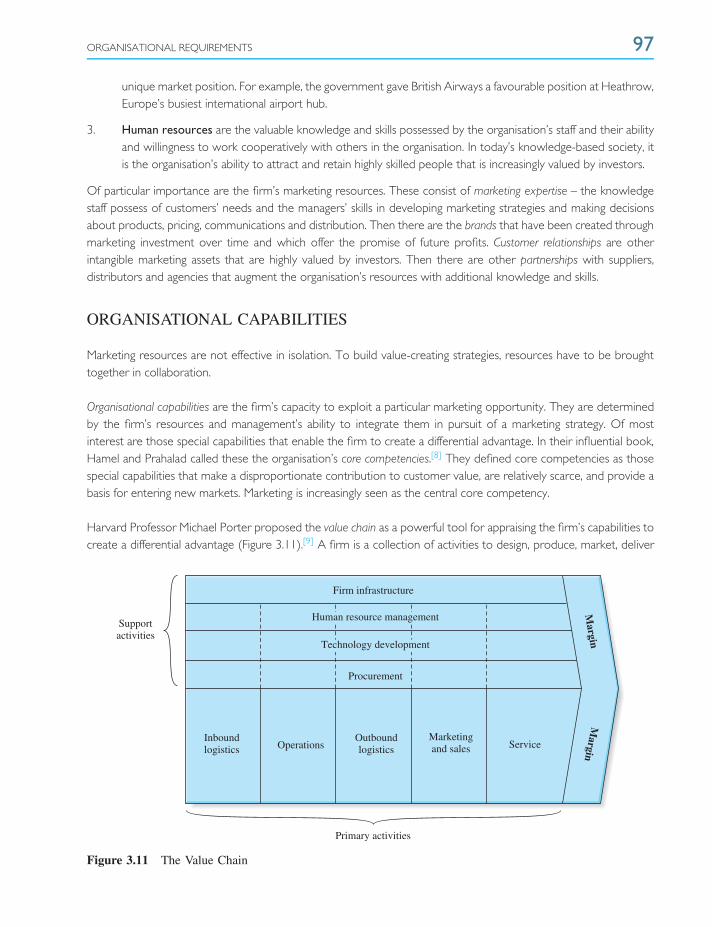
ORGANISATIONAL REQUIREMENTS 97
unique market position. For example, the government gave British Airways a favourable position at Heathrow,Europe’s busiest international airport hub.
3. Human resources are the valuable knowledge and skills possessed by the organisation’s staff and their abilityand willingness to work cooperatively with others in the organisation. In today’s knowledge-based society, itis the organisation’s ability to attract and retain highly skilled people that is increasingly valued by investors.
Of particular importance are the firm’s marketing resources. These consist of marketing expertise – the knowledgestaff possess of customers’ needs and the managers’ skills in developing marketing strategies and making decisionsabout products, pricing, communications and distribution. Then there are the brands that have been created throughmarketing investment over time and which offer the promise of future profits. Customer relationships are otherintangible marketing assets that are highly valued by investors. Then there are other partnerships with suppliers,distributors and agencies that augment the organisation’s resources with additional knowledge and skills.
ORGANISATIONAL CAPABILITIES
Marketing resources are not effective in isolation. To build value-creating strategies, resources have to be broughttogether in collaboration.
Organisational capabilities are the firm’s capacity to exploit a particular marketing opportunity. They are determinedby the firm’s resources and management’s ability to integrate them in pursuit of a marketing strategy. Of mostinterest are those special capabilities that enable the firm to create a differential advantage. In their influential book,Hamel and Prahalad called these the organisation’s core competencies.[8] They defined core competencies as thosespecial capabilities that make a disproportionate contribution to customer value, are relatively scarce, and provide abasis for entering new markets. Marketing is increasingly seen as the central core competency.
Harvard Professor Michael Porter proposed the value chain as a powerful tool for appraising the firm’s capabilities tocreate a differential advantage (Figure 3.11).[9] A firm is a collection of activities to design, produce, market, deliver
Supportactivities
Firm infrastructure
Human resource management
Technology development
Procurement
Margin
Margin
Primary activities
Inboundlogistics
OutboundlogisticsOperations
Marketingand sales Service
Figure 3.11 The Value Chain
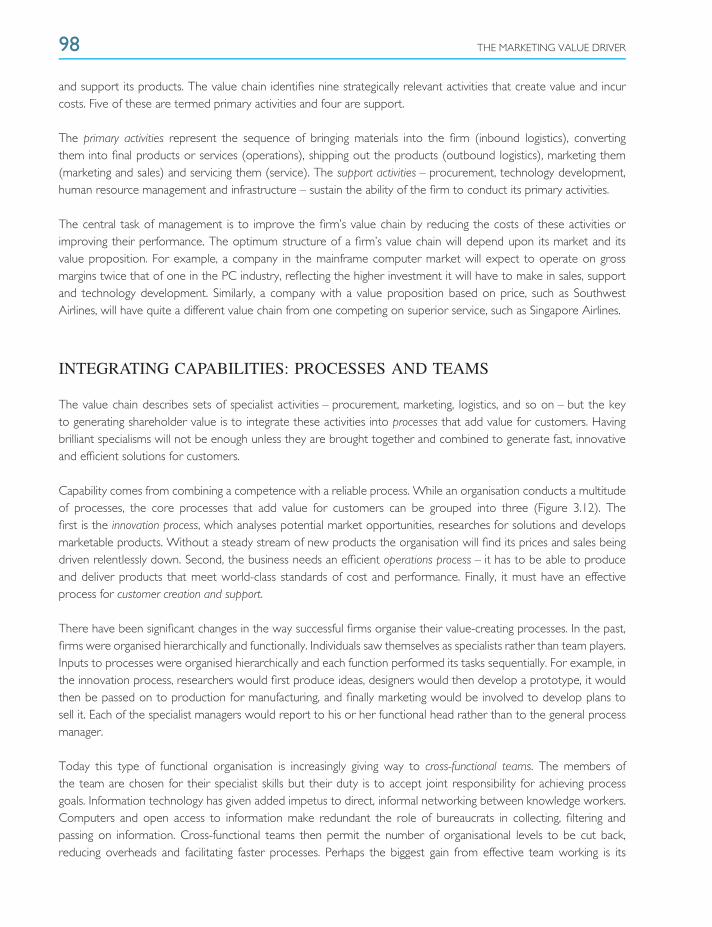
98 THE MARKETING VALUE DRIVER
and support its products. The value chain identifies nine strategically relevant activities that create value and incurcosts. Five of these are termed primary activities and four are support.
The primary activities represent the sequence of bringing materials into the firm (inbound logistics), convertingthem into final products or services (operations), shipping out the products (outbound logistics), marketing them(marketing and sales) and servicing them (service). The support activities – procurement, technology development,human resource management and infrastructure – sustain the ability of the firm to conduct its primary activities.
The central task of management is to improve the firm’s value chain by reducing the costs of these activities orimproving their performance. The optimum structure of a firm’s value chain will depend upon its market and itsvalue proposition. For example, a company in the mainframe computer market will expect to operate on grossmargins twice that of one in the PC industry, reflecting the higher investment it will have to make in sales, supportand technology development. Similarly, a company with a value proposition based on price, such as SouthwestAirlines, will have quite a different value chain from one competing on superior service, such as Singapore Airlines.
INTEGRATING CAPABILITIES: PROCESSES AND TEAMS
The value chain describes sets of specialist activities – procurement, marketing, logistics, and so on – but the keyto generating shareholder value is to integrate these activities into processes that add value for customers. Havingbrilliant specialisms will not be enough unless they are brought together and combined to generate fast, innovativeand efficient solutions for customers.
Capability comes from combining a competence with a reliable process. While an organisation conducts a multitudeof processes, the core processes that add value for customers can be grouped into three (Figure 3.12). Thefirst is the innovation process, which analyses potential market opportunities, researches for solutions and developsmarketable products. Without a steady stream of new products the organisation will find its prices and sales beingdriven relentlessly down. Second, the business needs an efficient operations process – it has to be able to produceand deliver products that meet world-class standards of cost and performance. Finally, it must have an effectiveprocess for customer creation and support.
There have been significant changes in the way successful firms organise their value-creating processes. In the past,firms were organised hierarchically and functionally. Individuals saw themselves as specialists rather than team players.Inputs to processes were organised hierarchically and each function performed its tasks sequentially. For example, inthe innovation process, researchers would first produce ideas, designers would then develop a prototype, it wouldthen be passed on to production for manufacturing, and finally marketing would be involved to develop plans tosell it. Each of the specialist managers would report to his or her functional head rather than to the general processmanager.
Today this type of functional organisation is increasingly giving way to cross-functional teams. The members ofthe team are chosen for their specialist skills but their duty is to accept joint responsibility for achieving processgoals. Information technology has given added impetus to direct, informal networking between knowledge workers.Computers and open access to information make redundant the role of bureaucrats in collecting, filtering andpassing on information. Cross-functional teams then permit the number of organisational levels to be cut back,reducing overheads and facilitating faster processes. Perhaps the biggest gain from effective team working is its

ORGANISATIONAL REQUIREMENTS 99
Analysis Research
Research
Development
Innovation process
Operations process
Customer creation and support
Design Engineering Production Delivery
Strategy Communications Service
Figure 3.12 The Core Processes of the Business
motivational impact on employees. By breaking work down into tasks that can be accomplished by self-managingteams, management releases the energies of their people. Employees can throw off the debilitating blanket ofbureaucracy, can set themselves ambitious targets, and can see the results of their contributions in new products,faster processes or higher levels of customer satisfaction.
NETWORKS: AUGMENTING COMPETENCIES
The competitiveness of a firm’s value chain depends not only upon the effectiveness of its internal, cross-functionalnetworks but increasingly upon its external networks. In the past, larger companies preferred to integrate theactivities which contributed to value. For example, in the past a company like Ford had its own foundries castingiron and steel, its own factories making glass, tyres, engines and electrical components, and its own distributionbusiness taking the assembled cars to its dealers. Today, however, most companies prefer to outsource non-coreactivities to a network of suppliers, distributors and partners. Procter & Gamble is a case in point. The company usesopen-source innovation, collaborating with suppliers, competitors, scientists, entrepreneurs, and others. It scours theworld for proven technologies, packages, and products that P&G can improve, scale up, and market either on itsown or in partnership with other companies. [10]
The decline of vertical integration and the growth of networks are due to the changing business environment:notably, rapid technological change, the globalisation of markets and rising customer expectations. New technologieshave meant that firms have had to rapidly obtain capabilities that were outside their traditional areas of competence.Sourcing such component products from outside is often the only practical route. Developing the capabilitiesinternally would take too long, require too great an investment and be too risky. Similarly, globalisation has openedup new markets, but often firms lack the capabilities to exploit these opportunities. Finding business partners is anobvious solution.
Increasingly, the firm’s value chain is part of a system for delivering solutions to customers (Figure 3.13). It is theeffectiveness with which managers handle the whole supply chain and network of partnerships that determines the
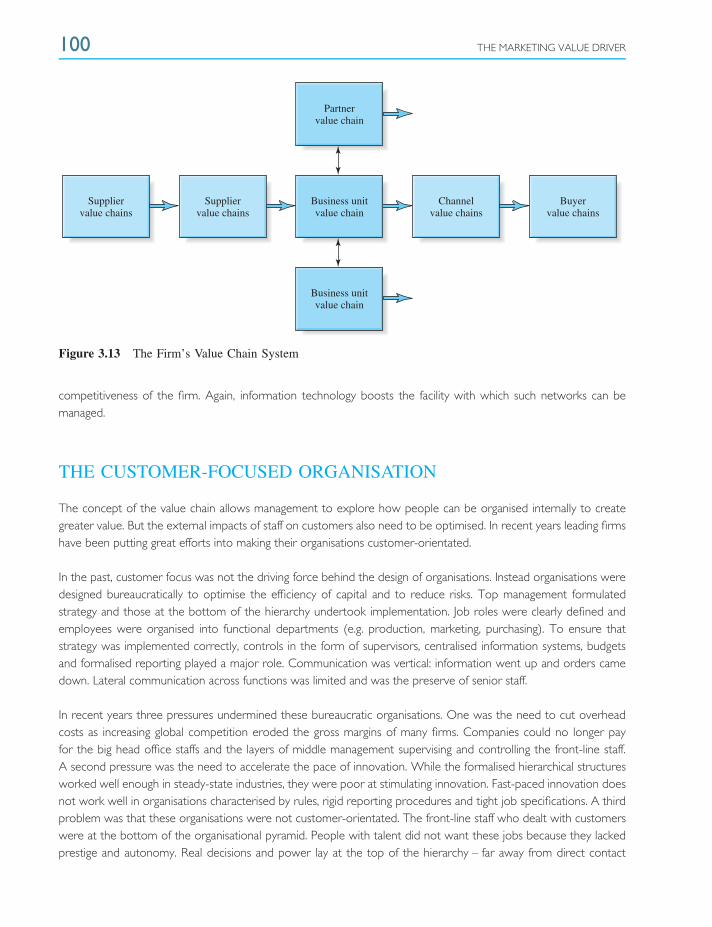
100 THE MARKETING VALUE DRIVER
Partnervalue chain
Suppliervalue chains
Suppliervalue chains
Business unitvalue chain
Business unitvalue chain
Channelvalue chains
Buyervalue chains
Figure 3.13 The Firm’s Value Chain System
competitiveness of the firm. Again, information technology boosts the facility with which such networks can bemanaged.
THE CUSTOMER-FOCUSED ORGANISATION
The concept of the value chain allows management to explore how people can be organised internally to creategreater value. But the external impacts of staff on customers also need to be optimised. In recent years leading firmshave been putting great efforts into making their organisations customer-orientated.
In the past, customer focus was not the driving force behind the design of organisations. Instead organisations weredesigned bureaucratically to optimise the efficiency of capital and to reduce risks. Top management formulatedstrategy and those at the bottom of the hierarchy undertook implementation. Job roles were clearly defined andemployees were organised into functional departments (e.g. production, marketing, purchasing). To ensure thatstrategy was implemented correctly, controls in the form of supervisors, centralised information systems, budgetsand formalised reporting played a major role. Communication was vertical: information went up and orders camedown. Lateral communication across functions was limited and was the preserve of senior staff.
In recent years three pressures undermined these bureaucratic organisations. One was the need to cut overheadcosts as increasing global competition eroded the gross margins of many firms. Companies could no longer payfor the big head office staffs and the layers of middle management supervising and controlling the front-line staff.A second pressure was the need to accelerate the pace of innovation. While the formalised hierarchical structuresworked well enough in steady-state industries, they were poor at stimulating innovation. Fast-paced innovation doesnot work well in organisations characterised by rules, rigid reporting procedures and tight job specifications. A thirdproblem was that these organisations were not customer-orientated. The front-line staff who dealt with customerswere at the bottom of the organisational pyramid. People with talent did not want these jobs because they lackedprestige and autonomy. Real decisions and power lay at the top of the hierarchy – far away from direct contact
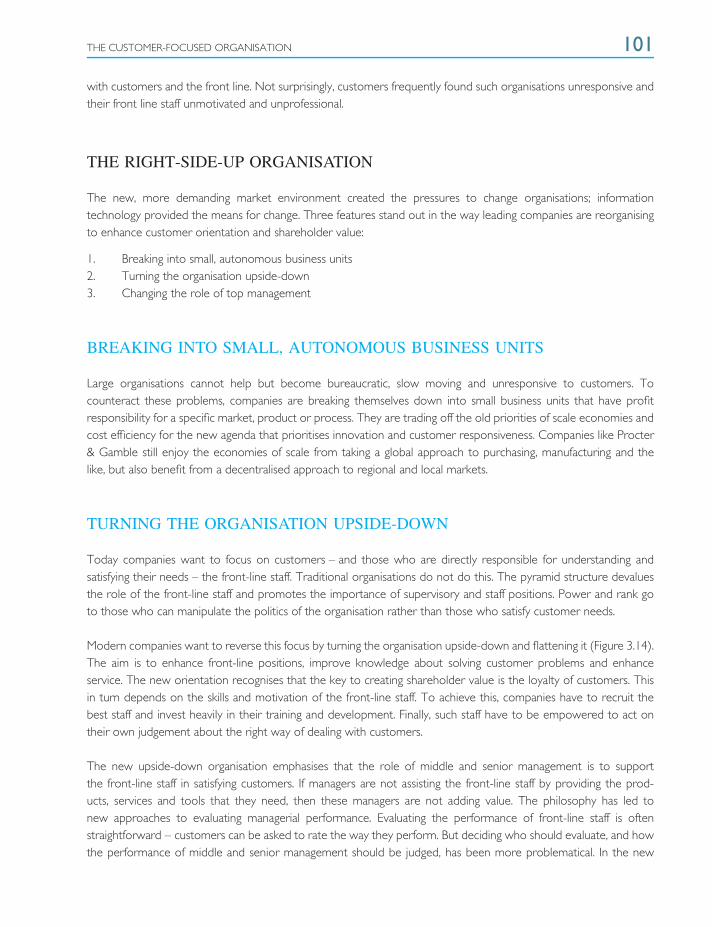
THE CUSTOMER-FOCUSED ORGANISATION 101
with customers and the front line. Not surprisingly, customers frequently found such organisations unresponsive andtheir front line staff unmotivated and unprofessional.
THE RIGHT-SIDE-UP ORGANISATION
The new, more demanding market environment created the pressures to change organisations; informationtechnology provided the means for change. Three features stand out in the way leading companies are reorganisingto enhance customer orientation and shareholder value:
1. Breaking into small, autonomous business units2. Turning the organisation upside-down3. Changing the role of top management
BREAKING INTO SMALL, AUTONOMOUS BUSINESS UNITS
Large organisations cannot help but become bureaucratic, slow moving and unresponsive to customers. Tocounteract these problems, companies are breaking themselves down into small business units that have profitresponsibility for a specific market, product or process. They are trading off the old priorities of scale economies andcost efficiency for the new agenda that prioritises innovation and customer responsiveness. Companies like Procter& Gamble still enjoy the economies of scale from taking a global approach to purchasing, manufacturing and thelike, but also benefit from a decentralised approach to regional and local markets.
TURNING THE ORGANISATION UPSIDE-DOWN
Today companies want to focus on customers – and those who are directly responsible for understanding andsatisfying their needs – the front-line staff. Traditional organisations do not do this. The pyramid structure devaluesthe role of the front-line staff and promotes the importance of supervisory and staff positions. Power and rank goto those who can manipulate the politics of the organisation rather than those who satisfy customer needs.
Modern companies want to reverse this focus by turning the organisation upside-down and flattening it (Figure 3.14).The aim is to enhance front-line positions, improve knowledge about solving customer problems and enhanceservice. The new orientation recognises that the key to creating shareholder value is the loyalty of customers. Thisin turn depends on the skills and motivation of the front-line staff. To achieve this, companies have to recruit thebest staff and invest heavily in their training and development. Finally, such staff have to be empowered to act ontheir own judgement about the right way of dealing with customers.
The new upside-down organisation emphasises that the role of middle and senior management is to supportthe front-line staff in satisfying customers. If managers are not assisting the front-line staff by providing the prod-ucts, services and tools that they need, then these managers are not adding value. The philosophy has led tonew approaches to evaluating managerial performance. Evaluating the performance of front-line staff is oftenstraightforward – customers can be asked to rate the way they perform. But deciding who should evaluate, and howthe performance of middle and senior management should be judged, has been more problematical. In the new
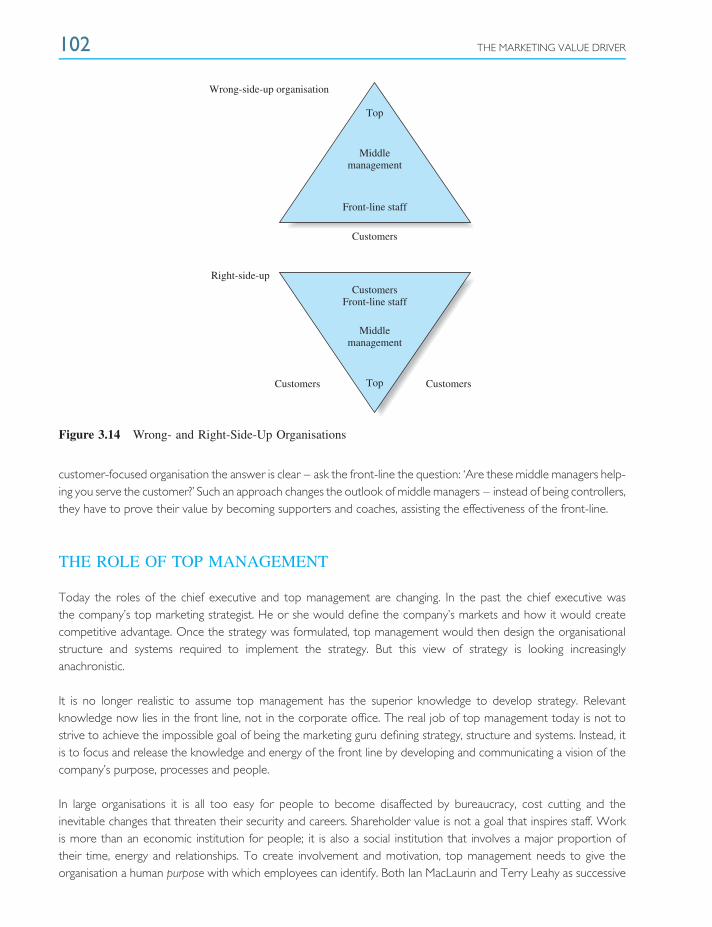
102 THE MARKETING VALUE DRIVER
Wrong-side-up organisation
Right-side-up
Customers Customers
Customers
CustomersFront-line staff
Top
Top
Middlemanagement
Middlemanagement
Front-line staff
Figure 3.14 Wrong- and Right-Side-Up Organisations
customer-focused organisation the answer is clear – ask the front-line the question: ‘Are these middle managers help-ing you serve the customer?’ Such an approach changes the outlook of middle managers – instead of being controllers,they have to prove their value by becoming supporters and coaches, assisting the effectiveness of the front-line.
THE ROLE OF TOP MANAGEMENT
Today the roles of the chief executive and top management are changing. In the past the chief executive wasthe company’s top marketing strategist. He or she would define the company’s markets and how it would createcompetitive advantage. Once the strategy was formulated, top management would then design the organisationalstructure and systems required to implement the strategy. But this view of strategy is looking increasinglyanachronistic.
It is no longer realistic to assume top management has the superior knowledge to develop strategy. Relevantknowledge now lies in the front line, not in the corporate office. The real job of top management today is not tostrive to achieve the impossible goal of being the marketing guru defining strategy, structure and systems. Instead, itis to focus and release the knowledge and energy of the front line by developing and communicating a vision of thecompany’s purpose, processes and people.
In large organisations it is all too easy for people to become disaffected by bureaucracy, cost cutting and theinevitable changes that threaten their security and careers. Shareholder value is not a goal that inspires staff. Workis more than an economic institution for people; it is also a social institution that involves a major proportion oftheir time, energy and relationships. To create involvement and motivation, top management needs to give theorganisation a human purpose with which employees can identify. Both Ian MacLaurin and Terry Leahy as successive
NOTES ON CHAPTER 3 103
chief executives of Tesco have had as the driving principle for everyone in the company: to create value forcustomers to earn their lifetime loyalty. Today, the real role of the chief executive is to shape the culture of theorganisation and give it a meaning that encourages people to willingly contribute their energies and skills.
SUMMARY
1. Marketing is the basis for creating shareholder value. Only by meeting customer needs, developing customerpreference and building customer relationships can an organisation achieve profitable growth.
2. Marketing has not had the impact on top management that its importance justifies. This is largely due toits objectives being poorly defined. Value-based marketing redefines marketing as the central contributor toshareholder value and presents a clear framework for evaluating the success of marketing strategies.
3. The first step to successful marketing is a detailed understanding of customers: their needs, operatingprocedures and decision-making processes. Customers do not want products, they want solutions to theirproblems. Preference and value is created by solving customers’ problems. Today it is increasingly difficult tomake money from selling products.
4. Meeting customer needs is not sufficient. The organisation also has to create a differential advantage: a reasonwhy it should be preferred to competitor businesses. A differential advantage may be based upon offeringconsumers superior benefits, lower costs or some combination of the two.
5. The ultimate goal is to build partnerships with high-value customers founded on loyalty and trust. Customerloyalty is the real source of sound business growth and profitability. Customers are assets: the longer theyare retained, the more value they should create.
6. Building successful customer partnerships depends upon the firm having the resources and capabilities tobuild outstanding processes, particularly in innovation, operations, and customer creation and support.
REVIEW QUESTIONS
1. How does value-based marketing differ from the traditional definition of marketing?2. Why is meeting customer needs the foundation for creating shareholder value?3. Explain the significance of the differential advantage for marketing and shareholder value.4. Explain and illustrate how customer loyalty affects a company’s rate of sales growth and its operating margin.5. What are the steps necessary for developing a relationship-marketing programme?6. What resources and capabilities does an organisation need to develop a successful marketing strategy?
NOTES ON CHAPTER 3
[1] Michael Treacy and Fred Wiersema, The Discipline of Market Leaders, London: HarperCollins, 1995.
[2] Many of these findings are presented in an important book, Frederick F. Reichheld, The Loyalty Effect, Boston,MA: Harvard Business School Press, 1996.
[3] ‘Consumer vigilantes’, Business Week, 21 February 2008.

104 THE MARKETING VALUE DRIVER
[4] Frederick F. Reichheld, The one number you need to grow, Harvard Business Review, December 2003.
[5] Thomas O. Jones and W. Earl Sasser, Jr, Why satisfied customers defect, Harvard Business Review, Novem-ber/December, 1995, 88–99.
[6] For a complete review of this approach see Robert M. Morgan and Shelby D. Hunt, The commitment–trusttheory of marketing, Journal of Marketing, 58(3), 1994, 20–38. See also: Glen L. Urban, The Trust Imperative, MITSloan Working Paper, No. 4302-03, March 2003.
[7] For an example of the use of rating systems to evaluate prospective customers see John O. Whitney, Strategicrenewal for business units, Harvard Business Review, 74(5), July/August, 1996, 84–99.
[8] Gary Hamel and C.K. Prahalad, Competing for the Future, Boston, MA: Harvard Business School Press, 1994.
[9] Michael E. Porter, Competitive Advantage: Creating and Sustaining Superior Performance, New York: Simon &Schuster, 1985.
[10] Larry Huston and Nabil Sakkab, Connect and develop: inside Procter & Gamble’s new model for innovation,Harvard Business Review, 1 March 2006.
4The Growth Imperative
‘When the rate of change inside the company is exceeded by the rate of change outside thecompany, the end is near.’
Jack Welch, Chairman of General Electric
INTRODUCTION AND OBJECTIVES
Growth is essential for creating shareholder value. Those companies that created the greatest shareholder valueduring the latter half of the 1990s and the early years of the 21st century, such as Microsoft, Dell, Vodaphone, Nokiaand Wal-Mart, were all companies that grew turnover rapidly. Logically, this is easy to understand: shareholder valueis created by discounting long-term cash flows. The primary determinant of cash flow is profitable sales. Of course,cutting costs and investment can temporarily boost cash flow. But such actions rarely increase the value of the businesssubstantially, because investors recognise that these actions do not create long-term profit growth. Such measuressimply produce short-term gains, often at the expense of long-term growth. In contrast, financial markets clearlyrecognise, in large share premiums, the value of those companies that create the potential for profitable growth.
Management should make growth a top priority. But the evidence suggests that this does not happen. Theboardroom agenda is all too often crowded out with operating and administrative concerns that have little relevanceto the key strategic issues of growth and value creation. This chapter focuses on how to develop and manage agrowth strategy.
By the time you have completed this chapter, you will be able to:
❍ Explain the link between growth and value creation
❍ Identify the alternative ways growth can be achieved
❍ Analyse when diversification outside the company’s traditional products and markets makes sense
❍ Describe how to develop a growth strategy for a business
❍ Understand how to implement a growth strategy in a company
The next section shows how growth increases the financial value of a company. We then turn to the growthladder – nine pathways to accelerate growth, starting with maximising the potential opportunities offered by thecompany’s existing customer base and culminating in the unconstrained search for growth outside the boundariesof the current industry. Finally, we show how a growth strategy should be organised. We explore how managementcan put growth at the top of the corporate agenda and implement an action plan to move up the growth ladder.
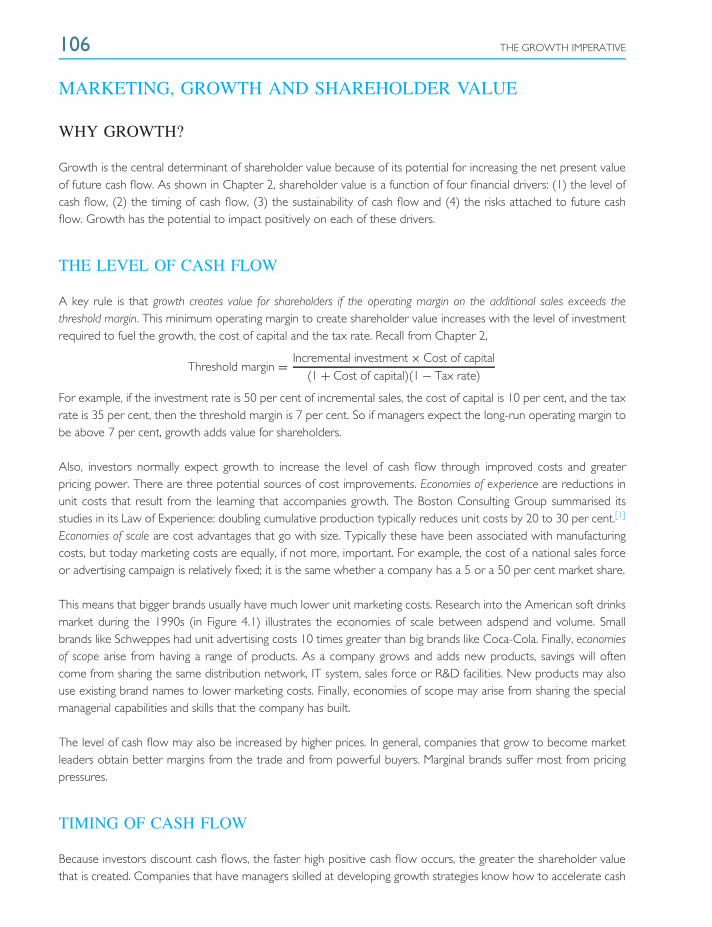
106 THE GROWTH IMPERATIVE
MARKETING, GROWTH AND SHAREHOLDER VALUE
WHY GROWTH?
Growth is the central determinant of shareholder value because of its potential for increasing the net present valueof future cash flow. As shown in Chapter 2, shareholder value is a function of four financial drivers: (1) the level ofcash flow, (2) the timing of cash flow, (3) the sustainability of cash flow and (4) the risks attached to future cashflow. Growth has the potential to impact positively on each of these drivers.
THE LEVEL OF CASH FLOW
A key rule is that growth creates value for shareholders if the operating margin on the additional sales exceeds thethreshold margin. This minimum operating margin to create shareholder value increases with the level of investmentrequired to fuel the growth, the cost of capital and the tax rate. Recall from Chapter 2,
Threshold margin = Incremental investment × Cost of capital(1 + Cost of capital)(1 − Tax rate)
For example, if the investment rate is 50 per cent of incremental sales, the cost of capital is 10 per cent, and the taxrate is 35 per cent, then the threshold margin is 7 per cent. So if managers expect the long-run operating margin tobe above 7 per cent, growth adds value for shareholders.
Also, investors normally expect growth to increase the level of cash flow through improved costs and greaterpricing power. There are three potential sources of cost improvements. Economies of experience are reductions inunit costs that result from the learning that accompanies growth. The Boston Consulting Group summarised itsstudies in its Law of Experience: doubling cumulative production typically reduces unit costs by 20 to 30 per cent.[1]
Economies of scale are cost advantages that go with size. Typically these have been associated with manufacturingcosts, but today marketing costs are equally, if not more, important. For example, the cost of a national sales forceor advertising campaign is relatively fixed; it is the same whether a company has a 5 or a 50 per cent market share.
This means that bigger brands usually have much lower unit marketing costs. Research into the American soft drinksmarket during the 1990s (in Figure 4.1) illustrates the economies of scale between adspend and volume. Smallbrands like Schweppes had unit advertising costs 10 times greater than big brands like Coca-Cola. Finally, economiesof scope arise from having a range of products. As a company grows and adds new products, savings will oftencome from sharing the same distribution network, IT system, sales force or R&D facilities. New products may alsouse existing brand names to lower marketing costs. Finally, economies of scope may arise from sharing the specialmanagerial capabilities and skills that the company has built.
The level of cash flow may also be increased by higher prices. In general, companies that grow to become marketleaders obtain better margins from the trade and from powerful buyers. Marginal brands suffer most from pricingpressures.
TIMING OF CASH FLOW
Because investors discount cash flows, the faster high positive cash flow occurs, the greater the shareholder valuethat is created. Companies that have managers skilled at developing growth strategies know how to accelerate cash
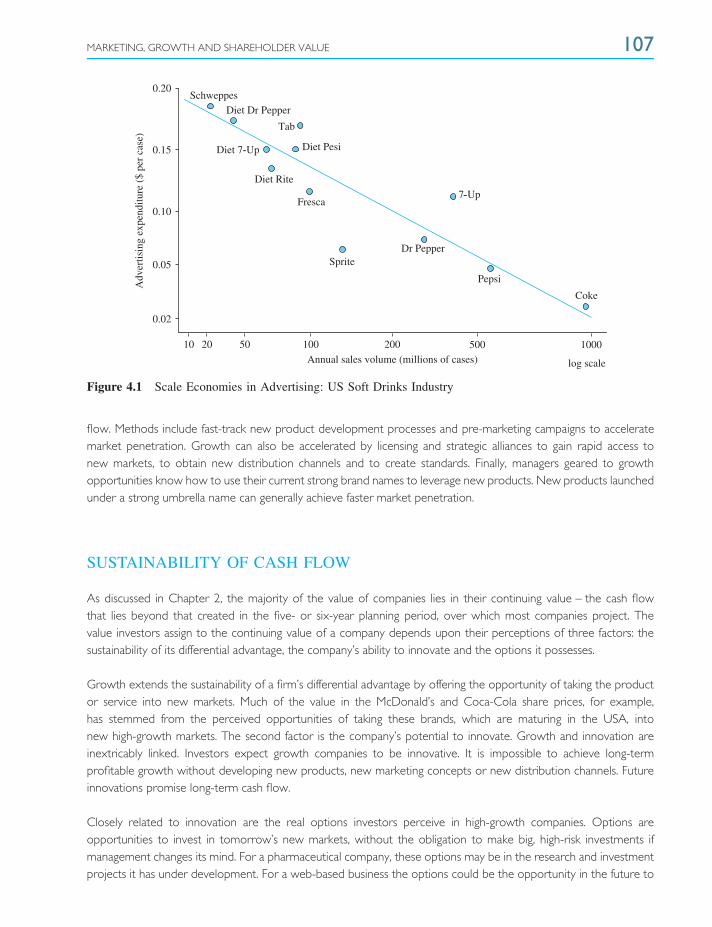
MARKETING, GROWTH AND SHAREHOLDER VALUE 107
10
Adv
ertis
ing
expe
nditu
re (
$ pe
r ca
se)
0.02
0.05
0.10
0.15
0.20Schweppes
Diet Dr Pepper
Tab
Diet Pesi
7-Up
Coke
Pepsi
Dr PepperSprite
Fresca
Diet Rite
Diet 7-Up
20 50 100 200
Annual sales volume (millions of cases)500 1000
log scale
Figure 4.1 Scale Economies in Advertising: US Soft Drinks Industry
flow. Methods include fast-track new product development processes and pre-marketing campaigns to acceleratemarket penetration. Growth can also be accelerated by licensing and strategic alliances to gain rapid access tonew markets, to obtain new distribution channels and to create standards. Finally, managers geared to growthopportunities know how to use their current strong brand names to leverage new products. New products launchedunder a strong umbrella name can generally achieve faster market penetration.
SUSTAINABILITY OF CASH FLOW
As discussed in Chapter 2, the majority of the value of companies lies in their continuing value – the cash flowthat lies beyond that created in the five- or six-year planning period, over which most companies project. Thevalue investors assign to the continuing value of a company depends upon their perceptions of three factors: thesustainability of its differential advantage, the company’s ability to innovate and the options it possesses.
Growth extends the sustainability of a firm’s differential advantage by offering the opportunity of taking the productor service into new markets. Much of the value in the McDonald’s and Coca-Cola share prices, for example,has stemmed from the perceived opportunities of taking these brands, which are maturing in the USA, intonew high-growth markets. The second factor is the company’s potential to innovate. Growth and innovation areinextricably linked. Investors expect growth companies to be innovative. It is impossible to achieve long-termprofitable growth without developing new products, new marketing concepts or new distribution channels. Futureinnovations promise long-term cash flow.
Closely related to innovation are the real options investors perceive in high-growth companies. Options areopportunities to invest in tomorrow’s new markets, without the obligation to make big, high-risk investments ifmanagement changes its mind. For a pharmaceutical company, these options may be in the research and investmentprojects it has under development. For a web-based business the options could be the opportunity in the future to

108 THE GROWTH IMPERATIVE
sell additional categories of merchandise through its portal. The options a firm is perceived to possess have a bigeffect on investors’ perceptions of its continuing value.
CASH FLOW RISK
Growth can also create shareholder value by reducing the volatility of cash flows and so cutting the cost of capital.First, growth reduces dependence on a single product and market and so reduces the firm’s vulnerability to specificshocks. Second, sustained growth is always based upon a growing core of satisfied customers who have beenwith the company for an extensive period. The greater the number of loyal customers, the less the company issusceptible to competitive activity.
ILLUSTRATING GROWTH EFFECTS: DELTA CO.
The effects of growth on shareholder value are illustrated in Table 4.1. Delta has a turnover of 20 million eurosand a current estimated market value of almost 19 million euros, when capitalised using the residual value method(NOPAT divided by the cost of capital). This will be its value if it does not pursue profitable growth opportunities.To explore how growth affects shareholder value, the following assumptions are made:
Operating profit margin (%) 12.0
Cash income tax rate (%) 30.0
Incremental working capital investment (%) 20.0
Incremental fixed capital investment (%) 25.0
Cost of capital (%) 9.0
To keep the model simple, marketing and overheads are assumed to increase proportionately with sales, so thatthe operating margin remains at 12 per cent. Note, this is well above the break-even threshold margin, calculatedat 5.3 per cent.[2]
A new management team introduces a marketing strategy that promises to boost growth to 10 per cent a yearover the six-year planning period. As shown, because of the positive threshold spread, this strategy increasesshareholder value by 34 per cent to over 25 million euros. Table 4.2 shows that if growth is accelerated to 20per cent a year, shareholder value is increased by 86 per cent. The last two columns in the table also show howvalue is further enhanced if growth also leads to economies in costs or working capital. For example, 10 per centgrowth associated with a similar reduction in unit variable cost would boost shareholder returns to 88 per cent. Thefigures in the growth columns illustrate why investors give such extraordinarily high share valuations to high-growthcompanies.
Of course, not any growth policy makes sense. If companies make excessive investments, and sales do not earnthe threshold margin, then growth will be value destroying. In the 1970s and 1980s, many Japanese manufacturersmade enormous investments in capacity in a vain effort to dominate their markets. The results in the 1990s wereexcess capacity, declining prices and massive losses, triggering a major recession and the collapse of many of thesebusinesses. To create value, sales have to achieve a threshold margin determined by the company’s cost of capital,its investment requirements and the tax rate.
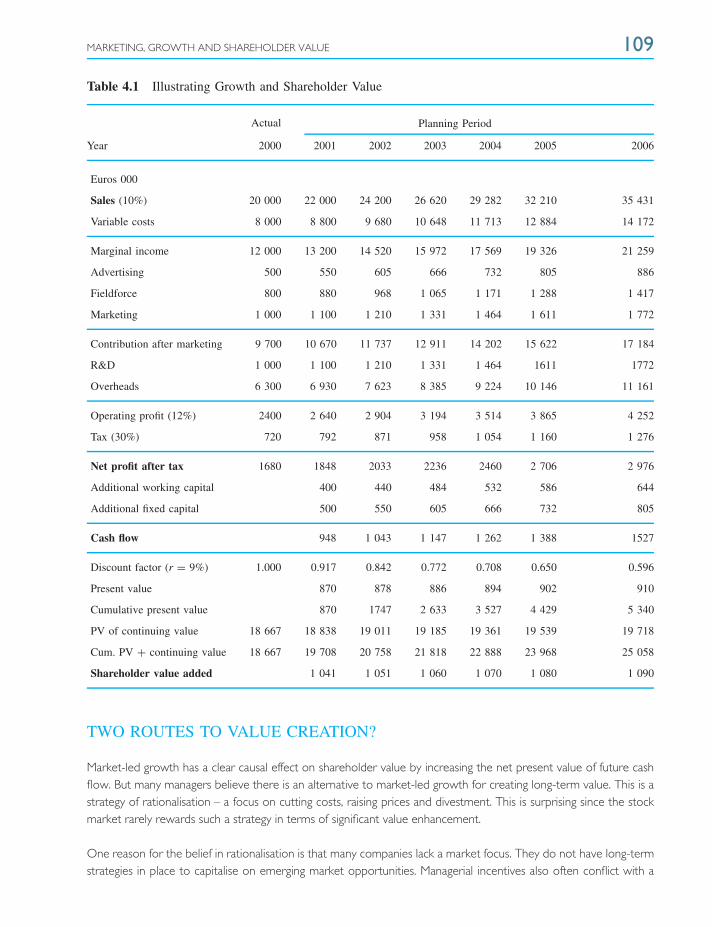
MARKETING, GROWTH AND SHAREHOLDER VALUE 109
Table 4.1 Illustrating Growth and Shareholder Value
Actual Planning Period
Year 2000 2001 2002 2003 2004 2005 2006
Euros 000
Sales (10%) 20 000 22 000 24 200 26 620 29 282 32 210 35 431
Variable costs 8 000 8 800 9 680 10 648 11 713 12 884 14 172
Marginal income 12 000 13 200 14 520 15 972 17 569 19 326 21 259
Advertising 500 550 605 666 732 805 886
Fieldforce 800 880 968 1 065 1 171 1 288 1 417
Marketing 1 000 1 100 1 210 1 331 1 464 1 611 1 772
Contribution after marketing 9 700 10 670 11 737 12 911 14 202 15 622 17 184
R&D 1 000 1 100 1 210 1 331 1 464 1611 1772
Overheads 6 300 6 930 7 623 8 385 9 224 10 146 11 161
Operating profit (12%) 2400 2 640 2 904 3 194 3 514 3 865 4 252
Tax (30%) 720 792 871 958 1 054 1 160 1 276
Net profit after tax 1680 1848 2033 2236 2460 2 706 2 976
Additional working capital 400 440 484 532 586 644
Additional fixed capital 500 550 605 666 732 805
Cash flow 948 1 043 1 147 1 262 1 388 1527
Discount factor (r = 9%) 1.000 0.917 0.842 0.772 0.708 0.650 0.596
Present value 870 878 886 894 902 910
Cumulative present value 870 1747 2 633 3 527 4 429 5 340
PV of continuing value 18 667 18 838 19 011 19 185 19 361 19 539 19 718
Cum. PV + continuing value 18 667 19 708 20 758 21 818 22 888 23 968 25 058
Shareholder value added 1 041 1 051 1 060 1 070 1 080 1 090
TWO ROUTES TO VALUE CREATION?
Market-led growth has a clear causal effect on shareholder value by increasing the net present value of future cashflow. But many managers believe there is an alternative to market-led growth for creating long-term value. This is astrategy of rationalisation – a focus on cutting costs, raising prices and divestment. This is surprising since the stockmarket rarely rewards such a strategy in terms of significant value enhancement.
One reason for the belief in rationalisation is that many companies lack a market focus. They do not have long-termstrategies in place to capitalise on emerging market opportunities. Managerial incentives also often conflict with a
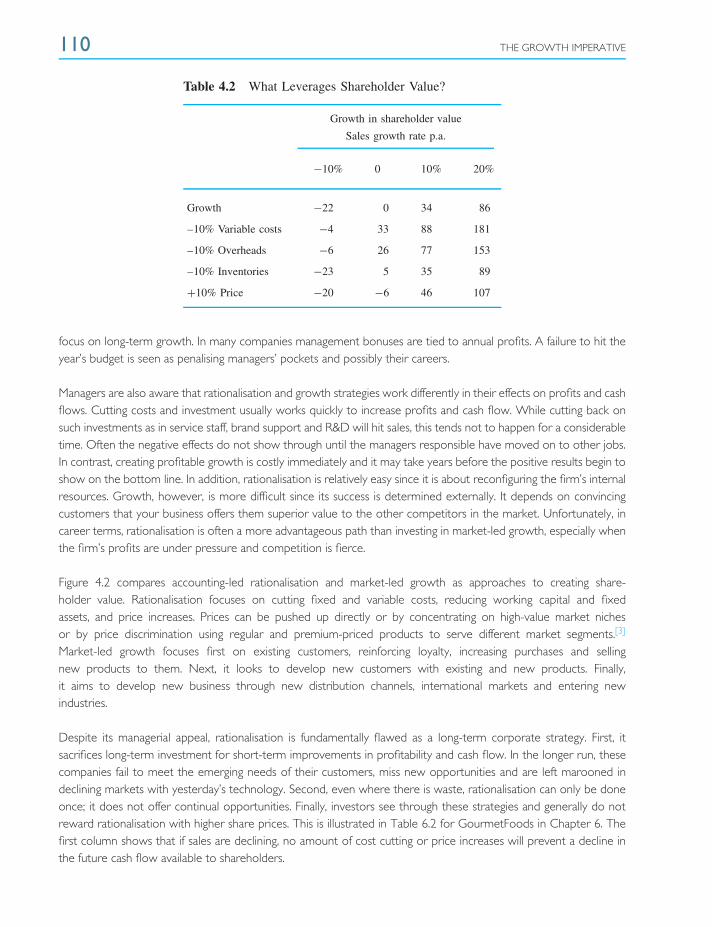
110 THE GROWTH IMPERATIVE
Table 4.2 What Leverages Shareholder Value?
Growth in shareholder value
Sales growth rate p.a.
−10% 0 10% 20%
Growth −22 0 34 86
–10% Variable costs −4 33 88 181
–10% Overheads −6 26 77 153
–10% Inventories −23 5 35 89
+10% Price −20 −6 46 107
focus on long-term growth. In many companies management bonuses are tied to annual profits. A failure to hit theyear’s budget is seen as penalising managers’ pockets and possibly their careers.
Managers are also aware that rationalisation and growth strategies work differently in their effects on profits and cashflows. Cutting costs and investment usually works quickly to increase profits and cash flow. While cutting back onsuch investments as in service staff, brand support and R&D will hit sales, this tends not to happen for a considerabletime. Often the negative effects do not show through until the managers responsible have moved on to other jobs.In contrast, creating profitable growth is costly immediately and it may take years before the positive results begin toshow on the bottom line. In addition, rationalisation is relatively easy since it is about reconfiguring the firm’s internalresources. Growth, however, is more difficult since its success is determined externally. It depends on convincingcustomers that your business offers them superior value to the other competitors in the market. Unfortunately, incareer terms, rationalisation is often a more advantageous path than investing in market-led growth, especially whenthe firm’s profits are under pressure and competition is fierce.
Figure 4.2 compares accounting-led rationalisation and market-led growth as approaches to creating share-holder value. Rationalisation focuses on cutting fixed and variable costs, reducing working capital and fixedassets, and price increases. Prices can be pushed up directly or by concentrating on high-value market nichesor by price discrimination using regular and premium-priced products to serve different market segments.[3]
Market-led growth focuses first on existing customers, reinforcing loyalty, increasing purchases and sellingnew products to them. Next, it looks to develop new customers with existing and new products. Finally,it aims to develop new business through new distribution channels, international markets and entering newindustries.
Despite its managerial appeal, rationalisation is fundamentally flawed as a long-term corporate strategy. First, itsacrifices long-term investment for short-term improvements in profitability and cash flow. In the longer run, thesecompanies fail to meet the emerging needs of their customers, miss new opportunities and are left marooned indeclining markets with yesterday’s technology. Second, even where there is waste, rationalisation can only be doneonce; it does not offer continual opportunities. Finally, investors see through these strategies and generally do notreward rationalisation with higher share prices. This is illustrated in Table 6.2 for GourmetFoods in Chapter 6. Thefirst column shows that if sales are declining, no amount of cost cutting or price increases will prevent a decline inthe future cash flow available to shareholders.
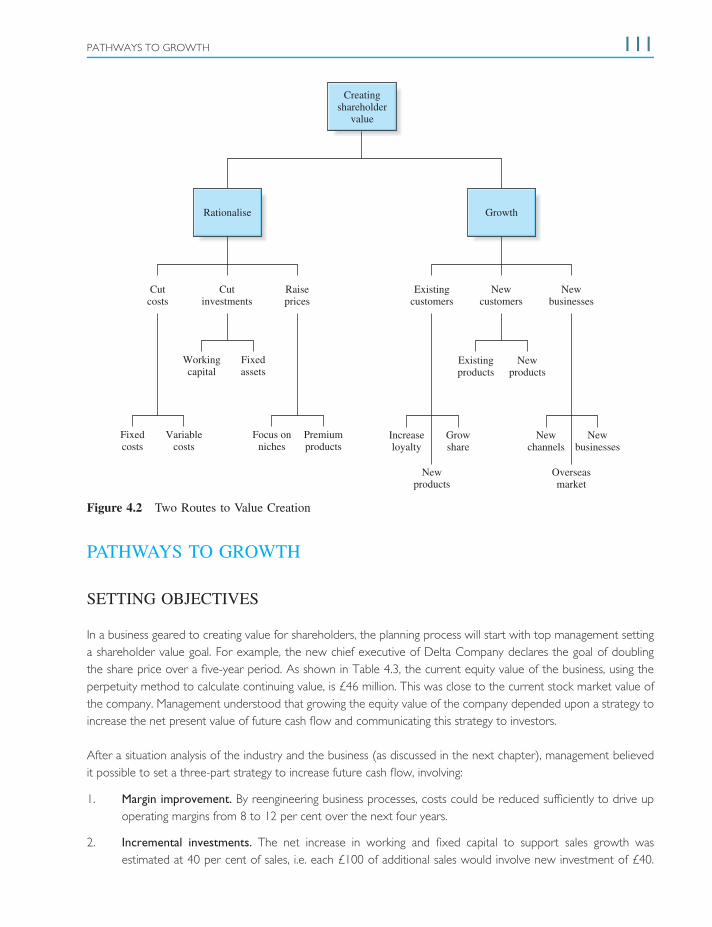
PATHWAYS TO GROWTH 111
Creatingshareholder
value
Rationalise
Cutcosts
Cutinvestments
Workingcapital
Fixedcosts
Variablecosts
Focus on niches
Fixedassets
Raiseprices
Existingcustomers
Newcustomers
Newbusinesses
Growth
Premiumproducts
Existingproducts
Newproducts
Newproducts
Overseasmarket
Increaseloyalty
Growshare
Newchannels
Newbusinesses
Figure 4.2 Two Routes to Value Creation
PATHWAYS TO GROWTH
SETTING OBJECTIVES
In a business geared to creating value for shareholders, the planning process will start with top management settinga shareholder value goal. For example, the new chief executive of Delta Company declares the goal of doublingthe share price over a five-year period. As shown in Table 4.3, the current equity value of the business, using theperpetuity method to calculate continuing value, is £46 million. This was close to the current stock market value ofthe company. Management understood that growing the equity value of the company depended upon a strategy toincrease the net present value of future cash flow and communicating this strategy to investors.
After a situation analysis of the industry and the business (as discussed in the next chapter), management believedit possible to set a three-part strategy to increase future cash flow, involving:
1. Margin improvement. By reengineering business processes, costs could be reduced sufficiently to drive upoperating margins from 8 to 12 per cent over the next four years.
2. Incremental investments. The net increase in working and fixed capital to support sales growth wasestimated at 40 per cent of sales, i.e. each £100 of additional sales would involve new investment of £40.
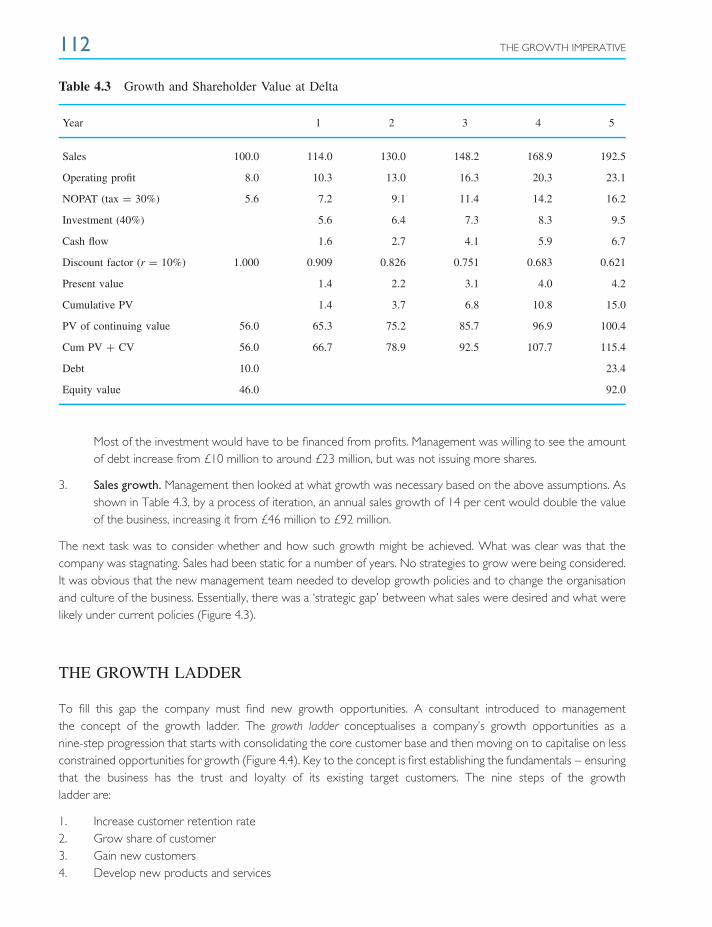
112 THE GROWTH IMPERATIVE
Table 4.3 Growth and Shareholder Value at Delta
Year 1 2 3 4 5
Sales 100.0 114.0 130.0 148.2 168.9 192.5
Operating profit 8.0 10.3 13.0 16.3 20.3 23.1
NOPAT (tax = 30%) 5.6 7.2 9.1 11.4 14.2 16.2
Investment (40%) 5.6 6.4 7.3 8.3 9.5
Cash flow 1.6 2.7 4.1 5.9 6.7
Discount factor (r = 10%) 1.000 0.909 0.826 0.751 0.683 0.621
Present value 1.4 2.2 3.1 4.0 4.2
Cumulative PV 1.4 3.7 6.8 10.8 15.0
PV of continuing value 56.0 65.3 75.2 85.7 96.9 100.4
Cum PV + CV 56.0 66.7 78.9 92.5 107.7 115.4
Debt 10.0 23.4
Equity value 46.0 92.0
Most of the investment would have to be financed from profits. Management was willing to see the amountof debt increase from £10 million to around £23 million, but was not issuing more shares.
3. Sales growth. Management then looked at what growth was necessary based on the above assumptions. Asshown in Table 4.3, by a process of iteration, an annual sales growth of 14 per cent would double the valueof the business, increasing it from £46 million to £92 million.
The next task was to consider whether and how such growth might be achieved. What was clear was that thecompany was stagnating. Sales had been static for a number of years. No strategies to grow were being considered.It was obvious that the new management team needed to develop growth policies and to change the organisationand culture of the business. Essentially, there was a ‘strategic gap’ between what sales were desired and what werelikely under current policies (Figure 4.3).
THE GROWTH LADDER
To fill this gap the company must find new growth opportunities. A consultant introduced to managementthe concept of the growth ladder. The growth ladder conceptualises a company’s growth opportunities as anine-step progression that starts with consolidating the core customer base and then moving on to capitalise on lessconstrained opportunities for growth (Figure 4.4). Key to the concept is first establishing the fundamentals – ensuringthat the business has the trust and loyalty of its existing target customers. The nine steps of the growthladder are:
1. Increase customer retention rate2. Grow share of customer3. Gain new customers4. Develop new products and services
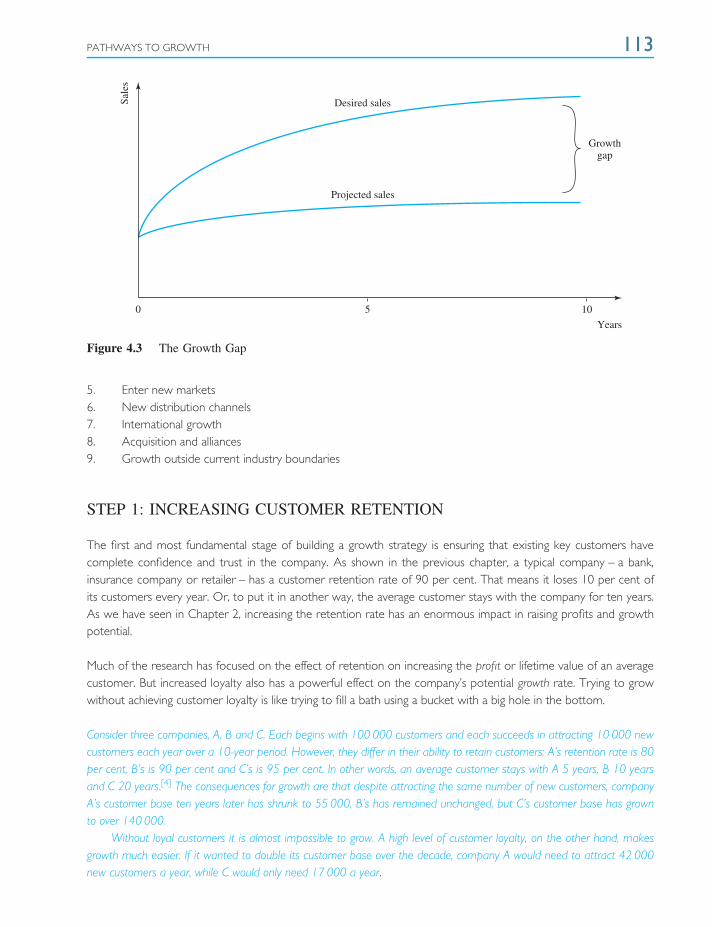
PATHWAYS TO GROWTH 113
0 5 10
Years
Projected sales
Desired sales
Growthgap
Sale
s
Figure 4.3 The Growth Gap
5. Enter new markets6. New distribution channels7. International growth8. Acquisition and alliances9. Growth outside current industry boundaries
STEP 1: INCREASING CUSTOMER RETENTION
The first and most fundamental stage of building a growth strategy is ensuring that existing key customers havecomplete confidence and trust in the company. As shown in the previous chapter, a typical company – a bank,insurance company or retailer – has a customer retention rate of 90 per cent. That means it loses 10 per cent ofits customers every year. Or, to put it in another way, the average customer stays with the company for ten years.As we have seen in Chapter 2, increasing the retention rate has an enormous impact in raising profits and growthpotential.
Much of the research has focused on the effect of retention on increasing the profit or lifetime value of an averagecustomer. But increased loyalty also has a powerful effect on the company’s potential growth rate. Trying to growwithout achieving customer loyalty is like trying to fill a bath using a bucket with a big hole in the bottom.
Consider three companies, A, B and C. Each begins with 100 000 customers and each succeeds in attracting 10 000 newcustomers each year over a 10-year period. However, they differ in their ability to retain customers: A’s retention rate is 80per cent, B’s is 90 per cent and C’s is 95 per cent. In other words, an average customer stays with A 5 years, B 10 yearsand C 20 years.[4] The consequences for growth are that despite attracting the same number of new customers, companyA’s customer base ten years later has shrunk to 55 000, B’s has remained unchanged, but C’s customer base has grownto over 140 000.
Without loyal customers it is almost impossible to grow. A high level of customer loyalty, on the other hand, makesgrowth much easier. If it wanted to double its customer base over the decade, company A would need to attract 42 000new customers a year, while C would only need 17 000 a year.

114 THE GROWTH IMPERATIVE
9. Growth outside industry boundaries
8. Acquisitions and alliances
7. International growth
6. New distribution channels
5. Enter new markets
4. Develop new products and services
3. Win new customers
2. Grow share of customer
1. Increase customer retention
Figure 4.4 The Ladder of Growth
To increase retention rate management needs to put in place a number of steps, outlined in the followingsubsections.
1. CUSTOMER SELECTION AND PRIORITISATION
Managers need to understand that customers should not all be treated equally. It is worth investing much more inretaining some customers than others. Two criteria determine what priority they should receive: customer lifetimevalue and strategic fit. The potential lifetime value of a customer depends on its size, growth, profitability and loyaltypotential. Strategic fit refers to the customer’s need for the firm’s distinctive capabilities and value proposition.
Managers should segment accounts along these criteria and respond accordingly. For example
A polymer company segmented its customers into three categories based on the size of the account, itsexpected future development and the type of business relationship. The categories were Partnership, Baseload and Swing. A different product and service offering was developed for each customer category.
PATHWAYS TO GROWTH 115
The company offered a formal partnership proposal to priority customers. If the customer accepted, itagreed to buy a minimum of 80 per cent of its requirements from the company. The agreement coveredproduct, credit terms, consignment stocks, technical and laboratory services as well as advice on trainingon environmental, health and safety issues. For example, the company maintained consignment stockrepresenting three weeks’ average consumption by the partner. All partner orders were handled on thesame day. Just-in-time deliveries meant that the customer did not need to maintain stock. All partnershad an account manager who took personal responsibility for the smooth operation of the customer’sbusiness.
Base load customers did not have consignment stocks maintained for them. Laboratory and technical serviceshad to be paid for. A more limited programme of training on environmental, health and safety issues wasoffered. Orders were handled within three working days.
Swing customers typically purchased most of their requirements from competitors. For these customers thebusiness relationship was limited to little more than delivery, If services were requested they were invoicedat market rates. Swing customers were normally requested to open a bank guarantee before orders wereaccepted.
2. CUSTOMISE THE VALUE PROPOSITION
Fundamentally, increasing the loyalty coefficient depends upon meeting the needs of the individual customer. Sothe first priority is listening to customers. Only by researching customers can management discover their needs andproblems. Business-to-business marketing will focus on offering customers superior profitability through lower costsor enhanced output. For household consumers it is often also about offering emotional value – confidence, prestigeor trust.
Until relatively recently it was only possible to customise solutions when a company had a small number ofcustomers. Most companies used variants of a mass marketing model. They designed products and services for amass market, or at least a major segment of it. Consumers then had to choose the best approximation to theirindividual requirements. Loyalty was low because consumers would shift when a competitor came out with a betterapproximation to their requirements.
The reducing cost of information technology has changed this by making new capabilities affordable. First, powerfuldatabases allow companies to tell customers apart and remember their individual interests and purchasinghistory, even when the numbers of customers run into millions. Second, interactivity through the Internet,telephone or direct mail means that individual customers can communicate information about their wants directlyto the company. Third, mass customisation technology means companies can customise products to individualrequirements. Companies like Dell and Amazon.com that pioneered this new mass customisation model foundthey could greatly increase the retention rate. What is the point of customers switching when their currentsupplier is giving them the exact product they want, when they want it, at a fair price? Especially whenthe company remembers what you bought last time and your billing details and can use this information totake the hassle out of ordering. It can even anticipate your requirements, suggesting new products that willinterest you and keep you up-to-date. Customisation can be either in terms of how the offer is communicatedto the customer or in terms of whether product attributes are personalised (see Chapter 10 for more oncustomisation).

116 THE GROWTH IMPERATIVE
3. ENHANCE THE VALUE PROPOSITION
However successful a company is today, it cannot afford to rest on its laurels. New competition is always closingthe gap. Changes in customer requirements and new technology continually make existing solutions obsolete. Tomaintain customer loyalty, the company has to maintain leadership by updating its products, services and the qualityof its relationships with customers.
Keeping one step ahead involves close monitoring of customers, competition and technological trends. It also meanstaking a long-term view of what is required to maintain customer loyalty. It may mean pursuing new productseven when they offer low margins and risk cannibalising current winners. For example, Hewlett Packard pioneeredcheap ink-jet printing technology even though it competed with its own high-margin laser technology. The companyrecognised that while in the short-run this cannibalisation reduced profits, in the long run it was the only way toretain customer loyalty.
4. MONITOR CUSTOMER SATISFACTION AND LOYALTY
Since customer loyalty is the first step on the ladder to achieving higher growth and profitability, it is amazing thatso few boards of directors insist on regularly measuring and monitoring it and its determinants. Improving customersatisfaction with the quality of the service experience is the most direct way of increasing loyalty. Researchers haveshown that there are normally five determinants of service quality that need to be monitored.[5] On average,customers weight them in importance as:
1. Reliability. The ability to perform the promised service dependably and accurately. (32 per cent of the totalimportance score)
2. Responsiveness. The willingness to help consumers and provide prompt service. (22 per cent)
3. Assurance. The knowledge and courtesy of employees and their ability to convey trust and confidence.(19 per cent)
4. Empathy. The provision of caring, individualised attention to customers. (16 per cent)
5. Tangibles. The appearance of the physical facilities, equipment, personnel and communications. (11 per cent)
Obviously, the relative importance of these factors will vary from product to product and market to market andfirms need to conduct research with their own customers to establish how they rank them.
Customers are satisfied if the service they perceive they receive along these dimensions equals what they expected.Customers are delighted if the perceived service exceeds expectations. The model of Figure 4.5 describes the maindeterminants of customer satisfaction.
How should managers use customer satisfaction data? Movements in ratings are lead indicators of the ability toretain customers and hence achieve growth and profit goals. As discussed in Chapter 3, only the highest scores, i.e.delighted customers, really correlate positively with loyalty. Management should not be satisfied if large groups ofkey customers are not rating the service in the top box.[6]
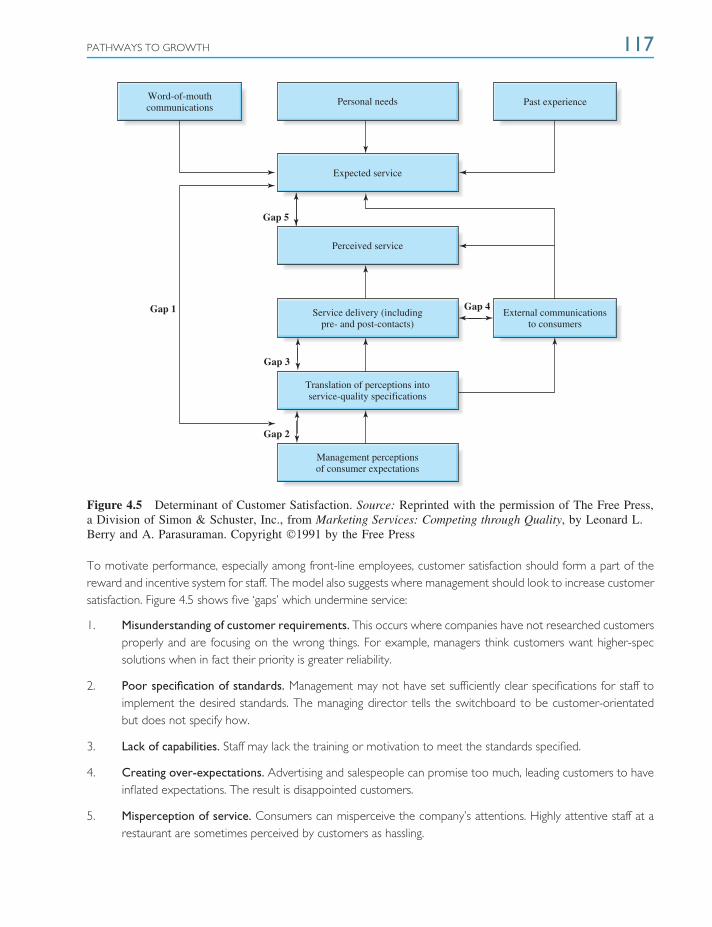
PATHWAYS TO GROWTH 117
Gap 5
Gap 4
Gap 3
Gap 2
Gap 1
Word-of-mouthcommunications
Personal needs
Expected service
Perceived service
Service delivery (includingpre- and post-contacts)
Translation of perceptions into service-quality specifications
Management perceptionsof consumer expectations
External communications to consumers
Past experience
Figure 4.5 Determinant of Customer Satisfaction. Source: Reprinted with the permission of The Free Press,a Division of Simon & Schuster, Inc., from Marketing Services: Competing through Quality, by Leonard L.Berry and A. Parasuraman. Copyright 1991 by the Free Press
To motivate performance, especially among front-line employees, customer satisfaction should form a part of thereward and incentive system for staff. The model also suggests where management should look to increase customersatisfaction. Figure 4.5 shows five ‘gaps’ which undermine service:
1. Misunderstanding of customer requirements. This occurs where companies have not researched customersproperly and are focusing on the wrong things. For example, managers think customers want higher-specsolutions when in fact their priority is greater reliability.
2. Poor specification of standards. Management may not have set sufficiently clear specifications for staff toimplement the desired standards. The managing director tells the switchboard to be customer-orientatedbut does not specify how.
3. Lack of capabilities. Staff may lack the training or motivation to meet the standards specified.
4. Creating over-expectations. Advertising and salespeople can promise too much, leading customers to haveinflated expectations. The result is disappointed customers.
5. Misperception of service. Consumers can misperceive the company’s attentions. Highly attentive staff at arestaurant are sometimes perceived by customers as hassling.
118 THE GROWTH IMPERATIVE
5. FOLLOW-UP ON COMPLAINTS AND DEFECTIONS
It is misleading for a company to rely on complaints as a measure of customer satisfaction. Most dissatisfiedcustomers do not bother to complain. Even when they do, not surprisingly, front-line staff often do not pass thecomplaints upward to management. It has been estimated that on average only 4 per cent of dissatisfied customerscomplain. So if a bank receives 1000 complaints a year, it probably has 25 000 dissatisfied customers.
But it is important to follow up on complaints for two reasons. First, angry customers can easily become customerswho actively bad-mouth the company to dozens of prospective purchasers. Such negative publicity can do enormousharm to a company’s growth prospects, particularly with the ability of disgruntled customers to wreak havoc throughanti-company web sites that can reach hundreds of thousands of prospective purchasers.[7] Second, complaintscan generally be dealt with and customer confidence restored if the company responds quickly and generously.Some studies show that when complaints are resolved to the customer’s satisfaction, such customers become moresatisfied than those who never experienced a problem in the first place.
Companies should make it easy for dissatisfied customers to record their complaints. This way, problems can beidentified early and dealt with decisively, before they become a tidal wave that washes away the company growthpotential. Defections analysis is another very useful tool. Here companies interview or survey via email customerswho have switched their business elsewhere. This gives direct, fresh insight into the causes of dissatisfaction, whichis often more incisive than general measures of customer satisfaction.
6. BUILD CUSTOMER PARTNERSHIPS
Increasingly, companies see the best way to create loyalty is to shift from a transactional to a partnership relationshipwith customers. By offering a formal partnership contract to customers companies create a framework for mutualgain. Customers gain an organisational capability dedicated to improving their long-term performance. For thesupplier partner, it means that it can trust in holding the account, gaining the majority of the business and theprobability of increasing its sales with the client.
Normally creating a partnership will mean assigning a dedicated account manager to the customer to coordinatethe development of the relationship. Partnering is about integrating the value chains of customer and supplier (seebox, ‘Building Partnerships with Customers’).
Building Partnerships with Customers
Forging highly collaborative relationships with selected customers can deliver significant results, according toMcKinsey. It suggests that an intelligent and well-organised approach can create and capture value at a time ofmounting price pressures.
It cites two prominent examples:
❍ ‘In the mid-1990s, Alcoa’s Wheel and Forged Products division began devoting more energy andattention to developing custom products for several auto manufacturers. The result was more
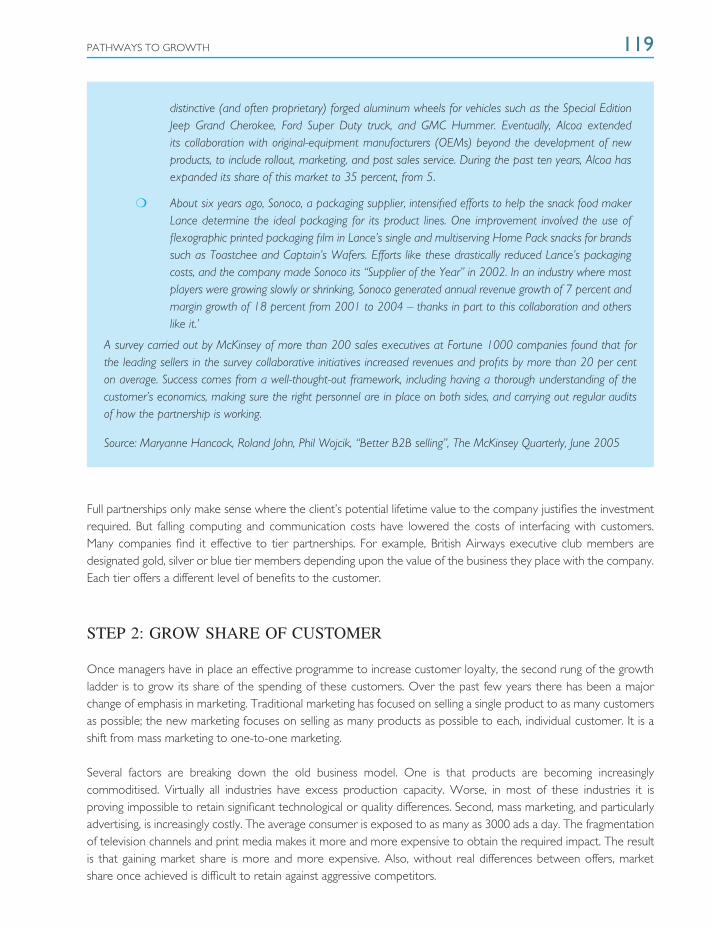
PATHWAYS TO GROWTH 119
distinctive (and often proprietary) forged aluminum wheels for vehicles such as the Special EditionJeep Grand Cherokee, Ford Super Duty truck, and GMC Hummer. Eventually, Alcoa extendedits collaboration with original-equipment manufacturers (OEMs) beyond the development of newproducts, to include rollout, marketing, and post sales service. During the past ten years, Alcoa hasexpanded its share of this market to 35 percent, from 5.
❍ About six years ago, Sonoco, a packaging supplier, intensified efforts to help the snack food makerLance determine the ideal packaging for its product lines. One improvement involved the use offlexographic printed packaging film in Lance’s single and multiserving Home Pack snacks for brandssuch as Toastchee and Captain’s Wafers. Efforts like these drastically reduced Lance’s packagingcosts, and the company made Sonoco its ‘‘Supplier of the Year’’ in 2002. In an industry where mostplayers were growing slowly or shrinking, Sonoco generated annual revenue growth of 7 percent andmargin growth of 18 percent from 2001 to 2004 – thanks in part to this collaboration and otherslike it.’
A survey carried out by McKinsey of more than 200 sales executives at Fortune 1000 companies found that forthe leading sellers in the survey collaborative initiatives increased revenues and profits by more than 20 per centon average. Success comes from a well-thought-out framework, including having a thorough understanding of thecustomer’s economics, making sure the right personnel are in place on both sides, and carrying out regular auditsof how the partnership is working.
Source: Maryanne Hancock, Roland John, Phil Wojcik, ‘‘Better B2B selling’’, The McKinsey Quarterly, June 2005
Full partnerships only make sense where the client’s potential lifetime value to the company justifies the investmentrequired. But falling computing and communication costs have lowered the costs of interfacing with customers.Many companies find it effective to tier partnerships. For example, British Airways executive club members aredesignated gold, silver or blue tier members depending upon the value of the business they place with the company.Each tier offers a different level of benefits to the customer.
STEP 2: GROW SHARE OF CUSTOMER
Once managers have in place an effective programme to increase customer loyalty, the second rung of the growthladder is to grow its share of the spending of these customers. Over the past few years there has been a majorchange of emphasis in marketing. Traditional marketing has focused on selling a single product to as many customersas possible; the new marketing focuses on selling as many products as possible to each, individual customer. It is ashift from mass marketing to one-to-one marketing.
Several factors are breaking down the old business model. One is that products are becoming increasinglycommoditised. Virtually all industries have excess production capacity. Worse, in most of these industries it isproving impossible to retain significant technological or quality differences. Second, mass marketing, and particularlyadvertising, is increasingly costly. The average consumer is exposed to as many as 3000 ads a day. The fragmentationof television channels and print media makes it more and more expensive to obtain the required impact. The resultis that gaining market share is more and more expensive. Also, without real differences between offers, marketshare once achieved is difficult to retain against aggressive competitors.
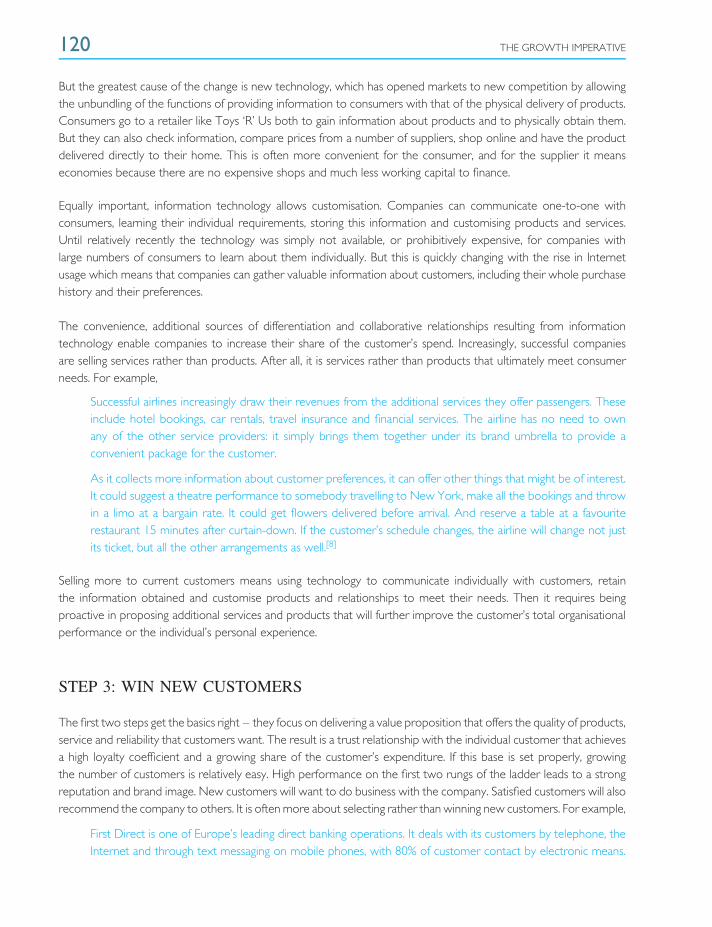
120 THE GROWTH IMPERATIVE
But the greatest cause of the change is new technology, which has opened markets to new competition by allowingthe unbundling of the functions of providing information to consumers with that of the physical delivery of products.Consumers go to a retailer like Toys ‘R’ Us both to gain information about products and to physically obtain them.But they can also check information, compare prices from a number of suppliers, shop online and have the productdelivered directly to their home. This is often more convenient for the consumer, and for the supplier it meanseconomies because there are no expensive shops and much less working capital to finance.
Equally important, information technology allows customisation. Companies can communicate one-to-one withconsumers, learning their individual requirements, storing this information and customising products and services.Until relatively recently the technology was simply not available, or prohibitively expensive, for companies withlarge numbers of consumers to learn about them individually. But this is quickly changing with the rise in Internetusage which means that companies can gather valuable information about customers, including their whole purchasehistory and their preferences.
The convenience, additional sources of differentiation and collaborative relationships resulting from informationtechnology enable companies to increase their share of the customer’s spend. Increasingly, successful companiesare selling services rather than products. After all, it is services rather than products that ultimately meet consumerneeds. For example,
Successful airlines increasingly draw their revenues from the additional services they offer passengers. Theseinclude hotel bookings, car rentals, travel insurance and financial services. The airline has no need to ownany of the other service providers: it simply brings them together under its brand umbrella to provide aconvenient package for the customer.
As it collects more information about customer preferences, it can offer other things that might be of interest.It could suggest a theatre performance to somebody travelling to New York, make all the bookings and throwin a limo at a bargain rate. It could get flowers delivered before arrival. And reserve a table at a favouriterestaurant 15 minutes after curtain-down. If the customer’s schedule changes, the airline will change not justits ticket, but all the other arrangements as well.[8]
Selling more to current customers means using technology to communicate individually with customers, retainthe information obtained and customise products and relationships to meet their needs. Then it requires beingproactive in proposing additional services and products that will further improve the customer’s total organisationalperformance or the individual’s personal experience.
STEP 3: WIN NEW CUSTOMERS
The first two steps get the basics right – they focus on delivering a value proposition that offers the quality of products,service and reliability that customers want. The result is a trust relationship with the individual customer that achievesa high loyalty coefficient and a growing share of the customer’s expenditure. If this base is set properly, growingthe number of customers is relatively easy. High performance on the first two rungs of the ladder leads to a strongreputation and brand image. New customers will want to do business with the company. Satisfied customers will alsorecommend the company to others. It is often more about selecting rather than winning new customers. For example,
First Direct is one of Europe’s leading direct banking operations. It deals with its customers by telephone, theInternet and through text messaging on mobile phones, with 80% of customer contact by electronic means.
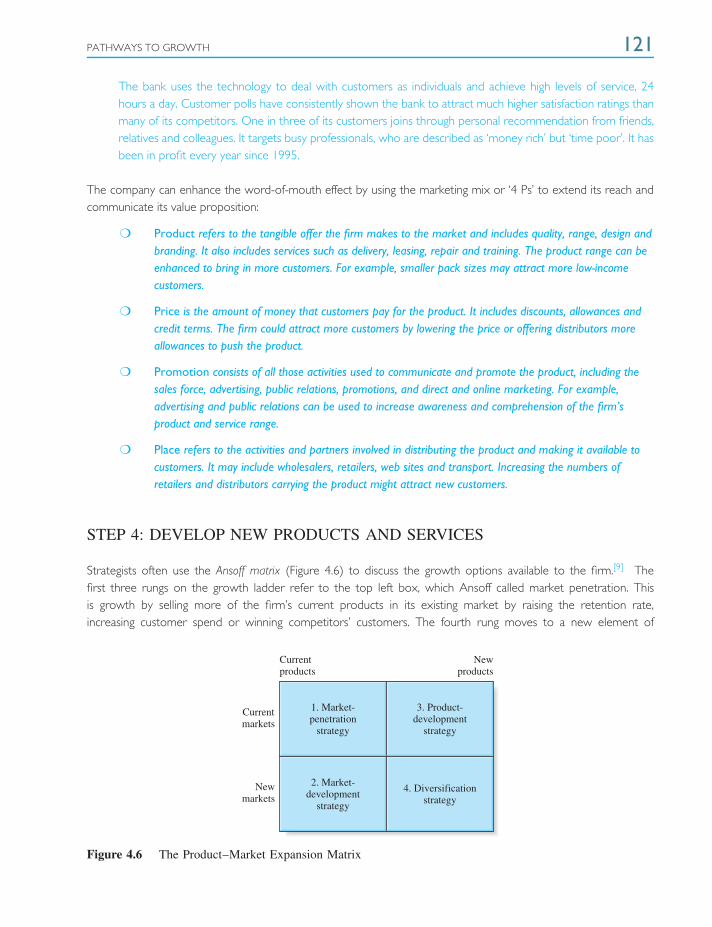
PATHWAYS TO GROWTH 121
The bank uses the technology to deal with customers as individuals and achieve high levels of service, 24hours a day. Customer polls have consistently shown the bank to attract much higher satisfaction ratings thanmany of its competitors. One in three of its customers joins through personal recommendation from friends,relatives and colleagues. It targets busy professionals, who are described as ‘money rich’ but ‘time poor’. It hasbeen in profit every year since 1995.
The company can enhance the word-of-mouth effect by using the marketing mix or ‘4 Ps’ to extend its reach andcommunicate its value proposition:
❍ Product refers to the tangible offer the firm makes to the market and includes quality, range, design andbranding. It also includes services such as delivery, leasing, repair and training. The product range can beenhanced to bring in more customers. For example, smaller pack sizes may attract more low-incomecustomers.
❍ Price is the amount of money that customers pay for the product. It includes discounts, allowances andcredit terms. The firm could attract more customers by lowering the price or offering distributors moreallowances to push the product.
❍ Promotion consists of all those activities used to communicate and promote the product, including thesales force, advertising, public relations, promotions, and direct and online marketing. For example,advertising and public relations can be used to increase awareness and comprehension of the firm’sproduct and service range.
❍ Place refers to the activities and partners involved in distributing the product and making it available tocustomers. It may include wholesalers, retailers, web sites and transport. Increasing the numbers ofretailers and distributors carrying the product might attract new customers.
STEP 4: DEVELOP NEW PRODUCTS AND SERVICES
Strategists often use the Ansoff matrix (Figure 4.6) to discuss the growth options available to the firm.[9] Thefirst three rungs on the growth ladder refer to the top left box, which Ansoff called market penetration. Thisis growth by selling more of the firm’s current products in its existing market by raising the retention rate,increasing customer spend or winning competitors’ customers. The fourth rung moves to a new element of
Currentproducts
1. Market-penetration
strategy
2. Market-development
strategy
3. Product-development
strategy
4. Diversification strategy
Currentmarkets
Newmarkets
Newproducts
Figure 4.6 The Product–Market Expansion Matrix
122 THE GROWTH IMPERATIVE
the matrix – the top right, developing new products and services. In today’s rapidly changing environment it isan essential step. Technological change, new competition and changing customer requirements are continuallyshortening product life cycles. In most markets it is impossible to satisfy customers without an increasing stream ofnew products and services (see box, ‘Accelerating Pressures to Develop New Products’). Without an effective newproduct development process, a firm will face declining customer loyalty, loss of customer share and decliningmargins on its products.
New product development has risen sharply up the corporate agenda. Top management has to champion innovationby continually asking three questions:
❍ Can existing products be improved to better meet customer aspirations?
❍ Could extensions to the product range meet latent customer needs or attract new customers?
❍ Are there new products that could be developed, purchased or licensed to complement the current rangeand enhance the firm’s value proposition?
Accelerating Pressures to Develop New Products
Pharmaceuticals is one of many industries being forced to radically ratchet up new product development. In thepast, patents meant successful new products earned huge profits for an average of ten years. When the patentexpired sales and profits usually collapsed under the onslaught of generic competitors. To maintain performancesuccessful companies needed to develop a stream of patentable product improvements to extend the protectionof their brands. But nowadays investors expect companies to launch several new drugs a year.
Expectations have been changed by three scientific revolutions – molecular genetics, informatics andautomation – which are expected to lead to an explosion of new products. To survive, companies are looking atthree strategies to ramp up their innovation activities. The first is outsourcing more of their R&D to new, nichecompanies with expertise in the new technologies. Second, they are boosting their own internal R&D budgets. Theneed to find bigger budgets has produced an explosion of mergers and alliances in the industry. Third, they arereengineering their new product development processes to accelerate the speed of development and launch andto ensure that they are closely linked to customer requirements.
Of the thousands of new products being introduced annually, less than 1 per cent are revolutionary, new to theworld products. Many are product improvements, upgraded or redesigned versions of previous models. Withoutthese continual facelifts, the products would soon become obsolete or unfashionable. Another major category isline extensions – new flavours, applications or types of the core brand to better fit special needs. These relativelylow-tech marketing initiatives can be very valuable. For example, Coca-Cola Zero is a new flavour with zero caloriesdesigned to appeal to young adult males. Procter & Gamble’s recent introduction of an active foam spray extensionto its Fairy washing-up liquid allowed it to grow significant share in the 18–25 year old market. Another goodexample is Gillette, which continuously relaunches its products with updates. It became such a valuable companythat Procter & Gamble paid £31 billion for it in 2006. Of this sum, only £4 billion was for tangible assets. £7billion was paid for Gillette’s innovative capability.[10] Another major category of new products are new product lines.These are a company’s version of product lines already successively introduced by competitors. For example, Nestlelaunched a cream-filled chocolate bar under its Kit Kat brand to compete with Ferrero’s successful Kinder Buenochocolate bar in New Zealand, Australia and the UK. Dell Computer Corporation followed the lead of Toshiba andCompaq in launching a line of notebook computers.
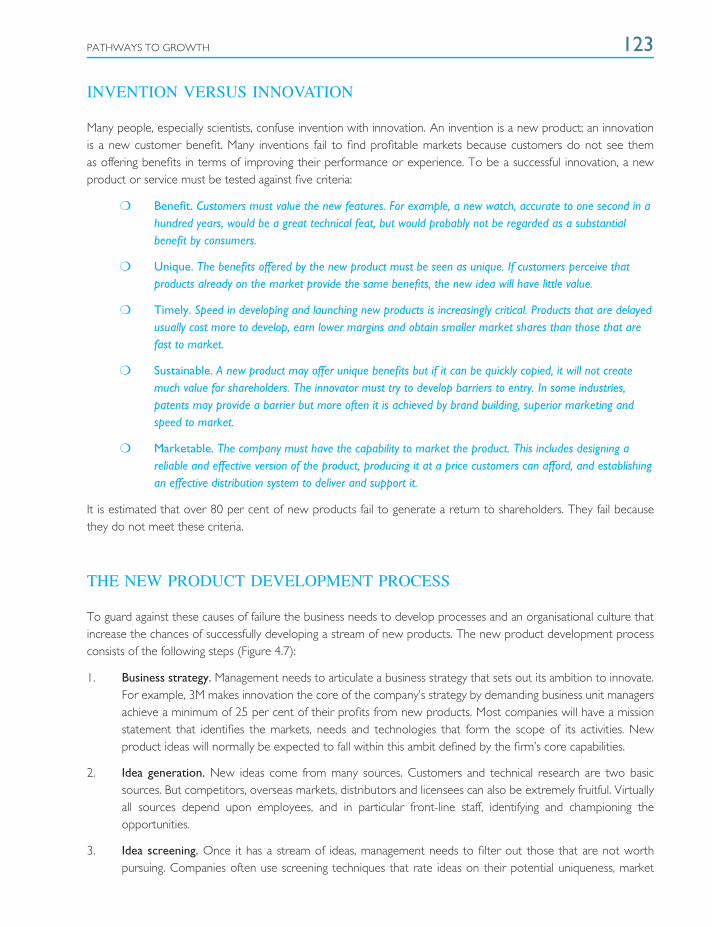
PATHWAYS TO GROWTH 123
INVENTION VERSUS INNOVATION
Many people, especially scientists, confuse invention with innovation. An invention is a new product; an innovationis a new customer benefit. Many inventions fail to find profitable markets because customers do not see themas offering benefits in terms of improving their performance or experience. To be a successful innovation, a newproduct or service must be tested against five criteria:
❍ Benefit. Customers must value the new features. For example, a new watch, accurate to one second in ahundred years, would be a great technical feat, but would probably not be regarded as a substantialbenefit by consumers.
❍ Unique. The benefits offered by the new product must be seen as unique. If customers perceive thatproducts already on the market provide the same benefits, the new idea will have little value.
❍ Timely. Speed in developing and launching new products is increasingly critical. Products that are delayedusually cost more to develop, earn lower margins and obtain smaller market shares than those that arefast to market.
❍ Sustainable. A new product may offer unique benefits but if it can be quickly copied, it will not createmuch value for shareholders. The innovator must try to develop barriers to entry. In some industries,patents may provide a barrier but more often it is achieved by brand building, superior marketing andspeed to market.
❍ Marketable. The company must have the capability to market the product. This includes designing areliable and effective version of the product, producing it at a price customers can afford, and establishingan effective distribution system to deliver and support it.
It is estimated that over 80 per cent of new products fail to generate a return to shareholders. They fail becausethey do not meet these criteria.
THE NEW PRODUCT DEVELOPMENT PROCESS
To guard against these causes of failure the business needs to develop processes and an organisational culture thatincrease the chances of successfully developing a stream of new products. The new product development processconsists of the following steps (Figure 4.7):
1. Business strategy. Management needs to articulate a business strategy that sets out its ambition to innovate.For example, 3M makes innovation the core of the company’s strategy by demanding business unit managersachieve a minimum of 25 per cent of their profits from new products. Most companies will have a missionstatement that identifies the markets, needs and technologies that form the scope of its activities. Newproduct ideas will normally be expected to fall within this ambit defined by the firm’s core capabilities.
2. Idea generation. New ideas come from many sources. Customers and technical research are two basicsources. But competitors, overseas markets, distributors and licensees can also be extremely fruitful. Virtuallyall sources depend upon employees, and in particular front-line staff, identifying and championing theopportunities.
3. Idea screening. Once it has a stream of ideas, management needs to filter out those that are not worthpursuing. Companies often use screening techniques that rate ideas on their potential uniqueness, market
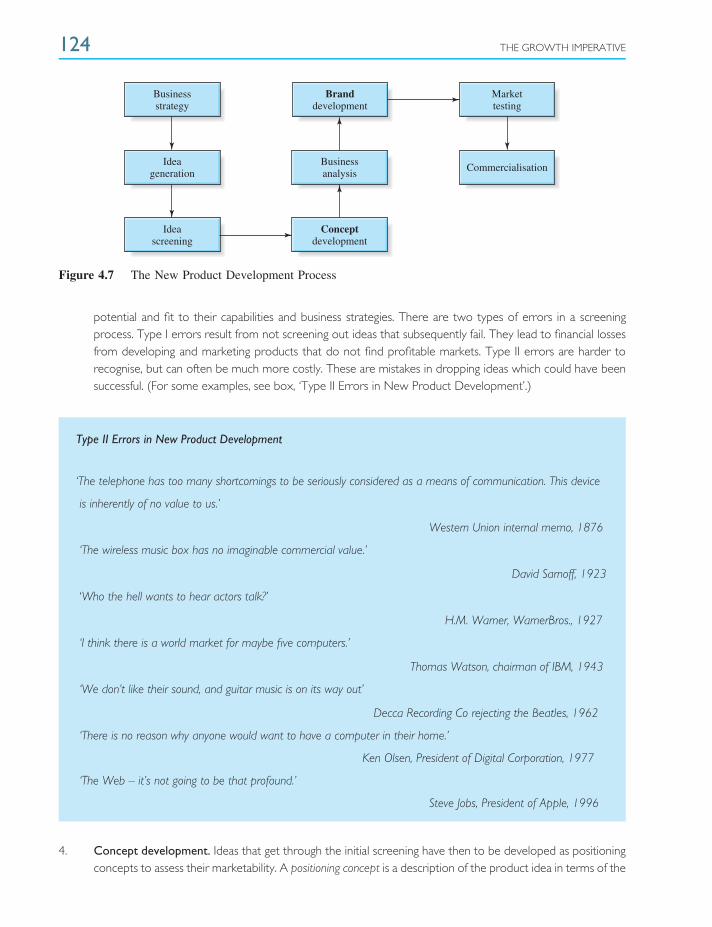
124 THE GROWTH IMPERATIVE
Businessstrategy
Branddevelopment
Markettesting
CommercialisationBusinessanalysis
Conceptdevelopment
Ideageneration
Ideascreening
Figure 4.7 The New Product Development Process
potential and fit to their capabilities and business strategies. There are two types of errors in a screeningprocess. Type I errors result from not screening out ideas that subsequently fail. They lead to financial lossesfrom developing and marketing products that do not find profitable markets. Type II errors are harder torecognise, but can often be much more costly. These are mistakes in dropping ideas which could have beensuccessful. (For some examples, see box, ‘Type II Errors in New Product Development’.)
Type II Errors in New Product Development
‘The telephone has too many shortcomings to be seriously considered as a means of communication. This device
is inherently of no value to us.’
Western Union internal memo, 1876
‘The wireless music box has no imaginable commercial value.’
David Sarnoff, 1923
‘Who the hell wants to hear actors talk?’
H.M. Warner, WarnerBros., 1927
‘I think there is a world market for maybe five computers.’
Thomas Watson, chairman of IBM, 1943
‘We don’t like their sound, and guitar music is on its way out’
Decca Recording Co rejecting the Beatles, 1962
‘There is no reason why anyone would want to have a computer in their home.’
Ken Olsen, President of Digital Corporation, 1977
‘The Web – it’s not going to be that profound.’
Steve Jobs, President of Apple, 1996
4. Concept development. Ideas that get through the initial screening have then to be developed as positioningconcepts to assess their marketability. A positioning concept is a description of the product idea in terms of the
PATHWAYS TO GROWTH 125
target market segment – who might buy it – and the value proposition – why they would buy it. The correctpositioning is a crucial determinant of the product’s potential market and its ability to achieve differentiation.It is generally a difficult problem because most new products could potentially be aimed at quite differentsegments and have different value propositions. For example, something as simple as a new cold remedycould be aimed at children or adults, severe or normal sufferers, those with headache or cough symptomsetc. Similarly, the value propositions could be built around efficiency, speed of action, length of action orfewer side effects. The choice of positioning concept will be the key determinant of the size of the marketand the competition the product will face.
Positioning concepts should be tested for their appeal by researching:
❍ Market. What types of customers are most interested in the product?
❍ Communicability. Do they understand the benefit being offered?
❍ Believability. Do they believe the benefits claimed?
❍ Need. Do they have a strong need for the benefit claimed?
❍ Usage. How would they use it and how often?
❍ Uniqueness. Are existing products already seen as satisfying the need?
5. Business analysis. Normally, the amount invested in the new product up to this stage is relatively low, butif it proceeds further costs and investment will now begin to accelerate. To make this go/no go decisionmanagement should require a detailed business analysis that will enable them to judge the potential rewards,risks and investments needed. In principle, this is the standard net present value calculation to determinewhether the proposed project will create value for shareholders.
The first task will be to calculate the level and timing of cash flow over the planning period. This requiresmarketers to estimate the prices that can be obtained and the growth of sales over the period. Next thedifferent functional areas will need to estimate the costs and investment requirements for developing, makingand marketing the product. Since these estimates will be very uncertain, it is useful to produce optimistic andpessimistic estimates, as well as a median forecast of cash flow. Finally, management will need to choose thediscount rate to be applied to the project. The more risky the product looks, the higher the discount ratethat will be applied. The expected net present value of the project is then:
ENPV =∑
t
ptCt
(1 + r)t
where ENPV is the expected net present value of the new product, Ct is net cash flow in year t, pt is theprobability estimate attached to cash flow in year t and r is the cost of capital.
The go/no go decision should not be based solely on the results of this financial calculation. Broader strategicconsiderations need to be examined. A failure to invest in a new product area could give a competitora strategic opportunity to enter the market and build a beachhead for subsequent expansion. Similarly, adecision to invest may offer profitable growth opportunities that are not reflected in the basic discountingformula.
The theory of options is increasingly being used to value such strategic new product opportunities. Optiontheory calculates the net present value of a project by explicitly incorporating estimates of the value of thefuture options a new product may offer (see box, ‘Using Options to Value New Product Proposals’).
126 THE GROWTH IMPERATIVE
Using Options to Value New Product Proposals
The net present value rule can sometimes be misleading when applied to new products. When managers factorin the high levels of uncertainty about a new product’s potential cash flows, the NPV will often be negative,indicating that the product proposal should be rejected. But such a decision may be wrong because managementdoes not need to make a go/no go decision at the start of the new product development process. Instead,they can purchase an option by investing in research and deferring a decision until the results are known.This is an extremely common situation in developing new products and, indeed, in developing growth strategiesgenerally.
Option theory was developed in finance in the 1970s. Essentially, options are a combination of decision treeanalysis and NPV. A simplified example can illustrate the approach.
Management is considering a new product concept. The product will require a £100 million investment and if itsucceeds it will be very profitable, generating an income stream with a present value of £150 million. The chancesof success are put at 50:50. If it fails then the present value of the income stream is put at £10 million. Atraditional NPV analysis would put the expected value of the project at £80 million. Since this is less than theupfront investment of £100 million, it has a NPV of minus £20 million, which leads to a rejection of the productproposal.
But in practice management will not put the whole investment upfront; instead, they will research the project.Suppose management takes an option to invest £10 million in research and consumer testing and delays a decisionabout proceeding further until the results are known after 12 months. If the development and testing are successful,management will launch the product and reap the profits of £150 million. However, since both the investment(£10 m + £100 m) and the returns are delayed by a year, they are discounted by the opportunity cost of capital,say 10 per cent, to £100 million and £135 million, respectively, or a net gain of £35 million.
The overall value of the new product, then, is £7.5 million (the average of £35 million and zero, less the upfront£10 million). Management should therefore proceed with further development and testing.
The technicalities in options analysis lie in calculating the discount rates to be used. Usually these are considerablyhigher than the normal weighted cost of capital. In summary, option valuation is most important in situations ofhigh uncertainty where management can respond flexibly to new information, and where the project value withoutflexibility is near breakeven. If the NPV is very high, the project will go full steam ahead, and flexibility is unlikely tobe exercised. Optionality is of greatest value for the tough decisions – the close call where the traditional NPV isclose to zero.
Source: Thomas E. Copeland and Philip T. Keenan, How much is flexibility worth? McKinsey Quarterly no. 2,1998, 38–49. Reproduced by Permission of McKinsey & Company.
6. Brand development. If the proposed product passes through the business analysis gate, the next stageinvolves developing a product capable of commercialisation and a marketing mix to complement andcommunicate its value.The brand development work demands the close cooperation of a cross-functionalteam, each member bringing in his or her specialist knowledge. A product has to be designed and developedto match the chosen positioning concept and be capable of efficient production and delivery. The brand
PATHWAYS TO GROWTH 127
components – name, packaging, advertising and price – have to be generated and tested. There are a widevariety of market research techniques for developing and testing alternatives.
7. Market testing. After a brand has been developed and pre-tested, a company can test it further in a moreauthentic market setting, to get more reliable information about the size of the market and reactions tothe elements of the brand, and to anticipate any problems that may occur in the full launch. The productcan be tested in a sample of shops or distributors. Consumer goods are often tested in a representativegeographical area.
8. Commercialisation. Once it is decided to commercialise the product then the really major costs andinvestments in manufacturing and marketing are incurred. By then management hope that all the problemshave been anticipated. Speed to market is increasingly important. Being first – provided it is done right – oftenoffers major advantages in terms of higher profits and long-run market share.
STEP 5: ENTER NEW MARKETS
The fifth step on the growth ladder is equivalent to the bottom left corner of the Ansoff matrix (Figure 4.6) – marketdevelopment strategy, or entering new markets, using existing products or technology. This is an obvious andcommon growth strategy, but managers often underestimate the difficulties of executing it successfully. There arethree stimuli for this growth strategy. One is the opportunity to build on the synergies from current know-how orproducts. For example, the success of the Apple iPod as a hand-held electronic device led the company to enterthe mobile phone handset market with the iPhone, competing with established players like Nokia, Sony-Ericssonand Samsung. Also, many of the leading brands of women’s perfumes have entered the market for men’s cosmetics.Another attraction may be the emergence of new growth markets. Porsche, which holds a pre-eminent positionin the upmarket sports car market, decided to enter the rapidly growing sports utility vehicle (SUV) market withthe powerful four-wheel drive Porsche Cayenne. Caterpillar, which dominated the market for large bulldozers,decided to enter the small equipment market when the US heavy construction market matured. Glaxo (nowGlaxoSmithKline) took its anti-ulcer drug Zantac into the over-the-counter market after sales peaked in theprescription-only market.
But the most common stimulus to entering new markets is the product life cycle. Initially, a new product, because ofits high price and limited communication, appeals to a specialist market. Then, over time, awareness grows and pricesfall, offering opportunities to sell the product to a succession of new markets. For example, when mobile phoneswere first launched, very high prices limited the market to senior executives, then after a few years the marketexpanded into the broader business community; later still, the household market offered growth opportunities, andfinally young people became the fastest growing market.
Managers often think that moving into new markets is straightforward because it deploys current products ortechnologies. But this is a mistake: adapting to the needs of different markets is generally more difficult thandeveloping new products. For example, in the mobile phones market, Motorola lost its leadership as it failed toadapt to the different requirements of the new markets. The problems occur because these new markets havedifferent needs, different operating processes and different buying patterns from the initial customers. This meansthat the products require different positioning strategies, and pricing, promotion and especially distribution channelshave to be dramatically changed. Seeking to sell to new markets with strategies that worked for the original marketare almost bound to fail.
128 THE GROWTH IMPERATIVE
Top management need to check that the new market strategy is soundly based by ensuring proper research hasbeen done on the following questions:
❍ Who are the new customers and what are their wants and aspirations?
❍ How do these differ from those of our current market?
❍ Who makes the decisions and who influences the buying process?
❍ What is the positioning strategy and marketing mix that would ideally match the needs of thesecustomers?
❍ How different is our proposed strategy from this ideal?
Market leaders often come unstuck by not adapting sufficiently to emerging markets. When this happens they areleapfrogged by new competitors, unencumbered by traditional strategies and channels, that can set up new marketstrategies that fit more effectively the needs of the new market.
STEP 6: NEW DISTRIBUTION CHANNELS
The sixth rung of the growth ladder is innovation in distribution channels. This has become one of the majorsources of growth opportunities for businesses. The main drivers of change have been technological. In 1990only 100 000 computers were connected to the Internet. By 2007 usage had soared, with over 1.3 billion peoplelogged on. This has produced huge changes in the way customers buy. Both in consumer markets, and even morein business-to-business markets, sweeping changes have occurred in the ways suppliers sell and distribute theirproducts and services.
REVIEWING DISTRIBUTION CHANNELS
The reasons why growth-orientated companies need to continually review their channels are:
1. Opportunities to innovate. New distribution channels have offered the opportunity to create whole newmarkets. Lastminute.com created a unique concept using the Internet to sell exclusive last minute deals forflights, entertainment, gifts and hotel rooms (see box, ‘New Distribution Channels Offer Opportunities toCreate New Markets’).
2. Accelerate growth. A company can outgrow its distribution channel. For example, confectionery companyThorntons relied on sales from its own shops for two decades. To increase its growth opportunities, it beganto sell to supermarkets and chain stores as well.
3. Changing customers. New customers or changing customer needs can make existing channels obsolete. Ascustomers become more familiar with a product, distribution tends to migrate from high-price, full-serviceretailers to low-cost channels such as mail order, telesales or online.
New Distribution Channels Offer Opportunities to Create New Markets
Two young British entrepreneurs set up Lastminute.com in 1999 to exploit the growing availability of the Internet.They recognised that for the first time the net offered the opportunity to publicise exclusive last-minute deals for awhole range of items including flights, entertainment and hotel rooms – even diamonds have been sold on the site.
PATHWAYS TO GROWTH 129
Their target market was ‘yuppies’: the cash-rich, time-poor people who can take off at the last minute. This wasthe audience that was already online. By 2007, there were 2.5 million people logging on in the UK every week. Thecompany was bought by two private equity groups in 2007.
4. New technology. New technology can make current distribution channels obsolete. The impact of ATMsand telephone and Internet banking has meant rationalisation of the bank branch network, for example. Withnew low-cost technologies, competitors do not need to make enormous investments in bricks and mortarto compete.
5. Poor performance. Current distributors may not be performing inadequately. Perhaps they have moreprofitable alternatives or lack the skills and knowledge to exploit the supplier’s product range.
Changing distribution channels is always difficult because it introduces conflict between the current distributionchannel and the emerging one. For example, the early 1990s saw the growth of direct selling of personal insuranceproducts. For the existing players this was a problem since they relied upon independent brokers to sell theirproducts. Fearing the loss of broker support, they were deterred from selling direct to the public. As a result theylost a major share of the market to new entrants. Similar problems face many businesses today: locked into largeinvestments in site locations, historical distribution networks or sales forces, they find it hard to slip into the newwave of low-cost, information-based distribution systems. Often the result is the emergence of a new generation ofindustry leaders.
SEARCHING FOR NEW DISTRIBUTION OPPORTUNITIES
By finding new and better ways of delivering products and services, companies can challenge the positions ofindustry leaders. Here are the questions managers should address:
1. Are there additional channels? The company can increase growth by adding new distributors to its currentnetwork to broaden or deepen its market coverage. Piggyback and co-marketing involve using the selling anddistribution networks of other suppliers to create additional sales. Besides intensifying distribution, a companycan add new channels. Web sites have become increasingly integrated into the growth strategies of firms.A company can also have parallel distribution by running two channels simultaneously. For example, beautycare company Avon sells its cosmetics online, by direct selling to individual households, by phone and bypost.
2. Are there substitute channels? As the market changes and new technologies appear a company may haveto look to change its channels. In the early 1990s, Compaq became the market leader in PCs through itsdominant position in leading retail channels. But by the late 1990s, direct marketing had become the fastestgrowing channel. By cutting out the retailer, dealing directly with the individual customer over the telephoneor Internet, and making to order, Dell was able to undercut Compaq’s prices and build a closer relationshipwith consumers. By 1999 Compaq’s channel leadership had become a liability rather than an asset. It mergedwith Hewlett-Packard in 2002.
3. Can the channel be reengineered? Often the current channel can be reengineered to reduce costs, takeout investment and increase speed of response to customer demand. Information technology can be usedto improve demand forecasting, reduce stocks and enhance the ability to meet customer expectations.
130 THE GROWTH IMPERATIVE
STEP 7: INTERNATIONAL GROWTH
Today even the smallest companies have to exploit the growth opportunities presented by the new global economy.Many companies are pulled into international marketing by the need to serve their customers. New stimulus isgiven by declining barriers to trade, deregulation of markets, global media and communications and new trading andpolitical entities like the European Union. Virtually all companies now face foreign competitors in their domesticmarkets. Indeed, the concept of a domestic market is losing much of its meaning; markets are increasingly regionalor global.
In developing an international growth strategy, management has to take a number of strategic decisions.
WHICH MARKETS?
A company can choose to focus on a small number of markets or spread its efforts over a large number ofcountries. For all but the most experienced businesses, focus is the best strategy. Concentration allows a companyto build knowledge in depth about its markets and it can focus resources to build strong distribution systems, criticalmass and market share. In deciding on which markets to concentrate, the company needs to assess their marketattractiveness, its competitive advantage and the country risks.
HOW TO ENTER THE MARKET?
Companies can choose between low-cost, limited-commitment methods of entering and developing overseasmarkets, and high-investment, high-goal approaches. They face the usual trade-off between risk and reward. Indirectexporting – paying independent agents or merchants to find customers – is a low-risk entry mode. Direct exportinggives more control. Licensing is another relatively low-risk method of developing a market. This allows a foreigncompany to use the brand name, patent or manufacturing process in return for a fee or royalty. Coca-Cola’senormously successful overseas growth has been based largely on having overseas bottlers licensing the company’sbrand name.
When a company is ambitious for greater control but still wishes to draw on outside skills and capital it can lookto joint ventures. Joint ventures are increasingly being created when it is necessary to quickly put together largeinvestments and complex technologies. Finally, the ultimate form of foreign commitment is direct investment andownership of overseas-based assembly or manufacturing plants. This gives the firm the greatest control and upsidepotential; the downside is the greater risk and resource commitment required.
HOW TO DEVELOP THE MARKET?
A key problem in developing an international marketing strategy is deciding on how much tailoring there shouldbe to local conditions. There are two extremes. One is a global strategy, where a company uses, as far aspossible, a standardised marketing mix everywhere. The other is a multinational strategy, where the marketing mixis adapted to the local conditions in each country. As examples, Sony, Panasonic and Coca-Cola have tended tofollow the global standardised model; Unilever, GE and Nestle more the multinational strategy. The ideal solution
PATHWAYS TO GROWTH 131
depends upon on how diverse are local consumption patterns and marketing systems. New electronics productsare easier to standardise than traditional eating habits. However, the opportunities presented by globalisation andthe desire to achieve scale economies have increased the pressure on companies to seek greater standardisationin their marketing. The ability to standardise varies with the different elements of the marketing mix. The basicproduct is often the most easily standardisable. With increasing transparency and fewer barriers to trade, there isalso greater pressure towards convergence in pricing. Culture and language differences demand local adaptationin advertising, but again companies are tending towards sharing themes across countries and especially regions.Different historical developments make distribution patterns probably the most diverse element of the marketingmix today.
WHAT TYPE OF ORGANISATION?
Companies need to develop international organisations that reflect their commitment to international operations.An export department will be able to handle the limited commitments of a company involved in indirect or directexporting. If the commitment grows to involve the firm in different types of overseas ventures and overseas salesbecome important, it will need to create an international division to control its operating units. In recent years, thelargest and most experienced operators such as Procter & Gamble, IBM and Microsoft have switched to a globalorganisation. Management plan brands, manufacturing and logistics on a global basis to maximise the company’soperating efficiency and effectiveness. Country managers then are constrained to develop their own strategies withinthe parameters set by the global strategy. This new global thrust is being shaped by pressures on companies toachieve economies of scale and lever new products and expertise more rapidly across markets.
STEP 8: ACQUISITIONS AND ALLIANCES
The next rung is acquisitions and alliances. Managers in high-growth companies assign these a major role.
The late 1990s saw record levels of mergers and acquisitions. One cause was the opportunities to boost efficiencycreated by the deregulation of such industries as telecommunications, transportation, financial services and theutilities. A second catalyst was overcapacity in many industries. Third was the race to become bigger. Companiessaw markets and competition becoming increasingly global, and regarded becoming one of the top two or threeplayers a necessity for long-run competitiveness.
Acquisitions have certain advantages over internal growth:
❍ Acquisitions are a faster way to penetrate a market. Developing successful new products can take years;an acquisition can achieve the sales goal in weeks.
❍ Internal growth is costly. A competitive battle to win market share can be very expensive. Buying abusiness is less likely to cut industry margins.
❍ Some strategic assets such as well-known brands, patents and strong distribution channels are oftendifficult, if not impossible, to develop internally.
❍ An established business is typically less risky than developing a new one from scratch.
132 THE GROWTH IMPERATIVE
HIGH FAILURE RATE
Despite the popularity of acquisitions, studies over the years have shown that most fail to add value for shareholdersin the acquiring company. The findings suggest the following:
1. The bid premium paid by the acquiring company averages between 40 and 50 per cent over the acquiredcompany’s pre-acquisition value. The premium is lower for a friendly merger and higher for a hostile takeover.
2. Shareholders in the acquired company are the big winners, receiving the benefits of the bid premiums. Intwo-thirds of take-overs, the value of the acquiring company declined after the acquisition. Taking a longerrun view, only around a quarter of acquisitions were judged successful in delivering satisfactory returns toshareholders. The higher the bid premium, the more likely the acquisition was to fail.
3. The chances of an acquisition being successful were improved when the acquirer had a strong core businessbefore the take-over. The success rate was also higher where the company being bought was relatively smalland in a related business.
What accounts for the failure of so many merger and acquisition programmes to deliver profitable growth? The mostimportant reason is that companies pay too much. With acquisitions costing up to 50 per cent more than the marketvalued the company, it is easy to see how this occurs. They overpay because they make overly optimistic forecastsof the market’s growth potential or because they overestimate the synergies the acquisition will create. A secondcause is poor post-acquisition implementation. Management fails to capture the potential synergies. Relationshipswith customers, staff and suppliers in the acquired company are eroded, damaging the value of the business. Athird reason for poor acquisitions is the incentive systems in many companies. Often managers are compensatedby the return they achieve on tangible assets. An acquisition adds to their top line, but the bid premium does notappear in the denominator. The result is that almost any acquisition increases the bonuses of managers even thoughshareholder value is being destroyed.
DEVELOPING A SUCCESSFUL ACQUISITIONS PROCESS
To increase the chances of acquisitions leading to profitable growth, a business needs a systematic acquisitionsprocess. This should consist of five stages:
1. Strategic analysis. The process starts with an objective assessment of what the company needs to do togenerate continuing value for shareholders. Are acquisitions necessary or would organic growth be superior?What types of acquisitions might enhance performance? This analysis should identify whether the companyneeds acquisitions to strengthen its present core business, or whether it should be looking for companiesthat will take it into new technologies or markets.
2. Search and screen. The next task is to generate a good list of acquisition candidates. The screening processthen eliminates candidates that do not fit the results of the strategic analysis. Additional screening criteriashould include company size, cultural fit, current market share and quality of management.
3. Strategy development. For the handful of companies that remain after the screening process, managementhas to assess in detail how they could leverage value from the company if it was acquired. How much costcould be taken out? How could sales be ratcheted up? How could best practices be transferred from onecompany to the other?
4. Valuation analysis. The next issue is determining how much it is worth paying for the acquisition candidate.This is discussed further below.

PATHWAYS TO GROWTH 133
5. Negotiation. Effective negotiation is based on thorough preparation. In entering negotiations the managementteam should be clear on what is the maximum price they are prepared to pay. They should also haveassessed the value of the candidate to the existing owners and other potential buyers. They need tohave assessed the financial position of the current owners, their objectives, strategy and likely negotiatingtactics.
VALUING AN ACQUISITION
How much should management be prepared to pay for an acquisition? The principles of valuation were describedin Chapter 2. As with any asset, the value of an acquisition is based on the net present value of the future stream ofcash flow that is anticipated. For an acquisition, the fundamental equation is:
Maximum acceptablepurchase price
= Pre-acquisitionvalue
+ Value ofsynergies
If the prospect can be acquired for less than the maximum price then the investment should generate a returnabove the cost of capital. The pre-acquisition value is the market value of the target before the prospect of theacquisition. This is the minimum the seller will expect. Invariably the seller will hold out for a premium above thispre-acquisition value. This will be rationalised in terms of other potential bidders or the belief by the managers thatthe market underestimates the company’s potential.
The amount the buyer should be willing to pay depends on the estimate of the synergies involved. Each of thesesynergies has to be identified and valued. The main synergies are:[11]
❍ Cost savings. Cost savings may increase the operating margin in the combined business. These are likelyto be greater where the acquired company is in the same industry. Savings may be from economies ofscale in purchasing, from eliminating duplicate jobs, facilities and other expenses, and from transferringbest practices.
❍ Investment savings. Consolidation of the two companies may produce economies in fixed and workingcapital requirements.
❍ Taxes and cost of capital. Sometimes a merger will reduce the combined cash tax rate and thecompany’s weighted cost of capital.
❍ Sales growth. This can occur when the acquirer introduces the target’s products into a broaderdistribution channel. Sales enhancements are generally more difficult and uncertain to estimate than costand investment savings.
The maximum acceptable price for a target is then calculated by valuing it using these synergies to upwardly adjustthe original cash flow projection. The present value of these cash flows should normally determine the maximumprice to be paid.
However, there are occasions when a higher price might be paid. This may be the case if the acquisition is anecessary investment as part of a much broader long-term strategy to gain competitive advantage in the targetmarket. Here, the whole strategy should be valued rather than any particular element forming a part of it. Thespecific acquisition can be thought of as purchasing an option allowing future opportunities to participate in theindustry. Analogously, there are occasions when the company should pay considerably less than the maximumacceptable price. This is where there are other bid candidates that are cheaper, or where other initiatives such asjoint ventures, strategic alliances or licensing could produce similar results more economically.
134 THE GROWTH IMPERATIVE
POST-MERGER INTEGRATION
Given the substantial premium an acquirer is likely to have paid, it is crucial that the post-acquisition implementationis handled effectively. In fact, studies show that most acquirers destroy rather than add value after theacquisition – acquired companies do worse after being acquired. To avoid this, a well-planned post-acquisitionplan is required. Step one is to agree objectives. Management in both companies should be in harmony about theobjectives and strategy of the new business. Step two is to communicate a plan to reassure customers, employeesand suppliers. Step three is to develop and implement the strategy for quickly progressing the synergies in costs,investments and sales. The last step is to develop a long-term strategic and organisational change programme toleverage value from the merger.
ALLIANCES
Strategic alliances provide an alternative to acquisitions for accelerating profitable growth. Alliances differ in severalways from acquisitions. First, there is no bid premium involved so it should be easier to create value for shareholders.Second, alliances usually involve only parts of a company rather than the whole business as in the case of anacquisition. This should lower the overall level of risk. Third, alliances have to be carefully structured to allow foreffective control. Finally, the motivation for alliances is often different from acquisitions. Acquisitions generally benefitfrom geographical overlap because of synergies from consolidating facilities, distribution networks and sales forces.Alliances, on the other hand, are usually intended to expand the geographical reach of the partners.
In an influential study of a large number of alliances in the 1990s, Bleeke and Ernst made the following findings:[12]
1. Both acquisitions and alliances had roughly the same success rate in creating shareholder value.
2. Acquisitions work better for core businesses and existing geographical areas. Alliances are more effective foredging into related businesses or new geographical areas.
3. Alliances between strong and weak rarely work. When one partner has the major stake, it tends to dominatedecision-making and put its own interests above those of the alliance. A 50:50 split works best.
4. Successful alliances must be able to evolve beyond their initial objectives. This means they must haveautonomy and flexibility to respond as markets and technology change.
5. Alliances and joint ventures have a limited life span. More than 75 per cent of the alliances that terminatedended with the acquisition by one of the parents.
STEP 9: GROWTH OUTSIDE INDUSTRY BOUNDARIES
The last rung of the ladder involves opportunities for even more creative ways of achieving profitable growth. Theseinvolve growth outside the current boundaries of the company’s industry. The most obvious alternatives are:
❍ Vertical Integration. Forward integration, where the firm takes over ownership and control of itscustomers, can offer opportunities. For example, PepsiCo began acquiring its bottlers in the 1990s to gaingreater control over sales effort. Such investment may enable the firm to achieve greater differentiationand avoid its margins being squeezed by an increasingly concentrating customer base.

DEVELOPING A GROWTH STRATEGY 135
Backward integration involves moving into a supplier industry. In the past, car manufacturers producedaround half of their components internally. Today, with the increasing importance of getting close tocustomers, forward integration has become more popular than backward integration.
❍ Diversification. Some companies have achieved enormous growth by transferring capabilities andintangible assets to quite disparate industries. The source of this creativity has often been based on takinga marketing view of the firm’s business. Instead of defining it in product terms, management has definedthe business in terms of meeting certain customer needs. For example, Gillette expanded from its corebusiness of men’s razors by redefining its mission first as men’s grooming products. This took it intoshaving creams, deodorants and aftershave. Later the mission was expanded even further to personalcare, which took it successfully into dental products, small appliances and stationery. Virgin defined itsmarkets even more broadly to include any area where its brand added value. This took it from its start inrecords to growth in the airline industry, financial services, cosmetics, clothing, railways,telecommunications and the Internet.
❍ Creating new businesses. Creative companies that are alert to the opportunities created by today’srapidly changing technologies and changing consumer wants can create new businesses. Tesco identifiedthe potential of using the Internet for home shopping early on. By 2001, it had emerged as the clear leaderin the battle to become the UK’s most successful grocery home delivery service. With over 65 per cent ofthe market and 95 per cent national coverage, it was taking over 100 000 weekly orders and offering morethan 20 000 grocery product lines. By 2005 it claimed to be able to serve 98 per cent of the UK populationfrom its 300 participating stores. In 2006 it launched a home shopping catalogue for its expandingnon-food range, which has been integrated with its Internet channel under the banner of Tesco Direct.
❍ Leveraging relationships. Some companies create whole new sources of growth by leveraging customerand supplier relationships to enter new markets. GE, one of the world’s most valuable companies, is agood example. Until the early 1980s it was seen primarily as a supplier of industrial equipment andconsumer appliances. But since then it has ratcheted up its growth rate by leveraging its relationships tomove into a whole new set of growth businesses, especially in the service sector. Initially, it focused onfinancing the sale and distribution of GE products. Today, it is a leader in a broad array of financial andoutsourcing services, ranging from railcar leasing and credit cards to reinsurance and equipment financing.It is regularly ranked as one of America’s most admired companies.
❍ Exploiting industry convergence. Today technological changes are leading to many industriesconverging. Examples are pharmaceuticals and genetic engineering, cable television and telecoms, andmedia, computers and the Internet. For industry leaders, such changes present opportunities as well asthreats. Pioneers of new technologies tend to be small, making it financially feasible for current leaders tobuy into them and dominate the newly converging sector. US telecoms provider Verizon is fighting backagainst cable competition by turning itself into a diversified communications company by offering voice andInternet tie-ups, as well as wireless and TV services.
DEVELOPING A GROWTH STRATEGY
To create continuing value for shareholders managers have to grow the top line. This means the company has toclimb the growth ladder. Unfortunately, relatively few companies manage to do this; most fall away once the changingmarketing and technological environment erodes their original core business. One reason is that many managers donot know how to grow their businesses; they have been over-preoccupied with the existing core. Another reason
136 THE GROWTH IMPERATIVE
is the belief in the conventional wisdom of ‘sticking to the knitting’. Managers believe that being tempted by newopportunities recklessly takes them out of their area of expertise. They do not understand that while innovation doesinvolve risk, ‘sticking to the knitting’ in today’s world brings certainty – of failure. Finally, many managers lack the flairfor leadership. They have honed the ability to manage operating processes but lack the imagination and confidenceto identify new opportunities, to communicate an inspiring vision to staff and to lead the company in new directions.
UNDERSTANDING GROWTH STRATEGY
To achieve long-term, continuing growth, managers have to understand the basic concept and its relationship toshareholder value. The objective of a growth strategy is to develop a pipeline of projects that will pour out a continuingstream of initiatives, some of which will create major new rivers of cash flow. A successful company’s businesses andprojects can be grouped into three types: today’s businesses, tomorrow’s businesses and options for growth.[13]
To understand their significance, we can work with a real example:
Tesco is Britain’s biggest supermarket group. Its revenue has grown from £37 billion in 2005 to £51.8 billion in2008 (figures to year-end February 2008). In the early 1990s the retailer was caught between rivals Sainsburyand Asda – between quality and value. It has since outperformed the market consistently and expanded intotelecoms, financial services, non-food and international markets and now enjoys a diversified business base. Ithas done this under the ‘Every little helps’ banner.[14]
This initiative, introduced in 1995, means that everything is measured against whether it is helpful to customersand whether it makes shopping easier. Building its strategy on penetrating customer insight has enabled thecompany to extend its brand not only into a new range of services, but also to increase choice in itscore products, such as its own-label Value and Finest food ranges. It also has an increasing internationalpresence – results for 2007/2008 show that half of its growth in trading came from the overseas operations,which includes supermarkets in Europe, Asia and a foothold in the US, where its first shops opened in 2007.
TODAY’S BUSINESSES
These are the company’s current core businesses and account for the bulk of the sales, profit and cash flow. AtTesco nearly 80 per cent of group sales and profits come from the UK business and provide all the cash to financethe growth of the other brands. Growth in the UK business comes from new space, extensions to existing storesand a multi-format approach. There are four different formats Tesco uses.
❍ Express stores, the first of which opened in 1994, are those of up to 3000 sq. ft and which offer arange of up to 7000 lines, including fresh produce, wines and spirits and in-store bakeries.
❍ Metro stores are approximately 7000–15 000 sq ft. They first opened in 1992 in town and city centrelocations. These offer a tailored range of food lines, including ready-made meals and sandwiches.
❍ Superstores are between 20 000–50 000 sq ft. Tesco began opening superstores in the 1970s, and,during the 1980s and 1990s, built a national network. In recent years a number of new non-foodranges such as DVDs and books have been offered for sale in this format.
❍ Extra stores are approximately 60 000 sq ft and above. The first one was opened in 1997 as aone-stop destination store. This format offers the widest range of food and non-food lines, rangingfrom electrical equipment to homewares, clothing, health and beauty and seasonal items.
DEVELOPING A GROWTH STRATEGY 137
The problem with today’s businesses is that they are inevitably maturing. For these established businessesmanagement has three tasks. First, they want to get rid of any older businesses which are not generating adequatereturns on capital and which cannot be turned around quickly. For those that remain, the focus is on operatingefficiency, ensuring that these businesses are managed to optimise return on investment. The marketing task is toensure that all profitable growth opportunities are explored. It is fatal to treat these successful businesses as cashcows: such attitudes will lead to a rapid erosion of market share. Instead the strategy must be to keep the brandsup to date, focus on customer retention and retain the brands, for as long as possible, as thriving assets.
TOMORROW’S BUSINESSES
These are the company’s star new businesses. They are already demonstrating their ability to win profitablecustomers and grow rapidly. For Tesco, this includes tesco.com, launched in 2001, and which rapidly became one ofthe UK’s number-one Internet shopping destinations. Results to the year-end February 2008 show that tesco.comachieved a 31 per cent increase in sales to £1.6 billion and a 49 per cent increase in profit to £124 million (beforeinitial operating losses on Tesco Direct – see below). A 20 per cent growth in new customers meant the web sitehad one million active customers by the end of the year.
Another source of tomorrow’s profits is Tesco Direct, a general merchandise business launched in 2006 withover 11 000 products online and 7000 in the catalogue, from beds and sofas through to kitchenware, electricalgoods, cameras and golf clubs, all of which can be ordered through the Internet, by phone or in selected stores.Management’s job here is to capture critical mass and dominate the market in the same way they have done withtheir core business.
OPTIONS FOR GROWTH
These are investments in research, experiments and trials that seed tomorrow’s businesses. They are low-costoptions that give the company the chance to learn about new opportunities. Many of these experiments will fail,in which case they can be dropped without major damage to the company; those that show promise can bedeveloped and exploited. Given the high failure rate to be expected with options, companies should always bepursuing a bundle of them simultaneously.
Many managers over-focus on today’s businesses because they generate the bulk of sales and profits. But this is abig mistake. Not only will their companies lose out on tomorrow’s growth, but today’s investors will penalise themin terms of the values they attach to their businesses. It is important to understand that the value investors attachto tomorrow’s businesses, and particularly an attractive bundle of options, can far exceed their current sales andprofit contributions. Much of the shareholder value created by successful companies is based not on the successof their current businesses but upon expectations about the management’s capacity to generate future profitablegrowth.
One of Tesco’s options for growth is its ambitious international expansion programme. By early 2008 operations ininternational markets already generated 54 per cent of the growth in group sales and 50 per cent of the growthin group trading profit. However, the company is determined to see revenue from overseas markets account formore than half its annual revenue by 2017, a doubling of the proportion it currently achieves. One approach, forexample, has been to form joint ventures with Sime Darby Berhad in Malaysia and Samsung in South Korea.

138 THE GROWTH IMPERATIVE
In 2008 the company also announced its move into online entertainment with Tesco Digital. While initially theservice was offering the availability to download music for iPods and MP3 players, it was set to be just the beginningof a wider Tesco Digital strategy that would encompass TV, films and games in the near future.
How should management implement a growth strategy? We suggest developing a six-step process:
1. Creating the mindset
2. Setting strategy
3. Making it happen
4. Building momentum
5. Fast implementation
6. Organising for growth
CREATING THE MINDSET
Building a sustainable growth strategy requires management to understand that they need businesses in all threecategories: today’s businesses, tomorrow’s and options. They first need to appraise the current situation. If today’sbusinesses are generating good returns but they do not have any emerging businesses or promising options, the taskof management is to focus on climbing the growth ladder. On the other hand, if the core business is not performing,the initial task is to sort this out.
SORTING OUT THE CORE
If the company’s core business is unprofitable it is difficult to pursue a growth strategy. A profitable core is necessaryto generate the funds to finance growth. It is also necessary to give investors confidence in management’s ability toachieve profitable growth.
Making today’s business perform depends upon achieving a strong strategic position in its market and efficientlyexecuting a sound operational plan. For some businesses the chances of achieving a strong strategic position maylook too formidable. In this case strategic divestment will be the appropriate action. Divesting those businessesthat are seen as not offering adequate returns sends a decisive signal to investors about management’s strategicintent.
For those mature businesses that are kept, the task is to quickly create cash flow. Since for most of these businessesgrowth potential is limited, restoring profitability usually focuses on reengineering to take out costs and reduce theamount of working capital and fixed assets employed. There is also often scope for improving margins by droppingunprofitable customers and targeting higher margin accounts.
SWITCHING TO GROWTH
Many experienced managers can handle the task of rationalisation but stumble when it comes to building growth.This is not surprising since the perspective and skills are quite different. Building a successful growth business normallytakes longer than fixing an unprofitable one. Rationalisation is essentially internally focused on the company’s
DEVELOPING A GROWTH STRATEGY 139
assets and costs; growth, on the other hand, requires a marketing focus on customers and the environmentoutside the firm. Growth is more difficult because it is competitive; it is about getting customers to preferbuying from your business rather than the myriad of other companies all seeking to attract the same customers.This requires having core capabilities and a differential advantage that are perceived as superior by customers.Unlike rationalisation, which is usually about divestment, growth and the creation of competitive advantage requireinvestment in skills, products and marketing. Finally, rationalisation can be directed from the top, but a growthstrategy requires a commitment throughout the business. In particular, it needs the enthusiastic support from thefront-line staff, who have the knowledge to generate ideas for growth and who have the task of implementingthem.
The catalyst for change is almost always a new chief executive. Few companies can catalyse a growth strategywithout the outside stimulus. Even with a new chief executive, building a growth orientation can take years sinceit requires a fundamental change in the company’s culture. The task can be divided into three stages. The first iswinning the commitment of the senior executive team. This requires an educational programme to teach executivesabout marketing and developing market-led strategies. Frequently the chief executive will need to bring in newblood to provide experience and support for the strategy.
The second stage will be to set ambitious goals which signal change and stimulate progress. Jack Welch, legendaryCEO of General Electric, set the goal of doubling sales over a five-year planning period. Each GE division was askedto find two ‘breakthrough’ ideas that would significantly transform their growth performance. Sam Walton, founderof Wal-Mart, the world’s biggest retailer, set the goal in 1990 of quadrupling sales, doubling the number of storesand increasing sales per square foot by 60 per cent by the year 2000. Such visible objectives signal what is expectedfrom managers.
The third stage is removing any organisational barriers that restrict managers from focusing on growth. To generategrowth options, the top team must sweep away a culture that penalises failure and mistakes. Fixed beliefs aboutwhat the company can and cannot do must also be challenged. Systems and budgets must be aligned to the newgrowth objective. For example, bonuses can be awarded for achieving top-line growth. Or, like at 3M, targets fornew products can play a key role in the planning process.
SETTING STRATEGY
If the firm’s growth is to be profitable it must be founded on a strategy to create a competitive advantage. Acompetitive advantage is developed by exploiting the firm’s unique competencies. Management should look forgrowth opportunities that match its organisational capabilities. To set strategy the management team need toundertake three steps:
❍ Assess the organisation’s resources and capabilities
❍ Search for growth opportunities that exploit resources and capabilities
❍ Develop the resource base
The company cannot build a sustainable growth strategy from its current resource base alone. In developing strategymanagement will be made aware of resource gaps which need to be plugged. It will need to develop comprehensivetraining programmes, recruit new talent with specialist knowledge and skills, develop additional technologies andform new relationships with customers, suppliers and distributors.

140 THE GROWTH IMPERATIVE
MAKING IT HAPPEN
Having ideas is not enough; ideas only have value when they are transformed into options through the planting of anew business. This may be achieved by initiating an R&D project, setting up a pilot plant or a test market, or makinga small acquisition.
The early business books on corporate planning saw developing a growth strategy in highly rational terms. Strategicdecision-making was viewed as a logical process in which a plan is formulated through systematic analysis of thefirm, its performance and the external environment. The strategy is then communicated to the organisation andimplemented down through successive organisational layers.
Today few people accept this picture. The process in practice is much less structured and more diffused, and thereis less of a dichotomisation between formulation and implementation. Mintzberg, one of the foremost researchers inthis area, has made a useful distinction between intended, realised and emergent strategy.[15] Intended strategy is thestrategy as conceived by top management. Even here, rationality is limited and the intended strategy is the result ofa process of negotiation, bargaining and compromise, involving many individuals and groups within the organisation.Emergent strategy is the process by which managers adapt the intended strategy to changing external circumstances,their own strengths and weaknesses and their own learning. Realised strategy is the strategy that emerges. Mintzbergsuggests this tends to be only 10 to 30 per cent of the intended strategy.
Drucker called this emergent process in successful growth companies a piloting approach.[16] A company takes smallsteps to learn more about the market opportunity and to gather the skills necessary to capitalise on it. Rather thana big, high-risk leap into a new venture, the piloting approach is a learning process. If they are going in the rightdirection managers can accelerate their steps; if it looks a dead end, they can abandon the option without toomuch being lost. For example, Johnson & Johnson’s growth in contact lenses remains a vivid example of this pilotingarchitecture (Figure 4.8):[17]
The original idea of entering the contact lens market came out of a 1980 strategic review and looked promising given thegrowth prospects, the lack of entrenched competition, and the potential fit with the company’s distribution strength andreputation. To turn the idea into an option for growth, Johnson & Johnson took an exploratory first step. It acquired FrontierContact Lenses, a small player in the US market, with the objective of learning about the contact lens business.
A year later it was able to buy the rights to a revolutionary new process developed in Denmark that had the potential toslash production costs. To improve the process it contracted NYPRO, a leader in precision injection moulding, to developlenses to the tolerances required. Three years after its first move, Johnson & Johnson had learned enough about the industryto judge the potential of its idea. It had also acquired distinctive technology and manufacturing skills. Up to this point thesums at risk had been relatively modest, but over the next few years, it invested nearly $500 million to develop and launchits new ranges around the world. By the mid-1990s, it had built a highly profitable business with annual sales of over $600million.
BUILDING MOMENTUM
A successful growth strategy depends upon putting together a difficult-to-imitate bundle of critical capabilities thatmake it possible to sustain a competitive advantage. A firm’s capabilities depend upon its collection of resources:

DEVELOPING A GROWTH STRATEGY 141
Create growth options
Stages of growth
1993−5
1988−92
1984−88
1983
1982
1981
ContractsNYPROto improve technology
Acquiredrights to new mouldingprocess
AcquiredFrontierContactLens
Introduces Acuvue daily disposable lenses and invests further $200 million
Disposablelenseslaunched in 45 countries
Invests $250 millionindevelopment
Develop business model Roll-out business model Manage for profitability
Figure 4.8 Johnson & Johnson’s Contact Lens Piloting. Source: M. Baghi, S. Coley and D. White, TheAlchemy of Growth, London: Orion, 1999, p. 83. Reproduced by Permission of McKinsey & Company
tangible assets, intangible assets and people. These resources, when integrated effectively, provide the firm with itsspecial capabilities, which in turn form the basis of its ability to grow.[18]
Capabilities are not fixed; they can be acquired and developed. Indeed, it is the skill in acquiring and developingcapabilities that determines an organisation’s ability to develop a long-term growth strategy. Hence companiesshould not take too narrow a view of their capabilities when considering growth opportunities. A company doesnot have to limit the search for opportunities to areas where it presently has the full range of competency, it shouldhave the confidence that it can develop and learn new competencies.
The essence of the piloting approach is that capabilities need to be built and developed. It makes sense for thecompany to develop the most critical capabilities internally so that it controls the key sources of competitiveadvantage. But capabilities that are not so critical can be outsourced. Outsourcing, alliances, partnerships, jointventures and the formation of economic webs have increasingly become the ways in which today’s companies accessmanufacturing, development and IT capabilities. The need to quickly learn about new products, technologies and localmarkets makes it difficult for any organisation, no matter how large, to develop all the necessary knowledge in-house.
FAST IMPLEMENTATION
Successful new business concepts are quickly copied. If the company is to profit from its innovation it needs tomove fast and to establish critical mass. Speed may allow the company to establish a first-mover advantage. A
142 THE GROWTH IMPERATIVE
first-mover advantage is access to resources and capabilities that later entrants cannot easily acquire. Such advantagesinclude:
❍ Patent and copyrights. By establishing a patent or copyright, the first mover may possess technology,products or designs from which followers are legally excluded.
❍ Scarce resources. When key resources are scarce, e.g. locations for new supermarkets or specialisedemployees, first movers can pre-empt these resources.
❍ Higher prices. Prices are usually higher at the beginning of the market life cycle. The first mover canrecoup higher margins before competition erodes prices.
❍ Reputation. The first mover establishes a reputation with customers, suppliers and distributors thatcannot initially be matched by followers.
❍ Standards. When proprietary standards in relation to product design and technology are important, thefirst mover may have an advantage in setting the standard.
❍ Experience. Economies of learning suggest that the first mover can obtain a cost advantage by virtue ofits longer experience.
Achieving first-mover advantage is not simply about being first but also about achieving sufficient scale to defendagainst ambitious followers. It requires heavy investment in marketing and product development. Strategic alliancesand partnering are ways of sharing the costs of developing the market. Priorities in exploiting the growth opportunitywill include:
❍ Market development. Initially a new product is bought by a specialist niche but if it is successful it willspread to broader markets. It is important for the innovator to lead in the development of these newmarket segments; otherwise it offers a beachhead for new competitors. For example, Xerox, inventor ofthe copier, did not develop the market for small machines, which allowed Canon to enter the market andbecome a major rival.
❍ Build the brand. Creating a well-known and trusted brand name can give additional sources of defence.Even when competitors copy the product, customers may feel more confident buying a familiar brand.Much of the success of companies like Gillette, Coca-Cola and Marlboro is due to their investment inbrand building.
❍ Line extensions. Line extensions allow the product to be more finely tuned to the needs of specificcustomer segments. Such customisation makes it more difficult for competitors to find gaps.
❍ Overseas markets. The erosion of barriers to trade has made it dangerously myopic for a company toneglect the opportunities presented by overseas markets. Exploiting such opportunities will often requirethe firm to find partners with experience and resources already in place.
CONSUMER ADOPTION PROCESS
When launching a new concept it is important to consider how the market will develop. It is generally a mistake toaim at all customers. People and firms differ in their propensity to take up new ideas quickly. An important idea inmarketing is the consumer adoption process.[19] Figure 4.9 shows the typical development of a market from launchto maturity. Researchers term the first 21/2 per cent of consumers buying the product innovators; these are followedby the early adopters, the early majority, late majority and finally the laggards.
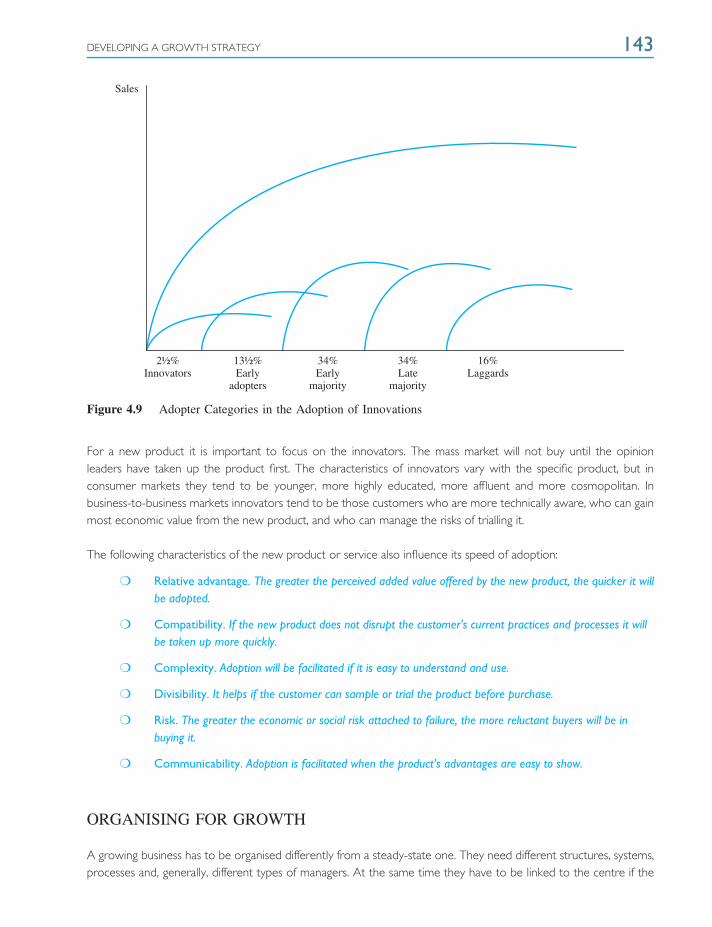
DEVELOPING A GROWTH STRATEGY 143
Sales
2½%Innovators
13½%Early
adopters
34%Early
majority
34%Late
majority
16%Laggards
Figure 4.9 Adopter Categories in the Adoption of Innovations
For a new product it is important to focus on the innovators. The mass market will not buy until the opinionleaders have taken up the product first. The characteristics of innovators vary with the specific product, but inconsumer markets they tend to be younger, more highly educated, more affluent and more cosmopolitan. Inbusiness-to-business markets innovators tend to be those customers who are more technically aware, who can gainmost economic value from the new product, and who can manage the risks of trialling it.
The following characteristics of the new product or service also influence its speed of adoption:
❍ Relative advantage. The greater the perceived added value offered by the new product, the quicker it willbe adopted.
❍ Compatibility. If the new product does not disrupt the customer’s current practices and processes it willbe taken up more quickly.
❍ Complexity. Adoption will be facilitated if it is easy to understand and use.
❍ Divisibility. It helps if the customer can sample or trial the product before purchase.
❍ Risk. The greater the economic or social risk attached to failure, the more reluctant buyers will be inbuying it.
❍ Communicability. Adoption is facilitated when the product’s advantages are easy to show.
ORGANISING FOR GROWTH
A growing business has to be organised differently from a steady-state one. They need different structures, systems,processes and, generally, different types of managers. At the same time they have to be linked to the centre if the
144 THE GROWTH IMPERATIVE
company is to leverage the advantages of its size and its shared services, and exploit potential synergies across thegroup.
ORGANISATION
New businesses have to be organised differently from mature ones because their tasks differ. For mature businessesthe priority is running them efficiently. The business is well understood; the company has the capabilities to runit and the market is familiar. The priority is to squeeze out more cash by controlling costs and investments andthrough marginal enhancements in the product and customer mix. For new businesses and growth options thepriorities are different. They are about achieving rapid growth, speed and decisiveness. Market uncertainty is muchgreater: customers, competition, channels and positioning are all new and changing. Many resources and capabilitieshave still to be acquired by the business.
If new businesses are reporting to the same line managers as the core business, there is a real danger thatthe new ventures will fail to flourish. First, managers will not give them sufficient priority; invariably the newbusinesses will have tiny sales and often they will be making losses. Second, new ventures will have to conformto the same planning, budget procedures and performance measures as the mature businesses. If new venturesare held to the same profitability objectives as core businesses, the former will certainly wither away. Finally,speed is much more important in growing businesses. Tying managers in these ventures to the same approvalprocesses found in mature business units would leave them floundering in the wake of more fleet-footedcompetitors.
Successful companies are responding in several ways to these problems. One approach is to assign responsibility toautonomous, cross-functional teams. Another approach often followed by companies like 3M, Johnson & Johnson andIBM is to create a separate business unit. Another approach is a spin-out. Spin-outs occur when the equity ownersof the parent company receive equity stakes in the newly spun-out company. For example, the Hewlett-Packardshareholders received shares in Agilent Technologies when it was spun-out of HP in 1999. Here the company notonly creates a separate unit, but establishes it as a separate company with some public shareholding. The seniormanagement team enjoy the excitement and, with luck, the financial rewards of running an independent publiccompany. At the same time, the group company, as the majority shareholder, can enjoy the benefits of keepingthe unit connected to the larger enterprise. All these approaches focus on the need to create fleet-footed smallbusiness units, with managers totally orientated to successfully growing the new ventures.
MANAGING THE TALENT
Because the task of managing mature and growing businesses is different, so the management style has to bedifferent. Most executives do not have the skills to create new businesses. Established businesses require managerswho can optimise current operational processes and deliver consistent bottom-line results.
Tomorrow’s businesses require managers to focus on top-line sales rather than bottom-line profitability. They needmanagers who are comfortable with ambiguity and changes in market requirements and operational processes.Managers who overemphasise consistency and discipline stifle risk taking and entrepreneurial flair. For managingoptions – explorations into new markets and technologies – the business needs visionaries. Commonly they areyounger, less experienced and naıve in the wiles of organisational politics. They will need the support and sponsorship
DEVELOPING A GROWTH STRATEGY 145
of a senior executive at the centre who appreciates their special skills and can reassure the organisation about theventure’s importance.
Any company needs a mixture of these disciplined operators, business builders and visionaries if it is going to manageeffectively its present businesses and capitalise on tomorrow’s growth markets. Too many managers focusing ondisciplined processes and budgets detract from the future. Too few focusing on the basics threatens the present.Individual business units benefit from cultural homogeneity, but the company as a whole needs to have culturalheterogeneity.
SYSTEMS AND PERFORMANCE MEASUREMENT
The type of planning used for mature businesses does not make sense for new ones. For emerging businessesthere is much greater uncertainty about the market and a greater focus on accumulating the necessary capabilities.Detailed annual operating plans and budgets are simply counterproductive.
Budgets, performance measures and rewards need to be different, reflecting the different objectives. In maturebusinesses the budgets should focus on short-term profits and cash flow. Leading companies use cash bonusesto reward managers achieving short-term profitability goals. Managers who cannot achieve budgets are swiftly putaside. For growing businesses the focus is on long-term sales growth and value creation. Key measures are marketshare, customer acquisition and retention rates, the trend of profitability and expected net present value. Rewardsneed to reflect long-run value creation rather than achieving short-term budgets. To encourage an entrepreneurialculture, many companies offer executives equity participation. They are also more tolerant of failure than formature businesses.
With options the focus is on estimating the potential rewards and the probability of success. In these businesseslearning takes place through experimental projects. Performance and rewards can be based on achieving resultsfrom project-based milestones. Increasingly, companies are exploring option theory to value these opportunities.The number of initiatives being pursued and the proportion of them that lead to a business launch can measure theoverall performance of the business in creating options.
AUTONOMY AND INTEGRATION
Growth and performance are best achieved by breaking big companies into small business units and giving theirmanagement teams as much autonomy as possible in running them. But if small businesses are best, what is thepoint of large companies? Surely investors would be better off if the company was broken up, the head office closedand the businesses floated as independent companies.
Large holding companies only make sense if they can add value through either shared central services or exploitingsynergies between the businesses. Small businesses can buy services outside but sometimes it can be cheaper ormore effective to have them internally. The most useful services the centre can offer growing businesses includeacquisition skills, financing capabilities and legal and accounting support. The second possible source of added valueare synergies. An emerging business may possess lower costs and investment through sharing the company’s existingfacilities. Marketing synergies may enable it to use existing sales force, channels and networks. Businesses may alsobe able to cooperate in cross-selling opportunities. Finally, technological synergies may enable the emerging ventureto utilise knowledge lying in other areas of the company.

146 THE GROWTH IMPERATIVE
Such synergies can be realised only if ideas are readily shared across the company. For the corporate centre, thechallenge is to devise sufficient coordination and exchanges that offer the benefits of size, but without eroding thevalue of the entrepreneurial flair and sense of ownership, that only devolved leadership can produce.
INSPIRING THE ORGANISATION
Many of the most exciting new businesses in the past decade or so have been start-ups. But it is important that largebusinesses learn how to create new enterprises. How can corporate headquarters in large corporations motivatetheir managers to hunger for the challenges of growth and entrepreneurial activities? One way successful companiesdo it is through setting ambitious goals, such as achieving double-digit growth or doubling market share. Ambitiousgoals help create a change in culture in the organisation by raising the profile of growth. They also stretch managersto be more imaginative by making them aware that the usual strategies will not be enough to reach the new goals.
The centre can also give managers the resources to achieve growth. These are not solely financial resources butalso include sweeping away the barriers to growth such as bureaucratic planning and budgeting procedures. Topexecutives have to recognise that creating new businesses requires autonomous organisations and systems thatprioritise entrepreneurial efforts.
Neither ambitious goal-setting nor adequate resourcing, however, is enough to inspire employees to great effortsyear after year. It is hardly surprising that studies of the great growth companies like General Electric (GE), 3M,Procter & Gamble and Microsoft all show that they have guiding ideals of leadership that transcend financial numbers.Ghoshal and Bartlett express this as follows:[20]
Strategies can engender strong, enduring emotional attachments only when embedded in a broader organisational purpose.Today, the corporate leader’s great challenge is to create a sense of meaning within the company, which its members canidentify, in which they share a feeling of pride, and to which they are willing to commit themselves.
SUMMARY1. The companies that have created the greatest returns for shareholders have all been high-growth businesses.
Top-line growth is the fundamental source of shareholder value.
2. Rationalisation and reengineering can produce short-run increases in cash flow but investors recognise thatsuch policies cannot produce enduring gains unless they are allied to gains in market performance.
3. Growth creates shareholder value by increasing the future level of cash flow, accelerating the timing of cashflow, extending its duration or reducing the risks attached to future returns.
4. Ascending the growth ladder must start with consolidating the current customer base: increasing customerretention and winning a growing share of their spending. This forms the foundation for going on to gain newcustomers and developing new products, markets and distribution channels.
5. Any company that is to endure needs three types of businesses in its portfolio: today’s businesses, tomorrow’sbusinesses and options for growth. The first provide the bulk of the revenue and cash but the last twoaccount for most of a company’s market value.
6. To grow, management has to create a growth mindset within the company, to build momentum and tosweep away the organisational barriers that constrain growth.
NOTES ON CHAPTER 4 147
REVIEW QUESTIONS
1. Explain the links between growth and shareholder value creation.2. Why has shareholder value become associated with rationalisation rather than growth?3. Identify the different pathways to accelerate growth.4. Why is customer loyalty seen as the foundation for building a growth strategy?5. Describe how to develop a growth strategy for a business.6. Discuss the issues in implementing a growth strategy in a company.
NOTES ON CHAPTER 4
[1] Carl W. Stern and George Stalk Jr. (eds), Perspectives on Strategy from the Boston Consulting Group, New York:John Wiley & Sons, Inc., 1998, pp. 12–23.
[2] The threshold margin is (20% + 25%) × 9% divided by 1.09 × 0.7.
[3] See the examples in Peter Doyle, Marketing Management and Strategy, London: Prentice Hall, 1998, pp. 65–68.
[4] Average customer tenure is calculated by taking the reciprocal of the defection rate. For example, if theretention rate is 90 per cent then the defection rate is 10 per cent annually. This gives a tenure of 1 divided by 10per cent, or 10 years.
[5] Leonard Berry and A. Parasuraman, Marketing Services: Competing through Quality, New York: Free Press, 1991.
[6] Frederick F. Reichheld, The one number you need to grow, Harvard Business Review, December 2003.
[7] ‘Consumer vigilantes’, Business Week, 21 February 2008.
[8] Drawn from The Economist, 26 June 1999, ‘Survey: business and the Internet’, p. 14.
[9] Ansoff was the pioneer of the analytical approach to strategic planning. For his most recent work, see IgorAnsoff and Edward McDonnell, Implanting Strategic Management, 2nd edn, New York: Prentice Hall, 1990.
[10] Malcolm McDonald, Linking intangible assets to share price, Intellectual Asset Management, April 2008.
[11] For a useful discussion and recent examples see Robert G. Eccles, Kersten L. Lanes and Thomas C. Wilson,Are you paying too much for that acquisition? Harvard Business Review, 77(4), July/August, 1999, 136–148.
[12] Joel Bleeke and David Ernst, Collaborating to Compete: Using Strategic Alliances and Acquisitions in the GlobalMarketplace, New York: John Wiley & Sons, Inc., 1993.
[13] This section borrows some of the ideas in Mehrdad Baghai, Stephen Coley and David White, The Alchemy ofGrowth, London: Orion Business, 1999.
[14] For more on this see Hugh Burkett and John Zealley, Marketing Excellence: Winning Companies Reveal theSecrets of Their Success, John Wiley & Sons, Ltd., 2006.
[15] Henry Mintzberg, The Rise and Fall of Strategic Planning: Reconceiving Roles for Planning, Plans and Planners, NewYork: Free Press, 1994. See also: Henry Mintzberg, Tracking Strategies: Towards a General Theory of Strategy Formation,Oxford University Press, 2008.
[16] Peter F. Drucker, Management Challenges for the 21st Century, Oxford: Butterworth-Heinemann, 1999,pp. 86–87.

148 THE GROWTH IMPERATIVE
[17] Baghai, Coley and White, The Alchemy of Growth, London: Orion, pp. 82–84.
[18] For a timely discussion of this topic, see Jean-Claude Larreche, The Momentum Effect: How to Ignite ExceptionalGrowth, Wharton School Publishing, 2008.
[19] Everett M. Rogers, Diffusion of Innovation, 5th edn, Free Press, 2003.
[20] Sumantra Ghosal and Christopher A. Barlett, The Individualized Corporation: A Fundamentally New Approach toManagement, New York: HarperBusiness, 1997.
PART 2PART 2Developing High-Value Strategies
5. Strategic Position Assessment
6. Value-Based Marketing Strategy


5Strategic PositionAssessment
‘Chance favours the prepared mind’Louis Pasteur
INTRODUCTION AND OBJECTIVES
Part 1 looked at the principles of value-based marketing: the importance of shareholder returns as an objective;how to calculate the shareholder value added by a strategy; and the role of marketing and growth in creating value.Part 2 shows how to develop a value-based marketing strategy. This chapter examines the underpinning of strategyformulation: the assessment of the organisation’s current business situation and the options available to it. Thefollowing chapter shows the steps in developing a value-based marketing strategy for a business unit.
By the time you have completed this chapter, you will be able to:
❍ Evaluate the performance of a business
❍ Assess the causes of its present performance, distinguishing between external or industry factors, andinternal or competency factors
❍ Take a view on where the business is heading, if it maintains its current trajectory
❍ Identify the internal and external opportunities to increase the value of the business
❍ Set broad strategic objectives for the products and markets that make up the firm’s portfolio of businesses
The chapter begins by looking at how managers can assess the current performance of their business. It illustratesthe difficulty of using purely financial or accounting performance measures to judge whether current actions arecreating shareholder value. It shows how measures of change in the firm’s strategic value drivers can be used tocreate a balanced scorecard for judging current performance. The chapter continues by showing how to analyse thecauses of the successes or failures of the business. Third, it examines how managers can project the likely patternof performance in the future. Finally, it explores the main strategic options managers have for enhancing the valuecreated for shareholders.
AN OVERVIEW
During the 1990s most managers came to accept that the objective of the business was to maximise total returnsto shareholders. If managers did not offer good returns to the owners of the business in the form of dividends and
152 STRATEGIC POSITION ASSESSMENT
stock appreciation then they were likely to be replaced. It was also accepted that the way to increase shareholderreturns was to maximise the net present value of long-run cash flow. This is a function of four factors: the level ofcash flow, its timing, longevity and risk. Marketing plays a critical role in determining all four variables.
Maximising shareholder value requires each business unit to have a process that encourages managers to developstrategic options, to evaluate these options in terms of their effects on shareholder value, and to effectivelyimplement the highest-value strategy. This process has three stages. The first is the strategic position assessment.This provides the basic information about the sources of value in the business and the drivers that create value inthe business. The second stage is the strategic marketing plan. This uses the information from the strategic positionassessment to decide on which markets to serve and how to win a competitive advantage in these markets. Thethird stage is implementation: the business needs the core capabilities and processes to achieve execution of thestrategy.
This chapter presents the strategic position assessment. This assessment needs to be done at two levels: at thecorporate and business unit levels. At the corporate level the focus will be on the value potential of the company’sportfolio of businesses. At the unit level the focus will be on the value and drivers of the individual products andmarkets. The methodology is the same; the difference is in the unit of analysis. In both, the outcomes will beconclusions about the future of the business. Each business will be assigned one of five strategic objectives:
1. Divest. Businesses will be closed or sold when it is judged that they do not offer good investmentopportunities for the firm.
2. Harvest. Some businesses will be run for cash when there are limited opportunities for further developmentbut they are capable of generating healthy cash flow.
3. Maintain. This may apply to businesses in mature markets where the firm already has an acceptable marketshare and where further share-building strategies are not seen as generating a positive net present value.
4. Growth. This will apply to businesses in attractive markets where they possess competitive advantages.
5. Enter. Managers should be generating new growth options for the firm to develop in the future.
The purpose of the strategic position assessment is to identify those parts of the business that are creating valueand to identify the drivers of value in the different markets. A simple way of thinking about the structure of theassessment is in terms of four questions. First, how is the business doing now? Is the business creating value? Whichare its strong parts and are there any parts that are destroying value? The next two questions seek to understandthe drivers of value. The second question is: how did the business get here? What explains its success or failurein creating value? The third question projects these drivers to the future by asking: where is the business heading?What are the implications of its current trajectory? The final question asks: what needs to be done? What actionsare necessary to enhance the value of the business?
ASSESSING THE CURRENT POSITION
The first step in the strategic position assessment is identifying whether the business is performing successfully atthe moment. In principle this should be a straightforward question, but in practice, answering it is not simple at all.

ASSESSING THE CURRENT POSITION 153
WEAKNESSES OF FINANCIAL MEASURES
Unfortunately, financial measures do not give reliable indications on whether current performance is creating thelong-term value shareholders expect. The problem needs to be explored at two levels: the company as a wholeand its constituent units.
THE COMPANY OVERALL
For a publicly quoted company, the total return to shareholders in the form of dividends and share price appreciationis the natural way to judge the performance of its management. In the long run this is certainly the case. But asa short-run measure of performance it is often not a good indicator. This is because a company’s share priceis determined by investors’ expectations of the value of future cash flows. This leads to a number of paradoxes,especially over the short term. If investors appreciate a well-run company’s strategy, the value of future cash flowswill be fully incorporated in the current share price. The future share price of this well-managed company willtherefore not appreciate more than the stock market average. Investors can do better investing in poorly managedcompanies, if they believe that market expectations have overestimated how badly these companies are doing. Inthe short run, good companies therefore may not deliver better shareholder returns than bad ones!
Because of this problem, managers tend to judge performance using accounting measures such as return on capitalor earnings per share. But such measures are even more unsatisfactory. Far from being objective, earnings andcapital employed are subjective and easily manipulated by different accounting methods. But even more seriously,these accounting metrics are short-term and can be quite unrelated to the real job of creating long-term value forshareholders. Profitability can be easily boosted by cutting back on marketing, training and research to the long-rundetriment of the business. New measures like economic value added may give a better measure of economic profit,but they in no way solve the problem of providing an indicator of long-term value creation.
OPERATING UNITS
Since the achievement of the company is the aggregate of the results of the operating performance of its individualbusinesses it is even more important to judge their results. Unfortunately, this is equally difficult. Since the operatingunits normally do not have their own shares quoted on the stock market, looking at the total shareholder return isnot possible.
The theoretically correct method of measuring the performance of an operating unit over a year is to look at thevalue management has created. This means comparing the value of the unit at the end of the year with that atthe beginning. The obvious problem is that these values are based on highly uncertain forecasts of long-term cashflows. Since generally the managers who make these forecasts will be the same ones whose performance is beingevaluated, there is considerable scope for biased results.
So again, as at the corporate level, performance is generally assessed using conventional accounting measures suchas return on capital, profits or economic value added. None of these gives a reliable measure of the long-termvalue being created by managers; indeed, they will often be completely misleading. In some ways, these measures
154 STRATEGIC POSITION ASSESSMENT
are worse at the operating unit level because they encourage deceptive comparisons across business units. Forexample, expecting a promising new business in a high-growth market to show the same levels of profitability as amature business unit would seriously erode the potential of the newcomer. Units at different levels of developmentneed quite different objectives and measures of performance.
STRATEGIC VALUE DRIVERS
Because of the weaknesses of performance measures based on annual accounting measures and the subjectivityinherent in estimating directly changes in value, indirect measures have to be employed to decide whether currentaccomplishments are creating long-term value.
These lead indicators are termed the strategic value drivers of the business. Strategic value drivers are thoseorganisational capabilities that have the most significant impact on the firm’s ability to create shareholder value. Forexample, key strategic value drivers at 3M and Intel are their new product development capabilities; at Procter &Gamble brand management is a key driver; at Toyota operational efficiency is important. These drivers shape acompany’s ability to create and retain competitive advantage and continuing profitability. If managers’ current actionsare enhancing these value drivers, then long-term value is likely to be created. If these resources and capabilities arebeing neglected then the firm’s competitive position and long-term value is likely to erode. To measure whethervalue is being created in any one year management have to (1) identify those organisational variables criticallyaffecting competitive advantage and long-term cash flow; (2) set target levels of performance on these variables and(3) measure the performance achieved and compare this against target performance levels.
IDENTIFYING VALUE DRIVERS
To identify strategic value drivers the management team needs a fundamental understanding of their business. Theyneed to be able to decide what are the most important factors determining the ability of the business to generatelong-term cash flows. A strategic value driver should have three characteristics. First, it should be a current asset orcapability that has a significant impact on the long-term value of the business. Second, it should be capable of beingmeasured and communicated. Third, it should be capable of being influenced by management actions.
Most successful businesses will have a set of value drivers including financial resources such as strong operatingmargins and cash flow; marketing resources including brands, customer loyalty and distribution partnerships; operatingcapabilities such as efficient manufacturing and supply chain processes, and learning capabilities in the form of trainingand development resources.
TARGET LEVELS OF PERFORMANCE
Once the value drivers are identified, the levels of performance that are acceptable have to be determined. The bestapproach is to benchmark performance against a peer group or other companies that the business aspires to emulate.
It is important to recognise that the significance of a value driver and the appropriate level of performance dependon the nature of the business and its stage in the life cycle. For example, high returns on capital and positivecash flows are to be expected from mature businesses, whereas growth is a much more important measure of

ASSESSING THE CURRENT POSITION 155
performance for a new business. Many new businesses will have high market valuations but little or no current profit.Here investors are valuing the future cash flows that they believe will occur once critical mass has been established.
MEASURING PERFORMANCE
To measure progress management has to set up the systems to collect regular, objective information on thesedrivers. These metrics are valuable if they form the basis for action. Targets have to be set, and individuals andgroups have to be assigned responsibility for achieving results.
Financial perspective
Goals Measures
How dowe want
shareholdersto see us?
How do wewant customers
to see us?
Customer perspective
Goals Measures
Visionand
strategy
Can wecontinue to
improve andcreate value?
Innovation andlearning perspective
Goals Measures
Goals Measures
Whatmust weexcel at?
Internalbusiness perspective
Figure 5.1 The Balanced Scorecard Links Performance Measures. Reprinted by permission of HarvardBusiness Review, Translating Vision and Strategy: Four Perspectives. From ‘Using the Balanced Scorecard asa Strategic Management System’, Robert S. Kaplan and David P. Norton, Jan.–Feb. 1996, Copyright 1996by the President and Fellows of Harvard College. All rights reserved
156 STRATEGIC POSITION ASSESSMENT
THE BALANCED SCORECARD
Successful companies are accepting that performance and plans cannot be built around a single measure such asreturn on capital or earnings per share. Instead they need a set of indicators to track performance and ensure thatmanagers are achieving on the drivers of long-term performance. The most systematic and popular approach inrecent years to developing such lead indicators has been the ‘balanced scorecard’ developed by Kaplan and Norton.[1]
The balanced scorecard was motivated by the recognition that companies cannot rely on short-run financialindicators to measure long-run performance. What is needed is a set of measures to link short-run achievement tolong-run value creation. The way this is done is by getting managers to develop a model of their business (see box,‘Developing the Balanced Scorecard’). The model aims to identify what determines the business’s long-run abilityto generate cash. Each business will have its own key drivers and hence will have its own measures. But based ontheir research, Kaplan and Norton suggest most businesses will have four common sets of perspectives – financial,customer, internal and innovation (Figure 5.1).
FINANCIAL PERSPECTIVE
The financial perspective incorporates the financial drivers of shareholder value. Normally it will make sense for thebusiness to set objectives for, and measure the performance of:
❍ Return on capital employed
❍ Operating margins
❍ Economic value added
❍ Cash flow
❍ Sales growth
Developing the Balanced Scorecard
Developing the scorecard consists of eight steps.
1. Preparation. The firm must define the business unit for which the scorecard is appropriate. Normally this willbe a unit that has its own customers, distribution channels, production facilities, and financial performancemeasures.
2. Developing mission and strategy. The management team receives briefing materials on the scorecardconcept and internal documents describing the company’s vision, mission and strategy. The scorecardfacilitator interviews the executives to obtain their perspectives of the firm’s objectives and ideas aboutscorecard measures. Often a sample of customers and shareholders are interviewed to understand theirexpectations.
3. Agreeing the vision and what it means. In a workshop, the top team debates the vision and strategyuntil a consensus is reached. They then identify the strategic objectives that are required for shareholders,customers, internal processes and for the business’s ability to improve, innovate and grow. Finally they try todraft a preliminary scorecard containing operational measures for the strategic objectives.

ASSESSING THE CURRENT POSITION 157
4. Drafting the balanced scorecard. The facilitator documents the output of the workshop and interviewsthe executives about the tentative scorecard. He also seeks opinions about implementing it.
5. Refining the scorecard. In a second workshop, involving a larger number of senior managers, theorganisation’s strategic drivers and draft scorecard is debated. Sub-groups are formed to review theproposed measures, link the various initiatives already underway to the measures, and start to develop animplementation plan. Finally, managers are asked to develop stretch objectives for each of the measures.
6. Final approval. The senior executive team meets to come to a final consensus on the strategy and scorecardand to agree stretch targets on the chosen measures. The team must also agree on an implementation planincluding an action programme, communicating the scorecard to employees and developing the informationto support it.
7. Implementation. A new team is created to implement the scorecard. This includes communicating itthroughout the organisation, developing second-level metrics for decentralised units and a new, comprehensiveinformation system that links top-level measures down through shop-floor and site-specific operationalindicators.
8. Periodic reviews. Each month information on scorecard performance is reviewed. The balanced scorecardmetrics are also evaluated annually as part of the strategic planning and budgetary processes
Reprinted by permission of Harvard Business School Press. From Putting the Business Scorecard to Work byRobert S. Kaplan and Richard L. Nolan. Boston, MA 1993, pp. 138. Copyright 1993 by the President andFellows of Harvard College. All rights reserved.
The measures chosen and the target levels will depend upon the maturity of the products and services in the unit’sportfolio. For businesses at the growth stage the primary financial objective will be sales growth. When the businessreaches maturity profitability measures such as return on capital employed, economic value added and operatingmargins become more important. Finally, at the decline stage cash flow will become the key financial measure.
CUSTOMER PERSPECTIVE
Growth and profitability depend crucially on the ability of the firm to satisfy its customers. Measures of marketingperformance are normally leading indicators of financial results. Goals and measurements will usually be required for:
❍ Market share
❍ Brand image and awareness
❍ Customer satisfaction
❍ Customer retention
❍ Customer acquisition
❍ Ranking by key accounts
158 STRATEGIC POSITION ASSESSMENT
Some businesses have different types of customers whose perspectives require separate measures. For example,financial institutions will need to monitor both savers and investors; fast-moving consumer goods companies willneed to look separately at both their trade customers and final consumers.
INTERNAL BUSINESS PERSPECTIVE
The ability of companies to generate cash flow also depends upon the efficiency of their business processes: R&D,design, manufacturing, selling and distribution. The goals and measures should focus on those internal processes thathave the greatest impact on customer satisfaction. They may include:
❍ Percentage of sales from new products
❍ Manufacturing cost
❍ Manufacturing cycle time
❍ Inventory management
❍ Quality indices
❍ Technological capabilities
INNOVATION AND LEARNING PERSPECTIVE
Long-run competitiveness depends on the firm’s core capabilities and its ability to upgrade them over time. Manycompanies now have competency assessment centres to measure the skills and attributes of their employees.Others map out their key organisational competencies to identify strengths and weaknesses. Goals and measurescan be set for competency developments in:
❍ Product development
❍ Purchasing
❍ Manufacturing
❍ Technology
❍ Marketing and sales
The balanced scorecard emphasises that in a complex business there are no single measures that can summariseperformance in the short run. High levels of current profitability can easily disguise a decline in the long-termcompetitiveness of the business. The appropriate metrics also vary with the maturity of the business. The balancedscorecard and lead indicator approach encourages managers to think about the strategic value drivers that generatelong-term value. The goal of maximising shareholder value is not itself an actionable objective or basis for strategy.To make it actionable managers have to think through what they need to accomplish and what competencies theywill need to acquire.
EXPLORING THE PORTFOLIO
It is not enough to look at performance at the aggregate level. To really understand the picture, aggregateperformance needs to be broken down into smaller units to identify the real winners and losers. A company will
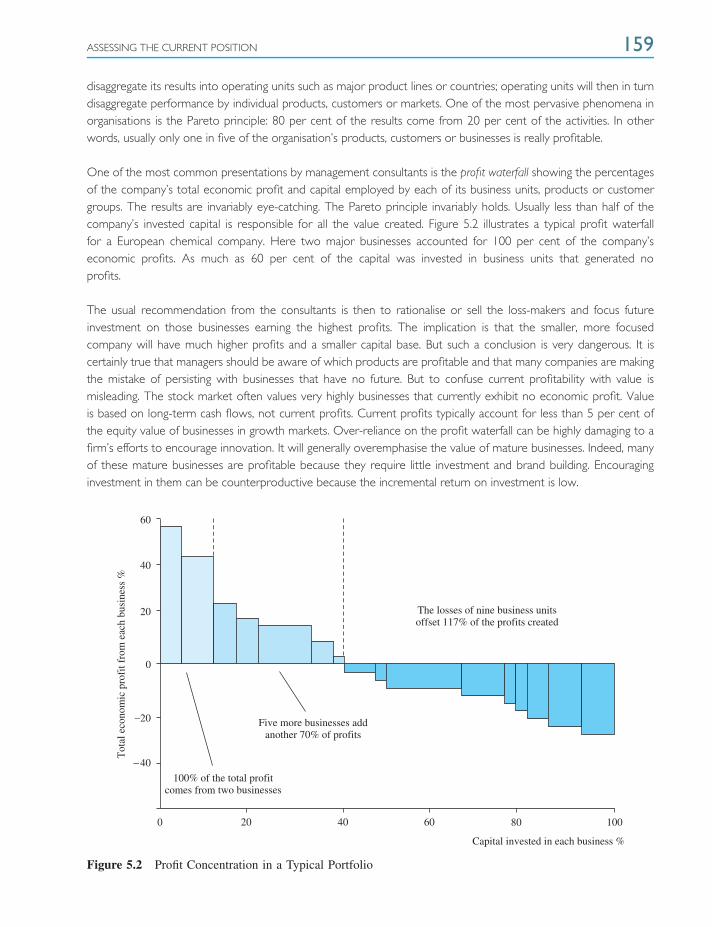
ASSESSING THE CURRENT POSITION 159
disaggregate its results into operating units such as major product lines or countries; operating units will then in turndisaggregate performance by individual products, customers or markets. One of the most pervasive phenomena inorganisations is the Pareto principle: 80 per cent of the results come from 20 per cent of the activities. In otherwords, usually only one in five of the organisation’s products, customers or businesses is really profitable.
One of the most common presentations by management consultants is the profit waterfall showing the percentagesof the company’s total economic profit and capital employed by each of its business units, products or customergroups. The results are invariably eye-catching. The Pareto principle invariably holds. Usually less than half of thecompany’s invested capital is responsible for all the value created. Figure 5.2 illustrates a typical profit waterfallfor a European chemical company. Here two major businesses accounted for 100 per cent of the company’seconomic profits. As much as 60 per cent of the capital was invested in business units that generated noprofits.
The usual recommendation from the consultants is then to rationalise or sell the loss-makers and focus futureinvestment on those businesses earning the highest profits. The implication is that the smaller, more focusedcompany will have much higher profits and a smaller capital base. But such a conclusion is very dangerous. It iscertainly true that managers should be aware of which products are profitable and that many companies are makingthe mistake of persisting with businesses that have no future. But to confuse current profitability with value ismisleading. The stock market often values very highly businesses that currently exhibit no economic profit. Valueis based on long-term cash flows, not current profits. Current profits typically account for less than 5 per cent ofthe equity value of businesses in growth markets. Over-reliance on the profit waterfall can be highly damaging to afirm’s efforts to encourage innovation. It will generally overemphasise the value of mature businesses. Indeed, manyof these mature businesses are profitable because they require little investment and brand building. Encouraginginvestment in them can be counterproductive because the incremental return on investment is low.
The losses of nine business unitsoffset 117% of the profits created
Five more businesses addanother 70% of profits
100% of the total profitcomes from two businesses
0 20
−20
20
40
−40
40
60
0
60
80 100
Capital invested in each business %
Tot
al e
cono
mic
pro
fit f
rom
eac
h bu
sine
ss %
Figure 5.2 Profit Concentration in a Typical Portfolio
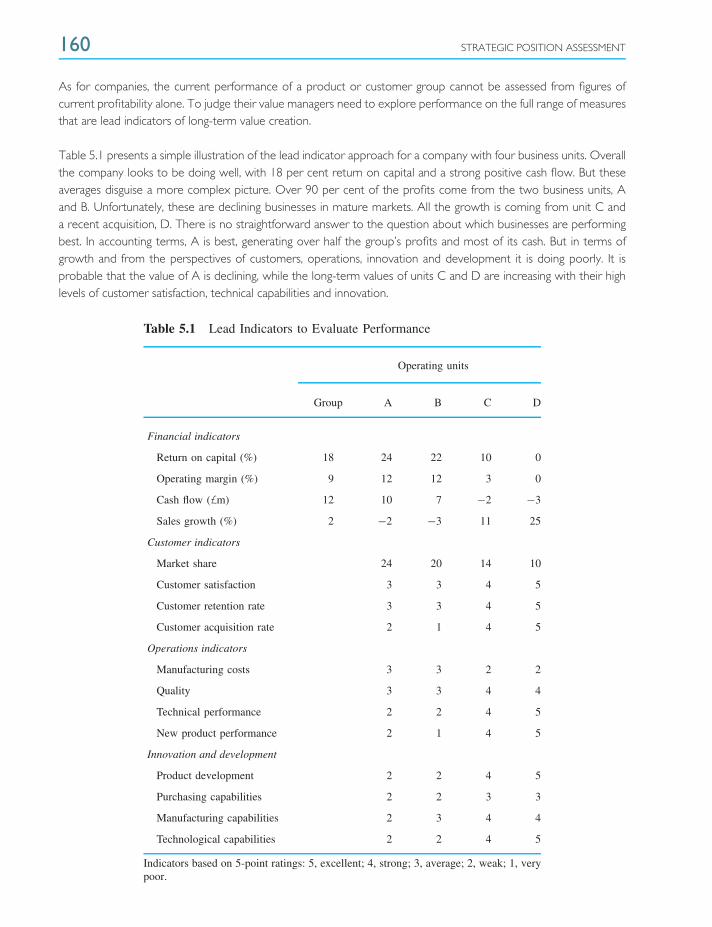
160 STRATEGIC POSITION ASSESSMENT
As for companies, the current performance of a product or customer group cannot be assessed from figures ofcurrent profitability alone. To judge their value managers need to explore performance on the full range of measuresthat are lead indicators of long-term value creation.
Table 5.1 presents a simple illustration of the lead indicator approach for a company with four business units. Overallthe company looks to be doing well, with 18 per cent return on capital and a strong positive cash flow. But theseaverages disguise a more complex picture. Over 90 per cent of the profits come from the two business units, Aand B. Unfortunately, these are declining businesses in mature markets. All the growth is coming from unit C anda recent acquisition, D. There is no straightforward answer to the question about which businesses are performingbest. In accounting terms, A is best, generating over half the group’s profits and most of its cash. But in terms ofgrowth and from the perspectives of customers, operations, innovation and development it is doing poorly. It isprobable that the value of A is declining, while the long-term values of units C and D are increasing with their highlevels of customer satisfaction, technical capabilities and innovation.
Table 5.1 Lead Indicators to Evaluate Performance
Operating units
Group A B C D
Financial indicators
Return on capital (%) 18 24 22 10 0
Operating margin (%) 9 12 12 3 0
Cash flow (£m) 12 10 7 −2 −3
Sales growth (%) 2 −2 −3 11 25
Customer indicators
Market share 24 20 14 10
Customer satisfaction 3 3 4 5
Customer retention rate 3 3 4 5
Customer acquisition rate 2 1 4 5
Operations indicators
Manufacturing costs 3 3 2 2
Quality 3 3 4 4
Technical performance 2 2 4 5
New product performance 2 1 4 5
Innovation and development
Product development 2 2 4 5
Purchasing capabilities 2 2 3 3
Manufacturing capabilities 2 3 4 4
Technological capabilities 2 2 4 5
Indicators based on 5-point ratings: 5, excellent; 4, strong; 3, average; 2, weak; 1, verypoor.
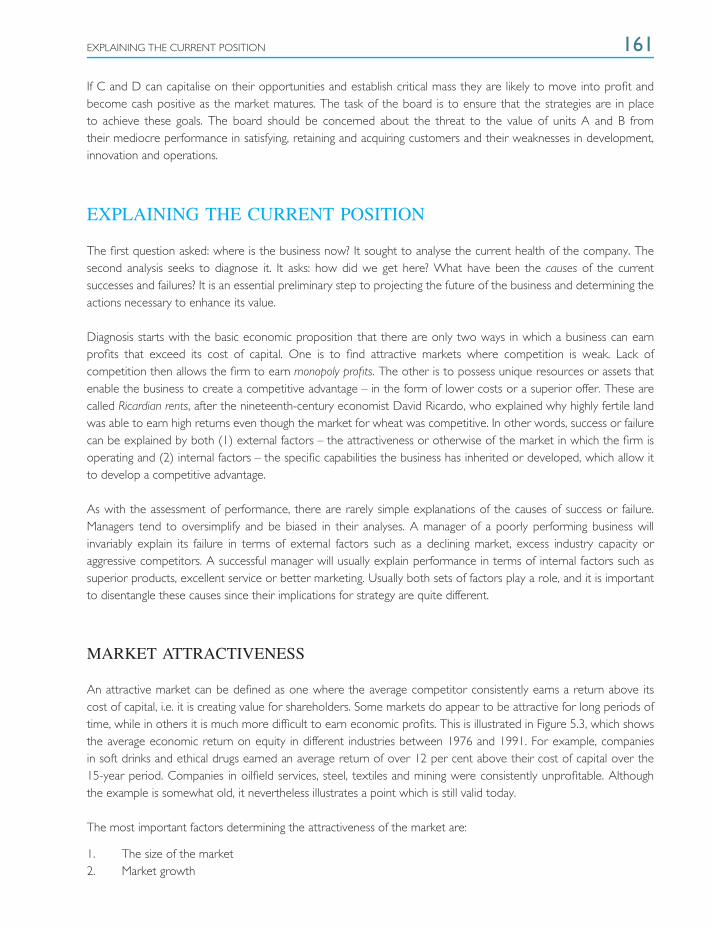
EXPLAINING THE CURRENT POSITION 161
If C and D can capitalise on their opportunities and establish critical mass they are likely to move into profit andbecome cash positive as the market matures. The task of the board is to ensure that the strategies are in placeto achieve these goals. The board should be concerned about the threat to the value of units A and B fromtheir mediocre performance in satisfying, retaining and acquiring customers and their weaknesses in development,innovation and operations.
EXPLAINING THE CURRENT POSITION
The first question asked: where is the business now? It sought to analyse the current health of the company. Thesecond analysis seeks to diagnose it. It asks: how did we get here? What have been the causes of the currentsuccesses and failures? It is an essential preliminary step to projecting the future of the business and determining theactions necessary to enhance its value.
Diagnosis starts with the basic economic proposition that there are only two ways in which a business can earnprofits that exceed its cost of capital. One is to find attractive markets where competition is weak. Lack ofcompetition then allows the firm to earn monopoly profits. The other is to possess unique resources or assets thatenable the business to create a competitive advantage – in the form of lower costs or a superior offer. These arecalled Ricardian rents, after the nineteenth-century economist David Ricardo, who explained why highly fertile landwas able to earn high returns even though the market for wheat was competitive. In other words, success or failurecan be explained by both (1) external factors – the attractiveness or otherwise of the market in which the firm isoperating and (2) internal factors – the specific capabilities the business has inherited or developed, which allow itto develop a competitive advantage.
As with the assessment of performance, there are rarely simple explanations of the causes of success or failure.Managers tend to oversimplify and be biased in their analyses. A manager of a poorly performing business willinvariably explain its failure in terms of external factors such as a declining market, excess industry capacity oraggressive competitors. A successful manager will usually explain performance in terms of internal factors such assuperior products, excellent service or better marketing. Usually both sets of factors play a role, and it is importantto disentangle these causes since their implications for strategy are quite different.
MARKET ATTRACTIVENESS
An attractive market can be defined as one where the average competitor consistently earns a return above itscost of capital, i.e. it is creating value for shareholders. Some markets do appear to be attractive for long periods oftime, while in others it is much more difficult to earn economic profits. This is illustrated in Figure 5.3, which showsthe average economic return on equity in different industries between 1976 and 1991. For example, companiesin soft drinks and ethical drugs earned an average return of over 12 per cent above their cost of capital over the15-year period. Companies in oilfield services, steel, textiles and mining were consistently unprofitable. Althoughthe example is somewhat old, it nevertheless illustrates a point which is still valid today.
The most important factors determining the attractiveness of the market are:
1. The size of the market2. Market growth

162 STRATEGIC POSITION ASSESSMENT
−5−10−15 0 5 10 15
Historical equity spreads (return on equity less cost of capital) (%)
5
10
15
20
Num
ber
of in
dust
ries
Oilf
ield
ser
vice
s
Stee
l
Air
tran
spor
t
Tex
tiles M
etal
s &
min
ing
Aut
o m
anuf
actu
ring
Tyr
e an
d ru
bber
Pack
agin
g
Hot
els
Bas
ic c
hem
ical
s
Food
who
lesa
lers
Publ
ishi
ng
Gro
cery
sto
res
Tob
acco
Pres
crip
tion
drug
s
Soft
dri
nks
Petr
oleu
m
Figure 5.3 Historical Economic Returns Across Industries 1976–1991. Reprinted with the permission ofThe Free Press, a Division of Simon & Schuster, Inc. From The Value Imperative: Managing the SuperiorShareholder Return by James M. McTaggart, Peter W. Kontes and Michael C. Mankins. Copyright 1994by the Free Press
3. The competitive structure of the market4. The cylicality of the market5. Risk factors
SIZE OF THE MARKET
Big markets offer firms more opportunities to grow. For larger firms, only sizeable markets will have the potential togenerate meaningful increases in value. Larger markets may offer smaller firms the opportunities to find profitableniches where they can prosper without competing head-to-head with the major players. Big markets can also enableambitious companies to build economies of scale.
MARKET GROWTH
It is easier to grow if the market in which the firm is operating is also growing. Non-growth markets are zero-sum: abusiness can only grow by taking customers away from competitors. Growth under these circumstances is usuallyassociated with declining prices and profitability. Growth markets are non-zero-sum: all the competitors can grow,which acts to reduce destructive price competition and margin erosion. In high-growth markets it is important to beambitious. A firm’s long-term competitive position can easily be undermined despite apparently satisfactory growth.

EXPLAINING THE CURRENT POSITION 163
For example, a business might be growing at 10 per cent annually, but if the market is growing at 20 per cent, itsmarket share is rapidly eroding. Within a few years it might be overtaken by competitors that are able to achieveeconomies of scale and power over the distribution channels.
THE COMPETITIVE STRUCTURE OF THE MARKET
The most important determinant of the average profitability of a market is its competitive structure. There are fivemain elements of competitive structure:
1. Intensity of direct competition. In some markets, competitors are much more aggressive in seeking to winor maintain sales. Where this occurs, prices and profits are invariably reduced. Intense competition is mostlikely in markets characterised by:
❍ Excess production capacity. The greater the excess capacity in an industry, the more likelycompetitors will cut prices and so erode profit margins in efforts to increase utilisation.
❍ Standardised products or services. The more similar are the offers of competitors, the greater thechances of price-based competition and low margins.
❍ Many competitors. The more players, the more likely is intense competition. With only a fewcompetitors tacit collusion will often maintain higher prices.
❍ Low growth. In rapidly growing markets, the intensity of competition is reduced since they do nothave to take customers from each other. As growth slows, excess capacity triggers price competition.
In some industries such as steel or textiles all these characteristics are present, which act to eliminate profitsfor all but the most efficient producers.
2. Buyer power. The drive and ability of customers to reduce prices also has a major effect on the profitabilityof the industry. Buying pressure is a function of two forces: the price sensitivity of buyers and their negotiatingpower. The price sensitivity of customers is determined primarily by their profitability and the significance ofthe product’s cost in their total expenditures. When times are tough for buyers and when they are spendingsignificant sums with the supplier, there is a greater incentive to seek lower prices to restore their ownmargins.
The negotiating power of a customer is high where there are few customers, many suppliers, little differentiationbetween suppliers, low switching costs, and opportunities for the customer to threaten to integrate backwards.
Generally, as markets mature, customer pressure puts margins under increasing threat. Over time, as buyersobtain more information about product features and suppliers’ costs, their leverage increases. When this iscombined with high price sensitivity, as it is for example in basic chemicals or auto tyres, buying power cancause profitability to disappear for all but the lowest-cost competitors.
3. Threat of new entry. If barriers to new entry are weak then it will be impossible for companies to maintainmonopoly profits. The major barriers to entry are:
❍ Patents and legal regulations
❍ Economies of scale
❍ High capital requirements to enter the market

164 STRATEGIC POSITION ASSESSMENT
❍ Strong brands
❍ Threat of retaliation
❍ Access to distribution channel
In some industries such as soft drinks and pharmaceuticals, such barriers are crucial in explaining the highprofit margins that have persisted. On the whole, however, globalisation, deregulation and the Internet havereduced entry barriers in many markets (see box, ‘The Internet Pulls Prices Down’).
The Internet Pulls Prices Down
E-commerce has introduced a strong deflationary effect on prices. For customers, it has allowed them to quicklysearch around the globe for the best prices. For suppliers, e-commerce has meant savings from lower real estateand rental costs, and reduced outlays for advertising, inventory and transportation – items that can account foraround 38 per cent of the consumer price.
4. Threat from substitutes. Substitute products are indirect competitors that can undermine demand andprices. There are different types of substitutes:
❍ Alternative products. For example, if the price of steel rises constructors can build bridges fromconcrete.
❍ New products. Innovation can erode demand, e.g. email undermined the fax, mobiles are replacinglandlines.
❍ Elimination of need. For example, new cars use less engine oil; eventually sealed engines may makereplacement lubricant unnecessary.
❍ Generic substitution. All products to some extent compete with one another. For example, producersof TVs, computers, cars and holidays all compete for the limited incomes of households.
❍ Abstinence. Consumers can often decide to do without the product if the price is unacceptable.
Some industries are more prone to substitutes than others. For example, it is more difficult for customers tosubstitute away from ethical pharmaceuticals than it is for them to find substitutes for glass packaging.
5. Power of suppliers. Suppliers limit a market’s profitability if they can drive up input costs faster than amarket’s customers will allow them to be passed on. Supplier power is likely to be high when:
❍ Few suppliers are available
❍ Suppliers have unique products or strongly differentiated brands
❍ Switching costs are high
❍ Suppliers can threaten to integrate forward
❍ There are large numbers of small customers with weak negotiating power
Again, some industries, such as textiles or petroleum, are more affected by these forces than others.
Professor Michael Porter of Harvard Business School represented these factors that determine industry profitabilityin his now familiar ‘five forces’ diagram (Figure 5.4).
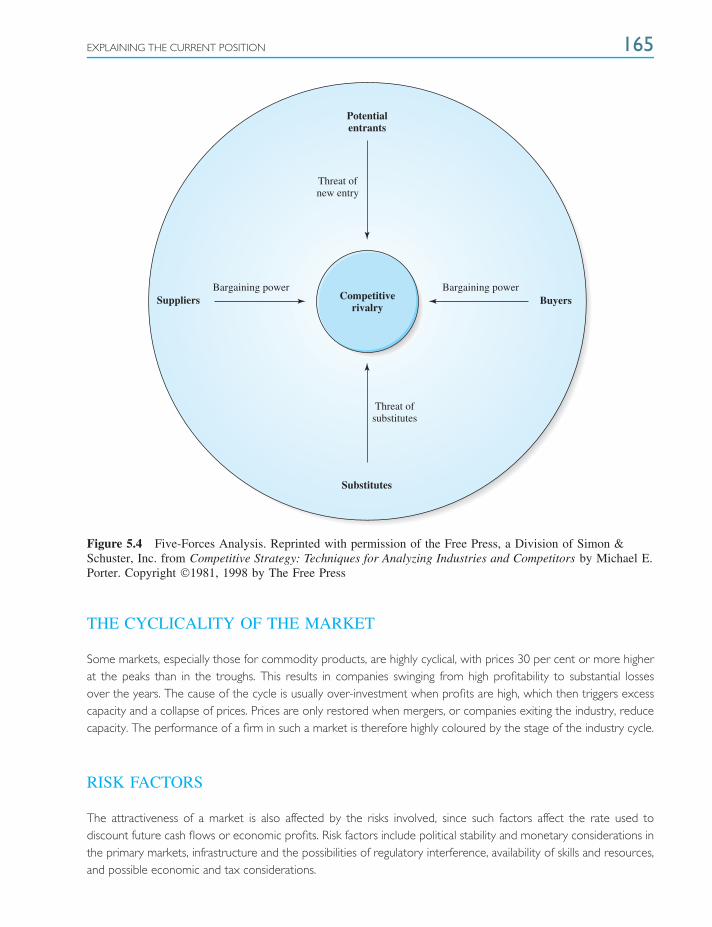
EXPLAINING THE CURRENT POSITION 165
Potentialentrants
Threat ofnew entry
Threat ofsubstitutes
SuppliersBargaining power Bargaining power
Buyers
Substitutes
Competitiverivalry
Figure 5.4 Five-Forces Analysis. Reprinted with permission of the Free Press, a Division of Simon &Schuster, Inc. from Competitive Strategy: Techniques for Analyzing Industries and Competitors by Michael E.Porter. Copyright 1981, 1998 by The Free Press
THE CYCLICALITY OF THE MARKET
Some markets, especially those for commodity products, are highly cyclical, with prices 30 per cent or more higherat the peaks than in the troughs. This results in companies swinging from high profitability to substantial lossesover the years. The cause of the cycle is usually over-investment when profits are high, which then triggers excesscapacity and a collapse of prices. Prices are only restored when mergers, or companies exiting the industry, reducecapacity. The performance of a firm in such a market is therefore highly coloured by the stage of the industry cycle.
RISK FACTORS
The attractiveness of a market is also affected by the risks involved, since such factors affect the rate used todiscount future cash flows or economic profits. Risk factors include political stability and monetary considerations inthe primary markets, infrastructure and the possibilities of regulatory interference, availability of skills and resources,and possible economic and tax considerations.

166 STRATEGIC POSITION ASSESSMENT
It is important to analyse all these external market factors when diagnosing a company’s performance advantages.They emphasise that high profits and growth are not solely a function of strong capabilities and good management.Some industries, for long periods of time, are just easier in which to achieve performance. In some industries,however well-managed the firm, it is just extraordinarily difficult to create value for shareholders.
COMPETITIVE ADVANTAGE
Generally, however, the firm’s competitive advantage, or lack of it, has a more important impact on its value than thenature of its particular market. Even in the toughest markets, firms with a competitive advantage are usually able toinvest at returns that exceed their cost of capital. Similarly, even in industries where the average company earns higheconomic profits, firms without any competitive advantage flounder. In other words, the variation of profitabilitywithin an industry exceeds the variation between industries. Ricardian profits are generally more important thanmonopoly profits.
To diagnose these internally generated sources of value creation, managers need to ask whether the businesshas held a value-creating differential advantage. If not, why not? As discussed in Chapter 3, the explanations of afirm’s differential advantage or lack of it will be found in the firm’s resources and the way they are integrated toform its core capabilities. If the firm has an effective set of lead indicators or balanced scorecard, which measuresperformance on the key value drivers, these should supply most of the answers.
When used in value-based marketing a differential advantage has a precise meaning. A business has a differentialadvantage if it is able to sustain economic profits that exceed the average of competitors in its market. This differentialadvantage can be based on either of two strategies. The first is an economic cost advantage, which occurs when afirm’s total costs (including capital costs) are lower than those of the average competitor. The second is through adifferentiation advantage, which occurs when customers perceive its product or services as superior, and are willingto pay a higher price than is charged by competitors.
COST ADVANTAGE
In many commodity markets building a differentiation advantage is very difficult. Of course, every marketing managercan find ways of differentiating the product by augmenting it with additional services and advertising. But, withoutreal innovation, it can often be very difficult, or impossible, to get buyers to pay price premiums sufficient to coverthe costs of these additional features. In such markets, superior profitability can only come through developing acost advantage.
For value-based analysis a cost advantage has a precise meaning. A business has a relative cost advantage if it hasa lower total economic cost than the average of competitors in its market. Total economic cost means the sum ofoperating costs plus a charge for capital, where the capital charge is the cost of capital multiplied by the amount ofcapital employed in the business.
Note that this definition of an economic cost advantage is different from the conventional accounting method thatlooks only at operating costs. Unless the business recognises the cost of employing capital, investing heavily toreduce operating costs can actually increase total unit costs. This occurs if the increased capital charge is greaterthan the decline in operating cost. An example of this is the Saturn programme at General Motors in the 1980s.GM spent billions on robotics and automation, only to find that companies like Ford, which focused on increasing
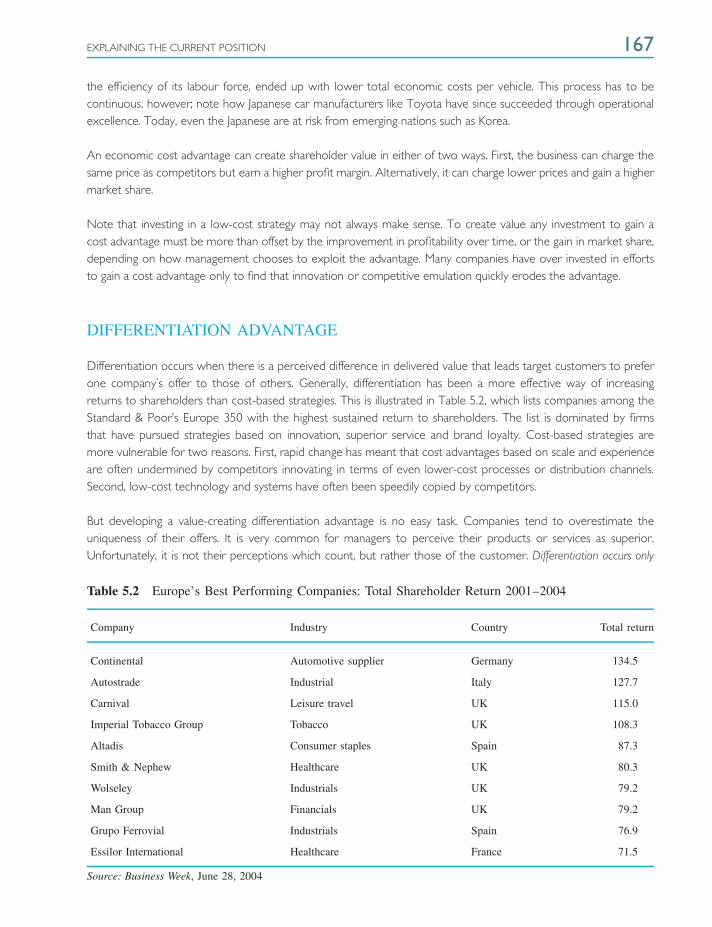
EXPLAINING THE CURRENT POSITION 167
the efficiency of its labour force, ended up with lower total economic costs per vehicle. This process has to becontinuous, however; note how Japanese car manufacturers like Toyota have since succeeded through operationalexcellence. Today, even the Japanese are at risk from emerging nations such as Korea.
An economic cost advantage can create shareholder value in either of two ways. First, the business can charge thesame price as competitors but earn a higher profit margin. Alternatively, it can charge lower prices and gain a highermarket share.
Note that investing in a low-cost strategy may not always make sense. To create value any investment to gain acost advantage must be more than offset by the improvement in profitability over time, or the gain in market share,depending on how management chooses to exploit the advantage. Many companies have over invested in effortsto gain a cost advantage only to find that innovation or competitive emulation quickly erodes the advantage.
DIFFERENTIATION ADVANTAGE
Differentiation occurs when there is a perceived difference in delivered value that leads target customers to preferone company’s offer to those of others. Generally, differentiation has been a more effective way of increasingreturns to shareholders than cost-based strategies. This is illustrated in Table 5.2, which lists companies among theStandard & Poor’s Europe 350 with the highest sustained return to shareholders. The list is dominated by firmsthat have pursued strategies based on innovation, superior service and brand loyalty. Cost-based strategies aremore vulnerable for two reasons. First, rapid change has meant that cost advantages based on scale and experienceare often undermined by competitors innovating in terms of even lower-cost processes or distribution channels.Second, low-cost technology and systems have often been speedily copied by competitors.
But developing a value-creating differentiation advantage is no easy task. Companies tend to overestimate theuniqueness of their offers. It is very common for managers to perceive their products or services as superior.Unfortunately, it is not their perceptions which count, but rather those of the customer. Differentiation occurs only
Table 5.2 Europe’s Best Performing Companies: Total Shareholder Return 2001–2004
Company Industry Country Total return
Continental Automotive supplier Germany 134.5
Autostrade Industrial Italy 127.7
Carnival Leisure travel UK 115.0
Imperial Tobacco Group Tobacco UK 108.3
Altadis Consumer staples Spain 87.3
Smith & Nephew Healthcare UK 80.3
Wolseley Industrials UK 79.2
Man Group Financials UK 79.2
Grupo Ferrovial Industrials Spain 76.9
Essilor International Healthcare France 71.5
Source: Business Week, June 28, 2004
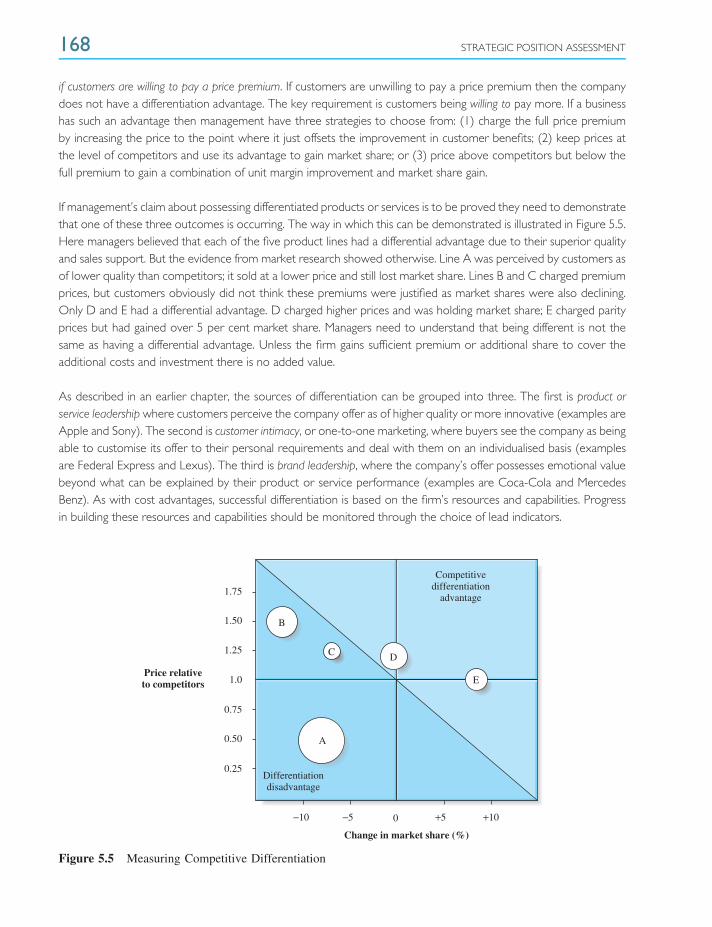
168 STRATEGIC POSITION ASSESSMENT
if customers are willing to pay a price premium. If customers are unwilling to pay a price premium then the companydoes not have a differentiation advantage. The key requirement is customers being willing to pay more. If a businesshas such an advantage then management have three strategies to choose from: (1) charge the full price premiumby increasing the price to the point where it just offsets the improvement in customer benefits; (2) keep prices atthe level of competitors and use its advantage to gain market share; or (3) price above competitors but below thefull premium to gain a combination of unit margin improvement and market share gain.
If management’s claim about possessing differentiated products or services is to be proved they need to demonstratethat one of these three outcomes is occurring. The way in which this can be demonstrated is illustrated in Figure 5.5.Here managers believed that each of the five product lines had a differential advantage due to their superior qualityand sales support. But the evidence from market research showed otherwise. Line A was perceived by customers asof lower quality than competitors; it sold at a lower price and still lost market share. Lines B and C charged premiumprices, but customers obviously did not think these premiums were justified as market shares were also declining.Only D and E had a differential advantage. D charged higher prices and was holding market share; E charged parityprices but had gained over 5 per cent market share. Managers need to understand that being different is not thesame as having a differential advantage. Unless the firm gains sufficient premium or additional share to cover theadditional costs and investment there is no added value.
As described in an earlier chapter, the sources of differentiation can be grouped into three. The first is product orservice leadership where customers perceive the company offer as of higher quality or more innovative (examples areApple and Sony). The second is customer intimacy, or one-to-one marketing, where buyers see the company as beingable to customise its offer to their personal requirements and deal with them on an individualised basis (examplesare Federal Express and Lexus). The third is brand leadership, where the company’s offer possesses emotional valuebeyond what can be explained by their product or service performance (examples are Coca-Cola and MercedesBenz). As with cost advantages, successful differentiation is based on the firm’s resources and capabilities. Progressin building these resources and capabilities should be monitored through the choice of lead indicators.
Price relativeto competitors
Change in market share (%)
−5−10 +5 +100
Differentiationdisadvantage
Competitivedifferentiation
advantage
0.25
0.50
0.75
1.0
1.25
1.50
1.75
A
C D
E
B
Figure 5.5 Measuring Competitive Differentiation
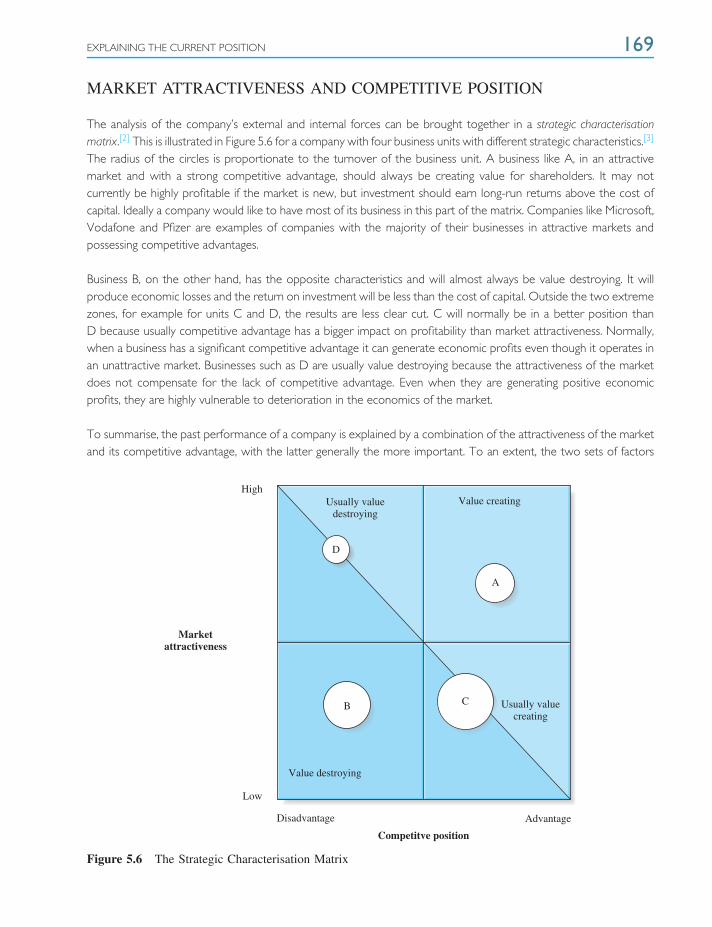
EXPLAINING THE CURRENT POSITION 169
MARKET ATTRACTIVENESS AND COMPETITIVE POSITION
The analysis of the company’s external and internal forces can be brought together in a strategic characterisationmatrix.[2] This is illustrated in Figure 5.6 for a company with four business units with different strategic characteristics.[3]
The radius of the circles is proportionate to the turnover of the business unit. A business like A, in an attractivemarket and with a strong competitive advantage, should always be creating value for shareholders. It may notcurrently be highly profitable if the market is new, but investment should earn long-run returns above the cost ofcapital. Ideally a company would like to have most of its business in this part of the matrix. Companies like Microsoft,Vodafone and Pfizer are examples of companies with the majority of their businesses in attractive markets andpossessing competitive advantages.
Business B, on the other hand, has the opposite characteristics and will almost always be value destroying. It willproduce economic losses and the return on investment will be less than the cost of capital. Outside the two extremezones, for example for units C and D, the results are less clear cut. C will normally be in a better position thanD because usually competitive advantage has a bigger impact on profitability than market attractiveness. Normally,when a business has a significant competitive advantage it can generate economic profits even though it operates inan unattractive market. Businesses such as D are usually value destroying because the attractiveness of the marketdoes not compensate for the lack of competitive advantage. Even when they are generating positive economicprofits, they are highly vulnerable to deterioration in the economics of the market.
To summarise, the past performance of a company is explained by a combination of the attractiveness of the marketand its competitive advantage, with the latter generally the more important. To an extent, the two sets of factors
Low
Disadvantage
Value destroying
B C
A
D
Usually valuecreating
HighUsually value
destroyingValue creating
Advantage
Competitve position
Marketattractiveness
Figure 5.6 The Strategic Characterisation Matrix
170 STRATEGIC POSITION ASSESSMENT
overlap in that a competence of management should be in identifying attractive markets. Also, not all the featuresof the market are outside the control of managers. They can also develop strategies to improve the competitivestructure of the market in their favour by, for example, building brands to create entry barriers, or by mergers toreduce capacity. But it is important to disentangle the two different dimensions since they shape how the future ofthe business is likely to develop.
PROJECTING THE FUTURE OF THE BUSINESS
The first part of the strategic assessment was aimed at obtaining a factual picture of the performance of thecompany. The second part sought to explain this performance in terms of the attractiveness of the firm’s marketsand its competitive advantages. The third question seeks to project where the business is heading under its presentpolicies. It aims at predicting what the performance is likely to be, as a prelude to determining what new actionsneed to be taken.
Forecasting the future of the business on its present strategies requires projecting the characteristics of the marketand anticipating the implications of the firm’s competitive position into the future.
MARKET ATTRACTIVENESS
We have looked at how the characteristics of the market affected performance in the past. Now the task is toassess how these characteristics are likely to change in the future and affect future performance.
Each of the dimensions of market attractiveness has to be evaluated. First, on the size and growth of the market,managers have to estimate how the growth rate will change over the next five years. Of particular importance isdetermining how the market will be segmented and which customer segments are likely to be most attractive. Thecompetitive structure of the market has to be evaluated and its impact on industry profitability. Will excess capacitybe a problem? What are the strategies of the competitors and how will they affect the competitive intensity of theindustry and the major segments? What implications will this have for prices and margins? Are customer pressuresgoing to be a major issue? Are new competitors likely to enter the market? Are product substitution and newtechnology going to create pressures? Will suppliers be exerting significant cost pressures?
Similar projections need to be made about the industry cycle. Will cyclical pressures be favourable or not for pricesand profits? Any new political, economic or societal risk factors also have to be considered. This research shouldlead to a profile of how market profitability and growth are likely to change over the next five years. It should leadto a conclusion on whether the market is likely to become more or less attractive.
DIFFERENTIAL ADVANTAGE
Alongside the projection of developments in the industry, management has to assess how the competitiveadvantage of the firm will shift over the coming years. If such an assessment is to be accurate and useful it willrequire comprehensive quantitative information, not only on the firm’s products and services, but also on those
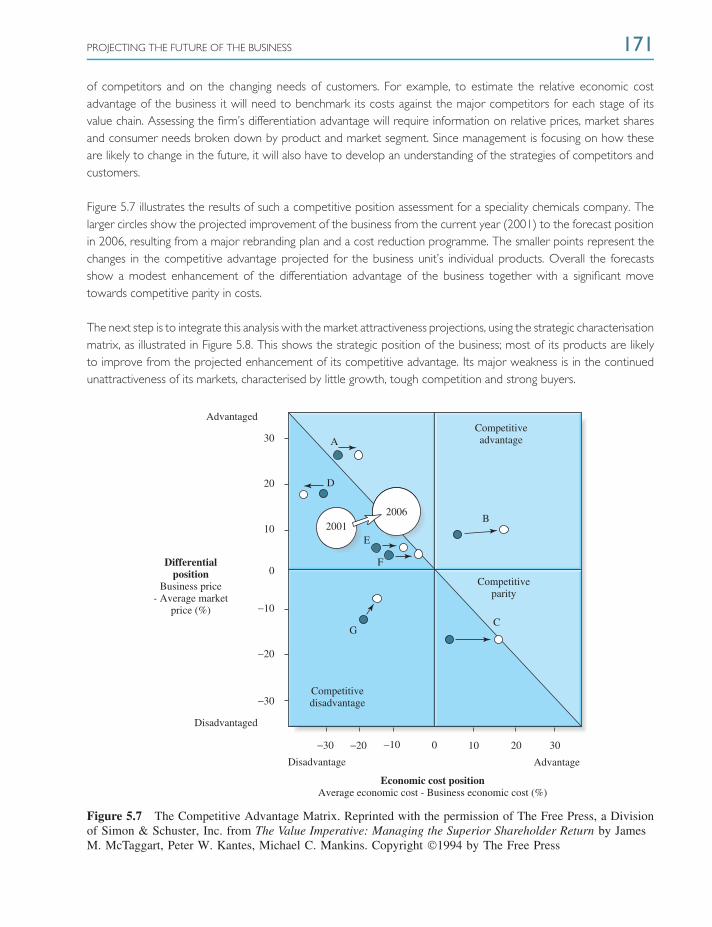
PROJECTING THE FUTURE OF THE BUSINESS 171
of competitors and on the changing needs of customers. For example, to estimate the relative economic costadvantage of the business it will need to benchmark its costs against the major competitors for each stage of itsvalue chain. Assessing the firm’s differentiation advantage will require information on relative prices, market sharesand consumer needs broken down by product and market segment. Since management is focusing on how theseare likely to change in the future, it will also have to develop an understanding of the strategies of competitors andcustomers.
Figure 5.7 illustrates the results of such a competitive position assessment for a speciality chemicals company. Thelarger circles show the projected improvement of the business from the current year (2001) to the forecast positionin 2006, resulting from a major rebranding plan and a cost reduction programme. The smaller points represent thechanges in the competitive advantage projected for the business unit’s individual products. Overall the forecastsshow a modest enhancement of the differentiation advantage of the business together with a significant movetowards competitive parity in costs.
The next step is to integrate this analysis with the market attractiveness projections, using the strategic characterisationmatrix, as illustrated in Figure 5.8. This shows the strategic position of the business; most of its products are likelyto improve from the projected enhancement of its competitive advantage. Its major weakness is in the continuedunattractiveness of its markets, characterised by little growth, tough competition and strong buyers.
0−30
−30
−20
−20
−10
−10
10 20 30
Disadvantage
Disadvantaged
Advantage
Economic cost positionAverage economic cost - Business economic cost (%)
0
10
20
30
Advantaged
Differentialposition
Business price- Average market
price (%)
A
D
E
F
20012006
B
CG
Competitiveadvantage
Competitivedisadvantage
Competitiveparity
Figure 5.7 The Competitive Advantage Matrix. Reprinted with the permission of The Free Press, a Divisionof Simon & Schuster, Inc. from The Value Imperative: Managing the Superior Shareholder Return by JamesM. McTaggart, Peter W. Kantes, Michael C. Mankins. Copyright 1994 by The Free Press
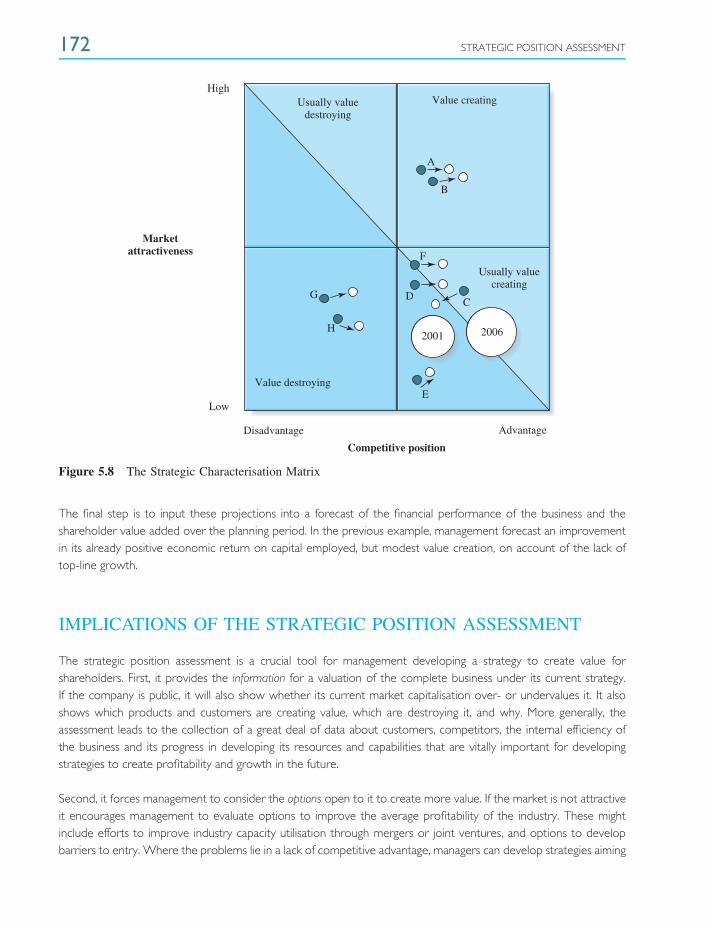
172 STRATEGIC POSITION ASSESSMENT
HighUsually value
destroying
Low
Disadvantage Advantage
Competitive position
Marketattractiveness
Value creating
Value destroying
Usually valuecreating
A
B
F
G
H
DC
E
2001 2006
Figure 5.8 The Strategic Characterisation Matrix
The final step is to input these projections into a forecast of the financial performance of the business and theshareholder value added over the planning period. In the previous example, management forecast an improvementin its already positive economic return on capital employed, but modest value creation, on account of the lack oftop-line growth.
IMPLICATIONS OF THE STRATEGIC POSITION ASSESSMENT
The strategic position assessment is a crucial tool for management developing a strategy to create value forshareholders. First, it provides the information for a valuation of the complete business under its current strategy.If the company is public, it will also show whether its current market capitalisation over- or undervalues it. It alsoshows which products and customers are creating value, which are destroying it, and why. More generally, theassessment leads to the collection of a great deal of data about customers, competitors, the internal efficiency ofthe business and its progress in developing its resources and capabilities that are vitally important for developingstrategies to create profitability and growth in the future.
Second, it forces management to consider the options open to it to create more value. If the market is not attractiveit encourages management to evaluate options to improve the average profitability of the industry. These mightinclude efforts to improve industry capacity utilisation through mergers or joint ventures, and options to developbarriers to entry. Where the problems lie in a lack of competitive advantage, managers can develop strategies aiming
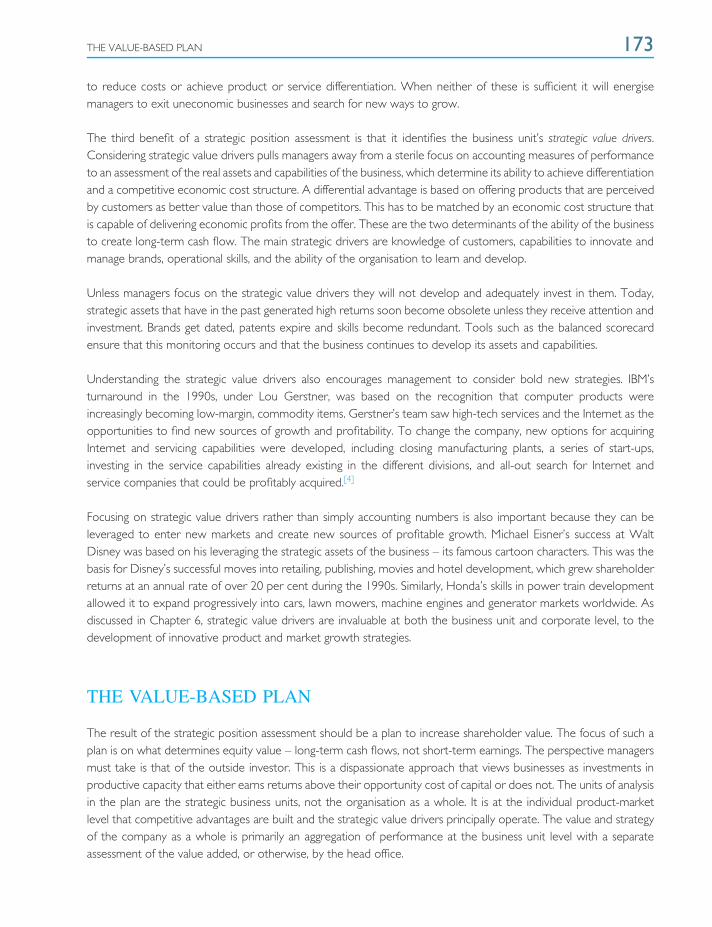
THE VALUE-BASED PLAN 173
to reduce costs or achieve product or service differentiation. When neither of these is sufficient it will energisemanagers to exit uneconomic businesses and search for new ways to grow.
The third benefit of a strategic position assessment is that it identifies the business unit’s strategic value drivers.Considering strategic value drivers pulls managers away from a sterile focus on accounting measures of performanceto an assessment of the real assets and capabilities of the business, which determine its ability to achieve differentiationand a competitive economic cost structure. A differential advantage is based on offering products that are perceivedby customers as better value than those of competitors. This has to be matched by an economic cost structure thatis capable of delivering economic profits from the offer. These are the two determinants of the ability of the businessto create long-term cash flow. The main strategic drivers are knowledge of customers, capabilities to innovate andmanage brands, operational skills, and the ability of the organisation to learn and develop.
Unless managers focus on the strategic value drivers they will not develop and adequately invest in them. Today,strategic assets that have in the past generated high returns soon become obsolete unless they receive attention andinvestment. Brands get dated, patents expire and skills become redundant. Tools such as the balanced scorecardensure that this monitoring occurs and that the business continues to develop its assets and capabilities.
Understanding the strategic value drivers also encourages management to consider bold new strategies. IBM’sturnaround in the 1990s, under Lou Gerstner, was based on the recognition that computer products wereincreasingly becoming low-margin, commodity items. Gerstner’s team saw high-tech services and the Internet as theopportunities to find new sources of growth and profitability. To change the company, new options for acquiringInternet and servicing capabilities were developed, including closing manufacturing plants, a series of start-ups,investing in the service capabilities already existing in the different divisions, and all-out search for Internet andservice companies that could be profitably acquired.[4]
Focusing on strategic value drivers rather than simply accounting numbers is also important because they can beleveraged to enter new markets and create new sources of profitable growth. Michael Eisner’s success at WaltDisney was based on his leveraging the strategic assets of the business – its famous cartoon characters. This was thebasis for Disney’s successful moves into retailing, publishing, movies and hotel development, which grew shareholderreturns at an annual rate of over 20 per cent during the 1990s. Similarly, Honda’s skills in power train developmentallowed it to expand progressively into cars, lawn mowers, machine engines and generator markets worldwide. Asdiscussed in Chapter 6, strategic value drivers are invaluable at both the business unit and corporate level, to thedevelopment of innovative product and market growth strategies.
THE VALUE-BASED PLAN
The result of the strategic position assessment should be a plan to increase shareholder value. The focus of such aplan is on what determines equity value – long-term cash flows, not short-term earnings. The perspective managersmust take is that of the outside investor. This is a dispassionate approach that views businesses as investments inproductive capacity that either earns returns above their opportunity cost of capital or does not. The units of analysisin the plan are the strategic business units, not the organisation as a whole. It is at the individual product-marketlevel that competitive advantages are built and the strategic value drivers principally operate. The value and strategyof the company as a whole is primarily an aggregation of performance at the business unit level with a separateassessment of the value added, or otherwise, by the head office.
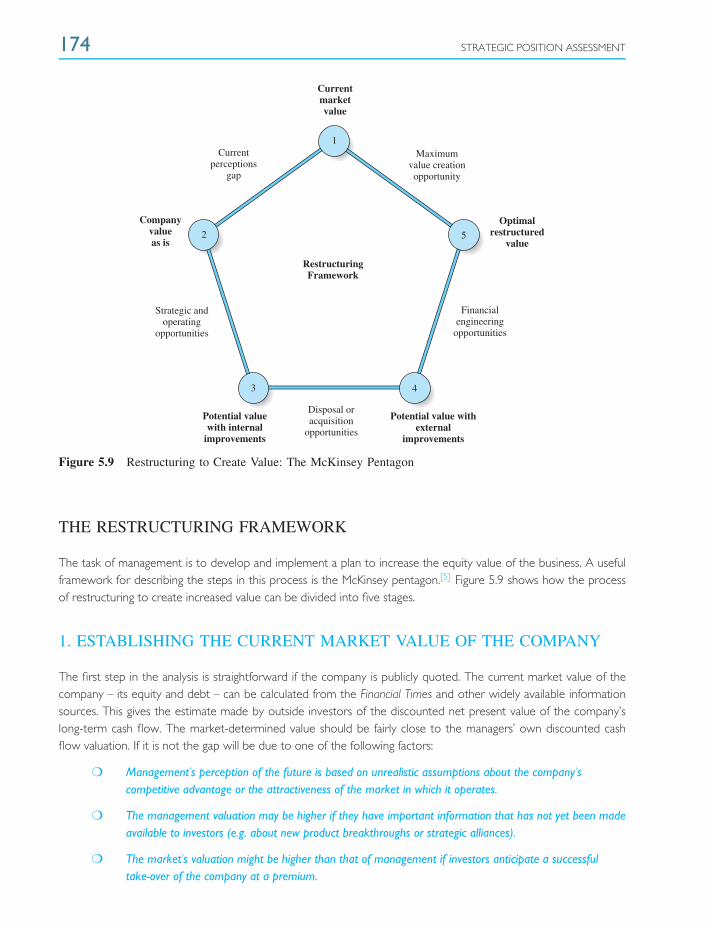
174 STRATEGIC POSITION ASSESSMENT
Currentperceptions
gap
Strategic andoperating
opportunities
Disposal oracquisition
opportunities
Financialengineering
opportunities
Maximumvalue creationopportunity
Companyvalueas is
1
2
3 4
5
Potential valuewith internal
improvements
Potential value withexternal
improvements
RestructuringFramework
Optimalrestructured
value
Currentmarketvalue
Figure 5.9 Restructuring to Create Value: The McKinsey Pentagon
THE RESTRUCTURING FRAMEWORK
The task of management is to develop and implement a plan to increase the equity value of the business. A usefulframework for describing the steps in this process is the McKinsey pentagon.[5] Figure 5.9 shows how the processof restructuring to create increased value can be divided into five stages.
1. ESTABLISHING THE CURRENT MARKET VALUE OF THE COMPANY
The first step in the analysis is straightforward if the company is publicly quoted. The current market value of thecompany – its equity and debt – can be calculated from the Financial Times and other widely available informationsources. This gives the estimate made by outside investors of the discounted net present value of the company’slong-term cash flow. The market-determined value should be fairly close to the managers’ own discounted cashflow valuation. If it is not the gap will be due to one of the following factors:
❍ Management’s perception of the future is based on unrealistic assumptions about the company’scompetitive advantage or the attractiveness of the market in which it operates.
❍ The management valuation may be higher if they have important information that has not yet been madeavailable to investors (e.g. about new product breakthroughs or strategic alliances).
❍ The market’s valuation might be higher than that of management if investors anticipate a successfultake-over of the company at a premium.
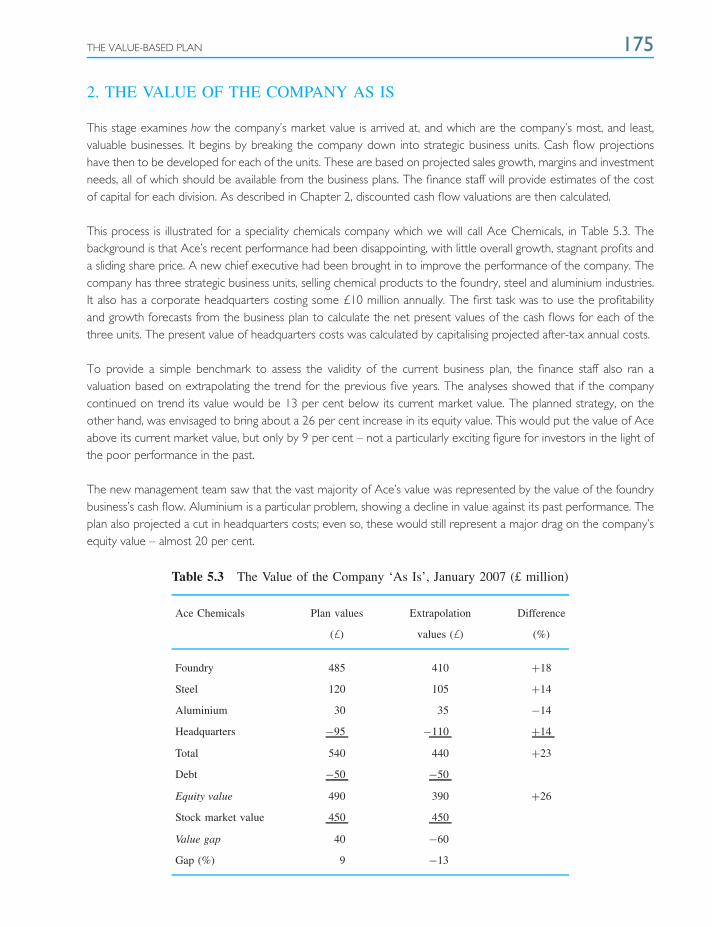
THE VALUE-BASED PLAN 175
2. THE VALUE OF THE COMPANY AS IS
This stage examines how the company’s market value is arrived at, and which are the company’s most, and least,valuable businesses. It begins by breaking the company down into strategic business units. Cash flow projectionshave then to be developed for each of the units. These are based on projected sales growth, margins and investmentneeds, all of which should be available from the business plans. The finance staff will provide estimates of the costof capital for each division. As described in Chapter 2, discounted cash flow valuations are then calculated.
This process is illustrated for a speciality chemicals company which we will call Ace Chemicals, in Table 5.3. Thebackground is that Ace’s recent performance had been disappointing, with little overall growth, stagnant profits anda sliding share price. A new chief executive had been brought in to improve the performance of the company. Thecompany has three strategic business units, selling chemical products to the foundry, steel and aluminium industries.It also has a corporate headquarters costing some £10 million annually. The first task was to use the profitabilityand growth forecasts from the business plan to calculate the net present values of the cash flows for each of thethree units. The present value of headquarters costs was calculated by capitalising projected after-tax annual costs.
To provide a simple benchmark to assess the validity of the current business plan, the finance staff also ran avaluation based on extrapolating the trend for the previous five years. The analyses showed that if the companycontinued on trend its value would be 13 per cent below its current market value. The planned strategy, on theother hand, was envisaged to bring about a 26 per cent increase in its equity value. This would put the value of Aceabove its current market value, but only by 9 per cent – not a particularly exciting figure for investors in the light ofthe poor performance in the past.
The new management team saw that the vast majority of Ace’s value was represented by the value of the foundrybusiness’s cash flow. Aluminium is a particular problem, showing a decline in value against its past performance. Theplan also projected a cut in headquarters costs; even so, these would still represent a major drag on the company’sequity value – almost 20 per cent.
Table 5.3 The Value of the Company ‘As Is’, January 2007 (£ million)
Ace Chemicals Plan values Extrapolation Difference
(£) values (£) (%)
Foundry 485 410 +18
Steel 120 105 +14
Aluminium 30 35 −14
Headquarters −95 −110 +14
Total 540 440 +23
Debt −50 −50
Equity value 490 390 +26
Stock market value 450 450
Value gap 40 −60
Gap (%) 9 −13
176 STRATEGIC POSITION ASSESSMENT
The results of the strategic position assessment that Ace had undertaken prior to developing the restructuring planrevealed the explanations of its position. The strategic characterisation matrix showed that the foundry’s success wasdue to its strong competitive advantage based on leading-edge products and an outstanding reputation for qualityand service. With steel and aluminium, however, Ace’s products were not seen as differentiated and the marketswere characterised by intense price competition and strong buying pressures. Conditions in the aluminium marketwere expected to deteriorate further and Ace had no expectations of significant breakthroughs in products or costs.
Ace had also developed a balanced scorecard to monitor performance on its strategic value drivers. The financial indi-cators confirmed investors’ disappointment with the company. When total shareholder returns were benchmarkedagainst a peer group in the chemicals sector, Ace had significantly underperformed the average. The consumer indica-tors, while good for foundry, were weak for steel, and especially for aluminium. The indicators for internal operationsand learning and development highlighted the weak technology and lack of new products in the latter areas.
What was clear from the valuation exercise and strategic position assessment was that Ace was a vulnerablebusiness. Even with the performance improvements envisaged in the plan, the equity value of the business was only9 per cent above its current stock market value. Any deviations from the plan or unexpected developments inmarket conditions would risk a collapse of the share price.
3. THE POTENTIAL VALUE WITH INTERNAL IMPROVEMENTS
The new chief executive decided to develop a new plan that would more aggressively seek to increase long-termcash flows in the business. The four financial drivers of higher cash flows are increased sales, higher prices,lower costs and reductions in investment requirements. The core strategic value drivers that determine thesedimensions of financial performance are increasing customer satisfaction, operational efficiency, quality management,the development of new products and the core capabilities that make possible further developments.
Action teams were set up for each business unit to undertake a fundamental reappraisal of the plan with the objectiveof significantly increasing the unit’s value. In the steel products division management first did a simulation to seethe leverage of the different financial value drivers. They found that a 5 per cent increase in sales would generate a20 per cent increase in the present value of the long-term cash flow; a 5 per cent increase in average prices could add48 per cent to the unit’s value, and a similar reduction in investment would add 8 per cent. Next, they benchmarkedsteel’s value chain against the best competitors to judge the scope for improvements in product performance,marketing and productivity. These analyses coupled with the strategic position assessment led management tobelieve that the business could perform at a significantly higher level. The major changes initiated were:
❍ Sales performance. The team was convinced that sales could be boosted without margin erosion by amodest increase in development spending on certain key projects, a new dealer partnership programme tobuild greater loyalty, and a refocusing of service staff around high potential customer accounts.
Management also decided to invest in three strategic alliances with high-tech businesses overseas todevelop potential new areas for growth. It was anticipated that at least one of these pilots would create asignificant new income stream after five years.
❍ Price increases. There was scope to reduce the high level and range of discounts the business was giving.A segmentation analysis also suggested that certain specialised customers were not price sensitive if highlevels of service and support were guaranteed.
STRATEGIC OBJECTIVES 177
❍ Cost reductions. Central buying and a vendor reduction programme could reduce material costs. Also,new information technology permitted further savings in office costs.
❍ Investment requirements. Reducing the number of sites and a new logistics system would offersignificant savings in working and fixed capital requirements.
Similar analyses in the other two business units also produced corresponding improvements in future cash flow. Ontop of this it was also proposed to cut head office costs by half. Putting it all together, the Ace management teambelieved that the total value of the business could be increased by 40 per cent over the value in the original plan.
4. THE POTENTIAL VALUE WITH EXTERNAL IMPROVEMENTS
The next step is determining whether value can be created by external improvements. Such enhancements may bepossible through either shrinking the business or expanding it. In the previous step management calculated what theunits were worth to the company. Perhaps significantly more value could be created for shareholders if some, orall, were sold to other parties, spun-off and floated as independent businesses, or simply liquidated by selling theirassets. Management can work with financial analysts to assess the price that might be obtained under each of theseoptions. These sell-off options are often particularly attractive for unrelated businesses where other companies havemore expertise, and could add more value than the current management. The cash received can then be returnedto shareholders or reinvested to improve the core business if there are profitable opportunities available.
The alternative strategy is to consider strengthening the business through an acquisition. An acquisition might offerthe potential to reduce costs or boost growth. While the overall success statistics for acquisitions are not high, theright combination can sometimes bring great rewards. Successful acquisitions depend upon being able to buy at areasonable price and identifying genuine synergies in costs or marketing to justify the premium paid.
5. OPTIMAL RESTRUCTURED VALUE
The final stage of the restructuring pentagon is to determine the optimal restructured value – what it is worth withall the internal and external improvements. The final plan that was agreed by the board of Ace included selling offthe aluminium business to a leading multinational for £60 million, halving the size of the head office, acquiring anotherfoundry business in Taiwan, and a raft of new marketing initiatives that were projected to double Ace’s growth rateover the next five years. The results of the value-orientated planning process are summarised in Figure 5.10. Thenew team was confident that the new strategy would increase the equity value of the company by 80 per centmore than its current value, offering shareholders the prospects of significant real returns on their investments.
STRATEGIC OBJECTIVES
The outcome of the strategic position assessment and the value creating planning process will be a set of strategicobjectives, one for each of the business units. For example, in the case of Ace Chemicals the aluminium businesswas targeted for divestment, while the foundry and steel businesses were set growth objectives. The strategicobjective assigned to a business unit sets the broad path management have to follow in pursuit of the company’s

178 STRATEGIC POSITION ASSESSMENT
Stock marketvalue £450 m
£490 m
£577 m
£700 m
£390 m
Historicalextrapolation
Businessplans
Internalimprovements
Optimalplan
Figure 5.10 Ace Company: Creating Shareholder Value
overall value creating process. What the appropriate strategic objective is for a unit depends upon the assessmentof the attractiveness of its market and the strength of its competitive advantage. Those in attractive markets andpossessing strong competitive advantages are likely to be assigned growth as the objective; those in areas of limitedattractiveness or where the business lacks the prospect of building a competitive advantage will be geared todivestment or harvesting.
Five broad objectives can be distinguished:
1. Divest2. Harvest3. Maintain4. Growth5. Enter
DIVEST
An essential element of value-based marketing is exiting from markets or market segments that do not offer profitpotential and rationalising unprofitable products. Divesting from such losers cuts costs and shifts resources fromuneconomic activities. By pruning the number of activities it reduces complexity and allows managers to focus onthose parts of the business that offer genuine opportunities for profitable growth. Many companies can double theirvalue over a two- or three-year period simply by divesting from those products and customers that produce large,irreversible losses and increasing the growth of their most profitable units.
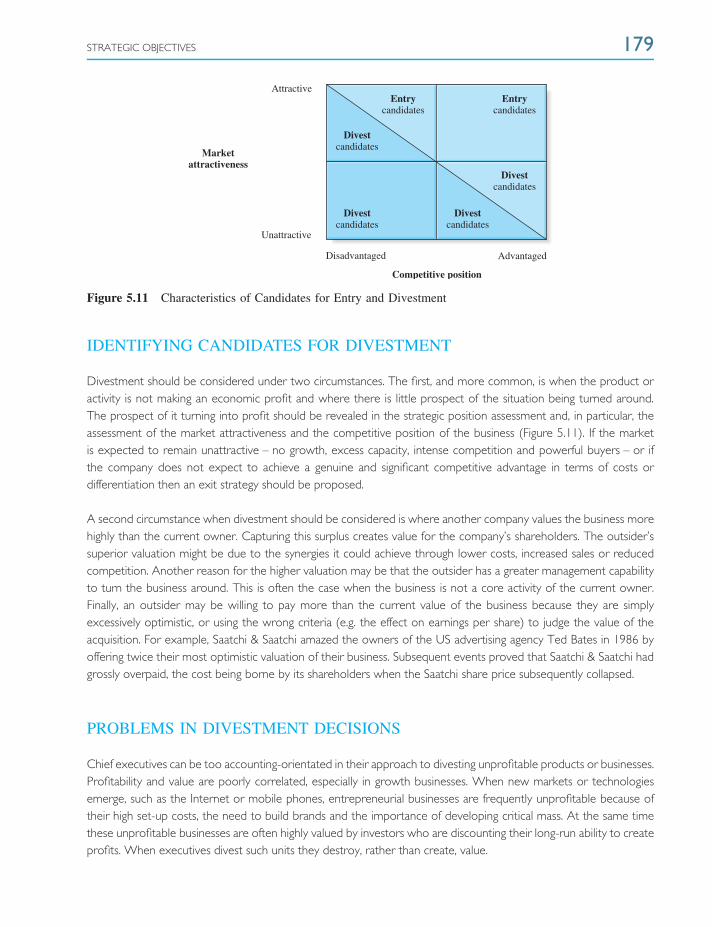
STRATEGIC OBJECTIVES 179
Attractive
Unattractive
Disadvantaged
Divestcandidates
Divestcandidates
Divestcandidates
Divestcandidates
Entrycandidates
Entrycandidates
Advantaged
Marketattractiveness
Competitive position
Figure 5.11 Characteristics of Candidates for Entry and Divestment
IDENTIFYING CANDIDATES FOR DIVESTMENT
Divestment should be considered under two circumstances. The first, and more common, is when the product oractivity is not making an economic profit and where there is little prospect of the situation being turned around.The prospect of it turning into profit should be revealed in the strategic position assessment and, in particular, theassessment of the market attractiveness and the competitive position of the business (Figure 5.11). If the marketis expected to remain unattractive – no growth, excess capacity, intense competition and powerful buyers – or ifthe company does not expect to achieve a genuine and significant competitive advantage in terms of costs ordifferentiation then an exit strategy should be proposed.
A second circumstance when divestment should be considered is where another company values the business morehighly than the current owner. Capturing this surplus creates value for the company’s shareholders. The outsider’ssuperior valuation might be due to the synergies it could achieve through lower costs, increased sales or reducedcompetition. Another reason for the higher valuation may be that the outsider has a greater management capabilityto turn the business around. This is often the case when the business is not a core activity of the current owner.Finally, an outsider may be willing to pay more than the current value of the business because they are simplyexcessively optimistic, or using the wrong criteria (e.g. the effect on earnings per share) to judge the value of theacquisition. For example, Saatchi & Saatchi amazed the owners of the US advertising agency Ted Bates in 1986 byoffering twice their most optimistic valuation of their business. Subsequent events proved that Saatchi & Saatchi hadgrossly overpaid, the cost being borne by its shareholders when the Saatchi share price subsequently collapsed.
PROBLEMS IN DIVESTMENT DECISIONS
Chief executives can be too accounting-orientated in their approach to divesting unprofitable products or businesses.Profitability and value are poorly correlated, especially in growth businesses. When new markets or technologiesemerge, such as the Internet or mobile phones, entrepreneurial businesses are frequently unprofitable because oftheir high set-up costs, the need to build brands and the importance of developing critical mass. At the same timethese unprofitable businesses are often highly valued by investors who are discounting their long-run ability to createprofits. When executives divest such units they destroy, rather than create, value.
180 STRATEGIC POSITION ASSESSMENT
Economic profits are more closely related to value in mature businesses. But even here turning unprofitablebusinesses around may be a better option than divestment. The decision has to be based, in particular, uponmanagement’s ability to develop a competitive advantage in terms of costs or a differentiated offering to customers.It also needs a hard-headed analysis of the future attractiveness of the market. Managers have to assess what marketconditions – capacity, competition and customer buying pressures – imply for average profitability in the industry.In cyclical industries taking a long-term view is particularly important. Depending upon where the business is on thecycle at any point of time, current prices and profitability can give very misleading signals of the trend. Managersneed to look at the picture over a longer period to get an objective view of profitability and value potential.
Divestment and product rationalisation depend for their success on accurate data on economic profits. It isimportant that overhead costs and investment be allocated to products in a way that accurately reflects theirusage. Without good economic information, the wrong products will often be sacrificed. Managers will oftenmake rationalisation decisions based on volume, believing that low-volume products are less profitable than theirhigh-volume counterparts. Once a proper allocation of costs and investments is made, it often becomes clear thatmany high-volume accounts are scarcely profitable because of the bargaining power of these customers. Manylow-volume accounts are often discovered to be highly profitable because they are niche businesses, achievinghigher prices, and selling to less demanding customers.
Another common problem in divestment lies in the links between the weak products and other parts of thebusiness. It is common for the product under review to share costs, assets and customers with other more profitableproducts. Divesting the product will then mean reducing the profitability of the remaining businesses as they haveto absorb the costs and assets. Often too there will be supply chain linkages. For example, shrinking the businessunit’s product line can reduce its level of influence over its dealers or retailers. Thus, the benefits of exiting onemarket or product must be weighed against the possibility of reducing the profitability of the whole product line.
Understanding of the linkages between products should not, however, be an excuse for inaction. Often the savingsfrom divestment will more than compensate for the side effects. When side effects are a major issue there areoften other options that can be considered. The business can source rather than manufacture products to maintainits product portfolio in a more economical manner. Alternatively, it may be able to find a strategic partner to sharethe costs of the business under review. In all circumstances managers have to decisively attack the problems causedby businesses that are not adding value.
Two other issues are common barriers to sensible divestment strategies. One is the use of marginal analysis toexplore investment and divestment options. This assumes a product is worth keeping if it makes any contributionto overheads and profits. Such an approach is particularly tempting to management faced with substantial excesscapacity. Unfortunately, such a criterion allows the business to drift into carrying a large number of products that donot make an economic profit because they are not held responsible for either the overheads or capital they incur.In the longer run, managers have to accept that all costs and assets are variable. Marginal analysis makes it too easyto sanction entry decisions and too easy to postpone exit decisions.
The second obstacle is the desire of managers for size and growth. Growth is of course a crucial way to create valuefor shareholders, but only if it is, over time, profitable growth. In many companies, ill-considered incentives biasmanagers to non-value-adding growth. These include the pattern of paying managers according to the size of thebusiness they manage, the prestige attached to running the biggest unit, and incentives that reward volume ratherthan value. All these incentives encourage managers to add products and discourage them from sacrificing parts oftheir empires.
STRATEGIC OBJECTIVES 181
THE PROCESS OF DIVESTING
Management should review the business annually to identify candidates for divestment. Such a process involves foursteps. First, identify divestment targets. These will be parts of the business that the strategic position assessmentforecasts cannot earn economic profits over the planning period on account of the inability of the business to build aprofitable competitive advantage or the unattractive nature of the markets in which they operate. Second, estimatethe liquidation value of the business unit. This is the cash that could be obtained from selling off the fixed assets andreleasing the working capital, less any exit costs (e.g. for environmental cleanup). Typically, liquidating a business andtaking the tax loss will produce a cash amount of 40–60 per cent of the book value of shareholders’ funds.
Third, estimate the highest operating value of the business unit under an optimal restructuring plan. As describedearlier, this includes exploring all internal and external options to increase the long-term discounted value of cashflow that can be generated from the business. The final step is to determine the net divestment value. This is thepresent value of the after-tax proceeds from selling the business, liquidating it or spinning it off. If the net divestmentvalue exceeds the highest operating value of the business then the decision should be to divest the business.
In summary, divesting parts of the business that do not add value is a crucial way of increasing returns to shareholders.It is also an important precursor to a growth strategy, by releasing management resources to focus on higher valueactivities.
HARVEST
A harvesting strategy is one that maximises the firm’s cash flow from its existing assets. It is an appropriate strategywhen two conditions hold. First, the net divestment value of the business is below its optimal restructured value.Second, the enhanced value from the restructured option accrues from increasing the cash flow from the currentvolume of sales rather than growth. Indeed, harvesting is often accompanied by declining sales volume.
Harvesting – or milking the business – is often appropriate when the competitive advantage of the business is inunavoidable decline or where market conditions are deteriorating. This may be because new technology is replacingthe company’s core product or because the market demand is falling. Harvesting is a common strategy in thepharmaceutical industry when a product’s patent is about to expire. Tobacco companies in Western Europe facedwith a falling demand for cigarettes also employ it.
STRATEGIES FOR HARVESTING
Companies pursuing harvesting strategies are willing to lose market share if this increases the cash flow. Cash flowcan be increased in two ways. First, the company can increase operating margins by:
❍ Raising prices
❍ Cutting variable costs
❍ Cutting fixed costs
❍ Focusing on premium market niches
182 STRATEGIC POSITION ASSESSMENT
Second, it can reduce investment by:
❍ Reducing stocks and tightening up on payment terms
❍ Pushing suppliers for extended financing
❍ Reducing fixed assets
Such policies can dramatically increase cash flow quite quickly.
DANGERS IN HARVESTING
The problem with harvesting strategies today is that excessive efforts to increase margins and prune investment canlead to very rapid losses of market share. If that occurs the market value of the business may fall precipitously. Insuch a situation selling off the business may generate a greater value than harvesting.
Successful harvesting will often require tactical investments in marketing and promotion to discourage new entry. Itwill also mean ensuring that value and service levels do not fall below market expectations, especially in those nicheswhere premium pricing is possible. To compare the value created by harvesting versus divestment, managementneeds to project the cash flow from harvesting under realistic competitive conditions.
MAINTAIN
For some strategic business units an appropriate objective is to maintain market share. This objective is different fromharvesting, where management normally accepts that market share will erode. On the other hand, managementdoes not aim at a more aggressive strategy of market share growth. The conditions for a maintenance strategyare: (1) the business is earning healthy economic profits and marginal investments earn a return exceeding theunit’s cost of capital, (2) the market is not expected to decline over the foreseeable future and the business has awell-established competitive position, (3) the market is dominated by only a small number of producers – usuallyno more than two or three – and (4) there are significant barriers to new entry.
In this type of market, a competitive equilibrium or implicit collusion often occurs. Each major competitor knowsthat an effort to increase market share will lead to a rapid response from competitors and prices and profits willtumble. Competitors earn higher profits by accepting the status quo. Such behaviour is apparent, for example, inUK detergents, where Unilever and Procter & Gamble have shared the market approximately equally for decades.
STRATEGIES FOR MAINTENANCE
The main objective in a maintenance strategy is to avoid price competition. Price competition is always the mostdamaging in its effects on value creation. For example, a price cut of 5 per cent for a company with a pre-taxoperating margin of 8 per cent would see its profits drop by almost two-thirds. Price wars are what competitorsfear most in these mature oligopolistic markets.
It is important for the established players to maintain barriers to entry since new competitors could quickly gainmarket share. Because lowering price is so unattractive for the incumbents, high levels of advertising and marketing
STRATEGIC OBJECTIVES 183
support are often the best way to deter entry. Advertising and marketing are normally fixed costs and so offer thebiggest competitors economies of scale that newcomers cannot match. In contrast, price cutting is like a variablecost: the bigger the company, the more it loses. A 5 per cent price cut costs a £40 million business, £2 million offits bottom line; a £4 million business on the other hand, loses only £0.2 million.
Besides high levels of marketing expenditures, companies also need to maintain a focus on innovation. Unless theykeep their products or services up to date they will face market share erosion by either current competitors or newentrants. Maintaining market share does therefore require considerable proactivity from the incumbents to maintainthe current position and keep out entrants.
Market signalling is another feature of a maintenance strategy. Signalling is defined as the selective communication ofinformation to competitors designed to influence competitors’ perceptions and behaviour in order to provoke oravoid certain types of action.[6] Signalling can be used to deter competitive entry. Procter & Gamble has developeda formidable reputation for defending its markets as this classic example shows.
Clorox long dominated the bleach segment, a relatively small niche of the consumer soaps and detergentsmarket. In 1990 it decided to extend into the mainstream US detergents market which was led by Procter &Gamble. Before Clorox’s new product was even launched Procter & Gamble rolled out its Tide With Bleach,employing a massive promotional campaign. Clorox soon had to withdraw, nursing losses estimated at $50million.
Signalling can also be used to discipline current players from aggressive moves. Alcoa, for example, deliberatelyover-invested in order to have available capacity to flood the market if the competitor did not toe the line onacceptable behaviour. Finally, it can be used to encourage mutual efforts to improve industry profitability. Forexample, the UK petrol market is characterised by price leadership. Before raising prices, the leader firm usually teststhe water and builds a consensus by press releases that announce ‘unsatisfactory industry margins’ and ‘expectedprice increases’.
GROWTH
The first three strategies – divest, harvest and maintain – should ensure that investors’ funds are not wasted oneconomically unattractive investments. But to create outstanding returns for shareholders, it is essential to possessgrowth businesses. Investing to achieve high growth makes sense as long as the business can earn a return on theinvested capital that exceeds its cost of capital. As long as this return is achieved, the faster the business grows, thegreater the value that is created for shareholders.
Such growth opportunities depend primarily on the firm possessing a competitive advantage. Second, it dependson the attractiveness of the market. The most obvious high-growth opportunities are to be found in the north eastquadrant of Figure 5.11. With high-growth businesses it is particularly important not to confuse profit or cash flowwith value creation. Companies maximising value creation opportunities in high-growth markets will always havelower cash flows and generally lower profits in the early years than what could be achieved by reining back ongrowth. But holding back on opportunities for value creating investments to boost current cash flow and profits isa short-term strategy that erodes the value of the business and frequently means that the company fails to achievethe critical mass to be viable in the long-run.
184 STRATEGIC POSITION ASSESSMENT
STRATEGIES FOR GROWTH
In Chapter 4 we presented strategies for growth in terms of the growth ladder. The ladder has nine rungs:
1. Increasing customer retention
2. Growing the share of the customer’s expenditure
3. Gaining new customers
4. Developing new products and services
5. Entering new markets
6. Developing new distribution channels
7. Growing internationally
8. Acquisitions and alliances
9. Growth outside industry boundaries
DILEMMAS IN GROWTH STRATEGIES
Marketing managers often appear to think that any strategy that achieves growth is successful. Of course, this isnonsense. Anyone can grow sales if the price is low enough or if enough is spent on advertising and promotion.What the company needs is value-generating growth. These are additional sales that increase the net present valueof the business. In other words, the additional sales must cover the investments, costs and the cost of capitalincurred to generate the growth.
If marketers are often too optimistic about the value of growth, accounting-orientated management can be tooconservative. One of the characteristics of many of today’s markets is network effects, which suggest increasingrewards to companies that move fast and decisively in growth markets. A product has network effects or‘externalities’ if the value to any one user rises with the total number of users of the product. A classic exampleis the telephone.[7] If you are the only owner of one in the country it is not much use. The more people withphones, the more valuable it is to the user. Such network externalities are a marked characteristic of many of today’sinformation-based industries.
Network effects mean that the first company to gain a big installed base sets the standard that makes it difficultto displace. New customers want to buy the product that everyone else has. For strategy this has a numberof implications. First, it stresses the importance of gaining a first-mover advantage. It also highlights the role ofmarketing and advertising to make customers aware that your product is going to be the leader. Often, too, thereare opportunities to form alliances to boost credibility in the future leadership of the product. Most controversially,it suggests the importance of penetration pricing at the early stages of these markets. It is worth subsidising earlyadopters through low prices. Microsoft, for example, gave its browser away free to get people to adopt it, countingon establishing it as the new standard.
Strategies like penetration pricing are risky. It will normally mean losing money in the early years with the hope ofbecoming the next Microsoft and recouping it many times after it becomes the dominant player. Companies thatare insufficiently aggressive in their marketing and pricing are still likely to lose money in the early years and loseeverything in the long run.

STRATEGIC OBJECTIVES 185
ENTER
In today’s rapidly changing environment, creating value is not just about rationalising uneconomic businesses andimproving current activities, it is increasingly about innovation. Innovation can take several forms:
❍ New products. Sometimes these are blockbuster innovations, but more often they are new product lines,product improvements and line extensions, all of which can create value by adapting the company to achanging market.
❍ New marketing concepts. These are solutions that meet new customer needs, without significanttechnical innovation being required. Examples are Diet Coke, which met the desire for low-calorie drinks,and Flora margarine, which met the desire for cholesterol-free spreads.
❍ New marketing strategies. These are innovative ways of marketing products or services. For example,Castrol became the leading machine lubricant by charging workshops a monthly fee for maintaining theirmachinery rather than charging per litre of oil.
❍ New processes. These are operational innovations that allow the same products to be delivered at lowercost or with higher quality. For example, Pilkington’s invention of the float-glass process enabled it tocapture much of the market for auto-glass.
❍ New markets. A company can achieve new sources of growth through exploiting new markets or marketsegments. Swatch, for example, developed the market for watches as fashion accessories, significantlyincreasing the size of the total watch market.
❍ New channels of distribution. Innovations in distribution channels are the most significant characteristicof the information age. Information technology and particularly the Internet have transformed industryafter industry. Dell Computer Corporation catapulted to leadership in PCs in the 1990s by cutting out thetraditional dealer and interacting directly with consumers using the telephone or Internet. Direct Line didthe same in insurance, Amazon in book retailing, eBay in auctions, First Direct in banking, Google insearch engines – the list is continually expanding.
CRITERIA FOR ENTRY DECISIONS
There are three main criteria for deciding upon which activities to start or markets to enter. The first is theanticipated market attractiveness. As described above, this means forecasting the size of the market, its growth rate,the competitive structure of the market, in particular the intensity of competition and the power of the buyers,cyclical factors and the nature of the risks involved. If the industry is not going to be profitable on average – asindustries like steel, airlines and textile manufacturing have been in the past – creating shareholder value is going tobe very difficult, however good the company is. It is much better to swim with the tide than against it.
The second, and most important, criteria for entry is the firm’s ability to create a sustainable competitive advantage.This means achieving a low cost structure or differentiated offering that will lead to customer preference, and apreference that can be sustained when competitors inevitably seek to emulate it. This base upon which such acompetitive advantage rests is, of course, the firm’s resources: the quality of the tangible and intangible assets itpossesses, the skills and knowledge of its staff, and the drive and adaptability emanating from its organisational
186 STRATEGIC POSITION ASSESSMENT
culture. Most successful innovations are, not surprisingly, based on leveraging the firm’s current resources to enternew markets or develop new positioning strategies.
The third requirement is overcoming the entry barriers to the industry. Attractive markets are usually characterisedby high entry barriers in the form of patents, capital requirements, economies of scale, strong brands or access todistribution channels. Their common feature is that they drive up the initial investment required to establish a viableposition in the market. This means that the firm must have a really sizeable and sustainable competitive advantageto generate the margins that will achieve an economic return on this investment. Alongside barriers to entry, theprospective entrant must evaluate the likelihood of retaliation on the part of the incumbents, who will seek to deterentry. For example, the major airlines flying the London–North America route successfully used price cuts to drivethe new discounter, Laker Airways, out of the market in 1982.
In general, the fiercest retaliation occurs when the total market is not growing. The odds are better for entrants ingrowing markets because increased sales are gained without necessarily reducing those of competitors. In maturemarkets, acquisition can be a more effective means of gaining entry since it does not add to industry capacity.
CREATING OPTIONS
Most managers do not understand the importance investors attach to a firm’s ability to enter attractive markets.Much the greatest part of a company’s equity value is based upon investors’ expectations about the company’sfuture products and markets rather than their current activities. As we have seen, on average cash flow over thenext four years accounts for less than 20 per cent of a company’s share price.[8] What investors are valuing aretheir expectations about long-term cash flow, which depends upon the options the firm has available and its abilityto exploit these options.
Management accounting has not kept pace with our knowledge about how investors value companies. Accountingstill overestimates short-term cash flows. It emphasises today’s profit earners at the expense of tomorrow’s. As wediscussed in Chapter 4, the standard discounted cash flow analysis accountants use to evaluate investment projectsdiscourages many new opportunities by overemphasising the risk and cost of failure. Financial options theory haspresented a more effective way of judging new entry proposals. This approach reflects that entry decisions are notbig, once-and-for-all choices, but rather a series of incremental investments, each one contingent upon the successof the previous one. If the feedback about the entry strategy is not promising, the company can usually pull outwithout further investment. Initial investments are options that allow the firm the opportunity to make subsequentinvestments if prospects look exciting at the end of the initial stage. Investors are valuing companies in terms ofwhether they have developed strategic positions to take up options in tomorrow’s attractive markets.
SUMMARY
1. To formulate a strategic plan management must first understand the firm’s current position and the forcesshaping the future of the industry and its competitive position within it. This is the role of the strategicposition assessment.
2. The first task is to assess whether management is currently adding value. This is often difficult to answerdirectly. Instead it is necessary to determine the strategic value drivers that act as lead indicators to long-term
NOTES ON CHAPTER 5 187
value creation. The balanced scorecard is a useful framework for monitoring performance on these keycapabilities.
3. The success or failure of a business is caused by a combination of external and internal factors. The first isthe attractiveness of the firm’s market; the second is its competitive advantage. Competitive advantage isgenerally the more important determinant of value creation. Competitive advantage is a consequence of thestrength of the firm’s strategic value drivers.
4. Value is determined by future cash flow, so it is the future attractiveness of the market and the futurecompetitive advantage that must be projected. The purpose of a strategy is to shift the business towardsattractive markets and build a sustainable differential advantage.
5. The strategic position assessment provides the information for value-based planning. This is a framework forrestructuring the business to optimise its value for shareholders.
6. The end result of the value-based plan is that each business unit will be assigned a broad strategic objectivethat will form the basis of the marketing strategy. These objectives are divest, harvest, maintain, grow or enter.
REVIEW QUESTIONS
1. How do you assess whether the management team has created value during the past year?2. Discuss the role of strategic value drivers in determining and assessing business performance.3. How might a company use the balanced scorecard in its planning process?4. What are the factors that shape a business’s potential to generate value for shareholders?5. Show how the McKinsey pentagon can be used to restructure a business with the goal of creating greater
value for shareholders.6. What determines the choice of strategic objective appropriate for a business unit?
NOTES ON CHAPTER 5
[1] Robert S. Kaplan and David P. Norton, The Balanced Scorecard, Boston, MA: Harvard Business School Press,1996. See also: Robert S. Kaplan and David P. Norton, Using the balanced scorecard as a strategic managementsystem, Harvard Business Review. Boston: Jul./Aug. 2007. Vol. 85, Iss. 7, 8, p. 150.
[2] The literature on strategy is replete with matrices which similarly try to characterise the attractiveness andcompetitive positions of business units. The best known are the Boston Consultancy Group’s growth-share matrix,the General Electric matrix, the Shell directional policy matrix and the Marakon Associates strategic matrix. Fora review see, for example, Gerry Johnson and Kevan Scholes, Exploring Corporate Strategy, London: Prentice Hall,1999.
[3] The following sections draw on the work of James M. Taggart, Peter W. Kontes and Michael C. Mankins, TheValue Imperative: Managing Superior Shareholder Returns, New York: Free Press, 1994, pp. 85–154.
[4] Doug Garr, IBM Redux: Lou Gerstner and the Business Turnaround of the Decade, New York: HarperBusiness,1999.
[5] See Tom Copeland, Tim Koller and Jack Murrin, Valuation: Measuring and Managing the Value of Companies, 2ndedn, New York: John Wiley & Sons, Inc., 1996, pp. 327–358.

188 STRATEGIC POSITION ASSESSMENT
[6] For a review of signalling see O. Heil and T.S. Robertson, Towards a theory of competitive market signalling,Strategic Management Journal 12, 1991, 403–454.
[7] For a good discussion of network effects and their strategic implications in information-based businesses see C.Shapiro and H. Varian, Information Rules, Boston, MA: Harvard Business School Press, 1999.
[8] See Kris Butler, Stephan Leithner et al., What is the market telling you about your strategy?, McKinsey Quarterly,no. 3, 1999, 98–109. See also: Marc H. Goedhart, Bin Jiang and Timothy Koller, The irrational component of yourstock price, McKinsey Quarterly, July 2006.
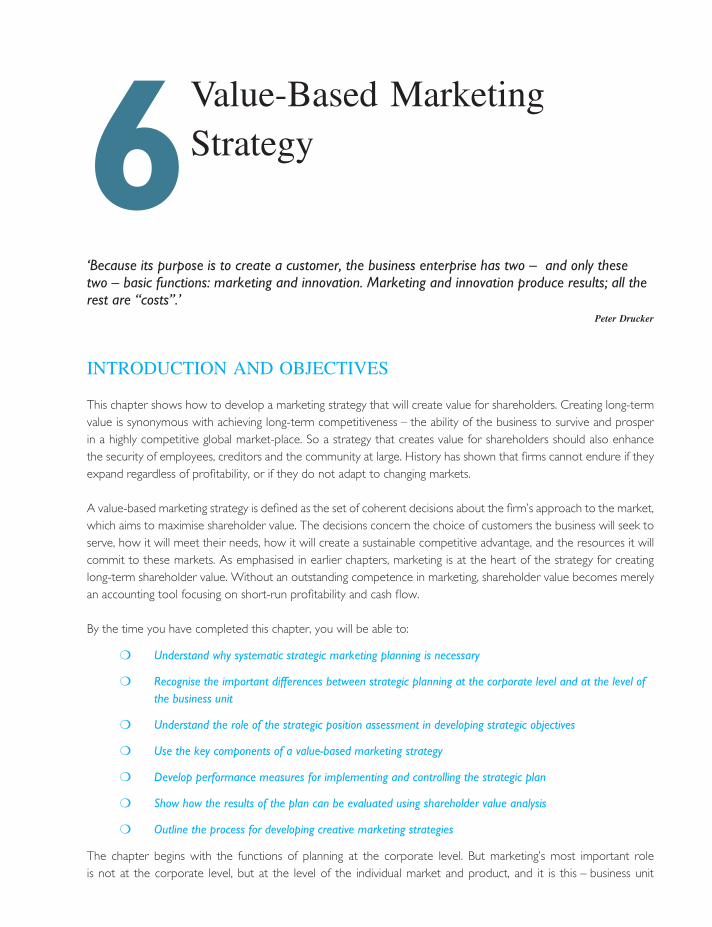
6Value-Based MarketingStrategy
‘Because its purpose is to create a customer, the business enterprise has two – and only thesetwo – basic functions: marketing and innovation. Marketing and innovation produce results; all therest are ‘‘costs’’.’
Peter Drucker
INTRODUCTION AND OBJECTIVES
This chapter shows how to develop a marketing strategy that will create value for shareholders. Creating long-termvalue is synonymous with achieving long-term competitiveness – the ability of the business to survive and prosperin a highly competitive global market-place. So a strategy that creates value for shareholders should also enhancethe security of employees, creditors and the community at large. History has shown that firms cannot endure if theyexpand regardless of profitability, or if they do not adapt to changing markets.
A value-based marketing strategy is defined as the set of coherent decisions about the firm’s approach to the market,which aims to maximise shareholder value. The decisions concern the choice of customers the business will seek toserve, how it will meet their needs, how it will create a sustainable competitive advantage, and the resources it willcommit to these markets. As emphasised in earlier chapters, marketing is at the heart of the strategy for creatinglong-term shareholder value. Without an outstanding competence in marketing, shareholder value becomes merelyan accounting tool focusing on short-run profitability and cash flow.
By the time you have completed this chapter, you will be able to:
❍ Understand why systematic strategic marketing planning is necessary
❍ Recognise the important differences between strategic planning at the corporate level and at the level ofthe business unit
❍ Understand the role of the strategic position assessment in developing strategic objectives
❍ Use the key components of a value-based marketing strategy
❍ Develop performance measures for implementing and controlling the strategic plan
❍ Show how the results of the plan can be evaluated using shareholder value analysis
❍ Outline the process for developing creative marketing strategies
The chapter begins with the functions of planning at the corporate level. But marketing’s most important roleis not at the corporate level, but at the level of the individual market and product, and it is this – business unit
190 VALUE-BASED MARKETING STRATEGY
planning – that forms the core of the chapter. A marketing plan is based first on the strategic position assessment,which evaluates the potential of the business unit and the broad direction by which shareholder value may becreated. The strategic position assessment then leads to a definition of the unit’s marketing objective. The chapterthen unfolds the key components of strategy: the strategic focus, customer targets, competitor targets, core strategyand the marketing mix.
Once the strategy is formulated, management needs relevant performance indicators to ensure that the plan is kepton track over time. Finally, the financial implications of the proposed plan have to be tested through a shareholdervalue analysis to assess whether the marketing strategy looks likely to maximise value. The last section of the chapterlooks at the dynamics of developing a marketing plan. It looks at how a cross-functional team can best work tocome up with creative ideas to capitalise on the growth opportunities available and create a differential advantage.
WHY STRATEGIC MARKETING PLANS?
Developing a systematic marketing strategy is important, not because it will plot the future – no one can do that. It isimpossible to forecast the future: there are too many unknowns in society, technology, economics and competitivereactions, to predict how the market will react to your company’s efforts. The real functions of strategic marketplanning are:
1. Facilitating the change process2. Forcing managers to ask the right questions3. Motivation and control4. Balancing the tyranny of accountants
FACILITATING THE CHANGE PROCESS
The process of developing a marketing strategy forces management to objectively confront the current performanceof the business today and its likely performance in the future. The remorseless pressures of day-to-day operationalproblems often hide the real fundamental issues facing the company. The plan starkly reveals whether the business hasbeen successful in generating value for shareholders, in satisfying customers, and creating a competitive advantage inthe market. Strategic marketing planning also provides a vehicle for piloting change. It sets the framework for thinkingabout the future, developing more ambitious goals and identifying new options (see box, ‘destroyyourbusiness.com’).Knowing that the business has a clear direction can invigorate employees and instil confidence among investors.
FORCING MANAGERS TO ASK THE RIGHT QUESTIONS
Managers cannot predict the future but they can plan for it. Most products that fail do not fail because of events thatcould not have been anticipated. Rather they fail because managers have not effectively analysed their customersand competitors. The marketing plan ensures that managers ask the key questions and do the vital analyses thatdetermine success or failure. These centre on understanding the needs of customers, evaluating the competition andanticipating their likely strategies, and ensuring that the company can communicate a genuine competitive advantage.When managers have analysed the key questions, they are in a much stronger position to react effectively to theunexpected events that inevitably occur.

WHY STRATEGIC MARKETING PLANS? 191
destroyyourbusiness.com
Few were surprised when Fortune magazine chose Jack Welch, chief executive of General Electric, as its‘businessman of the century’. Since taking over in 1981 he had increased the value of the company from $14 bnto more than $400 bn, quadrupled sales to over $100 bn and had grown profits six times to $9.3 bn.
Despite the applause, at the end of 1999, only a year from retirement, Welch was still not satisfied and wantedmore. The particular challenge he identified was e-business, both as an opportunity and a threat to GE’s dominance.His response was to launch a major new initiative called ‘destroyyourbusiness.com’. Welch believed that only bygetting his managers to imagine the end of their current businesses could they really create something radical andnew enough to survive into the next century.
The initiative was based on the three key elements that lay at the heart of Welch’s transformation of GE inearlier decades. It was iconoclastic – nothing was sacred: products, channels, practices and systems were all up forchallenge. It sought to learn and borrow from the best practices of other leading edge companies. GE envoys whowent out to study the new e-business pioneers came back with alarming demonstrations of how GE was still tooslow, too internally focused and insufficiently customer-orientated for competing in ‘Internet-time’. Last, the initiativesought to make determined use of GE’s collective effort and intellect. A new set of ‘workouts’ was organised tostimulate all employees to challenge senior executives on current practices and to make recommendations fortransforming the business and creating new ones. His strategy helped propel GE into what continues to be one ofthe world’s most successful companies.
MOTIVATION AND CONTROL
Value-based marketing is based on two principles. First, the task of management is to create long-run value forshareholders. Second, its accomplishment depends on building relationships with customers founded on satisfyingtheir needs more effectively than competitors. The strategic marketing plan brings these two principles together.The objective and test of the strategy is its ability to create shareholder value. The process of strategy formulationfocuses on choosing profitable customers and developing a value proposition that will make them want to dobusiness with the company rather than competitors.
The structure of the plan aims at ensuring managers do not pursue growth strategies that are not value enhancing.At the same time it encourages managers to invest heavily in growth if this will create long-run profits in the future.Investors are quite happy to forgo cash and profits today if they believe the company is investing in a strategythat offers great long-run potential. In particular, value-based planning should discourage arbitrary cuts in marketingbudgets to boost short-term profits and cash flow. Investors look through such cuts and often react to the movesby selling their shares, knowing that future profitability and competitiveness are being sacrificed.
BALANCING THE TYRANNY OF ACCOUNTANTS
The great majority of company boards spend too much time on the monthly, quarterly and annual budgetsproduced by their accountants. Such a focus leads to an overemphasis on short-term profit performance and anunderemphasis on the viability of the long-term strategy of the business. By delving into the details of the unit’s costsand investments, the board demotivates management, discourages initiative and blankets the entrepreneurship itshould be encouraging, under a stifling layer of bureaucracy.
192 VALUE-BASED MARKETING STRATEGY
The strategic marketing plan asks the board to consider what is important: will the strategy create competitiveadvantage? Will it maximise shareholder value? While accountants look backwards, the strategic plan looks forwards;and it is the future not the past that determines the value of the business.
CORPORATE LEVEL PLANNING
In discussing the strategic planning it is important to distinguish between the corporate or group plan and thebusiness unit plans. Every company consists of business units. In big companies there can be a very large numberof business units: GE, for example, has a number of business units grouped within six main businesses. A businessunit may consist of a group of related products, a market or a distribution channel. Because a business unit serves aspecific group of customers or meets a particular need, a tailored marketing strategy is required. It is the responsibilityof unit managers to develop such a strategy with the aim of maximising long-run economic profits. It is this type ofstrategic planning which is the main focus of this chapter.
The corporate centre does not directly create value for customers; that is the task of the business unit. Butheadquarters can be very costly and absorb a substantial proportion of shareholder value. The largest companiesspend on headquarters costs an average of 1.3 per cent of annual sales. This amounted to an estimated 39 per centof their equity value.[1] Some companies had costs three times this average figure, implying that cutting headquarterscosts could sometimes have a big impact on the share price. How can the corporate centre justify loading thebusiness with this overhead cost burden? Would it not be cheaper if all their functions and staff were allocated tothe business units that have the profit responsibility, and hence the incentive to manage costs more economically?Headquarters add value only if they enable the individual business units to generate additional profits that exceedthe headquarters costs. In principle, headquarters can add value in three ways:
1. Driving organisational change2. Managing the shared value drivers3. Managing the business portfolio
DRIVING ORGANISATIONAL CHANGE
In successful companies, the corporate centre, and in particular the chief executive, is the catalyst for change. He orshe communicates what the organisation’s priorities should be. First of these is the belief that the central objective ofall managers must be to develop strategies that will maximise shareholder value. Second is passionate understandingthat in competitive markets shareholder value is derived from serving the needs of customers more successfully thancompetitors. Only by delighting customers and building strong, continuing relationships with them can the companybuild the revenue stream that is the basis for long-term cash flow. Third is the recognition that in today’s rapidlychanging environment the company must be continually sloughing off strategies that have worked in the past andfinding new opportunities for growth.
An effective corporate centre puts in place a combination of formal and informal mechanisms for driving thesepriorities. The key mechanisms are:
1. The strategic planning process. In successful businesses strategic plans rather than accounting budgetsbecome the focus for managers. Business units are required to develop strategic plans that demonstrate howthey will create long-term value for shareholders rather than short-term profits. Top management also looksto see that these strategic plans are firmly grounded on convincing assumptions about customers’ needs and
CORPORATE LEVEL PLANNING 193
competitor reactions. The plans give management the information to question whether the business unitsare being sufficiently radical in responding to the problems and opportunities being created by today’s rapidlychanging markets and technologies and whether they are creating sufficient growth options.
2. Resource allocation process. The centre is responsible for allocating resources among the business unitsand for creating new businesses and making acquisitions. Over time these decisions will lead to a majorreshaping of the company. Companies that manage for value allocate resources to businesses and newventures when they promise a return that exceeds the cost of capital. There is no rationing problem. It makessense for investors to forgo dividends and bring in new capital if management can earn returns that exceedthe cost of capital. In this case a business is earning a better return than investors could earn if they investedthe money themselves. An effective resource allocation process acts to continually reposition the companytowards markets that have attractive economics (where market conditions allow the average company tomake economic profits) and where the business has a sustainable differential advantage.
3. Performance measurement and compensation. Managers need feedback and incentives that motivatebehaviour consistent with the objectives of creating shareholder value, customer orientation and growth.The first requirement is to give managers of the business units clear responsibility for strategy. As far aspossible, each unit should be able to act as a separate profit centre and have total autonomy over how itbuys, operates and markets its products or services. Ongoing performance will be judged on the balancedscorecard measures, which have been identified as the strategic value drivers. These in turn should be thebasis of the compensation and rewards managers receive.
4. Creating a sense of purpose. In today’s complex, knowledge-intensive organisations strategy is not enough.Employees need a sense of purpose with which they can identify if they are going to be truly committed tothe firm. Increasingly the role of the chief executive is seen as providing this catalyst. Leaders such as RichardBranson of Virgin and Anita Roddick of The Body Shop, for example, articulated strong business philosophies,which created an unusually strong alignment between company and employee beliefs.
MANAGING THE SHARED VALUE DRIVERS
The ability of a multibusiness corporation to outperform a single business firm lies in whether the former can exploiteconomies from sharing resources or from transferring special capabilities which exist in one business to otherbusinesses within the group.
SHARED SERVICES
All multibusiness companies have shared services. Typically these will include accounting and tax, treasury, legal,human resources and information systems. But shared services rarely create a differential advantage for the companyin terms of either lower cost or superior quality. The key problem tends to be a lack of incentive within the centreto reduce costs or to meet the needs of their customers within the business units. The lack of customer focus oftenleads to the units duplicating corporate services. In dealing with corporate services, management needs to answertwo questions. Which services are best done centrally to minimise costs? Which should be decentralised to bestmatch the requirements of their business unit customers? For those services that continue to be offered centrally,management needs to find the least costly way to provide them, subject to quality standards. Sometimes it will bepossible to do this by creating an internal market, in which central services have to ‘sell’ their capabilities to thebusiness units, in competition with independent suppliers.

194 VALUE-BASED MARKETING STRATEGY
LEVERAGING RESOURCES
Much more important for creating shareholder value and, in particular, for creating new growth opportunities, arethe opportunities the centre has to catalyse the transfer of resources across businesses and, indeed, to create newones. As discussed in Chapter 3, every successful business has resources that form the basis of core competencies,giving it unique opportunities for growth and profitability. These resources may be tangible assets such as first-classfactories or equipment, intangible assets such as brands or patents, strategic assets such as licences and naturalmonopolies or finally human resources in the form of highly skilled staff.
The centre can add value in a crucial way by leveraging these resources across its business units. Hamel and Prahaladhave shown how much of the growth of such companies as 3M, Sony, Canon and Honda has been due to the waythey leveraged technical skills across their business units to create entirely new products.[2] For example, a classiccase is how business units at Canon developed core competencies in the early 1990s in precision mechanics, fineoptics and microelectronics (Figure 6.1).
The centre continually encouraged the discovery of new products and markets that can draw on the entire range ofthe company’s skills. This allowed Canon to move into a range of new opportunities from cameras, to calculators,printers, faxes, copiers and so on. For instance, when Canon identified an opportunity in digital laser printers, itcreated a new business unit and gave management the right to raid other units to pull together the required talentin engineering, optics, microelectronics and imaging.
Product
X
X
X
X
X
X
X
X
X
X
X
X
X
X
X
X
X
X
X
X
X
X
X
X
X
X
X
X
X
X
X
X
X
X
X
X
X
X
Precisionmechanics
Fineoptics
Microelectronics
Electronicimaging
Basic camera
Compact fashion camera
Electronic camera
Video camera
Laser printer
Colour printer
Bubble jet printer
Fax
Calculator
Copier
Laser imager
Cell analyser
Excimer laser aligners
Figure 6.1 Deployment of Canon’s Core Competencies. Reprinted by permission of Harvard BusinessSchool Press. From Competing for the Future by Gary Hamel and C.K. Prahalad. Boston, MA 1994, p. 228.Copyright 1994 by the President and Fellows of Harvard College. All rights reserved
CORPORATE LEVEL PLANNING 195
Besides technical skills, marketing assets such as brands and customer relationships are becoming increasinglyimportant sources of leverage across business units. Virgin, for example, has built a brand name symbolisinginnovation and genuine value, which has enabled it to move into businesses as diverse as record shops, airlines, softdrinks, railways, mobile phones and financial services.
To create these dynamic synergies across businesses, top management at the centre has to ask four key questions.First, what are the key strategic value drivers that can be leveraged across units? To preserve the autonomy andresponsibility of business unit managers, the list of such shared drivers should be a short one. To meet the criteriaa resource must offer access to multiple markets. For example, 3M’s special competency in coatings and adhesivesgave it the opportunity to start new markets in Post-it notes, magnetic tape, photographic film and pressure sensitivetapes. Second, it must offer a customer benefit. The Virgin brand name, for instance, gives customers confidence inproducts bearing the name. Third, it must be hard for competitors to copy, otherwise any advantage is short-lived.
The second question is: are these shared resources receiving sufficient investment? Because the benefits of thesevalue drivers are shared there is a disincentive for any individual business to make sufficient investment. Unless thecentre counteracts this, these capabilities will wither away. The third question is: are any of the units exploiting theshared resource to the detriment of the company as a whole? For example, if a shared brand name is used onpoor-value products or promoted using an inappropriate campaign, the residual damage to the company as a wholemay be severe. The centre has to act as the guardian of the shared resource. The final question management atthe centre should ask is whether these resources are leveraged to the fullest extent possible to generate growth.This means encouraging managers to look for growth opportunities in the form of new products and new markets,where the company’s special capabilities can form the basis of a competitive advantage.
Exploiting shared value drivers is an extremely critical function of the centre in the strategic planning process. Unlessthese drivers are proactively and aggressively managed the company will lose major opportunities to create valueand leave itself exposed to new competition.
MANAGING THE BUSINESS PORTFOLIO
The centre shapes the value-creating potential of the company through the way it allocates resources to the businessunits, funds new ones, and makes acquisitions and divestments. A review of the company’s opportunities shouldstart with the strategic position assessment described in Chapter 5. This involves examining each business unit andassessing the future attractiveness of its market and its competitive advantage. This then enables management toproduce, for each business unit, a forecast of its future cash flow and the shareholder value it can create. Whenthe value a unit can create is less than can be obtained from selling or liquidating it, then it is in the shareholders’interest to divest the business. The general rules for managing the business portfolio are:
1. Invest in strategies that increase shareholder value. This then puts the onus on managers to look forattractive markets, to focus on developing differential advantages and testing that their plans create cash flowwith a positive net present value.
2. Encourage managers to look for new growth opportunities. The centre should act as a catalyst challengingbusiness unit managers to explore opportunities on each rung of the growth ladder (see Chapter 4):increasing customer retention, growing share of customer wallets, winning new customers, and developing

196 VALUE-BASED MARKETING STRATEGY
new products and distribution channels. They should also be triggering the creation of new business units totake advantage of emerging opportunities that build on key value drivers within the current business.
3. Fund value-creating acquisitions and strategic alliances. Not all new market opportunities can be exploitedthrough internal development; sometimes it is faster or more economic to acquire or make alliances withother companies. The role of the centre is to help the search for candidates that may exploit the firm’sstrategic value drivers.
4. Divest businesses that cannot create value for shareholders. When, even after restructuring, a businessunit looks incapable of generating value, management should divest it. Since the initiative is unlikely to comefrom the business unit managers themselves, this is a task for the centre.
THE CORPORATE CENTRE: DIFFERENT APPROACHES
The role of the corporate centre varies considerably across companies. Michael Porter identified four types of roles.
1. Portfolio management. Portfolio management is where the parent company simply acquires a group ofcompanies that it believes are attractive and allows them to continue operating autonomously, linked onlythrough an internal capital market. This is often termed a holding company structure. One successful examplehas been Berkshire Hathaway. Holding companies will normally have a very small corporate centre focusedon monitoring financial performance.
2. Restructuring. While holding companies like Berkshire Hathaway buy well-managed companies, others,like private equity group Apax Partners and US leveraged buy-out operators such as KKR, createdvalue by restructuring poorly-run businesses. Here the centre intervenes to change managers, dispose ofunderperforming assets, cut costs and restructure liabilities.
3. Transfer skills. Some companies have corporate centres that seek to add value by transferring skills acrossbusiness units. Philip Morris has focused on creating competitive advantage in newly acquired businesses bybringing in people with proven marketing and branding skills. To be successful this policy requires similaritiesbetween businesses such that skills learned in one market will be valuable in the new one.
4. Sharing activities. The most important sources of value arise when the centre can exploit economies ofscope from shared strategic value drivers such as brands, technical resources, R&D, distribution and servicenetworks. Porter suggests such sharing is facilitated by:
❍ a strong sense of shared purpose
❍ a mission statement that emphasises integrating business level strategies
❍ incentives for cooperation across businesses
❍ inter-business task forces and other vehicles for cooperation
Changes in the role of the centre in leading-edge companies have paralleled changes in management more generally.This is a shift away from a controlling role to one more about encouraging and supporting. The key features of thetransition can be summarised under four headings:
❍ A view of corporate headquarters less as the apex of the pyramid and more as a support service for thebusiness
❍ Less emphasis on formal systems and techniques, and more on relationships and informal interaction
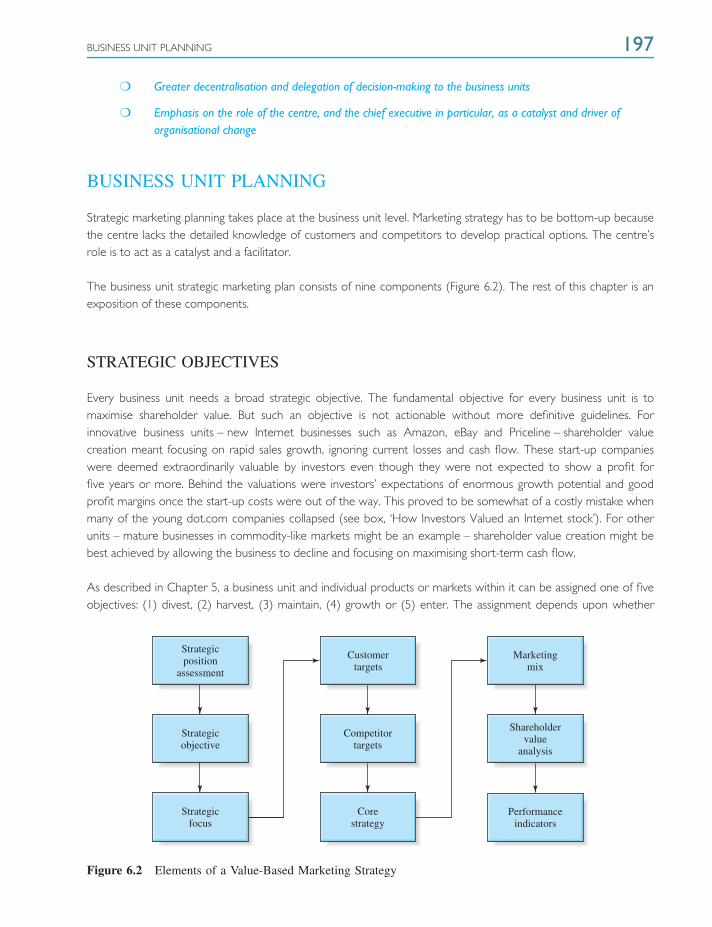
BUSINESS UNIT PLANNING 197
❍ Greater decentralisation and delegation of decision-making to the business units
❍ Emphasis on the role of the centre, and the chief executive in particular, as a catalyst and driver oforganisational change
BUSINESS UNIT PLANNING
Strategic marketing planning takes place at the business unit level. Marketing strategy has to be bottom-up becausethe centre lacks the detailed knowledge of customers and competitors to develop practical options. The centre’srole is to act as a catalyst and a facilitator.
The business unit strategic marketing plan consists of nine components (Figure 6.2). The rest of this chapter is anexposition of these components.
STRATEGIC OBJECTIVES
Every business unit needs a broad strategic objective. The fundamental objective for every business unit is tomaximise shareholder value. But such an objective is not actionable without more definitive guidelines. Forinnovative business units – new Internet businesses such as Amazon, eBay and Priceline – shareholder valuecreation meant focusing on rapid sales growth, ignoring current losses and cash flow. These start-up companieswere deemed extraordinarily valuable by investors even though they were not expected to show a profit forfive years or more. Behind the valuations were investors’ expectations of enormous growth potential and goodprofit margins once the start-up costs were out of the way. This proved to be somewhat of a costly mistake whenmany of the young dot.com companies collapsed (see box, ‘How Investors Valued an Internet stock’). For otherunits – mature businesses in commodity-like markets might be an example – shareholder value creation might bebest achieved by allowing the business to decline and focusing on maximising short-term cash flow.
As described in Chapter 5, a business unit and individual products or markets within it can be assigned one of fiveobjectives: (1) divest, (2) harvest, (3) maintain, (4) growth or (5) enter. The assignment depends upon whether
Strategicposition
assessment
Customertargets
Marketingmix
Shareholdervalue
analysis
Performanceindicators
Competitortargets
Corestrategy
Strategicobjective
Strategicfocus
Figure 6.2 Elements of a Value-Based Marketing Strategy

198 VALUE-BASED MARKETING STRATEGY
investment in the unit is likely to generate a positive net present value. The strategic determinants of this are theattractiveness of its market and, most important of all, the possession of a competitive advantage.
Pruning the Portfolio
Low volume products may be dropped in order to create the slack necessary to develop and launch a new product.Current examples would be the frozen food market in the UK, which is generally viewed as being in long termdecline. Although there are still large numbers of consumers who buy frozen food, Unilever announced in 2005 thatit would drop its Bird’s Eye brand which, although turning over £500 million per year, was seen as being a drain onresources that would hinder its growth into growth markets of the future. Bird’s Eye was eventually sold to a privateequity firm in 2006 for £1.2 billion.
Taken from: Baker, MJ and Hart, SJ, Product Strategy and Management, 2nd edition, Pearson, 2007, p. 40
Consultants and academics have come up with various matrices to portray businesses along these two dimensions.The best known include the Boston Consulting Group, the GE–McKinsey matrix and the Arthur D. Little model.[3]
Our approach is the strategic characterisation matrix, described in Chapter 5 and illustrated in Figure 6.3. Theprevious models were presented as capital rationing models: cash had to be funnelled from ‘cash cow’ businessunits to ‘stars’ and ‘problem children’. But today, companies geared to shareholder value recognise that there areno capital constraints if a business has strategies that will generate returns above the cost of capital. External financeis available to fund any and all businesses capable of delivering economic profits.
What most of these matrices agree on is that business units in attractive markets and with a strong competitiveposition are much more likely to generate good returns than units without an attractive market or competitivestrength. Figure 6.3 suggests possible strategic objectives depending on the position of the business unit on the twodimensions. The objectives are clear at the two extremes; where they are more ambiguous is when one dimension
High
Divest/growth
Harvest
Harvest
Average
MediumMarketattractiveness
Competitive position
Low
Divest
Disadvantaged Advantaged
GrowthGrowth/
enter
GrowthMaintain
Maintain
Figure 6.3 Strategic Objectives and the Strategic Characterisation Matrix
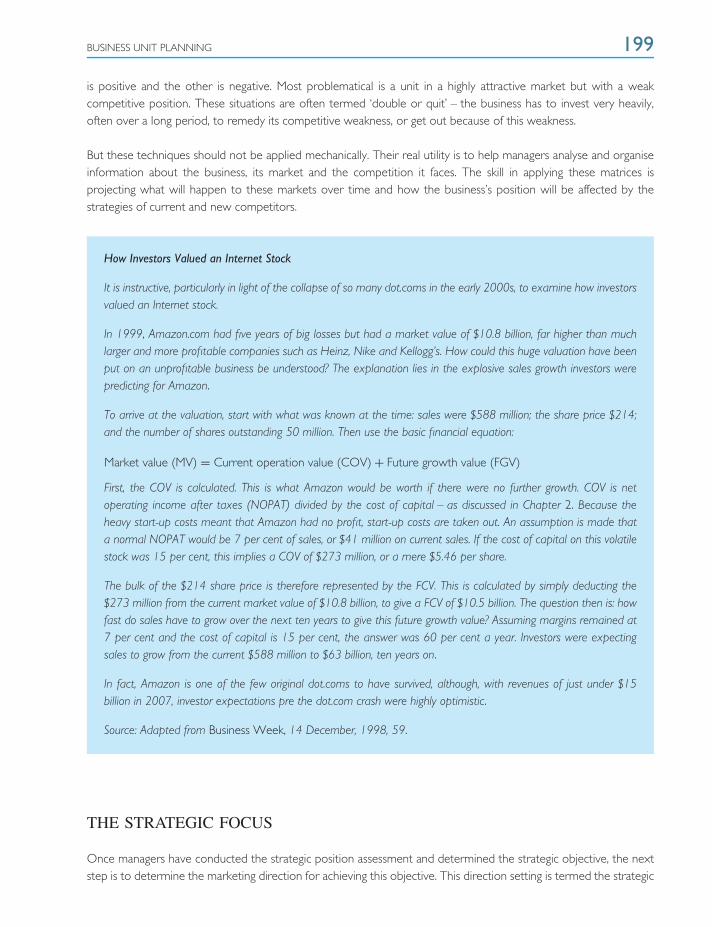
BUSINESS UNIT PLANNING 199
is positive and the other is negative. Most problematical is a unit in a highly attractive market but with a weakcompetitive position. These situations are often termed ‘double or quit’ – the business has to invest very heavily,often over a long period, to remedy its competitive weakness, or get out because of this weakness.
But these techniques should not be applied mechanically. Their real utility is to help managers analyse and organiseinformation about the business, its market and the competition it faces. The skill in applying these matrices isprojecting what will happen to these markets over time and how the business’s position will be affected by thestrategies of current and new competitors.
How Investors Valued an Internet Stock
It is instructive, particularly in light of the collapse of so many dot.coms in the early 2000s, to examine how investorsvalued an Internet stock.
In 1999, Amazon.com had five years of big losses but had a market value of $10.8 billion, far higher than muchlarger and more profitable companies such as Heinz, Nike and Kellogg’s. How could this huge valuation have beenput on an unprofitable business be understood? The explanation lies in the explosive sales growth investors werepredicting for Amazon.
To arrive at the valuation, start with what was known at the time: sales were $588 million; the share price $214;and the number of shares outstanding 50 million. Then use the basic financial equation:
Market value (MV) = Current operation value (COV) + Future growth value (FGV)
First, the COV is calculated. This is what Amazon would be worth if there were no further growth. COV is netoperating income after taxes (NOPAT) divided by the cost of capital – as discussed in Chapter 2. Because theheavy start-up costs meant that Amazon had no profit, start-up costs are taken out. An assumption is made thata normal NOPAT would be 7 per cent of sales, or $41 million on current sales. If the cost of capital on this volatilestock was 15 per cent, this implies a COV of $273 million, or a mere $5.46 per share.
The bulk of the $214 share price is therefore represented by the FCV. This is calculated by simply deducting the$273 million from the current market value of $10.8 billion, to give a FCV of $10.5 billion. The question then is: howfast do sales have to grow over the next ten years to give this future growth value? Assuming margins remained at7 per cent and the cost of capital is 15 per cent, the answer was 60 per cent a year. Investors were expectingsales to grow from the current $588 million to $63 billion, ten years on.
In fact, Amazon is one of the few original dot.coms to have survived, although, with revenues of just under $15billion in 2007, investor expectations pre the dot.com crash were highly optimistic.
Source: Adapted from Business Week, 14 December, 1998, 59.
THE STRATEGIC FOCUS
Once managers have conducted the strategic position assessment and determined the strategic objective, the nextstep is to determine the marketing direction for achieving this objective. This direction setting is termed the strategic
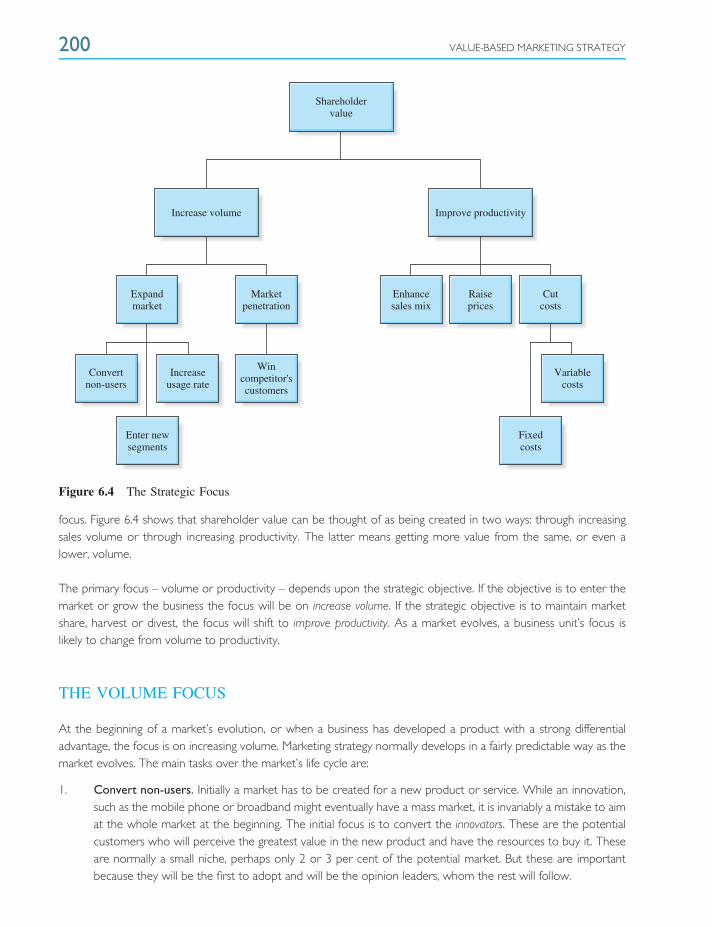
200 VALUE-BASED MARKETING STRATEGY
Shareholdervalue
Improve productivity
Enhancesales mix
Raiseprices
Cutcosts
Variablecosts
Fixedcosts
Increase volume
Increaseusage rate
Wincompetitor'scustomers
Marketpenetration
Expandmarket
Convertnon-users
Enter new segments
Figure 6.4 The Strategic Focus
focus. Figure 6.4 shows that shareholder value can be thought of as being created in two ways: through increasingsales volume or through increasing productivity. The latter means getting more value from the same, or even alower, volume.
The primary focus – volume or productivity – depends upon the strategic objective. If the objective is to enter themarket or grow the business the focus will be on increase volume. If the strategic objective is to maintain marketshare, harvest or divest, the focus will shift to improve productivity. As a market evolves, a business unit’s focus islikely to change from volume to productivity.
THE VOLUME FOCUS
At the beginning of a market’s evolution, or when a business has developed a product with a strong differentialadvantage, the focus is on increasing volume. Marketing strategy normally develops in a fairly predictable way as themarket evolves. The main tasks over the market’s life cycle are:
1. Convert non-users. Initially a market has to be created for a new product or service. While an innovation,such as the mobile phone or broadband might eventually have a mass market, it is invariably a mistake to aimat the whole market at the beginning. The initial focus is to convert the innovators. These are the potentialcustomers who will perceive the greatest value in the new product and have the resources to buy it. Theseare normally a small niche, perhaps only 2 or 3 per cent of the potential market. But these are importantbecause they will be the first to adopt and will be the opinion leaders, whom the rest will follow.
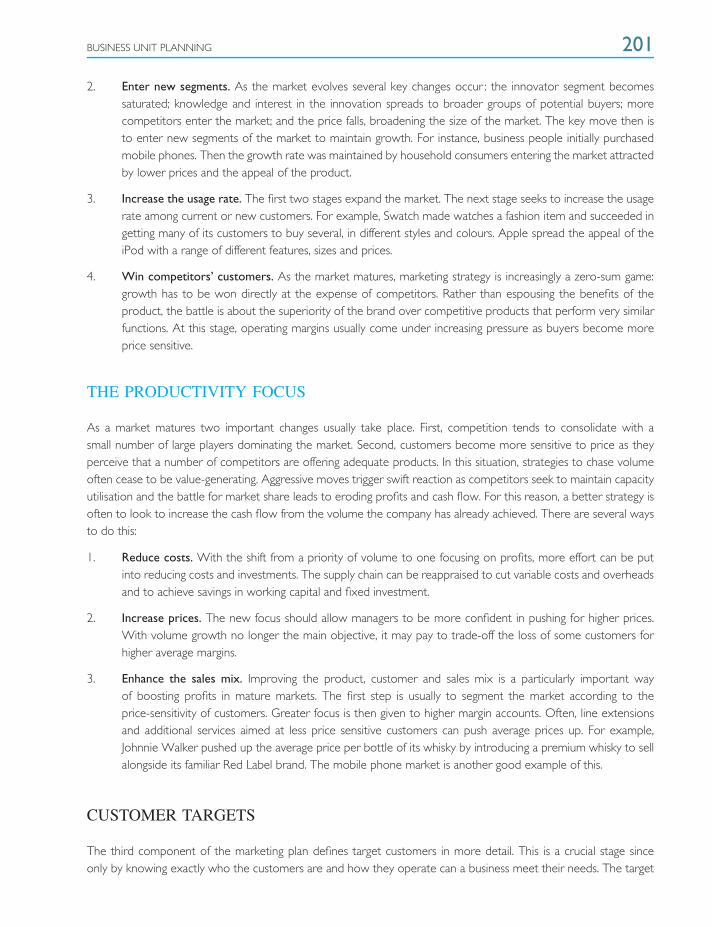
BUSINESS UNIT PLANNING 201
2. Enter new segments. As the market evolves several key changes occur : the innovator segment becomessaturated; knowledge and interest in the innovation spreads to broader groups of potential buyers; morecompetitors enter the market; and the price falls, broadening the size of the market. The key move then isto enter new segments of the market to maintain growth. For instance, business people initially purchasedmobile phones. Then the growth rate was maintained by household consumers entering the market attractedby lower prices and the appeal of the product.
3. Increase the usage rate. The first two stages expand the market. The next stage seeks to increase the usagerate among current or new customers. For example, Swatch made watches a fashion item and succeeded ingetting many of its customers to buy several, in different styles and colours. Apple spread the appeal of theiPod with a range of different features, sizes and prices.
4. Win competitors’ customers. As the market matures, marketing strategy is increasingly a zero-sum game:growth has to be won directly at the expense of competitors. Rather than espousing the benefits of theproduct, the battle is about the superiority of the brand over competitive products that perform very similarfunctions. At this stage, operating margins usually come under increasing pressure as buyers become moreprice sensitive.
THE PRODUCTIVITY FOCUS
As a market matures two important changes usually take place. First, competition tends to consolidate with asmall number of large players dominating the market. Second, customers become more sensitive to price as theyperceive that a number of competitors are offering adequate products. In this situation, strategies to chase volumeoften cease to be value-generating. Aggressive moves trigger swift reaction as competitors seek to maintain capacityutilisation and the battle for market share leads to eroding profits and cash flow. For this reason, a better strategy isoften to look to increase the cash flow from the volume the company has already achieved. There are several waysto do this:
1. Reduce costs. With the shift from a priority of volume to one focusing on profits, more effort can be putinto reducing costs and investments. The supply chain can be reappraised to cut variable costs and overheadsand to achieve savings in working capital and fixed investment.
2. Increase prices. The new focus should allow managers to be more confident in pushing for higher prices.With volume growth no longer the main objective, it may pay to trade-off the loss of some customers forhigher average margins.
3. Enhance the sales mix. Improving the product, customer and sales mix is a particularly important wayof boosting profits in mature markets. The first step is usually to segment the market according to theprice-sensitivity of customers. Greater focus is then given to higher margin accounts. Often, line extensionsand additional services aimed at less price sensitive customers can push average prices up. For example,Johnnie Walker pushed up the average price per bottle of its whisky by introducing a premium whisky to sellalongside its familiar Red Label brand. The mobile phone market is another good example of this.
CUSTOMER TARGETS
The third component of the marketing plan defines target customers in more detail. This is a crucial stage sinceonly by knowing exactly who the customers are and how they operate can a business meet their needs. The target
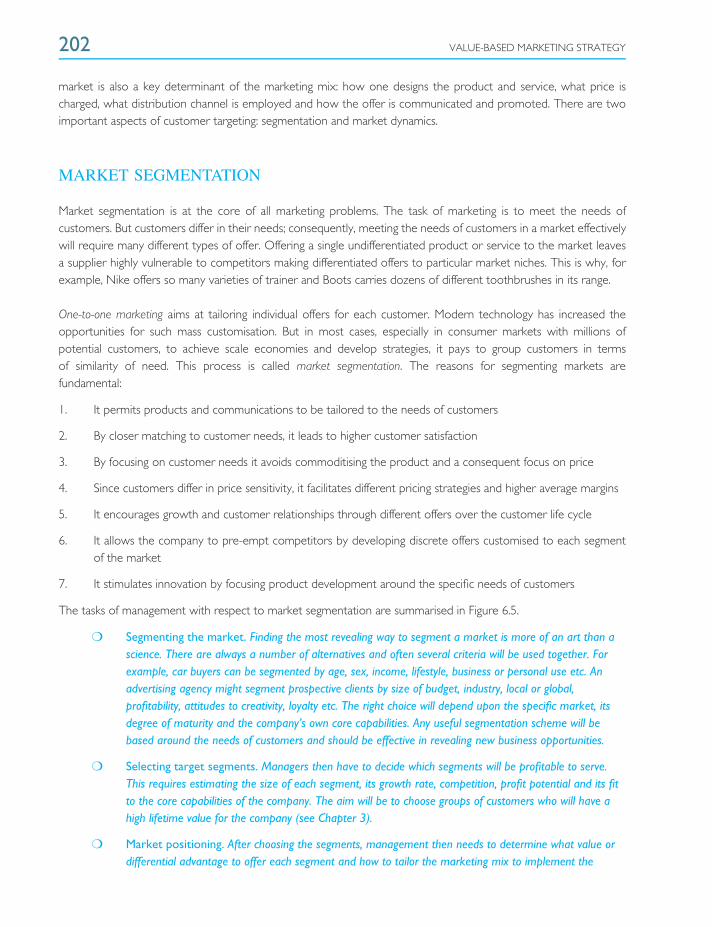
202 VALUE-BASED MARKETING STRATEGY
market is also a key determinant of the marketing mix: how one designs the product and service, what price ischarged, what distribution channel is employed and how the offer is communicated and promoted. There are twoimportant aspects of customer targeting: segmentation and market dynamics.
MARKET SEGMENTATION
Market segmentation is at the core of all marketing problems. The task of marketing is to meet the needs ofcustomers. But customers differ in their needs; consequently, meeting the needs of customers in a market effectivelywill require many different types of offer. Offering a single undifferentiated product or service to the market leavesa supplier highly vulnerable to competitors making differentiated offers to particular market niches. This is why, forexample, Nike offers so many varieties of trainer and Boots carries dozens of different toothbrushes in its range.
One-to-one marketing aims at tailoring individual offers for each customer. Modern technology has increased theopportunities for such mass customisation. But in most cases, especially in consumer markets with millions ofpotential customers, to achieve scale economies and develop strategies, it pays to group customers in termsof similarity of need. This process is called market segmentation. The reasons for segmenting markets arefundamental:
1. It permits products and communications to be tailored to the needs of customers
2. By closer matching to customer needs, it leads to higher customer satisfaction
3. By focusing on customer needs it avoids commoditising the product and a consequent focus on price
4. Since customers differ in price sensitivity, it facilitates different pricing strategies and higher average margins
5. It encourages growth and customer relationships through different offers over the customer life cycle
6. It allows the company to pre-empt competitors by developing discrete offers customised to each segmentof the market
7. It stimulates innovation by focusing product development around the specific needs of customers
The tasks of management with respect to market segmentation are summarised in Figure 6.5.
❍ Segmenting the market. Finding the most revealing way to segment a market is more of an art than ascience. There are always a number of alternatives and often several criteria will be used together. Forexample, car buyers can be segmented by age, sex, income, lifestyle, business or personal use etc. Anadvertising agency might segment prospective clients by size of budget, industry, local or global,profitability, attitudes to creativity, loyalty etc. The right choice will depend upon the specific market, itsdegree of maturity and the company’s own core capabilities. Any useful segmentation scheme will bebased around the needs of customers and should be effective in revealing new business opportunities.
❍ Selecting target segments. Managers then have to decide which segments will be profitable to serve.This requires estimating the size of each segment, its growth rate, competition, profit potential and its fitto the core capabilities of the company. The aim will be to choose groups of customers who will have ahigh lifetime value for the company (see Chapter 3).
❍ Market positioning. After choosing the segments, management then needs to determine what value ordifferential advantage to offer each segment and how to tailor the marketing mix to implement the
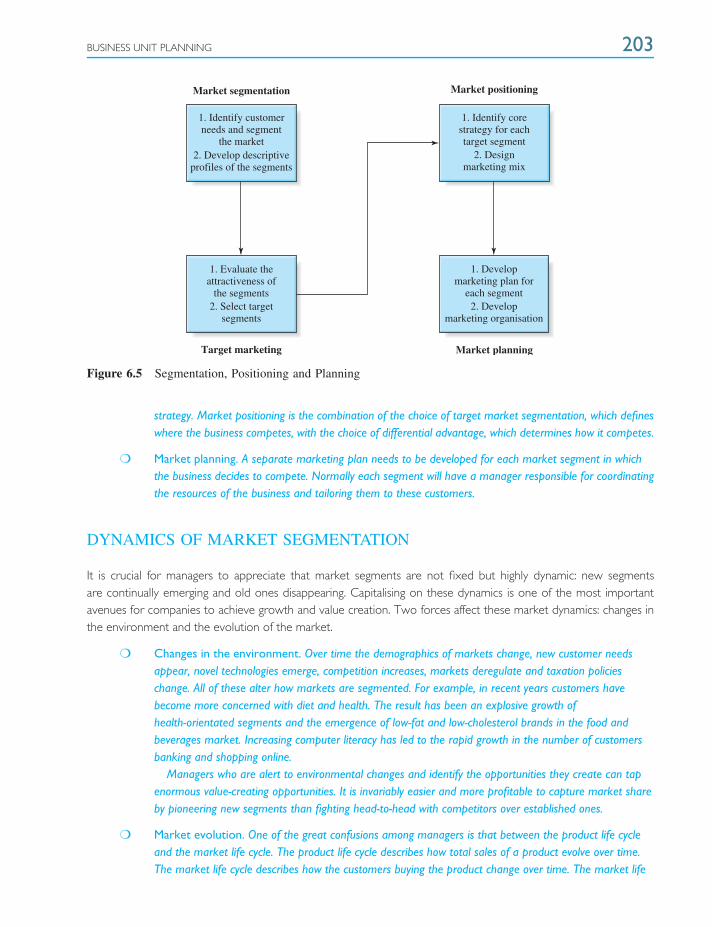
BUSINESS UNIT PLANNING 203
1. Identify customerneeds and segment
the market
Market segmentation Market positioning
Market planningTarget marketing
1. Identify corestrategy for each target segment
1. Develop marketing plan for
each segment2. Develop
marketing organisation
2. Designmarketing mix
1. Evaluate theattractiveness of
the segments2. Select target
segments
2. Develop descriptive profiles of the segments
Figure 6.5 Segmentation, Positioning and Planning
strategy. Market positioning is the combination of the choice of target market segmentation, which defineswhere the business competes, with the choice of differential advantage, which determines how it competes.
❍ Market planning. A separate marketing plan needs to be developed for each market segment in whichthe business decides to compete. Normally each segment will have a manager responsible for coordinatingthe resources of the business and tailoring them to these customers.
DYNAMICS OF MARKET SEGMENTATION
It is crucial for managers to appreciate that market segments are not fixed but highly dynamic: new segmentsare continually emerging and old ones disappearing. Capitalising on these dynamics is one of the most importantavenues for companies to achieve growth and value creation. Two forces affect these market dynamics: changes inthe environment and the evolution of the market.
❍ Changes in the environment. Over time the demographics of markets change, new customer needsappear, novel technologies emerge, competition increases, markets deregulate and taxation policieschange. All of these alter how markets are segmented. For example, in recent years customers havebecome more concerned with diet and health. The result has been an explosive growth ofhealth-orientated segments and the emergence of low-fat and low-cholesterol brands in the food andbeverages market. Increasing computer literacy has led to the rapid growth in the number of customersbanking and shopping online.
Managers who are alert to environmental changes and identify the opportunities they create can tapenormous value-creating opportunities. It is invariably easier and more profitable to capture market shareby pioneering new segments than fighting head-to-head with competitors over established ones.
❍ Market evolution. One of the great confusions among managers is that between the product life cycleand the market life cycle. The product life cycle describes how total sales of a product evolve over time.The market life cycle describes how the customers buying the product change over time. The market life
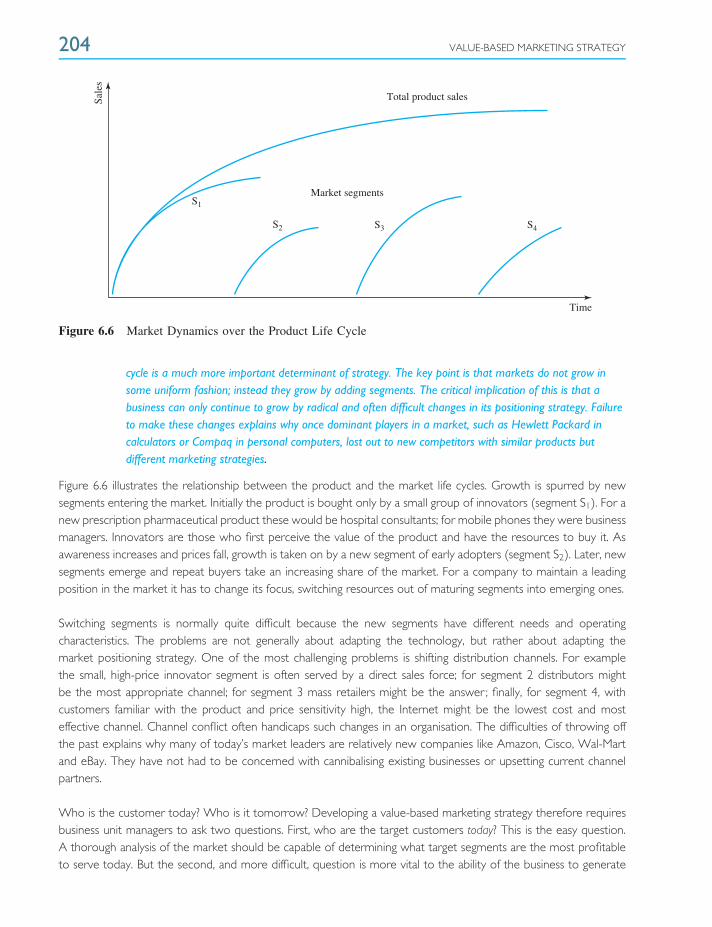
204 VALUE-BASED MARKETING STRATEGY
Total product sales
Market segmentsS1
S2 S3 S4
Time
Sale
s
Figure 6.6 Market Dynamics over the Product Life Cycle
cycle is a much more important determinant of strategy. The key point is that markets do not grow insome uniform fashion; instead they grow by adding segments. The critical implication of this is that abusiness can only continue to grow by radical and often difficult changes in its positioning strategy. Failureto make these changes explains why once dominant players in a market, such as Hewlett Packard incalculators or Compaq in personal computers, lost out to new competitors with similar products butdifferent marketing strategies.
Figure 6.6 illustrates the relationship between the product and the market life cycles. Growth is spurred by newsegments entering the market. Initially the product is bought only by a small group of innovators (segment S1). For anew prescription pharmaceutical product these would be hospital consultants; for mobile phones they were businessmanagers. Innovators are those who first perceive the value of the product and have the resources to buy it. Asawareness increases and prices fall, growth is taken on by a new segment of early adopters (segment S2). Later, newsegments emerge and repeat buyers take an increasing share of the market. For a company to maintain a leadingposition in the market it has to change its focus, switching resources out of maturing segments into emerging ones.
Switching segments is normally quite difficult because the new segments have different needs and operatingcharacteristics. The problems are not generally about adapting the technology, but rather about adapting themarket positioning strategy. One of the most challenging problems is shifting distribution channels. For examplethe small, high-price innovator segment is often served by a direct sales force; for segment 2 distributors mightbe the most appropriate channel; for segment 3 mass retailers might be the answer ; finally, for segment 4, withcustomers familiar with the product and price sensitivity high, the Internet might be the lowest cost and mosteffective channel. Channel conflict often handicaps such changes in an organisation. The difficulties of throwing offthe past explains why many of today’s market leaders are relatively new companies like Amazon, Cisco, Wal-Martand eBay. They have not had to be concerned with cannibalising existing businesses or upsetting current channelpartners.
Who is the customer today? Who is it tomorrow? Developing a value-based marketing strategy therefore requiresbusiness unit managers to ask two questions. First, who are the target customers today? This is the easy question.A thorough analysis of the market should be capable of determining what target segments are the most profitableto serve today. But the second, and more difficult, question is more vital to the ability of the business to generate
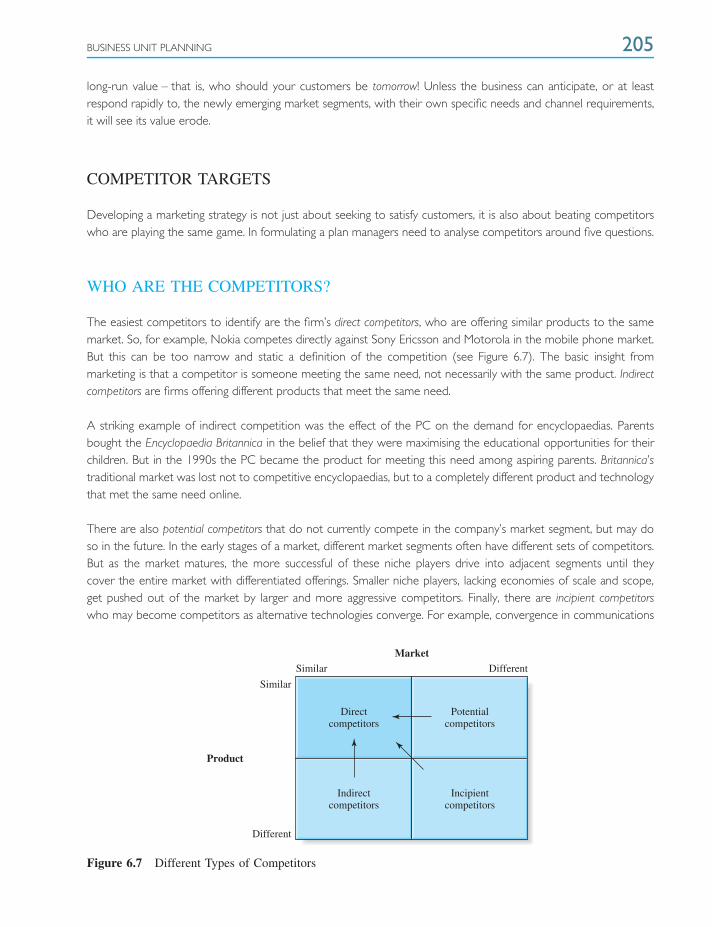
BUSINESS UNIT PLANNING 205
long-run value – that is, who should your customers be tomorrow! Unless the business can anticipate, or at leastrespond rapidly to, the newly emerging market segments, with their own specific needs and channel requirements,it will see its value erode.
COMPETITOR TARGETS
Developing a marketing strategy is not just about seeking to satisfy customers, it is also about beating competitorswho are playing the same game. In formulating a plan managers need to analyse competitors around five questions.
WHO ARE THE COMPETITORS?
The easiest competitors to identify are the firm’s direct competitors, who are offering similar products to the samemarket. So, for example, Nokia competes directly against Sony Ericsson and Motorola in the mobile phone market.But this can be too narrow and static a definition of the competition (see Figure 6.7). The basic insight frommarketing is that a competitor is someone meeting the same need, not necessarily with the same product. Indirectcompetitors are firms offering different products that meet the same need.
A striking example of indirect competition was the effect of the PC on the demand for encyclopaedias. Parentsbought the Encyclopaedia Britannica in the belief that they were maximising the educational opportunities for theirchildren. But in the 1990s the PC became the product for meeting this need among aspiring parents. Britannica’straditional market was lost not to competitive encyclopaedias, but to a completely different product and technologythat met the same need online.
There are also potential competitors that do not currently compete in the company’s market segment, but may doso in the future. In the early stages of a market, different market segments often have different sets of competitors.But as the market matures, the more successful of these niche players drive into adjacent segments until theycover the entire market with differentiated offerings. Smaller niche players, lacking economies of scale and scope,get pushed out of the market by larger and more aggressive competitors. Finally, there are incipient competitorswho may become competitors as alternative technologies converge. For example, convergence in communications
Different
Product
MarketDifferent
Directcompetitors
Indirectcompetitors
Incipientcompetitors
Potentialcompetitors
Similar
Similar
Figure 6.7 Different Types of Competitors

206 VALUE-BASED MARKETING STRATEGY
has transformed the industry, with competitors emerging from cable, satellite, wireless and traditional telecomscompanies. To summarise, in looking ahead at the strategy, managers again have to focus on the market dynamicsand ask who are the competitors today and who might they be tomorrow.
WHAT ARE THEIR LIKELY STRATEGIES?
Second, management will need to anticipate the strategies of the key competitors and their likely reactions to thebusiness’s own plans. This includes assessing how aggressive they will be in seeking to gain market share, whichmarket segments they will focus on, and whether their positioning will be around price, service or innovation. Insightsinto these questions will be obtained from looking at their past behaviour, the strategic significance of the businessto them, their financial position, and the focus of their recent investments and R&D spending.
WHERE ARE THEY VULNERABLE?
Developing a strategy to beat competitors requires identifying any weaknesses that can be exploited. The weaknessesmay lie at the corporate level or at the level of the business unit. Two leading low-cost airlines, Laker and Debonair,were crushed by the majors (in 1982 and 1999 respectively) who had identified the precarious nature of theircorporate finances. Their high levels of debt and low operating margins meant they were fatally vulnerable torelatively small erosions in price and market share.
More often it will be operating and marketing deficiencies at the business unit level that can be exploited. Glaxo wasable to catapult Zantac into leadership in the huge anti-ulcer therapy market by exploiting the side effects said toaffect patients using SmithKline’s Tagamet. British Airways began to lose market share when rivals focused publicityon its very high prices. Tesco made gains when rival supermarket group Sainsbury introduced a poorly perceivedadvertising campaign. Dell won leadership by exploiting Compaq’s weakness in direct marketing channels. Marks &Spencer lost its market-leading position when it had a poor year for fashion.
WHERE ARE WE VULNERABLE?
The fourth question reverses the previous one. It asks: what are our weaknesses that could threaten our long-runposition in the market? This involves projecting the implications of changes in the socio-economic, technologicaland market environments. Changing customer needs and the evolution of new segments have to be explored.The competitiveness of the company’s differential advantage and marketing mix have to be objectively assessed.Questions that need to be asked are: how competitive are our products and services in range and quality?Do our prices offer genuine value? Are our promotional and marketing channels right for the consumers oftoday and tomorrow? Nowadays any holes in the company’s defensive wall are quickly exploited by aggressivecompetition.
WHAT SHOULD WE DO?
Finally, management need to decide on an action plan that anticipates and responds to the competitive threat. Theplan will seek to reduce the company’s own vulnerability and attack the competitor’s own area of weakness.
BUSINESS UNIT PLANNING 207
CORE STRATEGY
Just as target customers and competition changes over time, so must the core strategy or differential advantage. Acompany’s differential is soon obsolete unless continually upgraded. Managers again have to consider the marketdynamics by asking: what is our core strategy today? What should it be tomorrow?
Chapter 3 introduced the concept of the value ladder. It described how managers can anticipate the requirementsfor maintaining a competitive advantage. Initially, at the innovation stage, the product concept forms a genericadvantage. For example, AOL initially had no real competition as an Internet service provider. It was able to grow byoffering customers a gateway to the Net and merged with Time-Warner in 2001. But then competitors enter themarket and to maintain leadership the innovator has to show it is a better alternative. AOL was unable to show thatit was a better gateway, with the resulting erosion in its market position and profit margins. Quality often becomesthe next battleground. But soon quality ceases to differentiate and to prevent commoditisation, a new differentialor core strategy is required. The third level of competition is often the provision of added services to augment thebasic product.
The ultimate stage of competition moves away from the product completely and focuses on solving the customer’sproblems directly. Products increasingly play a marginal role in the core strategies of leading-edge companies such asGE and IBM. They see themselves as winning and retaining high-margin customers by offering customised solutionsthat have direct and measurable effects on the customer’s bottom line. Today, managers have to realise thatcompetitive advantage is about information rather than hardware. Value is created by providing information thatenables customers to solve their problems better than before.
This requires turning the business into a learning organisation. In particular, it means that knowledge of thecustomer’s business and operations ranks in importance with knowledge of one’s own operations and busi-ness. To sell computing systems or merchandise to retailers, the supplier needs to know as much aboutwhat creates value for the retailer as it does about its own computing technology or baked beans. Withoutsuch information, computers and baked beans are just commodities that can no longer generate value forshareholders.
THE MARKETING MIX
The marketing mix is the set of operating decisions the business uses to pursue its marketing objectives in its targetmarket. These decisions are often referred to as the four Ps: product, price, promotion and place. The four Ps area simple – perhaps over-simple – reminder of the classes of decisions managers have to make to implement themarketing strategy.
PRODUCT DECISIONS
In commodity markets a supplier’s product is a simple idea: it is a physical item produced or sold by the firm. But intoday’s marketing environment this concept of a product is less useful for describing the firm’s options. One reasonis that the business increasingly customises its offer so that there is no standard ‘product’. The customer definesthe product as much as the supplier. Also the firm increasingly augments its product with a range of services andsupplementary products to increase its market competitiveness.
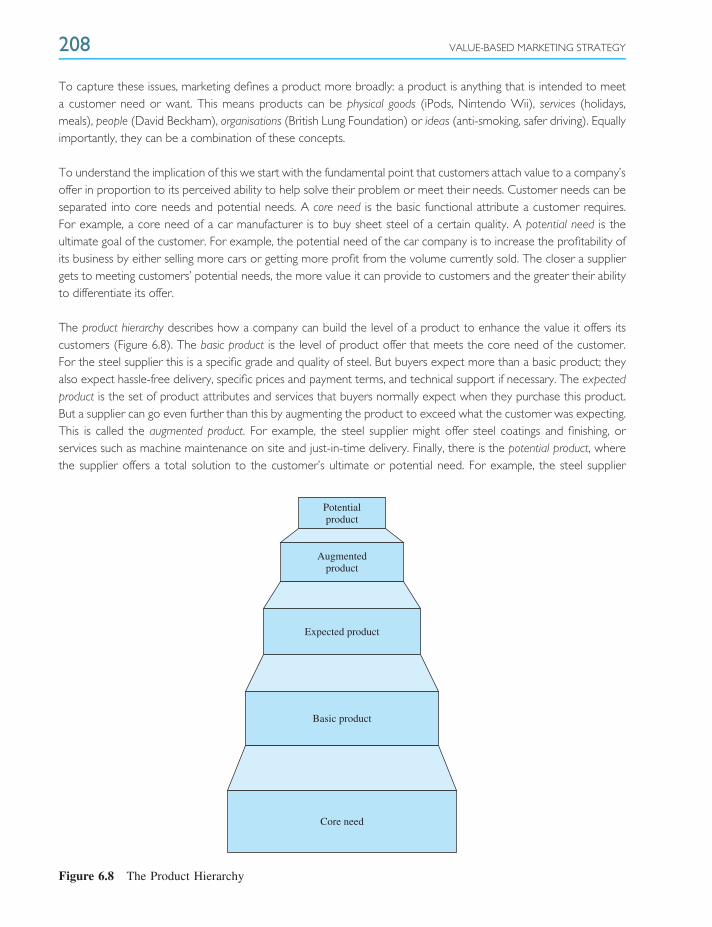
208 VALUE-BASED MARKETING STRATEGY
To capture these issues, marketing defines a product more broadly: a product is anything that is intended to meeta customer need or want. This means products can be physical goods (iPods, Nintendo Wii), services (holidays,meals), people (David Beckham), organisations (British Lung Foundation) or ideas (anti-smoking, safer driving). Equallyimportantly, they can be a combination of these concepts.
To understand the implication of this we start with the fundamental point that customers attach value to a company’soffer in proportion to its perceived ability to help solve their problem or meet their needs. Customer needs can beseparated into core needs and potential needs. A core need is the basic functional attribute a customer requires.For example, a core need of a car manufacturer is to buy sheet steel of a certain quality. A potential need is theultimate goal of the customer. For example, the potential need of the car company is to increase the profitability ofits business by either selling more cars or getting more profit from the volume currently sold. The closer a suppliergets to meeting customers’ potential needs, the more value it can provide to customers and the greater their abilityto differentiate its offer.
The product hierarchy describes how a company can build the level of a product to enhance the value it offers itscustomers (Figure 6.8). The basic product is the level of product offer that meets the core need of the customer.For the steel supplier this is a specific grade and quality of steel. But buyers expect more than a basic product; theyalso expect hassle-free delivery, specific prices and payment terms, and technical support if necessary. The expectedproduct is the set of product attributes and services that buyers normally expect when they purchase this product.But a supplier can go even further than this by augmenting the product to exceed what the customer was expecting.This is called the augmented product. For example, the steel supplier might offer steel coatings and finishing, orservices such as machine maintenance on site and just-in-time delivery. Finally, there is the potential product, wherethe supplier offers a total solution to the customer’s ultimate or potential need. For example, the steel supplier
Potentialproduct
Augmentedproduct
Expected product
Basic product
Core need
Figure 6.8 The Product Hierarchy
BUSINESS UNIT PLANNING 209
could offer a partnership that guarantees to take 5 per cent a year out of the car company’s body manufacturingcosts, so increasing the customer’s bottom-line profitability by a defined and significant amount.
Today it is more and more difficult to earn economic returns from offering basic or expected products. Increasinglycompetition has shifted to the augmented level, whereby suppliers offer more services and features to differentiatethemselves and seek to gain preference. But ultimately the best way of forging enduring relationships with customersis to focus on their ultimate or potential problems and offer them solutions which have direct value, rather thanoffering them more of your products and services.
In developing product policy, business unit managers have three broad decisions to make. The first is how muchto invest in augmenting the product and seeking to meet the potential needs of customers. The manager hasto ask whether customers will pay enough to generate an economic return on the additional investment. Thesecond question is how much to invest in the brand – to create awareness and add emotional values that will buildconfidence in the company and its products. This important question we will explore in detail in the next chapter.The final question concerns the product mix: how many products should the business be offering to the targetmarket? The broad answers to all three questions lie with the strategy: the strategic objective of the business, itsfocus, target customers, competitor targets and core strategy.
The product line is defined in terms of breadth, length and depth. Breadth refers to how many different productlines a business unit carries. Length refers to the number of items within a product line. Depth refers to the numberof variants of each item.
The first determinant of these decisions is the business unit’s strategic objective. In general, the more ambitious thegrowth objectives of the business unit, the greater the breadth, length and depth of its product mix. For example, abusiness like Amazon.com whose share price was originally dependent upon achieving truly enormous sales growth(see box ‘How Investors Valued an Internet stock’), predictably increased the breadth of its product line. It startedwith books, but then added CDs to double its potential revenue sources, then auctions, and later a whole rangeof retailing lines. Without broadening its product line beyond books it could never have achieved its sales of over$14 billion by 2007 since the entire book market was valued less than that. Similarly, in its push to dominate itscategories, the length of its product lines was expanded. For example, the number of different books offered hasincreased significantly. It also increased its depth, offering hardback, paperback, audio books, e-books and gift variantsof most books. If such a company had become ‘accounting-orientated’ and sought to increase profits by pruningthe product mix and focusing only on areas that were currently profitable, its potential growth would have beencurtailed, triggering a fatal collapse in the share price. Instead, the company made its first profit in 2002.
The second determinant of the product mix is the strategic focus. Where a business shifts from a volume to aproductivity focus, the product criteria change. Here the product mix is designed for more immediate profits thanlong-term sales growth. The length of the product line is likely to be reduced to cut costs, to save on workingcapital, and to focus on the more profitable items. Management should explore the possibility of introducingpremium-priced versions of the more successful products to trade up customers and to capitalise on the highermargins that can be made from less price-sensitive customers.
Customer targets also have an important influence on the product mix. As the market develops, it becomesincreasingly segmented. It is vital to introduce products to match the needs of each segment if the company is toretain customer loyalty. For example, once consumers simply bought trainers. Nike built a dominant presence byidentifying that the market was segmented: players of tennis, basketball and squash, joggers, serious runners andthose who ‘hang out’ could all have targeted products. It was no contest between Nike’s customised offerings and
210 VALUE-BASED MARKETING STRATEGY
the mass-marketed products of their old-fashioned rivals before they began to catch up. If a company has differentcustomers with different needs – and that is virtually always – then it will need different products. Of course,the ultimate level of segmentation – increasingly possible in today’s information age – is one-to-one marketing: adifferent ‘product’ for each customer.
Competitive targets can also influence the optimal product mix. Some products are introduced to thwart the strategicambitions of competitors. Xerox had its position undermined in the copier market after it declined to producecheap, low-volume copiers for smaller offices. This allowed Canon to first exploit the small market and then usethis opening to move up into the larger product heartland of Xerox. Rover’s position in the middle range sectorof the car market was undermined when the luxury car makers, Daimler-Benz (now Daimler) and BMW moveddownmarket with mid-level cars. To prevent competitors threatening the core businesses, companies need toconsider line stretching. Downward stretching occurs when a company located at the upper end of the marketstretches its line downward to block a segment that would otherwise attract a new competitor. Upward stretchingis where a company at the lower end shifts into the higher end.
When a company is attacked by low-priced competition, it often resorts to launching fighter products. These areproducts added to the line and targeted at price-sensitive accounts most at risk from the new competition. Theaim is to segment the market and limit as far as possible the overall decline in margins caused by price competition.Fighter products will often be withdrawn if they succeed in eliminating the competitor.
The last strategic influence on the product mix is the core strategy of the business. The core strategy will determinehow much resource is put into augmenting the product and positioning the business as a solution provider ratherthan a product supplier. If the value positioning is around low price, then the necessity of minimising costs will lead to a‘basic product’ positioning. If the value proposition is around service the business will invest in an ‘augmented product’strategy. If the proposition is customisation then the company will be creating a ‘potential product’ positioning.
Information technology has made a significant impact on the approach to product decisions. Online marketers recog-nise that customers want not more choice, but less. They want a single offer that is tailored to their exact requirementsrather than having to choose among a plethora of imperfectly fitting options. Personalised communications andcustomised solutions made to order is a response that makes more sense for both customers and companies.
PRICING DECISIONS
Pricing is covered in detail in Chapter 8. Pricing has a crucial impact on both the cash flow and growth potentialof the business. Broadly, pricing decisions flow from the same set of five strategic parameters described above i.e.strategic objective, focus, customer targets, competitor targets and core strategy. The first determinant of the priceis the strategic objective. If rapid growth is the goal then penetration pricing – pricing below current full-cost – maywell be a viable option. Its justification could be that it is necessary to pre-empt competition and gain critical mass,without which long-run viability is not possible. Also, volume growth is likely to reduce average costs througheconomies of scale, so that while the price is unprofitable at the beginning it may be profitable in the longer run.Pricing to achieve short-run profit targets can destroy a business’s future in young, dynamic markets.
When critical mass is achieved, the strategic focus may shift the pricing objective to margin improvement. Forexample, when the Japanese had captured large market shares in many of the world’s car markets, they raisedtheir prices upwards to improve their margins. The target customer segment also plays an obvious role in thepricing decision. The price points in the luxury car segment will be much higher than those in the economy
BUSINESS UNIT PLANNING 211
segment. Different market segments have quite different price elasticities because of their spending ability andspecific choice criteria. Competitive strategies are also important. The prices charged by competitors will constrainthe pricing options available for the business.
Finally, the core strategy has a crucial bearing on the price that the company can charge. Fundamentally, the price acustomer will pay for a product or service is determined by its perceived value, relative to competition. If a company ispursuing a ‘basic product’ or ‘expected product’ strategy then its price will have to be similar to the competition. If thecore strategy is based on offering superior economic value to the customer, then the upper limit on the price will bethe additional value this represents. For example, if a steel company offers a fabricating solution that saves a car com-pany $1 million a year, then this, in principle, is what it should be willing to pay at the limit. How close to this limit thesteel company is actually able to price depends on its negotiating skill and the sustainability of its competitive advantage.
Note that online markets bring in many innovations in pricing. Interactive communications can reverse the locus ofthe pricing decision. Conventionally, businesses have set the price to customers, but now we have, in addition toB2C, C2B and C2C. In C2B online intermediaries like Priceline allow consumers to state what they will pay for carsor airline tickets and companies have to respond. On C2C auction sites such as eBay, the company can be left outentirely as consumers sell unwanted goods to other consumers.
Online marketing facilitates much greater price discrimination. Using data banks that rank customers by anticipatedvalue to the company or following web chains that indicate the customer’s price sensitivity, suppliers are increasinglyoffering customised prices to online shoppers. Used effectively, such individualised pricing can capture the consumersurplus and maximise profitable sales.
PROMOTION DECISIONS
Promotion decisions cover advertising, sales promotion, public relations, personal selling, sponsorship, eventmarketing and the increasing array of online marketing techniques, as well as direct mail, telemarketing and TVshopping. The key decisions are how much the total promotion budget should be, how to allocate it across thesepromotional channels, and what message the firm should try to get across to the audience.
Again, these decisions are all consequences of the prior strategic decisions. The size of the promotional budget ismainly a function of the strategic objective management has determined for the business unit. If it is a new businesswith an objective of rapid growth, it is likely to require a large budget. While accountants treat this spending as acurrent expense, much of it is in fact an investment that builds up an intangible asset in the form of brand equity.The benefits of the current spending, in terms of positive awareness and attitudes to the business, carry over wellinto the future. In many of today’s new markets, it is crucial to build a brand quickly to pre-empt competition. Thismeans a high promotional spend is an essential entry requirement.
The strategic focus will determine the objective of the promotion. The focus may be on converting non-users,entering new segments or increasing the usage rate. When the strategic focus shifts from volume to productivitythe task of communications will change from winning new customers to maintaining the existing base. Its functionwill move from persuasion to reminding customers about the benefits of the product.
The characteristics of the target market segment play a central role in every aspect of the communicationsstrategy. Their behaviour will determine the most effective communication channels. Their attitudes to the business,its products and competitors will determine the most appropriate message. Thorough audience research is a
212 VALUE-BASED MARKETING STRATEGY
prerequisite to effective promotion planning. Finally, the core strategy will have a major influence on what iscommunicated. The message will be designed to communicate the value proposition of the business.
A significant trend has been the growth of online media. The explosion of access to the Internet has given thisan even greater impetus. This form of direct marketing has a number of advantages. It is easier to customise themessage to specific market segments than ‘mass media’ like advertising and sales promotion. This enables it to matchthe message more effectively to the needs of individual customers. Second, it is more convenient for customers:they can often order 24 hours a day, 7 days a week, right from their homes or desk . Third, it allows more choiceby separating the physical goods from the information about them. Unlike, say, shops where the presentation andstorage of the goods take place in the one location, direct marketing can present a huge catalogue of choices, whichdo not have to be stored at multiple locations. A central warehouse and direct marketing offer economies of scalewith maximum variety.[4]
The online medium has the additional advantage of allowing two-way communication, which is richer and moreeffective than one-way messages. For marketers, it offers often dramatically lower costs, continually updatedinformation about customers, greater flexibility, and the ability to build relationships with customers by storing andretrieving information about their preferences.
Technology has spurred the trend towards greater efforts to produce integrated marketing communications. Thismeans seeking to combine all forms of promotion in a synergistic way, to produce greater clarity, consistency andeffectiveness in the way the business communicates to its target markets. The problem until now has been that eachof these tools has usually been controlled by different managers and different external agencies that have set theirown objectives. Much can be gained by bringing these together and developing integrated, multi-stage, multi-vehiclecommunications campaigns.[5]
PLACE DECISIONS
Place is concerned with the channels of distribution the business employs to reach the target market. Mostcompanies do not sell their goods directly to final users; instead they use intermediaries such as agents, distributors,wholesalers, transport companies and retailers. They use intermediaries to perform channel functions when this is amore efficient or effective alternative. The advantage of intermediaries may lie in their superior access to the targetmarket, their experience, or the economies of scale and scope that they possess. A higher return may be achievedfrom investing in expanding the firm’s core business than in establishing its own channels.
The functions channels perform can be grouped into four :
❍ Information. The marketer needs information about what customers want, or might want. Customersneed information about what the company can offer
❍ Selling. The company has to promote its products and negotiate on prices and terms
❍ Delivery. Goods have to be stored and transferred from the company to its customers
❍ Financing. Inventories, accounts receivable and associated risks have to be managed and financed
The question is not whether these four functions have to be performed, but who can perform them most efficientlyand effectively. The key channel decisions management must make are who should perform these activities? Shouldthey be done internally or through independent organisations? Then, how should the people or organisations
BUSINESS UNIT PLANNING 213
be selected, trained, motivated and controlled? Most companies employ a multi-function, multi-channel approach.Different organisations are chosen for different functions, and some functions are handled by several intermediariessimultaneously. A computer company might use a market research company to gather information, a transportationcompany to handle delivery, banks to finance receivables and inventories, and then sell through its own sales forceto large accounts and use independent retailers and a web site to sell to smaller customers.
A major problem today for many established companies is the way distribution channels have changed. Theoptimum channel structure is significantly influenced by the stage of the market. As a market evolves most productsand services shift from high-service to low-cost channels. Personal computers, for example, were first sold bymanufacturers’ sales forces, later office equipment distributors became a lead channel, then retailers, and nowmail-order firms and the Internet are the fastest growing channels. Information technology has also had a majorimpact on channel design decisions. In particular, the Internet has increasingly led to disintermediation in somemarkets as consumers order directly. In other markets, intermediaries called infomediaries have been created to helpshoppers find the best deals from among the multitude of companies selling online.
Channels once established are not easy to change. Long-term relationships, contracts, infrastructure and systemslinking channel partners cannot be quickly altered. This dilemma makes channel strategy an increasingly key factoraffecting the company’s long-term potential.
Channel decisions are influenced by the familiar marketing strategy parameters. Ideally the unit’s channel configurationshould create a differential advantage by matching the service needs of customers more effectively than competitors.So planning starts with research into the service needs of target customers and into the effectiveness of thecompetitors’ channels. The amount a business should be willing to invest in channels will depend on the strategicobjective. The strategic focus will also shape the appropriate channels. If the focus is to convert new customersto the business a more aggressive channel will be required than if the focus is on maintenance or cash flow. Asthe market evolves and becomes more segmented, the business will increasingly be pulled into developing multiplechannels to cover the market and match the different needs. Similarly, the core strategy will be an importantinfluence. If the strategy is around customised solutions to the potential problems customers are facing, a moredirect channel will be required than if the business is simply selling basic or expected products and using low pricesas the value driver.
VALUING THE STRATEGY
Once the strategy has been developed, management have to demonstrate that it is the best strategy for creatingshareholder value. Typically companies adopt planning processes that culminate in projected (often five-year)accounting statements. These show the sales, operating profits and the return on capital employed the business isprojected to earn if the strategy is adopted. But such statements do not demonstrate that value will be createdfor investors. Value-based planning looks at marketing plans from the viewpoint of investors and asks if the strategywill generate a return that exceeds the investors’ opportunity cost of capital. The strategy valuation process shouldenable business unit managers to answer such questions as:
❍ Does the proposed marketing strategy create value for the company’s shareholders?
❍ Would alternative marketing strategies create more value?
❍ How sensitive is the strategy to the marketing assumptions and to unexpected changes in the industryenvironment?

214 VALUE-BASED MARKETING STRATEGY
Let us consider an example of the strategy valuation process. A company we will call Fine Wines Ltd was anestablished family firm selling wine to customers through a direct mail catalogue, which was sent out quarterly. Inrecent years sales and profits had stagnated due to increased competition from both retailers, other direct mailoperators and the growing presence of online competitors. With net operating profit after tax of £5.3 million, and acost of capital of 12 per cent, the business was valued at £44.17 million (i.e. using the perpetuity method, continuingvalue equals NOPAT divided by the cost of capital). A new managing director proposed to relaunch the businessas an Internet operation, GourmetFoods.com. An executive summary of the marketing strategy is as follows:
Strategic objective. To create shareholder value by establishing market leadership online. The business wouldbe launched initially in the UK and then rapidly developed throughout Europe. In the first year the productline would be limited to wine. But then a range of gourmet foods would be added and later a range of otherluxury branded products.
Strategic focus. The focus would be on volume growth by attracting customers to switch from conventionalretail channels to the Internet.
Target market segment. The initial market would be high-income householders aged between 30 and 45.Later the market would be broadened, as more online buyers were attracted to it.
Competitive targets. The competition would be conventional retailers, wine merchants, direct mail operatorsand other online marketers.
Core strategy. To develop the leading brand name in the sector. Key attributes associated with the brandwill be excellent service, competitive prices and a broad range of high quality products.
Marketing mix
Product. A broader assortment of wines and gourmet foods than are available in supermarkets and othercompetitive outlets. Expert online advice to help customers with their selection. Delivery within five workingdays.
Price. Prices to be at least 5 per cent below high-street prices. Creative use of promotions to encourageseasonal purchasing and create consumer interest.
Promotion. Heavy continuous advertising campaigns in national press. Promotion on major Internet portals,including Google and Amazon.
Distribution. State of the art warehouse located at Dover. European warehouse to be located outside Brussels.Distribution through the leading overnight delivery operator.
Because this was a new market and one that would require heavy initial investment, management used a 10-yearforecast horizon in assessing the value-creating potential of the strategy. As shown in Table 6.1, managementbelieved that their strategy could drive sales growth of 30 per cent a year. They anticipated a normal operatingmargin of 15 per cent, but saw very high start-up costs over the first five years, particularly in advertising.£10 million annually was set aside to create critical mass in brand awareness and market penetration. Net investmentand fixed and working capital was put at 40 per cent of incremental sales. Because of the higher volatility of Internetbusinesses, the financial director calculated a cost of capital of 15 per cent, as against 12 per cent currently. Tofinance the expansion, the board planned an initial public offering, selling up to 20 per cent of the shares on thestock market, and a borrowing facility of £10 million.
Table 6.1 shows a typical profile of an entrepreneurial business in a rapidly growing market. In the first year operatingprofits fall due to the high start-up costs. Cash flow does not recover to the current pre-strategy level until the ninth
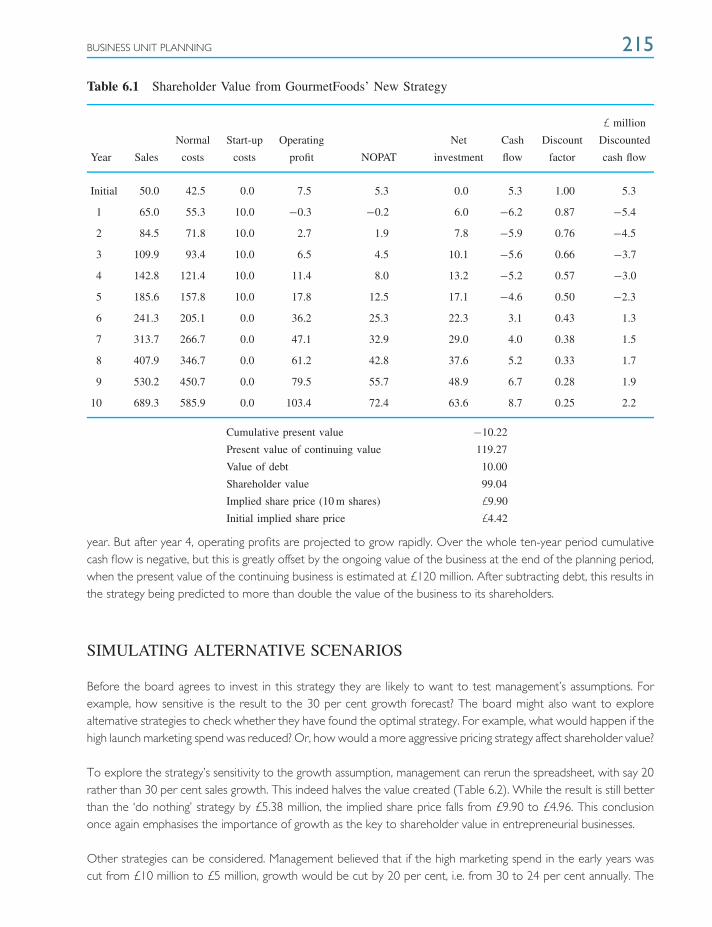
BUSINESS UNIT PLANNING 215
Table 6.1 Shareholder Value from GourmetFoods’ New Strategy
£ million
Normal Start-up Operating Net Cash Discount Discounted
Year Sales costs costs profit NOPAT investment flow factor cash flow
Initial 50.0 42.5 0.0 7.5 5.3 0.0 5.3 1.00 5.3
1 65.0 55.3 10.0 −0.3 −0.2 6.0 −6.2 0.87 −5.4
2 84.5 71.8 10.0 2.7 1.9 7.8 −5.9 0.76 −4.5
3 109.9 93.4 10.0 6.5 4.5 10.1 −5.6 0.66 −3.7
4 142.8 121.4 10.0 11.4 8.0 13.2 −5.2 0.57 −3.0
5 185.6 157.8 10.0 17.8 12.5 17.1 −4.6 0.50 −2.3
6 241.3 205.1 0.0 36.2 25.3 22.3 3.1 0.43 1.3
7 313.7 266.7 0.0 47.1 32.9 29.0 4.0 0.38 1.5
8 407.9 346.7 0.0 61.2 42.8 37.6 5.2 0.33 1.7
9 530.2 450.7 0.0 79.5 55.7 48.9 6.7 0.28 1.9
10 689.3 585.9 0.0 103.4 72.4 63.6 8.7 0.25 2.2
Cumulative present value −10.22
Present value of continuing value 119.27
Value of debt 10.00
Shareholder value 99.04
Implied share price (10 m shares) £9.90
Initial implied share price £4.42
year. But after year 4, operating profits are projected to grow rapidly. Over the whole ten-year period cumulativecash flow is negative, but this is greatly offset by the ongoing value of the business at the end of the planning period,when the present value of the continuing business is estimated at £120 million. After subtracting debt, this results inthe strategy being predicted to more than double the value of the business to its shareholders.
SIMULATING ALTERNATIVE SCENARIOS
Before the board agrees to invest in this strategy they are likely to want to test management’s assumptions. Forexample, how sensitive is the result to the 30 per cent growth forecast? The board might also want to explorealternative strategies to check whether they have found the optimal strategy. For example, what would happen if thehigh launch marketing spend was reduced? Or, how would a more aggressive pricing strategy affect shareholder value?
To explore the strategy’s sensitivity to the growth assumption, management can rerun the spreadsheet, with say 20rather than 30 per cent sales growth. This indeed halves the value created (Table 6.2). While the result is still betterthan the ‘do nothing’ strategy by £5.38 million, the implied share price falls from £9.90 to £4.96. This conclusiononce again emphasises the importance of growth as the key to shareholder value in entrepreneurial businesses.
Other strategies can be considered. Management believed that if the high marketing spend in the early years wascut from £10 million to £5 million, growth would be cut by 20 per cent, i.e. from 30 to 24 per cent annually. The

216 VALUE-BASED MARKETING STRATEGY
Table 6.2 GourmetFoods: Sensitivity of ShareholderValue (£ million)
Strategy Shareholder value SV added Share price (£)
Proposed strategy 99.04 54.87 9.90
20% growth 49.55 5.38 4.96
Cut start-up costs 70.94 26.77 7.09
10% price cut 57.11 12.94 5.71
analysis shows that the effect of this would be to reduce shareholder value by nearly 30 per cent to £71 million.Finally, management explored an even more aggressive strategy of cutting prices by 10 per cent. They believed thiswould reduce the operating margin from 15 to 10 per cent, but boost revenue growth to 40 per cent annually.Unfortunately, the higher investment requirements and the lower operating margin make this an unattractiveoption. As Table 6.2 shows, this is materially worse than the proposed strategy, reducing shareholder value by over40 per cent.
THE PLANNING PROCESS
We now look at how management can introduce this type of value-based marketing planning in their companies. Inmost companies it will start with an educational process: a workshop to develop an understanding of the principlesof value-based planning, the objectives of the process, and the importance of a marketing orientation.
A VALUE FOCUS
It is also important to make sure that managers understand why creating shareholder value is their principal task .They need to be familiar with the principle of creating shareholder value – that the task of management is todevelop a business unit strategy that maximises the net present value of long-term cash flow. Value-based planningis quite different from conventional planning built around budgets. Budgets focus on accounting profits; value-basedplanning focuses on value creation. In today’s dynamic markets there is no correlation between profits and the shareprice. Investors are looking at the potential of the business to create long-term cash, not short-term profits. Findingnew growth opportunities from meeting new or unmet customer needs is the way to create long-term cash flow.
UNDERSTANDING THE OBJECTIVES
Managers need to understand the objectives of the planning process. The first objective is to drive business growth.This means clearing away the dead wood in the portfolio and exploring the growth ladder to find new opportunitiesto expand the business. Without growth it is impossible to build sustained increases in shareholder value. Thesecond objective is to find a formula that will allow the business, and the people who work there, to win. Winning isabout developing strategies that will give the organisation a lasting differential advantage in its target markets. Finally,implementing a strategy successfully depends upon building core capabilities that can result in meeting customer

THE PLANNING PROCESS 217
needs efficiently and effectively. These core capabilities are assets, skills and systems, which make possible customerbenefits and are difficult for competitors to emulate.
BEING CUSTOMER DRIVEN
Managers also need to appreciate that the foundation for growth and profitability is solving customers’ problemsmore effectively than competitors. Customers do not want products – they want relationships with organisationsthat can give them solutions to their problems. The performance of a business depends on its knowledgeof customers, their operations and problems, and its ability to innovate by bringing out new and superiorsolutions. The task of the planning process is to bring this knowledge and problem-solving outlook to thefore. Without this knowledge and outlook the company becomes a commodity business, forced to competelargely on price. Commodity-based competition makes earning economic profits virtually impossible over a longperiod.
DEVELOPING THE PLAN
The recommended process for developing the marketing strategy is outlined in Figure 6.9.
Representatives from across the business:
technical, marketing,operations, sales
Cross functional teamGain commitmentDevelop workplan
Define market Hypothesis about
key success factors
Develop fact baseReview and refine
hypothesis
Understanding ofcustomers, competitors
and key trends in the industry
Short-list the beststrategic options
Select valuemaximising option
Shareholder valueanalysis
Marketing mixPerformance indicators
Collect data
Strategic position assessment
Evaluate growth options
Develop marketing plan
Brainstorm andhypothesis generation
Input Output
Ideas about the market opportunity and
strategic possibilities
What are the options to improve
performance?
Strategic objectivesStrategic focus
Customer targets Core strategy
Collect data:• internal audit
• secondary sources • primary research
Key questions:• Where are we now?
• How did we get here? • Where are we heading?
Figure 6.9 The Process of Value-Based Marketing Planning
218 VALUE-BASED MARKETING STRATEGY
FORM CROSS-FUNCTIONAL TEAM
The marketing department alone should not develop the marketing strategy. Genuine innovation relies on inputs
from across the business – from technologists, market researchers, sales force, country managers etc. Involvementfrom across the organisation creates enthusiasm, accelerates the process and facilitates implementation.
BRAINSTORMING AND HYPOTHESIS DEVELOPMENT
Marketing is a creative process. Brainstorming is a good way of generating ideas from across the organisation and
obtaining fresh insights about how to stimulate growth. The ideas that seem to be most relevant should then beformulated as hypotheses that in principle can be tested against data. For example, in a food company a hypothesismight emerge that there is a big marketing opportunity for a fat-free range of desserts, or that prices could be raisedacross the current product line by 10 per cent without affecting volume. One of the tasks of the leader is to steerthe team to develop hypotheses across the range of issues relevant to the plan.
Hypothesis-orientated planning is valuable because it leads to a focus on the critical issues affecting performance.It also helps in developing a consensus because hypotheses provide clarity about what is under debate. Finally,once the critical hypotheses are agreed, they provides guidelines on what is the key information to collectand how it should be analysed, so that these hypotheses can be evaluated. Without hypotheses it is alltoo easy to get drowned in excessive amounts of data and for the whole process to suffer ‘paralysis byanalysis’.
COLLECT DATA TO EVALUATE HYPOTHESES
Once the critical issues have been identified data will have to be brought together to analyse the issues and test
the hypotheses. Some of the data will be internal, concerning the business unit’s current and past performance.Some will be secondary data available from published sources. Developing new ideas will almost always requireprimary data: original, purpose-specific information from surveys and focus groups to gauge customers’ attitudesand problems. Good data is critical to make the plan rigorous and fact based.
ANALYSE DATA AND CONDUCT STRATEGIC POSITION ASSESSMENT
The data is then analysed to evaluate the hypotheses and to conduct a thorough strategic position assessment. This
will include looking at the current performance of the business and its main products. It will enable an analysis ofthe internal and external factors that have shaped performance in the past. It should provide the facility to projectthe growth and profitability implications of the unit’s current strategy. Inputs to the assessments will be informationabout how markets can be segmented and analyses of the probable strategies of competitors. Finally, the team willjudge whether the present strategy is likely to fit the future environment and whether the results are likely to besatisfactory to the board and shareholders.
THE PLANNING PROCESS 219
EVALUATE GROWTH OPTIONS
The team should then identify the best strategic options for generating shareholder value. For example, a
pharmaceutical company looked at the possibilities for one of its major products, at a mature stage of the productlife cycle and with its patent about to expire. It identified five strategic options:
❍ Maximise market share over what was left of the product’s life by aggressive spending on promotion.
❍ Hold market share by taking competitive actions only where required to maintain the current position.
❍ Create life-cycle extensions and migrate customers to higher priced newer products with better patentprotection.
❍ Divest by licensing or selling the product to another company.
❍ Launch a generic and aim for leadership in the new market that will open when the patent expires.
Members of the team will have to debate and value the options and prioritise the alternatives.
DEVELOP MARKETING STRATEGY
Here the team develops its main conclusions and investment recommendations. The strategy will summarise thekey issues emerging from the strategic position assessment, the overall strategic objective and focus, how thebusiness unit’s value proposition will be positioned and the marketing mix. The shareholder value analysis will thenbe presented based on the sales, costs and investments forecast.
IMPLEMENTING THE STRATEGY
Bartlett and Ghoshal reviewed how 20 large, successful European, US and Japanese companies implementedstrategy. [6] They found little similarity in their strategies, structures and systems, but a surprising consistency inhow their leaders sought to implement strategies. They described it as a softer, more organic model built on thedevelopment of purpose, process and people. The overriding goal was to create a shared sense of commitment,belonging and common values throughout the organisation. The implementation style can be summarised underthree headings:
1. Defining the organisation’s mission2. Building on the organisation’s value3. Giving meaning to employees’ work
DEFINING THE ORGANISATION’S MISSION
Outside the ranks of top management it is difficult to make strategies to increase shareholder returns an inspiringgoal. Maximising the returns for outside investors is unlikely to enthuse inside staff, who have their own goals and
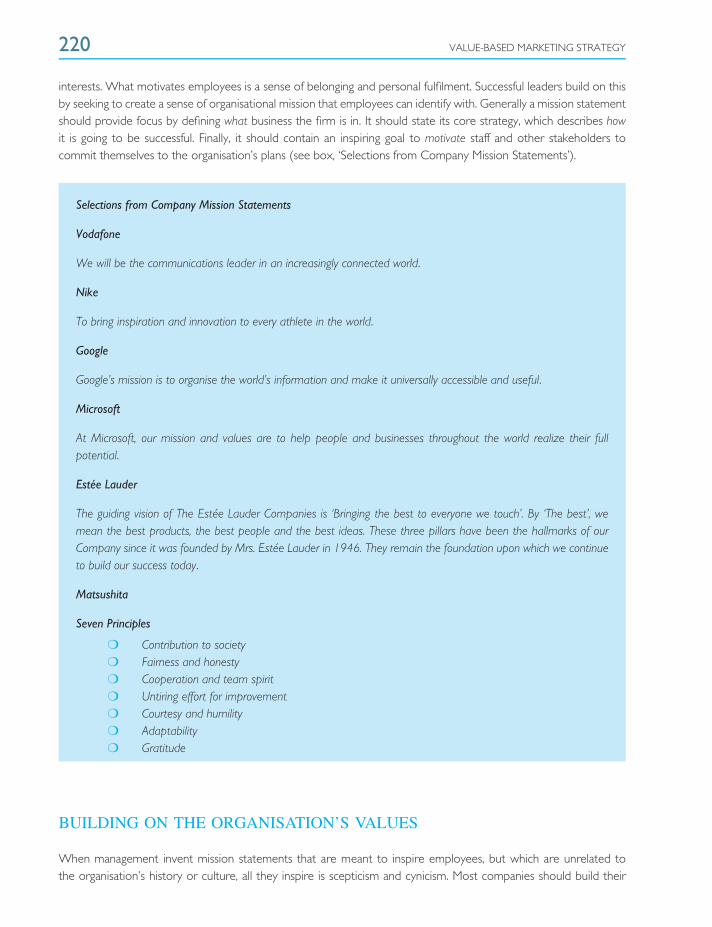
220 VALUE-BASED MARKETING STRATEGY
interests. What motivates employees is a sense of belonging and personal fulfilment. Successful leaders build on thisby seeking to create a sense of organisational mission that employees can identify with. Generally a mission statementshould provide focus by defining what business the firm is in. It should state its core strategy, which describes howit is going to be successful. Finally, it should contain an inspiring goal to motivate staff and other stakeholders tocommit themselves to the organisation’s plans (see box, ‘Selections from Company Mission Statements’).
Selections from Company Mission Statements
Vodafone
We will be the communications leader in an increasingly connected world.
Nike
To bring inspiration and innovation to every athlete in the world.
Google’s mission is to organise the world’s information and make it universally accessible and useful.
Microsoft
At Microsoft, our mission and values are to help people and businesses throughout the world realize their fullpotential.
Estee Lauder
The guiding vision of The Estee Lauder Companies is ‘Bringing the best to everyone we touch’. By ‘The best’, wemean the best products, the best people and the best ideas. These three pillars have been the hallmarks of ourCompany since it was founded by Mrs. Estee Lauder in 1946. They remain the foundation upon which we continueto build our success today.
Matsushita
Seven Principles
❍ Contribution to society❍ Fairness and honesty❍ Cooperation and team spirit❍ Untiring effort for improvement❍ Courtesy and humility❍ Adaptability❍ Gratitude
BUILDING ON THE ORGANISATION’S VALUES
When management invent mission statements that are meant to inspire employees, but which are unrelated tothe organisation’s history or culture, all they inspire is scepticism and cynicism. Most companies should build their
THE PLANNING PROCESS 221
mission around the strengths and values the company already possesses. Ian MacLaurin turned around Tesco, tomake it Britain’s largest, fastest growing and most profitable supermarket group in the 1990s, by building on itshistoric reputation for competitive pricing. But he realised that this value focus had to be supplemented with anew emphasis on quality and innovation if Tesco were to meet the needs of increasingly affluent and demandingshoppers. ‘Being the UK’s number one for quality, innovation and value’ was a mission to which staff could subscribe.
Creating a sense of purpose and commitment to the strategy involves more than inspiring speeches and missionstatements. It requires getting the organisation involved in interpreting, refining and making it operational. Thismeans tapping into the reservoir of knowledge and expertise that is widely distributed throughout the organisation.Tesco’s MacLaurin had store managers, buying groups and operations people engaged in dozens of projects tooperationalise the mission and get buy-in. He also sanctioned a major programme of management education,training and organisational development to give the staff the knowledge and skills to move the organisation forward.Finally, implementing the mission also means developing indicators that measure progress. MacLaurin, for example,employed a market research company to provide regular feedback on how Tesco’s brand name was perceived byconsumers and how its image for quality, innovation and value was progressing, benchmarked against key competitors.
His successor, Terry Leahy, built on MacLaurin’s legacy with the ‘Every Little Helps’ strategy, which revolved aroundthe core purpose of creating value for customers to earn their lifetime loyalty. That included regularly askingcustomers and staff what the retailer could do to make shopping and working with Tesco that ‘little bit better’.
GIVING MEANING TO EMPLOYEES’ WORK
Successful leaders intent on implementing their strategies consider how to gain the commitment of individualemployees. Three initiatives stand out as encouraging such commitment. First, successful organisations recognise andcelebrate individual accomplishments. People want to feel part of the team: not cogs in a huge machine. It is not justabout recognising the organisation’s stars but also the efforts of all those who sustain the organisation. This has tobe done in a meaningful way: front-line staff see through PR gestures as meaningless attempts at manipulation. Atretailer John Lewis, for example, where all employees have a stake in the profits and all workers are called ‘partners’,the staff turnover is well below the national average.
Second, organisations need to be committed to developing employees. This is more than just skill training; it isalso about educating them and helping them to realise their full potential. KPMG, for example, topped the SundayTimes 2008 ‘Best Big Companies to Work For’ league table, which is voted on by employees, largely becauseof its commitment to developing its people.[7] By developing its employees’ potential, management shows that itrecognises commitment has to be two-way. Last, effective leaders foster individual initiative. Since the 1920s, when3M was turned around, it has always shown that it recognises that innovation and growth depend on the initiativeof individuals. Its processes recognise this, for example by the ‘15% rule’ that allows employees to spend 15 percent of their time on their own projects. Individual initiative can be stimulated by open information sharing in theorganisation, by cooperation and by operating transparent and open decision-making, allowing all with relevantknowledge to contribute.
To summarise, strategic marketing planning is a key process in creating value for the organisation. But itsimplementation depends on engendering the cooperation and commitment of employees throughout the business.This requires creating a sense of organisational purpose that people can identify with, and feel a sense of pride in itsaccomplishment.

222 VALUE-BASED MARKETING STRATEGY
SUMMARY
1. The purpose of strategic marketing planning is not to forecast the future – that is an impossible task. Instead,it is to encourage managers to ask the critical questions about their changing markets so that they can identifythe trends that are occurring and capitalise on the opportunities they offer.
2. Corporate level planning focuses on driving organisational change, managing the company’s shared valuedrivers and adapting the business portfolio to the changing marketing and technological environment.
3. Marketing strategy has to be formulated at the level of the business unit. Business unit managers have thedetailed knowledge of changing customer needs and competitive activities that are essential components fordeveloping a growth-orientated marketing strategy.
4. A value-based marketing strategy consists of six parts: strategic objective, strategic focus, customer targets,competitor targets, core strategy and the marketing mix.
5. Once a strategy is formulated management have to test whether it looks likely to generate value forshareholders. It also has to consider whether there are other marketing strategies that would offer evengreater returns.
6. The planning process and its successful implementation depend upon the involvement and commitment ofthe staff. They are the people with the detailed knowledge of the market and who have to make the strategywork .
REVIEW QUESTIONS
1. Why do companies develop marketing strategies?2. What is the centre’s role in the planning process?3. What are the components of a value-based marketing strategy?4. Illustrate how shareholder value analysis can be used to assess the potential of a strategic plan.5. Describe the process of strategic marketing planning.6. What additional considerations affect the successful implementation of marketing strategies?
NOTES ON CHAPTER 6
[1] Tom Copeland, Tim Koller and Jack Murrin, Valuation: Measuring and Managing the Value of Companies,New York : John Wiley & Sons, Inc., 1996, pp. 336–339.
[2] Gary Hamel and C.K. Prahalad, Competing for the Future, Boston, MA: Harvard Business School Press, 1994.
[3] For a summary see Peter Doyle, Marketing Management and Strategy, London: Prentice Hall, 1998.
[4] For an excellent discussion of the implications of this separation of the economics of information from theeconomics of physical items, see Philip Evans and Thomas Wurster, Blown to Bits: How the New Economics ofInformation Transforms Strategy, Boston, MA: Harvard Business School Press, 2000.

NOTES ON CHAPTER 6 223
[5] For detailed examples of integrated communications, see Stan Rapp and Thomas L. Collins, Beyond Maximarketing:The New Power of Caring and Daring, New York : McGraw-Hill, 1994; Ernan Roman, Integrated Direct Marketing,Lincolnwood, IL: NTC Business Books, 1995.
[6] Christopher A. Bartlett and Sumantra Ghoshal, Changing the role of top management: beyond strategy topurpose, Harvard Business Review, November/December, 72(6), 1994, 79–98. See also: Jim Collins and Jerry Porras,Built to Last : Successful Habits of Visionary Companies, Collins, 2004.
[7] The Sunday Times, ‘100 Best Companies to Work For’, March 9, 2008.

PART 3PART 3Implementing High-ValueStrategies
7. Building Brands
8. Pricing for Value
9. Value-Based Communications
10. Value-Based Marketing in the Digital Age

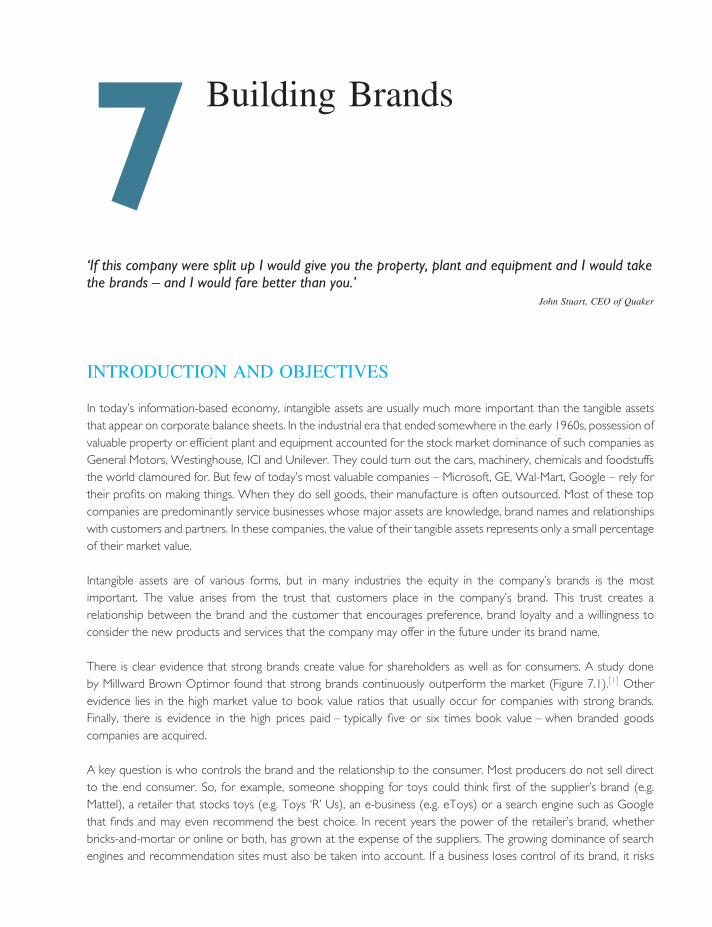
7 Building Brands
‘If this company were split up I would give you the property, plant and equipment and I would takethe brands – and I would fare better than you.’
John Stuart, CEO of Quaker
INTRODUCTION AND OBJECTIVES
In today’s information-based economy, intangible assets are usually much more important than the tangible assetsthat appear on corporate balance sheets. In the industrial era that ended somewhere in the early 1960s, possession ofvaluable property or efficient plant and equipment accounted for the stock market dominance of such companies asGeneral Motors, Westinghouse, ICI and Unilever. They could turn out the cars, machinery, chemicals and foodstuffsthe world clamoured for. But few of today’s most valuable companies – Microsoft, GE, Wal-Mart, Google – rely fortheir profits on making things. When they do sell goods, their manufacture is often outsourced. Most of these topcompanies are predominantly service businesses whose major assets are knowledge, brand names and relationshipswith customers and partners. In these companies, the value of their tangible assets represents only a small percentageof their market value.
Intangible assets are of various forms, but in many industries the equity in the company’s brands is the mostimportant. The value arises from the trust that customers place in the company’s brand. This trust creates arelationship between the brand and the customer that encourages preference, brand loyalty and a willingness toconsider the new products and services that the company may offer in the future under its brand name.
There is clear evidence that strong brands create value for shareholders as well as for consumers. A study doneby Millward Brown Optimor found that strong brands continuously outperform the market (Figure 7.1).[1] Otherevidence lies in the high market value to book value ratios that usually occur for companies with strong brands.Finally, there is evidence in the high prices paid – typically five or six times book value – when branded goodscompanies are acquired.
A key question is who controls the brand and the relationship to the consumer. Most producers do not sell directto the end consumer. So, for example, someone shopping for toys could think first of the supplier’s brand (e.g.Mattel), a retailer that stocks toys (e.g. Toys ‘R’ Us), an e-business (e.g. eToys) or a search engine such as Googlethat finds and may even recommend the best choice. In recent years the power of the retailer’s brand, whetherbricks-and-mortar or online or both, has grown at the expense of the suppliers. The growing dominance of searchengines and recommendation sites must also be taken into account. If a business loses control of its brand, it risks
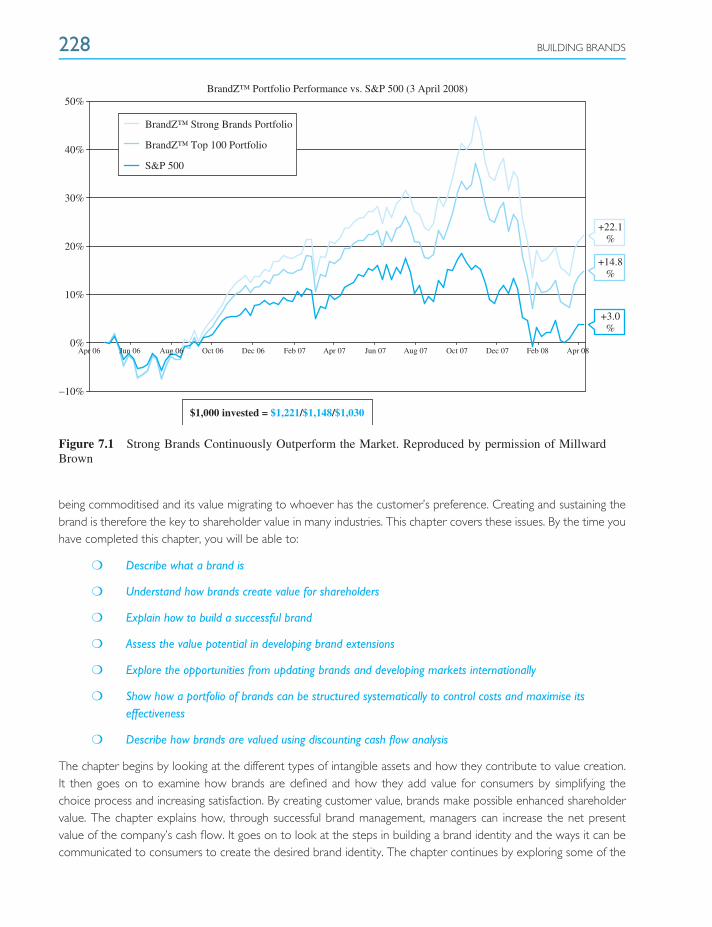
228 BUILDING BRANDS
BrandZ™ Portfolio Performance vs. S&P 500 (3 April 2008)
−10%
0%
10%
20%
30%
40%
50%
Apr 06 Jun 06 Aug 06 Oct 06 Dec 06 Feb 07 Apr 07 Jun 07 Aug 07 Oct 07 Dec 07 Feb 08 Apr 08
BrandZ™ Strong Brands Portfolio
BrandZ™ Top 100 Portfolio
S&P 500
+22.1%
+14.8%
+3.0%
$1,000 invested = $1,221/$1,148/$1,030
Figure 7.1 Strong Brands Continuously Outperform the Market. Reproduced by permission of MillwardBrown
being commoditised and its value migrating to whoever has the customer’s preference. Creating and sustaining thebrand is therefore the key to shareholder value in many industries. This chapter covers these issues. By the time youhave completed this chapter, you will be able to:
❍ Describe what a brand is
❍ Understand how brands create value for shareholders
❍ Explain how to build a successful brand
❍ Assess the value potential in developing brand extensions
❍ Explore the opportunities from updating brands and developing markets internationally
❍ Show how a portfolio of brands can be structured systematically to control costs and maximise itseffectiveness
❍ Describe how brands are valued using discounting cash flow analysis
The chapter begins by looking at the different types of intangible assets and how they contribute to value creation.It then goes on to examine how brands are defined and how they add value for consumers by simplifying thechoice process and increasing satisfaction. By creating customer value, brands make possible enhanced shareholdervalue. The chapter explains how, through successful brand management, managers can increase the net presentvalue of the company’s cash flow. It goes on to look at the steps in building a brand identity and the ways it can becommunicated to consumers to create the desired brand identity. The chapter continues by exploring some of the
THE ROLE OF INTANGIBLE ASSETS 229
most important issues in developing a branding strategy – the contribution of brand extensions, repositioning andupdating brands – and organising the brand portfolio for maximum effectiveness. Finally we look at using discountedcash flow analysis to measure brand equity and the value of a brand.
THE ROLE OF INTANGIBLE ASSETS
The three core business processes, or marketing, can be seen as: (1) the product development process, which aimsto create solutions that customers want, (2) the supply chain process, which acquires the inputs for those customersolutions and efficiently delivers them and (3) the customer relationship process which identifies customers,understands their needs, builds relationships and shapes the perceptions of the organisation and its brands.[2] Thefirst two processes lead to the sale but the third is essential for continuity, i.e. future sales. The effectiveness withwhich the firm undertakes these processes determines its ability to create a competitive advantage.
Whether this competitive advantage translates into profitable long-term growth is affected by two other factors. Oneis the sustainability of the firm’s competitive advantage. In some markets even strongly advantaged firms do not earnhigh returns because low entry barriers mean that the competitive advantage is quickly copied. A second factor is theappropriability of the value of the advantage. Sometimes parties other than the shareholders appropriate this value.
These may be powerful customers, who are able to use their buying power to drive down the company’s pricesand so appropriate the value themselves. Sometimes suppliers may appropriate the value. Star employees canoccasionally use their specialised skills or fame to leverage the full value of their added value to the firm. Movie starsand football players are examples. Wage demands may then make even organisations or products that lead themarket only marginally profitable as value migrates from shareholders to the suppliers of skills.
Conventional balance sheets show only the firm’s tangible resources or assets. Tangible assets consist of its financialresources and physical assets such as plant and equipment, land and locations. But in today’s information age, tangibleassets represent only a fraction of the value of major companies. For example, the ratio of market value to bookvalue for the world’s top 20 companies averaged 15, and for the Fortune 500 it averaged 8, implying that tangibleassets represented between only 5 and 12 per cent of a company’s total assets.
Most of the resources a modern company uses to build strong core business processes and value for customersand shareholders do not appear on the balance sheet. These intangible assets can be classified into five types:
1. Technological assets. These are proprietary technology in the form of patents, copyrights and trade secrets,or special know-how in the application of technology.
2. Strategic assets. These are licences, natural monopolies or other privileges that restrict competition fromother firms.
3. Reputational assets. These are the name of the company and its brands, which convey the reputation of itsproducts, services and fair dealings with customers, suppliers, the government and the community.
4. Human resources. These are the skills and adaptability of the firm’s employees.
5. Organisation and culture. These are the values and social norms inside the firm that shape the commitmentand loyalty of employees.
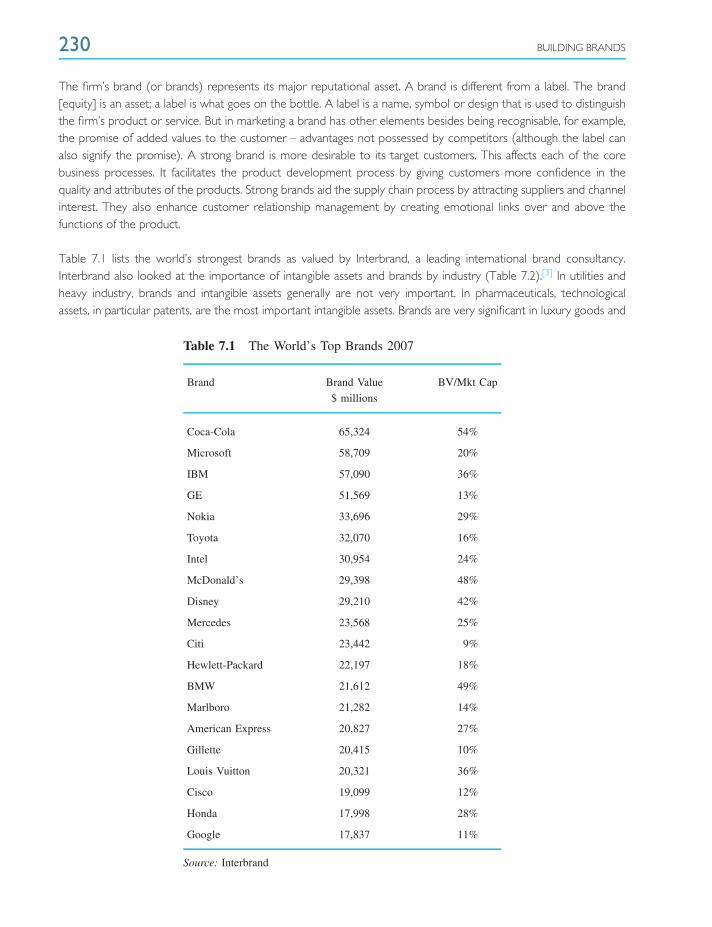
230 BUILDING BRANDS
The firm’s brand (or brands) represents its major reputational asset. A brand is different from a label. The brand[equity] is an asset; a label is what goes on the bottle. A label is a name, symbol or design that is used to distinguishthe firm’s product or service. But in marketing a brand has other elements besides being recognisable, for example,the promise of added values to the customer – advantages not possessed by competitors (although the label canalso signify the promise). A strong brand is more desirable to its target customers. This affects each of the corebusiness processes. It facilitates the product development process by giving customers more confidence in thequality and attributes of the products. Strong brands aid the supply chain process by attracting suppliers and channelinterest. They also enhance customer relationship management by creating emotional links over and above thefunctions of the product.
Table 7.1 lists the world’s strongest brands as valued by Interbrand, a leading international brand consultancy.Interbrand also looked at the importance of intangible assets and brands by industry (Table 7.2).[3] In utilities andheavy industry, brands and intangible assets generally are not very important. In pharmaceuticals, technologicalassets, in particular patents, are the most important intangible assets. Brands are very significant in luxury goods and
Table 7.1 The World’s Top Brands 2007
Brand Brand Value BV/Mkt Cap
$ millions
Coca-Cola 65,324 54%
Microsoft 58,709 20%
IBM 57,090 36%
GE 51,569 13%
Nokia 33,696 29%
Toyota 32,070 16%
Intel 30,954 24%
McDonald’s 29,398 48%
Disney 29,210 42%
Mercedes 23,568 25%
Citi 23,442 9%
Hewlett-Packard 22,197 18%
BMW 21,612 49%
Marlboro 21,282 14%
American Express 20,827 27%
Gillette 20,415 10%
Louis Vuitton 20,321 36%
Cisco 19,099 12%
Honda 17,998 28%
Google 17,837 11%
Source: Interbrand
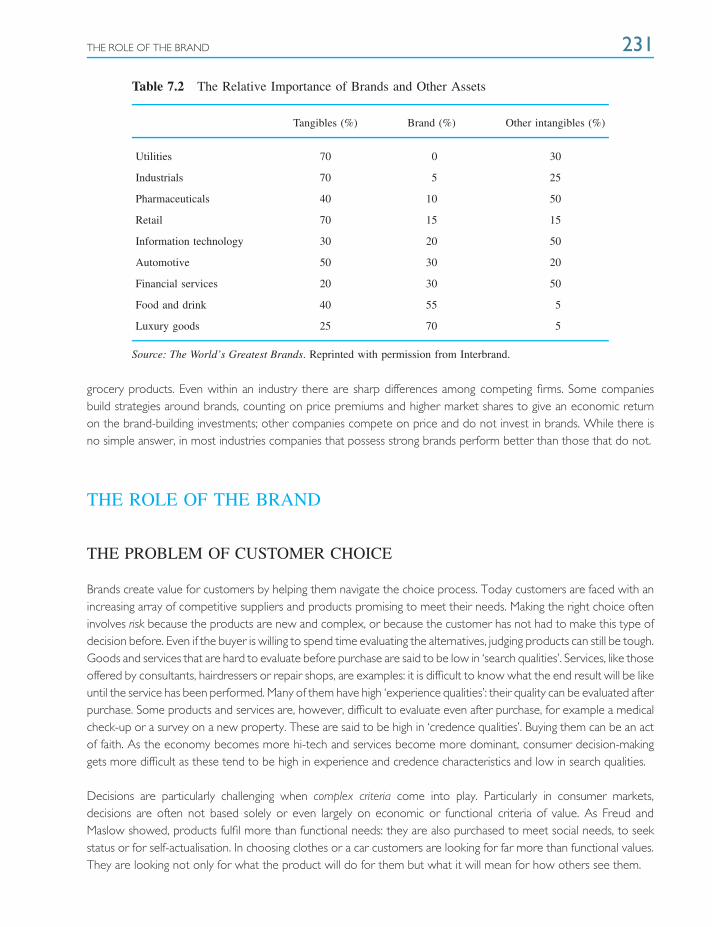
THE ROLE OF THE BRAND 231
Table 7.2 The Relative Importance of Brands and Other Assets
Tangibles (%) Brand (%) Other intangibles (%)
Utilities 70 0 30
Industrials 70 5 25
Pharmaceuticals 40 10 50
Retail 70 15 15
Information technology 30 20 50
Automotive 50 30 20
Financial services 20 30 50
Food and drink 40 55 5
Luxury goods 25 70 5
Source: The World’s Greatest Brands. Reprinted with permission from Interbrand.
grocery products. Even within an industry there are sharp differences among competing firms. Some companiesbuild strategies around brands, counting on price premiums and higher market shares to give an economic returnon the brand-building investments; other companies compete on price and do not invest in brands. While there isno simple answer, in most industries companies that possess strong brands perform better than those that do not.
THE ROLE OF THE BRAND
THE PROBLEM OF CUSTOMER CHOICE
Brands create value for customers by helping them navigate the choice process. Today customers are faced with anincreasing array of competitive suppliers and products promising to meet their needs. Making the right choice ofteninvolves risk because the products are new and complex, or because the customer has not had to make this type ofdecision before. Even if the buyer is willing to spend time evaluating the alternatives, judging products can still be tough.Goods and services that are hard to evaluate before purchase are said to be low in ‘search qualities’. Services, like thoseoffered by consultants, hairdressers or repair shops, are examples: it is difficult to know what the end result will be likeuntil the service has been performed. Many of them have high ‘experience qualities’: their quality can be evaluated afterpurchase. Some products and services are, however, difficult to evaluate even after purchase, for example a medicalcheck-up or a survey on a new property. These are said to be high in ‘credence qualities’. Buying them can be an actof faith. As the economy becomes more hi-tech and services become more dominant, consumer decision-makinggets more difficult as these tend to be high in experience and credence characteristics and low in search qualities.
Decisions are particularly challenging when complex criteria come into play. Particularly in consumer markets,decisions are often not based solely or even largely on economic or functional criteria of value. As Freud andMaslow showed, products fulfil more than functional needs: they are also purchased to meet social needs, to seekstatus or for self-actualisation. In choosing clothes or a car customers are looking for far more than functional values.They are looking not only for what the product will do for them but what it will mean for how others see them.
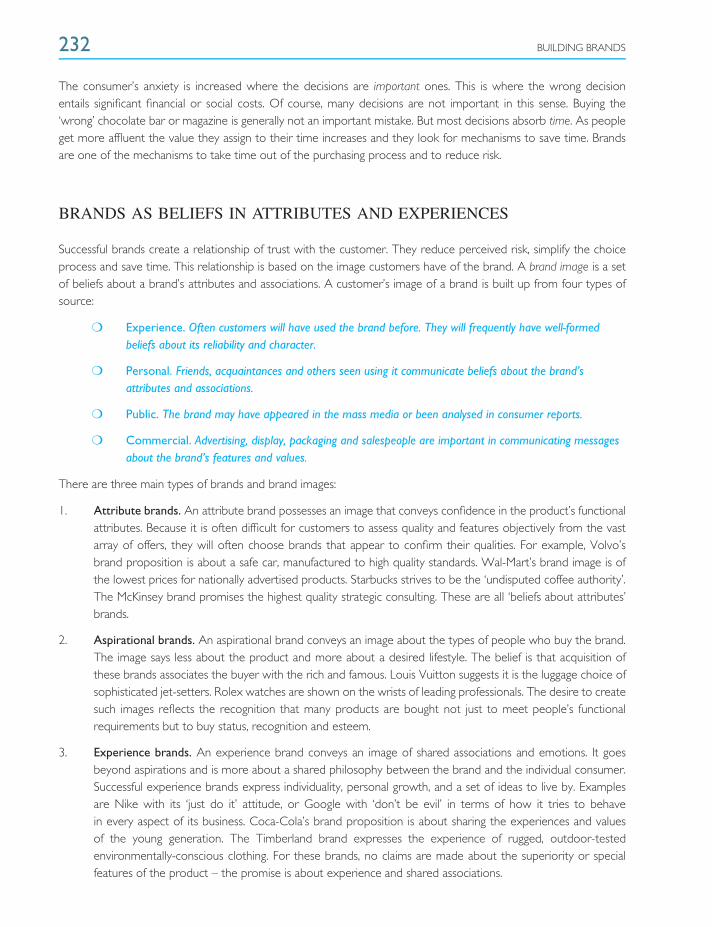
232 BUILDING BRANDS
The consumer’s anxiety is increased where the decisions are important ones. This is where the wrong decisionentails significant financial or social costs. Of course, many decisions are not important in this sense. Buying the‘wrong’ chocolate bar or magazine is generally not an important mistake. But most decisions absorb time. As peopleget more affluent the value they assign to their time increases and they look for mechanisms to save time. Brandsare one of the mechanisms to take time out of the purchasing process and to reduce risk.
BRANDS AS BELIEFS IN ATTRIBUTES AND EXPERIENCES
Successful brands create a relationship of trust with the customer. They reduce perceived risk, simplify the choiceprocess and save time. This relationship is based on the image customers have of the brand. A brand image is a setof beliefs about a brand’s attributes and associations. A customer’s image of a brand is built up from four types ofsource:
❍ Experience. Often customers will have used the brand before. They will frequently have well-formedbeliefs about its reliability and character.
❍ Personal. Friends, acquaintances and others seen using it communicate beliefs about the brand’sattributes and associations.
❍ Public. The brand may have appeared in the mass media or been analysed in consumer reports.
❍ Commercial. Advertising, display, packaging and salespeople are important in communicating messagesabout the brand’s features and values.
There are three main types of brands and brand images:
1. Attribute brands. An attribute brand possesses an image that conveys confidence in the product’s functionalattributes. Because it is often difficult for customers to assess quality and features objectively from the vastarray of offers, they will often choose brands that appear to confirm their qualities. For example, Volvo’sbrand proposition is about a safe car, manufactured to high quality standards. Wal-Mart’s brand image is ofthe lowest prices for nationally advertised products. Starbucks strives to be the ‘undisputed coffee authority’.The McKinsey brand promises the highest quality strategic consulting. These are all ‘beliefs about attributes’brands.
2. Aspirational brands. An aspirational brand conveys an image about the types of people who buy the brand.The image says less about the product and more about a desired lifestyle. The belief is that acquisition ofthese brands associates the buyer with the rich and famous. Louis Vuitton suggests it is the luggage choice ofsophisticated jet-setters. Rolex watches are shown on the wrists of leading professionals. The desire to createsuch images reflects the recognition that many products are bought not just to meet people’s functionalrequirements but to buy status, recognition and esteem.
3. Experience brands. An experience brand conveys an image of shared associations and emotions. It goesbeyond aspirations and is more about a shared philosophy between the brand and the individual consumer.Successful experience brands express individuality, personal growth, and a set of ideas to live by. Examplesare Nike with its ‘just do it’ attitude, or Google with ‘don’t be evil’ in terms of how it tries to behavein every aspect of its business. Coca-Cola’s brand proposition is about sharing the experiences and valuesof the young generation. The Timberland brand expresses the experience of rugged, outdoor-testedenvironmentally-conscious clothing. For these brands, no claims are made about the superiority or specialfeatures of the product – the promise is about experience and shared associations.
THE ROLE OF THE BRAND 233
Table 7.3 Famous Business-to-Business Brands
Accenture GE John Deere
Boeing GlaxoSmithKline McKinsey & Co
Boston Consulting Group Goldman Sachs Merck
Du Pont Harvard Business School Microsoft
The Economist Hewlett-Packard Motorola
FedEx IBM Reuters
Financial Times Intel Canon
The most effective brand image varies with the nature of the market. In business-to-business markets, wherepurchasing tends to be more functional, attribute brands are more important (see Table 7.3). In luxury markets,aspirational brands play a big role. In consumer markets, many companies have been trying to create experiencebrands. Experience brands have a number of advantages over attribute and aspirational brands. The problemwith attribute brands is that with today’s sophisticated technologies it is virtually impossible to retain uniqueproduct features or qualities for any length of time. The availability of more objective information sourcesheightens the problem of attribute claims. For example, customers might read on the Internet about consumertests that demonstrate that Volvo cars are not safer than other models, or that other retailers are as cheap asWal-Mart.
Aspirational brands are threatened by increasing affluence, the declining influence of social class, and the growth ofmore individualistic lifestyles. In the West, people no longer feel the same need to imitate their betters or keep upwith the Joneses. Consumers are becoming more individualistic, preferring to spend money on what makes themhappy than on trying to impress the neighbours. Experience brands are more robust because they do not dependon a product or a ‘look’. Another advantage of experience brands is that, because they are about personal values,they are often capable of greater extendibility than attribute or aspirational brands. The latter tend to be restrictedto their category or closely related markets. By contrast, experience brands can stretch to wherever a buyer’spersonal philosophy can be made relevant.
The archetype of an experience brand is Richard Branson’s Virgin brand, which stands for an unstuffy, irreverent,us-against-them attitude. This has been stretched from music and entertainment to transport (airlines and trains),financial services, media, cosmetics, clothing and mobile phones.
The most important thing about successful brands is that they differentiate. Today even the newest and mostcomplex products can be copied within weeks. It is not difficult to produce a drink that tastes like Coca-Cola, anMP3 player like the iPod, a suit like Armani, or a microprocessor that functions like Intel’s latest Pentium. But peoplewill not buy these products in the same numbers and certainly not at the same prices. People buy the well-knownbrands because they have confidence in their quality, aspire to their status, or because they personally identify withthe brand’s philosophy.
The added values provided by strong brands in the form of risk reduction, confidence and experience are oftendemonstrated. Bartle describes how a parity performance on taste, when two food products are tested ‘blind’,becomes a clear preference for one brand (brand B), when the two products are labelled (Figure 7.2).[4] In anotherexample, for a household product, a clear performance deficiency is removed when brand identities are revealed
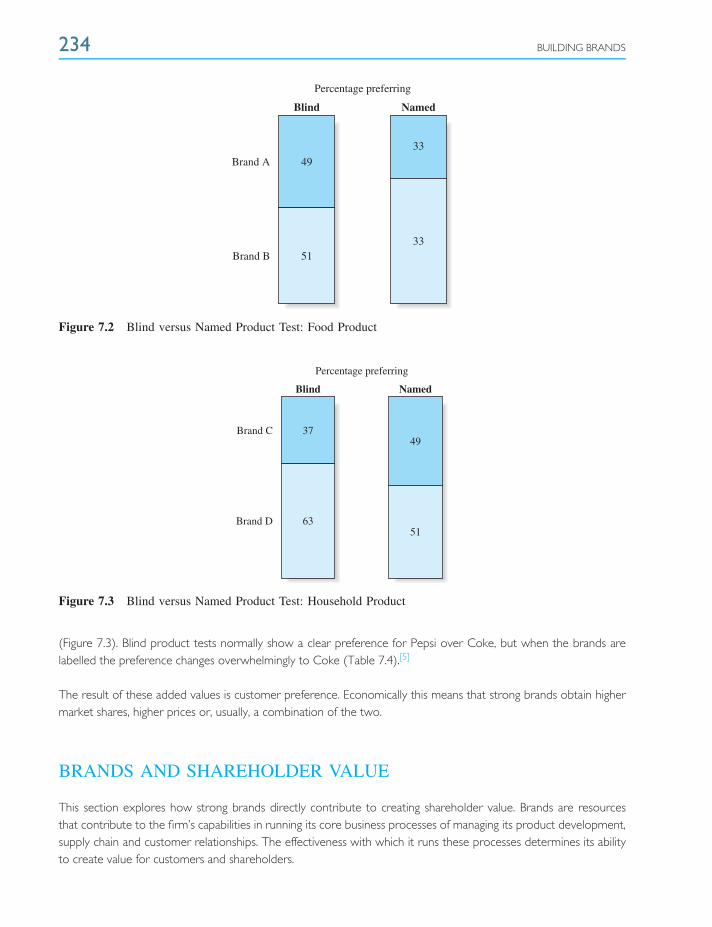
234 BUILDING BRANDS
Percentage preferring
Blind Named
49Brand A
Brand B 51
33
33
Figure 7.2 Blind versus Named Product Test: Food Product
Percentage preferring
Blind Named
Brand C
Brand D
49
51
37
63
Figure 7.3 Blind versus Named Product Test: Household Product
(Figure 7.3). Blind product tests normally show a clear preference for Pepsi over Coke, but when the brands arelabelled the preference changes overwhelmingly to Coke (Table 7.4).[5]
The result of these added values is customer preference. Economically this means that strong brands obtain highermarket shares, higher prices or, usually, a combination of the two.
BRANDS AND SHAREHOLDER VALUE
This section explores how strong brands directly contribute to creating shareholder value. Brands are resourcesthat contribute to the firm’s capabilities in running its core business processes of managing its product development,supply chain and customer relationships. The effectiveness with which it runs these processes determines its abilityto create value for customers and shareholders.
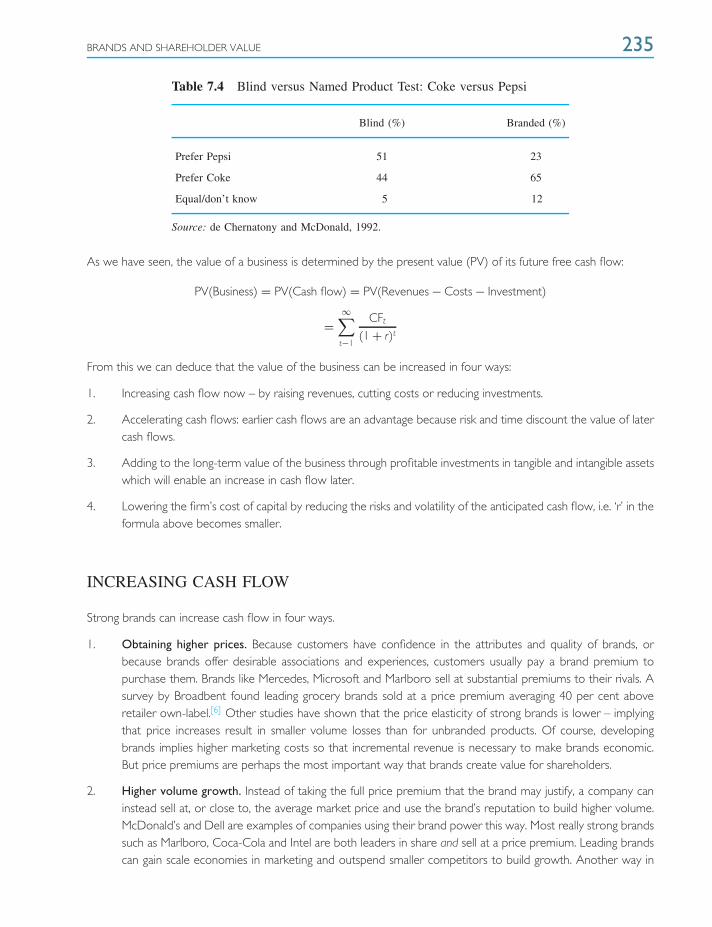
BRANDS AND SHAREHOLDER VALUE 235
Table 7.4 Blind versus Named Product Test: Coke versus Pepsi
Blind (%) Branded (%)
Prefer Pepsi 51 23
Prefer Coke 44 65
Equal/don’t know 5 12
Source: de Chernatony and McDonald, 1992.
As we have seen, the value of a business is determined by the present value (PV) of its future free cash flow:
PV(Business) = PV(Cash flow) = PV(Revenues − Costs − Investment)
=∞∑
t−1
CFt
(1 + r)t
From this we can deduce that the value of the business can be increased in four ways:
1. Increasing cash flow now – by raising revenues, cutting costs or reducing investments.
2. Accelerating cash flows: earlier cash flows are an advantage because risk and time discount the value of latercash flows.
3. Adding to the long-term value of the business through profitable investments in tangible and intangible assetswhich will enable an increase in cash flow later.
4. Lowering the firm’s cost of capital by reducing the risks and volatility of the anticipated cash flow, i.e. ‘r’ in theformula above becomes smaller.
INCREASING CASH FLOW
Strong brands can increase cash flow in four ways.
1. Obtaining higher prices. Because customers have confidence in the attributes and quality of brands, orbecause brands offer desirable associations and experiences, customers usually pay a brand premium topurchase them. Brands like Mercedes, Microsoft and Marlboro sell at substantial premiums to their rivals. Asurvey by Broadbent found leading grocery brands sold at a price premium averaging 40 per cent aboveretailer own-label.[6] Other studies have shown that the price elasticity of strong brands is lower – implyingthat price increases result in smaller volume losses than for unbranded products. Of course, developingbrands implies higher marketing costs so that incremental revenue is necessary to make brands economic.But price premiums are perhaps the most important way that brands create value for shareholders.
2. Higher volume growth. Instead of taking the full price premium that the brand may justify, a company caninstead sell at, or close to, the average market price and use the brand’s reputation to build higher volume.McDonald’s and Dell are examples of companies using their brand power this way. Most really strong brandssuch as Marlboro, Coca-Cola and Intel are both leaders in share and sell at a price premium. Leading brandscan gain scale economies in marketing and outspend smaller competitors to build growth. Another way in

236 BUILDING BRANDS
which strong brands increase growth is via line and brand extensions, which enable them to cover the marketmore fully or move into additional markets.
3. Lower costs. Brand leaders gain economies of scale that often result in lower costs. Buying power canmean lower variable costs. But it is in fixed costs, especially marketing and distribution costs, where brandleaders have their biggest advantage. Most marketing costs are fixed. For example, the minimum cost to runa national advertising campaign or national sales force is the same whether the brand share is 5 per cent or50 per cent. This means that while brand leaders generally spend more in absolute terms than their smallercompetitors, their unit marketing cost is lower.
4. Higher asset utilisation. Strong brands often have more opportunities to economise in fixed and workingcapital. They can obtain scale economies in plant and distribution. Suppliers and distributors also have agreater incentive to integrate their supply chains with companies possessing strong brands. This can lead tosignificant reductions in inventories, manufacturing and distribution assets.
Table 7.5 illustrates how these four factors operating together can augment the cash flow of a strong brand. Herethe brand leader sells three times the volume of the follower and also has a brand premium of 10 per cent. Itsbuying power gives it a 5 per cent advantage in unit variable costs. The brand leader’s fixed costs are £18 millionmore, yet in terms of fixed cost per unit, the follower is 20 per cent more costly. Both brands are assumed to havebeen growing sales by 5 per cent annually; the leader’s investment rate is 40 per cent of additional sales and thefollower’s is 45 per cent. The result is that the brand leader’s market share advantage of 3:1 turns into a free cashflow advantage of 8:1. In addition, with its much higher marketing spend, the brand leader is in a strong position toincrease even further its market dominance (see box, ‘The Importance of Market Share’).
ACCELERATING CASH FLOW
Brands can increase shareholder value by generating cash flows sooner than otherwise. The faster the companyreceives cash flow, the higher is its net present value. There is considerable evidence that consumers respondquicker to marketing campaigns when they are already familiar with the brand and have positive attitudes towards it.
Table 7.5 Brand Strength and Cash Flow
Brand leader Brand follower
Volume (m units) 100 33
Price (£) 1.00 0.9
Revenue (£m) 100 29.7
Variable costs (£m) 40 (0.4/unit) 13.86 (0.42/unit)
Fixed costs 30 (0.3/unit) 12 (0.36/unit)
Operating earnings 10 1.86
Tax 3 0.56
NOPAT 7 1.3
Net investment 2 0.67
Free cash flow 5 0.63
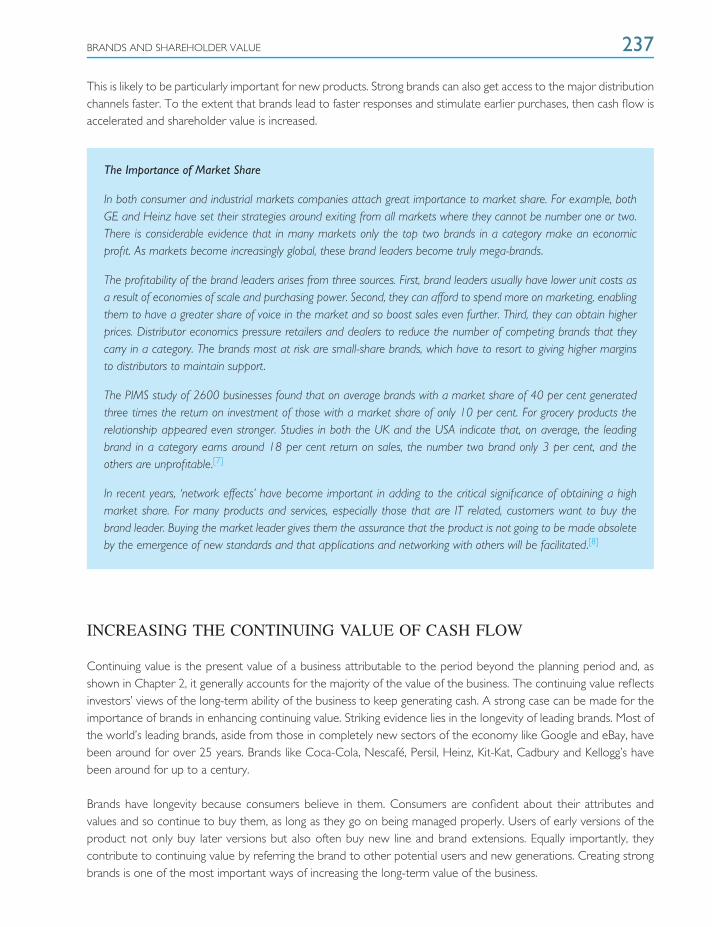
BRANDS AND SHAREHOLDER VALUE 237
This is likely to be particularly important for new products. Strong brands can also get access to the major distributionchannels faster. To the extent that brands lead to faster responses and stimulate earlier purchases, then cash flow isaccelerated and shareholder value is increased.
The Importance of Market Share
In both consumer and industrial markets companies attach great importance to market share. For example, bothGE and Heinz have set their strategies around exiting from all markets where they cannot be number one or two.There is considerable evidence that in many markets only the top two brands in a category make an economicprofit. As markets become increasingly global, these brand leaders become truly mega-brands.
The profitability of the brand leaders arises from three sources. First, brand leaders usually have lower unit costs asa result of economies of scale and purchasing power. Second, they can afford to spend more on marketing, enablingthem to have a greater share of voice in the market and so boost sales even further. Third, they can obtain higherprices. Distributor economics pressure retailers and dealers to reduce the number of competing brands that theycarry in a category. The brands most at risk are small-share brands, which have to resort to giving higher marginsto distributors to maintain support.
The PIMS study of 2600 businesses found that on average brands with a market share of 40 per cent generatedthree times the return on investment of those with a market share of only 10 per cent. For grocery products therelationship appeared even stronger. Studies in both the UK and the USA indicate that, on average, the leadingbrand in a category earns around 18 per cent return on sales, the number two brand only 3 per cent, and theothers are unprofitable.[7]
In recent years, ‘network effects’ have become important in adding to the critical significance of obtaining a highmarket share. For many products and services, especially those that are IT related, customers want to buy thebrand leader. Buying the market leader gives them the assurance that the product is not going to be made obsoleteby the emergence of new standards and that applications and networking with others will be facilitated.[8]
INCREASING THE CONTINUING VALUE OF CASH FLOW
Continuing value is the present value of a business attributable to the period beyond the planning period and, asshown in Chapter 2, it generally accounts for the majority of the value of the business. The continuing value reflectsinvestors’ views of the long-term ability of the business to keep generating cash. A strong case can be made for theimportance of brands in enhancing continuing value. Striking evidence lies in the longevity of leading brands. Most ofthe world’s leading brands, aside from those in completely new sectors of the economy like Google and eBay, havebeen around for over 25 years. Brands like Coca-Cola, Nescafe, Persil, Heinz, Kit-Kat, Cadbury and Kellogg’s havebeen around for up to a century.
Brands have longevity because consumers believe in them. Consumers are confident about their attributes andvalues and so continue to buy them, as long as they go on being managed properly. Users of early versions of theproduct not only buy later versions but also often buy new line and brand extensions. Equally importantly, theycontribute to continuing value by referring the brand to other potential users and new generations. Creating strongbrands is one of the most important ways of increasing the long-term value of the business.

238 BUILDING BRANDS
REDUCING THE COST OF CAPITAL
The company’s cost of capital is influenced by the risk attached to its cash flow. Cash flows that are more stable andpredictable will have a higher net present value and consequently create more shareholder value. Strong brandsreduce a company’s vulnerability to competitive attack. While products are easy to copy, the evidence suggests thatstrong brands are not. Brand identity is a significant barrier to entry and so acts to reduce the vulnerability of cashflow.
The volatility of cash flow is also often reduced for strong brands because brand loyalty promotes stability inoperations. With a loyal customer base the company does not have to risk major investments in winning largenumbers of new customers. This is important because the cost of winning new customers is much greater than thecost of retaining existing ones.
HOW TO BUILD BRANDS
FROM PRODUCTS TO BRANDS
A successful brand image BS can be thought of as the combination of three elements: a good product (P), adistinctive identity (D), and added values (AV):
Bs = P × D × AV
The relationship is multiplicative, indicating that all three elements are necessary to create a successful brand.Developing a brand starts with having an effective product. Product effectiveness can normally be measured in blindproduct tests. Next, the product has to be given a distinctive identity so that customers can recognise it and askfor it by name. This is usually measured by prompted and unprompted awareness. Finally, and most crucially, asuccessful brand has to have added values that elicit confidence in consumers that it is of higher quality or is moredesirable than similar products from competitors. Added values can be measured through market research intoattitudes and preferences.
Having an effective product alone is not sufficient to earn economic profits. Competition only at the product leveleventually makes it a commodity-type business and price becomes the major factor in customer choice. Mostcompanies attach their names to their products so that they become recognisable, but again this is insufficient tocreate preference. Being distinctive is not the same as being seen as better. Preference depends upon the lastingredient: added values that give customers confidence that this product has qualities, status or associations notpossessed by alternative choices.
The process of brand building is often described as a series of layers (Figure 7.4). The starting point is a product(or service) that meets a customer need. But however innovative or effective the product, it rarely forms the basisof a sustainable advantage. First, competitors can usually rapidly copy new products. For example, Gillette spentthree years and over $1 billion developing the first version of its Mach3 razor which it launched in 1998. But onemonth after it was launched a retailer own-label copy of it had been introduced. In most markets today, thereare no major quality differences among the leading competitors. Because manufacturing is often such a low-valueactivity, even the most innovative companies increasingly outsource making the product to third parties. A second

HOW TO BUILD BRANDS 239
Extras
Training
Guarantees Installation
Technicalsupport
Delivery
1. Product
2. Basic brand
3. Augmented brand
4. Potential brand
Services
Name
Design
Logos
QualityPack
Features
Figure 7.4 The Process of Brand Building
problem is emphasised in the basic marketing concept – people do not want products, they want solutions to theirproblems. Products are not bought for their own sake, but for the satisfaction they provide. In particular, emotionalvalues – confidence, perceived status and personal fulfilment – are all major influences on choice.
The second layer builds a basic brand around the product. The primary function of this stage is to differentiate thecompany’s product from competitors and to make customers aware of it. At the same time management will wantto ensure that the differentiators are consistent with the added values they want to associate with the brand. Themost obvious ways in which the basic brand is built, differentiated and customers made aware of it are through thechoices of brand name, packaging, design, advertising and promotion.
The third layer of branding is the augmented brand. The objective here is to make the brand more desirable anddifferentiated by adding benefits. These typically include additional services such as free delivery, technical support,training, guarantees, credit and other financial terms. The final layer of branding is the creation of the potential brandwhereby it succeeds in possessing the added values of emotional associations of confidence, status or identificationthat secure brand preference and loyalty. The potential brand status achieved by such brands as Sony, McDonald’sand BMW is usually the result of a long period of sustained investment in marketing communications allied to astrong concern for the quality and consistency of the products and services that are offered.
DEVELOPING BRAND IDENTITY
THE BRAND COMMUNICATIONS PROCESS
Brand management centres on creating perceived added value for the company’s offer among customers. Themanager does this by shaping the brand’s identity. The perceived brand identity is what the customer perceives; theintended brand identity is the message about the brand that the marketer wants customers to receive. This brand
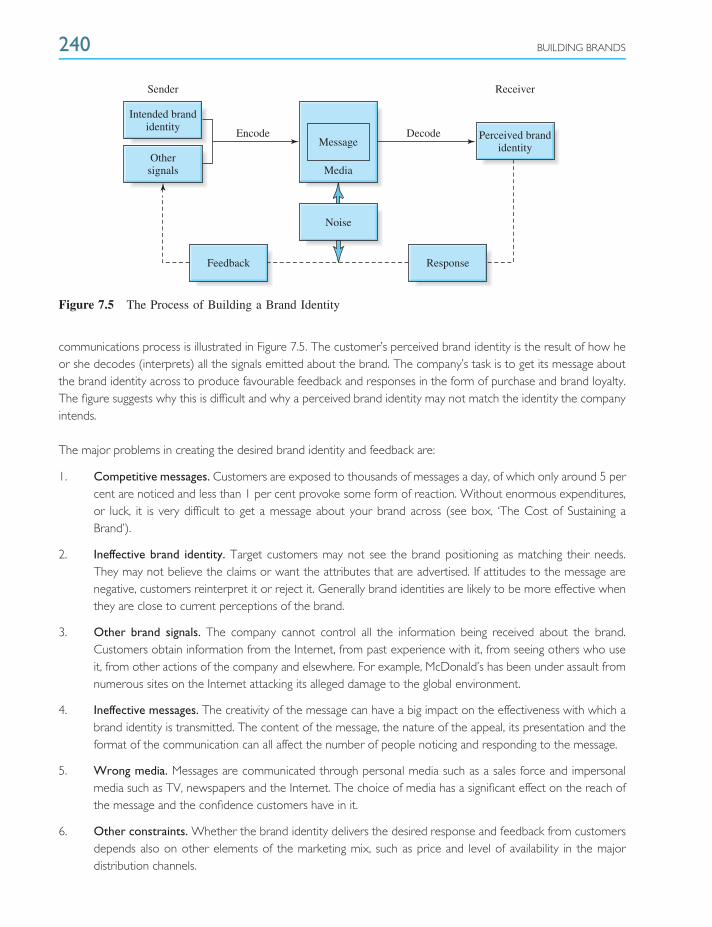
240 BUILDING BRANDS
Sender Receiver
Encode Decode
Response
Message
Media
Noise
Feedback
Intended brandidentity
Perceived brandidentity
Othersignals
Figure 7.5 The Process of Building a Brand Identity
communications process is illustrated in Figure 7.5. The customer’s perceived brand identity is the result of how heor she decodes (interprets) all the signals emitted about the brand. The company’s task is to get its message aboutthe brand identity across to produce favourable feedback and responses in the form of purchase and brand loyalty.The figure suggests why this is difficult and why a perceived brand identity may not match the identity the companyintends.
The major problems in creating the desired brand identity and feedback are:
1. Competitive messages. Customers are exposed to thousands of messages a day, of which only around 5 percent are noticed and less than 1 per cent provoke some form of reaction. Without enormous expenditures,or luck, it is very difficult to get a message about your brand across (see box, ‘The Cost of Sustaining aBrand’).
2. Ineffective brand identity. Target customers may not see the brand positioning as matching their needs.They may not believe the claims or want the attributes that are advertised. If attitudes to the message arenegative, customers reinterpret it or reject it. Generally brand identities are likely to be more effective whenthey are close to current perceptions of the brand.
3. Other brand signals. The company cannot control all the information being received about the brand.Customers obtain information from the Internet, from past experience with it, from seeing others who useit, from other actions of the company and elsewhere. For example, McDonald’s has been under assault fromnumerous sites on the Internet attacking its alleged damage to the global environment.
4. Ineffective messages. The creativity of the message can have a big impact on the effectiveness with which abrand identity is transmitted. The content of the message, the nature of the appeal, its presentation and theformat of the communication can all affect the number of people noticing and responding to the message.
5. Wrong media. Messages are communicated through personal media such as a sales force and impersonalmedia such as TV, newspapers and the Internet. The choice of media has a significant effect on the reach ofthe message and the confidence customers have in it.
6. Other constraints. Whether the brand identity delivers the desired response and feedback from customersdepends also on other elements of the marketing mix, such as price and level of availability in the majordistribution channels.
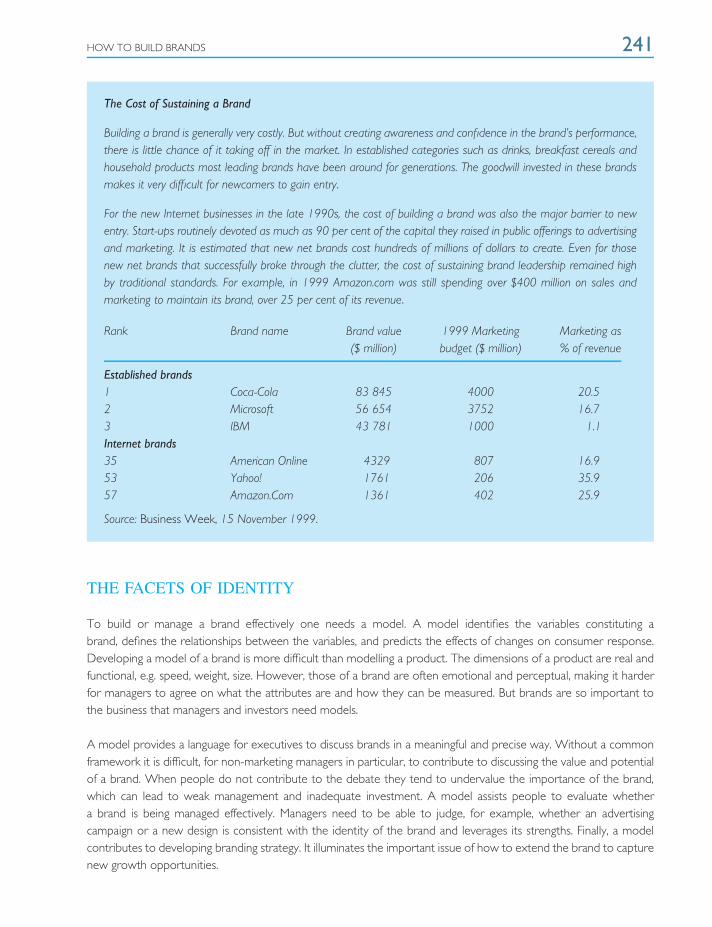
HOW TO BUILD BRANDS 241
The Cost of Sustaining a Brand
Building a brand is generally very costly. But without creating awareness and confidence in the brand’s performance,there is little chance of it taking off in the market. In established categories such as drinks, breakfast cereals andhousehold products most leading brands have been around for generations. The goodwill invested in these brandsmakes it very difficult for newcomers to gain entry.
For the new Internet businesses in the late 1990s, the cost of building a brand was also the major barrier to newentry. Start-ups routinely devoted as much as 90 per cent of the capital they raised in public offerings to advertisingand marketing. It is estimated that new net brands cost hundreds of millions of dollars to create. Even for thosenew net brands that successfully broke through the clutter, the cost of sustaining brand leadership remained highby traditional standards. For example, in 1999 Amazon.com was still spending over $400 million on sales andmarketing to maintain its brand, over 25 per cent of its revenue.
Rank Brand name Brand value 1999 Marketing Marketing as($ million) budget ($ million) % of revenue
Established brands1 Coca-Cola 83 845 4000 20.52 Microsoft 56 654 3752 16.73 IBM 43 781 1000 1.1Internet brands35 American Online 4329 807 16.953 Yahoo! 1761 206 35.957 Amazon.Com 1361 402 25.9
Source: Business Week, 15 November 1999.
THE FACETS OF IDENTITY
To build or manage a brand effectively one needs a model. A model identifies the variables constituting abrand, defines the relationships between the variables, and predicts the effects of changes on consumer response.Developing a model of a brand is more difficult than modelling a product. The dimensions of a product are real andfunctional, e.g. speed, weight, size. However, those of a brand are often emotional and perceptual, making it harderfor managers to agree on what the attributes are and how they can be measured. But brands are so important tothe business that managers and investors need models.
A model provides a language for executives to discuss brands in a meaningful and precise way. Without a commonframework it is difficult, for non-marketing managers in particular, to contribute to discussing the value and potentialof a brand. When people do not contribute to the debate they tend to undervalue the importance of the brand,which can lead to weak management and inadequate investment. A model assists people to evaluate whethera brand is being managed effectively. Managers need to be able to judge, for example, whether an advertisingcampaign or a new design is consistent with the identity of the brand and leverages its strengths. Finally, a modelcontributes to developing branding strategy. It illuminates the important issue of how to extend the brand to capturenew growth opportunities.
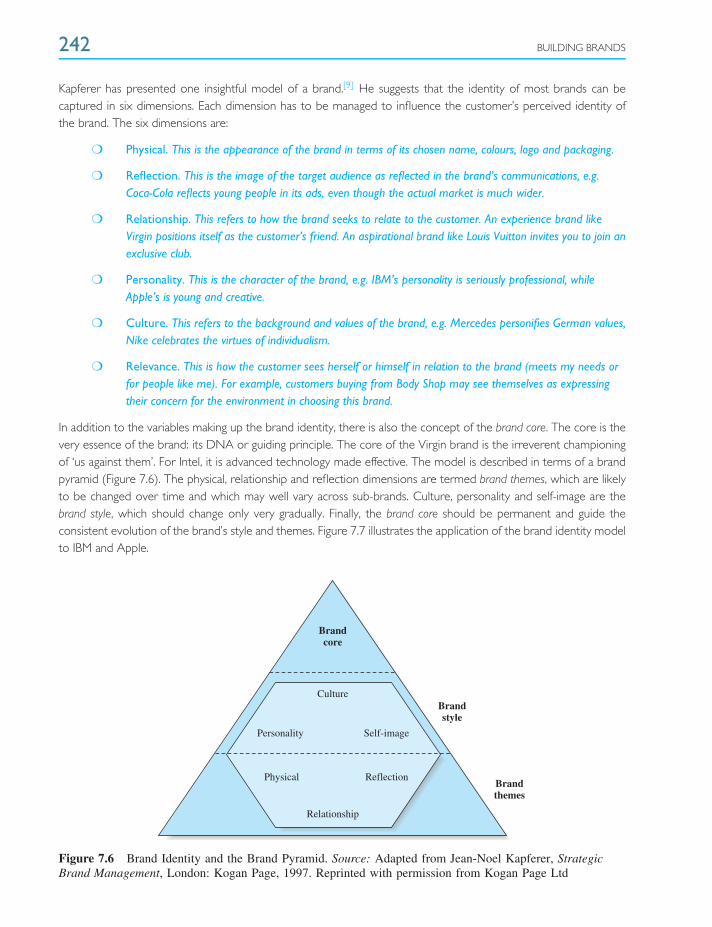
242 BUILDING BRANDS
Kapferer has presented one insightful model of a brand.[9] He suggests that the identity of most brands can becaptured in six dimensions. Each dimension has to be managed to influence the customer’s perceived identity ofthe brand. The six dimensions are:
❍ Physical. This is the appearance of the brand in terms of its chosen name, colours, logo and packaging.
❍ Reflection. This is the image of the target audience as reflected in the brand’s communications, e.g.Coca-Cola reflects young people in its ads, even though the actual market is much wider.
❍ Relationship. This refers to how the brand seeks to relate to the customer. An experience brand likeVirgin positions itself as the customer’s friend. An aspirational brand like Louis Vuitton invites you to join anexclusive club.
❍ Personality. This is the character of the brand, e.g. IBM’s personality is seriously professional, whileApple’s is young and creative.
❍ Culture. This refers to the background and values of the brand, e.g. Mercedes personifies German values,Nike celebrates the virtues of individualism.
❍ Relevance. This is how the customer sees herself or himself in relation to the brand (meets my needs orfor people like me). For example, customers buying from Body Shop may see themselves as expressingtheir concern for the environment in choosing this brand.
In addition to the variables making up the brand identity, there is also the concept of the brand core. The core is thevery essence of the brand: its DNA or guiding principle. The core of the Virgin brand is the irreverent championingof ‘us against them’. For Intel, it is advanced technology made effective. The model is described in terms of a brandpyramid (Figure 7.6). The physical, relationship and reflection dimensions are termed brand themes, which are likelyto be changed over time and which may well vary across sub-brands. Culture, personality and self-image are thebrand style, which should change only very gradually. Finally, the brand core should be permanent and guide theconsistent evolution of the brand’s style and themes. Figure 7.7 illustrates the application of the brand identity modelto IBM and Apple.
Brandcore
Brandstyle
Brandthemes
Culture
Relationship
Personality
Physical Reflection
Self-image
Figure 7.6 Brand Identity and the Brand Pyramid. Source: Adapted from Jean-Noel Kapferer, StrategicBrand Management, London: Kogan Page, 1997. Reprinted with permission from Kogan Page Ltd
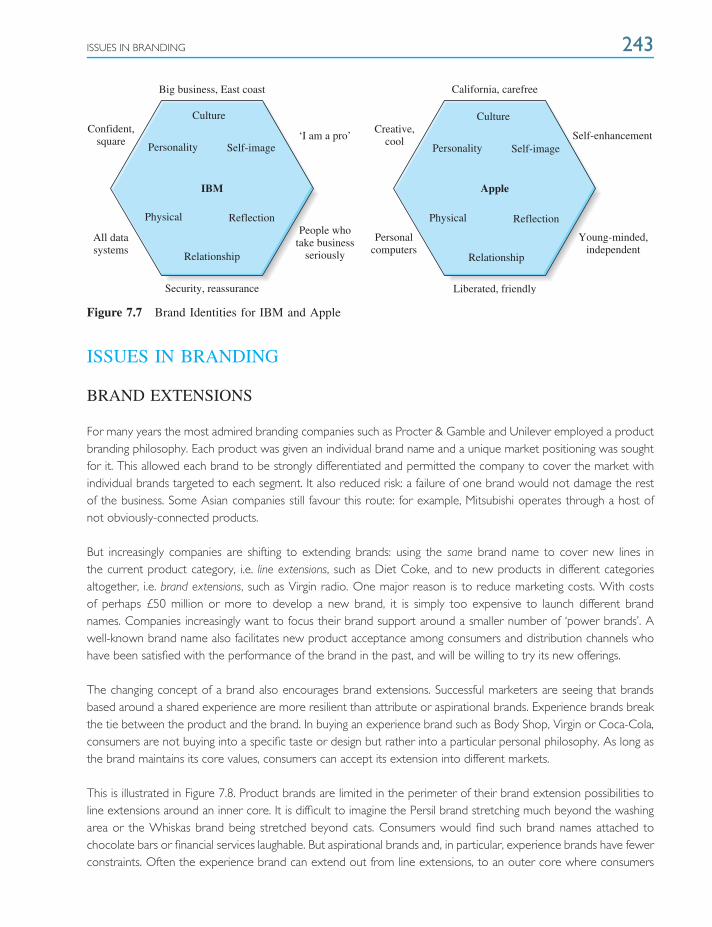
ISSUES IN BRANDING 243
Culture
Personality Self-image
Physical Reflection
Relationship
Culture
Personality Self-image
Physical Reflection
Relationship
Big business, East coast
Confident,square ‘I am a pro’
IBM Apple
People whotake business
seriously
Personalcomputers
Creative,cool
California, carefree
Self-enhancement
Young-minded,independent
Liberated, friendly
All data systems
Security, reassurance
Figure 7.7 Brand Identities for IBM and Apple
ISSUES IN BRANDING
BRAND EXTENSIONS
For many years the most admired branding companies such as Procter & Gamble and Unilever employed a productbranding philosophy. Each product was given an individual brand name and a unique market positioning was soughtfor it. This allowed each brand to be strongly differentiated and permitted the company to cover the market withindividual brands targeted to each segment. It also reduced risk: a failure of one brand would not damage the restof the business. Some Asian companies still favour this route: for example, Mitsubishi operates through a host ofnot obviously-connected products.
But increasingly companies are shifting to extending brands: using the same brand name to cover new lines inthe current product category, i.e. line extensions, such as Diet Coke, and to new products in different categoriesaltogether, i.e. brand extensions, such as Virgin radio. One major reason is to reduce marketing costs. With costsof perhaps £50 million or more to develop a new brand, it is simply too expensive to launch different brandnames. Companies increasingly want to focus their brand support around a smaller number of ‘power brands’. Awell-known brand name also facilitates new product acceptance among consumers and distribution channels whohave been satisfied with the performance of the brand in the past, and will be willing to try its new offerings.
The changing concept of a brand also encourages brand extensions. Successful marketers are seeing that brandsbased around a shared experience are more resilient than attribute or aspirational brands. Experience brands breakthe tie between the product and the brand. In buying an experience brand such as Body Shop, Virgin or Coca-Cola,consumers are not buying into a specific taste or design but rather into a particular personal philosophy. As long asthe brand maintains its core values, consumers can accept its extension into different markets.
This is illustrated in Figure 7.8. Product brands are limited in the perimeter of their brand extension possibilities toline extensions around an inner core. It is difficult to imagine the Persil brand stretching much beyond the washingarea or the Whiskas brand being stretched beyond cats. Consumers would find such brand names attached tochocolate bars or financial services laughable. But aspirational brands and, in particular, experience brands have fewerconstraints. Often the experience brand can extend out from line extensions, to an outer core where consumers
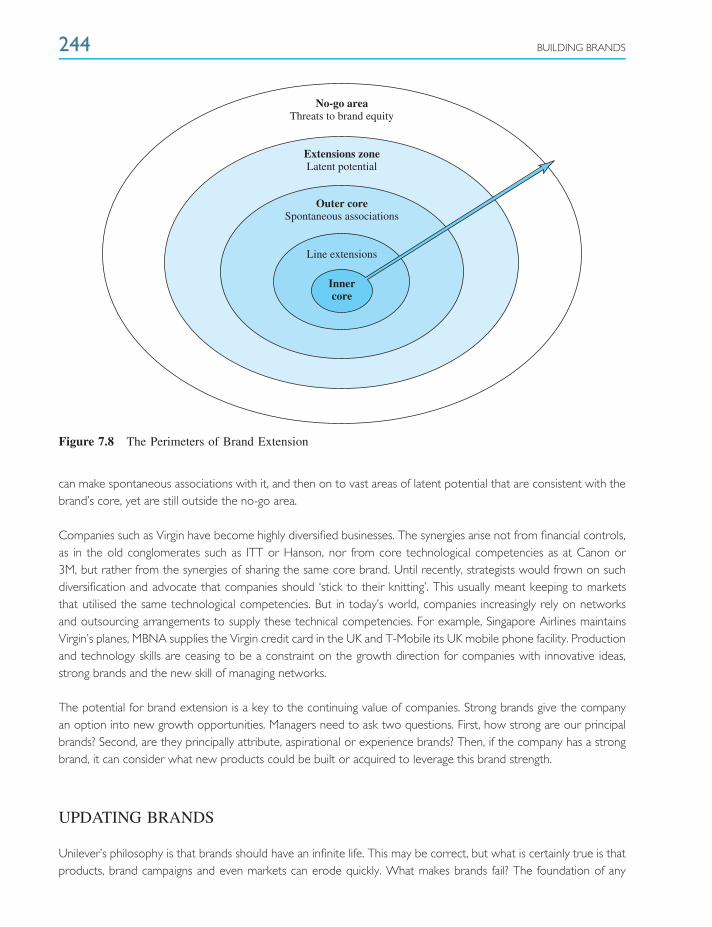
244 BUILDING BRANDS
No-go area Threats to brand equity
Extensions zone Latent potential
Outer core Spontaneous associations
Innercore
Line extensions
Figure 7.8 The Perimeters of Brand Extension
can make spontaneous associations with it, and then on to vast areas of latent potential that are consistent with thebrand’s core, yet are still outside the no-go area.
Companies such as Virgin have become highly diversified businesses. The synergies arise not from financial controls,as in the old conglomerates such as ITT or Hanson, nor from core technological competencies as at Canon or3M, but rather from the synergies of sharing the same core brand. Until recently, strategists would frown on suchdiversification and advocate that companies should ‘stick to their knitting’. This usually meant keeping to marketsthat utilised the same technological competencies. But in today’s world, companies increasingly rely on networksand outsourcing arrangements to supply these technical competencies. For example, Singapore Airlines maintainsVirgin’s planes, MBNA supplies the Virgin credit card in the UK and T-Mobile its UK mobile phone facility. Productionand technology skills are ceasing to be a constraint on the growth direction for companies with innovative ideas,strong brands and the new skill of managing networks.
The potential for brand extension is a key to the continuing value of companies. Strong brands give the companyan option into new growth opportunities. Managers need to ask two questions. First, how strong are our principalbrands? Second, are they principally attribute, aspirational or experience brands? Then, if the company has a strongbrand, it can consider what new products could be built or acquired to leverage this brand strength.
UPDATING BRANDS
Unilever’s philosophy is that brands should have an infinite life. This may be correct, but what is certainly true is thatproducts, brand campaigns and even markets can erode quickly. What makes brands fail? The foundation of any
ISSUES IN BRANDING 245
brand is its product. If the firm allows the quality of the product to erode or become outdated or competitive, thebrand will fail (see box, ‘Revitalising the Jaguar Brand’). Even if the quality remains acceptable, technological advances,new competition, changing needs and new fashions invariably date products over time. No brand name can save aproduct that has become obsolete or irrelevant to consumers.
Revitalising the Jaguar Brand
Founded in the 1920s, Jaguar was one of the greatest car brands, admired for its sporting successes and distinctiveclassic styling. But Jaguar failed to match the rising product quality standards that occurred in the car industry duringthe 1960s and 70s. Disenchanted by the cars’ unreliability and poor finish, consumers switched to other brands,such as Mercedes and BMW.
Eventually the loss-making company was acquired by Ford. The first task was to improve Jaguar’s quality andtechnology. But the new management recognised that these were entry requirements and were not enough torestore Jaguar to health. Chairman Walter Reitzle recognised that by the late 1990s ‘there were no bad cars onthe market; quality is now given, not a matter of differentiation’. Technology faced the same problem. Technologyin the car industry was converging as the systems-supply industry consolidated.
Today, if a car maker gets a lead on a new component, that advantage is fleeting. You might enjoy exclusivity on abreakthrough in technology for 12 months, maximum, says Reitzle. But because of the ramp-up curve involved inusing technology, all your competitors will have it almost before the customer even realises that there is somethingnew out there.
Although Jaguar continued to lose Ford money in the late 1990s, improvement in design carried on and, even asFord sold the marque in 2007, one of its new models won a car of the year award in the UK. This is expected tobe the salvation of Jaguar.
Brand presentation is also likely to get dated. The physical presentation of the product, including its packaging,colours and logos, will need to be updated if they are going to mirror current lifestyles. Similarly the brand’sspokesperson and reflection need modernising as time progresses. Sometimes the brand’s market may erode,requiring radical repositioning. For example, warmer winters and the spread of central heating sapped sales ofDamart thermalwear. Consumers were less willing to sacrifice aesthetics for practicality. The brand had to berevitalised with new products, new themes and new relationships to fit today’s fashion markets and is now amulti-channel specialist in women’s clothing, including thermal wear.
If a brand, or set of brands, ceases to generate value for shareholders then management has four alternatives:repositioning, revitalisation, improving brand productivity or brand elimination.
BRAND REPOSITIONING
Repositioning the brand is a viable alternative if the brand has a weak position in an attractive market. There areseveral ways to do this:
❍ Real repositioning. Managers may need to update the product by improving its quality or updating itstechnology, functions or design. This is how Jaguar was turned around at the end of the 1990s.

246 BUILDING BRANDS
❍ Augmenting the brand. Offering additional products and services alongside the core product can increasethe brand’s value. Hotels have added leisure facilities, bars, and entertainment on top of their coreproduct, accommodation.
❍ Psychological repositioning. The company can seek to change buyers’ beliefs about the quality of theproduct’s attributes, the status of the brand or the philosophy behind it. Unfortunately, people’s beliefs,once formed, are difficult to alter.
❍ Reweighting values. Sometimes buyers can be persuaded to attach greater importance to certain valuesin which the brand excels. Lexus, for example, emphasised quietness as a factor in choosing a luxury car.
❍ Neglected values. Occasionally new attributes are introduced. Unilever’s new Radion detergent waspositioned on the claim that it removes odours as well as dirt, an attribute not previously consideredrelevant in the market. The brand, however, did not have staying power (some blamed it on the stridentadvertising): it disappeared after 10 years by being rolled into another detergent brand, Surf.
❍ Changing preferences. Sometimes buyers can be persuaded to change their preferences. Scare stories inthe media created a preference for non-genetically modified foods and ingredients.
❍ Competitive depositioning. In some countries it is possible to use comparative advertising to underminethe value of competitors’ brands.
BRAND REVITALISATION
Brand revitalisation is a strategy for when the brand is potentially strong but its current market is not sufficientlyattractive to offer adequate profit opportunities. There are four ways forward:
❍ Find new markets. Developing new international markets has been a key means of maintaining thegrowth of strong brands such as Coca-Cola, McDonald’s and Starbucks after they reached maturity intheir US home market.
❍ Enter new segments. Developing new segments is one of the most important ways to expand the marketfor a brand. Growing awareness in the market and falling prices are important stimuli, particularly inhi-tech markets. Line extensions are a flexible way to push into new market segments.
❍ Find new applications. Companies can find new applications for the brand. The classic example is Arm &Hammer Baking Soda, which increased its sales significantly over the past 25 years by finding newapplications as a deodoriser and cleaner for refrigerators, sinks, animals and even in toothpaste.
❍ Increase the usage rate. The average consumption rate can be increased, for example by making theproduct easier to use (instant tea), reducing the disincentives to use (decaffeinated coffee), providingincentives for use (frequent flyer discounts), and finding new ways to increase the quantity consumed(large bottles).
IMPROVING BRAND PRODUCTIVITY
When the market matures it makes sense to take a harder look at profitability. First, costs – fixed and variable – canoften be cut. However, management must recognise that reducing marketing spend may well lead to a long-termerosion of the brand’s market share. Second, cash flow can be boosted by reducing working and fixed capital
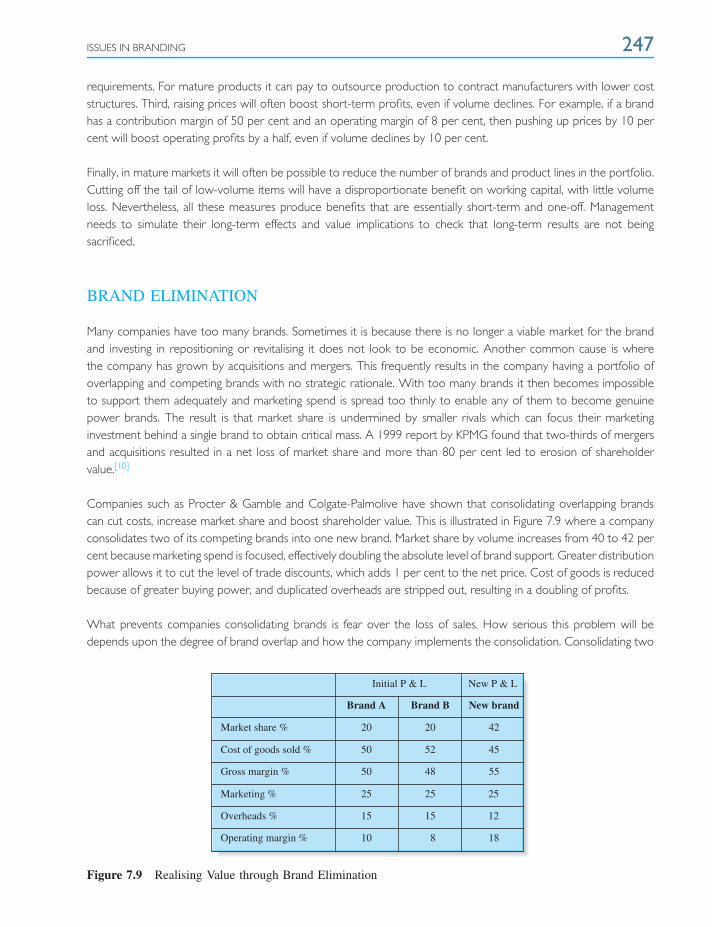
ISSUES IN BRANDING 247
requirements. For mature products it can pay to outsource production to contract manufacturers with lower coststructures. Third, raising prices will often boost short-term profits, even if volume declines. For example, if a brandhas a contribution margin of 50 per cent and an operating margin of 8 per cent, then pushing up prices by 10 percent will boost operating profits by a half, even if volume declines by 10 per cent.
Finally, in mature markets it will often be possible to reduce the number of brands and product lines in the portfolio.Cutting off the tail of low-volume items will have a disproportionate benefit on working capital, with little volumeloss. Nevertheless, all these measures produce benefits that are essentially short-term and one-off. Managementneeds to simulate their long-term effects and value implications to check that long-term results are not beingsacrificed.
BRAND ELIMINATION
Many companies have too many brands. Sometimes it is because there is no longer a viable market for the brandand investing in repositioning or revitalising it does not look to be economic. Another common cause is wherethe company has grown by acquisitions and mergers. This frequently results in the company having a portfolio ofoverlapping and competing brands with no strategic rationale. With too many brands it then becomes impossibleto support them adequately and marketing spend is spread too thinly to enable any of them to become genuinepower brands. The result is that market share is undermined by smaller rivals which can focus their marketinginvestment behind a single brand to obtain critical mass. A 1999 report by KPMG found that two-thirds of mergersand acquisitions resulted in a net loss of market share and more than 80 per cent led to erosion of shareholdervalue.[10]
Companies such as Procter & Gamble and Colgate-Palmolive have shown that consolidating overlapping brandscan cut costs, increase market share and boost shareholder value. This is illustrated in Figure 7.9 where a companyconsolidates two of its competing brands into one new brand. Market share by volume increases from 40 to 42 percent because marketing spend is focused, effectively doubling the absolute level of brand support. Greater distributionpower allows it to cut the level of trade discounts, which adds 1 per cent to the net price. Cost of goods is reducedbecause of greater buying power, and duplicated overheads are stripped out, resulting in a doubling of profits.
What prevents companies consolidating brands is fear over the loss of sales. How serious this problem will bedepends upon the degree of brand overlap and how the company implements the consolidation. Consolidating two
Market share % 20
Initial P & L New P & L
Brand A Brand B New brand
20 42
45
55
50 52
50 48
25 25 25
15 15 12
10 8 18
Cost of goods sold %
Gross margin %
Marketing %
Overheads %
Operating margin %
Figure 7.9 Realising Value through Brand Elimination
248 BUILDING BRANDS
brands into one is easier where the brands serve similar market segments, have overlapping brand images and whenone is relatively weak. The problem is more complex where both are strong brands and they are serving differentsegments or distribution channels.
In implementing consolidation a company has four routes to choose from:
❍ Phasing out the brand is the appropriate approach if the brand to be eliminated has substantial brandvalue and a significant base of customers. This policy keeps the old brand as long as necessary but focusespromotion and development on the new brand. Effectively it seeks to reduce the cost of carrying duplicatebrands, with the objective of eliminating the overlap over time.
❍ Quick kill means the immediate dropping of a brand name. This is a high-risk strategy but may becomenecessary if competition is ratcheting up the cost of supporting brands. It requires a very heavy investmentin marketing and trade support, if a loss of market share is to be avoided.
❍ Co-branding is the most common transition strategy. Both brand names are kept on the new brand,giving consumers time to adjust. When Whirlpool bought Philips’ household appliances business, the brandwas marketed as Philips Whirlpool for the first six years.
❍ Sale. Procter & Gamble and Unilever have sold off the lower performing ‘tail’ of brands and somespecialists have now entered this secondary market. Sometimes the competition authorities require sales,as Diageo had to dispose of Dewar’s whisky, Bombay gin and Malibu.
TAKING THE BRAND INTERNATIONAL
Taking a brand into overseas markets is an obvious strategy for enhancing growth and shareholder value. Indeed,in today’s globally competitive environment it is an essential strategy to achieve scale economies and to justify theinvestment in the new products that will ensure the continuity of the company.
In developing overseas markets a company can pursue one of three strategies. The first is multinational branding.This means developing different brands for each country and tailoring the marketing mix to local markets. This hasbeen the approach broadly followed by Unilever, for example, which markets its brands under a variety of namesand product formulations. The second approach is global branding where the brand name is standardised and thestrategy is as far as possible similar in each country. Coca-Cola, McDonald’s and Microsoft are obvious examples.The intermediate approach is regional branding, whereby the company tries to build common brands and strategiesin certain areas, for example in the European Union or the Americas. Ford has pursued such an approach inthe past.
LOCAL BRANDS
The primary case for local brands rests on the great differences in language, culture and market conditions thatstill exist between most counties. A brand of breakfast cereal like Sanitarium that has meaning and broad appealin Australia will rarely have the same resonance in Belgium or Finland. It seems obvious that an approach thatdesigns the brand identity to the local language, preferences, traditions, climate and competition will do better.Another advantage of local branding is that it facilitates higher prices to be charged in less competitive markets. Withcommon branding, parallel imports makes differential pricing more difficult and this can lead to a significant loss of
ISSUES IN BRANDING 249
operating profit. A final important reason for local autonomy is that it encourages initiative, pride and responsibilityfor performance. Nothing destroys commitment like a faceless headquarters second-guessing local decisions andimposing strategies that the local management has not participated in developing.
GLOBAL AND REGIONAL BRANDS
However, in most leading companies there has been a significant shift towards regional and global branding. Thedrive to eliminate duplicate costs has been one reason. The cost of producing a TV commercial can easily amountto £1 million. The advertising agency McCann-Erickson claims to have saved Coca-Cola almost $100 million overa period of 20 years by producing commercials with international appeal. A global strategy facilitates a fasterinternational launch, which reduces the danger of the brand being pre-empted by competitors. It also enhancesshareholder value by accelerating cash flow.
On top of this, a number of forces in today’s information society encourage a move towards global or regionalbranding. These include the growth of international business, the emergence of global media such as CNN andSkyTV, the explosion of tourism and international business travel, and the development of common standards likethe Internet and GSM. All of these encourage the emergence of international lifestyles, or more accurately theemergence of market segments that transcend geographical boundaries. Scientists in different countries want thesame brands of equipment, teenagers the same clothing, and those with aspirational lifestyles the same symbols astheir peers abroad. Finally, the pace of technological progress and innovation has meant that people are increasinglyspending on new products that have fewer cultural heritages to hinder global branding.
Global brands can make more efficient use of the new international media and the Internet. They can also uniquelyexploit the growing popularity of international events such as the World Cup, the Olympics and Formula One, andthe sponsorship of international stars such as Tiger Woods, Madonna or Manchester United. International brandsoften also obtain a premium status from the glamour they possess. Finally, an international reputation facilitatesbrand extensions and entry into new markets. Global brands often have a stature that gives customers confidencein trying their offerings.
CONSTRAINTS ON GLOBAL BRANDING
The constraints on global branding are external and internal. Some markets are still so idiosyncratic that globalbrands have limited potential. Often a brand name does not make sense in another market. Snuggles fabric softenerhas to be translated as Cajoline in France, Kuschelweich in Germany, Cocolino in Italy, and so on. Culture andtradition also prevent common approaches. For example, a basic product like cheese plays different roles in differentcountries: in Holland it is mostly consumed at breakfast; in France it is served after the main course at dinner; in theUK it is mostly consumed at lunch in sandwiches. Different laws, climates and traditions can all create constraints ona common brand identity.
Factors internal to the organisation also have an important influence on the development of global brands. A keyfactor is history. The first international companies were European and were well established by the beginning ofthe 20th century. Then the slowness of international travel and rudimentary international communications forcedthese companies to delegate decision-making to the local markets. Distance made central control from Europeanheadquarters simply impractical. Many companies like Unilever and Nestle have maintained much of this pattern
250 BUILDING BRANDS
of multinational marketing. Global branding is much more associated with US companies and later the Japanese.US companies, which became prominent internationally after the Second World War, pursued an ethnocentricapproach – they sold to a willing overseas market the products that had been successful in the home market, usuallywith only the minimum necessary adaptation. In the 1960s, Japanese companies such as Toyota and Sony introducedthe first real global branding strategies. These were uniform products with a global brand name, designed to matchthe needs of international markets.
In recent years, the tendency has been to shift towards what is called transnational marketing. This might be looselydefined as seeking to standardise those elements of the brand where this is possible, but recognising that oftenit makes sense to adapt to local conditions. Generally this approach leads to asymmetrical, pragmatic strategies;companies will invest in adapting to local conditions in the biggest markets such as the USA, Japan and Germany,but not in smaller countries. Traditional brands that are part of the culture and heritage of a market will be left asthey are. New products, particularly those in new categories or using new technology, will be much more gearedto a global approach.
The elements of the brand’s marketing mix also vary in the degree to which they can be standardised. Generallythe core product is standardised across countries. Product functionality and use (e.g. how people listen to music ordrive a bulldozer) tend to be fairly similar internationally. Also economies of scale are important here, as productdevelopment and manufacture are high-investment areas. The features of the basic brand – design, packaging, logoand name – can also often be standardised across countries, if planned systematically.
At the next level of branding – the positioning and communications – the difficulties begin to mount as culture, atti-tudes, language and economics impinge on the interpretation of the brand’s meaning. The degree of standardisationpossible varies with the market and the product. National values and traditions are still very important in food, butless so in electronics. Culture is less important in youth and more affluent markets than it is in mature, low-incomeones. Moving further down the marketing chain to selling, promotion and distribution, these decisions are invariablyspecified locally because of sharp differences that normally occur in market and institutional characteristics acrosscountries.
The shift from national to transnational branding and marketing is reshaping how companies are managed. Many ofthe biggest multinationals such as Ford, Unilever and Procter & Gamble have restructured to create internationalproduct divisions to replace the old country business units. Strategic decisions about brands are increasingly takenwith a view to leveraging their full international potential and looking for global efficiencies in production andmarketing. Most companies have sought to avoid building large central bureaucracies and rather aimed to use teamsof local managers cooperating to develop international branding strategy. Often this has been accompanied bymaking certain countries lead managers for specific brands.
CONTROLLING THE BRAND FRANCHISE
Today competition is not between single companies but between networks. A network consists of all thosecompanies in the supply chain that contribute components, services or knowledge to the ultimate product boughtby the final customer. So Hewlett-Packard and its network of suppliers, partners and retailers compete with thoseof Dell to design and deliver desirable brands of personal computer to consumers. Tesco’s network competes withthat of Sainsbury to develop and execute the best retail concept.

ISSUES IN BRANDING 251
WHO CONTROLS THE BRAND?
All companies participate in networks. A key issue to participants in a network is who controls the brand. In general,the participant that controls the brand that consumers value makes the greatest economic profit. Traditionallythe manufacturer, such as Ford, IBM or GE, has usually controlled the brand. The manufacturer normally tries tocommoditise suppliers’ inputs to push down costs and stimulate competition among them. But manufacturers donot always succeed and sometimes the supplier succeeds in wresting brand power from, or at least sharing it with,the manufacturer. Intel and Microsoft are striking examples of this phenomenon. The images of Intel and Microsoftare so powerful among final consumers that computer manufacturers are forced to purchase their components.The result is that much of the profit in the industry has migrated to these two component suppliers.
The distribution channels – wholesalers, retailers or the Internet – can also control the brand power. One of themajor trends in the past few decades has been the growth of retailer own-label brands. The large supermarketgroups have succeeded in substituting their own brands for manufacturers’ brands over an increasing percentageof their shelf space. Again, this has led to a transfer of value from manufacturer to retailer as the former’s outputhas become increasingly commoditised. Today e-commerce has brought new participants to the struggle for whocontrols the consumer brand franchise. On the one hand, e-commerce has enabled the manufacturer to restorethe power of the manufacturer by allowing it to ‘disintermediate’ – cut out the retailer and go direct to the endconsumer, as Dell did so successfully in the 1990s. On the other hand, e-commerce has brought in a new breed ofretailer like Amazon and eToys that can offer customers product ranges far superior to any that have been offeredby retailers in the past. Other threats to traditional brand hegemony are the Internet navigators, including searchengines such as Google and Yahoo!, evaluators such as Consumer Reports, databases such as Auto Trader andsoftware programs such as Quicken. All of these can become, and indeed are becoming, the brands in which moreconsumers are placing their trust. When this happens, power in the network changes in favour of the organisationthat controls the most trusted brand.
The implications of a loss of brand control are severe. If a company’s product is seen as a commodity or a mere labelit loses its ability to drive profitable growth. Customers will buy on price and there will be no barriers to switchingto alternative suppliers. This is what happened to the personal computer manufacturers when they effectively cededbrand power upstream to the suppliers of their operating system and microprocessors. Computers became littlemore than low margin commodities while their suppliers, Microsoft and Intel, became immensely profitable. Thesame problem occurred with many textile and grocery goods manufacturers that became own-label suppliers topowerful branded retail groups. The enhanced bargaining power of the retailer often enabled them to appropriateall the economic profit of the manufacturers.
MANUFACTURING OR BRANDING
Companies increasingly have to choose between investing heavily in brands or becoming contract manufacturersfor other branded businesses. The problem facing many firms is that they have got ‘stuck in the middle’ as the tideof global competition has washed away established relationships.
Contract manufacturing has become a rapidly growing area of business as companies increasingly outsource produc-tion. But global competition and global sourcing have made contract manufacturing much more demanding than itwas in the past. To be a profitable contract manufacturer, a company has to minimise its cost structure on a global
252 BUILDING BRANDS
scale. Generally, this will mean locating production facilities in countries with the cheapest facilities and lowest labourcosts, or where valuable resources are most abundant. It means minimising overheads and tight operational control.
Developing a strategy based on building strong brands leads to a different philosophy and organisation. A contractmanufacturer focuses on production and costs; a branded business focuses on marketing and innovation. A contractmanufacturer produces to a customer’s specifications; a branded company has to discover what specificationsconsumers will want. The former has very low marketing costs; the latter needs to invest heavily in marketing tounderstand consumers and to build and communicate the brand. The personnel of a branded goods company haveto be close to the market; those of the contract manufacturer have to be located where costs are minimised.
Given these completely different orientations, it is not surprising that trying to be both a low-cost manufacturer anda sophisticated marketer is a strategy that is difficult to make work. The danger is that in striving to be both, thecompany’s philosophy and organisation becomes fatally compromised. It lacks, on the one hand, the cost structureto compete with global contract manufacturers and, on the other, the creativity and investment in branding tocompete with those companies like Virgin and Amazon that focus entirely on innovation, marketing and branding.
ORGANISING THE BRAND PORTFOLIO
When a company goes beyond marketing one product, it has to decide how its products and brands should berelated. It can market all its additional products under the same umbrella brand, as for example Canon does with itscameras, printers and office equipment, or it can do the opposite, developing a separate brand name for each newproduct, as Procter & Gamble has traditionally done. In between there are various other alternatives, including linebrands, range brands and source branding strategies.[11]
A dilemma arises because management has to balance three partly conflicting goals. One goal is to differentiate theproduct from others it already markets. Generally, it only makes sense to introduce another product if it will dosomething differently, or appeal to a different group of customers. From this point of view, separate brand namesare attractive. The second goal is to leverage the strengths and associations of the current brand name. This impliesan advantage in using the existing brand name. Thirdly, cost factors have to be considered: the objective is not tomaximise sales but to increase long-run economic profits. This again leads to an orientation to sharing brand names.
The right brand architecture should result in a system that makes sense to consumers. The branding system shouldindicate to them how products are differentiated from each other. Managers inside the company should alsounderstand the logic of the system and when a new product should have a separate name or when it should sharean existing name. Finally, the architecture should facilitate the growth in value of the brand portfolio as a whole, byenabling it to be effectively communicated and promoted.
BRAND ARCHITECTURE
The main difference between branding strategies is in the way they make the trade-off between differentiation andshared identity. There are six main brand strategies:
❍ Product brands exist where the company assigns a unique name and positioning to each of its products.So, in the detergents market Procter & Gamble in the UK has Ariel, Bold, Dreft, Fairy and Lenor brands,
ORGANISING THE BRAND PORTFOLIO 253
each with its own target market segment and differential advantage. The Accor Group has developedmultiple brands of hotels each with its own positioning strategy: Novotel, Ibis, Formula 1, Sofitel etc. Thecorporate name plays no role in the marketing of the brands to consumers: the focus is entirely ondifferentiation rather than shared identity.
❍ Line brands are when a company has several complementary products sharing the same brand concept.For example, rather than individual product brands, L’Oreal sells a shampoo, hair spray, gel and lacquerunder the L’Oreal Paris line of hair products. Selling a brand line rather than individual brands canreinforce the brand’s selling power and reduce marketing costs.
❍ Range brands include a broader array of products than with line brands, but still limit the extension of thebrand name to the same area of competence. For example, Nestle uses the name Lean Cuisine for itsrange of frozen food products in North America and Australia; Heinz uses the Weight Watchers SmartOnes brand for its diet range in the US.
❍ Source brands are double-branded with a corporate or range name plus a product brand name.Examples are Kellogg’s Corn Flakes, Castrol GTX and Johnnie Walker Black Label. The corporate nameconveys identity and associations; the product brand focuses it to a particular segment.
❍ Endorsing brand is a weaker association of the corporate name with the product brand name. Here theproduct brand is the dominant name; the umbrella endorsement merely aims to guarantee the brand’squality. Nestle, General Motors and Johnson & Johnson follow this approach in endorsing, for example,their brands Kit-Kat, Opel and Pledge, respectively. An endorsing brand strategy is often an intermediatestep as companies seek to shift away from product branding to range or umbrella branding strategies.
❍ Umbrella brands are when one brand supports several products in very different markets. For example,Philips sells computers, phones, hi-fi, televisions, electric shavers and office equipment using the samename. This is the opposite strategy to product branding. Here the focus is on shared identity at theexpense of differentiation. The main advantages are sharing brand-building costs. The main threat is whatis called the ‘rubber band effect’ – the more the brand is stretched across different categories, the morelikely the brand’s identity is going to be weakened until its credibility and meaning are broken.
CHOOSING A BRANDING STRATEGY
Competing companies often adopt quite different branding strategies. In the hotel market, Accor uses productbranding, while Holiday Inn uses source branding. What are the criteria for deciding the right approach?
History again plays a big role. Many firms would not have the current number of product brands if they were startingafresh. Companies such as Procter & Gamble adopted a product branding approach in an era when competitionwas less fierce and margins were high enough to cover the heavy marketing costs involved in this strategy. Changetoday is difficult. For example, the Procter & Gamble name has no equity with consumers and so the type ofumbrella branding favoured by Sony or Virgin is just not practicable.
A second factor is the power and type of brand. An umbrella or source branding strategy is not possible if the branddoes not have strong added values, if it is little more than a label. Here, if a new product is thought to have potential,it is best launched under an individual brand name. Experience brands usually have more potential for umbrella orsource branding than do attribute or aspirational brands. For example, British Airways aims to be an aspirationalbrand, so when it launched a budget brand in 1998 it did so under the name Go (since merged with EasyJet) in
254 BUILDING BRANDS
order not to risk weakening its core values. In contrast, Virgin is an experience brand – ‘us against them’ – with corevalues that shift easily into a budget offer. However, if the brand is exceptionally strong it is possible for aspirationalbrands to stretch downwards as long as the new product’s status is indicated. For example, Daimler indicates thepositioning of the different Mercedes models by affixing letters such as S, E, C and A to the appropriate ranges.
If a product is truly innovative in its attributes or concept, then product branding is attractive to highlight its originality.BP wisely decided not to risk diluting the equity in the Castrol brand by source branding when it was acquired.Product branding is also a way of reducing risks when there are hazards with a product’s technology or side effects,which could be the subject of damaging publicity. Pharmaceutical companies selling novel medicines invariably useproduct branding.
A third factor is the attractiveness of the market. Developing separate brands is hugely expensive and most of thecosts are fixed. Such an investment can only generate an economic return if the revenue and profits available arelarge enough. Umbrella branding can be the most effective way to enter smaller markets or where the opportunitiesto gain a high market share are limited. However, note that there is a risk that umbrella branding might dilute themain brand, and there could be conflicts with other brands under the umbrella. On the other hand, the otherbrands under the umbrella may help. Finally, product branding may be more expensive but also lead in the longterm to higher profits and marketing assets.
VALUING THE BRAND
The issue of whether brands should appear as assets on the balance sheet has become controversial but is, as weshall see, irrelevant. A spate of hostile take-overs and asset stripping of brand-rich companies led to the accusationthat, because brands were excluded from the balance sheet, these companies were undervalued and easy prey tocorporate raiders. Conventional accounting treats investment in brand-building as costs to be set against currentprofits. The treatment of brands acquired externally was more equivocal and differed in countries around the world.Equated to the 19th century concept of ‘goodwill’, the cost might be carried permanently on the balance sheet (ifthe value was maintained or amortised against profits over a number of years, or written-off against shareholderfunds). This need not divert us now because brand values can be annually reported by companies to shareholdersin the narrative sections of their annual reports, if not the balance sheet sections. Note that the valuations of brands,internally grown or acquired, can never be shown on balance sheets but only the acquisition costs, downwardlyadjusted if value has declined.
So, balance sheets apart, we still have the issue of whether companies should (a) value their brands and (b) reportthose values to their shareholders.
THE PROS AND CONS OF VALUATION
The pros and cons of brand valuation largely reflect the views of enthusiasts and conservatives. The conservativesargue against brands being reported. First, any valuation of brands is highly subjective. Different methods anddifferent valuers will give very different valuations. Second, it may be difficult to separate the earnings that are createdfrom the brand name from those generated by the company’s other tangible and intangible assets. Can one reallyseparate the value created by the Cadbury’s brand from the values created by its other intangible assets [Note:the product differentiation and therefore the quality is part of the brand] including specialist skills and long-standingsupply chain relationships? Third, the arbitrary assumptions needed to come up with brand valuations would make
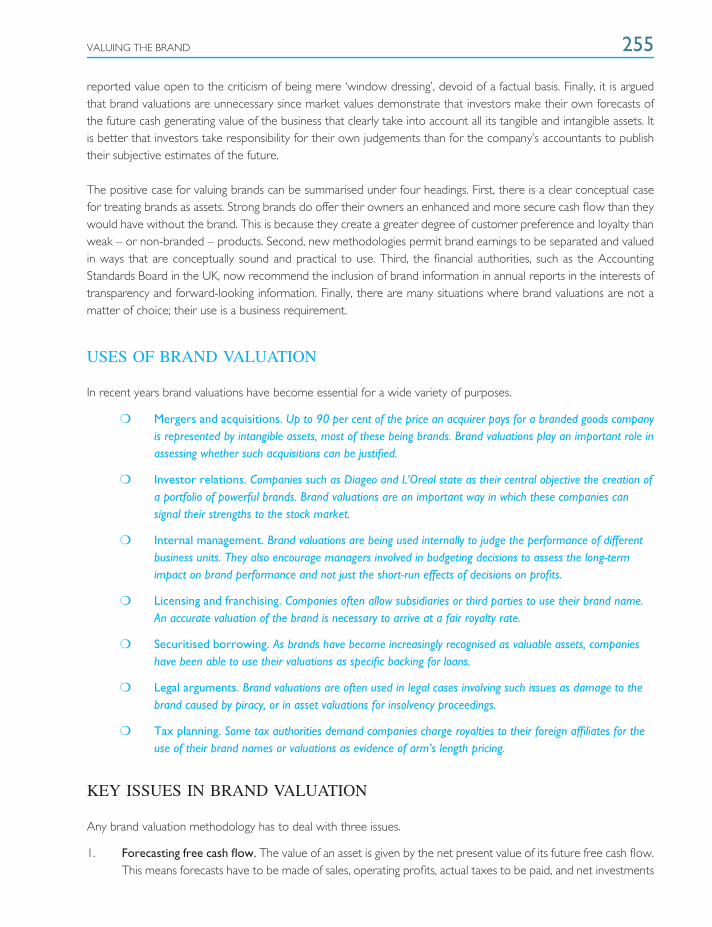
VALUING THE BRAND 255
reported value open to the criticism of being mere ‘window dressing’, devoid of a factual basis. Finally, it is arguedthat brand valuations are unnecessary since market values demonstrate that investors make their own forecasts ofthe future cash generating value of the business that clearly take into account all its tangible and intangible assets. Itis better that investors take responsibility for their own judgements than for the company’s accountants to publishtheir subjective estimates of the future.
The positive case for valuing brands can be summarised under four headings. First, there is a clear conceptual casefor treating brands as assets. Strong brands do offer their owners an enhanced and more secure cash flow than theywould have without the brand. This is because they create a greater degree of customer preference and loyalty thanweak – or non-branded – products. Second, new methodologies permit brand earnings to be separated and valuedin ways that are conceptually sound and practical to use. Third, the financial authorities, such as the AccountingStandards Board in the UK, now recommend the inclusion of brand information in annual reports in the interests oftransparency and forward-looking information. Finally, there are many situations where brand valuations are not amatter of choice; their use is a business requirement.
USES OF BRAND VALUATION
In recent years brand valuations have become essential for a wide variety of purposes.
❍ Mergers and acquisitions. Up to 90 per cent of the price an acquirer pays for a branded goods companyis represented by intangible assets, most of these being brands. Brand valuations play an important role inassessing whether such acquisitions can be justified.
❍ Investor relations. Companies such as Diageo and L’Oreal state as their central objective the creation ofa portfolio of powerful brands. Brand valuations are an important way in which these companies cansignal their strengths to the stock market.
❍ Internal management. Brand valuations are being used internally to judge the performance of differentbusiness units. They also encourage managers involved in budgeting decisions to assess the long-termimpact on brand performance and not just the short-run effects of decisions on profits.
❍ Licensing and franchising. Companies often allow subsidiaries or third parties to use their brand name.An accurate valuation of the brand is necessary to arrive at a fair royalty rate.
❍ Securitised borrowing. As brands have become increasingly recognised as valuable assets, companieshave been able to use their valuations as specific backing for loans.
❍ Legal arguments. Brand valuations are often used in legal cases involving such issues as damage to thebrand caused by piracy, or in asset valuations for insolvency proceedings.
❍ Tax planning. Some tax authorities demand companies charge royalties to their foreign affiliates for theuse of their brand names or valuations as evidence of arm’s length pricing.
KEY ISSUES IN BRAND VALUATION
Any brand valuation methodology has to deal with three issues.
1. Forecasting free cash flow. The value of an asset is given by the net present value of its future free cash flow.This means forecasts have to be made of sales, operating profits, actual taxes to be paid, and net investments
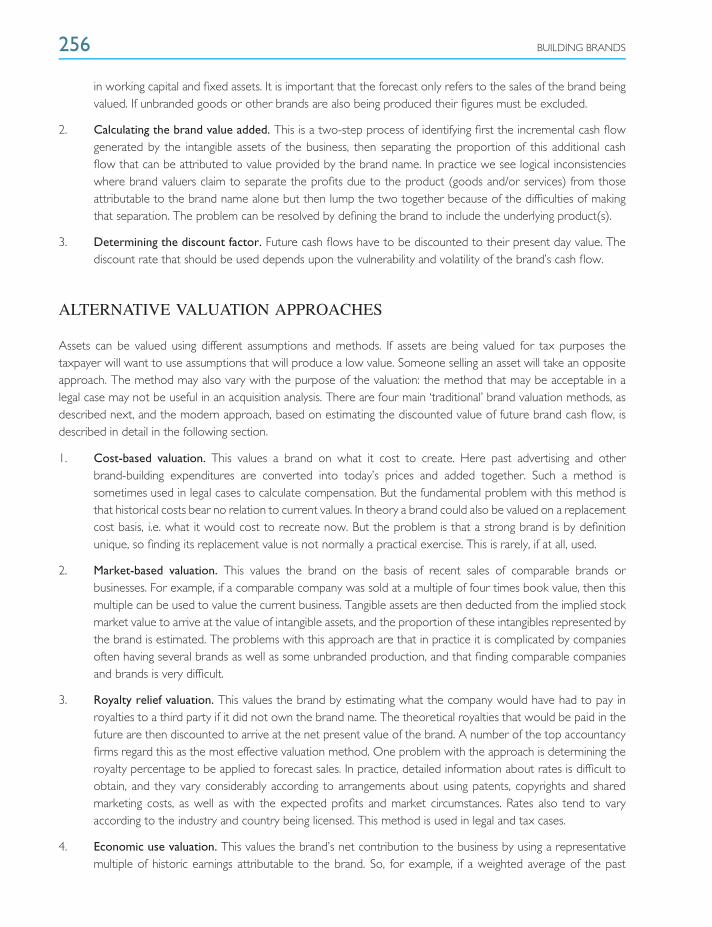
256 BUILDING BRANDS
in working capital and fixed assets. It is important that the forecast only refers to the sales of the brand beingvalued. If unbranded goods or other brands are also being produced their figures must be excluded.
2. Calculating the brand value added. This is a two-step process of identifying first the incremental cash flowgenerated by the intangible assets of the business, then separating the proportion of this additional cashflow that can be attributed to value provided by the brand name. In practice we see logical inconsistencieswhere brand valuers claim to separate the profits due to the product (goods and/or services) from thoseattributable to the brand name alone but then lump the two together because of the difficulties of makingthat separation. The problem can be resolved by defining the brand to include the underlying product(s).
3. Determining the discount factor. Future cash flows have to be discounted to their present day value. Thediscount rate that should be used depends upon the vulnerability and volatility of the brand’s cash flow.
ALTERNATIVE VALUATION APPROACHES
Assets can be valued using different assumptions and methods. If assets are being valued for tax purposes thetaxpayer will want to use assumptions that will produce a low value. Someone selling an asset will take an oppositeapproach. The method may also vary with the purpose of the valuation: the method that may be acceptable in alegal case may not be useful in an acquisition analysis. There are four main ‘traditional’ brand valuation methods, asdescribed next, and the modern approach, based on estimating the discounted value of future brand cash flow, isdescribed in detail in the following section.
1. Cost-based valuation. This values a brand on what it cost to create. Here past advertising and otherbrand-building expenditures are converted into today’s prices and added together. Such a method issometimes used in legal cases to calculate compensation. But the fundamental problem with this method isthat historical costs bear no relation to current values. In theory a brand could also be valued on a replacementcost basis, i.e. what it would cost to recreate now. But the problem is that a strong brand is by definitionunique, so finding its replacement value is not normally a practical exercise. This is rarely, if at all, used.
2. Market-based valuation. This values the brand on the basis of recent sales of comparable brands orbusinesses. For example, if a comparable company was sold at a multiple of four times book value, then thismultiple can be used to value the current business. Tangible assets are then deducted from the implied stockmarket value to arrive at the value of intangible assets, and the proportion of these intangibles represented bythe brand is estimated. The problems with this approach are that in practice it is complicated by companiesoften having several brands as well as some unbranded production, and that finding comparable companiesand brands is very difficult.
3. Royalty relief valuation. This values the brand by estimating what the company would have had to pay inroyalties to a third party if it did not own the brand name. The theoretical royalties that would be paid in thefuture are then discounted to arrive at the net present value of the brand. A number of the top accountancyfirms regard this as the most effective valuation method. One problem with the approach is determining theroyalty percentage to be applied to forecast sales. In practice, detailed information about rates is difficult toobtain, and they vary considerably according to arrangements about using patents, copyrights and sharedmarketing costs, as well as with the expected profits and market circumstances. Rates also tend to varyaccording to the industry and country being licensed. This method is used in legal and tax cases.
4. Economic use valuation. This values the brand’s net contribution to the business by using a representativemultiple of historic earnings attributable to the brand. So, for example, if a weighted average of the past
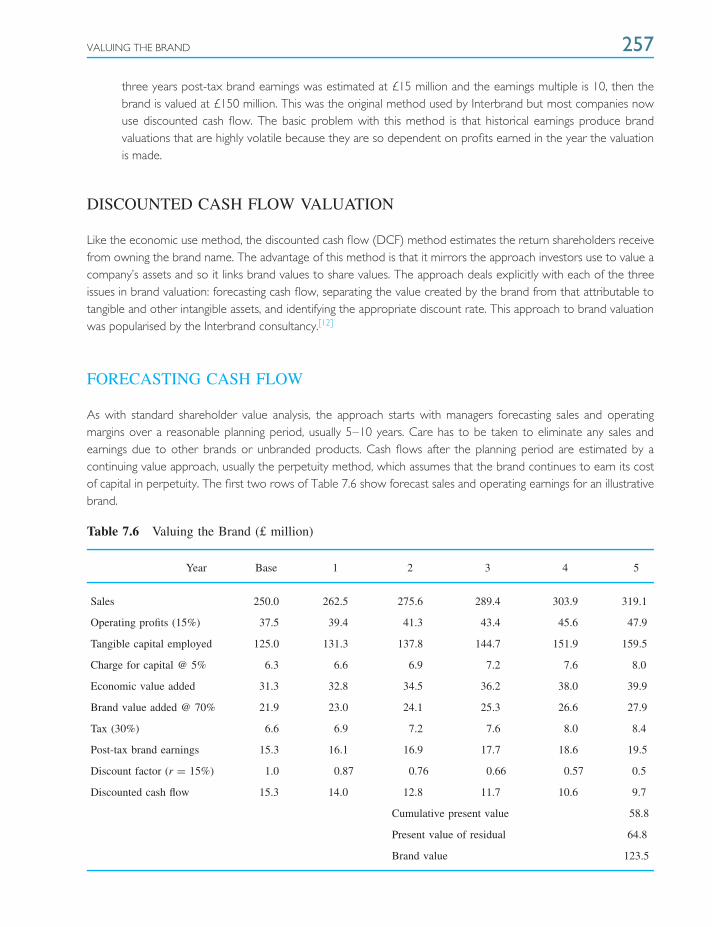
VALUING THE BRAND 257
three years post-tax brand earnings was estimated at £15 million and the earnings multiple is 10, then thebrand is valued at £150 million. This was the original method used by Interbrand but most companies nowuse discounted cash flow. The basic problem with this method is that historical earnings produce brandvaluations that are highly volatile because they are so dependent on profits earned in the year the valuationis made.
DISCOUNTED CASH FLOW VALUATION
Like the economic use method, the discounted cash flow (DCF) method estimates the return shareholders receivefrom owning the brand name. The advantage of this method is that it mirrors the approach investors use to value acompany’s assets and so it links brand values to share values. The approach deals explicitly with each of the threeissues in brand valuation: forecasting cash flow, separating the value created by the brand from that attributable totangible and other intangible assets, and identifying the appropriate discount rate. This approach to brand valuationwas popularised by the Interbrand consultancy.[12]
FORECASTING CASH FLOW
As with standard shareholder value analysis, the approach starts with managers forecasting sales and operatingmargins over a reasonable planning period, usually 5–10 years. Care has to be taken to eliminate any sales andearnings due to other brands or unbranded products. Cash flows after the planning period are estimated by acontinuing value approach, usually the perpetuity method, which assumes that the brand continues to earn its costof capital in perpetuity. The first two rows of Table 7.6 show forecast sales and operating earnings for an illustrativebrand.
Table 7.6 Valuing the Brand (£ million)
Year Base 1 2 3 4 5
Sales 250.0 262.5 275.6 289.4 303.9 319.1
Operating profits (15%) 37.5 39.4 41.3 43.4 45.6 47.9
Tangible capital employed 125.0 131.3 137.8 144.7 151.9 159.5
Charge for capital @ 5% 6.3 6.6 6.9 7.2 7.6 8.0
Economic value added 31.3 32.8 34.5 36.2 38.0 39.9
Brand value added @ 70% 21.9 23.0 24.1 25.3 26.6 27.9
Tax (30%) 6.6 6.9 7.2 7.6 8.0 8.4
Post-tax brand earnings 15.3 16.1 16.9 17.7 18.6 19.5
Discount factor (r = 15%) 1.0 0.87 0.76 0.66 0.57 0.5
Discounted cash flow 15.3 14.0 12.8 11.7 10.6 9.7
Cumulative present value 58.8
Present value of residual 64.8
Brand value 123.5
258 BUILDING BRANDS
ESTIMATING BRAND EARNINGS
There are two approaches: direct and by subtraction. The direct method relies on the widespread modern internalpractice of attributing profits both to brands and to customers. The double counting involved in that can be simplyresolved for the combined profits. The ‘by subtraction’ process is a two-step approach: (1) separate earnings dueto tangible assets from those due to intangible assets, and (2) separate intangible earnings into those attributable tothe brand name and those attributable to other intangibles such as patents, special skills or monopolistic advantages.
❍ Earnings on intangibles. These are the residual earnings after the return on tangible assets has beendeducted from total operating profits. First, the tangible assets employed in the business – for example,plant, warehousing, creditors and stock – are calculated. These assets are valued at their realisablemarket value. Because they are included at realisable values ownership risk is minimised, so a reasonablereturn is the risk free borrowing rate, usually taken as the yield on ten-year government bonds, currentlyaround 5 per cent. Operating earnings less the capital charge gives economic value added. This residualprofit is the return on intangible assets.
❍ Earnings from the brand. The next step is to judge the percentage of these intangible earnings that canbe attributed to the brand. For some consumer goods, such as perfume or fashions, the brand is the majorintangible item. For others, such as speciality chemicals or prescription pharmaceuticals, patents, technicalknow-how and personal relationships with key customers are more important than the brand name. Inother words, they would sell almost as well under another name. Interbrand’s approach involves twodistinct steps. First, analyse the brand and its market to identify and rate the importance of the keystrategic business drivers. Second, assess the extent to which each business driver is dependent upon thebrand. If the driver would be just as effective without the brand, then the brand makes no contribution.
Table 7.7 illustrates the approach for Esso’s retail petrol business in the UK in the 1990s, where the branding indexwas estimated at 26 per cent.[13] This percentage varies by country. In this case it was 43 per cent in Chile and37 per cent in the USA. It also varies by activity. For example, the brand name was more important in lubricantsthan petrol, and higher in the retail market than in marine. By applying the weighted average branding index toresidual earnings, brand earnings were calculated. In the example of Table 7.6, the branding index indicates that thebrand contributes 70 per cent of residual earnings.
DETERMINING THE DISCOUNT FACTOR
Future brand earnings have to be discounted to arrive at their present value. The discount factor depends upon thevolatility and vulnerability of these future earnings. Interbrand has developed a technique called the ‘brand strengthindex’ to determine the discount rate. A brand is rated on seven attributes that are taken to indicate the strengthof the brand. Each attribute has the maximum score shown in parentheses.
1. Market (10). Brands in stable growing markets with strong barriers to entry are the most attractive. So foodbrands will score higher than high-tech brands on this attribute.
2. Stability (15). Long-established brands that command consumer loyalty score better than new ones, orbrands that have been erratically managed in the past.
3. Leadership (25). Strong brand leaders score better than brands with small market shares.
4. Internationality (25). Brands that have proven international acceptance and appeal are inherently strongerthan national brands.
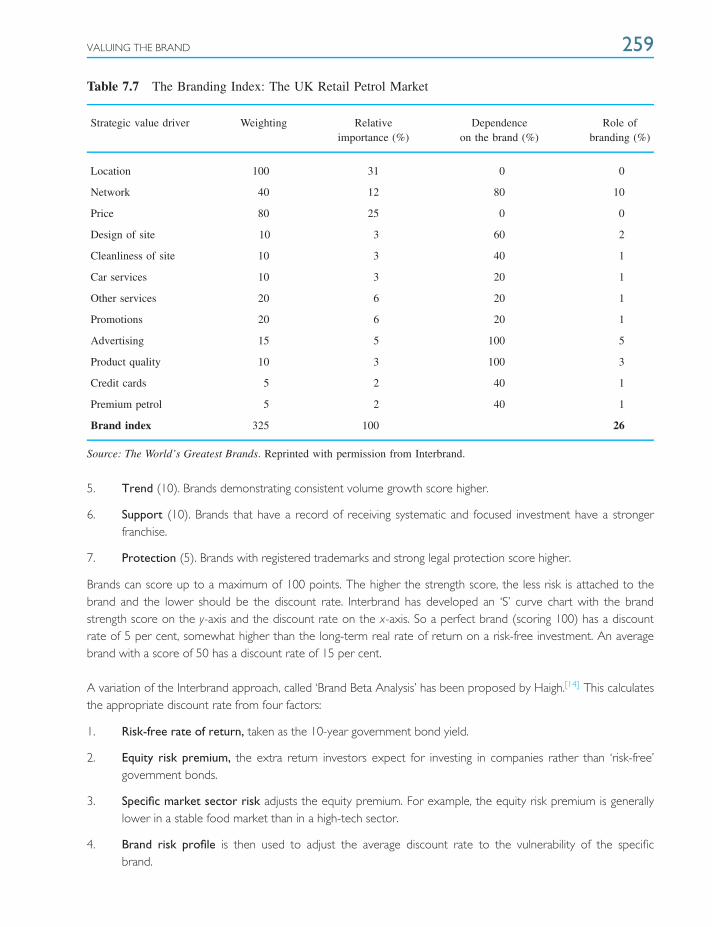
VALUING THE BRAND 259
Table 7.7 The Branding Index: The UK Retail Petrol Market
Strategic value driver Weighting Relative Dependence Role ofimportance (%) on the brand (%) branding (%)
Location 100 31 0 0
Network 40 12 80 10
Price 80 25 0 0
Design of site 10 3 60 2
Cleanliness of site 10 3 40 1
Car services 10 3 20 1
Other services 20 6 20 1
Promotions 20 6 20 1
Advertising 15 5 100 5
Product quality 10 3 100 3
Credit cards 5 2 40 1
Premium petrol 5 2 40 1
Brand index 325 100 26
Source: The World’s Greatest Brands. Reprinted with permission from Interbrand.
5. Trend (10). Brands demonstrating consistent volume growth score higher.
6. Support (10). Brands that have a record of receiving systematic and focused investment have a strongerfranchise.
7. Protection (5). Brands with registered trademarks and strong legal protection score higher.
Brands can score up to a maximum of 100 points. The higher the strength score, the less risk is attached to thebrand and the lower should be the discount rate. Interbrand has developed an ‘S’ curve chart with the brandstrength score on the y-axis and the discount rate on the x-axis. So a perfect brand (scoring 100) has a discountrate of 5 per cent, somewhat higher than the long-term real rate of return on a risk-free investment. An averagebrand with a score of 50 has a discount rate of 15 per cent.
A variation of the Interbrand approach, called ‘Brand Beta Analysis’ has been proposed by Haigh.[14] This calculatesthe appropriate discount rate from four factors:
1. Risk-free rate of return, taken as the 10-year government bond yield.
2. Equity risk premium, the extra return investors expect for investing in companies rather than ‘risk-free’government bonds.
3. Specific market sector risk adjusts the equity premium. For example, the equity risk premium is generallylower in a stable food market than in a high-tech sector.
4. Brand risk profile is then used to adjust the average discount rate to the vulnerability of the specificbrand.
260 BUILDING BRANDS
For the brand risk profile Haigh presents a scoring method, based on a list of factors analogous to the brand strengthindex, to produce a brand beta score, which is again marked out of 100. For example, Coca-Cola can expect amuch lower risk rating than, say, Virgin Cola. The beta score varies from 0 for a perfect brand to 2 for an unbrandedproduct. In the example of Table 7.6, the risk-free rate at the time is 5 per cent, the average equity risk premium is7 per cent, the specific market sector risk is averaged at 1.0, and it is a relatively new brand with an above-averagebeta calculated at 1.43, so the discount rate is then 5 + (7 × 1.0) × 1.43 = 15 per cent.
The brand is valued in Table 7.6 at £123.5 million. Of its forecast total earnings, approximately 17 per cent isattributed to earnings on tangible assets, 83 per cent to intangible assets, and 58 per cent to the associations createdby the brand name. Of the £123.5 million brand value, £58.8 million was due to cash flow added in the planningperiod; the remainder was its continuing value at the end of the period. This continuing value is estimated by thefamiliar perpetuity method, described in Chapter 2. The continuing value reflects the fact that well-managed brandscan last indefinitely.
SUMMARY
1. Today a firm’s intangible assets are more important than its balance sheet assets in creating value forcustomers and shareholders. In many companies, the brands represent one of the most valuable of theseintangible assets.
2. Brands create value for customers by assisting them to reduce risks and by simplifying the choice process.Brands offer customers confirmation of their quality, status or the promise of shared experiences.
3. Brands create value for shareholders by increasing the level of cash flow, accelerating its timing, extending itsduration or reducing the cost of capital.
4. Brand identities once communicated have to be periodically updated by brand repositioning and revitalisation.Improving brand productivity and eliminating redundant brands can also sometimes increase shareholdervalue.
5. Today companies compete within a network of suppliers, distributors and partners. A critical issue is whocontrols the brand. Value in a network tends to migrate towards the organisation that holds the brand name.
6. Brands can be valued using discounted cash flow analysis. This links brand values directly to the company’sown market value.
REVIEW QUESTIONS
1. Describe how brands create value for customers.2. How do brands create value for shareholders?3. How are successful brands built?4. Show how brand extensions can be a means of creating value.5. Describe how a multiproduct organisation can structure its portfolio to control the costs and maximise the
effectiveness of its brands.6. Describe how brands can be valued. What uses can brand valuations have? How confident can you be in a
brand valuation?
NOTES ON CHAPTER 7 261
NOTES ON CHAPTER 7
[1] Millward Brown Optimor, BrandZ Portfolio Performance, 4 April 2008.
[2] Rajendra K. Srivastava, Tasadduk A. Shervani and Liam Fahey, Marketing, business processes and shareholdervalue: an organizationally embedded view of marketing activities and the discipline of marketing, Journal of Marketing63, Special issue 1999, 168–179.
[3] Raymond Perrier, ed., Brand Valuation, London: Interbrand and Premier Books: 1997, p. 44.
[4] John Bartle, ‘The advertising contribution’, in Leslie Butterfield (ed.), Excellence in Advertising, Oxford:Butterworth-Heinemann, 1999.
[5] Quoted from Leslie de Chernatony and Malcolm H.B. McDonald, Creating Powerful Brands, Oxford:Butterworth-Heinemann, 1992, p. 9.
[6] Simon Broadbent, Diversity in categories, brands and strategies, Journal of Brand Management, 2, August, 1994,9–18.
[7] Robert A. Buzzell and Barney T. Gale, The PIMS Principles: Linking Strategy to Performance. New York: Free Press,1987; The year of the brand, The Economist, 25 December 1988, 93.
[8] See, for example, Larry Downes and Chunka Mui, Unleashing the Killer App: Digital Strategies for MarketDominance, Boston, MA: Harvard Business School Press, 1998.
[9] Jean-Noel Kapferer, Strategic Brand Management, 2nd edn, London: Kogan Page, 1997.
[10] KPMG, A Report Card on Cross-Border Mergers and Acquisitions, London: KPMG, 1999.
[11] This section draws heavily on Jean-Noel Kapferer, Strategic Brand Management, 2nd edn, London: Kogan Page,1997.
[12] Raymond Perrier (ed.), Brand Valuation, London: Interbrand and Premier Books, 1997.
[13] Perrier, op. cit, pp. 43–53.
[14] David Haigh, Brand valuation methodology, in Leslie Butterfield and David Haigh, Understanding the FinancialValue of Brands, London: Institute of Practitioners in Advertising, 1998, pp. 20–27.
8 Pricing for Value
‘The majority of the public will buy on price but some will pay a slight premium. In our case a 5 percent premium translates into an extra £250 million profit a year.’
Sir Colin Marshall, Chairman of British Airways
INTRODUCTION AND OBJECTIVES
In many ways pricing is the most important determinant of shareholder value. For the typical company a 5 percent price increase can boost operating profits by more than a half. In many industries, such as pharmaceuticals,management consulting or drinks, the purpose of marketing is considered as primarily about obtaining higherprices. This is because the results of successful innovation, brand building or adding value should be a willingnesson the part of customers to pay more. Pricing affects shareholder value through its impact on the company’smargin and the volume it sells. Ideally a company wants to charge higher prices without this being offset by weakvolume performance. Companies such as GlaxoSmithKline, McKinsey and Microsoft have shown how this canbe done.
Price is the only element of the marketing mix that directly produces revenue; all the others produce costs.The short-term impact of price changes on both profits and sales is usually much greater than advertising orother marketing mix changes. Price is also a highly flexible tool: while new products or changes in channels orcommunications policies can take years, prices can usually be adjusted very rapidly. In spite of its importance, fewcompanies are good at pricing strategy. Most do not collect adequate information and rely on rules-of-thumb thatlead to decisions that are very costly in shareholder value terms.
Today’s dynamic markets increase the need for better methods of pricing. In the last century consumers becameused to sellers and retailers offering one price to everyone. But the information revolution and the Internet havedestroyed the simplicity of uniform pricing and have brought back individually negotiated prices and haggling. Websites like PriceScan.com specialise in comparing the prices of sellers across the market; intelligent shopping agentslike Kelkoo find the best deals for customers; online auction sites like eBay enable buyers and sellers to negotiateprices individually, and business models like Priceline reverse the normal process by having buyers name the pricethey will pay and inviting sellers to respond. The information revolution makes markets more price-sensitive, placinggreater pressure on suppliers’ operating margins.
Pricing decisions are also becoming more critical due to the increasing complexity of markets. All markets arebecoming more segmented, which has resulted in firms having to broaden their product lines with different productsaimed at different types of customers. Gone are the days when Coca-Cola could offer a single brand to everyone:today it has Coke, Diet Coke, Cherry Coke, Coke Zero, etc. Successful business-to-business marketing is similarly
PRICE AND SHAREHOLDER VALUE 263
shifting from commodity selling to speciality products. The result is that firms do not price products in isolation buthave to develop product-line pricing strategies that take into account interdependencies within the range.
Another area of complexity is international pricing. Globalisation has meant that prices charged in one market affectthe prices that can be charged in others. Finally, competition has also become more complex and diverse. The dayshave passed when Coke simply had to compete against Pepsi. Nowadays, competition comes also from retailerbrands and a range of products such as mineral water brands and sports drinks that capture the imagination oftoday’s consumers.
By the time you have completed this chapter, you will be able to:
❍ Show how pricing decisions affect shareholder value
❍ Explain the weaknesses of the pricing approaches commonly used in business
❍ Describe the principles of developing value-based pricing
❍ Propose a more effective approach to making pricing decisions
❍ Outline the key issues in designing product-line pricing strategies, customised pricing, international pricingand promotional pricing policies
❍ Plan price changes
❍ Manage prices to ensure effective price realisation
The chapter begins by exploring the different effects price has on sales, profits and shareholder value. It shows thatthe price that optimises shareholder value is likely to be very different from that which maximises sales or profits.Different perspectives on pricing objectives is one reason why pricing is done so badly in practice. Four principlesunderlying effective pricing are discussed. These are the need to base prices on what value is being offered to thecustomer, the need to customise prices to individual consumers, the importance of anticipating competitor reaction,and the role of business strategy in shaping pricing decisions.
Next, the chapter describes an effective methodology for making pricing decisions. It starts with defining thelong-term strategy for the brand. Next, the business has to collect information about the price sensitivity of themarket and the structure of its costs, and predict the behaviour of competition. This then generates options forpricing strategy that can be evaluated in shareholder-value terms.
This fundamental approach is applied to the complex pricing decisions that characterise today’s markets. We lookat customising pricing to different types of buyers, pricing a product line, international pricing, and the use of sales,discounts and price promotions. In a changing economy, prices have to be adapted from time to time if economicprofits are to be optimised. The issues in raising and lowering prices to customers are analysed. Next the differencebetween list price and realised price is emphasised. Care has to be taken to ensure that satisfactory list prices arenot discounted away to produce inadequate realised prices.
PRICE AND SHAREHOLDER VALUE
The basic objective in pricing is to choose a price that maximises the discounted value of the product’s free cashflow. Free cash flow (CF) in any year i, it will be recalled; is:
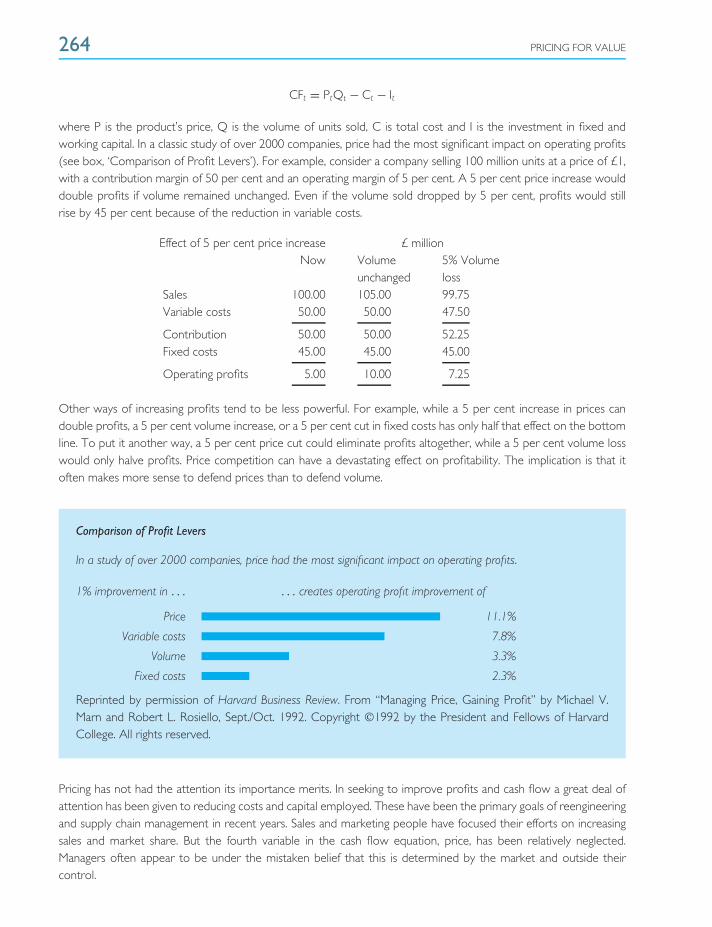
264 PRICING FOR VALUE
CFt = PtQt − Ct − It
where P is the product’s price, Q is the volume of units sold, C is total cost and I is the investment in fixed andworking capital. In a classic study of over 2000 companies, price had the most significant impact on operating profits(see box, ‘Comparison of Profit Levers’). For example, consider a company selling 100 million units at a price of £1,with a contribution margin of 50 per cent and an operating margin of 5 per cent. A 5 per cent price increase woulddouble profits if volume remained unchanged. Even if the volume sold dropped by 5 per cent, profits would stillrise by 45 per cent because of the reduction in variable costs.
Effect of 5 per cent price increase £ millionNow Volume 5% Volume
unchanged lossSales 100.00 105.00 99.75Variable costs 50.00 50.00 47.50
Contribution 50.00 50.00 52.25Fixed costs 45.00 45.00 45.00
Operating profits 5.00 10.00 7.25
Other ways of increasing profits tend to be less powerful. For example, while a 5 per cent increase in prices candouble profits, a 5 per cent volume increase, or a 5 per cent cut in fixed costs has only half that effect on the bottomline. To put it another way, a 5 per cent price cut could eliminate profits altogether, while a 5 per cent volume losswould only halve profits. Price competition can have a devastating effect on profitability. The implication is that itoften makes more sense to defend prices than to defend volume.
Comparison of Profit Levers
In a study of over 2000 companies, price had the most significant impact on operating profits.
1% improvement in . . . . . . creates operating profit improvement of
Price 11.1%
Variable costs 7.8%
Volume 3.3%
Fixed costs 2.3%
Reprinted by permission of Harvard Business Review. From ‘‘Managing Price, Gaining Profit’’ by Michael V.Marn and Robert L. Rosiello, Sept./Oct. 1992. Copyright 1992 by the President and Fellows of HarvardCollege. All rights reserved.
Pricing has not had the attention its importance merits. In seeking to improve profits and cash flow a great deal ofattention has been given to reducing costs and capital employed. These have been the primary goals of reengineeringand supply chain management in recent years. Sales and marketing people have focused their efforts on increasingsales and market share. But the fourth variable in the cash flow equation, price, has been relatively neglected.Managers often appear to be under the mistaken belief that this is determined by the market and outside theircontrol.
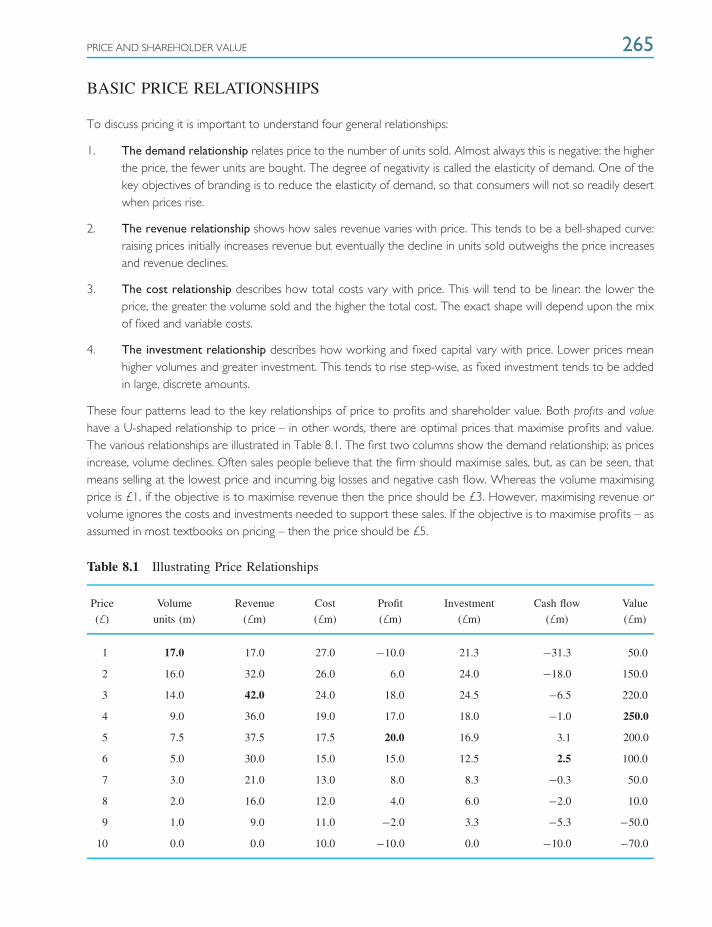
PRICE AND SHAREHOLDER VALUE 265
BASIC PRICE RELATIONSHIPS
To discuss pricing it is important to understand four general relationships:
1. The demand relationship relates price to the number of units sold. Almost always this is negative: the higherthe price, the fewer units are bought. The degree of negativity is called the elasticity of demand. One of thekey objectives of branding is to reduce the elasticity of demand, so that consumers will not so readily desertwhen prices rise.
2. The revenue relationship shows how sales revenue varies with price. This tends to be a bell-shaped curve:raising prices initially increases revenue but eventually the decline in units sold outweighs the price increasesand revenue declines.
3. The cost relationship describes how total costs vary with price. This will tend to be linear: the lower theprice, the greater the volume sold and the higher the total cost. The exact shape will depend upon the mixof fixed and variable costs.
4. The investment relationship describes how working and fixed capital vary with price. Lower prices meanhigher volumes and greater investment. This tends to rise step-wise, as fixed investment tends to be addedin large, discrete amounts.
These four patterns lead to the key relationships of price to profits and shareholder value. Both profits and valuehave a U-shaped relationship to price – in other words, there are optimal prices that maximise profits and value.The various relationships are illustrated in Table 8.1. The first two columns show the demand relationship: as pricesincrease, volume declines. Often sales people believe that the firm should maximise sales, but, as can be seen, thatmeans selling at the lowest price and incurring big losses and negative cash flow. Whereas the volume maximisingprice is £1, if the objective is to maximise revenue then the price should be £3. However, maximising revenue orvolume ignores the costs and investments needed to support these sales. If the objective is to maximise profits – asassumed in most textbooks on pricing – then the price should be £5.
Table 8.1 Illustrating Price Relationships
Price Volume Revenue Cost Profit Investment Cash flow Value
(£) units (m) (£m) (£m) (£m) (£m) (£m) (£m)
1 17.0 17.0 27.0 −10.0 21.3 −31.3 50.0
2 16.0 32.0 26.0 6.0 24.0 −18.0 150.0
3 14.0 42.0 24.0 18.0 24.5 −6.5 220.0
4 9.0 36.0 19.0 17.0 18.0 −1.0 250.0
5 7.5 37.5 17.5 20.0 16.9 3.1 200.0
6 5.0 30.0 15.0 15.0 12.5 2.5 100.0
7 3.0 21.0 13.0 8.0 8.3 −0.3 50.0
8 2.0 16.0 12.0 4.0 6.0 −2.0 10.0
9 1.0 9.0 11.0 −2.0 3.3 −5.3 −50.0
10 0.0 0.0 10.0 −10.0 0.0 −10.0 −70.0
266 PRICING FOR VALUE
The problem with maximising profits this way, however, is that it is a short-term solution. By selling only to customerswho will pay £5, much of the market is left unsatisfied and this presents an open invitation to competition. Thelong-run result of short-run profit-maximisation is likely to be declining market share, loss of scale economies, andcompetitors obtaining critical mass and building the dominant brands. For example, such were the fates of Xeroxin the copier market and the British motorcycle industry after they set short-run profit maximising prices. The rightpricing decision is one that maximises the net present value of long-run cash flow, not short-run profits. This is theprice that maximises value for shareholders. In the illustration this value-maximising price is £4.
It is important to note that maximising volume, revenue, profits and shareholder value lead to quite different prices.In particular, in growing markets the value-maximising price will often be lower than the price that maximisesshort-run profits or cash flow. One reason is that market share effects are often important, either because thedistribution channels will only support the brand leaders, or because network effects mean that customers attachvalue to buying the leading brands. A second reason is that scale economies or experience-curve effects mean thatbrands that do not grow fast suffer increasing cost disadvantages. Pricing, like strategy generally, requires taking alonger-term view.
PRICING IN PRACTICE
The right price is the one that maximises value. In practice such an approach is more challenging to implementsince it requires collecting information to estimate long-run demand relationships, competitive strategies, and thebehaviour of costs over time. Instead, managers usually look to simpler mark-up formulas that add a standard marginto an estimate of the cost of the product or service. Mark-up pricing is a method widely practised on a day-to-daybasis by, for example, accountants, solicitors and contractors.
For example, suppose a firm sells printers. It has a variable cost of £80 per unit, fixed costs of £2 million, and plansto sell 100 000 units annually. Then its unit cost is £100. If its standard cost mark-up is 33 per cent, then its pricewill be set at £133. Generally, the mark-up is expressed as a percentage of sales rather than costs. So if a firm had atarget sales mark-up of 25 per cent, then its price is given by:
Price = Unit cost(1 − target return on sales)
= £100(1 − 0.25)
= £133
A variation of this mark-up approach is target-return pricing. This method is popular among capital-intensive businessessuch as public utilities and auto companies. Here the firm aims to price to achieve a target return on investment.For example, if the printer company had £13 million of invested capital and it aimed for a 25 per cent return, thenthe target price is given by:
Price = Unit cost + target return × invested capitalUnit sales
= £100 + 0.25 × £13 million100 000
= £133
Managers like mark-up pricing because they find it easier to estimate costs than demand. It can also lead to morestability in prices if competitors are using the same methods. But mark-up pricing is not an effective way to price.It ignores demand and the perceived value of the product to the customer. For example, strong brands withadded values should normally be much less price sensitive than weak brands. Mark-up pricing throws away thevalue created by effective marketing. It also ignores competition – standard mark-ups would be a disastrous policy ifaggressive competitors were competing on price.
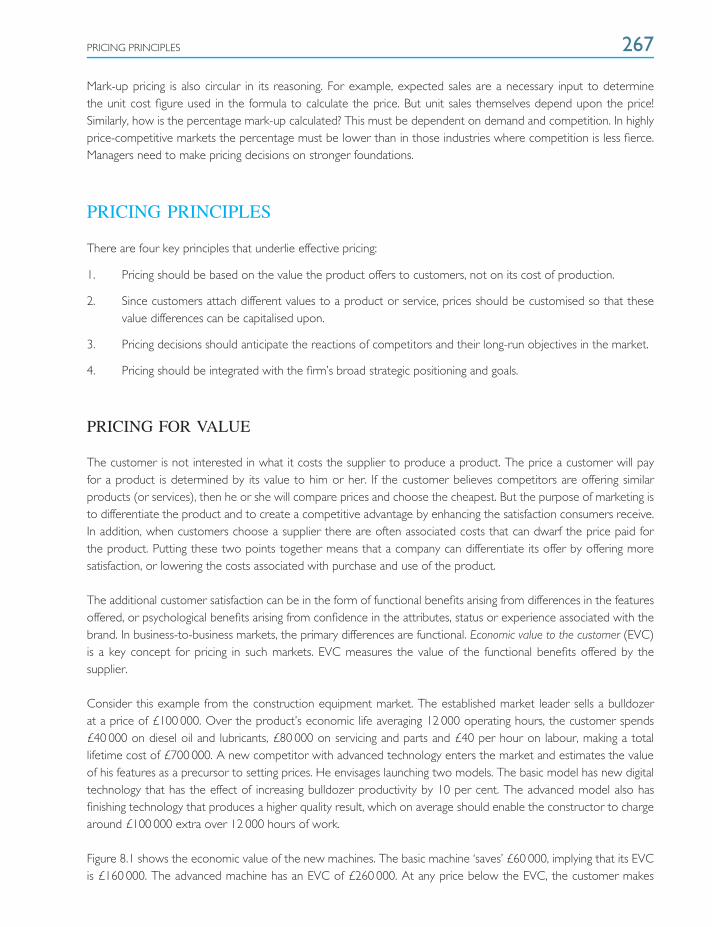
PRICING PRINCIPLES 267
Mark-up pricing is also circular in its reasoning. For example, expected sales are a necessary input to determinethe unit cost figure used in the formula to calculate the price. But unit sales themselves depend upon the price!Similarly, how is the percentage mark-up calculated? This must be dependent on demand and competition. In highlyprice-competitive markets the percentage must be lower than in those industries where competition is less fierce.Managers need to make pricing decisions on stronger foundations.
PRICING PRINCIPLES
There are four key principles that underlie effective pricing:
1. Pricing should be based on the value the product offers to customers, not on its cost of production.
2. Since customers attach different values to a product or service, prices should be customised so that thesevalue differences can be capitalised upon.
3. Pricing decisions should anticipate the reactions of competitors and their long-run objectives in the market.
4. Pricing should be integrated with the firm’s broad strategic positioning and goals.
PRICING FOR VALUE
The customer is not interested in what it costs the supplier to produce a product. The price a customer will payfor a product is determined by its value to him or her. If the customer believes competitors are offering similarproducts (or services), then he or she will compare prices and choose the cheapest. But the purpose of marketing isto differentiate the product and to create a competitive advantage by enhancing the satisfaction consumers receive.In addition, when customers choose a supplier there are often associated costs that can dwarf the price paid forthe product. Putting these two points together means that a company can differentiate its offer by offering moresatisfaction, or lowering the costs associated with purchase and use of the product.
The additional customer satisfaction can be in the form of functional benefits arising from differences in the featuresoffered, or psychological benefits arising from confidence in the attributes, status or experience associated with thebrand. In business-to-business markets, the primary differences are functional. Economic value to the customer (EVC)is a key concept for pricing in such markets. EVC measures the value of the functional benefits offered by thesupplier.
Consider this example from the construction equipment market. The established market leader sells a bulldozerat a price of £100 000. Over the product’s economic life averaging 12 000 operating hours, the customer spends£40 000 on diesel oil and lubricants, £80 000 on servicing and parts and £40 per hour on labour, making a totallifetime cost of £700 000. A new competitor with advanced technology enters the market and estimates the valueof his features as a precursor to setting prices. He envisages launching two models. The basic model has new digitaltechnology that has the effect of increasing bulldozer productivity by 10 per cent. The advanced model also hasfinishing technology that produces a higher quality result, which on average should enable the constructor to chargearound £100 000 extra over 12 000 hours of work.
Figure 8.1 shows the economic value of the new machines. The basic machine ‘saves’ £60 000, implying that its EVCis £160 000. The advanced machine has an EVC of £260 000. At any price below the EVC, the customer makes
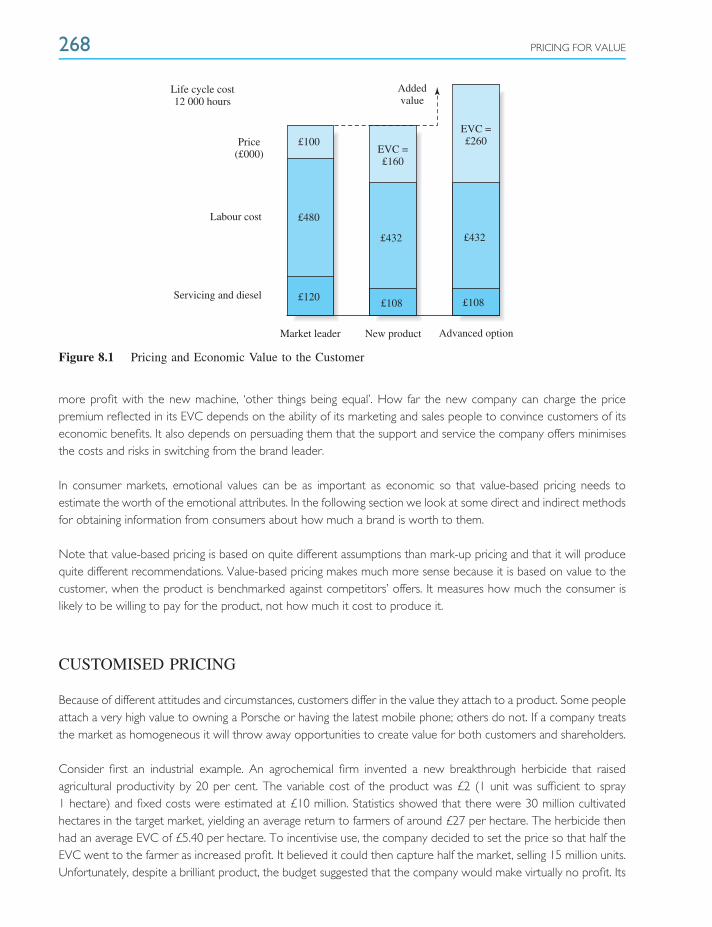
268 PRICING FOR VALUE
Market leader New product Advanced option
Servicing and diesel
Labour cost
Price(£000)
Life cycle cost12 000 hours
Addedvalue
EVC =£260
EVC =£160
£100
£432 £432
£480
£108£108£120
Figure 8.1 Pricing and Economic Value to the Customer
more profit with the new machine, ‘other things being equal’. How far the new company can charge the pricepremium reflected in its EVC depends on the ability of its marketing and sales people to convince customers of itseconomic benefits. It also depends on persuading them that the support and service the company offers minimisesthe costs and risks in switching from the brand leader.
In consumer markets, emotional values can be as important as economic so that value-based pricing needs toestimate the worth of the emotional attributes. In the following section we look at some direct and indirect methodsfor obtaining information from consumers about how much a brand is worth to them.
Note that value-based pricing is based on quite different assumptions than mark-up pricing and that it will producequite different recommendations. Value-based pricing makes much more sense because it is based on value to thecustomer, when the product is benchmarked against competitors’ offers. It measures how much the consumer islikely to be willing to pay for the product, not how much it cost to produce it.
CUSTOMISED PRICING
Because of different attitudes and circumstances, customers differ in the value they attach to a product. Some peopleattach a very high value to owning a Porsche or having the latest mobile phone; others do not. If a company treatsthe market as homogeneous it will throw away opportunities to create value for both customers and shareholders.
Consider first an industrial example. An agrochemical firm invented a new breakthrough herbicide that raisedagricultural productivity by 20 per cent. The variable cost of the product was £2 (1 unit was sufficient to spray1 hectare) and fixed costs were estimated at £10 million. Statistics showed that there were 30 million cultivatedhectares in the target market, yielding an average return to farmers of around £27 per hectare. The herbicide thenhad an average EVC of £5.40 per hectare. To incentivise use, the company decided to set the price so that half theEVC went to the farmer as increased profit. It believed it could then capture half the market, selling 15 million units.Unfortunately, despite a brilliant product, the budget suggested that the company would make virtually no profit. Its

PRICING PRINCIPLES 269
=
£10 millionYield £10EVC £2
Yield £20EVC £4
Yield £50EVC £10
Price £5.00Profit £20 million*
£10 million
£10 million
Unsegmented market
30 million hectaresAverage yield £27
Average EVC £5.40Price £2.70Profit £0.50
Segments
* i.e. 10 million units × (£5 price − £2 variable cost) − £10 million fixed cost
Figure 8.2 Customised Pricing, EVC and Profitability
revenue would be £40.5 million (15 million × £2.70) but its costs would amount to almost the same sum (variablecosts 15 million × £2 plus £10 million fixed cost).
Before abandoning the product, the company commissioned some market research. Like most markets, this oneproved to be highly segmented (Figure 8.2). The market could be divided into three segments of approximatelyequal size – around 10 million hectares each. The first was a low-value segment of rough grazing land in the northof the country, which yielded only £10 per hectare. A second segment of arable farming had a yield of £20, and thethird was high-value fruit farming with a yield of £50 per hectare. The EVCs were then £2, £4 and £10, respectively.The research showed that at the original price of £2.70, the low-value segment would never buy because the priceexceeded the EVC. In the middle segment the incentive to switch was also quite low. But if the company focusedon the high-value segment, it could sell at £5, offering an attractive incentive to the farmers and making a profit ofup to £20 million i.e. 10 million × (£5 – £2) – £10 million.
An important concept in pricing is the consumer surplus. The consumer surplus is the difference between the pricethe consumer would be willing to pay for a product and the price he or she actually pays. The existence of aconsumer surplus means that the company is ‘leaving money on the table’ – missing out on profit that it could bemaking. Consider an obvious example – pricing seats on an aeroplane. Suppose the demand curve for a returnflight to New York is like Figure 8.3. The price that just fills the 300-seater plane is £300, generating revenue of£90 000. The problem with this price is that the airline is passing up the consumer surplus represented by thetriangle ABC – worth some £165 000 of revenue.[1] This is because many affluent customers who get the ticket for£300 would have been willing to pay substantially more. A more profitable ticket price for the airline would be£750, which generates revenue of £120 000. Here the consumer surplus shrinks to the triangle ADE, but becauseonly 160 seats are sold, the airline misses out on the revenue from the 140 unfilled seats.
The obvious solution to this problem of minimising consumer surplus and maximising capacity is charging differentprices to different customers. The airlines introduced First, Business Class and Economy to do this. In the example,the airline sells 50 first-class seats at £1200, 110 business-class seats at £750 and 140 economy-class seats at£300, generating total revenue of £184 500. Table 8.2, which estimates the variable and fixed costs associatedwith the flight, shows that the three-class solution more than doubles profits compared to the single-pricesolution.
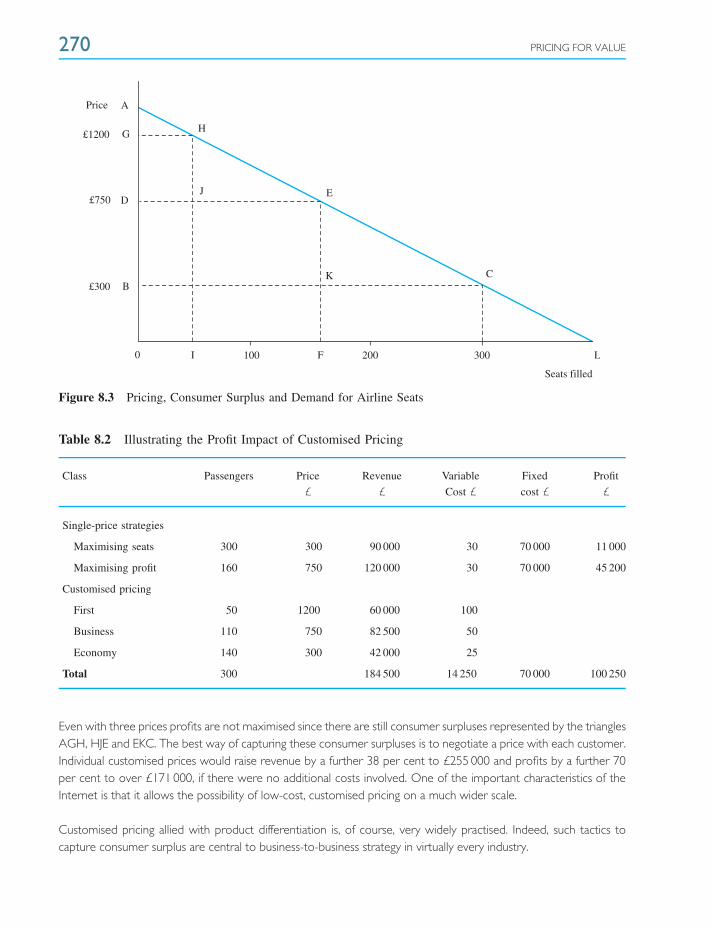
270 PRICING FOR VALUE
H
J E
K C
L0 100 200 300I F
Seats filled
B
D
G
APrice
£1200
£750
£300
Figure 8.3 Pricing, Consumer Surplus and Demand for Airline Seats
Table 8.2 Illustrating the Profit Impact of Customised Pricing
Class Passengers Price Revenue Variable Fixed Profit
£ £ Cost £ cost £ £
Single-price strategies
Maximising seats 300 300 90 000 30 70 000 11 000
Maximising profit 160 750 120 000 30 70 000 45 200
Customised pricing
First 50 1200 60 000 100
Business 110 750 82 500 50
Economy 140 300 42 000 25
Total 300 184 500 14 250 70 000 100 250
Even with three prices profits are not maximised since there are still consumer surpluses represented by the trianglesAGH, HJE and EKC. The best way of capturing these consumer surpluses is to negotiate a price with each customer.Individual customised prices would raise revenue by a further 38 per cent to £255 000 and profits by a further 70per cent to over £171 000, if there were no additional costs involved. One of the important characteristics of theInternet is that it allows the possibility of low-cost, customised pricing on a much wider scale.
Customised pricing allied with product differentiation is, of course, very widely practised. Indeed, such tactics tocapture consumer surplus are central to business-to-business strategy in virtually every industry.
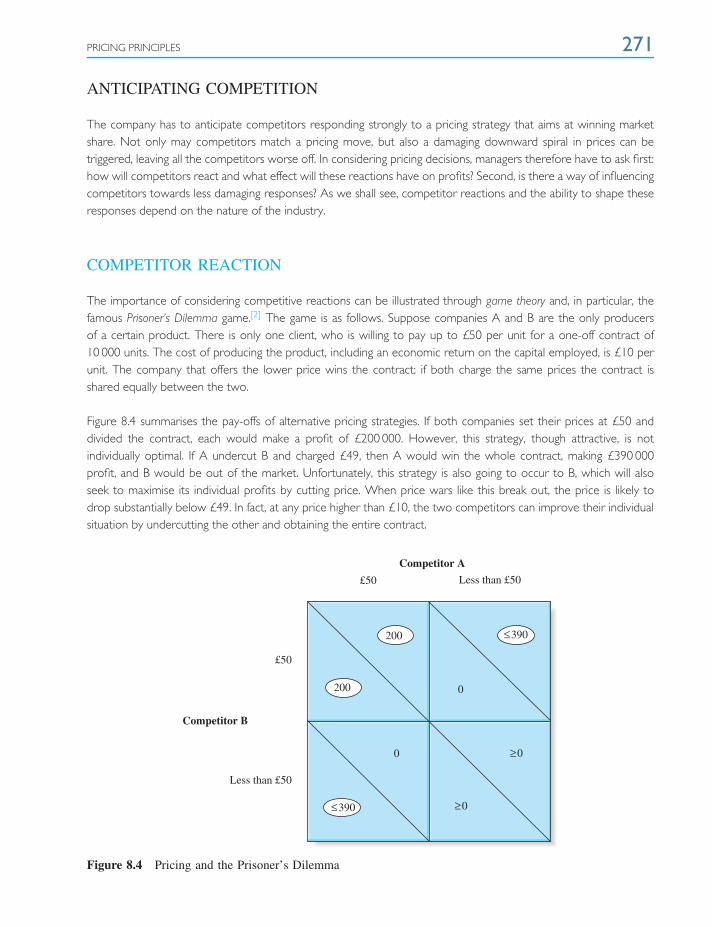
PRICING PRINCIPLES 271
ANTICIPATING COMPETITION
The company has to anticipate competitors responding strongly to a pricing strategy that aims at winning marketshare. Not only may competitors match a pricing move, but also a damaging downward spiral in prices can betriggered, leaving all the competitors worse off. In considering pricing decisions, managers therefore have to ask first:how will competitors react and what effect will these reactions have on profits? Second, is there a way of influencingcompetitors towards less damaging responses? As we shall see, competitor reactions and the ability to shape theseresponses depend on the nature of the industry.
COMPETITOR REACTION
The importance of considering competitive reactions can be illustrated through game theory and, in particular, thefamous Prisoner’s Dilemma game.[2] The game is as follows. Suppose companies A and B are the only producersof a certain product. There is only one client, who is willing to pay up to £50 per unit for a one-off contract of10 000 units. The cost of producing the product, including an economic return on the capital employed, is £10 perunit. The company that offers the lower price wins the contract; if both charge the same prices the contract isshared equally between the two.
Figure 8.4 summarises the pay-offs of alternative pricing strategies. If both companies set their prices at £50 anddivided the contract, each would make a profit of £200 000. However, this strategy, though attractive, is notindividually optimal. If A undercut B and charged £49, then A would win the whole contract, making £390 000profit, and B would be out of the market. Unfortunately, this strategy is also going to occur to B, which will alsoseek to maximise its individual profits by cutting price. When price wars like this break out, the price is likely todrop substantially below £49. In fact, at any price higher than £10, the two competitors can improve their individualsituation by undercutting the other and obtaining the entire contract.
Less than £50
Less than £50
£50
£50
0
0
≤390
≤390
≥0
≥0
200
200
Competitor A
Competitor B
Figure 8.4 Pricing and the Prisoner’s Dilemma
272 PRICING FOR VALUE
Only when both competitors are charging £10, and just making the minimum return necessary to stay in themarket, is there no incentive for either to undercut the other. In the language of game theory, £10 is the only Nashequilibrium of this game – the only price at which neither competitor can individually improve its own situation byreducing prices. But if the two competitors are charging £10, they are both much worse off than they could havebeen if they had shared the contract at £50.
The Prisoner’s Dilemma game is a simplified model of price competition but it does highlight a conclusion that holdsgenerally. That is, the individual incentive to cut prices can lead to consequences that leave every competitor worseoff. This result, however, does not always occur. The most important oversimplification of the model is that it isa one-off, static decision. In practice, competitors can usually react to each other’s price decisions. If a competitoranticipates that a rival will respond, then it may not engage in price competition. Take a simple example of a townwith two petrol stations next to each other and customers purely interested in getting the cheapest petrol. Tobegin with assume that both are charging the monopoly price – that price which maximises the joint profits of thetwo stations. What happens if competitor A lowers its price by 1p a litre? Competitor B, knowing that a pricedisadvantage will drive its market share to zero, is bound to immediately follow A’s price down. Anticipating thatthis will happen, station A should not lower its price in the first place. The outcome of anticipating a competitivereaction is the exact opposite of the Prisoner’s Dilemma – monopoly pricing, rather than competitive pricing.
Note that it is easy to predict a cooperative rather than a competitive price outcome in the petrol station examplebecause of the assumptions that were made. These include: price starts at the monopoly level; both competitorsimplicitly agree what this level is; information about prices is available immediately and without cost to bothcompetitors and consumers; there are only two competitors and no substitutes for the commodity. However, mostmarkets have more complex features than the petrol station example, making predictions about prices more difficult(see box, ‘Price Competition and the Internet’). The key to anticipating competitive pricing behaviour is to look atthe characteristics of the industry.
Price Competition and the Internet
On first glance, economic theory might suggest the Internet would reduce price competition. Prices become moretransparent, consumers and competitors have much fuller information at very low cost – all factors conducive toindustry cooperation.
However, what makes price competition more rather than less likely is the lowering of barriers to entry. Newentrants do not need to invest in expensive stores or spend on costly customer lists. This should increase the numberof firms and the differences among them, making high prices much more difficult to sustain, except where firmshave earned brand loyalty. New entrants with no brand name and unable to fund large advertising campaigns willfind it necessary to compete on price to get a toehold in the market.
Further, the reduction in search costs and the ease with which customers can compare prices on the Internetencourage consumers to switch to lower price suppliers. Search and switching costs may be so low that negotiatedprices become the norm. It may be much easier for customers to play suppliers off against each other, obtainingprice quotes through email and making offers and counter offers among a large number of sellers. For example,Internet sites like uSwitch make it easy to play one power supplier off against another. Online auctions like eBayhave become major growth businesses and online ‘name your own price’ businesses such as Priceline.com havefurther reduced the ability of suppliers to coordinate prices.
PRICING PRINCIPLES 273
CONDITIONS AFFECTING PRICE COMPETITION
Cooperation usually leads to more profitable outcomes than competition. Cooperation can be explicit, as whencompanies get together to fix prices. However, explicit cooperation on prices, or collusion, is normally illegal.The other way of restricting price competition is by implicit cooperation. This occurs when competitors learnto trust each other not to cut prices. This is more difficult, but a combination of price signalling and tit-for-tatoften produces this outcome. Price signalling involves tactics to make more transparent what the firm’s objectiveis. A company might signal its intention of not reducing prices by public commitment to its published price listor advanced announcements of price increases. Tit-for-tat is a specific strategy that begins by cooperating with thecompetitor then matching the last price move by the competitor. This simple strategy has been found to give themost profitable outcomes for both competitors in repeated Prisoner’s Dilemma games. What industry conditionsfavour price cooperation rather than competition?
1. The number of competitors. Such forms of implicit cooperation are more difficult to achieve where thereare a large number of competitors.
2. Differences among competitors. Where companies have very different cost structures, market shares andproduct ranges it is more difficult to reach agreement on a cooperative pricing strategy.
3. The short-run gain from price cutting. Price competition is more likely to break out when there arepotentially big short-run gains. These are greatest when firms have substantial excess capacity and when theproducts are relatively similar so that consumers can easily switch.
4. Price transparency. Transparent pricing encourages cooperation. If rivals immediately observe price cuts,aggressive pricing is deterred. On the other hand, if prices are the result of complex, private negotiations it isharder for implicit cooperation to develop because rivals cannot assess their opponent’s actions.
CHANGING THE RULES OF THE GAME
Companies often seek to reduce price competition by changing the rules of the game. This involves shifting theabove conditions to make them more favourable to cooperation. One way is to reduce the number of competitorsthrough mergers and acquisitions. This may also reduce some of the differences between the surviving players,making cooperative behaviour more likely.
Another strategy is to reduce the gains to be had from price cutting. Building stronger brands, through such actionsas advertising, market segmentation and product differentiation, reduces price sensitivity and the advantage rivalscan expect from price cuts. Relationship marketing programmes are particularly effective. For example, a customerwho is a member of the British Airways frequent flyer programme is less likely to respond to a low price offeredby Virgin Atlantic on the same route. This reduces the incentive for competitors to cut prices. Higher ticket pricesresult.
Finally, there are a variety of methods that companies can use to make their pricing more transparent, to encouragecompetitors’ trust. One way of avoiding price competition is for firms to follow a pattern of price leadership. Oftenthis is preceded by announcements to build a consensus. The firm will test the water by press releases announcing‘unsatisfactory industry margins’, ‘the need to recoup increased costs’ and ‘a price increase being expected soon’.

274 PRICING FOR VALUE
ALIGNING PRICING TO STRATEGY
Prices are not determined in isolation but are influenced by the firm’s strategy, the market positioning of the product,the other products it sells, and the various markets where it operates.[3]
VALUE NOT PROFITS
The firm’s pricing should be geared to deliver value, not short-term profits. Value is measured by the net presentvalue of the long-term cash flow that a pricing policy delivers. The value-maximising price can be higher or lowerthan the profit-maximising price. If prices fall over time, the price that maximises short-run profits may be belowthe value-maximising price. For example, some pharmaceutical markets are characterised by price elasticity andlow variable costs, so that a lower price will increase profits. But in the Japanese market in the 1990s, the healthauthorities demanded 50 per cent price cuts every two years. In this situation, a higher initial price may mean lowershort-term sales and profits but higher long-term returns.
More usually, however, the value-maximising price is lower than the short-run profit-maximising price. One reasonis that price elasticity is higher in the long run than in the short run. Lack of information about alternatives andswitching costs means that it takes time for customers dissatisfied with the firm’s relatively high price to find newsuppliers. Second, high short-term profits stimulate new competitors eager to capitalise on the opportunities offeredby high prices. Finally, in growing markets high prices can prevent the firm gaining the critical mass in market sharenecessary to be attractive to customers and distributors and so to be viable in the longer term.
PRICE AND POSITIONING
Pricing is influenced by how the firm wants to position the product. All markets are segmented. Historically athree-tier segmentation of economy, mid-market and premium positioned brands has characterised many markets(Figure 8.5). Customers normally choose brands from within a specific segment. For example, in the car market thepremium segment includes the higher-end Mercedes, BMW and Lexus brands; the mid-market includes the largerFord, General Motors and VW ranges, and the economy has the lower-end Ford, Nissan and Fiat ranges. Brandswithin a segment are termed a strategic group.
Brands within a strategic group compete with each other to attract the same customers. The price elasticity within astrategic group is normally significantly higher than that between brands in different strategic groups. That is, a pricecut by a mid-market brand will draw more sales from other mid-market brands than from other segments. Studiesalso suggest that where switching occurs between segments it is not symmetrical. Price cuts by a higher-quality tierare more powerful in pulling customers up from lower tiers, than lower tier price cuts are in pulling customersdown from upper tiers. In other words, customers trade-up more readily than they trade-down.
A company that competes in only one group is called a niche business. As markets mature successful companiesincreasingly tend to seek to compete in all the groups to achieve economies of scale and scope. For example,American Express offers Blue, Green, Gold and Platinum cards. As the market matures niche businesses are oftenacquired. For example, in the car market Volvo was bought by Ford to penetrate the premium segment; VW boughtSkoda to boost its share in the economy segment.
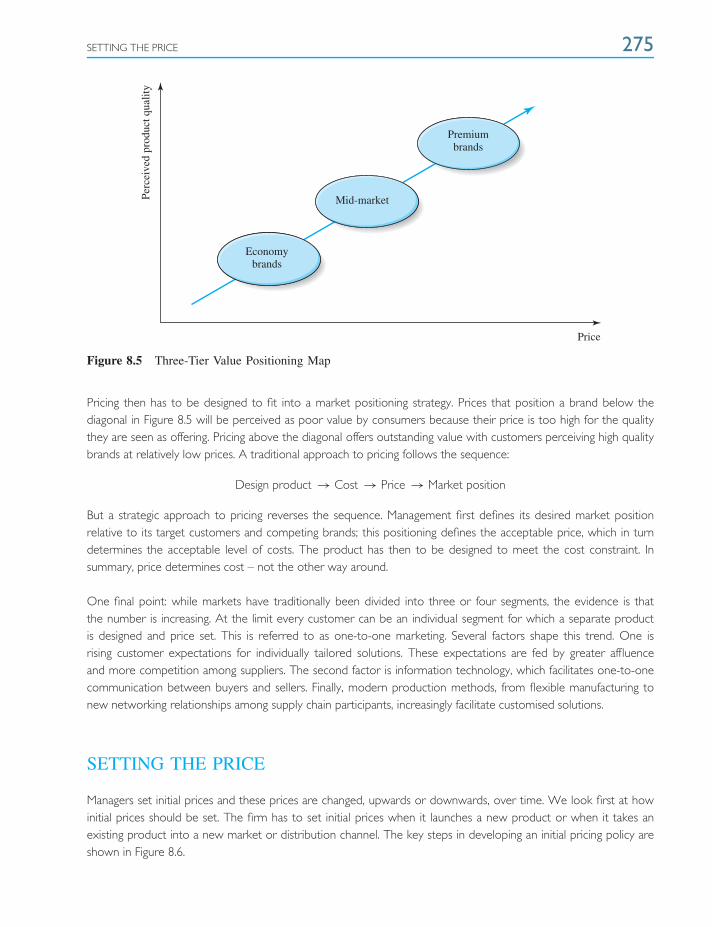
SETTING THE PRICE 275
Economybrands
Mid-market
Premiumbrands
Perc
eive
d pr
oduc
t qua
lity
Price
Figure 8.5 Three-Tier Value Positioning Map
Pricing then has to be designed to fit into a market positioning strategy. Prices that position a brand below thediagonal in Figure 8.5 will be perceived as poor value by consumers because their price is too high for the qualitythey are seen as offering. Pricing above the diagonal offers outstanding value with customers perceiving high qualitybrands at relatively low prices. A traditional approach to pricing follows the sequence:
Design product → Cost → Price → Market position
But a strategic approach to pricing reverses the sequence. Management first defines its desired market positionrelative to its target customers and competing brands; this positioning defines the acceptable price, which in turndetermines the acceptable level of costs. The product has then to be designed to meet the cost constraint. Insummary, price determines cost – not the other way around.
One final point: while markets have traditionally been divided into three or four segments, the evidence is thatthe number is increasing. At the limit every customer can be an individual segment for which a separate productis designed and price set. This is referred to as one-to-one marketing. Several factors shape this trend. One isrising customer expectations for individually tailored solutions. These expectations are fed by greater affluenceand more competition among suppliers. The second factor is information technology, which facilitates one-to-onecommunication between buyers and sellers. Finally, modern production methods, from flexible manufacturing tonew networking relationships among supply chain participants, increasingly facilitate customised solutions.
SETTING THE PRICE
Managers set initial prices and these prices are changed, upwards or downwards, over time. We look first at howinitial prices should be set. The firm has to set initial prices when it launches a new product or when it takes anexisting product into a new market or distribution channel. The key steps in developing an initial pricing policy areshown in Figure 8.6.
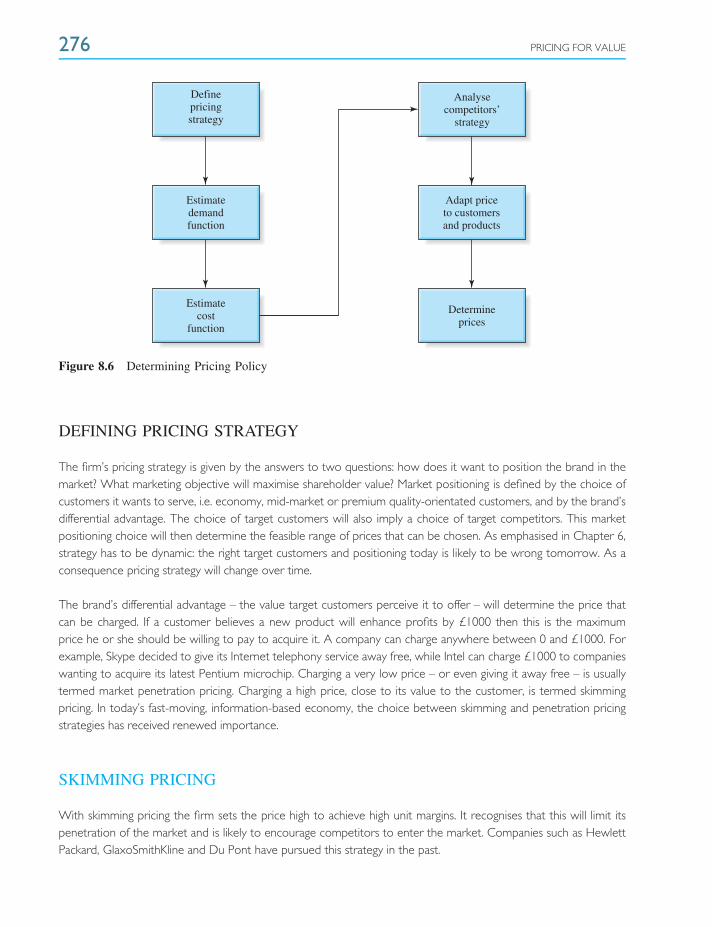
276 PRICING FOR VALUE
Definepricingstrategy
Estimatedemandfunction
Estimatecost
function
Analysecompetitors’
strategy
Adapt priceto customersand products
Determineprices
Figure 8.6 Determining Pricing Policy
DEFINING PRICING STRATEGY
The firm’s pricing strategy is given by the answers to two questions: how does it want to position the brand in themarket? What marketing objective will maximise shareholder value? Market positioning is defined by the choice ofcustomers it wants to serve, i.e. economy, mid-market or premium quality-orientated customers, and by the brand’sdifferential advantage. The choice of target customers will also imply a choice of target competitors. This marketpositioning choice will then determine the feasible range of prices that can be chosen. As emphasised in Chapter 6,strategy has to be dynamic: the right target customers and positioning today is likely to be wrong tomorrow. As aconsequence pricing strategy will change over time.
The brand’s differential advantage – the value target customers perceive it to offer – will determine the price thatcan be charged. If a customer believes a new product will enhance profits by £1000 then this is the maximumprice he or she should be willing to pay to acquire it. A company can charge anywhere between 0 and £1000. Forexample, Skype decided to give its Internet telephony service away free, while Intel can charge £1000 to companieswanting to acquire its latest Pentium microchip. Charging a very low price – or even giving it away free – is usuallytermed market penetration pricing. Charging a high price, close to its value to the customer, is termed skimmingpricing. In today’s fast-moving, information-based economy, the choice between skimming and penetration pricingstrategies has received renewed importance.
SKIMMING PRICING
With skimming pricing the firm sets the price high to achieve high unit margins. It recognises that this will limit itspenetration of the market and is likely to encourage competitors to enter the market. Companies such as HewlettPackard, GlaxoSmithKline and Du Pont have pursued this strategy in the past.
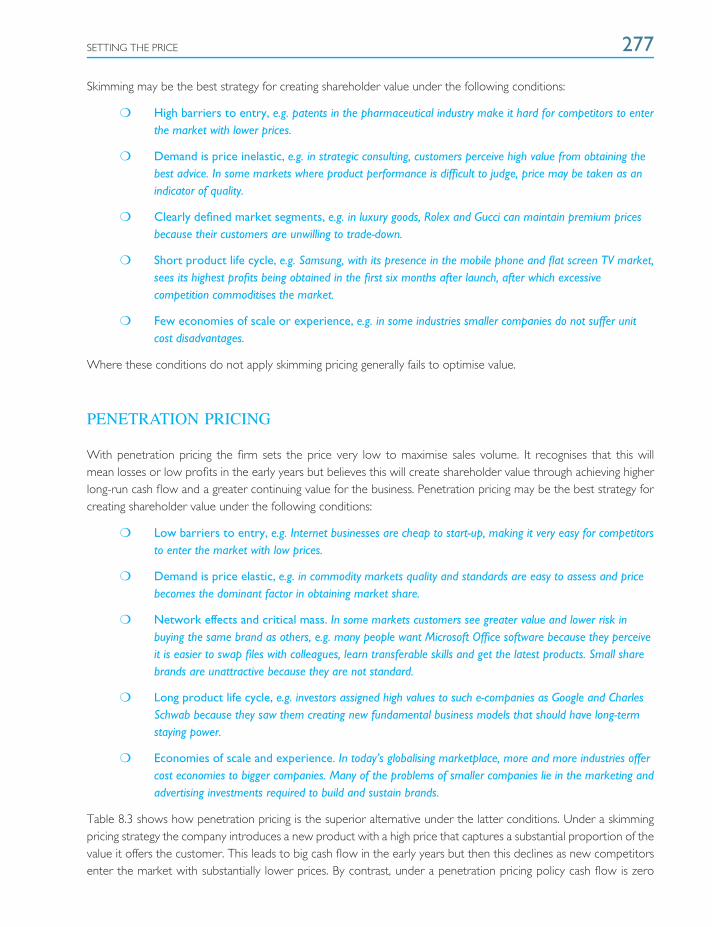
SETTING THE PRICE 277
Skimming may be the best strategy for creating shareholder value under the following conditions:
❍ High barriers to entry, e.g. patents in the pharmaceutical industry make it hard for competitors to enterthe market with lower prices.
❍ Demand is price inelastic, e.g. in strategic consulting, customers perceive high value from obtaining thebest advice. In some markets where product performance is difficult to judge, price may be taken as anindicator of quality.
❍ Clearly defined market segments, e.g. in luxury goods, Rolex and Gucci can maintain premium pricesbecause their customers are unwilling to trade-down.
❍ Short product life cycle, e.g. Samsung, with its presence in the mobile phone and flat screen TV market,sees its highest profits being obtained in the first six months after launch, after which excessivecompetition commoditises the market.
❍ Few economies of scale or experience, e.g. in some industries smaller companies do not suffer unitcost disadvantages.
Where these conditions do not apply skimming pricing generally fails to optimise value.
PENETRATION PRICING
With penetration pricing the firm sets the price very low to maximise sales volume. It recognises that this willmean losses or low profits in the early years but believes this will create shareholder value through achieving higherlong-run cash flow and a greater continuing value for the business. Penetration pricing may be the best strategy forcreating shareholder value under the following conditions:
❍ Low barriers to entry, e.g. Internet businesses are cheap to start-up, making it very easy for competitorsto enter the market with low prices.
❍ Demand is price elastic, e.g. in commodity markets quality and standards are easy to assess and pricebecomes the dominant factor in obtaining market share.
❍ Network effects and critical mass. In some markets customers see greater value and lower risk inbuying the same brand as others, e.g. many people want Microsoft Office software because they perceiveit is easier to swap files with colleagues, learn transferable skills and get the latest products. Small sharebrands are unattractive because they are not standard.
❍ Long product life cycle, e.g. investors assigned high values to such e-companies as Google and CharlesSchwab because they saw them creating new fundamental business models that should have long-termstaying power.
❍ Economies of scale and experience. In today’s globalising marketplace, more and more industries offercost economies to bigger companies. Many of the problems of smaller companies lie in the marketing andadvertising investments required to build and sustain brands.
Table 8.3 shows how penetration pricing is the superior alternative under the latter conditions. Under a skimmingpricing strategy the company introduces a new product with a high price that captures a substantial proportion of thevalue it offers the customer. This leads to big cash flow in the early years but then this declines as new competitorsenter the market with substantially lower prices. By contrast, under a penetration pricing policy cash flow is zero
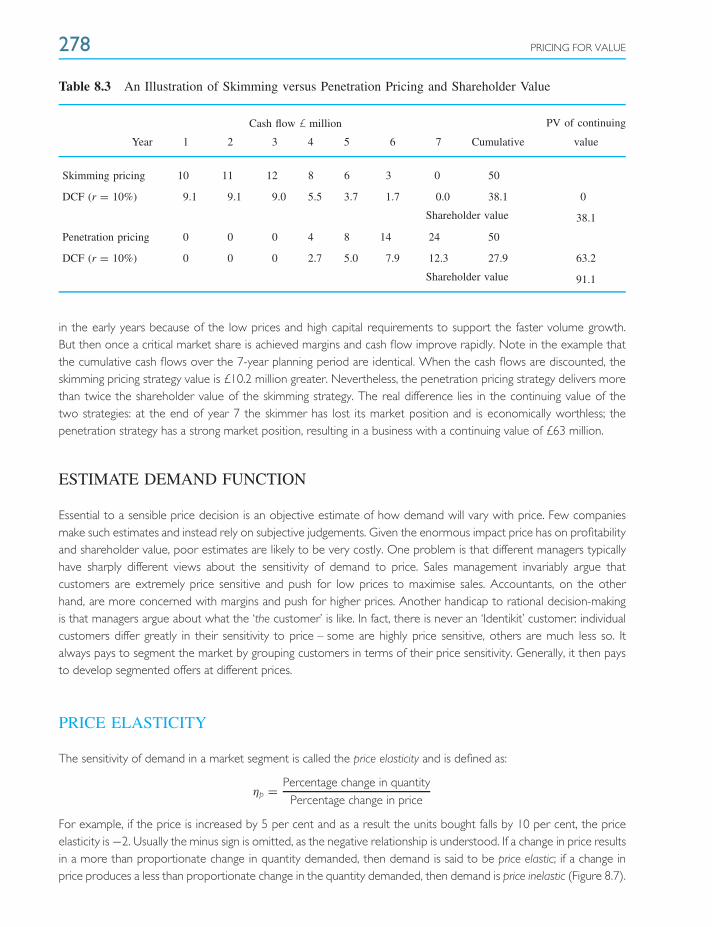
278 PRICING FOR VALUE
Table 8.3 An Illustration of Skimming versus Penetration Pricing and Shareholder Value
PV of continuingCash flow £ million
Year 1 2 3 4 5 6 7 Cumulative value
Skimming pricing 10 11 12 8 6 3 0 50
DCF (r = 10%) 9.1 9.1 9.0 5.5 3.7 1.7 0.0 38.1 0
38.1Shareholder value
Penetration pricing 0 0 0 4 8 14 24 50
DCF (r = 10%) 0 0 0 2.7 5.0 7.9 12.3 27.9 63.2
91.1Shareholder value
in the early years because of the low prices and high capital requirements to support the faster volume growth.But then once a critical market share is achieved margins and cash flow improve rapidly. Note in the example thatthe cumulative cash flows over the 7-year planning period are identical. When the cash flows are discounted, theskimming pricing strategy value is £10.2 million greater. Nevertheless, the penetration pricing strategy delivers morethan twice the shareholder value of the skimming strategy. The real difference lies in the continuing value of thetwo strategies: at the end of year 7 the skimmer has lost its market position and is economically worthless; thepenetration strategy has a strong market position, resulting in a business with a continuing value of £63 million.
ESTIMATE DEMAND FUNCTION
Essential to a sensible price decision is an objective estimate of how demand will vary with price. Few companiesmake such estimates and instead rely on subjective judgements. Given the enormous impact price has on profitabilityand shareholder value, poor estimates are likely to be very costly. One problem is that different managers typicallyhave sharply different views about the sensitivity of demand to price. Sales management invariably argue thatcustomers are extremely price sensitive and push for low prices to maximise sales. Accountants, on the otherhand, are more concerned with margins and push for higher prices. Another handicap to rational decision-makingis that managers argue about what the ‘the customer’ is like. In fact, there is never an ‘Identikit’ customer: individualcustomers differ greatly in their sensitivity to price – some are highly price sensitive, others are much less so. Italways pays to segment the market by grouping customers in terms of their price sensitivity. Generally, it then paysto develop segmented offers at different prices.
PRICE ELASTICITY
The sensitivity of demand in a market segment is called the price elasticity and is defined as:
ηp = Percentage change in quantityPercentage change in price
For example, if the price is increased by 5 per cent and as a result the units bought falls by 10 per cent, the priceelasticity is −2. Usually the minus sign is omitted, as the negative relationship is understood. If a change in price resultsin a more than proportionate change in quantity demanded, then demand is said to be price elastic; if a change inprice produces a less than proportionate change in the quantity demanded, then demand is price inelastic (Figure 8.7).
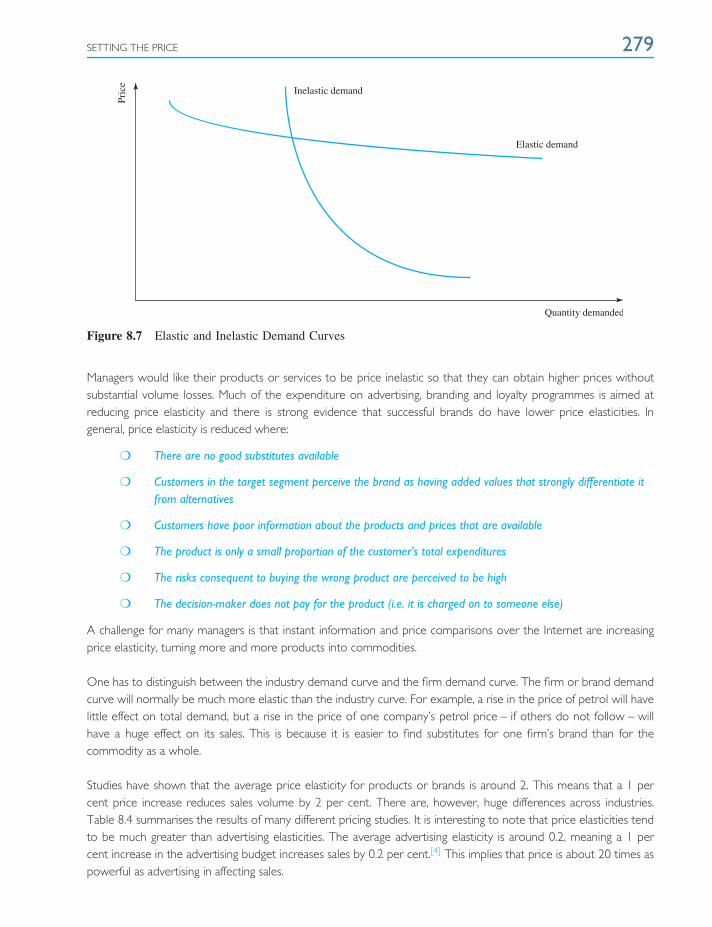
SETTING THE PRICE 279
Pric
e
Inelastic demand
Elastic demand
Quantity demanded
Figure 8.7 Elastic and Inelastic Demand Curves
Managers would like their products or services to be price inelastic so that they can obtain higher prices withoutsubstantial volume losses. Much of the expenditure on advertising, branding and loyalty programmes is aimed atreducing price elasticity and there is strong evidence that successful brands do have lower price elasticities. Ingeneral, price elasticity is reduced where:
❍ There are no good substitutes available
❍ Customers in the target segment perceive the brand as having added values that strongly differentiate itfrom alternatives
❍ Customers have poor information about the products and prices that are available
❍ The product is only a small proportion of the customer’s total expenditures
❍ The risks consequent to buying the wrong product are perceived to be high
❍ The decision-maker does not pay for the product (i.e. it is charged on to someone else)
A challenge for many managers is that instant information and price comparisons over the Internet are increasingprice elasticity, turning more and more products into commodities.
One has to distinguish between the industry demand curve and the firm demand curve. The firm or brand demandcurve will normally be much more elastic than the industry curve. For example, a rise in the price of petrol will havelittle effect on total demand, but a rise in the price of one company’s petrol price – if others do not follow – willhave a huge effect on its sales. This is because it is easier to find substitutes for one firm’s brand than for thecommodity as a whole.
Studies have shown that the average price elasticity for products or brands is around 2. This means that a 1 percent price increase reduces sales volume by 2 per cent. There are, however, huge differences across industries.Table 8.4 summarises the results of many different pricing studies. It is interesting to note that price elasticities tendto be much greater than advertising elasticities. The average advertising elasticity is around 0.2, meaning a 1 percent increase in the advertising budget increases sales by 0.2 per cent.[4] This implies that price is about 20 times aspowerful as advertising in affecting sales.
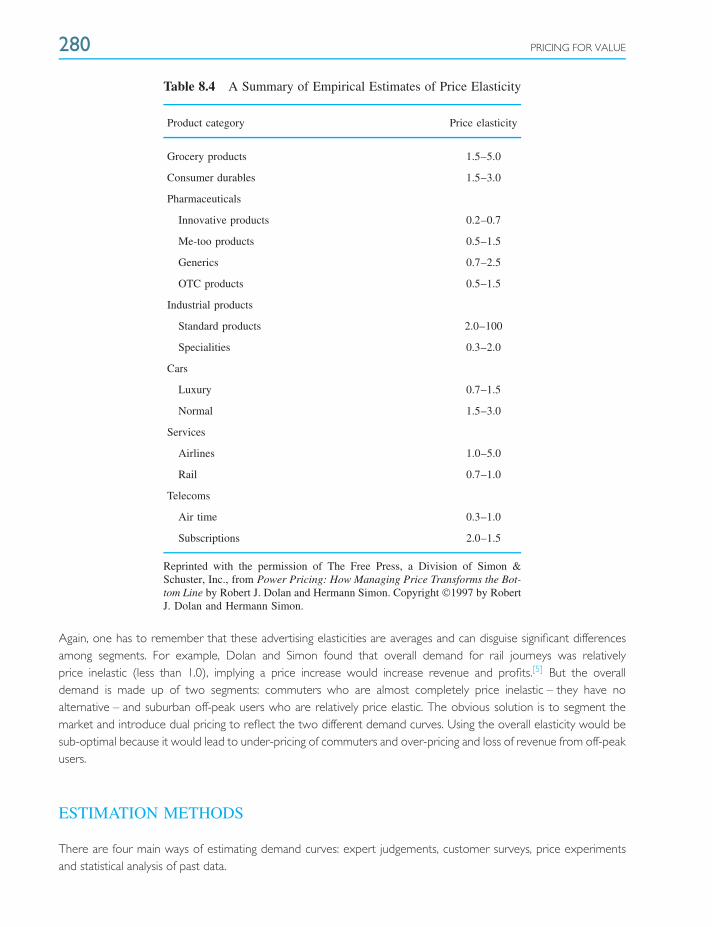
280 PRICING FOR VALUE
Table 8.4 A Summary of Empirical Estimates of Price Elasticity
Product category Price elasticity
Grocery products 1.5–5.0
Consumer durables 1.5–3.0
Pharmaceuticals
Innovative products 0.2–0.7
Me-too products 0.5–1.5
Generics 0.7–2.5
OTC products 0.5–1.5
Industrial products
Standard products 2.0–100
Specialities 0.3–2.0
Cars
Luxury 0.7–1.5
Normal 1.5–3.0
Services
Airlines 1.0–5.0
Rail 0.7–1.0
Telecoms
Air time 0.3–1.0
Subscriptions 2.0–1.5
Reprinted with the permission of The Free Press, a Division of Simon &Schuster, Inc., from Power Pricing: How Managing Price Transforms the Bot-tom Line by Robert J. Dolan and Hermann Simon. Copyright 1997 by RobertJ. Dolan and Hermann Simon.
Again, one has to remember that these advertising elasticities are averages and can disguise significant differencesamong segments. For example, Dolan and Simon found that overall demand for rail journeys was relativelyprice inelastic (less than 1.0), implying a price increase would increase revenue and profits.[5] But the overalldemand is made up of two segments: commuters who are almost completely price inelastic – they have noalternative – and suburban off-peak users who are relatively price elastic. The obvious solution is to segment themarket and introduce dual pricing to reflect the two different demand curves. Using the overall elasticity would besub-optimal because it would lead to under-pricing of commuters and over-pricing and loss of revenue from off-peakusers.
ESTIMATION METHODS
There are four main ways of estimating demand curves: expert judgements, customer surveys, price experimentsand statistical analysis of past data.
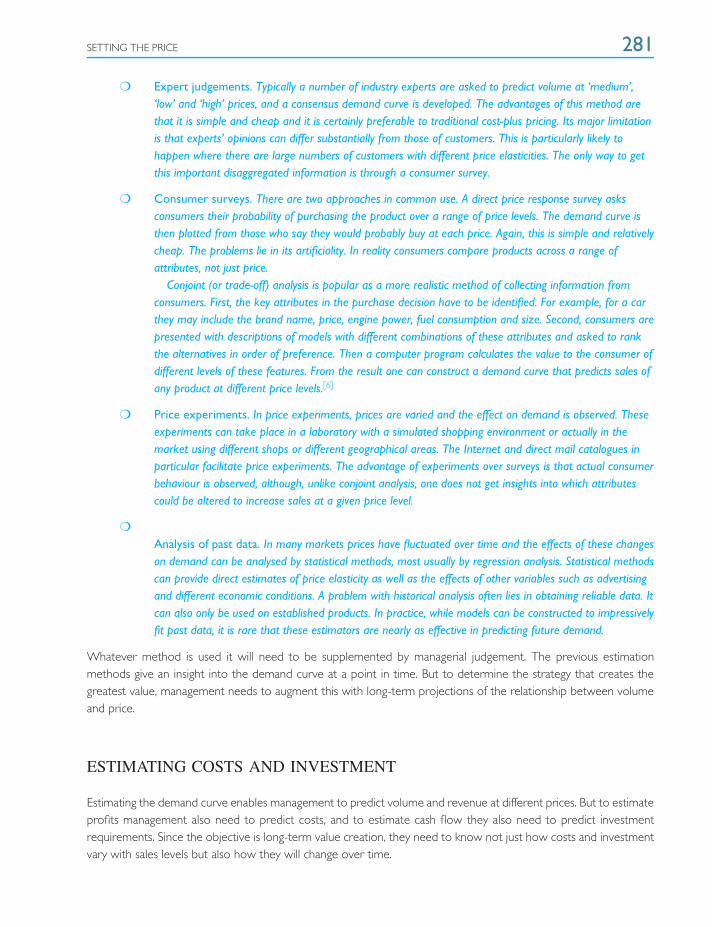
SETTING THE PRICE 281
❍ Expert judgements. Typically a number of industry experts are asked to predict volume at ‘medium’,‘low’ and ‘high’ prices, and a consensus demand curve is developed. The advantages of this method arethat it is simple and cheap and it is certainly preferable to traditional cost-plus pricing. Its major limitationis that experts’ opinions can differ substantially from those of customers. This is particularly likely tohappen where there are large numbers of customers with different price elasticities. The only way to getthis important disaggregated information is through a consumer survey.
❍ Consumer surveys. There are two approaches in common use. A direct price response survey asksconsumers their probability of purchasing the product over a range of price levels. The demand curve isthen plotted from those who say they would probably buy at each price. Again, this is simple and relativelycheap. The problems lie in its artificiality. In reality consumers compare products across a range ofattributes, not just price.
Conjoint (or trade-off) analysis is popular as a more realistic method of collecting information fromconsumers. First, the key attributes in the purchase decision have to be identified. For example, for a carthey may include the brand name, price, engine power, fuel consumption and size. Second, consumers arepresented with descriptions of models with different combinations of these attributes and asked to rankthe alternatives in order of preference. Then a computer program calculates the value to the consumer ofdifferent levels of these features. From the result one can construct a demand curve that predicts sales ofany product at different price levels.[6]
❍ Price experiments. In price experiments, prices are varied and the effect on demand is observed. Theseexperiments can take place in a laboratory with a simulated shopping environment or actually in themarket using different shops or different geographical areas. The Internet and direct mail catalogues inparticular facilitate price experiments. The advantage of experiments over surveys is that actual consumerbehaviour is observed, although, unlike conjoint analysis, one does not get insights into which attributescould be altered to increase sales at a given price level.
❍
Analysis of past data. In many markets prices have fluctuated over time and the effects of these changeson demand can be analysed by statistical methods, most usually by regression analysis. Statistical methodscan provide direct estimates of price elasticity as well as the effects of other variables such as advertisingand different economic conditions. A problem with historical analysis often lies in obtaining reliable data. Itcan also only be used on established products. In practice, while models can be constructed to impressivelyfit past data, it is rare that these estimators are nearly as effective in predicting future demand.
Whatever method is used it will need to be supplemented by managerial judgement. The previous estimationmethods give an insight into the demand curve at a point in time. But to determine the strategy that creates thegreatest value, management needs to augment this with long-term projections of the relationship between volumeand price.
ESTIMATING COSTS AND INVESTMENT
Estimating the demand curve enables management to predict volume and revenue at different prices. But to estimateprofits management also need to predict costs, and to estimate cash flow they also need to predict investmentrequirements. Since the objective is long-term value creation, they need to know not just how costs and investmentvary with sales levels but also how they will change over time.
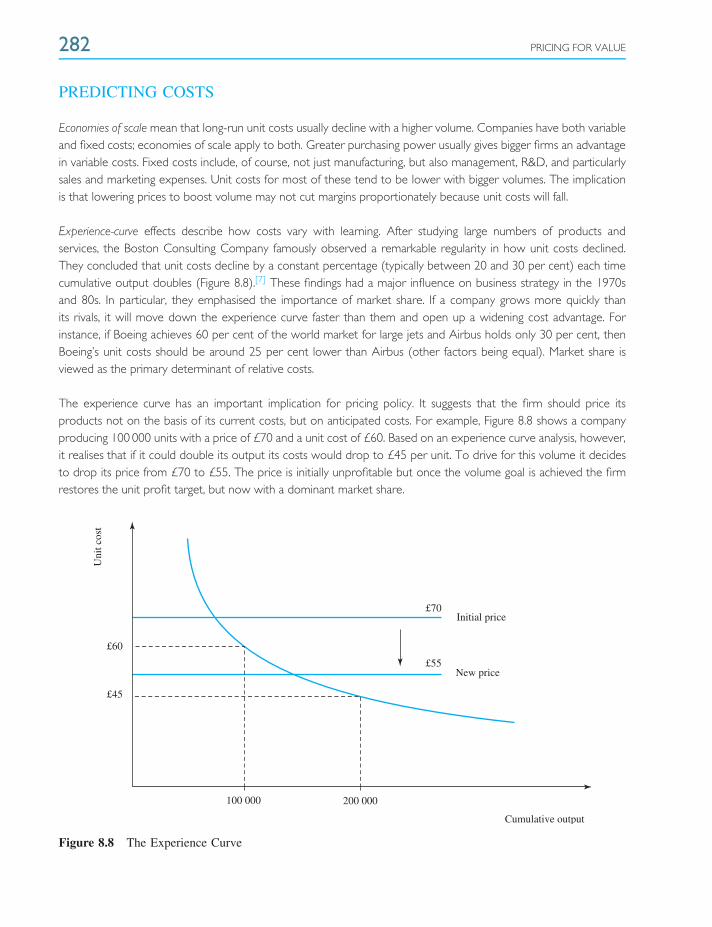
282 PRICING FOR VALUE
PREDICTING COSTS
Economies of scale mean that long-run unit costs usually decline with a higher volume. Companies have both variableand fixed costs; economies of scale apply to both. Greater purchasing power usually gives bigger firms an advantagein variable costs. Fixed costs include, of course, not just manufacturing, but also management, R&D, and particularlysales and marketing expenses. Unit costs for most of these tend to be lower with bigger volumes. The implicationis that lowering prices to boost volume may not cut margins proportionately because unit costs will fall.
Experience-curve effects describe how costs vary with learning. After studying large numbers of products andservices, the Boston Consulting Company famously observed a remarkable regularity in how unit costs declined.They concluded that unit costs decline by a constant percentage (typically between 20 and 30 per cent) each timecumulative output doubles (Figure 8.8).[7] These findings had a major influence on business strategy in the 1970sand 80s. In particular, they emphasised the importance of market share. If a company grows more quickly thanits rivals, it will move down the experience curve faster than them and open up a widening cost advantage. Forinstance, if Boeing achieves 60 per cent of the world market for large jets and Airbus holds only 30 per cent, thenBoeing’s unit costs should be around 25 per cent lower than Airbus (other factors being equal). Market share isviewed as the primary determinant of relative costs.
The experience curve has an important implication for pricing policy. It suggests that the firm should price itsproducts not on the basis of its current costs, but on anticipated costs. For example, Figure 8.8 shows a companyproducing 100 000 units with a price of £70 and a unit cost of £60. Based on an experience curve analysis, however,it realises that if it could double its output its costs would drop to £45 per unit. To drive for this volume it decidesto drop its price from £70 to £55. The price is initially unprofitable but once the volume goal is achieved the firmrestores the unit profit target, but now with a dominant market share.
100 000 200 000
Cumulative output
£60
£55
£70
£45
New price
Initial price
Uni
t cos
t
Figure 8.8 The Experience Curve
SETTING THE PRICE 283
These dynamic cost relationships offer important insights into value-based pricing. In particular, they emphasise thedangers of cost-plus formulas and pricing aimed at maximising short-term profits. In growing markets especially,companies that do not maintain their market shares will often end up with non-viable cost structures, having missedopportunities to build scale and experience-curve economies. However, these relationships must be used withcaution. If all the competitors are seeking to achieve scale and experience curve economies through ambitiousstrategies to build market share, then overcapacity will be the result and the anticipated superior profitability frommarket share will not emerge. A further problem is that focusing on optimising costs for existing products can openthe firm to being leapfrogged by innovative products. TI, for example, used experience-curve pricing to capturemarket share in calculators when it invented them in the late 1960s, but missed out on profitable new markets suchas PCs, hand-held computers and mobile phones.
PREDICTING INVESTMENTS
To calculate cash flow, incremental investment has to be deducted from after-tax operating profits. Incrementalfixed investment is capital expenditures less the depreciation expense. A forecast of incremental fixed investment isusually obtainable from the long-term business plan. But this will have to be adapted to any revisions of the pricingstrategy. The higher are predicted volume sales, the greater the fixed capital requirement. Incremental workingcapital investment represents net debtors, stocks and creditors that are required to support sales growth. Again,baseline forecasts are usually built from expressing the investment as a percentage of incremental sales.
Projections need to be adjusted for pricing policy. For example, lower prices will tend to raise the historic relationshipbetween investment and incremental sales. On the other hand, advances in technology may lower it. There is alsoevidence that economies of scale mean that companies with a high market share have lower percentage investmentrequirements than smaller companies. Finally, any plans aimed at reducing investment (e.g. just-in-time stocking ormanufacturing-to-order) have to be factored in.
ANTICIPATING COMPETITIVE STRATEGIES
Estimates of demand and pricing need to incorporate specific assumptions about competitors’ current price-valuecombinations and their likely reactions to new product and pricing initiatives.
ASSESSING COMPETITORS’ VALUES
Customers will choose products that offer the best perceived value. Value can be increased by improving perceivedproduct quality or lowering the price. Competitive values can be compared using conjoint analysis or direct customerresearch. Here is an example of the direct research approach.[8] The method requires four steps:
1. Identify the dimensions of quality. Use focus groups to find out what product and service attributescustomers are looking for when they choose suppliers.
2. Weight quality dimensions. Determine which attributes customers perceive as most important.
3. Measure competitors along attributes. Conduct a survey to determine how customers rate competitors’offers along the attributes.
4. Discover value preferences. Ask customers to rate which combinations of price and quality they prefer.Segment customers according to their preferences.
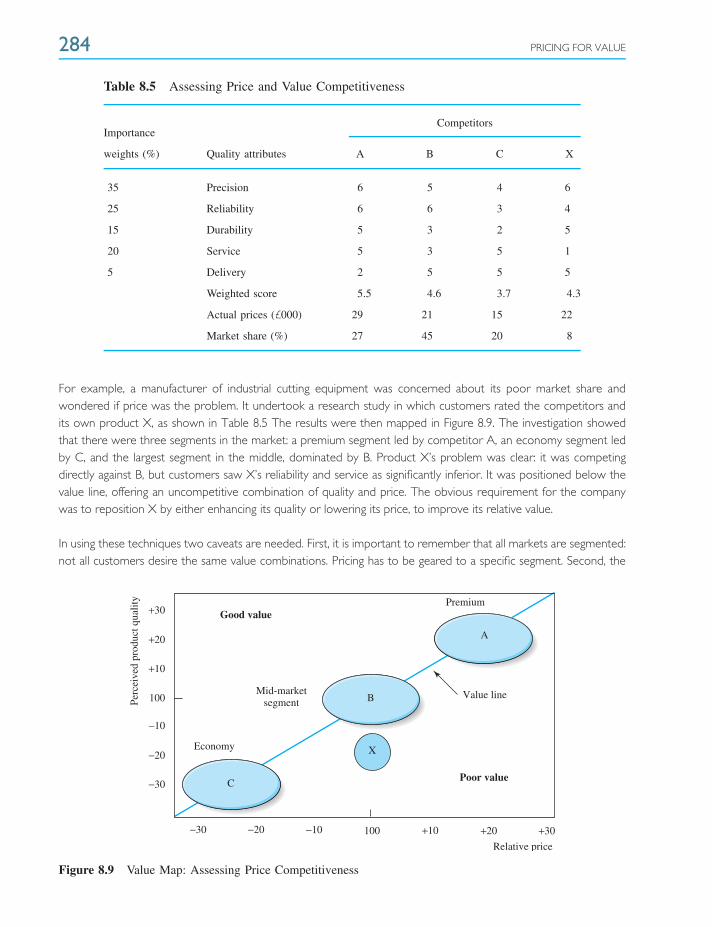
284 PRICING FOR VALUE
Table 8.5 Assessing Price and Value Competitiveness
CompetitorsImportance
weights (%) Quality attributes A B C X
35 Precision 6 5 4 6
25 Reliability 6 6 3 4
15 Durability 5 3 2 5
20 Service 5 3 5 1
5 Delivery 2 5 5 5
Weighted score 5.5 4.6 3.7 4.3
Actual prices (£000) 29 21 15 22
Market share (%) 27 45 20 8
For example, a manufacturer of industrial cutting equipment was concerned about its poor market share andwondered if price was the problem. It undertook a research study in which customers rated the competitors andits own product X, as shown in Table 8.5 The results were then mapped in Figure 8.9. The investigation showedthat there were three segments in the market: a premium segment led by competitor A, an economy segment ledby C, and the largest segment in the middle, dominated by B. Product X’s problem was clear: it was competingdirectly against B, but customers saw X’s reliability and service as significantly inferior. It was positioned below thevalue line, offering an uncompetitive combination of quality and price. The obvious requirement for the companywas to reposition X by either enhancing its quality or lowering its price, to improve its relative value.
In using these techniques two caveats are needed. First, it is important to remember that all markets are segmented:not all customers desire the same value combinations. Pricing has to be geared to a specific segment. Second, the
+30+20+10
+30
+20
+10
100−10−20−30
100
−10
−20
−30
Relative price
Mid-marketsegment
Economy
Value line
C
X
B
A
Premium
Perc
eive
d pr
oduc
t qua
lity
Good value
Poor value
Figure 8.9 Value Map: Assessing Price Competitiveness
ADAPTING PRICES TO CUSTOMERS AND PRODUCTS 285
buying criteria generally vary among members of the decision-making unit. For example, in business-to-businessmarkets, purchasing executives tend to be the most price sensitive; technical staff are more quality-orientated, andsenior executives emphasise lifetime costs and whether the seller can offer a potential competitive advantage tothe company. Consequently, by strategically tailoring selling and communications to specific members of the buyingunit, the supplier can partly shape the importance attached to the different attributes.
ANTICIPATING COMPETITOR REACTIONS
If a competitor sets a price to offer customers an outstanding value combination, it should anticipate competitorsreacting to defend their market share. The company will not want to trigger a mutually damaging price war – which,as the Prisoner’s Dilemma game illustrates, can easily occur. Anticipating competitors’ reactions requires firstunderstanding their strategic objectives for the product. How important is it for the company’s future? This willsuggest how hard they might fight to retain market share. Second, management needs to estimate the companycost structure and financial strength. How much can they afford to cut prices and invest in defending theproduct?
ADAPTING PRICES TO CUSTOMERS AND PRODUCTS
The price of a product is rarely set in isolation. Its price has to be set in relation to the other products the firm isselling and to the various markets and types of customer who might buy it.
CUSTOMISED PRICING
In the early days of the industrial era, such companies as Ford with its Model T and Coca-Cola with its ubiquitouscurved bottle practised undifferentiated marketing. The same product was offered to the whole market at the sameprice. But in the second half of the twentieth century, undifferentiated marketing gave way to segmentation andpositioning. Companies differentiated their offers, tailoring products and prices to specific segments of the market.The information era has seen marketing strategies being customised even more precisely to customer needs withthe emergence of one-to-one marketing. Airlines no longer just have three classes of ticket; any regular flight willcontain people who have paid over a dozen different prices depending on when they booked, where they booked,who they booked with, how long they are away, their age, affiliation, past flights and so on. Internet-based-companieslike Priceline.com even allow customers to name their own prices for a flight and invite airlines to compete. Inconsumer markets Internet auction sites such as eBay let customers bid at a price they are willing to pay and therebycustomise prices. In business-to-business procurement Internet auctions are a pricing mechanism especially suitableto goods where a number of suppliers can meet a designated specification.
The importance of price on profits, cash flow and shareholder value has been constantly reiterated. A 5 per centprice increase can easily increase profits by 50 per cent or more. But in aiming to increase prices, it rarely makessense to increase prices by 5 per cent to everyone. Consumers differ in price sensitivity. Some would switch to acompetitor if faced with such an increase; others would not even notice. The same economic result is more likelyto be achieved by raising the price by 10 per cent to half the customers, or by 20 per cent to a quarter of them.This principle of pricing is, as we have seen, based around capturing the consumer surplus – getting customers topay the full amount that they are willing to pay.
286 PRICING FOR VALUE
CONSTRAINTS ON PRICE CUSTOMISATION
For price customisation, or what economists call price discrimination, to work certain conditions are required:
1. The market must be segmentable and the segments must show different price elasticities.
2. Customers in the lower price segment must not be able to resell the product to the higher price segment.
3. Competitors must not be able to undercut the firm in the higher price segments.
4. The cost of segmenting the market must not exceed the extra revenue derived from price discrimination.
5. The practice should not breed resentment against the firm and its products.
6. The form of price discrimination should be legal.
Customised pricing techniques seek to meet these constraints. Greater competition and deregulation have encour-aged price discrimination in more and more markets. Information technology has facilitated price customisation.Scanners in stores and e-commerce companies can use software to monitor customer purchases and customiseprices and promotions to each one. On the other hand, there is the increasing countervailing power with customersable to use the web to compare prices instantly and discriminate between suppliers.
TYPES OF CUSTOMISED PRICING
❍ Self-selection. By being offered different versions of a product at different prices consumers can self-selectand segment themselves according to their price sensitivity. This is done extremely widely in bothconsumer and business-to-business markets. In consumer goods, car companies offer a range of versionsof the same model. For example, a customer for a new Mercedes C class can pay anywhere between£20 000 for the basic version to over £50 000 for the top of the range. The Johnnie Walker Scotchwhisky range is from £18 for a bottle of Red Label to £157 for the Blue Label. Microsoft offers its Officesuite of programmes in Professional, Standard, Small Business and Home and Student versions. Theexamples are endless today. Prices can easily vary by a factor of 10 from the cheapest to the mostexpensive variant, with the cost differences between them being minor. The advantage of this form ofpricing is that since all variants are available, no one can object to it being ‘unfair’.
❍ Controlled availability. Controlled availability pricing differs from self-selection in that the customer doesnot have a choice about the price. As one-to-one marketing becomes more prevalent it becomes possibleto target different customers with different prices. E-businesses now offer individual customers specialprices online, based on the information they have in their computer data banks of their past shoppingpatterns, and the price sensitivity these patterns imply. Supermarkets can do the same using the scannerdata collected at the checkout. Sales promotions, coupons and direct mail catalogues can be similarlytargeted. For example, General Motors sent a $1500 coupon incentive on a new car only to those whohad expressed unhappiness with the previous model in a consumer survey. Victoria’s Secret, the glamourunderwear company, sent its catalogues with a $25-off coupon to male addressees but not to females.
❍ Geographic pricing is another type of controlled availability. Companies like The Gap, Nike and RalphLauren routinely charge 30 per cent or more in the UK than they do in the more price competitive USmarket. Controlled purchase locations also facilitate taking advantage of different price elasticities. Forexample, the lower-price Eurail rail pass can only be purchased in the United States; the operators
ADAPTING PRICES TO CUSTOMERS AND PRODUCTS 287
naturally do not want it to be available to regular European travellers. Negotiated prices, long a feature ofbusiness markets, look likely to become more significant in consumer markets with the development ofe-commerce.
❍ Buyer characteristics. Different types of buyers are given different prices. Ideally the criteria should beeasy to apply and be effective in segmenting customers by price sensitivity. Common criteria aresocio-economic variables such as sex, age, income, type of user and user status. In industrial markets,industry classification is often used. For example, some nightclubs allow women in free; children areallowed into many events at a lower price than adults; universities give scholarships to applicants frompoor families; companies charge resellers less than they do end users; Microsoft sells new versions of itssoftware to current users cheaper than to new users.
Simple socio-economic categories generally do not sort customers out very effectively according to pricesensitivity.[9] A better method is researching price sensitivity directly. This involves interviews to determinewhat factors are most important in the purchasing process to individual customers and then groupingcustomers by responses. Generally the groupings do not correlate well with simple socio-economic orindustry groupings. For example, studies by McKinsey and others have looked at industrial purchasing.[10]
They found most markets, even mature commodity markets, could be segmented into three types ofbuying companies:
❍ Price-sensitive buyers who are primarily concerned with cost and less so with the quality andservice provided. They exhibit little loyalty to suppliers.
❍ Service-sensitive buyers who require the highest levels of quality and often have specialservice and delivery requirements.
❍ Relationship-orientated buyers who want a close long-term commitment from their suppliersgeared to developing superior customised products and processes.
Research needed to be done on a one-to-one basis because price sensitivity did not matchobvious industry characteristics such as end-user industry, company size or value added. Armedwith the right segmentation information, the supplier is in a much more effective position toapply customised pricing. The same is increasingly true in consumer markets whereprice-orientated shoppers, for a particular product, rarely fall neatly into a clear socio-economicgroup such as income or age.
❍ Transaction characteristics. Transaction characteristics often facilitate price discrimination. Timing is onecriterion. In the airline industry, a ticket booked well in advance and including a Saturday night stay is asignal of a price-sensitive customer. Prices are varied by season, day and hour. For hotels and airlines ‘yieldpricing’ – finely tuned pricing to mop-up anticipated vacancies – is a key to profitability. Quantity isanother transaction characteristic widely used in pricing, the assumption being that customers who buylarge quantities are more price sensitive and therefore receive discounts. Banks offer higher interest rateson larger deposits. Supermarkets offer ‘buy six bottles and get one free’.
In summary, customised pricing is very important to creating shareholder value. A single price policy, on the onehand, loses the consumer surplus because the price is too low for some customers, and at the same time it losesrevenue because it is too high for others. The aim of segmentation is to group customers by price sensitivity sothat different prices can be charged. Most schemes do this only approximately. For example, airlines offer cheapertickets to customers who stay over a Saturday; cinemas give discounts for children, but many of these customerswho obtain lower prices are not very price sensitive and the company loses the consumer surplus. Technology hasoffered scope for better segmentation schemes.
288 PRICING FOR VALUE
Care needs to be taken with price customisation plans. First, customisation usually entails extra costs and investmentfor modifying the product, service and communication channels to individual customers or segments. The companyneeds to assess that the plans are profitable. Second, discriminatory pricing can lead to customer disaffection; it canalso be illegal. Airline or hotel customers can get upset to discover that the adjacent customer is paying half theprice for an identical service. It also changes the relationship between the customer and the company’s service staff.Customers sometimes feel they cannot trust the representative to give them a fair deal and the transaction focuseson price negotiation rather than solving the customer’s problem.
PRODUCT MIX PRICING
Companies have increasingly broadened their product lines to meet the different needs of customers and tocapitalise on their different price sensitivities. This means that managers do not price a product in isolation but ratherhave to consider in addition its impacts on the sales and prices of other products in the range. Products in a rangecan be complements or substitutes. Complements are where sales of one product stimulate sales of another. Forexample, if Nespresso sell more coffee machines, the company will also be able to sell more of its coffee capsules.For complementary products the optimal product line price is lower than the stand-alone price. Substitutes arewhere sales of one product reduce the sales of another. For example, sales of a faster model of a Dell PC mayreduce the sales of its slower model. Several common situations can be identified.
PRODUCT LINE PRICING
There are several reasons why suppliers introduce multiple products. The most obvious is to meet the needs ofdifferent segments. For example, Nike offers separate shoes for runners, tennis players and so on. A second reasonis that separate products permit the firm to charge different prices and capitalise on different price elasticities. Forexample, the Levi Strauss company offers a range of jeans from a standard priced Levis 501, to Engineered Jeans anda premium range of Vintage Jeans. A broad product line also allows the firm to encourage customers to trade-upover their life-cycle. So Vauxhall/Opel aims to capture younger buyers with its Corsa model and trade them upas they become older and more affluent to more expensive models. Finally, different products are sometimestailored to adapt for differences among distribution channels. Discount channels operate on low gross margins; otherdistributors want exclusive products. A common solution to these conflicts is offering separate products. Sometimesthese are under different brand names; sometimes the differences are in product quality or special features.
Without a line of targeted products firms would lose market share. The problem is that these products are atleast partly substitutes for one another and low-margin products can easily cannibalise high-margin ones. Anotherdanger is that downward extensions can threaten the exclusive image of the firm. It is important, therefore, to try topreserve the identities of the high-margin products and to set price points that take into account substitution effects.
PRICING FOLLOW-ON PRODUCTS
Some products require the use of ancillary products. These follow-on products are complements. For example,it will generally be more profitable for producers of razors or printers to price them lower than their optimalstand-alone prices to increase sales. The loss of margin is compensated by charging higher prices for the subsequentblades or print cartridges. The danger with the strategy is that the high prices of the follow-up products attract

ADAPTING PRICES TO CUSTOMERS AND PRODUCTS 289
‘pirates’, who capture much of the profits. Companies with follow-up products have to try to build unique designs,patents or guarantees that lock customers into the supply of ‘original parts’.
BUNDLED AND OPTIONS PRICING
To reduce the perceived price, a product may be advertised at a low, stripped-down price. At the point of purchase,the salesperson then seeks to persuade the buyer to add high-margin features. A typical buyer of a £40 000Mercedes will be persuaded to add another £10 000 on options and features that will contribute disproportionatelyto the company’s margin. In contrast, Japanese auto companies have historically bundled a comprehensive range offeatures in the sticker price to offer customers a superior value proposition.
Options are complementary products. When they are bundled together the customer will normally obtain asignificant discount to emphasise the value of the offer. For example, Microsoft Office, which bundles Word, Exceland PowerPoint, costs around 50 per cent less than buying the three programmes separately. Without detailedinformation about elasticities across the market, it cannot be predicted whether bundling or separate pricing isoptimal. Bundling can be profitable when it allows the company to tap unexploited consumer surplus. Unbundlingis better when there are opportunities to exploit new markets through selling the products individually.[11]
BLOCKING PRODUCTS
Often it makes sense for a firm to introduce a special product to block new low-price competitors from makinginroads into the market. Cutting the price on the main product would be very expensive. Instead the companylaunches a blocking or ‘fighter brand’ aimed at those price-sensitive segments most at risk from the new competition.The company will make little or no profit from the blocker product but this is compensated for by its ability topreserve margins on its less price-sensitive customers and to limit penetration by competitors.
INTERNATIONAL PRICING
The globalisation of business has made international pricing a major issue. Currently big differences can exist in theprices the firm charges for its product in different countries. The barriers to trade that permit such divergencesto persist allow the firm to significantly increase profits by capitalising on differences in price elasticities. However,declining trade barriers, notably in the trade areas such as the European Union and the North Atlantic Free TradeArea (NAFTA), are markedly reducing the scope of such divergences, with potentially damaging implications forprofitability.
PRESSURES FOR PRICE HARMONISATION
Several factors are making it difficult to sustain major price differences between countries. These include:
1. Elimination of trade barriers between countries. This makes it easier to ship the product from a cheapcountry to a dear one.
2. Decreasing transportation costs. This makes it more profitable to undertake arbitrage transactions.
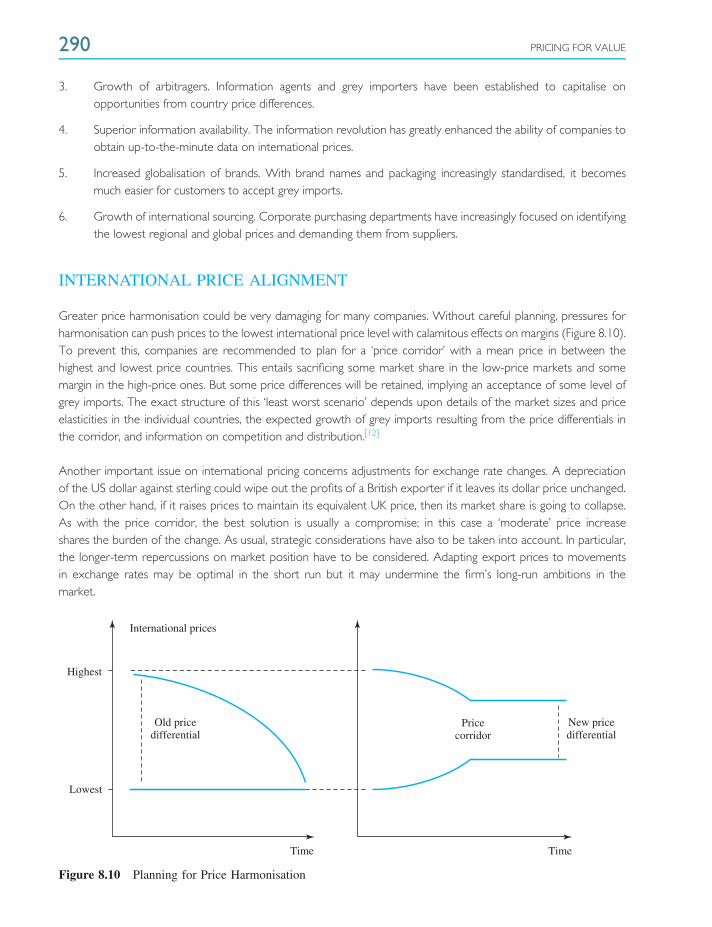
290 PRICING FOR VALUE
3. Growth of arbitragers. Information agents and grey importers have been established to capitalise onopportunities from country price differences.
4. Superior information availability. The information revolution has greatly enhanced the ability of companies toobtain up-to-the-minute data on international prices.
5. Increased globalisation of brands. With brand names and packaging increasingly standardised, it becomesmuch easier for customers to accept grey imports.
6. Growth of international sourcing. Corporate purchasing departments have increasingly focused on identifyingthe lowest regional and global prices and demanding them from suppliers.
INTERNATIONAL PRICE ALIGNMENT
Greater price harmonisation could be very damaging for many companies. Without careful planning, pressures forharmonisation can push prices to the lowest international price level with calamitous effects on margins (Figure 8.10).To prevent this, companies are recommended to plan for a ‘price corridor’ with a mean price in between thehighest and lowest price countries. This entails sacrificing some market share in the low-price markets and somemargin in the high-price ones. But some price differences will be retained, implying an acceptance of some level ofgrey imports. The exact structure of this ‘least worst scenario’ depends upon details of the market sizes and priceelasticities in the individual countries, the expected growth of grey imports resulting from the price differentials inthe corridor, and information on competition and distribution.[12]
Another important issue on international pricing concerns adjustments for exchange rate changes. A depreciationof the US dollar against sterling could wipe out the profits of a British exporter if it leaves its dollar price unchanged.On the other hand, if it raises prices to maintain its equivalent UK price, then its market share is going to collapse.As with the price corridor, the best solution is usually a compromise; in this case a ‘moderate’ price increaseshares the burden of the change. As usual, strategic considerations have also to be taken into account. In particular,the longer-term repercussions on market position have to be considered. Adapting export prices to movementsin exchange rates may be optimal in the short run but it may undermine the firm’s long-run ambitions in themarket.
International prices
Highest
Lowest
Old pricedifferential
New pricedifferential
Time Time
Pricecorridor
Figure 8.10 Planning for Price Harmonisation
ADAPTING PRICES TO CUSTOMERS AND PRODUCTS 291
PROMOTIONAL PRICING
Price cuts to stimulate purchase are widely and increasingly used by suppliers. Promotions are used with theobjectives of accelerating purchases, getting new customers to try the product, encouraging customers to buymore, or gaining new sales from price-sensitive customers. The growth of promotional pricing reflects the increasingcompetitive pressures in many markets. It is a tempting competitive weapon because studies show that promotionalprice elasticities are often very high, up to four times normal price elasticities. A promotional price elasticity ofaround 8 means a 5 per cent temporary price cut typically yields a 40 per cent unit sales increase.
Promotional prices come in many forms. Some are trade promotions aimed at persuading retailers or distributors tocarry the brand or more of the brand. They include various forms of discounts, allowances and contests. Othersare consumer promotions aimed at getting consumers to buy more. They include coupons, price-off, cash rebates,low-interest financing and sales events.
Promotions have grown at the expense of advertising in their share of marketing budgets. However, they are acontroversial tool among marketing professionals. One problem is that the powerful effects of price promotionsalmost guarantee that competitors will have to respond. The result then becomes a zero-sum game in which all thesuppliers lose margin. If money is diverted from advertising and long-run brand-building investments to promotionsthis also threatens the manufacturer’s long-run profitability. High short-run sales boosts are then outweighed bya decline in the brand’s long-run competitiveness. Promotions also impose additional costs in the form of higherstocks and expenses in communicating and implementing the programme.
But the biggest concern with promotions is whether they cannibalise regular high-margin business. Studies clearlyshow that most of those who buy on promotion are the company’s regular customers, who would have boughtanyway.[13] If the promotions encourage customers to load up, then normal sales decline in proportion to theincremental business in the promotional period. The high promotional price elasticities may as a result be somewhatillusory. Profit then suffers a major hit because the disproportionate level of sales in the promotional period carry avery low margin. The long-run effects may be amplified in promotion-prone markets. Consumers come to see thesale price as the ‘normal’ price and become unwilling to buy at the regular price.
In attempts to break the vicious circle of promotions some companies, including such notable marketing heavyweightsas Procter & Gamble and Wal-Mart, have sought to substantially reduce price promotions in favour of ‘everydaylow prices’. They believe this will reduce supply chain costs, enable them to develop consistent brand images andoffer customers a better deal over the longer run.
Sales promotions are likely to be more effective for smaller brands. Price promotions can give customers an incentiveto trial their new product. It is also more difficult to make advertising cost-effective for small brands. Companies arealso becoming more conscious about ensuring promotions do not damage the brand’s image. Hence the growth of‘cause-related marketing’ whereby the seller associates the promotion with a good cause, usually a charity.[14] Forexample, Pizza Express ran a levy on sales of its Veneziana pizzas, with the Venice in Peril campaign as the beneficiary.Tesco ran a highly successful promotion whereby customers earned points that could be used by neighbourhoodschools to buy computers.
292 PRICING FOR VALUE
CHANGING THE PRICE
From time to time management has to change prices. Naturally price increases are more difficult to implement thanprice decreases. However, achieving price increases is often essential.
PRICE REDUCTIONS
There are always pressures on management to reduce prices. When the industry is in recession and there is excesscapacity these pressures are amplified. Sometimes price cuts are used proactively to increase the firm’s dominancein the industry. This may be particularly appealing if the firm believes that there are major economies of scale orexperience-curve advantages to be had from greater market share.
Price cuts offer more value to customers and a higher market share may be expected. But there are dangers. First,price cuts are easy for competitors to copy. If they do follow then all the players are worse off. Second, even if thecompany attracts new customers as a result of its price cut, these switchers are unlikely to be loyal and can switchagain when a competitor takes an initiative. Third, price cuts can sometimes lead customers to question the qualityor success of the brand, threatening its brand image. Finally, cuts can upset dealers or recent customers who seethe value of their stocks depreciated.
Given the threat to profits that price cuts present, it is worth managers considering alternative ways to maintainor increase market share. These can include improving the perceived quality offered. After all, a 10 per cent costincrease is a lot less costly than a 10 per cent price cut. Another strategy may be to launch a fighter brand to servethose segments that have become most price sensitive.
PRICE INCREASES
As we have emphasised, price is one of the most vital determinants of shareholder value. In periods of high inflation,obtaining price increases is easier. With an inflation rate of 20 per cent a year, buyers do not see a 23 per centprice increase as remarkable, but with low inflation such real price increases are much harder to obtain.
Strategies to obtain high prices can be seen in terms of a trade-off between timing and feasibility (Figure 8.11).On the one hand, there are some techniques to improve prices that management can try immediately, but theirfeasibility is uncertain. On the other hand, there are some very straightforward ways of obtaining higher prices, buttheir deployment can take years. The only sure way of achieving higher prices is by finding ways to deliver greatervalue to customers. This may be via operational excellence, customisation, new marketing concepts or innovativeproducts. For example, if a company can develop a new battery that will enable electric cars to operate with theflexibility of petrol-engine ones, or if a pharmaceutical company can develop a cure for cancer, then there will beno problem about attaining a price premium. Superior performance and innovation are the only sustainable meansof obtaining better prices. The techniques for increasing prices are listed in order of their immediacy.
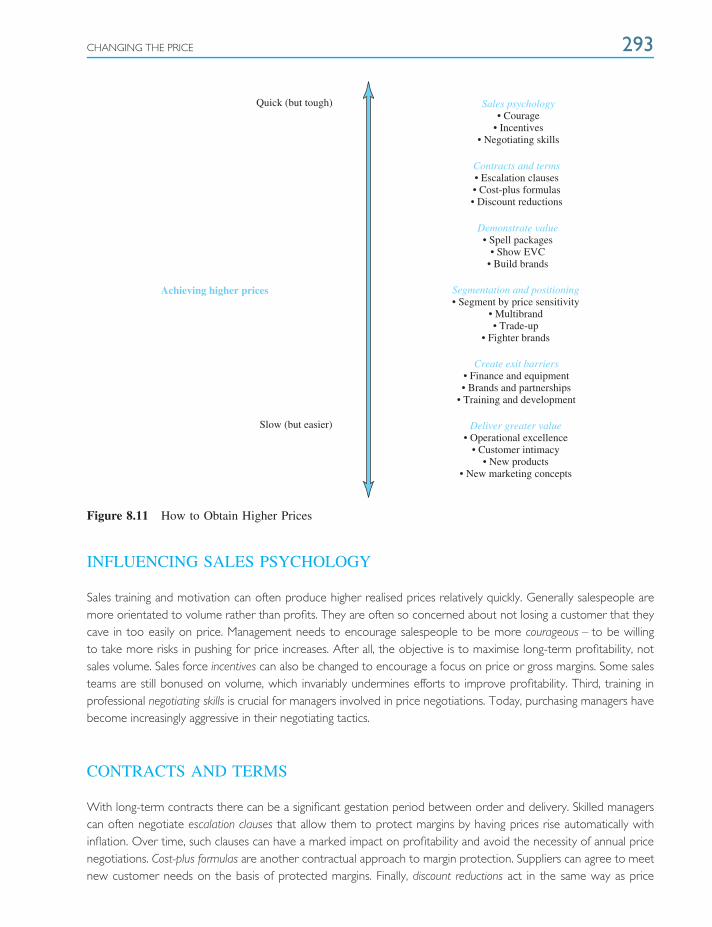
CHANGING THE PRICE 293
Quick (but tough)
Achieving higher prices
Slow (but easier)
Sales psychology• Courage
• Incentives• Negotiating skills
Segmentation and positioning• Segment by price sensitivity
• Multibrand• Trade-up
• Fighter brands
Deliver greater value• Operational excellence
• Customer intimacy• New products
• New marketing concepts
Create exit barriers• Finance and equipment• Brands and partnerships
• Training and development
Demonstrate value• Spell packages
• Show EVC• Build brands
Contracts and terms• Escalation clauses• Cost-plus formulas• Discount reductions
Figure 8.11 How to Obtain Higher Prices
INFLUENCING SALES PSYCHOLOGY
Sales training and motivation can often produce higher realised prices relatively quickly. Generally salespeople aremore orientated to volume rather than profits. They are often so concerned about not losing a customer that theycave in too easily on price. Management needs to encourage salespeople to be more courageous – to be willingto take more risks in pushing for price increases. After all, the objective is to maximise long-term profitability, notsales volume. Sales force incentives can also be changed to encourage a focus on price or gross margins. Some salesteams are still bonused on volume, which invariably undermines efforts to improve profitability. Third, training inprofessional negotiating skills is crucial for managers involved in price negotiations. Today, purchasing managers havebecome increasingly aggressive in their negotiating tactics.
CONTRACTS AND TERMS
With long-term contracts there can be a significant gestation period between order and delivery. Skilled managerscan often negotiate escalation clauses that allow them to protect margins by having prices rise automatically withinflation. Over time, such clauses can have a marked impact on profitability and avoid the necessity of annual pricenegotiations. Cost-plus formulas are another contractual approach to margin protection. Suppliers can agree to meetnew customer needs on the basis of protected margins. Finally, discount reductions act in the same way as price
294 PRICING FOR VALUE
increases. Many companies allow satisfactory list prices to be eroded into unprofitable realised prices by giving awayunnecessary discounts for on-time payment, buying minimum quantities, seasonal discounts and other allowances.
DEMONSTRATING VALUE
Most companies fail to optimise prices because they sell product features rather than demonstrating the valueof their product to the customer. Focusing on product features invariably emphasises price as buyers comparecompeting products. There are several ways of focusing more productively on value to the customer. One is to sellpackages rather than products. Packages include emphasising the services, technical support, terms and guaranteesoffered alongside the product. Even more effective is demonstrating directly the economic value to the customer(EVC) of the product. This means showing the customer the lifetime savings accruing from purchasing the product.Another value creator is brand values that give customers confidence in the product’s qualities or the experienceassociated with using it. When a blue chip company signs up with McKinsey or a woman buys Armani they arewilling to pay a price premium because they perceive the brand as unique, conveying an image, reputation andconfidence not possessed by competitors.
SEGMENTATION AND POSITIONING
Basic to any marketing strategy, and critical to pricing, is the recognition that customers differ greatly in pricesensitivity. For some customers, price is the most important criterion, but for others quality, service or image aremuch more significant. If a 5 per cent price increase can increase operating profits by 50 per cent, then this 5 percent increase is invariably best achieved by segmentation. That means recognising that some customers will notaccept any increase at all, while others will accept a 10 or even 20 per cent price increase. Implementation requiresresearching what factors are most important in shaping the buying decisions of individual customers, groupingcustomers according to similarity of need, and then positioning different offers at different prices to each group, orindeed customising it to each individual buyer.
A further step permitting even wider scope for price discrimination is the development of a multibranding or lineextension strategy. Here differentially priced brands or lines are targeted to different segments of the market. SoDistillers sells Johnnie Walker Red Label Scotch whisky at about £15, Black Label at about £22, Blue Label at £157,and so on. Such a policy also often facilitates a policy of trading-up, where customers start with an entry-level brand,e.g. the American Express green card, and are subsequently encouraged to move up to a more expensive option,e.g. the Amex gold or platinum card. A fighter brand is another tool for price segmentation and positioning. Theseare special brands introduced to defend against competitors in low-price market segments. A fighter brand allows acompany to defend its market share without having to cut prices across its entire market.
CREATING EXIT BARRIERS
Skilful companies focus on creating exit barriers that make it difficult for customers to switch to cheaper suppliers.These include:
❍ Provision of finance or special equipment. Tetrapak, for example, leases sophisticated assembly lineequipment to customers using its packaging. Switching suppliers would require customers to make majornew capital investments.
CHANGING THE PRICE 295
❍ Customer partnerships. Suppliers can integrate into the customer’s research and development work,making divorce a major problem. Outstanding levels of service can also increase the customer’sdependency.
❍ Brand images. Customers who have developed associations and loyalty with a particular brand arereluctant to switch. Research shows that strong brands have relatively low price elasticities.
❍ Training and development costs. For example, it is costly and difficult to switch from Microsoft productsonce staff are trained and expert on their use.
❍ Electronic links. Where IT is integrating the two supply chains, changing suppliers entails increased riskand disruption.
❍ Loyalty programmes. Where customers have built up privileges from loyalty programmes, e.g. frequentflyer schemes, they are reluctant to write off these assets.
DELIVERING GREATER VALUE
In the long-run, offering customers added value is the only way to obtain consistently high prices. All the otherroutes are one-off or limited opportunities that eventually erode market share. Without bringing new value tocustomers, competitors and new formats inevitably commoditise a company’s products and services. Added-valuestrategies that permit premium pricing can be grouped into four:
1. Operational excellence. Customer value can be created by increasing the perceived efficiency of the currentservices offered to the customer. This effectively lowers the cost to the customer by cutting out hassle,inconvenience and the need to carry safety stocks. Service quality can be increased in five main ways:
❍ Reliability. Performing services more dependably and accurately.
❍ Tangibles. Customers respond to the professional appearance of physical facilities, equipment,personnel and communications materials.
❍ Responsiveness. Greater willingness to help customers and to provide prompt service.
❍ Assurance. Improving knowledge and courtesy of employees and their ability to convey trust andconfidence.
❍ Empathy. Providing more care and attention to customers.
2. Customer intimacy. Customising solutions on a one-to-one basis can enhance pricing power. Whencustomers perceive that they are getting a tailored solution, made and delivered to meet their individualneeds, they believe that they are getting what they want rather than a compromised solution aimed atmeeting the needs of a broader group with different needs. Today’s information revolution is facilitatinggreater customer intimacy through (1) permitting flexible data banks of individual customer information to beconstructed at very low cost, (2) allowing cheap one-to-one communication between the firm and individualcustomers and (3) the development of fast, flexible supply chains that permit customised manufacturing.[15]
3. New products. The most obvious means of gaining a premium are to develop new products or servicesthat offer customers superior economic, functional or psychological values. Customers value products thatmeet unmet needs or meet current needs in a superior way. Customers will pay more for pharmaceuticalproducts that they perceive are more efficacious, batteries that last longer, computers that are faster, orequipment that is more productive.
296 PRICING FOR VALUE
4. New marketing concepts. New products require technological innovation; new marketing concepts addvalue by changing the way existing products are presented or distributed. They are more common thanproduct innovations. New marketing concepts have included:
❍ Identifying new markets. For example, Lastminute.com identified a new market for customerswanting to go on holiday, go to a restaurant, go to a show, or send a gift, immediately
❍ New market segments. Coke identified a huge market for diet colas. Marks & Spencer identified amajor segment for chilled foods.
❍ New delivery systems. The Internet, in particular, has stimulated new delivery systems of existingproducts that offer superior convenience or service to customers. Amazon.com’s revolution of the bookmarket is just one example.
❍ New business systems. Customer value can be created from offering customers services rather thanproducts. Castrol launched Castrol Plus, which instead of selling lubricants to workshops offered aservice that maintained the efficient running of customers’ equipment.
❍ New information. New information can create value for customers. Suppliers such as Procter &Gamble and Cadbury offer supermarkets a category management service that enables retailers toincrease the productivity of their space.
PRICE MANAGEMENT
Effective pricing requires good strategy and good implementation. So far we have focused on the strategic issues.
PRICE IMPLEMENTATION
Implementation concerns achieving the profitability that the pricing strategy is designed to obtain. There are twoimportant issues: obtaining reliable cost data to measure customer and product profitability, and optimising realisedprices as distinct from invoiced prices.
DIFFERENTIATED COSTING
To target the right customers and prioritise the right products it is important to have accurate measures of customerand product profitability. Typically there are big differences in the costs of serving different customers and acrossdifferent products in the line. For example, some retail chains want daily delivery to individual stores; others willaccept twice a week delivery to a central warehouse. Others want special packaging and customisation. Productsdiffer in the amount of R&D and technical service they require.
Most companies have standard cost systems that do not identify and allocate such differences in overheads. Trackingtrue customer and product profitability requires activity-based costing (ABC) that allocates both variable costs andoverheads to the products and customers that incur them. When this is done profit margins on high value addedproducts can be lowered by up to 10 per cent. In general, standard costing systems overstate the profitabilityof high-end products and customer segments, allowing simple products to subsidise complex ones and low-endcustomers to subsidise high-end ones.

SUMMARY 297
List price Invoice price Realised price
£4.47
£5.78£6.00
Size
dis
coun
t 0.1
0
Com
petit
ive
disc
ount
0.1
2
Paym
ent d
isco
unt 0
.30
Vol
ume
disc
ount
0.3
7
Prom
otio
nal d
isco
unt 0
.35
Co-
op a
dver
tisin
g 0.
20
Frei
ght 0
.09
Figure 8.12 Realised Prices versus Invoiced Prices
ACHIEVING REALISED PRICES
There is often a significant difference between invoiced prices and realised prices, which can seriously impact onprofits. Figure 8.12 illustrates this for a textile manufacturer selling to retailers.[16] The starting point in implementinga pricing policy is the list price. From this are normally deducted discounts for such things as larger orders andcompetitively negotiated terms to arrive at the invoice price. But in most firms the invoice price is not the actualrealised price. From the invoiced price are deducted a whole new range of discounts for such things as promptpayment, volume bonuses, cooperative advertising and promotions. It is this realised price, not the invoice price,that determines the profitability of a customer or a product. Here the difference is big, amounting to almost 23 percent off the invoice price per unit.
The problem is that management attention focuses on the invoiced price rather than the money the companyactually realises. In fact, most accounting systems do not even measure realised prices. Many of these discountsget lumped into overheads and not allocated to individual products and customers. Again, with discountsvarying enormously across transactions the profitability of individual products and customers can be seriouslymisunderstood.
SUMMARY
1. Effective pricing is of fundamental importance to strategies aimed at maximising shareholder value. Onaverage, a 5 per cent price increase can raise economic profits by over 50 per cent. However, in the long-run,premium prices can only be sustained by offering customers superior value. Charging premium prices withoutoffering higher value will undermine the company’s market position.
2. The pricing strategy that maximises shareholder value is different from one that maximises market share orprofits. Pricing to maximise market share or revenue leads to prices that are too low. But the price thatmaximises short-term profits is generally too high because it ignores the implications of economies of scale,competition and market share on long-term cash flows. The value-maximising price is the one that maximisesthe present value of future cash flow.
298 PRICING FOR VALUE
3. Customisation is central to an effective pricing strategy. Many managers make dangerous generalisationsabout what price customers in their market will be willing to pay. The error is assuming that there is atypical customer. In fact, customers, even in what are considered commodity markets, differ greatly in theirprice sensitivity. For the company to achieve its twin objectives of growth and healthy margins it mustemploy price discrimination – generally meaning providing different products at different prices to differentcustomers. This way, it can both cover more of the market and capture the consumer surplus available fromless price-sensitive clients.
4. Price elasticity is normally relatively high. Certainly, it is usually much higher than advertising elasticity. Thismeans competitors are likely to react to price cuts, especially in mature markets. When a price war istriggered, all competitors can end up worse off. Consequently, pricing strategy needs to carefully assesscompetitive strategies.
5. Information technology and the Internet increase the price elasticity of most markets. The web lowers thebarriers to entry for companies competing on price. It also makes up-to-date information about products andprices more readily available to customers. Finally, it enables customers to be more proactive in negotiatingprices and encouraging suppliers to compete for their custom.
6. Pricing strategy needs careful implementation. Most companies do not have accurate data on the costs ofserving different customers and selling individual products. They also lack data on realised prices, which canbe quite different from the recorded invoice prices. As a result of inadequate pricing and cost information,companies can be prioritising the wrong customers and wrong products.
REVIEW QUESTIONS
1. Illustrate how pricing decisions normally have a major impact on shareholder value.2. Why is the price that maximises the firm’s profits likely to be very different from the one that maximises
shareholder value?3. Discuss the concept of economic value to the customer (EVC) and show how it can be used in pricing
decisions.4. What should determine the choice between a penetration and a skimming pricing policy?5. Show how customised pricing usually creates shareholder value.6. Suggest some techniques that can be used by firms in highly competitive markets to increase achieved prices.
NOTES ON CHAPTER 8
[1] The revenue in the triangle is given by 1/2 base × height, i.e. ABC = 150 × £1100 = £165 000.
[2] For a review of game theory applications to business see Howard Raiffa, Decision Analysis, New York:McGraw-Hill, 1997.
[3] For more on pricing and marketing strategy see John W. Mullins, Orville C. Walker, Harper W. Boyd, andJean-Claude Larreche, Marketing Management: A Strategic Decision-Making Approach, New York: McGraw-Hill Irwin,2005.
[4] Raj Sethuraman and Gerald E. Tellis, Analysis of the tradeoff between advertising and price discounting, Journalof Marketing Research, 28 May, 1991, 168–176.
NOTES ON CHAPTER 8 299
[5] Robert J. Dolan and Herman Simon, Power Pricing, New York: Free Press, 1997.
[6] On conjoint analysis see Jonathan Weiner, Forecasting Demand: consumer electronics marketer uses conjointapproach to configure its new product and set the right price, Market Research, Summer 1994, 6–11; Dick R.Wittnick, Marco Vriens and Wim Burhenne, Commercial uses of Conjoint Analysis in Europe: Results and CriticalReflections, International Journal of Research in Marketing, January, 1994, 41–52.
[7] Carl W. Stern and George Stalk (eds), Perspectives on Strategy from the Boston Consultancy Group, New York:John Wiley & Sons, Inc., 1998, pp. 12–24.
[8] Adapted from Peter Doyle, Marketing Management and Strategy, 3rd edn, London: Prentice Hall, 2001,Chapter 8.
[9] John Forsyth, Sunil Gupta, Sudeep Halder, Anil Kaul and Keith Kettle, A segmentation you can act on, McKinseyQuarterly, no. 3, 1999, 6–15.
[10] Louis L. Schorch, You can market steel, McKinsey Quarterly, no. 1, 1994, 111–120; V. Kasturi Rangan, RowlandT. Moriarty and Gordon S. Schwartz, Segmenting customers in mature industrial markets, Journal of Marketing,October, 1992, 72–82.
[11] A good discussion of price bundling is: Tony Cram, Smarter Pricing, Harlow, UK: Prentice Hall, 2006,pp. 135–145; Michael V. Marn, Eric V. Roegner and Craig C. Zawada, The Price Advantage, Hoboken, NJ, John Wiley& Sons, Inc., 2004, pp. 116–122; Thomas T. Nagle and Reed K. Holden, The Strategy and Tactics of Pricing, UpperSaddle River, NJ: Prentice Hall, 2002, pp. 244–249; Robert J. Dolan and Hermann Simon, Power Pricing, New York:Free Press, 1996, pp. 222–247.
[12] Johny K. Johansson, Global Marketing, New York: McGraw Hill, 2003, Chapter 13 Global Pricing, pp. 466–475;Hermann Simon and Eckhard Kucher, The European pricing time bomb: and how to cope with it, EuropeanManagement Journal, 10(2), June, 1992, 136–145.
[13] A.S.C. Ehrenberg, K. Hammond and G.J. Goodhardt, The after-effects of price-related consumer promotions,Journal of Advertising Research, July/August 1994, 1–10. See also: Leonard M. Lodish, Carl F. Mela, If brands are builtover years, why are they managed over quarters, Harvard Business Review, July 2007.
[14] Hamish Pringle and Marjorie Thompson, Brand Spirit: How Cause Related Marketing Builds Brands, Chichester:John Wiley & Sons, Ltd., 1999.
[15] See Adrian J. Slywotzky, The age of the choiceboard, Harvard Business Review, January/February, 2000, 40–41.
[16] Adapted from Michael Marn and Robert L. Rosiello, Managing price, gaining profit, Harvard Business Review,September/October 1992, 84–93. See also: Michael V. Marn, Eric V. Roegner and Craig C. Zawada, The PriceAdvantage, Hoboken, NJ, John Wiley & Sons, Inc., 2004 (Pricing Architecture and the Pocket Price Waterfall,pp. 193–206).

9Value-BasedCommunications
‘There is growing pressure from shareholders to make marketing more accountable. Investors arebecoming more active in analysing and questioning marketing expenditures.’
Dominic Cadbury, Chairman of Cadbury-Schweppes
INTRODUCTION AND OBJECTIVES
It is not enough for a firm to produce a good product; it also has to communicate its values effectively to potentialcustomers. Today the number of products competing for the customer’s attention is so great that gaining shareof mind is a major problem. The business has to invest in communications to make people aware of the product,to communicate the value of its functional and emotional attributes, to persuade them of its advantages overcompetitive products, and to reassure customers once they have bought it. For a new company, unless it invests incommunications its offer will be slow to take off, it will be quickly copied by competitors, and it will fail to get thelevel of market share necessary to achieve critical mass. For an established company, inadequate communicationsrisks its skills being under-appreciated by its customers and new competitors eroding its image for leadership andinnovation.
The communications that companies engage in take many forms. These include advertising, sales promotion, publicrelations, sponsorship, personal selling and direct response, including the growing number of online techniques.These advances in information technology mean that communications is increasingly being seen as a two-way,interactive process. It is not just about the company broadcasting information about itself and its products, but alsoabout finding ways to encourage customers to talk to the company about their needs and their degree of satisfactionwith the company’s current products and services. Figure 9.1 gives an indication of the size and composition ofcommunications expenditure in 2000, when over £50 billion was spent in the UK on communications. Companies,new and old, big and small, spent a great deal of money. Figures 9.2 and 9.3 show that on advertising alone,companies like Unilever and Procter & Gamble were investing up to 15 per cent of their sales and as much as 100per cent of their operating profits. By 2005, spend on advertising alone, including TV, press, cinema and Internet,had risen to over £19 billion.
In the previous chapter we looked at the effect of price promotions, which primarily have short-term effects onsales. This chapter focuses on how communications can create long-term value for shareholders. By the time youhave completed this chapter, you will be able to:
❍ Understand how effective communications creates shareholder value
❍ Show the dangers of treating communications as an accounting cost rather than an investment
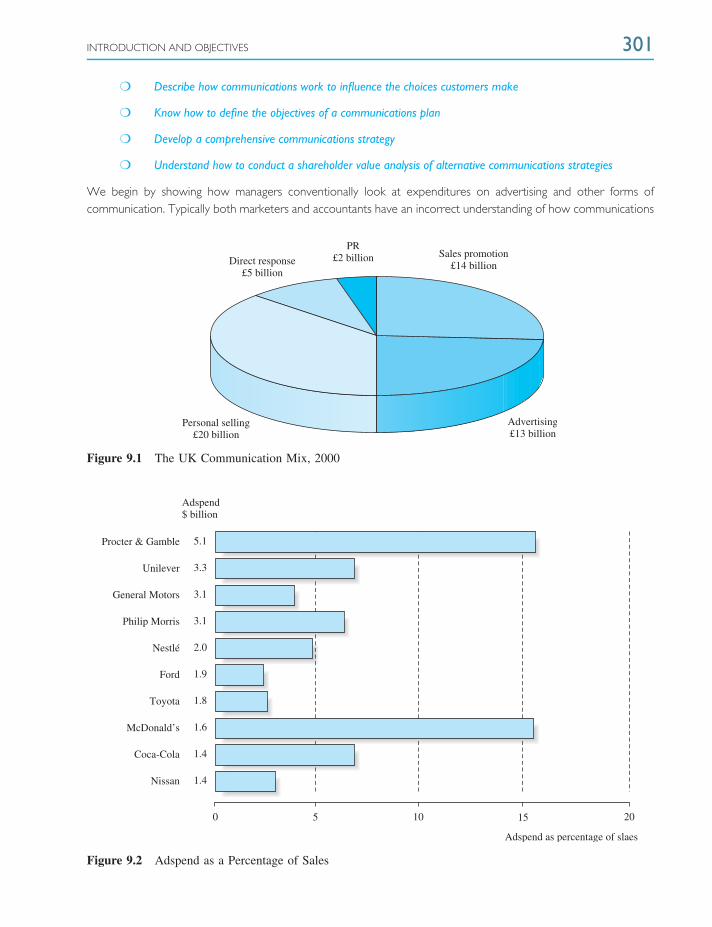
INTRODUCTION AND OBJECTIVES 301
❍ Describe how communications work to influence the choices customers make
❍ Know how to define the objectives of a communications plan
❍ Develop a comprehensive communications strategy
❍ Understand how to conduct a shareholder value analysis of alternative communications strategies
We begin by showing how managers conventionally look at expenditures on advertising and other forms ofcommunication. Typically both marketers and accountants have an incorrect understanding of how communications
Personal selling£20 billion
Sales promotion£14 billion
PR£2 billionDirect response
£5 billion
Advertising£13 billion
Figure 9.1 The UK Communication Mix, 2000
0 5 10 15 20
Adspend as percentage of slaes
5.1
3.3
3.1
3.1
2.0
1.9
1.8
1.6
1.4
1.4
Adspend$ billion
Unilever
General Motors
Philip Morris
Nestlé
Ford
Toyota
McDonald’s
Coca-Cola
Nissan
Procter & Gamble
Figure 9.2 Adspend as a Percentage of Sales

302 VALUE-BASED COMMUNICATIONS
0
Unilever
General Motors
Philip Morris
Nestlé
Ford
Toyota
McDonald’s
Coca-Cola
Nissan
Procter & Gamble
12010080604020
Adspend as percentage of operating profit
140 160
Figure 9.3 Adspend as a Percentage of Operating Profit
expenditures should be judged. Whether the money is spent on short-term promotions or image-building advertising,the campaign should be evaluated in terms of its effect on shareholder value. Generally, such a value-led approachwill lead to quite different, and much superior, decisions on communications spending. The chapter then goeson to show how communications works in terms of influencing consumers. This leads to an analysis of howcommunications objectives need to be formulated.
The core of the chapter presents how a value-based communications strategy should be developed. This includesthe analysis of the market, choosing messages and media, and allocating the budget across the different types ofcommunications. Finally, we look at how shareholder value analysis can be used to estimate the financial value thatthe campaign might produce.
COMMUNICATIONS AND SHAREHOLDER VALUE
Managers are generally confused about the role of communications. Normally they take a functional perspective,marketing managers being generally positive about communications spending and accountants being suspicious.These two functional perspectives are evaluated and then contrasted with the approach taken by rational investorsin judging communications spending.
THE MARKETING VIEW
Few marketing professionals think about their strategies in financial terms. They view the task of communications interms of increasing sales, awareness or shaping the brand’s image. For example, a study carried out in 2000 asked finan-cial directors what criteria their marketing departments used to justify their marketing and communications budgets:[1]
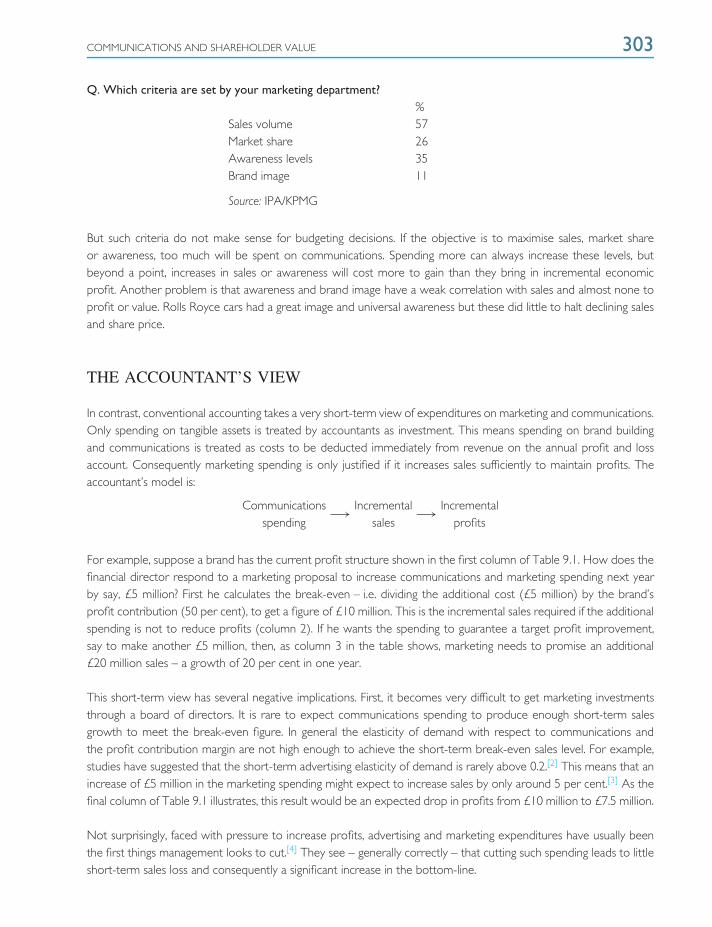
COMMUNICATIONS AND SHAREHOLDER VALUE 303
Q. Which criteria are set by your marketing department?%
Sales volume 57Market share 26Awareness levels 35Brand image 11
Source: IPA/KPMG
But such criteria do not make sense for budgeting decisions. If the objective is to maximise sales, market shareor awareness, too much will be spent on communications. Spending more can always increase these levels, butbeyond a point, increases in sales or awareness will cost more to gain than they bring in incremental economicprofit. Another problem is that awareness and brand image have a weak correlation with sales and almost none toprofit or value. Rolls Royce cars had a great image and universal awareness but these did little to halt declining salesand share price.
THE ACCOUNTANT’S VIEW
In contrast, conventional accounting takes a very short-term view of expenditures on marketing and communications.Only spending on tangible assets is treated by accountants as investment. This means spending on brand buildingand communications is treated as costs to be deducted immediately from revenue on the annual profit and lossaccount. Consequently marketing spending is only justified if it increases sales sufficiently to maintain profits. Theaccountant’s model is:
Communicationsspending
−→ Incrementalsales
−→ Incrementalprofits
For example, suppose a brand has the current profit structure shown in the first column of Table 9.1. How does thefinancial director respond to a marketing proposal to increase communications and marketing spending next yearby say, £5 million? First he calculates the break-even – i.e. dividing the additional cost (£5 million) by the brand’sprofit contribution (50 per cent), to get a figure of £10 million. This is the incremental sales required if the additionalspending is not to reduce profits (column 2). If he wants the spending to guarantee a target profit improvement,say to make another £5 million, then, as column 3 in the table shows, marketing needs to promise an additional£20 million sales – a growth of 20 per cent in one year.
This short-term view has several negative implications. First, it becomes very difficult to get marketing investmentsthrough a board of directors. It is rare to expect communications spending to produce enough short-term salesgrowth to meet the break-even figure. In general the elasticity of demand with respect to communications andthe profit contribution margin are not high enough to achieve the short-term break-even sales level. For example,studies have suggested that the short-term advertising elasticity of demand is rarely above 0.2.[2] This means that anincrease of £5 million in the marketing spending might expect to increase sales by only around 5 per cent.[3] As thefinal column of Table 9.1 illustrates, this result would be an expected drop in profits from £10 million to £7.5 million.
Not surprisingly, faced with pressure to increase profits, advertising and marketing expenditures have usually beenthe first things management looks to cut.[4] They see – generally correctly – that cutting such spending leads to littleshort-term sales loss and consequently a significant increase in the bottom-line.
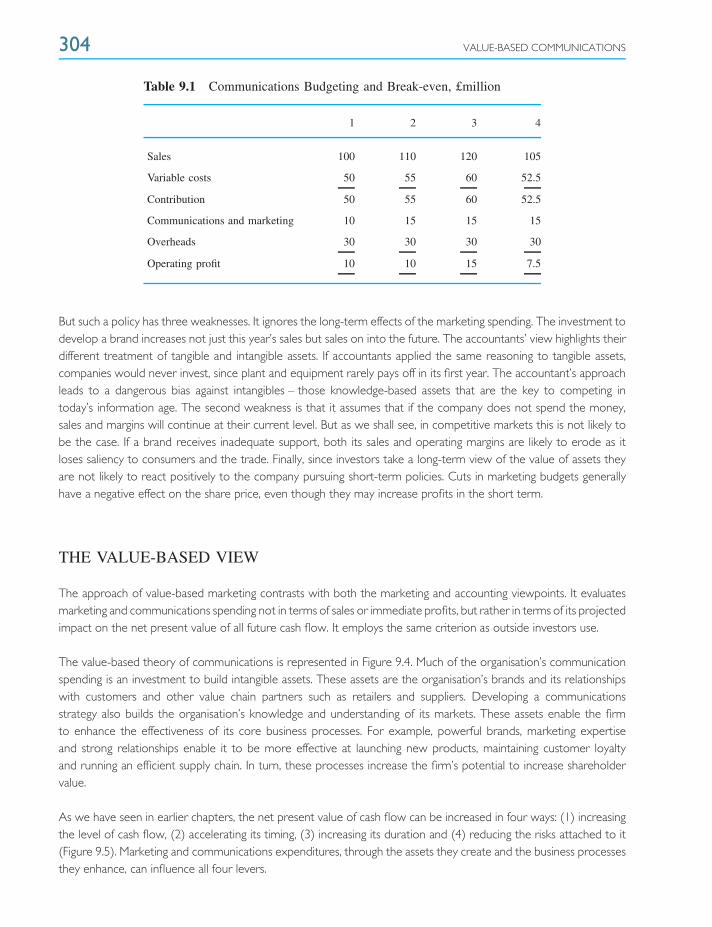
304 VALUE-BASED COMMUNICATIONS
Table 9.1 Communications Budgeting and Break-even, £million
1 2 3 4
Sales 100 110 120 105
Variable costs 50 55 60 52.5
Contribution 50 55 60 52.5
Communications and marketing 10 15 15 15
Overheads 30 30 30 30
Operating profit 10 10 15 7.5
But such a policy has three weaknesses. It ignores the long-term effects of the marketing spending. The investment todevelop a brand increases not just this year’s sales but sales on into the future. The accountants’ view highlights theirdifferent treatment of tangible and intangible assets. If accountants applied the same reasoning to tangible assets,companies would never invest, since plant and equipment rarely pays off in its first year. The accountant’s approachleads to a dangerous bias against intangibles – those knowledge-based assets that are the key to competing intoday’s information age. The second weakness is that it assumes that if the company does not spend the money,sales and margins will continue at their current level. But as we shall see, in competitive markets this is not likely tobe the case. If a brand receives inadequate support, both its sales and operating margins are likely to erode as itloses saliency to consumers and the trade. Finally, since investors take a long-term view of the value of assets theyare not likely to react positively to the company pursuing short-term policies. Cuts in marketing budgets generallyhave a negative effect on the share price, even though they may increase profits in the short term.
THE VALUE-BASED VIEW
The approach of value-based marketing contrasts with both the marketing and accounting viewpoints. It evaluatesmarketing and communications spending not in terms of sales or immediate profits, but rather in terms of its projectedimpact on the net present value of all future cash flow. It employs the same criterion as outside investors use.
The value-based theory of communications is represented in Figure 9.4. Much of the organisation’s communicationspending is an investment to build intangible assets. These assets are the organisation’s brands and its relationshipswith customers and other value chain partners such as retailers and suppliers. Developing a communicationsstrategy also builds the organisation’s knowledge and understanding of its markets. These assets enable the firmto enhance the effectiveness of its core business processes. For example, powerful brands, marketing expertiseand strong relationships enable it to be more effective at launching new products, maintaining customer loyaltyand running an efficient supply chain. In turn, these processes increase the firm’s potential to increase shareholdervalue.
As we have seen in earlier chapters, the net present value of cash flow can be increased in four ways: (1) increasingthe level of cash flow, (2) accelerating its timing, (3) increasing its duration and (4) reducing the risks attached to it(Figure 9.5). Marketing and communications expenditures, through the assets they create and the business processesthey enhance, can influence all four levers.

COMMUNICATIONS AND SHAREHOLDER VALUE 305
Shareholderreturns
PV of futurecash flow
Businessprocesses
Intangibleassets
Communicationsinvestment
Share priceDividends
Level of CFSpeedDurationRisk
Customer relationship managementSupply chain managementNew product development
BrandsCustomer relationshipsNetworks and partnershipsMarket knowledge
AdvertisingPromotionDirect marketingPersonal sellingPR
Figure 9.4 The Value-Based Communications Model
Many studies confirm that effective communications can increase the level of cash flow mainly by stimulating short-and long-run sales growth and by building a price premium for a brand. It can accelerate the timing of cash flowthrough a faster penetration of the market. The longevity of positive cash flows can be increased through the brandloyalty that communications contribute to creating. Finally, the risks attached to future cash flows, and hence thecompany’s cost of capital, can be reduced through the effect of communications investments in building barriers toentry and reinforcing customer loyalty.[5]
Factoring in plausible assumptions about these effects, the dilemma of Table 9.1 can be reconsidered in value ratherthan short-term profit terms. Suppose if the additional communications spend of £5 million a year is not approved,marketing predicts that revenue will decline by 2 per cent a year. In contrast, with the additional spend, marketingpredicts that they can maintain prices and grow volume by a conservative 1 per cent a year. The finance staff thenestimates the cash flows and shareholder values resulting from the two strategies as follows:
Year 1 2 3 4 5 Present value of:
Cum. Cont. Total
Cash flow (no increase) 6.5 5.4 4.4 3.5 2.5 17.6 12.6 30.2Cash flow (with increase) 3.4 3.7 4.1 4.4 4.8 15.1 32.8 47.9
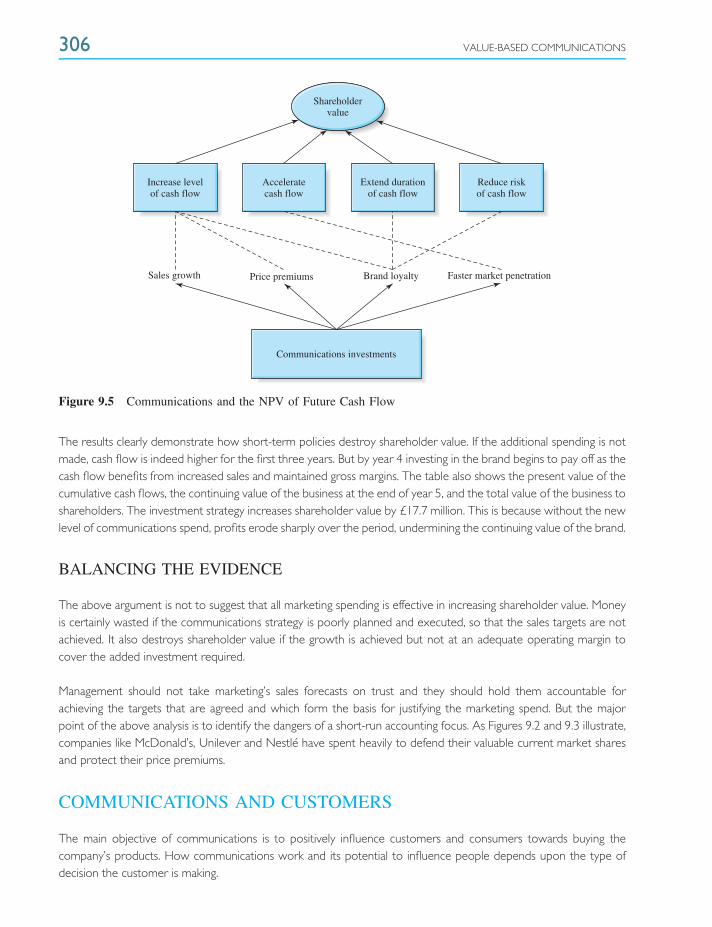
306 VALUE-BASED COMMUNICATIONS
Sales growth Price premiums Brand loyalty Faster market penetration
Communications investments
Shareholdervalue
Increase levelof cash flow
Acceleratecash flow
Extend durationof cash flow
Reduce riskof cash flow
Figure 9.5 Communications and the NPV of Future Cash Flow
The results clearly demonstrate how short-term policies destroy shareholder value. If the additional spending is notmade, cash flow is indeed higher for the first three years. But by year 4 investing in the brand begins to pay off as thecash flow benefits from increased sales and maintained gross margins. The table also shows the present value of thecumulative cash flows, the continuing value of the business at the end of year 5, and the total value of the business toshareholders. The investment strategy increases shareholder value by £17.7 million. This is because without the newlevel of communications spend, profits erode sharply over the period, undermining the continuing value of the brand.
BALANCING THE EVIDENCE
The above argument is not to suggest that all marketing spending is effective in increasing shareholder value. Moneyis certainly wasted if the communications strategy is poorly planned and executed, so that the sales targets are notachieved. It also destroys shareholder value if the growth is achieved but not at an adequate operating margin tocover the added investment required.
Management should not take marketing’s sales forecasts on trust and they should hold them accountable forachieving the targets that are agreed and which form the basis for justifying the marketing spend. But the majorpoint of the above analysis is to identify the dangers of a short-run accounting focus. As Figures 9.2 and 9.3 illustrate,companies like McDonald’s, Unilever and Nestle have spent heavily to defend their valuable current market sharesand protect their price premiums.
COMMUNICATIONS AND CUSTOMERS
The main objective of communications is to positively influence customers and consumers towards buying thecompany’s products. How communications work and its potential to influence people depends upon the type ofdecision the customer is making.

COMMUNICATIONS AND CUSTOMERS 307
FACTORS INFLUENCING BUYING BEHAVIOUR
The firm’s marketing communications are only one of many factors influencing the buyer’s decision process. Thevarious factors shaping choice can be grouped into four.
1. The buyer’s role. Organisational buyers make different decisions than people buying for themselves ortheir households. For example, senior managers will expect to fly business class when they represent theircompany, but on holiday they will fly economy. Organisational buyers often have different constraints,attitudes and objectives than personal consumers.
2. The buyer’s background. The cultural, social and personal background of the buyer influences decisions. Forexample, governments have been encouraging much wider access to the Internet across age, socio-economicgroup and gender to try and prevent a ‘digital divide’ among different groups of the population. Political,technological and economic forces also affect decisions. For example, firms increase their advertising budgetswhen the economy is growing and cut back in recessions.
3. The buyer’s experience. A person buying his or her first car approaches the decision quite differently fromsomeone who changes their car every year. If the buyer has made the same decision many times beforethe choice will generally be a routine, low involvement one. If he or she is satisfied with the previous servicethey are likely to buy from the same source. For someone who has never bought before, the decision isa much more complex problem, requiring more information, an evaluation of the alternatives and ofteninvolving more people.
4. The buyer’s information sources. When buyers need to supplement their experience they have four sourcesof information:
❍ Personal sources. Information can be obtained from family, friends and neighbours. Organisationalbuyers can draw on the knowledge of other functional experts within the business.
❍ Public sources. Television, newspapers, consumer-rating organisations and the Internet all provideinformation, comment and criticism about businesses.
❍ Experiential sources. Buyers can often learn about the product before purchase by handling,examining and trialling it.
❍ Commercial sources. The buyer receives information in two ways. First, from the company’spresence in the market the buyer perceives the quality of its service, products, prices and positioningin the distribution channels. Second, the buyer can be influenced by the firm’s marketing andcommunications – its advertising, promotions, web activities, PR, personal selling and direct marketing.
This review suggests why most studies have found the direct effect of commercial communications spending onbuying behaviour to be small. The firm’s communications are only one of many factors shaping decisions. Mostother forms of information are more credible than commercially sponsored communications. People recognise thatadvertising and marketing messages are biased. Finally, there are so many thousands of other commercial messagesevery day competing for the buyer’s attention that it is difficult to have a strong impact.
HOW MARKETING COMMUNICATIONS WORK
The way advertising or other forms of marketing communication works depends upon the type of decision thebuyer is making. It works differently when the buyer is choosing coffee than it does when he or she is choosing anairline flight. It works differently for an organisational buyer than it does for an individual consumer.
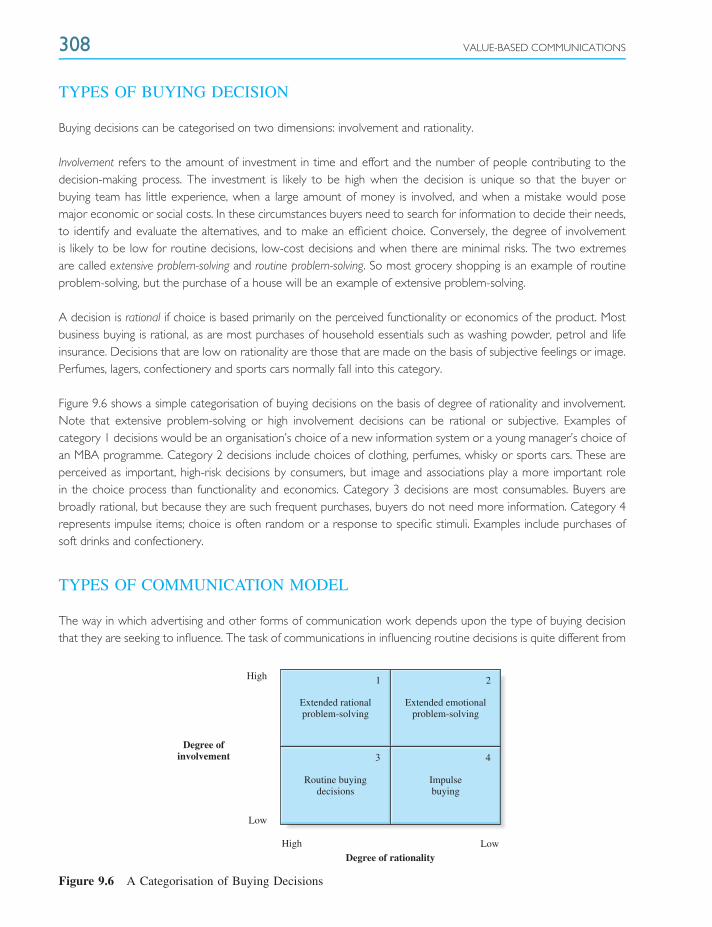
308 VALUE-BASED COMMUNICATIONS
TYPES OF BUYING DECISION
Buying decisions can be categorised on two dimensions: involvement and rationality.
Involvement refers to the amount of investment in time and effort and the number of people contributing to thedecision-making process. The investment is likely to be high when the decision is unique so that the buyer orbuying team has little experience, when a large amount of money is involved, and when a mistake would posemajor economic or social costs. In these circumstances buyers need to search for information to decide their needs,to identify and evaluate the alternatives, and to make an efficient choice. Conversely, the degree of involvementis likely to be low for routine decisions, low-cost decisions and when there are minimal risks. The two extremesare called extensive problem-solving and routine problem-solving. So most grocery shopping is an example of routineproblem-solving, but the purchase of a house will be an example of extensive problem-solving.
A decision is rational if choice is based primarily on the perceived functionality or economics of the product. Mostbusiness buying is rational, as are most purchases of household essentials such as washing powder, petrol and lifeinsurance. Decisions that are low on rationality are those that are made on the basis of subjective feelings or image.Perfumes, lagers, confectionery and sports cars normally fall into this category.
Figure 9.6 shows a simple categorisation of buying decisions on the basis of degree of rationality and involvement.Note that extensive problem-solving or high involvement decisions can be rational or subjective. Examples ofcategory 1 decisions would be an organisation’s choice of a new information system or a young manager’s choice ofan MBA programme. Category 2 decisions include choices of clothing, perfumes, whisky or sports cars. These areperceived as important, high-risk decisions by consumers, but image and associations play a more important rolein the choice process than functionality and economics. Category 3 decisions are most consumables. Buyers arebroadly rational, but because they are such frequent purchases, buyers do not need more information. Category 4represents impulse items; choice is often random or a response to specific stimuli. Examples include purchases ofsoft drinks and confectionery.
TYPES OF COMMUNICATION MODEL
The way in which advertising and other forms of communication work depends upon the type of buying decisionthat they are seeking to influence. The task of communications in influencing routine decisions is quite different from
Routine buyingdecisions
High
High
Low
Low
1 2
3 4
Extended rationalproblem-solving
Impulsebuying
Extended emotionalproblem-solving
Degree ofinvolvement
Degree of rationality
Figure 9.6 A Categorisation of Buying Decisions
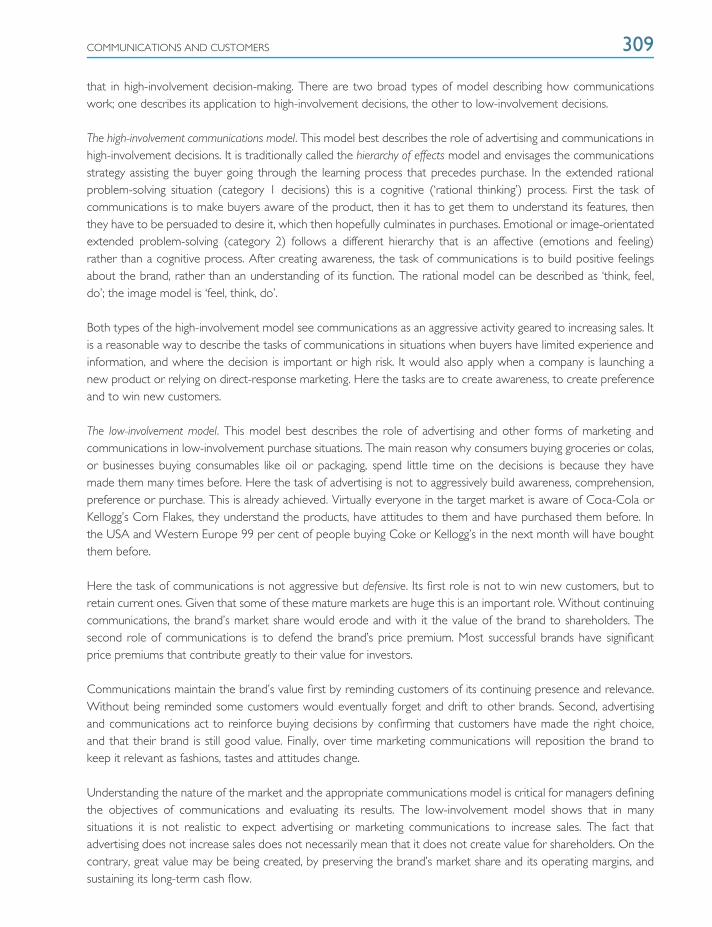
COMMUNICATIONS AND CUSTOMERS 309
that in high-involvement decision-making. There are two broad types of model describing how communicationswork; one describes its application to high-involvement decisions, the other to low-involvement decisions.
The high-involvement communications model. This model best describes the role of advertising and communications inhigh-involvement decisions. It is traditionally called the hierarchy of effects model and envisages the communicationsstrategy assisting the buyer going through the learning process that precedes purchase. In the extended rationalproblem-solving situation (category 1 decisions) this is a cognitive (‘rational thinking’) process. First the task ofcommunications is to make buyers aware of the product, then it has to get them to understand its features, thenthey have to be persuaded to desire it, which then hopefully culminates in purchases. Emotional or image-orientatedextended problem-solving (category 2) follows a different hierarchy that is an affective (emotions and feeling)rather than a cognitive process. After creating awareness, the task of communications is to build positive feelingsabout the brand, rather than an understanding of its function. The rational model can be described as ‘think, feel,do’; the image model is ‘feel, think, do’.
Both types of the high-involvement model see communications as an aggressive activity geared to increasing sales. Itis a reasonable way to describe the tasks of communications in situations when buyers have limited experience andinformation, and where the decision is important or high risk. It would also apply when a company is launching anew product or relying on direct-response marketing. Here the tasks are to create awareness, to create preferenceand to win new customers.
The low-involvement model. This model best describes the role of advertising and other forms of marketing andcommunications in low-involvement purchase situations. The main reason why consumers buying groceries or colas,or businesses buying consumables like oil or packaging, spend little time on the decisions is because they havemade them many times before. Here the task of advertising is not to aggressively build awareness, comprehension,preference or purchase. This is already achieved. Virtually everyone in the target market is aware of Coca-Cola orKellogg’s Corn Flakes, they understand the products, have attitudes to them and have purchased them before. Inthe USA and Western Europe 99 per cent of people buying Coke or Kellogg’s in the next month will have boughtthem before.
Here the task of communications is not aggressive but defensive. Its first role is not to win new customers, but toretain current ones. Given that some of these mature markets are huge this is an important role. Without continuingcommunications, the brand’s market share would erode and with it the value of the brand to shareholders. Thesecond role of communications is to defend the brand’s price premium. Most successful brands have significantprice premiums that contribute greatly to their value for investors.
Communications maintain the brand’s value first by reminding customers of its continuing presence and relevance.Without being reminded some customers would eventually forget and drift to other brands. Second, advertisingand communications act to reinforce buying decisions by confirming that customers have made the right choice,and that their brand is still good value. Finally, over time marketing communications will reposition the brand tokeep it relevant as fashions, tastes and attitudes change.
Understanding the nature of the market and the appropriate communications model is critical for managers definingthe objectives of communications and evaluating its results. The low-involvement model shows that in manysituations it is not realistic to expect advertising or marketing communications to increase sales. The fact thatadvertising does not increase sales does not necessarily mean that it does not create value for shareholders. On thecontrary, great value may be being created, by preserving the brand’s market share and its operating margins, andsustaining its long-term cash flow.
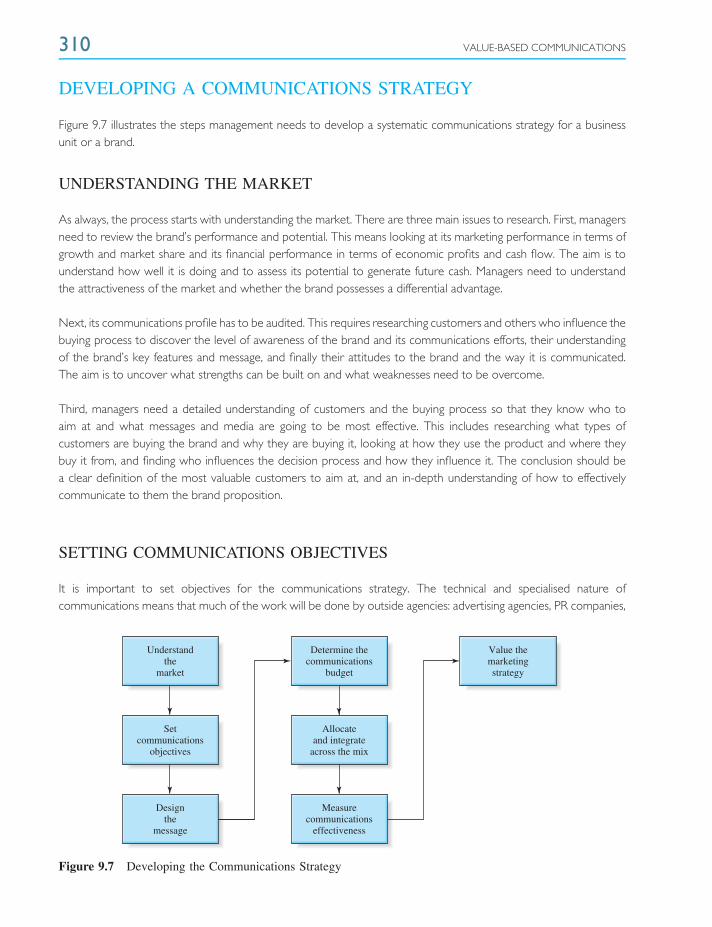
310 VALUE-BASED COMMUNICATIONS
DEVELOPING A COMMUNICATIONS STRATEGY
Figure 9.7 illustrates the steps management needs to develop a systematic communications strategy for a businessunit or a brand.
UNDERSTANDING THE MARKET
As always, the process starts with understanding the market. There are three main issues to research. First, managersneed to review the brand’s performance and potential. This means looking at its marketing performance in terms ofgrowth and market share and its financial performance in terms of economic profits and cash flow. The aim is tounderstand how well it is doing and to assess its potential to generate future cash. Managers need to understandthe attractiveness of the market and whether the brand possesses a differential advantage.
Next, its communications profile has to be audited. This requires researching customers and others who influence thebuying process to discover the level of awareness of the brand and its communications efforts, their understandingof the brand’s key features and message, and finally their attitudes to the brand and the way it is communicated.The aim is to uncover what strengths can be built on and what weaknesses need to be overcome.
Third, managers need a detailed understanding of customers and the buying process so that they know who toaim at and what messages and media are going to be most effective. This includes researching what types ofcustomers are buying the brand and why they are buying it, looking at how they use the product and where theybuy it from, and finding who influences the decision process and how they influence it. The conclusion should bea clear definition of the most valuable customers to aim at, and an in-depth understanding of how to effectivelycommunicate to them the brand proposition.
SETTING COMMUNICATIONS OBJECTIVES
It is important to set objectives for the communications strategy. The technical and specialised nature ofcommunications means that much of the work will be done by outside agencies: advertising agencies, PR companies,
Understandthe
market
Setcommunications
objectives
Designthe
message
Determine thecommunications
budget
Allocateand integrate
across the mix
Measurecommunications
effectiveness
Value themarketingstrategy
Figure 9.7 Developing the Communications Strategy
DEVELOPING A COMMUNICATIONS STRATEGY 311
digital specialists, direct response businesses etc. Objectives align the different activities to common goals; they alsoprovide standards to judge the effectiveness of the work.
Objectives should be specific, measurable and operational. Ultimately the primary objectives of a communicationsstrategy are to increase, or at least maintain, long-term sales and operating margins. The problem is that it is difficultto make these operational as communications objectives. Generally it is impossible to disentangle the effects ofadvertising or other forms of marketing communication from the myriad of other factors influencing sales andmargins. In addition, the purchase is often the end result of a long process of customer decision-making. Currentcommunications investments, therefore, may not fully be reflected in sales until well into the future. Similarly, today’sbuyers of established brands like Coca-Cola or IBM are influenced not just by current communications expenditurebut by that which took place in the years before.
As a result communications objectives are normally framed in terms of intermediate goals which better meet thecriteria of being specific, measurable and operational. As noted in the discussion of communications models above,the buying process consists of three stages. The first is the cognitive stage – customers have to be aware of theproduct and understand its benefits. The next is the affective stage – positive attitudes, liking and preferences forit have to be induced. Finally comes the behavioural stage: purchase, repeat purchase or intermediate measuressuch as intention to buy or rebuy. Since these variables are easy to measure through surveys or customer panels, astandard way of setting objectives is to target improvements in these variables.
Judgement is required to determine which are the most important measures and what are reasonable targets.For rational high-involvement decisions, cognitive measures are generally the most important. Buyers have tounderstand the special features and benefits the product offers. For image or emotive decisions, affective criteriaare more important. Targets also have to be appropriate to the market situation. For mature, established brandsin low-involvement markets it is unreasonable to set ambitious targets for cognitive and affective measures or forbig sales increases. Such targets are unlikely to be met, and setting them shows a misunderstanding of the roleof communications in such situations. For established brands the main communications task is to maintain currentperformance levels or to produce marginal repositioning.
DESIGNING THE MESSAGE
Once the cognitive, affective and behavioural targets have been set, then communications messages have to bedeveloped to achieve the objectives. Given the volume of products competing for the attention of buyers, messageshave to have impact; to capture attention, they also have to suggest benefits that are desirable, exclusive andbelievable.
MESSAGE CONTENT
The message may be rational or emotional in appeal. Rational appeals make claims about the brand’s uniquelysuperior attributes or economic value to the customer. In the past, brand managers at companies like Procter& Gamble were taught to write the message around a unique selling proposition (USP). Such messages makesense for attribute brands (see Chapter 7) and where decision-making is highly rational. They are still common inbusiness-to-business markets. But increasingly, in today’s highly competitive markets, the problem is that it is difficultto sustain real differences in functionality or cost.

312 VALUE-BASED COMMUNICATIONS
Today, more messages are emotional appeals. They seek to present added values over and above functional oreconomic differences. Some offer aspirational messages, associating the brand with status and desired lifestyles.Others offer experiences or shared emotions. These can be based on negative or positive motivations. Negativeappeals use fear, guilt or shame to influence people’s behaviour (e.g. stop smoking, avoid drinking and driving).Evidence shows that overly negative campaigns are not usually effective. Positive appeals use humour, pride oraffection to achieve their goals. The evidence suggests that communications that are liked tend to be more effective.
MESSAGE PRESENTATION
Effectiveness depends upon the presentation as well as the content of the message. The style of the message can beone-way or two-way. Personal selling and, perhaps more significantly, the Internet can be highly effective becausethey permit interaction between sender and recipient. Two-way communication permits the sender to tailor themessage to the recipient’s needs. Even for conventional advertising and direct response communications, gettingconsumer involvement increases the effectiveness of the message. This can be done by presenting the disadvantagesas well as the advantages of the product, or leaving some ambiguity in the message to involve recipients, andencourage them to draw their own conclusions.
Many messages are delivered by spokespersons such as celebrities or opinion leaders to increase the impact andcredibility of the message. Expertise, trustworthiness and likeability are the characteristics of sources who are mostcredible to audiences. The message’s effectiveness is also a function of the creativity of the phrasing of the wording,the tone and the visual appeal of the message. Most communications messages are pretested against consumergroups to monitor impact and credibility. This has been enhanced with the emergence of social networking sitessuch as MySpace and Facebook, which enable people to share their thoughts with thousands of others aboutmessage presentation.
DECIDING THE COMMUNICATIONS BUDGET
With spending on communications routinely representing 15 per cent or more of sales, more effective budgetingpotentially has a big impact on profits. But few managers in either marketing or finance know how to approach thedecision of how much to spend. We explain how managers should decide on how much to spend on communications.
CONVENTIONAL APPROACHES TO BUDGETING
Deciding how much to spend on communications is difficult in practice because it is hard to judge the effectivenessof the expenditure. Many other factors such as the product’s quality, its price, competition and economic conditionsare affecting sales simultaneously. Effectiveness is also not just about how much is spent but how creatively it isspent. Some companies and their agencies get much more from a given budget than others. Many companiesappear to give up any attempt to budget rationally.
Incremental budgeting is employed by many companies, whereby they increase last year’s budget by a givenpercentage. The percentage of sales method is also common, where the communications budget is set at somepercentage of current or anticipated sales. Other methods that research shows are widely used include competitiveparity – spending the same percentage as competitors – and the affordability method, where the company spendswhat it feels it can afford from the budget.
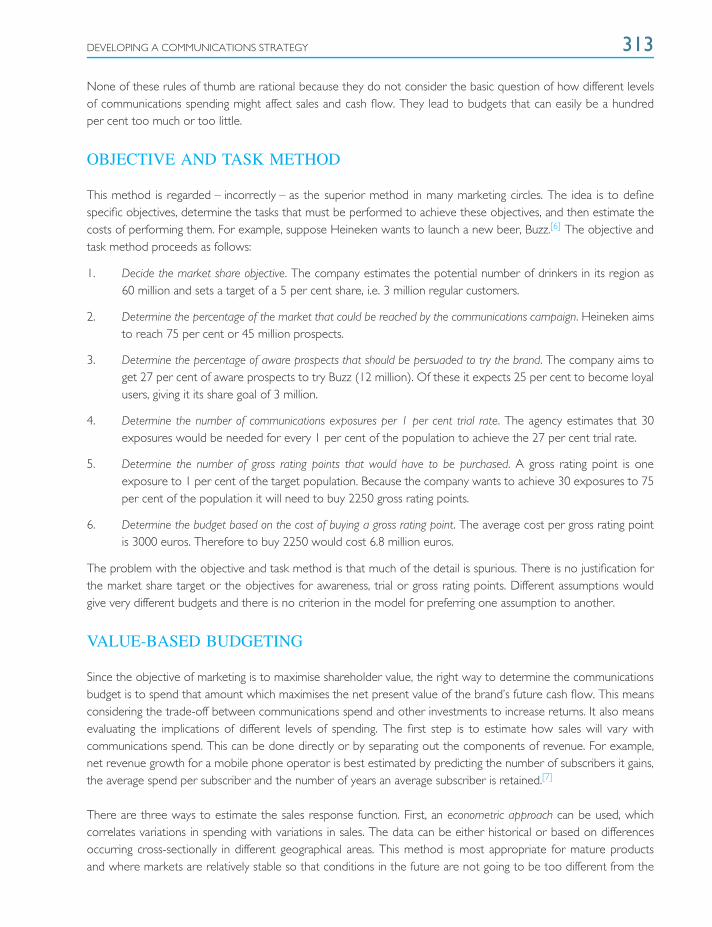
DEVELOPING A COMMUNICATIONS STRATEGY 313
None of these rules of thumb are rational because they do not consider the basic question of how different levelsof communications spending might affect sales and cash flow. They lead to budgets that can easily be a hundredper cent too much or too little.
OBJECTIVE AND TASK METHOD
This method is regarded – incorrectly – as the superior method in many marketing circles. The idea is to definespecific objectives, determine the tasks that must be performed to achieve these objectives, and then estimate thecosts of performing them. For example, suppose Heineken wants to launch a new beer, Buzz.[6] The objective andtask method proceeds as follows:
1. Decide the market share objective. The company estimates the potential number of drinkers in its region as60 million and sets a target of a 5 per cent share, i.e. 3 million regular customers.
2. Determine the percentage of the market that could be reached by the communications campaign. Heineken aimsto reach 75 per cent or 45 million prospects.
3. Determine the percentage of aware prospects that should be persuaded to try the brand. The company aims toget 27 per cent of aware prospects to try Buzz (12 million). Of these it expects 25 per cent to become loyalusers, giving it its share goal of 3 million.
4. Determine the number of communications exposures per 1 per cent trial rate. The agency estimates that 30exposures would be needed for every 1 per cent of the population to achieve the 27 per cent trial rate.
5. Determine the number of gross rating points that would have to be purchased. A gross rating point is oneexposure to 1 per cent of the target population. Because the company wants to achieve 30 exposures to 75per cent of the population it will need to buy 2250 gross rating points.
6. Determine the budget based on the cost of buying a gross rating point. The average cost per gross rating pointis 3000 euros. Therefore to buy 2250 would cost 6.8 million euros.
The problem with the objective and task method is that much of the detail is spurious. There is no justification forthe market share target or the objectives for awareness, trial or gross rating points. Different assumptions wouldgive very different budgets and there is no criterion in the model for preferring one assumption to another.
VALUE-BASED BUDGETING
Since the objective of marketing is to maximise shareholder value, the right way to determine the communicationsbudget is to spend that amount which maximises the net present value of the brand’s future cash flow. This meansconsidering the trade-off between communications spend and other investments to increase returns. It also meansevaluating the implications of different levels of spending. The first step is to estimate how sales will vary withcommunications spend. This can be done directly or by separating out the components of revenue. For example,net revenue growth for a mobile phone operator is best estimated by predicting the number of subscribers it gains,the average spend per subscriber and the number of years an average subscriber is retained.[7]
There are three ways to estimate the sales response function. First, an econometric approach can be used, whichcorrelates variations in spending with variations in sales. The data can be either historical or based on differencesoccurring cross-sectionally in different geographical areas. This method is most appropriate for mature productsand where markets are relatively stable so that conditions in the future are not going to be too different from the
314 VALUE-BASED COMMUNICATIONS
past.[8] Experimental estimates can be used for new products. This involves varying the levels of spending in differentregions and assessing the response function.[9] The third approach is consensus estimates. This requires membersof the brand team to use their best judgements to make predictions about sales at ‘low’, ‘medium’ and ‘high’ levelsof marketing spend; from these estimates a consensus response curve is developed.
The resulting levels of spend and sales forecasts are input into a shareholder value analysis to estimate theshareholder value added for the different budgets. Figure 9.8 illustrates this for the beer, Buzz, showing theshareholder value added with annual communications budgets of 5, 10 and 15 million euros. Note that marketshare is always maximised with the maximum communications budget, but the objective is to maximise value, notsales. Table 9.2 shows the calculation in detail for the optimum communications spend of 10 million euros. Heremanagers forecast sales reaching 35 million euros and the brand having a shareholder value of 27.8 million euros.
22m
11m
35m
28m
41m euros
24m
15m
10m
5m
Sales
Shareholder value
Communications budget(euros)
Figure 9.8 Value-Based Budgeting for Communications Investments
Table 9.2 Optimum Communications Budget for Buzz Beer
Year 1 2 3 4 5
Sales (euros m) 30.0 33.0 35.0 35.0 35.0
Communications budget 10.0 10.0 10.0 10.0 10.0
Operating profit 3.0 3.3 4.2 5.3 7.0
NOPAT 3.0 2.6 2.9 3.7 4.9
Net investment 15.0 1.2 0.8 0.0 0.0
Cash flow –12.0 1.4 2.1 3.7 4.9
PV of CF –10.9 1.2 1.6 2.5 3.0
Cumulative present value −2.6
PV of continuing value 30.4
Shareholder value 27.8
ALLOCATING ACROSS COMMUNICATIONS CHANNELS 315
ALLOCATING ACROSS COMMUNICATIONS CHANNELS
The budget has to be allocated and integrated across the various communications vehicles – advertising, salespromotion, public relations, direct response and the sales force. Companies even within the same market canemploy very different strategies. Developing an appropriate set of channels will have a marked effect on the successof a campaign. Each of the channels has certain characteristics and advantages and disadvantages.
ADVERTISING
Companies can use advertising in a range of media including TV, radio, newspapers, magazines, billboards and websites such as YouTube. The aims can be long-term brand development or quick sales response. The general featuresof advertising are:
❍ Legitimises the brand. Exposure in major advertising vehicles expresses the company’s commitment tothe brand and conveys a measure of confidence among buyers.
❍ Creative expression. Advertising, through the use of pictures, colour and language, permits a morecreative presentation of the brand’s emotional and functional benefits.
❍ Image building. Advertising over a long period can be the most effective way of building a distinctivepersonality for the brand.
❍ Economical. Advertising can be a relatively low cost means of exposing the company’s message to largepopulations. The downside is that it generally has smaller effects than personal selling or promotions.
SALES PROMOTIONS
Sales promotion tools include money-off vouchers, samples, contests, trade-in allowances, gifts, exhibits and tie-ins.Their general features are:
❍ Impact. By offering direct inducements to buyers they can have strong and quick effects on sales.Normally the elasticity of demand with respect to promotions is significantly higher than for advertising.
❍ Trial. Promotions can be an effective means of obtaining customer trial in low-involvement markets whereother communications vehicles do not receive attention.
❍ Expensive. Promotions, particularly where they involve price reductions, can be expensive. They can alsoreduce margins by displacing sales from periods when promotions are not being offered.
❍ Image erosion. Excessive use of promotions can damage the quality image of a brand.
PUBLIC RELATIONS
PR can include lobbying politicians and the media, publications, press handouts, speeches, charitable donations, wordof mouth and sponsorships. Its main features are:
❍ Credibility. News stories and features are more credible sources of information to buyers than ads andpromotions that are obviously biased and paid for.

316 VALUE-BASED COMMUNICATIONS
❍ Imprecise. It is more difficult to control the message and target it to particular groups than withconventional commercial communications.
❍ Low cost. Effective public relations can obtain substantial free media exposure.
❍ Difficult. PR cannot depend upon gaining effective access to the most important media or communitystakeholders. It depends upon the perceived importance and interest of the message.
PERSONAL SELLING
Using the company’s own sales representatives is a highly effective way of building up an understanding of thecompany’s offer and creating preference. Its main features are:
❍ Two-way. Two-way communications are always more persuasive than one-way. The sales person is ableto modify and tailor the information to the reactions and wants of the customer.
❍ Closure. Personal selling allows the deal to be agreed. It also puts the buyer under psychological pressureto respond to the representative’s visit.
❍ Relationships. Personal selling facilitates the developments of friendships and lasting relationships thatencourage continuing business.
❍ Expensive. Personal selling is normally a much more expensive form of communication. With keeping asalesperson on the road costing up to £100 000, an individual sales call can easily cost £20 as against afew pence using ads or promotions.
DIRECT MARKETING
Direct marketing includes digital communications, email, catalogues, mailings and telemarketing. (See box, ‘TheImpact of Digital Technology on Marketing’.)
❍ Personalised. The message can usually be addressed to a specific person and customised to theirindividual circumstances.
❍ Responsive. Direct marketing usually invites a behavioural response from the buyer. Where effective,direct marketing can lead to a rapid increase in sales.
❍ Interactive. Messages can be prepared quickly and can be changed depending on the customer’sresponse.
❍ Targeted. Direct marketing can be precisely targeted to specific market segments.
What determines the right mix of communications for a brand? The allocation the manager should make dependsupon the following factors:
1. The company’s objectives and capabilities. If the company’s aim is to increase awareness in the mass market,then advertising is the obvious medium. On the other hand, if it wants to create trial, promotions are attractive.The resources available also influence the options. Television advertising is very expensive; PR can be cheap.
2. Characteristics of the target market. If the target market consists of a relatively small number of customers,direct selling is likely to be effective. If the market consists of millions of customers, then mass media willbe better.

ALLOCATING ACROSS COMMUNICATIONS CHANNELS 317
3. Type of product. In general, personal selling is the most effective vehicle for products that are expensive,complex and high risk, and for markets with few, large buyers. Advertising and sales promotion are moreefficient for products that are cheaper and routine, or where emotions play an important role in the choiceprocess.
4. Push versus pull strategy. An important factor is whether the company is pursuing a push or a pull marketingstrategy. A pull strategy uses advertising and consumer promotions targeted at end customers with the aimof getting them to induce the retailer or other channels to stock the product. Pull strategies create a demandfrom consumers. A push strategy directs selling and promotions to the trade with the aim of incentivisingretailers and distributors to carry the product and in turn promote it to customers.
5. Stage of market evolution. The mix of communications instruments tends to shift as the product andmarket evolve. For a new product, advertising and public relations, including word of mouth, are usually themost appropriate vehicles to build awareness. In the mature phase, sales promotion and personal sellingcan become more important. In the decline stage, advertising, PR and direct selling are cut back as there islittle new to say about the product and declining margins make it difficult to justify high investment. Salespromotion will often be necessary to stimulate the trade to continue to push the product.
The Impact of Digital Technology on Marketing
The Internet is radically affecting how the firm communicates with its customers and builds relationships with them.
Three factors have made the continued rapid growth of the Internet a certainty. One is the explosion of Internetaccess devices in addition to the personal computer, such as mobile phones, handheld devices, digital assistants,digital TV and games machines. The second is the rapid development of broadband communications, whichenormously expands the speed and amount of information that can be accessed by customers. Third, and mostimportant, is the sheer amount of customer-focused innovation being released by companies racing to capitalise onthe opportunities presented by the new technology.
A survey of marketers around the world by McKinsey[10] in 2007 looked at what online tools are most important,how they are being used and on which ones companies plan to spend more. Along with established online toolssuch as email, information-rich web sites and display advertising, the respondents showed a lot of interest in moreinteractive and collaborative technologies known as ‘Web 2.0’ for advertising, product development and customerservice.
These technologies include:
❍ Blogs: web log which are online journals hosted on a web site.
❍ Podcasts: audio or video recordings – a multi-media form of blog or other content, often distributedthrough ‘aggregator’ sites such as Apple’s ITunes.
❍ Social networks: sites such as MySpace and Facebook enable members to learn about each other.
❍ Virtual worlds: sites like Second Life are highly social, three-dimensional online environments shapedby users who interact with each other and receive instant feedback through ‘avatars’.
❍ Wikis: such as Wikipedia, which are systems for collaborative publishing.
318 VALUE-BASED COMMUNICATIONS
INTEGRATED MARKETING COMMUNICATIONS
To make the communications investment effective it is important for management to integrate the various elementsof the communications mix around a common set of objectives.[11] In recent years the major advertising agencies,such as Saatchi & Saatchi, J. Walter Thompson and Young & Rubicam, have bought agencies specialising insales promotion, digital communications, direct marketing and public relations with the aim of making an integratedcommunications offer to clients. But this move has not been noticeably successful – most clients still prefer to choosetheir own set of specialist agencies and to develop strategies for individual elements of their communications mix.
Often these activities are poorly coordinated – each agency working in isolation, developing its own messages,themes and modes of presentation, and reporting to different specialist managers within the client company, jealouslyguarding their own areas. The results are communications efforts that fail to exploit the synergies between thecompany’s advertising, digital, direct marketing and promotional initiatives, and that do not maximise the effectivenessof the large investment it may be making.
Integrated communications can be stimulated by a number of measures. First, management should have a singlebudget for marketing communications. One manager should have responsibility for the company’s entire communi-cations investment. The company’s communications specialists should plan the communications strategy as a teamand work out how it should be coordinated and implemented. Finally, senior managers should evaluate the results ofthe communications strategy as a whole in terms of overall, rather than specialist, goals. The world’s biggest adver-tiser, Procter & Gamble, has adopted this approach to incentivise its managers and their specialist communicationsagencies to work as a team. It has moved away from the traditional approach of paying agencies a commission onthe work they do, to paying them a performance fee based on the overall sales achieved by the business unit.
MEASURING COMMUNICATIONS EFFECTIVENESS
In spite of the huge sums being spent on communications, companies spend relatively little on judging whether theirinvestments have paid off. More is spent on pretesting campaigns than on post-campaign results.
PRETESTS
Before the national or international launch of a major communications campaign, companies will sometimes testit in one region to assess its effects on sales. If the campaign fails, it can be dropped before more is spent. Butbecause such real market tests take time, most companies rely on more flexible copy testing services. These involveshowing proposed ads to audiences of potential consumers and having the messages rated for their ability to attractattention, achieve cognitive effects, and impact on customers’ attitudes and intentions to buy. Most advertisingagencies are sceptical about such pretesting, arguing that the methods overemphasise the rationality of consumersand ignore the ads’ non-verbal effects on subsequent behaviour.
SALES EFFECTS RESEARCH
More companies, like Procter & Gamble, want to judge the success of marketing and communications spendingthrough its effect on increasing sales. But caution is necessary in using short-term sales increases as a measure of valuegeneration. Many factors affect sales besides communications investments. A longer period than a year has to be
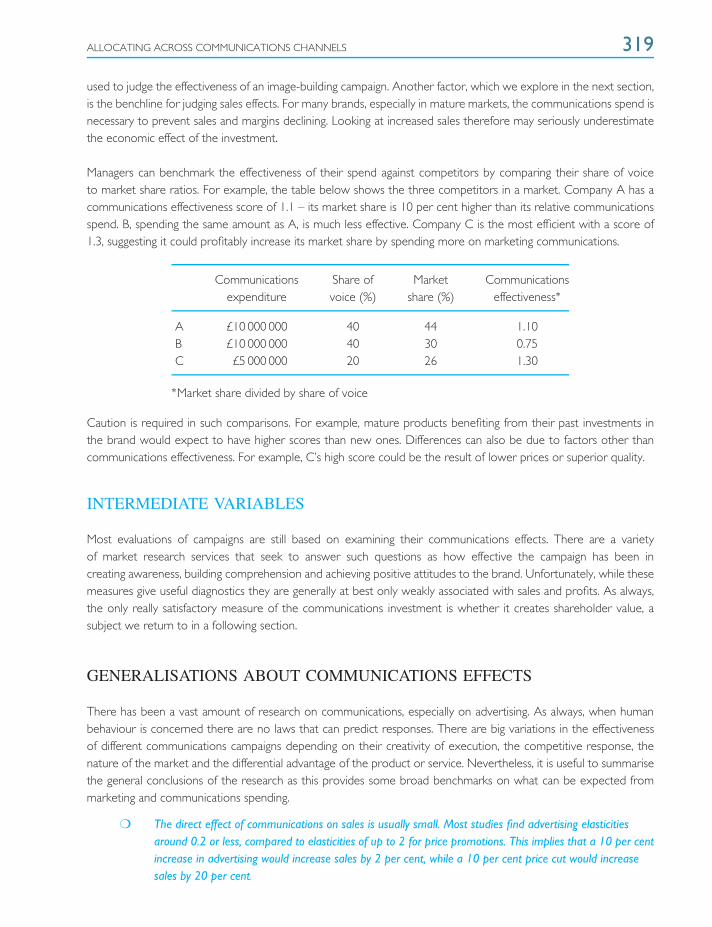
ALLOCATING ACROSS COMMUNICATIONS CHANNELS 319
used to judge the effectiveness of an image-building campaign. Another factor, which we explore in the next section,is the benchline for judging sales effects. For many brands, especially in mature markets, the communications spend isnecessary to prevent sales and margins declining. Looking at increased sales therefore may seriously underestimatethe economic effect of the investment.
Managers can benchmark the effectiveness of their spend against competitors by comparing their share of voiceto market share ratios. For example, the table below shows the three competitors in a market. Company A has acommunications effectiveness score of 1.1 – its market share is 10 per cent higher than its relative communicationsspend. B, spending the same amount as A, is much less effective. Company C is the most efficient with a score of1.3, suggesting it could profitably increase its market share by spending more on marketing communications.
Communications Share of Market Communicationsexpenditure voice (%) share (%) effectiveness∗
A £10 000 000 40 44 1.10B £10 000 000 40 30 0.75C £5 000 000 20 26 1.30
∗Market share divided by share of voice
Caution is required in such comparisons. For example, mature products benefiting from their past investments inthe brand would expect to have higher scores than new ones. Differences can also be due to factors other thancommunications effectiveness. For example, C’s high score could be the result of lower prices or superior quality.
INTERMEDIATE VARIABLES
Most evaluations of campaigns are still based on examining their communications effects. There are a varietyof market research services that seek to answer such questions as how effective the campaign has been increating awareness, building comprehension and achieving positive attitudes to the brand. Unfortunately, while thesemeasures give useful diagnostics they are generally at best only weakly associated with sales and profits. As always,the only really satisfactory measure of the communications investment is whether it creates shareholder value, asubject we return to in a following section.
GENERALISATIONS ABOUT COMMUNICATIONS EFFECTS
There has been a vast amount of research on communications, especially on advertising. As always, when humanbehaviour is concerned there are no laws that can predict responses. There are big variations in the effectivenessof different communications campaigns depending on their creativity of execution, the competitive response, thenature of the market and the differential advantage of the product or service. Nevertheless, it is useful to summarisethe general conclusions of the research as this provides some broad benchmarks on what can be expected frommarketing and communications spending.
❍ The direct effect of communications on sales is usually small. Most studies find advertising elasticitiesaround 0.2 or less, compared to elasticities of up to 2 for price promotions. This implies that a 10 per centincrease in advertising would increase sales by 2 per cent, while a 10 per cent price cut would increasesales by 20 per cent.
320 VALUE-BASED COMMUNICATIONS
❍ Communications are often critical for new brands. The advertising elasticity is higher for new brands.Communications create awareness and comprehension, and signals the brand’s quality.
❍ Once brands are established the role of communications is to reinforce existing buying behaviour.Communications add value by maintaining sales and prices rather than increasing them. While these mayappear modest goals they can have a major effect on the value of the brand.
❍ The effect of communications on maintaining price levels can be as important as its effects on volume.Brand advertising tends to reduce price sensitivity allowing the firm to obtain higher gross margins and beless sensitive to price competition.
❍ Advertising has diminishing effects in terms of short-term sales results. The first exposure to an ad has thebiggest effect on consumers’ purchasing behaviour. After the third exposure, effects are usually very small.This means that reach soon becomes more important than frequency.
❍ Communications are more effective when the brand has a differential advantage. Such an advantage canbe based on functional or emotional attributes.
❍ Because communications elasticities are normally low, the pay-off will vary with the brand’s profitcontribution. High communications budgets are unlikely to create value on low-margin products.
These conclusions suggest that the power of communications, and particularly advertising, has often beenexaggerated. The satisfactory experience of customers and habit tend to be more important than marketing andcommunications in maintaining sales. For new brands, companies have to employ additional and more powerfulmeans to capture initial sales, including aggressive pricing, samples and word-of-mouth endorsements. At thesame time, shareholder value is a long-term phenomenon. This means that small advantages in communicationseffectiveness will compound over time into surprisingly large value differences. This is illustrated next.
VALUING COMMUNICATIONS STRATEGIES
The basic principle of value-based marketing is that managers should develop and choose the marketing strategythat is most likely to maximise the return for shareholders. As we have seen, this is the strategy that maximisesthe net present value of all future cash flow. This is the principle that should be used in valuing and selectingcommunications strategies.
We have shown that there are two broad types of communications problems: high-involvement and low involvement.In high involvement purchasing situations the buyer is searching for information about the attributes or emotionalbenefits offered by competing products. The function of communications here is to help buyers solve this problemby providing information to take them through the process of learning about the product and building attitudesfavourable to purchase. The ultimate test of this type of communications is whether it succeeds in increasing thenumber of buyers and the value of sales. Low-involvement buying is different. Here buyers are familiar with theproduct and have bought it before. The function of communications is not persuading customers to try it, but toreinforce current purchasing habits.
To determine whether a given investment in advertising and marketing creates value in high-involvement situationsis straightforward. Managers have to forecast the effects of the expenditure on the components of sales, estimatethe resulting free cash flows, discount them and calculate the shareholder value added. This is similar to the casesummarised in Table 9.2. The problem becomes more controversial, however, in the low-involvement situation
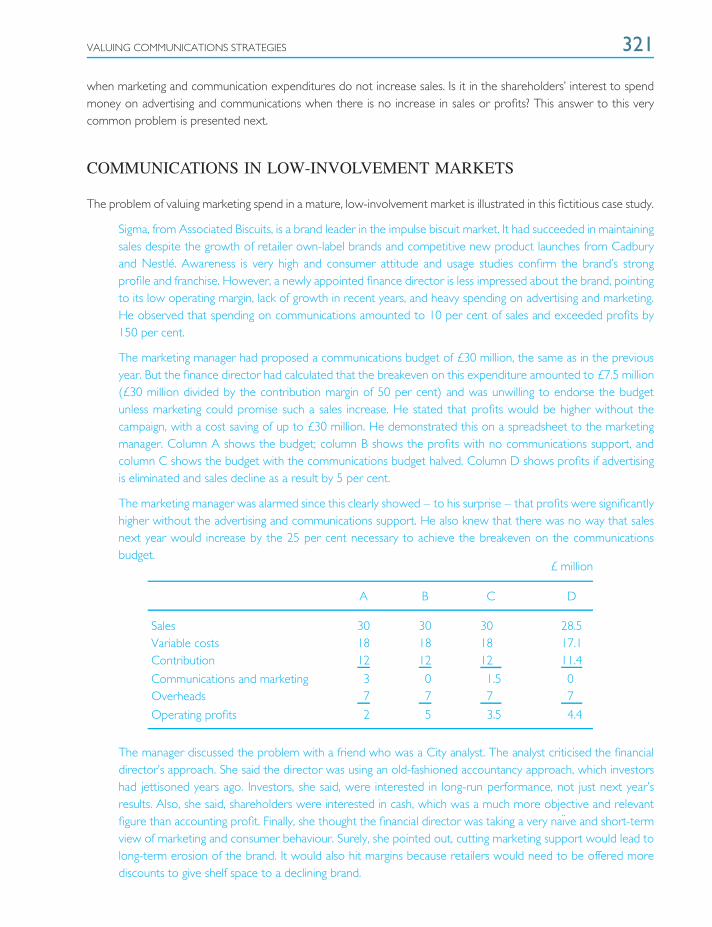
VALUING COMMUNICATIONS STRATEGIES 321
when marketing and communication expenditures do not increase sales. Is it in the shareholders’ interest to spendmoney on advertising and communications when there is no increase in sales or profits? This answer to this verycommon problem is presented next.
COMMUNICATIONS IN LOW-INVOLVEMENT MARKETS
The problem of valuing marketing spend in a mature, low-involvement market is illustrated in this fictitious case study.
Sigma, from Associated Biscuits, is a brand leader in the impulse biscuit market. It had succeeded in maintainingsales despite the growth of retailer own-label brands and competitive new product launches from Cadburyand Nestle. Awareness is very high and consumer attitude and usage studies confirm the brand’s strongprofile and franchise. However, a newly appointed finance director is less impressed about the brand, pointingto its low operating margin, lack of growth in recent years, and heavy spending on advertising and marketing.He observed that spending on communications amounted to 10 per cent of sales and exceeded profits by150 per cent.
The marketing manager had proposed a communications budget of £30 million, the same as in the previousyear. But the finance director had calculated that the breakeven on this expenditure amounted to £7.5 million(£30 million divided by the contribution margin of 50 per cent) and was unwilling to endorse the budgetunless marketing could promise such a sales increase. He stated that profits would be higher without thecampaign, with a cost saving of up to £30 million. He demonstrated this on a spreadsheet to the marketingmanager. Column A shows the budget; column B shows the profits with no communications support, andcolumn C shows the budget with the communications budget halved. Column D shows profits if advertisingis eliminated and sales decline as a result by 5 per cent.
The marketing manager was alarmed since this clearly showed – to his surprise – that profits were significantlyhigher without the advertising and communications support. He also knew that there was no way that salesnext year would increase by the 25 per cent necessary to achieve the breakeven on the communicationsbudget.
£ million
A B C D
Sales 30 30 30 28.5Variable costs 18 18 18 17.1Contribution 12 12 12 11.4
Communications and marketing 3 0 1.5 0Overheads 7 7 7 7
Operating profits 2 5 3.5 4.4
The manager discussed the problem with a friend who was a City analyst. The analyst criticised the financialdirector’s approach. She said the director was using an old-fashioned accountancy approach, which investorshad jettisoned years ago. Investors, she said, were interested in long-run performance, not just next year’sresults. Also, she said, shareholders were interested in cash, which was a much more objective and relevantfigure than accounting profit. Finally, she thought the financial director was taking a very naıve and short-termview of marketing and consumer behaviour. Surely, she pointed out, cutting marketing support would lead tolong-term erosion of the brand. It would also hit margins because retailers would need to be offered morediscounts to give shelf space to a declining brand.
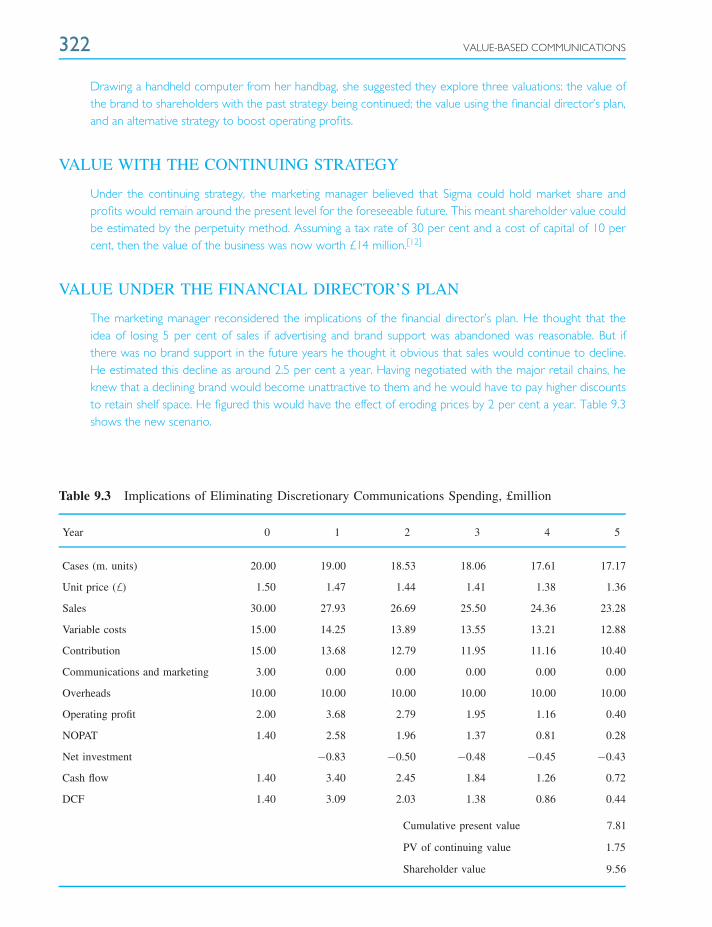
322 VALUE-BASED COMMUNICATIONS
Drawing a handheld computer from her handbag, she suggested they explore three valuations: the value ofthe brand to shareholders with the past strategy being continued; the value using the financial director’s plan,and an alternative strategy to boost operating profits.
VALUE WITH THE CONTINUING STRATEGY
Under the continuing strategy, the marketing manager believed that Sigma could hold market share andprofits would remain around the present level for the foreseeable future. This meant shareholder value couldbe estimated by the perpetuity method. Assuming a tax rate of 30 per cent and a cost of capital of 10 percent, then the value of the business was now worth £14 million.[12]
VALUE UNDER THE FINANCIAL DIRECTOR’S PLAN
The marketing manager reconsidered the implications of the financial director’s plan. He thought that theidea of losing 5 per cent of sales if advertising and brand support was abandoned was reasonable. But ifthere was no brand support in the future years he thought it obvious that sales would continue to decline.He estimated this decline as around 2.5 per cent a year. Having negotiated with the major retail chains, heknew that a declining brand would become unattractive to them and he would have to pay higher discountsto retain shelf space. He figured this would have the effect of eroding prices by 2 per cent a year. Table 9.3shows the new scenario.
Table 9.3 Implications of Eliminating Discretionary Communications Spending, £million
Year 0 1 2 3 4 5
Cases (m. units) 20.00 19.00 18.53 18.06 17.61 17.17
Unit price (£) 1.50 1.47 1.44 1.41 1.38 1.36
Sales 30.00 27.93 26.69 25.50 24.36 23.28
Variable costs 15.00 14.25 13.89 13.55 13.21 12.88
Contribution 15.00 13.68 12.79 11.95 11.16 10.40
Communications and marketing 3.00 0.00 0.00 0.00 0.00 0.00
Overheads 10.00 10.00 10.00 10.00 10.00 10.00
Operating profit 2.00 3.68 2.79 1.95 1.16 0.40
NOPAT 1.40 2.58 1.96 1.37 0.81 0.28
Net investment −0.83 −0.50 −0.48 −0.45 −0.43
Cash flow 1.40 3.40 2.45 1.84 1.26 0.72
DCF 1.40 3.09 2.03 1.38 0.86 0.44
Cumulative present value 7.81
PV of continuing value 1.75
Shareholder value 9.56

SUMMARY 323
In the first year, the financial director was correct: profits and cash flow would be higher if the advertisingand marketing budget were cut. But from the second year profits and cash flow would fall precipitously asmarket share and prices eroded. At £9.56 million, shareholder value is one-third less under this policy thanunder the current strategy.
VALUE UNDER AN ALTERNATIVE STRATEGY
The analyst suggested that if the financial director was determined to improve short-term profits, then astrategy that might do less permanent damage to the brand would be to raise the price by 5 per cent. Shesuggested that a leading brand like Sigma would be expected to have a lower than average price elasticity,say around −1, suggesting this might erode the number of cases sold by around 5 per cent. They werepleased with the numbers that were generated from these assumptions: operating profits jumped by nearly40 per cent to £2.77 million and shareholder value increased to £19.38 million. The market share loss overthe planning period was only 5 per cent as against nearly 15 per cent under the financial director’s plan.[13]
In summary, the three options gave the following figures:
Shareholder value (£) Market share, year 5 (%)
Current policy £14 000 000 34Finance director £9 560 000 29Alternative policy £19 380 000 32
SUMMARY
1. It is not enough to have a good product; its values have to be communicated to create awareness, to build anunderstanding of its benefits, and to develop positive attitudes towards it. Without a decisive communicationsstrategy competitors can catch up and usurp the brand’s position in the customer’s share of mind.
2. Usually neither marketing nor accounting managers know how to evaluate spending on communications.Marketers usually look at awareness and sales, accountants focus on the impact on short-term profits. Neitherset of measures correlates with shareholder value.
3. Investing in communications and marketing increases shareholder value by creating and developing intangibleassets which enhance the effectiveness of the business’s core processes: new product development, customerrelationship management and management of the supply chain.
4. The firm’s commercial communications activities are only one of many factors affecting the buying process.In general their effects are quite small. Nevertheless, small differences in communications effectiveness cancompound over a long period to significant differences in the value of the business to investors.
5. There are two broad models of how communications work: the high-involvement and low-involvementmodels. The former sees the role of communications primarily as persuading new customers to buy; thelatter sees its role as reinforcing current buying behaviour.
6. Much advertising and communications investment is primarily about reinforcement. Such spending can stillcreate shareholder value even though its effects on increasing sales is minimal.
324 VALUE-BASED COMMUNICATIONS
REVIEW QUESTIONS
1. How do advertising and communications create shareholder value?2. Contrast how accountants and marketing managers conventionally judge the effectiveness of spending on
marketing and communications.3. How do advertising and communications influence buying behaviour?4. Describe how communications objectives will differ for mature products and new ones.5. Describe the steps in developing a communications strategy.6. Show how to evaluate the potential effect on shareholder value of a communications plan.
NOTES ON CHAPTER 9
[1] Finance Directors Survey 2000, sponsored by the Institute of Practitioners in Advertising and KPMG, London:IPA, 2000.
[2] Demetrios Vakratsas and Tim Ambler, How advertising works: what do we really know, Journal of Marketing,63, January, 1999, 26–43.
[3] The increase in sales is given by the elasticity times the percentage increase in the spend: 0.2 × 25 per cent =5 per cent. Sales would be expected to grow from £50 million to £50 million.
[4] Finance Directors Survey 2000, sponsored by the Institute of Practitioners in Advertising and KPMG, London:IPA, 2000.
[5] A good summary of supporting studies is in Rajendra K. Strivastava, Tasadduq A. Shervani and Liam Fahey,Market-based assets and shareholder value: a framework for analysis, Journal of Marketing, 62, January, 1998, 2–18.See also: Werner Reinartz and V. Kumar, The mismanagement of customer loyalty, Harvard Business Review, 2002.
[6] Adapted from Philip Kotler, Marketing Management, New Jersey: Prentice Hall, 2000, p. 563.
[7] For a good example see, The FTSE’s bright, the FTSE’s Orange: how advertising enhanced Orange PLCshareholder value, The IPA Advertising Effectiveness Awards 1998, London: IPA, 1999.
[8] For a full account see Dominique M. Hanssens, Leonard J. Parsons and Randall L. Schultz, Market ResponseModels: Econometric and Time Series Analysis, Boston, MA: Kluwer, 1990.
[9] Leonard M. Lodish, Magid Abraham et al. A summary of 55 in-market experimental estimates of the long-termeffects of advertising, Marketing Science, 14(3), 133–140.
[10] Jacques Bughin, Christoph Erbenich, Amy Shenkan, How companies are marketing online: A McKinsey GlobalSurvey, McKinsey Quarterly, September 2007.
[11] For a compelling example of how a well-planned integrated communications campaign can create value, see‘It only works if it all works: how troubled BT Cellnet transformed into thriving O2’, The IPA Advertising EffectivenessAwards, 2004, IPA/WARC.
[12] After tax profit or NOPAT is £1.4 million. Dividing by the cost of capital at 10 per cent gives £50 million.
[13] It should be straightforward to rework Table 9.3 on a spreadsheet to check this alternative strategy.

10 Value-BasedMarketingin the Digital Age
‘Every now and then, a technology comes along that is so profound, so powerful, so universal, thatits impact will change everything. It will transform every institution in the world. It will create winnersand losers, it will change the way we do business, the way we teach our children, communicate andinteract as individuals.’
Lou Gerstner, Chairman of IBM
INTRODUCTION AND OBJECTIVES
The growth and speed of the impact of the Internet on business and society has had few precedents. ‘The Internetchanges everything’ is a cry heard on every business platform. What accounts for the obsession with the Internet?The Internet has offered such enormous improvements in operating efficiency and market effectiveness that, in manymarkets, traditional ways of doing business look to be unviable. The Internet is fundamental for marketing, despitethe bursting of the dot.com bubble in the early 2000s. Most companies’ web sites are managed by their marketingdepartments. More importantly, the Internet radically affects how the firm communicates with its customers andbuilds relationships with them.
By the time you have completed this chapter, you will be able to:
❍ Understand the development of the Internet and its key features
❍ Describe the drivers of the new e-markets
❍ Assess how the Internet is reshaping marketing and competition
❍ Show how it can create value for customers
❍ Analyse how the Internet affects marketing strategy
❍ Summarise how companies need to respond to the threats and opportunities from the Internet
The chapter begins by describing the growth and development of the Internet and the key features for marketing.It explains the three fundamental drivers of e-business: digitisation, the network economy and one-to-onecommunication with customers. It then shows how the web creates value for customers and companies. We thenlook at the implications for marketing strategy and communications.
326 VALUE-BASED MARKETING IN THE DIGITAL AGE
THE GROWTH AND DEVELOPMENT OF THE INTERNET
GROWTH OF THE NET
The Internet refers to the web of computer networks that is making possible today’s cheap, instantaneous globalcommunications. Public interest in the Internet first exploded in 1994. But its origins go back 30 years earlier.Research into the Internet started in the USA and Europe in the early 1960s. In the USA the objective was to createan emergency military communications network that would be invulnerable to nuclear attack. In Europe the aimwas to develop a communications system that would allow academics to share research ideas. The first practicalimplementation of the Net occurred in 1969, when the University of California at Los Angeles was connected tothe Stanford Research Institute. In the following years today’s universal Internet standards were developed, includingthe @ symbol in addresses (1971), remote accessing of computers through telnet (1972), multiple-person chatsessions (1973), and the downloading of files through ftp (1973). After these developments the embryonic Internetspread quickly among academics. In particular, the research community soon adopted email as an effective meansof communicating with colleagues.
In 1994 three breakthroughs brought the Internet out of academia and into a much broader community. First, theUS National Science Foundation, which effectively regulated the Internet, ended its ban on the commercial use ofthe Net. Second, low-cost computers and new software made it much easier and cheaper to access the Net. Third,the development of web browsers and web servers made it possible for people to navigate the Net more easilyand for organisations to put richer content on to their web sites.
These breakthroughs created a communications and marketing revolution that is still ongoing. Now, anyoneconnected to the Net can communicate with anyone else through open, universal standards, instantaneously andat almost zero cost. Companies can communicate with other companies, individuals with other individuals andcompanies with individuals. Firms suddenly found themselves able to create marketing material that had globalreach for very low cost. Small businesses could compete on a much more even footing with the largest firmsin the world. Customers found that they could quickly find product and company information at the click ofa mouse. Even more fundamental, companies and customers could engage in a dialogue and learn from eachother.
Since 1994 the number of people connected to the Net has grown exponentially every year. By the end of2007, there were over 1.3 billion users worldwide. Almost 70 per cent of the population were connected tothe Internet in the USA in 2006. In Britain the equivalent figure was over 55 per cent, while in Germany, Franceand Italy it was around 1 in 2. Moreover, the amount of material on the web is increasing even faster thanthe number of users. As of 2008, there were at least 45 billion pages on the web and over 100 million websites.
Three factors have made the continued rapid growth of the Internet a certainty. One is the explosion of newInternet access devices in addition to the personal computer : common methods of home access include dial-up,landline broadband (over coaxial cable, fiber optic or copper wires), personal digital assistants, digital TV andgames machines, Wi-Fi, satellite and 3G technology cell phones. The second has been the rapid development ofbroadband communications, which enormously expands the speed and amount of information that can be accessedby customers. Third, and most important, is the sheer amount of customer-focused innovation being released bycompanies racing to capitalise on the opportunities presented by the new technology.
DRIVERS OF CHANGE IN THE NEW ECONOMY 327
DRIVERS OF CHANGE IN THE NEW ECONOMY
Three forces are driving the growth of the Internet and e-commerce: digitisation, networks and customisation.These in turn are reshaping the role and tools of marketing and the ways companies create value for shareholders.
GOING DIGITAL: MOORE’S LAW
The digital concept is very simple. Something is digital when all its properties and information are stored as a stringof zeros and ones. The smallest piece of this digital information is called a bit. All the text, pictures, music andvideos seen on a computer screen or sent over the Internet are simply strings of bits. Digital devices that processbits are now all around us in the car, in the home, in digital cameras, digital TVs and digital telephones. Everythingon the Internet is digital. The essence of the information revolution is this transformation of information into digitalform where it can be manipulated by computers and transmitted by networks. Computers and digital devices are allbuilt on semiconductors (or chips). The remarkable phenomenon about semiconductor production is the strikingproductivity gains that occur. Chips are becoming cheaper, smaller and more powerful at an amazing rate. Thesignificance of this is that computing power has apparently boundless possibilities because of its power, cheapnessand applicability.
This feature was first codified by Gordon Moore, founder of Intel, into what is now accepted as an equation ofenormous power.
Moore’s Law states that every 18 months, computer processing power doubles while cost stays constant.
Every 18 months, you get twice as much power for the same price, or the same power for half the cost. Moore’sLaw has proved to be remarkably accurate for the past 30 years, and most scientists expect it to hold for thenext 30 years too. It means computing power is becoming almost free. It also means that storing, processing andcommunicating information becomes incredibly cheap. This provides new ways for marketing to create value forcustomers and shareholders. Let us look at some of the implications of Moore’s Law.
RESOURCE SUBSTITUTION – ‘ATOMS TO BITS’
In the new digital world bits replace atoms. To create shareholder value it means managers must seek to substitutecheap digital resources for those that are expensive – labour, raw materials and capital. So to stay cost competitivebanks are replacing branches with the Internet; companies replace paper with online documents; letters andtelephone calls are replaced by email; service staff by online customer support. Digital substitution also allows firmsto become more effective as well as to reduce costs. Firms can offer benefits to customers that were virtuallyimpossible before, such as ‘24/7’ (twenty-four hours a day, seven days a week availability and service). Web sitescan offer information in multiple languages, or even instantaneous translation.
THE DEVELOPING DIGITAL ENVIRONMENT
Currently many customers find the digital interface a poor substitute for the richness of shopping in the realworld. But broadband access, faster connection speeds and advances in software have made cyberspace increasingly

328 VALUE-BASED MARKETING IN THE DIGITAL AGE
realistic, stimulating and user friendly. Web sites can now create a virtual space to simulate or enhance the real world,whether it is a shop, classroom or office. Customers can get feedback and interaction, and shopping agents can giveadvice or compare different products. Two- or three-dimensional images allow customers to ‘walk around’ productsand even try them out under simulated conditions. Finally, the product assortment and information available on awell-designed web site can far exceed any ‘bricks and mortar’ site.
DIGITISING MARKETING PROCESSES
Moore’s Law and the developing digital environment create major opportunities to increase the efficiency andeffectiveness of marketing. To exploit these, the first step is to map out in detail the firm’s marketing processes.[1]
At the aggregate level these processes consist of first understanding customer needs, then involving customersin the design of products and services. Next, the products have to be communicated, sold and delivered. Finally,customer service has to be provided and customer relationships built. The second stage looks for opportunities tosubstitute digital material. Market research materials can be converted to online formats; the firm’s intranet can bea vehicle for cross-functional new product development; web sites can augment the selling efforts; online customersupport can be used to build an interface with customers. The third stage is to fundamentally redesign marketingprocesses to capitalise on digital capabilities. For example, the airlines are redesigning their marketing processes tocut costs and deal directly with the customer, eliminating the travel agent. The whole process, from enquiring aboutschedules and availability, making reservations, to obtaining an ‘e-ticket’, has now been digitised.
NETWORKS AND METCALF’S LAW
Moore’s Law puts cheap computing power into the hands of millions. The Internet permits all these users to be linkedtogether into a universal communications network. Once people are networked, new sources of consumer andshareholder value are created that go beyond the acceleration of computing power predicted by Moore. Digitisationis a technological phenomenon; networks that allow millions of people to communicate with organisations and withone another are social phenomena.
What explained why the Internet was so valuable was a law, proposed by Robert Metcalf, founder of 3ComCorporation.
Metcalf’s Law states that the value of any network is proportional to the square of the number of users.
For example, a telephone service is not very valuable if only a handful of people is connected. Its value rises rapidlythe more users are connected. When the Internet was only used by a handful of academics, it was not very valuable.Now that hundreds of millions of people and organisations are connected, it becomes essential. The explosion ofconnectivity that the Internet created has implications that promise to fundamentally change how businesses createvalue for their customers and shareholders.
UNBUNDLING PRODUCTS AND INFORMATION
Companies have traditionally provided customers jointly with both information and products. For example,shoppers go to a car showroom to collect information about features, credit terms, prices and availability. They visit
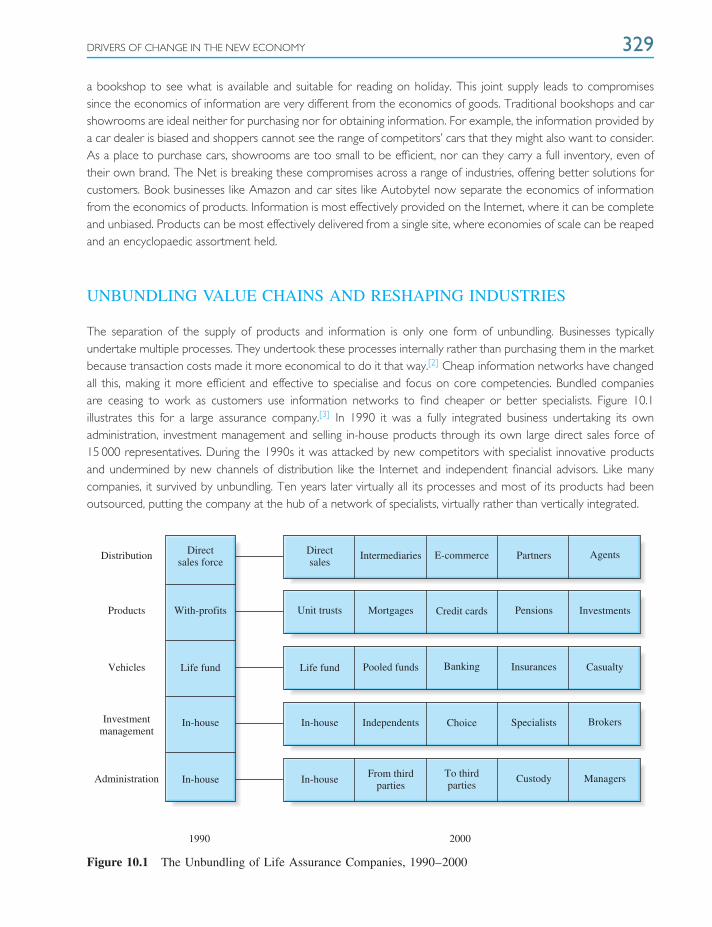
DRIVERS OF CHANGE IN THE NEW ECONOMY 329
a bookshop to see what is available and suitable for reading on holiday. This joint supply leads to compromisessince the economics of information are very different from the economics of goods. Traditional bookshops and carshowrooms are ideal neither for purchasing nor for obtaining information. For example, the information provided bya car dealer is biased and shoppers cannot see the range of competitors’ cars that they might also want to consider.As a place to purchase cars, showrooms are too small to be efficient, nor can they carry a full inventory, even oftheir own brand. The Net is breaking these compromises across a range of industries, offering better solutions forcustomers. Book businesses like Amazon and car sites like Autobytel now separate the economics of informationfrom the economics of products. Information is most effectively provided on the Internet, where it can be completeand unbiased. Products can be most effectively delivered from a single site, where economies of scale can be reapedand an encyclopaedic assortment held.
UNBUNDLING VALUE CHAINS AND RESHAPING INDUSTRIES
The separation of the supply of products and information is only one form of unbundling. Businesses typicallyundertake multiple processes. They undertook these processes internally rather than purchasing them in the marketbecause transaction costs made it more economical to do it that way.[2] Cheap information networks have changedall this, making it more efficient and effective to specialise and focus on core competencies. Bundled companiesare ceasing to work as customers use information networks to find cheaper or better specialists. Figure 10.1illustrates this for a large assurance company.[3] In 1990 it was a fully integrated business undertaking its ownadministration, investment management and selling in-house products through its own large direct sales force of15 000 representatives. During the 1990s it was attacked by new competitors with specialist innovative productsand undermined by new channels of distribution like the Internet and independent financial advisors. Like manycompanies, it survived by unbundling. Ten years later virtually all its processes and most of its products had beenoutsourced, putting the company at the hub of a network of specialists, virtually rather than vertically integrated.
Directsales
Directsales force
Intermediaries
Unit trusts
Life fundLife fund
In-houseIn-house
In-houseIn-house
Mortgages
Pooled funds
Independents
From thirdparties
20001990
With-profits
Distribution
Products
Vehicles
Investmentmanagement
Administration
E-commerce
Credit cards
Banking
Choice
To thirdparties
Partners
Pensions
Insurances
Specialists
Custody
Agents
Investments
Casualty
Brokers
Managers
Figure 10.1 The Unbundling of Life Assurance Companies, 1990–2000
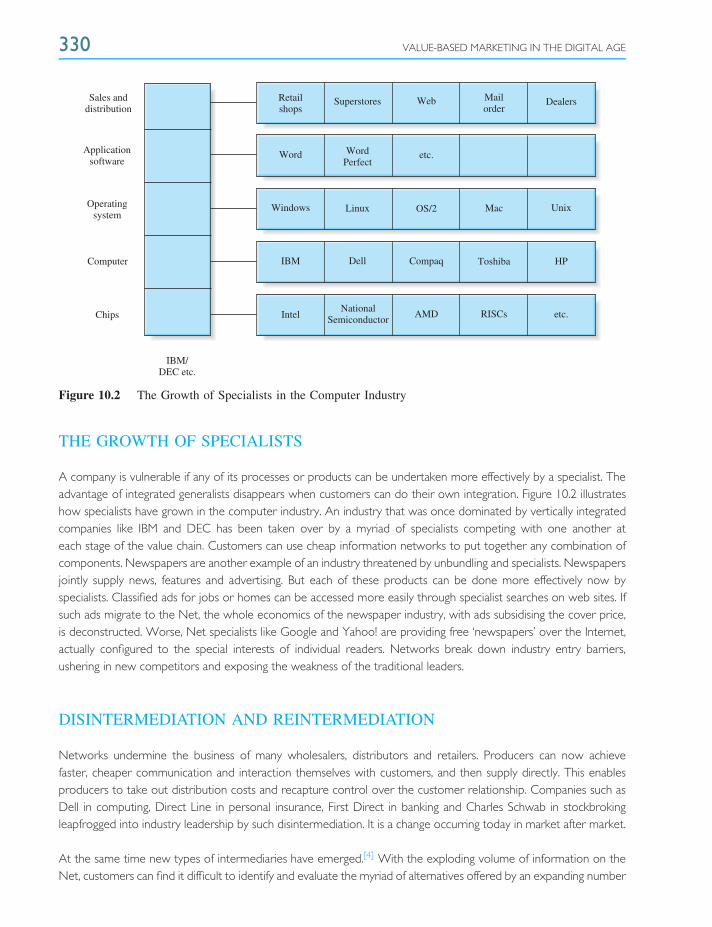
330 VALUE-BASED MARKETING IN THE DIGITAL AGE
Sales anddistribution
Applicationsoftware
Operatingsystem
Computer
Chips
IBM/DEC etc.
Retailshops
WordPerfect
Word etc.
etc.
Windows
IBM
Intel
Superstores
Linux
Dell
NationalSemiconductor
AMD
Compaq
OS/2
Web
RISCs
Toshiba
Mac
Mailorder
Dealers
HP
Unix
Figure 10.2 The Growth of Specialists in the Computer Industry
THE GROWTH OF SPECIALISTS
A company is vulnerable if any of its processes or products can be undertaken more effectively by a specialist. Theadvantage of integrated generalists disappears when customers can do their own integration. Figure 10.2 illustrateshow specialists have grown in the computer industry. An industry that was once dominated by vertically integratedcompanies like IBM and DEC has been taken over by a myriad of specialists competing with one another ateach stage of the value chain. Customers can use cheap information networks to put together any combination ofcomponents. Newspapers are another example of an industry threatened by unbundling and specialists. Newspapersjointly supply news, features and advertising. But each of these products can be done more effectively now byspecialists. Classified ads for jobs or homes can be accessed more easily through specialist searches on web sites. Ifsuch ads migrate to the Net, the whole economics of the newspaper industry, with ads subsidising the cover price,is deconstructed. Worse, Net specialists like Google and Yahoo! are providing free ‘newspapers’ over the Internet,actually configured to the special interests of individual readers. Networks break down industry entry barriers,ushering in new competitors and exposing the weakness of the traditional leaders.
DISINTERMEDIATION AND REINTERMEDIATION
Networks undermine the business of many wholesalers, distributors and retailers. Producers can now achievefaster, cheaper communication and interaction themselves with customers, and then supply directly. This enablesproducers to take out distribution costs and recapture control over the customer relationship. Companies such asDell in computing, Direct Line in personal insurance, First Direct in banking and Charles Schwab in stockbrokingleapfrogged into industry leadership by such disintermediation. It is a change occurring today in market after market.
At the same time new types of intermediaries have emerged.[4] With the exploding volume of information on theNet, customers can find it difficult to identify and evaluate the myriad of alternatives offered by an expanding number
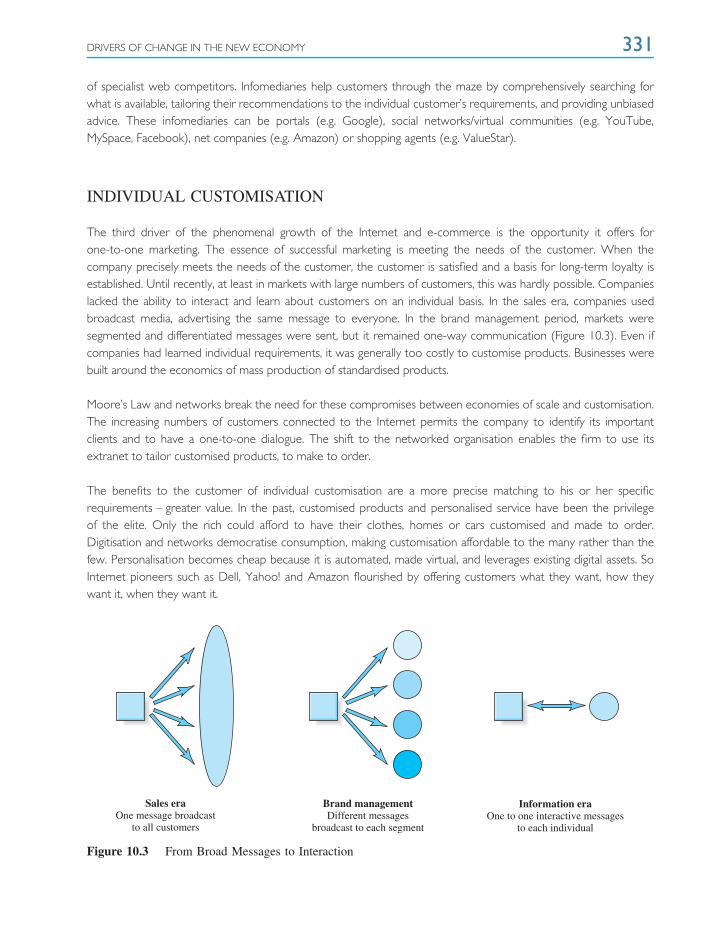
DRIVERS OF CHANGE IN THE NEW ECONOMY 331
of specialist web competitors. Infomediaries help customers through the maze by comprehensively searching forwhat is available, tailoring their recommendations to the individual customer’s requirements, and providing unbiasedadvice. These infomediaries can be portals (e.g. Google), social networks/virtual communities (e.g. YouTube,MySpace, Facebook), net companies (e.g. Amazon) or shopping agents (e.g. ValueStar).
INDIVIDUAL CUSTOMISATION
The third driver of the phenomenal growth of the Internet and e-commerce is the opportunity it offers forone-to-one marketing. The essence of successful marketing is meeting the needs of the customer. When thecompany precisely meets the needs of the customer, the customer is satisfied and a basis for long-term loyalty isestablished. Until recently, at least in markets with large numbers of customers, this was hardly possible. Companieslacked the ability to interact and learn about customers on an individual basis. In the sales era, companies usedbroadcast media, advertising the same message to everyone. In the brand management period, markets weresegmented and differentiated messages were sent, but it remained one-way communication (Figure 10.3). Even ifcompanies had learned individual requirements, it was generally too costly to customise products. Businesses werebuilt around the economics of mass production of standardised products.
Moore’s Law and networks break the need for these compromises between economies of scale and customisation.The increasing numbers of customers connected to the Internet permits the company to identify its importantclients and to have a one-to-one dialogue. The shift to the networked organisation enables the firm to use itsextranet to tailor customised products, to make to order.
The benefits to the customer of individual customisation are a more precise matching to his or her specificrequirements – greater value. In the past, customised products and personalised service have been the privilegeof the elite. Only the rich could afford to have their clothes, homes or cars customised and made to order.Digitisation and networks democratise consumption, making customisation affordable to the many rather than thefew. Personalisation becomes cheap because it is automated, made virtual, and leverages existing digital assets. SoInternet pioneers such as Dell, Yahoo! and Amazon flourished by offering customers what they want, how theywant it, when they want it.
Sales eraOne message broadcast
to all customers
Brand managementDifferent messages
broadcast to each segment
Information eraOne to one interactive messages
to each individual
Figure 10.3 From Broad Messages to Interaction
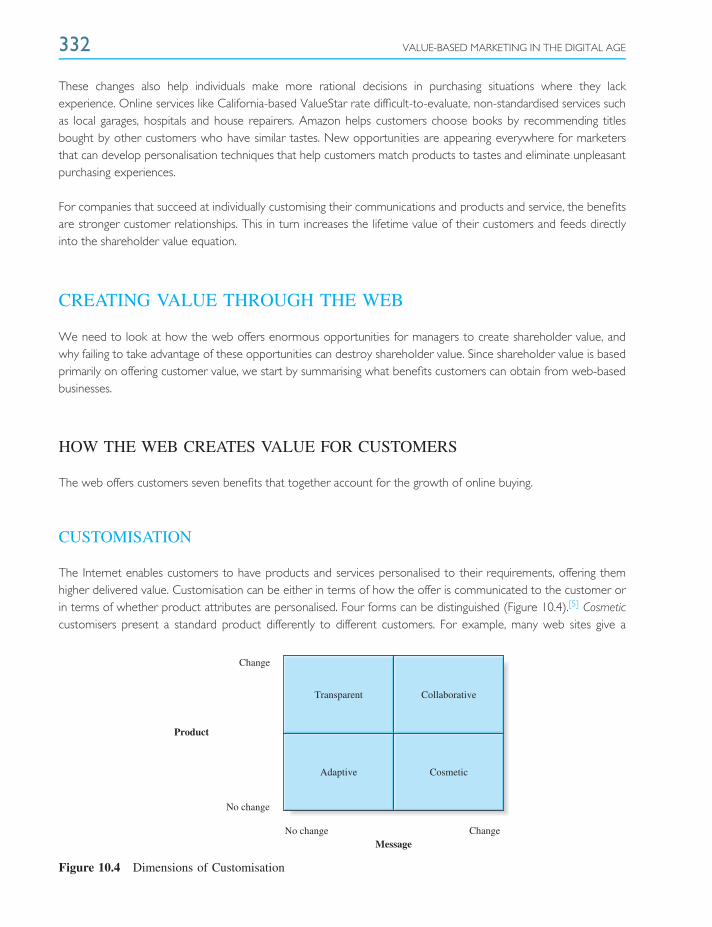
332 VALUE-BASED MARKETING IN THE DIGITAL AGE
These changes also help individuals make more rational decisions in purchasing situations where they lackexperience. Online services like California-based ValueStar rate difficult-to-evaluate, non-standardised services suchas local garages, hospitals and house repairers. Amazon helps customers choose books by recommending titlesbought by other customers who have similar tastes. New opportunities are appearing everywhere for marketersthat can develop personalisation techniques that help customers match products to tastes and eliminate unpleasantpurchasing experiences.
For companies that succeed at individually customising their communications and products and service, the benefitsare stronger customer relationships. This in turn increases the lifetime value of their customers and feeds directlyinto the shareholder value equation.
CREATING VALUE THROUGH THE WEB
We need to look at how the web offers enormous opportunities for managers to create shareholder value, andwhy failing to take advantage of these opportunities can destroy shareholder value. Since shareholder value is basedprimarily on offering customer value, we start by summarising what benefits customers can obtain from web-basedbusinesses.
HOW THE WEB CREATES VALUE FOR CUSTOMERS
The web offers customers seven benefits that together account for the growth of online buying.
CUSTOMISATION
The Internet enables customers to have products and services personalised to their requirements, offering themhigher delivered value. Customisation can be either in terms of how the offer is communicated to the customer orin terms of whether product attributes are personalised. Four forms can be distinguished (Figure 10.4).[5] Cosmeticcustomisers present a standard product differently to different customers. For example, many web sites give a
Change
Change
No change
No change
Transparent Collaborative
CosmeticAdaptive
Message
Product
Figure 10.4 Dimensions of Customisation
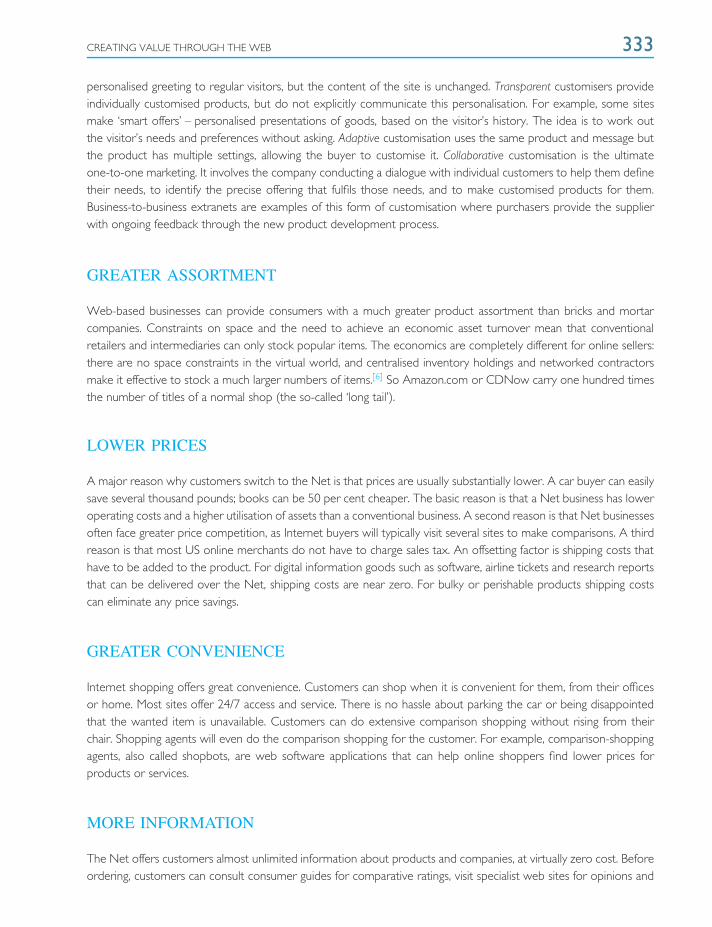
CREATING VALUE THROUGH THE WEB 333
personalised greeting to regular visitors, but the content of the site is unchanged. Transparent customisers provideindividually customised products, but do not explicitly communicate this personalisation. For example, some sitesmake ‘smart offers’ – personalised presentations of goods, based on the visitor’s history. The idea is to work outthe visitor’s needs and preferences without asking. Adaptive customisation uses the same product and message butthe product has multiple settings, allowing the buyer to customise it. Collaborative customisation is the ultimateone-to-one marketing. It involves the company conducting a dialogue with individual customers to help them definetheir needs, to identify the precise offering that fulfils those needs, and to make customised products for them.Business-to-business extranets are examples of this form of customisation where purchasers provide the supplierwith ongoing feedback through the new product development process.
GREATER ASSORTMENT
Web-based businesses can provide consumers with a much greater product assortment than bricks and mortarcompanies. Constraints on space and the need to achieve an economic asset turnover mean that conventionalretailers and intermediaries can only stock popular items. The economics are completely different for online sellers:there are no space constraints in the virtual world, and centralised inventory holdings and networked contractorsmake it effective to stock a much larger numbers of items.[6] So Amazon.com or CDNow carry one hundred timesthe number of titles of a normal shop (the so-called ‘long tail’).
LOWER PRICES
A major reason why customers switch to the Net is that prices are usually substantially lower. A car buyer can easilysave several thousand pounds; books can be 50 per cent cheaper. The basic reason is that a Net business has loweroperating costs and a higher utilisation of assets than a conventional business. A second reason is that Net businessesoften face greater price competition, as Internet buyers will typically visit several sites to make comparisons. A thirdreason is that most US online merchants do not have to charge sales tax. An offsetting factor is shipping costs thathave to be added to the product. For digital information goods such as software, airline tickets and research reportsthat can be delivered over the Net, shipping costs are near zero. For bulky or perishable products shipping costscan eliminate any price savings.
GREATER CONVENIENCE
Internet shopping offers great convenience. Customers can shop when it is convenient for them, from their officesor home. Most sites offer 24/7 access and service. There is no hassle about parking the car or being disappointedthat the wanted item is unavailable. Customers can do extensive comparison shopping without rising from theirchair. Shopping agents will even do the comparison shopping for the customer. For example, comparison-shoppingagents, also called shopbots, are web software applications that can help online shoppers find lower prices forproducts or services.
MORE INFORMATION
The Net offers customers almost unlimited information about products and companies, at virtually zero cost. Beforeordering, customers can consult consumer guides for comparative ratings, visit specialist web sites for opinions and
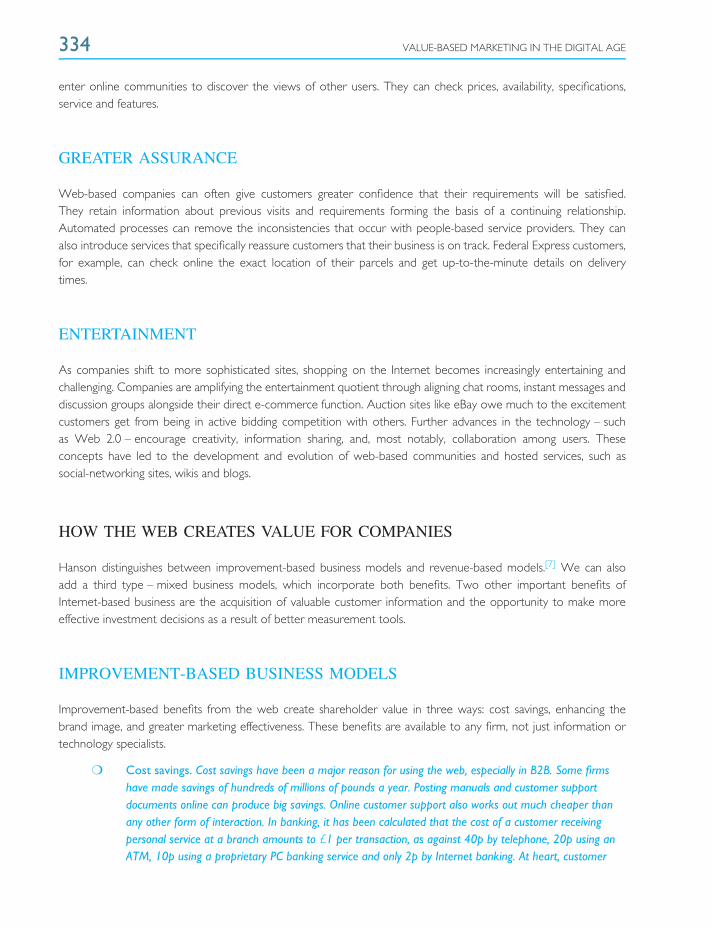
334 VALUE-BASED MARKETING IN THE DIGITAL AGE
enter online communities to discover the views of other users. They can check prices, availability, specifications,service and features.
GREATER ASSURANCE
Web-based companies can often give customers greater confidence that their requirements will be satisfied.They retain information about previous visits and requirements forming the basis of a continuing relationship.Automated processes can remove the inconsistencies that occur with people-based service providers. They canalso introduce services that specifically reassure customers that their business is on track. Federal Express customers,for example, can check online the exact location of their parcels and get up-to-the-minute details on deliverytimes.
ENTERTAINMENT
As companies shift to more sophisticated sites, shopping on the Internet becomes increasingly entertaining andchallenging. Companies are amplifying the entertainment quotient through aligning chat rooms, instant messages anddiscussion groups alongside their direct e-commerce function. Auction sites like eBay owe much to the excitementcustomers get from being in active bidding competition with others. Further advances in the technology – suchas Web 2.0 – encourage creativity, information sharing, and, most notably, collaboration among users. Theseconcepts have led to the development and evolution of web-based communities and hosted services, such associal-networking sites, wikis and blogs.
HOW THE WEB CREATES VALUE FOR COMPANIES
Hanson distinguishes between improvement-based business models and revenue-based models.[7] We can alsoadd a third type – mixed business models, which incorporate both benefits. Two other important benefits ofInternet-based business are the acquisition of valuable customer information and the opportunity to make moreeffective investment decisions as a result of better measurement tools.
IMPROVEMENT-BASED BUSINESS MODELS
Improvement-based benefits from the web create shareholder value in three ways: cost savings, enhancing thebrand image, and greater marketing effectiveness. These benefits are available to any firm, not just information ortechnology specialists.
❍ Cost savings. Cost savings have been a major reason for using the web, especially in B2B. Some firmshave made savings of hundreds of millions of pounds a year. Posting manuals and customer supportdocuments online can produce big savings. Online customer support also works out much cheaper thanany other form of interaction. In banking, it has been calculated that the cost of a customer receivingpersonal service at a branch amounts to £1 per transaction, as against 40p by telephone, 20p using anATM, 10p using a proprietary PC banking service and only 2p by Internet banking. At heart, customer
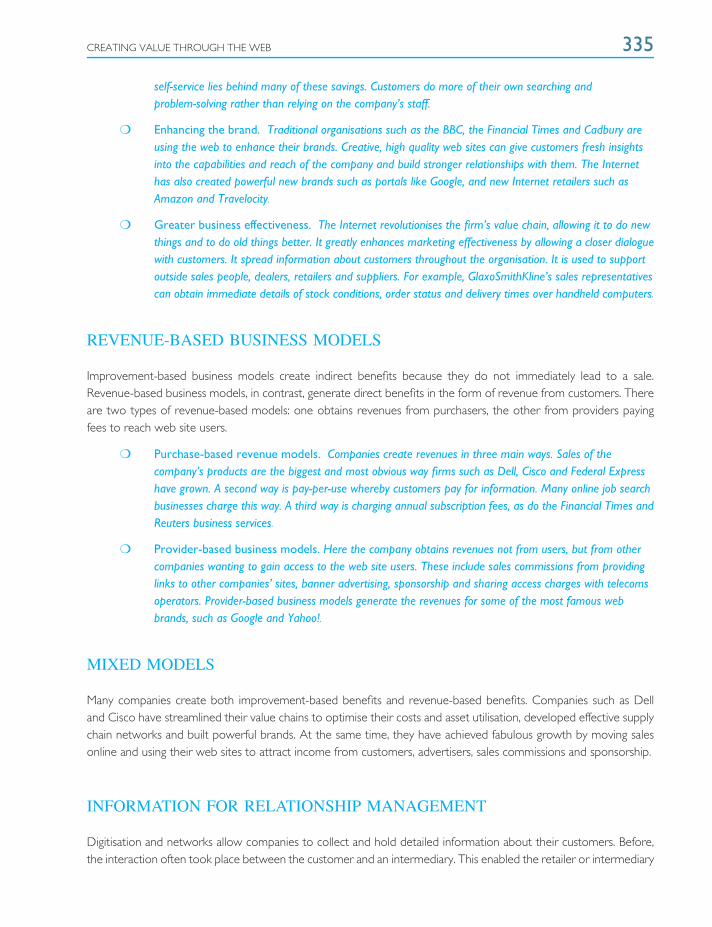
CREATING VALUE THROUGH THE WEB 335
self-service lies behind many of these savings. Customers do more of their own searching andproblem-solving rather than relying on the company’s staff.
❍ Enhancing the brand. Traditional organisations such as the BBC, the Financial Times and Cadbury areusing the web to enhance their brands. Creative, high quality web sites can give customers fresh insightsinto the capabilities and reach of the company and build stronger relationships with them. The Internethas also created powerful new brands such as portals like Google, and new Internet retailers such asAmazon and Travelocity.
❍ Greater business effectiveness. The Internet revolutionises the firm’s value chain, allowing it to do newthings and to do old things better. It greatly enhances marketing effectiveness by allowing a closer dialoguewith customers. It spread information about customers throughout the organisation. It is used to supportoutside sales people, dealers, retailers and suppliers. For example, GlaxoSmithKline’s sales representativescan obtain immediate details of stock conditions, order status and delivery times over handheld computers.
REVENUE-BASED BUSINESS MODELS
Improvement-based business models create indirect benefits because they do not immediately lead to a sale.Revenue-based business models, in contrast, generate direct benefits in the form of revenue from customers. Thereare two types of revenue-based models: one obtains revenues from purchasers, the other from providers payingfees to reach web site users.
❍ Purchase-based revenue models. Companies create revenues in three main ways. Sales of thecompany’s products are the biggest and most obvious way firms such as Dell, Cisco and Federal Expresshave grown. A second way is pay-per-use whereby customers pay for information. Many online job searchbusinesses charge this way. A third way is charging annual subscription fees, as do the Financial Times andReuters business services.
❍ Provider-based business models. Here the company obtains revenues not from users, but from othercompanies wanting to gain access to the web site users. These include sales commissions from providinglinks to other companies’ sites, banner advertising, sponsorship and sharing access charges with telecomsoperators. Provider-based business models generate the revenues for some of the most famous webbrands, such as Google and Yahoo!.
MIXED MODELS
Many companies create both improvement-based benefits and revenue-based benefits. Companies such as Delland Cisco have streamlined their value chains to optimise their costs and asset utilisation, developed effective supplychain networks and built powerful brands. At the same time, they have achieved fabulous growth by moving salesonline and using their web sites to attract income from customers, advertisers, sales commissions and sponsorship.
INFORMATION FOR RELATIONSHIP MANAGEMENT
Digitisation and networks allow companies to collect and hold detailed information about their customers. Before,the interaction often took place between the customer and an intermediary. This enabled the retailer or intermediary
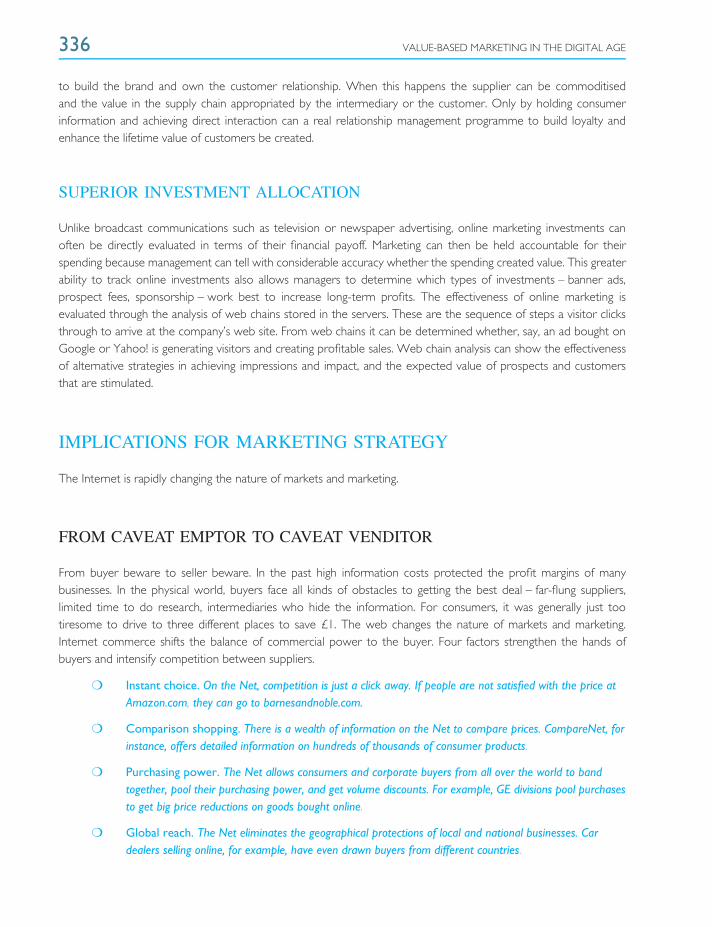
336 VALUE-BASED MARKETING IN THE DIGITAL AGE
to build the brand and own the customer relationship. When this happens the supplier can be commoditisedand the value in the supply chain appropriated by the intermediary or the customer. Only by holding consumerinformation and achieving direct interaction can a real relationship management programme to build loyalty andenhance the lifetime value of customers be created.
SUPERIOR INVESTMENT ALLOCATION
Unlike broadcast communications such as television or newspaper advertising, online marketing investments canoften be directly evaluated in terms of their financial payoff. Marketing can then be held accountable for theirspending because management can tell with considerable accuracy whether the spending created value. This greaterability to track online investments also allows managers to determine which types of investments – banner ads,prospect fees, sponsorship – work best to increase long-term profits. The effectiveness of online marketing isevaluated through the analysis of web chains stored in the servers. These are the sequence of steps a visitor clicksthrough to arrive at the company’s web site. From web chains it can be determined whether, say, an ad bought onGoogle or Yahoo! is generating visitors and creating profitable sales. Web chain analysis can show the effectivenessof alternative strategies in achieving impressions and impact, and the expected value of prospects and customersthat are stimulated.
IMPLICATIONS FOR MARKETING STRATEGY
The Internet is rapidly changing the nature of markets and marketing.
FROM CAVEAT EMPTOR TO CAVEAT VENDITOR
From buyer beware to seller beware. In the past high information costs protected the profit margins of manybusinesses. In the physical world, buyers face all kinds of obstacles to getting the best deal – far-flung suppliers,limited time to do research, intermediaries who hide the information. For consumers, it was generally just tootiresome to drive to three different places to save £1. The web changes the nature of markets and marketing.Internet commerce shifts the balance of commercial power to the buyer. Four factors strengthen the hands ofbuyers and intensify competition between suppliers.
❍ Instant choice. On the Net, competition is just a click away. If people are not satisfied with the price atAmazon.com, they can go to barnesandnoble.com.
❍ Comparison shopping. There is a wealth of information on the Net to compare prices. CompareNet, forinstance, offers detailed information on hundreds of thousands of consumer products.
❍ Purchasing power. The Net allows consumers and corporate buyers from all over the world to bandtogether, pool their purchasing power, and get volume discounts. For example, GE divisions pool purchasesto get big price reductions on goods bought online.
❍ Global reach. The Net eliminates the geographical protections of local and national businesses. Cardealers selling online, for example, have even drawn buyers from different countries.
IMPLICATIONS FOR MARKETING STRATEGY 337
NEW MARKET OPPORTUNITIES
Electronic commerce has created entirely new high-growth markets and new sources of competitive advantage.The main sources of opportunities arise from the following:
❍ Declining market entry barriers. In the physical world new competitors were deterred from entry tomany markets by the scale economies possessed by the incumbents, an inability to obtain distribution orgood locations, established brand names and a lack of information among buyers. In the virtual worldmost of these barriers erode. In industry after industry – computers, travel, books, distribution, financialservices – established leaders are being overtaken by new online entrants.
❍ Deconstructing value chains. The increasing weaknesses of vertically integrated companies – high incosts and assets, inflexible and insufficiently specialist – are forcing companies to unbundle their valuechains and outsource more and more of their products and processes. Such unbundling and the growth ofvirtual companies create an array of opportunities for specialist firms able to contribute products andprocesses to these networked organisations.
❍ Convergence of industries. Common digital technologies and the Internet are leading many industries toconverge. This is most obvious in the computer, communications and content industries. The results arenew market opportunities and a rush of mergers, acquisitions, alliances and partnerships as firms try tocapitalise on the new synergies.
❍ Superior customer value. Online marketing can offer customers superior value through lower prices,greater choice, more convenience and one-to-one communication. These benefits enable companies thatcan quickly capitalise on them to possess differential advantages to outflank established competitors.
NEW MARKETING STRATEGIES
The core of marketing strategy is segmentation and positioning. Segmentation refers to the choice of customersthe firm is targeting for its product or service. Positioning refers to the differential advantage or choice of valueproposition that the firm hopes will attract customers in the chosen market segment to its offer. In the informationenvironment both these dimensions have to change subtly but significantly.
FROM SEGMENTATION TO PERSONALISATION
Only relatively recently has it become possible for companies in mass markets, such as Unilever and Tesco, to obtainand process information on individual consumers. Traditionally, information about consumers has been obtainedthrough sampling. A few hundred or thousand consumers would be interviewed about their attitudes, wants andbuying processes and the results would be partitioned and averaged by profilers such as age, sex, income or,sometimes, lifestyle characteristics. The aim of the market research would be to group customers into a handfulof market segments with similar wants and characteristics. Then products and communications would be aimed ateach of these segment averages. The result would be a compromise – products and messages that met the needsof some consumers better than others. How good or bad the fits were was often not clear since companies didnot obtain direct feedback from individual consumers.
338 VALUE-BASED MARKETING IN THE DIGITAL AGE
Digitisation and networks has made such compromises less necessary. Companies can now enter a dialogue withindividual customers.[8] Of course, for companies with thousands or even millions of customers, investing in detailedinteraction with all of them is not cost effective, so segmentation is still necessary. But the objective of segmentationis different; the aim is to segment not by similarity of needs but rather by the potential lifetime value of the customerto the organisation.
FROM BRAND PROPOSITIONS TO CUSTOMISATION
Traditionally marketing has focused on seeking to develop a unique selling proposition that would give the firm adifferential advantage to a market or market segment. In the networked world competitive advantage is gained notfrom selling an unbeatable proposition to as many people as possible, but from matching the needs of the individualcustomer more precisely. It is about making to order rather than making for orders. The traditional marketing modelhas been based upon maximising the sales of a single product or brand by selling it to as many people as possible.The new model is based upon selling as many products as possible to each individual customer. In the language ofeconomics, economies of scope become more important than economies of scale.[9]
What makes the transformation possible are the new capabilities that today’s information technology provides.Digitally stored databases allow companies to tell customers apart and remember their individual requirements andpurchasing behaviour. Interactive networks allow individual customers to talk to the company and update theirlearning. Mass customisation technology and networked organisations mean companies can increasingly customisetheir products and services at low cost.
What is forcing companies to adapt is that the old business model cannot any longer meet the increasingexpectations of consumers. In attempts to meet the growing variety of consumer needs, suppliers such as Procter& Gamble or Du Pont and retailers and intermediaries such as supermarkets and distributors are being forced tocarry inventories of ever increasing product ranges. A typical supermarket will carry 30 000 stock keeping units, anda supplier might have 100 varieties of steel or shoes. No single customer will want more than a minute fraction ofsuch variety. The modern competitor is unbundling information from supply. The information about the availablevariety is put on the web site, the individual’s requirement is then customised after the order is received, and finallyit is delivered to the home or business.
THE CHANGING MARKETING MIX
Implementing marketing strategies in the information age requires companies to adapt their marketing mix.
PRODUCT POLICY
As discussed in Chapter 6, the demand for more customised products and communications has risen amongcustomers as the technology enables companies to tailor what they offer. Customisation also allows companiesto augment their products and differentiate them. Many products and services such as banking or insurance havebecome commodities. But what can differentiate them and create customer loyalty are personalised additions thatenable them to meet requirements more effectively. These might be 24/7 access, helpful web sites, customisedportfolio planning services or emails on special opportunities.

IMPLICATIONS FOR MARKETING STRATEGY 339
More generally, customisation shifts the company from competing in products to competing in services. Servicesare increasingly a more attractive area in which to compete. In the modern economy the service sector is twicethe size of the goods sector and growing more rapidly. Services too tend to be more profitable. This is becauseproducts are standard and much easier for customers to compare. Also customers do not really believe there ismuch difference in quality between products such as computers, cars or detergents. Because services are hard tostandardise they are more difficult to compare. Buying services is more risky. Customers often use price as anindicator of quality – high price means good service. The car industry is typical. Excess capacity and fierce pricecompetition mean that few car companies make consistent economic profits. In contrast, margins on servicing cars,insuring and renting them are very attractive.
PRICING POLICY
Pricing is certainly even more critical in online markets. Customers have more information about prices than everbefore, which is certain to increase price sensitivity in most markets. Companies seeking to dominate new marketsare using low prices more often. But profits are so sensitive to price that ill-considered aggression can easily destroythe chances of new companies ever creating value for shareholders. (See Chapter 8 for more on pricing.)
COMMUNICATIONS AND PROMOTION
The communications mix companies have employed reflected the traditional trade-off companies have been forcedto make between what Evans and Wurster call ‘richness and reach’.[10] Reach refers to the number of peoplereceiving information. Richness refers to the detail of the information and whether it can be customised througha dialogue between buyer and seller. Some communications media, such as TV advertising, allow high reach butsacrifice richness. Others, such as a sales force, allow richness but are too expensive to achieve high reach. Witha given communications budget, managers choose a communications mix to achieve the best combination on thebudget line (Figure 10.5). The significance of the Net is that it promises to enable much higher levels of reachwithout sacrificing richness. As such it is leading to significant changes in the communications mix.
Reach
Traditionaltrade-off
Ric
hnes
s
The Internet offersnew levels of
richness and reachin communications
Figure 10.5 The Change in the Richness/Reach Trade-Off
340 VALUE-BASED MARKETING IN THE DIGITAL AGE
Traditional advertising is a high-reach, low-richness medium since it employs a one-to-many communications modelthat allows only limited forms of feedback from the customer. The Internet operationalises a model that facilitatesinteractive multimedia one-to-one communication – a rich form of communication. Online communications differ inanother important way. With conventional advertising the message is sent by the seller to customers, but with onlinecommunications the customer has to seek out the supplier’s message. Online communications are self-selecting; thecustomer must be motivated to want to read the supplier’s communication.
Online advertising possesses a number of advantages. One is that the advertiser can target the most valuablecustomers and not waste money on unproductive reach. This is achieved by having the ad appear only to customerswith particular socio-demographic profiles, or who key in relevant words when using search engines. Increasinglyadvertisers can target promotions and ads on a one-to-one basis and thus build rich interactive relationships withusers, one at a time. This is achieved through the personal information the user supplies when registering with a siteor through ‘cookies’ – small data files stored on the user’s hard disk, which reveal to the supplier the user’s searchpatterns. Another strength of web communications is its ability to provide extensive product information, unliketraditional media. Finally, online advertising creates the opportunity for immediate interaction with customers, eitherby providing more information or completing an online order.
DISTRIBUTION
Digitisation and networks have major implications for how companies organise their distribution. The two primaryfunctions of retailers and distributors are providing information (about availability, prices, the suitability of alternativeproducts etc.) and supplying goods. The traditional logic of using intermediaries is that since the supplier has only alimited number of products, while customers desire a vast number of different products and services, it would behopelessly inefficient for each producer to go to each customer, and vice versa. This is illustrated in Figure 10.6,which shows three producers, a farmer, a food processor and a beverage manufacturer, marketing to ten consumers.If there are no intermediaries, as in scenario A, then the costs of thirty separate contacts have to be paid. But withan intermediary, only thirteen contacts are required.
The Net changes this logic by permitting the separation of the economics of information from that of products.Over the Net companies and customers can interact at almost zero cost, so the model of scenario A is viable.What makes the direct model attractive to consumers is the potential of lower prices, greater assortment, moreconvenience and customised service. What makes it attractive to suppliers is lower costs, competitive advantage andthe value-enhancing opportunities that accrue from a direct relationship with the customer. Many online marketersstill need to handle the physical distribution of their goods. But when this is separated from the information functionit can normally be handled from one or a small number of central distribution points, often by third parties like DHLor UPS.
This change offers disintermediation opportunities and with it big cost savings. For example, if airlines do directbooking and ticketing on the Internet they save agency commissions of at least 10 per cent. For an airline issuinga million tickets a year this amounts to a saving of around £40 million. A computer company selling direct cansave around £200 per machine by eliminating the retailer. The network world is also creating opportunities forintermediaries to help buyers steer their way through the deluge of information.
The most exciting distribution breakthroughs are for digital products such as software that can be downloaded fromthe Internet as more products become digitised, such as music and films. More troublesome are physical products
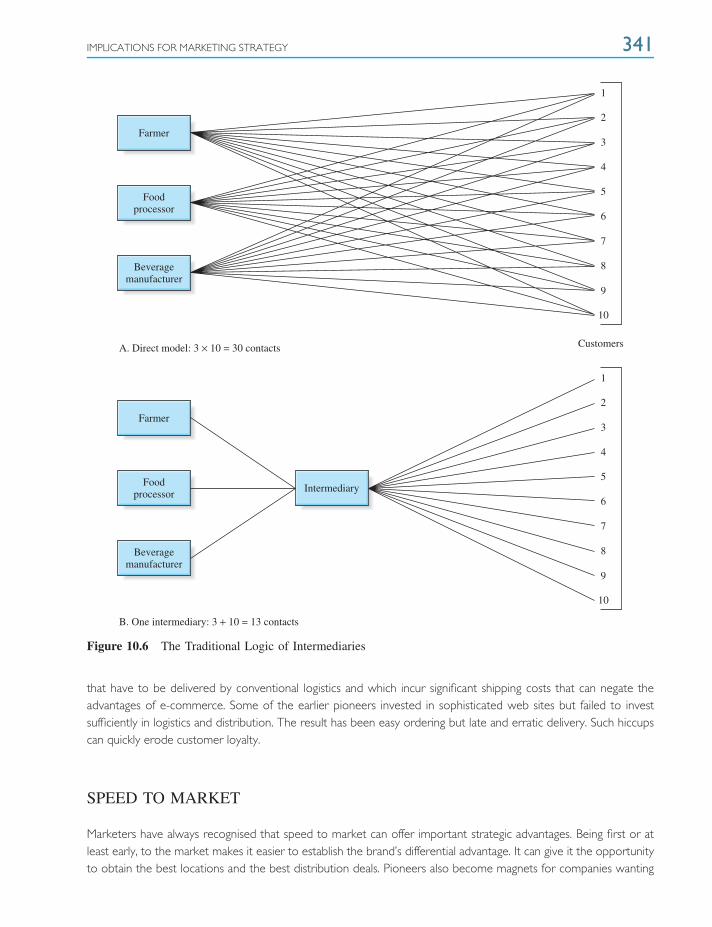
IMPLICATIONS FOR MARKETING STRATEGY 341
Farmer
Foodprocessor
Beveragemanufacturer
Farmer
Foodprocessor
Intermediary
Customers
1
2
3
4
5
6
7
8
9
10
1
2
3
4
5
6
7
8
9
10
Beveragemanufacturer
B. One intermediary: 3 + 10 = 13 contacts
A. Direct model: 3 × 10 = 30 contacts
Figure 10.6 The Traditional Logic of Intermediaries
that have to be delivered by conventional logistics and which incur significant shipping costs that can negate theadvantages of e-commerce. Some of the earlier pioneers invested in sophisticated web sites but failed to investsufficiently in logistics and distribution. The result has been easy ordering but late and erratic delivery. Such hiccupscan quickly erode customer loyalty.
SPEED TO MARKET
Marketers have always recognised that speed to market can offer important strategic advantages. Being first or atleast early, to the market makes it easier to establish the brand’s differential advantage. It can give it the opportunityto obtain the best locations and the best distribution deals. Pioneers also become magnets for companies wanting
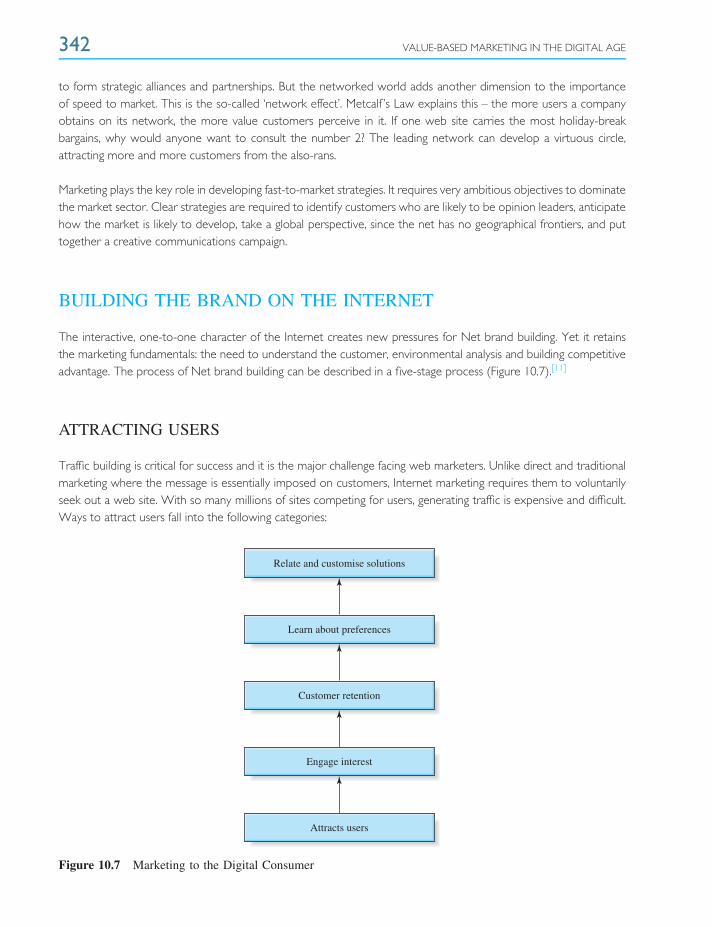
342 VALUE-BASED MARKETING IN THE DIGITAL AGE
to form strategic alliances and partnerships. But the networked world adds another dimension to the importanceof speed to market. This is the so-called ‘network effect’. Metcalf ’s Law explains this – the more users a companyobtains on its network, the more value customers perceive in it. If one web site carries the most holiday-breakbargains, why would anyone want to consult the number 2? The leading network can develop a virtuous circle,attracting more and more customers from the also-rans.
Marketing plays the key role in developing fast-to-market strategies. It requires very ambitious objectives to dominatethe market sector. Clear strategies are required to identify customers who are likely to be opinion leaders, anticipatehow the market is likely to develop, take a global perspective, since the net has no geographical frontiers, and puttogether a creative communications campaign.
BUILDING THE BRAND ON THE INTERNET
The interactive, one-to-one character of the Internet creates new pressures for Net brand building. Yet it retainsthe marketing fundamentals: the need to understand the customer, environmental analysis and building competitiveadvantage. The process of Net brand building can be described in a five-stage process (Figure 10.7).[11]
ATTRACTING USERS
Traffic building is critical for success and it is the major challenge facing web marketers. Unlike direct and traditionalmarketing where the message is essentially imposed on customers, Internet marketing requires them to voluntarilyseek out a web site. With so many millions of sites competing for users, generating traffic is expensive and difficult.Ways to attract users fall into the following categories:
Relate and customise solutions
Learn about preferences
Customer retention
Engage interest
Attracts users
Figure 10.7 Marketing to the Digital Consumer
BUILDING THE BRAND ON THE INTERNET 343
❍ Domain names. A good domain name can be an important traffic builder. The domain name is theaddress that customers use to find a web site. Like a brand name, a successful domain name should beeasy to recall and be related to the positioning of the brand. Examples include Cocacola.com, Hyatt.comand Lastminute.com. Well-chosen names make it easy for users to remember and find the site withouthaving to rely on search engines.
❍ Portals. If a potential customer does not know the domain name, a search engine or directory such asGoogle or Yahoo! is the usual next step. The problem, and one which is frustrating to the user, is that asearch will often list thousands of entries. If the desired site does not appear in the first dozen entriesmany users will give up. Such factors mean that ambitious online marketers are actively engaged in searchengine optimisation, a process of improving the volume and quality of traffic to a web site from searchengines.
❍ Publicity and word-of-mouth. Publicity and word-of-mouth are highly effective in generating users. TheNet amplifies the speed of feedback from users to potential adopters: emails, online forums anddiscussion groups can quickly spread good or bad news about a site (see box, ‘Intel Finds Bad NewsTravels Fast’). Word-of-mouth follows the same dynamics as Metcalf’s Law, diffusing through the networkof individuals who communicate with one another. A well-designed marketing strategy targeting opinionleaders can be highly productive for diffusing information about a new site.
Intel Finds Bad News Travels Fast
In 1994 a newly released Intel Pentium chip contained a bug that made certain complex calculations come outwrong. An early adopter – a US maths professor – noticed the flaw during his research. After emails documentingthe problems were rebuffed by Intel, the professor posted the email correspondence on a CompuServe bulletinboard. There they started a forest fire of comment, discussion, further examples and publicity. By the time Intel hadworked out a proper response, the story had become front-page news internationally, a target of late-night jokesand a serious blow to Intel’s reputation. Mishandling of the early problem eventually led to a very expensive productrecall with compensation that cost Intel millions. Ironically, this eventually proved beneficial to the company. Theextensive media coverage turned what was a technology brand into one recognised by millions of consumers andencouraged the company to change some of its business practices to be more end-user focused. The ‘Intel Inside’campaign also helped transform perception of the Intel brand.
❍ Banners and buttons. These are ads which encourage users to click through to the advertiser’s site. Theyinclude pay-per-click, pop-up ads and live banners which change content in real time. Banner ads have theadvantage that their effectiveness can be measured, which facilitates trial and experimentation. But thereis still scepticism about the effectiveness of this form of advertising because of what can be lowclick-through rates.
❍ Traditional advertising media. Even new online companies can be heavy users of traditional advertisingmedia. This can be more effective because target users are still not heavy users of the Internet. TV andradio are highly effective for creatively developing new brands, and newspaper ads allow the presentationof a high level of content. Particularly with B2C brands, it is difficult to create quick awareness withoutusing traditional media. In addition, with web addresses increasingly integrated into them, traditional adshave direct traffic building effects.
344 VALUE-BASED MARKETING IN THE DIGITAL AGE
ENGAGING INTEREST
Once users have been attracted to a site it is essential to capture their interest and attention, otherwise they clickout without looking at more than a couple of pages. The objective is to increase the visit duration. The longer theduration, the more time there is to communicate the messages of the site, the more chance to build commitmentand loyalty, and the more opportunity to expose the user to advertising or alliance partners.
Interest is a function of the creativity of the site and the quality of its content. Creative site programming is increasinglyessential to engage users. Simple sites that transfer content from conventional brochures or advertising do not workbecause they fail to create interaction. Successful sites are interactive, easy to use and entertaining. Simple guidancethrough the site is important. Users have limited tolerance for inappropriate material before abandoning their visit.
Content, or the substance of the site, is even more important. A web site must have a perceived differentialadvantage to engage users’ interest. This may be a reputation for offering more bargains than competitive sites,greater variety or superior customisation. Being fast to market, and creating the largest network, can be key ways tocreate and sustain such a differential advantage.
Another technique for creating user interest is the development of online communities.[12] These bring togetherusers of the firm’s products or services to share ideas and applications. For example, GM has an online communityfor Saturn car owners to find and communicate with one another, while Nike has channelled investment awayfrom traditional advertising and into non-traditional activities such as online communities, workout advice and sportscompetition in order to be able to interact with customers when they are online by enhancing the experience andservices it offers.
CUSTOMER RETENTION
Because winning new customers is so difficult and expensive, retaining them becomes even more valuable. Theenormous value of high retention to the cost of building a web site and the chance it has of becoming successful iseasy to demonstrate.
Suppose a new web site has 50 000 active users and aims to grow to 100 000. It decides to run a banner advertisingcampaign costing £20 per thousand impressions and the click-through rate is estimated at 2 per cent. The cost foracquiring each new visitor is then £1. It decides to buy 1 million banner impressions each month until its objectiveis reached. Table 10.1 shows how the cost and time to build a successful site increase if retention rates are low. Ifretention were 100 per cent, so that all new visitors became loyal users, it would cost £70 000 and take 2.5 monthsto reach the 100 000-user target. With a 90 per cent retention rate it costs £100 000 and takes 4 months. Thelower the retention rate the higher the cost and the longer the time needed to reach the goal. With retention ratesbelow 80 per cent the objective can never be reached with this strategy.
Achieving high retention is about maintaining ongoing contact with users. Engaging a visitor’s initial interest andmaintaining loyalty are subtly different problems. Customers can visit a site initially out of curiosity but they will notreturn without a reason. To achieve high retention, the first requirement is for the content to be strong and keptcontinually up-to-date. Developing an effective online site is not a one-off project, but requires continued resourcecommitments over time. Many companies have seriously underestimated the costs of maintaining fresh ongoingcontent. One way companies seek to manage costs is by outsourcing web site maintenance to specialist third
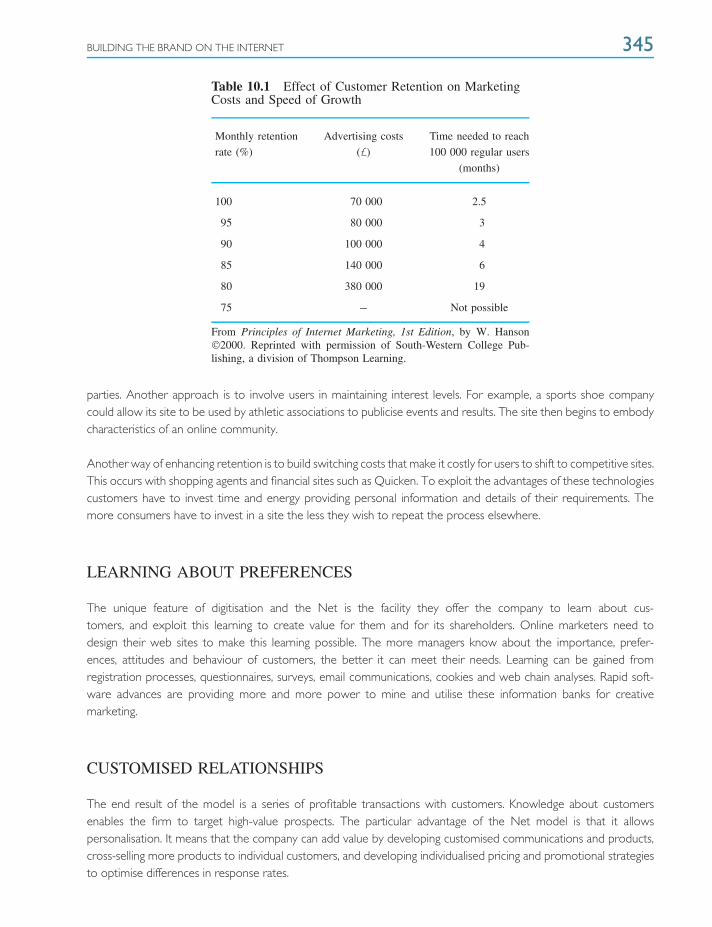
BUILDING THE BRAND ON THE INTERNET 345
Table 10.1 Effect of Customer Retention on MarketingCosts and Speed of Growth
Monthly retention Advertising costs Time needed to reach
rate (%) (£) 100 000 regular users
(months)
100 70 000 2.5
95 80 000 3
90 100 000 4
85 140 000 6
80 380 000 19
75 − Not possible
From Principles of Internet Marketing, 1st Edition, by W. Hanson2000. Reprinted with permission of South-Western College Pub-lishing, a division of Thompson Learning.
parties. Another approach is to involve users in maintaining interest levels. For example, a sports shoe companycould allow its site to be used by athletic associations to publicise events and results. The site then begins to embodycharacteristics of an online community.
Another way of enhancing retention is to build switching costs that make it costly for users to shift to competitive sites.This occurs with shopping agents and financial sites such as Quicken. To exploit the advantages of these technologiescustomers have to invest time and energy providing personal information and details of their requirements. Themore consumers have to invest in a site the less they wish to repeat the process elsewhere.
LEARNING ABOUT PREFERENCES
The unique feature of digitisation and the Net is the facility they offer the company to learn about cus-tomers, and exploit this learning to create value for them and for its shareholders. Online marketers need todesign their web sites to make this learning possible. The more managers know about the importance, prefer-ences, attitudes and behaviour of customers, the better it can meet their needs. Learning can be gained fromregistration processes, questionnaires, surveys, email communications, cookies and web chain analyses. Rapid soft-ware advances are providing more and more power to mine and utilise these information banks for creativemarketing.
CUSTOMISED RELATIONSHIPS
The end result of the model is a series of profitable transactions with customers. Knowledge about customersenables the firm to target high-value prospects. The particular advantage of the Net model is that it allowspersonalisation. It means that the company can add value by developing customised communications and products,cross-selling more products to individual customers, and developing individualised pricing and promotional strategiesto optimise differences in response rates.
346 VALUE-BASED MARKETING IN THE DIGITAL AGE
FUTURE PERSPECTIVES
The Internet represents such a paradigm shift for every business that it is worth summarising how management, andparticularly marketing, needs to respond. Nine recommendations are presented under four areas: the new contextof business, the new strategic priorities, the implications for value-based marketing and the implications for businessorganisation.
RECOGNISE THE NEW CONTEXT OF BUSINESS
1. THE INTERNET CHANGES EVERYTHING
The Internet, by creating instantaneous, universal and almost free communications, changes the whole nature ofbusiness. It destroys the traditional model of business that links information to products. It unbundles industries,triggers new, better adapted competition and creates new distribution structures. The first industries to betransformed have been the ‘low touch’ industries such as computers, books, CDs, travel and financial services. Buteven ‘high touch’ businesses such as clothing, shoes and groceries are now feeling the impact. Here the effects aremost immediate on the way the Internet is reengineering supply chains, cutting costs and accelerating asset turnover.It needs to be remembered that while online business-to-consumer commerce causes the most excitement, it is inbusiness-to-business trade where the effects of the Internet are greatest.
2. REENGINEER THE BUSINESS MODEL
The Internet is not an innovation that can be adapted to simply by improving the efficiency of the traditional businessmodel or by adding a web site. It is what is termed a ‘disruptive technology’ that destroys previously successfulbusiness models.[13] Many businesses need to change radically because what were once assets have becomeliabilities. Today, survival often means having to compete with, and cannibalise, one’s traditional business model.
3. CUSTOMISE MARKETING
The Internet is most of all a marketing phenomenon, shifting power to customers, giving them much more accessto competitors, to lower prices and better products and services. Indeed, it is spawning a whole new class ofinfomediaries and exchanges whose sole function is giving buyers more information and helping them get thebest deals. The web is a threat because it is the customer – not the marketer – who decides whether to interactand who to interact with. The web is an opportunity, however, for companies that grasp the new possibilities tocustomise their products to the needs of individual consumers and so form enduring relationships.
CHANGING THE STRATEGY
4. THINK OUTSIDE THE BOX
Changing strategy is not just about selling through the web; it is about thinking creatively about the industry’s wholevalue chain and the company’s entire business processes. It means reappraising customer service and support and
FUTURE PERSPECTIVES 347
looking at how the Internet might offer radically new ways of communicating with customers, enhancing service levelsand ensuring a better experience. Operations processes will have to be reengineered to permit the introductionof customised made-to-order products, to lower inventories and cut costs. New product development needs tobe reviewed to expedite processes and consider new, unrelated products that could be cross-marketed to thecustomer base.
5. MOVE FAST
Competitors move fast in Internet time. When Amazon moved into selling CDs online it took just 45 days tobecome market leader; it took only nine days to seize leadership in video sales. Slow movers can find their marketpositions destroyed before they have even put together a plan. To move fast companies have to outsource muchmore radically. There are now hosts of Internet specialists and contract manufacturers that can develop and hostthe site, make-to-order and handle distribution. Tomorrow’s businesses are network organisations.
6. TAKE AN OFFENSIVE POSTURE
It is not enough to be first into the market; strategies have to be developed and resources obtained to exploit thefirst-mover advantage and critical mass. In the networked world, customers often attach the greatest value to thesites that have most users.
RESTRUCTURING THE ORGANISATION
7. BUILD NETWORKS
New economy firms are built around networks. The information revolution has made vertical integration unnecessaryand the speed of change has made it uneconomic. Creating virtual businesses with suppliers and partners offersspeed, pooled expertise, lower costs and lower asset requirements. Using digital technology to form networks withcustomers creates relationships that build lifetime value out of expensively obtained assets.
8. INVEST IN HUMAN CAPITAL
The Internet revolutionises communications inside organisations, making bureaucratic structures obsolete andreleasing human capital. It also makes employees with exceptional skills more marketable. If organisations are goingto hold on to these people they will need to rethink payment systems and tie rewards more closely to the valueemployees create, and also make their work environments more rewarding.
9. MAKE MANAGERS RESPONSIBLE
Top management has to take responsibility for building a culture that recognises that creating value depends uponinnovation, marketing and growth rather than cost-cutting and downsizing. They have to build planning processes
348 VALUE-BASED MARKETING IN THE DIGITAL AGE
that stimulate the development of such strategies. Finally, they need to introduce evaluation and reward systemsthat help implement such strategies and reinforce the behaviour of managers.
SUMMARY
1. The Internet is a ‘discontinuous change’ that is leading to a fundamental restructuring in all industries. Thethree sources of this shift are the increasing power and declining costs of digital technology, the explosion ofconnectedness brought about by the Internet, and the new opportunities to customise communications andproducts.
2. The web creates benefits for customers by facilitating companies to offer individualised solutions totheir needs, lower prices, greater convenience, more information, assurance and entertainment. The mostimmediate impact has been on ‘low touch’ markets such as computers and business-to-business purchases,but in the longer run few markets will remain unaffected.
3. The web creates direct benefits for companies by creating new opportunities to gain market share and earnrevenues. It also produces major indirect benefits in lowering costs, reducing investment requirements andenhancing business effectiveness.
4. The information revolution has major implications for marketing strategy. It changes the context of marketsby increasing the power of customers over suppliers. It creates new marketing opportunities and leads toways of thinking about segmentation and positioning. By breaking the trade-off between richness and reachit also leads to a reformulation of the marketing mix, emphasising direct one-to-one communications.
REVIEW QUESTIONS
1. What are the drivers of the Internet revolution and how might the Internet be characterised?2. How does the Internet create value for consumers?3. How can the Internet create value for companies?4. How does the Internet affect marketing strategy?5. Develop the outline of a presentation to the board of directors of a large consumer goods company
suggesting how they need to respond to the Internet.
NOTES ON CHAPTER 10
[1] Robert Hiebeler, Thomas Kelly and Charles Ketteman, Best Practices: Building your Business with Customer-FocussedSolutions, New York : Simon & Schuster, 1998.
[2] For more on how transactions costs shape businesses see Larry Downes and Chunka Mui, Unleashing the KillerApp: Digital Strategies for Market Dominance, Boston, MA: Harvard Business School Press, 1998, pp. 35–56.
[3] Figures 10.2 and 10.3 are adapted from a presentation by Keith Beddell-Pearce, executive director of Prudentialplc, at the Warwick Business School, March 2000.
NOTES ON CHAPTER 10 349
[4] John Hagel III and Marc Singer, Net Worth, New York: McKinsey & Co, 1999.
[5] James H. Gilmore and B. Joseph Pine II, Every Business a Stage: Why Customers Now Want Experiences, Boston,MA: Harvard Business School Press, 1999, p. 95.
[6] For a good discussion of this, see Chris Anderson, The Long Tail: Why the Future of Business is Selling Less ofMore, Hyperion, 2006.
[7] Ward Hanson, Principles of Internet Marketing, Cincinnati, OH: South Western, 2000, pp. 126–127.
[8] For convenience, the words ‘consumer’ and ‘customer’ are being used virtually synonymously. It should beremembered, as emphasised in Chapter 3, that purchasing is generally a networked activity involving several membersof the household or organisation. Marketers need to understand the whole buying process and experience. SeeRobin Wensley, The MSI priorities: a critical view of researching firm performance, customer experience andmarketing, Journal of Marketing Management, 16, April, 2000, 11–27.
[9] The earliest and most complete exposition of this change is Don Peppers and Martha Rogers, EnterpriseOne-to-One: Tools for Building Unbreakable Customer Relationships in the Interactive Age, London: Piatkus, 1997; seealso Fred Wiersema, Customer Intimacy, London: HarperCollins, 1998. See also: Cliff Allen, Deborah Kania, BethYaechel, One-to-One Web Marketing: Build a Relationship Marketing Strategy One Customer at a Time, John Wiley &Sons, Inc, 2001 (2nd edition).
[10] Philip Evans and Thomas S. Wurster, Blown to Bits: How the New Economics of Information Transforms Strategy,Boston, MA: Harvard Business School Press, 2000.
[11] This model is adapted from Alexa Kierzkowski, Shayne McQuade, Robert Waitman and Michael Zeisser,Marketing to the digital consumer, McKinsey Quarterly, no. 3, 1996, 5–21.
[12] John Hagel III and Arthur Armstrong, Net Gain: Expanding Markets through Virtual Communities, Boston, MA:Harvard Business School Press, 1997.
[13] Clayton M. Christensen and Michael Overdorf, Meeting the challenge of disruptive change, Harvard BusinessReview, 78(2), March/April 2000, 66–77.
Glossary
Book equity. The value of shareholders’ funds as recorded in the published accounts of the business. It contrastswith the ‘market value’ of equity, which is its actual value as reflected in the market price of the business.
Cost of capital. This is the opportunity cost, or expected return, that investors forgo by investing in the companyrather than in other comparable shares.
Discounted cash flow (DCF). Future cash flows multiplied by the discount factor to obtain the present value of thecash flows.
Discount factor. Present value of £1 received at a stated future date. It is calculated as 1/(1 + r)t where r is thediscount rate and t is the year.
Discount rate. Rate used to calculate the present value of future cash flows.
Intangible asset. Non-material asset such as technical expertise, brand or patent.
Market-to-book ratio. The market value of the business divided by the book equity value.
Net present value. The net contribution of a strategy to the wealth of shareholders: present value of cash flowsminus initial investment.
Option. Option to buy an asset at a specified exercise price on or before a specified date.
Perpetuity. Investment offering a level stream of cash flow in perpetuity.
Present value method. The technique for comparing alternative strategies in terms of the present value of theircash flows discounted by the cost of capital.
Price/earnings ratio (P/E). Market price of the share divided by earnings per share.
Return on investment (ROI). Generally, book profits as a proportion of net book value.
Return on equity (ROE). Generally, equity earnings as a proportion of the book value of equity.
Risk premium. Expected additional return for making a risky investment rather than a safe one.
Tangible asset. Physical asset such as plant, machinery and offices.
Working capital. Net current assets, i.e. current assets less current liabilities.
Yield. The percentage which earnings per share bears to the share price.
The Advisory Board
TIM AMBLER
Tim Ambler joined London Business School in 1991 and is a Senior Fellow. His research includes brands and brandequity, neuro marketing, measuring marketing performance, advertising and promotions, measuring governmentregulation and deregulation.
His publications include Marketing and the Bottom Line: Health Drives Wealth (FT/Prentice Hall, 2nd ed., 2003); DoingBusiness in China (with Morgen Witzel, Routledge, 2nd edn, 2003); The SILK Road to International Marketing (withChris Styles, FT/Prentice Hall, 2000); Marketing from Advertising to Zen (Financial Times Guide, FT/Pitman, 1996);and articles on advertising effectiveness. He was previously Joint Managing Director of International Distillers andVintners (IDV – now part of Diageo), responsible for strategy, acquisitions and marketing. He holds a Master’sdegree in mathematics from Oxford and in business from the Sloan School at MIT. He is a qualified charteredaccountant.
MICHAEL J. BAKER
Professor Emeritus Michael J. Baker of University of Strathclyde Business School was Founding Professor of Marketingand Head of the Department from its inception in 1971 to 1988. After serving as Dean of the School of BusinessAdministration/Strathclyde Business School, 1978–84, he was appointed as Deputy Principal in 1984, DeputyPrincipal (Management) in 1988 and Senior Adviser to the Principal in 1991, Emeritus 1999. He is Former Chairmanof Scottish Business Education Council (SCOTBEC), past Chairman of the Institute of Marketing and Governor ofthe CAM Foundation.
He has been President of the Academy of Marketing and Founding Dean, Senate of the Chartered Institute ofMarketing, among a number of other professorial appointments. He is author/editor of over 40 books, includingMarketing (7th edn, 2006), Marketing: Theory and Practice (3rd edn, 1996), Dictionary of Advertising and Marketing(3rd edn, 1998) and Marketing Strategy and Management (4th edn, 2008). He is the winner of the Institute ofMarketing’s Gold Medal and designated Author of the Year 1978 for a paper entitled Export Myopia and author ofover 150 articles and papers.
TONY CRAM
Tony Cram joined Ashridge Business School in 1992. As a Programme Director, he designs and delivers programmeson business strategy and market innovation. His particular interests are understanding customer value, developingbrands and the dynamics of long-term business relationships. He works internationally with experience in Europe,Asia and the Americas.
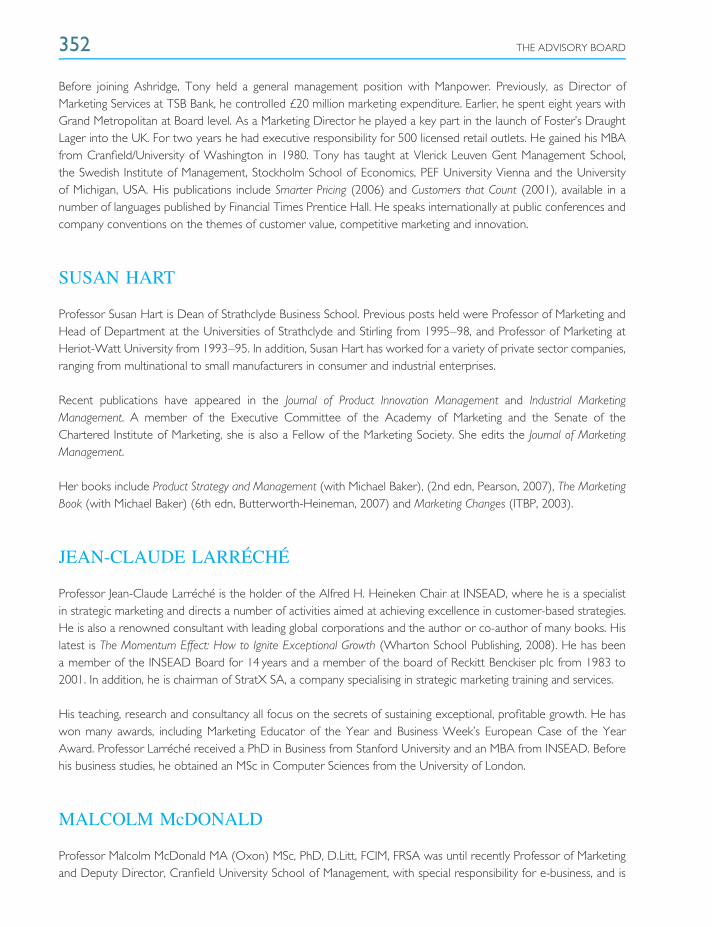
352 THE ADVISORY BOARD
Before joining Ashridge, Tony held a general management position with Manpower. Previously, as Director ofMarketing Services at TSB Bank, he controlled £20 million marketing expenditure. Earlier, he spent eight years withGrand Metropolitan at Board level. As a Marketing Director he played a key part in the launch of Foster’s DraughtLager into the UK. For two years he had executive responsibility for 500 licensed retail outlets. He gained his MBAfrom Cranfield/University of Washington in 1980. Tony has taught at Vlerick Leuven Gent Management School,the Swedish Institute of Management, Stockholm School of Economics, PEF University Vienna and the Universityof Michigan, USA. His publications include Smarter Pricing (2006) and Customers that Count (2001), available in anumber of languages published by Financial Times Prentice Hall. He speaks internationally at public conferences andcompany conventions on the themes of customer value, competitive marketing and innovation.
SUSAN HART
Professor Susan Hart is Dean of Strathclyde Business School. Previous posts held were Professor of Marketing andHead of Department at the Universities of Strathclyde and Stirling from 1995–98, and Professor of Marketing atHeriot-Watt University from 1993–95. In addition, Susan Hart has worked for a variety of private sector companies,ranging from multinational to small manufacturers in consumer and industrial enterprises.
Recent publications have appeared in the Journal of Product Innovation Management and Industrial MarketingManagement. A member of the Executive Committee of the Academy of Marketing and the Senate of theChartered Institute of Marketing, she is also a Fellow of the Marketing Society. She edits the Journal of MarketingManagement.
Her books include Product Strategy and Management (with Michael Baker), (2nd edn, Pearson, 2007), The MarketingBook (with Michael Baker) (6th edn, Butterworth-Heineman, 2007) and Marketing Changes (ITBP, 2003).
JEAN-CLAUDE LARRECHE
Professor Jean-Claude Larreche is the holder of the Alfred H. Heineken Chair at INSEAD, where he is a specialistin strategic marketing and directs a number of activities aimed at achieving excellence in customer-based strategies.He is also a renowned consultant with leading global corporations and the author or co-author of many books. Hislatest is The Momentum Effect: How to Ignite Exceptional Growth (Wharton School Publishing, 2008). He has beena member of the INSEAD Board for 14 years and a member of the board of Reckitt Benckiser plc from 1983 to2001. In addition, he is chairman of StratX SA, a company specialising in strategic marketing training and services.
His teaching, research and consultancy all focus on the secrets of sustaining exceptional, profitable growth. He haswon many awards, including Marketing Educator of the Year and Business Week’s European Case of the YearAward. Professor Larreche received a PhD in Business from Stanford University and an MBA from INSEAD. Beforehis business studies, he obtained an MSc in Computer Sciences from the University of London.
MALCOLM McDONALD
Professor Malcolm McDonald MA (Oxon) MSc, PhD, D.Litt, FCIM, FRSA was until recently Professor of Marketingand Deputy Director, Cranfield University School of Management, with special responsibility for e-business, and is
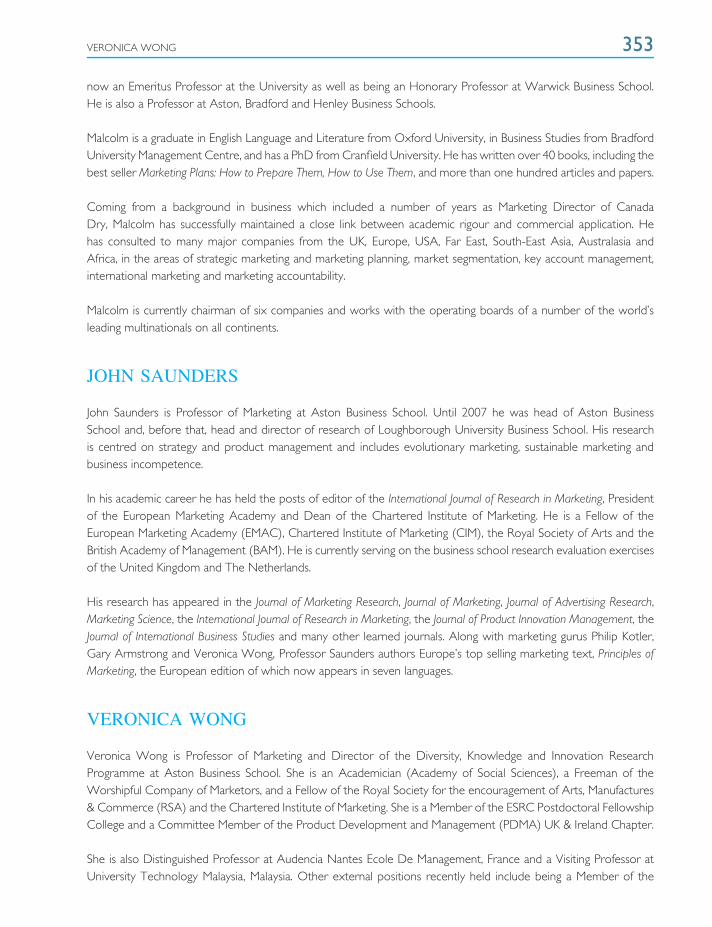
VERONICA WONG 353
now an Emeritus Professor at the University as well as being an Honorary Professor at Warwick Business School.He is also a Professor at Aston, Bradford and Henley Business Schools.
Malcolm is a graduate in English Language and Literature from Oxford University, in Business Studies from BradfordUniversity Management Centre, and has a PhD from Cranfield University. He has written over 40 books, including thebest seller Marketing Plans: How to Prepare Them, How to Use Them, and more than one hundred articles and papers.
Coming from a background in business which included a number of years as Marketing Director of CanadaDry, Malcolm has successfully maintained a close link between academic rigour and commercial application. Hehas consulted to many major companies from the UK, Europe, USA, Far East, South-East Asia, Australasia andAfrica, in the areas of strategic marketing and marketing planning, market segmentation, key account management,international marketing and marketing accountability.
Malcolm is currently chairman of six companies and works with the operating boards of a number of the world’sleading multinationals on all continents.
JOHN SAUNDERS
John Saunders is Professor of Marketing at Aston Business School. Until 2007 he was head of Aston BusinessSchool and, before that, head and director of research of Loughborough University Business School. His researchis centred on strategy and product management and includes evolutionary marketing, sustainable marketing andbusiness incompetence.
In his academic career he has held the posts of editor of the International Journal of Research in Marketing, Presidentof the European Marketing Academy and Dean of the Chartered Institute of Marketing. He is a Fellow of theEuropean Marketing Academy (EMAC), Chartered Institute of Marketing (CIM), the Royal Society of Arts and theBritish Academy of Management (BAM). He is currently serving on the business school research evaluation exercisesof the United Kingdom and The Netherlands.
His research has appeared in the Journal of Marketing Research, Journal of Marketing, Journal of Advertising Research,Marketing Science, the International Journal of Research in Marketing, the Journal of Product Innovation Management, theJournal of International Business Studies and many other learned journals. Along with marketing gurus Philip Kotler,Gary Armstrong and Veronica Wong, Professor Saunders authors Europe’s top selling marketing text, Principles ofMarketing, the European edition of which now appears in seven languages.
VERONICA WONG
Veronica Wong is Professor of Marketing and Director of the Diversity, Knowledge and Innovation ResearchProgramme at Aston Business School. She is an Academician (Academy of Social Sciences), a Freeman of theWorshipful Company of Marketors, and a Fellow of the Royal Society for the encouragement of Arts, Manufactures& Commerce (RSA) and the Chartered Institute of Marketing. She is a Member of the ESRC Postdoctoral FellowshipCollege and a Committee Member of the Product Development and Management (PDMA) UK & Ireland Chapter.
She is also Distinguished Professor at Audencia Nantes Ecole De Management, France and a Visiting Professor atUniversity Technology Malaysia, Malaysia. Other external positions recently held include being a Member of the
354 THE ADVISORY BOARD
ESRC Virtual Research College, the Chartered Institute of Marketing (CIM) Academic Senate and Vice-President(Conferences) of the European Marketing Academy Executive (EMAC).
In addition, Veronica reviews for several academic journals, professional associations and research councils. She iscurrently a consulting editor for the International Journal of Management Reviews and an editorial board member ofthe Journal of Marketing Management and 21st Century Society and the Journal of the Academy of Social Sciences.
THE EDITOR
LAURA MAZUR
Laura Mazur is a business journalist and partner in Writers 4 Management, a professional writing firm. She hascontributed to a range of publications on topics such as strategy, leadership HR and marketing since leaving Marketingmagazine, where she was editor. She has also acted as a ghost writer/editor on a number of books. She is co-authorwith Louella Miles of Conversations with Marketing Masters (John Wiley & Sons, Ltd, 2007).
Index
ABC see activity-based costingAccor Group 253accountants 191–2accounting measures 20, 21, 27–30, 69, 153
brand valuation 254–5, 256communications expenditure 303–4, 321entry strategies 185–6
Ace Chemicals 175–8acquisitions and mergers 5, 19, 23, 27, 67–8, 131–4,
247brand evaluation 255, 256mature markets 186strategy 177, 179, 196
activity-based costing (ABC) 91, 296adaptive customisation 333added values, brand equity 238, 239advertising 67, 119, 315, 316
costs 300, 301elasticity 279–80incumbents 182–3Internet 339–40pretests 318sales 311, 315see also communications
Agilent Technologies 144Airbus 282Alcoa 183alliances 57, 107, 134, 141, 196Alpha Plc 43, 47, 49, 50, 55Amazon.com 8, 15, 81, 331, 335
brand equity 241, 252competition 336, 346customer information 120customisation 115, 331–2, 333delivery systems 296distribution channels 185economics of information 329high valuation 197, 199, 204innovation 251product mix 209success 204
America Online (AOL) 207American Express 81, 274, 294Ansoff matrix 121, 127AOL 207Apax Partners 196Apple 81, 201, 242, 243Arm & Hammer Baking Soda 246Armani 18, 233, 294aspirational brands 232, 233, 243, 244, 253–4assessment, strategic position 151–86, 190, 195, 218assets
brand valuation 254, 255, 256, 257, 258, 260intangible 19–20, 21, 51, 194, 227, 228–31
accounting measures 29, 69assessing 96–7brand valuation 254, 255–6. 257, 258, 260communications 303, 304, 323growth strategies 53investment 54
market-to-book (M/B) ratio 47net present value (NPV) 37–8return on investment 28–9strategic 173strong brands 236tangible 20, 194, 229, 254–5, 256, 257–8, 303,
304attribute brands 232, 233, 311augmented brand 239Auto Trader 251Autobytel 329autonomy 146
backward integration 135balanced scorecard 156–8, 173, 176, 187, 193banners 343barnesandnoble.com 336barriers to market entry 163–4, 186, 330, 337baseline shareholder value 69BBC 335benchmarking 154, 176, 319Berkshire Hathaway 3, 196
356 INDEX
bits 327blogs 317BMW 62, 210, 239, 274Body Shop 193, 242, 243Boeing 81, 93, 94, 282bonds 38, 39Boots 202brainstorming 218brand 57, 57, 97, 195, 227–60, 331
advertising 315brand-building 21, 57, 67, 142, 227–60, 342–5communications 239–41, 309, 310, 315, 316, 319development 126–7enhancement 335growth 106Internet marketing 342–5leadership 82, 168loyalty 305promotional spending 211–12propositions 338superiority 61value 66, 254–8, 294
Brand Beta Analysis 259British Airways 63, 97, 119
branding strategy 253competition 206prices 273
British Broadcasting Corporation (BBC) 335broadband 327BTR 16budgets 19, 21, 27, 216, 312–14, 320bundled pricing 289business effectiveness 335business reengineering, Internet 346business unit planning 189–90, 197–200business-to-business (B2B) marketing 77, 81, 82, 92,
94–5, 262–3, 267, 285attribute brands 233globalisation 13Internet 332, 334, 346, 347
business-to-consumer (B2C) transactions 329, 343,346
buttons 343
Cable and Wireless 17Cadbury 3, 66, 237, 296, 335Cadbury-Schweppes Plc 254
Canon 142, 194, 210, 244, 252capital
accounting measures 153brand equity 236, 237–8cost advantage 166–7cost of 37, 39, 41, 43–4, 47–9, 54, 69estimating 68–9EVA 49, 50, 51return on 28, 65–6shareholder value 23, 24strong brands 237threshold margin 55–6
capitalism 4, 74cash flows 41, 43, 68, 70
brands 66, 228–9, 235–8, 246–7, 255–6, 257–60continuity value 45, 46customer lifetime value (CLV) 85discounted (DCF) 22, 37, 38, 39–40, 41–2, 53,
67, 70dividend discount model 39harvesting strategy 181–2level of 106new product development 128–9pricing 272, 279risk 38, 52, 57, 108sustainability 57–8timing 57value-based communications 304–6
Castrol 94, 185, 254, 296category management 81–2, 296Caterpillar 127CDNow 333chips 327Cisco Systems 204
Internet marketing 335scale economies 6
CLV see customer lifetime valueCMG 15CNN 249co-branding 248Coca-Cola 4, 57, 61, 62, 168, 260, 342
advertising costs 106, 301brand name 82, 142, 232, 233, 235, 237communications 311competition 263customer awareness 309global branding 248, 249
INDEX 357
licensing 130line extensions 122, 262new markets 106, 246outsourcing 18target audience 242undifferentiated marketing 285
Colgate-Palmolive 247collaborative customisation 333communications 300–23, 339–40community 24Compaq 122, 129, 204, 206, 331CompareNet 336competition 10, 11, 163–5
customers 201equilibrium 182GourmetFoods.com example 214Internet 337pricing 211, 263, 266–7, 271–3, 283–5, 291suppliers 24, 93targets 205–6, 210see also differential advantage
competitive advantage 15, 19, 166–8, 170–1, 185–6,187
appropriating 228growth strategy 140Internet 337, 338Ricardian rents 161, 166shareholder value 20, 25short periods of 4solution-based 207strategic objectives 178strategic value drivers 154sustainability 229see also differential advantage
complaints 87, 118complements 288CompuServe 343conjoint analysis 281, 283, 299consensus estimates 314consolidation of brands 247–8consumer adoption process 142–3Consumer Reports 251consumer surplus 269, 287consumer surveys 281consumer-to-business (C2B) transactions 329consumer-to-consumer (C2C) transactions 329continuing value 39, 41, 45–7, 52, 237
contract manufacturing 251–2contracts 293–4convergence 135, 337cooperation 273core business 59, 138core competencies 62–3, 97, 194
brand equity 229, 244customer solutions 93information networks 329
corporate level planning 189, 192–3cosmetic customers 332cost advantage 166–7cost of capital 37, 39, 41, 43–4, 47–9, 54
acquisitions 133estimating 68–9EVA 49, 50, 51strong brands 237threshold margin 55
cost savings 334–5costs
acquisitions 133advertising 300, 301, 315brands 236, 241, 247, 256communications channels 315customer loyalty 85decreasing 54economies of experience 106Internet companies 333, 334–5, 344–5low 82–3new product development 124pricing 263, 264, 275, 281–3, 296rationalisation 109, 110reductions 18, 19, 177, 201value chain 98
Credit Lyonnais 17critical mass 15, 155, 161, 183, 210
pricing strategy 274, 277sales growth 53
cross-functional teams 8, 63, 95, 98–9, 126, 144, 218cultural factors 249customer-focused organisations 13, 14, 100–1customer lifetime value (CLV) 85customer loyalty 336customer value, Internet and 337customers
balanced scorecard measures 157–8brand equity 229, 259
358 INDEX
customers (continued)buying power 8, 163, 336choice 231–2communications 306–8consumer adoption process 142–3differential advantage 61–2, 81–3direct business model 13direct marketing 211–12distribution channels 128–9economic value to (EVC) 93–4, 95expectations 10individual marketing concept 330, 331Internet 120, 331–2, 332–6, 336–9, 344–5intimacy 61, 81–2, 168, 295loyalty 61, 73, 74, 84–7, 92, 101, 103market segmentation 60, 202–5market-orientated organisations 79–80marketing strategy 12, 30needs 73, 74–6, 101, 202, 208organisational structure 99, 102planning process 216pricing 267–8, 279, 291, 292, 293–4, 297research 283–4retention 113–19, 344–5sales growth 53satisfaction 24, 57, 88–9, 116–17selecting 74, 91–2, 114–15share of 94, 119–20targets 201–6, 209–10volume focus 200–1Web value 332–6winning new 120–1
customisation 61, 115, 120, 275, 296Internet 327, 331–3, 337–9, 343, 346pricing 268–70, 285–8, 298see also mass customisation; one-to-one
marketingcyclicality of the market 165, 180
Daimler-Benz 210Damart 245databases 115, 338Debonair 206debt 41, 43, 44, 69DEC 330decentralisation 101, 197decision making 77–8, 94–5, 231–2, 306, 307–8
deconstruction of value chains 337defections analysis 118Dell Computer Corporation 6, 9, 10, 32,
64brand equity 235competition 206continuing value 45customer information 330customisation 115direct marketing 10, 129disintermediation 331distribution channels 185growth 105line extensions 122networks 251outsourcing 18revenue-based model 335substitutes 288
Delta Company 108–9, 111–12demand 266, 277, 278–81destroyyourbusiness.com 191DHL 83Diageo 248Diageo 66, 248, 255differential advantage 45, 57, 61–2, 74, 80–3, 103
communications effectiveness 319distribution channels 214growth 107organisational capabilities 97pricing 276strategic position assessment 166, 167–8,
172–3see also competitive advantage
digital environment 327–8digital specialists 330digital substitution 327digitisation 325, 327, 328, 331, 338, 340, 345direct business model 12, 13Direct Line 9, 185, 330direct marketing 10, 129, 211–12, 316–17direct research 283–4discounted cash flow (DCF) 22, 37, 38, 39–40, 41–2,
53, 67, 70brand valuation 257–60
disintermediation 9, 213, 330–1, 340Disney Corporation 57, 61, 173disruptive technolog 346
INDEX 359
distribution 12, 62, 123, 185, 212–13, 329brand power 251GourmetFoods.com example 214Internet marketing 340–1market segmentation 201new channels 128–9product pricing 288
diversification 135, 244divestment 138, 152, 178–81, 196dividend discount model 39domain names 342downsizing 14, 19, 26Du Pont 8, 276, 338Durr 93–4
e-commerce 164, 327, 331, 334, 341brands 251price customisation 286
earnings 27–8, 29, 30, 153brand valuation 256–7short-term 40
eBay 185, 204, 237, 329, 334high valuation 197prices 211, 262, 272
econometric approach 313economic use valuation 256–7economic value added (EVA) 49–52, 65, 70, 153economic value to the customer (EVC) 92–3, 95,
267–8, 269, 294economies of experience 106economies of scale 7, 54, 106, 236, 250
costs 282investment 283large markets 163pricing 266, 277sales growth 53
economies of scope 106, 338elasticity
demand 265price 274, 277, 278–80, 290, 291, 298
employees 23, 64, 97, 158company commitment to 221marketing professionals 18–19, 21motivation 25, 99, 101, 102, 117organisational structure 63, 98, 99–102sales personnel 293see also knowledge workers; teams
Encyclopaedia Britannica 8–9, 205enterprise value 41, 47entertainment 335environmental assessment 26–27equity
brand 228–60cost of 44shareholder value 23, 29, 41, 43, 44
Ericsson 205Esso 258Estee Lauder 220eToys 227, 251EVA see economic value addedEVC see economic value to the customerexchange rates 290exit barriers 294–5experience brands 232–4, 253–4experience curve 282, 283experimental estimates 314expert judgements 280, 281exports 130, 290express stores 136extra stores 136extranets 8, 331, 333
Facebook 330Federal Express 81, 89, 335Fiat 274fighter products 210, 292, 294finance
balanced scorecard measures 156–7financial planning 30shareholder value analysis 21value drivers 36–7, 40–1, 42, 52–7, 70,
176see also accounting measures
Financial Times 335Fine Wines Ltd 214First Direct 61, 64, 120, 185, 330first-mover advantage 15, 141–2, 184follow-on products 288–9Ford 99, 167, 329
advertising costs 301brand equity 245, 248, 250, 251market segmentation 274, 275regional branding 248undifferentiated marketing 285
360 INDEX
forecasts 39–47, 53, 65, 69, 153brand valuation 257, 260differential advantage 170–2new product development 125
Forward integration 134Four Seasons Hotel 81
game theory 271–2Gap, The 286GEC 16General Electric (GE) 17, 93, 94, 135, 191, 207
brand equity 237business units 191cost advantage 166–7destroyyourbusiness.com 191global markets 6goals 139intangible assets 227Internet 336leadership 146multinational strategy 130services 17success 4, 62trust relationships 89
General Motors 17, 31, 62, 166–7, 274advertising costs 301assets 227brand endorsement 253Internet 344mass production 329price customisation 286
Gillette 82, 122, 135, 142, 238Glaxo/GlaxoSmithKline 127, 206, 262, 276, 335global branding 248–9global strategy 13–14, 130globalisation 6–7, 13–14, 99, 100, 130, 263, 336,
289–90goals 139, 146
see also objectives; targetsGoldman Sachs 64Google 220, 227, 237, 331, 342GourmetFoods.com 214–15growth 105–46, 180, 195, 215
customer loyalty 84–5international 130–1ladder 112–13market 162–3, 170
new businesses 155options 60, 69–70, 137–8, 219prices 210sales 52–3strategic objectives 152, 183–4
Gucci 277
Hanson 16, 244harvesting strategy 69, 152, 181–2headquarters 192, 196Heinz 237, 253Henkel 17Hertz 81Hewlett Packard 64, 82, 89, 116, 144, 204, 250, 276hierarchical structure 98, 100hierarchy of effects model 309holding companies 196Holiday Inn 253Honda 173, 194human resources 97, 229Hyatt.com 342hypothesis-orientated planning 218
IBM 6, 13, 93, 94, 131, 144, 207, 330brand equity 230, 233, 241, 242–3, 251communications 311networks 251new markets 128–9organisational competencies 62separate business units 144services 19strategic value drivers 173
ICI 227idea screening 123–4identity, brand 238, 239–43image, brand 232–3, 238, 248, 294, 315, 319implementation 152improvement-based business models 334–5incentives 180individual marketing concept 330, 331industrial structures 7infomediaries 213, 330, 346information
Internet 333–6unbundling 328–9
information age 4–5, 6, 7, 9, 14, 18, 22, 63information revolution 7–9, 12, 262
INDEX 361
information technology 5, 7–9, 64, 300cross-functional teams 98customisation 120, 286, 298differential advantage 61distribution channels 129integrated marketing communications 212mass customisation 10, 115networks 99organisational change 14price elasticity 298see also Internet; telecommunications
innovation 54, 78, 81, 91–3, 98, 99, 100, 101balanced scorecard measures 158invention distinction 122market entry 185price premiums 292
intangible assets 19–20, 21, 51, 194, 227, 228–31accounting measures 29, 69assessing 96–7brand valuation 254, 255–6. 257, 258, 260communications 303, 304, 323growth strategies 53investment 54
integrated communications 212, 318Intel 17, 46, 61, 81, 343
brand equity 233, 235, 242, 251global markets 6pricing 276strategic value drivers 154
internal networks 63internal processes 156international growth 130–1international pricing 289–90Internet 6, 7–8, 12, 30, 32, 77, 78, 120, 325–47
auctions 285brand building 240, 342–5broadband 326delivery systems 296direct marketing 211–12distribution channels 129, 213future perspectives 345–7GourmetFoods.com example 214–15growth and development 325, 326IBM strategy 173partnerships with customers 120prices 164, 262, 272, 277, 281shopping 135
value for customers 332–6value for companies 336–9see also web sites
intranets 8, 328invention 123investment 15–16, 21, 23, 29–30, 54–6
accounting measures 186bonds 38brand valuation 254–5capital savings 177discounted cash flows 37, 38enterprise value 41, 47Internet 336long-term profitability 189objective setting 111–12options 57, 107pricing 265, 281, 283share prices 39, 40
invoice prices 296–7ipod 233ITT 244
Jaguar 245Johnnie Walker 10, 201, 253, 286, 294Johnson & Johnson 89, 140, 144, 253joint ventures 130
Kellogg’s 237, 253, 309KKR 196knowledge workers 14, 24, 63, 98KPMG 81
Laker Airways 186, 206Lastminute.com 128–9, 296, 342Lauren, Ralph 286leadership 146, 206learning organisation 207Letsbuyit.com 329leveraging relationships 135Levi 8Levi Strauss 288Lexus 81, 246, 274licensing 130line extensions 122, 142, 201, 243–4, 262, 294liquidation 181list prices 263, 297local branding 248–9
362 INDEX
logic of intermediaries 341Logica 15loyalty 61, 73, 74, 84–7, 92, 101, 103
brand 238, 305communications investments 305as exit barrier 295growth 112, 113–14
macroenvironmental changes 4–5maintenance strategy 152, 182–3managers 11–12, 14–15, 22, 23, 93, 94–5, 97, 98,
99–100, 102–3growth strategy 135–6, 144–5, 146incentives 180Internet 347marketing strategy 190obligation 22
manufacturing 5, 6, 7, 251–2marginal analysis 180mark-up pricing 266–7market entry barriers 337market-orientated organisations 78, 79–80market penetration 53, 57, 107, 121market research 57, 319, 328, 337market segmentation 10, 60, 91, 201, 202–5, 209–10
GourmetFoods.com example 214Internet marketing 336–9pricing 269, 274, 275, 278, 284, 285–8, 294promotion 211
market shareacquisitions 247brand consolidation 247–8brand equity 236, 237communications effectiveness 319maintenance strategy 182pricing 282, 283, 292, 298
market-to-book (M/B) ratio 3, 16, 17, 22, 23, 47, 227,229
marketing concept 79marketing mix 8, 19, 61–2, 121, 201, 207–13, 250
GourmetFoods example 214Internet 338–41standardisation 130–1
marketing strategy 12–13, 17, 30, 58–63, 70, 189–222cash flow 41Internet 317, 328, 338–41new markets 127–8
shareholder value 17, 19, 20, 40strategic position assessment 151–86
marketing value drivers 36, 41, 42, 58–63, 73–103markets
attractiveness 161–6, 169–70, 178, 179, 180, 185,198–9
brand revitalisation 245choices 59–60communications strategy 310–11evolution 203–4, 317globalisation of 6–7, 14growth strategy 140–1international 130–1, 142, 248–9Internet competition 326new 127–8participation strategy 11–12positioning 81, 124–5, 202–3, 274–5, 276, 337see also market segmentation; market share
Marks & Spencer 206, 296Marlboro 142, 235mass customisation 10, 115, 202, 338mass production 63, 331Matsushita 10, 220Mattel 227McDonald’s 6, 57, 301, 306
brand name 235, 239, 248environmental damage 240new markets 107, 246
McKinsey 82, 232, 287, 294company classification 16–17pentagon 174pricing 2627-S framework 63–5
Mercedes 57, 235, 242, 245, 254, 274options 289product variation 286, 289
Mercedes-Benz 166Merck 6, 17mergers see acquisitions and mergersmessages 311Metcalf’s law 328–30, 342, 343metro stores 136microenvironmental changes 4–5Microsoft 6, 46, 105, 131, 220
brand equity 235, 241, 251critical mass 277Encarta 9
INDEX 363
global branding 248goal sorting 146innovation 81intangible assets 227market attractiveness 169Office software 286, 289pricing 184, 262, 286, 287staff training 295
Milliken Company 8mission statements 219–20mixed business models 334, 335monitoring customers 116–17monopoly pricing 272monopoly profits 161, 166Moore’s Law 327–8, 331Morris, Philip 196, 301Motorola 127, 205multi-national strategy 130, 248, 250MySpace 331
Nescafe 57, 237Nespresso 288Nestle 130, 249–50, 253, 301, 306net operating profit after tax (NOPAT) 43, 47, 48, 50,
51, 53, 54, 55net present value (NPV) 37–8, 45, 52, 55, 67, 109, 111
new product development 125pricing 266, 274sales growth 184value-based communications 304–6
network economy 325network effects 184, 237, 266, 275, 277, 342networks 57, 63–4, 99–100
brand equity 244, 250, 251Internet 328–30, 347see also partnerships; strategic alliances
newspapers 330niche businesses 274Nike 4, 10, 18, 209–10, 220, 286
brand equity 232, 242product variation 10, 202, 288online community 344
Nissan 274, 301Nokia 46, 57–8, 105, 205NOPAT see net operating profit after taxNordstrom 81NPV see net present value
objective and task method 313objectives 111–12, 156, 216–17
communications strategy 310–11strategic 152, 177–8, 187, 197–9, 200, 209see also goals; targets
one-to-one marketing 10, 119, 120, 202customer intimacy 81Internet 77, 325, 331, 332, 337, 340pricing 275, 285, 286see also customisation
online communities 344operations model 27operations strategy 12–13options 60, 69, 107, 125–6, 145–6, 186
cash flow sustainability 57Orange Plc 67Oreal, L’ 253, 255organisation
capabilities 95–6, 97–8change 10–11, 14, 192–3culture 229growth strategy 144networks 99–100resources 96–7structure 98, 99–102theory of business 26values 220–1see also learning organisation
organisational value drivers 36, 37, 41, 42, 62–5, 70outsourcing 18–19, 99, 141
brands 227, 238, 244, 247, 251Internet companies 329, 337, 345–6
Panasonic 130Pareto principle 159participation strategy 11–12partnerships 57, 94–5, 95–6, 97, 118–19PC World 8penetration pricing 184, 210, 276, 277–8Pepsi 62, 134, 234, 235, 263performance
marketing strategy 190measurement 144, 193, 218strategic position assessment 151–86
perpetuity method 46–7, 48, 50, 69, 257Persil 237, 243personal selling 300, 307, 312
364 INDEX
personalisation 337Pfizer 169pharmaceuticals 122phasing out the brand 248Philips 62, 248, 253Pilkington 185piloting approach 140–1Pizza Express 291place 62, 121, 212–13planning
business unit level 189–90, 197–200corporate level 189, 192–3strategic market 190–2, 216–19
podcasts 317portals 342portfolios
analysis 65–6, 158–61managing 58, 195–6
positioning 81, 124–5, 202–3, 274–5, 276, 337present value (PV) 37, 41, 45, 69, 235pretests 318price experiments 281price leadership 183, 273price/earnings (P/E) ratio 47Priceline.com 197, 211, 262, 272, 285, 329prices 11–12, 62, 121, 210–11, 262–97
advertising 319bonds 38brands 231, 235, 247competition 182–3customer loyalty 85first-mover advantage 141–2GourmetFoods.com example 214Internet 164, 333, 334–5, 345penetration 184, 210, 276, 277–8premium 166, 235, 297, 305, 306, 309raising 54, 58, 109, 177, 201, 285, 292–6reducing 292sensitivity 164, 201, 278, 285, 287, 294, 298shares 37, 38–40, 69, 153
PriceScan.com 262Prisoner’s Dilemma 271–2, 285Proctor & Gamble 8, 10, 122, 131, 182, 248
advertising costs 300, 301brands 31, 32, 66, 243, 247, 250, 252, 253category management 296communications agencies 318
consolidation of brands 248customers 77global markets 13leadership 146line extensions 122market signalling 183pricing 291skills 64stock 338strategic value drivers 154unique selling proposition 311
product leadership 61, 81, 168production-orientated organisations 78–9, 92productivity 200, 201–2, 246–7products 62, 121, 207–10
brand equity 238–9communications channels 317development 57, 121–6, 229, 230divestment 178, 180economies of scope 106GourmetFoods.com example 214Internet marketing 338life cycle 122, 127, 203–4, 277positioning 274–5pricing 288–9, 295–6standardisation 250substitute 164unbundling 328–9
profit 4, 7, 61–2accounting 20, 27–8advertising 67brand consolidation 247–8brand valuation 254, 256–7communications expenditure 303, 304, 320,
321competitive advantage 166customers 59, 61, 85, 87, 88, 91differential advantage 83divestment decisions 179–80economic 49, 50, 51, 153, 180monopoly 161, 166net operating profit after tax (NOPAT) 43, 47,
48, 50, 51, 53, 54, 55operating profit margin 41, 43portfolio analysis 65–6pricing 210, 263–7, 274, 285, 291, 297rationalisation 109
INDEX 365
promotion 62, 121, 211–12, 291, 315, 317GourmetFoods.com example 214Internet 340
provider-based business models 335public relations 315–16publicity, Internet 342purchase-based revenue models 335purchasing power, Internet and 336
quick kill 248Quicken 251, 345QXL 329
rationalisation 109–10, 138–9, 146, 180rationality of buying decisions 307–8reach 339realised prices 263, 296–7, 298regional branding 248, 249reintermediation 330–1relationship management, Internet and 335–6repositioning 66–7, 245–6reputation 229research & development (R&D) 122resources 96–7, 140–1, 229, 327, 344
corporate level planning 193, 194–5market entry 185–6substituion 327
return on investment 28–9Reuters 17, 335revenue-based business models 334, 335revitalisation of brands 246rewards 144, 145Ricardian rents 161, 166richness 339risk 22, 41, 165–6
brand valuation 259cash flows 38, 52, 57, 108equity risk premium 44, 259market risk premium 39
Rolex 232, 277Rolls Royce 303Rover 210royalty relief valuation 256
Saatchi & Saatchi 179, 318Sainsbury 206, 250sales
advertising 311, 315brand valuation 255communications expenditure 302–3, 313, 314,
320, 321growth 41, 52–3, 109–10, 112, 133, 184measuring communications success 318–19operating profit margin 43performance 176pricing 264, 265, 266promotions 291, 315–16
sales-orientated organisations 78–9, 92Sanitarium 248Schwab, Charles 15, 277, 329, 330Schweppes 106semiconductors 327service leadership 81services 7, 121–2, 231, 338, 3397-S framework 63–5shared value drivers 63–4, 193–5, 196shareholder value 3–33, 36–71, 191, 199–200, 215
acquisitions 132, 247brand equity 23, 227, 234–8, 259communications 302–6, 313, 314, 319–23cost advantage 166customer value relationship 74, 85–7GourmetFoods.com example 214, 215growth 105, 106–11marketing strategy 190, 214pricing 262, 263–7, 276–7, 278, 297strategic options 152
shareholder value added 36, 48, 52, 53, 56shareholder value analysis (SVA) 20–7, 29, 66, 70
continuing value 45limits of 68–70marketing strategy 17, 18, 190
shares 37, 38–40, 69, 153, 306Sharp 64Shell 62short-termism 3, 27, 28, 30, 40–1, 52, 68
profit-maximisation 264, 266rationalisation 110strategic planning 191
Siemens 62Sigma 321–3signalling 183, 240, 273Singapore Airlines 62, 244size of markets 162
366 INDEX
skills 64, 196skimming pricing 276–7Skype 276SkyTV 249SmithKline Beecham 206Snuggles 249social networks 317social responsibilities 23, 24Sony 10, 62, 130, 239, 250, 253
competition 205innovation 78, 81success 62technical skills 194value proposition 95
Southwest Airlines 98speed to market, Internet and 341–2spinouts 144staff see employeesstakeholders 23–5standardisation 130–1, 163, 250Starbucks 232, 246statistical analysis 281stock market 15–16, 22, 40, 69
brand equity 227strategic alliances 57, 107, 134, 142, 196strategic assets 229strategic characterisation matrix 169, 172, 176, 198strategic marketing plan 152, 190–2strategic position assessment 151–86, 190, 195, 218strategic value drivers 154–5, 173, 176, 186strategy 10–15, 64
acquisitions 132–3branding 252–3communications 310–14core 207, 210, 211, 214emergent 140growth 135–45intended 140Internet 336–41new product development 123pricing 274–9repositioning 66–7see also marketing strategy
substitute products 164, 288substitutes 288Subway 57supermarkets 81–2, 250
superstores 136suppliers 13, 24, 76, 89, 164
brands 236, 251category management 81–2competition 93cost-reduction 54exit barriers 294–5information technology effect on 8, 9Internet 332, 335–6, 338, 340, 347partnerships 118–19product hierarchy 208–9
supply chain 229, 230, 234, 236, 250, 254, 335, 336,346
surveys 281sustainability of cash flow 57–8Swatch 185, 201synergies
acquisitions 68, 132, 133, 134adding value 146core brand 244Internet convergence 337
tangible assets 20, 194, 229, 254–5, 256, 257–8, 303,304
target-return pricing 266targets 140, 154, 201–6, 209–10, 214, 311
see also goals; objectivesteams
balanced scorecard 156, 157cross-functional 8, 63, 95, 98–9, 126, 144, 218
technological assets 229telecommunications 6, 11, 13, 23
see also Internetterminal value 69Tesco 135, 137, 206, 221, 250, 291, 337Tesco Digital 138Tesco Direct 137tesco.com 137Tetrapak 294Thorntons 1283Com 173M 61, 64, 81, 123, 144, 194, 244
innovation 78, 81leadership 146multiple markets 195strategic value drivers 154targets 139

INDEX 367
threshold margin 55, 106, 108TI 283Timberland 232top management 102Toshiba 57, 122Toyota 10, 61, 62, 154, 250, 301, 302Toys ’R’ Us 8, 120, 227trade 6, 289, 290transnational marketing 250transparent customers 333Travelocity 335trust relationships 73, 74, 75, 82,, 85, 89, 94, 95, 120
Unilever 62, 182, 248advertising costs 300, 301, 302, 306assets 227brands 66, 227, 243, 244, 246, 249, 250consumer information 337multinational strategy 130strategic objectives 197, 198
unique selling proposition (USP) 311United Distillers 10
valuation principles 37–8value 75, 81, 173–8, 213–15
acquisitions 133brands 254, 259, 294continuing 39, 41, 45–7, 52, 237economic value added (EVA) 49–52enterprise 41Internet 327, 328, 331, 332–6, 337, 338, 339,
341, 344, 345net divestment 181optimal restructured 177, 181organisational 220–1pricing 211, 266, 267–8, 274, 283–4, 295–6terminal 69see also net present value; shareholder value
value chain 97–8, 99–100, 329, 330, 335, 337, 346value propositions 73–4, 80–1, 83, 89–91, 92–3,
95–6, 98enhancing 115positioning 125
ValueStar 331, 332Vauxhall/Opel 288Verizon 135vertical integration 134–5Victoria’s Secret 286Virgin 61, 89, 135, 273, 273
brand 57, 195, 233, 242, 243, 244, 253–4, 260innovation 252leadership 193
Virgin Atlantic 81virtual integration 13, 32virtual worlds 317Vodafone 15, 105, 169, 220Volkswagen (VW) 275volume 54, 200–1, 235Volvo 232, 233, 275Vuitton, Louis 232, 242
Wal-Mart 57, 64, 105, 139, 204, 291brand equity 232, 233information technology 61intangible assets 227value proposition 96
Web 2.0 317, 334web chain analysis 336web sites 325, 326, 327–8, 330, 332, 333, 335, 336,
338, 341, 342, 343–5as first port of call 12growth strategies 129see also Internet
Westinghouse 227Whirlpool 248Whiskas 243wikis 317Williams Holdings 51word-of-mouth 342–3
Xerox 89, 142, 210, 266
Yahoo! 331, 335, 336, 342brands 251customisation 331
YouTube 330

NetLibrary - Online Reader: Display Message
The requested page could not be found.
file:///C|/Export/www.netlibrary.com/reader/DisplayMessage.aspx@MessageId=811.htm4/3/2009 2:20:14 πμ