Shareholder investment horizons and the market for corporate control
33
(forthcoming in the Journal of Financial Economics) Shareholder Investment Horizons and the Market for Corporate Control Jose-Miguel Gaspar a , Massimo Massa b* , Pedro Matos b Abstract This paper investigates how the investment horizon of a firm’s institutional shareholders impacts the market for corporate control. We find that target firms with short-term shareholders are more likely to receive an acquisition bid but get lower premiums. This effect is robust and economically significant: Targets whose shareholders hold their stocks for less four months, one standard deviation away from the average holding period of 15 months, exhibit a lower premium by 3%. In addition, we find that bidder firms with short-term shareholders experience significantly worse abnormal returns around the merger announcement, as well as higher long-run underperformance. These findings suggest that firms held by short-term investors have a weaker bargaining position in acquisitions. Weaker monitoring from short-term shareholders could allow managers to proceed with value-reducing acquisitions or to bargain for personal benefits (e.g., job security, empire building) at the expense of shareholder returns. JEL classification: G34; G23; G32 Keywords: Investment horizon; Mergers and acquisitions; Shareholder heterogeneity; Institutional investors; Short termism a Finance Department, ESSEC Business School, Av. Bernard Hirsch 95021 Cergy-Pontoise, France b Finance Department, INSEAD, Blvd. de Constance, 77300 Fontainebleau, France * Corresponding author. Tel. +33160724481 Fax:+33160724045 E-mail: [email protected]u . We thank an anonymous referee, Alexandre Baptista, Jean Dermine, Bernard Dumas, Paolo Fulghieri, Harald Hau, Pascal Maenhout, Urs Peyer, Matti Suominen, Lucia Teplá, Theo Vermaelen, and seminar participants at Oxford Saïd Business School, HEC Montréal, ESSEC, and CEMAF/ISCTE for many helpful comments, and Jean Cropper for editorial assistance. All remaining errors are our own. This is a substantially revised version of a paper previously circulated with the title “Shareholder Portfolio Policies and the Market for Corporate Control: The Value of Long-Term Investors.” Pedro Matos and José-Miguel Gaspar kindly acknowledge the financial support of Programa Praxis XXI of Fundação para a Ciência e Tecnologia.
-
Upload
independent -
Category
Documents
-
view
1 -
download
0
Transcript of Shareholder investment horizons and the market for corporate control

(forthcoming in the Journal of Financial Economics)
Shareholder Investment Horizons and the Market for Corporate Control
Jose-Miguel Gaspara , Massimo Massab* , Pedro Matosb
Abstract
This paper investigates how the investment horizon of a firm’s institutional shareholders impacts the market for corporate control. We find that target firms with short-term shareholders are more likely to receive an acquisition bid but get lower premiums. This effect is robust and economically significant: Targets whose shareholders hold their stocks for less four months, one standard deviation away from the average holding period of 15 months, exhibit a lower premium by 3%. In addition, we find that bidder firms with short-term shareholders experience significantly worse abnormal returns around the merger announcement, as well as higher long-run underperformance. These findings suggest that firms held by short-term investors have a weaker bargaining position in acquisitions. Weaker monitoring from short-term shareholders could allow managers to proceed with value-reducing acquisitions or to bargain for personal benefits (e.g., job security, empire building) at the expense of shareholder returns.
JEL classification: G34; G23; G32 Keywords: Investment horizon; Mergers and acquisitions; Shareholder heterogeneity; Institutional investors; Short termism
aFinance Department, ESSEC Business School, Av. Bernard Hirsch 95021 Cergy-Pontoise, France bFinance Department, INSEAD, Blvd. de Constance, 77300 Fontainebleau, France
* Corresponding author. Tel. +33160724481 Fax:+33160724045 E-mail: [email protected]. We thank an anonymous referee, Alexandre Baptista, Jean Dermine, Bernard Dumas, Paolo Fulghieri, Harald Hau, Pascal Maenhout, Urs Peyer, Matti Suominen, Lucia Teplá, Theo Vermaelen, and seminar participants at Oxford Saïd Business School, HEC Montréal, ESSEC, and CEMAF/ISCTE for many helpful comments, and Jean Cropper for editorial assistance. All remaining errors are our own. This is a substantially revised version of a paper previously circulated with the title “Shareholder Portfolio Policies and the Market for Corporate Control: The Value of Long-Term Investors.” Pedro Matos and José-Miguel Gaspar kindly acknowledge the financial support of Programa Praxis XXI of Fundação para a Ciência e Tecnologia.

2
1. Introduction
This paper is an empirical analysis of the impact of shareholder investment horizons on the
market for corporate control. Our purpose is to investigate the claim that the U.S. corporate governance
system myopically puts too much emphasis on the short term, leading to distorted investment decisions.1
Mergers and acquisitions (M&As) are a good setting to study the influence of shareholder investment
horizons on corporate decision making. An acquisition is an important investment decision likely to
impact the shareholder value of the bidding firm. Receiving an acquisition offer is often a direct source
of sizable gains for target firm shareholders. In addition, unsolicited acquisitions provide indirect gains
by disciplining managerial actions ex ante (Jensen, 1993).
Investment horizons, as many other shareholder characteristics, are naturally hard to observe.
The availability of data on institutional holdings provides a unique opportunity to infer investment
horizon from actual portfolio behavior. Institutions constitute the biggest investor group in the U.S.
equity markets and are usually portrayed as a pivotal investor group in takeovers (Useem, 1996). They
are also investors whose portfolio policies are important, well defined, and professionally set up.
Previous research has investigated the role played in acquisitions by different classes of shareholders
(e.g., managers, institutions, blockholders) but has not addressed investment horizon per se.
Institutional investors have different portfolio horizons for many reasons. Different
demographics or liquidity needs of final owners can imply strategies with different horizons. For
example, employee-defined contribution plans usually have a long-term orientation, while retail open-
ended mutual funds tend to be more short-term oriented because of frequent money inflows and
outflows (Edelen, 1999). Agency problems inherent in delegated asset management also affect
investment horizons. Shorter horizons could result from the inability to continuously gather capital to
implement long-term strategies (Shleifer and Vishny, 1997) or from the incentives to trade on short-term
signals if there is imperfect information about the portfolio manager’s ability (Scharfstein and Stein,
1990; Dow and Gorton, 1997).
M&A events are strongly affected by agency problems existing between managers and
shareholders. The effectiveness of the monitoring activities that can alleviate these problems depends on
the existence of shareholders with enough cash-flow rights and incentives to monitor firm managers
effectively.2 Moreover, M&As are characterized by high bargaining costs, mostly because the bidder has
to surrender a significant portion of the gains to acquire control. Based on this theoretical background,
we suggest two interrelated channels through which shareholder investment horizons influence the
outcome of M&A events. 1 See Stein (1989), Porter (1992), and Noe and Rebello (1997). 2 The amount of monitoring performed depends on the shareholder’s size of stake (Shleifer and Vishny, 1986), his liquidity concerns (Bolton and Von Thadden, 1998), and the possibility of profitably trading on information acquired during the monitoring process (Kahn and Winton, 1998).

3
First, we expect investment horizons to affect the degree to which firm managers are monitored.
Investors with a shorter horizon have fewer incentives to spend resources in monitoring, as they are less
likely to remain shareholders of the firm long enough to reap the corresponding benefits. In addition,
they have less time to learn about the firm. Therefore, the length of the investment horizon of
shareholders affects managerial behavior both in initiating corporate control transactions and in merger
negotiations. Weakly monitored managers will trade off shareholder interests for personal benefits,
ranging from job security (target) to empire building (bidder), at the expense of shareholder returns.
Second, shareholder investment horizons affect the bargaining power of each party involved in
an acquisition. A deal can create economic surplus that has to be split between the target and the bidder.
In a tender offer, shareholders with a short-term orientation have a lower ability to hold out in the
negotiation, in the sense identified by Grossman and Hart (1980), when compared with long-term
investors who can afford to stay in the firm until all the benefits of the acquisition are realized. In a
friendly merger, managers of firms held by short-term shareholders can be expected to have a weaker
bargaining position, as a result of higher chances that their shareholders take the “Wall Street walk” and
sell their holdings.
The two effects, monitoring and bargaining power, are intertwined. Weak monitoring by short-
term investors can lead to managers trying to cut a deal for themselves at the expense of shareholder
interests at the bargaining table. Our hypothesis predicts that we should observe lower premiums for
target firms held by short-term investors, as well as a higher probability of a bid being received.
Similarly, we should observe a more negative abnormal return around the merger announcement for
bidder firms held by short-term investors, as well as a higher probability of a bid being made.
To test these predictions, we build a measure of investor horizon based on the average turnover
of investors’ entire portfolios. Short-term investors are defined as those exhibiting high portfolio
turnover. We then characterize the ownership structure of a firm prior to an acquisition announcement in
terms of its shareholders’ portfolio turnover. Our characterization of the behavior of investors uses a
one-year history of filings and is measured six to nine months before the announcement date.
We show that the more short-term oriented the target shareholders are (that is, the more
frequently they rotate their portfolio), the lower is the target premium. At the same time, the more short-
term oriented the bidder shareholders are, the more negative is the bidder abnormal market return around
the merger announcement. For example, in the case of target firms, an increase of one standard deviation
on the average institutional shareholder level of portfolio turnover (a mere difference of four months
from the average 15-month period the firm’s investors hold a stock) implies more than a 3% reduction in
premium.

4
Our paper also analyzes the impact of investor horizons on the likelihood of a bid and finds that
short-term investors facilitate the deal by increasing its probability. Given that investor horizons affect
both the likelihood and the premium of a transaction, we investigate whether a problem of sample-
selection bias exists. We find that, even after properly accounting for this phenomenon, our variables
still exhibit significant statistical power to explain premium levels.
Finally, we address the question of whether investor horizons are related to the long-term
performance of the merging firms. Acquirers with short-term shareholders prior to the merger are found
to underperform significantly (by as much as –0.7% monthly, or –8% per year, over a holding period of
three years), compared with acquirers with long-term shareholders.
Our findings clearly demonstrate the trade-off implicit in the prevalence of short-horizon
ownership structures, thus contributing to the debate on the U.S. corporate governance system. In
particular, shareholders’ investment horizons affect the relative affordability of takeovers. The more
short term the shareholders of the target are, the higher the likelihood of a takeover and the lower its
cost. At the same time, short-term shareholders in the bidder provide more leeway for managers to
overbid and carry out value-reducing acquisitions. This trade-off follows the arguments put forward by
Jensen (1993).
In addition, our findings shed light on the true costs and benefits of pursuing a policy of
relationship investing (Kensinger and Martin, 1996; Chidambaran and John, 1999) or shareholder
targeting (Useem, 1996). Industry practitioners seem to devote considerable attention to investor horizon
considerations, and many firms implement investor relation activities aimed at attracting long-term
investors to their shareholder base. Our paper adds to this debate by empirically validating the idea that
it does make a difference who the shareholders are. In particular, managers face a trade-off between
targeting acquiescent short-term shareholders who are not committed to the company and targeting
demanding long-term shareholders who can give them a strong hand at a merger negotiation table.
Our paper adds to the stream of literature that investigates the effects of shareholder
heterogeneity on stock prices (e.g., Shleifer, 1986; Bagwell, 1991). Hotchkiss and Strickland (2000) find
that ownership composition affects stock price behavior around the release of corporate information.
Bushee (2001) shows that transient (high turnover and highly diversified) investors are associated with
an overweighting of near-term expected earnings. In the context of M&As, Stulz, Walkling, and Song
(1990) conclude that higher institutional ownership is associated with lower acquisition premiums.
Ambrose and Megginson (1992) do not find a significant impact for the level of ownership on the
likelihood of a bid.
The remainder of the paper is articulated as follows. Section 2 lays out our main testable
hypothesis. Section 3 describes the sample and the variables. Section 4 analyzes the impact of investor

5
horizon on the acquisition premium and on the bidder’s short-term stock price performance. Section 5
does the same for the likelihood of the takeover and addresses the issue of sample selection bias. Section
6 investigates the impact of investor horizon on the long-term performance of acquiring companies. A
brief conclusion follows.
2. Main hypothesis and testable propositions
The null hypothesis posits that shareholder investment horizons play no role in the market for
corporate control. If managers always act in the shareholders’ best interest and we stay within the realm
of perfect capital markets, whatever a company does can be undone by its shareholders through portfolio
rebalancing (as it would be the case if the stock ceases to exist because of a merger). In this scenario,
little reason exists to expect that differences in ownership structure affect corporate decisions.
We now describe our working hypothesis and its predictions for the target, the bidder, and the
cross-effects between firms. 3
2.1. Target firm
Differences in investment horizon qualify the nature of the Grossman and Hart (1980) free-rider
problem. Long-term investors will hold out and not tender their shares in a tender offer (or approve a
proposed merger) unless they are offered a premium that incorporates the improvement resulting from
the acquisition. In contrast, short-term investors are more likely to divest before all the benefits of the
acquisition are realized. This creates a wedge between the bargaining power of short-term held potential
targets and long-term held ones.
At the same time, the weaker monitoring incentives of short-term investors increase the
discretionary power of managers in negotiating the deal terms. Managers of the target firm might
bargain not only over the price to be paid to their shareholders, but also over such items as future
position in the merged company, board composition, or executive compensation. Hartzell, Ofek, and
Yermack (2004) suggest that target managers do so at the cost of a lower premium.
If potential bidders anticipate these issues, they will offer lower premiums for targets held by
short-term investors and will make bids more often. We therefore expect that the more short term the
investors of the target firm are, the lower is the premium received by target shareholders and the higher
is the probability of a takeover bid.4
3 We thank an anonymous referee for valuable help in refining our hypothesis. 4 One alternative prediction is that low monitoring by short-term shareholders increases the wedge between the current firm value and the next-best alternative use of the firm’s assets. This implies a higher potential for the deal to unlock economic

6
2.2. Bidder firm
While for target firms takeovers can act as a disciplining device, for bidders these same
acquisitions can be a manifestation of agency problems. Empirical evidence shows that returns to bidder
shareholders in mergers are insignificant at best, with many studies finding negative returns.5 The Jensen
(1986) free cash-flow theory emphasizes the incentives for bidder managers to undertake acquisitions
that bring them private benefits of control, while Roll (1986) interprets overbidding as a consequence of
managerial hubris. Monitoring and intervention (at the extreme, blocking mergers through the use of a
proxy contest) require in many instances a high engagement from bidder shareholders. This is less likely
for short-term investors who could prefer to sell their stake. Being accountable to long-term
shareholders reduces the leeway that managers of the bidder have to engage in questionable acquisitions
and to bid too aggressively in merger negotiations.
We therefore expect that for firms held by short term investors, we should observe a higher
probability of undertaking a takeover bid as well as more negative bidder abnormal returns.
2.3. Cross-effects between firms
The payoff accruing to one party in the bargaining process should be directly related to the
investment horizon of the shareholders of the other party. If the bidder’s shareholders have short
horizons, the bidder likely overpays, generating a gain for target shareholders. Analogously, if the
target’s shareholders have short horizons, managers of the target likely trade-off personal benefits for a
lower final price. This implies that more value accrues to the bidder firm. In summary, the higher the
fraction of short-term investors in the target (bidder) firm, the bigger should be the fraction of value
accruing to the bidder (target) firm.
3. Data and empirical testing issues
3.1. Sample construction
We use data on all acquisition announcements involving U.S. targets and taking place between
January 1980 and December 1999, extracted from the Securities Data Corporation (SDC) database. We
require that the target firm is listed in NYSE, Amex or Nasdaq; that the target’s CUSIP can be matched
with Center for Research in Securities Prices (CRSP) data; and that the outcome of the merger is known
(either completed or withdrawn). We exclude extreme outliers and transactions whose value represents
value. Consequently, we still expect firms held by short-term investors to be more likely to become a target of a bid, but to exhibit higher, not lower, premiums. It is an empirical question which of the mentioned effects predominates. 5 This body of evidence has been accumulated since Morck, Shleifer, and Vishny (1990). Fuller, Netter, and Stegemoller (2002) report that bidder returns are negative only for the cases of purchasing public target firms.

7
less than 1% of the target’s market value.6 Whenever there are several bids for the same target
(occurring within one year of the first bid), we keep only the first bid. We do so because revised or
competing bids are likely to be associated with low abnormal stock returns, as the target’s price already
incorporates the news that the company is in play. If firms with short-term shareholders tend to receive
multiple bids, a spurious negative correlation between shorter investment horizon and abnormal return
premiums could be generated.7 The final number of events in our base sample is 3,814.
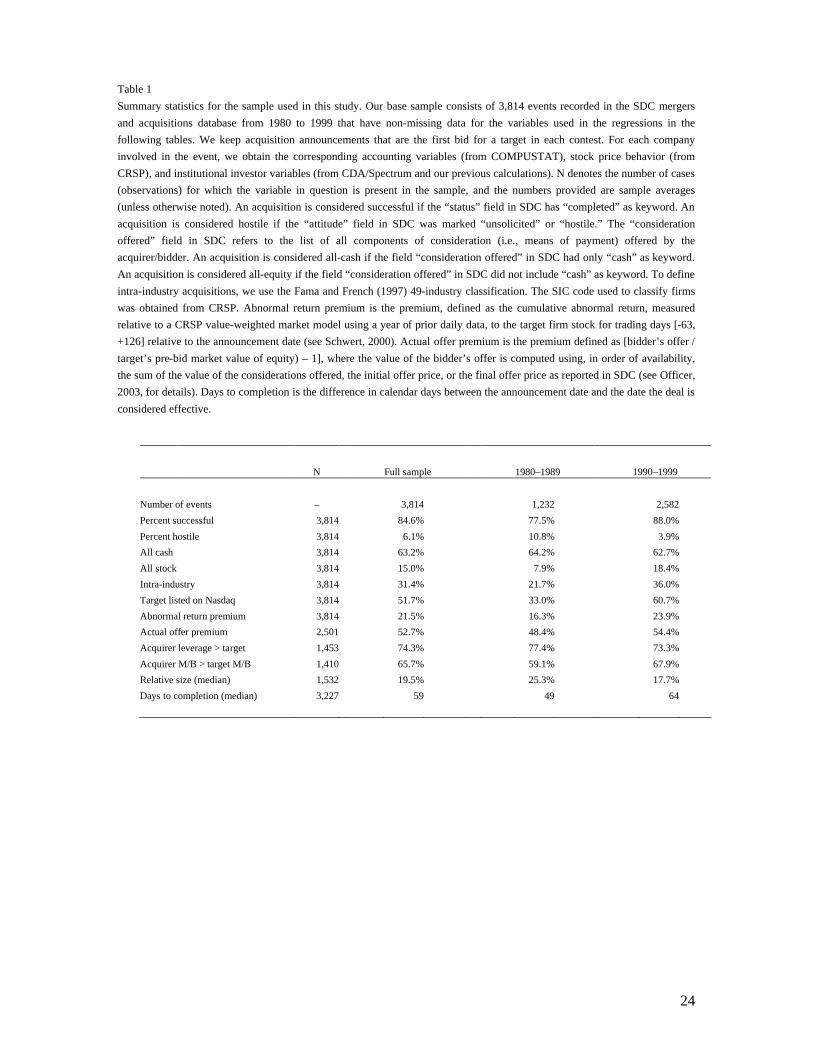
Table 1 presents summary statistics for the sample. Overall, the characteristics of our sample are
in line with those reported in recent studies (Andrade, Mitchell, and Stafford, 2001; Holmström and
Kaplan, 2001; Schwert, 2000). The number of acquisitions increased markedly in the 1990s, relative to
the previous decade, while the rate of hostility declined substantially. The 1990s were also characterized
mainly by related acquisitions and a greater use of stock-financed acquisitions.
<Insert Table 1 near here>
A central variable of interest is the acquisition premium. Most of our analysis is conducted using
the Schwert (2000) abnormal return premium, defined as the sum of abnormal returns of the event firm’s
stock for trading days [–63, +126] relative to the announcement date. We use as benchmark to calculate
abnormal returns the market model whose parameters are estimated using daily returns for the trading
year ending on day –64. We employ an equivalent procedure to calculate the bidder firm’s abnormal
return around the announcement date. This abnormal return-based measure of premium, although
common in the M&A literature, mixes the market’s estimate of the nominal premium with the likelihood
of the acquisition going through (Betton and Eckbo, 2000; Officer, 2003). To address this issue, we
complement our analysis of target firms with the actual offer premium, measured as [(bidder’s offer /
target’s pre-bid market value of equity) – 1]. The value of the bidder’s offer is computed using SDC
data, following the procedure described in more detail in Officer (2003).8
3.2. Investor turnover
Investor-level portfolio information comes from CDA/Spectrum, a database of quarterly 13-F
filings of money managers to the U.S. Securities and Exchange Commission. The database contains the
positions (of more than 10,000 shares or US$200,000 in value) of all the institutions with more than
US$100 million dollars under discretionary management. Gompers and Metrick (2001) provide a
6 We exclude events in which the target’s P/E, debt-equity, market-to-book, or ROE is greater than one-hundred (Schwert, 2000) and the target or the acquirer has more than 200% institutional ownership (institutions sometimes report common and preferred shares, while CRSP reports common shares). 7 We thank an anonymous referee for pointing out this issue to us. All our results are similar if we include all bids and are available upon request. 8 The value of the bidder’s offer is equal to (in order of availability in SDC) the total consideration offered, the value resulting from the initial offer premium, and the value resulting from the final offer premium.

8
detailed analysis of this data set. 13-F filings do not contain short-selling positions, used frequently by
merger arbitrageurs in merger deals.
A short-term investor should buy and sell his investments frequently, while a long-term investor
should hold his positions unchanged for a considerable length of time. To implement this idea
empirically, we calculate for each institutional investor a measure of how frequently he rotates his
positions on all the stocks of his portfolio (churn rate). If we denote the set of companies held by
investor i by Q, the churn rate of investor i at quarter t is
∑
∑
∈
−−
∈−−−
+
∆−−
=
Qj
tjtijtjtij
Qjtjtijtjtijtjtij
ti PNPN
PNPNPN
CR
2
11
111
,,,,,,
,,,,,,,,,
, , (1)
where Pj,t and Nj,i,t represent the price and the number of shares, respectively, of company j held by
institutional investor i at quarter t. This definition follows those commonly used to assess overall
portfolio rotation (Carhart, 1997; Barber and Odean, 2000; CRSP, 2003).9
We use investor churn rates to construct a measure of investor turnover for the firm that
measures the investment horizon of institutional shareholders in the firm prior to an acquisition
announcement. Denote by S the set of shareholders in company k and by wk,i,t the weight of investor i in
the total percentage held by institutional investors at quarter t. The investor turnover of firm k is the
weighted average of the total portfolio churn rates of its investors over four quarters:
∑ ∑∈ =
+−
=
Si rrtitik CRw
4
114
1k firm of Turnover Investor ,,, . (2)
In our paper the instant of measurement t is such that at least two full quarters pass between the
measurement of all shareholder variables and the announcement date.
Fig. 1 illustrates our approach and emphasizes several important features of our measure. First,
investor turnover is measured six to nine months before the announcement date. This is a greater time
distance than the length of the run-up period, usually considered sufficient to avoid the possibility of
rumors being made public about the deal (Schwert, 2000). Second, investor turnover uses a one-year
history of information on the behavior of investors. Because churn rates are basically changes in
holdings, this means we use portfolio information that dates 18 to 21 months before the event. This
minimizes the influence of a single quarter in the calculations and makes our measure appropriate to test
a long-run effect such as monitoring. Third, using churn rates calculated across investors’ overall
portfolios minimizes the possibility that an increase in traded volume (of the particular company 9 By construction, the range of the churn rate is the interval [0, 2]. When performing its calculation, we exclude in each quarter the investors entering the CDA/Spectrum universe for the first time (because they would automatically have a maximum churn rate of 2). We also exclude in each quarter companies that have just entered the sample (for the same reason).

9
involved in the upcoming event) would bias our results.10 These features help us to treat investor
turnover as a predetermined variable with respect to the event.
<Insert Fig. 1 near here>
Further confirmation of this is given by unreported tests for the existence of anticipatory
positioning of institutional investors prior to the announcement. Based on Pinkowitz (1999), we look at
time-series changes in investors’ turnover, level of ownership and concentration of holdings, in target
and bidder firms, for the quarters prior to announcement. We find that these changes are neither
economically meaningful nor statistically different from corresponding control samples and conclude,
like Pinkowitz (1999), for the absence of pre-positioning by institutional investors.11
Table 2 shows that median values of investor turnover do not differ much across target and
bidder firms (P-value = 0.3). If we consider levels, we see that institutional investors with stakes in event
firms before the event churn their portfolios intensively. A median portfolio turnover rate of 39% means
that almost 20% of the portfolio is churned in a quarter, or around 80% of the position is turned over in a
given year.12 In other words, the median investor is holding an average stock in his portfolio for a period
of around 12 / 0.8 = 15 months.
<Insert Table 2 near here>
3.3. Other shareholder portfolio variables
Table 2 presents summary statistics of additional shareholder portfolio variables. It is important
to control for them in our analysis, because investor turnover might be correlated with investor
characteristics other than investment horizon.
• The level and concentration of institutional ownership play an important role in the theories of
monitoring (Shleifer and Vishny, 1986; Stulz, Walkling, and Song, 1990). Fraction, the level
of ownership, is the ratio of the firm’s shares held by institutional investors. Concentration, the
degree of ownership concentration, is the Herfindahl Index of the investor weights wk,i,t.
• Less risk-averse investors could reshuffle their portfolios more often. We therefore calculate
two proxies for investors’ risk-taking behavior. Beta is the weighted average of each
shareholders’ portfolio betas. It measures the shareholders’ loading on systematic risk.
10 We also control for the activity of arbitrageur institutions, which have short horizons, are attracted to firms around the takeover event, and would cause a feedback from returns to investor turnover (see Section 3.3). 11 After the announcement, institutions sell, in percentage terms, about 5.5% of the holdings they had prior to the merger, the degree of concentration of holdings increases, and the investor turnover measure jumps about 5% in percent points relative to the quarter before the announcement (probably a result of the entrance of arbitrageur institutions). 12 This figure is consistent with Cai, Kaul and Zheng (2000). Given that CDA/Spectrum has quarterly frequency, the estimates of turnover are lower than those obtained if data were available at a higher frequency.

10
Manager concentration is the weighted average of shareholders’ portfolio concentration
(Herfindahl Index of their holdings). It proxies for investors’ sensitivity to idiosyncratic risk.
• Our measure of portfolio churning might be distorted by information-based trading. To capture
information-gathering abilities, we calculate Industry exposure as the average percentage of
shareholders’ portfolios that are invested in the industry the event firm belongs to. The
underlying assumption is that an investor who is heavily invested in an industry is likely to
have better information-gathering abilities or monitoring skills for that industry.
• Investor turnover might be capturing the particularly long investment horizon of corporate
governance activist institutions or short investment horizon of merger arbitrageurs. We
therefore add a measure of shareholder activism and one of arbitrage capital. Activism is the
fraction of the firm’s shares held by the public pension funds members of the Council of
Institutional Investors whose holdings are available in CDA/Spectrum.13 Arbitrage capital is
the sum of total portfolio holdings of arbitrageur institutions. We follow Baker and Savasoglu
(2002) and classify an investor to be an arbitrageur if his holdings go from zero to positive in a
target firm (in the quarter immediately following an acquisition announcement) for more than
two-hundred events during the sample period.
Table 2 shows that, not surprisingly, institutional ownership is larger in bidders (because the
latter are, on average, also larger firms). The median institutional ownership is 49% for bidders and
around 30% for targets (the P-value of a Wilcoxon difference of medians test is < .001).14 Concentration
of ownership is lower for bidder firms (5% versus 14% for targets, P-value < .001). Activist investors
have bigger stakes in bidder firms (6% versus 3%, P-value < .001).
4. Investment horizon and short-term takeover premium
The first issue we address is whether investment horizons affect the acquisition premium and the
bidder’s stock price performance around the announcement. Fig. 2 reports the average cumulative
abnormal returns around the acquisition announcement for firms with high investor turnover and for
firms with low investor turnover. We classify a firm as high (low) if its investor turnover is above
(below) the 67th (33rd) percentile of the distribution of investor turnover for the full CRSP-Compustat-
CDA/Spectrum universe of firms.
<Insert Fig. 2 near here>
13 The council is one of the broadest organizations defending active corporate governance. Our list of 14 institutions contains its most preeminent members. Several papers use the universe of council members to study the impact of activist policies. See Karpoff (1998) for a survey. 14 We discuss median values because the distributions of many of the variables are considerably skewed.

11
Fig. 2 suggests that target firms with high investor turnover exhibit lower premiums relative to
targets with low investor turnover. At the same time, bidders with high investor turnover underperform
more significantly than bidders with low investor turnover. This is preliminary but strong evidence of
our hypothesis that target (bidder) firms with short-term shareholders are associated with lower
premiums (more negative bidder abnormal returns).
4.1. Target firm results
We estimate the following White-adjusted ordinary least-squares (OLS) cross-sectional
regression for the target premium:
kkControlskholderVarsOtherSharekrnoverInvestorTuk υ+γ+δ+β= Premium ,,, XXX (3)
where XInvestorTurnover is the vector of investor turnover, XOtherShareholderVars is a matrix containing the
shareholder portfolio variables discussed in Section 3.3, and XControls is a matrix composed of the
standard set of control variables commonly employed in the M&A literature to predict target premiums.
Column 0 of Table 3 includes, for purposes of comparison with the literature, only the matrix of
controls. Like Schwert (2000) and Officer (2003), we find that the target’s premium is negatively related
to the target’s size, market-to-book ratio, and initial bidder toehold. The target’s premium is higher if the
deal is considered hostile, if it consists of a tender offer, or if it is an intra-industry acquisition.
Our base specification in Column 1 shows that the level of investor turnover of the target’s
shareholders negatively impacts the target’s premium (coefficient of –0.20, T-statistic of –2.2). This
result is economically significant: An increase of one standard deviation in the turnover rate (or of 0.15
per quarter, which represents a increase of about 30% of the average yearly churning of the investors’
portfolios) reduces the target firm’s premium by 3%. This increase in churning is equivalent to a
decrease in the investors’ holding period from 15 to 11 months.
This result survives an important series of robustness checks reported in Table 3. Column 2
includes the normalized trading volume of the target firm and the percentage of the firm’s shares held by
mutual funds and investment advisers. Investor turnover could be picking up the higher natural turnover
activity characteristic of very liquid stocks or the stakes of more aggressive investors such as mutual
funds or investment banks. Results show that this is not the case. Column 3 adds the holdings of
executive officers in the target firm for the year before the acquisition announcement.15 The T-statistic
of manager holdings is insignificant.16 More important, it is still the case that the presence of short-term
15 The source for managerial holdings is the Standard & Poor’s Execucomp database, which has information on the compensation of the top five officers of S&P-500, S&P Midcap-400, and S&P SmallCap-600 firms, from 1992 onward. The number of observations available in this regression is therefore much smaller. 16 This result echoes the Stulz (1988) argument that managers of the target firm will demand a high premium if they wish to be compensated for surrendering control, but they could also use their holdings to facilitate a deal (and reduce the premium) if they wish to sell out.

12
shareholders decreases the acquisition premium. Finally, Column 5 uses the actual offer premium as the
dependent variable in our regression. The results again indicate that target firms held by short-term
investors receive lower-ball offers. These findings support the hypothesis that incumbent shareholders
with short investment horizons lower the ability of targets to hold out in the deal negotiation and make it
more likely that weakly monitored target managers do not maximize returns for their shareholders.
<Insert Table 3 near here>
The impact of the investment horizon of the bidder’s shareholders on the returns of the target
firm (the cross-effect) provides further confirmation of our hypothesis. Column 4 and Column 6 of
Table 3 introduce the investor turnover of the bidder firm in the abnormal return premium and actual
offer premium regressions, respectively. The positive and significant coefficients show that short-term
held bidders are not only associated with higher returns accruing to target shareholders, but also that
these bidders offer a higher price for the target firm.
The level of institutional ownership (fraction) seems to affect positively the acquisition
premium, contrary to the findings of Stulz, Walkling, and Song (1990).17 Most of the other variables
(concentration of ownership, beta, manager concentration, and industry exposure) do not exhibit a
consistent sign across specifications. The positive sign of activism can be the result of activist investors’
higher ability to extract a bigger surplus from the bidder when they bargain to tender their shares or set
the terms of the merger agreement. Finally, the negative sign of change in arbitrage capital is consistent
with the Cornelli and Li (2002) prediction that arbitrage capital availability should facilitate takeovers.
4.2. Bidder firm results
Table 4 reports a similar analysis for the case of the bidder firm. Eq. (3) is estimated with the
same set of variables as before, with the exceptions that they now refer to the bidder instead of the target
and to the first bid made by each acquirer within a given contest. As in previous literature, firm and deal
characteristics have low power to explain the bidder abnormal returns around M&A events. The
introduction of the investor variables increases the explanatory power substantially, although to a still
low absolute level.
<Insert Table 4 near here>
The most important finding is the negative and significant coefficient of investor turnover that
holds across all specifications. This suggests that the more short term the shareholders are, the more
negative the bidder return (i.e., the higher the bidder discount) is. This finding is consistent with the
hypothesis that short-term investors appropriate less value in a takeover and provide managers more
17 Possible sources of this difference are the different sample and time period of their study. In addition, the authors use the square root, not the level, of ownership as an explanatory variable.

13
scope to undertake value-reducing acquisitions. Concerning the existence of cross-effects, Column 4
reports that the coefficient of the target firm’s investor turnover is positive but not statistically
significant. Differences in size between bidder and target firm might explain why this effect seems to be
hampered in this instance.
Columns 5 and 6 of Table 4 replicate our main specifications using the abnormal bidder return
calculated in a [–1, +1] trading days event window around the announcement date. The coefficient point
estimate of Column 5 is around –0.03, much lower than the –0.3 to –0.5 point estimates obtained using
the Schwert (2000) extended bidder abnormal return. This conclusion seems to indicate that for bidder
firms the market impact of shareholder horizons is spread over time instead of felt immediately at the
time of announcement. In the context of our hypothesis, this might be because the market takes time to
uncover the terms of the deal and its true value. We address this topic further in Section 6.
4.3. Additional robustness checks
We perform (unreported) additional tests that are also worth mentioning. First, our results are
unchanged if we explicitly exclude merger arbitrageurs from the set of shareholders used to construct
investor turnover, out of the concern that their presence in this measure might still be a source of bias.18
Second, we find that our results are robust to dropping the other shareholder portfolio variables
(fraction, concentration, manager concentration, industry exposure and beta) from the regression. Third,
we find that the results do not differ if we split the sample according to the mode of acquisition (mergers
versus tender offers).
We also investigate if differences in investment horizon matter more when management
interests are less aligned with shareholders. Datta, Iskandar-Datta, and Raman (2001) show that high
levels of Equity-based compensation (EBC), defined as the Black–Scholes value of recently awarded
options, provide the stronger incentives for managers to engage in value-creating acquisitions. We
therefore interact investor turnover with a dummy of whether a firm is above-median on EBC. The
interaction is positive and statistically significant, suggesting that the negative effect of investor turnover
on bidder abnormal returns is partially mitigated if bidder management is aligned with shareholder
interests. This supports our hypothesis that weak monitoring is one of the channels through which
investor horizons affect acquisitions.19
18 The average sample value of the resulting measure, “investor turnover no-arbs”, is 0.27 compared with 0.38 for investor
turnover calculated using all investors (P-value of difference < 0.01), so the churn rate of arbitrageurs is higher than that of
other investors. For example, the average churn rate of the top ten arbitrageurs is 0.54. 19 All the robustness results in this section are available upon request.

14
5. Investment horizon, probability of acquisition, and sample-selection correction
5.1. Probability of acquisition
A relevant issue in its own right is whether shorter investment horizons increase the likelihood
of a firm entering an M&A transaction, either as a bidder or target firm. To address this issue, we
estimate a probit model of the acquisition likelihood. Denote hk* the latent unobservable variable that
represents the value of the acquisition to the decision maker and hk a dummy that takes the value of one
if the company is involved in a deal: hk = 1 if hk* > 0 or hk = 0 if hk
* < 0. The probit regression to be
estimated for the probability of Prob(hk = 1) is
kkControlkholderVarsOtherSharekrnoverInvestorTukh υ+ς+η+θ= ,,,* XXX . (4)
To perform this analysis, we build an expanded data set that is made up of the universe of firms
for which we are able to match CRSP, COMPUSTAT, and CDA/Spectrum. The data set includes a total
of 17,640 different securities tracked over each of the sample years 1980 through 1999. We construct the
accounting and institutional control variables in the same way as before, with the exception that they are
now calculated as averages over the two years prior to the forecast year and an additional variable is
employed (the stock’s abnormal return, as defined in Comment and Schwert, 1995). The results are
reported in Table 5. Panel A reports, on the left column, the results of the likelihood of a firm being a
target in a given year and, on the right column, the results of the likelihood of being a bidder.
<Insert Table 5 near here>
Regarding the target firms, we find that firms with higher investor turnover have a significantly
higher chance of receiving an offer. This suggests that potential bidders are more willing to bid for firms
held by short-term investors, because these constitute easier targets with lower bargaining power in the
event of the bid. In terms of the control variables, the results are consistent with those existing in the
literature (Palepu, 1986; Comment and Schwert, 1995). Fraction has a positive coefficient, while
ownership concentration decreases the likelihood of receiving an offer (Pinkowitz, 1999). Changes in
arbitrage capital are positively related to the likelihood of receiving an offer. Regarding the bidder firms,
the positive coefficient of investor turnover again supports our conjectured hypothesis.
5.2. Sample-selection correction
If investment horizons affect the probability of an acquisition being observed, this could
potentially bias our previous OLS estimates. For example, if the presence of short-term shareholders for
the target firm facilitates bids, the potential economic value of the deal does not need to be so high to
compensate the costs of launching it. We would therefore observe a lower premium on average. This
could induce a negative relation between average premiums and the amount of short-term investors.

15
Therefore, to identify the marginal effect of investor turnover on premium, we need to control for
sample selection.
Heckman (1979) suggests a two-stage procedure to solve the sample-selection problem, based
on first estimating Eq. (4) using a probit choice model and then running OLS on
kkkControlskholderVarsOtherSharekrnoverInvestorTuk υ+σλ+γ+δ+β= 2 2 2 Premium ,,, XXX (5)
where λk is a term known as Heckman’s Lambda, constructed using the results from the first stage. The
standard errors in the second stage regression are corrected for heteroskedasticity and for the fact that
Lambda is an estimated regressor (Greene, 1997). The significance of the estimate of σ obtained from
Eq. (5) provides a test of the null of no sample selection bias. The results are reported in Table 5, Panel
B. The left-hand side contains the results of the second-stage estimates for target firms, with two
alternative premium measures: the abnormal return premium and the actual offer premium (these should
be compared with Column 4 and Column 6, respectively, of Table 3). The right-hand side contains the
results for the bidder firms.
Our basic conclusions are left unchanged. The coefficient of the target’s investor turnover is
significant and negative, while the cross-effect (the investor turnover of the bidder firm) is positive. The
point estimates and significance levels are similar to those reported in Table 3. The results for the bidder
also replicate our earlier single-stage results from Table 4. We conclude that our results do not stem
from a potential sample selection problem.20 The coefficient of Heckman’s Lambda is significant and
negative for the abnormal return premium regression, which means that sample selection was
empirically relevant (at least for the target regressions using the abnormal return premium measure).
We also perform a probit analysis of the success probability of the merger (not reported). Our
results confirm Schwert (2000) and other researchers’ findings that hostility is the only powerful
predictor of merger success. Investor turnover is not significant. Shareholding structure hence affects
jointly the likelihood of a bid and its pricing but has little predictive power over the outcome of the
contest once initiated. If the characteristics of the bid are an equilibrium response to the shareholder
structure, then there is no reason to expect a relation between investor turnover and success rates. For
example, short-term investors make firms easier targets but also command lower premiums, therefore
mitigating any effect of investment horizon on the probability that a deal goes through.
6. Investment horizon and long-term performance
Research on the long-run performance of mergers has shown that returns to bidder firms are on
average nonpositive, with some authors finding positive but insignificant returns (e.g., Franks, Harris, 20 One difference to Table 4 is that the cross-effect term (the target’s investor turnover) in the bidder regression is now significantly positive.
16
and Titman, 1991) and others reporting negative and significant returns (e.g., Agrawal, Jaffe, and
Mandelker, 1992). Subsequent papers (Loughran and Vijh, 1997; Rau and Vermaelen, 1998) reveal that
this long-run underperformance is primarily found in acquisitions paid in stock and in the case of
glamour acquirers. The crucial issue in both cases is that the announcement date stock price reaction
does not fully incorporate into prices all the relevant information about the merger.
The results of Sections 4 and 5 show that, in the short-run, the division of gains tends to harm
bidder firms with more short-term investors. This is consistent with short-term investors allowing the
bidder’s management to bid too aggressively. If it takes time for the market to learn about the true
quality of the deal, we expect to find a pattern of under-reaction where firms with short-term
shareholders exhibit greater long-run underperformance. We test this prediction by looking at long-run
returns of acquirer firms, conditional on the type of shareholding structure they had before the merger.
We employ two long-run study methodologies: the calendar-time portfolio regression (CTPR)
approach (e.g., Ikenberry, Lakonishok, and Vermaelen, 2000) and the calendar-time abnormal return
(CTAR) approach (Jaffe, 1974; Mandelker, 1974). The CTPR approach has the advantage of taking into
account cross-sectional dependence and being less sensitive to model misspecification (Mitchell and
Stafford, 2000). The CTAR approach offers a solution to the heteroskedasticity problem induced by the
clustering of events over time, a characteristic feature of M&A activity (Fama, 1998). Full details
concerning the two methodologies can be found in Table 6.
<Insert Table 6 near here>
For each month of the sample period (1980–1999), we form portfolios of bidder firms that have
just completed an acquisition during that month and keep them in a portfolio for a prespecified holding
period. Portfolios are rebalanced monthly to drop all the firms that have just reached the end of their
holding period and to add all firms that have just completed a transaction. We exclude multiple
observations of the same firm that occur within the same holding period (Mitchell and Stafford, 2000).
We use holding periods of one to 12 months (one year), one to 24 months (two years), and one to 36
months (three years) after the event month.
To capture the cross-sectional variation in shareholding behavior, we form portfolios as follows.
Each month, we sort all the stocks in the CRSP-COMPUSTAT-CDA/Spectrum universe according to
their institutional shareholders’ turnover.21 An acquirer firm is considered an acquirer with high investor
turnover if its investor turnover variable is in the top third of the distribution for the entire universe in
the month prior to the acquisition. Inversely, an acquirer is considered an acquirer with low investor
turnover if its investor turnover variable is in the bottom third of the distribution. We then form a 21 To have a more conservative test, calculations in this section exclude arbitrageur institutions. Because arbitrageurs present in the bidder sell on announcement, their short-term nature allows more overbidding and implies a higher likelihood of finding underperformance. Results are not sensitive to this modification.

17
portfolio that buys acquirers with high investor turnover and sells acquirers with low investor turnover,
to investigate whether there are significant performance differences between the two types of firms.
Table 6 reports the results for both equal-weighted and value-weighted portfolios and for the
CTPR and CTAR approaches. Panel A shows the results for the portfolio of all acquirers in the sample.
The results are comparable to the findings of previous literature. Over a holding period of three years,
the value-weighted portfolio of acquirers exhibits a negative abnormal return of –0.2% per month, or –
2.4% per year (Column 6 of the table). Panel B shows that the alpha of a portfolio strategy that buys
acquirers with short-term shareholders and sells acquirers with long-term shareholders is negative and
highly significant.
The data support our conjecture that underperformance is worse for acquirers held by short-term
shareholders. Over a holding period of three years, the value-weighted portfolio strategy exhibits
negative abnormal returns of –0.7% per month, or –8% per year. Using equal-weighted returns delivers
similar results. If equal weighting is used, the effect is already visible the year immediately following
the acquisition. In addition, most of this abnormal negative performance comes from the
underperformance of acquirers with short-term investors. The bottom panels show the alpha coefficient
for a portfolio that buys exclusively acquirers with high investor turnover (Panel C) and a portfolio that
buys exclusively acquirers with low investor turnover (Panel D). The alpha coefficient and the SR
statistic of the acquirers with high investor turnover is of the same order of magnitude as that of the
difference portfolio, while the acquirers with low investor turnover portfolio does not exhibit abnormal
returns.22
Why is this underreaction pattern observed only for firms held by short-term investors? We
believe that such a mispricing phenomenon is more likely for companies in which investors have shorter
horizons, because these investors do not have strong incentives to arbitrage the price back to
fundamental value (DeLong, Shleifer, Summers, and Waldmann, 1990). This reasoning relies on the
assumption that long-term capital is scarce. Goldman and Slezak (2003) develop a model in which short
tenure by delegated portfolio managers lowers their incentive to trade on long-term information. As a
result, the shorter is the investment horizon of fund managers, the more likely it is that prolonged
rational mispricing can occur.
22 As a robustness check, we repeat the analysis considering the case of industry-adjusted returns (e.g., Gompers, Ishii, and Metrick, 2003). Using the Fama and French (1997) industry classification, we calculate a value-weighted excess return for all industries and subtract from each acquirer return the corresponding industry return before constructing the portfolios. Results are similar and are available upon request.

18
7. Conclusion
The attention given to shareholder characteristics in the M&A literature has mostly been
restricted to the role played by institutional differences between classes of shareholders (e.g., firm
managers, affiliated blockholders, or institutional investors). We focus on differences in investment
horizon, and we put forward explanations as to why they are likely to be a major source of variation in
the value of a takeover deal. A longer investment horizon of the shareholders implies a higher ability to
hold out in the merger negotiation. At the same time, shareholders with longer investment horizon have
bigger incentives to monitor. This means that firm managers are less likely to trade off shareholder
returns for their own personal benefit.
We show that investment horizon affects the affordability of takeovers. Short-term shareholders
in the target enhance the likelihood of a takeover and lower its cost. At the same time, short-term
shareholders in the bidder give managers more leeway to carry out value-reducing acquisitions. Long-
term investors defend management from takeovers (by making bids more expensive) but also prevent
overbidding and value-reducing acquisitions.
In future work it is worth investigating the impact of shareholder horizons on other aspects of
corporate control. Given our findings, we expect that shareholders’ horizon will affect the outcome of
other events in which shareholder monitoring and bargaining constitute major features (such as proxy
fights, going private transactions, or self-tender offers). At a more general level, it would be interesting
to study the determinants of a firm’s shareholder base. We believe that long-term capital is scarce,
because of the problems discussed in the literature (e.g., the importance of liquidity needs or the
distortions of incentives caused by delegated portfolio management). Hence long-term capital cannot
have a major presence in all firms. What are the key attributes that attract long-term capital to a
company or that persuade existing shareholders to hold their investments for longer periods? This is an
open question left for future research.

19
References
Agrawal, A., Jaffe, J. F., Mandelker, G. N., 1992. The post-merger performance of acquiring firms: a re-
examination of an anomaly. Journal of Finance 47(4), 1605-1621.
Ambrose, B. W., Megginson, W. L., 1992. The role of asset structure, ownership structure and takeover
defenses in determining acquisition likelihood. Journal of Financial and Quantitative Analysis
27(4), 575-589.
Andrade, G., Mitchell, M., Stafford, A., 2001. New evidence and perspectives on mergers. Journal of
Economic Perspectives 15(2), 103-120.
Bagwell, L., 1991. Shareholder heterogeneity: evidence and implications. American Economic Review
81(2), 218-221.
Baker, M., Savasoglu, S., 2002. Limited arbitrage in mergers and acquisitions. Journal of Financial
Economics 64(1), 91-115.
Barber, B., Odean, T., 2000. Trading is hazardous to your wealth: the common stock investment
performance of individual investors. Journal of Finance 55, 773-806.
Betton, S., Eckbo, B. E., 2000. Toeholds, bid-jumps, and expected payoffs in takeovers. Review of
Financial Studies 13, 841-882.
Bolton, P., and Von Thadden, E.-L., 1998. Blocks, liquidity, and corporate control. Journal of Finance
53(1), 1-25.
Bushee, B. J., 2001. Do institutional investors prefer near-term earnings over long-run value?
Contemporary Accounting Research 18(2), 207-246.
Cai, F., Kaul, G., Zheng, L., 2000. Institutional trading and stock returns. Mimeo.
Carhart, M., 1997. On persistence in mutual fund performance. Journal of Finance 52, 57-82.
Chidambaran, N., John, K., 1999. Managerial compensation and the efficiency of large shareholder
monitoring. Unpublished working paper. New York University, Center for Law and Business.
Comment, R., Schwert, W., 1995. Poison or placebo? Evidence on the deterrence and wealth effects of
modern antitakeover measures. Journal of Financial Economics 39, 3-43.
Cornelli, F., Li, D., 2002. Risk arbitrage in takeovers. Review of Financial Studies 15, 837-868.
CRSP, 2003. CRSP Survivor–Bias Free U.S. Mutual Fund Database Guide. University of Chicago,
Chicago, Illinois.
Datta, S., Iskandar-Datta, M., Raman, K., 2001. Executive compensation and corporate acquisition
decisions. Journal of Finance 56(6), 2299-2336.
DeLong, B., Shleifer, A., Summers, L., Waldmann, R., 1990. Noise trader risk in financial markets.
Journal of Political Economy 98(4), 703-738.
Dow, J., Gorton, G., 1997. Noise trading, delegated portfolio management, and economic welfare.
Journal of Political Economy 105(5) 1024-1050. Edelen, R. M., 1999. Investor flows and the assessed performance of open-end mutual funds. Journal of
Financial Economics 5, 439-466.

20
Fama, E., French, K. R., 1993. Common risks factors in the returns on stocks and bonds. Journal of
Financial Economics 33(1), 3-56.
Fama, E., French, K. R., 1997. Industry costs of equity. Journal of Financial Economics 43, 153-193.
Fama, E., 1998. Market efficiency, long-term returns, and behavioral finance. Journal of Financial
Economics 49, 283-306.
Franks, J.,, Harris R., Titman, S., 1991. The postmerger share-price performance of acquiring firms.
Journal of Financial Economics 29(1), 81-96.
Fuller, K., Netter J., Stegemoller, M., 2002. What do returns to acquiring firms tell us? Evidence from
firms that make many acquisitions. Journal of Finance 52, 1763-1793.
Goldman, E. and Slezak, S., 2003. Delegated portfolio management and rational prolonged mispricing.
Journal of Finance 58(1), 283-311.
Gompers, P., Metrick, A., 2001. Institutional investors and equity prices. Quarterly Journal of
Economics 116(1), 229-259.
Gompers, P., Ishii, J., Metrick, A., 2003. Corporate governance and equity prices. Quarterly Journal of
Economics 118(1), 107-155.
Greene, W. H., 1997. Econometric Analysis, 3rd ed. Prentice-Hall, New Jersey.
Grossman, S. and Hart, O., 1980. Takeover bids, the free-rider problem, and the theory of the
corporation. Bell Journal of Economics 11, 42-64.
Hartzell, J., Ofek E., Yermack, D., 2004. What’s in it for me? Personal benefits obtained by CEOs
whose firms get acquired. Review of Financial Studies 17, 37-61.
Heckman, J., 1979. Sample selection bias as a specification error. Econometrica 47, 153-161.
Hotchkiss, E. S., Strickland, D., 2000. Does shareholder composition matter? Evidence from the market
reaction to corporate earnings announcements. Mimeo.
Holmström, B., Kaplan, S., 2001. Corporate governance and merger activity in the U.S.: making sense
of the 80s and 90s. Journal of Economic Perspectives 15(2), 121-144.
Ikenberry, D., Lakonishok, J., Vermaelen, T., 2000. Stock repurchases in Canada: performance and
strategic trading. Journal of Finance 55(5), 2373-2397.
Jaffe, J., 1974. Special information and insider trading. Journal of Business 47, 410-428.
Jensen, M., 1986. Agency costs of free cash flow, corporate finance, and takeovers. American Economic
Review 76, 659-665.
Jensen, M., 1993. The modern industrial revolution, exit, and the failure of internal control systems.
Journal of Finance 48(3), 831-880.
Kahn, C., Winton, A., 1998. Ownership structure, speculation, and shareholder intervention. Journal of
Finance 53(1), 99-129.
Karpoff, J. M., 1998. The impact of shareholder activism on target companies: a survey of empirical
findings. Mimeo.
Kensinger, J., Martin, J., 1996. Relationship investing: what active institutional investors want from
management. Financial Executives Research Foundation.
21
Loughran, T., Vijh, A. M., 1997. Do long-term shareholders benefit from corporate acquisitions. Journal
of Finance 52(5), 1765-1790.
Mandelker, G., 1974. Risk and return: the case of merging firms. Journal of Financial Economics 1, 303-
335.
Mitchell, M. L., Stafford, E., 2000. Managerial decisions and long-term stock price performance.
Journal of Business 73(3) 287-329.
Morck, R., Shleifer, A., Vishny, R., 1990. Do managerial objectives drive bad acquisitions? Journal of
Finance 45(1), 31-48.
Noe, T., Rebello, M., 1997. Renegotiations, investment horizons, and managerial discretion. Journal of
Business 70(3), 385-407.
Officer, M., 2003. Termination fees in mergers and acquisitions. Journal of Financial Economics, 69,
431-437.
Palepu, K. G., 1986. Predicting takeover targets–a methodological and empirical analysis. Journal of
Accounting and Economics 8, 3-35.
Pinkowitz, L., 1999. Monitoring by transient investors? Institutions and corporate control. Mimeo.
Porter, M., 1992. Capital disadvantage: America’s falling capital investment system. Harvard Business
Review, September-October, 65-83.
Rau, P. R., Vermaelen, T., 1998. Glamour, value, and the post-acquisition performance of acquiring
firms. Journal of Financial Economics 49(2), 223-253.
Roll, R., 1986. The hubris hypothesis of corporate takeovers. Journal of Business 59, 197-216.
Scharfstein, D. S., Stein, J. C., 1990. Herd behavior and investment. American Economic Review 80(3),
465-479.
Schwert, G. W., 2000. Hostility in takeovers: in the eyes of the beholder? Journal of Finance 55(6),
2599-2640.
Shleifer, A., 1986. Do demand curves for stocks slope down? Journal of Finance 41, 579-590.
Shleifer, A., Vishny, R., 1986. Large shareholders and corporate control. Journal of Political Economy
94(3), 461-488.
Shleifer, A., Vishny, R., 1997. The limits of arbitrage. Journal of Finance 52, 35-55.
Stein, J. C., 1989. Efficient capital markets, inefficient firms: a model of myopic corporate behavior.
Quarterly Journal of Economics 104, 655-669.
Stulz, R. M., 1988. Managerial control of voting rights: financing policies and the market for corporate
control. Journal of Financial Economics 20(1/2), 25-54. Stulz, R., Walkling R., Song, M., 1990. The distribution of target ownership and the division of gains in
successful takeovers. Journal of Finance 45(3), 817-833.
Useem, M., 1996. Investor capitalism. BasicBooks, New York.

22
Fig. 1
Investor turnover, our main independent variable, is the average of investors’ churn rates for a one-year period that finishes at
least two full quarters before the announcement date. The run-up period is defined as the interval of trading days [-63, -1]
relative to the announcement date (Schwert, 2000). Markup is analogously defined, for trading days [0, 126]. Our main
dependent variable, abnormal return premium, is the sum of abnormal returns during the run-up and the markup period.
average of investors’ churn rates at quarters –5, ..., –2
Run-up
Markup
Markup period Run-up period
0 −1 +1
Announcement date
Cumulative
abnormal returns
Premium
=
+
Time (quarters) −3 −4 −5 −6
CRi,–5 CRi,–4 CRi,–3 CRi,–2
Investor turnover =
−2

23
-10
-5
0
5
10
15
20
25
-63 -54 -45 -36 -27 -18 -9 0 9 18 27 36 45 54
Cumulativeabnormalreturns(percent)
Trading days relative to merger announcement
TARGET - low investor turnover
TARGET - high investorturnover
BIDDER - low investor turnover
BIDDER - high investor turnover
Fig. 2 Cumulative abnormal returns around acquisition announcement: firms with high investor turnover versus firms with low investor turnover. Cumulative abnormal returns for target and bidder firms are measured relative to a CRSP value-weighted market model using a year of prior daily data (Schwert, 2000). Investor turnover is the average of investors’ churn rates for a one-year period that finishes at least two full quarters before the announcement date. Each month we sort all stocks in the CRSP-COMPUSTAT-CDA/Spectrum universe according to their investor turnover. A target is considered a high investor turnover firm if its investor turnover variable is in the top third of the distribution for the entire universe on the month prior to the acquisition. Inversely, a target is considered a low investor turnover firm if its investor turnover variable is in the bottom third of the distribution for the entire universe in the month prior to the acquisition. The same procedure is used for the case of bidder firms.
24
Table 1 Summary statistics for the sample used in this study. Our base sample consists of 3,814 events recorded in the SDC mergers and acquisitions database from 1980 to 1999 that have non-missing data for the variables used in the regressions in the following tables. We keep acquisition announcements that are the first bid for a target in each contest. For each company involved in the event, we obtain the corresponding accounting variables (from COMPUSTAT), stock price behavior (from CRSP), and institutional investor variables (from CDA/Spectrum and our previous calculations). N denotes the number of cases (observations) for which the variable in question is present in the sample, and the numbers provided are sample averages (unless otherwise noted). An acquisition is considered successful if the “status” field in SDC has “completed” as keyword. An acquisition is considered hostile if the “attitude” field in SDC was marked “unsolicited” or “hostile.” The “consideration offered” field in SDC refers to the list of all components of consideration (i.e., means of payment) offered by the acquirer/bidder. An acquisition is considered all-cash if the field “consideration offered” in SDC had only “cash” as keyword. An acquisition is considered all-equity if the field “consideration offered” in SDC did not include “cash” as keyword. To define intra-industry acquisitions, we use the Fama and French (1997) 49-industry classification. The SIC code used to classify firms was obtained from CRSP. Abnormal return premium is the premium, defined as the cumulative abnormal return, measured relative to a CRSP value-weighted market model using a year of prior daily data, to the target firm stock for trading days [-63, +126] relative to the announcement date (see Schwert, 2000). Actual offer premium is the premium defined as [bidder’s offer / target’s pre-bid market value of equity) – 1], where the value of the bidder’s offer is computed using, in order of availability, the sum of the value of the considerations offered, the initial offer price, or the final offer price as reported in SDC (see Officer, 2003, for details). Days to completion is the difference in calendar days between the announcement date and the date the deal is considered effective.
N Full sample 1980–1989 1990–1999
Number of events – 3,814 1,232 2,582
Percent successful 3,814 84.6% 77.5% 88.0%
Percent hostile 3,814 6.1% 10.8% 3.9%
All cash 3,814 63.2% 64.2% 62.7%
All stock 3,814 15.0% 7.9% 18.4%
Intra-industry 3,814 31.4% 21.7% 36.0%
Target listed on Nasdaq 3,814 51.7% 33.0% 60.7%
Abnormal return premium 3,814 21.5% 16.3% 23.9%
Actual offer premium 2,501 52.7% 48.4% 54.4%
Acquirer leverage > target 1,453 74.3% 77.4% 73.3%
Acquirer M/B > target M/B 1,410 65.7% 59.1% 67.9%
Relative size (median) 1,532 19.5% 25.3% 17.7%
Days to completion (median) 3,227 59 49 64

25
Table 2 Summary statistics of the shareholder variables for target and bidder firms. Denote by S the set of shareholders in company k and by wk,i,t the weight of investor i in the total percentage held by institutional investors in quarter t. The instant of measurement t is such that there is at least two full quarters between the measurement of all shareholder variables and the announcement date. The investor turnover of firm k is the weighted average of the average total portfolio churn rates of its investors over four quarters (see text for details on the construction of the churn rates):
.,,,∑ ∑∈ =
+−
=
Si rrtitik CRwk
4
114
1 firm of Turnover Investor
Fraction denotes the ratio of a firm’s shares held by institutional investors relative to total shares outstanding in CRSP. Concentration is the Herfindahl Index calculated over the distribution of weights wk,i,t. For each institutional investor, we calculate the Herfindahl Index and the average beta of its portfolio. Manager concentration is the weighted average (using the
weights wk,i,t) of the Herfindahl Index for all investors i ∈ S. Similarly, beta is the weighted average (using the weights wk,i,t) of
the betas of all investors i ∈ S. The activism variable is the fraction of the firm’s shares held by activist institutional investors relative to total shares outstanding. Activist investors are the ones belonging to the list of members of the Council of Institutional Investors. We also include in this table a measure of the change in arbitrage capital (following Baker and Savasoglu, 2002), measured in percentage terms. Arbitrage capital is the sum of total portfolio holdings of institutions considered as arbitrageurs. An institution is considered an arbitrageur if its holdings go from zero to positive in a target firm in the quarter immediately following a takeover announcement, for more than two hundred events during the sample period. This variable takes only one value per quarter; the averages presented are therefore time-series averages during the sample period.
Full sample 1980–1989 1990–1999
N Mean Median Standard
Error Mean Median Standard
Error Mean Median Standard
Error
Target
Investor turnover 3,736 0.37 0.37 0.15 0.42 0.44 0.14 0.35 0.32 0.15
Fraction 3,746 0.33 0.30 0.23 0.28 0.24 0.20 0.35 0.32 0.23
Concentration 3,746 0.21 0.14 0.20 0.23 0.15 0.23 0.20 0.13 0.19
Manager concentration 3,746 0.02 0.01 0.03 0.02 0.02 0.03 0.02 0.01 0.03
Industry exposure 3,746 0.05 0.04 0.05 0.04 0.03 0.04 0.05 0.04 0.05
Beta 3,746 1.13 1.10 0.15 1.08 1.07 0.10 1.15 1.13 0.16
Activism 2,864 0.05 0.03 0.07 0.05 0.03 0.05 0.05 0.03 0.08
Bidder
Investor turnover 2,162 0.38 0.39 0.14 0.43 0.45 0.14 0.36 0.32 0.13
Fraction 2,168 0.47 0.49 0.24 0.37 0.39 0.21 0.52 0.55 0.24
Concentration 2,168 0.11 0.05 0.16 0.13 0.06 0.19 0.10 0.05 0.14
Manager concentration 2,168 0.02 0.01 0.02 0.02 0.02 0.02 0.02 0.01 0.03
Industry exposure 2,168 0.06 0.05 0.05 0.05 0.04 0.05 0.06 0.05 0.05
Beta 2,168 1.12 1.10 0.13 1.07 1.07 0.09 1.15 1.11 0.14
Activism 1,967 0.06 0.06 0.06 0.06 0.06 0.06 0.06 0.06 0.06
Change in arbitrage capital 3,184 0.05 0.06 0.09 0.04 0.06 0.10 0.06 0.06 0.08

26
Table 3 Ordinary least squares estimates of the relation between investor turnover and the target’s premium. The left-hand side variables are the target firm’s abnormal return premium and actual offer premium, as defined in text and the caption of Table 1. The right-hand side variables are all measured for the target firm, and all accounting variables are calculated over the fiscal year prior to the acquisition, except where noted. ROE is the ratio of earnings to average equity [COMPUSTAT items 20 / (60 + 60 (t – 1)]. Sales growth is the proportional change in sales (log [COMPUSTAT items 12 / 12 (t – 1)]). Liquidity is the ratio of net liquid assets to total assets [COMPUSTAT items (4 – 5) / 6]. D/E is the ratio of debt to equity (COMPUSTAT items 9 / 60). M/B is the ratio of year-end market value of common stock to book value of equity (COMPUSTAT items 24 * 25 / 60). P/E is the ratio of year-end stock price to earnings per share (COMPUSTAT items 24 / 58). Size is the log of equity capitalization at the start of the runup period (price times shares outstanding from CRSP). An acquisition is considered hostile if the “attitude” field in SDC was marked “unsolicited” or “hostile”. Competing bids is a dummy variable indicating whether SDC records another bid by a different bidder for the same target firm in the following six months (as in Officer, 2003). Intra-industry is a dummy variable indicating whether the acquisition involved two firms belonging to the same Fama and French (1997) 49-industry classification. Tender offer is a dummy variable equal to one if the bid involved a tender offer (as recorded in SDC). Toehold is a dummy variable equal to one if the fraction of the target’s common stock owned by the bidder is greater than 5% at the bid announcement date or zero otherwise (following Officer, 2003). Denote by S the set of shareholders in company k and by wk,i,t the weight of investor i in the total percentage held by institutional investors in quarter t. The instant of measurement t is such that there is at least two full quarters between the measurement of all shareholder variables and the announcement date. The investor turnover of firm k is the weighted average of the average total portfolio churn rates of its investors over four quarters (see text for details on the construction of the churn rates):
.,,,∑ ∑∈ =
+−
=
Si rrtitik CRwk
4
114
1 firm of Turnover Investor
Fraction denotes the ratio of a firm’s shares held by institutional investors relative to total shares outstanding in CRSP. Concentration is the Herfindahl Index calculated over the distribution of weights wk,i,t. For each institutional investor, we calculate the Herfindahl Index and the average beta of its portfolio. Manager concentration is the weighted average (using the weights wk,i,t) of the Herfindahl
Index for all investors i ∈ S. Similarly, beta is the weighted average (using the weights wk,i,t) of the betas of all investors i ∈ S. The activism variable is the fraction of the firm’s shares held by activist
institutional investors relative to total shares outstanding. Activist investors are the ones belonging to the list of members of the Council of Institutional Investors. We also included in this table a measure of the change in arbitrage capital (following Baker and Savasoglu, 2002), measured in percentage terms. Arbitrage capital is the sum of total portfolio holdings of institutions considered as arbitrageurs. An institution is considered an arbitrageur if its holdings go from zero to positive in a target firm in the quarter immediately following a takeover announcement, for more than two hundred events during the sample period. All specifications include time dummies (for the year where announcement takes place) and industry dummies (for the target firm’s industry, the latter obtained from the Fama and French, 1997, classification). Volume is the trading volume for the target firm, measured as the average daily (raw) number of shares of traded during the year prior to the run-up period (trading days [-316, -64] relative to the announcement date), divided by shares outstanding at the beginning of the run-up period. The fraction held by category 3 (mutual funds) and by category 4 (investment advisers) is the ratio of a firm’s shares held by institutional investors of these categories relative to total shares outstanding. Managerial Holdings is the ratio of a firm’s shares held by management officers of the firm (obtained from EXECUCOMP) relative to total shares outstanding. The turnover of BIDDER firm (cross-effect) is the investor turnover measure calculated as above, but for shareholders of the bidder firm. T-statistics are calculated using White’s heteroskedastic consistent errors. The symbols ***,**, and * denote significance levels of 1%, 5%, and 10%, respectively, for the two-tailed hypothesis test that the coefficient equals zero.

27
Table 3 (cont.)
Dependent variable Abnormal return premium Actual offer premium
(0) (1) (2) (3) (4) (5) (6) Coefficient T-statistic Coefficient T-statistic Coefficient T-statistic Coefficient T-statistic Coefficient T-statistic Coefficient T-statistic Coefficient T-statistic Intercept 0.905 11.92 *** 1.387 6.15 *** 1.228 5.16 *** 1.848 2.88 *** 1.161 3.55 *** 0.780 5.30 *** 0.790 2.13 **
ROE 0.002 0.43 0.001 0.15 -0.001 -0.13 0.027 0.56 0.001 0.15 0.002 0.44 -0.007 -1.49
Sales growth -0.024 -1.10 -0.073 -2.68 *** -0.042 -1.15 -0.125 -1.29 -0.029 -0.64 -0.017 -0.71 -0.042 -1.29
Liquidity -0.006 -0.16 -0.008 -0.15 -0.035 -0.61 -0.055 -0.35 -0.077 -1.09 -0.020 -0.42 -0.182 -2.65 ***
D/E 0.022 0.44 0.132 2.20 ** 0.077 1.34 -0.217 -1.50 0.068 0.94 0.090 1.64 0.062 0.88
M/B -0.006 -2.57 ** -0.006 -1.88 * -0.007 -2.01 ** 0.001 0.23 -0.007 -1.45 0.002 0.79 0.004 0.93
P/E 0.000 -1.11 0.000 -1.14 0.000 -0.56 -0.001 -0.78 0.000 -1.04 0.000 -1.02 0.000 -0.89
Size -0.062 -10.62 *** -0.088 -9.58 *** -0.079 -8.59 *** -0.086 -2.60 *** -0.078 -6.68 *** -0.047 -5.57 *** -0.023 -2.18 **
Hostility 0.046 1.69 * 0.081 2.96 *** 0.091 3.18 *** 0.105 1.35 0.034 0.90 0.055 1.77 * 0.041 0.97
Competing bids 0.072 1.71 * 0.091 2.04 ** 0.081 1.99 ** 0.264 1.40 0.058 1.40 0.006 0.14 -0.006 -0.13
Intra-industry 0.098 5.35 *** 0.075 3.67 *** 0.061 3.00 *** 0.020 0.33 -0.008 -0.30 0.082 4.10 *** 0.052 1.93 *
Tender offer 0.240 12.58 *** 0.207 10.00 *** 0.203 9.30 *** 0.170 1.33 0.160 5.77 *** 0.137 6.20 *** 0.043 1.44
Toehold -0.148 -8.04 *** -0.122 -6.01 *** -0.116 -5.50 *** -0.147 -2.58 ** -0.091 -3.20 *** -0.129 -5.42 *** -0.163 -5.14 ***
Investor turnover -0.200 -2.20 ** -0.348 -3.50 *** -1.088 -3.32 *** -0.560 -4.51 *** -0.176 -2.00 ** -0.239 -1.76 *
Fraction 0.083 1.66 * 0.243 2.21 ** 0.049 0.16 0.273 1.95 * 0.076 1.49 0.252 1.99 **
Concentration -0.141 -1.53 -0.052 -0.34 -0.369 -0.57 0.004 0.02 0.224 2.09 ** 0.522 3.07 ***
Manager concentration 0.340 1.45 0.059 0.17 3.813 3.57 *** 0.069 0.17 -0.071 -0.15 -0.756 -1.59
Industry exposure 0.114 0.50 0.186 0.66 -2.991 -3.11 *** 0.116 0.35 0.462 1.92 * 0.038 0.12
Beta -0.181 -2.18 ** -0.118 -1.29 0.003 0.01 -0.141 -1.31 0.340 4.20 *** 0.300 2.60 ***
Activism 0.558 3.48 *** 0.630 3.07 *** 0.937 1.88 * 0.544 2.75 *** -0.168 -1.21 -0.314 -1.69 *
Change in arbitrage capital -0.242 -1.96 ** -0.342 -2.78 *** -0.453 -1.05 -0.206 -1.40 0.005 0.04 0.023 0.16
Volume -1.095 -0.39 -6.561 -0.81 -0.868 -0.24 8.909 3.37 ***
Fraction category 3 (mutual funds) 0.057 0.29 0.387 0.64 0.160 0.66 -0.290 -1.41
Fraction category 4 (investment advisers) -0.414 -2.76 *** -0.041 -0.10 -0.331 -1.76 * -0.085 -0.47 Managerial holdings -0.325 -1.22
Turnover of BIDDER (cross-effect) 0.405 5.33 *** 0.424 5.84 ***
Year and industry dummies – Yes Yes Yes Yes Yes Yes
Mean squared error 0.24 0.22 0.18 0.16 0.17 0.15 0.13 Adjusted R2 0.093 0.140 0.159 0.106 0.162 0.113 0.126 N 3,814 2,863 2,340 258 1,471 1,880 984

28
Table 4 Ordinary least squares estimates of the relation between investor turnover and the bidder’s short-term stock price performance. We keep the first bid made by each different acquirer within a given contest. The left-hand side variable in Columns 1 through 4 is the bidder’s abnormal return, defined as the cumulative abnormal return, measured relative to a CRSP value-weighted market model regression using a year of prior daily data, to the bidder firm’s stock for trading days [-63, +126] relative to the announcement date (Schwert, 2000). Columns 5 and 6 replicate Columns 1 and 4 but use as a dependent variable the sum of the bidder abnormal returns in the [–1, +1] event window around the announcement date. The right-hand side variables are all measured for the bidder firm following the procedures detailed in the caption to Table 3. T-statistics are calculated using White’s heteroskedastic consistent errors. The symbols ***,**, and * denote significance levels of 1%, 5%, and 10%, respectively, for the two-tailed hypothesis test that the coefficient equals zero.

29
Table 4 (cont.)
Dependent variable Bidder abnormal return Bidder abnormal return in days [-1, 1]
(0) (1) (2) (3) (4) (5) (6)
Coefficient T-statistic Coefficient T-statistic Coefficient T-statistic Coefficient T-statistic Coefficient T-statistic Coefficient T-statistic Coefficient T-statistic
Intercept 0.047 0.53 0.426 1.86 * 0.744 3.65 *** 1.099 3.39 *** 0.784 3.77 *** -0.029 -1.07 -0.014 -0.48
ROE -0.007 -0.16 0.041 0.61 -0.056 -1.67 * -0.096 -1.93 * -0.063 -1.85 * 0.000 -3.04*** 0.000 -0.94
Sales growth -0.033 -1.46 0.001 0.05 -0.016 -0.78 0.040 1.09 -0.007 -0.33 0.000 0.01 -0.003 -1.02
Liquidity 0.021 0.36 -0.159 -2.36 ** -0.144 -2.10 ** -0.071 -0.67 -0.159 -2.31 ** -0.001 -0.07 -0.003 -0.29
D/E -0.001 -0.20 -0.001 -0.10 -0.009 -1.38 0.009 1.33 -0.011 -1.46 0.000 -0.02 0.000 0.51
M/B -0.001 -0.51 0.001 0.49 0.000 -0.17 -0.010 -2.34 ** 0.000 -0.02 0.000 -1.38 0.000 -0.58
P/E 0.000 0.64 0.000 0.87 0.000 0.39 0.000 -0.52 0.000 1.32 0.000 -1.89* 0.000 -1.43
Size -0.008 -1.39 -0.030 -3.17 *** -0.030 -3.18 *** -0.027 -1.93 * -0.030 -3.13 *** 0.002 1.51 0.002 1.55
Hostility -0.055 -1.72 -0.031 -0.97 -0.042 -1.40 -0.048 -1.23 -0.039 -1.29 -0.011 -2.81*** -0.011 -2.61***
Competing bidders -0.016 -0.53 0.003 0.09 0.014 0.45 0.047 0.79 0.009 0.27 -0.004 -0.96 -0.004 -0.92
Intra-industry 0.003 0.16 0.033 1.73 * 0.039 2.05 ** 0.010 0.38 0.038 2.00 ** 0.000 -0.15 -0.001 -0.27
Tender offer 0.042 1.99 0.006 0.26 -0.003 -0.13 0.008 0.26 -0.007 -0.33 0.004 1.07 0.004 1.23
Toehold 0.002 0.09 0.027 0.86 0.045 1.51 0.045 0.99 0.038 1.26 0.005 0.91 0.004 0.80
Investor turnover -0.519 -2.50 ** -0.354 -3.02 *** -0.478 -2.51 ** -0.452 -2.90 *** -0.028 -1.97** -0.039 -2.15**
Fraction -0.019 -0.35 0.143 1.25 0.122 0.60 0.089 0.74 0.005 0.66 -0.024 -1.51
Concentration -0.234 -1.25 -0.066 -0.28 -0.517 -1.16 -0.025 -0.10 0.029 1.38 0.041 1.22
Manager concentration 0.468 0.93 0.490 1.00 1.866 2.78 *** 0.659 1.43 -0.037 -0.58 0.005 0.07
Industry exposure -0.461 -1.18 -0.640 -1.60 -1.967 -3.01 *** -0.759 -1.93 * -0.008 -0.17 -0.027 -0.52
Beta -0.067 -0.48 -0.203 -1.62 -0.266 -1.52 -0.242 -1.90 * -0.019 -1.11 -0.030 -1.61
Activism 0.569 3.32 *** 0.439 2.30 ** -0.274 -0.65 0.421 2.16 ** -0.028 -1.25 -0.017 -0.61
Change in arbitrage capital -0.119 -1.01 -0.143 -1.28 -0.165 -0.82 -0.152 -1.37 -0.003 -0.21 -0.004 -0.24
Volume 1.830 0.48 14.850 2.85 *** 3.149 0.81 0.975 2.25**
Fraction category 3 (mutual funds) -0.074 -0.36 -0.313 -1.05 0.000 0.00 0.048 1.73*
Fraction category 4 (investment advisers) -0.424 -2.38 ** -0.662 -2.36 ** -0.366 -2.01 ** 0.028 1.14
Managerial holdings 0.069 0.24
Turnover of TARGET (cross-effect) 0.084 0.72 0.005 0.40
Year and industry dummies – Yes Yes Yes Yes Yes Yes
Mean squared error 0.20 0.17 0.15 0.13 0.15 0.00 0.00
Adjusted R2 0.001 0.034 0.048 0.062 0.052 0.011 0.008
N 2,202 1,964 1,842 784 1,808 1,964 1,808

30
Table 5 Full analysis of the relation between investor turnover and the acquisition premium taking into account possible sample-selection issues. Panel A presents a probit regression of the likelihood of a firm being a target (bidder) of a takeover bid. The base sample universe is the merged set of COMPUSTAT, CDA/Spectrum, and CRSP firms and includes a total of 17,640 different securities tracked over each of the sample years 1980 through 1999. The number of observations available refers therefore to firm-years instead of events as in previous tables. The left-hand side variable of the probit regression is a dummy taking the value of one if the company is the target (bidder) of an acquisition bid that year and zero otherwise. Right-hand side variables include all accounting and institutional variables calculated as before (see Table 3), with the exception that they are now calculated as averages over the prior two years. We also add the cumulative abnormal return, measured relative to a CRSP value-weighted market model and estimated using the third year prior to the forecast year, of the firm’s stock for the two previous years (see Palepu, 1986; Comment and Schwert, 1995). Panel B presents the estimates for the relation between investor turnover and the acquisition premium using Heckman’s sample-selection correction technique (Heckman, 1979). This equation is estimated using the selected sample (i.e., the sample of firms for which there were events). The left-hand side variable is, as before, the target’s (bidder’s) premium, while target (bidder) accounting and institutional variables are used on the right-hand side. The results for targets are presented in the left–hand side of the table, while results for bidders are presented in the right-hand side. The statistical significance of Heckman’s Lambda can also be seen as a test for the null hypothesis that sample selection is irrelevant in the sample. T-statistics for the second stage are calculated using the procedure described in Greene (1997). The symbols ***,**, and * denote significance levels of 1%, 5%, and 10%, respectively, for the two-tailed hypothesis test that the coefficient equal zero.

31
Table 5 (cont.) Panel A. First stage: Probit estimates
Likelihood of being a TARGET FIRM Likelihood of being a BIDDER FIRM
Coefficient T-statistic Marginal
effect Coefficient T-statistic Marginal
effect
Intercept -2.63 -23.10 -0.18 *** -1.87 -17.82 -0.18 ***
ROE 0.00 -0.46 0.00 0.01 1.92 0.00 *
Sales growth 0.02 0.85 0.00 0.15 7.87 0.02 ***
Liquidity -0.10 -1.79 -0.01 * -0.28 -5.54 -0.03 ***
D/E 0.01 2.01 0.00 ** 0.01 1.46 0.00
M/B -0.01 -1.83 0.00 * 0.00 1.11 0.00
P/E 0.00 -1.19 0.00 0.00 1.08 0.00
Size 0.00 -5.56 0.00 *** 0.00 18.32 0.00 ***
Abnormal return -61.92 -6.76 -4.18 *** 28.64 3.66 2.78 ***
Investor turnover 1.29 6.83 0.09 *** 0.94 5.23 0.09 ***
Fraction 0.40 6.19 0.03 *** 0.61 11.58 0.06 ***
Concentration -0.99 -7.42 -0.07 *** -1.67 -13.35 -0.16 ***
Manager concentration 0.50 0.86 0.03 0.72 1.40 0.07
Industry exposure 0.50 1.63 0.03 0.56 2.07 0.05 **
Beta 0.32 3.03 0.02 *** -0.16 -1.65 -0.02 *
Activism -0.10 -0.54 -0.01 0.62 3.72 0.06 ***
Change in arbitrage capital 1.58 4.75 0.11 *** -0.23 -0.84 -0.02
Likelihood ratio index 0.39 0.10
N 43,793 44,005
Panel B. Sample-selection corrected estimates for premium regressions
Dependent variable Abnormal return premium Actual offer premium Abnormal return premium
Coefficient T-statistic Coefficient T-statistic Coefficient T-statistic
Intercept 2.40 8.90 *** 0.67 2.47 ** 0.72 2.84 ***
ROE 0.00 0.34 -0.01 -0.74 -0.07 -2.03 **
Sales growth -0.04 -1.28 -0.04 -1.13 -0.02 -1.16
Liquidity 0.01 0.23 -0.12 -2.03 ** -0.04 -0.74
D/E -0.02 -0.34 0.03 0.46 -0.02 -3.06 ***
M/B -0.01 -1.94 * 0.01 1.36 0.00 0.30
P/E 0.00 -0.56 0.00 -0.64 0.00 0.53
Size -0.06 -5.49 *** -0.04 -3.64 *** -0.03 -2.38 **
Hostility 0.03 0.68 0.02 0.52 -0.04 -1.27
Competing bidders 0.04 0.83 -0.01 -0.13 0.00 -0.01
Intra-industry -0.02 -0.93 0.03 1.22 0.03 1.62
Tender offer 0.19 5.85 *** 0.05 1.77 * 0.01 0.24
Toehold -0.10 -3.18 *** -0.11 -3.31 *** 0.72 2.84 ***
Target investor turnover -0.55 -5.13 *** -0.25 -2.24 ** 0.20 1.90 *
Bidder investor turnover 0.49 6.76 *** 0.47 6.22 *** -0.32 -2.63 ***
Fraction 0.07 0.48 0.24 1.62 0.11 0.92
Concentration 0.54 2.80 *** 0.37 1.98 ** 0.15 0.81
Manager concentration -0.49 -0.97 -0.58 -0.91 0.53 1.07
Industry exposure 0.04 0.13 0.20 0.66 -0.79 -3.08 ***
Beta -0.30 -3.23 *** 0.15 1.65 * -0.22 -2.36 **
Activism 0.57 2.83 *** -0.29 -1.46 0.40 2.18 **
Change in arbitrage capital 0.03 0.20 0.10 0.78 0.02 0.22
Volume -1.06 -0.55 10.63 4.16 *** 4.07 1.56
Fraction category 3 (m. funds) 0.29 1.36 -0.13 -0.61 -0.07 -0.42
Fraction category 4 (inv. adv.) -0.26 -1.41 -0.02 -0.12 -0.49 -2.96 ***
Heckman’s lambda -0.49 -5.35 *** -0.01 -0.10 -0.04 -0.72
Mean squared error 0.17 0.13 0.15
Adjusted R2 0.170 0.137 0.048 N 1,354 969 1,702

32
Table 6 Estimates of the abnormal return of a portfolio composed of acquirer firms during the sample period, using the calendar-time portfolio regressions (CTPR) approach of Ikenberry, Lakonishok, and Vermaelen (2000) and the calendar-time abnormal return (CTAR) approach of Jaffe (1974) and Mandelker (1974). For each month of the sample period, we form portfolios of firms that have just completed an acquisition and keep them in the portfolio for a prespecified holding period counted relative to the event month. We exclude multiple observations of the same firm that occur within the same holding period (Mitchell and Stafford, 2000). Portfolios are rebalanced monthly to drop all companies that have just reached the end of their holding period and add all firms that have just completed a transaction. Holding periods used are one to 12 months (one year), one to 24 months (two years), and one to 36 months (three years). In the CTPR approach, the excess return of the portfolio of acquirers is regressed on the three Fama and French (1993) factors
( ) ttttftmtftp HMLSMBRRRR ε+β+β+−β+α=− 321 ,,,, .
Abnormal performance is measured by the intercept of this time-series regression. In the CTAR approach, the residual
( ) tititftmitftiti HMLSMBRRRRe ,,,,,,,,ˆ 321 β−β−−β−−=
is calculated for each acquirer using factor betas estimated from returns in the three years prior to the acquisition announcement date. These residuals are aggregated to form a portfolio of residuals for each month,
∑ ω=i
titit
t eS
e ,, ˆˆ 1 ,
where St is the number of firms in the portfolio in month t and ω is the weight of the firm in the portfolio (we use both equal-weighting and value-weighting). An estimate of the portfolio’s
standard deviation is used to standardized the residuals, such that sêt = êt / SDt , where
∑ ∑=
+−+−
−=
50
1
2
11 501
491
j tjttjttt eeSD ,, ˆˆ .
Abnormal performance is measured by the SR statistic, the time-series average of standardized portfolio residuals
∑=t
tesNSR ˆ1
.
where N denotes the number of months that the strategy lasts. Panel A shows the results for the case in which the portfolio is composed of all acquirers in the sample. Panel B shows the results for a portfolio formed as follows: Each month, we sort all stocks in the CRSP-COMPUSTAT-CDA/Spectrum universe according to their Investor Turnover. An acquirer firm is considered an acquirer with high investor turnover if its investor turnover variable is in the top third of the distribution for the entire universe on the month prior to the acquisition. Inversely, an acquirer is considered an acquirer with low investor turnover if its investor turnover variable is in the bottom third of the distribution for the entire universe on the month prior to the acquisition. Panel B presents results for a portfolio that buys acquirers with high investor turnover and sells acquirers with low investor turnover. The estimated alpha and the different betas are shown, for the different holding periods. For purposes of comparison, Panel C presents results for a portfolio that buys acquirers with high investor turnover exclusively and Panel D presents results for a portfolio that buys acquirers with low investor turnover exclusively. T-statistics for the CTPR approach are calculated using White’s heteroskedastic consistent errors. The symbols ***,**, and * denote significance levels of 1%, 5%, and 10%, respectively, for the two-tailed hypothesis test that the coefficient equals zero.
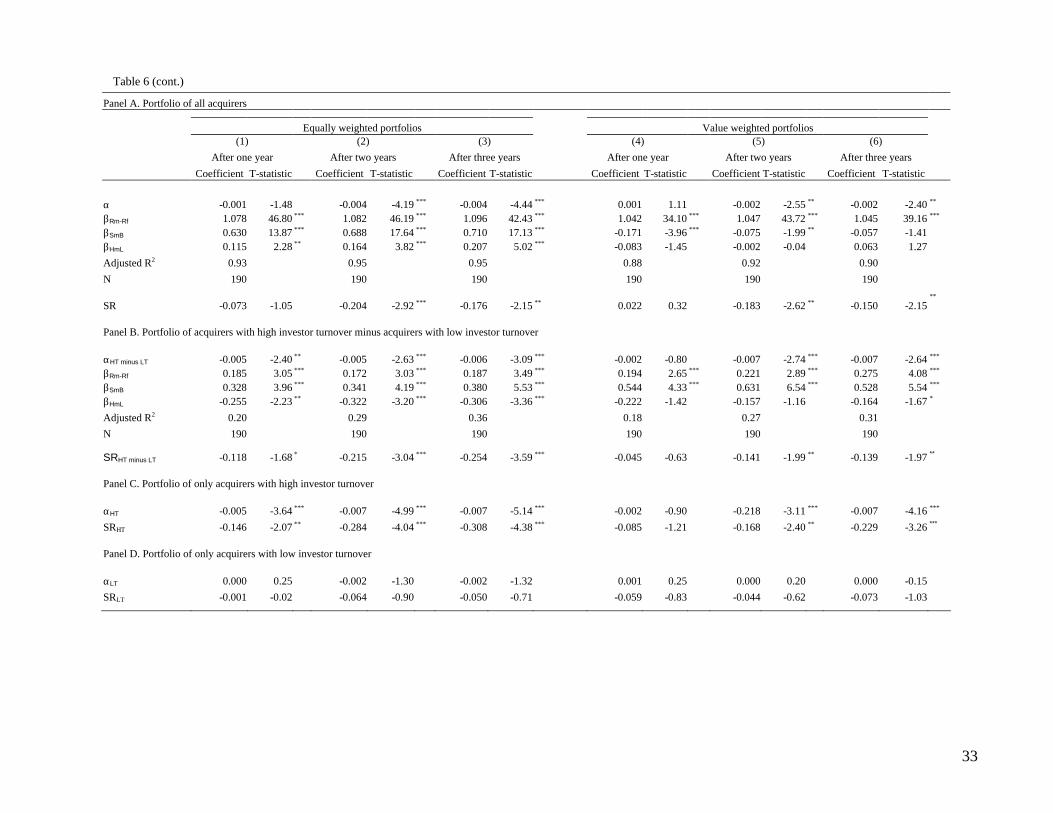
33
Table 6 (cont.)
Panel A. Portfolio of all acquirers
Equally weighted portfolios Value weighted portfolios (1) (2) (3) (4) (5) (6)
After one year After two years After three years After one year After two years After three years Coefficient T-statistic Coefficient T-statistic Coefficient T-statistic Coefficient T-statistic Coefficient T-statistic Coefficient T-statistic α -0.001 -1.48 -0.004 -4.19 *** -0.004 -4.44 *** 0.001 1.11 -0.002 -2.55 ** -0.002 -2.40 **
βRm-Rf 1.078 46.80 *** 1.082 46.19 *** 1.096 42.43 *** 1.042 34.10 *** 1.047 43.72 *** 1.045 39.16 ***
βSmB 0.630 13.87 *** 0.688 17.64 *** 0.710 17.13 *** -0.171 -3.96 *** -0.075 -1.99 ** -0.057 -1.41
βHmL 0.115 2.28 ** 0.164 3.82 *** 0.207 5.02 *** -0.083 -1.45 -0.002 -0.04 0.063 1.27
Adjusted R2 0.93 0.95 0.95 0.88 0.92 0.90
N 190 190 190 190 190 190
SR -0.073 -1.05 -0.204 -2.92 *** -0.176 -2.15 ** 0.022 0.32 -0.183 -2.62 ** -0.150 -2.15 **
Panel B. Portfolio of acquirers with high investor turnover minus acquirers with low investor turnover αHT minus LT -0.005 -2.40 ** -0.005 -2.63 *** -0.006 -3.09 *** -0.002 -0.80 -0.007 -2.74 *** -0.007 -2.64 ***
βRm-Rf 0.185 3.05 *** 0.172 3.03 *** 0.187 3.49 *** 0.194 2.65 *** 0.221 2.89 *** 0.275 4.08 ***
βSmB 0.328 3.96 *** 0.341 4.19 *** 0.380 5.53 *** 0.544 4.33 *** 0.631 6.54 *** 0.528 5.54 ***
βHmL -0.255 -2.23 ** -0.322 -3.20 *** -0.306 -3.36 *** -0.222 -1.42 -0.157 -1.16 -0.164 -1.67 *
Adjusted R2 0.20 0.29 0.36 0.18 0.27 0.31
N 190 190 190 190 190 190
SRHT minus LT -0.118 -1.68 * -0.215 -3.04 *** -0.254 -3.59 *** -0.045 -0.63 -0.141 -1.99 ** -0.139 -1.97 **
Panel C. Portfolio of only acquirers with high investor turnover αHT -0.005 -3.64 *** -0.007 -4.99 *** -0.007 -5.14 *** -0.002 -0.90 -0.218 -3.11 *** -0.007 -4.16 ***
SRHT -0.146 -2.07 ** -0.284 -4.04 *** -0.308 -4.38 *** -0.085 -1.21 -0.168 -2.40 ** -0.229 -3.26 ***
Panel D. Portfolio of only acquirers with low investor turnover αLT 0.000 0.25 -0.002 -1.30 -0.002 -1.32 0.001 0.25 0.000 0.20 0.000 -0.15 SRLT -0.001 -0.02 -0.064 -0.90 -0.050 -0.71 -0.059 -0.83 -0.044 -0.62 -0.073 -1.03