April 27, 2020 Dear Fellow Shareholder - A Service From ...
264
April 27, 2020 Dear Fellow Shareholder: On behalf of the Board of Directors, I cordially invite you to participate in the Annual Meeting of Shareholders of Ocwen Financial Corporation, which will be held on Wednesday, May 27, 2020, at 9:00 a.m., Eastern Daylight Time. In light of public health concerns regarding the coronavirus outbreak, we will be hosting this year’s Annual Meeting in a virtual format only via live audiocast on the Internet at www.virtualshareholdermeeting.com/OCN2020. To participate, vote or submit questions during the Annual Meeting via live audiocast, please review the detailed procedures included in our Notice of Annual Meeting. You will not be able to attend the Annual Meeting in person. This does not represent a change in our shareholder engagement philosophy and we intend to return to an in-person meeting next year. The matters to be considered by shareholders at the Annual Meeting are described in detail in the accompanying materials. It is very important that you be represented at the Annual Meeting regardless of the number of shares you own or whether you are able to participate in our virtual Annual Meeting. We encourage you to complete your proxy card in one of the manners described in the accompanying materials even if you plan to participate in the Annual Meeting. This will not prevent you from voting during the Annual Meeting if you choose to participate and vote at that time, but will ensure that your vote is counted if you are unable to participate. If you are a beneficial owner holding shares through a brokerage firm, bank, broker -dealer, or similar organization you should follow the instructions on your voting instruction form to vote your shares. Please note that if you are a beneficial owner of our shares you cannot vote your shares at the Annual Meeting unless you have obtained a legal proxy from your brokerage firm, bank, broker-dealer, or similar organization. Your continued support of, and interest in, Ocwen Financial Corporation is sincerely appreciated. Sincerely, Phyllis R. Caldwell Chair, Board of Directors
-
Upload
khangminh22 -
Category
Documents
-
view
0 -
download
0
Transcript of April 27, 2020 Dear Fellow Shareholder - A Service From ...

April 27, 2020
Dear Fellow Shareholder:
On behalf of the Board of Directors, I cordially invite you to participate in the Annual Meeting of Shareholders of Ocwen Financial
Corporation, which will be held on Wednesday, May 27, 2020, at 9:00 a.m., Eastern Daylight Time. In light of public health concerns
regarding the coronavirus outbreak, we will be hosting this year’s Annual Meeting in a virtual format only via live audiocast on the
Internet at www.virtualshareholdermeeting.com/OCN2020. To participate, vote or submit questions during the Annual Meeting via live
audiocast, please review the detailed procedures included in our Notice of Annual Meeting. You will not be able to attend the Annual
Meeting in person. This does not represent a change in our shareholder engagement philosophy and we intend to return to an in-person
meeting next year.
The matters to be considered by shareholders at the Annual Meeting are described in detail in the accompanying materials.
It is very important that you be represented at the Annual Meeting regardless of the number of shares you own or whether you are able
to participate in our virtual Annual Meeting. We encourage you to complete your proxy card in one of the manners described in the
accompanying materials even if you plan to participate in the Annual Meeting. This will not prevent you from voting during the
Annual Meeting if you choose to participate and vote at that time, but will ensure that your vote is counted if you are unable to
participate. If you are a beneficial owner holding shares through a brokerage firm, bank, broker-dealer, or similar organization you
should follow the instructions on your voting instruction form to vote your shares. Please note that if you are a beneficial owner of our
shares you cannot vote your shares at the Annual Meeting unless you have obtained a legal proxy from your brokerage firm, bank,
broker-dealer, or similar organization.
Your continued support of, and interest in, Ocwen Financial Corporation is sincerely appreciated.
Sincerely,
Phyllis R. Caldwell
Chair, Board of Directors


1
OCWEN FINANCIAL CORPORATION
1661 Worthington Road, Suite 100
West Palm Beach, Florida 33409
NOTICE OF ANNUAL MEETING OF SHAREHOLDERS AND
IMPORTANT NOTICE REGARDING THE AVAILABILITY OF PROXY MATERIALS
FOR THE SHAREHOLDER MEETING TO BE HELD ON MAY 27, 2020
NOTICE
Our Annual Meeting of Shareholders will be held:
Date: Wednesday, May 27, 2020
Time: 9:00 a.m., Eastern Daylight Time
Location: Virtual Meeting Only via Live Audiocast
Please review the instructions contained in this Proxy Statement if you wish to participate in the virtual Annual Meeting.
PURPOSE
• To elect seven directors for one-year terms or until their successors are elected and qualified;
• To ratify, on an advisory basis, the appointment by the Audit Committee of our Board of Directors of Deloitte & Touche
LLP as the independent registered public accounting firm of Ocwen Financial Corporation for the fiscal year ending
December 31, 2020;
• To hold an advisory vote to approve executive compensation (“Say-on-Pay”);
• To hold an advisory vote to approve an amendment to our Articles of Incorporation to implement a reverse stock split of
our issued and outstanding common stock in a ratio between 1-for-5 and 1-for-25 and reduce the number of authorized
shares of our common stock by the same proportion as the ratio of our reverse stock split;
• To approve a proposal to adjourn the Annual Meeting, if necessary or appropriate, to solicit additional proxies if there are
not sufficient votes at the time of the Annual Meeting to approve Proposal Four; and
• To transact such other business as may properly come before the meeting and any postponement or adjournment of the
meeting. Management is not aware of any such other business at this time.
PROCEDURES
• Our Board of Directors has fixed March 27, 2020 as the record date for the determination of shareholders entitled to notice
of and to vote at the Annual Meeting.
• Shareholders of record at the close of business on the record date will be entitled to vote and ask questions online at the
Annual Meeting. Please note that if you do not have your control number, you will be able to access and listen to the
Annual Meeting but you will not be able to vote your shares or submit questions during the Annual Meeting.
• If you would like to attend the virtual meeting and you have your control number, please go
to www.virtualshareholdermeeting.com/OCN2020 15 minutes prior to the start of the meeting to log in. For shareholders
who hold shares in street name, if you came through your brokerage firm's website and do not have your control number,
you can gain access to the meeting by logging into your brokerage firm's website 15 minutes prior to the meeting start,
selecting the shareholder communications mailbox to link through to the meeting and the control number will automatically
populate. For technical assistance when logging into Ocwen’s Annual Meeting, please call 800-586-1548 (US) or 303-562-
9288 (International).
• If you wish to submit a question during the Annual Meeting, log into the virtual meeting platform at
www.virtualshareholdermeeting.com/OCN2020, type your question into the "Ask a Question" field, and click "Submit."

2
This proxy statement for our 2020 Annual Meeting of Shareholders and our Annual Report to shareholders on Form 10-K for the
year ended December 31, 2019 will be available on or about April 27, 2020 on our website at www.ocwen.com in the Financial
Information section under the “Shareholders” tab. The approximate date on which this proxy statement, the proxy card and other
accompanying materials are first being sent or given to shareholders is April 27, 2020. Additionally, and in accordance with
Securities and Exchange Commission rules, you may access our annual report and proxy materials at
http://shareholders.ocwen.com/sec.cfm, a website that does not identify or track visitors of the site.
If you have questions for Ocwen Financial Corporation regarding this virtual Annual Meeting, please contact our shareholder
relations department at [email protected].
By Order of the Board of Directors,
Joseph J. Samarias
Secretary
April 27, 2020
3
OCWEN FINANCIAL CORPORATION
PROXY STATEMENT
ANNUAL MEETING OF SHAREHOLDERS
General Information
This proxy statement is being furnished to you in connection with the solicitation of proxies by the Board of Directors of Ocwen
Financial Corporation (“Ocwen,” the “Company,” “we,” “us,” or “our”) for use at our 2020 Annual Meeting of Shareholders (the
“Annual Meeting”) and at any postponement or adjournment of this meeting. The approximate date on which this proxy statement,
the proxy card and other accompanying materials are first being sent or given to shareholders is April 27, 2020. The Annual Meeting
will be held on Wednesday, May 27, 2020, at 9:00 a.m., Eastern Daylight Time, for the purposes listed in the Notice of Annual
Meeting of Shareholders. In light of public health concerns regarding the coronavirus outbreak, we will be hosting this year’s
Annual Meeting via live audiocast on the Internet at www.virtualshareholdermeeting.com/OCN2020. This does not represent a
change in our shareholder engagement philosophy and we intend to return to an in-person meeting next year. If you are interested in
participating in the virtual meeting, voting or submitting questions at that time, please see “Annual Meeting Participation” below for
further details. Please note that except as otherwise specified, all share and dollar amounts set forth in this Proxy Statement are on a
pre-Reverse Stock Split basis.
How a Proxy Works
The Board of Directors has appointed Glen A. Messina, President and Chief Executive Officer, and Joseph J. Samarias, Executive
Vice President, General Counsel and Secretary, as the management proxy holders for the Annual Meeting. If you properly complete,
sign and return your proxy card by mail, or submit your proxy by Internet or telephone, and do not revoke it prior to its use, your
shares will be voted in accordance with your instructions. If you do not give contrary instructions, the management proxy holders
will vote all shares represented by valid proxies as follows:
• Proposal One (Election of Directors) - “FOR ALL” of the seven nominees for Director;
• Proposal Two (Advisory Ratification of Appointment of Independent Registered Public Accounting Firm) - “FOR”
ratification, on an advisory basis, of the appointment of Deloitte & Touche LLP as our independent registered public
accounting firm for 2020;
• Proposal Three (Advisory Resolution on Named Executive Officer Compensation) - “FOR” approval, on an advisory basis,
of the compensation of Ocwen’s executive officers whose compensation is disclosed in this proxy statement (“named
executive officers”) (“Say-on-Pay”);
• Proposal Four (Advisory Approval of an Amendment to the Articles of Incorporation to Effect a Reverse Stock Split) -
“FOR” approval, on an advisory basis, of an amendment to our Articles of Incorporation to implement a reverse stock split
of our issued and outstanding common stock in a ratio between 1-for-5 and 1-for-25 and reduce the number of authorized
shares of our common stock by the same proportion as the ratio of our reverse stock split
• Proposal Five (Adjournment of Meeting to Solicit Additional Proxies for Proposal Four) - “FOR” approval of a proposal to
adjourn the Annual Meeting, if necessary or appropriate, to solicit additional proxies if there are not sufficient votes at the
time of the Annual Meeting to approve Proposal Four; and
• with regard to any other business that properly comes before the meeting, in accordance with the best judgment of the
management proxy holders. As of the date of this proxy statement, we do not know of any other business that may come
before the Annual Meeting.
How to Revoke a Proxy
Your proxy may be used only at the Annual Meeting and any postponement or adjournment of this meeting and may not be used for
any other meeting. You have the power to revoke your proxy at any time before it is exercised by:

4
Joseph J. Samarias, Secretary
c/o Ocwen Financial Corporation
1661 Worthington Road, Suite 100
West Palm Beach, Florida 33409
• submitting a properly executed proxy card bearing a later date or submitting another proxy using the Internet or by
telephone (your latest Internet or telephone voting instructions will be followed), or
• participating in the virtual Annual Meeting and giving the Secretary notice of your intention to vote at that time.
If you are interested in participating in the virtual Annual Meeting, voting or submitting questions at that time, please see “Annual
Meeting Participation” below for further details.
Who May Vote at the Annual Meeting
On all matters properly presented at the Annual Meeting, each share of our common stock is entitled to one vote. All shareholders
who owned our common stock as of the close of business on March 27, 2020 (the “Record Date”) are cordially invited to participate
in the 2020 Annual Meeting. Only shareholders of record or beneficial owners of shares of our common stock at the close of
business on the Record Date are entitled to participate and vote at the Annual Meeting or any postponement or adjournment of this
meeting. If your shares are registered directly in your name with American Stock Transfer & Trust Company, Ocwen’s stock transfer
agent, you are the “shareholder of record” with respect to those shares. If your shares are held in an account at a brokerage firm,
bank, broker-dealer, or similar organization (collectively, “Broker”), then you are the “beneficial owner of shares held in street
name.” As a beneficial owner, you have the right to instruct your Broker how to vote your shares. Most individual shareholders are
beneficial owners of shares held in street name. At the close of business on the Record Date, there were 134,956,288 shares of
common stock issued and outstanding.
How to Vote if you are a Shareholder of Record
If you are a shareholder of record and you have received a printed set of the proxy materials by mail, we encourage you to fill in,
date and sign the enclosed proxy card and mail it promptly in the enclosed envelope to make sure that your shares are represented at
the Annual Meeting. Shareholders of record also have the option of voting by using a toll-free telephone number or via the Internet.
Instructions for using these services are included on the proxy card. If you are a shareholder of record and participate in the Annual
Meeting, you may, if you desire, revoke your proxy in accordance with the procedures described in this Proxy Statement and vote
your shares during the meeting. Please note that your presence (without further action) at the Annual Meeting will not constitute
revocation of a previously given proxy.
How to Give Voting Instructions if you are a Beneficial Owner of Shares held in Street Name
If you are a beneficial owner of shares held in street name, you are considered the beneficial owner of the shares, and your shares
may be voted at the Annual Meeting only by the Broker that holds your shares. To instruct your Broker how your shares are to be
voted at the Annual Meeting, you will need to follow the instructions provided by the Broker that holds your shares. Many Brokers
offer the option of submitting voting instructions over the Internet or by telephone. You are also welcome to participate in the
Annual Meeting, but you will need to follow the instructions provided to you by your Broker. Please note that if you are a beneficial
owner of our shares you cannot vote your shares at the Annual Meeting unless you have obtained a legal proxy from your Broker.
Please contact your Broker for further information. If you wish to revoke your proxy any time before the Annual Meeting you
should contact your Broker to find out how to change or revoke your voting instructions.
If you hold your shares in street name through a brokerage account and you do not submit instructions to your Broker about how
your shares are to be voted, one of two things can happen depending on the type of proposal. If the proposal involves a “routine”
matter, then the rules of the New York Stock Exchange provide Brokers discretionary power to vote your shares even if you do not
provide instructions. “Routine” matters include proposals to ratify the appointment of the independent registered public accounting
firm, provide advisory approval of an amendment to our Articles of Incorporation to implement a reverse stock split, and approve a
proposal to authorize an adjournment of the Annual Meeting to solicit additional proxies for Proposal Four. If, however, the
proposal involves a “non-routine” matter, such as the proposals to elect directors and vote on executive compensation, then Brokers
are not permitted to vote your shares without instruction from you. If you do not submit voting instructions to your Broker and your
Broker exercises its discretion to vote your shares on Proposal Two to ratify the appointment of Deloitte & Touche LLP as our
independent registered public accounting firm for 2020, Proposal Four to approve a reverse stock split of our issued and outstanding
common stock and reduce the number of authorized shares of our common stock by the same proportion as the ratio of our reverse
stock split, or Proposal Five to authorize an adjournment of the Annual Meeting to solicit additional proxies for Proposal Four, your
• filing written notice of revocation with our Secretary at the following address:

5
shares will constitute broker “non-votes” on each of the other proposals at the Annual Meeting. Therefore, it is important that you
provide instructions to your Broker if your shares are held by a Broker so that your votes with respect to election of directors and
Say-on-Pay are counted.
Quorum and Voting Information
The presence at the Annual Meeting of a majority of the votes of our common stock entitled to vote, represented in person or by
proxy, will constitute a quorum for the transaction of business at the Annual Meeting.
Assuming a quorum, the seven nominees for director receiving a plurality of the votes cast for director will be elected as directors of
Ocwen. A plurality vote requirement means that the director nominees with the greatest number of votes cast, even if less than a
majority, will be elected. There is no cumulative voting. You may vote in favor of or withhold authority to vote for one or more
nominees for director. For Proposal Two to ratify the appointment of Deloitte & Touche LLP as our independent registered public
accounting firm for 2020, Proposal Three to approve the Say-on-Pay, Proposal Four to approve a reverse stock split of our issued
and outstanding common stock and reduce the number of authorized shares of our common stock by the same proportion as the ratio
of our reverse stock split, and Proposal Five to authorize an adjournment of the Annual Meeting to solicit additional proxies for
Proposal Four, the proposal will be approved if the votes cast by the holders of the shares represented at the Annual Meeting and
entitled to vote in favor of the action exceed the votes cast opposing the action. Because Proposal Two to ratify the appointment of
Deloitte & Touche LLP as our independent registered public accounting firm for 2020 and Proposal Three to approve the Say-on-
Pay are advisory in nature, there is no specific requirement for approval for these proposals. It will be up to the Audit Committee
and the Compensation and Human Capital Committee with respect to Proposals Two and Three, respectively, as well as the Board of
Directors, to determine whether and how to implement the advisory votes on the ratification of the appointment of our independent
registered public accounting firm and Say-on-Pay. In addition, Proposal Four to approve a reverse stock split of our issued and
outstanding common stock and reduce the number of authorized shares of our common stock by the same proportion as the ratio of
our reverse stock split is also advisory in nature. Under Florida law, because we are reducing our authorized shares proportionately,
our Board is not required to submit the proposal regarding our reverse stock split to shareholders and may elect, as it determines to
be in the best interests of the Company and our shareholders, whether or not to effect a Reverse Stock Split, and if so, at which split
ratio. However, while our Board is seeking, and will give appropriate consideration to, advisory feedback from our shareholders in
the form of Proposal Four, our Board may elect to implement a Reverse Stock Split at its sole discretion, even if the proposed
Reverse Stock Split is not approved by our shareholders.
Abstentions will be counted as present and entitled to vote for purposes of determining whether a quorum is present. For Proposal
One on the election of directors, a “withhold vote” will not be counted in determining the vote’s outcome, because the candidates
who receive the highest number of “for” votes are elected, and candidates only need a single “for” vote to be elected. Abstentions
will not be counted as votes cast with respect to Proposal Two to ratify the appointment of Deloitte & Touche LLP as our
independent registered public accounting firm for 2020, Proposal Three to approve the Say-on-Pay, Proposal Four to approve a
reverse stock split of our issued and outstanding common stock and reduce the number of authorized shares of our common stock by
the same proportion as the ratio of our reverse stock split, or Proposal Five to authorize an adjournment of the Annual Meeting to
solicit additional proxies for Proposal Four and therefore will not be counted in determining the outcome of those proposals. If any
broker “non-votes” occur at the meeting with respect to your shares, the broker “non-votes” will be counted as present and entitled
to vote for purposes of determining whether a quorum is present, but will not be counted as votes cast with respect to Proposal One
on the election of directors or Proposal Three to approve the Say-on-Pay.
Annual Meeting Participation
In light of public health concerns regarding the coronavirus outbreak and to support the health and wellbeing of our shareholders,
our directors, and our employees, we will be hosting this year’s Annual Meeting via live audiocast on the Internet
at www.virtualshareholdermeeting.com/OCN2020. You will not be able to attend the Annual Meeting in person. This does not
represent a change in our shareholder engagement philosophy and we intend to return to an in-person meeting next year. Our
shareholders will be afforded the same opportunities to participate at the virtual Annual Meeting as they would at an in-person
annual meeting of shareholders.
Shareholders of record will be able to vote and ask questions online during the meeting. If you would like to attend the virtual
Annual Meeting and you have your control number, please go to www.virtualshareholdermeeting.com/OCN2020 15 minutes prior to
the start of the meeting to log in. Please note that if you do not have your control number, you will be able to access and listen to the
Annual Meeting but you will not be able to vote your shares or submit questions during the Annual Meeting. For shareholders who
hold shares in street name, if you came through your brokerage firm's website and do not have your control number, you can gain
access to the meeting by logging into your brokerage firm's website site 15 minutes prior to the meeting start, selecting the

6
shareholder communications mailbox to link through to the meeting and the control number will automatically populate. Please note
that if you are a beneficial owner of our shares you cannot vote your shares at the Annual Meeting unless you have obtained a legal
proxy from your Broker. Please contact your Broker for further information.
After the Annual Meeting, we will spend up to 15 minutes answering shareholder questions that comply with the meeting rules of
conduct, which will be posted on the website above prior to the Annual Meeting. To the extent time doesn’t allow us to answer all of
the appropriately submitted questions, we will answer them in writing on our investor relations website, at http://www.ocwen.com in
the Shareholder Relations section, soon after the meeting and the answers will remain available until one week after posting. If we
receive substantially similar questions, we will group such questions together and provide a single response to avoid repetition.
For technical assistance when logging into the virtual Annual Meeting, please call 800-586-1548 (US) or 303-562-9288
(International).
If you plan to attend the virtual Annual Meeting, we request you notify us no less than seven days in advance at
[email protected] (i.e. no later than May 20, 2020) to assist us in our preparations for the virtual meeting.

7
SPECIAL NOTE REGARDING FORWARD-LOOKING STATEMENTS
This proxy statement contains forward-looking statements within the meaning of Section 27A of the Securities Act of 1933, as
amended, and Section 21E of the Securities Exchange Act of 1934, as amended. These forward-looking statements may be identified
by a reference to a future period or by the use of forward-looking terminology. Forward-looking statements by their nature address
matters that are, to different degrees, uncertain. Our business has been undergoing substantial change and we are in the midst of a
period of significant capital markets volatility and experiencing significant changes within the mortgage lending and servicing
ecosystem which has magnified such uncertainties. In addition, there is significant uncertainty relating to the economic impact of the
global COVID-19 pandemic, including the response of the U.S. government, state governments, and regulators, and disruption in the
financial markets. Readers should bear these factors in mind when considering such statements and should not place undue reliance
on such statements. Forward-looking statements involve a number of assumptions, risks and uncertainties that could cause actual
results to differ materially. In the past, actual results have differed from those suggested by forward looking statements and this may
happen again. Important factors that could cause actual results to differ materially from those suggested by the forward-looking
statements include those described in Ocwen’s reports and filings with the SEC, including our Annual Report on Form 10-K for the
year ended December 31, 2019 and any current and quarterly reports since such date. Anyone wishing to understand Ocwen’s
business should review our SEC filings. Ocwen’s forward-looking statements speak only as of the date they are made and we
disclaim any obligation to update or revise forward-looking statements whether as a result of new information, future events or
otherwise. Ocwen may post information that is important to investors on our website.

8
ELECTION OF DIRECTORS
(Proposal One)
Our Bylaws provide that our Board of Directors shall consist of no less than three and no more than eleven members with the exact
number to be fixed by our Board of Directors. Effective May 30, 2019, our Board of Directors fixed the number of directors at nine.
Following the retirement of Robert A. Salcetti effective July 31, 2019, our Board has had eight directors. As Robert J. Lipstein has
informed the Board of Directors that he does not intend to stand for re-election and is retiring from the Board of Directors
immediately prior to the Annual Meeting, our Board of Directors has fixed the number of directors at seven, effective immediately
prior to the commencement of the Annual Meeting.
As further described below under “Board of Directors and Corporate Governance” and, in particular, under “Annual Board
Assessment” and “Director Nomination Process,” it is the responsibility of the Nomination/Governance Committee and the Board to
periodically review Board size and composition and, if deemed appropriate, to make changes that the Board believes will best
position the Board to enhance our ability to create value for shareholders and address changes in the market and business
environment in which we operate.
Under the leadership of our Board, the Company demonstrated strong execution on our key strategic initiatives throughout 2019,
including integrating PHH Corporation, growing our originations platform, re-engineering our cost structure, diversifying our
funding sources, and fulfilling our regulatory commitments. The Company built a significant originations platform which includes
all our channels for sourcing owned MSRs and subservicing, reduced costs and complexity through a legal entity reorganization in
which we merged two of our licensed operating entities, Ocwen Loan Servicing, LLC and Homeward Residential, Inc., into PHH
Mortgage Corporation, and completed the transition to the Black Knight Financial Services, Inc. LoanSphere MSP® servicing
system. During the current highly challenging environment created by the global COVID-19 pandemic and related disruption in the
financial markets and our industry, the Board remains committed to addressing our critical near-term challenges and positioning the
Company to execute on our strategic priorities while maximizing value for our shareholders.
To put the Company in the best position to execute on these initiatives, the Nomination/Governance Committee and the Board
evaluated the skillsets and experiential perspectives of our directors as well as individuals recommended as potential nominees and,
consistent with our Board Diversity Policy and our Corporate Governance Guidelines, identified a set of director nominees with
individual backgrounds that, when combined, provide a portfolio of experience and knowledge that will best serve the Company’s
strategic and governance needs.
Our Board of Directors, upon the recommendation of the Nomination/Governance Committee, is proposing the seven nominees
listed below for election as directors at the Annual Meeting. All nominees currently serve as our directors. There are no
arrangements or understandings between any nominee and any other person for selection as a nominee.
Each of the nominees listed below has consented to being named in this proxy statement and to serving as a director, if elected. If
any nominee is unable to or will not stand for election at the time of the Annual Meeting, the person or persons appointed as proxies
will nominate and vote for a replacement nominee recommended by our Board of Directors or the Board of Directors may reduce
the number of directors constituting the Board. As of the date of this proxy statement, our Board of Directors knows of no reason
why any of the nominees would not be able or willing to serve as a director if elected.
Nominees for Director
The following sets forth certain information concerning our director nominees, including his or her principal occupation for at least
the last five years, additional biographical information and specific qualifications of each director:
Phyllis R. Caldwell. Ms. Caldwell became Chair of the Board of Directors on March 15, 2016. Ms. Caldwell has served as a director
of Ocwen since January 2015. Ms. Caldwell is founder and managing member of Wroxton Civic Ventures, LLC, which provides
advisory services on various financial, housing and economic development matters, a position she has held since January 2012.
Previously, Ms. Caldwell was Chief, Homeownership Preservation Officer at the U.S. Department of the Treasury, responsible for
oversight of the U.S. housing market stabilization, economic recovery and foreclosure prevention initiatives established through the
Troubled Asset Relief Program, from November 2009 to December 2011. From December 2007 to November 2009, Ms. Caldwell
was the President and Chief Executive Officer of the Washington Area Women's Foundation. Prior to such time, Ms. Caldwell held
various leadership roles in commercial real estate finance during her eleven years at Bank of America until her retirement from Bank
of America in 2007, serving most recently as President of Community Development Banking. Since January 2014, Ms. Caldwell has
served as an independent director of City First Bank of DC. Since October 2018, Ms. Caldwell has also served as a member of the
board of directors of MicroVest Holdings, Inc. From January 2014 through September 2018, Ms. Caldwell served as an independent
director of American Capital Senior Floating, Ltd. (NASDAQ: ACSF), a publicly traded business development company. Ms.

9
Caldwell has also served on the boards of numerous non-profit organizations engaged in housing and community development
finance. Ms. Caldwell received her Master of Business Administration from the Robert H. Smith School of Business at the
University of Maryland, College Park and holds a Bachelor of Arts in Sociology, also from the University of Maryland.
Ms. Caldwell was selected to serve as a member of our Board of Directors due to her extensive experience in the housing and
financial services industries, both in the private sector and as a senior government official, and her experience as a board member of
another public company in the financial services industry.
Jenne K. Britell. Dr. Britell has served as a director of Ocwen since February 2019. Dr. Britell served as a director of United
Rentals, Inc. from 2006 to 2019, including as its non-executive Chairman from 2008 to 2019. Dr. Britell also served as a director of
Quest Diagnostics Inc., including as a member of its Audit and Finance Committee, from 2005 to 2019. From 2000 through 2017,
Dr. Britell served as a director of Crown Holdings, Inc., including as Chairman of the Audit Committee. From 2001 to 2009, Dr.
Britell was Chairman and Chief Executive Officer of Structured Ventures, Inc., advisors to U.S. and multinational companies. From
1996 to 2000, Dr. Britell was a senior executive of GE Capital. At GE Capital, she most recently served as the Executive Vice
President of Global Consumer Finance and President of Global Commercial and Mortgage Banking. From January 1998 to July
1999, she was President and Chief Executive Officer of GE Capital, Central and Eastern Europe. Before joining GE Capital, she
held significant management positions with Dime Bancorp, Inc., HomePower, Inc., Citicorp and Republic New York Corporation.
Earlier, she was the founding Chairman and Chief Executive Officer of the Polish-American Mortgage Bank. Dr. Britell’s extensive
prior board service also includes serving as Lead Director for Aames Investment Corp., as a trustee for the Teachers Insurance and
Annuity Association (TIAA-CREF), including as a member of its Executive, Strategic Planning, and Mortgage Banking
Committees, and as a director for Lincoln National Corp., including as a member of its Audit and Governance Committees, in
addition to numerous civic and philanthropic boards.
Dr. Britell was selected to serve as a member of our Board of Directors due to her extensive executive and advisory experience,
including in corporate governance, corporate finance, capital markets, international business and strategic planning, with
multinational corporations operating in complex, regulated industries.
Alan J. Bowers. Mr. Bowers has served as a director of Ocwen since May 2015. Mr. Bowers has also served as a Director of Walker
& Dunlop, Inc., a publicly traded commercial real estate finance company, since December 2010, serves as its Lead Director, and
serves on its Audit Committee and its Nominating and Corporate Governance Committee (Chair). Mr. Bowers also serves on the
board and as Audit Committee Chair of CorePoint Lodging Group, a publicly traded lodging REIT, and serves on its
Nominating/Governance and Compensation Committees. From July 2013 to May 2018, Mr. Bowers served as a Director of La
Quinta Inns & Suites, a publicly traded hotel chain. From 2006 to 2015, Mr. Bowers served as a Director of American Achievement
Corp., a privately-held manufacturer and distributer of graduation products. Prior to Mr. Bowers' retirement in 2005, he was the
President and Chief Executive Officer and a board member of Cape Success, LLC, a private equity-backed staffing service and
information technology solutions business, from 2001 to 2004. Mr. Bowers was also the President and Chief Executive Officer and a
board member of MarketSource Corporation, a marketing and sales support service firm, from 2000 to 2001, and of MBL Life
Assurance Corporation, a life insurance company, from 1995 to 1999. Mr. Bowers previously served on the boards and as Audit
Committee Chair of Refrigerated Holdings, Inc., a temperature controlled logistics firm (from January 2009 to April 2013);
Roadlink Inc., a trucking and logistics firm (from February 2010 to April 2013); and Fastfrate Holdings, Inc., a Canadian trucking
and logistics firm (from July 2008 to June 2011), each a privately held company. Mr. Bowers has been a Certified Public Accountant
since 1978 and served as Staff Auditor, Audit Partner and Managing Partner, serving a diverse client base during his tenure at
Coopers & Lybrand, L.L.P. from 1978 to 1995 and as a Staff Accountant with Laventhol & Horwath, CPAs from 1976 to 1978. Mr.
Bowers received his Bachelor of Science in Accounting from Montclair State University and his Master of Business Administration
from St. John's University.
Mr. Bowers was selected to serve as a member of our Board of Directors because he brings to our Board over thirty years of
experience in accounting and executive management, including experience on the audit committees of private companies and
Securities and Exchange Commission registrants. Mr. Bowers’ accounting expertise and diverse corporate management experience
are assets to our Board.
Jacques J. Busquet. Mr. Busquet has served as a director of Ocwen since January 2016. Mr. Busquet was formerly Chief Risk
Officer and Managing Director of Natixis North America LLC and a member of the Executive Committee from April 2008 to
February 2015. Prior to that, Mr. Busquet was Executive Vice President and member of the Executive Committee of Calyon
Americas (formerly Credit Lyonnais Americas) in charge of Risks, Compliance, Legal, Regulatory Affairs and Asset Recovery from
1998 to March 2008. Since July 1, 2016, Mr. Busquet has served as a director of Mizuho Americas LLC, the US Bank Holding
Company of Mizuho Financial Group, Inc. Since 2005, Mr. Busquet has served as a director of Prolitec Inc., a privately-held
commercial air scenting company. From 2012 to March 2015, Mr. Busquet was a trustee of the Institute of International Bankers.
From 2003 to 2009, Mr. Busquet was a trustee of the African Wildlife Foundation and the Chair of its Audit Committee for two

10
years. Mr. Busquet has a Master of Business Administration in Finance from each of The Wharton School of the University of
Pennsylvania and Hautes Études Commerciales (HEC), Paris.
Mr. Busquet was selected to serve as a member of our Board of Directors because with his broad experience as an officer in charge
of risks in his prior positions, Mr. Busquet brings to our Board valuable insight into risk management and compliance issues. His
experience working in financial institutions provides him with a deep understanding of the financial services industry. We also
benefit from his corporate management experience.
Glen A. Messina. Mr. Messina has served as President and Chief Executive Officer and as a director of Ocwen since October 2018.
He previously served as the President and Chief Executive Officer of PHH Corporation (“PHH”) from January 2012 to June 2017
and Chief Operating Officer of PHH from July 2011 to December 2011. Mr. Messina also served as a director of PHH from January
2012 to June 2017 and as a consultant to PHH through March 2018. Prior to joining PHH, Mr. Messina spent 17 years at General
Electric Company (“GE”), most recently as Chief Executive Officer of GE Chemical and Monitoring Solutions, a global water and
process specialty chemicals services business, from 2008 until July 2011.
Mr. Messina was selected to serve on our Board of Directors because of his extensive operational and leadership experience,
including his service as both our President and Chief Executive Officer and his service as a director and the President and Chief
Executive Officer of PHH.
DeForest B. Soaries Jr. Dr. Soaries has served as a director of Ocwen since January 2015. Dr. Soaries has served as Senior Pastor of
First Baptist Church of Lincoln Gardens since 1990. He formerly served as New Jersey Secretary of State from 1999 to 2002 and as
Chair of the United States Election Assistance Commission from 2004 to 2005. Dr. Soaries was a director of New Era Bank from
1996 to 1998. He currently serves as an independent director at Independence Realty Trust, a publicly traded real estate investment
trust, a position he has held since February 2011 and is Chair of the Compensation Committee. Dr. Soaries has also served as an
independent director of the Federal Home Loan Bank of New York since January 2009, where he is Chair of the Compensation and
Human Resources Committee and also serves as a member of the Technology Committee and the Housing Committee. Dr. Soaries
earned a Bachelor of Arts from Fordham University, a Master of Divinity from Princeton Theological Seminary and a Doctor of
Ministry from United Theological Seminary.
Dr. Soaries was selected to serve as a member of our Board of Directors due to his experience in the financial services industry,
including as a board member of a public financial services company. Dr. Soaries brings a unique perspective as a religious and
community leader focused on the issues facing struggling borrowers and communities.
Kevin Stein. Mr. Stein has served as a director of Ocwen since February 2019. He is a Senior Managing Director of EJF Capital
LLC. From March 2017 to December 2019, Mr. Stein served as Chief Executive Officer of Resolution Analytica Corp., a buyer of
commercial judgments. From March 2016 through March 2017, he served as Senior Managing Director of KCK US, Inc., a private
equity firm. Mr. Stein was previously a Managing Director in the Financial Institutions Group of Barclays until 2016. Prior to
joining Barclays in 2011, Mr. Stein was a Partner at FBR Capital Markets & Co. From 1994 to 2004, Mr. Stein was an executive of
GreenPoint Financial Corporation, a bank holding company. Prior to joining GreenPoint in 1994, Mr. Stein was an Associate
Director of the Federal Deposit Insurance Corporation, Division of Resolutions. Mr. Stein is the Audit Chair of Dime Community
Bancshares, Inc., and has served as a director since December 2017. Mr. Stein also served as a director of PHH from June 2017 until
its acquisition by the Company in October 2018. Mr. Stein is also a director and Chair of the Audit Committee of Bedford
Stuyvesant Restoration Corporation.
Mr. Stein was selected to serve as a member of our Board of Directors due to his knowledge regarding the financial services industry
and his mortgage servicing experience, including his prior service as a director of PHH.
Retiring Director
Robert J. Lipstein. Mr. Lipstein has served as a director of Ocwen since March 2017. Since May 2019, Mr. Lipstein has served as a
board member and the Audit Committee Chair of Seacoast Banking Corp. Mr. Lipstein was formerly a partner with KPMG LLP
and served as the Global IT Partner in Charge of Business Services from 2014 to 2016 and as an Advisory Business Unit Partner in
Charge for its Mid-Atlantic Region from 2009 to 2014. His career at KPMG LLP began in 1977. In January 2017, he became a
director at CrossCountry Consulting, a privately-held consulting firm that focuses on corporate advisory services. Since January
2013, he has served as an Advisory Board Member of the Weinberg Center for Corporate Governance at the University of Delaware.
Mr. Lipstein has a Bachelor of Science in Accounting from the University of Delaware.

11
OUR BOARD OF DIRECTORS UNANIMOUSLY RECOMMENDS
THAT YOU VOTE “FOR ALL” OF THE NOMINEES FOR DIRECTOR.

12
BOARD OF DIRECTORS AND CORPORATE GOVERNANCE
Role of the Board of Directors
The Board of Directors plays an active role in overseeing management and representing the interests of the shareholders. Each
director is expected to dedicate sufficient time, energy and attention to ensure diligent performance of his or her duties, including by
attending annual meetings of the shareholders of the Company, and meetings of the Board and Committees of which he or she is a
member.
Our Board of Directors held 14 meetings and acted by unanimous written consent six times in 2019. Each incumbent director who
served as a director during 2019 attended at least 75% of the aggregate of these meetings and all meetings held by all committees of
our Board of Directors on which he or she served during 2019. Directors are expected to attend the annual meeting of shareholders
(including via electronic participation) and a director who is unable to attend is expected to notify the Company Secretary in
advance of such meeting. Our 2019 Annual Meeting of Shareholders was attended by all directors in office on the date thereof.
Director Independence
Our Corporate Governance Guidelines provide that a majority of our Board of Directors must be independent in accordance with the
listing standards of the New York Stock Exchange.
Our Nomination/Governance Committee and the Board of Directors review independence upon appointment and annually review
the direct and indirect relationships that each director has with Ocwen based in part on responses provided by our directors to a
questionnaire that incorporates the independence standards established by the New York Stock Exchange. Only those directors who
satisfy the independence standards and who are determined by our Board of Directors to have no material relationship with Ocwen
(either directly or as a partner, shareholder or officer of an organization that has a relationship with Ocwen) are considered
independent. Following the Nomination/Governance Committee’s review and findings, the Nomination/Governance Committee and
our Board of Directors have affirmatively determined that Ms. Caldwell, Messrs. Bowers, Busquet, and Stein, and Drs. Britell and
Soaries are independent directors. In addition, our Board of Directors has previously determined that Mr. Salcetti, who served as a
director through July 31, 2019, qualified as an independent director, and Mr. Lipstein, who is retiring immediately prior to the
Annual Meeting, is an independent director.
Annual Board Evaluation
Our Corporate Governance Guidelines and Nomination/Governance Committee Charter provide that the Nomination/Governance
Committee will oversee an annual self-assessment of the performance of the Board of Directors as a whole and the performance of
each committee of the Board of Directors. The evaluations are designed to assess whether the Board of Directors and its committees
function effectively and make valuable contributions and to identify opportunities for improving their operations and procedures.
Our 2019 performance self-assessments were conducted in the first quarter of 2020.
Board Leadership Structure
The Board of Directors believes that separating the positions of Chief Executive Officer and Chair of the Board of Directors is the
best structure to fit the Company’s needs at this time. However, our Board of Directors does not believe that it is in the best interests
of the Company and our shareholders to mandate the separation of the offices of Chair of the Board of Directors and Chief
Executive Officer. Rather, our Board of Directors retains the discretion to make determinations on this matter from time to time as
may be in the best interests of the Company and our shareholders. As Chair of the Board, Ms. Caldwell leads the Board of Directors
and oversees Board meetings and the delivery of information necessary for the Board’s informed decision-making. As our President
and Chief Executive Officer, Mr. Messina is responsible for our day-to-day operations and for formulating and executing our long-
term strategies in collaboration with the Board of Directors.
Committees of the Board of Directors
Our Board of Directors has the following standing committees: an Audit Committee, a Compensation and Human Capital
Committee, a Nomination/Governance Committee, a Risk and Compliance Committee, and an Executive Committee. The table
below lists the current members of each of these committees. A brief description of each committee is provided below the table.

13
Name Age(1) Director
Since Audit
Committee
Compensation and Human
Capital Committee
Nomination/ Governance Committee
Risk and Compliance Committee
Executive Committee
Alan J. Bowers 65 2015 X(2) X
Jacques J. Busquet 71 2016 X X(2) X
Jenne K. Britell 77 2019 X X
Phyllis R. Caldwell 60 2015 X(2) X(2)
Robert J. Lipstein(3) 64 2017 X
Glen A. Messina 58 2018 X
DeForest B. Soaries, Jr. 68 2015 X(2) X
Kevin Stein 58 2019 X X
(1) As of April 15, 2020
(2) Committee Chair
(3) In connection with his retirement from our Board of Directors at the Annual Meeting, Mr. Lipstein will step down from his
membership on the Audit Committee.
Audit Committee. The Audit Committee of our Board of Directors oversees the relationship with our independent registered public
accounting firm, and reviews and advises our Board of Directors with respect to matters involving accounting, auditing, and
financial reporting, among other things. Audit Committee oversight also includes the evaluation of significant matters relating to the
financial reporting process and our system of internal accounting controls. The Audit Committee also provides oversight of the
internal audit function and is responsible for ensuring the Company has appropriate procedures in place for the receipt and review of
confidential and anonymous reports of questionable accounting or auditing matters. Additionally, the Audit Committee reviews the
scope and results of the annual audit conducted by the independent registered public accounting firm.
The current members of the Audit Committee are Messrs. Bowers (Chair), Lipstein and Stein. Each member of our Audit Committee
(i) is independent as independence for audit committee members is defined in the listing standards of the New York Stock Exchange
and applicable rules of the Securities and Exchange Commission, (ii) is financially literate, (iii) possesses accounting or related
financial management expertise within the meaning of the listing standards of the New York Stock Exchange and (iv) qualifies as an
audit committee financial expert, as such term is defined in the applicable rules of the Securities and Exchange Commission. No
current member of the Audit Committee serves on the audit committee of more than three other public companies.
Our Audit Committee operates under a written charter approved by our Board of Directors, a copy of which is available on our
website at www.ocwen.com. The Audit Committee generally reviews its charter annually and occasionally reviews it more
frequently. When circumstances require, the charter is amended and the revised version posted on our website. This Committee met
11 times in 2019.
Compensation and Human Capital Committee. The Compensation and Human Capital Committee (Compensation Committee) of
our Board of Directors oversees our compensation and employee benefit plans and practices. In furtherance thereof, the
Compensation Committee reviews and approves corporate goals and objectives relevant to the compensation of our executive
officers, including the President and Chief Executive Officer, evaluates our executive officers’ performance in light of those goals
and objectives and approves our executive officers’ compensation based on their evaluations. In addition, the Compensation
Committee oversees the review and approval of awards made to our non-executive officer employees that participate in our cash and
equity incentive programs. The Compensation Committee is empowered to review and to administer awards under the 2007 Equity
Incentive Plan, under which no new awards may be granted but previously granted awards remain outstanding, and the 2017
Performance Incentive Plan. The Compensation Committee has the authority to retain, at the Company’s expense, compensation
consultants, independent counsel or other advisers as it deems necessary in connection with its responsibilities. The Compensation
Committee may form and delegate authority to subcommittees when it deems it to be appropriate. The role of the Compensation
Committee and our processes and procedures for the consideration and determination of executive and director compensation are
described in more detail below under “Board of Directors Compensation” and “Compensation Discussion and Analysis,”
respectively.

14
The current members of the Compensation Committee are Dr. Soaries (Chair), Mr. Busquet and Dr. Britell. Each of these directors is
independent as independence for Compensation Committee members is defined in the listing standards of the New York Stock
Exchange. In addition, each member of the Compensation Committee also qualifies as a “non-employee” director as defined in Rule
16b-3 of the Securities and Exchange Commission and as an “outside” director within the meaning of Section 162(m) of the Internal
Revenue Code (the “Code”).
Our Compensation Committee operates under a written charter approved by our Board of Directors, a copy of which is available on
our website at www.ocwen.com. The Compensation Committee generally reviews its charter annually and occasionally reviews it
more frequently. When circumstances require, the charter is amended and the revised version posted on our website. This Committee
met nine times in 2019.
Compensation Committee Interlocks and Insider Participation. Dr. Soaries, Messrs. Busquet and Lipstein, and Dr. Britell served
as members of the Compensation Committee during 2019. None of such members were, at any time during the 2019 fiscal year or at
any previous time, an officer or employee of the Company. None of our executive officers have served on the Board of Directors or
Compensation Committee of any other entity that has or had one or more executive officers who served as a member of our Board
of Directors or our Compensation Committee during the 2019 fiscal year. No member of the Compensation Committee had any
relationship with us requiring disclosure under Item 404 of Securities and Exchange Commission Regulation S-K.
Nomination/Governance Committee. The Nomination/Governance Committee of our Board of Directors makes recommendations
to our Board of Directors of candidates to serve as Directors and Committee members for our Board of Directors, advises our Board
of Directors with respect to director composition, procedures and committees, recommends a set of corporate governance principles
to our Board and oversees the evaluation of our Board of Directors and our management.
The current members of the Nomination/Governance Committee are Ms. Caldwell (Chair) and Drs. Britell and Soaries. Each
member of our Nomination/Governance Committee is independent as defined in the listing standards of the New York Stock
Exchange.
Our Nomination/Governance Committee operates under a written charter approved by our Board of Directors, a copy of which is
available on our website at www.ocwen.com. The Nomination/Governance Committee generally reviews its charter annually and
occasionally reviews it more frequently. When circumstances require, the charter is amended and the revised version posted on our
website. This Committee met 13 times in 2019.
Risk and Compliance Committee. The Risk and Compliance Committee of our Board of Directors provides assistance to the Board
of Directors with (i) review of risks that could affect the ability of the Company to achieve its strategies and preserve its assets, (ii)
oversight of an enterprise risk management infrastructure to identify, measure, monitor and report on the risks the Company faces,
(iii) oversight of our compliance function, including our compliance management system, and (iv) oversight of our compliance with
applicable laws, rules and regulations governing our consumer-oriented businesses, including Federal consumer financial laws and
applicable state laws. The Risk and Compliance Committee also provides assistance to the Board of Directors with the review,
approval and oversight of related party transactions pursuant to our Related Party Transactions Approval Policy.
The current members of the Risk and Compliance Committee are Messrs. Busquet (Chair) and Messrs. Bowers and Stein, all of
whom are independent directors as defined in the listing standards of the New York Stock Exchange.
Our Risk and Compliance Committee operates under a written charter approved by our Board of Directors, a copy of which is
available on our website at www.ocwen.com. The Risk and Compliance Committee generally reviews its charter annually and
occasionally reviews it more frequently. When circumstances require, the charter will be amended and the revised version posted on
our website. This Committee met eight times in 2019.
Executive Committee. Our Executive Committee is generally responsible to act on behalf of our Board of Directors during the
intervals between meetings of our Board of Directors, if necessary. The current members of the Executive Committee are Ms.
Caldwell (Chair) and Messrs. Messina and Busquet.
Other Committees. Our Board of Directors has the authority to form additional standing or temporary committees, and delegate
appropriate authority to such committees if and when the Board determines that it is advisable to do so. In addition, the Board may,
from time to time, determine that a standing committee should be dissolved or re-organized in order to more efficiently serve the
Company’s corporate governance needs.

15
Director Nomination Process
The Nomination/Governance Committee periodically assesses the appropriate size and composition of the Board of Directors,
including whether any vacancies on the Board of Directors are anticipated. If vacancies are anticipated, various potential candidates
for director are identified. Candidates may come to the attention of the Nomination/Governance Committee through current
members of the Board of Directors, professional search firms, shareholders or industry sources.
Since January 1, 2015, the Nomination/Governance Committee has recommended, and the Board of Directors has appointed, eight
new independent directors, including three new independent directors appointed in 2015, two new independent directors appointed
in 2016, one new independent director appointed in 2017, and two new independent directors appointed in 2019. Effective May 30,
2019, our Board of Directors fixed the number of directors at nine. Following the retirement of Mr. Salcetti effective July 31, 2019,
our Board has had eight directors. As Mr. Lipstein has informed the Board of Directors that he does not intend to stand for re-
election and is retiring from the Board of Directors immediately prior to the Annual Meeting, our Board of Directors has fixed the
number of directors at seven, effective immediately prior to the commencement of the Annual Meeting.
In evaluating nominees for Director, our Nomination/Governance Committee takes into account the applicable requirements for
directors under the rules of the Securities and Exchange Commission and the listing standards of the New York Stock Exchange. In
addition, our Nomination/Governance Committee takes into account such factors as experience, knowledge, skills, expertise,
integrity, diversity, ability to make independent analytical inquiries, understanding of the Company’s business environment and
willingness and ability to devote adequate time and effort to Board responsibilities and the interplay of the candidate’s qualifications
and experience with the qualifications and experience of other members of our Board of Directors. In February 2019, we revised our
prior policy that directors who have reached the age of 78 may generally not be nominated, as we believe it is more beneficial to
focus on the qualifications, experience, and performance of our directors and director nominees and consider Board refreshment
from a broader perspective than the age of individual directors. We also consider the number of other boards on which a nominee
sits. The Company’s general policy is to limit the number of other public company boards of directors upon which a director may sit
to four. The Board of Directors retains discretion to appoint or nominate for election by the shareholders individuals who sit on more
than four other public company boards of directors if the Board of Directors considers the addition of such individual to the Board
of Directors to be in the best interests of the Company and its shareholders. Our Nomination/Governance Committee evaluates all of
the factors outlined above, as well as any other factors it deems to be appropriate, and recommends candidates that it believes will
enhance our Board of Directors and benefit the Company and our shareholders. It is the policy of our Nomination/Governance
Committee to consider candidates for director recommended by shareholders, but the Nomination/Governance Committee has no
obligation to recommend such candidates. A copy of our Corporate Governance Guidelines is available on our website at
www.ocwen.com.
Pursuant to the Board of Director’s Diversity Policy, the Nomination/Governance Committee considers diversity when it
recommends director nominees to the Board of Directors. We view diversity in an expansive way to include differences in prior
work experience, viewpoint, education and skill set. In particular, the Nomination/Governance Committee considers diversity in
professional experience, skills, expertise, training, broad-based business knowledge and understanding of the Company’s business
environment when recommending director nominees to the Board of Directors with the objective of achieving a Board with diverse
business and educational backgrounds. In addition, the Board recognizes the value of including perspectives shaped by diverse
ethnicities, geographic origins and genders in building an inclusive corporate culture that reflects and supports Ocwen’s diverse
customer base and global workforce. Board members should have individual backgrounds that, when combined, provide a portfolio
of experience and knowledge that will serve the Company’s strategic and governance needs. The Nomination/Governance
Committee reviews the skills and attributes of Board members within the context of the current make-up of the full Board of
Directors from time-to-time, as appropriate. The Nomination/Governance Committee does not discriminate against candidates for
the Board of Directors based on race, color, religion, sex, sexual orientation or national origin.
In evaluating a particular candidate, the Nomination/Governance Committee will consider factors other than the candidate’s
qualifications, including the current composition of the Board of Directors, the balance of management and independent directors,
the need for Audit Committee and other expertise and the evaluations of other prospective nominees. In connection with this
evaluation, the Nomination/Governance Committee determines whether to interview the prospective nominee, and if warranted, one
or more members of the Nomination/Governance Committee, and others as appropriate, interview prospective nominees. After
completing this evaluation and interview process, the Nomination/Governance Committee makes a recommendation to the full
Board of Directors as to the persons who should be nominated by the Board of Directors. The Board of Directors determines the
nominees after considering the recommendation of the Nomination/Governance Committee. Should a shareholder recommend a
candidate for Director, our Nomination/Governance Committee would evaluate such candidate in the same manner that it evaluates
any other nominee. To date, no shareholder or group of shareholders has put forth any director nominees for the Annual Meeting.
16
If you wish to recommend persons for consideration by our Nomination/Governance Committee as nominees for election to our
Board of Directors, you may do so by written notice to our Secretary at Ocwen Financial Corporation, 1661 Worthington Road,
Suite 100, West Palm Beach, Florida 33409. Such notice must contain all the information set forth in Section 2.2 of our Bylaws and
comply with the procedures and deadline set forth therein. See “Submission of Shareholder Proposals for 2021 Annual Meeting,”
below for additional information about this process.
Prohibition against Short Sales, Hedging and Margin Accounts
Our Insider Trading Prevention Policy prohibits any director, officer or employee from engaging in any short sale of the Company’s
stock, establishing and using a margin account with a broker-dealer for the purpose of buying or selling Company stock, pledging
Company securities as collateral for a loan, buying or selling puts or calls on the Company’s stock, or engaging in any other
transaction that hedges the economic risk associated with ownership of the Company’s securities. This policy is designed to
encourage investment in the Company’s stock for the long term, on a buy and hold basis, and to discourage active trading or short-
term speculation and applies regardless of whether such Company securities were (i) granted to the director, officer or employee as
part of their compensation or (ii) held directly or indirectly by the director, officer or employee.
Corporate Governance Guidelines
The Corporate Governance Guidelines adopted by our Board of Directors provide guidelines for us and our Board of Directors to
help ensure effective corporate governance. The Corporate Governance Guidelines cover topics such as director qualifications,
board of director and committee composition, director responsibilities, director access to management and independent advisers,
director compensation, director orientation and continuing education, management succession and annual performance appraisal of
the Board of Directors.
Our Corporate Governance Guidelines are available on our website at www.ocwen.com. Our Nomination/Governance Committee
reviews our Corporate Governance Guidelines annually and recommends amendments to the Board of Directors for approval.
The Board of Directors has also adopted a Clawback Policy as further described under “Clawback Policy” in the “Executive
Compensation” section below.
Executive Sessions of Non-Management Directors
Ms. Caldwell chairs executive sessions of the full Board of Directors. Our non-management directors met in executive sessions of
the full Board without management during seven meetings in 2019. In addition, our Audit and Risk and Compliance Committees
generally met in executive session at each regularly scheduled quarterly meeting and on other occasions when the members believed
it was advisable to do so.
Meetings with Management Independent of the Chief Executive Officer
Our Chair, the chairs of our committees and our other directors meet with various members of management, without the Chief
Executive Officer present, to discuss matters relevant to the business of the Company. For example, in addition to discussions with
members of senior management, the chair of the Audit Committee meets independently with the Chief Audit Executive, our
independent auditors and the General Counsel from time to time and the chair of the Risk and Compliance Committee meets
independently with the Chief Risk and Compliance Officer and the General Counsel from time to time. Our directors have also
visited various of our U.S. and international sites to meet generally with employees and senior management in those locations.
Communications with Directors
If you desire to communicate with our Board of Directors or any individual director regarding Ocwen, you may do so by writing to
our Secretary at Ocwen Financial Corporation, 1661 Worthington Road, Suite 100, West Palm Beach, Florida 33409. You may
communicate anonymously or confidentially and may also indicate whether you are a shareholder, customer, supplier, or other
interested party.
You may also write to our Board of Directors through our website at http://shareholders.ocwen.com/contactBoard.cfm.
Shareholders and other interested parties may communicate directly with the Audit Committee and the non-management directors of
the Board of Directors by calling our hotline, which is administered by a third party, at 1-800-884-0953. The Chair of the Audit
Committee has been designated to receive such communications.

17
Communications received in writing are distributed to our Board of Directors or to individual directors, as the General Counsel and
Secretary deem appropriate, depending on the facts and circumstances outlined in the communication received. In that regard, the
Board of Directors has requested that certain items that are unrelated to the duties and responsibilities of the Board of Directors
should be excluded, such as:
• Service or product complaints
• Service or product inquiries
• New service or product suggestions
• Resumes and other forms of job inquiries
• Surveys
• Business solicitations or advertisements
In addition, material that is unduly hostile, threatening, illegal, repetitive, irrelevant to the Board of Directors or similarly unsuitable
will be excluded, provided that any communication that is filtered out will be made available to any non-management director upon
request.
Code of Ethics
We have adopted a Code of Business Conduct and Ethics that applies to our directors, officers and employees as required by the
New York Stock Exchange rules. We have also adopted a Code of Ethics for Senior Financial Officers that applies to our Chief
Executive Officer, Chief Financial Officer, and Chief Accounting Officer. Any waivers from either the Code of Business Conduct
and Ethics or the Code of Ethics for Senior Financial Officers must be approved by our Board of Directors or a Board Committee
and must be promptly disclosed. The Code of Business Conduct and Ethics and the Code of Ethics for Senior Financial Officers are
available on our web site at www.ocwen.com. Any amendments to the Code of Business Conduct and Ethics or the Code of Ethics
for Senior Financial Officers, as well as any waivers that are required to be disclosed under the rules of the Securities and Exchange
Commission or the New York Stock Exchange, will be posted on our website.
Risk Management and Oversight Process
One of our Board of Directors’ key responsibilities is the oversight of risk associated with the Company. Certain of these
responsibilities have been delegated to specific Committees, in which case the Board oversees the work of the Committee. As
discussed above, our Risk and Compliance Committee is responsible for monitoring the Company’s enterprise risk management
framework, and regularly meets with the Chief Risk and Compliance Officer to discuss risk exposures and mitigation plans. This
Committee monitors the Company’s evaluation and management of risks, including operational risk, regulatory compliance risks
and cybersecurity risks, through reviews with management and it reviews and approves related party transactions. The Audit
Committee monitors the Company’s financial risks through regular reviews of the Company’s financial activities with management
and internal and external auditors. The Nomination/Governance Committee monitors the Company’s governance risk by regular
review with management. The Compensation Committee monitors the Company’s compensation policies and related risks by
regular reviews with management. The Board of Directors’ role in risk oversight is consistent with the Company’s leadership
structure with the President and Chief Executive Officer and other members of senior management, including our Chief Risk and
Compliance Officer, having responsibility for assessing and managing the Company’s risk exposure, and the Board of Directors and
its Committees providing oversight in connection with these efforts.

18
BOARD OF DIRECTORS COMPENSATION
The following table discloses compensation received for fiscal year 2019 by each member of our Board of Directors who was not
employed by us or one of our subsidiaries and who served as a director during fiscal year 2019 (our “non-management directors”).
Name
Fees Earned Or Paid in Cash
($)
Stock Awards(1)(2)(3)
($)
Total
($)
Phyllis R. Caldwell 176,000 100,000 276,000
Jenne K. Britell (4) 74,460 125,205 199,665
Alan J. Bowers 123,500 100,000 223,500
Jacques J. Busquet 124,500 100,000 224,500
Carol J. Galante (5) 38,118 — 38,118
Robert J. Lipstein 103,651 100,000 203,651
Robert A. Salcetti (6) 62,686 100,000 162,686
DeForest B. Soaries, Jr. 112,000 100,000 212,000
Kevin Stein (4) 79,657 125,205 204,862
(1) Amounts reported for stock awards represent the aggregate grant date fair value of awards granted during fiscal 2019 under the
2017 Performance Incentive Plan (the “2017 Plan”) computed in accordance with Financial Accounting Standards Board
(“FASB”) Accounting Standards Codification (“ASC”) Topic 718. We based the grant date fair value of stock awards on the
closing price of our common stock on the New York Stock Exchange on the date of grant of the awards.
(2) On May 30, 2019, our non-management directors received equity awards under the 2017 Plan for their service for the 2019-
2020 term. Each award had a grant date fair value totaling $100,000 (with immaterial incremental value resulting from
rounding to the next whole share). Each director received 62,500 restricted stock units (“RSUs”) vesting May 30, 2020 in the
event each director attends at least 75% of applicable Board and committee meetings.
(3) Our non-management directors have no shares subject to option awards or other equity awards outstanding as of December 31,
2019, other than the RSUs issued May 30, 2019, except the following issued in prior service years to directors deferring their
equity compensation pursuant to the Deferral Plan for Directors: Mr. Salcetti held 79,348 RSUs deliverable January 31, 2020
(six months following the termination of his service), and Dr. Soaries holds 12,240 RSUs deliverable six months following the
termination of his service and 19,901 RSUs deliverable on January 1, 2023.
(4) On February 28, 2019, the Board appointed Dr. Britell and Mr. Stein to the Board of Directors and granted each a pro-rated
equity award with a grant date fair value of $25,205 corresponding to the period between the date of their appointment and the
date of the 2019 Annual Meeting. Each of Dr. Britell and Mr. Stein received 11,778 RSUs which vested on May 30, 2019.
(5) Ms. Galante retired effective May 30, 2019 immediately prior to the 2019 Annual Meeting. Accordingly, she did not receive a
2019 equity award for 2019-2020 director service.
(6) Mr. Salcetti retired effective July 31, 2019. As described in Note (2), above, director equity awards will vest May 30, 2020.
Under the terms of the awards, a director who retires mid-year must attend 75% of the combined total of (i) Board meetings that
occurred while he or she served on the Board during 2019 and (ii) the total number of meetings during 2019 for committees on
which the director served immediately prior to retirement. If the 75% threshold is not met, the award will vest in the same
proportion as the director’s attendance. Since presently unscheduled meetings may occur from the date of this Proxy Statement
through May 30, 2020, it is not possible to determine what percentage of Mr. Salcetti’s $100,000 stock award will vest.
Standard Compensation Arrangements for Non-Management Directors
The Compensation Committee has the responsibility for determining the form and amount of compensation for our non-
management directors. Mr. Messina, our management director, does not receive an annual retainer or any other compensation for his
service on the Board of Directors. Non-management directors receive the following compensation for their services on the Board of
Directors.

19
Cash Compensation
In 2019, we provided the following annual cash compensation to our non-management directors in quarterly installments (except as
noted below):
• a retainer of $80,000;
• an additional $75,000 to the Chair of the Board;
• an additional $25,000 to the Audit Committee, Compensation Committee, and Risk and Compliance Committee
Chairs;
• an additional $15,000 to the Nomination/Governance Committee Chair; and
• an additional $12,500 to all Audit Committee, Compensation Committee, and Risk and Compliance Committee members
(other than the Chairs).
In addition, our directors receive per-meeting fees of $1,000 per meeting for each meeting in excess of eight meetings of the Board
of Directors a year. Similarly, each member of the Compensation Committee receives an additional $1,000 for attending each
meeting of the Compensation Committee in excess of eight annually. Our other committee members are not compensated on a per-
meeting basis.
Our 2019 Board of Directors fee structure reflects the determination of our Compensation Committee to reduce the cash component
of directors’ annual retainer fee from $100,000 to $80,000 and to reduce compensation for service as chair of the Audit,
Compensation and Risk & Compliance committees from $30,000 to $25,000, in each case effective as of January 1, 2019.
Effective February 10, 2020, the Compensation Committee determined to increase annual compensation for service as Chair of the
Board from $75,000 to $100,000.
Equity Compensation
At our 2017 Annual Shareholder Meeting, our shareholders approved the 2017 Performance Incentive Plan (the “2017 Plan”).
Following the 2019 Annual Shareholder Meeting, each non-management member of the Board of Directors was granted an award of
restricted stock units (“RSUs”) under the 2017 Plan with a grant date fair value of $100,000 (rounded to the next whole share). The
RSUs vest on the one-year anniversary of grant if the director has attended an aggregate of at least 75% of all meetings of the Board
of Directors and committees of which the director is a member during such period. Upon vesting, the shares of common stock
underlying the RSUs will be issued to the director unless the director has elected to defer delivery in accordance with the Deferral
Plan for Directors, as described below. In the event that the director has attended less than an aggregate of at least 75% of all such
meetings, such director’s right to ownership will vest on a pro rata basis according to the director’s actual attendance percentage,
with the remaining shares forfeited. RSUs are generally non-transferable, confer no voting rights in the underlying shares prior to
delivery, and no adjustments will be made for dividends for which the record date is prior to the date of issuance of such shares.
Following our 2020 Annual Shareholder Meeting on May 27, 2020, each non-management member of the Board of Directors will
again be granted an equity award with a grant date fair value of $100,000 (rounded to the next whole share), subject to their election
to defer, as described further below. In the event we have an insufficient number of shares remaining available under the 2017 Plan
at the time of the Annual Meeting, directors will be granted the right to receive cash to the extent of the available share shortfall.
Payment of any cash amounts will be made on May 27, 2021 subject to the same vesting and other conditions as the RSUs.
Deferral Plan for Directors
The Ocwen Financial Corporation Deferral Plan for Directors provides non-management directors with the opportunity to defer the
receipt of all or a portion of their equity compensation earned for their service as directors. The plan is administered by the
Compensation Committee. Before the end of each calendar year (or, in the case of directors appointed between Annual Meetings,
within 30 days of appointment), the non-management directors make an election to defer delivery of either all or a portion of the
equity portion of their annual compensation for the following grant year. Directors electing to defer receipt of equity will become
vested in the shares underlying a deferred equity award and will receive dividend equivalents to the same extent as they would if the
original award had not been deferred.
Each director electing deferral must specify the payment date at the time of election for any shares underlying a deferred award as
either (i) the six-month anniversary of the director’s termination date or (ii) any other date elected by the director which is at least
two years after the last day of the year of service for which the compensation was awarded. At least thirty days prior to payment of
deferred compensation, a director shall elect to receive such payment in the form of either (i) cash in an amount equal to the fair

20
market value of the shares underlying the deferred equity award, or (ii) the shares of common stock underlying the deferred equity
award.
Other Compensation Matters
Director compensation may be prorated for a director serving less than a full one-year term such as in the case of a director joining
the Board of Directors after an annual meeting of shareholders. Directors are reimbursed for reasonable travel and other expenses
incurred in connection with performing their duties, including attending meetings of the Board of Directors and its committees.
Director compensation is subject to review and adjustment by the Compensation Committee from time to time.

21
EXECUTIVE OFFICERS
The following table sets forth certain information with respect to each person who currently serves as one of our executive officers.
Our executive officers are appointed by our Board of Directors and generally serve at the discretion of our Board of Directors. There
are no arrangements or understandings between us and any person for the appointment of any person as an executive officer. None
of our directors and/or executive officers is related to any other director and/or executive officer of Ocwen or any of its subsidiaries
by blood, marriage or adoption.
Name Age(1) Position(1)
Glen A. Messina 58 President and Chief Executive Officer
Scott W. Anderson 51 Executive Vice President and Chief Servicing Officer
John V. Britti 60 Executive Vice President and Chief Investment Officer
June C. Campbell 62 Executive Vice President and Chief Financial Officer
Albert J. Celini 57 Executive Vice President and Chief Risk and Compliance Officer
Francois Grunenwald 49 Senior Vice President and Chief Accounting Officer
Joseph J. Samarias 48 Executive Vice President, General Counsel and Company Secretary
Arthur C. Walker, Jr. 48 Senior Vice President, Global Tax
Timothy J. Yanoti 57 Executive Vice President and Chief Growth Officer
Dennis Zeleny 64 Executive Vice President and Chief Administrative Officer
(1) All age and position information set forth herein is as of April 15, 2020.
The principal occupation for at least the last five years, as well as certain other biographical information, for each of our executive
officers who is not a director is set forth below.
Scott W. Anderson. Mr. Anderson has served as Executive Vice President and Chief Servicing Officer since 2009, and his career
with Ocwen has spanned over twenty years. Prior to his current role, he served as Senior Vice President, Residential Assets since
November 2001. Prior to joining Ocwen in November 1993, Mr. Anderson was employed by CIGNA. He holds a Bachelor of Arts
in Economics from Bowdoin College.
John V. Britti. Mr. Britti has served as Executive Vice President and Chief Investment Officer since June 2014. From July 1, 2018
through October 3, 2018, he also served as interim Chief Executive Officer. From September 2016 to February 2017, he served as
the Interim Head of Risk Management. He previously served as Chief Financial Officer from March 2012 to June 2014 and
Executive Vice President of Ocwen responsible for Finance and Business Development from January 2011 to March 2012. He has
been with Ocwen since January 2011. Prior to joining Ocwen, Mr. Britti was Chief Operating Officer for mortgage insurer RMIC
from 2005 to 2011. Mr. Britti held two positions at Freddie Mac as a Vice President running Field Sales and Pricing & Structured
Transactions. Mr. Britti has also been a Vice President at Capital One running Thrift and Mortgage Operations. After business
school, Mr. Britti worked at McKinsey & Company in its financial services industry group. He holds a Bachelor of Arts in
Economics from the University of Maryland and a Master of Business Administration from Dartmouth’s Amos Tuck School.
June C. Campbell. Ms. Campbell has served as Executive Vice President and Chief Financial Officer since March 2019. Ms.
Campbell joined Ocwen from GE Capital, the financial services unit of General Electric Company, where she held multiple senior
management positions in Finance, Capital Markets and Operations during her more than 20-year career at the company. Most
recently, she served as Managing Director, Global Capital Markets, a position she held since 2014. Ms. Campbell’s prior roles
included serving as Chief Operating Officer for GE Capital Canada from 2011 to 2014 and Chief Financial Officer of GE Capital
Real Estate Canada from 2008 to 2011. She holds a Bachelor of Science from Simmons College and a Master of Business
Administration from the University of Chicago.
Albert J. Celini. Mr. Celini has served as Executive Vice President and Chief Risk and Compliance Officer since May 2019. From
the closing of Ocwen’s acquisition of PHH Corporation in October 2018 until May 2019, he served as Senior Vice President and
Chief Risk and Compliance Officer. From November 2017 through October 2018, he served as the Chief Risk and Compliance
Officer of PHH Corporation. From May 2017 through October 2018, he served as a risk management consultant to the mortgage
industry with Newbold Advisors LLC, a professional services firm, and from June 2016 through April 2017, with Common
Securitization Solutions LLC (a joint venture between Fannie Mae and Freddie Mac). He also previously held executive roles at Sun

22
National Bank, Freddie Mac, and Ally Bank (formerly GMAC Bank). Mr. Celini is a Certified Public Accountant and received a
Bachelor of Science in Accounting from Fordham University.
Francois Grunenwald. Mr. Grunenwald has served as our Senior Vice President and Chief Accounting Officer since August 2019.
Prior to joining Ocwen, he spent the prior 20 years at PricewaterhouseCoopers, where he served in various accounting and financial
advisory roles with a focus on financial services clients, including for the last 12 years as a Partner. Mr. Grunenwald is a Certified
Public Account and holds a Master’s degree in Finance and Banking from the University of Paris II Panthéon-Assas.
Joseph J. Samarias. Mr. Samarias has served as Executive Vice President and General Counsel since April 2019. He previously
served as Senior Vice President, Deputy General Counsel of Ocwen since 2013. He also serves as the Company’s Chief Ethics
Officer, and was appointed Company Secretary in April 2020. Prior to joining Ocwen, from 2009 to 2013, Mr. Samarias was a
senior attorney with the Treasury Department’s Office of Financial Stability (“OFS”). From 2012 to 2013, he served as Chief
Counsel of OFS where he was responsible for directing all legal activities of the Troubled Asset Relief Program, and served as the
chief legal advisor to the Assistant Secretary for Financial Stability. Prior to his government service, Mr. Samarias was a litigator
with several international law firms from 1997 to 2009. He holds a Bachelor of Arts from Vanderbilt University, a Juris Doctor
from Washington University School of Law, and is a member of the bars of the Commonwealth of Virginia and the District of
Columbia, as well as a Florida Authorized House Counsel, and a New Jersey In-House Counsel.
Arthur C. Walker, Jr. Mr. Walker serves as our Senior Vice President, Global Tax and has been with Ocwen since August 2013. In
that capacity he leads all the tax department functions for Ocwen. Mr. Walker has over nineteen years of tax experience advising
public companies on domestic and international tax matters. Prior to joining Ocwen, Mr. Walker was a tax partner with the law firm
of Mayer Brown LLP and had been with Mayer Brown for fourteen years. Mr. Walker has advised companies in many different
industries throughout his career including financial services, technology, software, service provider, pharmaceutical, transportation,
healthcare, and manufacturing. His tax practice experience has included planning, intercompany transfer pricing, structuring /
restructuring of business operations, offshore intangibles, contract manufacturing, cross-border financing, mergers and acquisitions,
legislation, private letter rulings, examinations and administrative appeals. Mr. Walker holds a Bachelor of Science in Business
Administration from Georgetown University’s McDonough School of Business and a Juris Doctor and Master of Laws in Taxation
from Georgetown University Law Center.
Timothy J. Yanoti. Mr. Yanoti has served as Executive Vice President and Chief Growth Officer since November 2018. From 2014
through 2018, he served as Co-Chairman and President of American Financial Resources, a residential mortgage originations
company with over 500 employees operating in all 50 states. From 2011 through 2014, he was Senior Vice President, Head of
Securitization for Fannie Mae where he was responsible for developing the Common Securitization Platform for the GSEs. Prior to
joining Fannie Mae, Mr. Yanoti served as Managing Director, Head of Mortgage Banking of Knight Capital Group, a global
financial services firm, and Senior Managing Director, Head of Capital Markets of National City Corporation. During his career Mr.
Yanoti has also held several leadership roles at General Electric Company, including Head of Global Securitization of GE
Capital and Head of Capital and Secondary Markets of GE Mortgage. Prior to entering the finance and banking industry he worked
as an aerospace and software engineer. He received a Bachelor of Science from Clarkson University and a Master of Business
Administration from Cornell University.
Dennis Zeleny. Mr. Zeleny has served as Executive Vice President and Chief Administrative Officer since August 2019. In that
capacity, he oversees Ocwen’s global human resources function, corporate communications, facilities, and diversity and inclusion
programs. From January through August 2019, Mr. Zeleny served Ocwen as a human resources consultant. From 2012 through
2019, Mr. Zeleny provided executive Human Capital consulting services including co-CEO Center on Executive Compensation, and
an Interim CHRO for Hertz. He previously held the role of Chief Administrative or Chief Human Resources Officer at Sunoco,
Caremark, and DuPont, oversaw global human resources at Honeywell and served 17 years at PepsiCo. Mr. Zeleny also served on
the Board of HRPA, Cornell ILR Advisory Board, SXL and SCX, NYSE publicly traded companies. He received a B.S. from
Cornell University and an M.S. from the Graduate School of Business at Columbia University.

23
SECURITY OWNERSHIP OF CERTAIN BENEFICIAL OWNERS
AND RELATED SHAREHOLDER MATTERS
Beneficial Ownership of Equity Securities
The following table sets forth certain information regarding the beneficial ownership of our common stock as of April 15, 2020 by:
• each of our directors and director nominees;
• each named executive officer; and
• all of our directors and current executive officers as a group.
Each of Ocwen’s directors, director nominees and named executive officers may be reached through Ocwen Corporate
Headquarters at 1661 Worthington Road, Suite 100, West Palm Beach, Florida 33409.
The following table also sets forth information with respect to each person known by Ocwen to beneficially own more than five
percent of the outstanding shares of its common stock.
The table is based upon information supplied to us by directors and executive officers and filings under the Securities Exchange
Act of 1934, as amended. We have based our calculation of the percentage of beneficial ownership on 129,683,377 shares of our
common stock outstanding as of April 15, 2020, unless otherwise noted.
Shares Beneficially Owned(1)
Name and Address of Beneficial Owner: Amount of Beneficial
Ownership Percent of Class
Deer Park Road Management Company, LP(2) 1195 Bangtail Way Steamboat Springs, CO 80487
13,356,147
10.3 %
Leon G. Cooperman(3) St. Andrew’s Country Club 7118 Melrose Castle Lane Boca Raton, FL 33428
12,193,460
9.4 %
BlackRock Inc.(4) 55 East 52nd Street New York, NY 10055
9,514,671
7.3 %
Roberto Marco Sella(5) 2929 Arch Street, Suite 325 Philadelphia, PA 19104
6,821,474
5.3 %
Directors and Named Executive Officers:
Scott W. Anderson(6) 253,326 *
Alan J. Bowers(7) 151,715 *
Jenne K. Britell(8) 113,858 *
Jacques J. Busquet(9) 136,717 *
Phyllis R. Caldwell(10) 285,651 *
June C. Campbell(11) 83,377 *
Catherine M. Dondzila(12) — *
Robert J. Lipstein(13) 333,052 *
Glen A. Messina(14) 674,242 *
DeForest B. Soaries, Jr.(15) 59,447 *
Kevin Stein(16) 104,278 *
Timothy J. Yanoti(17) 107,785 *
Dennis Zeleny(18) 5,000 *
All Current Directors and Executive Officers as a Group (17 persons)(19) 2,777,229 2.1 %

24
* Less than 1%
(1) For purposes of this table, an individual is considered the beneficial owner of shares of common stock if he or she has the right
to acquire such common stock within 60 days of April 15, 2020 and directly or indirectly has or shares voting power or
investment power, as defined in the rules promulgated under the Securities Exchange Act of 1934, as amended. Unless
otherwise indicated, each person has sole voting power and sole investment power with respect to the reported shares. No
shares have been pledged as security by the named executive officers or directors.
(2) Deer Park Road Management Company, LP: Based solely on information contained in a Schedule 13G/A filed with the
Securities and Exchange Commission on February 14, 2020, reporting securities deemed to be beneficially owned as of
December 31, 2019, by Deer Park Road Management Company, LP (“Deer Park”); Deer Park Road Management GP, LLC
(“DPRM”); Deer Park Road Corporation (“DPRC”); Michael Craig-Scheckman (“Mr. Craig-Scheckman”); AgateCreek LLC
(“AgateCreek”); and Scott Edward Burg (“Mr. Burg”), each of which reports shared voting and dispositive power of
13,356,147 shares held for the account of STS Master Fund, Ltd. (the “STS Master Fund”), which is an exempted company
organized under the laws of the Cayman Islands. Deer Park serves as investment adviser to the STS Master Fund and, in such
capacity, exercises voting and investment power over the shares held in the account for the STS Master Fund. DPRM is the
general partner of Deer Park. Each of DPRC and AgateCreek is a member of DPRM. Mr. Craig-Scheckman is the Chief
Executive Officer of each of Deer Park and DPRC and the sole owner of DPRC. Mr. Burg is the Chief Investment Officer of
Deer Park and the sole member of AgateCreek.
(3) Mr. Cooperman: Based solely on information contained in a Schedule 13G/A filed with the Securities and Exchange
Commission on February 14, 2020 reporting securities beneficially owned as of December 31, 2019. Mr. Cooperman is the
Managing Member of Omega Associates, L.L.C. (“Associates”), a limited liability company organized under the laws of the
State of Delaware. Associates is a private investment firm formed to invest in and act as general partner of investment
partnerships or similar investment vehicles. Associates is the general partner of a limited partnership organized under the laws
of Delaware known as Omega Capital Partners, L.P. (“Capital LP”), a private investment firm comprised of Cooperman family
funds engaged in the purchase and sale of securities for investment for its own account. Mr. Cooperman is the ultimate
controlling person of Associates and Capital LP. Mr. Cooperman is married to an individual named Toby Cooperman, and has
an adult son named Michael S. Cooperman. Mr. Cooperman has investment authority over the shares held by Toby Cooperman
and Michael S. Cooperman. Mr. Cooperman reports sole voting and dispositive power with respect to 12,193,460 shares,
which consists of 10,193,460 shares owned by Capital LP, 1,000,000 shares owned by Mr. Cooperman, 500,000 shares owned
by Toby Cooperman, and 500,000 shares owned by Michael S. Cooperman.
(4) BlackRock, Inc.: Based solely on information contained in a Schedule 13G/A filed with the Securities and Exchange
Commission on February 5, 2020 reporting securities deemed to be beneficially owned as of December 31, 2019, by
BlackRock, Inc. Pursuant to the Schedule 13G/A, BlackRock, Inc. has sole voting power over 9,129,512 shares and sole
dispositive power over 9,514,671 shares and is reporting beneficial ownership of the shares as the parent holding company or
control person of BlackRock Advisors, LLC, BlackRock Investment Management (UK) Limited, BlackRock Asset
Management Canada Limited, BlackRock Investment Management (Australia) Limited, BlackRock (Netherlands) B.V.,
BlackRock Fund Advisors, BlackRock Asset Management Ireland Limited, BlackRock Institutional Trust Company, National
Association, BlackRock Financial Management, Inc., BlackRock Asset Management Schweiz AG, and BlackRock Investment
Management, LLC.
(5) Mr. Sella: Based solely on information contained in a Schedule 13G/A filed with the Securities and Exchange Commission on
February 6, 2020 reporting securities beneficially owned as of December 31, 2019, Mr. Sella reports sole voting and
dispositive power with respect to 6,480,400 shares, consisting of 6,139,326 shares held of record by Roberto Marco Sella and
341,074 shares held of record by LL Charitable Foundation, of which Mr. Sella serves as President. Mr. Sella reports shared
voting and dispositive power with respect to 341,074 shares held of record by the Roberto Sella 2012 Family Trust (the
“Trust”). Francine Sella, Mr. Sella’s spouse, and Mr. Sella’s minor children are beneficiaries of the Trust. Francine Sella is a
co-trustee of the Trust and in such capacity, Francine Sella has voting power over and power to dispose of the 341,074 shares
of Common Stock held by the Trust. Mr. Sella is not a beneficiary of the Trust.
(6) Mr. Anderson serves as Executive Vice President and Chief Servicing Officer. Includes shares underlying 55,272 options
which are presently exercisable and 16,875 options which could become exercisable within 60 days of April 15, 2020.
(7) Mr. Bowers serves as a director. Includes shares underlying 62,500 RSUs which will vest May 27, 2020 subject to certain
conditions relating to the individual’s service as a director.

25
(8) Dr. Britell serves as a director. Includes shares underlying 62,500 RSUs which will vest May 27, 2020 subject to certain
conditions relating to the individual’s service as a director. Also includes 39,580 shares held by trust.
(9) Mr. Busquet serves as a director. Does not include shares underlying 62,500 RSUs which will vest May 27, 2020 subject to
certain conditions relating to the individual’s service as a director but which are not settleable until June 1, 2022.
(10) Ms. Caldwell serves as Chair of the Board of Directors. Includes shares underlying 62,500 RSUs which will vest May 27,
2020 subject to certain conditions relating to the individual’s service as a director.
(11) Ms. Campbell serves as Executive Vice President and Chief Financial Officer. Includes shares underlying 11,060 options
which are presently exercisable and 19,201 restricted stock units which could vest within 60 days of April 15, 2020. Also
includes 47,638 shares held jointly with spouse.
(12) Ms. Dondzila served as principal financial officer from July 17, 2018 through March 3, 2019.
(13) Mr. Lipstein serves as a director. Includes shares underlying 62,500 RSUs which will vest May 27, 2020 subject to certain
conditions relating to the individual’s service as a director. Mr. Lipstein has announced his retirement from the Board, effective
immediately prior to the commencement of the Annual Meeting.
(14) Mr. Messina serves as President, Chief Executive Officer, and a director. Includes shares underlying 88,996 options which are
presently exercisable. Also includes 308,300 shares held jointly with spouse.
(15) Dr. Soaries serves as a director. Does not include shares underlying 62,500 RSUs which will vest May 27, 2020 subject to
certain conditions relating to the individual’s service as a director but which are not settleable until the six-month anniversary
of the director’s termination of service, 12,240 shares underlying vested RSUs which are not settleable until the six-month
anniversary of the director’s termination of service, and 19,901 shares underlying vested RSUs which are not settleable until
January 1, 2023.
(16) Mr. Stein serves as a director. Includes shares underlying 62,500 RSUs which will vest May 27, 2020 subject to certain
conditions relating to the individual’s service as a director. Also includes 30,000 shares held by trust.
(17) Mr. Yanoti serves as Executive Vice President and Chief Growth Officer. Includes shares underlying 27,131 options which are
presently exercisable and 23,255 restricted stock units which could vest within 60 days of April 15, 2020. Also includes 10,000
shares held by spouse.
(18) Mr. Zeleny serves as Executive Vice President and Chief Administrative Officer.
(19) Includes shares underlying 355,041 stock options which are presently exercisable, 26,250 stock options which could become
exercisable within 60 days, and 42,456 restricted stock units which could vest within 60 days of April 15, 2020. Excludes
shares beneficially owned by Catherine D. Dondzila, who is a Named Executive Officer for SEC purposes but not a current
executive officer, and includes shares beneficially owned by John V. Britti, Albert. J Celini, Joseph J. Samarias, and Arthur C.
Walker, Jr., who are current executive officers but not Named Executive Officers.
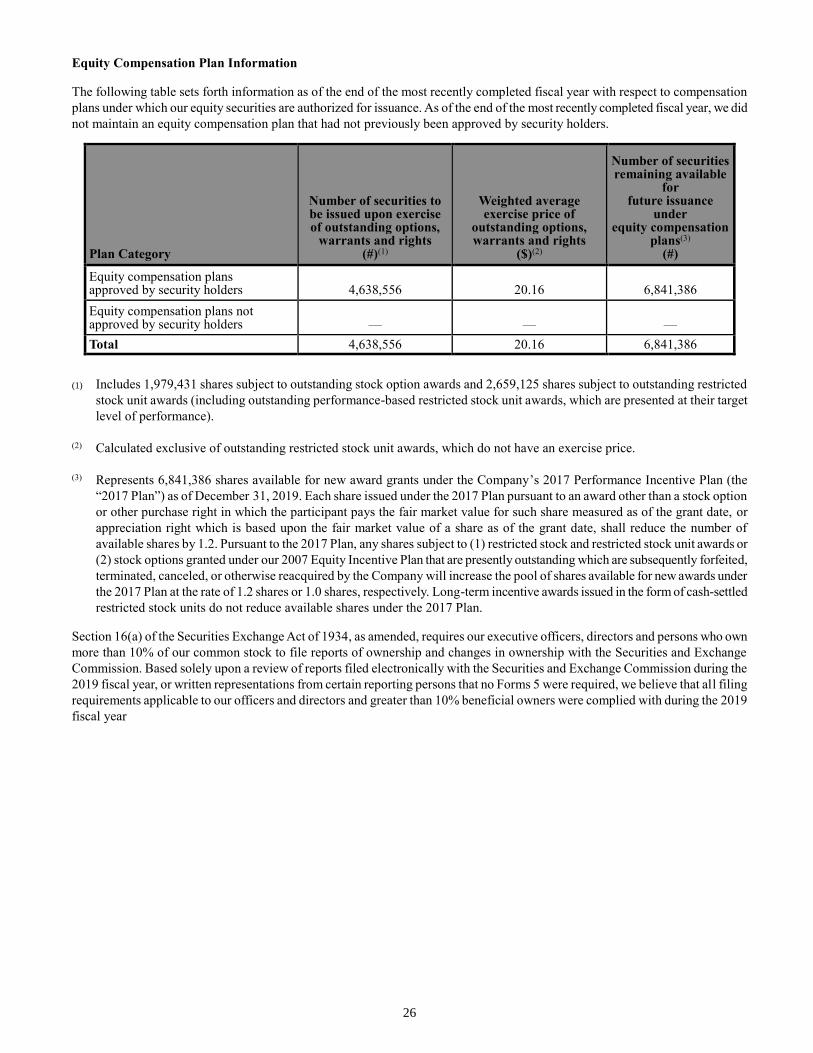
26
Equity Compensation Plan Information
The following table sets forth information as of the end of the most recently completed fiscal year with respect to compensation
plans under which our equity securities are authorized for issuance. As of the end of the most recently completed fiscal year, we did
not maintain an equity compensation plan that had not previously been approved by security holders.
Plan Category
Number of securities to be issued upon exercise of outstanding options,
warrants and rights (#)(1)
Weighted average exercise price of
outstanding options, warrants and rights
($)(2)
Number of securities remaining available
for future issuance
under equity compensation
plans(3) (#)
Equity compensation plans approved by security holders 4,638,556 20.16 6,841,386
Equity compensation plans not approved by security holders — — —
Total 4,638,556 20.16 6,841,386
(1) Includes 1,979,431 shares subject to outstanding stock option awards and 2,659,125 shares subject to outstanding restricted
stock unit awards (including outstanding performance-based restricted stock unit awards, which are presented at their target
level of performance).
(2) Calculated exclusive of outstanding restricted stock unit awards, which do not have an exercise price.
(3) Represents 6,841,386 shares available for new award grants under the Company’s 2017 Performance Incentive Plan (the
“2017 Plan”) as of December 31, 2019. Each share issued under the 2017 Plan pursuant to an award other than a stock option
or other purchase right in which the participant pays the fair market value for such share measured as of the grant date, or
appreciation right which is based upon the fair market value of a share as of the grant date, shall reduce the number of
available shares by 1.2. Pursuant to the 2017 Plan, any shares subject to (1) restricted stock and restricted stock unit awards or
(2) stock options granted under our 2007 Equity Incentive Plan that are presently outstanding which are subsequently forfeited,
terminated, canceled, or otherwise reacquired by the Company will increase the pool of shares available for new awards under
the 2017 Plan at the rate of 1.2 shares or 1.0 shares, respectively. Long-term incentive awards issued in the form of cash-settled
restricted stock units do not reduce available shares under the 2017 Plan.
Section 16(a) of the Securities Exchange Act of 1934, as amended, requires our executive officers, directors and persons who own
more than 10% of our common stock to file reports of ownership and changes in ownership with the Securities and Exchange
Commission. Based solely upon a review of reports filed electronically with the Securities and Exchange Commission during the
2019 fiscal year, or written representations from certain reporting persons that no Forms 5 were required, we believe that all filing
requirements applicable to our officers and directors and greater than 10% beneficial owners were complied with during the 2019
fiscal year
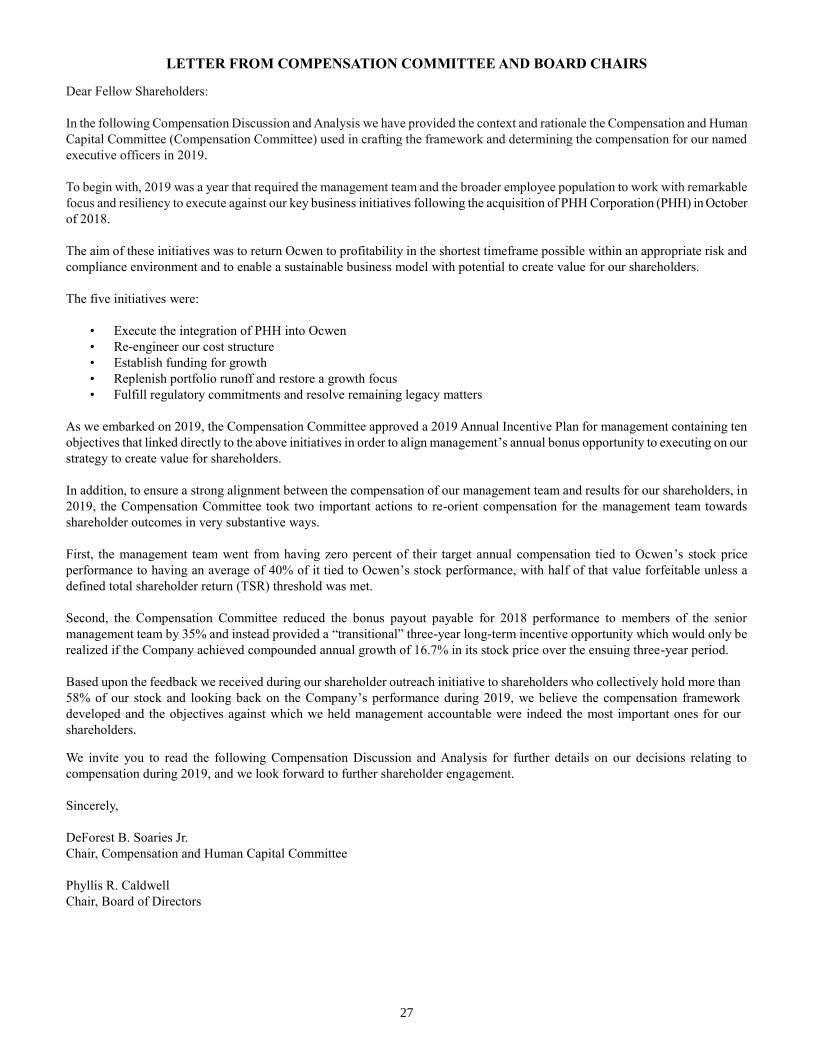
27
LETTER FROM COMPENSATION COMMITTEE AND BOARD CHAIRS
Dear Fellow Shareholders:
In the following Compensation Discussion and Analysis we have provided the context and rationale the Compensation and Human
Capital Committee (Compensation Committee) used in crafting the framework and determining the compensation for our named
executive officers in 2019.
To begin with, 2019 was a year that required the management team and the broader employee population to work with remarkable
focus and resiliency to execute against our key business initiatives following the acquisition of PHH Corporation (PHH) in October
of 2018.
The aim of these initiatives was to return Ocwen to profitability in the shortest timeframe possible within an appropriate risk and
compliance environment and to enable a sustainable business model with potential to create value for our shareholders.
The five initiatives were:
• Execute the integration of PHH into Ocwen
• Re-engineer our cost structure
• Establish funding for growth
• Replenish portfolio runoff and restore a growth focus
• Fulfill regulatory commitments and resolve remaining legacy matters
As we embarked on 2019, the Compensation Committee approved a 2019 Annual Incentive Plan for management containing ten
objectives that linked directly to the above initiatives in order to align management’s annual bonus opportunity to executing on our
strategy to create value for shareholders.
In addition, to ensure a strong alignment between the compensation of our management team and results for our shareholders, in
2019, the Compensation Committee took two important actions to re-orient compensation for the management team towards
shareholder outcomes in very substantive ways.
First, the management team went from having zero percent of their target annual compensation tied to Ocwen’s stock price
performance to having an average of 40% of it tied to Ocwen’s stock performance, with half of that value forfeitable unless a
defined total shareholder return (TSR) threshold was met.
Second, the Compensation Committee reduced the bonus payout payable for 2018 performance to members of the senior
management team by 35% and instead provided a “transitional” three-year long-term incentive opportunity which would only be
realized if the Company achieved compounded annual growth of 16.7% in its stock price over the ensuing three-year period.
Based upon the feedback we received during our shareholder outreach initiative to shareholders who collectively hold more than
58% of our stock and looking back on the Company’s performance during 2019, we believe the compensation framework
developed and the objectives against which we held management accountable were indeed the most important ones for our
shareholders.
We invite you to read the following Compensation Discussion and Analysis for further details on our decisions relating to
compensation during 2019, and we look forward to further shareholder engagement.
Sincerely,
DeForest B. Soaries Jr.
Chair, Compensation and Human Capital Committee
Phyllis R. Caldwell
Chair, Board of Directors

28
EXECUTIVE COMPENSATION
Compensation Discussion and Analysis
Business Highlights
The design and the application of our executive compensation programs take shape and are delivered within the context of Ocwen’s
business plan and its performance against that plan. 2019 was a year in which we set very ambitious goals for the company. It was
also a year of tremendous change for the company in which we made progress on a number of the strategic, financial and operational
priorities that we set out to accomplish.
Some of the key business highlights which the management team delivered against include:
• Completed integration of PHH Corporation which was acquired on October 4, 2018, including harmonization of policies,
programs and platforms including the transitioning of all our servicing onto the Black Knight MSP servicing system.
• Delivered against synergy cost reduction objectives, including reducing total staffing levels by 1,100 or 17%, with a total
headcount of approximately 5,300 at December 31, 2019 compared to the Ocwen headcount pre-PHH acquisition of 6,400
on September 30, 2018.
• Took substantial steps toward removing operating risk by complying with ongoing commitments under settlement
agreements with 29 states and District of Columbia to resolve alleged deficiencies in compliance with laws and regulations
relating to our servicing and lending activities.
• Grew total revenue by 6% to $1.1 billion in 2019.
• Improved our liquidity position, as measured by unrestricted cash, by over 30% from December 31, 2018 to a total of
$428.3 million at December 31, 2019, while also increasing our available borrowing capacity under our advance financing
facilities by 9% to $50.9 million from December 31, 2018 to December 31, 2019.
• Implemented a hedging strategy to partially offset the changes in fair value of our net MSR portfolio attributable to interest
rate changes.
Compensation Highlights
The Compensation Committee designed the 2019 executive compensation program to align with evolving compensation and
governance best practices and strengthen the rigor used to link to pay for performance and shareholder value creation.
The key features of our 2019 executive compensation program relating to pay decisions, program design and shareholder
engagement are highlighted below:
• Introduced annual Long-Term Incentive (LTI) awards under our 2017 Performance Incentive Plan that (1) changed the mix
of compensation tied to long-term objectives for our named executive officers (NEOs) from 0% to 40%; (2) tied all LTI
award value to stock price performance; and (3) linked half of the target LTI award value granted to any participant to
absolute TSR objectives over the course of a 3-year measurement period.
• Fortified the pay-for-performance linkage within our 2019 Annual Incentive Program (AIP) through the use of ten
objectives that linked directly to our publicly-disclosed key business initiatives. Moreover, financial performance
objectives which constituted over 50% of corporate and business unit scorecards were 100% formulaic with specific goal
posts for threshold, target and maximum performance levels.
• Reduced 2018 AIP payments for all NEOs by 35% based on the Compensation Committee’s general assessment of the
Company’s overall performance and financial condition
• Initiated an outreach effort to shareholders representing over 58% of outstanding shares regarding their views on our
executive compensation program.
• Conducted a comprehensive, risk-based review of our compensation policies and practices designed to ensure appropriate
mitigation of undue risk.

29
Name Position
Glen A. Messina President and Chief Executive Officer
June C. Campbell Executive Vice President and Chief Financial Officer
Timothy J. Yanoti Executive Vice President and Chief Growth Officer
Scott W. Anderson Executive Vice President and Chief Servicing Officer
Dennis Zeleny Executive Vice President and Chief Administrative Officer
Catherine M. Dondzila(1) Former Senior Vice President and Chief Accounting Officer
(1) Ms. Dondzila resigned as Senior Vice President and Chief Accounting Officer on May 31, 2019. Due to serving as
principal financial officer during a portion of 2019, Ms. Dondzila is included in this Proxy Statement as a “Named
Executive Officer” pursuant to the Securities Exchange Act of 1934, as amended.
Philosophy and Objectives of Our Executive Compensation Program
The philosophy underlying our executive compensation program is to provide an attractive, flexible, and market-based total
compensation program that aligns the interests of executives and shareholders by rewarding both short-term and long-term
performance against specific financial and strategic objectives designed to improve long-term shareholder value.
Equally important, our compensation programs are designed to communicate our goals and reinforce our standards as they relate to
risk, compliance and leadership - not only to our senior management team, but across our entire employee population.
Within this context, we believe our executive compensation programs enable us to:
• Retain and hire top-caliber experienced executives: In a tight labor market, especially within an organization that is facing
appreciable challenges to build a sustainable business model and pivot back to profitability, we believe it is critical that we
offer compensation opportunities that allow us to attract and retain strong proven executive talent.
• Pay for Performance: A significant portion of our target 2019 executive compensation (the sum of base salary, annual
target bonus, and grant date fair value of stock awards granted during 2019) – 63% for NEOs and 79% for CEO – was
dependent on the Company’s business performance and our executive officers’ contribution to that performance, and the
performance of our stock.
• Align compensation with shareholder interests: A consequential portion of our target 2019 executive compensation – 29%
for NEOs and 53% for CEO – is directly tied to absolute TSR or stock price emphasizing our focus on shareholder value
creation.
• Reinforce a long-term view: A major portion – 25% – of each executive officer’s target 2019 annual incentive
compensation was tied to risk and compliance-based objectives demonstrating that our focus is not only on what was
accomplished but on how it was accomplished. We believe that our focus on how things are done in the short-term will
establish a foundation for long-term success.
2019 Incentive Programs
To create a strong link between our incentive compensation opportunities and our short-term and longer-term objectives, we use two
specific programs: our AIP and LTI awards under our 2017 Performance Incentive Plan.
The chart below illustrates the portions of our NEOs’ target 2019 executive compensation that are driven by the various objectives
under our incentive programs. Our programs are designed to align the interests of our executives with the interests of our
shareholders and link the drivers of short-term and long-term value creation with our executive compensation performance metrics.
Our named executive officers for 2019, whose compensation we will discuss in detail below, are as follows:

30
Element of 2019 Compensation Description and Link to Key Priorities
NEOs’ (excluding
CEO) Average % of Total
Target Compensation
CEO’s % of Total Target
Compensation
Salary • Only element of total direct compensation that is not at
risk based on short- or long-term performance.
• The Committee determines salaries after consideration of
multiple factors, including comparative data from our peer
group (described below).
37% 21%
AIP • Target amount is informed by
comparator groups, including peer
group, and other factors further noted
below.
• Funding is linked to key priorities of
the Company in three areas (shown
right).
• All components, as well as individual
payouts, are capped at a maximum of
150%.
• Individual performance serves as a
modifier to the corporate and business
unit scorecard performance level (the
Individual Performance Multiplier).
Financial Performance
17% 13%
Strategic and Operational Objectives
9% 7%
Managing Risk and Ensuring Compliance
9% 7%
LTI Awards(a) • Target amount is informed by
comparator groups, including peer
group, and other factors further noted
below.
• 50% of award is in form of Restricted
Stock Units (RSUs) that vest annually
over three years in equal tranches.
• 50% of award is in form of
Performance-Restricted Stock Units
(PRSUs) that cliff vest at end of three
years provided minimum TSR level
has been achieved.
Time-vested Units
13% 26%
Units Earned Based on Total Shareholder Return or Share Price
15% 26%
Total(b) 100% 100%
(a) Not included are one-time transitional PRSU awards granted to Messrs. Messina and Anderson, which were awarded based on the decision to
reduce 2018 bonus payments and not as part of regular annual target compensation. Ms. Campbell’s LTI Awards were granted 50% as time-
vested awards (RSUs and stock options) vesting in equal installments over three years, and 50% as PRSUs vesting in equal installments over
four years if stock price doubles from grant date. Refer to “2019 Long-Term Incentive (LTI) Awards” below for further details.
(b) Other compensation that is available to all of our employees includes medical, dental and life insurance programs. 401(k) matching
contributions account for less than 0.1% of our NEOs’ compensation.
On February 27, 2019, in furtherance of the Company’s cost re-engineering efforts, Mr. Messina volunteered to reduce his
compensation as follows: (i) reduce his annual cash target incentive from $1,350,000 to $1,125,000, and (ii) reduce his annual long-
term incentive equity target from a target value of $3,150,000 to $2,250,000. These reductions were effective for the 2019 calendar
year and represented a reduction of approximately 20% to Mr. Messina’s target total compensation for 2019. On March 30, 2020, the
Compensation Committee proposed to restore Mr. Messina’s 2020 target total compensation to the levels he received upon his
October 4, 2018 hire, in recognition of his strong performance in his first full year as President and Chief Executive Officer in 2019
(described below) and informed by relevant market benchmarks, including the Company’s compensation peer group. However, Mr.
Messina declined to accept the increased compensation. Consequently, Mr. Messina’s compensation levels for 2020 continue to
reflect the reductions Mr. Messina agreed to in 2019.

31
Parties Involved in Compensation Decisions
The governance of our executive compensation programs generally occurs through interaction of three groups: the Compensation
Committee, the Compensation Committee’s independent compensation consultants and management. In 2019, on occasion and as
it considered appropriate, the Compensation Committee enlisted the advice of outside counsel specializing in executive and non-
employee director compensation matters to assist it in fulfilling its responsibilities under the Compensation Committee’s charter.
Role of the Committee
The Compensation Committee is responsible for overseeing the development and approval of our executive compensation and
benefits policies and programs. The Compensation Committee, consisting of three independent directors, is responsible for the
design, review and approval of all aspects of our executive compensation program. Among its duties, the Compensation Committee
formulates recommendations to the Board for CEO compensation and reviews and approves all compensation recommendations for
the other NEOs. Adjustments are made by the Compensation Committee in its judgment, taking into account compensation
arrangements for comparable positions at peer group companies (discussed below), analysis prepared by Willis Towers Watson,
individual performance of the NEO, an assessment of the value of the individual’s performance going forward and compensation
levels necessary to maintain and attract quality personnel. Compensation levels are also considered upon a promotion or other
change in job responsibility. Additionally, the Company considers feedback from shareholders, including feedback in the form of
shareholder advisory votes on Ocwen’s executive compensation, as discussed below.
The Compensation Committee’s review for NEOs also includes:
• approval of corporate and business unit scorecards;
• evaluation of individual performance results to determine the Individual Performance Multiplier of each NEO;
• evaluation of the market competitiveness of each NEO’s total compensation (and principal elements of compensation)
against applicable market data including a peer group of companies that are recommended to the Compensation
Committee by its independent compensation consultant based on a number of metrics, including industry classification,
revenues, assets and number of employees. The peer group used to help inform compensation decisions at the beginning
of 2019 is listed below.
Associated Banc-Corp MGIC Investment Corporation
BankUnited, Inc. Navient Corporation
Black Knight Financial Services, Inc. PennyMac Financial Services, Inc.
CIT Group People's United Financial, Inc.
CoreLogic, Inc. Radian Group Inc.
Euronet Worldwide Signature Bank
First Republic Bank Sterling Bancorp
Flagstar Bancorp, Inc. Synovus Financial Corp.
Jack Henry & Associates, Inc. Zions National Bancorp
LendingTree, Inc.
In August 2019, the Compensation Committee revised the peer group to the list below to better reflect our business model,
scale and competitors.
Associated Banc-Corp Mr. Cooper Group Inc.
BankUnited, Inc. Navient Corporation
Black Knight Financial Services, Inc. PennyMac Financial Services, Inc.
CenterState Bank Corporation People's United Financial, Inc.
CoreLogic, Inc. Radian Group Inc.
Flagstar Bancorp, Inc. Signature Bank
Jack Henry & Associates, Inc. Sterling Bancorp
LendingTree, Inc. Synovus Financial Corp.
MGIC Investment Corporation Walker & Dunlop, Inc.
• approval of any changes to compensation, including, but not limited to, base salary, short-term and long-term incentive
award opportunities, severance payments and retention programs.

32
How We Make Compensation Decisions
Each year our executive and other compensation programs are developed and refined through a year’s worth of analysis and decision
making by the Compensation Committee. A typical year’s work is summarized below:
QUARTER 1 QUARTER 2 QUARTER 3 QUARTER 4
• Evaluate the Company’s prior year performance against the financial and strategic metrics set forth in the prior year’s corporate and business unit scorecards.
• Review and evaluate the individual performance of the CEO and each of our other NEOs and other executive officers.
• Determine the payouts to be made under the AIP based on prior year’s performance.
• Determine total target compensation levels for our NEOs and other executive officers, as informed by both market data and prior year’s performance.
• Establish the structure and targets for the current year’s AIP to align with the financial and strategic priorities for the Company.
• Establish the structure for the current year’s LTI awards, including TSR or other performance objective.
• Prepare the Compensation Committee’s report and CD&A for the Proxy Statement.
• Review and discuss Say-on-Pay voting recommendations from proxy advisory firms.
• Review and discuss the results of the voting at the Annual Meeting.
• Review reports from the Compensation Committee’s independent compensation consultants on practices and trends in the industry.
• Undertake a review of the Company’s designated peer group to determine if any changes need to be made in order for it to remain appropriate.
• Commence shareholder engagement focused on the Say-on-Pay vote at the Annual Meeting to inform pay decisions and design compensation programs for the coming year.
• Continue shareholder engagement focused on Say-on-Pay vote at the Annual Meeting.
• Review the goals and objectives of the Company’s compensation programs.
• Conduct an assessment of executive compensation and independent Director compensation against peer group and relevant bench-marks assisted by analysis provided by the Compensation Committee’s independent compensation consultants.
• Conduct comprehensive, risk-based review of the Company’s compensation policies and practices that is designed to ensure appropriate mitigation of undue risk.
These decisions and payments were made before the full global extent of COVID-19 became apparent. The Compensation
Committee will consider the business and financial impact to Ocwen, our shareholders and our employees, in evaluating 2020
performance in early 2021.
Roles of Executive Officers
The President and Chief Executive Officer (CEO) is involved in the recommendation of certain compensation arrangements for
approval by the Compensation Committee. The CEO, with the assistance of the Chief Administrative Officer, annually reviews the
performance of the executive officers and is involved in formulating recommendations regarding equity compensation for the
executive officers (other than himself, whose performance is reviewed, and compensation determined, by the Compensation
Committee). The CEO presents his conclusions and recommendations regarding annual compensation and annual incentive
opportunity amounts for the executive officers to the Compensation Committee for its consideration and approval. The
Compensation Committee can exercise its discretion in accepting, rejecting and/or modifying any such executive compensation
recommendations, subject, in each case, to any applicable limits contained in any plan or agreements applicable to such awards. All
compensation decisions with respect to the compensation of the CEO are made by the Compensation Committee, which consults
with the other non-management directors and outside advisors to the extent it deems appropriate. The Chief Administrative Officer
assists the CEO and the Compensation Committee by providing them with market data and other reference materials.

33
Role of Independent Compensation Consultant
The primary role of the Compensation Committee’s independent compensation consultant (Willis Towers Watson) is to assist the
Compensation Committee with overseeing the development and approval of our compensation policies and programs. Except as
otherwise noted in this Compensation Discussion and Analysis, the Compensation Committee’s compensation determinations are the
result of the Compensation Committee’s business judgment with respect to compensation matters. The Compensation Committee’s
judgment is informed by the experiences of the members of the Compensation Committee and analysis and input from the
Compensation Committee’s independent compensation consultants, among other factors. The Compensation Committee has
assessed the independence of Willis Towers Watson and has concluded that its engagement does not raise any conflict of interest
with the Company or any of its directors or executive officers. During 2019, Willis Towers Watson performed a number of services
for the Compensation Committee, including but not limited to reviewing and providing guidance on:
• the design of the 2019 AIP and LTI awards
• market competitiveness of the 2019 compensation of our NEOs
• the Company’s peer group for purposes of informing compensation decisions
• the reports of proxy advisory firms, ISS and Glass-Lewis, relating to the 2019 Proxy Statement
• market competitiveness of the compensation of our independent directors
• emerging best practices for executive and independent director compensation
Shareholder Engagement and Consideration of Shareholder Advisors’ Input
Prior to last year, shareholder feedback in the form of shareholder advisory votes on Ocwen’s executive compensation has been very
positive. At each of our Annual Meetings of Shareholders from 2014 through 2018, we received at least 85% of votes cast on our
Say-on-Pay proposal in favor of our executive compensation. That changed last year when we received 66% support on the votes
casted on our Say-on-Pay proposal. Based on outreach efforts to both institutional and active investors, we believe that a significant
driver of this was the “AGAINST” recommendation provided by ISS’s proxy advisory group. We understand that factors guiding
their recommendation included their views that annual incentive awards were tied to a large number of metrics, several of which
they considered to be subjective, and that our CEO’s new hire equity grants were large and not performance-restricted.
The Compensation Committee considered ISS’s input, as well as the input we gathered from reaching out or meeting directly with
active investors. Through these outreach efforts we reached a group who held approximately 58% of our outstanding shares. During
the shareholder engagement process, we shared with investors the changes we had made in our programs including the reduction of
compensation levels and the introduction of a long-term incentive plan. As a result of the engagement process, we concluded that
Ocwen’s current focus on rewarding the management team for cost reduction, maximizing the synergies of the PHH acquisition,
settling legacy issues with regulators and focusing on the quickest return to profitability, as well as linking management’s
compensation to absolute total shareholder return, aligns with the priorities of our shareholders.
The Compensation Committee and our Board of Directors intend to continue to consider shareholder feedback as well as
recommended best practices put forth by shareholder proxy advisory firms such as ISS to the extent these institution’s
recommendations are aligned with the interests of our shareholders. We also intend to continue to hold an advisory Say-on-Pay vote
at each annual meeting of shareholders.

34
Key Governance Considerations in How We Design and Implement Our Compensation Programs
WHAT WE DO WHAT WE DON’T DO
Pay for performance
Most of our NEOs’ pay is at-risk and not guaranteed. We set
clear and transparent financial and strategic goals within our
short- and long-term incentive awards which include
performance-based vesting conditions.
Discourage excessive risk taking
We operate within our risk management framework and
include a balanced program design, multiple performance
measures, claw-back and retention requirements. We also
conduct an annual risk assessment of our NEO
compensation plans to ensure they do not promote undue or
excessive risk-taking.
Retain an independent compensation consultant
The Compensation Committee has retained the services of
Willis Towers Watson as an independent consultant that
reports directly to the Chair of the Compensation
Committee.
Caps on annual incentives and long-term awards
Our practice under the AIP provides for a maximum payout
opportunity at 150% of the target incentive and our current
equity incentive plan limits the number of shares that may
be awarded to any individual to 4,000,000 shares during any
12 -month period.
No fixed term of employment agreements
We do not have employment agreements that provide for a
fixed term of employment with any of our executive
officers. Employment is at-will and provisions for
separation and treatment of compensation is contained in
applicable award documents or offer letters.
No tax gross-ups
It is our policy to not provide tax gross-ups (other than for
taxable relocation expenses for moves necessitated by our
business), including tax gross-ups related to excess
parachute payments as defined under section 280G of the
Internal Revenue Code.
No option back-dating, re-pricing or reloading
We do not permit back-dating, re-pricing of stock options,
or reloading of stock options. No stock options are granted
with exercise prices that are below the closing price of
Ocwen stock on the date of grant.
No hedging or pledging
We prohibit directors and all employees, including
executive officers, from pledging shares of our stock as
collateral for loans or for other reasons and from engaging
in any activity that hedges the economic risk of an
investment in our stock.
No “single-trigger” LTI awards
With the exception of the sign-on LTIP for our CFO, 2019
LTI awards do not automatically vest upon the occurrence
of a change in control. Rather, these LTI awards include
double-trigger provisions such that a NEO will only receive
accelerated payouts if terminated without cause, or upon
voluntary resignation for good reason, following a change in
control.
Base Salaries for our NEOs.
Base salaries are intended to provide a level of cash compensation that is competitive and appropriate in relation to the
responsibilities of the executive’s position. During 2019, the Compensation Committee provided an increase only to Ms. Campbell.
Base salaries provided to our executives represent relative market competitive positioning, experience, performance and
contributions to our success.

35
Annualized Salary
Name
As of 12/31/2018 or
2019 Date of Hire
($)
As of 12/31/2019
or Separation
($)
Change to
Annualized Salary
(%)
Glen A. Messina 900,000 900,000 0%
June C. Campbell(1) 425,000 475,000 12%
Timothy J. Yanoti 450,000 450,000 0%
Scott W. Anderson 500,000 500,000 0%
Dennis Zeleny(2) 425,000 425,000 0%
Catherine M. Dondzila(3) 433,100 433,100 0%
(1) Ms. Campbell assumed the role of Executive Vice President and Chief Financial Officer on March 4, 2019 and received a $50,000
increase in her base salary effective August 1, 2019 to compensate her for the expansion of her responsibilities to include oversight of the
Capital Markets and Investor Relations functions.
(2) Mr. Zeleny assumed the role of Executive Vice President and Chief Administrative Officer on July 31, 2019.
(3) Ms. Dondzila resigned as Senior Vice President and Chief Accounting Officer on May 31, 2019.
Annual Incentive Compensation for our NEOs
Ocwen’s annual incentive compensation opportunity for eligible employees, including our executive officers, is provided under the
1998 Annual Incentive Plan (AIP), as amended, which has been approved by our shareholders. Awards under the plan are paid in
cash or, in the Compensation Committee’s discretion, all or a portion of the total award value may be paid in the form of equity
awards of our stock. Awards under the plan for 2019 were in the form of cash. The plan provides the Compensation Committee
with the authority to establish incentive award guidelines which are further discussed below. If equity awards are granted as
payment of an award under the 1998 Annual Incentive Plan, they will be granted pursuant to the 2017 Performance Incentive Plan
discussed below. Other equity awards may also be made under the 2017 Performance Incentive Plan as discussed below.
Each executive officer has a target annual incentive award that is expressed as a percentage of base salary. The target annual
incentive award for each executive officer was determined by the Compensation Committee based on its assessment of the nature
and scope of each executive officer’s responsibilities and an assessment of compensation levels necessary to maintain and attract
quality personnel as informed by market benchmarking.
As noted earlier in the Compensation Highlights section, the implementation of an annual LTIP is a continuation of our
compensation strategy, which is to ensure that our executives’ overall pay mix accounts for both short-term and long-term objectives
and will result in reduced target short-term compensation delivered through our Annual Incentive Plan. 2019 AIP targets were
reduced from 2018 levels for many senior leaders, including Mr. Anderson. Mr. Messina’s 2019 AIP target was voluntarily reduced
as part of cost savings initiatives. Ms. Campbell and Messrs. Yanoti and Zeleny were not eligible for the 2018 AIP.
The table below reflects each presently-serving NEO’s 2019 AIP targets expressed as a percentage of his or her base salary and a
comparison against 2018 AIP targets, if applicable. Under Ms. Dondzila’s separation agreement with the Company, she was not
eligible for payouts under the 2019 Annual Incentive Plan and as such she is excluded from the below chart and subsequent narrative
on 2019 AIP.
Annualized AIP Target(1)
Name
As of
12/31/2018 or
2019 Date of
Hire
($)
% of
Annualized
Salary
As of
12/31/2019 or
Separation
($)
% of Annualized
Salary
Percent Change
to AIP Target
($)
Glen A. Messina(2) 1,350,000 150% 1,125,000 125% -17%
June C. Campbell(3) 425,000 100% 475,000 100% 12%
Timothy J. Yanoti(4) 500,000 111% 500,000 111% 0%
Scott W. Anderson(5) 500,000 100% 450,000 90% -10%
Dennis Zeleny 300,000 71% 300,000 71% 0%

36
(1) Annualized AIP targets are pro-rated for in-year hire dates as well as in-year salary changes.
(2) Effective January 1, 2019, Mr. Messina’s Annualized Incentive Target was voluntarily reduced to $1,125,000.
(3) Effective August 1, 2019 Ms. Campbell received a $50,000 increase in her AIP target effective to compensate her for the expansion of
her responsibilities to include oversight of both the Capital Markets and Investor Relations functions.
(4) Mr. Yanoti was not eligible for a 2018 AIP due to the date of his hire.
(5) Effective January 1, 2019, Mr. Anderson's AIP target was reduced from $500,000 to $450,000 as part of the introduction of the annual
LTI awards and pay mix rebalancing.
Detail on the 2019 Annual Incentive Plan (AIP)
The Compensation Committee structured the 2019 AIP award opportunity to help motivate executives to deliver against the five key
initiatives listed below that it believes will enhance Company performance and create a path for long-term shareholder value.
• Execute the integration of PHH into Ocwen
• Re-engineer our cost structure
• Establish funding for growth
• Replenish portfolio runoff and restore growth focus
• Fulfill regulatory commitments and resolve remaining legacy matters.
In doing so, the Compensation Committee, working with the President and CEO, his management team and the Compensation
Committee’s independent advisor, prioritized a series of 10 measurable objectives which formed the performance metrics of the
Corporate Scorecard.
Award Determination for each NEO under the 2019 AIP
For each executive other than the CEO, the 2019 AIP award opportunity was based on a combination of three components.
(i) The Company’s performance in meeting the objectives established in the corporate scorecard (the Corporate
Scorecard);
(ii) Meeting performance objectives of the executive officer’s business unit or support unit scorecard (the Business Unit
Scorecard).
(iii) An Individual Performance component which is based on an assessment of their individual performance against a
number of key objectives unique to them, including achievement against key projects and their demonstrated
leadership in promulgating a high-performing culture focused on teamwork, managing risk, and maintaining
compliance.
The performance achievement level in the first two components creates the baseline funding level for the executive’s 2019 AIP
award. Specifically, for the CEO, 100% of funding comes from the Corporate Scorecard, and for the other NEOs, 80% of the
funding comes from the Corporate Scorecard and 20% from the Business Unit Scorecard.
The baseline funding is then subject to an Individual Performance Multiplier recognizing the third component above.
Corporate Scorecard Component
The Corporate Scorecard which drives the overall funding for the AIP is approved annually by the Compensation Committee. The
Committee then delegates to the CEO the development of the Business Unit Scorecards. The 2019 Corporate Scorecard contained
both specific financial goals and other non-financial goals that are aligned to key business initiatives, including risk management. In
determining whether to approve the Corporate Scorecard each year, the Compensation Committee considers a number of factors,
including whether the goals are consistent with and likely to enhance corporate performance and long-term shareholder value, as
well as the level of difficulty associated with attainment of each goal in the scorecard. The intent of the Compensation Committee is
to establish the “target” performance at a level that is challenging to achieve, a “threshold” level for each goal that must be met in
order for any portion of the incentive to be paid with respect to that goal, and a maximum or “outstanding” level for each goal that
would result in payment of the maximum bonus opportunity with respect to that goal. The chart below depicts the level of
achievement for a given objective on the scorecard and the corresponding incentive leverage that is applied to the target funding for
the given objective.

37
Level of Achievement % of Target Opportunity
Outstanding (Maximum) 150%
Target 100%
Threshold 50%
Below Threshold 0%
The Committee measured the level of performance achievement against scorecard objectives using both quantitative and qualitative
assessments, as appropriate. Quantitative assessments were used when the objective measure was numeric in nature, such as
meeting the budget. For the assessments, the level of achievement was determined using straight-line interpolation between the
“threshold”, “target” and “maximum” anchor posts, as applicable. Other objectives required a more nuanced and qualitative
assessment, even for objectives containing deadlines and metrics which defined achievement, such as risk and compliance
objectives. Achievement against these qualitative objectives were scored either “Pass” or “Fail” and yielded funding of 100% or 0%,
respectively.
Prior to the Committee’s assessment of the level of performance achieved against scorecard objectives, the information on which the
Committee based its assessment was first reviewed and verified by the Company’s Internal Audit, Finance and Risk Management
functions.
Based on the Company’s actual performance and the relative weightings assigned to each of the 10 objectives, the overall Corporate
Scorecard 2019 AIP funding was 113.5%. Our Corporate Scorecard for 2019 and corresponding achievement levels are detailed
below:
Corporate Objective Objective
Weight Threshold Target Maximum Performance
Outcome Performance Achievement
Weighted Performance Achievement
Financial Objectives
Full-year pre-tax income before notable items(1)
50% (both objectives must meet threshold
achievement)
-$117M -$96M -$72M -$67M 150% 62.2%
Fourth-quarter pre-tax income before notable items(1)
-$9M $1M $25M $12M 124.5%
Key Strategic Priorities
Execute the integration - complete integration, loan boarding and legal entity merger actions and milestones per finalized integration plans as of March 15, 2019
5% Up to 30 days behind
schedule overall
Achieve integration
plan milestones
At least 30 days ahead of
schedule overall
Achieved integration
plan milestones
100% 5%
Achieve 2019 Board approved business plan volume objectives (amount and timing) - $ billions unpaid principal balance (UPB) replenishment funded by quarter and in the calendar year within targeted risk/return thresholds
5% $23B $27B $43B $17B 0% 0%
Cost re-engineering annualized cost reduction achievement by year-end(2)
5% $300M $327M $345M $347M 150% 7.5%
Establish funding for growth - achieve financing plan objectives of $100M senior secured term loan upsizing, 60% financing for purchased mortgage servicing rights (MSRs), and 60% secured funding against existing agency and Ginnie Mae MSRs on market rates and terms; all facilities renewed on time at market rates and terms
5% Pass / Fail Pass 100% 5%
Timely and complete fulfillment of regulatory commitment deliverables
5% Pass / Fail Pass 100% 5%
Risk and Compliance
Promote Risk and Compliance culture within Board Risk Appetite thresholds
25% (objectives evaluated in
the aggregate)
Pass / Fail Pass 115% 28.75%
Timely resolution of open issue remediation items (% resolved by policy remediation date)
80% 90% 100% 93%
No significant current audit, exam or SOX matters
Pass / Fail Pass
TOTAL 100% 113.5%

38
(1) Pre-tax income before notable items for purposes of the Corporate Scorecard excludes income statement notables and amortization of New
Residential Investment Corp. (NRZ) lump-sum payments and refers to our pre-tax income/(loss) after excluding the positive impact of the
amortization of NRZ lump-sum payments and after adjusting GAAP pre-tax income/(loss) for the following factors (1) Expense Notables
(excluding MSR Valuation Adjustments, net), (2) changes in fair value of our Non-Agency MSRs due to changes in interest rates, valuation inputs
and other assumptions, (3) changes in fair value of our Agency MSRs due to changes in interest rates, valuation inputs and other assumptions, net
of hedge position, (4) offsets to changes in fair value of our MSRs in our NRZ financing liability due to changes in interest rates, valuation inputs
and other assumptions, (5) changes in fair value of our reverse lending portfolio due to changes in interest rates, valuation inputs and other
assumptions (6) gains related to exercising servicer call rights, and (7) certain other costs, including pension benefits (collectively, Other)
consistent with the intent of providing management and investors with a supplemental means of evaluating our pre-tax income/(loss). Collectively,
we refer to these adjustments as “income statement notables.” “Expense Notables” includes (1) expense related to severance, retention and other
cost re-engineering actions, (2) certain significant legal and regulatory settlement expense items, (3) CFPB, Florida Attorney General/Florida
Office of Financial Regulations and Massachusetts Attorney General litigation related legal expenses, state regulatory action related legal expenses
and state regulatory action settlement related escrow analysis costs (collectively, CFPB and state regulatory defense and escrow analysis expenses),
(4) NRZ consent process expenses related to the transfer of legal title in MSRs to NRZ, (5) PHH Corporation acquisition and integration planning
expenses, (6) expense recoveries related to insurance recoveries of legal expenses, mortgage insurance claim settlement recoveries and amounts
previously expensed from a service provider and (7) certain other costs including compensation expense reversals relating to departing executives
and reversals of management incentive compensation payouts and reversals of reserves related to a legacy MSR sale (collectively, Other) consistent
with the intent of providing management and investors with a supplemental means of evaluating our expenses.
(2) Cost re-engineering annualized cost reduction achievement by year-end for purposes of the Corporate Scorecard is compared to a 2Q’18
baseline and was adjusted for notable items, as defined above, and further adjusted to account for changes in certain beneficial GAAP accrual
impacts that did not warrant inclusion for purposes of cost re-engineering performance measurement. See also Ocwen’s February 26, 2020 earnings
call webcast and the accompanying presentation materials, which are available in the Shareholder Relations section of Ocwen’s website
(www.ocwen.com).
Business Unit Scorecard Component
In developing the Business Unit Scorecard goals in the NEO scorecards, we incorporated a variety of quantitative and qualitative
measures to incentivize performance that we believe will help perpetuate the long-term success of the Company and discourage
executives from pursuing short-term goals that may not be consistent with achieving such long-term success. The level of
performance achievement against Business Unit Scorecard objectives was determined in the same manner described in the
Corporate Scorecard section above.
Each NEO’s Business Unit Scorecard contained components and weighting consistent with the Company’s Corporate Scorecard,
including:
• Financial Objectives (50% weight) contained the same full-year and fourth-quarter pre-tax income objectives for each
executive officer’s respective area of responsibility;
• Key Strategic Priorities (25% weight) measured critical functional objectives, including meeting PHH integration
objectives and timelines, and goals around cost re-engineering, which linked back to the work that each NEO needed to
accomplish in their respective area to help the Company achieve the 10 objectives contained in the Corporate Scorecard;
and
• Risk and Compliance (25% weight) contained the same objectives as the Corporate scorecard, measuring results for each
executive officer’s respective area of responsibility.
Each NEO had a unique set of Key Strategic Priorities which correlated directly to line-of-sight objectives supporting Corporate
objectives listed above in their respective area of responsibility and were weighted depending upon their relative importance within
the category. Each executives Key Strategic Priorities included the following:
• Ms. Campbell’s Business Unit Scorecard was based on her oversight of the Finance, Capital Markets and Treasury
departments, which included objectives on financial reporting and forecasting, and cultural transformation.
• Mr. Yanoti’s Business Unit Scorecard was based on his oversight of the Originations organization, which included
objectives on unpaid principal balance (UPB) replenishment and customer satisfaction scores.
• Mr. Anderson’s Business Unit Scorecard was based on his oversight of the Servicing organization, which included
objectives on on-boarding of loans, reduction of Consumer Financial Protection Bureau complaints, and customer
satisfaction scores.
• Mr. Zeleny’s Business Unit Scorecard was based on his oversight of the Human Resources, Communications and Facilities
organizations, which included objectives on executing the human capital aspects associated with the PHH integration,
including managing the reduction of the workforce and other strategic initiatives.

39
Individual Performance Component
The Compensation Committee is accountable for both reviewing and approving the full-year performance evaluations and
recommended performance appraisal ratings for each member of the Executive Leadership Team, including the President and CEO.
The Compensation Committee considers recommendations from the CEO in determining performance appraisal ratings of the other
NEOs. The CEO’s performance appraisal rating is determined by the Compensation Committee in consultation with the other non-
management directors.
The documentation provided to the Compensation Committee includes the executives’ self-assessments capturing their views on
their performance against each of the objectives they and the CEO agreed to at the start of the year, as well as those that may have
been introduced as a result of emerging priorities during the year. The objectives for all employees, including NEOs, fell into three
weighted categories
• Key Business Unit and Functional Priorities (55% weight) reflected individual goals required to meet the objectives
contained in the Corporate and Business Unit Scorecards;
• Leadership Expectations and Behaviors (25% weight, described below); and
• Risk and Compliance (20% weight) assessed executive performance in promoting a culture of risk and compliance,
remediating of any identified issues, and lack of any material findings relating to audit, SOX or examination matters.
Leadership expectations and behaviors for our executive team require them to:
• Behave as a leadership role model and lead by example, demonstrate integrity, create a culture in which we keep our
promises, treats all with respect and dignity, and build trust within and outside the organization.
• Build strong working relationships in which they solicit, consider and appropriately incorporate perspectives from
others.
• Drive and deliver exceptional results by proactively anticipating situations that require a plan of action, identifying critical
issues and assuming personal ownership for driving their resolution.
• Lead efforts on diversity and inclusion by creating, promoting and sustaining an inclusive work environment in which
diversity, inclusiveness and respect are integral parts of our culture and work environment.
• Build and motivate a high performing team by identifying and securing top talent to increase performance while also
actively holding people accountable for results and behaviors.
• Lead change by providing a visible anchor for others and helping resolve breakdowns in times of transition and uncertainty,
and by convincing others of the need for change to support critical organizational objectives.
The Compensation Committee then evaluates the proposed results and performance appraisal recommendations and determines the
final incentive compensation awards for each executive. Each executive receives an individual Performance Appraisal rating
against a 4-point scale with an “individual performance multiplier” that is applied to their funded Annual Incentive, as described
above.
The value for the multiplier is determined by the Compensation Committee using a value from the range shown in the chart below.
Individual Performance Rating Individual Performance Multiplier
Exceeds Expectations 105-125%
Fully Meets Expectations 95-105%
Sometimes Meets Expectations 70-95%
Does Not Meet Expectations 0%
Performance Rating for Each NEO
After careful consideration, the Compensation Committee - and the full Board, in the case of the CEO - determined that each of the
NEOs’ performance warranted an Exceeds Expectations performance rating in 2019.

40
Name Synopsis of Performance
Individual
Performance
Multiplier
Glen A. Messina • Quickly assessed leadership, retaining key individuals and recruited strong
external complement necessary to execute against the complex turn-around
and integration required in 2019.
• Formulated and achieved an ambitious strategic and annual Business Plan
which clearly identified the nature and magnitude of both the opportunities
and challenges facing the business and established concrete and measurable
actions to address them including establishing a new originations business.
• Put in place a disciplined operating system (people, process, technology) to
effectively manage achievement of business plan objectives and mitigate risk.
• Put in place performance and incentive programs that reinforced driving
results that right way including transformation needed around collaboration,
transparency, self-identification of risks and issues, timely remediation with
appropriate and scalable solutions.
• Re-established proactive and effective relationships with key external
constituents: shareholders, lenders, rating agencies, regulators, and consumer
advocacy groups to provide updates on key initiatives and promote a positive
image of the company.
• Improved leadership diversity at VP and above levels in the US, increasing
representation of women from 27% to 32% and minorities from 17% to 20%.
Outside the US where diversity is measured by gender, the representation of
women in Senior Manager roles increased from 13% to 17%.
125%
June C. Campbell • Took on a highly challenging leadership role and reorganized the function to
upgrade talent and capability, process and systems and exit underperformers.
• Under her direction, actions were sequenced to provide pay-down capacity
while maintaining investment capability and all working capital facilities
were renewed on or prior to termination dates, achieving significant savings
on multiple renewals.
• Eliminated duplicate systems and migrated to a single platform with no
restatements or SOX control deficiencies, built a client and investor level
financial analysis and new cost per loan model for Servicing and defined
requirements and re-defined channel-specific financial views for Lending.
115%
Timothy J. Yanoti • Stabilized the Lending organization and oversaw the significant integration
objective by developing a strategy and business plan for Lending, quickly
communicating his clear vision, recruiting a strong leadership team, turning
around the culture, exiting subpar performers and removing $40 million of
cost from the business.
• Started up the Correspondent channel and overall lending was profitable by
the fourth quarter, positioning the Company for a target of over $10 billion in
lending volume in 2020 compared to $1.4 billion in 2018.
• Met or exceeded all of Lending’s financial objectives, exceeding the Lending
Pre-Tax Income and volume targets.
• Integrated two fundamentally different lending platforms on different systems
in different locations, while accommodating the closure of a key lending
headquarters in the forward lending business.
• Completed numerous state and federal audits throughout 2019 with no
material findings.
110%

41
Scott W. Anderson • Planned for and executed the integration of the PHH-Ocwen operating
platforms and the Black Knight Financial Services, Inc. LoanSphere MSP®
servicing system onboarding while overseeing 23 functional area integration
plans.
• Surpassed Servicing’s 2019 annualized cost reduction goal by 20%.
• Developed a dynamic cost of servicing model which enabled us to
differentiate/understand servicing costs across three vectors, ultimately
transforming the model from an analytic tool to a decision-making tool.
• Delivered on all Servicing regulatory commitments.
120%
Dennis Zeleny • Quickly implemented a human capital agenda to support the merger and
integration of people, processes and programs of Ocwen and PHH.
• Led efforts to achieve Ocwen’s cost and synergy restructuring goals in the
areas of site operations and personnel, which included the closing of eight
facilities and the reduction of over 26% of the workforce from point of PHH’s
acquisition.
• Executed human capital plan including staffing efforts, extensive
communication, and providing each outplaced employee with professional
transition support.
• Developed and deployed training to over 4,000 employees on the new
mortgage servicing platform which was a critical requirement of the
integration.
• Demonstrated significant agility in responding to unplanned human capital
business needs, including the design and launch of new corporate
performance management process and long-term incentive program.
115%
Calculation of Total 2019 AIP Awards
Outlined below are the payout results (expressed as a percentage) for each component of the annual incentive opportunity: corporate
component (based on the Corporate Scorecard), business unit component (based on the Business Unit Scorecard), individual
component (individual performance multiplier based on performance appraisal) and total payout as a percentage of target annual
incentive for each NEO.
Payout for Annual Incentive Awards
Organization Performance Individual Performance Final Award
Name
Corporate Performance Component
(80% weight)
Business Unit
Performance Component
(20% weight)
Total Baseline Funding (100%)
Individual Performance
Multiplier
Resulting Preliminary
Award
Reduction to Remain within
Corporate Budget(1)
Final Annual Incentive
Payout (as a % of Target
Annual Incentive)
Glen A. Messina 113.5%(2) + n/a = 113.5% x 125% = 141.9% x -4.14% = 136.0%
June C. Campbell 113.5% + 114.6% = 113.7% x 115% = 130.8% x -4.14% = 125.4%
Timothy J. Yanoti 113.5% + 112.5% = 113.3% x 110% = 124.6% x -4.14% = 119.5%
Scott W. Anderson 113.5% + 118.0% = 114.4% x 120% = 137.3% x -4.14% = 131.6%
Dennis Zeleny 113.5% + 133.2% = 117.4% x 115% = 135.1% x -4.14% = 129.5%
(1) A negative adjustment of 4.14% was applied to all AIP eligible employees, including our NEOs, in order to remain within the budgeted
cost for the 2019 AIP program.
(2) Mr. Messina’s Total Baseline Funding was weighted 100% on Corporate Performance.
2019 Long-Term Incentive Plan (LTIP)
Ocwen’s long-term incentive opportunity for eligible employees, including executive officers, through equity awards is provided
under the 2017 Performance Incentive Plan (the “2017 Plan”). The 2017 Plan authorizes the grant of restricted stock, restricted
stock units, options, stock appreciation rights or other equity-based awards, including cash-settled awards, to our employees
(including executive officers), directors, advisors and consultants. To date, we have made grants under the 2017 Plan only to
employees and directors. We implemented the 2017 Plan to motivate employees to make extraordinary efforts to achieve significant

42
improvements to shareholder value, support retention of key employees and align the interests of our employees with the interests of
our shareholders.
The Compensation Committee periodically reviews the granting of equity awards to employees based on such factors as Company
performance, market competitive conditions and advice on executive compensation from the Compensation Committee’s
independent compensation consultant.
2019 Long-Term Incentive (LTI) Awards
The annual LTI is designed to promote actions and decisions aligned with our strategic objectives and reward our executives and
other program participants for long-term value creation for our shareholders in a manner that is consistent with our pay-for-
performance philosophy. The implementation of the annual LTI program in 2019 is a continuation of our compensation strategy to
ensure that our executives’ overall pay mix accounts for both short-term and long-term objectives and will result in reduced target
short-term compensation delivered through our Annual Incentive Plan.
The program includes both a time-vesting component for retention purposes and performance-based component to align with pay-
for-performance objectives. Half of the target value is granted as restricted stock units (RSUs) vesting in equal thirds on the first,
second and third anniversaries of the grant, and half is granted as performance-restricted stock units (PRSUs) vesting at the end of a
measurement period from March 29, 2019 through March 29, 2021 based on cumulative Total Shareholder Return (TSR) during
such period. The number of target PRSUs that may vest based on cumulative TSR performance during the measurement period are
interpolated between threshold 50% of PRSUs at 27.3% TSR, target 100% of PRSUs at 59.1% TSR, and maximum 200% of PRSUs
at 91.0% TSR. No PRSUs will vest if TSR is below threshold.
Messrs. Messina, Anderson, Yanoti and Zeleny and Ms. Dondzila received awards under the 2019 annual LTI program. Ms.
Dondzila’s award was later forfeited prior to any vesting upon her resignation. With the exception of Mr. Messina’s award, these
awards will be cash-settled to avoid share dilution, but were granted as share-based units to align final award value with share
performance.
Additionally, Messrs. Messina and Anderson and Ms. Dondzila received additional “transitional” awards relating to the 35%
reduction of their 2018 bonus payment. Ms. Dondzila’s award was later forfeited prior to any vesting upon her resignation. These
cash-settled restricted stock unit awards vest in equal thirds on the first, second and third anniversaries of the grant dates based on
the Company's cumulative TSR during three performance periods, each beginning March 29, 2019. The number of target PRSUs
that may vest range based on cumulative TSR performance during each measurement period are interpolated between 50% at
threshold, 100% at target, and 200% at maximum. No PRSUs will vest if cumulative TSR is below threshold. For the one-, two- and
three-year periods ending March 29, 2020, 2021 and 2022, cumulative TSR performance thresholds are 8.4%, 17.4% and 27.3%,
targets are 16.7%, 36.3% and 59.1%, and maximums are 24.0%, 54.0% and 94.0%, respectively.
In connection with Ms. Campbell’s new hire offer, she was granted the following equity awards on March 4, 2019: (1) a stock option
with a grant date fair value of $72,000 and an exercise price equal to the closing price of our stock on the date of grant, which vest in
equal thirds on the first, second and third anniversaries of the grant date, (2) RSUs with a grant date fair value of $53,000, which
vest in equal thirds on the first, second and third anniversaries of the grant date, and (3) PRSUs with a grant date fair value of
$125,000, which vest in equal fourths on the first, second, third and fourth anniversaries of the grant date, provided that on or before
the fourth anniversary of the grant date, the average of the closing stock price over a period of 20 consecutive trading days equal or
exceeds $4.34. Ms. Campbell did not receive any awards under the 2019 annual LTI program but expects to participate in the 2020
annual LTI program.
The table below shows the annual target value of equity awards granted to our current NEOs in 2019 as well the percentage of the
target value of such equity awards that are subject to performance vesting.

43
Name
Annual Target Value Granted as Restricted
Stock Units ($)
Annual Target Value Granted as
Performance Restricted
Stock Units ($)
Target Value of Additional Performance
Restricted Stock Units
($)
Target Value of Stock Options
($)
Total Target Value of Awards Granted
($)
Percent of Target Value
that is Performance
Based
Glen A. Messina 1,125,000 1,125,000 115,212 — 2,365,212 52%
June C. Campbell 53,000 125,000 — 72,000 250,000 50%
Timothy J. Yanoti 250,000 250,000 — — 500,000 50%
Scott W. Anderson 150,000 150,000 175,000 — 475,000 68%
Dennis Zeleny 187,500 187,500 — — 375,000 50%
Catherine M. Dondzila 54,138 54,138 96,915 — 205,190 74%
Realizable Value of Outstanding Equity at Year-End
Further illustrating Ocwen’s commitment to shareholder alignment, if the year-end share price stays flat in future performance and
vesting periods, it would result in a 75% average loss of target LTI value for our executives for awards granted over the past three
years. (As reference, no equity awards were granted to NEOs between March 30, 2016 and October 3, 2018.) As shown below,
based on $1.37 closing share price on December 31, 2019, all performance-based units would be forfeited and stock options would
be underwater, in addition to the 52% total reduction in RSU value compared to their grant date value.
Name
Total Target Value of
Outstanding Units at Grant
($)
Award Value at $1.37 Share Price
Change in Award Value from Grant
($)
Change in Award Value from Grant
(%)
Realizable Value of
Outstanding Restricted
Stock Units ($)
Realizable Value of
Outstanding Performance
Restricted Stock Units
($)
Realizable Value of
Outstanding Stock
Options ($)
Glen A. Messina 6,165,214 1,672,314 0 0 -4,492,900 -73%
June C. Campbell 250,000 33,461 0 0 -216,540 -87%
Timothy J. Yanoti 958,332 241,287 0 0 -717,045 -75%
Scott W. Anderson 475,000 112,911 0 0 -362,088 -76%
Dennis Zeleny 375,000 135,197 0 0 -289,802 -64%
Other Compensation
Our policy with respect to employee benefit plans generally is to provide benefits to our employees, including our executive officers,
which are comparable to benefits offered by companies of a similar size. We believe that a competitive comprehensive benefit
program is essential to achieving the goal of attracting and retaining highly-qualified employees. Our NEOs participate in the benefit
plans offered to our salaried employees, generally, including medical, dental, life and disability insurance plans, and a 401(k) plan.
Stock Ownership and Prohibition against Short Sales, Hedging and Margin Accounts
Although we do not have stock ownership requirements for our executives, our philosophy is that equity ownership by our
executives is important to attract, motivate and retain executives, as well as to align their interests with those of our shareholders.
The Compensation Committee believes that the Company’s equity plans are adequate to achieve this philosophy.
We maintain an Insider Trading Prevention Policy that governs the timing of transactions in securities of the Company by directors
and executives. In addition, the Policy prohibits any director, officer or employee from engaging in any short sale of the Company’s
stock, establishing and using a margin account with a broker-dealer for the purpose of buying or selling Company stock, or buying
or selling puts or calls on the Company’s stock. This policy is designed to encourage investment in the Company’s stock for the long
term and to discourage active trading or short-term speculation.

44
Clawback Policy
The Company maintains an incentive compensation clawback policy that allows our Board of Directors or the Compensation
Committee to recoup incentive compensation if the Company restates its financial statements. The policy applies to cash or equity
incentive payments or awards to Covered Individuals (as defined below) when (1) the amount of any such payment or award was
determined based on the achievement of financial results that were subsequently the subject of an accounting restatement due to
noncompliance with any financial reporting requirement under federal securities laws, (2) a lesser (or no) payment or award would
have been made based upon the restated financial results, and (3) the payment or award was received (or the applicable vesting event
of the award occurred) during the three-year period preceding the date on which the Company is required to prepare such accounting
restatement. For purposes of the policy, a “Covered Individual” means any current or former employee who, at the time of receipt of
any such payment or award, was an executive officer of the Company or an Executive Vice President or more senior officer of the
Company or any of its subsidiaries.
Restrictive Covenants
All of our NEOs have executed an intellectual property and non-disclosure agreement. This agreement requires the NEO to hold all
“confidential information” in trust for us and prohibits the NEO from using or disclosing such confidential information except as
necessary in the regular course of our business or as otherwise required by law. Other than these restrictive covenants, we generally
do not have non-competition or non-solicitation agreements with our executive officers. From time to time, we enter into separation
agreements with executive officers that contain these provisions. In addition, certain of our equity award agreements contain
provisions that provide that post-retirement vesting or exercise of the award, as applicable, is dependent on compliance with certain
covenants.
Tax Considerations
Section 162(m) of the Internal Revenue Code generally disallows public companies a tax deduction for compensation in excess of
$1,000,000 paid to its “covered employees.” Prior to federal tax reform enacted in December 2017, Section 162(m) included an
exception to this limitation on deductibility for qualifying “performance-based compensation,” provided that certain performance
and other requirements are met. Under the new tax legislation, for taxable years beginning after December 31, 2017, there is no
longer an exception to the deductibility limit for qualifying “performance-based compensation” unless the compensation qualifies
for transition relief applicable to certain arrangements in place as of November 2, 2017. Also under the new legislation, the
definition of “covered employees” has been expanded to include a company’s chief financial officer (in addition to the chief
executive officer and three other most highly paid executive officers), plus any individual who has been a “covered employee” in
any taxable year beginning after December 31, 2016. As one of the factors in its consideration of compensation matters, the
Compensation Committee considers the anticipated tax treatment to the Company of various payments and benefits, including the
impact of Section 162(m). However, we reserve the right to design programs that may not be deductible under Section 162(m) if we
believe they are nevertheless appropriate to help achieve our executive compensation program objectives, and in any case, there can
be no assurance that any compensation paid by the Company will be fully deductible.
CEO Pay-Ratio Disclosure
Pursuant to the Securities Exchange Act of 1934, as amended, we are required to disclose in this proxy statement the ratio of the
total annual compensation of our CEO to the median of the total annual compensation of all of our employees (excluding our CEO).
Based on Securities and Exchange Commission rules for this disclosure and applying the methodology described below, we have
determined that Mr. Messina’s total compensation for 2019 was $7,562,330 and the median of the total 2019 compensation of all of
our employees (excluding our CEO) was $33,651 (after applying a cost-of-living adjustment and converting foreign currency to U.S.
dollars, as described below). Accordingly, we estimate the cost-of-living-adjusted ratio of our CEO’s total compensation for 2019 to
the median of the total 2019 compensation of all of our employees (excluding our CEO) to be 225 to 1.
We identified the median employee by taking into account the total compensation paid for 2019 to all individuals, excluding our
CEO, who were employed by us or one of our subsidiaries on December 31, 2019. We included all employees, whether employed on
a full-time, part-time, or seasonal basis. We did not annualize the compensation for any employees who were not employed by us
for all of 2019. We applied a cost of living adjustment to employees employed outside of the United States as described below.
Once the median employee was identified as described above, that employee’s total compensation for 2019 was determined using
the same rules that apply to reporting the compensation of our Named Executive Officers (including our CEO) in the “Total” column
of the Summary Compensation Table. The total compensation amounts included in the first paragraph of this pay-ratio disclosure
were determined based on that methodology (in the case of the median employee’s compensation, as adjusted for cost-of-living and
currency conversion as described below).

45
If we only considered our U.S.-based employees (excluding our CEO) in identifying the median employee using the methodology
otherwise described above, we determined that our median U.S.-based employee’s total compensation was $57,598. Accordingly, we
estimate the resulting ratio of our CEO’s total compensation to the median of the total compensation of all our U.S.-based
employees (excluding our CEO) to be 131 to 1.
In calculating the compensation of our employees in the Philippines, we applied a currency conversion factor based on the U.S.
dollar to Philippines Peso exchange rate as of December 31, 2019. In calculating the compensation of our employees in India, we
applied a currency conversion factor based on the U.S. dollar to Indian Rupee exchange rate as of December 31, 2019.1 As permitted
under SEC rules, in identifying the median employee and in presenting the median employee’s total 2019 compensation above, we
applied a cost-of-living adjustment to the compensation of employees outside the United States based on a purchasing power parity
conversion factor published by The World Bank for 2018.2 Using this methodology, we determined that our median employee is
employed in India. If we had determined the median employee and total compensation as described above but had not applied a
cost-of-living adjustment to identify our median employee or calculate our median employee’s total compensation, the median of the
total compensation of all of our employees (excluding our CEO) would have been $10,916 and we estimate the resulting ratio of our
CEO’s total compensation to the median of the total compensation of all of our employees (excluding our CEO) would have been
693 to 1.
Report of the Compensation Committee
The Compensation Committee of the Board of Directors has reviewed and discussed the Compensation Discussion and Analysis of
this proxy statement with management.
Based on the review and discussion, the Compensation Committee recommended to the Board of Directors that the Compensation
Discussion and Analysis be included in this proxy statement.
April 27, 2020 Compensation Committee:
DeForest B. Soaries, Jr., Chair
Jenne K. Britell, Director
Jacques J. Busquet, Director
1 As reported by the U.S. Bureau of the Fiscal Service Treasury Reporting Rates of Exchange as of December 31, 2019, the Indian
Rupee to U.S. Dollar to conversion rate was 71:1 and the Philippines Peso to U.S. Dollar to conversion rate was 50.64:1.
2 The “price level ratio of PPP conversion factor (GDP) to market exchange rate” published by the World Bank indicates how many
U.S. dollars are needed to buy one U.S. dollar’s worth of goods in a particular country. For 2018, the most recent data accessible, the
ratio reported for both India and the Philippines was 0.3, meaning the local currency equivalent of $1 purchased $3.33 worth of
goods in those countries. Accordingly, we multiplied the 2019 compensation of each employee based in India or the Philippines by
3.33 prior to identifying the employee with the median of the total 2019 compensation and in presenting such employee’s total
compensation in order to reflect a cost-of-living adjustment.

46
Summary Compensation Table - 2017, 2018 and 2019
The following table provides information concerning the compensation of our named executive officers for the 2019, 2018 and
2017 fiscal years.
Name and Principal Position Year
Salary ($)
Bonus ($)
Stock Awards(1)
($)
Option Awards(1)
($)
Non-Equity Incentive Plan
Compensation(2) ($)
All Other Compensation(3)
($) Total
($)
Glen A. Messina President and Chief Executive Officer
2019 900,000 2,518,950 1,529,974 2,613,406 7,562,330
2018 214,615 — 4,050,001 791,035 213,966 1,690,804 6,960,421
June C. Campbell Executive Vice President and Chief Financial Officer(4)
2019 370,673 253,757 153,986 51,432 468,583 120,113 1,418,545
Timothy J. Yanoti Executive Vice President and Chief Growth Officer
2019 450,001 — 559,066 — 597,359 80,804 1,687,230
Scott W. Anderson Executive Vice President, Chief Servicing Officer
2019 500,000 — 538,002 — 592,207 — 1,630,208
2018 500,000 — — — 314,236 — 814,236
2017 500,000 — — — 542,984 750 1,043,734
Dennis Zeleny Executive Vice President and Chief Administrative Officer(5)
2019 176,539 350,000 409,539 — 163,879 426,000 1,525,956
Catherine M. Dondzila Former Senior Vice President and Chief Accounting Officer(6)
2019 183,235 — 233,244 — — 868,645 1,285,124
2018 433,100 — — — 159,197 6,200 598,497
(1) Represents the aggregate grant date fair value of stock awards and stock options, computed in accordance with FASB ASC 718. These amounts
do not represent the actual amounts paid to or realized by the executive. We based the grant date fair value of stock awards with a service
condition on the average of the high and low prices of our common stock as reported on the New York Stock Exchange on the date of grant of
the awards. The fair value of the time-based option awards was determined using the Black-Scholes options pricing model. Stock unit awards
with only a service condition are valued at their intrinsic value, which is the market value of the stock on the date of the award. The fair value of
stock unit awards with both a service condition and a market-based vesting condition is based on the output of a Monte Carlo simulation.
Additional detail regarding the calculation of these values is included in Note 22 to our audited financial statements for the fiscal year ended
December 31, 2019, which are included in our Annual Report on Form 10-K filed with the Securities and Exchange Commission on February
26, 2020.
(2) Represents annual incentive compensation earned in the corresponding year and paid in the first quarter of the following year.
(3) Amounts shown in this column are set forth in the supplemental “All Other Compensation” table below.
(4) Ms. Campbell assumed the role of Executive Vice President and Chief Financial Officer on March 4, 2019. In connection with her employment
and to induce her to join the company, she received a signing bonus which is reported in the “Bonus” column.
(5) Mr. Zeleny assumed the role of Executive Vice President and Chief Administrative Officer on July 31, 2019. In connection with his employment
and to induce him to join the company, he received a signing bonus which is reported in the “Bonus” column.
(6) Ms. Dondzila resigned as Senior Vice President and Chief Accounting Officer on May 31, 2019.
For more information about the elements of the compensation paid to our named executive officers, see “Compensation Discussion
and Analysis” above.

47
All Other Compensation
The following table provides additional information about the amounts that appear in the “All Other Compensation” column in the
Summary Compensation Table.
Executive Officer
401(k) Matching
Contributions(1)
($)
Relocation Benefits(2)
($)
Other
($)
Total
($)
Glen A. Messina(3) 7,269 577,971 2,028,165 2,613,406
June C. Campbell — 120,113 — 120,113
Timothy J. Yanoti 1,558 79,247 — 80,804
Scott W. Anderson — — — —
Dennis Zeleny(4) — — 426,000 426,000
Catherine M. Dondzila(5) 8,400 — 860,245 868,645
(1) Reflects employer matching contributions made under the Ocwen Financial Corporation 401(k) Savings Plan.
(2) Reflects the value of temporary commuting and relocation benefits paid under the Ocwen Relocation Plan, including amounts to gross-up for
taxable expenses.
(3) “Other” reflects the value of Mr. Messina's severance benefits to which Mr. Messina was entitled as former President and Chief Executive
Officer of PHH Corporation.
(4) “Other” represents the value of fees paid to Mr. Zeleny as an independent consultant prior to regular full-time employment.
(5) “Other” represents the values of Ms. Dondzila's lump sum payment in exchange for a general release of claims upon her resignation as Senior
Vice President and Chief Accounting Officer on May 31, 2019 ($568,870), independent consulting agreement ($216,550), payout of accrued
paid time off balances ($62,825), subsidy for COBRA benefits continuation ($11,620) and stipends paid to cover telecommuting expenses
($381).

48
Grants of Plan-Based Awards for 2019
The following table provides information related to awards granted in 2019 under our 2017 Performance Incentive Plan and our 1998
Annual Incentive Plan, as amended.
Name Grant Date
Estimated Possible Payouts
Under Non-Equity Incentive Plan Awards(1)
Estimated Future Payouts Under Equity
Incentive Plan Awards
All Other Stock
Awards: Number of Shares of Stock or Units(2)
(#)
All Other Option
Awards: Number of Securities
Underlying Options
(#)
Exercise or Base Price of Option Awards
($)
Grant Date Fair Value of
Stock and Option
Awards (3) ($)
Threshold
($)
Target
($)
Maximum
($)
Threshold
(#)
Target
(#)
Maximum (#)
Glen A. Messina
3/29/2019 562,500 1,125,000 1,687,500 — — — — — — —
4/11/2019(4) — — — 282,663 565,327 1,130,654 — — — 1,271,986
4/11/2019 — — — — — — 565,326 — — 1,124,999
4/11/2019(5) — — — 28,947 57,895 115,790 --- — — 121,966
June C. Campbell
3/29/2019 186,884 373,767 560,651 — — — — — — —
3/04/2019(6) — — — — 57,604 — — — — 100,986
3/04/2019 — — — — — — 24,424 — — 53,000
3/04/2019 — — — — — — — 33,180 2.17 51,432
Timothy J. Yanoti
3/29/2019 250,000 500,000 750,000 — — — — — — —
3/29/2019(4) — — — 68,681 137,363 274,726 — — — 309,067
3/29/2019 — — — — — — 137,362 — — 249,999
Scott W. Anderson
3/29/2019 225,000 450,000 675,000 — — — — — — —
3/29/2019(4) — — — 41,209 82,418 164,836 — — — 185,441
3/29/2019 — — — — — — 82,417 — — 149,999
3/29/2019(5) — — — 48,076 96,153 192,306 — — — 202,562
Dennis Zeleny
7/31/2019 63,288 126,575 189,863 — — — — — — —
7/31/2019(4) — — — 49,342 98,684 197,368 — — — 222,039
7/31/2019 — — — — — — 98,684 — — 187,500
Catherine M. Dondzila
3/29/2019 138,450 276,900 415,350 — — — — — — —
3/29/2019(4) — — — 14,873 29,746 59,492 — — — 66,929
3/29/2019 — — — — — — 29,745 — — 54,136
3/29/2019(5) — — — 26,624 53,250 106,500 — — — 112,180
(1) These amounts represent the potential non-equity compensation that would have been earned by each respective executive officer for 2019
service under the different achievement levels under their 2019 annual incentive opportunity, which are more fully discussed in “Compensation
Discussion and Analysis,” pursuant to our 1998 Annual Incentive Plan. Under our current compensation structure, all non-equity incentive
compensation is paid to the executive officer in the first quarter of the year following the year in which service was rendered. The actual amount
of non-equity incentive compensation that was paid to our named executive officers for 2019 service is set forth in the “Non-Equity Incentive
Plan Compensation” column of the “Summary Compensation Table” above.
(2) RSU awards vest in three equal installments on the first, second and third anniversary dates of the grant, subject to continued employment.
Awards for Mr. Messina and Ms. Campbell settle in equity, but they do not have any rights of a shareholder with respect to any of the shares
subject to the award until such units are vested and settled. Awards for Messrs. Anderson, Yanoti and Zeleny and Ms. Dondzila settle in cash.
(3) See footnote (1) under “Summary Compensation Table” above for detail regarding the methodology used to calculate Grant Date Fair
Value.
(4) PRSU awards are earned based on the Company's TSR during the performance period of March 29, 2019 through March 29, 2022, and vest at
the third anniversary of the respective grant dates. Awards for all but Mr. Messina will settle in cash, if earned. Refer to “Compensation
Discussion and Analysis - 2019 Long-Term Incentive Awards” for additional details.
(5) PRSU awards vest in equal thirds on the first, second and third anniversaries of the respective grant dates based on the Company's cumulative
Total Shareholder Return during three performance periods (the first from March 29, 2019 through March 29, 2020, the second from March 29,
2019 through March 29, 2021, and the third from March 29, 2019 through March 29, 2022). These awards will settle in cash, if earned. Refer to
“Compensation Discussion and Analysis - 2019 Long-Term Incentive Awards” for additional details on these “transitional” awards.

49
(6) PRSU award granted March 4, 2019 to Ms. Campbell time-vests in equal fourths on the first, second, third and fourth anniversaries of the grant,
and performance vesting upon the Average Stock Price equaling or exceeding $4.34 at any time during such four-year vesting period. For these
purposes, “Average Stock Price” means the average of the Adjusted Stock Price for a period of twenty consecutive trading days, and the term
“Adjusted Stock Price” shall mean, for a particular trading day, the sum of (i) the closing price of the Corporation’s common stock on such
trading day, and (ii) the aggregate amount of dividends paid by the Company on a share of its common stock during the period commencing on
the award date and ending on the applicable trading day. This PRSU award does not have threshold or maximum levels for performance.
Outstanding Equity Awards at Fiscal Year-End
The following table provides information regarding outstanding equity awards at December 31, 2019 for Ocwen’s named
executive officers other than Ms. Dondzila, who had no outstanding equity awards.
Name
Option Awards Stock Awards
Number of Securities
Underlying Unexercised
Options Exercisable
(#)
Number of Securities
Underlying Unexercised
Options Unexercisable
(#)(1)
Equity Incentive
Plan Awards:
Number of Securities
Underlying Unexercised Unearned Options
(#)(2)
Option Exercise
Price ($)
Option Expiration
Date
Number of Shares or Units of
Stock That Have Not
Vested (#)(1)
Market Value of
Shares or Units of Stock That
Have Not Vested ($)(3)
Equity Incentive
Plan Awards:
Number of Unearned
Shares, Units or Other
Rights That Have Not
Vested (#)(4)
Equity Incentive
Plan Awards:
Market or Payout Value of
Unearned Shares, Units or
Other Rights That Have Not Vested
($)(3)
Glen A. Messina
88,997 177,993(5) - 4.12 10/4/2028 - - - -
- - - - - 655,341(6) 897,817 - -
- - - - - 565,326(7) 774,497 - -
- - - - - - - 282,663(8) 387,248
- - - - - - - 28,947(9) 39,657
June C. Campbell
- 33,180(10) - 2.17 3/4/2029 - - - -
- - - - - 24,424(11) 33,461 - -
- - - - - - - 57,604(12) 78,917
Timothy J. Yanoti
27,132 54,263(10) - 2.15 11/26/2028 - - - -
- - - - - 38,760(13) 53,101 - -
- - - - - - - 93,023(12) 127,442
- - - - - 137,362(7) 188,186 - -
- - - - - - - 68,681(8) 94,093
Scott W. Anderson
22,500 - - 33.45 5/14/2024 - - - -
- - 45,000(14) 33.45 5/14/2024 - - - -
- - 22,500(15) 33.45 5/14/2024 - - - - 32,772 - - 10.14 2/24/2025 - - - -
- - - - - 20,000(16) 27,400 - -
- - - - - 82,417(7) 112,911 - -
- - - - - - - 41,209(8) 56,456
- - - - - - - 48,076(9) 65,864
Dennis Zeleny
- - - - - 98,684(7) 135,197 - -
- - - - - - - 49,342(8) 67,599
(1) Consists of equity awards with respect to which, as of December 31, 2019, any applicable performance hurdles have been met but awards remain
subject to time-based vesting criteria.
(2) Consists of option awards with respect to which, as of December 31, 2019, the applicable performance hurdles have not been met.
(3) The dollar amounts shown in these columns are determined by multiplying the number of unvested shares or units subject to the award by $1.37,
the closing price of a share of our common stock on the New York Stock Exchange on December 31, 2019 (the last trading day of 2019).
(4) Consists of equity awards with respect to which, as of December 31, 2019, the applicable time-based and/or performance vesting criteria have
not been met.

50
(5) Represents non-qualified stock options (NQSOs) granted to Mr. Messina October 4, 2018. One-third of granted options vested October 4, 2019,
with the remaining options vesting in equal tranches on the second and third anniversaries of the grant.
(6) Represents RSUs granted to Mr. Messina October 4, 2018. One-third of granted units vested October 4, 2019, with the remaining units vesting in
equal tranches on the second and third anniversaries of the grant.
(7) Represents RSUs granted to Mr. Messina April 11, 2019, to Messrs. Anderson and Yanoti March 29, 2019, and to Mr. Zeleny July 21, 2019,
vesting in equal tranches on the first, second and third anniversaries of the respective grant dates. Awards for all but Mr. Messina will settle in
cash.
(8) Represents PRSUs granted to Mr. Messina April 11, 2019, to Messrs. Anderson and Yanoti March 29, 2019, and to Mr. Zeleny July 21, 2019.
These PRSUs are earned based on the Company's TSR during the performance period of March 29, 2019 through March 29, 2022, and vest on
the third anniversary of the respective grant dates. Awards for all but Mr. Messina will settle in cash, if earned. Amounts reported assume
threshold levels of achievement.
(9) Represents PRSUs granted to Mr. Messina April 11, 2019, and to Mr. Anderson March 29, 2019. These PRSUs vest in equal thirds on the first,
second and third anniversaries of the respective grant dates based on the Company's cumulative Total Shareholder Return during three
performance periods (the first from March 29, 2019 through March 29, 2020, the second from March 29, 2019 through March 29, 2021, and the
third from March 29, 2019 through March 29, 2022). These awards will settle in cash, if earned. Amounts reported assume threshold levels of
achievement.
(10) Represents NQSOs granted November 26, 2018 to Mr. Yanoti and March 4, 2019 to Ms. Campbell, vesting in equal thirds on the first, second
and third anniversaries of the grant.
(11) Represents RSUs granted March 4, 2019 to Ms. Campbell, vesting in equal thirds on the first, second and third anniversaries of the grant.
(12) Represents PRSUs granted November 26, 2018 to Mr. Yanoti and March 4, 2019 to Ms. Campbell, time-vesting in equal fourths on the first,
second, third and fourth anniversaries of the grant, and performance vesting upon the Average Stock Price equaling or exceeding $5.80 and
$4.34 for Mr. Yanoti and Ms. Campbell, respectively, at any time during such four-year period. For these purposes, “Average Stock Price” means
the average of the Adjusted Stock Price for a period of twenty consecutive trading days, and the term “Adjusted Stock Price” shall mean, for a
particular trading day, the sum of (i) the closing price of the Corporation’s common stock on such trading day, and (ii) the aggregate amount of
dividends paid by the Company on a share of its common stock during the period commencing on the award date and ending on the applicable
trading day.
(13) Represents RSUs granted to Mr. Yanoti November 26, 2018. One-third of granted units vested November 26, 2019, with the remaining units
vesting in equal tranches on the second and third anniversaries of the grant.
(14) Represents NQSOs granted to Mr. Anderson 5/14/2014, one-fourth of which vest upon achieving a stock price of $66.90 and compounded
annual gain of 20% over the exercise price, with the balance vesting one-fourth each subsequent anniversary.
(15) Represents NQSOs granted to Mr. Anderson 5/14/2014, one-fourth of which vest upon achieving a stock price of $100.35 and compounded
annual gain of 25% over the exercise price, with the balance vesting one-fourth each subsequent anniversary.
(16) Represents remaining one-fourth of PRSUs granted to Mr. Anderson March 29, 2016, which vested March 29, 2020.
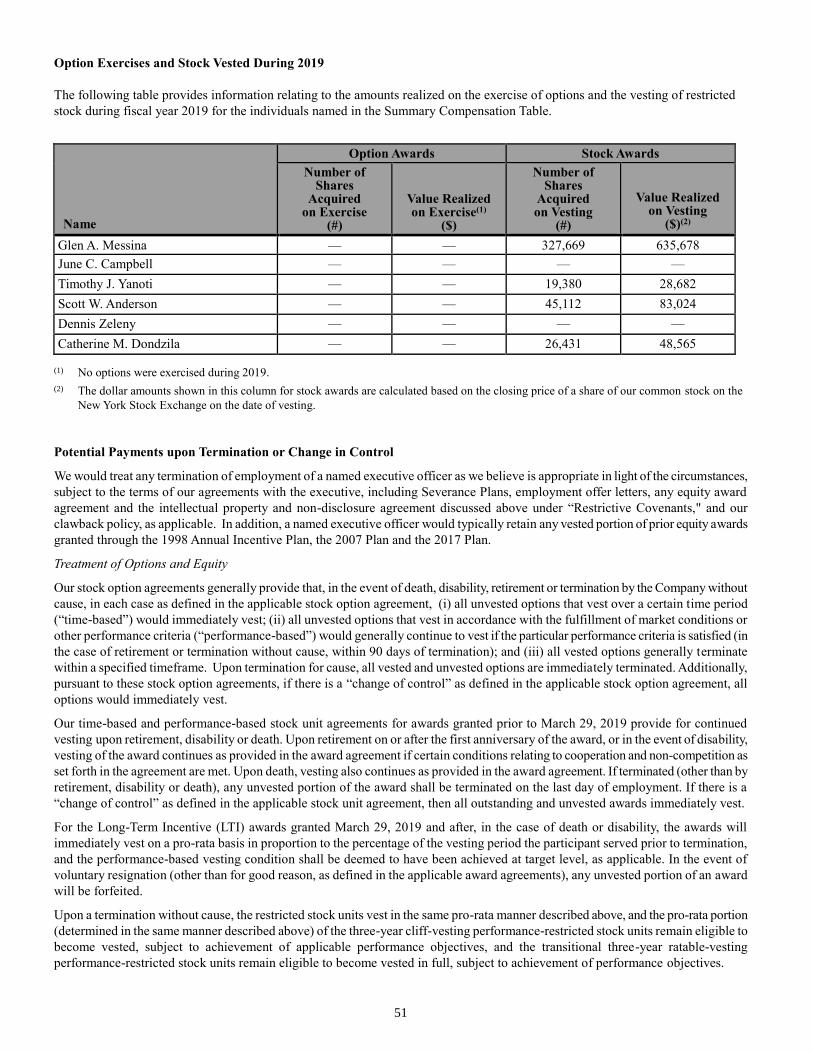
51
Option Exercises and Stock Vested During 2019
The following table provides information relating to the amounts realized on the exercise of options and the vesting of restricted
stock during fiscal year 2019 for the individuals named in the Summary Compensation Table.
Name
Option Awards Stock Awards
Number of Shares
Acquired on Exercise
(#)
Value Realized on Exercise(1)
($)
Number of Shares
Acquired on Vesting
(#)
Value Realized on Vesting
($)(2)
Glen A. Messina — — 327,669 635,678
June C. Campbell — — — —
Timothy J. Yanoti — — 19,380 28,682
Scott W. Anderson — — 45,112 83,024
Dennis Zeleny — — — —
Catherine M. Dondzila — — 26,431 48,565
(1) No options were exercised during 2019.
(2) The dollar amounts shown in this column for stock awards are calculated based on the closing price of a share of our common stock on the
New York Stock Exchange on the date of vesting.
Potential Payments upon Termination or Change in Control
We would treat any termination of employment of a named executive officer as we believe is appropriate in light of the circumstances,
subject to the terms of our agreements with the executive, including Severance Plans, employment offer letters, any equity award
agreement and the intellectual property and non-disclosure agreement discussed above under “Restrictive Covenants," and our
clawback policy, as applicable. In addition, a named executive officer would typically retain any vested portion of prior equity awards
granted through the 1998 Annual Incentive Plan, the 2007 Plan and the 2017 Plan.
Treatment of Options and Equity
Our stock option agreements generally provide that, in the event of death, disability, retirement or termination by the Company without
cause, in each case as defined in the applicable stock option agreement, (i) all unvested options that vest over a certain time period
(“time-based”) would immediately vest; (ii) all unvested options that vest in accordance with the fulfillment of market conditions or
other performance criteria (“performance-based”) would generally continue to vest if the particular performance criteria is satisfied (in
the case of retirement or termination without cause, within 90 days of termination); and (iii) all vested options generally terminate
within a specified timeframe. Upon termination for cause, all vested and unvested options are immediately terminated. Additionally,
pursuant to these stock option agreements, if there is a “change of control” as defined in the applicable stock option agreement, all
options would immediately vest.
Our time-based and performance-based stock unit agreements for awards granted prior to March 29, 2019 provide for continued
vesting upon retirement, disability or death. Upon retirement on or after the first anniversary of the award, or in the event of disability,
vesting of the award continues as provided in the award agreement if certain conditions relating to cooperation and non-competition as
set forth in the agreement are met. Upon death, vesting also continues as provided in the award agreement. If terminated (other than by
retirement, disability or death), any unvested portion of the award shall be terminated on the last day of employment. If there is a
“change of control” as defined in the applicable stock unit agreement, then all outstanding and unvested awards immediately vest.
For the Long-Term Incentive (LTI) awards granted March 29, 2019 and after, in the case of death or disability, the awards will
immediately vest on a pro-rata basis in proportion to the percentage of the vesting period the participant served prior to termination,
and the performance-based vesting condition shall be deemed to have been achieved at target level, as applicable. In the event of
voluntary resignation (other than for good reason, as defined in the applicable award agreements), any unvested portion of an award
will be forfeited.
Upon a termination without cause, the restricted stock units vest in the same pro-rata manner described above, and the pro-rata portion
(determined in the same manner described above) of the three-year cliff-vesting performance-restricted stock units remain eligible to
become vested, subject to achievement of applicable performance objectives, and the transitional three-year ratable-vesting
performance-restricted stock units remain eligible to become vested in full, subject to achievement of performance objectives.

52
In the event of a change of control, awards continue vesting in accordance with their terms, but the performance-based vesting
condition shall be deemed to have been achieved at target levels at each subsequent vesting date, as applicable. If, within 12 months of
such change of control, the corporation terminates the participant’s employment for any reason other than for cause or the participant
resigns for good reason, the awards will vest at target level as of the date of termination.
We believe that the provisions in our equity award agreements relating to change in control support our compelling business need to
incentivize the retention of key employees during the uncertain times preceding a change of control. As described above, beginning
with our March 29, 2019 awards, our award agreements provide for accelerated vesting following change of control only if such
change of control is followed by actual or constructive termination (i.e., a “double trigger”), in order to further incentivize post-change
of control retention and engagement.
Payments for Mr. Messina
In the event of Mr. Messina’s termination without cause or resignation for good reason, under the terms of his offer letter he will be
entitled to receive (i) a lump sum termination payment in an amount equal to the sum of his base salary plus his annual target
incentive, (ii) the estimated cost of 18 months’ COBRA benefits, and (iii) a pro rata portion of his annual bonus payment based on
actual achievement of Ocwen performance objectives and payment of any unpaid prior year bonus. In addition, in the event of Mr.
Messina’s termination without cause, resignation for good reason or termination due to death or disability, he will be entitled to
accelerated vesting of his sign-on option award and sign-on restricted stock unit award.
Severance Plans
Messrs. Anderson, Yanoti and Zeleny and Ms. Campbell are eligible for severance benefits upon a qualifying termination of
employment, conditioned upon the execution of a separation and release agreement, consistent with either the United States Basic
Severance Plan (the “Severance Plan”) or the United States Change in Control Severance Plan (the “CIC Plan”).
Under the Severance Plan, if an executive officer’s employment with the Company is terminated by the Company due to an eligible
termination as defined in the Plan, the executive will be entitled to receive the following benefits: (i) a lump sum payment equal to 18
times the monthly base salary rate; and (ii) a monthly subsidy equal to the executive’s expected cost of COBRA premiums for
continued medical coverage for 18 months.
Under the CIC Plan, if a Change in Control (as defined in the Plan) occurs and either the participant’s employment is involuntarily
terminated within the 12-month period following the Change in Control or he or she has been requested by the Company to continue in
the employment of the Company through a specified date following a Change in Control and the participant remains in the
employment of the Company for such specified period, the executive will be entitled to receive the following benefits, in lieu of not in
addition to, the benefits described in the preceding paragraph: (i) a lump sum payment equal to 24 times the monthly base salary rate,
plus the annual target incentive under the Annual Incentive Plan prorated for their length of service for the year in which the
termination occurs; and (ii) a monthly subsidy equal to the participant’s expected cost of COBRA premiums for continued medical
coverage for 24 months.

53
Tabular Disclosure of Payments on Termination or Change in Control
The table below sets forth the potential benefits that each named executive officer serving as of December 31, 2019 would have been
entitled to receive from the Company as described above upon a termination of employment under the circumstances described above,
and the potential benefits that each individual would have been entitled to receive with respect to accelerated vesting of equity awards
had a termination of employment under the circumstances described above or a change in control of the Company occurred, assuming
that the event occurred on the last day of fiscal year 2019. For Ms. Dondzila, as required under SEC rules, payments to her in
connection with her termination of employment on May 31, 2019 are described below.
The value of any outstanding equity awards that would accelerate is determined by multiplying (i) the number of unvested restricted
stock units held by the named executive officer that would accelerate by (ii) $1.37, the closing price of a share of our common stock on
the New York Stock Exchange on December 31, 2019 (the last trading day of the year). Additionally, at that share price, no stock
options for which vesting would accelerate had value.
Potential Payments upon Termination of Employment or Change in Control
Name
Voluntary Termination
without Good Reason or
Involuntary Termination
for Cause
Voluntary Resignation with Good
Reason
Involuntary Termination
Not for Cause
Change in Control without
Termination
Change in Control with Qualifying
Termination Disability or
Death Retirement
Glen A. Messina — 3,573,440 3,573,440 897,817 4,538,151 653,017 187,093
June C. Campbell — 712,500 712,500 112,378 1,062,378 — —
Timothy J. Yanoti — 675,000 722,690 180,543 1,456,916 95,379 47,690
Scott W. Anderson — 750,000 778,612 27,400 1,384,954 188,956 28,612
Dennis Zeleny — 637,500 656,479 — 1,120,394 37,957 18,979
Catherine M. Dondzila Separation
Effective as of May 31, 2019, Ms. Dondzila resigned as our Senior Vice President and Chief Accounting Officer. The Company
entered into a separation and release agreement with Ms. Dondzila on June 19, 2019 in connection with her departure. Under this
agreement, in addition to any other accrued obligations and vested benefits under the Company’s benefit plans, the Company agreed to
pay Ms. Dondzila a lump sum payment of $568,870 in exchange for a general release of claims. This agreement also included certain
restrictive covenants.

54
ADVISORY RATIFICATION OF APPOINTMENT OF
INDEPENDENT REGISTERED PUBLIC ACCOUNTING FIRM
(Proposal Two)
The Audit Committee of our Board of Directors has appointed Deloitte & Touche LLP, independent registered public accountants, to
be our independent registered public accounting firm for the year ending December 31, 2020 and has further directed that such
appointment be submitted for ratification, on an advisory basis, by our shareholders at the Annual Meeting. Although shareholder
ratification of the Audit Committee’s action in this respect is not required, the Audit Committee considers it desirable for
shareholders to ratify such appointment. If the shareholders do not ratify the appointment of Deloitte & Touche LLP, the Audit
Committee may, in its sole discretion, reevaluate the engagement of the independent registered public accounting firm. Even if this
appointment is ratified, the Audit Committee, in its discretion, may direct the appointment of a different independent registered
public accounting firm at any time during the year if the Audit Committee determines that such a change would be in the best
interests of the Company and its shareholders.
Representatives of Deloitte & Touche LLP will be present at the Annual Meeting, will be given the opportunity to make a statement,
if they so desire, and will be available to respond to appropriate questions from you.
OUR BOARD OF DIRECTORS UNANIMOUSLY RECOMMENDS THAT YOU VOTE “FOR” THE
ADVISORY RATIFICATION OF DELOITTE & TOUCHE LLP AS OUR INDEPENDENT REGISTERED PUBLIC
ACCOUNTING FIRM FOR 2020.

55
Report of the Audit Committee
The Audit Committee of the Board of Directors has:
• Reviewed and discussed with management Ocwen’s audited financial statements as of and for the year ended
December 31, 2019;
• Discussed with Deloitte & Touche LLP, Ocwen’s independent registered public accounting firm, the matters required to be
discussed by the applicable requirements of the Public Company Accounting Oversight Board and the Securities and
Exchange Commission; and
• Received and reviewed the written disclosures and the letter required by the applicable requirements of the Public
Company Accounting Oversight Board regarding the independent registered certified public accounting firm’s
communications with the Audit Committee concerning independence and discussed with Deloitte & Touche LLP their
independence.
In reliance on the review and discussion referred to above, the Audit Committee recommended to the Board of Directors that the
audited financial statements be included in Ocwen’s annual report on Form 10-K for the year ended December 31, 2019.
The Audit Committee operates under a written charter approved by our Board of Directors, a copy of which is available on our
website at www.ocwen.com.
April 27, 2020 Audit Committee
Alan J. Bowers, Chair
Robert J. Lipstein, Director
Kevin Stein, Director
Deloitte & Touche LLP Fees
The following table shows the aggregate fees billed to Ocwen for professional services by Deloitte & Touche LLP for fiscal
years 2019 and 2018:
2019 2018
Audit Fees $ 6,584,205 $ 5,601,457
Audit Related Fees 313,000 250,000
Tax Fees 1,846,820 2,150,010
All Other Fees 38,877 4,286
Total $ 8,782,902 $ 8,005,753
Audit Fees. This category includes the aggregate fees billed for professional services rendered for the audits of Ocwen’s
consolidated financial statements for fiscal years 2019 and 2018, for the reviews of the financial statements included in Ocwen’s
quarterly reports on Form 10-Q during fiscal years 2019 and 2018 and for services that are normally provided by the independent
registered public accounting firm in connection with statutory and regulatory filings or engagements for the relevant fiscal years.
Audit Related Fees. This category includes the aggregate fees billed for reporting on internal controls relating to servicing
operations.
Tax Fees. This category includes the aggregate fees billed in each of the last two fiscal years for professional services rendered by
the independent registered public accounting firm for tax compliance, tax planning and tax advice.
All Other Fees. This category includes the aggregate amounts billed in each of the last two fiscal years by the independent registered
public accounting firm that are not reported above under “Audit Fees,” “Audit-Related Fees” or “Tax Fees.”
The Audit Committee considered the compatibility of the non-audit-related services provided by and fees paid to Deloitte & Touche
LLP in 2018 and 2019 and the proposed services for 2020 and determined that such services and fees are compatible with the
independence of Deloitte & Touche LLP.

56
Principles for Audit Committee Pre-Approval of Audit and Non-Audit Services Provided by the Independent Auditor (the “Pre-
Approval Principles”). The Audit Committee has adopted the Pre-Approval Principles to set forth the procedures and conditions for
pre-approving audit and permitted non-audit services to be performed by the independent auditor responsible for auditing the
Company’s consolidated financial statements filed with the Securities and Exchange Commission or any separate financial
statements that may be required.
Pursuant to the Pre-Approval Principles, proposed services may either be pre-approved by the Audit Committee on a categorical
basis, without consideration of specific services (“general pre-approval”), or may be subject to case-by-case pre-approval by the
Audit Committee (“specific pre-approval”). The Audit Committee believes that the combination of these two approaches will result
in an effective and efficient procedure for purposes of addressing the Company’s auditing and non-auditing services and for
evaluating the potential impact of non-audit services on the independence of the independent auditor.
Pursuant to the Pre-Approval Principles, regardless of whether a class of services or individual service is proposed for general or
specific pre-approval, the Audit Committee shall consider whether such service is consistent with applicable Securities and
Exchange Commission and Public Company Accounting Oversight Board rules and guidance with respect to auditor independence.
The Audit Committee shall also consider whether the independent auditor is best positioned to provide the most effective and
efficient service, for reasons such as familiarity with the Company’s business, people, culture, accounting systems, risk profile and
other factors, and whether the service may enhance the Company’s ability to manage or control risk or improve audit quality. All
such factors will be considered as a whole, and no one factor should necessarily be determinative. The Audit Committee shall also
be mindful of the relationship between fees for audit and non-audit services in determining whether to pre-approve any class of
services or individual service and may determine, for each year, the appropriate ratio between the total amount of “Audit Fees,”
“Audit-Related Fees” and “Tax Fees” and the total amount of fees for permissible non-audit services classified under “All Other
Fees.”
All audit and permitted non-audit services to be provided by the independent auditor, including the projected fees for such services,
shall be pre-approved by the Audit Committee. In general, predictable and recurring audit and permitted non-audit services shall be
considered for general and/or specific pre-approval by the full Audit Committee on an annual basis, generally in conjunction with
the selection of the independent auditor. At this time, the Audit Committee may also choose to provide pre-approval of audit, audit-
related and tax services that may ultimately be required, but are not specifically identified at the beginning of the calendar year.
For any services not covered by these initial pre-approvals, the Audit Committee delegates authority to the Chair of the Audit
Committee to pre-approve any audit or permitted non-audit or tax service for which the estimated fee does not exceed $500,000.
Any service not covered by the Audit Committee’s initial pre-approvals and for which fees are expected to exceed $500,000 shall be
pre-approved by the full Audit Committee.
The Audit Committee does not delegate its responsibilities to pre-approve services performed by the independent auditor to
management.

57
ADVISORY VOTE TO APPROVE NAMED EXECUTIVE OFFICER COMPENSATION
(Proposal Three)
As required pursuant to Section 14A of the Securities Exchange Act of 1934, as amended, the Company is presenting this proposal
which gives you as a shareholder the opportunity to approve or not approve our pay program for our named executive officers.
As described in more detail under the heading “Executive Compensation,” we believe our executive compensation programs are
effectively designed, are in alignment with the interests of our shareholders and are instrumental to achieving our business strategy.
Prior to 2019, shareholder feedback in the form of shareholder advisory votes on Ocwen’s executive compensation has been very
positive. At each of our Annual Meetings of Shareholders from 2014 through 2018, we received at least 85% of votes cast on our
Say-on-Pay proposal in favor of our executive compensation. In 2019, we received 66% support on the votes casted on our Say-on-
Pay proposal. Based on outreach efforts to both institutional and active investors, we believe that a significant driver of this was the
“AGAINST” recommendation provided by ISS’s proxy advisory group. ISS comments included, among others, that our “annual
incentive awards being tied to a large number of metrics, several which appear to be subjective” and that our new Chief Executive
Officer, Mr. Messina, received equity grants that were “large and entirely time-vesting.”
The Compensation Committee considered ISS’s input, as well as the input we gathered from reaching out or meeting directly with
active investors. Through these outreach efforts we reached a group who held approximately 58% of our outstanding shares. During
the shareholder engagement process, we shared with investors the changes we had made in our programs including the reduction of
compensation levels and the introduction of a long-term incentive plan. As a result of the engagement process, we concluded that
Ocwen’s current focus on rewarding the management team for cost reduction, maximizing the synergies of the PHH acquisition,
settling legacy issues with regulators and focusing on the quickest return to profitability, as well as linking management’s
compensation to absolute total shareholder return, aligns with the priorities of our shareholders.
The Compensation Committee and our Board of Directors intend to continue to consider shareholder feedback as well as
recommended best practices put forth by shareholder proxy advisory firms such as ISS to the extent these institution’s
recommendations are aligned with the interests of our shareholders. We also intend to continue to hold an advisory Say-on-Pay vote
at each annual meeting of shareholders.
Accordingly, we will ask our shareholders to vote on the following proposed resolution at the Annual Meeting:
“RESOLVED, that the Company’s shareholders approve, on an advisory basis, the compensation of the named
executive officers, as disclosed in the Company’s Proxy Statement for the 2020 Annual Meeting of Shareholders
pursuant to the compensation disclosure rules of the Securities and Exchange Commission including the
Compensation Discussion and Analysis, the compensation tables and the narrative discussion that accompanies
the compensation tables.”
While the Compensation Committee and our Board of Directors intend to carefully consider the shareholder vote resulting from this
proposal, the final vote will not be binding on us and is advisory in nature.
You may vote for or against or abstain from the approval, on an advisory basis, of the compensation of the Company’s named
executive officers as disclosed in the Compensation Discussion and Analysis, the compensation tables and the narrative discussion
that accompanies the compensation tables contained in this proxy statement.
The Company’s current policy is to provide shareholders with an opportunity to approve, on an advisory basis, the compensation of
the named executive officers each year at the annual meeting of shareholders. This policy aligns with the preference expressed by
our shareholders at our 2017 Annual Meeting for Shareholders, who voted overwhelmingly to advise the Company to hold Say-on-
Pay votes annually. Therefore, we expect that the next such vote will occur at the 2020 annual meeting of shareholders.
OUR BOARD OF DIRECTORS UNANIMOUSLY RECOMMENDS THAT YOU VOTE “FOR” THE
APPROVAL, ON AN ADVISORY BASIS, OF THE COMPENSATION OF THE COMPANY’S NAMED
EXECUTIVE OFFICERS, AS DISCLOSED IN THIS PROXY STATEMENT.
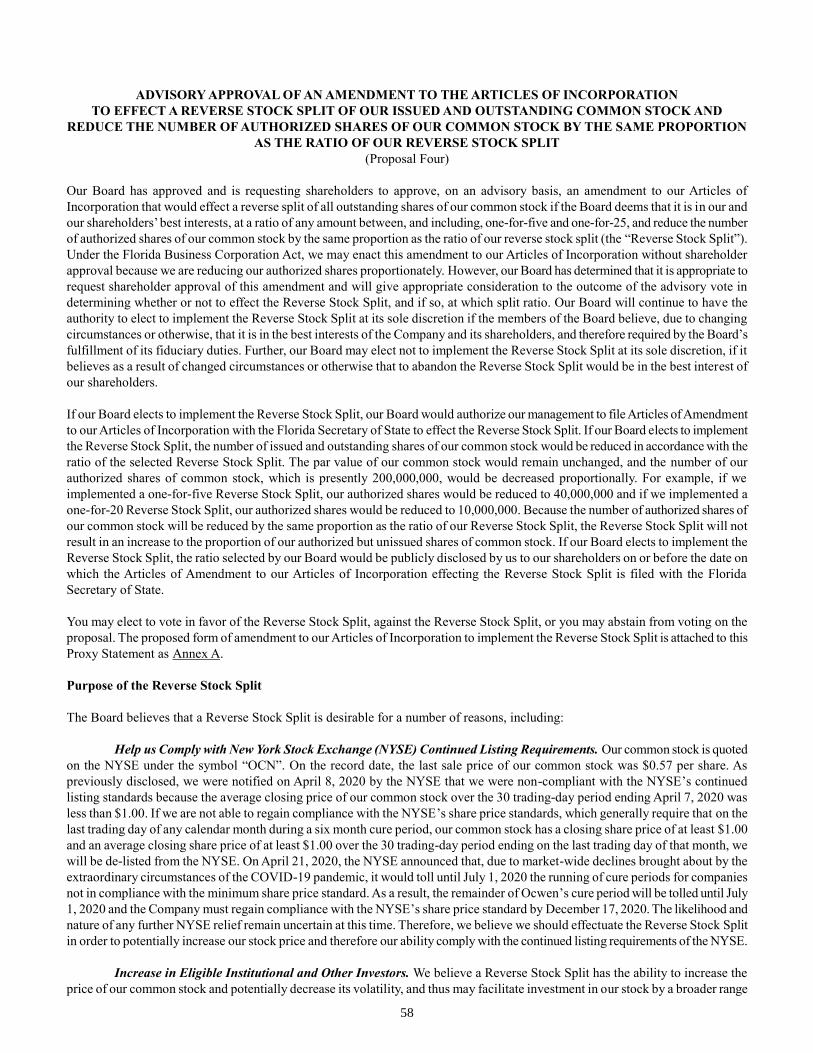
58
ADVISORY APPROVAL OF AN AMENDMENT TO THE ARTICLES OF INCORPORATION
TO EFFECT A REVERSE STOCK SPLIT OF OUR ISSUED AND OUTSTANDING COMMON STOCK AND
REDUCE THE NUMBER OF AUTHORIZED SHARES OF OUR COMMON STOCK BY THE SAME PROPORTION
AS THE RATIO OF OUR REVERSE STOCK SPLIT
(Proposal Four)
Our Board has approved and is requesting shareholders to approve, on an advisory basis, an amendment to our Articles of
Incorporation that would effect a reverse split of all outstanding shares of our common stock if the Board deems that it is in our and
our shareholders’ best interests, at a ratio of any amount between, and including, one-for-five and one-for-25, and reduce the number
of authorized shares of our common stock by the same proportion as the ratio of our reverse stock split (the “Reverse Stock Split”).
Under the Florida Business Corporation Act, we may enact this amendment to our Articles of Incorporation without shareholder
approval because we are reducing our authorized shares proportionately. However, our Board has determined that it is appropriate to
request shareholder approval of this amendment and will give appropriate consideration to the outcome of the advisory vote in
determining whether or not to effect the Reverse Stock Split, and if so, at which split ratio. Our Board will continue to have the
authority to elect to implement the Reverse Stock Split at its sole discretion if the members of the Board believe, due to changing
circumstances or otherwise, that it is in the best interests of the Company and its shareholders, and therefore required by the Board’s
fulfillment of its fiduciary duties. Further, our Board may elect not to implement the Reverse Stock Split at its sole discretion, if it
believes as a result of changed circumstances or otherwise that to abandon the Reverse Stock Split would be in the best interest of
our shareholders.
If our Board elects to implement the Reverse Stock Split, our Board would authorize our management to file Articles of Amendment
to our Articles of Incorporation with the Florida Secretary of State to effect the Reverse Stock Split. If our Board elects to implement
the Reverse Stock Split, the number of issued and outstanding shares of our common stock would be reduced in accordance with the
ratio of the selected Reverse Stock Split. The par value of our common stock would remain unchanged, and the number of our
authorized shares of common stock, which is presently 200,000,000, would be decreased proportionally. For example, if we
implemented a one-for-five Reverse Stock Split, our authorized shares would be reduced to 40,000,000 and if we implemented a
one-for-20 Reverse Stock Split, our authorized shares would be reduced to 10,000,000. Because the number of authorized shares of
our common stock will be reduced by the same proportion as the ratio of our Reverse Stock Split, the Reverse Stock Split will not
result in an increase to the proportion of our authorized but unissued shares of common stock. If our Board elects to implement the
Reverse Stock Split, the ratio selected by our Board would be publicly disclosed by us to our shareholders on or before the date on
which the Articles of Amendment to our Articles of Incorporation effecting the Reverse Stock Split is filed with the Florida
Secretary of State.
You may elect to vote in favor of the Reverse Stock Split, against the Reverse Stock Split, or you may abstain from voting on the
proposal. The proposed form of amendment to our Articles of Incorporation to implement the Reverse Stock Split is attached to this
Proxy Statement as Annex A.
Purpose of the Reverse Stock Split
The Board believes that a Reverse Stock Split is desirable for a number of reasons, including:
Help us Comply with New York Stock Exchange (NYSE) Continued Listing Requirements. Our common stock is quoted
on the NYSE under the symbol “OCN”. On the record date, the last sale price of our common stock was $0.57 per share. As
previously disclosed, we were notified on April 8, 2020 by the NYSE that we were non-compliant with the NYSE’s continued
listing standards because the average closing price of our common stock over the 30 trading-day period ending April 7, 2020 was
less than $1.00. If we are not able to regain compliance with the NYSE’s share price standards, which generally require that on the
last trading day of any calendar month during a six month cure period, our common stock has a closing share price of at least $1.00
and an average closing share price of at least $1.00 over the 30 trading-day period ending on the last trading day of that month, we
will be de-listed from the NYSE. On April 21, 2020, the NYSE announced that, due to market-wide declines brought about by the
extraordinary circumstances of the COVID-19 pandemic, it would toll until July 1, 2020 the running of cure periods for companies
not in compliance with the minimum share price standard. As a result, the remainder of Ocwen’s cure period will be tolled until July
1, 2020 and the Company must regain compliance with the NYSE’s share price standard by December 17, 2020. The likelihood and
nature of any further NYSE relief remain uncertain at this time. Therefore, we believe we should effectuate the Reverse Stock Split
in order to potentially increase our stock price and therefore our ability comply with the continued listing requirements of the NYSE.
Increase in Eligible Institutional and Other Investors. We believe a Reverse Stock Split has the ability to increase the
price of our common stock and potentially decrease its volatility, and thus may facilitate investment in our stock by a broader range

59
of institutional investors. For example, many funds and institutions have investment guidelines and policies that prohibit them from
investing in stocks with a price below a certain threshold. We believe that increased institutional investor interest in the Company
and our common stock may potentially lead to an increase in the market price of our common stock, as well as the trading volume
and liquidity of our common stock.
Increase Analyst and Broker Interest. We believe a Reverse Stock Split would help increase analyst and broker-dealer
interest in our common stock as many brokerage and investment advisory firms’ policies can discourage analysts, advisors, and
broker/dealers from following or recommending companies with low stock prices. Because of the trading volatility and lack of
liquidity often associated with lower-priced stocks, many brokerage houses have adopted investment guidelines and policies and
practices that either prohibit or discourage them from investing or trading such stocks or recommending them to their clients and
customers. Some of those guidelines, policies and practices may also function to make the processing of trades in lower-priced
stocks economically unattractive to broker-dealers. Additionally, because brokers’ commissions and dealer mark-ups/mark-downs on
transactions in lower-priced stocks generally represent a higher percentage of the stock price than commissions and mark-ups/mark-
downs on higher-priced stocks, the current average price per share of our common stock can result in shareholders or potential
shareholders paying transaction costs representing a higher percentage of the total share value than would otherwise be the case if
the share price were substantially higher.
In evaluating the Reverse Stock Split, our Board of Directors also considered a number of negative factors commonly associated
with reverse stock splits. These factors include the negative perception of reverse stock splits held by some investors and analysts, as
well as the fact that the stock prices of some companies that effect reverse stock splits do not necessarily trade at levels
commensurate with expectations based on the applicable reverse stock split ratios. See “- Risks of the Reverse Stock Split” below for
more information on the risks associated with the Reverse Stock Split. Our Board, however, may determine that these potential
negative factors would be significantly outweighed by the potential benefits, and may believe that the increase of the per share
market price of our common stock that may result from the Reverse Stock Split may allow us to maintain the listing of our common
stock on the NYSE, encourage greater interest in our common stock from market participants, and enhance the marketability of our
common stock.
Risks of the Reverse Stock Split
Before voting on this proposal, you should consider the following risks associated with the implementation of the Reverse Stock
Split.
The Reverse Stock Split may not increase our market capitalization, which would prevent us from realizing some of the
anticipated benefits of the Reverse Stock Split. The market price of our common stock is based on a number of factors which may
be unrelated to the number of shares outstanding. These factors may include our performance, general economic and market
conditions and other factors, many of which are beyond our control. The market price per share may not rise in inverse proportion to
the reduction in the number of shares outstanding before the Reverse Stock Split, and any increase in share price may not be
maintained. For example, based on the closing price of our common stock on March 31, 2020, of $0.50 per share, if our Board were
to implement the Reverse Stock Split and utilize a ratio of one-for-20, we cannot assure you that the post-split market price of our
common stock would be $10.00 (that is $0.50 multiplied by 20) per share or greater. Accordingly, the total market capitalization of
our common stock after the Reverse Stock Split may be lower than the total market capitalization before the Reverse Stock Split.
Even if the Reverse Stock Split is implemented, we may still become ineligible for continued listing on the NYSE. In the
future, the market price of our common stock following the Reverse Stock Split may not equal or exceed the market price prior to
the Reverse Stock Split. The long- and near-term effect of a Reverse Stock Split upon the market price of our common stock cannot
be predicted with any certainty. Even if the Reverse Stock Split is implemented, we may still become ineligible for continued listing
on the NYSE.
If the Reverse Stock Split is effected, the resulting per-share market price may not attract institutional investors or
investment funds and may not satisfy the investing guidelines of such investors and, consequently, the trading liquidity of our
common stock may not improve. There can be no assurance that the Reverse Stock Split will result in a per-share market price that
will attract institutional investors or investment funds or that such share price will satisfy the investing guidelines of institutional
investors or investment funds. As a result, the trading liquidity of our common stock may not necessarily improve.
The reduced number of issued shares of common stock resulting from the Reverse Stock Split could adversely affect the
liquidity of our common stock. As noted above, the Reverse Stock Split may not increase interest in our common stock and to the
contrary, the reduced number of shares issued and outstanding after the Reverse Stock Split could adversely affect the liquidity of
our common stock by reducing the number of shares available for trading.

60
Effects of the Reverse Stock Split
Reduction of the number of Shares Held by Individual Shareholders. After the effective date of the Reverse Stock Split,
each common shareholder will own fewer shares of our common stock. However, the Reverse Stock Split will affect all of our
common shareholders uniformly and will not affect any common shareholder’s percentage ownership interests in us, except to the
extent that the Reverse Stock Split results in any of our shareholders owning a fractional share as described below. As discussed
further below, we will round up any fractional shares. The number of shareholders of record will not be affected by the Reverse
Stock Split. However, if the Reverse Stock Split is approved, it will increase the number of shareholders who own “odd lots” of less
than 100 shares of our common stock. Brokerage commissions and other costs of transactions in odd lots may be higher than the
costs of transactions of more than 100 shares of common stock.
Reduction in Total Outstanding Shares. The proposed Reverse Stock Split will reduce the total number of outstanding
shares of common stock by a factor based on the ratio of the split. The following table shows the number of shares of our common
stock outstanding both before the Reverse Stock Split and after the Reverse Stock Split:
Reverse Split Ratio
Number of Shares
Authorized
Approximate Number of
Shares Issued and
Outstanding(1)
Percentage of Authorized
Common Stock
Number of Shares
Available for Issuance
Current Shares 200,000,000 134,956,288 67.5% 65,043,712
1-for-5 40,000,000 26,991,258 67.5% 13,008,742
1-for-10 20,000,000 13,495,629 67.5% 6,504,371
1-for-15 13,333,333 8,997,086 67.5% 4,336,247
1-for-20 10,000,000 6,747,814 67.5% 3,252,186
1-for-25 8,000,000 5,398,252 67.5% 2,601,748
(1) As of the Record Date, March 27, 2020.
Change in Number and Exercise Price of Employee and Equity Awards. The Reverse Stock Split will reduce the number
of shares of common stock available for issuance under the 2017 Performance Incentive Plan (the “2017 Plan”) and equity award
agreements issued under the 2017 Plan in proportion to the split ratio. Under the terms of our outstanding equity awards, the Reverse
Stock Split will cause a reduction in the number of shares of common stock issuable upon exercise or vesting of such awards in
proportion to the split ratio of the Reverse Stock Split and will cause a proportionate increase in the exercise price of such awards to
the extent they are stock options. The number of shares of common stock issuable upon exercise or vesting of stock option awards
will be rounded to the nearest whole share and no cash payment will be made in respect of such rounding.
Effect on cash-settled and equity-settled RSUs and relevant performance metrics. The number of outstanding Restricted
Stock Units (RSUs) will be proportionately reduced and rounded down to the nearest whole unit. The remaining fractional unit will
be converted to a cash obligation not subject to the terms of the Plan but administered according to the same vesting, performance
and other terms contained in the corresponding Award agreement. As applicable, performance requirements assigned to RSU vesting
that are based on share price metrics (including total shareholder return) will be increased in proportion to the split ratio.
Regulatory Effects. Our common stock is currently registered under Section 12(b) of the Exchange Act and we are subject
to the periodic reporting and other requirements of the Exchange Act. The Reverse Stock Split will not affect the registration of the
common stock under the Exchange Act or our obligation to publicly file financial and other information with the Securities and
Exchange Commission. If the Reverse Stock Split is implemented, we will remain subject to NYSE continued listing standards,
including compliance with the minimum price per share requirements described above, in order to continue to trade on the NYSE.
In addition to the above, the Reverse Stock Split will have the following effects upon our common stock:
• The per share loss and net book value of our common stock will be increased because there will be a lesser number of
shares of our common stock outstanding;
• The authorized common stock and the par value of the common stock will remain $0.01 per share; and
• The stated capital on our balance sheet attributable to the common stock will be decreased and the additional paid-in
capital account will be credited with the amount by which the stated capital is decreased.

61
Shares of common stock outstanding after the Reverse Stock Split will be fully paid and non-assessable. The amendment will not
change any of the other terms of our common stock. The shares of common stock outstanding after the Reverse Stock Split will have
the same voting rights and rights to dividends and distributions and will be identical in all other respects to the shares of common
stock outstanding prior to the Reverse Stock Split.
Because the number of authorized shares of our common stock will be reduced by the same proportion as the ratio of our Reverse
Stock Split, the Reverse Stock Split will not result in an increase to the proportion of our authorized but unissued shares of common
stock.
Once we implement a Reverse Stock Split, all share certificates issued prior to the Reverse Stock Split will continue to be valid. In
the future, new share certificates will be issued reflecting the Reverse Stock Split, but this in no way will affect the validity of your
current share certificates. When implemented, the Reverse Stock Split will adjust the number of shares held by each shareholder
without any further action on the part of our shareholders. After the effective date of the Reverse Stock Split, each book-entry share
certificate issued prior to the Reverse Stock Split will be re-issued by our transfer agent, American Stock Transfer & Trust Company,
LLC (AST), to account for the Reverse Stock Split.
After the effective date of the Reverse Stock Split, each physical share certificate issued prior to the Reverse Stock Split will be
deemed to represent the number of shares shown on the certificate, divided by the split ratio. Physical share certificates will be re-
issued in book-entry form in due course as such certificates are tendered for exchange or transfer to our transfer agent in accordance
with instructions in a transmittal letter that will be provided to shareholders of record.
As applicable, if a share certificate issued prior to the Reverse Stock Split bears a restrictive legend, the replacement share certificate
that will be issued following the Reverse Stock Split will contain the same restrictive legend. Also, if applicable, for purposes of
determining the term of the restrictive period applicable to shares after the Reverse Stock Split for purposes of Rule 144 of the
Securities Act of 1933, as amended, the time period during which a shareholder has held their existing pre-Reverse Stock Split
shares will be included in the total holding period.
We request that shareholders do not send in any of their stock certificates at this time and follow the instructions on the
transmittal letter that will be sent to record holders of physical certificates by our stock transfer agent, American Stock
Transfer & Trust Company, LLC (AST).
Procedure for Implementing the Reverse Stock Split
The Reverse Stock Split would become effective upon the filing of Articles of Amendment to our Articles of Incorporation with the
Secretary of State of Florida. The exact date of the filing of the Articles of Amendment that will effectuate the Reverse Stock Split
will be determined by our Board based on its evaluation as to when such action will be the most advantageous to us and our
shareholders. In addition, our Board reserves the right, notwithstanding shareholder approval and without further action by the
shareholders, to elect not to proceed with the Reverse Stock Split if, at any time prior to filing the amendment to our Articles, our
Board, in its sole discretion, determines that it is no longer in our best interest and the best interests of our shareholders to proceed
with the Reverse Stock Split.
After the filing of the Articles of Amendment, our common stock will have a new CUSIP number, which is a number used to
identify our equity securities, and stock certificates with the prior CUSIP number will need to be exchanged for stock certificates
with the new CUSIP number by following the procedures described below.
As soon as practicable after the Reverse Stock Split is implemented, our transfer agent will act as exchange agent for purposes of
implementing the exchange of physical stock certificates for record holders (i.e., shareholders who hold their shares directly in their
own name and not through a broker). Record holders of pre-Reverse Stock Split physical share certificates will be asked to surrender
to the transfer agent certificates representing pre-Reverse Stock Split shares in exchange for a book-entry certificate representing
post-Reverse Stock Split shares in accordance with the procedures to be set forth in a letter of transmittal for from our transfer agent.
No new certificates will be issued to a shareholder until such shareholder has surrendered such shareholder’s outstanding physical
share certificate(s) together with the properly completed and executed letter of transmittal to the exchange agent.
For street name holders of pre-Reverse Stock Split shares (i.e., shareholders who hold their shares through a broker), your broker
will make the appropriate adjustment to the number of shares held in your account following the effective date of the Reverse Stock
Split.

62
SHAREHOLDERS SHOULD NOT DESTROY ANY STOCK CERTIFICATE(S) AND SHOULD NOT SUBMIT ANY
CERTIFICATE(S) UNTIL THEY RECEIVE A TRANSMITTAL FORM FROM OUR TRANSFER AGENT.
No service charges, brokerage commissions or transfer taxes will be payable by any shareholder, except that if any new stock
certificates are to be issued in a name other than that in which the surrendered certificate(s) are registered it will be a condition of
such issuance that (1) the person requesting such issuance pays all applicable transfer taxes resulting from the transfer (or prior to
transfer of such certificate, if any) or establishes to our satisfaction that such taxes have been paid or are not payable, (2) the transfer
complies with all applicable federal and state securities laws, and (3) the surrendered certificate is properly endorsed and otherwise
in proper form for transfer.
Fractional Shares
No fractional shares of common stock will be issued as a result of the Reverse Stock Split. Instead, shareholders who otherwise
would be entitled to a fraction of a share of common stock will, in lieu of such fractional share, receive one whole share of common
stock.
Accounting Matters
The par value per share of our common stock will remain unchanged at $0.01 per share after the Reverse Stock Split. As a result, on
the effective date of the Reverse Stock Split, the stated capital on our consolidated balance sheet attributable to common stock will
be reduced and the additional paid-in-capital account will be increased by the amount by which the stated capital is reduced. Per
share net income or loss will be increased because there will be fewer shares of our common stock outstanding. We do not anticipate
that any other accounting consequences, including changes to the amount of stock-based compensation expense to be recognized in
any period, will arise as a result of the Reverse Stock Split.
Certain Federal Income Tax Consequences
Each shareholder is advised to consult their own tax advisor as the following discussion may be limited, modified or not apply
based on your own particular situation.
The following summary of certain United States federal income tax consequences of the Reverse Stock Split is based on current law,
including the Internal Revenue Code of 1986, as amended (the “Code”) and is for general information only. This summary addresses
only shareholders who are United States Persons, as defined in Section 7701(a)(30) of the Code and who hold the pre-Reverse Stock
Split shares and post-Reverse Stock Split shares as capital assets. This summary does not purport to be complete and does not
address shareholders subject to special rules, such as financial institutions, tax-exempt organizations, insurance companies, dealers
in securities, mutual funds, non-U.S. shareholders, shareholders who hold the pre-Reverse Stock Split shares as part of a straddle,
hedge, or conversion transaction, shareholders who hold the pre-Reverse Stock Split shares as qualified small business stock within
the meaning of Section 1202 of the Code, shareholders who hold the pre-Reverse Stock split shares as Section 1244 stock within the
meaning of Section 1244 of the Code, shareholders who are subject to the alternative minimum tax provisions of the Code, and
shareholders who acquired their pre-Reverse Stock Split shares pursuant to the exercise of employee stock options or otherwise as
compensation. This summary does not address tax considerations under state, local and/or non-U.S. income tax and other laws. If a
partnership holds pre-Reverse Stock Split shares, the tax treatment of a partner in such partnership will generally depend upon the
status of the partner and the activities of such partnership. Furthermore, we have not obtained a ruling from the Internal Revenue
Service or an opinion of legal or tax counsel with respect to the consequences of the Reverse Stock Split and do not intend to do so.
This summary is not binding upon the Internal Revenue Service or the courts, and there can be no assurance that the Internal
Revenue Service or the courts will accept the positions expressed herein.
The Reverse Stock Split is intended to constitute a reorganization within the meaning of Section 368 of the Code. Assuming the
Reverse Stock Split qualifies as a reorganization for federal income tax purposes, we will not recognize taxable income, gain or loss
as a result of the transaction.
Assuming the Reverse Stock Split qualifies as a reorganization for federal income tax purposes, a shareholder generally will not
recognize income, gain or loss on the Reverse Stock Split, except possibly to the extent of the value of the shares received solely as
a result of the stock “round up” (see below). The aggregate tax basis of the post-Reverse Stock Split shares received by a
shareholder will be equal to the aggregate tax basis of its pre-Reverse Stock Split shares plus the value of the shares received solely
as a result of the stock “round up”. The holding period of the post-Reverse Stock Split shares received by a shareholder will include
the holding period of the pre-Reverse Stock Split shares exchanged by such shareholder as part of this transaction for all shares
received other than any received as a result of the “round-up.” The shares received as a result of the “round-up” may have a new
holding period starting on the date of the Reverse Stock Split.

63
The federal income tax consequences of the stock “round up” are unclear, and a holder of the pre-Reverse Stock Split shares may
recognize income or gain to the extent of the value of the shares received solely as a result of the stock “round up.”
PLEASE CONSULT YOUR OWN TAX ADVISOR REGARDING THE U.S. FEDERAL, STATE, LOCAL, AND FOREIGN
INCOME AND OTHER TAX CONSEQUENCES OF THE REVERSE STOCK SPLIT AND THE RECEIPT OF ANY
“ROUND UP” SHARES IN YOUR PARTICULAR CIRCUMSTANCES UNDER THE INTERNAL REVENUE CODE AND
THE LAWS OF ANY OTHER TAXING JURISDICTION.
No Appraisal Rights
Shareholders have no rights under the Florida Business Corporation Act or under our charter documents to exercise dissenters’ rights
of appraisal with respect to the Reverse Stock Split.
No Expected Anti-Takeover Effects
Because the Reverse Stock Split will not result in Ocwen having additional authorized and unissued shares, we do not expect the
Reverse Stock Split to have any impact on the ability of the Company to engage in a merger, business combination or other
transformative transaction, nor do we expect it to impact the ability of any party to assume control of us through a hostile-takeover,
tender offer or proxy contest. Additionally, the Reverse Stock Split is not intended to effect a going private transaction.
Neither our Articles of Incorporation nor our Bylaws presently contain any provisions having anti-takeover effects, with the
exception of our Board’s ability to issue preferred stock, at any time and from time to time, with such voting powers, designations,
preferences and relative, participating, optional or other special rights, qualification, limitations or restrictions as adopted by our
Board. The Reverse Stock Split Proposal is not a plan by our Board to adopt a series of amendments to our Articles or Bylaws to
institute an anti-takeover provision. We do not have any plans or proposals to adopt other provisions or enter into other arrangements
that may have material anti-takeover consequences.
Rather, as discussed above, the reason for the Reverse Stock Split is to increase the ability of institutions to purchase our common
stock and the interest in our common stock by analysts and brokers as well as help us comply with NYSE continued listing
standards.
Interests of Certain Persons in this Proposal Four
Certain of our officers and directors have an interest in Proposal Four as a result of their ownership of shares of our common stock.
However, the Reverse Stock Split will affect all of our common shareholders uniformly and will not affect any common
shareholder’s percentage ownership interests in us, except to the extent that the Reverse Stock Split results in any of our
shareholders owning a fractional share as described above.
Consequences if the Reverse Stock Split is Not Approved
In the event that the Reverse Stock Split is not approved by shareholders, we intend to actively monitor the trading price of our
common stock on the NYSE and will consider available options in order to comply with the NYSE listing rules. We believe that our
ability to remain listed on the NYSE may be significantly and negatively affected if a Reverse Stock Split is not implemented. If we
are unable to achieve an increase in our stock price and our common stock is subsequently delisted, we would experience significant
negative impacts, including but not limited to, impairment of our ability to obtain debt or equity financing to support our operations,
and our shareholders could experience significant negative impacts, including but not limited to, decreased trading volume and
liquidity of our common stock. Therefore, if the members of the Board believe, due to changing circumstances or otherwise, that it
is in the best interests of the Company and its shareholders, and therefore required by the Board’s fulfillment of its fiduciary duties,
to act to prevent delisting of the Company, the Board reserves discretion to implement the Reverse Stock Split.
OUR BOARD OF DIRECTORS UNANIMOUSLY RECOMMENDS THAT YOU VOTE “FOR” THE ADVISORY
APPROVAL OF AN AMENDMENT TO OUR ARTICLES OF INCORPORATION TO IMPLEMENT A REVERSE
STOCK SPLIT AS DISCLOSED IN THIS PROXY STATEMENT.

64
APPROVAL OF THE ADJOURNMENT OF THE ANNUAL MEETING
(Proposal Five)
If, at the Annual Meeting, the number of shares of common stock present in person or represented by proxy and voting in favor of
Proposal Four to approve the Reverse Stock Split is insufficient to approve such proposal, the Company believes it is advisable that
the Company should be authorized to move to adjourn the Annual Meeting in order to enable the Board of Directors to solicit
additional proxies for the approval of Proposal Four. If we determine that this is necessary, we will ask our shareholders to vote only
on Proposals One, Two, Three and Five and not on Proposal Four. We do not intend to call a vote on this Proposal Five if Proposal
Four is approved by the requisite number of shares of our common stock at the Annual Meeting.
If our shareholders approve this Proposal Five to adjourn the Annual Meeting, we could adjourn the Annual Meeting and use the
additional time to solicit additional proxies, including the solicitation of proxies from shareholders that have previously voted.
Among other things, approval of this Proposal Five could mean that, even if we had received proxies representing a sufficient
number of votes “AGAINST” Proposal Four to defeat such proposal, we could adjourn the Annual Meeting without a vote on the
Reverse Stock Split and seek to convince the holders of those shares to change their votes to votes in favor of Proposal Four.
OUR BOARD OF DIRECTORS UNANIMOUSLY RECOMMENDS THAT YOU VOTE “FOR” THE AUTHORITY
OF THE COMPANY TO ADJOURN THE ANNUAL MEETING, IF NECESSARY OR APPROPRIATE, TO SOLICIT
ADDITIONAL PROXIES IN THE EVENT THAT THERE ARE NOT SUFFICIENT VOTES AT THE TIME OF THE
ANNUAL MEETING TO APPROVE PROPOSAL FOUR.
65
BUSINESS RELATIONSHIPS AND RELATED TRANSACTIONS
Ocwen’s Related Party Transactions Approval Policy (the “Policy”) sets forth our policies and procedures for the review, approval
and monitoring of Related Party Transactions (which, as defined in the Policy and subject to certain exceptions, includes
transactions in which the amount involved exceeds $120,000 and that involve Ocwen and (i) any person who is a director, nominee
for director or senior vice-president or higher ranking employee of the Company or any of its subsidiaries and any other person who
performs policy-making functions for the Company, (ii) any person who beneficially owns more than five percent of any class of the
Company’s voting securities, (iii) any immediate family member of any of the foregoing persons, (iv) any entity or individual
controlling or under common control with the Company or any of its subsidiaries, (v) any entity or individual covered by paragraph
f or g of the definition of “Related Parties” in the Glossary of Financial Accounting Standards Board Accounting Standards
Codification 850, Related Party Disclosures (“ASC 850”) such that disclosures of transactions with such entity or individual would
be required in the Company’s audited financial statements under ASC 850, (vi) any entity or individual sharing any risk,
compliance, internal audit or vendor oversight function with the Company or any of its subsidiaries or (vii) any Specified
Companies designated by the Risk and Compliance Committee of the Board of Directors notwithstanding that such Specified
Companies are not "related persons" as defined in Item 404 of SEC Regulation S-K ("Item 404'') or "related parties" as defined in
ASC 850. Our written Code of Business Conduct and Ethics, which is available at www.ocwen.com, also includes policies and
procedures that broadly cover situations in which conflicts of interest may arise.
The Risk and Compliance Committee (the “Committee”) of the Board of Directors provides independent review, approval and
oversight of Related Party Transactions as required under the Policy.
In connection with the review and approval of a Related Party Transaction, the Committee is to be provided with the pertinent
details of the proposed Related Party Transaction, including the terms of the transaction, the business purpose of the transaction, and
the perceived benefits or any detriments to Ocwen. In determining whether to approve a Related Party Transaction, the Committee
may consider the following factors, as well as any others it deems appropriate, to the extent relevant to the transaction (i) whether
the transaction is in the best interests of Ocwen; (ii) whether there are any alternatives to the Related Party Transaction; (iii) whether
the Related Party Transaction is on terms comparable to those available to third parties; (iv) the potential for the Related Party
Transaction to lead to an actual or apparent conflict of interest and any safeguards imposed to prevent such actual or apparent
conflicts, (v) the overall fairness of the Related Party Transaction to Ocwen and (vi) any impact, positive or negative, on borrowers
or mortgage loan investors. The Committee may request or require members of management to make certain modifications to a
proposed Related Party Transaction prior to its approval of such Related Party Transaction.
Relationship with Altisource
Based on information contained in filings under the Exchange Act, we understand that Deer Park Road Management Company, LP,
an Ocwen shareholder reporting beneficial ownership of over 5% of our common stock, also reports beneficial ownership of 19.8%
of the common stock of Altisource Portfolio Solutions, S.A. (“Altisource”) as of December 31, 2019. Pursuant to SEC guidance, we
consider this shareholder to have an indirect material interest in our transactions with Altisource, and, pursuant to our Policy, we
consider our transactions with Altisource and certain of its subsidiaries to be Related Party Transactions notwithstanding that such
Specified Companies are not “related persons” as defined in Item 404 or “related parties” as defined in ASC 850.
Our relationship with Altisource is governed by a series of agreements that set forth the terms on which we do business with
Altisource. The key agreements are summarized below.
Ocwen Financial Corporation is a party to a number of long-term agreements with Altisource S.à r.l., and certain other subsidiaries
of Altisource, including a Services Agreement, under which Altisource provides various services, such as property valuation
services, property preservation and inspection services and title services, among other things. This agreement expires August 31,
2025 and includes renewal provisions. Ocwen and Altisource have also entered into a Master Services Agreement pursuant to which
Altisource currently provides title services to Ocwen’s subsidiary PHH Mortgage Corporation doing business as Liberty Reverse
Mortgage. Ocwen also has a General Referral Fee Agreement with Altisource pursuant to which Ocwen receives referral fees which
are paid out of the commission that would otherwise be paid to Altisource as the selling broker in connection with certain real estate
sales services provided by Altisource. In February 2019, Ocwen and Altisource S.à r.l (a subsidiary of Altisource) signed a Binding
Term Sheet, which among other things, confirmed Altisource’s cooperation with the deboarding of loans from Altisource’s
REALServicing servicing system to Black Knight MSP. The Binding Term Sheet also amends certain provisions in the Services
Agreement. After certain conditions have been met and where Ocwen has the right to select the services provider, Ocwen agreed to
use Altisource to provide the types of services that Altisource currently provides under the Services Agreement for at least 90% of
services for all portfolios for which Ocwen is the servicer or subservicer, except that Altisource will be the provider for all such
services for the portfolios: (i) acquired by Ocwen pursuant to loan servicing under agreements from Homeward Residential, Inc.
(acquired in 2012) or assigned and assumed by Ocwen from Residential Capital, LLC, et al (assets acquired in 2013); and (ii)

66
acquired from Ocwen, excluding certain portfolios in which PHH has an interest, by New Residential Investment Corp. or its
affiliates prior to the date of the Binding Term Sheet.
The Binding Term Sheet also sets forth a framework for negotiating additional service level changes under the Services Agreement
in the future. As specified in the Binding Term Sheet, if Altisource fails certain performance standards for specified periods of time,
then Ocwen may terminate Altisource as a provider for the applicable service(s), subject to Altisource’s right to cure. For certain
claims arising from service referrals received by Altisource after the effective date of the Binding Term Sheet, the provisions include
reciprocal indemnification obligations in the event of negligence by either party, and Altisource’s indemnification of Ocwen in the
event of breach by Altisource of its obligations under the Services Agreement. The limitations of liability provisions include an
exception for losses either party suffers as a result of third-party claims.
For the year ended December 31, 2019, we paid expenses of $18.3 million to Altisource under our agreements with Altisource.
OTHER BUSINESS
The Board of Directors knows of no other business or nominees as of the date of printing this proxy statement other than the
proposals described above in this proxy statement that will be presented for consideration at the meeting. If any other business or
nominees should properly come before the meeting or any postponement or adjournment thereof, it is the intention of the
management proxy holders to vote in accordance with their judgment, unless otherwise restricted by law.
SUBMISSION OF SHAREHOLDER PROPOSALS FOR 2021 ANNUAL MEETING
Requirements for Proposals to be Considered for Inclusion in Proxy Materials
Any proposal which a shareholder desires to have considered for inclusion in our proxy materials relating to our 2021 Annual
Meeting of Shareholders, must be received by the Secretary of Ocwen at our principal executive offices no later than December 28,
2020 and must comply with the procedures prescribed in Rule 14a-8 under the Securities Exchange Act of 1934, as amended.
Requirements for Proposals Not Intended for Inclusion in Proxy Materials and for Nomination of Director Candidates
If a shareholder wants to present a proposal, or nominate a person for election as Director, at the 2020 Annual Meeting, we must
receive written notice of the proposal or nomination no earlier than December 28, 2020 and no later than January 27, 2021, which
notice of the proposal or nomination must meet the requirements set forth in Sections 1.1 and 2.2 of our Bylaws, respectively. Under
the circumstances described in, and upon compliance with, Rule 14a-4(c) under the Securities Exchange Act of 1934, as amended,
management proxies would be allowed to use their discretionary voting authority to vote on any matter with respect to which the
foregoing requirements have been met.
Requests to have a shareholder proposal considered for inclusion in our 2021 proxy materials and notices of intent to present a
proposal or nomination directly at the 2021 Annual Meeting should be mailed to our Secretary at Ocwen Financial Corporation,
1661 Worthington Road, Suite 100, West Palm Beach, Florida 33409. Notices should be sent by first class United States mail or by a
nationally recognized courier service. If you use the mail, we recommend that you use certified mail, return receipt requested.
ANNUAL REPORTS
A copy of our annual report on Form 10-K for the year ended December 31, 2019 was mailed on or about April 27, 2020 to
shareholders of record as of March 27, 2020. The annual report is not part of the proxy solicitation materials and can be found on
our website www.ocwen.com in the Financial Information section under the “Shareholders” tab.
We will furnish without charge to each person whose proxy is solicited and to any beneficial owner entitled to vote as of the Record
Date for the meeting, on written request, a copy of the annual report on Form 10-K for the year ended December 31, 2019 required
to be filed by us with the Securities and Exchange Commission under the Securities Exchange Act of 1934, as amended. Such
requests should be directed to our Secretary at Ocwen Financial Corporation, 1661 Worthington Road, Suite 100, West Palm Beach,
Florida 33409.

OTHER MATTERS
Proxies will be solicited on behalf of the Board of Directors by mail or electronic means, and we will pay the solicitation costs.
Copies of this proxy statement and our annual report on Form 10-K for the year ended December 31, 2019 will be supplied to
Brokers for the purpose of soliciting proxies from beneficial owners. In addition to solicitations by mail or electronic means, our
Directors, officers and employees may solicit proxies personally or by telephone without additional compensation. The shares
represented by all valid proxies received by phone, by Internet or by mail will be voted in the manner specified. Where specific
choices are not indicated, the shares represented by all valid proxies received will be voted: (i) “for all” the nominees for Director
named earlier in this proxy statement, (ii) “for” the ratification, on an advisory basis, of the appointment of Deloitte & Touche LLP
as our independent registered public accounting firm for 2020, (iii) “for” the approval, on an advisory basis, of the compensation of
our named executive officers as disclosed in this proxy statement, (iv) “for” the approval, on an advisory basis, of an amendment to
our Articles of Incorporation to implement a reverse stock split of our issued and outstanding common stock and reduce the number
of authorized shares of our common stock by the same proportion as the ratio of our reverse stock split, and (v) “for” the approval to
authorize an adjournment of the Annual Meeting to solicit additional proxies for Proposal Four. Should any matter not described
above be properly presented at the meeting, it is the intention of the management proxy holders to vote in accordance with their
judgment, unless otherwise restricted by law. As of the date of this proxy statement, management was not aware that any matters not
referred to in this proxy statement would be presented for action at the 2020 Annual Meeting. If you are interested in participating in
the virtual Annual Meeting and voting at that time, please see “Annual Meeting Participation” above for further details on
participation requirements.
We have adopted a procedure called “householding,” which the Securities and Exchange Commission has approved. Under this
procedure, shareholders of record who have the same address and last name and did not receive their proxy materials electronically
will receive only one copy of our proxy materials unless we receive contrary instructions from one or more of such shareholders.
Upon oral or written request, we will deliver promptly a separate copy of the proxy materials to a shareholder at a shared address to
which a single copy of proxy materials was delivered. If you are a shareholder of record at a shared address to which we delivered a
single copy of the proxy materials and you desire to receive a separate copy of the proxy materials for the Annual Meeting or for our
future meetings, or if you are a shareholder at a shared address to which we delivered multiple copies of the proxy materials and you
desire to receive one copy in the future, please submit your request to the Householding Department of Broadridge Financial
Solutions, Inc. at 51 Mercedes Way, Edgewood, New York 11717, or at 1-800-542-1061. If you are a beneficial shareholder, please
contact your Broker directly if you have questions, require additional copies of the proxy materials, wish to receive multiple reports
by revoking your consent to householding or wish to request single copies of the proxy materials in the future.
This proxy statement and our 2019 annual report may be viewed online at www.ocwen.com in the Financial Information section
under the “Shareholders” tab. If you are a shareholder of record, you can elect to access future annual reports and proxy statements
electronically by following the instructions provided on the proxy card. If you choose this option, you will receive a notice by mail
listing the website locations, and your choice will remain in effect until you notify us by mail that you wish to resume mail delivery
of these documents. If you hold your common stock through a Broker, refer to the information provided by that entity for
instructions on how to elect this option.
ANNEX A
Assumes a Reverse Stock Split ratio of 1-for-10 for illustrative purposes only. If approved and implemented, the actual
Reverse Stock Split ratio will be between, and including, one-for-five and one-for-25.
ARTICLES OF AMENDMENT TO
AMENDED AND RESTATED ARTICLES OF INCORPORATION
OF OCWEN FINANCIAL CORPORATION
Ocwen Financial Corporation, a Florida corporation (the “Corporation”), acting pursuant to the provisions of Sections
607.1006 and 607.10025 of the Florida Business Corporation Act, does hereby adopt the following Articles of Amendment to its
Amended and Restated Articles of Incorporation:
FIRST: The name of the Corporation is: Ocwen Financial Corporation.
SECOND: These Articles of Amendment have been adopted and approved in connection with a share division pursuant to Section
607.10025 of the Florida Business Corporation Act. The resolutions approving the division of shares were adopted and approved by
the Board of Directors of the Corporation on [ ], without shareholder action. Shareholder action was not required pursuant to
Section 607.10025(2) of the Florida Business Corporation Act.
THIRD: The amendment to the Amended and Restated Articles of Incorporation set forth below does not adversely affect the rights
or preferences of the holders of outstanding shares of the Corporation’s common stock, and the percentage of authorized shares of
the Corporation’s common stock remaining unissued after the division will not exceed the percentage of authorized shares of the
Corporation’s common stock that were unissued before the division.
FOURTH: Paragraph one (1) of Article III of the Amended and Restated Articles of Incorporation shall be deleted in its entirety and
replaced with the following:
“The total number of shares of stock of all classes and series the Company shall have authority to issue is [40,000,000] shares
consisting of (i) [20,000,000] shares of common stock, par value of $0.01 per share and (ii) 20,000,000 shares of preferred stock, par
value $0.001 with such rights, preferences and limitations as may be set from time to time by resolution of the board of directors and
the filing of Articles of Amendment as required by the Florida Business Corporation Act. Upon the filing and effectiveness (the
“Effective Time”) pursuant to the Florida Business Corporation Act of these Articles of Amendment to the Articles of Incorporation
of the Corporation, each [ten (10)] shares of Common Stock either issued and outstanding immediately prior to the Effective Time
shall, automatically and without any action on the part of the respective holders thereof, be combined and converted into one (1)
share of Common Stock (the “Reverse Stock Split”). No fractional shares shall be issued in connection with the Reverse Stock Split.
Shareholders who otherwise would be entitled to receive fractional shares of Common Stock shall be entitled to receive shares
rounded up to the nearest whole share. Each certificate that immediately prior to the Effective Time represented shares of Common
Stock (“Old Certificates”), shall from and after the Effective Time, automatically and without the necessity of presenting the same
for exchange, represent that number of shares of Common Stock into which the shares of Common Stock represented by the Old
Certificate shall have been combined, subject to the elimination of fractional share interests as described above.”
FIFTH: That these Articles of Amendment shall become effective at [time] eastern time on [date], in accordance with the applicable
provisions of the Florida Statutes.
IN WITNESS WHEREOF, the undersigned duly authorized officer of the Corporation has executed these Articles of Amendment as
of this _____ day of _____, 20__.
OCWEN FINANCIAL CORPORATION
By:______________________
Name:____________________
Title:_____________________

UNITED STATES
SECURITIES AND EXCHANGE COMMISSION Washington, D.C. 20549
FORM 10-K
ANNUAL REPORT PURSUANT TO SECTION 13 OR 15(d) OF THE SECURITIES EXCHANGE ACT OF 1934
For the fiscal year ended December 31, 2019
OR
TRANSITION REPORT PURSUANT TO SECTION 13 OR 15(d) OF THE SECURITIES EXCHANGE ACT OF 1934
For the transition period from: ____________________ to ____________________
Commission File No. 1-13219
OCWEN FINANCIAL CORPORATION (Exact name of registrant as specified in its charter)
Florida 65-0039856
(State or other jurisdiction of incorporation or organization) (I.R.S. Employer Identification No.)
1661 Worthington Road, Suite 100 West Palm Beach, Florida 33409
(Address of principal executive office) (Zip Code)
(561) 682-8000
(Registrant’s telephone number, including area code)
Securities registered pursuant to Section 12(b) of the Act:
Title of each class Trading Symbol(s) Name of each exchange on which registered
Common Stock, $0.01 Par Value OCN New York Stock Exchange (NYSE)
Securities registered pursuant to Section 12 (g) of the Act: Not applicable.
Indicate by check mark if the registrant is a well-known seasoned issuer, as defined in Rule 405 of the Securities Act. Yes No
Indicate by check mark if the registrant is not required to file reports pursuant to Section 13 or Section 15(d) of the Act. Yes No
Indicate by check mark whether the registrant (1) has filed all reports required to be filed by Section 13 or 15(d) of the Securities
Exchange Act of 1934 during the preceding 12 months (or for such shorter period that the registrant was required to file such reports),
and (2) has been subject to such filing requirements for the past 90 days. Yes No
Indicate by check mark whether the registrant has submitted electronically every Interactive Data File required to be submitted
pursuant to Rule 405 of Regulation S-T (§232.405 of this chapter) during the preceding 12 months (or for such shorter period that the
registrant was required to submit such files). Yes No
Indicate by check mark whether the registrant is a large accelerated filer, an accelerated filer, a non-accelerated filer, a smaller
reporting company, or emerging growth company. See the definitions of “large accelerated filer,” “accelerated filer,” “smaller
reporting company,” and “emerging growth company” in Rule 12b-2 of the Exchange Act:
Large Accelerated filer Accelerated filer
Non-accelerated filer Smaller reporting company
Emerging growth company
If an emerging growth company, indicate by check mark if the registrant has elected not to use the extended transition period for
complying with any new or revised financial accounting standards provided pursuant to Section 13(a) of the Exchange Act.
Indicate by check mark whether the registrant is a shell company (as defined in Rule 12b-2 of the Act) Yes No
Aggregate market value of the voting and non-voting common equity of the registrant held by nonaffiliates as of June 30, 2019:
$275,549,706
Number of shares of common stock outstanding as of February 21, 2020: 134,948,008 shares
DOCUMENTS INCORPORATED BY REFERENCE: Portions of our definitive Proxy Statement with respect to our Annual Meeting
of Shareholders, which is currently scheduled to be held on May 27, 2020, are incorporated by reference into Part III, Items 10 - 14.

1
OCWEN FINANCIAL CORPORATION
2019 FORM 10-K ANNUAL REPORT
TABLE OF CONTENTS
PAGE
PART I
Item 1. Business 4
Item 1A. Risk Factors 14
Item 1B. Unresolved Staff Comments 41
Item 2. Properties 41
Item 3. Legal Proceedings 42
Item 4. Mine Safety Disclosures 42
PART II
Item 5.
Market for Registrant’s Common Equity, Related Stockholder Matters and Issuer Purchases of Equity Securities 42
Item 6. Selected Financial Data 44
Item 7. Management’s Discussion and Analysis of Financial Condition and Results of Operations 46
Item 7A. Quantitative and Qualitative Disclosures about Market Risk 93
Item 8. Financial Statements and Supplementary Data 93
Item 9. Changes in and Disagreements with Accountants on Accounting and Financial Disclosure 93
Item 9A. Controls and Procedures 94
Item 9B. Other Information 94
PART III
Item 10. Directors, Executive Officers and Corporate Governance 94
Item 11. Executive Compensation 95
Item 12. Security Ownership of Certain Beneficial Owners and Management and Related Stockholder Matters 95
Item 13. Certain Relationships and Related Transactions, and Director Independence 95
Item 14. Principal Accounting Fees and Services 95
PART IV
Item 15. Exhibits, Financial Statement Schedules 95
Item 16. Form 10-K Summary 100
Signatures 101

2
FORWARD-LOOKING STATEMENTS
This Annual Report contains forward-looking statements within the meaning of Section 27A of the Securities Act of 1933,
as amended, and Section 21E of the Securities Exchange Act of 1934, as amended. All statements other than statements of
historical fact included in this report, including, statements regarding our financial position, business strategy and other plans
and objectives for our future operations, are forward-looking statements.
Forward-looking statements may be identified by a reference to a future period or by the use of forward-looking
terminology. Forward-looking statements are typically identified by words such as “expect”, “believe”, “foresee”, “anticipate”,
“intend”, “estimate”, “goal”, “strategy”, “plan” “target” and “project” or conditional verbs such as “will”, “may”, “should”,
“could” or “would” or the negative of these terms, although not all forward-looking statements contain these words. Forward-
looking statements by their nature address matters that are, to different degrees, uncertain. Our business has been undergoing
substantial change, which has magnified such uncertainties. Readers should bear these factors in mind when considering
forward-looking statements and should not place undue reliance on such statements. Forward-looking statements involve a
number of assumptions, risks and uncertainties that could cause actual results to differ materially from those suggested by such
statements. In the past, actual results have differed from those suggested by forward-looking statements and this may happen
again. Important factors that could cause actual results to differ include, but are not limited to, the risks discussed in “Risk
Factors” and the following:
• uncertainty related to the adequacy of our financial resources, including our sources of liquidity and ability to fund,
sell and recover advances, originate, sell and securitize forward and reverse mortgage loans, fund forward and reverse
mortgage loan buyouts, repay, renew and extend borrowings and borrow additional amounts as and when required;
• uncertainty related to our ability to execute on our cost re-engineering initiatives and take the other actions we believe
are necessary for us to improve our financial performance;
• uncertainty related to our ability to acquire mortgage servicing rights (MSRs) or other assets or businesses at adequate
risk-adjusted returns, including our ability to allocate adequate capital for such investments, negotiate and execute
purchase documentation and satisfy closing conditions so as to consummate such acquisitions;
• uncertainty related to our ability to grow our lending business and increase our lending volumes in a competitive
market and uncertain interest rate environment;
• uncertainty related to our long-term relationship and remaining agreements with New Residential Investment Corp.
(NRZ), our largest servicing client;
• our ability to execute an orderly and timely transfer of responsibilities in connection with the termination by NRZ of
our legacy PHH Mortgage Corporation (PMC) subservicing agreement;
• the reactions of regulators, lenders and other contractual counterparties, rating agencies, stockholders and other
stakeholders to the announcement of the termination of the PMC subservicing agreement;
• uncertainty related to claims, litigation, cease and desist orders and investigations brought by government agencies
and private parties regarding our servicing, foreclosure, modification, origination and other practices, including
uncertainty related to past, present or future investigations, litigation, cease and desist orders and settlements with state
regulators, the Consumer Financial Protection Bureau (CFPB), State Attorneys General, the Securities and Exchange
Commission (SEC), the Department of Justice or the Department of Housing and Urban Development (HUD) and
actions brought under the False Claims Act regarding incentive and other payments made by governmental entities;
• adverse effects on our business as a result of regulatory investigations, litigation, cease and desist orders or
settlements;
• reactions to the announcement of such investigations, litigation, cease and desist orders or settlements by key
counterparties, including lenders, the Federal National Mortgage Association (Fannie Mae), the Federal Home Loan
Mortgage Corporation (Freddie Mac) and the Government National Mortgage Association (Ginnie Mae);
• our ability to comply with the terms of our settlements with regulatory agencies and the costs of doing so;
• increased regulatory scrutiny and media attention;
• any adverse developments in existing legal proceedings or the initiation of new legal proceedings;
• our ability to effectively manage our regulatory and contractual compliance obligations;
• our ability to interpret correctly and comply with liquidity, net worth and other financial and other requirements of
regulators, Fannie Mae, Freddie Mac and Ginnie Mae, as well as those set forth in our debt and other agreements;
• our ability to comply with our servicing agreements, including our ability to comply with our agreements with, and the
requirements of, Fannie Mae, Freddie Mac and Ginnie Mae and maintain our seller/servicer and other statuses with
them;
• our servicer and credit ratings as well as other actions from various rating agencies, including the impact of prior or
future downgrades of our servicer and credit ratings;
• failure of our information technology or other security systems or breach of our privacy protections, including any
failure to protect customers’ data;

3
• uncertainty related to the ability of our technology vendors to adequately maintain and support our systems, including
our servicing systems, loan originations and financial reporting systems;
• our ability to identify and address any issues arising in connection with the transfer of loans to the Black Knight
Financial Services, Inc. (Black Knight) LoanSphere MSP® servicing system (Black Knight MSP) without incurring
significant cost or disruption to our operations;
• the loss of the services of our senior managers and key employees;
• uncertainty related to the actions of loan owners and guarantors, including mortgage-backed securities investors,
Federal National Mortgage Association (Fannie Mae) and Federal Home Loan Mortgage Corporation (Freddie Mac)
(collectively, the GSEs), Government National Mortgage Association (Ginnie Mae) and trustees regarding loan put-
backs, penalties and legal actions;
• uncertainty related to the GSEs substantially curtailing or ceasing to purchase our conforming loan originations or the
Federal Housing Administration (FHA) of the HUD or Department of Veterans Affairs (VA) ceasing to provide
insurance;
• uncertainty related to our ability to continue to collect certain expedited payment or convenience fees and potential
liability for charging such fees;
• uncertainty related to our reserves, valuations, provisions and anticipated realization of assets;
• uncertainty related to the ability of third-party obligors and financing sources to fund servicing advances on a timely
basis on loans serviced by us;
• volatility in our stock price;
• the characteristics of our servicing portfolio, including prepayment speeds along with delinquency and advance rates;
• our ability to successfully modify delinquent loans, manage foreclosures and sell foreclosed properties;
• uncertainty related to the processes for judicial and non-judicial foreclosure proceedings, including potential additional
costs or delays or moratoria in the future or claims pertaining to past practices;
• our ability to adequately manage and maintain real estate owned (REO) properties and vacant properties
collateralizing loans that we service;
• uncertainty related to legislation, regulations, regulatory agency actions, regulatory examinations, government
programs and policies, industry initiatives and evolving best servicing practices;
• our ability to realize anticipated future gains from future draws on existing loans in our reverse mortgage portfolio;
• our ability to effectively manage our exposure to interest rate changes and foreign exchange fluctuations;
• our ability to effectively transform our operations in response to changing business needs, including our ability to do
so without unanticipated adverse tax consequences;
• uncertainty regarding regulatory restrictions on our ability to repurchase our own stock and limitations under our debt
agreements on stock repurchases;
• uncertainty related to the political or economic stability of the United States and of the foreign countries in which we
have operations; and
• our ability to maintain positive relationships with our large shareholders and obtain their support for management
proposals requiring shareholder approval.
Further information on the risks specific to our business is detailed within this report, including under “Risk Factors.” Forward-
looking statements speak only as of the date they were made and we disclaim any obligation to update or revise forward-
looking statements whether because of new information, future events or otherwise.

4
PART I
ITEM 1. BUSINESS
When we use the terms “Ocwen,” “OCN,” “we,” “us” and “our,” we are referring to Ocwen Financial Corporation and
its consolidated subsidiaries.
OVERVIEW
We are a financial services company that services and originates mortgage loans. We have a strong track record of success
as a leader in the servicing industry in foreclosure prevention and loss mitigation that helps homeowners stay in their homes
and improves financial outcomes for mortgage loan investors. This long-standing core competency will continue to be a
guiding principle as we seek to grow our business and improve our financial performance.
We are headquartered in West Palm Beach, Florida with offices in the U.S. (West Palm Beach, FL, Mount Laurel, NJ,
Rancho Cordova, CA), in the United States Virgin Islands (St. Croix)), and operations in India and the Philippines. At
December 31, 2019, approximately 72% of our workforce is located outside the U.S. Ocwen Financial Corporation is a Florida
corporation organized in February 1988. With our predecessors, we have been servicing residential mortgage loans since 1988.
In late 2018 and throughout 2019, we successfully completed our acquisition and integration of PHH Corporation (PHH). We
have been originating forward mortgage loans since 2012 and reverse mortgage loans since 2013. We currently provide
solutions through our primary operating, wholly-owned subsidiaries, PHH Mortgage Corporation (PMC) and Liberty Home
Equity Solutions, Inc. (Liberty).
Our priority is to return to sustainable profitability in the shortest timeframe possible within an appropriate risk and
compliance environment. To do so, we believe we must execute on the following key initiatives. First, we must manage the size
of our servicing portfolio through expanding our lending business and acquisitions of mortgage servicing rights (MSRs) that
are prudent and well-executed with appropriate financial return targets. Second, we must re-engineer our cost structure to go
beyond eliminating redundant costs through the integration process and establish continuous cost improvement as a core
strength. Our continuous cost improvement efforts are focused on leveraging our single servicing platform and technology,
optimizing strategic sourcing and off-shore utilization, lean process design, automation and other technology-enabled
productivity enhancements. Third, we must manage our balance sheet to ensure adequate liquidity and provide a solid platform
for financing our ongoing business needs and executing on our other key business initiatives. Finally, we must fulfill our
regulatory commitments and resolve our remaining legal and regulatory matters on satisfactory terms.
BUSINESS MODEL AND SEGMENTS
Ocwen’s business model is designed to optimize our value creation for our primary stakeholders, improve our returns and
effectively allocate our resources. Over the past twelve months, in addition to our PHH integration efforts, we have continued
to adjust and transform our business model to generate growth through diversification and drive operational efficiencies. Our
core competencies revolve around our servicing business and we aggressively pursue growth of our servicing portfolio through
origination and acquisitions of servicing volume from multiple sources.
Our servicing portfolio is comprised of three components with different economics - our owned MSRs, our subservicing
portfolio, and the NRZ servicing portfolio. We invest our capital to fund acquisitions and originations of our owned MSRs and
servicing advances, for which we establish a targeted return on investment. Our net return includes servicing revenue net of
servicing costs, less MSR portfolio runoff and other fair value changes, and less our MSR and advance funding cost. Our
subservicing portfolio generates a relatively more stable source of revenue with lower subservicing fees but without any
significant capital utilization and funding of advances. Our NRZ servicing portfolio has effectively been a subservicing
relationship - See New Residential Investment Corp. Relationship. We target a balanced mix of our portfolio between servicing
and subservicing. Our servicing operations and customer interactions do not differentiate whether loans are serviced or
subserviced.
Our growth strategy is built on our relationships with borrowers, lenders and other market participants. We develop these
relationships to grow our existing owned MSR portfolio, or develop new subservicing arrangements. We acquire MSRs through
bulk portfolio purchases in the open market or through flow purchase agreements with our network of mortgage companies and
financial institutions, or through participation in the Agency co-issue programs. In order to diversify our sources of servicing
and reduce our reliance on others, we have been developing our origination of MSRs through different channels, including our
portfolio recapture channel, retail, wholesale and correspondent lending. In 2019, bulk acquisitions represented the largest
volume of MSR additions.

5
The chart below presents our current business model:
We report our activities in three segments, with Servicing and Lending being our primary segments. Our other business
activities that are currently individually insignificant are included in the Corporate Items and Other segment. Our business
segments reflect the internal reporting that we use to evaluate operating performance of services and to assess the allocation of
our resources. The historical financial information of our segments is presented in our financial statements in Note 23 —
Business Segment Reporting and discussed in the individual business operations sections of Management’s Discussion and
Analysis of Financial Condition and Results of Operations.
Servicing
Our Servicing business is primarily comprised of our core residential mortgage servicing business that currently accounts
for most of our total revenues, and we also have a small commercial mortgage servicing business. Our servicing clients include
some of the largest financial institutions in the U.S., including the GSEs, Ginnie Mae, NRZ and non-Agency residential
mortgage-backed securities (RMBS) trusts. As of December 31, 2019, our residential servicing portfolio consisted of 1,419,943
loans with an unpaid principal balance (UPB) of $212.4 billion.
Servicing involves the collection of principal and interest payments from borrowers, the administration of tax and
insurance escrow accounts, the collection of insurance claims, the management of loans that are delinquent or in foreclosure or
bankruptcy, including making servicing advances, evaluating loans for modification and other loss mitigation activities and, if
necessary, foreclosure referrals and the sale of the underlying mortgaged property following foreclosure (REO) on behalf of
mortgage loan investors or other servicers. Master servicing involves the collection of payments from servicers and the
distribution of funds to investors in mortgage and asset-backed securities and whole loan packages. We earn contractual
monthly servicing fees (which are typically payable as a percentage of UPB) pursuant to servicing agreements as well as other
ancillary fees relating to our servicing activities such as late fees and, in certain circumstances, REO referral commissions.
We own MSRs outright, where we typically receive all the servicing economics, and we subservice on behalf of other
institutions that own the MSRs or Rights to MSRs, in which case we typically earn a smaller fee for performing the
subservicing activities. Special servicing is a form of subservicing where we generally manage only delinquent loans on behalf
of a loan owner. We typically earn subservicing and special servicing fees either as a percentage of UPB or on a per loan basis.
Servicing advances are an important component of our business and are amounts that we, as servicer, are required to
advance to, or on behalf of, our servicing clients if we do not receive such amounts from borrowers. These amounts include
principal and interest payments, property taxes and insurance premiums and amounts to maintain, repair and market real estate
properties on behalf of our servicing clients. Most of our advances have the highest reimbursement priority such that we are
entitled to repayment of the advances from the loan or property liquidation proceeds before most other claims on these
proceeds. The costs incurred in meeting advancing obligations consist principally of the interest expense incurred in financing

6
the advance receivables and the costs of arranging such financing. Under subservicing agreements, Ocwen is promptly
reimbursed by the owners of the MSRs who generally finance the advances and incur the associated financing cost.
Reducing delinquencies is important to our business because it enables us to recover advances and recognize additional
ancillary income, such as late fees, which we do not recognize on delinquent loans until they are brought current. Performing
loans also require less work and thus are generally less costly to service. While increasing borrower participation in loan
modification programs is a critical component of our ability to reduce delinquencies, borrower compliance with those
modifications is also an important factor.
We report our MSR purchases through flow, agency co-issue programs, and bulk sources in our Servicing segment. We
initially recognize our MSR origination with the associated gain in our Lending business, and subsequently transfer the MSR to
our Servicing segment. Our Servicing segment reflects all subsequent performance associated with the MSR, including funding
cost, run-off and other fair value changes.
Our servicing portfolio naturally decreases over time as homeowners make regularly scheduled mortgage payments,
prepay loans prior to maturity, refinance with a mortgage loan not serviced by us or involuntarily liquidate through foreclosure
or other liquidation process. In addition, existing clients may determine to terminate their servicing and subservicing
arrangements with us and transfer the servicing to others. Therefore, our ability to grow the size of our servicing portfolio
depends on our ability to acquire the right to service or subservice additional mortgage loans at a rate that exceeds portfolio
runoff and any client terminations. We are focused on profitably replenishing and growing our servicing and subservicing
portfolios through a variety of sources, including our lending business channels (retail/recapture, wholesale and correspondent),
forward flow MSR arrangements with certain business partners, GSE cash window programs, additional subservicing business
arrangements, and bulk MSR acquisitions.
Lending
In 2019, our Lending business originated or purchased forward and reverse mortgage loans with a UPB of $1.2 billion and
$729.4 million, respectively. These loans were acquired through three primary channels: directly with mortgage customers
(retail), through correspondent lender relationships (correspondent) and through broker relationships (wholesale). Per-loan
margins vary by channel, with correspondent typically being the lowest margin and retail the highest. We exited the forward
lending correspondent and wholesale channels in 2017 for strategic purposes, and re-entered the correspondent channel in the
second quarter of 2019. Our forward lending business is also focused on portfolio recapture (i.e., refinancing loans in our
servicing portfolio).
Our forward mortgage loans are conventional (conforming to the underwriting standards of the GSEs, collectively Agency
loans) and government-insured (insured by the FHA or VA). After origination, we generally package and sell the loans in the
secondary mortgage market, through GSE and Ginnie Mae guaranteed securitizations and whole loan transactions. We typically
retain the associated MSRs on securitizations, providing the Servicing business with a source of new MSRs to replenish our
servicing portfolio and partially offset the impact of loan amortization and prepayments, i.e., portfolio runoff. Whole loan
transactions are generally completed on a servicing released basis.
We also originate and purchase Home Equity Conversion Mortgages (HECM or reverse mortgage loans) through our
Liberty Home Equity Solutions, Inc. (Liberty) operations. Loans originated under this program are generally guaranteed by the
FHA, which provides investors with protection against risk of borrower default. The reverse mortgage business generates
revenue from new originations and subsequent tail draws, scheduled and unscheduled, taken by the borrower. In the second half
of 2019, we launched our non-FHA guaranteed jumbo proprietary product, EquityIQ, for borrowers in high property value
areas that exceed FHA limits.
Retail Lending. We originate forward and reverse mortgage loans directly with borrowers through our retail lending
business. Our forward lending business benefits from our servicing portfolio by offering refinance options to qualified
borrowers seeking to lower their mortgage payments. Depending on borrower eligibility, we refinance eligible customers into
conforming or government-insured products. We also are increasing our ability to originate retail loans to non-Ocwen servicing
customers through various marketing channels. Through lead campaigns and direct marketing, the retail channel seeks to
convert leads into loans in a cost-efficient manner. We are focused on increasing recapture rates on our existing servicing
portfolio to grow this business.
Correspondent Lending. Our correspondent lending operation purchases mortgage loans that have been originated by a
network of approved third-party lenders. We re-entered the forward correspondent lending channel in the second quarter of
2019.
All the lenders participating in our correspondent lending program are approved by senior management members of our
lending and compliance teams. We also employ an ongoing monitoring and renewal process for participating lenders that
includes an evaluation of the performance of the loans they have sold to us. We perform a variety of pre- and post-funding

7
review procedures to ensure that the loans we purchase conform to our requirements and to the requirements of the investors to
whom we sell loans.
Wholesale Lending. We originate reverse mortgage loans through a network of approved brokers. Brokers are subject to a
formal approval and monitoring process. We underwrite all loans originated through this channel consistent with the
underwriting standards required by the ultimate investor prior to funding.
We provide customary origination representations and warranties to investors in connection with our loan sales and
securitization activities. We receive customary origination representations and warranties from our network of approved
originators relating to loans we purchase through our correspondent lending channel. In the event we cannot remedy a breach
of a representation or warranty, we may be required to repurchase the loan or provide an indemnification payment to the
investor. To the extent that we have recourse against a third-party originator, we may recover part or all of any loss we incur.
REGULATION
Our business is subject to extensive oversight and regulation by federal, state and local governmental authorities, including
the CFPB, HUD and various state agencies that license and conduct examinations of our loan servicing, origination and
collection activities. In addition, we operate under a number of regulatory settlements that subject us to ongoing reporting and
other obligations. From time to time, we also receive requests (including requests in the form of subpoenas and civil
investigative demands) from federal, state and local agencies for records, documents and information relating to the policies,
procedures and practices of our loan servicing, origination and collection activities. The GSEs and their conservator, the
Federal Housing Finance Authority (FHFA), Ginnie Mae, the United States Treasury Department, various investors, non-
Agency securitization trustees and others also subject us to periodic reviews and audits.
In the current regulatory environment, we have faced and expect to continue to face heightened regulatory and public
scrutiny as an organization as well as stricter and more comprehensive regulation of the entire mortgage sector. We continue to
work diligently to assess and understand the implications of the regulatory environment in which we operate and to meet the
requirements of this constantly changing environment. We devote substantial resources to regulatory compliance, while, at the
same time, striving to meet the needs and expectations of our customers, clients and other stakeholders. Our actual or alleged
failure to comply with applicable federal, state and local laws, regulations and licensing requirements could lead to any of the
following:
• loss of our licenses and approvals to engage in our servicing and lending businesses;
• governmental investigations and enforcement actions;
• administrative fines and penalties and litigation;
• civil and criminal liability, including class action lawsuits and actions to recover incentive and other payments made
by governmental entities;
• breaches of covenants and representations under our servicing, debt or other agreements;
• damage to our reputation;
• inability to raise capital or otherwise secure the necessary financing to operate the business;
• changes to our operations that may otherwise not occur in the normal course, and that could cause us to incur
significant costs; or
• inability to execute on our business strategy.
We must comply with a large number of federal, state and local consumer protection laws including, among others, the
Dodd-Frank Wall Street Reform and Consumer Protection Act (the Dodd-Frank Act), the Gramm-Leach-Bliley Act, the Fair
Debt Collection Practices Act, the Real Estate Settlement Procedures Act (RESPA), the Truth in Lending Act (TILA), the Fair
Credit Reporting Act, the Servicemembers Civil Relief Act, the Homeowners Protection Act, the Federal Trade Commission
Act, the Telephone Consumer Protection Act, the Equal Credit Opportunity Act, as well as individual state laws pertaining to
licensing, general mortgage origination and servicing practices and foreclosure, and federal and local bankruptcy rules. These
statutes apply to many facets of our business, including loan origination, default servicing and collections, use of credit reports,
safeguarding of non-public personally identifiable information about our customers, foreclosure and claims handling,
investment of and interest payments on escrow balances and escrow payment features, and mandate certain disclosures and
notices to borrowers. These requirements can and do change as statutes and regulations are enacted, promulgated, amended,
interpreted and enforced.
In recent years, the general trend among federal, state and local lawmakers and regulators has been toward increasing laws,
regulations and investigative proceedings with regard to residential mortgage lenders and servicers. The CFPB continues to
take a very active role in the mortgage industry, and its rule-making and regulatory agenda relating to loan servicing and
origination continues to evolve. Individual states have also been active, as have other regulatory organizations such as the
Multistate Mortgage Committee (MMC), a multistate coalition of various mortgage banking regulators. We also believe there
has been a shift among certain regulators towards a broader view of the scope of regulatory oversight responsibilities with
respect to mortgage lenders and servicers. In addition to their traditional focus on licensing and examination matters, certain

8
regulators have begun to make observations, recommendations or demands with respect to areas such as corporate governance,
safety and soundness and risk and compliance management.
The CFPB and state regulators have also focused on the use and adequacy of technology in the mortgage servicing
industry, privacy concerns and other topical issues, such as likely discontinuation of the London Interbank Offered Rate
(LIBOR). In 2016, the CFPB issued a special edition supervision report that stressed the need for mortgage servicers to assess
and make necessary improvements to their information technology systems to ensure compliance with the CFPB’s mortgage
servicing requirements. The NY DFS also issued Cybersecurity Requirements for Financial Services Companies, which took
effect in 2017, and which required banks, insurance companies, and other financial services institutions regulated by the NY
DFS to establish and maintain a cybersecurity program designed to protect consumers and ensure the safety and soundness of
New York State’s financial services industry. Likewise, the NY DFS has directed New York-regulated depository and non-
depository institutions, insurers and pension funds to submit their plans for managing the risks relating to the likely
discontinuation of LIBOR. Similarly, the California Consumer Privacy Act, which was enacted in 2018 and became effective
on January 1, 2020, created new consumer rights relating to the access to, deletion of, and sharing of personal information.
New regulatory and legislative measures, or changes in enforcement practices, including those related to the technology we
use, could, either individually or in the aggregate, require significant changes to our business practices, impose additional costs
on us, limit our product offerings, limit our ability to efficiently pursue business opportunities, negatively impact asset values
or reduce our revenues.
Our licensed entities are required to renew their licenses, typically on an annual basis, and to do so they must satisfy the
license renewal requirements of each jurisdiction, which generally include financial requirements such as providing audited
financial statements or satisfying minimum net worth requirements and non-financial requirements such as satisfactorily
completing examinations as to the licensee’s compliance with applicable laws and regulations. The minimum net worth
requirements to which our licensed entities are subject are unique to each state and type of license. Failure to satisfy any of the
requirements to which our licensed entities are subject could result in a variety of regulatory actions ranging from a fine, a
directive requiring a certain step to be taken, a suspension or ultimately a revocation of a license, any of which could have a
material adverse impact on our results of operations and financial condition. In addition, we receive information requests and
other inquiries, both formal and informal in nature, from our state regulators as part of their general regulatory oversight of our
servicing and lending businesses. We also engage with state attorneys general and the CFPB and, on occasion, we engage with
other federal agencies, including the Department of Justice and various inspectors general on various matters, including
responding to information requests and other inquiries. Many of our regulatory engagements arise from a complaint that the
entity is investigating, although some are formal investigations or proceedings. The GSEs and their conservator, FHFA, HUD,
FHA, VA, Ginnie Mae, the United States Treasury Department, and others also subject us to periodic reviews and audits. We
have in the past resolved, and may in the future resolve, matters via consent orders or payment of monetary amounts to settle
issues identified in connection with examinations or regulatory or other oversight activities, and such resolutions could have
material and adverse effects on our business, reputation, operations, results of operations and financial condition.
In recent years, we have been subject to significant state and federal regulatory actions against us, including the following:
• We are currently in litigation with the CFPB after the CFPB filed a lawsuit in the federal district court for the Southern
District of Florida against Ocwen, Ocwen Mortgage Servicing, Inc. (OMS) and Ocwen Loan Servicing, LLC (OLS)
alleging violations of federal consumer financial laws relating to our servicing business
• We are currently in litigation with the Florida Attorney General and the Florida Office of Financial Regulation after
they filed a lawsuit in the federal district court for the Southern District of Florida against Ocwen, OMS and OLS
alleging violations of federal and state consumer financial laws relating to our servicing business
• We have settled state regulatory actions against us by 29 states and the District of Columbia after these states and the
District of Columbia alleged deficiencies in our compliance with laws and regulations relating to our servicing and
lending activities
• We have entered into regulatory settlements with the New York Department of Financial Services (NY DFS) and the
California Department of Business Oversight (CA DBO) relating to our servicing practices and other aspects of our
business
• We have entered into a settlement agreement with the MMC and consent orders with certain state attorneys general to
resolve and close out findings of an MMC examination of PMC’s legacy mortgage servicing practices
We have incurred, and will continue to incur significant costs to comply with the terms of the settlements into which we
have entered. In addition, the restrictions imposed under these settlements have significantly impacted how we run our
business and will continue to do so. If we fail to comply with the terms of our settlements, additional legal or other actions
could be taken against us. Such actions could have a materially adverse impact on our business, reputation, financial condition,
liquidity and results of operations.

9
We continue to be subject to a number of ongoing federal and state regulatory examinations, consent orders, inquiries,
subpoenas, civil investigative demands, requests for information and other actions, which could result in further adverse
regulatory action against us.
To the extent that an examination, audit or other regulatory engagement identifies an alleged failure by us to comply with
applicable laws, regulations or licensing requirements, or if allegations are made that we have failed to comply with applicable
laws, regulations or licensing requirements or the commitments we have made in connection with our regulatory settlements
(whether such allegations are made through administrative actions such as cease and desist orders, through legal proceedings or
otherwise) or if other regulatory actions of a similar or different nature are taken in the future against us, this could lead to (i)
administrative fines and penalties and litigation, (ii) loss of our licenses and approvals to engage in our servicing and lending
businesses, (iii) governmental investigations and enforcement actions, (iv) civil and criminal liability, including class action
lawsuits and actions to recover incentive and other payments made by governmental entities, (v) breaches of covenants and
representations under our servicing, debt or other agreements, (vi) damage to our reputation, (vii) inability to raise capital or
otherwise fund our operations, (viii) changes to our operations that may otherwise not occur in the normal course, and that
could cause us to incur significant costs or (ix) inability to execute on our business strategy. Any of these occurrences could
increase our operating expenses and reduce our revenues, hamper our ability to grow or otherwise materially and adversely
affect our business, reputation, financial condition, liquidity and results of operations.
Finally, there are a number of foreign laws and regulations that are applicable to our operations outside of the U.S.,
including laws and regulations that govern licensing, employment, safety, taxes and insurance and laws and regulations that
govern the creation, continuation and the winding up of companies as well as the relationships between shareholders, our
corporate entities, the public and the government in these countries. Non-compliance with these laws and regulations could
result in adverse actions against us, including (i) restrictions on our operations in these counties, (ii) fines, penalties or
sanctions or (iii) reputational damage.
COMPETITION
The financial services markets in which we operate are highly competitive. We compete with large and small financial
services companies, including bank and non-bank entities, in the servicing and lending markets. Our competitors include large
banks, such as Wells Fargo, JPMorgan Chase, Bank of America and Citibank, large non-bank servicers such as Mr. Cooper and
PennyMac Loan Services, market disruptors such as Quicken Loans, SunTrust Mortgage and Regions Mortgage who are
aggressively investing in the digital transformation of their business platforms, and real estate investment trusts, including New
Residential Investment Corp.
In the servicing industry, we compete based on price, quality and risk appetite. Potential counterparties also (1) assess our
regulatory compliance track record and examine our systems and processes for maintaining and demonstrating regulatory
compliance, (2) consider our customer satisfaction rankings, and (3) consider our third-party servicer ratings. Certain of our
competitors, especially large banks, may have substantially lower costs of capital and greater financial resources, which makes
it challenging to compete. We believe that our competitive strengths flow from our ability to control and drive down
delinquencies using proprietary processes, our lower cost to service non-performing loans and our deep know-how as a long-
time operator of servicing loans. Notwithstanding these strengths, we have suffered reputational damage as a result of our
regulatory settlements and the associated scrutiny of our business. We believe this has weakened our competitive position
against both our bank and non-bank servicing competitors.
In the lending industry, we face intense competition in most areas, including product offerings, rates, fees and customer
service. Some of our competitors, including the larger banks, have substantially lower costs of capital and strong retail
presence, which makes it challenging to compete. In addition, with the proliferation of smartphones and technological changes
enabling improved payment systems and cheaper data storage, newer market participants, often called “disruptors,” are
reinventing aspects of the financial industry and capturing profit pools previously enjoyed by existing market participants. As a
result, the lending industry could become even more competitive if new market participants are successful in capturing market
share from existing market participants such as ourselves. We believe our competitive strengths flow from our existing
customer relationships and from our focus on providing strong customer service.
The reverse lending market faces many of the same competitive pressures as the forward market. In addition, the reverse
market is significantly smaller than the forward market with a higher market share concentration among the top five Ginnie
Mae HMBS issuers. These higher concentration levels can, at times, lead to significant price competition. We believe our
competitive advantage flows from Liberty’s long tenure in the industry (Liberty began operations in 2004), which provides us
with significant experience and contributes to our name recognition, our strategic partnerships and our use of technology to
produce higher levels of productivity to drive down per-loan costs.

10
THIRD-PARTY SERVICER RATINGS
Like other servicers, we are the subject of mortgage servicer ratings or rankings (collectively, ratings) issued and revised
from time to time by rating agencies including Moody’s Investors Service, Inc. (Moody’s), S&P Global Ratings, Inc. (S&P)
and Fitch Ratings, Inc. (Fitch). Favorable ratings from these agencies are important to the conduct of our loan servicing and
lending businesses.
The following table summarizes our key servicer ratings:
PHH Mortgage Corporation
Moody’s S&P Fitch
Residential Prime Servicer SQ3 Average RPS3
Residential Subprime Servicer SQ3 Average RPS3
Residential Special Servicer SQ3 Average RSS3
Residential Second/Subordinate Lien Servicer SQ3 Average RPS3
Residential Home Equity Servicer — — RPS3
Residential Alt-A Servicer — — RPS3
Master Servicer SQ3 Average RMS3
Ratings Outlook N/A Stable Stable
Date of last action August 29,
2019 December 27,
2019 December 19,
2019
Following the merger of OLS into PMC on June 1, 2019, Ocwen submitted requests to withdraw the servicer ratings for
OLS. S&P and Moody’s have transferred the Master Servicer rating for OLS to PMC, and Fitch assigned the Master Servicer
rating on December 19, 2019.
In addition to servicer ratings, each of the agencies will from time to time assign an outlook (or a ratings watch such as
Moody’s review status) to the rating status of a mortgage servicer. A negative outlook is generally used to indicate that a rating
“may be lowered,” while a positive outlook is generally used to indicate a rating “may be raised.” There have been no new
outlooks released for PMC regarding our servicer ratings.
Downgrades in servicer ratings could adversely affect our ability to service loans, sell or finance servicing advances and
could impair our ability to consummate future servicing transactions or adversely affect our dealings with lenders, other
contractual counterparties, and regulators, including our ability to maintain our status as an approved servicer by Fannie Mae
and Freddie Mac. The servicer rating requirements of Fannie Mae do not necessarily require or imply immediate action, as
Fannie Mae has discretion with respect to whether we are in compliance with their requirements and what actions it deems
appropriate under the circumstances if we fall below their desired servicer ratings.
See Item 1A. Risk Factors - Risks Relating to Our Business for further discussion of the adverse effects that a failure to
maintain minimum servicer ratings could have on our business, financing activities, financial condition or results of operations.
NEW RESIDENTIAL INVESTMENT CORP. RELATIONSHIP
Ocwen has a legacy relationship with NRZ and we acquired PMC’s legacy relationship with NRZ when we acquired PHH
in October 2018. As a result, we service loans on behalf of NRZ under various agreements, including traditional subservicing
agreements, where NRZ is the legal owner of the MSRs, and in connection with Rights to MSRs, where Ocwen retains legal
title to the underlying MSRs but NRZ has generally assumed risks and rewards consistent with an MSR owner. As of
December 31, 2019, we serviced loans with a UPB of $58.1 billion under legacy Ocwen subservicing agreements, loans with a
UPB of $18.5 billion under legacy Ocwen Rights to MSRs agreements and loans with a UPB of $42.1 billion under a legacy
PMC subservicing agreement. See Note 10 — Rights to MSRs and Note 25 — Commitments, NRZ Relationship.
NRZ is our largest servicing client, accounting for 56% of the UPB of our servicing portfolio as of December 31, 2019 and
approximately 74% of all delinquent loans that Ocwen serviced. During 2019, NRZ-related servicing fees retained by Ocwen
represented approximately 36% of the total servicing and subservicing fees earned by Ocwen, net of servicing fees remitted to
NRZ (excluding ancillary income). We also benefit from the amortization of $334.2 million in upfront lump-sum cash
payments that we received from NRZ in 2017 and 2018 when we renegotiated certain aspects of the legacy Ocwen agreements.
These lump-sum cash payments were deferred and are recorded within Other income (expense) within our financial statements
as they amortize through the remaining term of the original agreements (April 2020). As a result, through April 2020, we expect
to recognize income of $35.4 million due to the amortization of these lump sum payments.
11
During 2019, we completed an assessment of the cost-to-service and the profitability of the NRZ servicing portfolio.
Based on this analysis, in the fourth quarter of 2019, we estimated that operating expenses, including direct servicing expenses
and overhead allocation, exceeded the net revenue retained for the NRZ servicing portfolio by approximately $10.0 million. As
with all estimates, this estimate required the exercise of judgment, including with respect to overhead allocations, and it
excludes the benefits of the lump-sum payment amortization. The estimated loss for these subservicing agreements is partially
driven by the declining revenue as the loan portfolio amortizes down without a corresponding reduction to our servicing cost
over time. As performing loans in the NRZ servicing portfolio have run-off, delinquencies have remained high, resulting in a
relatively elevated average cost per loan. Because the NRZ portfolio contains a high percentage of delinquent accounts, it has
an inherently high level of potential operational and compliance risk and requires a disproportionately high level of operating
staff, oversight support infrastructure and overhead which drives the elevated average cost per loan. We actively pursue cost re-
engineering initiatives to continue to reduce our cost-to-service and our corporate overhead, as well as pursue actions to grow
our non-NRZ servicing portfolio to offset the losses on the NRZ sub servicing.
On February 20, 2020, we received a notice of termination from NRZ with respect to the legacy PMC subservicing
agreement. This termination is for convenience (and not for cause). The notice states that the effective date of termination is
June 19, 2020 for 25% of the loans under the agreement (not including loans constituting approximately $6.6 billion in UPB
that were added by NRZ under the agreement in 2019) and August 18, 2020 for the remainder of the loans under the agreement.
The actual servicing transfer date(s) will be determined through discussions with NRZ and other stakeholders such as GSEs. In
connection with the termination, we estimate that we will receive loan deboarding fees of approximately $6.1 million from
NRZ. The portfolio subject to termination accounted for $42.1 billion in UPB, or 20% of our total serviced UPB as of
December 31, 2019. Under this agreement, in the fourth quarter of 2019, we estimate that operating expenses, including direct
expenses and overhead allocation, exceeded the net revenue retained for this portion of the NRZ servicing portfolio by
approximately $3.0 million. At this stage, we do not anticipate significant operational impacts on our servicing business as a
result of this termination. The terminated servicing is comprised of Agency loans with relatively low delinquencies that do not
pose a high level of operating and compliance risk or require substantial direct and oversight staffing relative to our non-
Agency servicing. Nonetheless, we intend to right-size and reduce expenses in our servicing business and the related corporate
support functions to the extent possible to align with our smaller portfolio.
We currently anticipate that the loan deboarding fees from NRZ will offset a significant portion of our transition and
restructuring costs assuming an orderly and timely transfer. However, it is possible that the loan deboarding and other
transition activities that we will undertake as a result of the termination may not occur in an orderly or timely manner, which
could be disruptive and could result in us incurring additional costs or even in disagreements with NRZ relating to our
respective rights and obligations. Overall, our current view is that if we can exclude the legacy PMC NRZ servicing portfolio
and successfully execute on the necessary transition and expense reduction actions in an orderly and timely manner, we will be
able to enhance the long-term financial performance of our servicing business.
The legacy Ocwen agreements have an initial term ending in July 2022 and the underlying loans are almost exclusively
non-Agency loans. As a result, the servicing of these loans involves a higher level of operational and regulatory risk and
requires substantial direct and oversight staffing relative to Agency loans. NRZ may terminate the agreements for convenience,
subject to Ocwen’s right to receive a termination fee and 180 days’ notice at any time during the initial term. The termination
fee is calculated as specified in the Ocwen agreements, and is a discounted percentage of the expected revenues that would be
owed to Ocwen over the remaining contract term based on certain portfolio run off assumptions. After the initial term, these
agreements can be renewed for three-month terms at NRZ’s option. In addition to a base servicing fee, we receive ancillary
income, which primarily includes late fees, loan modification fees and Speedpay® fees. We may also receive certain incentive
fees or pay penalties tied to various contractual performance metrics. NRZ receives all float earnings and deferred servicing
fees related to delinquent borrower payments, as well as certain REO-related income, including REO referral commissions. As
legal MSR owner, or in compliance with the Rights to MSRs agreements, NRZ is responsible for financing all servicing
advance obligations in connection with the loans underlying the MSRs.
PMC and NRZ are parties to an MSR sale agreement pursuant to which $2.7 billion in UPB of MSRs and the related
advances remain to be sold to NRZ as of December 31, 2019. These MSRs and the related advances have not been sold because
required third-party consents have not been obtained. Ocwen and NRZ are in discussions regarding the disposition of these
remaining assets.
In the ordinary course, we regularly share information with NRZ and discuss various aspects of our relationship. At times,
we discuss modifications to our relationship that we believe could be to our mutual benefit as our respective businesses evolve
over time. We also discuss alternatives to the outcomes contemplated under our agreements when they were originally executed
as facts and circumstances change over time. Examples of these discussions include our discussions with respect to the $18.5
billion in UPB of Rights to MSRs and our discussions with respect to the $2.7 billion in UPB of MSRs and the related
advances that remain to be sold to NRZ under the legacy PMC sale agreement referenced above. With respect to the Rights to
MSRs, we are discussing various alternative arrangements, including those contemplated under our existing agreements which

12
provide, among other scenarios, that the Rights to MSRs could (i) remain in the existing Rights to MSR structure, (ii) be
acquired by Ocwen or (iii) be sold or transferred to a third party together with Ocwen’s title to the related MSRs. As part of
these discussions, we have discussed several potential changes to existing contracts. It is also possible that NRZ could exercise
its rights to terminate for convenience some or all of the legacy Ocwen servicing agreements. In our business planning efforts,
we have analyzed the potential impact of such an action by NRZ in light of the current and predicted future economics of the
NRZ relationship generally. Because of the large percentage of our servicing business that is represented by agreements with
NRZ, if NRZ exercised all or a significant portion of these termination rights, we would need to substantially restructure many
aspects of our servicing business as well as the related corporate support functions to address our smaller servicing portfolio.
This would likely be a complex and expensive undertaking. However, we would also receive termination fees that we would
expect to offset a significant portion of our transition and restructuring costs. Overall, we believe that if we were to exclude our
NRZ servicing portfolio and successfully execute on the necessary transition and restructuring actions, we would be able to
enhance the long-term financial performance and reduce the client concentration and operating risk profile of our servicing
business.
ALTISOURCE VENDOR RELATIONSHIP
Ocwen is a party to a number of long-term agreements with Altisource S.à r.l., and certain of other subsidiaries of
Altisource Portfolio Solutions, S.A. (Altisource), including a Services Agreement, under which Altisource provides various
services, such as property valuation services, property preservation and inspection services and title services, among other
things. This agreement expires August 31, 2025 and includes renewal provisions. Ocwen and Altisource have also entered into
a Master Services Agreement pursuant to which Altisource currently provides title services to Liberty. Ocwen also has a
General Referral Fee Agreement with Altisource pursuant to which Ocwen receives referral fees which are paid out of the
commission that would otherwise be paid to Altisource as the selling broker in connection with real estate sales services
provided by Altisource. However, for MSRs that transferred to NRZ, as well as those subject to our Rights to MSRs
agreements with NRZ, we are not entitled to REO referral commissions.
In February 2019, Ocwen and Altisource signed a Binding Term Sheet, which among other things, confirmed Altisource’s
cooperation with the deboarding of loans from Altisource’s REALServicing servicing system to Black Knight MSP. The
Binding Term Sheet also amends certain provisions in the Services Agreement. After certain conditions have been met and
where Ocwen has the right to select the services provider, Ocwen agreed to use Altisource to provide the types of services that
Altisource currently provides under the Services Agreement for at least 90% of services for all portfolios for which Ocwen is
the servicer or subservicer, except that Altisource will be the provider for all such services for the portfolios: (i) acquired by
Ocwen pursuant to loan servicing under agreements from Homeward (acquired in 2012) or assigned and assumed by Ocwen
from Residential Capital, LLC, et al (assets acquired in 2013); and (ii) acquired from Ocwen, excluding certain portfolios in
which PHH has an interest, by NRZ or its affiliates prior to the date of the Binding Term Sheet. The Binding Term Sheet also
sets forth a framework for negotiating additional service level changes under the Services Agreement in the future. As specified
in the Binding Term Sheet, if Altisource fails certain performance standards for specified periods of time, then Ocwen may
terminate Altisource as a provider for the applicable service(s), subject to Altisource’s right to cure. For certain claims arising
from service referrals received by Altisource after the effective date of the Binding Term Sheet, the provisions include
reciprocal indemnification obligations in the event of negligence by either party, and Altisource’s indemnification of Ocwen in
the event of breach by Altisource of its obligations under the Services Agreement. The limitations of liability provisions include
an exception for losses either party suffers as a result of third-party claims.
Certain services provided by Altisource under these agreements are charged to the borrower and/or mortgage loan investor.
Accordingly, such services, while derived from our loan servicing portfolio, are not reported as expenses by Ocwen. These
services include residential property valuation, residential property preservation and inspection services, title services and real
estate sales-related services.
USVI OPERATIONS
The majority of our USVI operations and assets were transferred to the U.S. during 2019 as a result of our legal entity
simplification.
In 2012, as part of an initiative to reorganize the ownership and management of our global servicing assets and operations
under a single entity and cost-effectively expand our U.S.- based origination and servicing activities, Ocwen formed OMS
under the laws of the USVI where OMS was incorporated and had its principal place of business. OMS was headquartered in
Christiansted, St. Croix, USVI and was located in a federally recognized economic development zone where qualified entities
are eligible for certain tax benefits. We refer to these benefits as “EDC Benefits” as they are granted by the USVI Economic
Development Commission (EDC). We were approved as a Category IIA service business, and are therefore entitled to receive
significant benefits that may have a favorable impact on our effective tax rate. These benefits, among others, enabled us to avail
ourselves of a credit of 90% of income taxes on certain qualified income related to our servicing business. The exemption was
granted as of October 1, 2012 and is available for a period of 30 years until expiration on September 30, 2042. Although we are

13
eligible for a reduced tax rate in the USVI, the reduced tax rate has not provided Ocwen with a foreign tax benefit in recent tax
years as we have been incurring taxable losses in the USVI.
During 2019, following our acquisition of PHH in 2018, and in connection with our overall corporate simplification and
cost reduction efforts, we executed a legal entity reorganization whereby OLS, through which we previously conducted a
substantial portion of our servicing business, was merged into PHH. OLS was previously the wholly-owned subsidiary of
OMS, which was incorporated and headquartered in the USVI prior to its merger in November 2019 with Ocwen USVI
Services, LLC, an entity which is also organized and headquartered in the USVI. As a result of this reorganization, the majority
of our USVI operations and assets were transferred to the U.S. We expect the reorganization to result in efficiencies and
operational cost savings through reduced complexity and a simplification of our global structure.
It is possible that we may not be able to retain our qualifications for the EDC Benefits, or that changes in U.S. federal,
state, local, territorial or USVI taxation statutes or applicable regulations may cause a reduction in or an elimination of the
value of the EDC Benefits, all of which could result in an increase to our tax expense, including a loss of anticipated income
tax refunds, and, therefore, adversely affect our financial condition and results of operations. Additionally, although we
executed a legal entity reorganization in 2019 such that the majority of our USVI operations and assets were transferred to the
U.S., we plan to continue to maintain operations in the USVI until, through and after the reorganization as it is possible that our
past and future EDC Benefits could be adversely impacted, which could jeopardize our ability to return to profitability.
On December 22, 2017, significant revisions to the Internal Revenue Code of 1986, as amended, were signed into law (Tax
Act). The newly enacted federal income tax law, among other things, contains significant changes to corporate taxation,
including reduction of the U.S. corporate tax rate from a top marginal rate of 35% to a flat rate of 21%, elimination of U.S. tax
on foreign earnings (subject to certain important exceptions), and a new minimum tax enacted to prevent companies from
stripping earnings out of the U.S. through U.S. tax deductible payments made to foreign affiliates. The reduction in the
statutory U.S. federal rate is expected to positively impact our future U.S. after-tax earnings. However, the impact of the Tax
Act on our future after tax earnings is subject to the effect of other complex provisions in the Tax Act, including the Base
Erosion and Anti-Abuse Tax (BEAT), Global Intangible Low-Taxed Income (GILTI), and revised interest deductibility
limitations. It is possible that the impact of these provisions could significantly reduce the benefit of the reduction in the
statutory U.S. federal rate and may also negatively impact the tax advantages received from the EDC Benefits. In addition,
Ocwen is continuing to evaluate the impact of the new tax legislation and recently issued regulations on its global tax position.
Certain provisions of the new tax laws and regulations have resulted in an increase to our current income tax obligations.
EMPLOYEES
We had a total of approximately 5,300 and 7,200 employees at December 31, 2019 and 2018, respectively. We maintain
operations in the U.S., USVI, India and the Philippines. At December 31, 2019, approximately 3,400 of our employees were
located in India and approximately 400 were based in the Philippines. Of our foreign-based employees, nearly 80% were
engaged in our Servicing operations as of December 31, 2019. Because of the large number of employees in India, our
operations could be impacted by significant changes to the political or economic conditions in India or in the political or
regulatory climate in the U.S. with respect to U.S. businesses engaging in foreign operations. If we had to curtail or cease our
operations in India and transfer some or all of these operations to another geographic area, we could incur significant transition
costs as well as higher future overhead costs that could materially and adversely affect our results of operations.
SUBSIDIARIES
For a listing of our significant subsidiaries, refer to Exhibit 21.1 of this Annual Report on Form 10-K.
AVAILABLE INFORMATION
Our annual report on Form 10-K, quarterly reports on Form 10-Q, current reports on Form 8-K and all amendments to
those reports are made available free of charge through our website (www.ocwen.com) as soon as reasonably practicable after
such material is electronically filed with or furnished to the SEC. The SEC maintains an Internet site that contains reports,
proxy and information statements and other information regarding issuers, including Ocwen, that file electronically with the
SEC. The address of that site is www.sec.gov. We have also posted on our website, and have available in print upon request (1)
the charters for our Audit Committee, Compensation and Human Capital Committee, Nomination/Governance Committee and
Risk and Compliance Committee, (2) our Corporate Governance Guidelines, (3) our Code of Business Conduct and Ethics and
(4) our Code of Ethics for Senior Financial Officers. Within the time period required by the SEC and the New York Stock
Exchange, we will post on our website any amendment to or waiver of the Code of Ethics for Senior Financial Officers, as well
as any amendment to the Code of Business Conduct and Ethics or waiver thereto applicable to any executive officer or director.
We may post information that is important to investors on our website. The information provided on our website is not part of
this report and is, therefore, not incorporated herein by reference.

14
ITEM 1A. RISK FACTORS
An investment in our common stock involves significant risk. We describe below the most significant risks that
management believes affect or could affect us. Understanding these risks is important to understanding any statement in this
Annual Report and to evaluating an investment in our common stock. You should carefully read and consider the risks and
uncertainties described below together with all the other information included or incorporated by reference in this Annual
Report before you make any decision regarding an investment in our common stock. You should also consider the information
set forth above under “Forward Looking Statements.” If any of the following risks actually occur, our business, financial
condition, liquidity and results of operations could be materially and adversely affected. If this were to happen, the value of our
common stock could significantly decline, and you could lose some or all of your investment. While the following discussion
provides a description of some of the important risks that could cause our results to vary materially from those expressed in
public statements or documents, other factors besides those discussed within this Annual Report or elsewhere in other of our
reports filed with or furnished to the SEC could also affect our business or results.
We have divided this section into the following general risk categories:
• Legal and Regulatory Related Risks
• Risks Related to Our Financial Performance, Financing Our Business, Liquidity and Net Worth and the Economy
• Operational Risks and Other Risks Related to Our Business
• Tax Risks
• Risks Relating to Ownership of Our Common Stock
Legal and Regulatory Risks
The business in which we engage is complex and heavily regulated. If we fail to operate our business in compliance with
both existing and future regulations, our business, reputation, financial condition or results of operations could be
materially and adversely affected.
Our business is subject to extensive regulation by federal, state and local governmental authorities, including the CFPB,
HUD, the SEC and various state agencies that license and conduct examinations of our servicing and lending activities. In
addition, we operate under a number of regulatory settlements that subject us to ongoing reporting and other obligations. See
the next risk factor below for additional detail concerning these regulatory settlements. From time to time, we also receive
requests (including requests in the form of subpoenas and civil investigative demands) from federal, state and local agencies for
records, documents and information relating to our servicing and lending activities. The GSEs (and their conservator, the
FHFA), Ginnie Mae, the United States Treasury Department, various investors, non-Agency securitization trustees and others
also subject us to periodic reviews and audits.
In the current regulatory environment, we have faced and expect to continue to face heightened regulatory and public
scrutiny as an organization as well as stricter and more comprehensive regulation of the entire mortgage sector. We must devote
substantial resources to regulatory compliance, and we incurred, and expect to continue to incur, significant ongoing costs to
comply with new and existing laws and governmental regulation of our business. If we fail to effectively manage our regulatory
and contractual compliance, the resources we are required to devote and our compliance expenses would likely increase. Any
significant delay or complication in fulfilling our regulatory commitments and resolving remaining legacy matters may
jeopardize our ability to return to profitability.
We must comply with a large number of federal, state and local consumer protection laws including, among others, the
Dodd-Frank Act, the Gramm-Leach-Bliley Act, the Fair Debt Collection Practices Act, RESPA, TILA, the Fair Credit
Reporting Act, the Servicemembers Civil Relief Act, the Homeowners Protection Act, the Federal Trade Commission Act, the
Telephone Consumer Protection Act, the Equal Credit Opportunity Act, as well as individual state licensing and foreclosure
laws and federal and local bankruptcy rules. These statutes apply to many facets of our business, including loan origination,
default servicing and collections, use of credit reports, safeguarding of non-public personally identifiable information about our
customers, foreclosure and claims handling, investment of and interest payments on escrow balances and escrow payment
features, and mandate certain disclosures and notices to borrowers. These requirements can and do change as statutes and
regulations are enacted, promulgated, amended, interpreted and enforced. In addition, we must maintain an effective corporate
governance and compliance management system. See “Business - Regulation” for additional information regarding our
regulators and the laws that apply to us.
We must structure and operate our business to comply with applicable laws and regulations and the terms of our regulatory
settlements. This can require judgment with respect to the requirements of such laws and regulations and such settlements.
While we endeavor to engage proactively with our regulators in an effort to ensure we do so correctly, if we fail to interpret
correctly the requirements of such laws and regulations or the terms of our regulatory settlements, we could be found to be in
breach of such laws, regulations or settlements.

15
Our actual or alleged failure to comply with the terms of our regulatory settlements or applicable federal, state and local
consumer protection laws, regulations and licensing requirements could lead to any of the following:
• administrative fines and penalties and litigation;
• loss of our licenses and approvals to engage in our servicing and lending businesses;
• governmental investigations and enforcement actions;
• civil and criminal liability, including class action lawsuits and actions to recover incentive and other payments made
by governmental entities;
• breaches of covenants and representations under our servicing, debt or other agreements;
• damage to our reputation;
• inability to raise capital or otherwise secure the necessary financing to operate the business and refinance maturing
liabilities;
• changes to our operations that may otherwise not occur in the normal course, and that could cause us to incur
significant costs; or
• inability to execute on our business strategy.
Any of these outcomes could materially and adversely affect our business, reputation, financial condition, liquidity and
results of operations.
In recent years, the general trend among federal, state and local lawmakers and regulators has been toward increasing laws,
regulations and investigative proceedings with regard to residential mortgage lenders and servicers. The CFPB continues to
take a very active role in the mortgage industry, and its rule-making and regulatory agenda relating to loan servicing and
originations continues to evolve. Individual states, including New York and California, have also been active, as have other
regulatory organizations such as the MMC. We also believe there has been a shift among certain regulators towards a broader
view of the scope of regulatory oversight responsibilities with respect to mortgage originators and servicers. In addition to their
traditional focus on licensing and examination matters, certain regulators have begun to make observations, recommendations
or demands with respect to such areas as corporate governance, safety and soundness, and risk and compliance management.
We must endeavor to work cooperatively with our regulators to understand all their concerns if we are to be successful in our
business.
The CFPB and state regulators have also increasingly focused on the use, and adequacy, of technology in the mortgage
servicing industry, privacy concerns and other topical issues, such as likely discontinuation of the London Interbank Offered
Rate (LIBOR). In 2016, the CFPB issued a special edition supervision report that stressed the need for mortgage servicers to
assess and make necessary improvements to their information technology systems in order to ensure compliance with the
CFPB’s mortgage servicing requirements. The NY DFS also issued Cybersecurity Requirements for Financial Services
Companies, effective in 2017, which require banks, insurance companies, and other financial services institutions regulated by
the NY DFS to establish and maintain a cybersecurity program designed to protect consumers and ensure the safety and
soundness of New York State’s financial services industry. Likewise, the NY DFS has directed New York-regulated depository
and non-depository institutions, insurers and pension funds to submit their plans for managing the risks relating to the likely
discontinuation of LIBOR. Similarly, the California Consumer Privacy Act, which was enacted in 2018 and became effective
on January 1, 2020, created new consumer rights relating to the access to, deletion of, and sharing of personal information.
Presently, a level of heightened uncertainty exists with respect to the future of regulation of mortgage lending and
servicing, including the future of the Dodd Frank Act and CFPB. We cannot predict the specific legislative or executive actions
that may result or what actions federal or state regulators might take in response to potential changes to the Dodd Frank Act or
to the federal regulatory environment generally. Such actions could impact the industry generally or us specifically, could
impact our relationships with other regulators, and could adversely impact our business and limit our ability to reach an
appropriate resolution with the CFPB, with which we are engaged to attempt to resolve certain concerns relating to our
mortgage servicing practices, as described in the next risk factor.
New regulatory and legislative measures, or changes in enforcement practices, including those related to the technology we
use, could, either individually or in the aggregate, require significant changes to our business practices, impose additional costs
on us, limit our product offerings, limit our ability to efficiently pursue business opportunities, negatively impact asset values
or reduce our revenues. Accordingly, they could materially and adversely affect our business and our financial condition,
liquidity and results of operations.
Governmental bodies have taken regulatory and legal actions against us in the past and may in the future impose regulatory
fines or penalties or impose additional requirements or restrictions on our activities that could increase our operating
expenses, reduce our revenues or otherwise adversely affect our business, financial condition, liquidity, results of
operations, ability to grow and reputation.
We are subject to a number of ongoing federal and state regulatory examinations, consent orders, inquiries, subpoenas,
civil investigative demands, requests for information and other actions that could result in further adverse regulatory action

16
against us, including certain matters summarized below. See Note 24 — Regulatory Requirements and Note 26 —
Contingencies to the Consolidated Financial Statements.
CFPB
In April 2017, the CFPB filed a lawsuit in the federal district court for the Southern District of Florida against Ocwen,
OMS and OLS alleging violations of federal consumer financial laws relating to our servicing business dating back to 2014.
The CFPB’s claims include allegations regarding (1) the adequacy of Ocwen’s servicing system and integrity of Ocwen’s
mortgage servicing data, (2) Ocwen’s foreclosure practices and (3) various purported servicer errors with respect to borrower
escrow accounts, hazard insurance policies, timely cancellation of private mortgage insurance, handling of customer
complaints, and marketing of optional products. The CFPB alleges violations of unfair, deceptive acts or abusive practices, as
well as violations of specific laws or regulations. The CFPB does not claim specific monetary damages, although it does seek
consumer relief, disgorgement of allegedly improper gains, and civil money penalties. While we believe we have factual and
legal defenses to the CFPB’s allegations and are vigorously defending ourselves, the outcome of the matters raised by the
CFPB, whether through negotiated settlements, court rulings or otherwise, could potentially involve monetary fines or penalties
or additional restrictions on our business and could have a material adverse impact on our business, reputation, financial
condition, liquidity and results of operations.
State Licensing and State Attorneys General
Our licensed entities are required to renew their licenses, typically on an annual basis, and to do so they must satisfy the
license renewal requirements of each jurisdiction, which generally include financial requirements such as providing audited
financial statements or satisfying minimum net worth requirements and non-financial requirements such as satisfactorily
completing examinations as to the licensee’s compliance with applicable laws and regulations. The minimum net worth
requirements to which our licensed entities are subject are unique to each state and type of license. We believe our licensed
entities were in compliance with all of their minimum net worth requirements at December 31, 2019. However, it is possible
that regulators could disagree with our calculations, and one state regulator has disagreed with our calculation for a prior year
period; we have discussed the matter with the regulator, including why we believe we were in compliance with the applicable
net worth requirements. Failure to satisfy any of the requirements to which our licensed entities are subject could result in a
variety of regulatory actions ranging from a fine, a directive requiring a certain step to be taken, a suspension or, ultimately, a
revocation of a license, any of which could have a material adverse impact on our results of operations and financial condition.
In April 2017 and shortly thereafter, mortgage and banking regulatory agencies from 29 states and the District of Columbia
took regulatory actions against OLS and certain other Ocwen companies that alleged deficiencies in our compliance with laws
and regulations relating to our servicing and lending activities. These regulatory actions generally took the form of orders
styled as “cease and desist orders” and prohibited a range of actions relating to our lending and servicing activities. We entered
into agreements with all 29 states plus the District of Columbia to resolve these regulatory actions. These agreements generally
contained the Multi-State Common Settlement Terms.
In addition, Ocwen entered into settlements with certain states on different or additional terms, which include making
additional communications with and for borrowers, certain restrictions, certain review, reporting and remediation obligations,
and requirements to make certain monetary payments.
We have incurred and will continue to incur, significant costs complying with the terms of these settlements, including in
connection with the escrow analysis and the transition to Black Knight MSP. In addition, the remediation of errors identified
during the escrow analysis could result in payments, credits or other actions to remediate such errors and legal or other actions
could be taken against us by regulators or others with respect to such errors, which could result in additional costs or other
adverse impacts. If we fail to comply with the terms of our settlements, additional legal or other actions could be taken against
us. Such actions could have a materially adverse impact on our business, reputation, financial condition, liquidity and results of
operations.
Although we have resolved all of the administrative actions taken by state regulators in April 2017 and shortly thereafter,
we have not resolved all of the legal actions. In April 2017, and concurrent with the issuance of the cease and desist orders and
the filing of the CFPB lawsuit discussed above, the Florida Attorney General, together with the Florida Office of Financial
Regulation, filed a lawsuit in the federal district court for the Southern District of Florida against Ocwen, OMS and OLS
alleging violations of federal and state consumer financial laws relating to our servicing business. These claims are similar to
the claims made by the CFPB. The Florida lawsuit seeks injunctive and equitable relief, costs, and civil money penalties in
excess of $10,000 per confirmed violation of the applicable statute.
Certain of the state regulators’ cease and desist orders referenced a confidential supervisory memorandum of understanding
(MOU) that we entered into with the MMC and six states relating to a servicing examination from 2013 to 2015. Among other
things, the MOU prohibited us from repurchasing stock during the development of a going forward plan and, thereafter, except
as permitted by the plan. We submitted a plan in 2016 that contained no stock repurchase restrictions and, therefore, we do not

17
believe we are currently restricted from repurchasing stock. We requested confirmation from the signatories of the MOU that
they agree with this interpretation, and received affirmative responses from the MMC and five states, and a response declining
to take a legal position from the remaining state.
In January 2018, prior to our acquisition of PHH, PMC entered into a settlement agreement with the MMC and consent
orders with certain state attorneys general to resolve and close out findings of an MMC examination of PMC’s legacy mortgage
servicing practices. Under the terms of these settlements, PMC agreed to comply with certain servicing standards, to conduct
testing of compliance with such servicing standards for a period of three years ending December 31, 2020, and to report to the
MMC regarding the same. To the extent PMC does not comply with the terms of the servicing standards, the MMC or state
attorneys general could take regulatory action against us, including imposing fines or penalties or otherwise restricting our
business activities.
We continue to work with the NY DFS to address matters they continue to raise with us as well as to fulfill our
commitments under the 2017 NY Consent Order and PHH acquisition conditional approval. To the extent that we fail to
address adequately any concerns raised by the NY DFS or fail to fulfill our commitments to the NY DFS, the NY DFS could
take regulatory action against us, including imposing fines or penalties or otherwise restricting our business activities. Any such
actions could have a material adverse impact on our business, financial condition liquidity and results of operations.
We have certain remaining reporting and other obligations under the 2017 CA Consent Order, including our completion of
$198.0 million in debt forgiveness for California borrowers by June 30, 2019. We believe we fulfilled this requirement during
the first quarter of 2019. However, our completion of this requirement is subject to testing by the CA DBO’s third-party
administrator who must confirm, among other things, that modified loans have remained current for specified time periods. If
we are unable to satisfy this requirement or obtain an extension, the 2017 CA Consent Order obligates us to pay the remaining
amount to the CA DBO in cash. If the CA DBO were to allege that we failed to comply with our obligations under the 2017 CA
Consent Order or that we otherwise were in breach of applicable laws, regulations or licensing requirements, the CA DBO
could also take regulatory actions against us, including imposing fines or penalties or otherwise restricting our business
activities. Any such actions could have a material adverse impact on our business, financial condition liquidity and results of
operations.
Other Matters
On occasion, we engage with agencies of the federal government on various matters, including the Department of Justice,
the Office of Inspector General of HUD, SIGTARP and the VA Office of the Inspector General. In addition to the expense of
responding to subpoenas and other requests for information from such agencies, in the event that any of these engagements
result in allegations of wrongdoing by us, we may incur fines or penalties or significant legal expenses defending ourselves
against such allegations.
In recent years, we have entered into significant settlements with the NY DFS, the CA DBO, and the 2013 Ocwen National
Mortgage Settlement. These settlements involved payments of significant monetary amounts, monitoring by third-party firms
for which we were financially responsible and other restrictions on our business. For example, we recognized $177.5 million in
third-party monitoring costs alone relating to these settlements between 2014 and 2017. While we are not currently subject to
active monitorships under these settlements, we remain obligated to comply with the commitments made to our regulators and
if we violate those commitments one or more of these entities could take regulatory action against us. Any future settlements or
other regulatory actions against us could have a material adverse impact on our business, reputation, operating results, liquidity
and financial condition will be adversely affected.
To the extent that an examination or other regulatory engagement results in an alleged failure by us to comply with
applicable laws, regulations or licensing requirements, or if allegations are made that we have failed to comply with applicable
laws, regulations or licensing requirements or the commitments we have made in connection with our regulatory settlements
(whether such allegations are made through administrative actions such as cease and desist orders, through legal proceedings or
otherwise) or if other regulatory actions of a similar or different nature are taken in the future against us, this could lead to (i)
administrative fines, penalties and litigation, (ii) loss of our licenses and approvals to engage in our servicing and lending
businesses, (iii) governmental investigations and enforcement actions, (iv) civil and criminal liability, including class action
lawsuits and actions to recover incentive and other payments made by governmental entities, (v) breaches of covenants and
representations under our servicing, debt or other agreements, (vi) damage to our reputation, (vii) inability to raise capital or
otherwise secure the necessary funding to operate the business, (viii) changes to our operations that may otherwise not occur in
the normal course, and that could cause us to incur significant costs, and (ix) inability to execute on our business strategy. Any
of these outcomes could increase our operating expenses and reduce our revenues, hamper our ability to grow or otherwise
materially and adversely affect our business, reputation, financial condition, liquidity and results of operations.
Our regulatory settlements and public allegations regarding our business practices by regulators and other third parties may
affect other regulators’, rating agencies’, and creditors’ perceptions, which could adversely impact our financial results and
ongoing operations.
18
Our regulatory settlements and public allegations regarding our business practices by regulators and other third parties may
affect other regulators’, rating agencies’ and creditors’ perceptions of us. As a result, our ordinary course interactions with
regulators may be adversely affected. We may incur additional compliance costs and management time may be diverted from
other aspects of our business to address regulatory issues. It is possible that we may incur additional fines or penalties or even
that we could lose the licenses and approvals necessary to engage in our servicing and lending businesses. In addition, certain
regulators have begun to make observations, recommendations or demands with respect to areas such as corporate governance,
safety and soundness and risk and compliance management, which could require us to incur additional expense or which could
result in the imposition of additional requirements such as liquidity and capital requirements or restrictions on business conduct
such as engaging in stock repurchases. To the extent that rating agencies or creditors perceive us negatively, our servicer or
credit ratings could be adversely impacted and our access to funding could be limited.
If regulators allege that we do not comply with the terms of our regulatory settlements, or if we enter into future regulatory
settlements, it could significantly impact our ability to maintain and grow our servicing portfolio.
Our servicing portfolio naturally decreases over time as homeowners make regularly scheduled mortgage payments,
prepay loans prior to maturity, refinance with a mortgage loan not serviced by us or involuntarily liquidate through foreclosure
or other liquidation process. Our ability to maintain or grow the size of our servicing portfolio depends on our ability to acquire
the right to service or subservice additional pools of mortgage loans or to originate additional loans for which we retain the
MSRs.
Our regulatory settlements have significantly impacted our ability to maintain or grow our servicing portfolio because we
agreed to certain restrictions that effectively prohibited future bulk acquisitions of residential servicing. While certain of these
restrictions have been eased in connection with our resolution of state regulatory matters and acquisition of PHH, we are still
restricted in our ability to grow our portfolio under the terms of our agreements with the NY DFS. If we are unable to satisfy
the conditions of the regulatory commitments we made to these and other regulators, or if a future regulatory settlement
restricts our ability to acquire MSRs, we will be unable to grow or even maintain the size of our servicing portfolio through
acquisitions and our business could be materially and adversely affected. Moreover, even when regulatory restrictions are
lifted, the reputational damage done by these actions may inhibit our ability to acquire new business.
If we are unable to respond timely and effectively to routine or other regulatory examinations and borrower complaints, our
business and financial conditions may be adversely affected.
Regulatory examinations by state and federal regulators are part of our ordinary course business activities. If we are unable
to respond effectively to regulatory examinations, our business and financial conditions may be adversely affected. For
example, our January 2015 consent order with the CA DBO arose out of an alleged failure to respond adequately to requests
from the CA DBO as part of a routine regulatory examination. In addition, we receive various escalated borrower complaints
and inquiries from our state and federal regulators and state Attorneys General and are required to respond within the time
periods prescribed by such entities. If we fail to respond effectively and timely to regulatory examinations and escalations, legal
action could be taken against us by such regulators and, as a result, we may incur fines or penalties or we could lose the
licenses and approvals necessary to engage in our servicing and lending businesses. We could also suffer from reputational
harm and become subject to private litigation.
The Dodd-Frank Act has significantly impacted our business and we expect it to continue to do so. In addition, new rules
and regulations or more stringent interpretations of existing rules and regulations by the CFPB could result in increased
compliance costs and, potentially, regulatory action against us.
We have devoted substantial resources and incurred significant compliance costs responding to the Dodd-Frank Act and
the rules and regulations issued thereunder, including CFPB rules. We expect to continue to do so. If we fail to comply with the
Dodd-Frank Act and the rules and regulations issued thereunder, including CFPB rules and subsequent amendments, we could
be subject to financial penalties, restrictions on our business activities, private litigation, breaches of our contractual obligations
to counterparties (including our debt agreements) and adverse actions by the GSEs or other entities, any of which could have a
material adverse effect on our business, financial condition and results of operations. For example, as discussed in greater detail
above, we are currently defending ourselves against a lawsuit brought by the CFPB alleging failures to comply with federal
consumer finance laws relating to our servicing business.
Private legal proceedings and related costs alleging failures to comply with applicable laws or regulatory requirements
could adversely affect our financial condition and results of operations.
We are subject to various pending private legal proceedings, including purported class actions, challenging whether certain
of our loan servicing practices and other aspects of our business comply with applicable laws and regulatory requirements. For
example, we are currently a defendant in various matters alleging that (1) certain fees imposed on borrowers relating to
payment processing, payment facilitation, or payment convenience violate state laws similar to the Fair Debt Collection
Practices Act, (2) certain fees we assess on borrowers are marked up improperly in violation of applicable state and federal law,

19
(3) we breached fiduciary duties we purportedly owe to benefit plans due to the discretion we exercise in servicing certain
securitized mortgage loans and (4) certain legacy mortgage reinsurance arrangements violated RESPA. In the future, we are
likely to become subject to other private legal proceedings alleging failures to comply with applicable laws and regulations,
including putative class actions, in the ordinary course of our business. While we do not currently believe that the resolution of
the vast majority of the legal proceedings we face will have a material adverse effect on our financial condition or results of
operations, we cannot express a view with respect to all of these proceedings. The outcome of any pending legal matter is never
certain, and it is possible that adverse results in private legal proceedings could materially and adversely affect our financial
results and operations. We have paid significant amounts to settle private legal proceedings in recent periods and paid
significant amounts in legal and other costs in connection with defending ourselves in such proceedings. To the extent we are
unable to avoid such costs in future periods, our business, financial position, results of operations and cash flows could be
materially and adversely affected.
Non-compliance with laws and regulations could lead to termination of servicing agreements or defaults under our debt
agreements.
Most of our servicing agreements and debt agreements contain provisions requiring compliance with applicable laws and
regulations. While the specific language in these agreements takes many forms and materiality qualifiers are often present, if
we fail to comply with applicable laws and regulations, we could be terminated as a servicer and defaults could be triggered
under our debt agreements, which could materially and adversely affect our revenues, cash flows, liquidity, business and
financial condition. We could also suffer reputational damage and trustees, lenders and other counterparties could cease
wanting to do business with us.
If new laws and regulations lengthen foreclosure times or introduce new regulatory requirements regarding foreclosure
procedures, our operating costs and liquidity requirements could increase and we could be subject to regulatory action.
When a mortgage loan that we service is in foreclosure, we are generally required to continue to advance delinquent
principal and interest to the securitization trust and to make advances for delinquent taxes and insurance and foreclosure costs
and the upkeep of vacant property in foreclosure to the extent that we determine that such amounts are recoverable. These
servicing advances are generally recovered when the delinquency is resolved or upon liquidation. Regulatory actions that
lengthen the foreclosure process will increase the amount of servicing advances that we are required to make, lengthen the time
it takes for us to be reimbursed for such advances and increase the costs incurred during the foreclosure process.
Increased regulatory scrutiny and new laws and procedures could cause us to adopt additional compliance measures and
incur additional compliance costs in connection with our foreclosure processes. We may incur legal and other costs responding
to regulatory inquiries or any allegation that we improperly foreclosed on a borrower. We could also suffer reputational damage
and could be fined or otherwise penalized if we are found to have breached regulatory requirements.
If we fail to comply with the TILA-RESPA Integrated Disclosure (TRID) rules, our business and operations could be
materially and adversely affected and our plans to expand our lending business could be adversely impacted.
The TRID rules include requirements relating to consumer facing disclosure and waiting periods to allow consumers to
reconsider committing to loans after receiving required disclosures. If we fail to comply with the TRID rules, we may be unable
to sell loans that we originate or purchase, or we may be required to sell such loans at a discount compared to other loans. We
also could be subject to repurchase or indemnification claims from purchasers of such loans, including the GSEs. Additionally,
loans might stay on our warehouse lines for longer periods before sale, which would increase our liquidity needs, holding costs
and interest expense. We could also be subject to regulatory actions or private lawsuits.
In response to the TRID rules, we have implemented significant modifications and enhancements to our loan production
processes and systems, and we continue to devote significant resources to TRID compliance. As regulatory guidance and
enforcement and the views of the GSEs and other market participants such as warehouse loan lenders evolve, we may need to
modify further our loan production processes and systems in order to adjust to evolution in the regulatory landscape and
successfully operate our lending business. In such circumstances, if we are unable to make the necessary adjustments, our
business and operations could be adversely affected and we may not be able to execute on our plans to grow our lending
business.
Failure to comply with the Home Mortgage Disclosure Act (HMDA) and related CFPB regulations could adversely impact
our business.
HMDA requires financial institutions to report certain mortgage data in an effort to provide the regulators and the public
with information that will help show whether financial institutions are serving the housing credit needs of the neighborhoods
and communities in which they are located. The data points include information related to the loan applicant/borrower (e.g.,
age, ethnicity, race and credit score), the underwriting process, loan terms and fees, lender credits and interest rate, among
others. The scope of the information available to the public could increase fair lending regulatory scrutiny and third-party
plaintiff litigation, as the changes will expand the ability of regulators and third parties to compare a particular lender to its

20
peers in an effort to determine differences among lenders in certain demographic borrower populations. We have devoted, and
will need to devote, significant resources to establishing systems and processes for complying with HMDA on an ongoing
basis. If we are not successful in capturing and reporting the new HMDA data, and analyzing and correcting any adverse
patterns, we could be exposed to regulatory actions and private litigation against us, we could suffer reputational damage and
we could incur losses, any of which could materially and adversely impact our business, financial condition and results of
operations.
As a participant in the now ended HAMP program, we are subject to review by SIGTARP, which could adversely affect our
business, reputation, and financial condition.
A significant portion of Ocwen’s loan modifications in recent years have been in connection with the now ended HAMP
program. SIGTARP has indicated that it is assessing potential unlawful conduct by servicers in the HAMP program. In May
2017, we received a subpoena from SIGTARP requesting various documents and information relating to Ocwen’s participation
in the HAMP program, and we have been providing documents and information in response to that subpoena. If SIGTARP
were to allege breaches of the HAMP program, such allegations could be referred to the enforcement authorities within the
Department of the Treasury or the Department of Justice and if such enforcement authorities elected to take action against
Ocwen, it could adversely affect our business, reputation and financial condition, regardless of the outcome of any such
enforcement action.
There may be material changes to the laws, regulations, rules or practices applicable to reverse mortgage programs
sponsored by HUD and FHA, and securitized by Ginnie Mae, which could materially and adversely affect us and the reverse
mortgage industry as a whole.
The reverse mortgage industry is largely dependent upon rules and regulations implemented by HUD, FHA and Ginnie
Mae. There can be no guarantee that HUD/FHA will retain Congressional authorization to continue the HECM program, which
provides FHA government insurance for qualifying HECM loans, or that they will not make material changes to the laws,
regulations, rules or practices applicable to reverse mortgage programs. For example, HUD previously implemented certain
lending limits for the HECM program, and added credit-based underwriting criteria designed to assess a borrower’s ability and
willingness to satisfy future tax and insurance obligations. In addition, Ginnie Mae’s participation in the reverse mortgage
industry may be subject to economic and political changes that cannot be predicted. Any of the aforementioned circumstances
could materially and adversely affect the performance of our reverse mortgage business and the value of our common stock.
Regulators continue to be active in the reverse mortgage space, including due to the perceived susceptibility of older
borrowers to be influenced by deceptive or misleading marketing activities. Regulators have also focused on appraisal practices
because reverse mortgages are largely dependent on collateral valuation. If we fail to comply with applicable laws and
regulations relating to the origination of reverse mortgages, we could be subject to adverse regulatory actions, including
potential fines, penalties or sanctions, and our business, reputation, financial condition and results of operations could be
materially and adversely affected.
Violations of predatory lending and/or servicing laws could negatively affect our business.
Various federal, state and local laws have been enacted that are designed to discourage predatory lending and servicing
practices. The federal Home Ownership and Equity Protection Act of 1994 (HOEPA) prohibits inclusion of certain provisions
in residential loans that have mortgage rates or origination costs in excess of prescribed levels and requires that borrowers be
given certain additional disclosures prior to origination. Some states have enacted, or may enact, similar laws or regulations,
which in some cases impose restrictions and requirements greater than are those in HOEPA. In addition, under the anti-
predatory lending laws of some states, the origination of certain residential loans, including loans that are not classified as
“high cost” loans under HOEPA or other applicable law, must satisfy a net tangible benefits test with respect to the related
borrower. A failure by us to comply with these laws, to the extent we originate, service or acquire residential loans that are non-
compliant with HOEPA or other predatory lending or servicing laws, could subject us, as an originator or a servicer, or as an
assignee, in the case of acquired loans, to monetary penalties and could result in the borrowers rescinding the affected loans.
Lawsuits have been brought in various states making claims against originators, servicers and assignees of high cost loans for
violations of state law. Named defendants in these cases have included numerous participants within the secondary mortgage
market. If we are found to have violated predatory or abusive lending laws, defaults could be declared under our debt or
servicing agreements, we could suffer reputational damage, and we could incur losses, any of which could materially and
adversely impact our business, financial condition and results of operations.
Failure to comply with FHA underwriting guidelines could adversely impact our business.
We must comply with FHA underwriting guidelines in order to successfully originate FHA loans. If we fail to do so, we
may not be able collect on FHA insurance. In addition, we could be subject to allegations of violations of the False Claims Act
asserting that we submitted claims for FHA insurance on loans that had not been underwritten in accordance with FHA
underwriting guidelines. If we are found to have violated FHA underwriting guidelines, we could face regulatory penalties and
21
damages in litigation, suffer reputational damage, and we could incur losses due to an inability to collect on such insurance, any
of which could materially and adversely impact our business, financial condition and results of operations.
Failure to comply with United States and foreign laws and regulations applicable to our global operations could have an
adverse effect on our business, financial position, results of operations or cash flows.
As a business with a global workforce, we need to ensure that our activities, including those of our foreign operations,
comply with applicable United States and foreign laws and regulations. Various states have implemented regulations which
specifically restrict the ability to perform certain servicing and originations functions offshore and, from time to time, various
state regulators have scrutinized the operations of our foreign subsidiaries. For example, as previously disclosed, in 2016, two
of our foreign subsidiaries entered into a Consent Order with the Washington State Department of Financial Institutions relating
to the activities of those entities in Washington State under the Washington Consumer Loan Act. Our failure to comply with
applicable laws and regulations could, among other things, result in restrictions on our operations, loss of licenses, fines,
penalties or reputational damage and have an adverse effect on our business.
Failure to comply with the S.A.F.E. Act could adversely impact our business.
The Secure and Fair Enforcement for Mortgage Licensing Act of 2008 (the S.A.F.E. Act) requires the individual licensing
and registration of those engaged in the business of loan origination. The S.A.F.E. Act is designed to improve accountability on
the part of loan originators, combat fraud and enhance consumer protections by encouraging states to establish a national
licensing system and minimum qualification requirements for applicants. Thus, Ocwen must ensure proper licensing for all
employees who participate in certain specified loan origination activities. Failure to comply with the S.A.F.E. Act licensing
requirements could adversely impact Ocwen’s origination business.
Risks Related to Our Financial Performance, Financing Our Business, Liquidity and Net Worth and the Economy
Our strategic plan to return to profitability may not be successful.
We are facing certain challenges and uncertainties that could have significant adverse effects on our business, financial
condition, liquidity and results of operations. The ability of management to appropriately address these challenges and
uncertainties in a timely manner is critical to our ability to operate our business successfully.
Historical losses have significantly eroded stockholders’ equity and weakened our financial condition. We have established
a set of key initiatives to achieve our objective of returning to sustainable profitability in the shortest timeframe possible within
an appropriate risk and compliance environment. First, we must expand our originations activities in our lending business and
acquisitions of MSRs that are prudent and well-executed with appropriate financial return targets to replenish and grow our
servicing portfolio. Second, we must re-engineer our cost structure to go beyond eliminating redundant costs through the
integration process and establish continuous cost improvement as a core strength. Third, we must manage our balance sheet to
ensure adequate liquidity, finance our ongoing business needs and provide a solid platform for executing on our other key
business initiatives. Finally, we must fulfill our regulatory commitments and resolve our remaining legal and regulatory matters
on satisfactory terms.
There can be no assurance that we will successfully execute on these initiatives, or that even if we do execute on these
initiatives we will be able to return to profitability. In addition to successful operational execution of our key initiatives, our
success will also depend on market conditions and other factors outside of our control, including continued access to capital. If
we continue to experience losses, our share price, business, reputation, financial condition, liquidity and results of operations
could be materially and adversely affected.
If we are unable to obtain sufficient capital to meet the financing requirements of our business, or if we fail to comply with
our debt agreements, our business, financing activities, financial condition and results of operations will be adversely
affected.
Our business requires substantial amounts of capital and our financing strategy includes the use of leverage. During 2019,
total leverage increased significantly relative to prior periods and we may increase our leverage further during 2020 as we
execute on our business initiatives, including investing in owned MSRs to replenish portfolio runoff. Accordingly, our ability to
finance our operations and repay maturing obligations rests in large part on our ability to continue to borrow money at
reasonable rates. If we are unable to maintain adequate financing, or other sources of capital are not available, we could be
forced to suspend, curtail or reduce our revenue generating objectives, which could harm our results of operations, liquidity,
financial condition and business prospects. Our ability to borrow money is affected by a variety of factors including:
• limitations imposed on us by existing debt agreements that contain restrictive covenants that may limit our ability to
raise additional debt;
• credit market conditions;
• the strength of the lenders from whom we borrow;
• lenders’ perceptions of us or our sector;

22
• corporate credit and servicer ratings from rating agencies; and
• limitations on borrowing under our MSR and advance facilities and mortgage loan warehouse facilities due to
structural features in these facilities and the amount of eligible collateral that is pledged.
In addition, our advance facilities are revolving facilities, and in a typical monthly cycle, we repay a portion of the
borrowings under these facilities from collections. During the remittance cycle, which starts in the middle of each month, we
depend on our lenders to provide the cash necessary to make the advances that we are required to make as servicer. If one or
more of these lenders were to restrict our ability to access these revolving facilities or were to fail, we may not have sufficient
funds to meet our obligations. We typically require significantly more liquidity to meet our advance funding obligations than
our available cash on hand.
Our advance financing facilities are comprised of (i) revolving notes issued to large financial institutions that generally
have a revolving period of less than two years, and (ii) term notes issued to institutional investors with one-, two- and three-
year periods. At December 31, 2019, we had $679.1 million outstanding under these facilities. The revolving periods for
variable funding notes with a total maximum borrowing capacity of $260.0 million end in 2020.
In the event we are unable to renew, replace or extend the revolving period of one or more of these advance financing
facilities, we would no longer have access to available borrowing capacity and repayment of the outstanding balances on the
revolving and term notes must begin at the end of the applicable revolving period and end of the term, respectively. In addition,
we use mortgage loan warehouse facilities to fund newly originated loans on a short-term basis until they are sold to secondary
market investors, including GSEs or other third-party investors. Currently, our master repurchase and participation agreements
for financing new loan originations generally have 364-day terms, and similar to the revolving notes in the advance financing
facilities, they are typically renewed, replaced or extended annually. At December 31, 2019, we had $332.2 million outstanding
under these warehouse financing arrangements, all under agreements maturing in 2020.
In 2019, we entered into three separate MSR financing arrangements related to loans we service for (i) Fannie Mae and
Freddie Mac, (ii) Ginnie Mae, and (iii) private investors (PLS MSRs). The Fannie Mae/Freddie Mac and Ginnie Mae facilities
were provided through bank commitments and had total capacity of $300.0 million and $100.0 million and borrowed amounts
of $147.7 million and $72.3 million, respectively at December 31, 2019. The PLS MSR financing was issued as an amortizing
note structure to capital markets investors with an initial principal amount of $100.0 million. The Fannie Mae/Freddie Mac and
Ginnie Mae facilities terminate in June 2020 and November 2021, respectively and the PLS MSR facility matures in May
2022. MSR financing structures have become more common in recent years and investor appetite has evolved in both the bank
and capital markets. As a result, MSR financing has become a lower cost funding alternative to corporate loans and bonds.
Despite these positive developments, MSR financing is not as readily available as secured match funded facilities for servicing
advances and whole loans via warehouse facilities. In addition, MSR financing may require a higher level of issuer scrutiny
despite being principally an asset-based financing structure.
Our MSR financing facilities provide funding based on an advance rate of MSR value that is subject to periodic mark-to-
market valuation adjustments. In the normal course, MSR value is expected to decline over time due to run off of the loan
balances in our servicing portfolio. As a result, we anticipate having to repay a portion of our MSR debt over a given time
period. The requirements to repay MSR debt including those due to unfavorable fair value adjustment may require us to
allocate a substantial amount of our available liquidity or future cash flows to meet these requirements. To the extent we are
unable to generate sufficient cash flows from operations to meet these requirements, we may be more constrained to invest in
our business and fund other obligations, and our business, financing activities, liquidity, financial condition and results of
operations will be adversely affected.
We currently plan to renew, replace or extend all of the above debt agreements consistent with our historical experience.
There can be no assurance that we will be able to renew, replace or extend all our debt agreements on appropriate terms or at all
and, if we fail to do so, we may not have adequate sources of funding for our business.
Our debt agreements contain various qualitative and quantitative covenants, including financial covenants, covenants to
operate in material compliance with applicable laws, monitoring and reporting obligations and restrictions on our ability to
engage in various activities, including but not limited to incurring additional debt, paying dividends, repurchasing or redeeming
capital stock, transferring assets or making loans, investments or acquisitions. As a result of the covenants to which we are
subject, we may be limited in the manner in which we conduct our business and may be limited in our ability to engage in
favorable business activities or raise additional capital to finance future operations or satisfy future liquidity needs. In addition,
breaches or events that may result in a default under our debt agreements include, among other things, noncompliance with our
covenants, nonpayment of principal or interest, material misrepresentations, the occurrence of a material adverse effect or
change, insolvency, bankruptcy, certain material judgments and changes of control. Covenants and defaults of this type are
commonly found in debt agreements such as ours. Certain of these covenants and defaults are open to subjective interpretation
and, if our interpretation were contested by a lender, a court may ultimately be required to determine compliance or lack
thereof. In addition, our debt agreements generally include cross default provisions such that a default under one agreement
23
could trigger defaults under other agreements. If we fail to comply with our debt agreements and are unable to avoid, remedy or
secure a waiver of any resulting default, we may be subject to adverse action by our lenders, including termination of further
funding, acceleration of outstanding obligations, enforcement of liens against the assets securing or otherwise supporting our
obligations and other legal remedies.
An actual or alleged default under any of our debt agreements, negative ratings action by a rating agency (including as a
result of our increased leverage or erosion of net worth), the perception of financial weakness, an adverse action by a regulatory
authority or GSE, a lengthening of foreclosure timelines or a general deterioration in the economy that constricts the
availability of credit may increase our cost of funds and make it difficult for us to renew existing credit facilities or obtain new
lines of credit. Any or all the above could have an adverse effect on our business, financing activities, financial condition and
results of operations.
We may be unable to obtain sufficient servicer advance financing necessary to meet the financing requirements of our
business, which could adversely affect our liquidity position and result in a loss of servicing rights.
We currently fund a substantial portion of our servicing advance obligations through our servicing advance facilities.
Under normal market conditions, mortgage servicers typically have been able to renew or refinance these facilities. However,
market conditions or lenders’ perceptions of us at the time of any renewal or refinancing may mean that we are unable to renew
or refinance our advance financing facilities or obtain additional facilities on favorable terms or at all.
If we fail to satisfy minimum net worth and liquidity requirements established by regulators, GSEs, Ginnie Mae, lenders, or
other counterparties, our business, financing activities, financial condition or results of operations could be materially and
adversely affected.
As a result of our servicing and loan origination activities, we are subject to minimum net worth and liquidity requirements
established by state regulators, GSEs, Ginnie Mae, lenders, and other counterparties. We have been incurring losses for the last
five years, which has eroded our net worth. In addition, we must structure our business so each subsidiary satisfies the net
worth and liquidity requirements applicable to it, which can be challenging.
The minimum net worth and liquidity requirements to which our licensed entities are subject vary by state and type of
license. We must also satisfy the minimum net worth and liquidity requirements of the GSEs and Ginnie Mae in order to
maintain our approved status with such agencies and the minimum net worth and liquidity requirements set forth in our
agreements with our lenders.
Minimum net worth requirements and liquidity are generally calculated using specific adjustments that may require
interpretation or judgment. Changes to these adjustments have the potential to significantly affect net worth and liquidity
calculations and imperil our ability to satisfy future minimum net worth and liquidity requirements. We believe our licensed
entities were in compliance with all of their minimum net worth requirements at December 31, 2019. However, it is possible
that regulators could disagree with our calculations, and one state regulator has disagreed with our calculation for a prior year
period; we have discussed the matter with the regulator, including why we believe we are in compliance with the applicable net
worth requirements. If we fail to satisfy minimum net worth requirements, absent a waiver or other accommodation, we could
lose our licenses or have other regulatory action taken against us, we could lose our ability to sell and service loans to or on
behalf of the GSEs or Ginnie Mae, or it could trigger a default under our debt agreements. Any of these occurrences could have
a material adverse effect on our business, financing activities, financial condition or results of operations.
We use estimates in measuring or determining the fair value of the majority of our assets and liabilities. If our estimates
prove to be incorrect, we may be required to write down the value of these assets or write up the value of these liabilities,
which could adversely affect our earnings.
Our ability to measure and report our financial position and operating results is influenced by the need to estimate the
impact or outcome of future events based on information available at the time of the financial statements. An accounting
estimate is considered critical if it requires that management make assumptions about matters that were highly uncertain at the
time the accounting estimate was made. If actual results differ from our judgments and assumptions, then it may have an
adverse impact on the results of operations and cash flows.
Fair value is estimated based on a hierarchy that maximizes the use of observable inputs and minimizes the use of
unobservable inputs. Observable inputs are inputs that reflect the assumptions that market participants would use in pricing the
asset or liability developed based on market data obtained from sources independent of the reporting entity. Unobservable
inputs are inputs that reflect the reporting entity’s own assumptions about the assumptions market participants would use in
pricing the asset or liability developed based on the best information available in the circumstances. The fair value hierarchy
prioritizes the inputs to valuation techniques into three broad levels whereby the highest priority is given to Level 1 inputs and
the lowest to Level 3 inputs.

24
At December 31, 2019, 77% and 70% of our consolidated total assets and liabilities are measured at fair value,
respectively, on a recurring and nonrecurring basis, 97% and 100% of which are considered Level 3 valuations, including our
MSR portfolio. Our largest Level 3 asset and liability carried at fair value on a recurring basis is Loans held for investment -
reverse mortgages and the related secured financing. We pool home equity conversion mortgages (reverse mortgages) into
Ginnie Mae Home Equity Conversion Mortgage-Backed Securities (HMBS). Because the securitization of reverse mortgage
loans do not qualify for sale accounting, we account for these transfers as secured financings and classify the transferred
reverse mortgages as Loans held for investment - reverse mortgages and recognize the related Financing liabilities. Holders of
HMBS have no recourse against our assets, except for standard representations and warranties and our contractual obligations
to service the reverse mortgages and HMBS.
We estimate the fair value of our assets and liabilities utilizing assumptions that we believe are appropriate and are used by
market participants. We generally engage third party valuation experts to support our fair value determination for Level 3 assets
and liabilities. The methodology used to estimate these values is complex and uses asset- and liability-specific data and market
inputs for assumptions including interest and discount rates, collateral status and expected future performance. If these
assumptions prove to be inaccurate, if market conditions change or if errors are found in our models, the value of certain of our
assets may decrease, which could adversely affect our business, financial condition and results of operations, including through
negative impacts on our ability to satisfy minimum net worth and liquidity covenants.
Valuations are highly dependent upon the reasonableness of our assumptions and the predictability of the relationships that
drive the results of our valuation methodologies. If changes to interest rates or other factors cause prepayment speeds to
increase more than estimated, delinquency and default levels are higher than anticipated or financial market illiquidity is
greater than anticipated, we may be required to adjust the value of certain assets or liabilities, which could adversely affect our
business, financial condition and results of operations.
We are exposed to liquidity, interest rate and foreign currency exchange risks.
We are exposed to liquidity risk primarily because of the highly variable daily cash requirements to support our servicing
business, including the requirement to make advances pursuant to our servicing agreements and the process of collecting and
applying recoveries of advances. We are also exposed to liquidity risk due to potential accelerated repayment of our debt
depending on the performance of the underlying collateral, including the fair value of MSRs, and certain covenants, among
other factors. We are also exposed to liquidity and interest rate risk by our decision to originate and finance mortgage loans and
sell mortgage loans into the secondary market. Further, as discussed below, the economic hedges that we have entered into in
order to limit MSR fair value change exposure may include instruments that require margin, thereby leading to liquidity
distributions should the hedge instrument lose value. In general, we finance our operations through operating cash flows and
various other sources of funding, including match funded borrowing agreements, secured lines of credit and repurchase
agreements.
We are exposed to interest rate risk to the degree that our interest-bearing liabilities mature or reprice at different speeds, or
on different bases, than our interest earning assets or when financed assets are not interest-bearing. Our servicing business is
characterized by non-interest earning assets financed by interest-bearing liabilities. Servicing advances are among our more
significant non-interest earning assets. At December 31, 2019, we had total advances and match funded advances of $1.1
billion. We are also exposed to interest rate risk because a portion of our advance financing and other outstanding debt
at December 31, 2019 is variable rate. Rising interest rates may increase our interest expense. Earnings on float balances
partially offset these higher funding costs. At December 31, 2019, we had no interest rate swaps in place to hedge our exposure
to rising interest rates.
Our MSRs, which we carry at fair value, are subject to substantial interest rate risk, primarily because the mortgage loans
underlying the servicing rights permit the borrowers to prepay the loans. A decrease in interest rates generally increases
prepayment speeds and vice versa. As a result, the valuation assumptions for MSRs are highly correlated to changes across the
yield curve. An interest rate decrease could result in an array of fair value changes, the severity of which would depend on
several factors, including the magnitude of the change, whether the decrease is across specific rate tenors or a parallel change
across the entire yield curve, and impact from market-side adjustments, among others. Beginning in September 2019, we
implemented a hedging strategy using economic hedges (derivatives that do not qualify as hedges for accounting purposes) to
partially offset the changes in fair value of our MSRs due to interest rate changes. However, as discussed below, there can be no
assurance that our hedging strategy will be effective in partially mitigating our exposure to changes in fair value of our MSRs
due to interest rate changes.
In our lending business, we are subject to interest rate and price risk on our pipeline (i.e., interest rate loan commitments
(IRLCs) and mortgage loans held for sale) from the commitment date up until the date the commitment expires or the loan is
sold into the secondary market. Generally, the fair value of the pipeline will decline in value when interest rates increase and
will rise in value when interest rates decrease. Our interest rate exposure on our pipeline had previously been economically
hedged with freestanding derivatives such as forward contracts. Beginning in September 2019, this exposure is no longer

25
individually hedged, but rather used as an offset to our MSR fair value exposure and managed as part of our MSR hedging
strategy described above.
We are exposed to foreign currency exchange rate risk in connection with our investment in non-U.S. dollar currency
operations to the extent that our foreign exchange positions remain unhedged. Our operations in the Philippines and India
expose us to foreign currency exchange rate risk.
While we have established policies and procedures intended to identify, monitor and manage the risks described above, we
cannot assure you that our risk management policies and procedures will be effective. Further, such policies and procedures are
not designed to mitigate or eliminate all of the risks we face. As a result, these risks could materially and adversely affect our
business, financial condition and results of operations.
Our hedging strategy may not be successful in partially mitigating our exposure to interest rate risk.
Our hedging strategy may not be as effective as desired due to the actual performance of an MSR differing from the
expected performance. While we actively track the actual performance of our MSRs across rate change environments, there is
potential for our economic hedges to underperform. The underperformance may be a result of various factors, including the
following: available hedge instruments have a different profile than the underlying asset, the duration of the hedge is different
from the MSR, the convexity of the hedge is not proportional to the valuation change of the MSR asset, the counterparty with
which we have traded has failed to deliver under the terms of the contract, or we fail to renew the hedge position in a timely or
efficient manner.
Unexpected changes in market rates or secondary liquidity may have a materially adverse impact on the cash flow or
operating performance of the Company. The expected hedge coverage profiled may not correlate to the asset as desired,
resulting in poorer performance than had we not hedged at all. In addition, hedging strategies involve transaction and other
costs. We cannot be assured that our hedging strategy and the derivatives that we use will adequately offset the risks of interest
rate volatility or that our hedging transactions will not result in or magnify losses.
GSE and Ginnie Mae initiatives and other actions may affect our financial condition and results of operations.
Due to the significant role that the GSEs play in the secondary mortgage market, new initiatives and other actions that they
may implement could become prevalent in the mortgage servicing industry generally. To the extent that FHFA and/or the GSEs
implement reforms that materially affect the market not only for conventional and/or government-insured loans but also the
non-qualifying loan markets, such reforms could have a material adverse effect on the creation of new MSRs, the economics or
performance of any MSRs that we acquire, servicing fees that we can charge and costs that we incur to comply with new
servicing requirements.
In addition, our ability to generate revenues through mortgage loan sales to institutional investors depends to a significant
degree on programs administered by the GSEs, Ginnie Mae, and others that facilitate the issuance of MBS in the secondary
market. These entities play a critical role in the residential mortgage industry and we have significant business relationships
with many of them. If it is not possible for us to complete the sale or securitization of certain of our mortgage loans due to
changes in GSE and Ginnie Mae programs, we may lack liquidity to continue to fund mortgage loans and our revenues and
margins on new loan originations would be materially and negatively impacted.
Our plans to acquire MSRs will require approvals and cooperation by the GSEs and Ginnie Mae. Should approval or
cooperation be withheld, we would have difficulty meeting our MSR acquisition objectives.
There are various proposals that deal with the future of the GSEs, including with respect to their ownership and role in the
mortgage market, as well as proposals to implement GSE reforms relating to borrowers, lenders and investors in the mortgage
market. Thus, the long-term future of the GSEs remains uncertain. Any change in the ownership of the GSEs, or in their
programs or role within the mortgage market, could materially and adversely affect our business, liquidity, financial position
and results of operations.
An economic slowdown or a deterioration of the housing market could increase both interest expense on servicing advances
and operating expenses and could cause a reduction in income from, and the value of, our servicing portfolio.
During any period in which a borrower is not making payments, we are required under most of our servicing agreements to
advance our own funds to meet contractual principal and interest remittance requirements for investors, pay property taxes and
insurance premiums and process foreclosures. We also advance funds to maintain, repair and market real estate properties on
behalf of investors. Most of our advances have the highest standing and are “top of the waterfall” so that we are entitled to
repayment from respective loan or REO liquidations proceeds before most other claims on these proceeds, and in the majority
of cases, advances in excess of respective loan or REO liquidation proceeds may be recovered from pool level proceeds.
Consequently, the primary impacts of an increase in advances are generally increased interest expense as we finance a large
portion of servicing advance obligations and a decline in the fair value of MSRs as the projected funding cost of existing and
future expected servicing advances is a component of the fair value of MSRs. Our liquidity is also negatively impacted because

26
we must fund the portion of our advance obligations that is not financed. Our liquidity would be more severely impacted if we
were unable to continue to finance a large portion of servicing advance obligations.
Higher delinquencies also decrease the fair value of MSRs and increase our cost to service loans, as loans in default require
more intensive effort to bring them current or manage the foreclosure process. An increase in delinquencies may delay the
timing of revenue recognition because we recognize servicing fees as earned, which is generally upon collection of payments
from borrowers or proceeds from REO liquidations. An increase in delinquencies also generally leads to lower balances in
custodial and escrow accounts (float balances) and lower net earnings on custodial and escrow accounts (float earnings).
Additionally, an increase in delinquencies in our GSE servicing portfolio will result in lower revenue because we collect
servicing fees from GSEs only on performing loans.
Foreclosures are involuntary prepayments resulting in a reduction in UPB. This may also result in declines in the value of
our MSRs.
Adverse economic conditions could also negatively impact our lending businesses. For example, declining home prices
and increasing loan-to-value ratios may preclude many borrowers from refinancing their existing loans or obtaining new loans.
Any of the foregoing could adversely affect our business, liquidity, financial condition and results of operations.
A significant increase in prepayment speeds could adversely affect our financial results.
Prepayment speed is a significant driver of our business. Prepayment speed is the measurement of how quickly borrowers
pay down the UPB of their loans or how quickly loans are otherwise brought current, modified, liquidated or charged off.
Prepayment speeds have a significant impact on our servicing fee revenues, our expenses and on the valuation of our MSRs as
follows:
• Revenue. If prepayment speeds increase, our servicing fees will decline more rapidly than anticipated because of the
greater decrease in the UPB on which those fees are based. The reduction in servicing fees would be somewhat offset
by increased float earnings because the faster repayment of loans will result in higher float balances that generate the
float earnings. Conversely, decreases in prepayment speeds result in increased servicing fees but lead to lower float
balances and float earnings.
• Expenses. Faster prepayment speeds result in higher compensating interest expense, which represents the difference
between the full month of interest we are required to remit in the month a loan pays off and the amount of interest we
collect from the borrower for that month. Slower prepayment speeds also lead to lower compensating interest expense.
• Valuation of MSRs. The fair value of MSRs is based on, among other things, projection of the cash flows from the
related pool of mortgage loans. The expectation of prepayment speeds is a significant assumption underlying those
cash flow projections from the perspective of market participants. Increases or decreases in interest rates have an
impact on prepayment rates. If prepayment speeds were significantly greater than expected, the fair value of our
MSRs, which we carry at fair value, could decrease. When the fair value of these MSRs decreases, we record a loss on
fair value, which also has a negative impact on our financial results.
Operational Risks and Other Risks Related to Our Business
If we do not comply with our obligations under our servicing agreements or if others allege non-compliance, our business
and results of operations may be harmed.
We have contractual obligations under the servicing agreements pursuant to which we service mortgage loans. Our non-
Agency servicing agreements generally contain detailed provisions regarding servicing practices, reporting and other matters.
In addition, Liberty and PMC are parties to seller/servicer agreements and/or subject to guidelines and regulations (collectively,
seller/servicer obligations) with one or more of the GSEs, HUD, FHA, VA and Ginnie Mae. These seller/servicer obligations
include financial covenants that include capital requirements related to tangible net worth, as defined by the applicable agency,
an obligation to provide audited consolidated financial statements within 90 days of the applicable entity’s fiscal year end as
well as extensive requirements regarding servicing, selling and other matters. To the extent that these requirements are not met
or waived, the applicable agency may, at its option, utilize a variety of remedies including requirements to provide certain
information or take actions at the direction of the applicable agency, requirements to deposit funds as security for our
obligations, sanctions, suspension or even termination of approved seller/servicer status, which would prohibit future
originations or securitizations of forward or reverse mortgage loans or servicing for the applicable agency.
Many of our servicing agreements require adherence to general servicing standards, and certain contractual provisions
delegate judgment over various servicing matters to us. Our servicing practices, and the judgments that we make in our
servicing of loans, could be questioned by parties to these agreements, such as GSEs, Ginnie Mae, trustees or master servicers,
or by investors in the trusts which own the mortgage loans or other third parties. As a result, we could be required to repurchase
mortgage loans, make whole or otherwise indemnify such mortgage loan investors or other parties. Advances that we have
made could be unrecoverable. We could also be terminated as servicer or become subject to litigation or other claims seeking

27
damages or other remedies arising from alleged breaches of our servicing agreements. For example, we are currently involved
in a dispute with a former subservicing client relating to alleged violations of our contractual agreements, including that we did
not properly submit mortgage insurance and other claims for reimbursement. We are presently engaged in a dispute resolution
process relating to these claims. We are unable to predict the outcome of this dispute or the size of any loss we might incur. In
addition, several trustees are currently defending themselves against claims by RMBS investors that the trustees failed to
properly oversee mortgage servicers - including Ocwen - in the servicing of hundreds of trusts. Trustees subject to those suits
have informed Ocwen that they may seek indemnification for losses they suffer as a result of the filings.
Any of the foregoing could have a significant negative impact on our business, financial condition and results of
operations. Even if allegations against us lack merit, we may have to spend additional resources and devote additional
management time to contesting such allegations, which would reduce the resources available to address, and the time
management is able to devote to, other matters.
GSEs or Ginnie Mae may curtail or terminate our ability to sell, service or securitize newly originated loans to them.
As noted in the prior risk factor, if we do not comply with our seller/servicer obligations, the GSEs or Ginnie Mae may
utilize a variety of remedies against us. Such remedies include curtailment of our ability to sell newly originated loans or even
termination of our ability to sell, service or securitize such loans altogether. Any such curtailment or termination would likely
have a material adverse impact on our business, liquidity, financial condition and results of operations.
A significant reduction in, or the total loss of, our remaining NRZ-related servicing would significantly impact our business,
liquidity, financial condition and results of operations.
NRZ is our largest servicing client, accounting for 56% of the UPB in our servicing portfolio as of December 31, 2019. On
February 20, 2020, we received a notice of termination from NRZ with respect to the legacy PMC subservicing agreement,
which accounted for approximately 20% of the UPB of our servicing portfolio as of December 31, 2019. It is possible that NRZ
could exercise its rights to terminate for convenience some or all of the legacy Ocwen servicing agreements. As of
December 31, 2019, these agreements accounted for approximately 36.0% of our servicing portfolio.
In addition, under the legacy Ocwen agreements, any failure under a financial covenant could result in NRZ terminating
Ocwen as subservicer under the subservicing agreements or in directing the transfer of servicing away from Ocwen under the
Rights to MSRs agreements. Similarly, failure by Ocwen to meet operational requirements, including service levels, critical
reporting and other obligations, could also result in termination or transfer for cause. In addition, if there is a change of control
to which NRZ did not consent, NRZ could terminate for cause and direct the transfer of servicing away from Ocwen. A
termination for cause and transfer of servicing could materially and adversely affect Ocwen’s business, liquidity, financial
condition and results of operations.
Further, under our Rights to MSRs agreements, in certain circumstances, NRZ has the right to sell its Rights to MSRs to a
third-party and require us to transfer title to the related MSRs, subject to an Ocwen option to acquire at a price based on the
winning third-party bid rather than selling to the third party. If NRZ sells its Rights to MSRs to a third party, the transaction can
only be completed if the third-party buyer can obtain the necessary third-party consents to transfer the MSRs. NRZ also has the
obligation to use reasonable efforts to encourage such third-party buyer to enter into a subservicing agreement with Ocwen.
Ocwen may lose future compensation for subservicing, however, if no subservicing agreement is ultimately entered into with
the third-party buyer.
Because of the large percentage of our servicing business that is represented by the legacy Ocwen agreements with NRZ
that provide NRZ with the termination or transfer rights described above, our business, financial condition, results of operations
would be significantly impacted if NRZ exercised all or a significant portion of these rights. If this were to occur, we anticipate
that we would need to substantially restructure many aspects of our servicing business as well as the related corporate support
functions to address our smaller servicing portfolio, which would likely be a complex and expensive undertaking. Such a
restructuring of our operations could divert management attention and financial resources required to execute on other strategic
objectives, which could delay or prevent our growth or otherwise negatively impact the execution of our plans to return to
profitability. In addition, it is possible that the unwinding of all or a significant portion of our relationship may not occur in an
orderly or timely manner, which could be disruptive and could result in us incurring additional costs or even in disagreements
with NRZ relating to our respective rights and obligations.
More generally, if NRZ were to decline to continue doing business with us and we were unable to develop relationships
with new servicing clients on a similar scale or otherwise acquire sufficient replacement servicing, our business, liquidity,
results of operations and financial condition could be materially and adversely affected. In addition, if NRZ were to take
actions to limit or terminate our relationship, that could impact perceptions of other servicing clients, lenders, GSEs, regulators
or others, which could cause them to take actions that materially and adversely impact our business, liquidity, results of
operations and financial condition.

28
We believe our remaining NRZ servicing will become increasingly unprofitable over time. If we are not successful in our
actions to improve the profitability of our remaining NRZ servicing or to acquire additional profitable client relationships to
offset the expected impact on our profitability, our business, liquidity, financial condition and results of operations could be
materially and adversely affected.
During 2019, we completed an assessment of the cost-to-service and the profitability of the NRZ servicing portfolio.
Based on this analysis, in the fourth quarter of 2019, we estimate that operating expenses, including direct servicing expenses
and overhead allocation, exceeded the net revenue retained for the legacy Ocwen servicing agreements by approximately $7.0
million. This estimate excludes the benefits of the lump-sum payment amortization. The estimated loss for these subservicing
agreements is partially driven by the declining revenue as the loan portfolio amortizes down without a corresponding reduction
to our servicing cost over time. As performing loans in the legacy Ocwen servicing portfolio have run-off, delinquencies have
remained high, resulting in a relatively elevated average cost per loan. Because the NRZ portfolio contains a high percentage of
delinquent accounts, it has an inherently high level of potential operational and compliance risk and requires a
disproportionately high level of operating staff, oversight support infrastructure and overhead which drives the elevated average
cost per loan. While we are actively pursuing cost re-engineering initiatives to reduce our cost-to-service and our corporate
overhead, we may be unsuccessful in reducing these costs to the level where the legacy Ocwen servicing is profitable during
2020 or beyond. We are also seeking to acquire, maintain and grow profitable client relationships that would offset any
negative impact from legacy Ocwen servicing; however, we may not be successful in these efforts. While we have the ability to
not to renew the legacy Ocwen agreements in certain circumstances, in such situations, we would not be entitled to termination
fees that would help offset the restructuring and transition costs required to adjust our operations to a significantly smaller
servicing portfolio. Consequently, absent a termination for convenience by NRZ, our most economically feasible alternative
with respect to these agreements may be to continue to service an increasingly unprofitable portfolio, which could materially
and adversely impact our business, liquidity, financial condition and results of operations.
If NRZ were to fail to comply with its servicing advance obligations under its agreements with us, it could materially and
adversely affect us.
Under the Rights to MSRs agreements, NRZ is responsible for financing all servicing advance obligations in connection
with the loans underlying the MSRs. At December 31, 2019, such servicing advances made by NRZ were approximately
$704.2 million. However, under the Rights to MSRs structure, we are contractually required under our servicing agreements
with the RMBS trusts to make the relevant servicing advances even if NRZ does not perform its contractual obligations to fund
those advances. Therefore, if NRZ were unable to meet its advance financing obligations, we would remain obligated to meet
any future advance financing obligations with respect to the loans underlying these Rights to MSRs, which could materially
and adversely affect our liquidity, financial condition and servicing operations.
NRZ currently uses advance financing facilities to fund a substantial portion of the servicing advances that NRZ is
contractually obligated to make pursuant to the Rights to MSRs agreements. Although we are not an obligor or guarantor under
NRZ’s advance financing facilities, we are a party to certain of the facility documents as the entity performing the work of
servicing the underlying loans on which advances are being financed. As such, we make certain representations, warranties and
covenants, including representations and warranties in connection with our sale of advances to NRZ. If we were to make
representations or warranties that were untrue or if we were otherwise to fail to comply with our contractual obligations, we
could become subject to claims for damages or events of default under such facilities could be asserted.
Technology or process failures or employee misconduct could damage our business operations or reputation, harm our
relationships with key stakeholders and lead to regulatory sanctions or penalties.
We are responsible for developing and maintaining sophisticated operational systems and infrastructure, which is
challenging. As a result, operational risk is inherent in virtually all of our activities. In addition, the CFPB and other regulators
have emphasized their focus on the importance of servicers’ and lenders’ systems and infrastructure operating effectively. If our
systems and infrastructure fail to operate effectively, such failures could damage our business and reputation, harm our
relationships with key stakeholders and lead to regulatory sanctions or penalties.
Our business is substantially dependent on our ability to process and monitor a large number of transactions, many of
which are complex, across various parts of our business. These transactions often must adhere to the terms of a complex set of
legal and regulatory standards, as well as the terms of our servicing and other agreements. In addition, given the volume of
transactions that we process and monitor, certain errors may be repeated or compounded before they are discovered and
rectified. For example, in the area of borrower correspondence, in 2014, problems were identified with our letter dating
processes such that erroneously dated letters were sent to borrowers, which damaged our reputation and relationships with
borrowers, regulators, important counterparties and other stakeholders. Because in an average month we mail over 2
million letters, a process problem such as erroneous letter dating has the potential to negatively affect many parts of our
business and have widespread negative implications.
29
We are similarly dependent on our employees. We could be materially adversely affected if an employee or employees,
acting alone or in concert with non-affiliated third parties, causes a significant operational break-down or failure, either because
of human error or where an individual purposefully sabotages or fraudulently manipulates our operations or systems, including
by means of cyberattack or denial-of-service attack. In addition to direct losses from such actions, we could be subject to
regulatory sanctions or suffer harm to our reputation, financial condition, customer relationships, and ability to attract future
customers or employees. Employee misconduct could prompt regulators to allege or to determine based upon such misconduct
that we have not established adequate supervisory systems and procedures to inform employees of applicable rules or to detect
and deter violations of such rules. It is not always possible to deter employee misconduct, and the precautions we take to detect
and prevent misconduct may not be effective in all cases. Misconduct by our employees, or even unsubstantiated allegations of
misconduct, could result in a material adverse effect on our reputation and our business.
Third parties with which we do business could also be sources of operational risk to us, including risks relating to break-
downs or failures of such parties’ own systems or employees. Any of these occurrences could diminish our ability to operate
one or more of our businesses or lead to potential liability to clients, reputational damage or regulatory intervention. We could
also be required to take legal action against or replace third-party vendors, which could be costly, involve a diversion of
management time and energy and lead to operational disruptions. Any of these occurrences could materially adversely affect us.
We are dependent on Black Knight, Altisource and other vendors for much of our technology, business process outsourcing
and other services.
Our vendor relationships subject us to a variety of risks. We have significant exposure to third-party risks, as we are
dependent on vendors, including, Black Knight and Altisource, for a number of key services.
We use the Black Knight MSP servicing system pursuant to a seven-year agreement with Black Knight, and we are highly
dependent on the successful functioning of it to operate our loan servicing business effectively and in compliance with our
regulatory and contractual obligations. It would be difficult, costly and complex to transfer all of our loans to another servicing
system in the event Black Knight failed to perform under its agreements with us and any such transfer would take considerable
time. Any such transfer would also likely be subject us to considerable scrutiny from regulators, GSEs, Ginnie Mae and other
counterparties.
Ocwen has entered into various long-term agreements with Altisource, including a Services Agreement under which
Altisource provides various services, such as property valuation services, property preservation and inspection services and title
services, among other things. Previously, Ocwen’s servicing system ran on an information technology system that we licensed
under agreements with Altisource.
In February 2019, Ocwen and Altisource signed a Binding Term Sheet, which among other things, confirmed Altisource’s
cooperation with the de-boarding of loans from Altisource’s REALServicing servicing system to Black Knight’s MSP servicing
system. In addition, Ocwen and Altisource entered into a letter agreement confirming that, except in relation to Ocwen’s
transfer off of the REALServicing technology beginning in February 2019 or termination of the REALServicing statement of
work, each party reserves its rights and remedies in the event of any disputes between them. While the Binding Term Sheet
does not restrict Ocwen’s rights to sell MSRs in any way, the letter agreement specifically includes a reservation of each party’s
rights to assert damage claims against the other party regarding such transactions including any transfer by Ocwen to NRZ (or
its affiliates) or any third party of the rights to designate a vendor. Ocwen does not believe its agreements with Altisource
restrict Ocwen’s rights to sell MSRs or restrict Ocwen from allowing an owner of MSRs, or owner of the economics thereto,
the right to designate vendors. As such, Ocwen believes any asserted claims by Altisource against Ocwen arising from Ocwen’s
sale of MSRs or related to the rights to designate a vendor to a third party, would be without merit and we have so informed
Altisource. However, if Altisource were to assert such claims against us, such disputes could cause us to incur costs, divert the
attention of management, and potentially disrupt our operations which rely on Altisource-provided services, regardless of
whether such claims were ultimately resolved in our favor.
If either Black Knight or Altisource were to fail to properly fulfill its contractual obligations to us, including through a
failure to provide services at the required level to maintain and support our systems, our business and operations would suffer.
In addition, if Black Knight fails to develop and maintain its technology so as to provide us with an effective and competitive
servicing system, our business could suffer. Similarly, we are reliant on other vendors for the proper maintenance and support
of our technological systems and our business and operations would suffer if these vendors do not perform as required. If our
vendors do not adequately maintain and support our systems, including our servicing systems, loan originations and financial
reporting systems, our business and operations could be materially and adversely affected.
Altisource and other vendors supply us with other services in connection with our business activities such as property
preservation and inspection services and valuation services. In the event that a vendor’s activities do not comply with the
applicable servicing criteria, we could be exposed to liability as the servicer and it could negatively impact our relationships
with our servicing clients, borrowers or regulators, among others. In addition, if our current vendors were to stop providing
services to us on acceptable terms, we may be unable to procure alternatives from other vendors in a timely and efficient

30
manner and on acceptable terms, or at all. Further, we may incur significant costs to resolve any such disruptions in service and
this could adversely affect our business, financial condition and results of operations.
In addition to our reliance on the vendors discussed above, our business is reliant on a number of technological vendors
that provide services such as integrated cloud applications and financial institutions that provide essential banking services on a
daily basis. Even short-terms interruptions in the services provided by these vendors and financial institutions could be
disruptive to our business and cause us financial loss. Significant or prolonged disruptions in the ability of these companies to
provide services to us could have a material adverse impact on our operations.
We have undergone and continue to undergo significant change to our technology infrastructure and business processes.
Failure to adequately update our systems and processes could harm our ability to run our business and adversely affect our
results of operations.
We are currently making, and will continue to make, technology investments and process improvements to improve or
replace the information processes and systems that are key to managing our business, to improve our compliance management
system, and to reduce costs. Additionally, as part of the transition to Black Knight MSP and the integration of our information
processes and systems with PHH, we have undergone and continue to undergo significant changes to our technology
infrastructure and business processes. Failure to select the appropriate technology investments, or to implement them correctly
and efficiently, could have a significant negative impact on our operations.
Disagreements with vendors, service providers or other contractual counterparties could materially and adversely affect our
business, financing activities, financial condition or results of operations.
We are dependent on Black Knight, Altisource and other vendors and service providers to operate our business effectively
and in compliance with applicable regulatory and contractual obligations and on banks, NRZ and other financing sources to
finance our business. Certain provisions of the agreements underlying our relationships with our vendors, service providers,
financing sources and other contractual counterparties could be open to subjective interpretation. Disagreements with these
counterparties, including disagreements over contract interpretation, could lead to business disruptions or could result in
litigation or arbitration or mediation proceedings, any of which could be expensive and divert senior management’s attention
from other matters. While we have been able to resolve disagreements with these counterparties in the past, if we were unable
to resolve a disagreement, a court, arbitrator or mediator might be required to resolve the matter and there can be no assurance
that the outcome of a material disagreement with a contractual counterparty would not materially and adversely affect our
business, financing activities, financial condition or results of operations.
Cybersecurity breaches or system failures may interrupt or delay our ability to provide services to our customers, expose our
business and our customers to harm and otherwise adversely affect our operations.
Disruptions and failures of our systems or those of our vendors may interrupt or delay our ability to provide services to our
customers, expose us to remedial costs and reputational damage, and otherwise adversely affect our operations. The secure
transmission of confidential information over the Internet and other electronic distribution and communication systems is
essential to our maintaining consumer confidence in certain of our services. We have programs in place to detect and respond to
security incidents. However, because the techniques used to obtain unauthorized access, disable or degrade service, or sabotage
systems change frequently and may be difficult to detect for long periods of time, we may be unable to anticipate these
techniques or implement adequate preventive measures. While none of the cybersecurity incidents that we have experienced to
date have had a material adverse impact on our business, financial condition or operations, we cannot assure that future
incidents will not so impact us.
Security breaches, computer viruses, cyberattacks, hacking and other acts of vandalism are increasing in frequency and
sophistication, and could result in a compromise or breach of the technology that we use to protect our borrowers’ personal
information and transaction data and other information that we must keep secure. Our financial, accounting, data processing or
other operating systems and facilities (or those of our vendors) may fail to operate properly or become disabled as a result of
events that are wholly or partially beyond our control, such as a cyberattack, a spike in transaction volume or unforeseen
catastrophic events, potentially resulting in data loss and adversely affecting our ability to process transactions or otherwise
operate our business. If one or more of these events occurs, this could potentially jeopardize data integrity or confidentiality of
information processed and stored in, or transmitted through, our computer systems and networks. Any failure, interruption or
breach in our cyber security could result in reputational harm, disruption of our customer relationships, or an inability to
originate and service loans and otherwise operate our business. Further, any of these cyber security and operational risks could
expose us to lawsuits by customers for identity theft or other damages resulting from the misuse of their personal information
and possible financial liability, any of which could have a material adverse effect on our results of operations, financial
condition and liquidity.
Regulators may impose penalties or require remedial action if they identify weaknesses in our systems, and we may be
required to incur significant costs to address any identified deficiencies or to remediate any harm caused. A number of states

31
have specific reporting and other requirements with respect to cybersecurity in addition to applicable federal laws. For
instance, the NY DFS Cybersecurity Regulation requires New York insurance companies, banks, and other regulated financial
services institutions - including certain Ocwen entities licensed in the state of New York - to assess their cybersecurity risk
profile. Regulated entities are required, among other things, to adopt the core requirements of a cybersecurity program,
including a cybersecurity policy, effective access privileges, cybersecurity risk assessments, training and monitoring for all
authorized users, and appropriate governance processes. This regulation also requires regulated entities to submit notices to the
NY DFS of any security breaches or other cybersecurity events, and to certify their compliance with the regulation on an annual
basis. In addition, consumers generally are concerned with security breaches and privacy on the Internet, and Congress or
individual states could enact new laws regulating the use of technology in our business that could adversely affect us or result
in significant compliance costs.
As part of our business, we may share confidential customer information and proprietary information with customers,
vendors, service providers, and business partners. The information systems of these third parties may be vulnerable to security
breaches as these third parties may not have appropriate security controls in place to protect the information we share with
them. If our confidential information is intercepted, stolen, misused, or mishandled while in possession of a third party, it could
result in reputational harm to us, loss of customer business, and additional regulatory scrutiny, and it could expose us to civil
litigation and possible financial liability, any of which could have a material adverse effect on our results of operations,
financial condition and liquidity.
Damage to our reputation could adversely impact our financial results and ongoing operations.
Our ability to serve and retain customers and conduct business transactions with our counterparties could be adversely
affected to the extent our reputation is damaged. Our failure to address, or to appear to fail to address, the various regulatory,
operational and other challenges facing Ocwen could give rise to reputational risk that could cause harm to us and our business
prospects. Reputational issues may arise from the following, among other factors:
• negative news about Ocwen or the mortgage industry generally;
• allegations of non-compliance with legal and regulatory requirements;
• ethical issues, including alleged deceptive or unfair servicing or lending practices;
• our practices relating to collections, foreclosures, property preservation, modifications, interest rate adjustments, loans
impacted by natural disasters, escrow and insurance;
• consumer privacy concerns;
• consumer financial fraud;
• data security issues related to our customers or employees;
• cybersecurity issues and cyber incidents, whether actual, threatened, or perceived;
• customer service or consumer complaints;
• legal, reputational, credit, liquidity and market risks inherent in our businesses;
• a downgrade of or negative watch warning on any of our servicer or credit ratings; and
• alleged or perceived conflicts of interest.
The proliferation of social media websites as well as the personal use of social media by our employees and others,
including personal blogs and social network profiles, also may increase the risk that negative, inappropriate or unauthorized
information may be posted or released publicly that could harm our reputation or have other negative consequences, including
as a result of our employees interacting with our customers in an unauthorized manner in various social media outlets. The
failure to address, or the perception that we have failed to address, any of these issues appropriately could give rise to increased
regulatory action, which could adversely affect our results of operations.
The industry in which we operate is highly competitive, and, to the extent we fail to meet these competitive challenges, it
would have a material adverse effect on our business, financial position, results of operations or cash flows.
We operate in a highly competitive industry that could become even more competitive as a result of economic, legislative,
regulatory or technological changes. Competition to service mortgage loans and for mortgage loan originations comes
primarily from commercial banks and savings institutions and non-bank lenders and mortgage servicers. Many of our
competitors are substantially larger and have considerably greater financial, technical and marketing resources, and lower
funding costs. Further, our competitors that are national banks may also benefit from a federal exemption from certain state
regulatory requirements that is applicable to depository institutions. In addition, some of our competitors may have higher risk
tolerances or different risk assessments, which could allow them to consider a wider variety of revenue generating options (e.g.,
originating types of loans that we choose not to originate) and establish more favorable relationships than we can. With the
proliferation of smartphones and technological changes enabling improved payment systems and cheaper data storage, newer
market participants, often called “disruptors,” are reinventing aspects of the financial industry and capturing profit pools
previously enjoyed by existing market participants. As a result, the lending industry could become even more competitive if
new market participants are successful in capturing market share from existing market participants such as ourselves.
Competition to service mortgage loans may result in lower margins. Because of the relatively limited number of servicing

32
clients, our failure to meet the expectations of any significant client could materially impact our business. Ocwen has suffered
reputational damage as a result of our regulatory settlements and the associated scrutiny of our business. We believe this may
have weakened our competitive position against both our bank and non-bank mortgage servicing competitors. These
competitive pressures could have a material adverse effect on our business, financial condition or results of operations.
We are highly dependent on an experienced senior management team, including our President and Chief Executive Officer,
and the loss of the services of one or more of our senior officers could have a material adverse effect on us. In addition,
high turnover of management and non-management employees could harm our business.
We are highly dependent on an experienced management team. We do not maintain key man life insurance relating to our
President and Chief Executive Officer, Glen A. Messina, or any of our other executive officers. The loss of the services of Mr.
Messina or any of our other senior officers could have a material adverse effect on us. We could also be harmed by legal actions
brought by former senior officers after they have ceased employment with Ocwen.
We have experienced elevated turnover among both management and non-management employees in recent years due, in
large part, to the acquisition of PHH, our subsequent integration of the combined company’s business units, and our continued
cost re-engineering plans, which may include further reductions in staffing levels and in the proportion of our workforce based
in the U.S. While planned departures form part of our plan to capture acquisition synergies, there is a risk that employee
departures, even if planned, could lead to operational disruptions, loss of important institutional knowledge or other adverse
impacts on our business.
An inability to attract and retain qualified personnel could harm our business, financial condition and results of operations.
Our future success depends, in part, on our ability to identify, attract and retain highly skilled servicing, lending, finance,
risk, compliance and technical personnel. We face intense competition for qualified individuals from numerous financial
services and other companies, some of which have greater resources, better recent financial performance, fewer regulatory
challenges and better reputations than we do. If we were to be unable to attract and retain the qualified personnel we need to
succeed, our business, financial condition and results of operations could suffer.
We have operations in India and the Philippines that could be adversely affected by changes in the political or economic
stability of these countries or by government policies in India, the Philippines or the U.S.
Approximately 3,400, or 64%, of our employees as of December 31, 2019 are located in India. A significant change in
India’s economic liberalization and deregulation policies could adversely affect business and economic conditions in India
generally and our business in particular. The political or regulatory climate in the U.S. or elsewhere also could change so that it
would not be lawful or practical for us to use international operations in the manner in which we currently use them. For
example, changes in regulatory requirements could require us to curtail our use of lower-cost operations in India to service our
businesses. If we had to curtail or cease our operations in India and transfer some or all of these operations to another
geographic area, we could incur significant transition costs as well as higher future overhead costs that could materially and
adversely affect our results of operations.
We may need to increase the levels of our employee compensation more rapidly than in the past to retain talent in India.
Unless we can continue to enhance the efficiency and productivity of our employees, wage increases in the long-term may
negatively impact our financial performance.
Political activity or other changes in political or economic stability in India could affect our ability to operate our business
effectively. For example, political protests disrupted our Indian operations in multiple cities for a number of days during 2018.
While we have implemented and maintain business continuity plans to reduce the disruption such events cause to our critical
operations, we cannot guarantee that such plans will eliminate any negative impact on our business. Depending on the
frequency and intensity of future occurrences of instability, our Indian operations could be significantly adversely affected.
Our operations in the Philippines are less substantial than our operations in India. However, they are still at risk of being
affected by the same types of risks that affect our Indian operations. If they were to be so affected, our business could be
materially and adversely affected.
There are a number of foreign laws and regulations that are applicable to our operations in India and the Philippines,
including laws and regulations that govern licensing, employment, safety, taxes and insurance and laws and regulations that
govern the creation, continuation and winding up of companies as well as the relationships between shareholders, our corporate
entities, the public and the government in these countries. Non-compliance with the laws and regulations of India or the
Philippines could result in (i) restrictions on our operations in these countries, (ii) fines, penalties or sanctions or (iii)
reputational damage.

33
Our operations are vulnerable to disruptions resulting from severe weather events.
Our operations are vulnerable to disruptions resulting from severe weather events, including our operations in India, the
Philippines, the USVI and Florida. Approximately 3,400, or 64%, of our employees as of December 31, 2019 are located in
India. In recent years, severe weather events caused disruptions to our operations in India, the Philippines, and the USVI and
we incurred expense resulting from the evacuation of personnel and from property damage. While we have implemented and
maintain business continuity plans to reduce the disruption such events cause to our critical operations, we cannot guarantee
that such plans will eliminate any negative impact on our business, including the cost of evacuation and repairs. Consequently,
the occurrence of severe weather events in the future could have a significant adverse effect on our business and results of
operations.
Pursuit of business or asset acquisitions exposes us to financial, execution and operational risks that could adversely affect
us.
We are actively looking for opportunities to grow our business through acquisitions of businesses and assets. The
performance of the businesses and assets we acquire through acquisitions may not match the historical performance of our
other assets. Nor can we assure you that the businesses and assets we may acquire will perform at levels meeting our
expectations. We may find that we overpaid for the acquired businesses or assets or that the economic conditions underlying
our acquisition decision have changed. For example, in 2014, we recognized an impairment loss of the full carrying value of
goodwill totaling $420.2 million, which was primarily associated with certain large acquisitions in prior years. It may also take
several quarters or longer for us to fully integrate newly acquired business and assets into our business, during which period our
results of operations and financial condition may be negatively affected. Further, certain one-time expenses associated with
such acquisitions may have a negative impact on our results of operations and financial condition. We cannot assure you that
acquisitions will not adversely affect our liquidity, results of operations and financial condition.
The risks associated with acquisitions include, among others:
• unanticipated issues in integrating servicing, information, communications and other systems;
• unanticipated incompatibility in servicing, lending, purchasing, logistics, marketing and administration methods;
• unanticipated liabilities assumed from the acquired business;
• not retaining key employees; and
• the diversion of management’s attention from ongoing business concerns.
The acquisition integration process can be complicated and time consuming and could potentially be disruptive to
borrowers of loans serviced by the acquired business. If the integration process is not conducted successfully and with minimal
effect on the acquired business and its borrowers, we may not realize the anticipated economic benefits of particular
acquisitions within our expected timeframe, or we could lose subservicing business or employees of the acquired business. In
addition, integrating operations may involve significant reductions in headcount or the closure of facilities, which may be
disruptive to operations and impair employee morale. Through acquisitions, we may enter into business lines in which we have
not previously operated. Such acquisitions could require additional integration costs and efforts, including significant time from
senior management. We may not be able to achieve the synergies we anticipate from acquired businesses, and we may not be
able to grow acquired businesses in the manner we anticipate. In fact, the businesses we acquire could decrease in size, even if
the integration process is successful.
Further, prices at which acquisitions can be made fluctuate with market conditions. We have experienced times during
which acquisitions could not be made in specific markets at prices that we considered to be acceptable, and we expect that we
will experience this condition in the future. In addition, to finance an acquisition, we may borrow funds, thereby increasing our
leverage and diminishing our liquidity, or we could raise additional equity capital, which could dilute the interests of our
existing shareholders.
The timing of closing of our acquisitions is often uncertain. We have in the past and may in the future experience delays in
closing our acquisitions, or certain aspects of them. For example, we and the applicable seller are often required to obtain
certain regulatory and contractual consents as a prerequisite to closing, such as the consents of GSEs, the FHFA, RMBS
trustees or regulators. Accordingly, even if we and the applicable seller are efficient and proactive, the actions of third parties
can impact the timing under which such consents are obtained. We and the applicable seller may not be able to obtain all the
required consents, which may mean that we are unable to acquire all the assets that we wish to acquire. Regulators may have
questions relating to aspects of our acquisitions and we may be required to devote time and resources responding to those
questions. It is also possible that we will expend considerable resources in the pursuit of an acquisition that, ultimately, either
does not close or is terminated.
Loan putbacks and related liabilities for breaches of representations and warranties regarding sold loans could adversely
affect our business.
34
We have exposure to representation, warranty and indemnification obligations relating to our lending, sales and
securitization activities, and in certain instances, we have assumed these obligations on loans we service. Our contracts with
purchasers of originated loans generally contain provisions that require indemnification or repurchase of the related loans under
certain circumstances. While the language in the purchase contracts varies, such contracts generally contain provisions that
require us to indemnify purchasers of loans or repurchase such loans if:
• representations and warranties concerning loan quality, contents of the loan file or loan underwriting circumstances are
inaccurate;
• adequate mortgage insurance is not secured within a certain period after closing;
• a mortgage insurance provider denies coverage; or
• there is a failure to comply, at the individual loan level or otherwise, with regulatory requirements.
Additionally, in one of the servicing contracts that Homeward acquired in 2008 from Freddie Mac involving non-prime
mortgage loans, it assumed the origination representations and warranties even though it did not originate the loans.
We believe that many purchasers of residential mortgage loans are particularly aware of the conditions under which
originators must indemnify or repurchase loans and under which such purchasers would benefit from enforcing any
indemnification rights and repurchase remedies they may have.
At December 31, 2019, we had outstanding representation and warranty repurchase demands of $47.0 million UPB
(285 loans).
If home values decrease, our realized loan losses from loan repurchases and indemnifications may increase as well. As a
result, our liability for repurchases may increase beyond our current expectations. Depending on the magnitude of any such
increase, our business, financial condition and results of operations could be adversely affected.
We originate and securitize reverse mortgages, which subjects us to risks that could have a material adverse effect on our
business, reputation, liquidity, financial condition and results of operations.
We originate, securitize and service reverse mortgages and we have retained third parties to subservice the reverse
mortgages. The reverse mortgage business is subject to substantial risks, including market, credit, interest rate, liquidity,
operational, reputational and legal risks. Generally, a reverse mortgage is a loan available to seniors aged 62 or older that
allows homeowners to borrow money against the value of their home. No repayment of the mortgage is required until a default
event under the terms of the mortgage occurs, the borrower dies, the borrower moves out of the home or the home is sold. A
decline in the demand for reverse mortgages may reduce the number of reverse mortgages we originate and adversely affect our
ability to sell reverse mortgages in the secondary market. Although foreclosures involving reverse mortgages generally occur
less frequently than forward mortgages, loan defaults on reverse mortgages leading to foreclosures may occur if borrowers fail
to occupy the home as their primary residence, maintain their property or fail to pay taxes or home insurance premiums. A
general increase in foreclosure rates may adversely impact how reverse mortgages are perceived by potential customers and
thus reduce demand for reverse mortgages. Additionally, we could become subject to negative headline risk in the event that
loan defaults on reverse mortgages lead to foreclosures or evictions of the elderly. The HUD HECM reverse mortgage program
has in the past responded to scrutiny around similar issues by implementing rule changes, and may do so in the future. It is not
possible to predict whether any such rule changes would negatively impact us. All of the above factors could have a material
adverse effect on our business, reputation, liquidity, financial condition and results of operations.
If we are unable to fund our tail commitments or securitize our HECM loans (including tails), this could have a material
adverse effect on our business, financial condition, liquidity and results of operations.
We have originated and continue to service HECM loans under which the borrower has additional undrawn borrowing
capacity in the form of undrawn lines of credit. We are obligated to fund future borrowings drawn on that capacity. As
of December 31, 2019, our commitment to fund additional borrowing capacity was $1.5 billion. In addition, we are required to
pay mortgage insurance premiums on behalf of HECM borrowers. We normally fund these obligations on a short-term basis
using our cash resources, and regularly securitize these amounts (along with our servicing fees) through the issuance of tails. In
December 2019, we entered into a revolving credit facility to fund HECM tail advances. However, to the extent our funding
commitments exceed our borrowing capacity under this facility, or if we are unable to renew this 364-day facility on acceptable
terms, we will be dependent on our cash resources to meet these commitments. If our cash resources are insufficient to fund
these amounts and we are unable to fund them through the securitization of such tails, this could have a material adverse effect
on our business, financial condition, liquidity and results of operations.
Our HMBS repurchase obligations may reduce our liquidity, and if we are unable to comply with such obligations, it could
materially adversely affect our business, financial condition, and results of operations.
As an HMBS issuer, we assume the obligation to purchase loans out of the Ginnie Mae securitization pools once the
outstanding principal balance of the related HECM is equal to or greater than 98% of the maximum claim amount (MCA
repurchases). Active repurchased loans are assigned to HUD and payment is typically received within 60 days of repurchase.

35
HUD reimburses us for the outstanding principal balance on the loan up to the maximum claim amount. We bear the risk of
exposure if the amount of the outstanding principal balance on a loan exceeds the maximum claim amount. Inactive
repurchased loans (the borrower is deceased, no longer occupies the property or is delinquent on tax and insurance payments)
are generally liquidated through foreclosure and subsequent sale of REO, with a claim filed with HUD for recoverable
remaining principal and advance balances. The recovery timeline for inactive repurchased loans depends on various factors,
including foreclosure status at the time of repurchase, state-level foreclosure timelines, and the post-foreclosure REO
liquidation timeline. The timing and amount of our obligations with respect to MCA repurchases are uncertain as repurchase is
dependent largely on circumstances outside of our control. MCA repurchases are expected to continue to increase due to the
seasoning of our portfolio, and the increased flow of HECMs and REO that are reaching 98% of their maximum claim amount.
If we do not have sufficient liquidity to comply with our Ginnie Mae repurchase obligations, Ginnie Mae could take
adverse action against us, including terminating us as an approved HMBS issuer. In addition, if we are required to purchase a
significant number of loans with respect to which the outstanding principal balances exceed HUD’s maximum claim amount,
we could be required to absorb significant losses on such loans following assignment to HUD or, in the case of inactive loans,
liquidation and subsequent claim for HUD reimbursement. Further, during the periods in which HUD reimbursement is
pending, our liquidity will be reduced by the repurchase amounts and we will have reduced resources with which to further
other business objectives. For all of the foregoing reasons, our liquidity, business, financial condition, and results of operations
could be materially and adversely impacted by our HMBS repurchase obligations.
Liabilities relating to our past sales of Agency MSRs could adversely affect our business.
We have made representations, warranties and covenants relating to our past sales of Agency MSRs, including sales made
by PHH before we acquired it. To the extent that we (including PHH prior to its acquisition by us) made inaccurate
representations or warranties or if we fail otherwise to comply with our sale agreements, we could incur liability to the
purchasers of these MSRs pursuant to the contractual provisions of these agreements.
Reinsuring risk through our captive reinsurance entity could adversely impact our results of operation and financial
condition.
If our captive reinsurance entity incurs losses from a severe catastrophe or series of catastrophes, particularly in areas
where a significant portion of the insured properties are located, claims that result could substantially exceed our expectations,
which could adversely impact our results of operation and financial condition.
A significant portion of our business is in the states of California, Florida, Texas, New York and Pennsylvania, and our
business may be significantly harmed by a slowdown in the economy or the occurrence of a natural disaster in those states.
A significant portion of the mortgage loans that we service and originate are secured by properties in California, Florida,
Texas, New York and Pennsylvania. Any adverse economic conditions in these markets, including a downturn in real estate
values, could increase loan delinquencies. Delinquent loans are more costly to service and require us to advance delinquent
principal and interest and to make advances for delinquent taxes and insurance and foreclosure costs and the upkeep of vacant
property in foreclosure to the extent that we determine that such amounts are recoverable. We could also be adversely affected
by business disruptions triggered by natural disasters or acts or war or terrorism in these geographic areas.
We may incur litigation costs and related losses if the validity of a foreclosure action is challenged by a borrower or if a
court overturns a foreclosure.
We may incur costs if we are required to, or if we elect to, execute or re-file documents or take other action in our capacity
as a servicer in connection with pending or completed foreclosures. We may incur litigation costs if the validity of a foreclosure
action is challenged by a borrower. If a court were to overturn a foreclosure because of errors or deficiencies in the foreclosure
process, we may have liability to a title insurer of the property sold in foreclosure. These costs and liabilities may not be legally
or otherwise reimbursable to us, particularly to the extent they relate to securitized mortgage loans. In addition, if certain
documents required for a foreclosure action are missing or defective, we could be obligated to cure the defect or repurchase the
loan. A significant increase in litigation costs could adversely affect our liquidity, and our inability to be reimbursed for
servicing advances could adversely affect our business, financial condition or results of operations.
A failure to maintain minimum servicer ratings could have an adverse effect on our business, financing activities, financial
condition or results of operations.
S&P, Moody’s, Fitch and others rate us as a mortgage servicer. Failure to maintain minimum servicer ratings could
adversely affect our ability to sell or fund servicing advances going forward, could affect the terms and availability of debt
financing facilities that we may seek in the future, and could impair our ability to consummate future servicing transactions or
adversely affect our dealings with lenders, other contractual counterparties and regulators, including our ability to maintain our
status as an approved servicer by Fannie Mae and Freddie Mac. The servicer rating requirements of Fannie Mae do not
necessarily require or imply immediate action, as Fannie Mae has discretion with respect to whether we are in compliance with

36
their requirements and what actions it deems appropriate under the circumstances in the event that we fall below their desired
servicer ratings.
Certain of our servicing agreements require that we maintain specified servicer ratings. As a result of our current servicer
ratings, termination rights have been triggered in some non-Agency servicing agreements. While the holders of these
termination rights have not exercised them to date, they have not waived the right to do so, and we could, in the future, be
subject to terminations either as a result of servicer ratings downgrades or future adverse actions by ratings agencies, which
could have an adverse effect on our business, financing activities, financial condition and results of operations. Downgrades in
our servicer ratings could also affect the terms and availability of advance financing or other debt facilities that we may seek in
the future. Our failure to maintain minimum or specified ratings could adversely affect our dealings with contractual
counterparties, including GSEs, Ginnie Mae and regulators, any of which could have a material adverse effect on our business,
financing activities, financial condition and results of operations. To date, terminations as servicer as a result of a breach of any
of these provisions have been minimal.
Our earnings are subject to volatility.
Our operating results have been and may in the future be significantly affected by inter-period variations in our results of
operations, including variations due to sales or acquisitions of MSRs or changes in the value of MSRs due to, among other
factors, increases or decreases in prepayment speeds, delinquencies or defaults.
Certain non-recurring gains and losses have significantly affected our operating results in the past, and other non-recurring
gains and losses may affect our operating results in future periods, resulting in substantial inter-period variations in financial
performance. In particular, our financial results for the year ended December 31, 2019 reflect substantial costs relating to the
integration of PHH, including costs relating to severance agreements and technology transitions. These costs may continue to
have a significant impact on our future financial results.
We are subject to, among other things, requirements regarding the effectiveness of our internal controls over financial
reporting. If our internal controls over financial reporting are found to be inadequate, our financial condition and results of
operations and the trading price of our common stock may be materially and adversely affected.
Effective internal controls are necessary for us to provide reliable financial reports and prevent fraud. In addition, Section
404 of the Sarbanes-Oxley Act of 2002, or the Sarbanes-Oxley Act, requires us to evaluate and report on our internal control
over financial reporting. As further detailed under Item 9A, Controls and Procedures, we concluded that, as of December 31,
2019, internal control over financial reporting is effective. However, during 2017, we identified a material weakness in internal
control over financial reporting that required remediation and subsequent testing and evaluation before we could conclude that
our internal control over financial reporting was once again effective. Because of its inherent limitations, internal control over
financial reporting may not prevent or detect fraud or misstatements. In addition, projections of any evaluation of effectiveness
to future periods are subject to the risk that controls may become inadequate because of changes in conditions or that the degree
of compliance with the policies or procedures may deteriorate. Fraud or misstatement could adversely affect our financial
condition and results of operations. Failure to implement required new or improved controls, or difficulties encountered in their
implementation, could harm our results of operations or cause us to fail to meet our reporting obligations. In addition, investors
could lose confidence in our financial reports and the trading price of our common stock may be adversely affected if our
internal control over financial reporting is found by management or by our independent registered public accounting firm not to
be adequate.
Changes in the method of determining the London Interbank Offered Rate (LIBOR), or the replacement of LIBOR with an
alternative reference rate, may adversely affect interest rates, our business, and financial markets as a whole.
On July 27, 2017, the Financial Conduct Authority in the U.K. announced that it would phase out LIBOR as a benchmark
by the end of 2021. It is unclear whether new methods of calculating LIBOR will be established such that it continues to exist
after 2021, or whether different benchmark rates used to price indebtedness will develop. We presently have no debt facilities
with maturities beyond 2021 that incorporate LIBOR and do not provide for its phase-out. As we renew or replace our debt
facilities with maturities prior to the end of 2021 that currently incorporate LIBOR, we will need to work with our
counterparties to incorporate alternative benchmarks. There is presently substantial uncertainty relating to the process and
timeline for developing LIBOR alternatives, how widely any given alternative will be adopted by parties in the financial
markets, and the extent to which alternative benchmarks may be subject to volatility or present risks and challenges that
LIBOR does not. It is possible that we will disagree with our contractual counterparties over which alternative benchmark to
adopt, which could make renewing or replacing our debt facilities and other agreements more complex. In addition, to the
extent our adoption of a benchmark alternative impacts the interest rates payable by borrowers, it could lead to borrower
complaints and litigation. Consequently, it is difficult to predict what effect, if any, the phase-out of LIBOR and the use of
alternative benchmarks may have on our business or on the overall financial markets. If LIBOR alternatives re-allocate risk
among parties in a way that is disadvantageous to market participants such as Ocwen, if there is disagreement among market

37
participants, including borrowers, over which alternative benchmark to adopt, or if uncertainty relating to the LIBOR phase-out
disrupts financial markets, it could have a material adverse effect on our financial position, results of operations, and liquidity.
Tax Risks
Failure to retain the tax benefits provided by the USVI would adversely affect our financial condition and results of
operations.
During 2019, in connection with our acquisition of PHH, overall corporate simplification and cost reduction efforts, we
executed a legal entity reorganization whereby OLS, through which we previously conducted a substantial portion of our
servicing business, was merged into PMC. OLS was previously the wholly-owned subsidiary of OMS, which was incorporated
and headquartered in the USVI prior to its merger with Ocwen USVI Services, LLC, an entity which is also organized and
headquartered in the USVI. The USVI has an Economic Development Commission (EDC) that provides certain tax benefits to
qualified businesses. OMS received its certificate to operate as a company qualified for EDC benefits in October 2012 and as a
result received significant tax benefits. Following our legal entity reorganization, we are no longer able to avail ourselves of
favorable tax treatment for our USVI operations on a going forward basis. However, if the EDC were to determine that we
failed to conduct our USVI operations in compliance with EDC qualifications prior to our reorganization, the value of the EDC
benefits corresponding to the period prior to the reorganization could be reduced or eliminated, resulting in an increase to our
tax expense. In addition, under our agreement with the EDC, we remain obligated to continue to operate Ocwen USVI
Services, LLC in compliance with EDC requirements through 2042. If we fail to maintain our EDC qualification, we could be
alleged to be in violation of our EDC commitments and the EDC could take adverse action against us, which could include
demands for payment and reimbursement of past tax benefits, and it could result in the loss of anticipated income tax refunds.
If any of these events were to occur, it could adversely affect our financial condition and results of operations.
We may be subject to increased United States federal income taxation.
OMS was incorporated under the laws of the USVI and operated in a manner that caused a substantial amount of its net
income to be treated as not related to a trade or business within the United States, which caused such income to be exempt from
United States federal income taxation. However, because there are no definitive standards provided by the Internal Revenue
Code (the Code), regulations or court decisions as to the specific activities that constitute being engaged in the conduct of a
trade or business within the United States, and as any such determination is essentially factual in nature, we cannot assure you
that the IRS will not successfully assert that OMS was engaged in a trade or business within the United States with respect to
that income.
If the IRS were to successfully assert that OMS had been engaged in a trade or business within the United States with
respect to that income in any taxable year, it may become subject to United States federal income taxation on such income. Our
tax returns and positions are subject to review and audit by federal and state taxing authorities. An unfavorable outcome to a tax
audit could result in higher tax expense.
The recently enacted comprehensive tax reform legislation could adversely affect our business and financial condition.
On December 22, 2017, President Trump signed into law new legislation that significantly revises the Internal Revenue
Code of 1986, as amended. The U.S. Tax Cuts and Jobs Act of 2017 (TCJA) significantly changed the taxation of U.S.-based
multinational corporations. The U.S. Treasury Department, the U.S. Internal Revenue Service and state tax authorities have
issued and are expected to continue to issue guidance on how the provisions of the TCJA will be applied or otherwise
administered. As regulations and guidance evolve with respect to the TCJA, the results of newly issued guidance could be
adverse and may differ from previous estimates. The TCJA, among other things, contains significant changes to corporate
taxation, including reduction of the corporate tax rate from a top marginal rate of 35% to a flat rate of 21%, limitation of the tax
deduction for interest expense and net operating loss carryforwards, one time taxation of offshore earnings at reduced rates
regardless of whether they are repatriated, elimination of deferral of U.S. tax on foreign earnings (subject to certain important
exceptions), a new minimum tax enacted to prevent companies from stripping earnings out of the U.S. through U.S. tax
deductible payments made to foreign affiliates, immediate deductions for certain new investments instead of deductions for
depreciation expense over time, and modifying or repealing many business deductions and credits. Notwithstanding the
reduction in the corporate income tax rate, the overall impact of the new federal tax law is uncertain and our business and
financial condition could be adversely affected.
In addition, state legislation and administrative guidance is still evolving. Certain states have recently enacted conformity
legislation or decoupling legislation with uncertainty if, and to what extent, the various remaining states will conform to the
newly enacted federal tax law. The impact of this tax reform on holders of our common stock is also uncertain and could be
adverse.
Changes in taxation, as well as changes to tax filing positions resulting from examinations of our tax returns, and the
ability to quantify such changes could adversely affect Ocwen’s financial results.

38
Ocwen is subject to taxation by the various taxing authorities at the Federal, state and local levels where it does business,
both in the U.S. and outside the U.S. Legislation or regulation, which could affect Ocwen’s tax burden, could be enacted by any
of these governmental authorities. Ocwen cannot predict the timing or extent of such tax-related developments, which could
have a negative impact on the financial results. In addition, in the ordinary course of business, our tax filings are subject to
examination by these same taxing jurisdictions. The results of an examination of a company’s tax positions by various taxing
authorities is inherently uncertain and could result in the disallowance of tax deductions, a reduction in the amount of and/or
timing for receiving anticipated tax refunds, and other potential adjustments which could have a negative impact on our
financial results.
Any “ownership change” as defined in Section 382 of the Internal Revenue Code could substantially limit our ability to
utilize our net operating losses carryforwards and other deferred tax assets.
As of December 31, 2019, Ocwen had U.S. federal net operating loss (NOL) carryforwards of approximately $306.5
million, which we estimate to be worth approximately $64.4 million to Ocwen under our present assumptions related to
Ocwen’s various relevant jurisdictional tax rates as a result of recently passed tax legislation (which assumptions reflect a
significant degree of uncertainty). As of December 31, 2019, Ocwen had state NOL and state tax credit carryforwards which we
estimate to be worth approximately $70.3 million. As of December 31, 2019, Ocwen had foreign tax credit carryforwards of
$0.01 million in the U.S. jurisdiction. As of December 31, 2019, Ocwen had disallowed interest under Section 163(j) of $51.9
million in the U.S. jurisdiction and $0.0 million in the USVI jurisdiction. NOL carryforwards, Section 163(j) disallowed
interest carryforwards and certain built-in losses or deductions may be subject to annual limitations under Internal Revenue
Code Section 382 (Section 382) (or comparable provisions of foreign or state law) in the event that certain changes in
ownership were to occur as measured under Section 382. In addition, tax credit carryforwards may be subject to annual
limitations under Internal Revenue Code Section 383 (Section 383). We periodically evaluate whether certain changes in
ownership have occurred as measured under Section 382 that would limit our ability to utilize our NOLs, tax credit
carryforwards, deductions and/or certain built-in losses. If it is determined that an ownership change(s) has occurred, there may
be annual limitations under Sections 382 and 383 (or comparable provisions of foreign or state law).
We have evaluated whether we experienced an ownership change under these provisions, and determined that an
ownership change did occur in January 2015 and in December 2017 in the U.S. jurisdiction, which also results in an ownership
change under Section 382 in the USVI jurisdiction. In addition, a Section 382 ownership change occurred at PHH when Ocwen
acquired the stock of PHH in October 2018. PHH was a loss corporation as defined under Section 382 at the date of the
acquisition. PHH also had an existing Section 382 ownership change on March 31, 2018. For certain states, an additional
Section 382 ownership change occurred on August 9, 2017. These Section 382 ownership changes may limit our ability to fully
utilize NOLs, tax credit carryforwards, deductions and/or certain built-in losses that existed as of each respective ownership
change date in the various jurisdictions.
Due to the Section 382 and 383 limitations and the maximum carryforward period for our NOLs and tax credits, we will be
unable to fully recognize certain deferred tax assets. Accordingly, as of December 31, 2018, we reduced our gross deferred tax
asset related to our U.S. federal and USVI NOLs by $160.9 million, our foreign tax credit deferred tax asset by $29.5 million
and corresponding valuation allowance by $55.7 million. The realization of all or a portion of our deferred income tax assets
(including NOLs and tax credits) is dependent upon the generation of future taxable income during the statutory carryforward
periods. In addition, the limitation on the utilization of our NOL and tax credit carryforwards could result in Ocwen incurring a
current tax liability in future tax years. Our inability to utilize our pre-ownership change NOL carryforwards, Section 163(j)
disallowed interest carryforwards, any future recognized built-in losses or deductions, and tax credit carryforwards could have
an adverse effect on our financial condition, results of operations and cash flows. Finally, any future changes in our ownership
or sale of our stock could further limit the use of our NOLs and tax credits in the future.
As part of our Section 382 evaluation and consistent with the rules provided within Section 382, Ocwen relies strictly on
the existence or absence of, as well as the information contained in, certain publicly available documents (e.g., Schedule 13D,
Schedule 13G or other documents filed with the SEC) to identify shareholders that own a 5-percent or greater interest in Ocwen
stock throughout the period tested. Further, Ocwen relies on such public filings to identify dates in which such 5-percent
shareholders acquired, disposed, or otherwise transacted in Ocwen common stock. As the requirement for filing such notices of
ownership from the SEC is to report beneficial ownership, as opposed to actual economic ownership of the stock of Ocwen,
certain SEC filings may not represent ownership in Ocwen stock that should be considered in determining whether Ocwen
experienced an ownership change under the Section 382 rules. Notwithstanding the preceding sentences (regarding Ocwen’s
ability to rely on the existence and absence of information in publicly filed Schedules 13D and 13G), the rules prescribed in
Section 382 and the regulations thereunder provide that Ocwen may (but is not required to) seek additional clarification from
shareholders filing such Schedules 13D and 13G if there are questions or uncertainty regarding the true economic ownership of
shares reported in such filing (whether due to ambiguity in the filing, an overly complex ownership structure, the type of
instruments owned and reported in the filings, etc.) (often referred to “actual knowledge” questionnaires). Such information can
be sought on a filer by filer basis (i.e., there is no requirement that if actual knowledge is sought with respect to one

39
shareholder, actual knowledge must be sought with respect to all shareholders that filed schedules 13D or 13G). While the
seeking of actual knowledge can be beneficial in some instances it may be detrimental in others. Once such actual knowledge is
received, Section 382 requires the inclusion of such actual knowledge, even if such inclusion is detrimental to the conclusion
reached.
Ocwen has performed its analysis of the rules under Section 382 and, based on all currently available information,
identified, in 2018, that it experienced an ownership change for Section 382 purposes in January 2015 and December 2017.
Prior to 2018, Ocwen was aware of shareholder activity in 2015 and 2017 that may have caused a Section 382 ownership
change(s) but determined that additional information could potentially be obtained from certain shareholders that would
indicate a Section 382 ownership change had not occurred. In completing this analysis, Ocwen identified several shareholders
that filed a schedule 13G during the period disclosing a greater than 5-percent interest in Ocwen stock where beneficial versus
economic ownership of the stock was unclear and Ocwen therefore requested further details. As of the date of this Form 10-K,
Ocwen has not received all requested responses from selected shareholders and will continue to consider such shareholders as
economic owners of Ocwen’s stock until actual knowledge is otherwise received.
Ocwen is continuing to monitor the ownership in its stock to evaluate information that will become available later in 2020
and that may result in a different outcome for Section 382 purposes and our future cash tax obligations. As part of this
monitoring, Ocwen periodically evaluates whether it is appropriate and beneficial to retroactively seek actual knowledge on
certain previously identified and included 5-percent shareholders, whereby, depending on the responses received, Ocwen may
conclude that either the January 2015 or December 2017 Section 382 ownership changes may have instead occurred on a
different date, or did not occur at all. As such, our analysis regarding the amount of tax attributes that may be available to offset
taxable income in the future without restrictions imposed by Section 382 may continue to evolve.
The reorganization of our USVI operations could adversely affect our business and financial condition.
During 2019, in connection with our acquisition of PHH, overall corporate simplification and cost reduction efforts, we
executed a legal entity reorganization whereby two primary licensed entities (PMC and OLS) would be combined by merging
OLS into PMC. OLS was previously the wholly-owned subsidiary of OMS, an entity that was incorporated and headquartered
in the USVI. As a result of this merger, a portion of our USVI operations and assets were transferred to the U.S. At this time,
we expect the merger to be treated as a reorganization that will result in efficiencies and operational cost savings through
reduced complexity and a simplification of our global structure.
Although we expect the reorganization to result in efficiencies and operational cost savings, it is uncertain how the
reorganization will ultimately impact Ocwen from a U.S. federal, state and USVI income tax perspective. We are continuing to
evaluate the impact of the new U.S. tax legislation and guiding regulations (which are still being promulgated and finalized) on
our global tax position. It is possible that our interpretation of the new tax legislation and related guidance that has been
provided to date, and for which we are relying on to conclude upon the tax consequences of the reorganization and the future
business operations, will not be consistent with final guidance provided by the IRS. In addition, the reorganization of the USVI
operations could result in a write-down of our net deferred tax assets, including our NOL carryforwards, as well as a permanent
loss of our EDC benefits in the USVI. Finally, the IRS or the Bureau of Internal Revenue may challenge our conclusions
regarding the taxation associated with the reorganization and future business operations which could result in an increase to our
current income tax obligations. The reorganization and future business operations could have an adverse effect on our financial
condition, results of operations and cash flows due to the uncertainty of how the new U.S. tax legislation will impact our global
tax position, as well as the other factors noted above.
Risks Relating to Ownership of Our Common Stock
Our common stock price experiences substantial volatility and has dropped significantly on a number of occasions in recent
periods, which may affect your ability to sell our common stock at an advantageous price.
The market price of our shares of common stock has been, and may continue to be, volatile. For example, the closing
market price of our common stock on the New York Stock Exchange fluctuated during 2019 between $1.27 per share and $2.41
per share and the closing stock price on February 21, 2020 was $1.40 per share. Therefore, the volatility and recent decline in
our stock price may affect your ability to sell our common stock at an advantageous price. Market price fluctuations in our
common stock may be due to factors both within and outside our control, including regulatory or legal actions, acquisitions,
dispositions or other material public announcements or speculative trading in our stock (e.g., traders “shorting” our common
stock), as well as a variety of other factors including, but not limited to those set forth under “Risk Factors” and “Forward-
Looking Statements.”
In addition, the stock markets in general, including the New York Stock Exchange, have, at times, experienced extreme
price and trading fluctuations. These fluctuations have resulted in volatility in the market prices of securities that often has been
unrelated or disproportionate to changes in operating performance. These broad market fluctuations may adversely affect the
market prices of our common stock.

40
When the market price of a company's shares drops significantly, shareholders often institute securities class action
lawsuits against the company. A lawsuit against us, even if unsuccessful, could cause us to incur substantial costs and could
divert the time and attention of our management and other resources. Further, if the average closing price of our stock over
thirty consecutive trading days were to fall below $1.00, we would need to take immediate steps to avoid de-listing by the New
York Stock Exchange. Such measures could cause us to incur substantial costs and divert management attention, and could
include implementing a reverse stock split, which would entail additional risk, and success in preventing de-listing would not
be assured.
We have several large shareholders, and such shareholders may vote their shares to influence matters requiring shareholder
approval.
Based on SEC filings, certain shareholders, such as investors Deer Park Road Management Company, LP and Leon G.
Cooperman, own or control significant amounts of our common stock. These and our other large shareholders each have the
ability to vote a meaningful percentage of our outstanding common stock on all matters put to a vote of our shareholders. As a
result, these shareholders could influence matters requiring shareholder approval, including the amendment of our articles of
incorporation, the approval of mergers or similar transactions and the election of directors. For instance, we held a special
meeting of shareholders in November 2018 in order to implement an amendment to our articles of incorporation that
management believed was necessary to help us preserve certain tax assets, but in part due to the fact that we did not receive the
vote of several large shareholders, the proposal was not adopted by our shareholders. If, in the future, situations arise in which
management and certain large shareholders have divergent views, we may be unable to take actions management believes to be
in the best interests of Ocwen.
Further, certain of our large shareholders also hold significant percentages of stock in companies with which we do business. It
is possible these interlocking ownership positions could cause these shareholders to take actions based on factors other than solely
what is in the best interests of Ocwen.
Our board of directors may authorize the issuance of additional securities that may cause dilution and may depress the price
of our securities.
Our charter permits our board of directors, without our stockholders’ approval, to:
• authorize the issuance of additional common stock or preferred stock in connection with future equity offerings or
acquisitions of securities or other assets of companies; and
• classify or reclassify any unissued common stock or preferred stock and to set the preferences, rights and other terms
of the classified or reclassified shares, including the issuance of shares of preferred stock that have preference rights
over the common stock and existing preferred stock with respect to dividends, liquidation, voting and other matters or
shares of common stock that have preference rights over common stock with respect to voting.
While any such issuance would be subject to compliance with the terms of our debt and other agreements, our issuance of
additional securities could be substantially dilutive to our existing stockholders and may depress the price of our common
stock.
Future offerings of debt securities, which would be senior to our common stock in liquidation, or equity securities, which
would dilute our existing stockholders’ interests and may be senior to our common stock in liquidation or for the purposes
of distributions, may harm the market price of our securities.
We will continue to seek to access the capital markets from time to time and, subject to compliance with our other
contractual agreements, may make additional offerings of term loans, debt or equity securities, including senior or subordinated
notes, preferred stock or common stock. We are not precluded by the terms of our charter from issuing additional indebtedness.
Accordingly, we could become more highly leveraged, resulting in an increase in debt service obligations and an increased risk
of default on our obligations. If we were to liquidate, holders of our debt and lenders with respect to other borrowings would
receive a distribution of our available assets before the holders of our common stock. Additional equity offerings by us may
dilute our existing stockholders’ interest in us or reduce the market price of our existing securities. Because our decision to
issue securities in any future offering will depend on market conditions and other factors beyond our control, we cannot predict
or estimate the amount, timing or nature of our future offerings. Further, conditions could require that we accept less favorable
terms for the issuance of our securities in the future. Thus, our existing stockholders will bear the risk of our future offerings
reducing the market price of our securities and diluting their ownership interest in us.
Because of certain provisions in our organizational documents and regulatory restrictions, takeovers may be more difficult,
possibly preventing you from obtaining an optimal share price. In addition, significant investments in our common stock
may be restricted, which could impact demand for, and the trading price of, our common stock.
Our amended and restated articles of incorporation provide that the total number of shares of all classes of capital stock
that we have authority to issue is 220 million, of which 200 million are common shares and 20 million are preferred shares. Our

41
board of directors has the authority, without a vote of the shareholders, to establish the preferences and rights of any preferred
or other class or series of shares to be issued and to issue such shares. The issuance of preferred shares could delay or prevent a
change in control. Since our board of directors has the power to establish the preferences and rights of the preferred shares
without a shareholder vote, our board of directors may give the holders of preferred shares preferences, powers and rights,
including voting rights, senior to the rights of holders of our common shares. In addition, our bylaws include provisions that,
among other things, require advance notice for raising business or making nominations at meetings, which could impact the
ability of a third party to acquire control of us or the timing of acquiring such control.
Third parties seeking to acquire us or make significant investments in us must do so in compliance with state regulatory
requirements applicable to licensed mortgage servicers and lenders. Many states require change of control applications for
acquisitions of “control” as defined under each state’s laws and regulation, which may apply to an investment without regard to
the intent of the investor. For example, New York has a control presumption triggered at 10% ownership of the voting stock of
the licensee or of any person that controls the licensee. In addition, we have licensed insurance subsidiaries in New York and
Vermont. Accordingly, there can be no effective change in control of Ocwen unless the person seeking to acquire control has
made the relevant filings and received the requisite approvals in New York and Vermont. These regulatory requirements may
discourage potential acquisition proposals or investments, may delay or prevent a change in control of us and may impact
demand for, and the trading price of, our common stock.
ITEM 1B. UNRESOLVED STAFF COMMENTS
None.
ITEM 2. PROPERTIES
The following table sets forth information relating to our principal facilities at December 31, 2019:
Location Owned/Leased Square Footage
Principal executive offices
West Palm Beach, Florida Leased 51,546
Document storage and imaging facility
West Palm Beach, Florida Leased 51,931
Business operations and support offices
U.S. facilities:
Mt. Laurel, New Jersey (1) Leased 483,896
Rancho Cordova, California (2) Leased 53,107
Houston, Texas (3) Leased 9,653
St. Croix, USVI (4) Leased 6,096
Offshore facilities (4)
Bangalore, India Leased 128,606
Mumbai, India Leased 96,696
Pune, India (5) Leased 88,683
Manila, Philippines Leased 39,329
Former operations and support offices no longer utilized
Waterloo, Iowa (6) Owned 154,980
Fort Washington, Pennsylvania (6) Leased 77,026
Westampton, New Jersey (7) Leased 71,164
Addison, Texas (6) Leased 39,646
Bannockburn, Illinois (7) Leased 36,188
42
(1) The Mt. Laurel facility includes two buildings, one with 376,122 square feet of space supporting our servicing and lending operations, as
well as our corporate functions. We ceased using 124,795 square feet as a result of the reduction in headcount. The second building has
107,774 square feet of space, all of which is subleased.
(2) Primarily supports reverse lending operations.
(3) Primarily supports commercial operations.
(4) Primarily supports servicing operations.
(5) We ceased using approximately half of the Pune facility as a result of a reduction in headcount. We did not renew our lease for 44,355
square feet of space on January 1, 2020.
(6) We ceased operations in these facilities during 2019 and the space is currently unoccupied. We have listed the Waterloo property for sale.
The Fort Washington lease expires in June 2020. The Addison lease, which expires in 2025, is currently being marketed for sublease.
(7) The Westampton and Bannockburn facilities are former PHH facilities. The Westampton lease, which expires in December 2021 is
currently subleased and the Bannockburn lease expires in March 2020.
In addition to the facilities listed in the table above, we also lease other small facilities in Glendale, California (ceased
operations in 2019); Irvine, California (occupied); and Atlanta, Georgia (ceased operations in 2019 and currently subleased).
ITEM 3. LEGAL PROCEEDINGS
See Note 26 — Contingencies to the Consolidated Financial Statements. That information is incorporated into this item by
reference.
ITEM 4. MINE SAFETY DISCLOSURES
Not applicable.
PART II
ITEM 5. MARKET FOR REGISTRANT’S COMMON EQUITY, RELATED STOCKHOLDER MATTERS AND
ISSUER PURCHASES OF EQUITY SECURITIES
Price Range of Our Common Stock
The common stock of Ocwen Financial Corporation is traded under the symbol “OCN” on the New York Stock Exchange
(NYSE).
Dividends
We have never declared or paid cash dividends on our common stock. We currently do not intend to pay cash dividends in
the foreseeable future but intend to reinvest earnings in our business. The timing and amount of any future dividends will be
determined by our Board of Directors and will depend, among other factors, upon our earnings, financial condition, cash
requirements, the capital requirements of subsidiaries and investment opportunities at the time any such payment is considered.
In addition, the covenants relating to certain of our borrowings contain limitations on our payment of dividends. Our Board of
Directors has no obligation to declare dividends on our common stock under Florida law or our amended and restated articles
of incorporation.

43
Stock Return Performance
The following graph compares the cumulative total return on the common stock of Ocwen Financial Corporation since
December 31, 2014, with the cumulative total return on the stocks included in Standard & Poor’s 500 Market Index and
Standard & Poor’s Diversified Financials Market Index. The graph assumes that $100 was invested in our common stock and in
each index on December 31, 2014 and the reinvestment of all dividends.
Period Ending
Index 12/31/2014 12/31/2015 12/31/2016 12/31/2017 12/31/2018 12/31/2019
Ocwen Financial Corporation $ 100.00 $ 46.16 $ 35.70 $ 20.73 $ 8.87 $ 9.07
S&P 500 $ 100.00 $ 100.88 $ 110.50 $ 131.96 $ 123.73 $ 159.45
S&P 500 Diversified Financials $ 100.00 $ 89.74 $ 106.63 $ 131.50 $ 117.01 $ 143.74
(1) Copyright © 2017 S&P Dow Jones Indices LLC, a division of S&P Global. All rights reserved. Redistribution or reproduction in whole
or in part are prohibited without written permission of S&P Dow Jones Indices LLC. S&P 500® and S&P® are registered trademarks of
Standard & Poor's Financial Services LLC, a division of S&P Global (S&P); DOW JONES is a registered trademark of Dow Jones
Trademark Holdings LLC (Dow Jones); and these trademarks have been licensed for use by S&P Dow Jones Indices LLC. S&P Dow
Jones Indices LLC, Dow Jones, S&P and their respective affiliates (S&P Dow Jones Indices) makes no representation or warranty,
express or implied, as to the ability of any index to accurately represent the asset class or market sector that it purports to represent and
S&P Dow Jones Indices and its third-party licensors shall have no liability for any errors, omissions, or interruptions of any index or the
data included therein. All data and information is provided by S&P DJI "as is". Past performance is not an indication or guarantee of
future results.
This performance graph shall not be deemed “filed” for purposes of Section 18 of the Securities Exchange Act of 1934, as
amended, or incorporated by reference into any filing by us under the Securities Act of 1933, as amended, except as shall be
expressly set forth by specific reference in such filing.
Number of Holders of Common Stock
On February 21, 2020, 134,948,008 shares of our common stock were outstanding and held by approximately 99 holders
of record. Such number of stockholders does not reflect the number of individuals or institutional investors holding our stock in
nominee name through banks, brokerage firms and others.
Unregistered Sales of Equity Securities and Use of Proceeds

44
All unregistered sales of equity securities have been previously reported.
Purchases of Equity Securities by the Issuer and Affiliates
There were no repurchases of our common stock during the fourth quarter of the year ended December 31, 2019.
ITEM 6. SELECTED FINANCIAL DATA (Dollars in thousands, except per share data and unless otherwise
indicated)
The selected historical consolidated financial information set forth below should be read in conjunction with Business,
Management’s Discussion and Analysis of Financial Condition and Results of Operations, our Consolidated Financial
Statements and the Notes to the Consolidated Financial Statements. The historical financial information presented may not be
indicative of our future performance.
December 31,
2019 2018 2017 2016 2015
Selected Balance Sheet Data
Total Assets $ 10,406,199 $ 9,394,216 $ 8,403,164 $ 7,655,663 $ 7,380,308
Loans held for sale $ 275,269 $ 242,622 $ 238,358 $ 314,006 $ 414,046
Loans held for investment 6,292,938 5,498,719 4,715,831 3,565,716 2,488,253
Advances and match funded advances 1,056,523 1,186,676 1,356,393 1,709,846 2,151,066
Mortgage servicing rights 1,486,395 1,457,149 1,008,844 1,042,978 1,138,569
Total Liabilities $ 9,994,188 $ 8,839,511 $ 7,856,290 $ 7,000,380 $ 6,525,670
HMBS-related borrowings $ 6,063,435 $ 5,380,448 $ 4,601,556 $ 3,433,781 $ 2,391,362
Other financing liabilities (1) 972,595 1,062,090 520,943 497,900 601,347
Match funded liabilities 679,109 778,284 998,618 1,280,997 1,584,049
Long-term other secured borrowings (1) 511,280
632,694
704,076
799,504
831,309
Total equity $ 412,011 $ 554,705 $ 546,874 $ 655,283 $ 854,638
Residential Loans and Real Estate Serviced or Subserviced for Others
Count 1,419,943 1,562,238 1,221,695 1,393,766 1,624,762
UPB $ 212,366,431 $ 256,000,490 $ 179,352,553 $ 209,092,130 $ 250,966,112

45
For the Years Ended December 31,
2019 2018 2017 2016 2015
Selected Results of Operations Data(2)
Revenue
Servicing and subservicing fees $ 975,507 $ 937,083 $ 991,597 $ 1,188,229 $ 1,532,865
Gain on loans held for sale, net 38,300 37,336 57,183 51,011 104,754
Reverse mortgage revenue, net 86,309 60,237 75,515 71,681 46,442
Other 23,259 28,389 70,281 76,242 57,037
Total revenue 1,123,375 1,063,045 1,194,576 1,387,163 1,741,098
MSR valuation adjustments, net (120,876 ) (153,457 ) (52,962 ) (32,978 ) (99,194 )
Operating expenses 673,939 779,039 945,683 1,190,276 1,378,990
Other income (expense)
Interest expense (114,129 ) (103,371 ) (126,927 ) (178,183 ) (213,580 )
Pledged MSR liability expense (372,089 ) (171,670 ) (236,311 ) (234,400 ) (268,793 )
Bargain purchase gain (3) (381 ) 64,036 — — —
Gain on sale of MSRs, net (4) 453 1,325 10,537 8,492 83,921
Other, net 31,095 7,655 12,797 33,821 5,677
Other expense, net (455,051 ) (202,025 ) (339,904 ) (370,270 ) (392,775 )
Loss from continuing operations before
income taxes (126,491 ) (71,476 ) (143,973 ) (206,361 ) (129,861 )
Income tax expense (benefit) (5) 15,634 529 (15,516 ) (6,986 ) 116,851
Loss from continuing operations (142,125 ) (72,005 ) (128,457 ) (199,375 ) (246,712 )
Income from discontinued operations, net of tax —
1,409
—
—
—
Net loss (142,125 ) (70,596 ) (128,457 ) (199,375 ) (246,712 )
Net loss (income) attributable to non-controlling interests —
(176 ) 491
(387 ) (305 )
Net loss attributable to Ocwen stockholders $ (142,125 ) $ (70,772 ) $ (127,966 ) $ (199,762 ) $ (247,017 )
Earnings (loss) per share - Basic and
Diluted
Continuing operations $ (1.06 ) $ (0.54 ) $ (1.01 ) $ (1.61 ) $ (1.97 )
Discontinued operations $ — $ 0.01 $ — $ — $ —
Total attributable to Ocwen stockholders $ (1.06 ) $ (0.53 ) $ (1.01 ) $ (1.61 ) $ (1.97 )
Weighted average common shares
outstanding
Basic 134,444,402 133,703,359 127,082,058 123,990,700 125,315,899
Diluted (6) 134,444,402 133,703,359 127,082,058 123,990,700 125,315,899
(1) In the consolidated balance sheets at December 31, 2018, 2017, 2016 and 2015, we reclassified borrowings with an outstanding balance
of $65.5 million, $72.6 million, $81.1 million and $96.5 million, respectively, from Other financing liabilities to Other secured
borrowings to conform to the current year presentation. See the Reclassifications section of Note 1 — Organization, Business
Environment, Basis of Presentation and Significant Accounting Policies for additional information.
(2) Certain amounts in the consolidated statements of operations for 2015 - 2018 have been reclassified to conform to the current year
presentation, including presentation of the MSR valuation adjustments, net line item separately from Operating expenses and adding
new line items for Reverse mortgage revenue, net (without any impact on total Revenue) and Pledged MSR liability expense (previously

46
included in Interest expense, without any impact on Other income (expense)). Reclassifications of prior years to present Reverse
mortgage revenue, net as a separate revenue line item on the face of the statement of operations are provided in the table below. See the
Reclassifications section of Note 1 — Organization, Business Environment, Basis of Presentation and Significant Accounting Policies for additional information.
Years ended December 31,
2018 2017 2016 2015
From Gain on loans held for sale, net $ 40,407 $ 46,219 $ 39,380 $ 30,215
From Other revenue, net 22,577 31,517 33,910 17,295
From Servicing and subservicing fees (2,747 ) (2,221 ) (1,609 ) (1,068 )
To Reverse mortgage revenue, net (New line item) 60,237 75,515 71,681 46,442
Total revenue $ — $ — $ — $ —
(3) Recognized in connection with the acquisition of PHH on October 4, 2018. See Note 2 — Business Acquisition to the Consolidated
Financial Statements for additional information.
(4) During 2019, 2018, 2017, 2016 and 2015, we sold certain of our MSRs relating to loans with a UPB of $140.8 million, $901.3 million,
$219.4 million, $3.7 billion and $87.6 billion, respectively.
(5) Income tax expense for 2015 includes a $97.1 million provision to establish valuation allowances relating to deferred tax assets in our
U.S. and USVI tax jurisdictions. See Note 20 — Income Taxes to the Consolidated Financial Statements for additional information.
(6) For 2015 - 2019, we have excluded the effect of all dilutive or potentially dilutive shares from the computation of diluted earnings per
share because of the anti-dilutive effect of our reported net loss.
ITEM 7. MANAGEMENT’S DISCUSSION AND ANALYSIS OF FINANCIAL CONDITION AND RESULTS OF
OPERATIONS (Dollars in thousands, unless otherwise indicated)
The following Management’s Discussion and Analysis of Financial Condition and Results of Operations, as well as other
portions of this Form 10-K, may contain certain statements that constitute forward-looking statements within the meaning of
the federal securities laws. In some cases, you can identify forward-looking statements by terminology such as “may,” “will,”
“should,” “could”, “intend,” “consider,” “expect,” “plan,” “anticipate,” “believe,” “estimate,” “predict” or “continue” or the
negative of such terms or other comparable terminology. Forward-looking statements by their nature address matters that are, to
different degrees, uncertain. Our business has been undergoing substantial change, which has magnified such risks and
uncertainties. You should bear these factors in mind when considering forward-looking statements and should not place undue
reliance on such statements. Forward-looking statements involve a number of assumptions, risks and uncertainties that could
cause actual results to differ materially from those suggested by such statements. In the past, actual results have differed from
those suggested by forward-looking statements and this may happen again. You should consider all uncertainties and risks
discussed or referenced in this report, including those under “Forward-Looking Statements” and Item 1A, Risk Factors, as well
as those discussed in any subsequent SEC filings.
The Management’s Discussion and Analysis of Financial Condition and Results of Operations section of this Form 10-K
generally discusses 2019 and 2018 items and year-to-year comparisons between 2019 and 2018. Discussions of 2017 items and
year-to-year comparisons between 2018 and 2017 that are not included in this Form 10-K can be found in “Management’s
Discussion and Analysis of Financial Condition and Results of Operations” in Part II, Item 7 of our Annual Report on Form 10-
K for the year ended December 31, 2018.
OVERVIEW
We are a financial services company that services and originates mortgage loans. The majority of our revenues are
generated from our residential mortgage servicing business. As of December 31, 2019, our residential mortgage servicing
portfolio consisted of 1,419,943 loans with a total UPB of $212.37 billion. We service all mortgage loan classes, including
conventional, government-insured and non-Agency loans.

47
We selectively sourced our MSR originations and acquisitions and subservicing in 2019 through diversified channels, as
detailed below:
Amounts in billions UPB
Quarter Ended
December 31, 2019
Year Ended December 31,
2019
MSR additions:
MSR originations
Recapture origination $ 0.17 $ 0.66
Correspondent 0.40 0.49
Flow purchases 0.24 0.24
GSE Cash Window 0.55 0.67
Reverse MSR originations 0.26 0.73
Total MSR originations 1.62 2.79
Bulk MSR purchases 2.74 14.62
Total MSR additions 4.36 17.41
Subservicing additions 3.79 8.68
Total MSR and subservicing additions $ 8.15 $ 26.09
In our lending business, we originate, purchase, sell and securitize forward and reverse mortgage loans that are mostly
conventional and government-insured. During 2019, we originated $1.88 billion forward and reverse mortgage loans.
On October 4, 2018, we completed the acquisition of PHH, whose servicing portfolio consisted of 537,225 residential
mortgage loans with a UPB of $119.3 billion, $68.7 billion of which were under subservicing agreements. During 2019, we
successfully executed our planned integration of PHH’s business with ours with a focus on system integration, elimination of
duplicative processes and transformation to create value. We have fully transitioned our servicing onto the Black Knight MSP
servicing system. We have reduced total staffing levels by 1,100 or 17%, with a total headcount of approximately 5,300 at
December 31, 2019 compared to the Ocwen headcount pre-PHH acquisition of 6,400 on September 30, 2018. We have vacated
seven U.S. facilities. In the first half of 2019, we completed the mergers of two of our primary licensed operating entities,
Homeward and OLS into PMC, with PMC being the surviving corporation.
We have established a set of key business initiatives to achieve our objective of returning to sustainable profitability in the
shortest timeframe possible within an appropriate risk and compliance environment. These include:
• Managing the size of our servicing portfolio through expanding our lending business to grow sustainable channels of
MSR replenishment;
• Reengineering our cost structure;
• Effectively managing our balance sheet to fund our ongoing business needs and growth; and,
• Fulfilling our regulatory commitments and resolving remaining legacy matters.
First, we must expand our lending business and targeted MSR acquisitions that have appropriate financial return targets to
replenish and grow our servicing portfolio. We expect to continue to focus on acquiring Agency and government-insured MSR
portfolios that meet or exceed our minimum targeted investment returns. During 2019, we closed MSR acquisitions with $14.6
billion UPB or $153.5 million fair value, allowing us to grow our Agency portfolio on a net basis after portfolio runoff. We also
executed on our plans to re-enter the forward lending correspondent channel in the second quarter of 2019 and we continue to
pursue a number of other MSR acquisition options, including driving improved recapture rates within our existing servicing
portfolio. In addition to our organic growth initiatives in lending, we have been actively engaged in evaluating opportunities to
acquire complimentary lending businesses with proven capabilities to generate significant volume through mortgage lending
cycles and provide a sustainable MSR source. Some of these opportunities could also immediately increase the size of our
servicing portfolio through these businesses’ existing MSRs.
Second, we must re-engineer our cost structure to go beyond eliminating redundant costs through the integration process
and establish continuous operational efficiencies and cost improvement as a core strength. Our continuous cost improvement
efforts are focused on leveraging our single servicing platform and technology, optimizing strategic sourcing and off-shore
utilization, lean process design, automation and other technology-enabled productivity enhancements. Our initiatives are
48
targeted at delivering superior accuracy, cost, speed and customer satisfaction. We believe these steps are necessary in order to
simplify our operations and drive stronger financial performance.
Third, we must manage our balance sheet to ensure adequate liquidity and maintain diverse sources of capital and a solid
platform for financing our ongoing business needs and executing on our other key business initiatives. In 2019, we established
three financing facilities secured by MSRs under which we had borrowed $314.4 million at December 31, 2019, approximately
half of which effectively supported our 2019 MSR acquisitions. In addition, in January 2020 we extended the maturity on our
senior secured term loan (SSTL) from December 2020 to May 2022 and reduced the outstanding balance from $326.1 million
to $200.0 million consistent with our focus on lower cost asset-backed structured finance debt. We continue to evaluate our
capital structure options to determine how to enable the most effective execution of our key business initiatives.
Finally, we must fulfill our regulatory commitments and resolve our remaining legal and regulatory matters on satisfactory
terms. Our business, operating results and financial condition have been significantly impacted in recent periods by regulatory
actions against us and by significant litigation matters. Should the number or scope of regulatory or legal actions against us
increase or expand or should we be unable to reach reasonable resolutions in existing regulatory and legal matters, our
business, reputation, financial condition, liquidity and results of operations could be materially and adversely affected, even if
we are successful in our ongoing efforts to drive stronger financial performance.
Our ability to execute on these key business initiatives is not certain and is dependent on the successful execution of
several complex actions, including our ability to grow our lending business and acquire MSRs with appropriate financial return
targets, our ability to acquire, maintain and grow profitable client relationships, our ability to implement further organizational
redesign and cost reduction, as well as the absence of significant unforeseen costs, including regulatory or legal costs, that
could negatively impact our return to sustainable profitability, and our ability to extend, renew or replace our debt agreements
in the ordinary course of business. There can be no assurances that the desired strategic and financial benefits of these actions
will be realized.
In recent periods, Ocwen has incurred significant losses as a result of declines in the fair value of our MSRs. Further
interest rate decreases, prepayment speed increases or changes to other fair value inputs or assumptions could result in further
fair value declines and hamper our ability to return to profitability. Starting in September 2019, we have implemented a
hedging strategy to partially offset the changes in fair value of our net MSR portfolio. See Risk Management - Market Risk for
further information.
In addition, we have exposure to concentration risk and client retention risk as a result of our relationship with NRZ, which
accounted for 56% of the UPB in our servicing portfolio as of December 31, 2019 and approximately 74% of all delinquent
loans that Ocwen serviced. During 2019, NRZ-related servicing fees retained by Ocwen represented approximately 36% of the
total servicing and subservicing fees earned by Ocwen, net of servicing fees remitted to NRZ (excluding ancillary income).
During 2019, we completed an assessment of the cost-to-service and the profitability of the NRZ servicing portfolio.
Based on this analysis, in the fourth quarter of 2019, we estimate that operating expenses, including direct servicing expenses
and overhead allocation, exceeded the net revenue retained for the NRZ servicing portfolio by approximately $10.0 million. As
with all estimates, this estimate required the exercise of judgment, including with respect to overhead allocations, and it
excludes the benefits of the lump-sum payment amortization. The estimated loss for these subservicing agreements is partially
driven by the declining revenue as the loan portfolio amortizes down without a corresponding reduction to our servicing cost
per loan over time. As performing loans in the NRZ servicing portfolio have run-off, delinquencies have remained high,
resulting in a relatively elevated average cost per loan. Because the NRZ portfolio contains a high percentage of delinquent
accounts, it has an inherently high level of potential operational and compliance risk and requires a disproportionately high
level of operating staff, oversight support infrastructure and overhead which drives the elevated average cost per loan. We
actively pursue cost re-engineering initiatives to continue to reduce our cost-to-service and corporate overhead, as well as
pursue actions to grow our non-NRZ servicing portfolio.
On February 20, 2020, we received a notice of termination from NRZ with respect to the legacy PMC subservicing
agreement. This termination is for convenience (and not for cause). The notice states that the effective date of termination is
June 19, 2020 for 25% of the loans under the agreement (not including loans constituting approximately $6.6 billion in UPB
that were added by NRZ under the agreement in 2019) and August 18, 2020 for the remainder of the loans under the agreement.
The actual servicing transfer date(s) will be determined through discussions with NRZ and other stakeholders such as GSEs. In
connection with the termination, we estimate that we will receive loan deboarding fees of approximately $6.1 million from
NRZ. The portfolio subject to termination accounted for $42.1 billion in UPB, or 20% of our total serviced UPB as of
December 31, 2019. Under this agreement, in the fourth quarter of 2019, we estimate that operating expenses, including direct
expenses and overhead allocation, exceeded the net revenue retained for this portion of the NRZ servicing portfolio by
approximately $3.0 million. At this stage, we do not anticipate significant operational impacts on our servicing business as a
result of this termination. The terminated servicing is comprised of Agency loans with relatively low delinquencies that do not
pose a high level of operating and compliance risk or require substantial direct and oversight staffing relative to our non-

49
Agency servicing. Nonetheless, we intend to right-size and reduce expenses in our servicing business and the related corporate
support functions to the extent possible to align with our smaller portfolio.
We currently anticipate that the loan deboarding fees from NRZ will offset a significant portion of our transition and
restructuring costs assuming an orderly and timely transfer. However, it is possible that the loan deboarding and other
transition activities that we will undertake as a result of the termination may not occur in an orderly or timely manner, which
could be disruptive and could result in us incurring additional costs or even in disagreements with NRZ relating to our
respective rights and obligations. Overall, our current view is that if we can exclude the legacy PMC NRZ servicing portfolio
and successfully execute on the necessary transition and expense reduction actions in an orderly and timely manner, we will be
able to enhance the long-term financial performance of our servicing business.

50
Operations Summary
Years Ended December 31, % Change
2019 2018 2017 2019 vs.
2018 2018 vs.
2017
Revenue
Servicing and subservicing fees $ 975,507 $ 937,083 $ 991,597 4 % (5 )%
Gain on loans held for sale, net 38,300 37,336 57,183 3 (35 )
Reverse mortgage revenue, net 86,309 60,237 75,515 43 (20 )
Other revenue, net 23,259 28,389 70,281 (18 ) (60 )
Total revenue 1,123,375 1,063,045 1,194,576 6 (11 )
MSR valuation adjustments, net (120,876 ) (153,457 ) (52,962 ) (21 ) 190
Operating expenses
Compensation and benefits 313,508 298,036 358,994 5 (17 )
Professional services 102,638 165,554 229,451 (38 ) (28 )
Servicing and origination 109,007 131,297 141,496 (17 ) (7 )
Technology and communications 79,166 98,241 100,490 (19 ) (2 )
Occupancy and equipment 68,146 59,631 66,019 14 (10 )
Other expenses 1,474 26,280 49,233 (94 ) (47 )
Total operating expenses 673,939 779,039 945,683 (13 ) (18 )
Other income (expense)
Interest income 17,104 14,026 15,965 22 (12 )
Interest expense (114,129 ) (103,371 ) (126,927 ) 10 (19 )
Pledged MSR liability expense (372,089 ) (171,670 ) (236,311 ) 117 (27 )
Gain on repurchase of senior secured notes 5,099 — — n/m n/m
Bargain purchase gain (381 ) 64,036 — (101 ) n/m
Gain on sale of MSRs, net 453 1,325 10,537 (66 ) (87 )
Other, net 8,892 (6,371 ) (3,168 ) (240 ) 101
Total other expense, net (455,051 ) (202,025 ) (339,904 ) 125 (41 )
Loss from continuing operations before income
taxes (126,491 ) (71,476 ) (143,973 ) 77
(50 )
Income tax expense (benefit) 15,634 529 (15,516 ) n/m (103 )
Loss from continuing operations, net of tax (142,125 ) (72,005 ) (128,457 ) 97 (44 )
Income from discontinued operations, net of tax — 1,409 — (100 ) n/m
Net loss (142,125 ) (70,596 ) (128,457 ) 101 (45 )
Net loss (income) attributable to non-controlling interests —
(176 ) 491
(100 ) (136 )
Net loss attributable to Ocwen stockholders $ (142,125 ) $ (70,772 ) $ (127,966 ) 101 (45 )
Segment income (loss) from continuing
operations before taxes:
Servicing $ (70,770 ) $ (31,948 ) $ 46,680 122 % (168 )%
Lending 40,733 11,154 (4,431 ) 265 (352 )
Corporate Items and Other (96,454 ) (50,682 ) (186,222 ) 90 (73 )
$ (126,491 ) $ (71,476 ) $ (143,973 ) 77 (50 )
n/m: not meaningful

51
Year Ended December 31, 2019 versus 2018
Ocwen reported a net loss of $142.1 million in 2019, largely impacted by $65.0 million re-engineering costs associated
with the integration of PHH, a $53.0 million net fair value decline of MSRs due to changes in interest rates and valuation
assumptions, and $15.6 million tax expense related to our foreign jurisdictions. While many factors impacted our performance
in 2019 and 2018 as discussed below, the increase in our net loss compared to 2018 is primarily explained by the $64.0 million
bargain purchase gain on the acquisition of PHH recorded in 2018.
Total revenue was $1.1 billion in 2019, $60.3 million or 6% higher than 2018, mostly due to $38.4 million additional
servicing revenue and $26.1 million additional reverse mortgage revenue. The $38.4 million increase in servicing and
subservicing fees is primarily due to the increase in the average portfolio serviced resulting from the acquisition of PHH on
October 4, 2018 with such increase being partially offset by a decline in completed modifications. Reverse mortgage revenue,
net increased $26.1 million, or 43%, as compared to 2018 largely due to a $37.2 million favorable net change in the fair values
of our HECM reverse mortgage loans and the HMBS-related borrowings due to higher UPB and interest rate changes, and the
fair value election in the first quarter of 2019 for future draw commitments on HECM reverse mortgage loans purchased or
originated after December 31, 2018. See Segment Results of Operations for additional information.
We reported a $120.9 million loss in MSR valuation adjustments, net in 2019, mostly driven by a $215.1 million portfolio
runoff, a $175.6 million loss due to the decline in interest rates, partially offset by $269.8 million favorable assumption updates.
The loss is mostly attributable to our forward MSR portfolio, with $0.3 million loss related to our reverse MSR reported in our
Lending segment. MSR valuation adjustments, net in 2019 decreased $32.6 million, as compared to 2018 primarily due to
assumption updates. See Segment Results of Operations - Servicing for additional information.
Operating expenses decreased $105.1 million, or 13%, compared to 2018, largely due to our integration and cost reduction
initiatives, with $673.9 million recognized in 2019 compared to $779.0 million in 2018. Operating expenses for 2019 include
recoveries of $43.4 million of prior professional fees and other operating expenses from service providers and a mortgage
insurer. The $105.1 million reduction in operating expenses in 2019 is partially offset by $65.0 million re-engineering costs
recorded in 2019 and the recognition of PHH operating expenses starting in the fourth quarter of 2018; i.e., 2018 operating
expenses did not include PHH through October 4, 2018.
Compensation and benefits expense increased $15.5 million, or 5%, as compared to 2018 primarily due to the acquisition
of the PHH workforce and $35.7 million severance and retention costs, partially offset by a decline in expenses resulting from
our efforts to re-engineer our cost structure. Despite the increase in headcount at the time of the PHH acquisition, average total
headcount in 2019 declined 10% as compared to 2018.
Professional services expense decreased $62.9 million, or 38%, as compared to 2018 primarily due to the $34.7 million
recovery of prior expense from service providers and a mortgage insurer and a $16.8 million decline in litigation provisions.
Also contributing to the decline in Professional services expense in 2019 is the $13.7 million expenses incurred in 2018 in
connection with the acquisition of PHH.
Servicing and origination expense decreased $22.3 million, or 17%, as compared to 2018 primarily due to a $7.4 million
reduction in government-insured claim loss provisions in line with a decline in claims and a $7.6 million decrease in provisions
for non-recoverable servicing advances and receivables.
Technology and communication expense decreased $19.1 million, or 19%, as compared to 2018 primarily because we no
longer license the REALServicing servicing system from Altisource following our transition to Black Knight MSP, a $10.3
million reduction in depreciation expense that is largely the result of a decline in capitalized technology investments, our
closure of seven U.S. facilities and the effects of our other cost reduction efforts which include bringing technology services in-
house. These declines were partially offset by an increase in expenses as a result of PHH expenses.
Occupancy and equipment expense increased $8.5 million, or 14%, as compared to 2018, due to PHH expenses and the
recognition of accelerated amortization of ROU assets in connection with our decision to vacate leased properties in 2019 prior
to the contractual maturity date of the lease agreements, offset in part by a decline resulting from our cost reduction efforts
which include consolidating vendors and closing and consolidating certain facilities.
Other expenses decreased $24.8 million, or 94%, as compared to 2018 due to a $15.7 million decline in the provision for
indemnification obligations that was largely due to favorable updates to default, defect and severity assumptions relative to
historical performance, a $7.2 million expense recovery in connection with a settlement with a mortgage insurer and a $2.5
million savings in license fees due to our legal entity reorganization.
Interest expense increased $10.8 million, or 10%, mostly due to the $120.0 million SSTL upsize we executed in March
2019 and the new MSR financing facilities executed in 2019.
Pledged MSR liability expense relates to the MSR sale agreements with NRZ that do not achieve sale accounting and are
presented on a gross basis in our financial statements. The $372.1 million expense in 2019 primarily includes a $437.7 million

52
net servicing fee remittance to NRZ partially offset by a $95.2 million amortization gain related to the lump-sum cash payments
received from NRZ in connection with the 2017 Agreements and New RMSR Agreements in 2017 and 2018, and a $33.8
million fair value loss on the pledged MSR liability.
Years Ended December 31, Change
Amounts in millions 2019 2018 2017 2019 vs
2018 2018 vs
2017
Net servicing fee remittance to NRZ (a) $ 437.7 $ 396.7 $ 254.2 $ 41.0 $ 142.5
2017/18 lump sum amortization (gain) (95.2 ) (148.9 ) (43.9 ) 53.7 (105.0 )
Pledged MSR liability fair value (gain) loss (b) 33.8
(82.2 ) 26.0
116.0
(108.2 )
Other (4.2 ) 6.0 — (10.2 ) 6.0
Pledged MSR liability expense $ 372.1 $ 171.6 $ 236.3 $ 200.5 $ (64.7 ) (a) Offset by corresponding amount recorded in Servicing and subservicing fee - See below table.
(b) Offset by corresponding amount recorded in MSR valuation adjustments, net - See below table.
The below table reflects the condensed statement of operations together with the included amounts related to the NRZ
pledged MSRs that offset each other (nil impact on net income/loss). Net servicing fee remittance and pledged MSR fair value
changes are presented on a gross basis and are offset by corresponding amounts presented in other statement of operations line
items. In addition, because we record both our pledged MSRs and the associated pledged MSR liability at fair value, the
changes in fair value of the pledged MSR liability were offset by the changes in fair value of the MSRs pledged, presented in
MSR valuation adjustments, net. Accordingly, only the $95.2 million lump sum amortization gain and the $4.2 million in
“Other” affect our net earnings.
Year Ended December 31,
2019 2018
Dollars in millions Statement of Operations
NRZ Pledged MSR-related Amounts (a)
Statement of Operations
NRZ Pledged MSR-related Amounts (a)
Total revenue $ 1,123.4 $ 437.7 $ 1,063.0 $ 396.7
MSR valuation adjustments, net (120.9 ) 33.8 (153.5 ) (82.2 )
Total operating expenses 673.9 — 779.0 —
Total other expense, net (455.1 ) (471.5 ) (202.0 ) (314.5 )
Loss before income taxes $ (126.5 ) $ — $ (71.5 ) $ —
(a) Amounts included in the specific statement of operations line items.
See Note 10 — Rights to MSRs to the Consolidated Financial Statements and Segment Results of Operations - Servicing
for additional information.
Other, net increased $15.3 million as compared to 2018 primarily due to other income recognized in connection with call
rights exercised by, or on behalf of NRZ for MSRs underlying the agreements with NRZ. See Note 10 — Rights to MSRs for
additional information.
Although we incurred a pre-tax loss for 2019 of $126.5 million, we recorded income tax expense of $15.6 million due to
the mix of earnings among different tax jurisdictions with different statutory tax rates. Our overall effective tax rates for 2019
and 2018 were (12.4)% and (0.7)%, respectively. Under our transfer pricing agreements, our operations in India and Philippines
are compensated on a cost-plus basis for the services they provide, such that even when we have a consolidated pre-tax loss
from operations these foreign operations have taxable income, which is subject to statutory tax rates in these jurisdictions that
are significantly higher than the U.S. statutory rate of 21%. The change in income tax expense for 2019, compared with 2018,
was primarily due to tax expense on the gain recognized in the USVI on the merger of OLS into PMC and the effects of
revaluing our Indian deferred tax assets as a result of the significant corporate rate reduction enacted in India, as well as
increased income tax expense as a result of recognizing income previously deferred for tax purposes related to our NRZ
agreements. In addition, income tax expense related to uncertain tax positions increased by $8.2 million in 2019 as compared to
2018.

53
Financial Condition Summary
December 31,
2019 2018 $ Change % Change
Cash and cash equivalents $ 428,339 $ 329,132 $ 99,207 30 %
Restricted cash 64,001 67,878 (3,877 ) (6 )
Mortgage servicing rights (MSRs), at fair value 1,486,395 1,457,149 29,246 2
Advances and match funded advances 1,056,523 1,186,676 (130,153 ) (11 )
Loans held for sale 275,269 242,622 32,647 13
Loans held for investment, at fair value 6,292,938 5,498,719 794,219 14
Other assets 802,734 612,040 190,694 31
Total assets $ 10,406,199 $ 9,394,216 $ 1,011,983 11 %
Total Assets by Segment
Servicing $ 3,378,515 $ 3,306,208 $ 72,307 2 %
Lending 6,459,367 5,603,481 855,886 15
Corporate Items and Other 568,317 484,527 83,790 17
$ 10,406,199 $ 9,394,216 $ 1,011,983 11 %
HMBS-related borrowings, at fair value $ 6,063,435 $ 5,380,448 $ 682,987 13
Match funded liabilities (related to VIEs) 679,109 778,284 (99,175 ) (13 )
Other financing liabilities 972,595 1,062,090 (89,495 ) (8 )
SSTL and other secured borrowings, net 1,025,791 448,061 577,730 129
Senior notes, net 311,085 448,727 (137,642 ) (31 )
Other liabilities 942,173 721,901 220,272 31
Total liabilities 9,994,188 8,839,511 1,154,677 13
Total stockholders’ equity 412,011 554,705 (142,694 ) (26 )
Total liabilities and equity $ 10,406,199 $ 9,394,216 $ 1,011,983 11 %
Total Liabilities by Segment
Servicing $ 2,862,063 $ 2,437,383 $ 424,680 17 %
Lending 6,347,159 5,532,069 815,090 15
Corporate Items and Other 784,966 870,059 (85,093 ) (10 )
$ 9,994,188 $ 8,839,511 $ 1,154,677 13 %
The increase in our balance sheet by $1.0 billion between December 31, 2019 and December 31, 2018 is principally
attributable to the continued growth of our reverse mortgage business, with additional $794.2 million Loans held for investment
and $683.0 million HMBS-related borrowings, and the $190.3 million increase in the Ginnie Mae contingent loan repurchase
asset offset by the corresponding liability. Our liquidity position increased at December 31, 2019 with $99.2 million additional
cash sourced through new MSR financing agreements, in anticipation of an SSTL pay-down in January 2020. Match funded
liabilities declined during 2019 as a result of lower advances and match funded advances. Changes in the composition of our
financing liabilities are principally attributable to our increased use of cost-effective asset-backed financing, with three new
MSR financing agreements entered into in 2019, under which $314.4 million was outstanding at December 31, 2019 and
increased warehouse line utilization to finance our pipeline of unsecuritized forward and reverse loans at balance sheet date.
Borrowings under our SSTL increased due to the $120.0 million term loan upsize executed during the first quarter of 2019.
Senior notes declined due to our repayment at the maturity of the $97.5 million 7.375% notes and our repurchases of $39.4
million of our 8.375% notes. Total equity decreased $142.7 million during 2019 mostly as a result of our net loss.
SEGMENT RESULTS OF OPERATIONS

54
Servicing
We earn contractual monthly servicing fees pursuant to servicing agreements, which are typically payable as a percentage
of UPB, as well as ancillary fees, including late fees, modification incentive fees, REO referral commissions, float earnings and
Speedpay fees. We also earn fees under both subservicing and special servicing arrangements with banks and other institutions
that own the MSRs. Subservicing and special servicing fees are earned either as a percentage of UPB or on a per-loan basis.
Per-loan fees typically vary based on delinquency status. As of December 31, 2019, we serviced 1.4 million loans with an
aggregate UPB of $212.4 billion.
The average UPB of loans serviced during 2019 increased by 20% or $39.5 billion compared to 2018, mostly due to the
acquisition of PHH in October 2018. We are actively pursuing actions to manage the size of our servicing portfolio through
expanding our lending business and making MSR acquisitions based on our capital availability that are prudent and well-
executed with appropriate financial return targets. We closed MSR acquisitions with $14.6 billion UPB during 2019. We expect
to continue to focus on acquiring Agency and government-insured MSR portfolios that meet or exceed our minimum targeted
investment returns. We re-entered the forward lending correspondent channel in the second quarter of 2019 to support the
growth of our MSR portfolio and we continue to pursue a number of other MSR acquisition options, including driving
improved recapture rates within our existing servicing portfolio.
NRZ is our largest servicing client, accounting for 56% and 61% of the UPB and loans in our servicing portfolio as of
December 31, 2019, respectively. NRZ subservicing fees retained by Ocwen represented approximately 36% and 38% of the
total servicing and subservicing fees earned by Ocwen, net of servicing fees remitted to NRZ, for 2019 and 2018, respectively
(excluding ancillary income). Consistent with a subservicing relationship, NRZ is responsible for funding the advances we
service for NRZ.
In 2017 and early 2018, we renegotiated the Ocwen agreements with NRZ to more closely align with a typical
subservicing arrangement whereby we receive a base servicing fee and certain ancillary fees, primarily late fees, loan
modification fees and Speedpay fees. We may also receive certain incentive fees or pay penalties tied to various contractual
performance metrics. We received upfront cash payments in 2018 and 2017 of $279.6 million and $54.6 million, respectively,
from NRZ in connection with the resulting 2017 and New RMSR Agreements. These upfront payments generally represent the
net present value of the difference between the future revenue stream Ocwen would have received under the original
agreements and the future revenue Ocwen will receive under the renegotiated agreements. These upfront payments received
from NRZ were deferred and are recorded within Other income (expense) as they amortize through the remaining term of the
original agreements.
During 2019, we completed an assessment of the cost-to-service and the profitability of the NRZ servicing portfolio. Based
on this analysis, in the fourth quarter of 2019, we estimate that operating expenses, including direct servicing expenses and
overhead allocation, exceeded the net revenue retained for the NRZ servicing portfolio by approximately $10 million. As with
all estimates, this estimate required the exercise of judgment, including with respect to overhead allocations, and it excludes the
benefits of the lump-sum payment amortization. The estimated loss for these subservicing agreements is partially driven by the
declining revenue as the loan portfolio amortizes down without a corresponding reduction to our servicing cost over time. As
performing loans in the NRZ servicing portfolio have run-off, delinquencies have remained high, resulting in a relatively
elevated average cost per loan. Because the NRZ portfolio contains a high percentage of delinquent accounts, it has an
inherently high level of potential operational and compliance risk and requires a disproportionally high level of operating staff,
oversight support infrastructure and overhead which drives the elevated average cost per loan. We actively pursue cost re-
engineering initiatives to continue to reduce our cost-to-service and our corporate overhead, as well as pursue actions to grow
our non-NRZ servicing portfolio to offset the losses on the NRZ sub servicing.
The following table presents subservicing fees retained by Ocwen under the NRZ agreements and the amortization gain
(including fair value change) of the lump-sum payments received in connection with the 2017 Agreements and New RMSR
Agreements:

55
Years Ended December 31,
2019 2018 2017
Retained subservicing fees on NRZ agreements $ 139,343 $ 142,334 $ 295,192
Amortization gain of the lump-sum cash payments received (including fair value change) recorded as a reduction of Pledged MSR liability expense 95,237
148,878
43,944
Total retained subservicing fees and amortization gain of lump-sum payments (including fair value change) $ 234,580
$ 291,212
$ 339,136
Average NRZ UPB $ 125,070,332 $ 104,773,894 $ 110,117,808
Average retained subservicing fees as a % of NRZ UPB 0.11 % 0.14 % 0.27 %
Our MSR portfolio is carried at fair value. The value of our MSRs is typically correlated to changes in interest rates; as
interest rates decrease, the value of the servicing portfolio typically decreases as a result of higher anticipated prepayment
speeds. The sensitivity of MSR fair value to interest rates is typically higher for higher credit quality loans. Valuation is also
impacted by loan delinquency rates whereby as delinquency rates decline, the value of the servicing portfolio rises.
For those MSR sale transactions with NRZ that do not achieve sale accounting treatment, we present gross the pledged
MSR as an asset and the corresponding liability amount pledged MSR liability on our balance sheet. Similarly, we present the
total servicing fees and the fair value changes related to the MSR sale transactions with NRZ within Servicing and subservicing
fees, net and MSR valuation adjustment, net. Net servicing fee remittance to NRZ and the fair value changes of the pledged
MSR liability are separately presented within Pledged MSR liability expense and are offset by the two corresponding amounts
presented in other statement of operations line items. We record both our pledged MSRs and the associated MSR liability at fair
value, the changes in fair value of the pledged MSR liability were offset by the changes in fair value of the associated MSRs
pledged, presented in MSR valuation adjustments, net.
Loan Resolutions
We have a strong track record of success as a leader in the servicing industry in foreclosure prevention and loss mitigation
that helps homeowners stay in their homes and improves financial outcomes for mortgage loan investors. Reducing
delinquencies also enables us to recover advances and recognize additional ancillary income, such as late fees, which we do not
recognize on delinquent loans until they are brought current. Loan resolution activities address the pipeline of delinquent loans
and generally lead to (i) modification of the loan terms, (ii) repayment plan alternatives, (iii) a discounted payoff of the loan
(e.g., a “short sale”), or (iv) foreclosure or deed-in-lieu-of-foreclosure and sale of the resulting REO. Loan modifications must
be made in accordance with the applicable servicing agreement as such agreements may require approvals or impose
restrictions upon, or even forbid, loan modifications. To select an appropriate loan modification option for a borrower, we
perform a structured analysis, using a proprietary model, of all options using information provided by the borrower as well as
external data, including recent broker price opinions to value the mortgaged property. Our proprietary model includes, among
other things, an assessment of re-default risk.
Our future financial performance will be less impacted by loan resolutions because, under our NRZ agreements, NRZ
receives all deferred servicing fees. Deferred servicing fees related to delinquent borrower payments were $200.5 million at
December 31, 2019, of which $162.1 million were attributable to NRZ agreements.
Advance Obligation
As a servicer, we are generally obligated to advance funds in the event borrowers are delinquent on their monthly mortgage
related payments. We advance principal and interest (P&I Advances), taxes and insurance (T&I Advances) and legal fees,
property valuation fees, property inspection fees, maintenance costs and preservation costs on properties that have been
foreclosed (Corporate Advances). For loans in non-Agency securitization trusts, if we determine that our P&I Advances cannot
be recovered from the projected future cash flows, we generally have the right to cease making P&I Advances, declare
advances, where permitted including T&I and Corporate advances, in excess of net proceeds to be non-recoverable and, in most
cases, immediately recover any such excess advances from the general collection accounts of the respective trust. With T&I and
Corporate Advances, we continue to advance if net future cash flows exceed projected future advances without regard to
advances already made.
Most of our advances have the highest reimbursement priority (i.e., they are “top of the waterfall”) so that we are entitled
to repayment from respective loan or REO liquidation proceeds before any interest or principal is paid on the bonds that were
issued by the trust. In the majority of cases, advances in excess of respective loan or REO liquidation proceeds may be
recovered from pool-level proceeds. The costs incurred in meeting these obligations consist principally of the interest expense
incurred in financing the servicing advances. Most, but not all, subservicing agreements, including our agreements with NRZ,
provide for more rapid reimbursement of any advances from the owner of the servicing rights.

56
Significant Variables
Aggregate UPB and Loan Count. Servicing fees are generally expressed as a percentage of UPB and subservicing fees are
generally expressed as a percentage of UPB or earned on a per-loan basis. Aggregate UPB and loan count decline as a result of
portfolio run-off and increase to the extent we retain MSRs from new originations or engage in MSR acquisitions, to the extent
permitted.
Operating Efficiency. Our operating results are heavily dependent on our ability to scale our operations to cost-effectively
and efficiently perform servicing activities in accordance with our servicing agreements. To the extent we are unable to process
a high volume of transactions consistently and systematically, the cost of our servicing activities increases and has a negative
impact on our operating results. To the extent we are unable to complete servicing activities in accordance with the
requirements of our servicing agreements, we may incur additional costs or fail to recover otherwise reimbursable costs and
advances.
Delinquencies. Delinquencies impact our results of operations and operating cash flows. Non-performing loans are more
expensive to service because the loss mitigation activities that we must undertake to keep borrowers in their homes or to
foreclose, if necessary, are costlier than the activities required to service a performing loan. These loss mitigation activities
include increased contact with the borrower for collection and the development of forbearance plans or loan modifications by
highly skilled associates who command higher compensation as well as the higher compliance costs associated with these, and
similar, activities. While the higher cost is somewhat offset by ancillary fees, for severely delinquent loans or loans that enter
the foreclosure process the incremental revenue opportunities are generally not sufficient to cover our increased costs.
In addition, when borrowers are delinquent, the amount of funds that we are required to advance to the investors increases.
We incur significant costs to finance those advances. We utilize servicing advance financing facilities, which are asset-backed
(i.e., match funded liabilities) securitization facilities, to finance a portion of our advances. As a result, increased delinquencies
result in increased interest expense.
Prepayment Speed. The rate at which portfolio UPB declines can have a significant impact on our business. Items reducing
UPB include normal principal payments (runoff), refinancing, loan modifications involving forgiveness of principal, voluntary
property sales and involuntary property sales such as foreclosures. Prepayment speed impacts future servicing fees,
amortization and valuation of MSRs, float earnings on float balances and interest expense on advances. Increases in anticipated
lifetime prepayment speeds generally cause MSR valuation adjustments to increase because MSRs are valued based on total
expected servicing income over the life of a portfolio. The converse is true when expectations for prepayment speeds decrease.

57
The following table presents selected results of operations of our Servicing segment. The amounts presented are before the
elimination of balances and transactions with our other segments:
Years Ended December 31, % Change
2019 2018 2017 2019 vs.
2018 2018 vs.
2017
Revenue
Servicing and subservicing fees:
Residential $ 969,700 $ 929,969 $ 982,929 4 % (5 )%
Commercial 3,847 5,548 7,700 (31 ) (28 )
973,547 935,517 990,629 4 (6 )
Gain on loans held for sale, net 6,110 8,435 11,458 (28 ) (26 )
Other revenue, net 5,445 7,272 39,203 (25 ) (81 )
Total revenue 985,102 951,224 1,041,290 4 (9 )
MSR valuation adjustments, net (120,646 ) (152,983 ) (52,689 ) (21 ) 190
Operating expenses
Compensation and benefits 142,674 145,574 160,514 (2 ) (9 )
Servicing and origination 91,096 114,597 119,569 (21 ) (4 )
Professional services 42,126 53,643 66,523 (21 ) (19 )
Occupancy and equipment 44,339 42,511 47,419 4 (10 )
Technology and communications 32,607 45,535 46,238 (28 ) (2 )
Corporate overhead allocations 197,880 211,701 221,049 (7 ) (4 )
Other expenses (14,569 ) 5,923 2,383 (346 ) 149
Total operating expenses 536,153 619,484 663,695 (13 ) (7 )
Other income (expense)
Interest income 8,051 5,383 783 50 587
Interest expense (47,347 ) (41,830 ) (57,284 ) 13 (27 )
Pledged MSR liability expense (372,172 ) (172,342 ) (236,311 ) 116 (27 )
Gain on sale of MSRs, net 453 1,325 10,537 (66 ) (87 )
Other, net 11,942 (3,241 ) 4,049 (468 ) (180 )
Total other expense, net (399,073 ) (210,705 ) (278,226 ) 89 (24 )
Loss (income) from continuing operations
before income taxes $ (70,770 ) $ (31,948 ) $ 46,680
122
(168 )

58
The following table provides selected operating statistics for our Servicing segment:
% Change
2019 2018 2017 2019 vs.
2018 2018 vs.
2017
Residential Assets Serviced at December 31
Unpaid principal balance (UPB) in billions:
Performing loans (1) $ 198.90 $ 243.39 $ 162.72 (18 )% 50 %
Non-performing loans 11.22 10.38 13.47 8 (23 )
Non-performing real estate 2.25 2.23 3.16 1 (29 )
Total $ 212.37 $ 256.00 $ 179.35 (17 ) 43
Conventional loans (2) $ 95.31 $ 127.05 $ 49.33 (25 )% 158 %
Government-insured loans 30.09 27.65 21.26 9 30
Non-Agency loans 86.97 101.30 108.76 (14 ) (7 )
Total $ 212.37 $ 256.00 $ 179.35 (17 ) 43
Percent of total UPB:
Servicing portfolio 36 % 28 % 42 % 28 % (33 )%
Subservicing portfolio 8 21 1 (61 ) n/m
NRZ (3) 56 51 57 10 (10 )
Non-performing residential assets serviced 6 5 9 29 (47 )
Number:
Performing loans (1) 1,344,925 1,498,960 1,137,012 (10 )% 32 %
Non-performing loans 60,735 52,291 69,135 16 (24 )
Non-performing real estate 14,283 10,987 15,548 30 (29 )
Total 1,419,943 1,562,238 1,221,695 (9 ) 28
Conventional loans (2) 607,854 677,927 298,564 (10 )% 127 %
Government-insured loans 185,138 182,595 156,090 1 17
Non-Agency loans 626,951 701,716 767,041 (11 ) (9 )
Total 1,419,943 1,562,238 1,221,695 (9 ) 28
Percent of total number:
Servicing portfolio 34 % 29 % 39 % 17 % (26 )%
Subservicing portfolio 5 10 2 (45 ) 485
NRZ (3) 61 61 59 — 4
Non-performing residential assets serviced 5 4 7 30 (42 )
n/m: not meaningful
Residential Assets Serviced for the Years Ended December 31
Average UPB (in billions)
Servicing portfolio $ 76.14 $ 72.28 $ 80.93 5 % (11 )%
Subservicing portfolio 31.23 15.93 3.83 96 316
NRZ (3) 125.07 104.77 110.12 19 (5 )
$ 232.44 $ 192.98 $ 194.88 20 (1 )

59
% Change
2019 2018 2017 2019 vs.
2018 2018 vs.
2017
Prepayment speed (average CPR) 15 % 13 % 15 % 15 % (13 )%
% Voluntary 93 82 81 13 1
% Involuntary 7 18 21 (61 ) (14 )
% CPR due to principal modification 1 1 1 — —
Average number
Servicing portfolio 471,808 463,529 516,736 2 % (10 )%
Subservicing portfolio 106,203 53,043 28,794 100 84
NRZ (3) 913,249 748,440 765,048 22 (2 )
1,491,260 1,265,012 1,310,578 18 (3 )
Residential Servicing and Subservicing Fees for the Years Ended December 31
Loan servicing and subservicing fees
Servicing $ 224,846 $ 224,176 $ 254,907 — % (12 )%
Subservicing 15,434 8,904 7,690 73 16
NRZ 577,015 539,039 549,411 7 (2 )
817,295 772,119 812,008 6 (5 )
Late charges 56,876 61,125 61,455 (7 ) (1 )
Custodial accounts (float earnings) 47,435 40,274 24,973 18 61
Loan collection fees 15,433 18,353 22,733 (16 ) (19 )
HAMP fees 5,538 14,312 43,274 (61 ) (67 )
Other 27,123 23,786 18,486 14 29
$ 969,700 $ 929,969 $ 982,929 4 (5 )
Number of Completed Modifications
HAMP 503 1,288 12,726 (61 )% (90 )%
Non-HAMP 25,251 38,257 32,956 (34 ) 16
Total 25,754 39,545 45,682 (35 ) (13 )
Financing Costs
Average balance of advances and match funded advances $ 1,059,607
$ 1,214,436
$ 1,502,530
(13 )% (19 )%
Average borrowings
Match funded liabilities 671,824 736,974 1,048,944 (9 ) (30 )
Financing liabilities (4) — 12,649 15,976 (100 ) (21 )
Other secured borrowings 395,183 74,555 98,023 430 (24 )
Interest expense on borrowings
Match funded liabilities 26,902 30,706 45,379 (12 ) (32 )
Financing liabilities — 66 634 (100 ) (90 )
Other secured borrowings 11,321 6,320 7,515 79 (16 )
Effective average interest rate
Match funded liabilities 4.00 % 4.17 % 4.33 % (4 ) (4 )
Financing liabilities — 0.52 3.97 (100 ) (87 )
Other secured borrowings 2.86 8.48 7.67 (66 ) 11

60
% Change
2019 2018 2017 2019 vs.
2018 2018 vs.
2017
Facility costs included in interest expense $ 8,793 $ 5,242 $ 7,450 68 (30 )
Average 1-month LIBOR 1.75 % 2.45 % 1.08 % (29 ) 127
Average Employment
India and other 3,360 4,097 5,090 (18 )% (20 )%
U. S. 1,158 1,128 1,187 3 (5 )
Total 4,518 5,225 6,277 (14 ) (17 )
(1) Performing loans include those loans that are less than 90 days past due and those loans for which borrowers are making scheduled
payments under loan modification, forbearance or bankruptcy plans. We consider all other loans to be non-performing.
(2) Conventional loans at December 31, 2019 include 111,246 prime loans with a UPB of $20.4 billion which we service or subservice. This
compares to 115,299 prime loans with a UPB of $19.6 billion at December 31, 2018. Prime loans are generally good credit quality loans
that meet GSE underwriting standards.
(3) Loans serviced or subserviced pursuant to our agreements with NRZ.
(4) Excludes the financing liability that we recognized in connection with the sales of Rights to MSRs to NRZ.
The following table provides information regarding the changes in our portfolio of residential assets serviced for the years
ended December 31:
Amount of UPB (in billions) Count
2019 2018 2017 2019 2018 2017
Portfolio at beginning of year $ 256.00
$ 179.35
$ 209.09
1,562,238
1,221,695
1,393,766
Acquisition of PHH — 119.34 — — 537,225 —
Other portfolio additions(1) 26.09
9.41
4.03
100,557
41,035
18,974
26.09 128.75 4.03 100,557 578,260 18,974
Sales (1.15 ) (0.59 ) (0.22 ) (8,256 ) (3,343 ) (979 )
Servicing transfers (2) (30.31 ) (23.01 ) (2.50 ) (48,548 ) (73,934 ) (12,617 )
Runoff (38.27 ) (28.50 ) (31.05 ) (186,048 ) (160,440 ) (177,449 )
Portfolio at end of year $ 212.36 $ 256.00 $ 179.35 1,419,943 1,562,238 1,221,695
(1) Additions in 2019 include purchased MSRs on portfolios consisting of 12,515 loans with a UPB of $2.7 billion that have not yet
transferred to the Black Knight MSP servicing system. These loans are scheduled to transfer onto Black Knight MSP by April 1, 2020.
Because we have legal title to the MSRs, the UPB and count of the loans are included in our reported servicing portfolio. The seller
continues to subservice the loans on an interim basis between the transaction closing date and the servicing transfer date.
(2) Servicing transfers in 2019 include the termination of a subservicing client relationship consisting of 33,626 loans with a UPB of $21.4
billion. For 2019, total servicing fee revenue for this client was $1.3 million which was earned through May 31, 2019 when the loans
were released.
Year Ended December 31, 2019 versus 2018
The key drivers of our servicing segment operating results for 2019, as compared to 2018, are the PHH acquisition and
related integration, MSR fair value changes and the effects of cost improvements achieved in aligning our servicing operations
more appropriately to the size of our servicing portfolio. Until the Black Knight MSP conversion was completed in June 2019,
we were maintaining the infrastructure and related costs of two servicing platforms, including certain corporate functions.
Servicing and subservicing fee revenue increased $39.7 million, or 4%, due to the increase in the average portfolio
resulting from the acquisition of PHH on October 4, 2018 and the acquisitions of MSRs during 2019, offset in part by portfolio
runoff and a decline in completed modifications. Revenue recognized in connection with loan modifications, including
servicing fees, late charges and HAMP fees, declined 35% to $38.5 million during 2019 as compared to $59.4 million in 2018.
Total completed loan modifications decreased 35% as compared to 2018 due primarily to the expiration of government
sponsored modification programs and fewer available modification opportunities in our servicing portfolio.

61
We reported a $120.6 million loss in MSR valuation adjustments, net in 2019. This decline in MSR fair value is mostly
driven by a $215.1 million portfolio runoff, a $175.6 million loss due to the decline in interest rates, partially offset by $269.8
million favorable assumption updates. The assumption fair value gains related mostly to our non-Agency MSR portfolio due to
continued improved collateral performance confirmed by market trade activity. The fair value loss reported in MSR valuation
adjustments, net, decreased $32.3 million in 2019 as compared to 2018, primarily due to an $88.1 million favorable valuation
adjustment associated with the non-Agency assumption update partially offset by the interest rate impact, with an 81 basis-point
decline in the 10-year swap rate in 2019, as compared to the 25 basis-point increase in 2018. In addition, we recognized in 2019
an additional $56.0 million loss due to higher runoff, mostly due to the MSRs added from the PHH acquisition.
The $120.6 million loss reported in MSR valuation adjustments, net is partially offset by a gain reported on the pledged
MSR liability. $915.1 million of our MSRs at December 31, 2019 have been sold under different agreements that did not
qualify for sale accounting treatment and, therefore are reported as MSR assets, pledged at fair value together with an
associated liability for the MSR failed-sale secured borrowing at fair value. Because both pledged MSRs and the associated
MSR liability are measured at fair value, changes in fair value offset each other, although they are separately presented in our
statement of operations, as MSR valuation adjustments, net and Pledged MSR liability expense, respectively. The following
table summarizes the fair value change impact on our statement of operations of our total MSRs and the MSRs liability
associated with the NRZ failed-sale accounting treatment during 2019:
In millions - 2019 Total Change in Fair Value Runoff
Interest Rate Change
Assumption Updates
MSR valuation adjustments, net (1) $ (120.9 ) (215.1 ) (175.6 ) $ 269.8
Pledged MSR liability expense - Fair value changes (2) (33.8 ) 113.4 86.3 (233.5 )
Total $ (154.7 ) $ (101.7 ) $ (89.3 ) $ 36.3
(1) Includes $0.3 million recognized in the Lending segment.
(2) Includes changes in fair value, including runoff and settlement, of the NRZ related MSR liability under the Original Rights to MSRs
Agreements and PMC MSR Agreements. See Note 10 — Rights to MSRs for further information.
As described in the table above, Ocwen’s MSR portfolio net of the pledged MSR liability incurred a fair value loss due to
interest rates of $89.3 million in 2019, that was partially offset by a $36.3 million fair value gain due to assumption updates.
Operating expenses decreased $83.3 million, or 13%, compared to 2018 largely due to our integration and cost reduction
initiatives, as discussed below.
Compensation and benefits expense declined $2.9 million, or 2% as compared to 2018 due to our efforts to re-engineer our
cost structure and align headcount in our servicing operations with the size of our servicing portfolio. Our average servicing
headcount declined 14% compared to 2018, despite the PHH headcount added on October 4, 2018.
Servicing and origination expense declined $23.5 million, or 21%, as compared to 2018 primarily due to an $8.7 million
decrease in government-insured claim loss provisions on reinstated or modified loans in line with a decline in the volume of
claims and a $7.6 million decrease in provisions for non-recoverable servicing advances and receivables. Government-insured
claim loss provisions are generally offset by changes in the fair value of the corresponding MSRs, which are recorded in MSR
valuation adjustments, net.
Professional services expense declined $11.5 million, or 21%, as compared to 2018 primarily due to a decline in legal fees
and settlements, including a $5.1 million decline in litigation provisions, partially offset by incremental professional services
expense associated with the integration of PHH business.
Technology and communication expense declined $12.9 million, or 28%, as compared to 2018 primarily because we no
longer license the REALServicing servicing system from Altisource following our transition to Black Knight MSP.
Corporate overhead allocations declined $13.8 million, as compared to 2018, primarily due to lower legal fees and
technology expenses.
Other expenses decreased $20.5 million as compared to 2018 primarily as a result of a $17.8 million decline in the
provision for indemnification obligations that was largely a result of the reversal of a portion of the liability for representation
and warranty obligations related to favorable updates to default, defect and severity assumptions relative to historical
performance. In addition, Other expenses for 2019 includes a $7.2 million expense recovery in connection with a settlement
with a mortgage insurer.
Interest expense increased by $5.5 million, or 13%, compared to 2018 primarily due to a $5.0 million of interest expense
on the new Agency MSR financing facility entered into on July 1, 2019.

62
Pledged MSR liability expense was $372.1 million for 2019 and included $437.7 million net servicing fee remittance to
NRZ, a $33.8 million fair value loss on the MSR secured financing liability, partially offset by a $95.2 million amortization.
The fair value loss on the MSR liability comprised a $233.5 million loss due to assumption updates, mostly related to non-
Agency MSRs, partially offset by an $86.3 million gain due to interest rate decline (as rates decline the value of the MSR asset
and the offsetting MSR liability decreases resulting in a gain on the liability) and $113.4 million gain due to runoff. Pledged
MSR liability expense increased $200.4 million in 2019 as compared to 2018, largely due to $115.9 million unfavorable
pledged MSR fair value adjustments, $53.7 million lower 2017/18 lump sum amortization gain and $41.0 million additional net
servicing fee remittance to NRZ. This unfavorable pledged MSR liability fair value adjustment results, among other factors,
from an update to our non-Agency MSR fair value assumptions associated with improved collateral performance and market
trade activity. We recognized a lower 2017/18 lump sum amortization gain in 2019 mostly due to a lower underlying collateral
balance, i.e., portfolio runoff. Additional servicing fees were remitted to NRZ in 2019 due to the PHH acquisition as similar
arrangements applied to the MSR transactions between PHH and NRZ. The following table provides information regarding the
Pledged MSR liability expense:
Years Ended December 31,
In millions 2019 2018 2017
Net servicing fee remitted to NRZ (a) $ 437.7 $ 396.7 $ 254.2
2017/18 lump sum amortization (gain) (95.2 ) (148.9 ) (43.9 )
Other (4.2 ) 6.7 —
338.3 254.5 210.3
Change in fair value (b)
Runoff (113.4 ) (77.3 ) (57.3 )
Rate and assumption change 147.1 (4.9 ) 83.3
33.8 (82.2 ) 26.0
Pledged MSR liability expense $ 372.1 $ 172.3 $ 236.3
(a) Offset by corresponding amount recorded in Servicing and subservicing fee
(b) Offset by corresponding amount recorded in MSR valuation adjustments, net
Pledged MSR liability expense relates to the MSR sale agreements with NRZ that do not achieve sale accounting and are
presented on a gross basis in our Consolidated Financial Statements. See the Overview section above, Year ended December
31, 2019 versus 2018 and Note 10 — Rights to MSRs to the Consolidated Financial Statements for further detail. As described,
the lump sum amortization gain and other affect our net earnings while the other changes are offset by corresponding amounts
in other statement of operations line items.
Other, net increased $15.2 million as compared to 2018 primarily due to other income recognized in connection with call
rights exercised by NRZ, or by Ocwen at NRZ’s direction, for MSRs underlying the agreements with NRZ. Ocwen
derecognizes the MSRs and the related financing liability upon collapse of the securitization. See Note 10 — Rights to MSRs
for additional information.
Lending
We originate and purchase conventional and government-insured forward mortgage loans through our forward lending
operations. During 2018 and the first half of 2019, our forward lending efforts were principally focused on targeting existing
Ocwen customers by offering them competitive mortgage refinance opportunities (i.e., portfolio recapture), where permitted by
the governing servicing and pooling agreement. In doing so, we generate revenues for our forward lending business and protect
the servicing portfolio by retaining these customers. We re-entered the forward lending correspondent channel in the second
quarter of 2019 to drive higher servicing portfolio replenishment.
A portion of our servicing portfolio is susceptible to refinance activity during periods of declining interest rates. Our
lending activity partially mitigates this risk. Origination volume and related gains are a natural economic hedge, to a certain
degree, to the impact of declining MSR values as interest rates decline. Under the terms of our agreements with NRZ, to the
extent we refinanced a loan underlying the MSRs subject to these agreements, we were obligated to transfer such recaptured
MSR to NRZ under the terms of a separate subservicing agreement. Effective June 1, 2019, we no longer perform any portfolio
recapture on behalf of NRZ.
We originate and purchase reverse mortgages through our reverse lending operations under the guidelines of the HECM
reverse mortgage insurance program of HUD. Loans originated under this program are generally guaranteed by the FHA,

63
which provides investors with protection against risk of borrower default. In the second half of 2019, we started originating
proprietary reverse mortgage loans that are not FHA-guarantee eligible and are sold servicing-released to third parties. The
financial statement impact of these non-HECM loans was negligible in 2019. We retain the servicing rights to reverse HECM
loans securitized through the Ginnie Mae HMBS program. We have originated HECM loans under which the borrowers have
additional borrowing capacity of $1.5 billion at December 31, 2019. These draws are funded by the servicer and can be
subsequently securitized or sold (Future Value). We do not incur any substantive underwriting, marketing or compensation
costs in connection with any future draws, although we must maintain sufficient capital resources and available borrowing
capacity to ensure that we are able to fund these future draws. At December 31, 2019, the Future Value related to future draw
commitments that is not recognized in our financial statements as part of the fair value of the loan portfolio is estimated to be
$47.0 million (versus $68.1 million at December 31, 2018) and will be recognized as a one-time adjustment to shareholders
equity on January 1, 2020, as we elected to measure future draw commitments at fair value in conjunction with the application
of the new credit loss accounting standard. See Note 1 — Organization, Business Environment, Basis of Presentation and
Significant Accounting Policies to the Consolidated Financial Statements for additional information.
In 2019, our Lending business originated or purchased forward and reverse mortgage loans with a UPB of $1.2 billion and
$729.4 million, respectively. Loans are originated or acquired through three primary channels: correspondent lender
relationships, broker relationships (wholesale) and directly with mortgage customers (retail). Loan margins vary by channel,
with correspondent typically being the lowest margin and retail the highest.
After origination, we package and sell the loans in the secondary mortgage market, through GSE and Ginnie Mae
securitizations on a servicing retained basis and through whole loan transactions on a servicing released basis. Lending
revenues mostly include interest income earned for the period the loans are held by us, gain on sale revenue, which represents
the difference between the origination value and the sale value of the loan including its MSR value, and fee income earned at
origination. As the securitizations of reverse mortgage loans do not achieve sale accounting treatment, reverse mortgage
revenues include the fair value changes of the loan from lock date net of the fair value changes of the MBS-related borrowings.
We provide customary origination representations and warranties to investors in connection with our loan sales and
securitization activities. We receive customary origination representations and warranties from our network of approved
correspondent lenders. We recognize the fair value of the liability for our representations and warranties at the time of sale. In
the event we cannot remedy a breach of a representation or warranty, we may be required to repurchase the loan or provide an
indemnification payment to the mortgage loan investor. To the extent that we have recourse against a third-party originator, we
may recover part or all of any loss we incur.
As an HMBS issuer, we assume certain obligations related to each security issued. The most significant obligation is the
requirement to purchase loans out of the Ginnie Mae securitization pools once the outstanding principal balance of the related
HECM is equal to or greater than 98% of the maximum claim amount (MCA repurchases). Active repurchased loans are
assigned to HUD and payment is received from HUD, typically within 60 days of repurchase. HUD reimburses us for the
outstanding principal balance on the loan up to the maximum claim amount. We bear the risk of exposure if the amount of the
outstanding principal balance on a loan exceeds the maximum claim amount. Inactive repurchased loans (the borrower is
deceased, no longer occupies the property or is delinquent on tax and insurance payments) are generally liquidated through
foreclosure and subsequent sale of real estate owned. State specific foreclosure and REO liquidation timelines have a
significant impact on the timing and amount of our recovery. If we are unable to sell the property underlying an inactive reverse
loan for an acceptable price within the timeframe established by HUD, we are required to make an appraisal-based claim to
HUD. In such cases, HUD reimburses us for the loan balance, eligible expenses and interest, less the appraised value of the
underlying property. Thereafter, all the risks and costs associated with maintaining and liquidating the property remains with us.
We may incur additional losses on REO properties as they progress through the claims and liquidation processes. The
significance of future losses associated with appraisal-based claims is dependent upon the volume of inactive loans, condition
of foreclosed properties and the general real estate market.
Significant Variables
Economic Conditions. General economic conditions impact the capacity for consumer credit and the supply of capital.
More specifically, employment and home prices are variables that can each have a material impact on mortgage volume.
Employment levels, the level of wages and the stability of employment are underlying factors that impact credit qualification.
The effect of home prices on lending volumes is significant and complex. As home prices go up, home equity increases and this
improves the position of existing homeowners either to refinance or to sell their home, which often leads to a new home
purchase and a new forward mortgage loan, or in the case of a reverse mortgage, increase the size of the mortgage loan
available and the number of potential borrowers. However, if home prices increase rapidly, the effect on affordability for first-
time and move-up buyers can dampen the demand for mortgage loans. The more restrictive standards for loan to value (LTV)
ratios, debt to income (DTI) ratios and employment that characterize the current market amplify the significance and sensitivity
of the housing market and related mortgage lending volumes to employment levels and home prices.

64
Market Size and Composition. Changes in mortgage rates directly impact the demand for both purchase and refinance
forward mortgages. Small changes in mortgage rates directly impact housing affordability for both first-time and move-up
home buyers and affect their ability to purchase a home. For refinance loans, current market mortgage rates must be considered
relative to the rates on the current mortgage debt outstanding. As the time and cost to refinance has decreased, relatively small
reductions in mortgage rates can trigger higher refinancing activity. Given the large size of U.S. residential forward mortgage
debt outstanding, the impact of mortgage rate changes can drive significant swings in mortgage refinance volume. A December
2019 Fannie Mae forecast projects a decline in mortgage originations of 5% from 2019 to 2020, including a decline in
refinance volume of approximately 22%. Declines in aggregate mortgage market and refinance volume will generally make
growing our Lending business more difficult.
Market size is likewise impacted by changes to existing, or development of new, GSE or other government sponsored
programs. Changes in GSE or HUD guidelines and costs and the availability of alternative financing sources, such as non-
Agency proprietary loans and traditional home equity loans, impact borrower demand for forward and reverse mortgages.
In August 2017, the FHFA announced an extension of the Home Affordable Refinance Program (HARP) to December 31,
2018. This program allowed borrowers with loans sold to Fannie Mae or Freddie Mac prior to June 1, 2009 to refinance
through a simplified process with broader underwriting guidelines, most notably, higher LTV ratios. The HARP program has
provided a boost to lending volumes and higher relative margins by providing broader refinance opportunities and more
effective portfolio recapture.
Effective in October 2017, HUD and FHA changed the amount of mortgage insurance premium paid by borrowers,
lowered the lending interest rate floor and updated the principal limit factors, all of which put downward pressure on the
amount of proceeds a borrower would receive. Since these changes were implemented, new endorsements, a proxy for market
size, have declined according to the HUD HECM Endorsement Summary Reports. To the extent the benefits of a reverse
mortgage are reduced, or become less attractive to borrowers, lending volumes and margins will continue to be negatively
impacted.
Investor Demand. The liquidity of the secondary market impacts the size of the market by defining loan attributes and
credit guidelines for loans that investors are willing to buy and at what price. In recent years, the GSEs have been the dominant
providers of secondary market liquidity for forward mortgages, keeping the product and credit spectrum relatively
homogeneous and risk averse (higher credit standards).
Margins. Changes in pricing margin are closely correlated with changes in market size. As loan demand and market
capacity move out of alignment, pricing adjusts. In a growing market, margins expand and in a contracting market, margins
tighten as lenders seek to keep their production at or close to full capacity. Managing capacity and cost is critical as volumes
change. Among our channels, our margins per loan are highest in the retail channel and lowest in the correspondent channel.
We work directly with the borrower to process, underwrite and close loans in our retail and reverse wholesale channels. In our
retail channel, we also identify the customer and take loan applications. As a result, our retail channel is the most people- and
cost-intensive and experiences the greatest volume volatility.
On February 28, 2019, we merged Homeward into PMC with PMC being the surviving entity. All of our forward lending
purchase and origination activities are conducted under the PHH brand effective April 1, 2019.

65
The following table presents the results of operations of our Lending segment. The amounts presented are before the
elimination of balances and transactions with our other segments:
Years Ended December 31, % Change
2019 2018 2017 2019 vs.
2018 2018 vs.
2017
Revenue
Gain on loans held for sale, net $ 32,181 $ 28,901 $ 45,588 11 % (37 )%
Reverse mortgage revenue, net 86,309 60,237 75,515 43 (20 )
Other revenue, net 6,596 4,534 6,372 45 (29 )
Total revenue 125,086 93,672 127,475 34 (27 )
MSR valuation adjustments, net (230 ) (474 ) (273 ) (51 ) 74
Operating expenses
Compensation and benefits 45,086 46,404 74,299 (3 ) (38 )
Servicing and origination 17,170 16,447 17,716 4 (7 )
Occupancy and equipment 6,431 6,070 4,778 6 27
Technology and communications 3,157 1,936 2,534 63 (24 )
Professional services 1,339 1,206 2,359 11 (49 )
Corporate overhead allocations 6,023 3,691 3,981 63 (7 )
Other expenses 5,074 6,678 22,118 (24 ) (70 )
Total operating expenses 84,280 82,432 127,785 2 (35 )
Other income (expense)
Interest income 7,277 6,061 10,914 20 (44 )
Interest expense (7,911 ) (7,311 ) (13,893 ) 8 (47 )
Other, net 791 1,638 (869 ) (52 ) (288 )
Total other income (expense), net 157 388 (3,848 ) (60 ) (110 )
Income (loss) from continuing operations before
income taxes $ 40,733
$ 11,154
$ (4,431 ) 265
(352 )
December 31,
UPB in millions 2019 2018 %
Change
Short-term loan funding commitments
Forward loans $ 204,021 $ 132,076 54 %
Reverse loans 28,545 18,099 58
Future Value (1) (2) 47,038 68,075 (31 )%
Future draw commitment (UPB) (3) 1,502.2 1,426.8 5 %

66
The following table provides selected operating statistics for our Lending segment:
Years Ended December 31, % Change
UPB in millions 2019 2018 2017 2019 vs.
2018 2018 vs.
2017
Loan Production by Channel
Forward loans
Retail $ 656.6 $ 868.1 $ 857.8 (24 )% 1 %
Correspondent 494.0 0.4 487.5 n/m (100 )
Wholesale — 1.8 1,173.0 (100 ) (100 )
$ 1,150.6 $ 870.3 $ 2,518.3 32 (65 )
% HARP production — % 7 % 8 % (100 )% (13 )%
% Purchase production 18 4 33 350 (88 )
% Refinance production 82 96 67 (15 ) 43
Reverse loans (4)
Correspondent $ 411.6 $ 360.4 $ 495.1 14 % (27 )%
Wholesale 238.2 170.9 382.2 39 (55 )
Retail 79.6 62.4 164.4 28 (62 )
$ 729.4 $ 593.7 $ 1,041.7 23 (43 )
Average Employment
U.S. 387 425 698 (9 )% (39 )%
India and other 97 131 234 (26 ) (44 )
Total 484 556 932 (13 ) (40 )
(1) Future Value represents the net present value of estimated future cash flows from customer draws of the reverse mortgage loans and
projected performance assumptions based on historical experience and industry benchmarks discounted at 12% related to HECM loans
originated prior to January 1, 2019. We have recognized this Future Value over time as future draws were securitized or sold.
(2) Excludes the fair value of future draw commitments related to HECM loans purchased or originated after December 31, 2018 that we
elected to carry at fair value.
(3) Includes all future draw commitments.
(4) New loan production excludes reverse mortgage loan draws by borrowers disbursed subsequent to origination of $293.6 million and
$301.9 million in 2019 and 2018, respectively.
Our Lending segment results for 2019, as compared to 2018, were primarily driven by the acquisition of PHH, our re-entry
into the forward lending correspondent channel, and reverse lending HECM program and market changes and the related
impacts on loan production, revenue and expenses. According to the HUD HECM Endorsement Summary Report, industry
endorsements, or the number of new HECM loans insured by the FHA during the reporting period, totaled 32,482 and 41,736
during 2019 and 2018, respectively, representing a decline of 22% as compared to 2018. The decline in the retail production of
forward mortgage loans was mostly driven by the end of the recapture program on behalf of NRZ effective June 1, 2019 and
the impact of the closure of a U.S. facility with origination personnel.
Year Ended December 31, 2019 versus 2018
Total revenue increased $31.4 million, or 34%, as compared to 2018 primarily due to a $37.2 million favorable net change
in the fair values of our HECM reverse mortgage loans and the related HMBS-related borrowings included in Reverse
mortgage revenue, net.
The $26.1 million increase in reverse mortgage revenue, net in 2019 as compared to 2018 is mostly explained by a $12.2
million fair value gain recognized in connection with the fair value election in the first quarter of 2019 for future draw
commitments on HECM reverse mortgage loans purchased or originated after December 31, 2018, and a $12.4 million fair
value gain due to lower interest rates. Lower interest rates generally result in favorable net fair value impacts on our HECM
reverse mortgage loans and the related HMBS-related borrowings and higher interest rates generally result in unfavorable net
fair value impacts. Fair value gain of HECM loans on securitization declined in spite of a 23% increase in loan production due
to margin compression in the wholesale and correspondent channels. The increase in our reverse lending volume in 2019 as
compared to 2018, versus the decline in industry endorsements for the comparable period, is due to our efforts to re-start

67
purchases with former customers and increase wallet share with existing customers in our wholesale, correspondent and closed
whole-loan purchase channels.
Gain on loans held for sale, net, increased $3.3 million, or 11%, as compared to 2018, mostly due to higher loan production
by $416.1 million, or 28%, partially offset by lower average gain on sales margins driven by the increased weight of the lower
margin correspondent channel and increased price competition as compared to 2018.
Operating expenses increased $1.8 million, or 2%, as compared to 2018, primarily due to an increase in corporate overhead
allocations that is attributed to PHH integration expenses offset in part by the effects of our cost reduction initiatives. Certain
expenses are variable, and as a result, as origination volume increase or decrease so do the related expenses. Examples include
commissions, recorded in Compensation and benefits expense, and advertising expense, recorded in Other expenses. Total
average headcount decreased 13% as compared to 2018, reflecting reductions in staffing levels as part of our cost re-
engineering and simplification plans offset in part by the increase due to the acquisition of PHH. Compensation and benefits
expense declined by only $1.3 million, or 3% as average higher-cost U.S. headcount increased to 80% of total average
headcount for 2019 from 76% for 2018.
Interest income consists primarily of interest earned on newly-originated and purchased loans prior to sale to investors.
Interest expense is incurred to finance the mortgage loans. We finance originated and purchased forward and reverse mortgage
loans with repurchase and participation agreements, commonly referred to as warehouse lines. The increases in interest income
and interest expense as compared to 2018 is primarily the result of the increase in loan production.
Corporate Items and Other
Corporate Items and Other includes revenues and expenses of corporate support services, our reinsurance business CRL,
discontinued operations and inactive entities, and our other business activities that are currently individually insignificant,
revenues and expenses that are not directly related to other reportable segments, interest income on short-term investments of
cash, gain on repurchases of debt, interest expense on corporate debt and foreign currency exchange gains or losses. Interest
expense on direct asset-backed financings are recorded in the respective Servicing and Lending segments, while interest
expense on the SSTL and the Senior Notes is recorded in Corporate Items and Other and is not allocated. Our cash balances are
included in Corporate Items and Other.
Corporate support services include finance, facilities, human resources, internal audit, legal, risk and compliance and
technology functions. Corporate support services costs, specifically compensation and benefits and professional services
expense, have been, and continue to be, significantly impacted by regulatory actions against us and by significant litigation
matters. As part of our need to return to sustainable profitability as soon as possible, we seek to reduce our corporate support
services expenses while complying with our legal and regulatory obligations. We anticipate that our ability to return to
sustainable profitability will be significantly impacted by the degree to which we can reduce these costs going forward.
Corporate Items and Other also includes severance, retention, facility-related and other expenses incurred in 2019 related to our
re-engineering plan and have not been allocated to other segments.
CRL, our wholly-owned captive reinsurance subsidiary, provides re-insurance related to coverage on REO properties
owned or serviced by us. CRL assumes a quota share of REO insurance coverage written by a third-party insurer under a
blanket policy issued to PMC (formerly OLS). The underlying REO policy provides coverage for direct physical loss on
commercial and residential properties, subject to certain limitations. Under the terms of the reinsurance agreement, CRL
assumes a 40% share of all related losses and loss adjustment expenses incurred by the third-party insurer. The reinsurance
agreement excludes properties located in the State of New York and has an expiration date of December 31, 2020, although it
may be terminated by either party at any time with thirty days’ advance written notice.
Certain expenses incurred by corporate support services that are not directly attributable to a segment are allocated to the
Servicing and Lending segments. Certain litigation and settlement related expenses or recoveries, costs related to our re-
engineering plan, costs related to our Board of Directors and costs related to certain closed facility sites are not allocated and
remain within in the Corporate Items and Other segment.

68
The following table presents selected results of operations of Corporate Items and Other. The amounts presented are before
the elimination of balances and transactions with our other segments:
Years Ended December 31, % Change
2019 2018 2017 2019 vs.
2018 2018 vs.
2017
Revenue
Premiums (CRL) $ 12,956 $ 16,603 $ 23,114 (22 )% (28 )%
Other revenue 231 1,546 2,697 (85 ) (43 )
Total revenue 13,187 18,149 25,811 (27 ) (30 )
Operating expenses
Compensation and benefits 125,748 106,058 124,181 19 (15 )
Professional services 59,173 110,705 160,569 (47 ) (31 )
Technology and communications 43,402 50,770 51,718 (15 ) (2 )
Occupancy and equipment 17,376 11,050 13,822 57 (20 )
Servicing and origination 741 253 4,211 193 (94 )
Other expenses 10,969 13,679 24,732 (20 ) (45 )
Total operating expenses before corporate overhead allocations 257,409
292,515
379,233
(12 ) (23 )
Corporate overhead allocations
Servicing segment (197,880 ) (211,701 ) (221,049 ) (7 ) (4 )
Lending segment (6,023 ) (3,691 ) (3,981 ) 63 (7 )
Total operating expenses 53,506 77,123 154,203 (31 ) (50 )
Other income (expense), net
Interest income 1,776 2,582 4,268 (31 ) (40 )
Interest expense (58,871 ) (54,230 ) (55,750 ) 9 (3 )
Bargain purchase gain (381 ) 64,036 — (101 ) n/m
Gain on repurchase of senior secured notes 5,099 — — n/m n/m
Other, net (3,758 ) (4,096 ) (6,348 ) (8 ) (35 )
Total other (expense) income, net (56,135 ) 8,292 (57,830 ) (777 ) (114 )
Loss from continuing operations before income
taxes $ (96,454 ) $ (50,682 ) $ (186,222 ) 90
(73 )
n/m: not meaningful
Year Ended December 31, 2019 versus 2018
CRL premium revenue decreased $3.6 million, or 22%, as compared to 2018 primarily due to the 10% decline in the
average number of foreclosed real estate properties in our servicing portfolio.
Total operating expenses before corporate overhead allocations declined $35.1 million, or 12%, as compared to 2018
primarily due to the recovery in 2019 of $34.7 million from a service provider and mortgage insurer, lower legal fees and
settlements and the effects of our cost-reduction efforts, partly offset by higher compensation and benefits expense attributed to
PHH and $65.0 million of costs incurred related to our cost re-engineering plan.
Compensation and benefits expense increased $19.7 million, or 19%, as compared to 2018 due to the PHH acquisition and
$35.7 million of severance and retention costs recognized in connection with our integration-related headcount reductions of
primarily U.S. based employees. Although average total corporate headcount increased 3%, average higher-cost U.S. headcount
increased to 39% of the total for 2019 from 32% for 2018.
Professional services expense declined $51.5 million, or 47%, as compared to 2018 primarily due to the $34.7 million
recovery in 2019 of prior expense from a service provider and mortgage insurer and an $11.7 million decrease in provisions for
probable losses in connection with litigation. In addition, 2018 included $13.7 million of direct costs related to the acquisition
of PHH.
Technology and communications expense decreased $7.4 million, or 15%, as compared to 2018 primarily due to a $7.2
million decrease in depreciation expense that is largely the result of a decline in capitalized technology investments and the

69
closure of seven U.S. facilities, as well as our other cost reduction efforts which included bringing technology services in-
house. These reductions were partially offset by an increase in expenses as a result of PHH expenses.
Occupancy and equipment expense increased $6.3 million or 57%, as compared to 2018, primarily due to PHH expenses
and accelerated amortization of ROU assets in connection with our decision to vacate leased properties in 2019 prior to the
contractual maturity date of the lease agreements.
Interest expense increased $4.6 million, or 9%, as compared to 2018, primarily as a result of the increase in borrowings
under our SSTL due to the $120.0 million SSTL upsize we executed in March 2019 and the financing cost of the senior
unsecured notes assumed as part of the PHH acquisition.
We recognized a bargain purchase gain, net of tax, of $63.7 million ($64.0 million original gain recognized in 2018) in
connection with the acquisition of PHH representing the excess of the net assets acquired over the consideration paid. The
purchase price we negotiated contemplated that PHH would incur losses after the acquisition date. See Note 2 — Business
Acquisition to the Consolidated Financial Statements for additional information.
During July and August 2019, we repurchased a total of $39.4 million of our 8.375% Senior secured notes in the open
market for a price of $34.3 million and recognized a gain of $5.1 million.
Other, net declined $0.3 million, or 8%, as compared to 2018 primarily due to a $3.1 million decrease in foreign currency
remeasurement losses offset by a $2.9 million increase in losses on fixed assets, including the write-off of $2.2 million of
capitalized software no longer used. The higher foreign currency remeasurement losses in 2018 were primarily attributable to
depreciation of the India Rupee against the U.S. Dollar. Foreign currency exchange losses were $0.2 million and $3.2 million
for 2019 and 2018, respectively. While we do not currently hedge our foreign currency exposure, we do maintain India Rupee
denominated investments in higher-yielding term deposits to partially offset our exposure.
Total expenses, after corporate overhead allocations, of $53.5 million for 2019 includes $65.0 million of severance,
retention, facility-related and other expenses related to our cost re-engineering plan and the recovery of $34.7 million from a
service provider and mortgage insurer in 2019, all of which are not allocated.

70
FOURTH QUARTER RESULTS
(Unaudited consolidated statements of operations)
Quarters Ended December 31, %
Change
2019 2018 2019 vs.
2018
Revenue
Servicing and subservicing fees $ 229,951 $ 276,970 (17 )%
Gain on loans held for sale, net 11,988 9,834 22
Reverse mortgage revenue, net 13,433 17,568 (24 )
Other revenue, net 5,799 6,557 (12 )
Total revenue 261,171 310,929 (16 )
MSR valuation adjustments, net 829 (61,762 ) (101 )
Operating expenses
Compensation and benefits 63,115 86,816 (27 )
Professional services 25,433 54,733 (54 )
Servicing and origination 21,717 39,845 (45 )
Technology and communications 18,086 30,935 (42 )
Occupancy and equipment 15,596 22,262 (30 )
Other expenses (5,089 ) 6,466 (179 )
Total operating expenses 138,858 241,057 (42 )
Other income (expense)
Interest income 4,580 4,008 14
Interest expense (29,493 ) (25,027 ) 18
Pledged MSR liability expense (68,787 ) (60,413 ) 14
Bargain purchase gain (118 ) 64,036 (100 )
Gain on sale of MSRs, net — 1,022 (100 )
Other, net 7,919 501 n/m
Other expense, net (85,899 ) (15,873 ) 441
Income (loss) from continuing operations before income taxes 37,243 (7,763 ) (580 )
Income tax expense (benefit) 2,370 (4,012 ) (159 )
Income (loss) from continuing operations 34,873 (3,751 ) n/m
Income from discontinued operations, net of income taxes — 1,409 (100 )
Net income (loss) $ 34,873 $ (2,342 ) n/m
Segment income (loss) from continuing operations before taxes:
Servicing $ 58,927 $ (40,616 ) (245 )%
Lending 3,624 3,048 19
Corporate Items and Other (25,308 ) 29,805 (185 )
$ 37,243 $ (7,763 ) (580 )
n/m: not meaningful
We reported net income of $34.9 million for the fourth quarter of 2019 as compared to a net loss of $2.3 million for the
fourth quarter of 2018.
Total revenue was $49.8 million, or 16% lower in the fourth quarter of 2019 as compared to the fourth quarter of 2018.
This decrease is primarily due to a decline in Servicing and subservicing fees that was mostly driven by a lower average UPB

71
of loans serviced for the quarter, due to runoff and servicing transfers, and fewer borrower loan modifications. The average
UPB of our servicing portfolio declined 12% as compared to the fourth quarter of 2018.
We reported a net $0.8 million gain in MSR valuation adjustments, net in the fourth quarter of 2019 compared to a $61.8
million loss for the fourth quarter of 2018. The $62.6 million improvement is primarily due to a $77.1 million positive change
in fair value related to higher interest rates, offset in part by a $14.7 million unfavorable impact from higher portfolio runoff.
The 10-year swap rate increased 33 basis points in the fourth quarter of 2019 as compared to a 40 basis-point decline in the
fourth quarter of 2018. Fair value adjustments to our MSRs are offset, in part, by fair value adjustments related to the NRZ
financing liabilities, which are recorded in Pledged MSR liability expense.
Operating expenses declined $102.2 million, or 42%, compared with the fourth quarter of 2018. Severance, retention,
facility-related and other expenses related to our cost re-engineering plan of $14.4 million in the fourth quarter of 2019 were
more than offset by significant expense reductions across the company as a result of our cost reduction efforts. Such efforts
include eliminating redundant costs through the integration process including headcount reductions, facility closures and legal
entity reorganization as well as bringing technology services in-house. We reduced total average headcount by 25% compared
to the fourth quarter of 2018. In addition, the fourth quarter of 2019 includes recoveries of $15.0 million from a mortgage
insurer and service provider of amounts recognized as expenses in prior periods.
LIQUIDITY AND CAPITAL RESOURCES
Overview
We closely monitor our liquidity position and ongoing funding requirements, and we regularly monitor and project cash
flows over various time horizons as a way to anticipate and mitigate liquidity risk.
In assessing our liquidity outlook, our primary focus is on available cash on hand, unused available funding and the
following six forecast measures:
• Financial projections for ongoing net income, excluding the impact of non-cash items, and working capital needs
including loan repurchases;
• Requirements for amortizing and maturing liabilities compared to sources of cash;
• The projected change in advances and match funded advances compared to the projected borrowing capacity to fund
such advances under our facilities, including capacity for monthly peak needs;
• Projected funding requirements for acquisitions of MSRs and other investment opportunities;
• Potential payments or recoveries related to legal and regulatory matters, insurance, taxes and MSR transactions; and
• Funding capacity for whole loans and tail draws under our reverse mortgage commitments subject to warehouse
eligibility requirements.
At December 31, 2019, our unrestricted cash position was $428.3 million compared to $329.1 million at December 31,
2018. We typically invest cash in excess of our immediate operating needs in money market deposit accounts and other liquid
assets. At December 31, 2019, no unencumbered loans held for sale were eligible for funding under our warehouse facilities on
an uncommitted basis, compared to $62.4 million on a committed basis as of December 31, 2018. Our liquidity was bolstered
by the $120.0 million upsizing of our SSTL during the first quarter of 2019 and net borrowings of $314.4 million under our
new MSR financing facilities in 2019. During 2019, we used $157.2 million of cash to repay the PHH senior unsecured notes at
maturity, partially repurchase second lien senior secured notes and pay the SSTL required amortization. On January 27, 2020,
we prepaid $126.1 million of the outstanding SSTL balance and executed certain amendments to the SSTL agreement to extend
the maturity date to May 15, 2022, reduce the contractual quarterly principal payment from $6.4 million to $5.0 million and
modify the interest rate. See Note 28 — Subsequent Events for additional information.
We regularly evaluate capital structure options that we believe will most effectively provide the necessary capacity to
support our investment plans, address upcoming debt maturities and accommodate our business needs. For example, in 2019,
we closed three new financing facilities secured by MSRs resulting in $314.4 million of funding at December 31, 2019 and
$179.97 million of available borrowing capacity. Our capital structure actions were targeted at optimizing access to capital,
improving our cost of funds, enhancing financial flexibility, bolstering liquidity and reducing funding risk while maintaining
leverage within our risk tolerances. Historical losses have significantly eroded our stockholders’ equity and weakened our
financial condition. To the extent we are not successful in achieving our objective of returning to profitability, funding
continuing losses will limit our opportunities to grow our business through capital investment.
The available borrowing capacity under our advance financing facilities has increased by $4.2 million from $46.7 million
at December 31, 2018 to $50.9 million at December 31, 2019. The $99.2 million decline in outstanding borrowings in
combination with a $95.0 million reduction in maximum borrowing capacity from December 31, 2018 drove the net increase in
available capacity. Our ability to continue to pledge collateral under our advance financing facilities depends on the
72
performance of the advances, among other factors. At December 31, 2019, we had fully funded the amounts that could be
funded under the available borrowing capacity based on the amount of eligible collateral that had been pledged to our advance
financing facilities.
At December 31, 2019, we had maximum borrowing capacity under our forward and reverse warehouse facilities of $1.5
billion. Of the borrowing capacity extended on a committed basis, $288.4 million was available at December 31, 2019, and no
additional amounts could be borrowed under the available borrowing capacity based on the amount of eligible collateral that
could be pledged. Uncommitted amounts ($684.4 million available at December 31, 2019) can be advanced solely at the
discretion of the lender, and there can be no assurance that any uncommitted amounts will be available to us at any particular
time. At December 31, 2019, no additional amounts could be borrowed under the uncommitted borrowing capacity based on
the amount of eligible collateral that could be pledged, assuming our lenders were willing to do so.
A portion of our cash balances are held in our non-U.S. subsidiaries. Should we wish to utilize this cash in the U.S, we
would have to repatriate the cash held by our non-U.S. subsidiaries in compliance with applicable laws and, potentially with tax
consequences.
We have considered the impact of financial projections on our liquidity analysis and have evaluated the appropriateness of
the key assumptions in our forecast such as revenues, expenses, our assessment of the likely impact of open regulatory and
litigation matters, recurring and nonrecurring costs, levels of investment and availability of funding sources. As part of this
analysis, we have also assessed the cash requirements to operate our business and service our financial obligations coming due.
Based upon these evaluations and analysis, we believe that we have sufficient liquidity and access to adequate sources of new
capital to meet our obligations and fund our operations for the next twelve months.
Sources of Funds
Our primary sources of funds for near-term liquidity in normal course include:
• Collections of servicing fees and ancillary revenues;
• Collections of advances in excess of new advances;
• Proceeds from match funded advance financing facilities;
• Proceeds from other borrowings, including warehouse facilities and MSR financing facilities;
• Proceeds from sales and securitizations of originated loans and repurchased loans; and
• Net positive working capital from changes in other assets and liabilities.
Servicing advances are an important component of our business and represent amounts that we, as servicer, are required to
advance to, or on behalf of, our servicing clients if we do not receive such amounts from borrowers. Our use of advance
financing facilities is integral to our servicing advance financing strategy. Revolving variable funding notes issued by our
advance financing facilities to financial institutions have revolving periods of 12 to 18 months. Term notes are generally issued
to institutional investors with one-, two- or three-year revolving periods.
We use mortgage loan warehouse facilities (commonly called warehouse lines) to fund newly-originated loans on a short-
term basis until they are sold to secondary market investors, including GSEs or other third-party investors, and to fund
repurchases of certain Ginnie Mae forward loans, HECM loans, second lien loans and other types of loans. Warehouse facilities
are structured as repurchase or participation agreements under which ownership of the loans is temporarily transferred to the
lender. These facilities contain eligibility criteria that include aging and concentration limits by loan type among other
provisions. Currently, our master repurchase and participation agreements generally have maximum terms of 364-days. The
funds are typically repaid using the proceeds from the sale of the loans to the secondary market investors, usually within 30
days.
We also rely on the secondary mortgage market as a source of consistent liquidity to support our lending operations.
Substantially all of the mortgage loans that we originate or purchase are sold or securitized in the secondary mortgage market
in the form of residential mortgage backed securities guaranteed by Fannie Mae or Freddie Mac and, in the case of mortgage
backed securities guaranteed by Ginnie Mae, are mortgage loans insured or guaranteed by the FHA or VA.

73
Collateral
Our assets held as collateral related to secured borrowings, committed under sale or other contractual obligations and
which may be subject to a secured lien under the SSTL are as follows at December 31, 2019:
Collateral for Secured Borrowings
Assets Total
Match Funded
Liabilities Financing Liabilities
Mortgage Loan
Warehouse/MSR
Facilities
Sales and Other
Commitments Other
Cash $ 428,339 $ — $ — $ — $ — $ 428,339
Restricted cash 64,001 17,332 — 5,944 40,725 —
MSRs (1) 1,486,395 — 915,148 575,471 — 525
Advances, net 254,533 — — — 28,737 225,796
Match funded assets 801,990 801,990 — — — —
Loans held for sale 275,269 — — 236,517 — 38,752
Loans held for investment 6,292,938
—
6,144,275
115,130
—
33,533
Receivables, net 201,220 — — 24,795 — 176,425
Premises and equipment, net 38,274
—
—
—
—
38,274
Other assets 563,240 — — 5,285 510,236 47,719
Total Assets $ 10,406,199 $ 819,322 $ 7,059,423 $ 816,944 $ 590,398 $ 1,120,112
Liabilities
HMBS - related borrowings $ 6,063,435
$ —
$ 6,063,435
$ —
$ —
$ —
Other financing liabilities 972,595 — 937,150 — — 35,445
Match funded liabilities 679,109 679,109 — — — —
Other secured borrowings, net 1,025,791
—
—
703,033
—
322,758
Senior notes, net 311,085 — — — — 311,085
Other liabilities 942,173 — — — 510,236 431,937
Total Liabilities $ 9,994,188 $ 679,109 $ 7,000,585 $ 703,033 $ 510,236 $ 1,101,225
Total Equity $ 412,011
(1) Certain MSR cohorts with a net negative fair value of $4.7 million that would be presented as Other are excluded from the eligible
collateral of the facilities and are comprised of $27.9 million of negative fair value related to RMBS and $23.2 million of positive fair
value related to private EBO and PLS MSRs.
See Note 14 — Borrowings for information on assets held as collateral related to secured borrowings, committed under
sale or other contractual obligations and which may be subject to a secured lien under the SSTL.
Use of Funds
Our primary uses of funds in normal course include:
• Payment of operating costs and corporate expenses;
• Payments for advances in excess of collections;
• Investing in our servicing and lending businesses, including MSR and other asset acquisitions;
• Originated and repurchased loans, including scheduled and unscheduled equity draws on reverse mortgage loans;
• Repayments of borrowings, including under our MSR financing, advance financing and warehouse facilities, and
payment of interest expense; and
• Net negative working capital and other general corporate cash outflows.

74
Under the terms of our SSTL facility agreement, subject to certain exceptions, we are required to prepay the SSTL with
certain percentage amounts of excess cash flow as defined and 100% of the net cash proceeds from certain permitted asset
sales, subject to our ability to reinvest such proceeds in our business within 270 days of receipt.
Outlook
Regarding the current maturities of our borrowings, as of December 31, 2019, we had approximately $1.2 billion of debt
outstanding that would either come due, begin amortizing or require partial repayment prior to December 31, 2020. This
amount is comprised of $326.1 million in contractual repayments of our SSTL, $332.2 million of borrowings under warehouse
facilities, $394.1 million of variable funding and term notes under advance financing facilities that will enter their respective
amortization periods and $147.7 million outstanding under one of our new MSR financing facilities which will terminate in
June 2020 unless renewed or extended. On January 27, 2020, we prepaid $126.1 million of the SSTL outstanding balance,
executed an amendment to the SSTL agreement which reduced the maximum borrowing capacity to $200.0 million, extended
the maturity date to May 15, 2022, reduced the contractual quarterly principal payment from $6.4 million to $5.0 million and
modified the interest rate.
We believe that we will be able to renew, replace or extend our debt agreements to the extent necessary to finance our
operations before or as they become due, consistent with our historical experience.
We are actively engaged with our lenders and as a result, have successfully completed the following with respect to our
current and anticipated financing needs:
• On February 4, 2019, we entered into a mortgage loan warehouse agreement under which the lender will provide
$300.0 million of borrowing capacity on an uncommitted basis for forward mortgage loan originations. On January
27, 2020, we renewed this facility through April 3, 2020.
• On March 18, 2019, we amended the SSTL to provide an additional term loan of $120.0 million subject to the same
maturity, interest rate and other material terms of existing borrowings under the SSTL. The required quarterly
principal payment was increased from $4.2 million to $6.4 million beginning March 31, 2019. On January 27, 2020,
we executed another amendment to the SSTL which reduced the maximum borrowing capacity to $200.0 million,
extended the maturity date to May 15, 2022, reduced the quarterly principal payment to $5.0 million and modified the
interest rate. See Note 28 — Subsequent Events for additional information.
• On June 6, 2019, we renewed our OFAF advance financing facility through June 5, 2020 and reduced the borrowing
capacity from $65.0 million to $60.0 million.
• On July 1, 2019, we entered into a committed financing facility that is secured by certain Fannie Mae and Freddie Mac
MSRs. The maximum amount which we may borrow is $300.0 million. This facility will terminate in June 2020
unless the parties mutually agree to renew or extend.
• On August 13, 2019, we renewed a reverse mortgage loan warehouse agreement with a maximum borrowing capacity
of $100.0 million (all of which is uncommitted) through August 14, 2020.
• On August 14, 2019, we issued two fixed-rate term notes (Series 2019 T-1 and Series 2019-T2) totaling $470.0
million and repaid Series 2016-T2, 2018-T1 and 2018-T2 fixed-rate term notes on August 15, 2019. The amortization
period for the Series 2019 T-1 and Series 2019-T2 notes begin on August 17, 2020 and August 16, 2021, respectively.
• On September 2, 2019, we redeemed all of the $97.5 million outstanding of our 7.375% Senior unsecured notes due in
September 2019, at a redemption price of 100.0% of the outstanding principal balance plus accrued and unpaid
interest.
• On September 27, 2019, we renewed a mortgage loan warehouse agreement with a maximum borrowing capacity of
$175.0 million ($100.0 million of which is committed) through September 25, 2020.
• On November 26, 2019, we entered into a committed financing facility that is secured by certain Ginnie Mae MSRs.
The maximum amount which we may borrow is $100.0 million. This facility will terminate in November 2021 unless
the parties mutually agree to renew or extend.
• On November 26, 2019, PMC issued notes secured by certain of PMC’s non-Agency or private label MSRs (PLS
MSRs) pursuant to a credit agreement. The Class A Notes issued pursuant to the credit agreement have an initial
principal amount of $100.0 million and amortize in accordance with a pre-determined schedule subject to modification
under certain events.
• On December 6, 2019, we renewed a reverse mortgage loan warehouse agreement with a maximum borrowing
capacity of $250.0 million ($200.0 million of which is committed) through December 5, 2020.
• On December 12, 2019, we renewed OMART advance financing facility through December 11, 2020 and reduced the
borrowing capacity from $225.0 million to $200.0 million.
• On December 26, 2019, we entered into a mortgage loan warehouse agreement to fund reverse mortgage loan draws
by borrowers subsequent to origination. Under this agreement, the lender provides financing for up to $50.0 million on
a committed basis.

75
• On January 27, 2020, as discussed above, we prepaid $126.1 million of the outstanding SSTL balance and executed
certain amendments to the SSTL agreement. See Note 28 — Subsequent Events for additional information.
Our liquidity forecast requires management to use judgment and estimates and includes factors that may be beyond our
control. Additionally, our business has been undergoing substantial change, which has magnified the uncertainties that are
inherent in the forecasting process. Our actual results could differ materially from our estimates. If we were to default under
any of our debt agreements, it could become very difficult for us to renew, replace or extend some or all of our debt
agreements. Challenges to our liquidity position could have a material adverse effect on our operating results and financial
condition and could cause us to take actions that would be outside the normal course of our operations to generate additional
liquidity.
Covenants
Our debt agreements contain various qualitative and quantitative covenants including financial covenants, covenants to
operate in material compliance with applicable laws and regulations, monitoring and reporting obligations and restrictions on
our ability to engage in various activities, including but not limited to incurring additional debt, paying dividends, repurchasing
or redeeming capital stock, transferring assets or making loans, investments or acquisitions. Because of the covenants to which
we are subject, we may be limited in the manner in which we conduct our business and may be limited in our ability to engage
in favorable business activities or raise additional capital to finance future operations or satisfy future liquidity needs. In
addition, breaches or events that may result in a default under our debt agreements include, among other things, nonpayment of
principal or interest, noncompliance with our covenants, breach of representations, the occurrence of a material adverse change,
insolvency, bankruptcy, certain material judgments and litigation and changes of control.
Covenants and default provisions of this type are commonly found in debt agreements such as ours. Certain of these
covenants and default provisions are open to subjective interpretation and, if our interpretation were contested by a lender, a
court may ultimately be required to determine compliance or lack thereof. In addition, our debt agreements generally include
cross default provisions such that a default under one agreement could trigger defaults under other agreements. If we fail to
comply with our debt agreements and are unable to avoid, remedy or secure a waiver of any resulting default, we may be
subject to adverse action by our lenders, including termination of further funding, acceleration of outstanding obligations,
enforcement of liens against the assets securing or otherwise supporting our obligations, and other legal remedies, any of which
could have a material adverse effect on our business, financial condition, liquidity and results of operations. We believe that we
are in compliance with the qualitative and quantitative covenants in our debt agreements as of the date this Annual Report on
Form 10-K is filed with the SEC.
Credit Ratings
Credit ratings are intended to be an indicator of the creditworthiness of a company’s debt obligations. Lower ratings
generally result in higher borrowing costs and reduced access to capital markets. The following table summarizes the current
ratings and outlook for PMC by the respective nationally recognized rating agencies. A credit rating is not a recommendation to
buy, sell or hold securities and may be subject to revision or withdrawal at any time.
Rating Agency Long-term Corporate
Rating Review Status /
Outlook Date of last action
Moody’s Caa1 Negative September 11, 2019
S&P B- Stable January 27, 2020
On September 11, 2019 Moody’s withdrew the Caa1 corporate family rating of Ocwen as it no longer maintained any rated
debt outstanding and issued a corporate family rating of Caa1 with negative outlook to PMC. It is possible that additional
actions by credit rating agencies could have a material adverse impact on our liquidity and funding position, including
materially changing the terms on which we may be able to borrow money. On January 27, 2020 S&P upgraded the Outlook on
our long-term issuer rating from Negative to Stable simultaneous with the closing of the transaction to amend and extend our
SSTL.
Cash Flows
Our operating cash flow is primarily impacted by operating results, changes in our servicing advance balances, the level of
mortgage loan production and the timing of sales and securitizations of mortgage loans. We classify proceeds from the sale of
servicing advances, including advances sold in connection with the sale of MSRs, as investing activity. We classify changes in
HECM loans held for investment as investing activity and changes in the related HMBS-related borrowings as financing
activity.
Our NRZ agreements have a significant impact on our consolidated statements of cash flows. Because the lump-sum
payments we received in connection with our 2017 Agreements and New RMSR Agreements are recorded as secured

76
financings, additions to, and reductions in, the balance of those secured financings are recognized as financing activity in our
consolidated statements of cash flows. Excluding the impact of changes to the secured financings attributed to changes in fair
value, changes in the balance of these secured financings are reflected in cash flows from operating activities despite having no
impact on our consolidated cash balance. Net cash provided by operating activities for the years ended December 31, 2019,
2018 and 2017 includes $101.0 million, $136.7 million and $1.9 million, respectively, of such cash flows and they were offset
by corresponding amounts in net cash used in financing activities in the same periods.
Cash flows for the year ended December 31, 2019
Our operating activities provided $151.9 million of cash largely due to $105.1 million of net collections of servicing
advances, offset in part by net cash paid on loans held for sale of $108.8 million.
Our investing activities used $587.4 million of cash. The primary uses of cash in our investing activities include net cash
outflows in connection with our HECM reverse mortgages of $467.4 million. Cash outflows also include $145.7 million to
purchase MSRs.
Our financing activities provided $530.8 million of cash. Cash inflows include $962.1 million received in connection with
our reverse mortgage securitizations, which are accounted for as secured financings, less repayments on the related financing
liability of $549.6 million. We increased borrowings under the SSTL through the issuance of an additional term loan of $120.0
million (before a discount of $0.9 million), less repayments of $25.4 million. In addition, we increased borrowings under our
mortgage loan warehouse facilities by $176.5 million and borrowed $314.4 million under new MSR financing facilities. Cash
outflows include $99.2 million of net repayments on match funded liabilities as a result of advance recoveries, $214.4 million
of net payments on the financing liabilities related to MSRs pledged, and $131.8 million to redeem and repurchase Senior
notes.
Cash flows for the year ended December 31, 2018
Our operating activities provided $272.6 million of cash largely due to $258.9 million of net collections of servicing
advances. Net cash paid on loans held for sale during the year was $90.1 million.
Our investing activities used $344.9 million of cash. The primary uses of cash in our investing activities include net cash
outflows in connection with our HECM reverse mortgages of $520.0 million. Cash inflows include net cash of $64.7 million
and restricted cash of $38.8 million acquired in connection with acquisition of PHH, net proceeds of $33.0 million on dealer
financing notes issued by our automotive capital services business, which we decided to exit in January 2018, and the receipt of
$41.1 million of net proceeds from the sale of MSRs and related advances.
Our financing activities provided $166.7 million of cash. Cash inflows include $948.9 million received in connection with
our reverse mortgage securitizations, which are accounted for as secured financings, less repayments on the related financing
liability of $392.0 million. In January 2018, we received a lump-sum payment of $279.6 million in accordance with the terms
of the New RMSR Agreements. Cash outflows include $220.3 million of net repayments on match funded liabilities as a result
of advance recoveries, $211.8 million of net payments on the financing liability related to MSRs pledged, $66.8 million of
repayments on the SSTL and $18.5 million to repurchase Senior notes. In addition, we reduced borrowings under our mortgage
loan warehouse facilities by $100.1 million.
RISK MANAGEMENT
Our risk management framework seeks to mitigate risk and appropriately balance risk and return. We have established
policies and procedures intended to identify, assess, monitor and manage the types of risk to which we are subject, including
strategic, market, credit, liquidity and operational risks.
Our Chief Risk and Compliance Officer is responsible for the design, implementation and oversight of our global risk
management and compliance programs. Risks unique to our businesses are governed through various management processes
and governance committees to oversee risk and related control activities across the company and provide a framework for
potential issues to be identified, assessed and remediated under the direction of senior executives from our business, finance,
risk, compliance, internal audit and law departments, as applicable. Information is aggregated and reports on risk matters are
made to the Board of Directors, its Risk and Compliance Committee or its other committees, as applicable, to enable the Board
of Directors and its committees to fulfill their governance and oversight responsibilities.
Strategic Risk
We are exposed to risk with respect to the strategic initiatives we need to undertake in order to return to growth and
profitability. Strategic risk represents the risk to shareholder or enterprise value, current or future earnings, capital and liquidity from
adverse business decisions and/or improper implementation of business strategies. Management is responsible for developing and
implementing business strategies that leverage our core competencies and are appropriately structured, resourced and executed.

77
Oversight for our strategic actions is provided by the Board of Directors. Our performance, relative to our business plans and our
longer-term strategic plans, is reviewed by management and the Board of Directors.
To achieve our near-term financial objectives, we believe we need to execute on the key business initiatives discussed above
under “Overview”. Our ability to achieve our objectives is highly dependent on the success of our business relationships with our
critical counterparties like the GSEs, FHFA, Ginnie Mae, our lenders, regulators, significant customers and our ability to attract new
customers, all of which are impacted by our capability to adequately address the competitive challenges we face. There can be no
assurance that we will be successful in executing on these initiatives. Further, there can be no assurance that even if we execute on
these initiatives we will be able to return to profitability. In addition to successful operational execution of our key initiatives, our
success will also depend on market conditions and other factors outside of our control. If we continue to experience losses, our share
price, business, reputation, financial condition, liquidity and results of operations could be materially and adversely affected.
Market Risk
Interest Rates
Our principal market risk exposure is the impact of interest rate changes on our mortgage-related assets and commitments,
including MSRs, loans held for sale, loans held for investment and interest rate lock commitments (IRLCs). In addition, changes
in interest rates could materially and adversely affect our volume of mortgage loan originations or result in MSR fair value
changes. We also have exposure to the effects of changes in interest rates on our floating-rate borrowings, including advance
financing facilities.
Interest rate risk is a function of (i) the timing of re-pricing and (ii) the dollar amount of assets and liabilities that re-price at
various times. We are exposed to interest rate risk to the extent that our interest rate-sensitive liabilities mature or re-price at
different speeds, or on different bases, than interest-earning assets.
Our management-level Market Risk Committee establishes and maintains policies that govern our hedging program,
including such factors as market volatility, duration and interest rate sensitivity measures, targeted hedge ratios, the hedge
instruments that we are permitted to use in our hedging activities and the counterparties with whom we are permitted to enter into
hedging transactions and our liquidity risk profile. See Note 17 — Derivative Financial Instruments and Hedging Activities to the
Consolidated Financial Statements for additional information regarding our use of derivatives.
Our market risk exposure may also be affected by the phase-out of LIBOR, expected to occur by the end of 2021. Many of
our debt facilities incorporate LIBOR. These facilities either mature prior to the end of 2021 or have terms in place that provide
for an alternative to LIBOR upon its phase-out. As we renew or replace these debt facilities, we will need to work with our
counterparties to incorporate alternative benchmarks. There is presently substantial uncertainty relating to the process and
timeline for developing LIBOR alternatives, how widely any given alternative will be adopted by parties in the financial markets,
and the extent to which alternative benchmarks may be subject to volatility or present risks and challenges that LIBOR does not.
Consequently, it is difficult to predict what effect, if any, the phase-out of LIBOR and the use of alternative benchmarks may have
on our business or on the overall financial markets. If LIBOR alternatives re-allocate risk among parties in a way that is
disadvantageous to market participants such as Ocwen, or if uncertainty relating to the LIBOR phase-out disrupts financial
markets, it could have a material adverse effect on our financial position, results of operations, and liquidity.
MSR Hedging Strategy
MSRs are carried at fair value with changes in fair value being recorded in earnings in the period in which the changes occur.
The fair value of MSRs is subject to changes in market interest rates and prepayment speeds. Beginning in September 2019,
management implemented a hedging strategy to partially offset the changes in fair value of our net MSR portfolio attributable to
interest rate changes. As a general matter, the impact of interest rates on the fair value of our MSR portfolio is naturally offset by
other exposures, including our pipeline and our economic MSR value embedded in our reverse mortgage loan portfolio. Our
hedging strategy is targeted at mitigating the residual exposure, which we refer to as our net MSR portfolio exposure. We define
our net MSR portfolio exposure as follows:
• our more interest rate-sensitive Agency MSR portfolio,
• less the Agency MSRs subject to our agreements with NRZ (See Note 10 — Rights to MSRs),
• less the unsecuritized reverse mortgage loans and tails classified as held-for-investment,
• less the asset value for securitized HECM loans net of the corresponding HMBS-related borrowings, and
• less the net value of our held for sale loan portfolio and lock commitments (pipeline).
We determine and monitor daily the hedge coverage based on the duration and interest rate sensitivity measures of our net
MSR portfolio exposure, considering market and liquidity conditions. At December 31, 2019, our hedging strategy provides for a
partial coverage of our net MSR portfolio exposure of approximately 37%. The changes in fair value of our hedging instruments
may not offset the changes in fair value of our net MSR portfolio exposure attributable to interest rate changes due to the partial
hedge coverage and other factors.

78
The following table illustrates the composition of our net MSR portfolio exposure at December 31, 2019 with the associated
interest rate sensitivity for a hypothetical, instantaneous decrease in interest rate of 25 basis points assuming a parallel shift in
interest rate yield curves (refer to the description below under Sensitivity Analysis). The amounts based on market risk sensitive
measures are hypothetical and presented for illustrative purposes only. Changes in fair value cannot be extrapolated because the
relationship to the change in fair value may not be linear.
Dollars in millions
Fair value at December 31,
2019
Hypothetical change in fair
value due to 25 bps rate decrease
Agency MSR - interest rate sensitive $ 714.0 $ (54.2 )
Less NRZ Agency MSR financing liability (312.1 ) 29.5
Net Agency MSR exposure $ 401.9 $ (24.7 )
Asset value of securitized HECM loans, net of HMBS-related liability $ 60.6 $ 2.6
HFI unsecuritized HECM loans and tails 145.5 0.7
Loans held for sale 208.8 1.9
Pipeline IRLCs 4.9 (0.2 )
Net MSR portfolio exposure (sum of the above) (19.7 )
Hypothetical 30% offset by hedging instruments 5.9
Hypothetical residual exposure to changes in interest rates $ (13.8 )
We use forward trades of MBS or Agency TBAs with different banking counterparties as hedging instruments that are not
designated as accounting hedges. TBAs, or To-Be-Announced securities are actively traded, forward contracts to purchase or sell
Agency MBS on a specific future date. We report changes in fair value of these derivative instruments in MSR valuation
adjustments, net in our consolidated statements of operations.
The TBAs are subject to margin requirements. Ocwen may be required to post or may be entitled to receive cash collateral
with its counterparties, based on daily value changes of the instruments. Changes in market factors, including interest rates, and
our credit rating could require us to post additional cash collateral and could have a material adverse impact on our financial
condition and liquidity.
MSRs and MSR Financing Liabilities
Effective January 1, 2018, we elected fair value accounting for our MSRs previously accounted for using the amortization
method, which included Agency MSRs and government-insured MSRs. Effective with this election, our entire portfolio of MSRs
is accounted for using the fair value measurement method. MSRs are subject to interest rate risk as the mortgage loans underlying
the MSRs permit borrowers to prepay their loans. The fair value of MSRs generally decreases in periods where interest rates are
declining, as prepayments increase, and generally increases in periods where interest rates are increasing, as prepayments
decrease.
While the majority of our non-Agency MSRs have been sold to NRZ, these transactions did not qualify as sales and are
accounted for as secured financings. We have elected fair value accounting for these MSR financing liabilities. Through these
transactions, the majority of the risks and rewards of ownership of the MSRs transferred to NRZ, including interest rate risk.
Changes in the fair value of the MSRs sold to NRZ are offset by a corresponding change in the fair value of the MSR financing
liabilities, which are recognized as a component of interest expense in our consolidated statements of operations.
Loans Held for Sale, Loans Held for Investment and IRLCs
In our lending business, newly-originated forward mortgage loans held for sale and newly originated reverse mortgage loans
held for investment that we have elected to carry at fair value and IRLCs are subject to the effects of changes in mortgage interest
rates from the date of the commitment through the sale of the loan into the secondary market. IRLCs represent an agreement to
purchase loans from a third-party originator or an agreement to extend credit to a mortgage loan applicant, whereby the interest
rate on the loan is set prior to funding. We are exposed to interest rate risk and related price risk during the period from the date of
the lock commitment through (i) the lock commitment cancellation or expiration date or (ii) through the date of sale of the
resulting loan into the secondary mortgage market. Loan commitments for forward loans range from 5 to 90 days, but the
majority of our commitments are for 60 days. Our holding period for forward mortgage loans from funding to sale is typically
less than 30 days. Loan commitments for reverse mortgage loans range from 10 to 30 days. The majority of our reverse loans are
variable rate loan commitments. This interest rate exposure had historically been economically hedged with freestanding
derivatives, including forward sales of agency “to be announced” securities (TBAs) and forward mortgage-backed securities

79
(Forward MBS). Beginning in September 2019, this exposure is not individually hedged, but rather used as an offset to our MSR
exposure and managed as part of our MSR hedging strategy described above.
Loans Held for Investment and HMBS-related Borrowings
We elected fair value accounting for the entire reverse mortgage HECM loan portfolio, which is held for investment, together
with the HMBS-related borrowings. The fair value of our HECM loan portfolio decreases as market interest rates rise and
increases as market rates fall. As our HECM loan portfolio is predominantly comprised of ARMs, higher interest rates cause the
loan balance to accrue and reach a 98% maximum claim amount liquidation event more quickly, with lower interest rates
extending the timeline to liquidation.
The fair value of our HECM loan portfolio net of the fair value of the HMBS-related borrowings comprise the fair value of
reverse mortgage loans and tails that are unsecuritized at the balance sheet date (reverse pipeline) and the fair value of securitized
HECM loans net of the corresponding HMBS-related borrowings that represent the reverse mortgage economic MSR (HMSR)
for risk management purposes. Both reverse assets (reverse pipeline and HMSR) act as a partial hedge for our forward MSR value
sensitivity. Due to this characteristic, beginning in September 2019, this exposure is used as an offset to our MSR exposure and
managed as part of our MSR hedging strategy described above.
Match Funded Liabilities
We monitor the effect of increases in interest rates on the interest paid on our variable-rate advance financing debt. Earnings
on cash and float balances are a partial offset to our exposure to changes in interest expense. We purchase interest rate caps as
economic hedges (not designated as a hedge for accounting purposes) when required by our advance financing arrangements.
Sensitivity Analysis
Fair Value MSRs, Loans Held for Sale, Loans Held for Investment and Related Derivatives
The following table summarizes the estimated change in the fair value of our MSRs, HECM loans held for investment and
loans held for sale that we have elected to carry at fair value as well as any related derivatives at December 31, 2019, given
hypothetical instantaneous parallel shifts in the yield curve. We used December 31, 2019 market rates to perform the sensitivity
analysis. The estimates are based on the interest rate risk sensitive portfolios described in the preceding paragraphs and assume
instantaneous, parallel shifts in interest rate yield curves. These sensitivities are hypothetical and presented for illustrative
purposes only. Changes in fair value based on variations in assumptions generally cannot be extrapolated because the relationship
to the change in fair value may not be linear.
Change in Fair Value
Dollars in millions Down 25 bps Up 25 bps Asset value of securitized HECM loans, net of HMBS-related liability
$ 2.6 $ (2.2 )
HFI unsecuritized HECM loans and tails 0.7 (0.7 )
Loans held for sale 1.9 (2.3 )
TBA / Forward MBS trades 10.1 (12.4 )
Total 15.3 (17.6 )
MSRs (1) (53.5 ) 53.4
MSRs, embedded in pipeline (0.2 ) 0.3
Total MSRs (2) (53.7 ) 53.7
Total, net $ (38.4 ) $ 36.1
(1) Primarily reflects the impact of market interest rate changes on projected prepayments on the Agency MSR portfolio and on advance
funding costs on the non-Agency MSR portfolio carried at fair value. Fair value adjustments to our MSRs are offset, in part, by fair value
adjustments related to the NRZ financing liabilities, which are recorded in Pledged MSR liability expense. Approximately 54% of the
above change in fair value would be offset by Pledged MSR liability expense on the NRZ financing liabilities.
(2) Forward mortgage loans only.
Borrowings
The majority of the debt used to finance much of our operations is exposed to interest rate fluctuations. We may purchase
interest rate swaps and interest rate caps to minimize future interest rate exposure from increases in interest rates, or when
required by the financing agreements.

80
Based on December 31, 2019 balances, if interest rates were to increase by 1% on our variable rate debt and interest earning
cash and float balances, we estimate a net positive impact of approximately $9.3 million resulting from an increase of
$22.3 million in annual interest income and an increase of $13.0 million in annual interest expense.
Home Prices
Inactive reverse mortgage loans for which the maximum claim amount has not been met are generally foreclosed upon on
behalf of Ginnie Mae with the REO remaining in the related HMBS until liquidation. Inactive MCA repurchased loans are
generally foreclosed upon and liquidated by the HMBS issuer. Although active and inactive reverse mortgage loans are insured by
FHA, we may incur expenses and losses in the process of repurchasing and liquidating these loans that are not reimbursable by
FHA in accordance with program guidelines. In addition, in certain circumstances, we may be subject to real estate price risk to
the extent we are unable to liquidate REO within the FHA program guidelines. As our reverse mortgage portfolio seasons, and the
volume of MCA repurchases increases, our exposure to this risk will increase.
Interest Rate Sensitive Financial Instruments
The tables below present the notional amounts of our financial instruments that are sensitive to changes in interest rates
categorized by expected maturity and the related fair value of these instruments at December 31, 2019 and 2018. We use certain
assumptions to estimate the expected maturity and fair value of these instruments. We base expected maturities upon contractual
maturity and projected repayments and prepayments of principal based on our historical experience. The actual maturities of these
instruments could vary substantially if future prepayments differ from our historical experience. Average interest rates are based
on the contractual terms of the instrument and, in the case of variable rate instruments, reflect estimates of applicable forward
rates. The averages presented represent weighted averages.
Expected Maturity Date at December 31, 2019
2020 2021 2022 2023 2024 There- after
Total Balance
Fair Value (1)
Rate-Sensitive Assets: Interest-earning cash $ 433,224 $ — $ — $ — $ — $ — $ 433,224 $ 433,224
Average interest rate 1.74 % — % — % — % — % — % 1.74 % Loans held for sale, at fair value 208,752 — — — — — 208,752 208,752
Average interest rate 5.41 % — % — % — % — % — % 5.41 % Loans held for sale, at lower of cost or fair value
(2) 5,009
6
—
559
203
60,740
66,517
66,517
Average interest rate 4.67 % 5.29 % — % 5.52 % 7.06 % 4.38 % 4.42 % Loans held for investment 258,058 275,651 608,912 1,231,545 1,566,200 2,329,230 6,269,596 6,269,596
Average interest rate 4.77 % 4.57 % 4.71 % 4.92 % 4.91 % 4.95 % 4.82 % Debt service accounts and interest-earning time
deposits 23,463
203
—
—
—
—
23,666
23,666
Average interest rate 0.11 % 9.90 % — % — % — % — % 0.19 % Total rate-sensitive assets $ 928,506 $ 275,860 $ 608,912 $ 1,232,104 $ 1,566,403 $ 2,389,970 $ 7,001,755 $ 7,001,755
Percent of total 13.26 % 3.94 % 8.70 % 17.60 % 22.37 % 34.13 % 100.00 % Rate-Sensitive Liabilities:
Match funded liabilities $ 394,109 $ 285,000 $ — $ — $ — $ — $ 679,109 $ 679,507
Average interest rate 3.02 % 2.53 % — % — % — % — % 2.81 % Senior notes — 21,543 291,509 — — — 313,052 270,022
Average interest rate — % 6.38 % 8.38 % — % — % — % 7.80 % SSTL and other borrowings (3) (4) 832,078 98,971 41,663 — — 57,594 1,030,306 1,010,789
Average interest rate 4.96 % 5.71 % — % — % 5.07 % — % 4.74 % Total rate-sensitive liabilities $ 1,226,187 $ 405,514 $ 333,172 $ — $ — $ 57,594 $ 2,022,467 $ 1,960,318
Percent of total 60.63 % 20.05 % 16.47 % — % — % 3 % 100.00 %

81
Expected Maturity Date at December 31, 2019 (Notional Amounts)
2020 2021 2022 2023 2024 There- after
Total Balance
Fair Value (1)
Rate-Sensitive Derivative Financial Instruments: Derivative assets (liabilities)
Interest rate caps $ 27,083 $ — $ — $ — $ — $ — $ 27,083 $ —
Average strike rate 3.00 % — % — % — % — % — % 3.00 % Forward MBS trades 60,000 — — — — — $ 60,000 $ (92 )
Average coupon — % — % — % — % — % — % — % TBA / Forward MBS Trades 1,200,000 — — — — — 1,200,000 1,121
Average coupon 3.00 % — — — — — 3.00 % IRLCs 232,566 — — — — — 232,566 4,878
Total derivatives, net $ 1,519,649 $ — $ — $ — $ — $ — $ 1,519,649 $ 5,907
Forward LIBOR curve (5) 1.76 % 1.51 % 1.48 % 1.58 % 1.68 % 1.77 %
Expected Maturity Date at December 31, 2018
2019 2020 2021 2022 2023 There- after
Total Balance
Fair Value (1)
Rate-Sensitive Assets: Interest-earning cash $ 266,235 $ — $ — $ — $ — $ — $ 266,235 $ 266,235
Average interest rate 2.31 % — % — % — % — % — % 2.31 % Loans held for sale, at fair value 176,525 — — — — — 176,525 176,525
Average interest rate 7.33 % — % — % — % — % — % 7.33 % Loans held for sale, at lower of cost or fair value
(2) 8,858
—
24
—
272
56,943
66,097
66,097
Average interest rate 5.00 % — % 8.97 % — % 5.51 % 4.89 % 4.91 % Loans held for investment 572,968 508,371 544,145 611,628 687,869 2,547,218 5,472,199 5,472,199
Average interest rate 4.95 % 4.89 % 4.84 % 4.85 % 4.93 % 4.99 % 4.85 % Debt service accounts and interest-earning time
deposits 27,569
235
160
—
—
—
27,964
27,964
Average interest rate 0.24 % 12.61 % 7.65 % — % — % — % 0.19 % Total rate-sensitive assets $ 1,052,155 $ 508,606 $ 544,329 $ 611,628 $ 688,141 $ 2,604,161 $ 6,009,020 $ 6,009,020
Percent of total 17.51 % 8.46 % 9.06 % 10.18 % 11.45 % 43.34 % 100.00 % Rate-Sensitive Liabilities:
Match funded liabilities $ 628,284 $ 150,000 $ — $ — $ — $ — $ 778,284 $ 776,485
Average interest rate 3.57 % 3.81 % — % — % — % — % 3.61 % Senior notes 97,521 — 21,543 330,878 — — 449,942 426,147
Average interest rate 7.38 % — % 6.38 % 8.38 % — % — % 8.07 % SSTL and other borrowings (3) (4) 172,463 214,750 — — — — 387,213 383,162
Average interest rate 2.96 % 6.50 % — % — % — % — % 5.49 % Total rate-sensitive liabilities $ 898,268 $ 364,750 $ 21,543 $ 330,878 $ — $ — $ 1,615,439 $ 1,585,794
Percent of total 55.61 % 22.58 % 1.33 % 20.48 % — % — % 100.00 %
Expected Maturity Date at December 31, 2018 (Notional Amounts)
2019 2020 2021 2022 2023 There- after
Total Balance
Fair Value (1)
Rate-Sensitive Derivative Financial Instruments: Derivative assets (liabilities)
Interest rate caps $ 240,833 $ 19,167 $ — $ — $ — $ — $ 260,000 $ 678
Average strike rate 1.98 % 3.00 % — % — % — % — % 2.06 % Forward MBS trades 165,363 — — — — — 165,363 (4,983 )
Average coupon 4.02 % — % — % — % — % — % 4.02 % IRLCs 150,175 — — — — — 150,175 3,871
Total derivatives, net $ 556,371 $ 19,167 $ — $ — $ — $ — $ 575,538 $ (434 )
Forward LIBOR curve (5) 2.50 % 2.49 % 2.35 % 2.37 % 2.44 % 2.53 %
(1) See Note 5 — Fair Value to the Consolidated Financial Statements for additional fair value information on financial instruments.
(2) Net of valuation allowances and including non-performing loans.
(3) Excludes financing liabilities that result from sales of assets that do not qualify as sales for accounting purposes and, therefore, are
accounted for as secured financings, which have no contractual maturity and are amortized over the life of the related assets.

82
(4) Amounts are exclusive of any related discount or unamortized debt issuance costs.
(5) Average 1-Month LIBOR for the periods indicated.
Liquidity Risk
We are exposed to liquidity risk through our ongoing needs to originate and finance mortgage loans, sell mortgage loans
into secondary markets, retain and finance MSRs, make and finance advances, fund and sell additional future draws by
borrowers under variable rate HECM loans, meet our HMBS issuer obligations with respect to MCA repurchases, repay
maturing debt, meet our contractual obligations and otherwise fund our operations. Liquidity is an essential component of our
ability to operate and grow our business; therefore, it is crucial that we maintain adequate levels of excess liquidity to fund our
businesses during normal economic cycles and events of market stress.
We estimate how our liquidity needs may be impacted by a number of factors, including fluctuations in asset and liability
levels due to our business strategy, asset valuations, changes in cash flows from operations, levels of interest rates, debt service
requirements including contractual amortization and maturities, and unanticipated events, including legal and regulatory
expenses. We also assess market conditions and capacity for debt issuance in the various markets that we access to fund our
business needs. We have established internal processes to anticipate future cash needs and continuously monitor the availability
of funds pursuant to our existing debt arrangements. We monitor MSR asset valuations monthly and communicate closely with
our lenders for this asset class to ensure adequate liquidity is maintained for mark-to-market valuation changes within MSR
financing facilities. We manage this risk in multiple ways, including but not limited to engaging in MSR hedging activities, and
maintaining liquidity earmarks at levels to support potential changes in MSR fair values.
We regularly evaluate capital structure options that we believe will most effectively provide the necessary capacity to
support our investment objectives, address upcoming debt maturities and contractual amortization, and accommodate our
business needs. Our objective is to maximize the total investment capacity through diversification of our funding sources while
optimizing cost, advance rates and terms. Historical losses have significantly eroded our stockholders’ equity and weakened our
financial condition. To the extent we are not successful in achieving our near-term objective of returning to profitability,
funding continuing losses will limit opportunities to grow our business.
We address liquidity risk by maintaining borrowing capacity in excess of our expected needs and by extending the tenor of
our financing arrangements from time to time. For example, to fund additional advance obligations, we have typically
“upsized” existing advance facilities or entered into new advance facilities in anticipation of the funding obligation and then
pledged additional advances to support the borrowing. In general, we finance our assets and operating requirements through
cash on hand, operating cash flow, advance financing facilities and other secured borrowings.
Operational Risk
Operational risk is inherent in each of our business lines and related support activities. This risk can manifest itself in
various ways, including process execution errors, clerical or technological failures or errors, business interruptions and frauds,
all of which could cause us to incur losses. Operational risk includes the following key risks:
• legal risk, as we can have legal disputes with borrowers or counterparties;
• compliance risk, as we are subject to many federal and state rules and regulations;
• third-party risk, as we have many processes that have been outsourced to third parties;
• information technology risk, as we operate many information systems that depend on proper functioning of
hardware and software;
• information security risk, as our information systems and associates handle personal financial data of borrowers.
The Board of Directors provides direction to senior executives by setting our organization’s risk appetite, and delegates to
our Chief Executive Officer and senior executives the primary ownership and responsibility for operational risk management
and control. Senior executives in our risk department oversee the establishment of policies and control frameworks that are
designed, executed and administered to provide a sound and well-controlled operational environment in accordance with our
risk appetite framework. We mandate training for our employees in respect to these policies, require business line change
control oversight, and we conduct control assessment/reviews on a regular basis. Risk issues identified are tracked in our
Governance, Risk and Compliance (GRC) system. Remediation and assurance testing are also tracked in our GRC system. We
also have several channels for employees to report operational and/or technological issues affecting their operations to
management, the operational risk or compliance teams or the Board.
We seek to embed a culture of compliance and business line responsibility for managing operational and compliance risks
in our enterprise-wide approach toward risk management. Ocwen has adopted a “Three Lines of Defense” model to enable
risks and controls to be properly managed on an on-going basis. The model delineates business line management's
accountabilities and responsibilities over risk management and the control environment and includes mechanisms to assess the
effectiveness of executing these responsibilities.

83
The first line of defense consists of business line management, dedicated control directors and quality assurance personnel
who are accountable and responsible for their day-to-day activities, processes and controls. The first line of defense is
responsible for ensuring that key risks within their activities and operations are identified, assessed, mitigated and monitored by
an appropriate control environment that is commensurate with the operations risk profile.
The second line of defense is independent from the business and comprises a Risk Management function (including Third-
Party Risk and Information Security) and a Compliance function, which are responsible for:
• providing assurance, oversight, and credible challenge over the effectiveness of the risk and control activities
conducted by the first line;
• establishing frameworks to identify and measure the risks being taken by different parts of the business;
• monitoring risk levels, through key indicators and oversight/assurance and testing programs; and
• provide periodic reporting to Senior Management and the Board of Directors for transparency.
The third line of defense, Internal Audit, provides independent assurance as to the effectiveness of the design,
implementation and embedding of the risk management frameworks, as well as the management of the risks and controls by the
first line and control oversight by the second line. The Internal Audit function provides periodic reporting on its activities to
Senior Management and the Board of Directors for transparency.
All business units and overhead functions are subject to unrestricted audits by our internal audit department. Internal audit
is granted unrestricted access to our records, physical properties, systems, management and employees in order to perform
these audits. The internal audit department reports to the Audit Committee of the Board and assists the Audit Committee in
fulfilling its governance and oversight responsibility.
Compliance risk is managed through an enterprise-wide compliance risk management program designed to monitor, detect
and deter compliance issues. Our compliance and risk management policies assign primary responsibility and accountability for
the management of compliance risk in the lines of business to business line management.
Information Security Risk oversight is performed by our Chief Information Security Officer. Ocwen’s information security
plans are developed to meet or exceed Federal Financial Institutions Examination Council standards.
Credit Risk
Consumer Credit Risk
The credit-related risks inherent in maintaining a mortgage loan portfolio as an investment tend to impact us less than a
typical long-term investor because we generally sell the mortgage loans that we originate in the secondary market shortly after
origination through GSE and Ginnie Mae guaranteed securitizations and whole loan transactions. We are exposed to early
payment defaults from the time that we originate a loan to the time that the loan is sold in the secondary market or shortly
thereafter. Early payment defaults are monitored and loans are audited by our quality assurance teams for origination defects.
Our exposure to early payment defaults remains very limited and we do not anticipate material losses from this exposure.
Servicing costs are generally higher on higher credit risk loans. In addition, higher credit risk loans are generally affected
to a greater extent by an economic downturn or a deterioration of the housing market. An increase in delinquencies and
foreclosure rates generally results in increased advances for delinquent principal and interest, taxes and insurance, foreclosure
costs and the upkeep of vacant property in foreclosure. Interest expense on advances and higher operating expenses decrease
the value of our servicing portfolio. We track the credit risk profile of our servicing portfolio, including the recoverability of
advances, with a view to ensuring that changes in portfolio credit risk are identified on a timely basis.
We have loan repurchase and indemnification obligations arising from potential breaches of the representation and
warranty provisions in connection with loans we sell in the secondary market. In the event of a breach of these representations
and warranties, we may be required to repurchase a mortgage loan or indemnify the purchaser, and we may bear any
subsequent loss on the mortgage loan.
We endeavor to minimize our losses from loan repurchases and indemnifications by focusing on originating fully
compliant mortgage loans and closely monitoring investor and agency eligibility requirements for loan sales. Our quality
assurance teams perform independent audits related to the processing and underwriting of mortgage loans prior to closing, as
well as after the closing but before the sale of loans, to identify potential repurchase exposures due to breach of representations
and warranties. In addition, we perform a comprehensive review of the loan files where we receive investor requests for
repurchase and indemnification to establish the validity of the claims and determine our obligation. In limited circumstances,
we may retain the full risk of loss on loans sold to the extent that the liquidation value of the asset collateralizing the loan is
insufficient to cover the loan itself and associated servicing expenses. In instances where we have purchased loans from third
parties, we usually have the ability to recover the loss from the third-party originator.
84
Counterparty Credit Risk
Counterparty credit risk represents the potential loss that may occur because a party to a transaction fails to perform
according to the terms of the contract. We regularly evaluate the financial position and creditworthiness of our counterparties
and disperse risk among multiple counterparties to the extent possible. We manage derivative counterparty credit risk by
entering into financial instrument transactions through national exchanges, primary dealers or approved counterparties and
using mutual margining agreements whenever possible to limit potential exposure.
NRZ is contractually obligated, pursuant to our agreements with them related to the Rights to MSRs, to make all advances
required in connection with the loans underlying such MSRs. If NRZ’s advance financing facilities do not perform as
envisaged or should NRZ otherwise be unable to meets its advance financing obligations, we would be required to meet our
advance financing obligations with respect to the loans underlying these Rights to MSRs, which could materially and adversely
affect our liquidity, financial condition and servicing operations.
Counterparty credit risk exists with our third-party originators, including our correspondent lenders, from whom we
purchase originated mortgage loans. The third-party originators make certain representations and warranties to us when we
acquire the mortgage loan from them, and they agree to reimburse us for losses incurred due to an origination defect. We
become exposed to losses for origination defects if the third-party originator is not able to reimburse us for losses incurred for
indemnification or repurchase. We mitigate this risk by monitoring purchase levels from our third-party originators (to reduce
concentration risk), by performing regular quality control reviews of the third-party originators’ underwriting standards and by
regular reviews of the creditworthiness of third-party originators.
Concentration Risk
Our Servicing segment has exposure to concentration risk and client retention risk. As of December 31, 2019, our servicing
portfolio included significant client relationships with NRZ which represented 56% and 61% of our servicing portfolio UPB
and loan count, respectively. The NRZ servicing portfolio accounts for approximately 74% of all delinquent loans that Ocwen
services. During 2019, NRZ-related servicing fees retained by Ocwen represented approximately 36% of the total servicing and
subservicing fees earned by Ocwen, net of servicing fees remitted to NRZ (excluding ancillary income). The current terms of
our agreements with NRZ extend through June 2020 (legacy PMC agreement) and July 2022 (legacy Ocwen agreements).
On February 20, 2020, we received a notice of termination from NRZ with respect to the legacy PMC subservicing
agreement. This termination is for convenience (and not for cause). The notice states that the effective date of termination is
June 19, 2020 for 25% of the loans under the agreement (not including loans constituting approximately $6.6 billion in UPB
that were added by NRZ under the agreement in 2019) and August 18, 2020 for the remainder of the loans under the agreement.
The actual servicing transfer date(s) will be determined through discussions with NRZ and other stakeholders such as GSEs. In
connection with the termination, we estimate that we will receive loan deboarding fees of approximately $6.1 million from
NRZ. The portfolio subject to termination accounted for $42.1 billion in UPB, or 20% of our total serviced UPB as of
December 31, 2019. Under this agreement, in the fourth quarter of 2019, we estimate that operating expenses, including direct
expenses and overhead allocation, exceeded the net revenue retained for this portion of the NRZ servicing portfolio by
approximately $3.0 million. At this stage, we do not anticipate significant operational impacts on our servicing business as a
result of this termination. The terminated servicing is comprised of Agency loans with relatively low delinquencies that do not
pose a high level of operating and compliance risk or require substantial direct and oversight staffing relative to our non-
Agency servicing. Nonetheless, we intend to right-size and reduce expenses in our servicing business and the related corporate
support functions to the extent possible to align with our smaller portfolio.
We currently anticipate that the loan deboarding fees from NRZ will offset a significant portion of our transition and
restructuring costs assuming an orderly and timely transfer. However, it is possible that the loan deboarding and other
transition activities that we will undertake as a result of the termination may not occur in an orderly or timely manner, which
could be disruptive and could result in us incurring additional costs or even in disagreements with NRZ relating to our
respective rights and obligations. Overall, our current view is that if we can exclude the legacy PMC NRZ servicing portfolio
and successfully execute on the necessary transition and expense reduction actions in an orderly and timely manner, we will be
able to enhance the long-term financial performance of our servicing business.
Currently, subject to proper notice (generally180 days) and the payment of termination fees, NRZ has rights to terminate
the legacy Ocwen agreements for convenience.
In the ordinary course, we regularly share information with NRZ and discuss various aspects of our relationship. At times,
we discuss modifications to our relationship that we believe could be to our mutual benefit as our respective businesses evolve
over time. We also discuss alternatives to the outcomes contemplated under our agreements when they were originally executed
as facts and circumstances change over time. Examples of these discussions include our discussions with respect to the Rights
to MSRs and with respect to the $2.7 billion in UPB of MSRs and the related advances that remain to be sold to NRZ under the
legacy PMC sale agreement referenced above. As part of these discussions, we discussed several potential changes to existing

85
contracts. It is possible that NRZ could exercise its rights to terminate for convenience some or all of the legacy Ocwen
servicing agreements. As of December 31, 2019, these agreements accounted for approximately 36.0% of our servicing
portfolio.
Given the NRZ concentration in our servicing segment, senior management has been monitoring two main risks associated
with our NRZ relationship, in addition to its strategic component.
First, management has been monitoring the profitability of the NRZ servicing agreements. Based on this analysis, in the
fourth quarter of 2019, while a significant portion of the Company’s revenue is derived from the NRZ servicing agreements, we
estimated that operating expenses, including direct servicing expenses and overhead allocation, exceeded the net revenue
retained for the NRZ servicing portfolio by approximately $10 million. As with all estimates, this estimate required the exercise
of judgment, including with respect to overhead allocations, and it excludes the benefits of the lump-sum payment
amortization. The estimated loss for these subservicing agreements is partially driven by the declining revenue as the loan
portfolio amortizes down without a corresponding reduction to our servicing cost over time. As performing loans in the NRZ
servicing portfolio have run-off, delinquencies have remained high, resulting in a relatively elevated average cost per loan.
Because the NRZ portfolio contains a high percentage of delinquent accounts, it has an inherently high level of potential
operational and compliance risk and requires a disproportionately high level of operating staff, oversight support infrastructure
and overhead which drives the elevated average cost per loan. We actively pursue cost re-engineering initiatives to continue to
reduce our cost-to-service and our corporate overhead, as well as pursue actions to grow our non-NRZ servicing portfolio.
Second, because NRZ has rights to terminate for convenience subject to certain conditions, senior management has been
monitoring the Company’s risks associated with a potential early termination or non-renewal of some or all agreements with
NRZ. Management developed stress scenarios to assess the operational and financial impact of such termination scenarios, and
the necessary mitigating actions. Management’s responses to the different scenarios are all based on the appropriate right-sizing
or restructuring of the Company’s operations and include, but are not limited to the adequate reduction of direct servicing
resources, the closure of certain facilities in different locations to rationalize property utilization, the appropriate planning of
loan deboarding, and the potential reduction in corporate support functions without impairing our ability to effectively operate
in a controlled environment.
It is possible that the unwinding of all or a significant portion of our relationship with NRZ may not occur in an orderly or
timely manner, which could be disruptive and could result in us incurring additional costs or even in disagreements with NRZ
relating to our respective rights and obligations. Furthermore, if NRZ were to take actions to limit or terminate our relationship,
that could impact perceptions of other servicing clients, lenders, GSEs or others, which could cause them to take actions that
materially and adversely impact our business, liquidity, results of operations and financial condition.
Market conditions, including interest rates and future economic projections, could impact investor demand to hold MSRs,
which may result in our loss of additional subservicing relationships, or significantly decrease the number of loans under such
relationships.
The mortgaged properties securing the residential loans that we service are geographically dispersed throughout all 50
states, the District of Columbia and two U.S. territories. The five largest concentrations of properties are located in California,
Florida, Texas, New York and Pennsylvania, which, taken together, comprise 40% of the number of loans serviced at
December 31, 2019. California has the largest concentration with 13% of the total loans serviced.

86
CONTRACTUAL OBLIGATIONS AND OFF-BALANCE SHEET ARRANGEMENTS
Contractual Obligations
We believe that we have adequate resources to fund all unfunded commitments to the extent required and meet all
contractual obligations as they come due. The following table sets forth certain information regarding amounts we owe to
others under contractual obligations as of December 31, 2019:
Less Than One Year
After One Year
Through Three Years
After Three Years
Through Five Years
After Five Years Total
Senior secured term loan (1) $ 326,066 $ — $ — $ — $ 326,066
Senior notes (1) — 313,052 — — 313,052
Other secured borrowings (1) 506,012 140,634 — 57,594 704,240
Contractual interest payments (2) 70,328 58,819 1,298 1,368 131,813
Originate/purchase mortgages or securities 232,566 — — — 232,566
Reverse mortgage equity draws (3) 1,502,163 — — — 1,502,163
Operating leases 16,652 28,458 3,785 654 49,549
$ 2,653,787 $ 540,963 $ 5,083 $ 59,616 $ 3,259,449
(1) Amounts are exclusive of any related discount, unamortized debt issuance costs or fair value adjustment. Excludes match funded
liabilities as these represent debt where the holders only have recourse to the assets that collateralize the debt and such assets are not
available to satisfy general claims against Ocwen. Also excludes financing liabilities that result from sales of assets that do not qualify
as sales for accounting purposes and, therefore, are accounted for as secured financings. See Note 14 — Borrowings to the
Consolidated Financial Statements for additional information related to these excluded borrowings. On January 27, 2020, we executed
an amendment to the SSTL which reduced the maximum borrowing capacity to $200.0 million (requiring a $126.1 million paydown
of the outstanding balance), extended the maturity date to May 15, 2022, reduced the quarterly principal payment from $6.4 million to
$5.0 million and modified the interest rate. See Note 28 — Subsequent Events to the Consolidated Financial Statements for additional
information.
(2) Represents estimated future interest payments on MSR financing facilities, warehouse lines, senior notes and the SSTL, based on
applicable interest rates as of December 31, 2019.
(3) Represents additional equity draw obligations in connection with reverse mortgage loans originated or purchased by Liberty. Because
these draws can be made in their entirety, we have classified them as due in less than one year at December 31, 2019.
As of December 31, 2019, we had gross unrecognized tax benefits of $10.6 million and an additional $6.6 million for gross
interest and penalties classified as Other liabilities. At this time, we are unable to make a reasonably reliable estimate of the
timing of payments in individual years in connection with these tax liabilities, including whether or not these tax liabilities will
be paid; therefore, such amounts are not included in the above contractual obligation table.
Our forecasting with respect to our ability to satisfy our contractual obligations requires management to use judgment and
estimates and includes factors that may be beyond our control. Additionally, our business has been undergoing substantial
change, which has magnified the uncertainties that are inherent in the forecasting process. Our actual results could differ
materially from our estimates, and if this were to occur, it could have a material adverse effect on our business, financial
condition, liquidity and results of operations.
Off-Balance Sheet Arrangements
In the normal course of business, we engage in transactions with a variety of financial institutions and other companies that
are not reflected on our balance sheet. We are subject to potential financial loss if the counterparties to our off-balance sheet
transactions are unable to complete an agreed upon transaction. We manage counterparty credit risk by entering into financial
instrument transactions through national exchanges, primary dealers or approved counterparties and through the use of mutual
margining agreements whenever possible to limit potential exposure. We regularly evaluate the financial position and
creditworthiness of our counterparties. Our off-balance sheet arrangements include mortgage loan repurchase and
indemnification obligations, unconsolidated special purpose entities (SPEs) (a type of variable interest entity or VIE) and
notional amounts of our derivatives.
Mortgage Loan Repurchase and Indemnification Liabilities. We have exposure to representation, warranty and
indemnification obligations in our capacity as a loan originator and servicer. We recognize the fair value of representation and
warranty obligations in connection with originations upon sale of the loan or upon completion of an acquisition. Thereafter, the
estimation of the liability considers probable future obligations based on industry data of loans of similar type segregated by
year of origination and estimated loss severity based on current loss rates for similar loans. Our historical loss severity
87
considers the historical loss experience that we incur upon sale or liquidation of a repurchased loan as well as current market
conditions. See Note 4 — Securitizations and Variable Interest Entities, Note 15 — Other Liabilities and Note 26 —
Contingencies to the Consolidated Financial Statements for additional information.
Unfunded Lending Commitments. We have originated floating-rate reverse mortgage loans under which the borrowers have
additional borrowing capacity of $1.5 billion at December 31, 2019. This additional borrowing capacity is available on a
scheduled or unscheduled payment basis. See Note 25 — Commitments to the Consolidated Financial Statements for additional
information.
HMBS Issuer Obligations. As an HMBS issuer, we assume certain obligations related to each security issued. The most
significant obligation is the requirement to purchase loans out of the Ginnie Mae securitization pools once the outstanding
principal balance of the related HECM is equal to or greater than 98% of the maximum claim amount (MCA repurchases).
Active repurchased loans are assigned to HUD and payment is received from HUD, typically within 60 days of repurchase.
HUD reimburses us for the outstanding principal balance on the loan up to the maximum claim amount. We bear the risk of
exposure if the amount of the outstanding principal balance on a loan exceeds the maximum claim amount. Inactive
repurchased loans (the borrower is deceased, no longer occupies the property or is delinquent on tax and insurance payments)
are generally liquidated through foreclosure and subsequent sale of REO, with a claim filed with HUD for recoverable
remaining principal and advance balances. See Note 25 — Commitments to the Consolidated Financial Statements for
additional information.
Involvement with VIEs. We use SPEs and VIEs for a variety of purposes but principally in the financing of our servicing
advances, in the securitization of mortgage loans and in the financing of our MSRs. We include VIEs in our consolidated
financial statements if we determine we are the primary beneficiary. See Note 4 — Securitizations and Variable Interest Entities
to the Consolidated Financial Statements for additional information.
We generally use match funded securitization facilities to finance our servicing advances. The SPEs to which the
receivables for servicing advances are transferred in the securitization transaction are included in our consolidated financial
statements either because we have the majority equity interest in the SPE or because we are the primary beneficiary where the
SPE is a VIE. Holders of the debt issued by the SPEs have recourse only to the assets of the SPEs for satisfaction of the debt.
Derivatives. We record all derivatives at fair value on our consolidated balance sheets. We use these derivatives primarily
to manage our interest rate risk. The notional amounts of our derivative contracts do not reflect our exposure to credit loss. See
Note 17 — Derivative Financial Instruments and Hedging Activities to the Consolidated Financial Statements for additional
information.
CRITICAL ACCOUNTING POLICIES AND ESTIMATES
Our ability to measure and report our financial position and operating results is influenced by the need to estimate the
impact or outcome of future events based on information available at the date of the financial statements. An accounting
estimate is considered critical if it requires that management make assumptions about matters that were highly uncertain at the
time the accounting estimate was made. If actual results differ from our judgments and assumptions, then it may have an
adverse impact on the results of operations and cash flows. We have processes in place to monitor these judgments and
assumptions, and management is required to review critical accounting policies and estimates with the Audit Committee of the
Board of Directors. Our significant accounting policies and critical accounting estimates are described in Note 1 —
Organization, Business Environment, Basis of Presentation and Significant Accounting Policies to the Consolidated Financial
Statements.
Fair Value Measurements
We use fair value measurements to record fair value adjustments to certain instruments in our statement of operations and
to determine fair value disclosures. Refer to Note 5 — Fair Value to the Consolidated Financial Statements for the fair value
hierarchy, descriptions of valuation methodologies used to measure significant assets and liabilities at fair value and details of
the valuation models, key inputs to those models, and significant assumptions utilized. We follow the fair value hierarchy to
prioritize the inputs utilized to measure fair value. We review and modify, as necessary, our fair value hierarchy classifications
on a quarterly basis. As such, there may be reclassifications between hierarchy levels.

88
The following table summarizes assets and liabilities measured at fair value on a recurring and nonrecurring basis and the
amounts measured using Level 3 inputs:
December 31,
2019 2018
Loans held for sale $ 275,269 $ 242,622
Loans held for investment 6,292,938 5,498,719
MSRs 1,486,395 1,457,149
Derivative assets 6,007 4,552
Mortgage-backed securities 2,075 1,502
U.S. Treasury notes and corporate bonds 441 1,514
Assets at fair value $ 8,063,125 $ 7,206,058
As a percentage of total assets 77 % 77 %
Financing liabilities
HMBS-related borrowings 6,063,435 5,380,448
Financing liability - MSRs pledged 950,593 1,032,856
Financing liability - Owed to securitization investors 22,002 24,815
7,036,030 6,438,119
Derivative liabilities 100 4,986
Liabilities at fair value $ 7,036,130 $ 6,443,105
As a percentage of total liabilities 70 % 73 %
Assets at fair value using Level 3 inputs $ 7,847,925 $ 7,024,145
As a percentage of assets at fair value 97 % 97 %
Liabilities at fair value using Level 3 inputs $ 7,036,030 $ 6,438,119
As a percentage of liabilities at fair value 100 % 100 %
Assets at fair value using Level 3 inputs increased during 2019 primarily due to reverse mortgage originations. Liabilities
at fair value using Level 3 inputs increased primarily in connection with reverse mortgage securitizations, which we account for
as secured financings.
Our net economic exposure to Loans held for investment - Reverse mortgages and the related Financing liabilities (HMBS-
related borrowings) is limited to the residual value we retain. Changes in inputs used to value the loans held for investment are
largely offset by changes in the value of the related secured financing.
We have various internal controls in place to ensure the appropriateness of fair value measurements. Significant fair value
measures are subject to analysis and management review and approval. Additionally, we utilize a number of operational
controls to ensure the results are reasonable, including comparison, or “back testing,” of model results against actual
performance and monitoring the market for recent trades, including our own price discovery in connection with potential and
completed sales, and other market information that can be used to benchmark inputs or outputs. Considerable judgment is used
in forming conclusions about Level 3 inputs such as interest rate movements, prepayment speeds, delinquencies, credit losses
and discount rates. Changes to these inputs could have a significant effect on fair value measurements.
Valuation and Amortization of MSRs
MSRs are assets that represent the right to service a portfolio of mortgage loans. We originate MSRs from our lending
activities and obtain MSRs through asset acquisitions or business combinations. For initial measurement, acquired and
originated MSRs are initially measured at fair value. Subsequent to acquisition or origination, we elect to account for MSRs
using either the amortization method or the fair value measurement method. For MSRs accounted for using the amortization
measurement method, we assess servicing assets or liabilities for impairment or increased obligation based on fair value on a
quarterly basis. We group our MSRs by stratum for impairment testing based on the predominant risk characteristics of the
underlying mortgage loans. Historically, our strata had been defined as conventional loans (i.e. conforming to the underwriting
standards of Fannie Mae or Freddie Mac), government-insured loans (insured by FHA or VA) and non-Agency loans (i.e. all
private label primary and master serviced).
Effective January 1, 2018, we elected fair value accounting for our MSRs previously accounted for using the amortization
method, which included Agency MSRs and government-insured MSRs. Effective with this election, our entire portfolio of
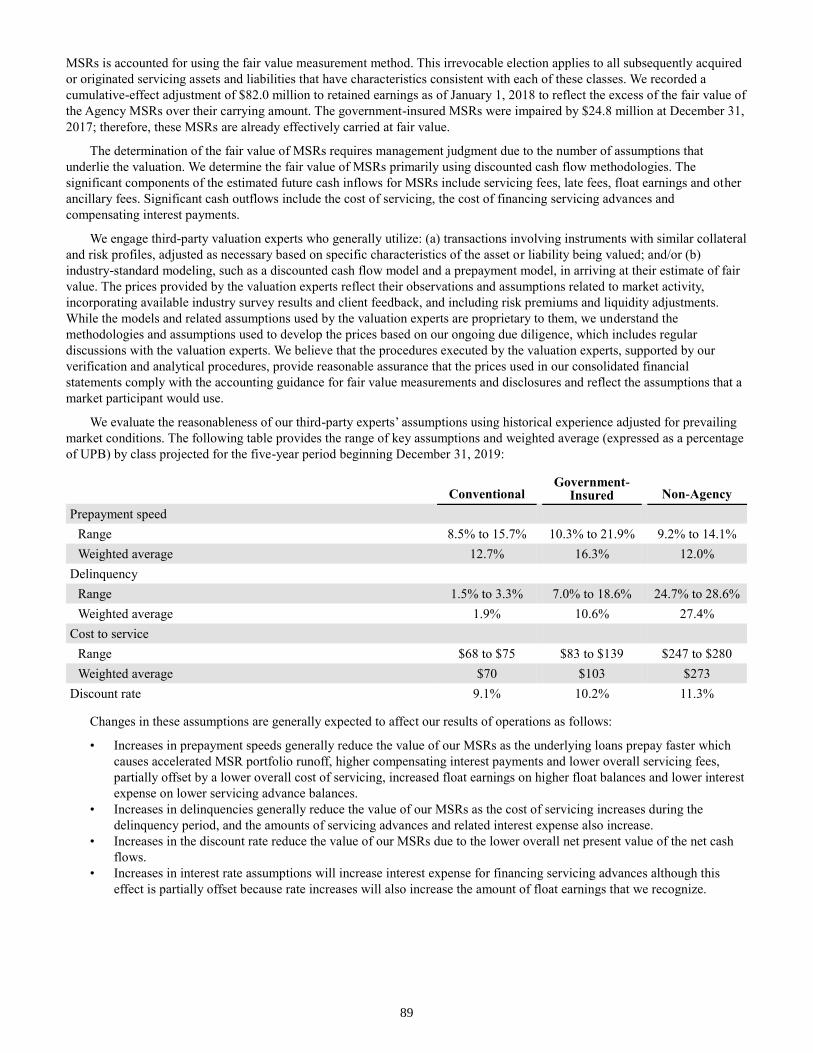
89
MSRs is accounted for using the fair value measurement method. This irrevocable election applies to all subsequently acquired
or originated servicing assets and liabilities that have characteristics consistent with each of these classes. We recorded a
cumulative-effect adjustment of $82.0 million to retained earnings as of January 1, 2018 to reflect the excess of the fair value of
the Agency MSRs over their carrying amount. The government-insured MSRs were impaired by $24.8 million at December 31,
2017; therefore, these MSRs are already effectively carried at fair value.
The determination of the fair value of MSRs requires management judgment due to the number of assumptions that
underlie the valuation. We determine the fair value of MSRs primarily using discounted cash flow methodologies. The
significant components of the estimated future cash inflows for MSRs include servicing fees, late fees, float earnings and other
ancillary fees. Significant cash outflows include the cost of servicing, the cost of financing servicing advances and
compensating interest payments.
We engage third-party valuation experts who generally utilize: (a) transactions involving instruments with similar collateral
and risk profiles, adjusted as necessary based on specific characteristics of the asset or liability being valued; and/or (b)
industry-standard modeling, such as a discounted cash flow model and a prepayment model, in arriving at their estimate of fair
value. The prices provided by the valuation experts reflect their observations and assumptions related to market activity,
incorporating available industry survey results and client feedback, and including risk premiums and liquidity adjustments.
While the models and related assumptions used by the valuation experts are proprietary to them, we understand the
methodologies and assumptions used to develop the prices based on our ongoing due diligence, which includes regular
discussions with the valuation experts. We believe that the procedures executed by the valuation experts, supported by our
verification and analytical procedures, provide reasonable assurance that the prices used in our consolidated financial
statements comply with the accounting guidance for fair value measurements and disclosures and reflect the assumptions that a
market participant would use.
We evaluate the reasonableness of our third-party experts’ assumptions using historical experience adjusted for prevailing
market conditions. The following table provides the range of key assumptions and weighted average (expressed as a percentage
of UPB) by class projected for the five-year period beginning December 31, 2019:
Conventional Government-
Insured Non-Agency
Prepayment speed
Range 8.5% to 15.7% 10.3% to 21.9% 9.2% to 14.1%
Weighted average 12.7% 16.3% 12.0%
Delinquency
Range 1.5% to 3.3% 7.0% to 18.6% 24.7% to 28.6%
Weighted average 1.9% 10.6% 27.4%
Cost to service
Range $68 to $75 $83 to $139 $247 to $280
Weighted average $70 $103 $273
Discount rate 9.1% 10.2% 11.3%
Changes in these assumptions are generally expected to affect our results of operations as follows:
• Increases in prepayment speeds generally reduce the value of our MSRs as the underlying loans prepay faster which
causes accelerated MSR portfolio runoff, higher compensating interest payments and lower overall servicing fees,
partially offset by a lower overall cost of servicing, increased float earnings on higher float balances and lower interest
expense on lower servicing advance balances.
• Increases in delinquencies generally reduce the value of our MSRs as the cost of servicing increases during the
delinquency period, and the amounts of servicing advances and related interest expense also increase.
• Increases in the discount rate reduce the value of our MSRs due to the lower overall net present value of the net cash
flows.
• Increases in interest rate assumptions will increase interest expense for financing servicing advances although this
effect is partially offset because rate increases will also increase the amount of float earnings that we recognize.

90
The following table provides information related to the sensitivity of our MSR fair value estimate to a 10% adverse change
in key valuation inputs as of December 31, 2019:
Conventional Government-
Insured Non-Agency
Prepayment speed $ (54,329 ) $ (13,548 ) $ (49,073 )
Delinquency (9,894 ) (10,758 ) (52,220 )
Cost to service (12,934 ) (4,358 ) (75,899 )
Discount rate (20,621 ) (3,868 ) (24,975 )
We currently account for the MSR sale agreements with NRZ as secured financings because the transactions did not
achieve sale accounting treatment. Accordingly, our balance sheets reflect MSRs at fair value, pledged to NRZ as assets, and a
corresponding pledged MSR liability at fair value within Other financing liabilities. The fair value of the pledged MSR liability
is determined based on the fair value of the associated pledged MSR assets subject to the sale agreements.
Allowance for Losses on Servicing Advances and Receivables
We record an allowance for losses on servicing advances through a charge to earnings to the extent that we believe that a
portion of advances are uncollectible under the provisions of each servicing contract taking into consideration, among other
factors, our historical collection rates, probability of default, cure or modification, length of delinquency and the amount of the
advance. We continually assess collectibility using proprietary cash flow projection models that incorporate a number of
different factors, depending on the characteristics of the mortgage loan or pool, including, for example, the probable loan
liquidation path, estimated time to a foreclosure sale, estimated costs of foreclosure action, estimated future property tax
payments and the estimated value of the underlying property net of estimated carrying costs, commissions and closing costs. At
December 31, 2019, the allowance for losses on servicing advances was $9.9 million, which represents 1% of the combined
total balance of servicing advances and match funded advances.
We record an allowance for losses on receivables in our Servicing business related to defaulted FHA or VA insured loans
repurchased from Ginnie Mae guaranteed securitizations (government-insured loan claims). This allowance represents
management’s estimate of incurred losses and is maintained at a level that management considers adequate based upon
continuing assessments of collectibility, current trends, and historical loss experience. At December 31, 2019, the allowance for
losses on receivables related to government-insured claims was $56.9 million, which represents 46% of the total balance of
government-insured claims receivables.
Determining an allowance for losses involves degrees of judgment and assumptions that, given similar information at any
given point, may result in a different but reasonable estimate.
Income Taxes
In December 2017, the Securities and Exchange Commission Staff issued Staff Accounting Bulletin (SAB) 118 (as further
clarified by Financial Accounting Standards Board (FASB) Accounting Standards Update (ASU) 2018-05, Income Taxes (Topic
740): “Amendments to SEC Paragraphs Pursuant to SEC Staff Accounting Bulletin No. 118”), which provides guidance on
accounting for the income tax effects of the Tax Act. SAB 118 provides a measurement period that should not extend beyond
one year from the Tax Act enactment date of December 22, 2017 for companies to complete the accounting under Accounting
Standards Codification (ASC) 740, Income Taxes. In accordance with SAB 118, a company must reflect the income tax effects
of those aspects of the Tax Act for which the accounting under ASC 740 is complete. To the extent that a company's accounting
for certain income tax effects of the Tax Act is incomplete but it is able to determine a reasonable estimate, it must record a
provisional estimate in the financial statements and should continue to apply ASC 740 on the basis of the provisions of the tax
laws that were in effect immediately before the enactment of the Tax Act. We adopted the guidance of SAB 118 as of December
31, 2017. We finalized our provisional amounts under SAB 118 in the fourth quarter of 2018. See Note 20 — Income Taxes to
the Consolidated Financial Statements for additional information on the Tax Act and the impact on our consolidated financial
statements.
We record a tax provision for the anticipated tax consequences of the reported results of operations. We compute the
provision for income taxes using the asset and liability method, under which deferred tax assets and liabilities are recognized
for the expected future tax consequences of temporary differences between the financial reporting and tax bases of assets and
liabilities, and for operating losses and tax credit carryforwards. We measure deferred tax assets and liabilities using the
currently enacted tax rates in each jurisdiction that applies to taxable income in effect for the years in which those tax assets are
expected to be realized or settled. We record a valuation allowance to reduce deferred tax assets to the amount that is believed
more likely than not to be realized.
We conduct periodic evaluations of positive and negative evidence to determine whether it is more likely than not that the
deferred tax asset can be realized in future periods. In these evaluations, we gave more significant weight to objective evidence,
91
such as our actual financial condition and historical results of operations, as compared to subjective evidence, such as
projections of future taxable income or losses.
For the three-year periods ended December 31, 2019 and 2018, the USVI filing jurisdiction was in a material cumulative
loss position. The U.S. jurisdiction was also in a three-year cumulative loss position as of December 31, 2019 and 2018. We
recognize that cumulative losses in recent years is an objective form of negative evidence in assessing the need for a valuation
allowance and that such negative evidence is difficult to overcome. Other factors considered in these evaluations are estimates
of future taxable income, future reversals of temporary differences, tax character and the impact of tax planning strategies that
may be implemented, if warranted.
As a result of these evaluations, we recognized a full valuation allowance of $199.5 million and $46.3 million on our U.S.
deferred tax assets at December 31, 2019 and 2018, respectively, and a full valuation allowance of $0.4 million and $21.3
million on our USVI deferred tax assets at December 31, 2019 and 2018, respectively. The U.S. and USVI jurisdictional
deferred tax assets are not considered to be more likely than not realizable based on all available positive and negative
evidence. We intend to continue maintaining a full valuation allowance on our deferred tax assets in both the U.S. and USVI
until there is sufficient evidence to support the reversal of all or some portion of these allowances. Release of the valuation
allowance would result in the recognition of certain deferred tax assets and a decrease to income tax expense for the period in
which the release is recorded. However, the exact timing and amount of the valuation allowance release are subject to change
based on the profitability that we achieve.
We recognize tax benefits from uncertain tax positions only if it is more likely than not that the tax position will be
sustained on examination by the taxing authorities, based on the technical merits of the position. The tax benefits recognized in
the financial statements from such positions are then measured based on the largest benefit that has a greater than 50%
likelihood of being realized upon ultimate settlement.
NOL carryforwards may be subject to annual limitations under Internal Revenue Code Section 382 (Section 382) (or
comparable provisions of foreign or state law) in the event that certain changes in ownership were to occur. In addition, tax
credit carryforwards may be subject to annual limitations under Internal Revenue Code Section 383 (Section 383). We
periodically evaluate our NOL and tax credit carryforwards and whether certain changes in ownership have occurred as
measured under Section 382 that would limit our ability to utilize a portion of our NOL and tax credit carryforwards. If it is
determined that an ownership change(s) has occurred, there may be annual limitations on the use of these NOL and tax credit
carryforwards under Sections 382 and 383 (or comparable provisions of foreign or state law).
We have evaluated whether we experienced an ownership change under these provisions, and determined that an
ownership change did occur in January 2015 and in December 2017 in the U.S. jurisdiction, which also results in an ownership
change under Section 382 in the USVI jurisdiction. In addition, a Section 382 ownership change occurred at PHH when Ocwen
acquired the stock of PHH in October 2018. PHH was a loss corporation as defined under Section 382 at the date of the
acquisition. PHH also had an existing Section 382 ownership change on March 31, 2018. For certain states, an additional
Section 382 ownership change occurred on August 9, 2017. These Section 382 ownership changes may limit our ability to fully
utilize NOLs, tax credit carryforwards, deductions and/or certain built-in losses that existed as of each respective ownership
change date in the various jurisdictions
Due to the Section 382 and 383 limitations and the maximum carryforward period for our NOLs and tax credits, we will
be unable to fully recognize certain deferred tax assets. Accordingly, as of December 31, 2018, we had reduced our gross
deferred tax asset related to our U.S. federal and USVI NOLs by $160.9 million, our foreign tax credit deferred tax asset by
$29.5 million and corresponding valuation allowance by $55.7 million. The realization of all or a portion of our deferred
income tax assets (including NOLs and tax credits) is dependent upon the generation of future taxable income during the
statutory carryforward periods. In addition, the limitation on the utilization of our NOL and tax credit carryforwards could
result in Ocwen incurring a current tax liability in future tax years. Our inability to utilize our pre-ownership change NOL
carryforwards, Section 163(j) disallowed interest carryforwards, any future recognized built-in losses or deductions, and tax
credit carryforwards could have an adverse effect on our financial condition, results of operations and cash flows. Finally, any
future changes in our ownership or sale of our stock could further limit the use of our NOLs and tax credits in the future.
As part of our Section 382 evaluation and consistent with the rules provided within Section 382, Ocwen relies strictly on
the existence or absence, as well as the information contained in certain publicly available documents (e.g., Schedule 13D,
Schedule 13G or other documents filed with the SEC) to identify shareholders that own a 5-percent or greater interest in Ocwen
stock throughout the period tested. Further, Ocwen relies on such public filings to identify dates in which such 5-percent
shareholders acquired, disposed, or otherwise transacted in Ocwen common stock. As the requirement for filing such notices of
ownership from the SEC is to report beneficial ownership, as opposed to actual economic ownership of the stock of Ocwen,
certain SEC filings may not represent ownership in Ocwen stock that should be considered in determining whether Ocwen
experienced an ownership change under the Section 382 rules. Notwithstanding the preceding sentences (regarding Ocwen’ s
ability to rely on the existence and absence of information in publicly filed Schedules 13D and 13G), the rules prescribed in

92
Section 382 and the regulations thereunder provide that Ocwen may (but is not required to) seek additional clarification from
shareholders filing such Schedules 13D and 13G if there are questions or uncertainty regarding the true economic ownership of
shares reported in such filing (whether due to ambiguity in the filing, an overly complex ownership structure, the type of
instruments owned and reported in the filings, etc.) (often referred to “actual knowledge” questionnaires). Such information can
be sought on a filer by filer basis (i.e., there is no requirement that if actual knowledge is sought with respect to one
shareholder, actual knowledge must be sought with respect to all shareholders that filed schedules 13D or 13G). While the
seeking of actual knowledge can be beneficial in some instances it may be detrimental in others. Once such actual knowledge is
received, Section 382 requires the inclusion of such actual knowledge, even if such inclusion is detrimental to the conclusion
reached.
Ocwen has performed its analysis of the rules under Section 382 and, based on all currently available information,
identified it experienced an ownership change for Section 382 purposes in January 2015 and December 2017. Prior to 2018,
Ocwen was aware of shareholder activity in 2015 and 2017 that may have caused a Section 382 ownership change(s), but
determined that additional information could potentially be obtained from certain shareholders that would indicate a Section
382 ownership change had not occurred. In completing this analysis, Ocwen identified several shareholders that filed a
schedule 13G during the period disclosing a greater than 5-percent interest in Ocwen stock where beneficial versus economic
ownership of the stock was unclear, and Ocwen therefore requested further details. As of the date of this Form 10-K, Ocwen
has not received all requested responses from selected shareholders, and will continue to consider such shareholders as
economic owners of Ocwen’s stock until actual knowledge is otherwise received.
Ocwen is continuing to monitor the ownership in its stock to evaluate information that will become available later in 2019
and that may result in a different outcome for Section 382 purposes and our future cash tax obligations. As part of this
monitoring, Ocwen periodically evaluates whether it is appropriate and beneficial to retroactively seek actual knowledge on
certain previously identified and included 5-percent shareholders, whereby, depending on the responses received, Ocwen may
conclude that either the January 2015 or December 2017 Section 382 ownership changes may have instead occurred on a
different date, or did not occur at all. As such, our analysis regarding the amount of tax attributes that may be available to offset
taxable income in the future without restrictions imposed by Section 382 may continue to evolve.
Indemnification Obligations
We have exposure to representation, warranty and indemnification obligations because of our lending, sales and
securitization activities, our acquisitions to the extent we assume one or more of these obligations, and in connection with our
servicing practices. We initially recognize these obligations at fair value. Thereafter, the estimation of the liability considers
probable future obligations based on industry data of loans of similar type segregated by year of origination, to the extent
applicable, and estimated loss severity based on current loss rates for similar loans, our historical rescission rates and the
current pipeline of unresolved demands. Our historical loss severity considers the historical loss experience that we incur upon
sale or liquidation of a repurchased loan as well as current market conditions. We monitor the adequacy of the overall liability
and make adjustments, as necessary, after consideration of other qualitative factors including ongoing dialogue and experience
with our counterparties. As of December 31, 2019, we have recorded a liability for representation and warranty obligations,
compensatory fees related to foreclosure timelines, and similar indemnification obligations of $50.8 million. See Note 26 —
Contingencies for additional information.
Litigation
We monitor our litigation matters, including advice from external legal counsel, and regularly perform assessments of these
matters for potential loss accrual and disclosure. We establish liabilities for settlements, judgments on appeal and filed and/or
threatened claims for which we believe it is probable that a loss has been or will be incurred and the amount can be reasonably
estimated.
Going Concern
In accordance with ASC 205-40, Presentation of Financial Statements - Going Concern, we evaluate whether there are
conditions that are known or reasonably knowable that raise substantial doubt about our ability to continue as a going concern
within one year after the date that our financial statements are issued. We perform a detailed review and analysis of relevant
quantitative and qualitative information from across our organization in connection with this evaluation. To support this effort,
senior management from key business units reviews and assesses the following information:
• our current financial condition, including liquidity sources at the date that the financial statements are issued (e.g.,
available liquid funds and available access to credit, including covenant compliance);
• our conditional and unconditional obligations due or anticipated within one year after the date that the financial
statements are issued (regardless of whether those obligations are recognized in our financial statements);
• funds necessary to maintain operations considering our current financial condition, obligations and other expected
cash flows within one year after the date that the financial statements are issued (i.e., financial forecasting); and

93
• other conditions and events, when considered in conjunction with the above items, that may adversely affect our
ability to meet obligations within one year after the date that the financial statements are issued (e.g., negative
financial trends, indications of possible financial difficulties, internal matters such as a need to significantly revise
operations and external matters such as adverse regulatory or legal proceedings, adverse counterparty actions or rating
agency decisions, and our client concentration).
Our evaluation of whether it is probable that we will be unable to meet our obligations as they become due within one year
after the date that our financial statements are issued involves a degree of judgment, including about matters that are, to
different degrees, uncertain.
If such conditions exist, management evaluates its plans that when implemented would mitigate the condition(s) and
alleviate the substantial doubt about our ability to continue as a going concern. Such plans are considered only if information
available as of the date that the financial statements are issued indicates both of the following are true:
• it is probable management’s plans will be implemented within the evaluation period; and
• it is probable management’s plans, when implemented individually or in the aggregate, will mitigate the condition(s)
that raise substantial doubt about our ability to continue as a going concern in the evaluation period.
Our evaluation of whether it is probable that management’s plans will be effectively implemented within the evaluation
period is based on the feasibility of implementation of management’s plans in light of our specific facts and circumstances.
Our evaluation of whether it is probable that our plans, individually or in the aggregate, will be implemented in the
evaluation period involves a degree of judgment, including about matters that are, to different degrees, uncertain.
Based on our evaluation, we have determined that there are no conditions that are known or reasonably knowable that raise
substantial doubt about our ability to continue as a going concern within one year after the date that our Consolidated Financial
Statements for the year ended December 31, 2019 are issued.
RECENT ACCOUNTING DEVELOPMENTS
Recent Accounting Pronouncements
Listed below are ASUs that we adopted on January 1, 2019.
• ASU 2016-02: Leases
• ASU 2017-08: Receivables: Nonrefundable Fees and Other Costs
• ASU 2018-02: Income Statement - Reporting Comprehensive Income: Reclassification of Certain Tax Effects from
Accumulated Other Comprehensive Income
• ASU 2018-09: Codification Improvements
The adoption of ASU 2016-02 resulted in the recognition of an insignificant cumulative-effect adjustment to the opening
balance of Retained earnings on January 1, 2019, the recognition of a gross ROU asset and lease liability of $66.2 million, and
the reclassification of balances which existed at December 31, 2018 for our leases.
Additional ASUs were adopted on January 1, 2020, including Financial Instruments - Credit Losses: Measurement of
Credit Losses on Financial Instruments (ASU 2016-13 and ASU 2019-04). For additional information, see Note 1 —
Organization, Business Environment, Basis of Presentation and Significant Accounting Policies to the Consolidated Financial
Statements.
ITEM 7A. QUANTITATIVE AND QUALITATIVE DISCLOSURES ABOUT MARKET RISK
Refer to the Market Risk sections of Item 7. Management’s Discussion and Analysis of Financial Condition and Results of
Operations for our quantitative and qualitative disclosures about market risk.
ITEM 8. FINANCIAL STATEMENTS AND SUPPLEMENTARY DATA
The information required by this section is contained in the Consolidated Financial Statements of Ocwen Financial
Corporation and Report of Deloitte & Touche LLP, Independent Registered Public Accounting Firm, beginning on Page F-1.
ITEM 9. CHANGES IN AND DISAGREEMENTS WITH ACCOUNTANTS ON ACCOUNTING AND FINANCIAL
DISCLOSURE
None.

94
ITEM 9A. CONTROLS AND PROCEDURES
Evaluation of Disclosure Controls and Procedures
Our management, under the supervision of and with the participation of our principal executive officer and our principal
financial officer, has evaluated the effectiveness of our disclosure controls and procedures, as such term is defined in Rules
13a-15(e) and 15d-15(e) under the Securities Exchange Act of 1934, as amended (Exchange Act), as of the end of the period
covered by this Annual Report. Based on such evaluation, management concluded that, as of the end of such period, our
disclosure controls and procedures are effective.
Management’s Report on Internal Control over Financial Reporting
Our management is responsible for establishing and maintaining adequate internal control over financial reporting, as that
term is defined in Exchange Act Rules 13a-15(f) and 15d-15(f).
Under the supervision of and with the participation of our management, including our principal executive officer and
principal financial officer, we conducted an evaluation of our internal control over financial reporting as of December 31, 2019,
based on the framework set forth by the Committee of Sponsoring Organizations of the Treadway Commission (COSO) in
Internal Control—Integrated Framework (2013 framework). Based on that evaluation, our management concluded that, as of
December 31, 2019, internal control over financial reporting is effective based on criteria established in Internal Control—
Integrated Framework issued by the COSO.
The effectiveness of Ocwen’s internal control over financial reporting as of December 31, 2019 has been audited by
Deloitte & Touche LLP, an independent registered public accounting firm, as stated in their report that appears herein.
Limitations on the Effectiveness of Controls
A company’s internal control over financial reporting is a process designed to provide reasonable assurance regarding the
reliability of financial reporting and the preparation of financial statements for external purposes in accordance with accounting
principles generally accepted in the United States of America. A company’s internal control over financial reporting includes
those policies and procedures that (i) pertain to the maintenance of records that, in reasonable detail, accurately and fairly
reflect the transactions and dispositions of the assets of the company; (ii) provide reasonable assurance that transactions are
recorded as necessary to permit preparation of financial statements in accordance with accounting principles generally accepted
in the United States of America and that receipts and expenditures of the company are being made only in accordance with
authorizations of management and directors of the company; and (iii) provide reasonable assurance regarding prevention or
timely detection of unauthorized acquisition, use or disposition of the company’s assets that could have a material effect on the
financial statements.
Because of its inherent limitations, internal control over financial reporting may not prevent or detect misstatements. In
addition, projections of any evaluation of effectiveness to future periods are subject to the risk that controls may become
inadequate because of changes in conditions or that the degree of compliance with the policies or procedures may deteriorate.
Changes in Internal Control over Financial Reporting
There have not been any changes in our internal control over financial reporting during our fiscal quarter ended
December 31, 2019 that have materially affected, or are reasonably likely to materially affect, our internal control over
financial reporting.
ITEM 9B. OTHER INFORMATION
There was no information required to be reported on Form 8-K during the fourth quarter of the year covered by this Form
10-K that was not so reported.
PART III
ITEM 10. DIRECTORS, EXECUTIVE OFFICERS AND CORPORATE GOVERNANCE
The information required by this item is incorporated by reference to the information contained under the captions
“Election of Directors-Nominees for Director,” “Executive Officers Who Are Not Directors,” “Board of Directors and
Corporate Governance-Committees of the Board of Directors-Audit Committee”, “Security Ownership of Certain Beneficial
Owners and Related Shareholder Matters-Section 16(a) Beneficial Ownership Reporting Compliance” and “Board of Directors
and Corporate Governance-Code of Ethics” in our definitive Proxy Statement with respect to our 2020 Annual Meeting, which
we intend to file with the SEC no later than April 29, 2020.

95
ITEM 11. EXECUTIVE COMPENSATION
The information required by this item is incorporated by reference to the information contained under the captions
“Executive Compensation” and “Board of Directors Compensation” in our definitive Proxy Statement with respect to our 2020
Annual Meeting, which we intend to file with the SEC no later than April 29, 2020.
ITEM 12. SECURITY OWNERSHIP OF CERTAIN BENEFICIAL OWNERS AND MANAGEMENT AND
RELATED STOCKHOLDER MATTERS
The information required by this item is incorporated by reference to the information contained under the captions
“Security Ownership of Certain Beneficial Owners and Related Shareholder Matters-Beneficial Ownership of Equity
Securities” and “Equity Compensation Plan Information” in our definitive Proxy Statement with respect to our 2020 Annual
Meeting, which we intend to file with the SEC no later than April 29, 2020.
ITEM 13. CERTAIN RELATIONSHIPS AND RELATED TRANSACTIONS, AND DIRECTOR INDEPENDENCE
The information required by this item is incorporated by reference to the information contained under the captions “Board
of Directors and Corporate Governance-Independence of Directors” and “Business Relationships and Related Transactions” in
our definitive Proxy Statement with respect to our 2020 Annual Meeting, which we intend to file with the SEC no later than
April 29, 2020.
ITEM 14. PRINCIPAL ACCOUNTING FEES AND SERVICES
The information required by this item is incorporated by reference to the information contained under the caption
“Ratification of Appointment of Independent Registered Public Accounting Firm” in our definitive Proxy Statement with
respect to our 2020 Annual Meeting, which we intend to file with the Securities and Exchange Commission no later than
April 29, 2020.
PART IV
ITEM 15. EXHIBITS, FINANCIAL STATEMENT SCHEDULES
(1) and (2) Financial Statements and Schedules. The information required by this section is contained in the Consolidated
Financial Statements of Ocwen Financial Corporation and Report of Deloitte & Touche LLP, Independent Registered Public
Accounting Firm, beginning on Page F-1.
(3) Exhibits.
2.1†
Agreement and Plan of Merger, dated as of February 27, 2018, by and among Ocwen Financial Corporation, POMS Corp and PHH Corporation (3)
2.2†
Agreement for the Purchase and Sale of Servicing Rights, dated December 28, 2016, by and between New Residential Mortgage LLC, PHH Mortgage Corporation and, for limited purposes, PHH Corporation (3)
3.1 Amended and Restated Articles of Incorporation, as amended (5)
3.2 Amended and Restated Bylaws of Ocwen Financial Corporation
4.1 Form of Certificate of Common Stock (2)
4.2
The Company agrees to furnish to the Securities and Exchange Commission upon request a copy of each instrument with respect to the issuance of long-term debt of the Company and its subsidiaries, the authorized principal amount of which does not exceed 10% of the consolidated assets of the Company and its subsidiaries.
4.3
Indenture, dated as of December 5, 2016, among Ocwen Loan Servicing, LLC, Ocwen Financial Corporation, the other guarantors named therein and Wilmington Trust, National Association (21)
4.4
First Supplemental Indenture, dated as of October 4, 2018, among PHH Corporation, PHH Mortgage Corporation and Wilmington Trust, National Association (31)
4.5
Second Supplemental Indenture, dated August 23, 2012, between PHH Corporation and The Bank of New York Mellon Trust Company, N.A., as trustee (32)
4.6
Third Supplemental Indenture, dated August 20, 2013, between PHH Corporation and The Bank of New York Mellon Trust Company, N.A., as trustee (33)
4.7
Fourth Supplemental Indenture, dated as of July 3, 2017, among PHH Corporation, as issuer and The Bank of New York Mellon Trust Company, N.A., as trustee (34)

96
4.8
Fifth Supplemental Indenture, dated as of July 3, 2017, among PHH Corporation, as issuer and The Bank of New York Mellon Trust Company, N.A., as trustee (34)
4.9 Form of 7.375% Senior Note due 2019 (32)
4.10 Form of 6.375% Senior Note due 2021 (33)
4.11
Indenture, dated as of January 17, 2012, between PHH Corporation and The Bank of New York Mellon Trust Company, N.A., as trustee (30)
4.12 Description of Common Stock (42)
10.1* Ocwen Financial Corporation 1998 Annual Incentive Plan, as amended (40)
10.2* Ocwen Financial Corporation Deferral Plan for Directors, dated March 7, 2005 (11)
10.3* Ocwen Financial Corporation 2007 Equity Incentive Plan, dated May 10, 2007 (12)
10.4* Ocwen Mortgage Servicing, Inc. Amended and Restated 2013 Preferred Stock Plan (6)
10.5 Ocwen Financial Corporation 2017 Performance Incentive Plan (23)
10.6
Services Agreement, dated as of August 10, 2009, by and between Ocwen Financial Corporation and Altisource Solutions S.à r.l. (10)
10.7
Services Agreement, dated as of October 1, 2012, by and between Ocwen Mortgage Servicing, Inc. and Altisource Solutions S.à r.l. (1)
10.8
First Amendment to Services Agreement, dated as of October 1, 2012, by and between Ocwen Financial Corporation and Altisource Solutions S.à r.l. (1)
10.9
Second Amendment to Services Agreement, dated as of March 29, 2013, by and between Ocwen Financial Corporation and Altisource Solutions S.à r.l. (4)
10.10
First Amendment to Services Agreement, dated as of March 29, 2013, by and between Ocwen Mortgage Servicing, Inc. and Altisource Solutions S.à r.l. (4)
10.11
Third Amendment to Services Agreement, dated as of July 24, 2013, by and between Ocwen Financial Corporation and Altisource Solutions S.à r.l. (6)
10.12
Second Amendment to Services Agreement dated July 24, 2013 by and between Ocwen Mortgage Servicing, Inc. and Altisource Solutions S.à r.l. (6)
10.13
Agreement dated as of April 12, 2013 by and among Altisource Solutions S.à r.l., Ocwen Financial Corporation and Ocwen Mortgage Servicing, Inc. (13)
10.14
Servicing Rights Purchase Agreement, dated October 1, 2012, between Ocwen Loan Servicing, LLC and HLSS Holdings, LLC (6)
10.15
Amendment to Master Servicing Rights Purchase Agreement and Sale Supplements, dated as of December 26, 2012 (22)
10.16
Sale Supplement, dated as of July 1, 2013, to the Master Servicing Rights Purchase Agreement, dated as of October 1, 2012, between Ocwen Loan Servicing, LLC, HLSS Holdings, LLC and Home Loan Servicing Solutions, Ltd. (14)
10.17
Subservicing Supplement, dated as of July 1, 2013, to the Master Subservicing Agreement, dated as of October 1, 2012, between Ocwen Loan Servicing, LLC and HLSS Holdings LLC (14)
10.18
Amendment, dated as of September 30, 2013, to the Sale Supplement, dated as of July 1, 2013, to the Master Servicing Rights Purchase Agreement, dated as of October 1, 2012, between Ocwen Loan Servicing, LLC, HLSS Holdings, LLC and Home Loan Servicing Solutions, Ltd. (15)
10.19
Amendment, dated as of September 30, 2013, to the Subservicing Supplement, dated as of July 1, 2013, to the Master Subservicing Agreement, dated as of October 1, 2012, between Ocwen Loan Servicing, LLC and HLSS Holdings LLC (15)
10.20
Amendment, dated as of February 4, 2014, to the Sale Supplement dated as of July 1, 2013, the Sale Supplement dated February 10, 2012 and various other sale supplements, between Ocwen Loan Servicing, LLC, HLSS Holdings, LLC and Home Loan Servicing Solutions, Ltd. (6)
10.21
Amendment, dated as of February 4, 2014, to the Subservicing Supplement dated as of July 1, 2013, the Subservicing Supplement dated as of February 10, 2012 and various other subservicing supplements, among Ocwen Loan Servicing, LLC and HLSS Holdings, LLC (6)
10.22
Amendment No. 2 to Master Servicing Rights Purchase Agreement and Sale Supplements, dated as of April 6, 2015 (16)
10.23
Amendment dated February 17, 2017 to the Master Servicing Rights Purchase Agreement and Sale Supplements (22)

97
10.24
Amended and Restated Senior Secured Term Loan Facility Agreement, dated as of December 5, 2016, by and among Ocwen Loan Servicing, LLC, as Borrower, Ocwen Financial Corporation, as Parent, Certain Subsidiaries of Ocwen Financial Corporation, as Subsidiary Guarantors, the Lender Parties thereto, and Barclays Bank PLC, as Administrative Agent and Collateral Agent (21)
10.25
Pledge and Security Agreement dated as of February 15, 2013 between each of the Grantor Parties thereto, and Barclays Bank PLC, as Collateral Agent (17)
10.26
Second Lien Notes Pledge and Security Agreement, dated as of December 5, 2016, among each of the grantors named therein and Wilmington Trust, National Association (21)
10.27
Junior Priority Intercreditor Agreement, dated as of December 5, 2016, among Ocwen Loan Servicing, LLC, Ocwen Financial Corporation, the other grantors named therein, Barclays Bank PLC and Wilmington Trust, National Association (21)
10.28 Description of USVI Relocation Package of Ocwen Mortgage Servicing, Inc. (18)
10.29*
Retirement Agreement, dated as of January 16, 2015, by and among Ocwen Financial Corporation, Ocwen Mortgage Servicing, Inc. and William C. Erbey. (19)
10.30 Form of Indemnification Agreement (20)
10.31 Form of Undertaking to Repay Advancement of Indemnification Expenses (20)
10.32††
Master Agreement dated as of July 23, 2017 by and among Ocwen Loan Servicing, LLC, HLSS Holdings, LLC, HLSS MSR - EBO Acquisition LLC, and New Residential Mortgage LLC (24)
10.33
Amendment No. 1, dated October 12, 2017, to Master Agreement dated as of July 23, 2017 by and among Ocwen Loan Servicing, LLC, HLSS Holdings, LLC, HLSS MSR - EBO Acquisition LLC, and New Residential Mortgage LLC (24)
10.34††
Transfer Agreement dated as of July 23, 2017 by and between Ocwen Loan Servicing, LLC, New Residential Mortgage LLC, Ocwen Financial Corporation, and New Residential Investment Corp. (24)
10.35††
Subservicing Agreement dated as of July 23, 2017 by and between New Residential Mortgage LLC and Ocwen Loan Servicing, LLC (24)
10.36††
New RMSR Agreement, dated as of January 18, 2018 by and among Ocwen Loan Servicing, LLC, HLSS Holdings, LLC, HLSS MSR - EBO Acquisition LLC, and New Residential Mortgage LLC (3)
10.37††
Amendment No. 1 to Transfer Agreement, dated as of January 18, 2018 by and among Ocwen Loan Servicing, LLC, New Residential Mortgage LLC, Ocwen Financial Corporation and New Residential Investment Corp. (3)
10.38*
Separation Agreement, dated as of February 9, 2018, between Otto Kumbar and Ocwen Financial Corporation (27)
10.39* Offer Letter, dated April 17, 2018, between Ocwen Financial Corporation and Glen Messina (28)
10.40*
Release and Restrictive Covenant Agreement, dated April 17, 2018, between Ocwen Financial Corporation and Ronald M. Faris (28)
10.41*
Separation Agreement and Full Release, dated May 29, 2018, between Ocwen Financial Corporation and Michael R. Bourque, Jr. (29)
10.42
Counterpart Agreement, dated as of October 4, 2018, executed by PHH Corporation and PHH Mortgage Corporation and acknowledged and agreed to by Barclays Bank PLC, as administrative agent and collateral agent (31)
10.43††
Amendment No. 1 to Subservicing Agreement dated as of August 17, 2018 between New Residential Mortgage LLC and Ocwen Loan Servicing, LLC (35)
10.44††
Amendment No. 1 to New RMSR Agreement dated as of August 17, 2018 among New Residential Mortgage LLC, Ocwen Loan Servicing, LLC and the other parties thereto (35)
10.45††
Subservicing Agreement dated as of August 17, 2018 between New Penn Financial, LLC and Ocwen Loan Servicing, LLC (35)
10.46††
Flow Mortgage Loan Subservicing Agreement, dated as of December 28, 2016, between New Residential Mortgage LLC, as Servicing Rights Owner, and PHH Mortgage Corporation, as Servicer (36)
10.47
Amendment Number One dated as of June 16, 2017 to the Flow Mortgage Loan Subservicing Agreement between New Residential Mortgage LLC, as Servicing Rights Owner, and PHH Mortgage Corporation, as Servicer (37)
10.48††
MSR Portfolio Defense Agreement, dated as of June 16, 2017, by and between PHH Mortgage Corporation, as subservicer, and New Residential Mortgage LLC, as the MSR owner (37)
10.49* Amended and Restated PHH Corporation Tier I Severance Pay Plan (38)
10.50* PHH Corporation Tier II Severance Pay Plan (39)

98
10.51* Amendment No. 3 to PHH Corporation Tier II Severance Pay Plan (26)
10.52*
Separation and General Release Agreement dated June 28, 2017 by and between Glen A. Messina and PHH Corporation (25)
10.53* Form of Director Restricted Stock Unit Agreement (2)
10.54* Amended and Restated Ocwen Financial Corporation United States Basic Severance Plan (2)
10.55*
Amended and Restated Ocwen Financial Corporation United States Change in Control Severance Plan (2)
10.56†††
Binding Term Sheet dated as of February 22, 2019 between Altisource S.à r.l., Ocwen Financial Corporation and Ocwen Mortgage Servicing, Inc. (7)
10.57*
Amendment to April 17, 2018 Offer Letter between Ocwen Financial Corporation and Glen Messina, dated February 27, 2019 (7)
10.58* Offer Letter between Ocwen Financial Corporation and June Campbell, dated January 17, 2019 (7)
10.59
Joinder and Amendment Agreement among Ocwen Financial Corporation, Ocwen Loan Servicing, LLC, as borrower, Barclays Bank PLC as administrative agent, and the other parties thereto, dated as of March 18, 2019 (9)
10.60*
Form of Annual Performance-Based Cash Award Agreement (8)
10.61* Form of Annual Performance-Based Stock Award Agreement (8)
10.62* Form of Annual Time-Based Cash Award Agreement (8)
10.63* Form of Annual Time-Based Stock Award Agreement (8)
10.64* Form of Transitional Cash Award Agreement (8)
10.65*
Consulting Agreement between Ocwen Financial Corporation and Catherine Dondzila, effective June 1, 2019 (8)
10.66*
Separation and Release Agreement between Ocwen Financial Corporation and Catherine Dondzila, effective June 19, 2019 (8)
10.67*
Amendment to April 17, 2018 Offer Letter between Ocwen Financial Corporation and Glen Messina, effective April 11, 2019 (8)
10.68††††
Joinder and Second Amendment Agreement, dated as of January 27, 2020, to the Amended and Restated Senior Secured Term Loan Facility Agreement (41)
10.69†††
Amended and Restated Flow Mortgage Loan Subservicing Agreement between New Residential Mortgage LLC and PHH Mortgage Corporation dated March 29, 2019 (8)
21.1 Subsidiaries (filed herewith)
23.1 Consent of Independent Registered Public Accounting Firm (filed herewith)
31.1
Certification of the principal executive officer pursuant to Section 302 of the Sarbanes-Oxley Act of 2002 (filed herewith)
31.2
Certification of the principal financial officer pursuant to Section 302 of the Sarbanes-Oxley Act of 2002 (filed herewith)
32.1
Certification of the principal executive officer pursuant to 18 U.S.C. Section 1350, as adopted pursuant to Section 906 of the Sarbanes-Oxley Act of 2002 (furnished herewith)
32.2
Certification of the principal financial officer pursuant to 18 U.S.C. Section 1350, as adopted pursuant to Section 906 of the Sarbanes-Oxley Act of 2002 (furnished herewith)
101.INS XBRL Instance Document (filed herewith)
101.SCH XBRL Taxonomy Extension Schema Document (filed herewith)
101.CAL XBRL Taxonomy Extension Calculation Linkbase Document (filed herewith)
101.DEF XBRL Taxonomy Extension Definition Linkbase Document (filed herewith)
101.LAB XBRL Taxonomy Extension Label Linkbase Document (filed herewith)
101.PRE XBRL Taxonomy Extension Presentation Linkbase Document (filed herewith)
* Management contract or compensatory plan or agreement.
† Certain schedules and exhibits have been omitted in accordance with Item 601(b)(2) of Regulation S-K. A copy of any
referenced schedules will be furnished supplementally to the SEC upon request.
†† Portions of this exhibit have been omitted pursuant to a request for confidential treatment.
††† Certain confidential information contained in this agreement has been omitted because it is not material and would be
competitively harmful if publicly disclosed.

99
†††† Certain schedules and exhibits have been omitted in accordance with Item 601(a)(5) of Regulation S-K. A copy of any
referenced schedules will be furnished supplementally to the SEC upon request.
(1) Incorporated by reference from the similarly described exhibit included with the Registrant’s Form 8-K filed on October
5, 2012.
(2) Incorporated by reference from the similarly described exhibit included with the Registrant’s Annual Report on Form
10-K filed for the year ended December 31, 2018 filed on February 27, 2019.
(3) Incorporated by reference to the similarly described exhibit included with the Registrant’s Quarterly Report on Form 10-
Q for the period ended March 31, 2018 filed on May 2, 2018.
(4) Incorporated by reference from the similarly described exhibit included with the Registrant’s Form 8-K filed on April 4,
2013.
(5) Incorporated by reference from the similarly described exhibit included with the Registrant’s Quarterly Report on Form
10-Q for the period ended June 30, 2017 filed on August 3, 2017.
(6) Incorporated by reference from the similarly described exhibit included with the Registrant’s Annual Report on Form
10-K for the year ended December 31, 2013 filed on March 3, 2014.
(7) Incorporated by reference from the similarly described exhibit included with the Registrant’s Quarterly Report on Form
10-Q for the period ended March 31, 2019 filed on May 7, 2019.
(8) Incorporated by reference from the similarly described exhibit included with the Registrant’s Quarterly Report on Form
10-Q for the period ended June 30, 2019 filed on August 6, 2019.
(9) Incorporated by reference to the similarly described exhibit to the Registrant’s Form 8-K filed on March 18, 2019.
(10) Incorporated by reference from the similarly described exhibit included with the Registrant’s Form 8-K filed on August
12, 2009.
(11) Incorporated by reference from the similarly described exhibit included with the Registrant’s Annual Report on Form
10-K for the year ended December 31, 2004 filed on March 16, 2005.
(12) Incorporated by reference from the similarly described exhibit to our definitive Proxy Statement with respect to our 2007
Annual Meeting of Shareholders as filed on March 30, 2007.
(13) Incorporated by reference from the similarly described exhibit included with the Registrant’s Form 8-K filed on April
18, 2013.
(14) Incorporated by reference from the similarly described exhibit included with the Registrant’s Form 8-K filed on July 8,
2013.
(15) Incorporated by reference from the similarly described exhibit included with the Registrant’s Quarterly Report on Form
10-Q for the period ended September 30, 2013 filed on November 5, 2013.
(16) Incorporated by reference from the similarly described exhibit included with the Registrant’s Form 8-K filed on April 6,
2015.
(17) Incorporated by reference from the similarly described exhibit included with the Registrant’s Form 8-K filed on
February 19, 2013.
(18) Incorporated by reference from the similarly described exhibit included with the Registrant’s Quarterly Report on Form
10-Q for the period ended March 31, 2014 filed on May 2, 2014.
(19) Incorporated by reference from the similarly described exhibit included with the Registrant’s Form 8-K filed on January
20, 2015.
(20) Incorporated by reference from the similarly described exhibit included with the Registrant’s Form 8-K filed on March
26, 2015.
(21) Incorporated by reference from the similarly described exhibit included with the Registrant’s Form 8-K filed on
December 6, 2016.
(22) Incorporated by reference from the similarly described exhibit included with the Registrant’s Annual Report on Form
10-K for the year ended December 31, 2016 filed February 23, 2017.
(23) Incorporated by reference from the similarly described exhibit included with the Registrant’s Form 8-K filed on May 24,
2017.
(24) Incorporated by reference from the similarly described exhibit included with the Registrant’s Quarterly Report on Form
10-Q for the period ended September 30, 2017 filed on November 2, 2017.
(25) Incorporated by reference to the similarly described exhibit included with PHH Corporation's Quarterly Report on Form
10-Q for the period ended June 30, 2017 filed on August 9, 2017.
(26) Incorporated by reference to the similarly described exhibit to PHH Corporation's Annual Report on Form 10-K for the
year ended December 31, 2017 filed on March 1, 2018.
(27) Incorporated by reference to the similarly described exhibit included with the Registrant’s Form 8-K filed on February
12, 2018.
(28) Incorporated by reference to the similarly described exhibit included with the Registrant’s Form 8-K filed on April 19,
2018.

100
(29) Incorporated by reference to the similarly described exhibit included with the Registrant’s Form 8-K filed on May 29,
2018.
(30) Incorporated by reference to the similarly described exhibit to PHH Corporation’s Form 8-K filed on January 17, 2012.
(31) Incorporated by reference to the similarly described exhibit to the Registrant’s Form 8-K filed on October 4, 2018.
(32) Incorporated by reference to the similarly described exhibit to PHH Corporation’s Form 8-K filed on August 23, 2012.
(33) Incorporated by reference to the similarly described exhibit to PHH Corporation’s Form 8-K filed on August 20, 2013.
(34) Incorporated by reference to the similarly described exhibit to PHH Corporation’s Form 8-K filed on July 5, 2017.
(35) Incorporated by reference to the similarly described exhibit included with the Registrant’s Quarterly Report on Form 10-
Q for the period ended September 30, 2018 filed on November 6, 2018.
(36) Incorporated by reference to the similarly described exhibit to PHH Corporation’s Form 8-K filed on December 28,
2016.
(37) Incorporated by reference to the similarly described exhibit to PHH Corporation’s Form 8-K filed on June 19, 2017.
(38) Incorporated by reference to the similarly described exhibit to PHH Corporation’s Form 8-K filed on May 25, 2016.
(39) Incorporated by reference to the similarly described exhibit to PHH Corporation’s Annual Report on Form 10-K filed on
February 27, 2015.
(40) Incorporated by reference to the similarly described exhibit included with the Registrant’s Quarterly Report on Form 10-
Q for the period ended March 31, 2016 filed on April 28, 2016.
(41) Incorporated by reference from the similarly described exhibit included with the Registrant’s Form 8-K filed on January
27, 2020.
(42) Incorporated by reference from the Description of Capital Stock included in the Registrant’s Registration Statement on
Form S-3 filed on May 9, 2013
ITEM 16. FORM 10-K SUMMARY
None.

101
Signatures
Pursuant to the requirements of Section 13 or 15(d) of the Securities Exchange Act of 1934, as amended, the Registrant has
duly caused this report to be signed on our behalf by the undersigned, thereunto duly authorized.
Ocwen Financial Corporation
By: /s/ Glen A. Messina
Glen A. Messina
President and Chief Executive Officer
Date: February 26, 2020
Pursuant to the requirements of the Securities Exchange Act of 1934, as amended, this Report has been signed below by
the following persons on behalf of the registrant and in the capacities and on the dates indicated:
/s/ Phyllis R. Caldwell Date: February 26, 2020
Phyllis R. Caldwell, Chair of the Board of Directors
/s/ Glen A. Messina Date: February 26, 2020
Glen A. Messina, President, Chief Executive Officer and Director (principal executive officer)
/s/ Alan J. Bowers Date: February 26, 2020
Alan J. Bowers, Director
/s/ Jacques J. Busquet Date: February 26, 2020
Jacques J. Busquet, Director
/s/ Kevin Stein Date: February 26, 2020
Kevin Stein, Director
/s/ Robert J. Lipstein Date: February 26, 2020
Robert J. Lipstein, Director
/s/ Jenne K. Britell Date: February 26, 2020
Jenne K. Britell, Director
/s/ DeForest B. Soaries, Jr. Date: February 26, 2020
DeForest B. Soaries, Jr., Director
/s/ June C. Campbell Date: February 26, 2020
June C. Campbell, Executive Vice President and Chief Financial Officer (principal financial officer)
/s/ Francois Grunenwald Date: February 26, 2020
Francois Grunenwald, Senior Vice President and Chief Accounting Officer (principal accounting officer)

102
OCWEN FINANCIAL CORPORATION AND SUBSIDIARIES
CONSOLIDATED FINANCIAL STATEMENTS AND
REPORT OF INDEPENDENT REGISTERED PUBLIC ACCOUNTING FIRM
December 31, 2019
F-1
OCWEN FINANCIAL CORPORATION AND SUBSIDIARIES
INDEX TO CONSOLIDATED FINANCIAL STATEMENTS AND SCHEDULES
December 31, 2019
Page
Report of Independent Registered Public Accounting Firm 2
Report of Independent Registered Public Accounting Firm on Internal Control over Financial Reporting 3
Consolidated Financial Statements:
Consolidated Balance Sheets at December 31, 2019 and 2018 4
Consolidated Statements of Operations for the years ended December 31, 2019, 2018 and 2017 5
Consolidated Statements of Comprehensive Loss for the years ended December 31, 2019, 2018 and 2017 6
Consolidated Statements of Changes in Equity for the years ended December 31, 2019, 2018 and 2017 7
Consolidated Statements of Cash Flows for the years ended December 31, 2019, 2018 and 2017 8
Notes to Consolidated Financial Statements 11

F-2
REPORT OF INDEPENDENT REGISTERED PUBLIC ACCOUNTING FIRM
To the shareholders and the Board of Directors of Ocwen Financial Corporation:
Opinion on the Financial Statements
We have audited the accompanying consolidated balance sheets of Ocwen Financial Corporation and subsidiaries (the
“Company”) as of December 31, 2019 and 2018, the related consolidated statements of operations, comprehensive loss,
changes in equity, and cash flows for each of the three years in the period ended December 31, 2019, and the related notes
(collectively referred to as the “financial statements”). In our opinion, the financial statements present fairly, in all material
respects, the financial position of the Company as of December 31, 2019 and 2018, and the results of its operations and its cash
flows for each of the three years in the period ended December 31, 2019, in conformity with accounting principles generally
accepted in the United States of America.
We have also audited, in accordance with the standards of the Public Company Accounting Oversight Board (United States)
(PCAOB), the Company's internal control over financial reporting as of December 31, 2019, based on criteria established in
Internal Control - Integrated Framework (2013) issued by the Committee of Sponsoring Organizations of the Treadway
Commission and our report dated February 26, 2020, expressed an unqualified opinion on the Company's internal control over
financial reporting.
Basis for Opinion
These financial statements are the responsibility of the Company’s management. Our responsibility is to express an opinion on
the Company’s financial statements based on our audits. We are a public accounting firm registered with the PCAOB and are
required to be independent with respect to the Company in accordance with the U.S. federal securities laws and the applicable
rules and regulations of the Securities and Exchange Commission and the PCAOB.
We conducted our audits in accordance with the standards of the PCAOB. Those standards require that we plan and perform the
audit to obtain reasonable assurance about whether the financial statements are free of material misstatement, whether due to
error or fraud. Our audits included performing procedures to assess the risks of material misstatement of the financial
statements, whether due to error or fraud, and performing procedures that respond to those risks. Such procedures included
examining, on a test basis, evidence regarding the amounts and disclosures in the financial statements. Our audits also included
evaluating the accounting principles used and significant estimates made by management, as well as evaluating the overall
presentation of the financial statements. We believe that our audits provide a reasonable basis for our opinion.
/s/ DELOITTE & TOUCHE LLP
New York, New York
February 26, 2020
We have served as the Company’s auditor since 2009.

F-3
REPORT OF INDEPENDENT REGISTERED PUBLIC ACCOUNTING FIRM
To the shareholders and the Board of Directors of Ocwen Financial Corporation:
Opinion on Internal Control over Financial Reporting
We have audited the internal control over financial reporting of Ocwen Financial Corporation and subsidiaries (the
“Company”) as of December 31, 2019, based on criteria established in Internal Control - Integrated Framework (2013) issued
by the Committee of Sponsoring Organizations of the Treadway Commission (COSO). In our opinion, the Company
maintained, in all material respects, effective internal control over financial reporting as of December 31, 2019, based on
criteria established in Internal Control - Integrated Framework (2013) issued by COSO.
We have also audited, in accordance with the standards of the Public Company Accounting Oversight Board (United States)
(PCAOB), the consolidated financial statements as of and for the year ended December 31, 2019, of the Company and our
report dated February 26, 2020, expressed an unqualified opinion on those financial statements.
Basis for Opinion
The Company’s management is responsible for maintaining effective internal control over financial reporting and for its
assessment of the effectiveness of internal control over financial reporting, included in the accompanying Management Report
on Internal Control over Financial Reporting. Our responsibility is to express an opinion on the Company’s internal control
over financial reporting based on our audit. We are a public accounting firm registered with the PCAOB and are required to be
independent with respect to the Company in accordance with the U.S. federal securities laws and the applicable rules and
regulations of the Securities and Exchange Commission and the PCAOB.
We conducted our audit in accordance with the standards of the PCAOB. Those standards require that we plan and perform the
audit to obtain reasonable assurance about whether effective internal control over financial reporting was maintained in all
material respects. Our audit included obtaining an understanding of internal control over financial reporting, assessing the risk
that a material weakness exists, testing and evaluating the design and operating effectiveness of internal control based on the
assessed risk, and performing such other procedures as we considered necessary in the circumstances. We believe that our audit
provides a reasonable basis for our opinion.
Definition and Limitations of Internal Control over Financial Reporting
A company’s internal control over financial reporting is a process designed to provide reasonable assurance regarding the
reliability of financial reporting and the preparation of financial statements for external purposes in accordance with generally
accepted accounting principles. A company’s internal control over financial reporting includes those policies and procedures
that (1) pertain to the maintenance of records that, in reasonable detail, accurately and fairly reflect the transactions and
dispositions of the assets of the company; (2) provide reasonable assurance that transactions are recorded as necessary to permit
preparation of financial statements in accordance with generally accepted accounting principles, and that receipts and
expenditures of the company are being made only in accordance with authorizations of management and directors of the
company; and (3) provide reasonable assurance regarding prevention or timely detection of unauthorized acquisition, use, or
disposition of the company’s assets that could have a material effect on the financial statements.
Because of its inherent limitations, internal control over financial reporting may not prevent or detect misstatements. Also,
projections of any evaluation of effectiveness to future periods are subject to the risk that controls may become inadequate
because of changes in conditions, or that the degree of compliance with the policies or procedures may deteriorate.
/s/ DELOITTE & TOUCHE LLP
New York, New York
February 26, 2020

OCWEN FINANCIAL CORPORATION AND SUBSIDIARIES
CONSOLIDATED BALANCE SHEETS
(Dollars in thousands, except per share data)
The accompanying notes are an integral part of these consolidated financial statements
F-4
December 31,
2019 December 31,
2018
Assets
Cash and cash equivalents $ 428,339 $ 329,132
Restricted cash (amounts related to variable interest entities (VIEs) of $20,434 and $20,968) 64,001
67,878
Mortgage servicing rights (MSRs), at fair value 1,486,395 1,457,149
Advances, net 254,533 249,382
Match funded advances (related to VIEs) 801,990 937,294
Loans held for sale ($208,752 and $176,525 carried at fair value) 275,269 242,622
Loans held for investment, at fair value (amounts related to VIEs of $23,342 and $26,520) 6,292,938 5,498,719
Receivables, net 201,220 198,262
Premises and equipment, net 38,274 33,417
Other assets ($8,524 and $7,568 carried at fair value) (amounts related to VIEs of $4,078 and $2,874) 563,240
379,567
Assets related to discontinued operations — 794
Total assets $ 10,406,199 $ 9,394,216
Liabilities and Stockholders’ Equity
Liabilities
Home Equity Conversion Mortgage-Backed Securities (HMBS) - related borrowings, at fair value $ 6,063,435
$ 5,380,448
Other financing liabilities ($972,595 and $1,057,671 carried at fair value) (amounts related to VIEs of $22,002 and $24,815) 972,595
1,062,090
Match funded liabilities (related to VIEs) 679,109 778,284
Other secured borrowings, net (amounts related to VIEs of $242,101 and $0) 1,025,791 448,061
Senior notes, net 311,085 448,727
Other liabilities ($100 and $4,986 carried at fair value) (amounts related to VIEs of $144 and $0) 942,173
703,636
Liabilities related to discontinued operations — 18,265
Total liabilities 9,994,188 8,839,511
Commitments and Contingencies (Notes 25 and 26)
Stockholders’ Equity
Common stock, $.01 par value; 200,000,000 shares authorized; 134,862,232 and 133,912,425 shares issued and outstanding at December 31, 2019 and December 31, 2018, respectively 1,349
1,339
Additional paid-in capital 556,798 554,056
(Accumulated deficit) retained earnings (138,542 ) 3,567
Accumulated other comprehensive loss, net of income taxes (7,594 ) (4,257 )
Total stockholders’ equity 412,011 554,705
Total liabilities and stockholders’ equity $ 10,406,199 $ 9,394,216
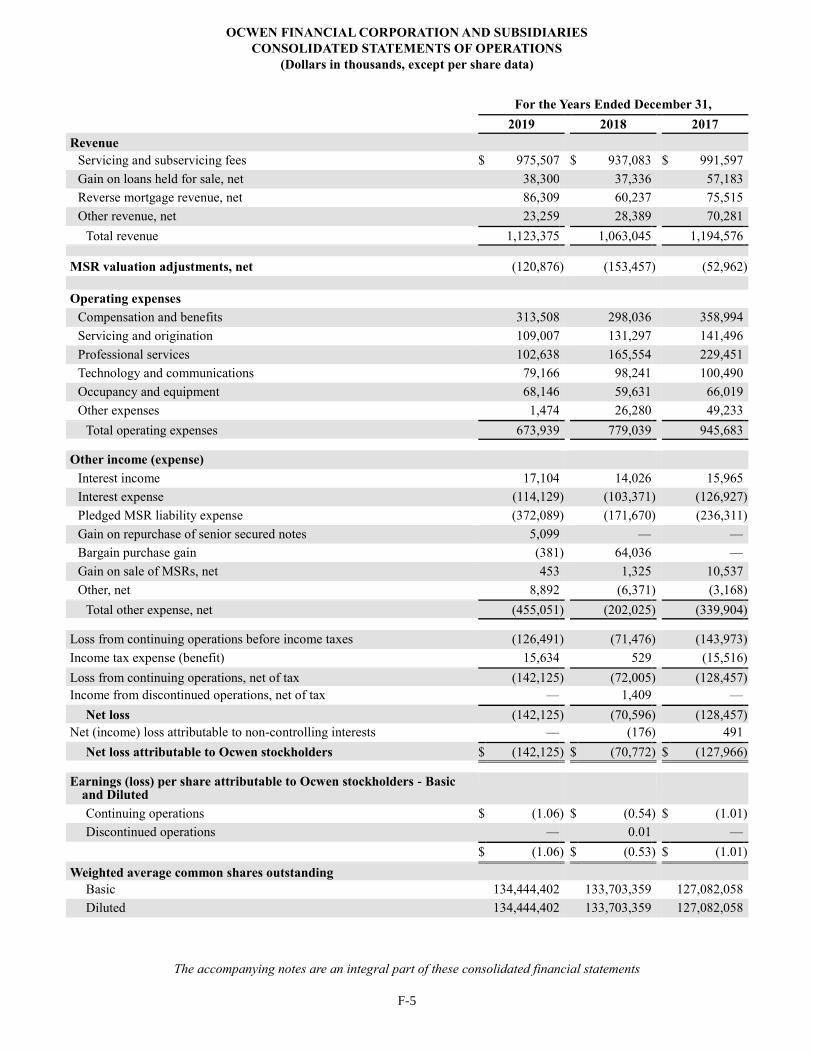
OCWEN FINANCIAL CORPORATION AND SUBSIDIARIES
CONSOLIDATED STATEMENTS OF OPERATIONS
(Dollars in thousands, except per share data)
The accompanying notes are an integral part of these consolidated financial statements
F-5
For the Years Ended December 31,
2019 2018 2017
Revenue
Servicing and subservicing fees $ 975,507 $ 937,083 $ 991,597
Gain on loans held for sale, net 38,300 37,336 57,183
Reverse mortgage revenue, net 86,309 60,237 75,515
Other revenue, net 23,259 28,389 70,281
Total revenue 1,123,375 1,063,045 1,194,576
MSR valuation adjustments, net (120,876 ) (153,457 ) (52,962 )
Operating expenses
Compensation and benefits 313,508 298,036 358,994
Servicing and origination 109,007 131,297 141,496
Professional services 102,638 165,554 229,451
Technology and communications 79,166 98,241 100,490
Occupancy and equipment 68,146 59,631 66,019
Other expenses 1,474 26,280 49,233
Total operating expenses 673,939 779,039 945,683
Other income (expense)
Interest income 17,104 14,026 15,965
Interest expense (114,129 ) (103,371 ) (126,927 )
Pledged MSR liability expense (372,089 ) (171,670 ) (236,311 )
Gain on repurchase of senior secured notes 5,099 — —
Bargain purchase gain (381 ) 64,036 —
Gain on sale of MSRs, net 453 1,325 10,537
Other, net 8,892 (6,371 ) (3,168 )
Total other expense, net (455,051 ) (202,025 ) (339,904 )
Loss from continuing operations before income taxes (126,491 ) (71,476 ) (143,973 )
Income tax expense (benefit) 15,634 529 (15,516 )
Loss from continuing operations, net of tax (142,125 ) (72,005 ) (128,457 )
Income from discontinued operations, net of tax — 1,409 —
Net loss (142,125 ) (70,596 ) (128,457 )
Net (income) loss attributable to non-controlling interests — (176 ) 491
Net loss attributable to Ocwen stockholders $ (142,125 ) $ (70,772 ) $ (127,966 )
Earnings (loss) per share attributable to Ocwen stockholders - Basic
and Diluted
Continuing operations $ (1.06 ) $ (0.54 ) $ (1.01 )
Discontinued operations — 0.01 —
$ (1.06 ) $ (0.53 ) $ (1.01 )
Weighted average common shares outstanding
Basic 134,444,402 133,703,359 127,082,058
Diluted 134,444,402 133,703,359 127,082,058

OCWEN FINANCIAL CORPORATION AND SUBSIDIARIES
CONSOLIDATED STATEMENTS OF COMPREHENSIVE LOSS
(Dollars in thousands)
The accompanying notes are an integral part of these consolidated financial statements
F-6
For the Years Ended December 31,
2019 2018 2017
Net loss $ (142,125 ) $ (70,596 ) $ (128,457 )
Other comprehensive income (loss), net of income taxes
Reclassification adjustment for losses on cash flow hedges included in net income 147 149 201
Change in unfunded pension plan obligation liability (3,442 ) (3,219 ) —
Other (42 ) 61 —
Comprehensive loss (145,462 ) (73,605 ) (128,256 )
Comprehensive (income) loss attributable to non-controlling interests — (176 ) 491
Comprehensive loss attributable to Ocwen stockholders $ (145,462 ) $ (73,781 ) $ (127,765 )

Th
e a
cco
mp
an
yin
g n
ote
s a
re a
n i
nte
gra
l p
art
of
thes
e co
nso
lid
ate
d f
inan
cia
l st
ate
men
ts
OC
WE
N F
INA
NC
IAL
CO
RP
OR
AT
ION
AN
D S
UB
SID
IAR
IES
CO
NS
OL
IDA
TE
D S
TA
TE
ME
NT
S O
F C
HA
NG
ES
IN
EQ
UIT
Y
FO
R T
HE
YE
AR
S E
ND
ED
DE
CE
MB
ER
31
, 2
01
9, 2
018
an
d 2
01
7
(Do
lla
rs i
n t
ho
usa
nd
s, e
xce
pt
per
sh
are
da
ta)
Ocw
en
Sto
ck
ho
lders
Co
mm
on
Sto
ck
A
dd
itio
na
l P
aid
-in
C
ap
ital
Reta
ined
E
arn
ing
s (A
ccu
mu
late
d
Defi
cit
)
Accu
mu
late
d
Oth
er
Co
mp
reh
en
sive
Inco
me (
Lo
ss),
N
et
of
Ta
xes
No
n-c
on
troll
ing
Inte
rest
in
S
ub
sid
iarie
s T
ota
l S
ha
res
Am
ou
nt
Bala
nce a
t Ja
nu
ary
1, 201
7
123
,98
8,1
60
$
1,2
40
$
527
,00
1
$
126
,16
7
$
(1,4
50 )
$
2,3
25
$
655
,28
3
Net
loss
—
—
—
(1
27
,966 )
—
(491 )
(128
,457 )
Cu
mu
lati
ve
effe
ct o
f ad
opti
on
of
Fin
anci
al A
ccou
nti
ng S
tand
ard
s B
oar
d
(FA
SB
) A
ccou
nti
ng S
tan
dar
ds
Upd
ate
(AS
U)
No.
2016
-09
—
—
284
(284 )
—
—
—
Issu
ance
of
com
mon s
tock
6
,700
,51
0
67
15,2
58
—
—
—
15,3
25
Equ
ity-b
ased
com
pen
sati
on a
nd o
ther
7
95
,38
8
8
4,5
14
—
—
—
4,5
22
Oth
er c
om
pre
hen
sive
inco
me
(loss
), n
et o
f in
com
e ta
xes
—
—
—
—
2
01
—
201
Bala
nce a
t D
ecem
ber
31, 2
017
1
31
,48
4,0
58
1,3
15
547
,05
7
(2,0
83 )
(1,2
49 )
1,8
34
546
,87
4
Net
loss
—
—
—
(7
0,7
72 )
—
176
(70
,59
6 )
Cu
mu
lati
ve
effe
ct o
f fa
ir v
alu
e el
ecti
on
- M
SR
s, n
et o
f in
com
e ta
xes
—
—
—
8
2,0
43
—
—
82,0
43
Cu
mu
lati
ve
effe
ct o
f ad
opti
on
of
FA
SB
AS
U N
o.
201
6-1
6
—
—
—
(5,6
21 )
—
—
(5,6
21 )
Issu
ance
of
com
mon s
tock
1
,875
,00
0
19
5,7
00
—
—
—
5,7
19
Equ
ity-b
ased
com
pen
sati
on a
nd o
ther
5
53
,36
7
5
1,2
99
—
—
—
1,3
04
Cap
ital
dis
trib
uti
on t
o n
on
-con
troll
ing i
nte
rest
—
—
—
—
—
(8
22 )
(822 )
Pu
rchas
e of
non
-con
troll
ing i
nte
rest
—
—
—
—
—
(1
,188 )
(1,1
88 )
Oth
er c
om
pre
hen
sive
inco
me
(loss
), n
et o
f in
com
e ta
xes
—
—
—
—
(3
,008 )
—
(3,0
08 )
Bala
nce a
t D
ecem
ber
31, 2
018
1
33
,91
2,4
25
1,3
39
554
,05
6
3,5
67
(4,2
57 )
—
554
,70
5
Net
loss
—
—
—
(1
42
,125 )
—
—
(142
,125 )
Cu
mu
lati
ve
effe
ct o
f ad
opti
on
of
FA
SB
AS
U N
o.
201
6-0
2
—
—
—
16
—
—
16
Equ
ity-b
ased
com
pen
sati
on a
nd o
ther
9
49
,80
7
10
2,7
42
—
—
—
2,7
52
Oth
er c
om
pre
hen
sive
inco
me
(loss
), n
et o
f in
com
e ta
xes
—
—
—
—
(3
,337 )
—
(3,3
37 )
Bala
nce a
t D
ecem
ber
31, 2
019
1
34
,86
2,2
32
$
1,3
49
$
556
,79
8
$
(138
,542 )
$
(7,5
94 )
$
—
$
412
,011
F-7

OCWEN FINANCIAL CORPORATION AND SUBSIDIARIES
CONSOLIDATED STATEMENTS OF CASH FLOWS
(Dollars in thousands)
The accompanying notes are an integral part of these consolidated financial statements
F-8
For the Years Ended December 31,
2019 2018 2017
Cash flows from operating activities
Net loss $ (142,125 ) $ (70,596 ) $ (128,457 )
MSR valuation adjustments, net 120,876 153,457 52,962
Gain on sale of MSRs, net (453 ) (1,325 ) (10,537 )
Provision for bad debts 34,867 49,180 76,828
Depreciation 31,911 27,202 26,886
Loss on write-off of fixed assets, net — — 8,502
Amortization of debt issuance costs 3,170 2,921 2,738
Gain on repurchase of senior secured notes (5,099 ) — —
Provision for (reversal of) valuation allowance on deferred tax assets 32,470 (23,347 ) (29,979 )
Decrease (increase) in deferred tax assets other than provision for valuation allowance (29,350 ) 20,058
30,710
Equity-based compensation expense 2,697 2,366 5,624
(Gain) loss on valuation of financing liability 152,986 (19,269 ) 41,282
(Gain) loss on trading securities (215 ) (527 ) 6,756
Net gain on valuation of mortgage loans held for investment and HMBS-related borrowings (55,869 ) (18,698 ) (23,733 )
Bargain purchase gain 381 (64,036 ) —
Gain on loans held for sale, net (38,300 ) (32,722 ) (53,209 )
Origination and purchase of loans held for sale (1,488,974 ) (1,715,190 ) (3,695,163 )
Proceeds from sale and collections of loans held for sale 1,380,138 1,625,116 3,662,065
Changes in assets and liabilities:
Decrease in advances and match funded advances 105,052 258,899 330,052
Decrease in receivables and other assets, net 126,881 144,310 199,209
Decrease in other liabilities (72,182 ) (69,207 ) (100,650 )
Other, net (6,922 ) 3,986 7,135
Net cash provided by operating activities 151,940 272,578 409,021
Cash flows from investing activities
Origination of loans held for investment (1,026,154 ) (920,476 ) (1,277,615 )
Principal payments received on loans held for investment 558,720 400,521 444,388
Net cash acquired in the acquisition of PHH — 64,692 —
Restricted cash acquired in the acquisition of PHH — 38,813 —
Purchase of MSRs (145,668 ) (5,433 ) (1,658 )
Proceeds from sale of MSRs 4,984 7,276 4,234
Acquisition of advances in connection with the purchase of MSRs (1,457 ) — —
Proceeds from sale of advances and match funded advances 14,186 33,792 9,446
Issuance of automotive dealer financing notes — (19,642 ) (174,363 )
Collections of automotive dealer financing notes — 52,598 162,965
Additions to premises and equipment (1,954 ) (9,016 ) (9,053 )
Proceeds from sale of real estate 7,548 9,546 3,147
Other, net 2,357 2,464 (707 )

OCWEN FINANCIAL CORPORATION AND SUBSIDIARIES
CONSOLIDATED STATEMENTS OF CASH FLOWS – (continued)
(Dollars in thousands)
The accompanying notes are an integral part of these consolidated financial statements
F-9
For the Years Ended December 31,
2019 2018 2017
Net cash used in investing activities (587,438 ) (344,865 ) (839,216 )
Cash flows from financing activities
Repayment of match funded liabilities, net (99,175 ) (220,334 ) (282,379 )
Proceeds from mortgage loan warehouse facilities and other secured borrowings 3,137,326
2,991,261
7,215,264
Repayments of mortgage loan warehouse facilities and other secured borrowings (2,875,377 ) (3,350,648 ) (7,395,013 )
Repayment and repurchase of senior notes (131,791 ) (18,482 ) —
Proceeds from issuance of additional senior secured term loan (SSTL) 119,100 — —
Repayment of SSTL borrowing (25,433 ) (66,750 ) (36,750 )
Payment of debt issuance costs (2,813 ) — (841 )
Proceeds from sale of MSRs accounted for as a financing — 279,586 54,601
Proceeds from sale of Home Equity Conversion Mortgages (HECM, or reverse mortgages) accounted for as a financing (HMBS-related borrowings) 962,113
948,917
1,281,543
Repayment of HMBS-related borrowings (549,600 ) (391,985 ) (418,503 )
Issuance of common stock — — 13,913
Capital distribution to non-controlling interest — (822 ) —
Purchase of non-controlling interest — (1,188 ) —
Other, net (3,522 ) (2,818 ) (1,478 )
Net cash provided by financing activities 530,828 166,737 430,357
Net increase in cash, cash equivalents and restricted cash 95,330 94,450 162
Cash, cash equivalents and restricted cash at beginning of year 397,010 302,560 302,398
Cash, cash equivalents and restricted cash at end of year $ 492,340 $ 397,010 $ 302,560
Supplemental cash flow information
Interest paid $ 111,144 $ 100,165 $ 128,391
Income tax payments (refunds), net 4,075 10,957 (23,501 )
Supplemental non-cash investing and financing activities
Initial consolidation of mortgage-backed securitization trusts (VIEs):
Loans held for investment $ — $ 28,373 $ —
Other financing liabilities — 26,643 —
Transfers from loans held for investment to loans held for sale 1,892 1,038 3,803
Transfers of loans held for sale to real estate owned (REO) 6,636 4,241 875
Issuance of common stock in connection with litigation settlement — 5,719 1,937
Cumulative effect adjustment for election of fair value for MSRs previously accounted for using the amortization method —
82,043
—
Recognition of gross right-of-use asset and lease liability upon adoption of FASB ASU No. 2016-02:
Right-of-use asset 66,231 — —
Lease liability 66,247 — —

OCWEN FINANCIAL CORPORATION AND SUBSIDIARIES
CONSOLIDATED STATEMENTS OF CASH FLOWS – (continued)
(Dollars in thousands)
The accompanying notes are an integral part of these consolidated financial statements
F-10
For the Years Ended December 31,
2019 2018 2017
Supplemental business acquisition information
Fair value of assets acquired $ 262 $ 1,192,155 $ —
Fair value of liabilities assumed 643 769,723 —
Total identifiable net assets acquired (381 ) 422,432 —
Bargain purchase gain related to acquisition of PHH (381 ) 64,036 —
Total consideration — 358,396 —
Less: Cash consideration paid by PHH — (325,000 ) —
Cash consideration paid by Ocwen — 33,396 —
Cash acquired from PHH — 98,088 —
Net cash acquired by Ocwen $ — $ 64,692 $ —
The following table provides a reconciliation of cash and restricted cash reported within the consolidated balance sheets
that sums to the total of the same such amounts reported in the consolidated statements of cash flows:
December 31,
2019 December 31,
2018 December 31,
2017
Cash and cash equivalents $ 428,339 $ 329,132 $ 259,655
Restricted cash and equivalents:
Debt service accounts 23,276 26,626 33,726
Other restricted cash 40,725 41,252 9,179
Total cash, cash equivalents and restricted cash reported in the statements of cash flows $ 492,340
$ 397,010
$ 302,560

F-11
OCWEN FINANCIAL CORPORATION AND SUBSIDIARIES
NOTES TO CONSOLIDATED FINANCIAL STATEMENTS
DECEMBER 31, 2019, 2018 AND 2017
(Dollars in thousands, except per share data and unless otherwise indicated)
Note 1 — Organization, Business Environment, Basis of Presentation and Significant Accounting Policies
Organization
Ocwen Financial Corporation (NYSE: OCN) (Ocwen, we, us and our) is a non-bank mortgage servicer and originator
providing solutions through its primary operating subsidiaries, PHH Mortgage Corporation (PMC) and Liberty Home
Equity Solutions, Inc. (Liberty). We are headquartered in West Palm Beach, Florida with offices in the United States (U.S.)
and the United States Virgin Islands (USVI) and operations in India and the Philippines. Ocwen is a Florida corporation
organized in February 1988.
Ocwen directly or indirectly owns all of the outstanding common stock of its operating subsidiaries, including PMC
since its acquisition on October 4, 2018, Liberty, Ocwen Financial Solutions Private Limited (OFSPL) and Ocwen USVI
Services, LLC (OVIS).
We perform servicing activities related to our own MSR portfolio (primary) and on behalf of other servicers
(subservicing), the largest being New Residential Investment Corp. (NRZ), and investors (primary and master servicing),
including the Federal National Mortgage Association (Fannie Mae) and Federal Home Loan Mortgage Corporation (Freddie
Mac) (collectively, the GSEs), the Government National Mortgage Association (Ginnie Mae) and private-label
securitizations (non-Agency). As a subservicer or primary servicer, we may be required to make advances for certain
property tax and insurance premium payments, default and property maintenance payments and principal and interest
payments on behalf of delinquent borrowers to mortgage loan investors before recovering them from borrowers. Most, but
not all, of our subservicing agreements provide for us to be reimbursed for any such advances by the owner of the servicing
rights. Advances made by us as primary servicer are generally recovered from the borrower or the mortgage loan investor.
As master servicer, we collect mortgage payments from primary servicers and distribute the funds to investors in the
mortgage-backed securities. To the extent the primary servicer does not advance the scheduled principal and interest, as
master servicer we are responsible for advancing the shortfall, subject to certain limitations.
We originate, sell and securitize conventional (conforming to the underwriting standards of Fannie Mae or Freddie
Mac; collectively referred to as Agency loans) and government-insured (Federal Housing Administration (FHA) or
Department of Veterans Affairs (VA)) forward mortgages, generally servicing retained. The GSEs or Ginnie Mae guarantee
these mortgage securitizations. We originate HECM loans, or reverse mortgages, that are mostly insured by the FHA and are
an approved issuer of HMBS that are guaranteed by Ginnie Mae.
We had a total of approximately 5,300 employees at December 31, 2019 of which approximately 3,400 were located in
India and approximately 400 were based in the Philippines. Our operations in India and the Philippines primarily provide
internal support services, principally to our loan servicing business and our corporate functions. Of our foreign-based
employees, nearly 80% were engaged in supporting our loan servicing operations as of December 31, 2019.
Business Environment
We are facing certain challenges and uncertainties that could have significant adverse effects on our business, financial
condition, liquidity and results of operations. The ability of management to appropriately address these challenges and
uncertainties in a timely manner is critical to our ability to operate our business successfully.
Losses have significantly eroded stockholders’ equity and weakened our financial condition. Our near-term priority is to
return to sustainable profitability in the shortest timeframe possible within an appropriate risk and compliance environment.
If we execute on our key business initiatives, we believe we will drive stronger financial performance.
First, we must expand our lending business and acquisitions of MSRs that are prudent and well-executed with
appropriate financial return targets to replenish and grow our servicing portfolio.
Second, we must re-engineer our cost structure to go beyond eliminating redundant costs through the integration
process and establish continuous cost improvement as a core strength. Our continuous cost improvement efforts are focused
on leveraging our single servicing platform and technology, optimizing strategic sourcing and off-shore utilization, lean
process design, automation and other technology-enabled productivity enhancements. Our initiatives are targeted at
delivering superior accuracy, cost, speed and customer satisfaction. We believe these steps are necessary to simplify our
operations and drive stronger financial performance.

F-12
Third, we must manage our balance sheet to ensure adequate liquidity, finance our ongoing business needs and provide
a solid platform for executing on our other key business initiatives. Regarding the current maturities of our borrowings, as of
December 31, 2019, we had approximately $1.2 billion of debt outstanding under facilities coming due in 2020. In January
2020, we extended the maturity of our SSTL from December 2020 to May 2022 and we reduced the outstanding balance
from $326.1 million to $200.0 million. Portions of our match funded advance facilities and all of our mortgage loan
warehouse facilities have 364-day terms consistent with market practice. We have historically renewed these facilities on or
before their expiration in the ordinary course of financing our business. We expect to renew, replace or extend all such
borrowings to the extent necessary to finance our business on or prior to their respective maturities consistent with our
historical experience.
Finally, we must fulfill our regulatory commitments and resolve our remaining legal and regulatory matters on
satisfactory terms. See Note 24 — Regulatory Requirements and Note 26 — Contingencies for further information.
Our debt agreements contain various qualitative and quantitative events of default provisions that include, among other
things, noncompliance with covenants, breach of representations, or the occurrence of a material adverse change. If a lender
were to allege an event of default and we are unable to avoid, remedy or secure a waiver of such alleged default, we could
be subject to adverse actions by our lenders that could have a material adverse impact on us. In addition, PMC and Liberty
are parties to seller/servicer agreements and/or subject to guidelines and regulations (collectively, seller/servicer obligations)
with one or more of the GSEs, the Department of Housing and Urban Development (HUD), FHA, VA and Ginnie Mae. To
the extent these requirements are not met or waived, the applicable agency may, at its option, utilize a variety of remedies
including requirements to provide certain information or take actions at the direction of the applicable agency, requirements
to deposit funds as security for our obligations, sanctions, suspension or even termination of approved seller/servicer status,
which would prohibit future originations or securitizations of forward or reverse mortgage loans or servicing for the
applicable agency. Any of these actions could have a material adverse impact on us. See Note 14 — Borrowings, Note 24 —
Regulatory Requirements and Note 26 — Contingencies for further information.
In certain recent periods, Ocwen has incurred significant losses as a result of accelerated declines in the fair value of our
MSRs due to interest rate decreases. Further interest rate decreases, prepayment speed increases and changes to other fair
value inputs or assumptions could result in further fair value declines and hamper our ability to return to profitability.
Starting in September 2019, we have implemented a hedging strategy to partially offset the changes in fair value of our net
MSR portfolio. See Note 17 — Derivative Financial Instruments and Hedging Activities for further information.
In addition, we have exposure to concentration risk and client retention risk as a result of our relationship with NRZ,
which accounted for 56% of the UPB in our servicing portfolio as of December 31, 2019. Currently, subject to proper notice
(generally 180 days’ notice), the payment of termination and loan deboarding fees and certain other provisions, NRZ has
rights to terminate these agreements for convenience. Because of the large percentage of our servicing business that is
represented by agreements with NRZ, if NRZ exercised all or a significant portion of these termination rights, we might
need to right-size or restructure certain aspects of our servicing business as well as the related corporate support functions.
On February 20, 2020, we received a notice of termination from NRZ with respect to the subservicing agreement between
NRZ and PMC, which accounted for 20% of our servicing portfolio UPB at December 31, 2019. See Note 28 — Subsequent
Events.
Our ability to execute on our key initiatives is not certain and is dependent on the successful execution of several
complex actions, including our ability to grow our lending business and acquire MSRs with appropriate financial return
targets, our ability to acquire, maintain and grow profitable client relationships, our ability to maintain relationships with the
GSEs, Ginnie Mae, FHFA, lenders and regulators, our ability to implement further organizational redesign and cost
reduction, as well as the absence of significant unforeseen costs, including regulatory or legal costs, that could negatively
impact our return to sustainable profitability, and our ability to extend, renew or replace our debt agreements in the ordinary
course of business. There can be no assurances that the desired strategic and financial benefits of these actions will be
realized.
Basis of Presentation and Significant Accounting Policies
Consolidation and Basis of Presentation
Principles of Consolidation
Our consolidated financial statements have been prepared in conformity with accounting principles generally accepted
in the U.S. (GAAP).
Our consolidated financial statements include the accounts of Ocwen, its wholly-owned subsidiaries and any variable
interest entity (VIE) for which we have determined that we are the primary beneficiary. We apply the equity method of
accounting to investments when the entity is not a VIE, and we are able to exercise significant influence, but not control,

F-13
over the policies and procedures of the entity but own 50% or less of the voting securities. Our statements of operations and
consolidated balance sheets include the accounts and results of PHH Corporation and its subsidiaries since acquisition on
October 4, 2018. See Note 2 — Business Acquisition for additional information.
We have eliminated intercompany accounts and transactions in consolidation.
Foreign Currency Translation
The functional currency of each of our foreign subsidiaries is the U.S. dollar. Re-measurement adjustments of foreign-
denominated amounts to U.S. dollars are included in Other, net in our consolidated statements of operations.
Reclassifications
Certain amounts in the consolidated statements of operations for 2018 and 2017 have been reclassified to conform to
the current year presentation. The reclassifications had no impact on net income (loss) or total revenue in our consolidated
statements of operations and no impact on operating, investing and financing cash flows in our consolidated statements of
cash flows.
We now present Reverse mortgage revenue, net as a separate revenue line item on the face of the statements of
operations to provide a further breakdown of Other revenue, net and provide greater transparency on the performance
associated with our portfolio of HECM loans, net of the HMBS-related borrowings that are both measured at fair value, as
follows:
Years ended December 31,
2018 2017
Statements of Operations
Revenue
From Gain on loans held for sale, net $ 40,407 $ 46,219
From Other revenue, net 22,577 31,517
From Servicing and subservicing fees (2,747 ) (2,221 )
To Reverse mortgage revenue, net (New line item) 60,237 75,515
Total revenue — —
In addition to the above reclassifications, we have made the following presentation changes:
• In the consolidated statements of operations, we now separately present MSR valuation adjustments, net from Total
expenses, renamed “Operating expenses”. The purpose of this reclassification is to separately present fair value
changes from operating expenses and provide additional insights on the nature of our performance.
• Within the Other income (expense), net on the consolidated statements of operations, we now present the expense
related to the pledged MSR liability recorded at fair value separately from Interest expense. The purpose of this
reclassification is to improve transparency between the interest expense associated with interest-bearing liabilities
recorded on an accrual basis and expenses that are attributable to the pledged MSR liability recorded at fair value.
The pledged MSR liability is the obligation to deliver NRZ all contractual cash flows associated with the
underlying MSR that did not meet the requirements for sale accounting treatment. The Pledged MSR liability
expense reflects net servicing fee remittance and fair value changes. In the Supplemental cash flow section of the
consolidated statements of cash flows, as a result of this reclassification of Pledged MSR liability expense from
interest expense, we have reclassified $171.7 million and $236.3 million of Pledged MSR liability expense out of
Interest paid in 2018 and 2017, respectively.
• Within the Total liabilities section of our consolidated balance sheet at December 31, 2018, we reclassified
borrowings with an outstanding balance of $65.5 million from Other financing liabilities to Other secured
borrowings. Effective with this reclassification, all amounts included in Other financing liabilities represent secured
financing as a result of sale transactions that do not meet the requirements for sale accounting treatment.
• Within the Cash flows from financing activities section of our consolidated statements of cash flows, we
reclassified repayments of our SSTL from the Repayments of mortgage loan warehouse facilities and other secured
borrowings line item to a new line item (Repayment of SSTL borrowings).
Use of Estimates and Assumptions
The preparation of financial statements in conformity with GAAP requires that management make estimates and
assumptions that affect the reported amounts of assets and liabilities and disclosure of contingent assets and liabilities at the
date of the financial statements and the reported amounts of revenues and expenses during the reporting period. Such
F-14
estimates and assumptions include, but are not limited to fair value measurements, allowance for losses, income taxes,
indemnification obligations, litigation-related obligations, and our going concern evaluation. In developing estimates and
assumptions, management uses all available information; however, actual results could materially differ from those
estimates and assumptions.
Significant Accounting Policies
Cash and cash equivalents
Cash includes both interest-bearing and non-interest-bearing demand deposits with financial institutions that have
original maturities of 90 days or less.
Restricted Cash
Restricted cash includes amounts specifically designated to repay debt, to provide over-collateralization for secured
borrowings and match funded debt facilities, and to provide additional collateral to support certain obligations, including
letters of credit.
Mortgage Servicing Rights
MSRs are assets representing our right to service portfolios of mortgage loans. We retain MSRs on originated or
purchased loans when they are sold in the secondary market. We also acquire MSRs through asset purchases or business
combination transactions. The unpaid principal balance (UPB) of the loans underlying the MSRs is not included on our
consolidated balance sheets. For servicing retained in connection with the securitization of reverse mortgage loans
accounted for as secured financings, we do not recognize an MSR.
All newly acquired or retained MSRs are initially measured at fair value. To the extent any portfolio contract is not
expected to compensate us adequately for performing the servicing, we would recognize a servicing liability. We define
contracts as Agency, government-insured or non-Agency (commonly referred to as non-prime, subprime or private-label
loans) based on their general comparability with regard to servicing guidelines, underwriting standards and borrower risk
characteristics. We identify classes of servicing assets and servicing liabilities based on the availability of market inputs used
in determining their fair value and our methods for managing their risks. Servicing assets are not recognized for
subservicing arrangements entered into with the entity that owns the MSRs.
Subsequent to acquisition, we account for servicing assets and servicing liabilities at fair value, and report changes in
fair value in earnings (MSR valuation adjustments, net) in the period in which the changes occur. Effective January 1, 2018,
we elected fair value accounting for our MSRs previously accounted for using the amortization method, which included
Agency MSRs and government-insured MSRs. Effective with this election, our entire portfolio of MSRs is accounted for
using the fair value measurement method. We recorded a cumulative-effect adjustment of $82.0 million to retained earnings
as of January 1, 2018 to reflect the excess of the fair value over the carrying amount. See Note 9 — Mortgage Servicing for
additional information.
Until December 31, 2017, for servicing assets or liabilities that we previously accounted for using the amortization
method, we amortized the balances in proportion to, and over the period of, estimated net servicing income (if servicing
revenues exceed servicing costs) or net servicing loss (if servicing costs exceed servicing revenues). Estimated net servicing
income is primarily driven by the estimated future cash flows of the underlying mortgage loan portfolio, which, absent new
purchases, declines over time from prepayments and scheduled loan amortization. We adjusted MSR amortization
prospectively in response to changes in estimated projections of future cash flows. We stratified servicing assets or liabilities
based upon one or more of the predominant risk characteristics of the underlying portfolios and assess servicing assets or
liabilities for impairment or increased obligation by determining the difference, if any, between the carrying amount and
estimated fair value at each reporting date. We recognized any impairment, or increased obligation, through a valuation
allowance which was adjusted to reflect subsequent changes in the measurement of impairment and reported in earnings
(MSR valuation adjustments, net) in the period in which the changes occurred. We do not recognize fair value in excess of
the carrying amount of servicing assets for any stratum.
We earn fees for servicing and subservicing mortgage loans. We collect servicing and subservicing fees, generally
expressed as a percent of UPB, from the borrowers’ payments. In addition to servicing and subservicing fees, we also report
late fees, prepayment penalties, float earnings and other ancillary fees as revenue in Servicing and subservicing fees in our
consolidated statements of operations. We recognize servicing and subservicing fees as revenue when the fees are earned,
which is generally when the borrowers’ payments are collected or when loans are modified or liquidated through the sale of
the underlying real estate collateral or otherwise.

F-15
Advances and Match Funded Advances
During any period in which a borrower does not make payments, servicing and subservicing agreements may require
that we advance our own funds to meet contractual principal and interest remittance requirements for the investors, to pay
property taxes and insurance premiums and to process foreclosures. We also advance funds to maintain, repair and market
foreclosed real estate properties on behalf of investors. These advances are made pursuant to the terms of each servicing and
subservicing contract. Each servicing and subservicing contract is associated with specific loans, identified as a pool.
When we make an advance on a loan under each servicing or subservicing contract, we are entitled to recover that
advance either from the borrower, for reinstated and performing loans, or from guarantors (GSEs), insurers (FHA/VA) and
investors, for modified and liquidated loans. Most of our servicing and subservicing contracts provide that the advances
made under the respective agreement have priority over all other cash payments from the proceeds of the loan, and in the
majority of cases, the proceeds of the pool of loans that are the subject of that servicing or subservicing contract. As a result,
we are entitled to repayment from loan proceeds before any interest or principal is paid on the bonds, and in the majority of
cases, advances in excess of loan proceeds may be recovered from pool level proceeds.
We establish an allowance for losses through a charge to earnings (Servicing and origination expense) to the extent we
believe that a portion of advances are uncollectible under the provisions of each servicing contract taking into consideration,
among other factors, probability of cure or modification, length of delinquency and the amount of the advance. We are
generally only obligated to advance funds to the extent that we believe the advances are recoverable from expected proceeds
from the loan. We continually assess collectibility using proprietary cash flow projection models that incorporate a number
of different factors, depending on the characteristics of the mortgage loan or pool, including, for example, estimated time to
a foreclosure sale, estimated costs of foreclosure action, estimated future property tax payments and the estimated value of
the underlying property net of estimated carrying costs, commissions and closing costs.
Under the terms of our subservicing agreements, we are generally reimbursed by our subservicing clients on a monthly
or more frequent basis. For those advances that have been reimbursed, i.e., that are off-balance sheet, if a loss contingency is
probable and reasonably estimable, we recognize a loss contingency accrual for the amount of advances deemed
uncollectible caused by our failure to comply with the subservicing agreements or our servicing practices. We report such
loss contingency within Other liabilities - Liability for indemnification obligations.
Loans Held for Sale
Loans held for sale include forward and reverse mortgage loans that we do not intend to hold until maturity. We report
loans held for sale at either fair value or the lower of cost or fair value computed on an aggregate basis. For loans we
measure at the lower of cost or fair value, we account for any excess of cost over fair value as a valuation allowance and
include changes in the valuation allowance in Other, net, in the consolidated statements of operations in the period in which
the change occurs. For loans that we elected to measure at fair value on a recurring basis, we report changes in fair value in
Gain on loans held for sale, net in the consolidated statements of operations in the period in which the changes occur. These
loans are expected to be sold into the secondary market to the GSEs, into Ginnie Mae guaranteed securitizations or to third-
party investors.
We report any gain or loss on the transfer of loans held for sale in Gain on loans held for sale, net in the consolidated
statements of operations along with the changes in fair value of the loans and the gain or loss on any related derivatives.
When loans are sold or securitized with servicing retained, the gain on sale includes the MSR retained as non-cash proceeds
at the date of sale. We include all changes in loans held for sale and related derivative balances in operating activities in the
consolidated statements of cash flows.
We accrue interest income as earned. We place loans on non-accrual status after any portion of principal or interest has
been delinquent for more than 89 days, or earlier if management determines the borrower is unable to continue performance.
When we place a loan on non-accrual status, we reverse the interest that we have accrued but not yet received. We return
loans to accrual status only when we reinstate the loan and there is no significant uncertainty as to collectability.
Loans Held for Investment
Newly originated reverse residential mortgage loans that are insured by the FHA and pooled into Ginnie Mae
guaranteed securities that we sell into the secondary market with servicing rights retained are classified as loans held for
investment. We have elected to measure these loans at fair value. Loan transfers in these Ginnie Mae securitizations do not
meet the definition of a participating interest and as a result, the transfers of the reverse mortgages do not qualify for sale
accounting. Therefore, we account for these transfers as financings, with the reverse mortgages classified as Loans held for
investment, at fair value, on our consolidated balance sheets, with no gain or loss recognized on the transfer.
We have elected to fair value future draw commitments for HECM loans purchased or originated after December 31,
2018. The estimated fair value is included in Loans held for investment on our consolidated balance sheet with changes in

F-16
fair value recognized in Reverse mortgage revenue, net in our consolidated statement of operations. The value of future
draw commitments for HECM loans purchased or originated before January 1, 2019 is recognized as the draws are
securitized or sold.
Upfront costs and fees related to loans held for investment, including broker fees, are recognized in Reverse mortgage
revenue, net in the statement of operations as incurred and are not capitalized. Premiums on loans purchased via the
correspondent channel are capitalized upon origination because they represent part of the purchase price. However, the loans
are subsequently measured at fair value on a recurring basis.
We record the proceeds from the transfer of assets as secured borrowings (HMBS-related borrowings) in Financing
liabilities and recognize no gain or loss on the transfer. We measure the HECM loans and HMBS-related borrowings at fair
value on a recurring basis. The changes in fair value of the HECM loans and HMBS-related borrowings are included in
Reverse mortgage revenue, net in our consolidated statements of operations. Included in net fair value changes on the
HECM loans and related HMBS borrowings are the net interest income that we expect to be collected on the HECM loans
and the interest expense that we expect to be paid on the HMBS-related borrowings. In addition, reverse mortgage revenue,
net includes the fair value changes of the interest rate lock commitments related to reverse mortgage loans. We report
originations and collections of HECM loans in investing activities in the consolidated statements of cash flows. We report
net fair value gains on HECM loans and the related HMBS borrowings as an adjustment to the net cash provided by or used
in operating activities in the consolidated statements of cash flows. Proceeds from securitizations of HECM loans and
payments on HMBS-related borrowings are included in financing activities in the consolidated statements of cash flows.
Transfers of Financial Assets and MSRs
We securitize, sell and service forward and reverse residential mortgage loans. Securitization transactions typically
involve the use of VIEs and are accounted for either as sales or as secured financings. We typically retain economic interests
in the securitized assets in the form of servicing rights and obligations. In order to efficiently finance our assets and
operations and create liquidity, we may sell servicing advances, MSRs or the right to receive certain servicing fees relating
to MSRs (Rights to MSRs).
In order to determine whether or not a VIE is required to be consolidated, we consider our ongoing involvement with
the VIE. In circumstances where we have both the power to direct the activities that most significantly impact the
performance of the VIE and the obligation to absorb losses or the right to receive benefits that could be significant, we
would conclude that we would consolidate the entity, which precludes us from recording an accounting sale in connection
with the transfer of the financial assets. In the case of a consolidated VIE, we continue to report the underlying residential
mortgage loans or servicing advances, and we record the securitized debt on our consolidated balance sheet.
In the case of transfers where either one or both of the power or economic criteria above are not met, we evaluate
whether a sale has occurred for accounting purposes. In order to recognize a sale, the transferred assets must be legally
isolated, not be constrained by restrictions from further transfer and be deemed to be beyond our control. If the transfer does
not meet any of these three criteria, the transaction is accounted for consistent with a secured financing. In certain situations,
we may have continuing involvement in transferred loans through our retained servicing. Transactions involving retained
servicing would still be eligible for sale accounting, as we have ceded effective control of these loans to the purchaser.
Subsequent to the determination that a transaction does not meet the accounting sale criteria, we may determine that we
meet the criteria. In the event we subsequently meet the accounting sale criteria, we derecognize the transferred assets and
related liabilities.
In connection with the Ginnie Mae early buyout program, our agreements provide either that: (a) we have the right, but
not the obligation, to repurchase previously transferred mortgage loans under certain conditions, including the mortgage
loans becoming eligible for pooling under a program sponsored by Ginnie Mae; or (b) we have the obligation to repurchase
previously transferred mortgage loans that have been subject to a successful trial modification before any permanent
modification is made. Once these conditions are met, we have effectively regained control over the mortgage loan(s), and
under GAAP, must re-recognize the loans on our consolidated balance sheets and establish a corresponding repurchase
liability. With respect to those loans that we have the right, but not the obligation, to repurchase under the applicable
agreement, this requirement applies regardless of whether we have any intention to repurchase the loan. We re-recognize the
loans in Other assets and a corresponding liability in Other liabilities.
In the case of transfers of MSRs and Rights to MSRs where we retain the right to subservice, we defer any related gain
or loss and amortize the balance over the life of the subservicing agreement.
Gains or losses on off-balance sheet securitizations take into consideration any retained interests, including servicing
rights and representation and warranty obligations, both of which are initially recorded at fair value at the date of sale in
Gain on loans held for sale, net, in our consolidated statements of operations.

F-17
Premises and Equipment
We report premises and equipment at cost and, except for land, depreciate them over their estimated useful lives on a
straight-line basis as follows:
Computer software 2 – 3 years
Computer hardware 3 years
Buildings 40 years
Leasehold improvements Term of the lease not to exceed useful life
Right of Use (ROU) assets Term of the lease not to exceed useful life
Furniture and fixtures 5 years
Office equipment 5 years
Litigation
We monitor our legal matters, including advice from external legal counsel, and periodically perform assessments of
these matters for potential loss accrual and disclosure. We establish a liability for settlements, judgments on appeal and filed
and/or threatened claims for which we believe that it is probable that a loss has been or will be incurred and the amount can
be reasonably estimated. We recognize legal costs associated with loss contingencies in Professional services expense in the
consolidated statement of operations as incurred.
Stock-Based Compensation
We initially measure the cost of employee services received in exchange for a stock-based award as the fair value of the
award on the grant date. For awards which must be settled in cash and are therefore classified as liabilities rather than equity
in the consolidated balance sheet, fair value is subsequently remeasured and fair value changes are reported as compensation
expense at each reporting date. For equity awards with a service condition, we recognize the cost as compensation expense
ratably over the vesting period. For equity awards with a market condition, we recognize the cost as compensation expense
ratably over the expected life of the option that is derived from an options pricing model. When equity awards with a market
condition meet their vesting requirements, any unrecognized compensation at the vesting date is recognized ratably over the
vesting period. For equity awards with both a market condition and a service condition for vesting, we recognize cost as
compensation expense over the requisite service period for each tranche of the award using the graded-vesting method.
Income Taxes
We file consolidated U.S. federal income tax returns. We allocate consolidated income tax among all subsidiaries
included in the consolidated return as if each subsidiary filed a separate return or, in certain cases, a consolidated return.
We account for income taxes using the asset and liability method, which requires the recognition of deferred tax
liabilities and assets for the expected future tax consequences of temporary differences between the carrying amounts and
the tax bases of assets and liabilities. Additionally, we adjust deferred taxes to reflect estimated tax rate changes. We conduct
periodic evaluations to determine whether it is more likely than not that some or all of our deferred tax assets will not be
realized. Among the factors considered in this evaluation are estimates of future earnings, the future reversal of temporary
differences and the impact of tax planning strategies that we can implement if warranted. We provide a valuation allowance
for any portion of our deferred tax assets that, more likely than not, will not be realized. We recognize the financial
statement benefit of a tax position only after determining that the relevant tax authority would more likely than not sustain
the position following an audit. For tax positions meeting the more-likely-than-not threshold, the amount recognized in the
consolidated financial statements is the largest benefit that has a greater than 50 percent likelihood of being realized upon
ultimate settlement with the relevant tax authority. We recognize interest and penalties related to income tax matters in
Income tax expense.
In December 2017, the Securities and Exchange Commission Staff issued Staff Accounting Bulletin (SAB) 118 (as
further clarified by FASB ASU 2018-05, Income Taxes (Topic 740): Amendments to SEC Paragraphs Pursuant to SEC Staff
Accounting Bulletin No. 118), which provides guidance on accounting for the income tax effects of the Tax Cuts and Jobs
Act (Tax Act) signed into law by the President of the United States on December 22, 2017. SAB 118 provides a
measurement period that should not extend beyond one year from the Tax Act enactment date for companies to complete the
accounting under Accounting Standards Codification (ASC) 740, Income Taxes. In accordance with SAB 118, a company
must reflect the income tax effects of those aspects of the Tax Act for which the accounting under ASC 740 is complete. To
the extent that a company's accounting for certain income tax effects of the Tax Act is incomplete but it is able to determine
a reasonable estimate, it must record a provisional estimate in the financial statements and should continue to apply ASC
740 on the basis of the provisions of the tax laws that were in effect immediately before the enactment of the Tax Act. We

F-18
adopted the guidance of SAB 118 as of December 31, 2017. We finalized our provisional amounts recognized under SAB
118 in the fourth quarter of 2018. See Note 20 — Income Taxes for additional information.
Basic and Diluted Earnings per Share
We calculate basic earnings per share based upon the weighted average number of shares of common stock outstanding
during the year. We calculate diluted earnings per share based upon the weighted average number of shares of common
stock outstanding and all dilutive potential common shares outstanding during the year. The computation of diluted earnings
per share includes the estimated impact of the exercise of the outstanding options to purchase common stock using the
treasury stock method.
Going Concern
In accordance with FASB ASC 205-40, Presentation of Financial Statements - Going Concern, we evaluate whether
there are conditions that are known or reasonably knowable, such as those discussed in the “Business Environment” section,
that raise substantial doubt about our ability to continue as a going concern within one year after the date that our financial
statements are issued.
Our financial statements have been prepared on a going concern basis, which contemplates the realization of assets and
the satisfaction of liabilities in the normal course of business.
The assessment of our ability to meet our future obligations is inherently judgmental, subjective and susceptible to
change. Our assessment considers information including, but not limited to, our financial condition, liquidity sources,
obligations coming due within one year after the financial statements are issued, funds necessary to maintain current
operations and any negative financial trends or other indicators of possible financial difficulty, including adverse regulatory
or legal proceedings, adverse counterparty actions or rating agency decisions, and our client concentration.
Based on our evaluation, we have determined that there are no conditions that are known or reasonably knowable that
raise substantial doubt about our ability to continue as a going concern within one year after the date that our financial
statements for the year ended December 31, 2019 are issued.
Accounting Standards Adopted in 2019
Leases (ASU 2016-02, ASU 2018-10, ASU 2018-11 and ASU 2019-01)
This ASU requires a lessee to recognize right-of-use (ROU) assets and lease liabilities on the balance sheet, regardless
of whether the lease is classified as a finance or operating lease.
We adopted the new leasing guidance on January 1, 2019, and we elected practical expedients permitted by the new
standard which provided us transition relief when assessing leases that commenced prior to the adoption date, including
determining whether existing contracts are or contain leases, the classification of such leases as operating or financing, and
the accounting for initial direct costs. No adjustments were made to comparative prior periods.
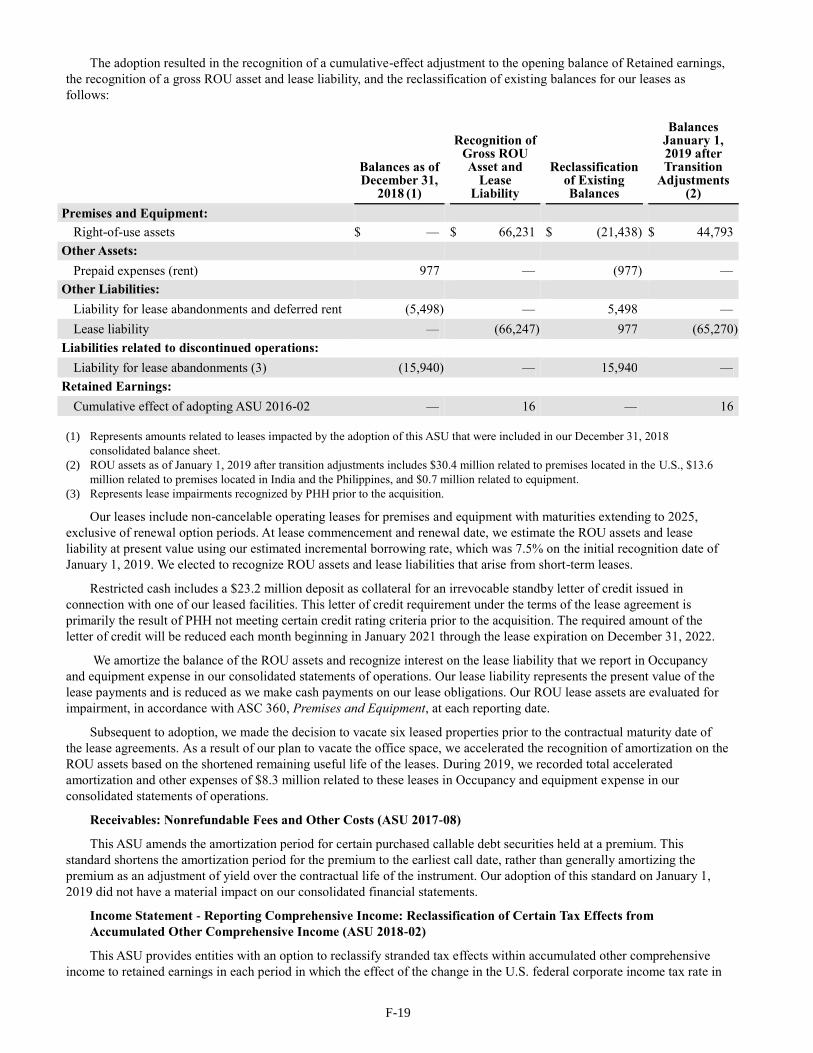
F-19
The adoption resulted in the recognition of a cumulative-effect adjustment to the opening balance of Retained earnings,
the recognition of a gross ROU asset and lease liability, and the reclassification of existing balances for our leases as
follows:
Balances as of December 31,
2018 (1)
Recognition of Gross ROU Asset and
Lease Liability
Reclassification of Existing Balances
Balances January 1, 2019 after Transition
Adjustments (2)
Premises and Equipment:
Right-of-use assets $ — $ 66,231 $ (21,438 ) $ 44,793
Other Assets:
Prepaid expenses (rent) 977 — (977 ) —
Other Liabilities:
Liability for lease abandonments and deferred rent (5,498 ) — 5,498 —
Lease liability — (66,247 ) 977 (65,270 )
Liabilities related to discontinued operations:
Liability for lease abandonments (3) (15,940 ) — 15,940 —
Retained Earnings:
Cumulative effect of adopting ASU 2016-02 — 16 — 16
(1) Represents amounts related to leases impacted by the adoption of this ASU that were included in our December 31, 2018
consolidated balance sheet.
(2) ROU assets as of January 1, 2019 after transition adjustments includes $30.4 million related to premises located in the U.S., $13.6
million related to premises located in India and the Philippines, and $0.7 million related to equipment.
(3) Represents lease impairments recognized by PHH prior to the acquisition.
Our leases include non-cancelable operating leases for premises and equipment with maturities extending to 2025,
exclusive of renewal option periods. At lease commencement and renewal date, we estimate the ROU assets and lease
liability at present value using our estimated incremental borrowing rate, which was 7.5% on the initial recognition date of
January 1, 2019. We elected to recognize ROU assets and lease liabilities that arise from short-term leases.
Restricted cash includes a $23.2 million deposit as collateral for an irrevocable standby letter of credit issued in
connection with one of our leased facilities. This letter of credit requirement under the terms of the lease agreement is
primarily the result of PHH not meeting certain credit rating criteria prior to the acquisition. The required amount of the
letter of credit will be reduced each month beginning in January 2021 through the lease expiration on December 31, 2022.
We amortize the balance of the ROU assets and recognize interest on the lease liability that we report in Occupancy
and equipment expense in our consolidated statements of operations. Our lease liability represents the present value of the
lease payments and is reduced as we make cash payments on our lease obligations. Our ROU lease assets are evaluated for
impairment, in accordance with ASC 360, Premises and Equipment, at each reporting date.
Subsequent to adoption, we made the decision to vacate six leased properties prior to the contractual maturity date of
the lease agreements. As a result of our plan to vacate the office space, we accelerated the recognition of amortization on the
ROU assets based on the shortened remaining useful life of the leases. During 2019, we recorded total accelerated
amortization and other expenses of $8.3 million related to these leases in Occupancy and equipment expense in our
consolidated statements of operations.
Receivables: Nonrefundable Fees and Other Costs (ASU 2017-08)
This ASU amends the amortization period for certain purchased callable debt securities held at a premium. This
standard shortens the amortization period for the premium to the earliest call date, rather than generally amortizing the
premium as an adjustment of yield over the contractual life of the instrument. Our adoption of this standard on January 1,
2019 did not have a material impact on our consolidated financial statements.
Income Statement - Reporting Comprehensive Income: Reclassification of Certain Tax Effects from
Accumulated Other Comprehensive Income (ASU 2018-02)
This ASU provides entities with an option to reclassify stranded tax effects within accumulated other comprehensive
income to retained earnings in each period in which the effect of the change in the U.S. federal corporate income tax rate in

F-20
the Tax Act (or portion thereof) is recorded. Our adoption of this standard on January 1, 2019 did not have a material impact
on our consolidated financial statements.
Accounting Standards Issued but Not Adopted in 2019
Financial Instruments - Credit Losses: Measurement of Credit Losses on Financial Instruments (ASU 2016-13
and ASU 2019-04)
This ASU will require more timely recording of credit losses on loans and other financial instruments. This standard
aligns the accounting with the economics of lending by requiring banks and other lending institutions to immediately record
the full amount of credit losses that are expected in their loan portfolios. The new guidance requires an organization to
measure all expected credit losses for financial assets and certain off-balance sheet credit exposures at the reporting date
based on historical experience, current conditions, and reasonable and supportable forecasts. This standard requires
enhanced disclosures related to the significant estimates and judgments used in estimating credit losses, as well as the credit
quality and underwriting standards of an organization’s portfolio. Additionally, the new guidance amends the accounting for
credit losses on available-for-sale debt securities and purchased financial assets with credit deterioration.
We will adopt this standard on January 1, 2020 by applying the guidance at the adoption date with a cumulative-effect
adjustment to the opening balance of retained earnings. As permitted by this standard, we will make an irrevocable fair
value election for certain financial instruments within the scope of the standard, including the future draw commitments for
HECM loans that are not accounted at fair value (i.e., those purchased or originated before January 1, 2019). We expect to
record a $47.0 million cumulative-effect transition gain adjustment (before income taxes) to retained earnings as of January
1, 2020 to reflect the fair value of these financial instruments. We do not expect any significant tax effect of this adjustment
as the increase in the deferred tax liability is expected to be offset by a corresponding decrease to the valuation allowance.
We currently do not expect the transition adjustment related to financial instruments for which we are not electing the fair
value option to result in a significant adjustment to the opening balance of retained earnings.
Fair Value Measurement: Disclosure Framework - Changes to the Disclosure Requirements for Fair Value
Measurement (ASU 2018-13)
This ASU modifies the disclosure requirements for fair value measurements in FASB ASC Topic 820, Fair Value
Measurement. The main provisions in this ASU include removal of the following disclosure requirements: 1) the amount of
and reasons for transfers between Level 1 and Level 2 of the fair value hierarchy, 2) the policy for timing of transfers
between levels and 3) the valuation processes for Level 3 fair value measurements. This standard adds disclosure
requirements to report the changes in unrealized gains and losses for the period included in other comprehensive income for
recurring Level 3 fair value measurements held at the end of the reporting period, and for certain unobservable inputs an
entity may disclose other quantitative information in lieu of the weighted average if the entity determines that other
quantitative information would be a more reasonable and rational method to reflect the distribution of unobservable inputs
used to develop Level 3 fair value measurements.
Our adoption of this standard on January 1, 2020 did not have a material impact on our consolidated financial
statements. The amendments on changes in unrealized gains and losses, the range and weighted average of significant
unobservable inputs used to develop Level 3 fair value measurements, and the narrative description of measurement
uncertainty will be applied prospectively for only the most recent interim or annual period presented in the initial fiscal year
of adoption. All other amendments will be applied retrospectively to all periods presented upon their effective date.
Intangibles - Goodwill and Other - Internal-Use Software: Customer’s Accounting for Implementation Costs
Incurred in a Cloud Computing Arrangement That Is a Service Contract (ASU 2018-15)
This ASU aligns the requirements for capitalizing implementation costs incurred in a hosting arrangement that is a
service contract with the requirements for capitalizing implementation costs incurred to develop or obtain internal-use
software (and hosting arrangements that include an internal use software license). The accounting for the service element of
a hosting arrangement that is a service contract is not affected by the amendments in this ASU. The amendments in this ASU
require an entity (customer) in a hosting arrangement that is a service contract to follow the guidance to determine which
implementation costs to capitalize as an asset related to the service contract and which costs to expense. The amendments in
this ASU require the entity (customer) to expense the capitalized implementation costs of a hosting arrangement that is a
service contract over the term of the hosting arrangement. The amendments in this ASU also require the entity to present the
expense related to the capitalized implementation costs in the same line item in the statement of operations as the fees
associated with the hosting element (service) of the arrangement and classify payments for capitalized implementation costs
in the statement of cash flows in the same manner as payments made for fees associated with the hosting element.
Upon adoption of this standard on January 1, 2020, we elected to apply the amendments in this ASU prospectively to all
implementation costs incurred subsequent to that date. We do not anticipate that our adoption of this standard will have a
material impact on our consolidated financial statements.
F-21
Compensation - Retirement Benefits - Defined Benefit Plans: Disclosure Framework - Changes to the Disclosure
Requirements for Defined Benefit Plans (ASU 2018-14)
This ASU modifies the disclosure requirements for defined benefit plans in FASB ASC Subtopic 715-20,
Compensation-Retirement Benefits-Defined Benefit Plans-General. The main provisions in this ASU include removal of the
following disclosure requirements: 1) the amounts in accumulated other comprehensive income expected to be recognized
as components of net periodic benefit cost over the next fiscal year, 2) the amount and timing of plan assets expected to be
returned to the employer, 3) related party disclosures about the amount of future annual benefits covered by insurance and
annuity contracts and significant transactions between the employer or related parties and the plan, and 4) the effects of a
one-percentage-point change in assumed health care cost trend rates on the (a) aggregate of the service and interest cost
components of net periodic benefit costs and (b) benefit obligation for postretirement health care benefits.
This ASU adds disclosure requirements to report 1) the weighted-average interest crediting rates for cash balance plans
and other plans with promised interest crediting rates and 2) an explanation of the reasons for significant gains and losses
related to changes in the benefit obligation for the period. The ASU clarifies disclosure requirements in paragraph 715-20-
50-3, which state that the 1) projected benefit obligation (PBO) and fair value of plan assets for plans with PBOs in excess
of plan assets and 2) accumulated benefit obligation (ABO) and fair value of plan assets for plans with ABOs in excess of
plan assets should be disclosed for defined benefit plans.
Our adoption of this standard on January 1, 2020 did not have a material impact on our consolidated financial
statements. Upon adoption, we elected to apply the amendments in this ASU prospectively.
Note 2 — Business Acquisition
On October 4, 2018, we completed our acquisition of PHH, a non-bank servicer with established servicing and origination
recapture capabilities. As a result of the acquisition, PHH became a wholly owned subsidiary of Ocwen.
The acquisition has been accounted for under the acquisition method of accounting pursuant to ASC 805, Business
Combinations. Assets acquired and liabilities assumed are recorded at their fair value as of the date of acquisition based on
management’s estimates using currently available information. The results of PHH operations are included in Ocwen’s
consolidated statements of operations from the date of acquisition. For U.S. income tax purposes, the acquisition of PHH is
treated as a stock purchase.
The aggregate consideration paid to the former holders of PHH common stock was $358.4 million in cash and was funded
by a combination of PHH cash on hand of $325.0 million and Ocwen cash on hand of $33.4 million. At the closing, there were
32,581,485 shares of PHH common stock, par value $0.01, outstanding, all of which were converted into the right to receive
$11.00 in cash per share. In connection with the acquisition, all outstanding options to purchase PHH common stock and all
PHH equity awards with performance-based vesting conditions were cancelled without any consideration or cash payment. All
other PHH equity awards were cancelled in exchange for a cash payment equal to $11.00 per share underlying the award.
We recognized a bargain purchase gain, net of tax, of $63.7 million ($64.0 million in 2018) in connection with the
acquisition. The bargain purchase gain results from the fair value of PHH’s net assets exceeding the purchase price we paid.
The purchase price we negotiated contemplated that PHH would incur losses after the acquisition date. To the extent those
losses are realized, they are included in our consolidated statements of operations.
Costs incurred in connection with the transaction are expensed as incurred and are reported in Professional services in the
consolidated statements of operations. Such costs were $13.7 million during 2018.
Purchase Price Allocation
The purchase price allocation provided in the table below reflects the final determination of the fair value of assets
acquired and liabilities assumed in the acquisition of PHH, with the excess of total identifiable net assets over total
consideration paid recorded as a bargain purchase gain. Independent valuation specialists conducted analyses to assist
management in determining the fair value of certain acquired assets and assumed liabilities. Management is responsible for
these third-party valuations and appraisals. The methodologies that we use and key assumptions that we made to estimate the
fair value of the acquired assets and assumed debt are described in Note 5 — Fair Value.

F-22
Purchase Price Allocation October 4,
2018 Adjustments Final
Cash $ 423,088 $ — $ 423,088
Restricted cash 38,813 — 38,813
MSRs 518,127 — 518,127
Advances 96,163 (96 ) 96,067
Loans held for sale 42,324 358 42,682
Receivables 46,838 — 46,838
Premises and equipment 15,203 — 15,203
Real estate owned (REO) 3,289 — 3,289
Other assets 6,293 — 6,293
Assets related to discontinued operations 2,017 — 2,017
Financing liabilities (MSRs pledged, at fair value) (481,020 ) — (481,020 )
Other secured borrowings (27,594 ) — (27,594 )
Senior notes (Senior unsecured notes) (120,624 ) — (120,624 )
Accrued legal fees and settlements (9,960 ) — (9,960 )
Other accrued expenses (36,889 ) — (36,889 )
Loan repurchase and indemnification liability (27,736 ) — (27,736 )
Unfunded pension liability (9,815 ) — (9,815 )
Other liabilities (34,131 ) (643 ) (34,774 )
Liabilities related to discontinued operations (21,954 ) — (21,954 )
Total identifiable net assets 422,432 (381 ) 422,051
Total consideration paid to seller (358,396 ) — (358,396 )
Bargain purchase gain $ 64,036 $ (381 ) $ 63,655
Post-Acquisition Results of Operations
The following table presents the results of operations of PHH that are included in our consolidated statements of operations
from the acquisition date of October 4, 2018 through December 31, 2018:
Revenues $ 72,487
Expenses 84,877
Other income (expense) (19,132 )
Income tax benefit (6,711 )
Net loss from continuing operations $ (24,811 )
Pro Forma Results of Operations (Unaudited)
The following table presents supplemental pro forma information for Ocwen as if the PHH Acquisition occurred on
January 1, 2017. Pro forma adjustments include:
• Increase (decrease) in MSR valuation adjustments, net of $24.4 million and $(16.9) million in 2018 and 2017,
respectively, to conform the accounting for MSRs to the valuation policies of Ocwen related to acquired MSRs;
• Adjust interest expense for a total net impact of $30.6 million and $(73.8) million in 2018 and 2017, respectively. The
pro forma adjustments primarily pertain to fair value adjustments of $31.4 million and $(79.3) million in 2018 and
2017, respectively, related to the assumed MSR secured liability using valuation assumptions consistent with Ocwen's
methodology;
• Report the bargain purchase gain of $63.7 million as if the acquisition had occurred in 2017 rather than 2018;
• Report Ocwen and PHH acquisition-related charges of $18.5 million for professional services as if they had been
incurred in 2017 rather than 2018;
• Adjust depreciation expense to amortize internally developed software acquired from PHH on a straight-line basis
based on a useful life of three years;
• Adjust revenue for a total net increase of $120.6 million and $134.6 million in 2018 and 2017, respectively, which
primarily include adjusting servicing and subservicing fees for $127.7 million and $97.0 million in 2018 and 2017,

F-23
respectively, to gross up activity related to PHH MSRs sold accounted for as secured borrowings consistent with
Ocwen’s presentation. The offset to these adjustments are interest income and interest expense, with no net effect on
earnings.
• Income tax benefit of $0.3 million and $0.2 million in 2018 and 2017, respectively, to record lower 2018 current
federal tax under the new base erosion and anti-abuse tax (BEAT) provision of the Tax Act assuming Ocwen and PHH
would file a consolidated federal tax return beginning January 1, 2017 and the benefit of the additional acquisition-
related charges as if they had been incurred in 2017, based on management’s estimate of the blended applicable
statutory tax rates and observing the continued need for a valuation allowance.
2018 2017
(Unaudited) (Unaudited)
Revenues $ 1,305,972 $ 1,785,408
Loss from continuing operations, net of tax attributable to Ocwen common stockholders $ (201,382 ) $ (356,824 )
The pro forma consolidated results presented above are not indicative of what Ocwen’s consolidated results would have
been had we completed the acquisition on the date indicated due to a number of factors, including but not limited to expected
reductions in servicing, origination and overhead costs through the realization of targeted cost synergies and improved
economies of scale, the impact of incremental costs to integrate the two companies and differences in servicing practices and
cost structures between Ocwen and PHH. In addition, the pro forma consolidated results do not purport to project combined
future operating results of Ocwen and PHH nor do they reflect the expected realization of any cost savings associated with the
acquisition of PHH.
Discontinued Operations
In November 2016, PHH announced its plan to exit the private label solutions (PLS) business, and in February 2017, PHH
announced its intention to operate as a smaller business that is focused solely on subservicing and portfolio retention services,
and exit the Real Estate channel. As a result, PHH would exit the PLS business through the run-off of operations, and exit the
Real Estate channel through the sale of certain assets of PHH Home Loans, LLC (PHH Home Loans) and its subsidiaries and
subsequent run-off of the operations. Those exit activities were substantially complete prior to our acquisition of PHH, and as
such, the results of PLS and Real Estate have been presented as discontinued operations in the consolidated statement of
operations and consolidated statement of comprehensive income (loss), and are excluded from continuing operations and
segment results for the post-acquisition period.
Results of Operations
The results of discontinued operations for the post-acquisition period (October 4, 2018, through December 31, 2018) are
summarized below:
Net revenues $ 413
Total expenses (1) (996 )
Income before income taxes 1,409
Income tax expense (benefit) —
Income from discontinued operations $ 1,409
(1) Total expenses are shown net of a severance expense reversal that occurred as a result of voluntary post-acquisition employee departures
and amortization of facility exit costs.
There was no gain or loss directly attributed to the completion of the disposal of these businesses.

F-24
Assets and Liabilities
The carrying amounts of major classes of assets and liabilities related to discontinued operations consisted of the following at
December 31, 2018:
Assets
Mortgage loans held for sale $ 650
Accounts receivable, net 144
Total assets related to discontinued operations $ 794
Liabilities
Other liabilities (1) 18,265
Total liabilities related to discontinued operations $ 18,265
(1) The primary component of Other liabilities is an exit cost liability which includes $14.9 million of facility exit costs related to vacating
certain facilities.
Cash Flows
The cash flows related to discontinued operations have not been segregated and are included in the consolidated statement of
cash flows for the post-acquisition period. There were no significant adjustments necessary to reconcile Net loss to net cash
provided by operating activities that relate to discontinued operations.
Note 3 — Cost Re-Engineering Plan
In February 2019, we announced our intention to execute cost re-engineering opportunities in order to drive stronger
financial performance and, in the longer term, simplify our operations. Our cost re-engineering plans extend beyond
eliminating redundant costs through the integration process and address organizational, process and control redesign and
automation, human capital planning, off-shore utilization, strategic sourcing and facilities rationalization. Costs for this plan
include severance, retention and other incentive awards, facilities-related costs and other costs to execute the reorganization.
While we continue to pursue additional cost re-engineering initiatives, this cost re-engineering plan announced in February
2019 was completed by December 31, 2019 and our remaining liability at December 31, 2019 is $11.9 million.
The following table provides a summary of the aggregate activity of the liability for the re-engineering plan costs, including the
detail of the $65.0 million total cost incurred in the year ended December 31, 2019:
Employee-
related Facility-related Other Total
Beginning balance $ — $ — $ — $ —
Charges (1) 35,704 10,133 19,133 64,970
Payments / Other (29,449 ) (7,202 ) (16,414 ) (53,065 )
Ending balance (2) $ 6,255 $ 2,931 $ 2,719 $ 11,905
(1) The expenses were all incurred within the Corporate Items and Other segment. Employee-related costs and facility-related costs are reported
in Compensation and benefits expense and Occupancy and equipment expense, respectively, in the consolidated statement of operations.
Other costs are primarily reported in Professional services expense and Other expenses.
(2) The liability for re-engineering plan costs at December 31, 2019 is included in Other liabilities (Other accrued expenses).
Note 4 — Securitizations and Variable Interest Entities
We securitize, sell and service forward and reverse residential mortgage loans and regularly transfer financial assets in
connection with asset-backed financing arrangements. We have aggregated these securitizations and asset-backed financing
arrangements using special purpose entities (SPEs) or VIEs into three groups: (1) securitizations of residential mortgage loans,
(2) financings of advances and (3) MSR financings. Financing transactions that do not use SPEs or VIEs are disclosed in
Note 14 — Borrowings.
We have determined that the SPEs created in connection with our match funded advance financing facilities are VIEs for
which we are the primary beneficiary.

F-25
From time to time, we may acquire beneficial interests issued in connection with mortgage-backed securitizations where
we may also be the master and/or primary servicer. These beneficial interests consist of subordinate and residual interests
acquired from third-parties in market transactions. We consolidate the VIE when we conclude we are the primary beneficiary.
Securitizations of Residential Mortgage Loans
Transfers of Forward Loans
We sell or securitize forward loans that we originate or purchased from third parties, generally in the form of mortgage-
backed securities guaranteed by the GSEs or Ginnie Mae. Securitization typically occurs within 30 days of loan closing or
purchase. We act only as a fiduciary and do not have a variable interest in the securitization trusts. As a result, we account for
these transactions as sales upon transfer.
The following table presents a summary of cash flows received from and paid to securitization trusts related to transfers of
loans accounted for as sales that were outstanding:
Years Ended December 31,
2019 2018 2017
Proceeds received from securitizations $ 1,248,837 $ 1,290,682 $ 3,256,625
Servicing fees collected (1) 50,326 45,046 41,509
Purchases of previously transferred assets, net of claims reimbursed (4,602 ) (4,395 ) (5,948 )
$ 1,294,561 $ 1,331,333 $ 3,292,186
(1) We receive servicing fees based upon the securitized loan balances and certain ancillary fees, all of which are reported in Servicing and
subservicing fees in the consolidated statements of operations.
In connection with these transfers, we retained MSRs of $7.5 million, $8.3 million and $20.7 million during 2019, 2018
and 2017, respectively. We securitize forward and reverse residential mortgage loans involving the GSEs and loans insured by
the FHA or VA through Ginnie Mae.
Certain obligations arise from the agreements associated with our transfers of loans. Under these agreements, we may be
obligated to repurchase the loans, or otherwise indemnify or reimburse the investor or insurer for losses incurred due to
material breach of contractual representations and warranties.
The following table presents the carrying amounts of our assets that relate to our continuing involvement with forward
loans that we have transferred with servicing rights retained as well as an estimate of our maximum exposure to loss including
the UPB of the transferred loans:
December 31,
2019 2018
Carrying value of assets
MSRs, at fair value $ 109,581 $ 132,774
Advances and match funded advances 141,829 138,679
UPB of loans transferred 14,490,984 15,600,971
Maximum exposure to loss $ 14,742,394 $ 15,872,424
At December 31, 2019 and 2018, 7.7% and 8.3%, respectively, of the transferred residential loans that we service were 60
days or more past due.
Transfers of Reverse Mortgages
We pool HECM loans into HMBS that we sell into the secondary market with servicing rights retained or we sell the loans
to third parties with servicing rights released. We have determined that loan transfers in the HMBS program do not meet the
definition of a participating interest because of the servicing requirements in the product that require the issuer/servicer to
absorb some level of interest rate risk, cash flow timing risk and incidental credit risk. As a result, the transfers of the HECM
loans do not qualify for sale accounting, and therefore, we account for these transfers as financings. Under this accounting
treatment, the HECM loans are classified as Loans held for investment, at fair value, on our consolidated balance sheets.
Holders of participating interests in the HMBS have no recourse against the assets of Ocwen, except with respect to standard
representations and warranties and our contractual obligation to service the HECM loans and the HMBS.

F-26
Financings of Advances
Match funded advances result from our transfers of residential loan servicing advances to SPEs in exchange for cash. We
consolidate these SPEs because we have determined that Ocwen is the primary beneficiary of the SPE. These SPEs issue debt
supported by collections on the transferred advances, and we refer to this debt as Match funded liabilities.
We make transfers to these SPEs in accordance with the terms of our advance financing facility agreements. Debt service
accounts require us to remit collections on pledged advances to the trustee within two days of receipt. Collected funds that are
not applied to reduce the related match funded debt until the payment dates specified in the indenture are classified as debt
service accounts within Restricted cash in our consolidated balance sheets. The balances also include amounts that have been
set aside from the proceeds of our match funded advance facilities to provide for possible shortfalls in the funds available to
pay certain expenses and interest, as well as amounts set aside as required by our warehouse facilities as security for our
obligations under the related agreements. The funds are held in interest earning accounts and those amounts related to match
funded advance facilities are held in the name of the SPE created in connection with the facility.
We classify the transferred advances on our consolidated balance sheets as a component of Match funded assets and the
related liabilities as Match funded liabilities. The SPEs use collections of the pledged advances to repay principal and interest
and to pay the expenses of the SPE. Holders of the debt issued by these entities have recourse only to the assets of the SPE for
satisfaction of the debt. The assets and liabilities of the advance financing SPEs are comprised solely of Match funded
advances, Restricted cash (debt service accounts), Match funded liabilities and amounts due to affiliates. Amounts due to
affiliates are eliminated in consolidation in our consolidated balance sheets.
MSR Financings
On July 1, 2019, we entered into a $300.0 million financing facility with a third-party secured by certain Fannie Mae and
Freddie Mac MSRs. Two trusts were established in connection with this facility. On July 1, 2019 we entered into an MSR
Excess Spread Participation Agreement under which we created a 100% participation interest in the Portfolio Excess Servicing
Fees, as defined, pursuant to which the holder of the participation interest is entitled to receive certain funds collected on the
related portfolio of mortgage loans (other than ancillary income and advance reimbursement amounts) with respect to such
Portfolio Excess Servicing Fees. Portfolio Excess Servicing Fees are defined within the Excess Spread Participation Agreement
as: (a) the portfolio collections received during the collection period, net of the base servicing fee; and (b) all other amounts
payable by a loan owner or master servicer with respect to the servicing rights for the portfolio mortgage loans, including any
portfolio termination payments. This participation interest has been contributed to the trusts.
In connection with this facility, we entered into repurchase agreements with a third-party pursuant to which we sold trust
certificates of the trusts representing certain indirect economic interests in the MSRs and agreed to repurchase such certificates
at a future date at the repurchase price set forth in the repurchase agreements. Our obligations under the facility are secured by
a lien on the related MSRs. In addition, Ocwen guarantees the obligations under the facility. This facility will terminate in June
2020 unless the parties mutually agree to renew or extend.
We determined that the trusts are VIEs for which we are the primary beneficiary. Therefore, we have included the trusts in
our consolidated financial statements effective July 1, 2019. We have the power to direct the activities of the VIEs that most
significantly impact the VIE’s economic performance given that we are the servicer of the MSRs that result in cash flows to the
trusts. In addition, we have designed the trusts at inception to facilitate the third-party funding facility under which we have the
obligation to absorb the losses of the VIEs that could be potentially significant to the VIEs.
At December 31, 2019, $147.7 million was outstanding under this facility which is included in Other secured borrowings,
net on our consolidated balance sheet. See Note 14 — Borrowings for additional information. The carrying value of the
pledged MSRs was $245.5 million at December 31, 2019. At December 31, 2019, $0.9 million of unamortized debt issuance
costs related to this facility are included in Other assets, $0.1 million of accrued interest payable related to this facility are
included in Other liabilities and $0.1 million of debt service account related to this facility are included in Restricted cash. The
assets and liabilities of the trusts include amounts due to or from affiliates which are eliminated in consolidation in our
consolidated balance sheets.
On November 26, 2019, we issued $100.0 million Ocwen Excess Spread-Collateralized Notes, Series 2019-PLS1 Class A
(PLS Notes) secured by certain of PMC’s private label MSRs (PLS MSRs). PMC PLS ESR Issuer LLC (PLS Issuer) was
established in this connection as a wholly owned subsidiary of PMC. PMC entered into an MSR Excess Spread Participation
Agreement with PLS Issuer. PMC created a participation interest in the Excess Servicing Fees, related float and REO fees
pursuant to which the holder of the participation interest will be entitled to receive such Excess Servicing Fees, related float and
REO fees. PMC holds the MSRs and services the loans which create the related excess cash flows pledged under the MSR
Excess Spread Participation Agreement. “Excess Servicing Fees” shall mean: “with respect to each servicing agreement and
any collection period, an amount equal to the total Servicing Fees payable under such servicing agreement for such collection
period minus the product of 13.0 basis points multiplied by the unpaid principal balance of the related mortgage loans for such

F-27
servicing agreement as of the first day of such collection period.” PLS Issuer’s obligations under the facility are secured by a
lien on the related PLS MSRs. PMC sold a participation certificate representing certain economic interests in the PLS MSRs
and in order to secure its obligations under the participation certificate, it granted a security interest to PLS Issuer in the PLS
MSRs. The PLS Issuer assigned the security interest in the PLS MSRs to the collateral agent for the noteholders. Ocwen
guarantees the obligations of PLS Issuer under the facility.
We determined that PLS Issuer is a VIE for which we are the primary beneficiary. Therefore, we have included PLS Issuer
in our consolidated financial statements effective November 26, 2019. We have the power to direct the activities of the VIE that
most significantly impact the VIE’s economic performance given that we are the servicer of the MSRs that result in cash flows
to PLS Issuer. In addition, PMC has designed PLS Issuer at inception to facilitate the funding for general corporate purposes.
Separately, in return for the participation interests, PMC received the proceeds from issuance of the PLS Notes. PMC is the sole
member of PLS Issuer, thus PMC has the obligation to absorb the losses of the VIE that could be potentially significant to the
VIE.
At December 31, 2019, $94.4 million was outstanding under this facility which is included in Other secured borrowings on
our consolidated balance sheet. See Note 14 — Borrowings for additional information. The carrying value of the pledged
MSRs was $146.2 million at December 31, 2019. At December 31, 2019, $1.2 million of unamortized debt issuance costs
related to the PLS Notes is reported as a reduction to the secured borrowing liability, $0.1 million of accrued interest payable
related to this facility are included in Other liabilities and a $3.0 million debt service account related to this facility is included
in Restricted cash. The assets and liabilities of PLS Issuer include amounts due to or from affiliates which are eliminated in
consolidation in our consolidated balance sheets.
Mortgage-Backed Securitizations
The table below presents the carrying value and classification of the assets and liabilities of two consolidated mortgage-
backed securitization trusts included in our consolidated balance sheet as a result of residual securities issued by the trust that
we acquired during the third quarter of 2018.
December 31,
2019 2018
Loans held for investment, at fair value - Restricted for securitization investors $ 23,342 $ 26,520
Financing liability - Owed to securitization investors, at fair value 22,002 24,815
We have concluded we are the primary beneficiary of certain residential mortgage-backed securitizations as a result of
beneficial interests consisting of residual securities, which expose us to the expected losses and residual returns of the trust, and
our role as master servicer, where we have the ability to direct the activities that most significantly impact the performance of
the trust.
Upon consolidation of the securitization trusts, we elected to apply the measurement alternative to ASC Topic 820, Fair
Value Measurement for collateralized financing entities. The measurement alternative requires a reporting entity to use the more
observable of the fair value of the financial assets or the financial liabilities to measure both the financial assets and the
financial liabilities of the entity. We determined that the fair value of the loans held by the trusts is more observable than the
fair value of the debt certificates issued by the trusts. Through the application of the measurement alternative, the fair value of
the financial liabilities of the trusts are measured as the difference between the fair value of the financial assets and the fair
value of our investment in the residual securities of the trusts.
Holders of the debt issued by the two securitization trust entities have recourse only to the assets of the SPE for satisfaction
of the debt and have no recourse against the assets of Ocwen. Similarly, the general creditors of Ocwen have no claim on the
assets of the trusts. Our exposure to loss as a result of our continuing involvement is limited to the carrying values of our
investments in the residual securities of the trusts, our MSRs and related advances.
Note 5 — Fair Value
Fair value is estimated based on a hierarchy that maximizes the use of observable inputs and minimizes the use of
unobservable inputs. Observable inputs are inputs that reflect the assumptions that market participants would use in pricing the
asset or liability developed based on market data obtained from sources independent of the reporting entity. Unobservable
inputs are inputs that reflect the reporting entity’s own assumptions about the assumptions market participants would use in
pricing the asset or liability developed based on the best information available in the circumstances. The fair value hierarchy
prioritizes the inputs to valuation techniques into three broad levels whereby the highest priority is given to Level 1 inputs and
the lowest to Level 3 inputs.
Level 1: Quoted prices (unadjusted) in active markets for identical assets or liabilities that the reporting entity can
access at the measurement date.

F-28
Level 2: Inputs other than quoted prices included in Level 1 that are observable for the asset or liability, either directly
or indirectly.
Level 3: Unobservable inputs for the asset or liability.
We classify assets in their entirety based on the lowest level of input that is significant to the fair value measurement.
We have elected to fair value future draw commitments for HECM loans purchased or originated after December 31, 2018.
The estimated fair value is included in Loans held for investment on our consolidated balance sheets with changes in fair value
recognized in Reverse mortgage revenue, net in our consolidated statements of operations. The value of future draw
commitments for HECM loans purchased or originated before January 1, 2019 is recognized as the draws are securitized or
sold.
The carrying amounts and the estimated fair values of our financial instruments and certain of our nonfinancial assets
measured at fair value on a recurring or non-recurring basis or disclosed, but not measured, at fair value are as follows:
December 31,
2019 2018
Level Carrying
Value Fair Value Carrying
Value Fair Value
Financial assets:
Loans held for sale
Loans held for sale, at fair value (a) 2 $ 208,752 $ 208,752 $ 176,525 $ 176,525
Loans held for sale, at lower of cost or fair value (b) 3 66,517 66,517 66,097 66,097
Total Loans held for sale $ 275,269 $ 275,269 $ 242,622 $ 242,622
Loans held for investment
Loans held for investment - Reverse mortgages (a) 3 $ 6,269,596 $ 6,269,596
$ 5,472,199
$ 5,472,199
Loans held for investment - Restricted for securitization investors (a) 3 23,342
23,342
26,520
26,520
Total loans held for investment 6,292,938 6,292,938 5,498,719 5,498,719
Advances (including match funded), net (c) 3 1,056,523 1,056,523 1,186,676 1,186,676
Receivables, net (c) 3 201,220 201,220 198,262 198,262
Mortgage-backed securities (a) 3 2,075 2,075 1,502 1,502
U.S. Treasury notes (a) 1 — — 1,064 1,064
Corporate bonds (a) 2 441 441 450 450
Financial liabilities:
Match funded liabilities (c) 3 $ 679,109 $ 679,507 $ 778,284 $ 776,485
Financing liabilities:
HMBS-related borrowings (a) 3 $ 6,063,435 $ 6,063,435 $ 5,380,448 $ 5,380,448
Financing liability - MSRs pledged (Rights to MSRs) (a) 3 950,593
950,593
1,032,856
1,032,856
Financing liability - Owed to securitization investors (a) 3 22,002
22,002
24,815
24,815
Other (c) 3 — — 4,419 4,419
Total Financing liabilities $ 7,036,030 $ 7,036,030 $ 6,442,538 $ 6,442,538
Other secured borrowings:
Senior secured term loan (c) (d) 2 $ 322,758 $ 324,643 $ 226,825 $ 227,449
Other (c) 3 703,033 686,146 221,236 204,864
Total Other secured borrowings $ 1,025,791 $ 1,010,789 $ 448,061 $ 432,313
Senior notes:
Senior unsecured notes (c) (d) 2 $ 21,046 $ 13,821 $ 119,924 $ 119,258

F-29
December 31,
2019 2018
Level Carrying
Value Fair Value Carrying
Value Fair Value
Senior secured notes (c) (d) 2 290,039 256,201 328,803 306,889
Total Senior notes $ 311,085 $ 270,022 $ 448,727 $ 426,147
Derivative financial instrument assets (liabilities)
Interest rate lock commitments (a) 2 $ 4,878 $ 4,878 $ 3,871 $ 3,871
Forward trades - Loans held for sale (a) 1 (92 ) (92 ) (4,983 ) (4,983 )
TBA / Forward mortgage-backed securities (MBS) trades - MSR hedging (a) 1 1,121
1,121
—
—
Interest rate caps (a) 3 — — 678 678
MSRs (a) 3 $ 1,486,395 $ 1,486,395 $ 1,457,149 $ 1,457,149
(a) Measured at fair value on a recurring basis.
(b) Measured at fair value on a non-recurring basis.
(c) Disclosed, but not measured, at fair value.
(d) The carrying values are net of unamortized debt issuance costs and discount. See Note 14 — Borrowings for additional information.

F-30
The following tables present a reconciliation of the changes in fair value of Level 3 assets and liabilities that we measure at
fair value on a recurring basis:
Loans Held for
Investment - Reverse
Mortgages
HMBS-Related
Borrowings
Loans Held for
Inv. - Restricted
for Securitiza-
tion Investors
Financing Liability - Owed to
Securitiza - tion
Investors
Mortgage-Backed
Securities
Financing Liability -
MSRs Pledged Derivatives MSRs
Year Ended December 31, 2019
Beginning balance $ 5,472,199 $ (5,380,448 ) $ 26,520 $ (24,815 ) $ 1,502 $ (1,032,856 ) $ 678 $ 1,457,149
Purchases, issuances, sales and settlements
Purchases — — — — — (1,276 ) — 162,300
Issuances 1,026,154 (962,113 ) — — — — — —
Sales — — — — — (44 ) — (4,344 )
Settlements (558,720 ) 549,600 (3,178 ) 2,813 — 214,364 — (7,309 )
Transfers (to) from:
Loans held for sale, at fair value (1,892 ) —
—
—
—
—
—
—
Receivables, net (327 ) — — — — — — —
Other assets (513 ) — — — — — — —
464,702 (412,513 ) (3,178 ) 2,813 — 213,044 — 150,647
Total realized and unrealized gains (losses)
Included in earnings:
Change in fair value (1) 332,430
(270,473 ) —
—
573
(152,986 ) (678 ) (121,401 )
Calls and other — — — — — 22,205 — —
332,430 (270,473 ) — — 573 (130,781 ) (678 ) (121,401 )
Transfers in and / or out of Level 3 —
—
—
—
—
—
—
—
Ending balance $ 6,269,331 $ (6,063,434 ) $ 23,342 $ (22,002 ) $ 2,075 $ (950,593 ) $ — $ 1,486,395

F-31
Loans Held for
Investment - Reverse
Mortgages
HMBS-Related
Borrowings
Loans Held for
Inv. - Restricted
for Securitiza-
tion Investors
Financing Liability - Owed to
Securitiza - tion
Investors
Mortgage-Backed
Securities
Financing Liability -
MSRs Pledged Derivatives MSRs
Year Ended December 31, 2018
Beginning balance $ 4,715,831 $ (4,601,556 ) $ — $ — $ 1,592 $ (508,291 ) $ 2,056 $ 671,962
Purchases, issuances, sales and settlements
Purchases — — — — — (667 ) 95 13,712
Recognized (assumed) in connection with the acquisition of PHH —
—
—
—
—
(481,020 ) —
518,127
Issuances (2) 920,476 (948,917 ) — — — (279,586 ) — —
Consolidation of mortgage-backed securitization trusts —
—
28,373
(26,643 ) —
—
—
—
Sales — — — — — — — (6,240 )
Settlements (400,521 ) 391,985 (1,853 ) 1,828 — 211,766 (371 ) (5,880 )
Transfers (to) from:
MSRs carried at amortized cost, net of valuation allowance —
—
—
—
—
—
—
418,925
Loans held for sale, at fair value (1,039 ) —
—
—
—
—
—
—
Receivables, net (158 ) — — — — — — —
Other assets (411 ) — — — — — — —
518,347 (556,932 ) 26,520 (24,815 ) — (549,507 ) (276 ) 938,644
Total realized and unrealized gains (losses)
Included in earnings:
Change in fair value (2) 238,021
(221,960 ) —
—
(90 ) 19,269
(1,102 ) (153,457 )
Calls and other — — — — — 5,673 — —
238,021 (221,960 ) — — (90 ) 24,942 (1,102 ) (153,457 )
Transfers in and / or out of Level 3 —
—
—
—
—
—
—
—
Ending balance $ 5,472,199 $ (5,380,448 ) $ 26,520 $ (24,815 ) $ 1,502 $ (1,032,856 ) $ 678 $ 1,457,149

F-32
Loans Held for
Investment - Reverse
Mortgages
HMBS-Related
Borrowings
Mortgage-Backed
Securities
Financing Liability -
MSRs Pledged Derivatives MSRs
Year Ended December 31, 2017
Beginning balance $ 3,565,716 $ (3,433,781 ) $ 8,342 $ (477,707 ) $ 1,836 $ 679,256
Purchases, issuances, sales and settlements
Purchases — — — — 655 —
Issuances (3) 1,277,615 (1,281,543 ) — (54,601 ) — (2,214 )
Sales — — — — — (540 )
Settlements (444,388 ) 418,503 — 59,190 (445 ) —
Transfers (to) from:
Loans held for sale, at fair value (3,803 ) — — — — —
Receivables, net (3,583 ) — — — — —
Other assets (1,929 ) — — — — —
823,912 (863,040 ) — 4,589 210 (2,754 )
Total realized and unrealized gains (losses) (4)
Included in earnings
Change in fair value (3) 326,203 (304,735 ) (6,750 ) (41,282 ) 10 (4,540 )
Calls and other — — — 6,109 — —
326,203 (304,735 ) (6,750 ) (35,173 ) 10 (4,540 )
Transfers in and / or out of Level 3 — — — — — —
Ending balance $ 4,715,831 $ (4,601,556 ) $ 1,592 $ (508,291 ) $ 2,056 $ 671,962
(1) The change in fair value adjustments on Loans held for investment for 2019 include $12.2 million in connection with the fair value
election for future draw commitments on HECM reverse mortgage loans purchased or originated after December 31, 2018.
(2) On January 18, 2018, Ocwen received a lump-sum payment of $279.6 million in accordance with terms of the agreements with NRZ.
See Note 10 — Rights to MSRs.
(3) On September 1, 2017, Ocwen transferred MSRs with UPB of $15.9 billion to NRZ and received a lump-sum payment of $54.6 million.
See Note 10 — Rights to MSRs.
(4) Total gains (losses) attributable to derivative financial instruments still held at December 31, 2019 and 2018 and 2017 were $(0.7)
million, $(1.1) million and $0.1 million for 2019, 2018 and 2017, respectively. Total losses for 2019, 2018 and 2017 attributable to
MSRs still held at December 31, 2019, 2018 and 2017 were $98.1 million, $153.5 million and $4.5 million, respectively.
The methodologies that we use and key assumptions that we make to estimate the fair value of financial instruments and
other assets and liabilities measured at fair value on a recurring or non-recurring basis and those disclosed, but not carried, at
fair value are described below.
Loans Held for Sale
Residential forward and reverse mortgage loans that we intend to sell are carried at fair value as a result of a fair value
election. Such loans are subject to changes in fair value due to fluctuations in interest rates from the closing date through the
date of the sale of the loan into the secondary market. These loans are classified within Level 2 of the valuation hierarchy
because the primary component of the price is obtained from observable values of mortgage forwards for loans of similar terms
and characteristics. We have the ability to access this market, and it is the market into which conventional and government-
insured mortgage loans are typically sold.
We purchase certain loans from Ginnie Mae guaranteed securitizations in connection with loan modifications, strategic
early buyouts (EBO) and loan resolution activity as part of our contractual obligations as the servicer of the loans. Modified
and EBO loans are classified as loans held for sale at the lower of cost or fair value as we expect to redeliver (sell) the loans
into new Ginnie Mae guaranteed securitizations (in the case of modified loans) or sell the loans to a private investor (in the case
of EBO loans). The fair value of these loans is estimated using published forward Ginnie Mae prices or existing sale contracts.
Loans repurchased in connection with loan resolution activities are classified as receivables. Because these loans are insured or
guaranteed by the FHA or VA, the fair value of these loans represents the net recovery value taking into consideration the
insured or guaranteed claim.

F-33
We report all other loans held for sale at the lower of cost or fair value. When we enter into an agreement to sell a loan or pool
of loans to an investor at a set price, we value the loan or loans at the commitment price, unless facts and circumstances exist that
could impact deal economics, at which point we use judgment to determine appropriate adjustments to recorded fair value, if any.
We determine the fair value of loans for which we have no agreement to sell on the expected future cash flows discounted at a rate
commensurate with the risk of the estimated cash flows.
Loans Held for Investment
Loans Held for Investment - Reverse Mortgages
We measure these loans at fair value based on the expected future cash flows discounted over the expected life of the loans
at a rate commensurate with the risk of the estimated cash flows, including future draw commitments for HECM loans
purchased or originated after December 31, 2018. Significant assumptions include expected future draws and prepayment and
delinquency rates and cumulative loss curves. The discount rate assumption for these assets is primarily based on an assessment
of current market yields on newly originated reverse mortgage loans, expected duration of the asset and current market interest
rates.
December 31,
Significant valuation assumptions 2019 2018
Life in years
Range 2.4 to 7.8 3.0 to 7.6
Weighted average 6.0 5.9
Conditional repayment rate
Range 7.8% to 28.3% 6.8% to 38.4%
Weighted average 14.6 % 14.7 %
Discount rate 2.8 % 3.4 %
Significant increases or decreases in any of these assumptions in isolation could result in a significantly lower or higher
fair value, respectively. The effects of changes in the assumptions used to value the loans held for investment, excluding future
draw commitments, are largely offset by the effects of changes in the assumptions used to value the HMBS-related borrowings
that are associated with these loans.
Loans Held for Investment – Restricted for securitization investors
We have elected to measure loans held by consolidated mortgage-backed securitization trusts at fair value. The loans are
secured by first liens on single family residential properties. Fair value is based on proprietary cash flow modeling processes
from a third-party broker/dealer and a third-party valuation expert. Significant assumptions used in the valuation include
projected monthly payments, projected prepayments and defaults, property liquidation values and discount rates.
MSRs
We determine the fair value of MSRs primarily using discounted cash flow methodologies. The significant components of
the estimated future cash inflows for MSRs include servicing fees, late fees, float earnings and other ancillary fees. Significant
cash outflows include the cost of servicing, the cost of financing servicing advances and compensating interest payments.
We engage third-party valuation experts who generally utilize: (a) transactions involving instruments with similar
collateral and risk profiles, adjusted as necessary based on specific characteristics of the asset or liability being valued; and/or
(b) industry-standard modeling, such as a discounted cash flow model and a prepayment model, in arriving at their estimate of
fair value. The prices provided by the valuation experts reflect their observations and assumptions related to market activity,
incorporating available industry survey results and client feedback, and including risk premiums and liquidity adjustments.
While the models and related assumptions used by the valuation experts are proprietary to them, we understand the
methodologies and assumptions used to develop the prices based on our ongoing due diligence, which includes regular
discussions with the valuation experts. We believe that the procedures executed by the valuation experts, supported by our
verification and analytical procedures, provide reasonable assurance that the prices used in our consolidated financial
statements comply with the accounting guidance for fair value measurements and disclosures and reflect the assumptions that a
market participant would use.

F-34
We evaluate the reasonableness of our third-party experts’ assumptions using historical experience adjusted for prevailing
market conditions. Assumptions used in the valuation of MSRs include:
• Mortgage prepayment speeds • Delinquency rates
• Cost of servicing • Interest rate used for computing float earnings
• Discount rate • Compensating interest expense
• Interest rate used for computing the cost of financing servicing advances
• Collection rate of other ancillary fees
• Curtailment on advances
MSRs are carried at fair value and classified within Level 3 of the valuation hierarchy. The fair value is determined using
the mid-point of the range of prices provided by third-party valuation experts, without adjustment, except in the event we have
a potential or completed sale, including transactions where we have executed letters of intent, in which case the fair value of the
MSRs is recorded at the estimated sale price. Fair value reflects actual Ocwen sale prices for orderly transactions where
available in lieu of independent third-party valuations. Our valuation process includes discussions of bid pricing with the third-
party valuation experts and are contemplated along with other market-based transactions in their model validation.
A change in valuation inputs or assumptions may result in a significantly higher or lower fair value measurement. Changes
in market interest rates predominantly impact the fair value for Agency MSRs via prepayment speeds by altering the borrower
refinance incentive and the non-Agency MSRs due to the impact on advance costs. Other key assumptions used in the valuation
of these MSRs include delinquency rates and discount rates.
December 31,
Significant valuation assumptions 2019 2018
Agency Non-Agency Agency Non-Agency
Weighted average prepayment speed 11.7 % 12.2 % 8.5 % 15.4 %
Weighted average delinquency rate 3.2 % 27.3 % 6.6 % 27.1 %
Advance financing cost 5-year swap 5-yr swap plus
2.00% 5-year swap 5-yr swap plus
2.75%
Interest rate for computing float earnings 5-year swap 5-yr swap minus
0.50% 5-year swap 5-yr swap minus
0.50%
Weighted average discount rate 9.3 % 11.3 % 9.1 % 12.8 %
Weighted average cost to service (in dollars) $ 85 $ 277 $ 90 $ 297
Because the mortgages underlying these MSRs permit the borrowers to prepay the loans, the value of the MSRs generally
tends to diminish in periods of declining interest rates, an improving housing market or expanded product availability (as
prepayments increase) and increase in periods of rising interest rates, a deteriorating housing market or reduced product
availability (as prepayments decrease). The following table summarizes the estimated change in the value of the MSRs that we
carry at fair value as of December 31, 2019 given hypothetical shifts in lifetime prepayments and yield assumptions:
Adverse change in fair value 10% 20%
Weighted average prepayment speeds $ (116,951 ) $ (224,689 )
Weighted average discount rate (49,463 ) (95,885 )
The sensitivity analysis measures the potential impact on fair values based on hypothetical changes, which in the case of
our portfolio at December 31, 2019 are increased prepayment speeds and an increase in the yield assumption.
Advances
We value advances and match funded advances at their net realizable value, which generally approximates fair value.
Servicing advances have no stated maturity and do not bear interest. Principal and interest advances are generally realized
within a relatively short period of time. The timing of recovery of taxes, insurance and other corporate advances depends on the
underlying loan attributes, performance, and in many cases, foreclosure or liquidation timeline. The fair value adjustment to
servicing advances associated with the estimated time to recover such advances is separately measured and reported as a
component of the fair value of the associated MSR, consistent with actual market transactions. Refer to MSRs above for a
description of the valuation methodology and assumptions related to the cost of financing servicing advances and discount rate,
among other factors. The fair value of advances and match funded advances does not include the fair value of any servicer
advance commitments that is included and measured as a component of the fair value of the associated MSR.

F-35
Receivables
The carrying value of receivables generally approximates fair value because of the relatively short period of time between
their origination and realization.
Mortgage-Backed Securities (MBS)
Our subordinate and residual securities are not actively traded, and therefore, we estimate the fair value of these securities
using a process based upon the use of an independent third-party valuation expert. Where possible, we consider observable
trading activity in the valuation of our securities. Key inputs include expected prepayment rates, delinquency and cumulative
loss curves and discount rates commensurate with the risks. Where possible, we use observable inputs in the valuation of our
securities. However, the subordinate and residual securities in which we have invested trade infrequently and therefore have
few or no observable inputs and little price transparency. Additionally, during periods of market dislocation, the observability of
inputs is further reduced. We classify subordinate and residual securities as trading securities and account for them at fair value
on a recurring basis. Changes in the fair value of our investment in subordinate and residual securities are recognized in Other,
net in the consolidated statements of operations.
U.S. Treasury Notes
We classify U.S. Treasury notes as trading securities and account for them at fair value on a recurring basis. We base the
fair value on quoted prices in active markets to which we have access. Changes in the fair value of our investment in U.S.
Treasury notes are recognized in Other, net in the consolidated statements of operations.
Match Funded Liabilities
For match funded liabilities that bear interest at a rate that is adjusted regularly based on a market index, the carrying value
approximates fair value. For match funded liabilities that bear interest at a fixed rate, we determine fair value by discounting
the future principal and interest repayments at a market rate commensurate with the risk of the estimated cash flows. We
assume the notes are refinanced at the end of their revolving periods, consistent with how we manage our advance facilities.
Financing Liabilities
HMBS-Related Borrowings
We have elected to measure these borrowings at fair value. These borrowings are not actively traded, and therefore, quoted
market prices are not available. We determine fair value by discounting the projected recovery of principal, interest and
advances over the estimated life of the borrowing at a market rate commensurate with the risk of the estimated cash flows.
Significant assumptions include prepayments, discount rate and borrower mortality rates. The discount rate assumption for
these liabilities is based on an assessment of current market yields for newly issued HMBS, expected duration and current
market interest rates.
December 31,
Significant valuation assumptions 2019 2018
Life in years
Range 2.4 to 7.8 3.0 to 7.6
Weighted average 6.0 5.9
Conditional repayment rate
Range 7.8% to 28.3% 6.8% to 38.4%
Weighted average 14.6 % 14.7 %
Discount rate 2.7 % 3.3 %
Significant increases or decreases in any of these assumptions in isolation would result in a significantly higher or lower
fair value.
MSRs Pledged (Rights to MSRs)
We have elected to measure and record these borrowings at fair value. We recognize the proceeds received in connection
with Rights to MSRs transactions as a secured borrowing that we account for at fair value. We determine the fair value of the
pledged MSR liability following a similar approach as for the associated pledged MSRs. Fair value for the portion of the
borrowing attributable to the MSRs underlying the Rights to MSRs is determined using the mid-point of the range of prices
provided by third-party valuation experts. Fair value for the portion of the borrowing attributable to any lump sum payments
received in connection with the transfer of MSRs underlying such Rights to MSRs to the extent such transfer is accounted for

F-36
as a financing is determined by discounting the relevant future cash flows that were altered through such transfer using
assumptions consistent with the mid-point of the range of prices provided by third-party valuation experts for the related MSR.
December 31,
Significant valuation assumptions 2019 2018
Weighted average prepayment speed 11.9 % 13.9 %
Weighted average delinquency rate 20.3 % 20.3 %
Advance financing cost
5-year swap plus 0% to
2.00% 5-year swap plus
0% to 2.75%
Interest rate for computing float earnings
5-year swap minus 0% to
0.50%
5-year swap minus 0% to
0.50%
Weighted average discount rate 10.7 % 12.0 %
Weighted average cost to service (in dollars) $ 223 $ 234
Significant increases or decreases in these assumptions in isolation would result in a significantly higher or lower fair
value.
Financing Liability – Owed to Securitization Investors
Consists of securitization debt certificates due to third parties that represent beneficial ownership interests in mortgage-
backed securitization trusts that we include in our consolidated financial statements. We determine fair value using the
measurement alternative to ASC Topic 820, Fair Value Measurement as disclosed in Note 4 — Securitizations and Variable
Interest Entities. In accordance with the measurement alternative, the fair value of the consolidated securitization debt
certificates is measured as the fair value of the loans held by the trust less the fair value of the beneficial interests held by us in
the form of residual securities.
Other Secured Borrowings
The carrying value of secured borrowings that bear interest at a rate that is adjusted regularly based on a market index
approximates fair value. For other secured borrowings that bear interest at a fixed rate, we determine fair value by discounting
the future principal and interest repayments at a market rate commensurate with the risk of the estimated cash flows. For the
SSTL, we base the fair value on valuation data obtained from a pricing service.
Secured Notes
In 2014, we issued Ocwen Asset Servicing Income Series (OASIS), Series 2014-1 Notes secured by Ocwen-owned MSRs
relating to Freddie Mac mortgages. In 2019, we issued Ocwen Excess Spread-Collateralized Notes, Series 2019-PLS1 notes
secured by certain of PMC’s private label MSRs. We determine the fair value of these notes based on bid prices provided by
third parties involved in the issuance and placement of the notes.
Senior Notes
We base the fair value on quoted prices in a market with limited trading activity, or on valuation data obtained from a
pricing service in the absence of trading data.
Derivative Financial Instruments
Interest rate lock commitments (IRLCs) represent an agreement to purchase loans from a third-party originator or an
agreement to extend credit to a mortgage applicant (locked pipeline), whereby the interest rate is set prior to funding. IRLCs
are classified within Level 2 of the valuation hierarchy as the primary component of the price is obtained from observable
values of mortgage forwards for loans of similar terms and characteristics. Fair value amounts of IRLCs are adjusted for
expected “fallout” (locked pipeline loans not expected to close) using models that consider cumulative historical fallout rates
and other factors.
We entered into forward MBS trades to provide an economic hedge against changes in the fair value of residential forward
and reverse mortgage loans held for sale that we carry at fair value until August 2019 and, beginning in September 2019, to
hedge of our net MSR portfolio. Forward contracts are actively traded in the market and we obtain unadjusted market quotes
for these derivatives; thus, they are classified within Level 1 of the valuation hierarchy.
In addition, we may use interest rate caps to minimize future interest rate exposure on variable rate debt issued on servicing
advance financing facilities from increases in one-month or three-month Eurodollar rate (1ML or 3ML, respectively) interest
rates. The fair value for interest rate caps is based on counterparty market prices and adjusted for counterparty credit risk.

F-37
Note 6 — Loans Held for Sale
Loans Held for Sale - Fair Value
Years Ended December 31,
2019 2018 2017
Beginning balance $ 176,525 $ 214,262 $ 284,632
Originations and purchases 1,168,885 944,627 2,678,372
Proceeds from sales (1,124,247 ) (1,019,211 ) (2,785,422 )
Principal collections (23,116 ) (20,774 ) (4,867 )
Acquired in connection with the acquisition of PHH — 42,324 —
Transfers from (to):
Loans held for investment, at fair value 1,892 1,038 3,803
Receivables (2,480 ) (1,132 ) —
REO (Other assets) (2,520 ) (1,886 ) —
Gain on sale of loans 25,253 34,724 35,429
(Decrease) increase in fair value of loans (589 ) (13,435 ) 151
Other (10,851 ) (4,012 ) 2,164
Ending balance (1) $ 208,752 $ 176,525 $ 214,262
(1) At December 31, 2019, 2018 and 2017, the balances include $(7.8) million, $(7.2) million and $5.0 million, respectively, of fair value
adjustments.
Loans Held for Sale - Lower of Cost or Fair Value
Years Ended December 31,
2019 2018 2017
Beginning balance $ 66,097 $ 24,096 $ 29,374
Purchases 320,089 770,563 1,016,791
Proceeds from sales (221,471 ) (569,718 ) (861,569 )
Principal collections (11,304 ) (15,413 ) (10,207 )
Transfers from (to):
Receivables, net (104,635 ) (155,586 ) (171,797 )
REO (Other assets) (4,116 ) (2,355 ) (875 )
Gain on sale of loans 4,974 3,659 11,683
Decrease (increase) in valuation allowance 4,926 (4,251 ) 2,746
Other 11,957 15,102 7,950
Ending balance (1) $ 66,517 $ 66,097 $ 24,096
(1) At December 31, 2019, 2018 and 2017, the balances include $60.6 million, $51.8 million and $19.6 million, respectively, of loans that
we repurchased from Ginnie Mae guaranteed securitizations pursuant to Ginnie Mae servicing guidelines. We may repurchase loans that
have been modified, to facilitate loss reduction strategies, or as otherwise obligated as a Ginnie Mae servicer. Repurchased loans may be
modified or otherwise remediated through loss mitigation activities, may be sold to a third party, or are reclassified to Receivables.
Valuation Allowance - Loans Held for Sale at Lower of Cost or Fair Value
Years Ended December 31,
2019 2018 2017
Beginning balance $ 11,569 $ 7,318 $ 10,064
Provision 2,537 4,033 3,109
Transfer from Liability for indemnification obligations (Other liabilities) 403 2,021 3,246
Sales of loans (7,866 ) (1,824 ) (9,415 )
Other — 21 314
Ending balance $ 6,643 $ 11,569 $ 7,318

F-38
Years Ended December 31,
Gains on Loans Held for Sale, Net 2019 2018 2017
Gain on sales of loans, net
MSRs retained on transfers of forward mortgage loans $ 7,458 $ 7,412 $ 20,900
Gain on sale of forward mortgage loans 25,310 34,216 35,445
Gain on sale of repurchased Ginnie Mae loans 4,764 3,659 11,683
37,532 45,287 68,028
Change in fair value of IRLCs 756 3,809 (3,089 )
Change in fair value of loans held for sale 3,005 (11,569 ) 1,475
(Loss) gain on economic hedge instruments (2,689 ) 136 (8,529 )
Other (304 ) (327 ) (702 )
$ 38,300 $ 37,336 $ 57,183
Note 7 — Advances
December 31,
2019 2018
Principal and interest $ 80,229 $ 43,671
Taxes and insurance 92,315 160,373
Foreclosures, bankruptcy, REO and other 91,914 68,597
264,458 272,641
Allowance for losses (9,925 ) (23,259 )
$ 254,533 $ 249,382
The following table summarizes the activity in net advances:
Years Ended December 31,
2019 2018 2017
Beginning balance $ 249,382 $ 211,793 $ 257,882
Asset acquisition 1,457 — —
Acquired in connection with the acquisition of PHH — 96,163 —
Transfers to match funded advances — (71,623 ) —
Sales of advances (11,791 ) (32,081 ) (444 )
Collections of advances, charge-offs and other, net 2,151 51,924 (67,132 )
Net decrease (increase) in allowance for losses (1) 13,334 (6,794 ) 21,487
Ending balance $ 254,533 $ 249,382 $ 211,793
Allowance for Losses
Years Ended December 31,
2019 2018 2017
Beginning balance $ 23,259 $ 16,465 $ 37,952
Provision 3,220 5,732 21,429
Net charge-offs and other (1) (16,554 ) 1,062 (42,916 )
Ending balance $ 9,925 $ 23,259 $ 16,465
(1) Net change for the year ended December 31, 2019 includes $18.0 million allowance related to sold advances presented in Other
liabilities (Liability for indemnification obligations).

F-39
Note 8 — Match Funded Assets
December 31,
2019 2018
Advances:
Principal and interest $ 334,617 $ 412,897
Taxes and insurance 330,068 374,853
Foreclosures, bankruptcy, REO and other 137,305 149,544
$ 801,990 $ 937,294
The following table summarizes the activity in match funded assets:
Years Ended December 31,
2019 2018 2017
Advances Advances
Automotive Dealer
Financing Notes Advances
Automotive Dealer
Financing Notes
Beginning balance $ 937,294 $ 1,144,600 $ 32,757 $ 1,451,964 $ —
Transfers from advances — 71,623 — — —
Transfer (to) from Other assets — — (36,896 ) — 25,180
Sales — — — (691 ) —
New advances (collections), net (135,304 ) (278,929 ) 1,504 (306,673 ) 10,212
Decrease (increase) in allowance for losses —
—
2,635
—
(2,635 )
Ending balance $ 801,990 $ 937,294 $ — $ 1,144,600 $ 32,757
Note 9 — Mortgage Servicing
Mortgage Servicing Rights – Amortization Method
Years Ended December 31,
2018 2017
Beginning balance $ 336,882 $ 363,722
Fair value election - transfer to MSRs carried at fair value (1) (361,670 ) —
Additions recognized in connection with asset acquisitions — 1,658
Additions recognized on the sale of mortgage loans — 20,738
Sales — (1,066 )
Servicing transfers and adjustments — 252
(24,788 ) 385,304
Decrease in impairment valuation allowance (1) (2) 24,788 3,366
Amortization (1) — (51,788 )
Ending balance $ — $ 336,882
Estimated fair value at end of year $ — $ 418,745
(1) Effective January 1, 2018, we elected fair value accounting for our MSRs previously accounted for using the amortization method,
which included Agency MSRs and government-insured MSRs. This irrevocable election applies to all subsequently acquired or
originated servicing assets and liabilities that have characteristics consistent with each of these classes. We recorded a cumulative-effect
adjustment of $82.0 million to retained earnings as of January 1, 2018 to reflect the excess of the fair value of the Agency MSRs over
their carrying amount. We also recognized the tax effect of this adjustment through an increase in retained earnings of $6.8 million and a
deferred tax asset for the same amount. However, we established a full valuation allowance on the resulting deferred tax asset through a
reduction in retained earnings. The government-insured MSRs were impaired by $24.8 million at December 31, 2017; therefore, these
MSRs were already effectively carried at fair value.
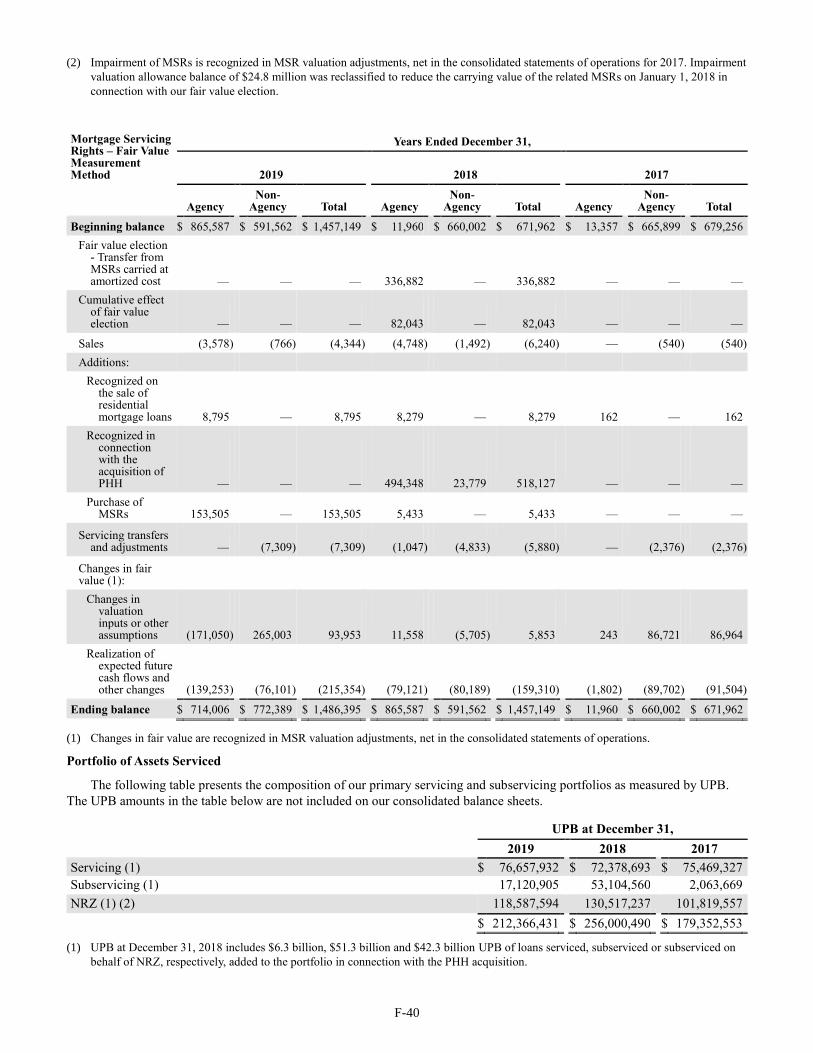
F-40
(2) Impairment of MSRs is recognized in MSR valuation adjustments, net in the consolidated statements of operations for 2017. Impairment
valuation allowance balance of $24.8 million was reclassified to reduce the carrying value of the related MSRs on January 1, 2018 in
connection with our fair value election.
Mortgage Servicing Rights – Fair Value Measurement Method
Years Ended December 31,
2019 2018 2017
Agency Non-
Agency Total Agency Non-
Agency Total Agency Non-
Agency Total
Beginning balance $ 865,587 $ 591,562 $ 1,457,149 $ 11,960 $ 660,002 $ 671,962 $ 13,357 $ 665,899 $ 679,256
Fair value election - Transfer from MSRs carried at amortized cost —
—
—
336,882
—
336,882
—
—
—
Cumulative effect of fair value election —
—
—
82,043
—
82,043
—
—
—
Sales (3,578 ) (766 ) (4,344 ) (4,748 ) (1,492 ) (6,240 ) — (540 ) (540 )
Additions:
Recognized on the sale of residential mortgage loans 8,795
—
8,795
8,279
—
8,279
162
—
162
Recognized in connection with the acquisition of PHH —
—
—
494,348
23,779
518,127
—
—
—
Purchase of MSRs 153,505
—
153,505
5,433
—
5,433
—
—
—
Servicing transfers and adjustments —
(7,309 ) (7,309 ) (1,047 ) (4,833 ) (5,880 ) —
(2,376 ) (2,376 )
Changes in fair value (1):
Changes in valuation inputs or other assumptions (171,050 ) 265,003
93,953
11,558
(5,705 ) 5,853
243
86,721
86,964
Realization of expected future cash flows and other changes (139,253 ) (76,101 ) (215,354 ) (79,121 ) (80,189 ) (159,310 ) (1,802 ) (89,702 ) (91,504 )
Ending balance $ 714,006 $ 772,389 $ 1,486,395 $ 865,587 $ 591,562 $ 1,457,149 $ 11,960 $ 660,002 $ 671,962
(1) Changes in fair value are recognized in MSR valuation adjustments, net in the consolidated statements of operations.
Portfolio of Assets Serviced
The following table presents the composition of our primary servicing and subservicing portfolios as measured by UPB.
The UPB amounts in the table below are not included on our consolidated balance sheets.
UPB at December 31,
2019 2018 2017
Servicing (1) $ 76,657,932 $ 72,378,693 $ 75,469,327
Subservicing (1) 17,120,905 53,104,560 2,063,669
NRZ (1) (2) 118,587,594 130,517,237 101,819,557
$ 212,366,431 $ 256,000,490 $ 179,352,553
(1) UPB at December 31, 2018 includes $6.3 billion, $51.3 billion and $42.3 billion UPB of loans serviced, subserviced or subserviced on
behalf of NRZ, respectively, added to the portfolio in connection with the PHH acquisition.

F-41
(2) UPB of loans for which the Rights to MSRs have been sold to NRZ, including $57.7 billion for which third-party consents have been
received and the MSRs have been transferred to NRZ (the MSRs remain on balance sheet as the transactions do not achieve sale
accounting treatment). At December 31, 2019, the $118.6 billion NRZ UPB includes $6.6 billion of loans that are subserviced on behalf
of NRZ and were added in 2019 by NRZ to the PMC subservicing agreement. This $6.6 billion loan UPB is not included in the MSR
loan UPB or associated Rights to MSRs - See Note 10 — Rights to MSRs.
On February 20, 2020, we received a notice of termination from NRZ with respect to the subservicing agreement between
NRZ and PMC, which accounted for 20% of our servicing portfolio UPB at December 31, 2019. See Note 28 — Subsequent
Events.
We acquired MSRs on portfolios with a UPB of $14.6 billion and $144.1 million during 2019 and 2018, respectively. We
also sold MSRs with a UPB of $140.8 million, $901.3 million and $219.4 million during 2019, 2018 and 2017, respectively.
A significant portion of the servicing agreements for our non-Agency servicing portfolio contain provisions where we
could be terminated as servicer without compensation upon the failure of the serviced loans to meet certain portfolio
delinquency or cumulative loss thresholds. To date, terminations as servicer as a result of a breach of any of these provisions
have been minimal.
At December 31, 2019, the S&P Global Ratings, Inc.’s (S&P) and Fitch Ratings, Inc.’s (Fitch) servicer ratings outlook for
both PMC is stable. Downgrades in servicer ratings could adversely affect our ability to service loans, sell or finance servicing
advances and could impair our ability to consummate future servicing transactions or adversely affect our dealings with
lenders, other contractual counterparties, and regulators, including our ability to maintain our status as an approved servicer by
Fannie Mae and Freddie Mac. The servicer rating requirements of Fannie Mae do not necessarily require or imply immediate
action, as Fannie Mae has discretion with respect to whether we are in compliance with their requirements and what actions it
deems appropriate under the circumstances in the event that we fall below their desired servicer ratings.
Certain of our servicing agreements require that we maintain specified servicer ratings from rating agencies such as
Moody’s and S&P. As a result of our current servicer ratings, termination rights have been triggered in some non-Agency
servicing agreements. To date, terminations as servicer as a result of a breach of any of these provisions have been minimal.
The geographic concentration of the UPB of residential loans and real estate we serviced at December 31, 2019 was as
follows:
Amount Count
California $ 47,350,699 189,959
New York 19,557,621 90,805
Florida 16,366,372 121,875
New Jersey 10,921,867 57,182
Texas 10,073,637 100,868
Other 108,096,235 859,254
$ 212,366,431 1,419,943
Years Ended December 31,
Servicing Revenue 2019 2018 2017
Loan servicing and subservicing fees
Servicing $ 227,490 $ 227,639 $ 259,640
Subservicing 15,459 8,904 7,775
NRZ 577,015 539,039 549,411
819,964 775,582 816,826
Late charges 57,194 61,453 61,763
Home Affordable Modification Program (HAMP) fees (1) 5,538 14,312 43,310
Custodial accounts (float earnings) 47,562 40,115 25,237
Loan collection fees 15,539 18,392 22,770
Other 29,710 27,229 21,691
$ 975,507 $ 937,083 $ 991,597
(1) The HAMP expired on December 31, 2016. Borrowers who had requested assistance or to whom an offer of assistance had been
extended as of that date had until September 30, 2017 to finalize their modification. We continue to earn HAMP success fees for HAMP

F-42
modifications that remain less than 90 days delinquent at the first-, second- and third-year anniversary of the start of the trial
modification.
Float balances (balances in custodial accounts, which represent collections of principal and interest that we receive from
borrowers) are held in escrow by unaffiliated banks and are excluded from our consolidated balance sheets. Float balances
amounted to $1.7 billion, $1.7 billion and $1.5 billion at December 31, 2019, 2018 and 2017, respectively.
Note 10 — Rights to MSRs
Ocwen and PMC have entered into agreements to sell MSRs or Rights to MSRs and the related servicing advances to
NRZ, and in all cases have been retained by NRZ as subservicer. In the case of Ocwen Rights to MSRs transactions, while the
majority of the risks and rewards of ownership were transferred in 2012 and 2013, legal title was retained by Ocwen, causing
the Rights to MSRs transactions to be accounted for as secured financings. In the case of the PMC transactions, and for those
Ocwen MSRs where consents were subsequently received and legal title was transferred to NRZ, due to the length of the non-
cancellable term of the subservicing agreements, the transactions do not qualify as a sale and are accounted for as secured
financings. As a result, we continue to recognize the MSRs and related financing liability on our consolidated balance sheets, as
well as the full amount of servicing revenue and changes in the fair value of the MSRs and related financing liability in our
consolidated statements of operations. Changes in fair value of the Rights to MSRs are recognized in MSR valuation
adjustments, net in the consolidated statements of operations. Changes in fair value of the MSR related financing liability are
reported in Pledged MSR liability expense.
The following tables present selected assets and liabilities recorded on our consolidated balance sheets as well as the
impacts to our consolidated statements of operations in connection with our NRZ agreements.
Years Ended December 31,
2019 2018 2017
Balance Sheets
MSRs, at fair value $ 915,148 $ 894,002 $ 499,042
Due from NRZ (Receivables)
Sales and transfers of MSRs (1) 24,167 23,757 —
Advance funding, subservicing fees and reimbursable expenses 9,197 30,845 14,924
$ 33,364 $ 54,602 $ 14,924
Due to NRZ (Other liabilities) $ 63,596 $ 53,001 $ 98,493
Financing liability - MSRs pledged, at fair value
Original Rights to MSRs Agreements $ 603,046 $ 436,511 $ 499,042
2017 Agreements and New RMSR Agreements (2) 35,445 138,854 9,249
PMC MSR Agreements 312,102 457,491 —
$ 950,593 $ 1,032,856 $ 508,291
Statements of Operations
Servicing fees collected on behalf of NRZ $ 577,015 $ 539,039 $ 549,411
Less: Subservicing fee retained 139,343 142,334 295,192
Net servicing fees remitted to NRZ 437,672 396,705 254,219
Less: Reduction (increase) in financing liability
Changes in fair value:
Original Rights to MSRs Agreements (229,198 ) 171 (83,300 )
2017 Agreements and New RMSR Agreements (5,866 ) 14,369 42,018
PMC MSR Agreements 82,078 4,729 —
(152,986 ) 19,269 (41,282 )
Runoff and settlement:
Original Rights to MSRs Agreements 48,729 58,837 57,264
2017 Agreements and New RMSR Agreements 101,003 134,509 1,926

F-43
Years Ended December 31,
2019 2018 2017
PMC MSR Agreements 64,631 18,420 —
214,363 211,766 59,190
Other 4,206 (6,000 ) —
Pledged MSR liability expense $ 372,089 $ 171,670 $ 236,311
(1) Balance represents the holdback of proceeds from PMC MSR sales and transfers to address indemnification claims and mortgage loan
document deficiencies. These sales were executed by PMC prior to the acquisition date.
(2) $35.4 million income is expected to be recognized for the year ended December 31, 2020 as a reduction in the pledged MSR liability.
Year Ended December 31, 2019
Financing Liability - MSRs Pledged
Original Rights to
MSRs Agreements
2017 Agreements
and New RMSR
Agreements PMC MSR Agreements Total
Beginning balance $ 436,511 $ 138,854 $ 457,491 $ 1,032,856
Additions — — 1,276 1,276
Sales — — 44 44
Changes in fair value:
Original Rights to MSRs Agreements 229,198 — — 229,198
2017 Agreements and New RMSR Agreements — 5,866 — 5,866
PMC MSR Agreements — — (82,078 ) (82,078 )
Runoff and settlement:
Original Rights to MSRs Agreements (48,730 ) — — (48,730 )
2017 Agreements and New RMSR Agreements — (101,003 ) — (101,003 )
PMC MSR Agreements — — (64,631 ) (64,631 )
Calls (1):
Original Rights to MSRs Agreements (13,933 ) — — (13,933 )
2017 Agreements and New RMSR Agreements — (8,272 ) — (8,272 )
PMC MSR Agreements — — — —
Ending balance $ 603,046 $ 35,445 $ 312,102 $ 950,593

F-44
Year Ended December 31, 2018
Financing Liability - MSRs Pledged
Original Rights to
MSRs Agreements
2017 Agreements
and New RMSR
Agreements PMC MSR Agreements Total
Beginning balance $ 499,042 $ 9,249 $ — $ 508,291
Additions — — 667 667
Assumed in connection with the acquisition of PHH —
—
481,020
481,020
Receipt of lump-sum cash payments — 279,586 — 279,586
Changes in fair value:
Original Rights to MSRs Agreements (171 ) — — (171 )
2017 Agreements and New RMSR Agreements — (14,369 ) — (14,369 )
PMC MSR Agreements — — (4,729 ) (4,729 )
Runoff and settlement:
Original Rights to MSRs Agreements (58,837 ) — — (58,837 )
2017 Agreements and New RMSR Agreements — (134,509 ) — (134,509 )
PMC MSR Agreements — — (18,420 ) (18,420 )
Calls (1): — — —
Original Rights to MSRs Agreements (3,523 ) — — (3,523 )
2017 Agreements and New RMSR Agreements — (1,103 ) — (1,103 )
PMC MSR Agreements — — (1,047 ) (1,047 )
Ending balance $ 436,511 $ 138,854 $ 457,491 $ 1,032,856
(1) Represents the carrying value of MSRs in connection with call rights exercised by NRZ, for MSRs transferred to NRZ under the 2017
Agreements and New RMSR Agreements, or by Ocwen at NRZ’s direction, for MSRs underlying the Original Rights to MSRs
Agreements. Ocwen derecognizes the MSRs and the related financing liability upon collapse of the securitization.
Ocwen Transactions
Prior to the transfer of legal title under the Master Servicing Rights Purchase Agreement dated as of October 1, 2012, as
amended, and certain Sale Supplements, as amended (collectively, the Original Rights to MSRs Agreements), Ocwen agreed to
service the mortgage loans underlying the MSRs on the economic terms set forth in the Original Rights to MSRs Agreements.
After the transfer of legal title as contemplated under the Original Rights to MSRs Agreements, Ocwen was to service the
mortgage loans underlying the MSRs as subservicer on substantially the same economic terms.
On July 23, 2017 and January 18, 2018, we entered into a series of agreements with NRZ that collectively modify,
supplement and supersede the arrangements among the parties as set forth in the Original Rights to MSRs Agreements. The
July 23, 2017 agreements, as amended, include a Master Agreement, a Transfer Agreement and the Subservicing Agreement
between Ocwen and New Residential Mortgage LLC (NRM), a subsidiary of NRZ, relating to non-agency loans (the NRM
Subservicing Agreement) (collectively, the 2017 Agreements) pursuant to which the parties agreed, among other things, to
undertake certain actions to facilitate the transfer from Ocwen to NRZ of Ocwen’s legal title to the remaining MSRs that were
subject to the Original Rights to MSRs Agreements and under which Ocwen would subservice mortgage loans underlying the
MSRs for an initial term ending July 2022 (the Initial Term).
On January 18, 2018, the parties entered into new agreements (including a Servicing Addendum) regarding the Rights to
MSRs related to MSRs that remained subject to the Original Rights to MSRs Agreements as of January 1, 2018 and amended
the Transfer Agreement (collectively, New RMSR Agreements) to accelerate the implementation of certain parts of our
arrangements in order to achieve the intent of the 2017 Agreements sooner. Under the new agreements, following receipt of the
required consents and transfer of the MSRs, Ocwen subservices the mortgage loans underlying the transferred MSRs pursuant
to the 2017 Agreements and the August 2018 subservicing agreement with NewRez LLC dba Shellpoint Mortgage Servicing
(Shellpoint) described below.
Ocwen received lump-sum cash payments of $54.6 million and $279.6 million in September 2017 and January 2018 in
accordance with the terms of the 2017 Agreements and New RMSR Agreements, respectively. These upfront payments
generally represent the net present value of the difference between the future revenue stream Ocwen would have received under
the Original Rights to MSRs Agreements and the future revenue stream Ocwen expects to receive under the 2017 Agreements

F-45
and the New RMSR Agreements. We recognized the cash received as a financing liability that we are accounting for at fair
value through the remaining term of the original agreements (April 2020). Changes in fair value are recognized in Pledged
MSR liability expense in the consolidated statements of operations.
On August 17, 2018, Ocwen and NRZ entered into certain amendments (i) to the New RMSR Agreements to include
Shellpoint, a subsidiary of NRZ, as a party to which legal title to the MSRs could be transferred after related consents are
received, (ii) to add a Subservicing Agreement between Ocwen and Shellpoint relating to non-agency loans (the Shellpoint
Subservicing Agreement), (iii) to add an Agency Subservicing Agreement between Ocwen and NRM relating to agency loans
(the Agency Subservicing Agreement), and (iv) to conform the New RMSR Agreements and the NRM Subservicing Agreement
to certain of the terms of the Shellpoint Subservicing Agreement and the Agency Subservicing Agreement.
At any time during the Initial Term, NRZ may terminate the Subservicing Agreements and Servicing Addendum for
convenience, subject to Ocwen’s right to receive a termination fee and 180 days’ notice. The termination fee is calculated as
specified in the Subservicing Agreements and Servicing Addendum, and is a discounted percentage of the expected revenues
that would be owed to Ocwen over the remaining contract term based on certain portfolio run off assumptions.
Following the Initial Term, NRZ may extend the term of the Subservicing Agreements and Servicing Addendum for
additional three-month periods by providing proper notice. Following the Initial Term, the Subservicing Agreements and
Servicing Addendum can be cancelled by Ocwen on an annual basis. NRZ and Ocwen have the ability to terminate the
Subservicing Agreements and Servicing Addendum for cause if certain specified conditions occur. The terminations must be
terminations in whole (i.e., cover all the loans under the relevant Subservicing Agreement or Servicing Addendum) and not in
part, except for limited circumstances specified in the agreements. In addition, if NRZ terminates any of the NRM or Shellpoint
Subservicing Agreements or the Servicing Addendum for cause, the other agreements will also terminate automatically.
Under the terms of the Subservicing Agreements and Servicing Addendum, in addition to a base servicing fee, Ocwen
receives certain ancillary fees, primarily late fees, loan modification fees and Speedpay® fees. We may also receive certain
incentive fees or pay penalties tied to various contractual performance metrics. NRZ receives all float earnings and deferred
servicing fees related to delinquent borrower payments, as well as being entitled to receive certain real estate owned (REO)
related income including REO referral commissions.
As of December 31, 2019, the UPB of MSRs subject to the Servicing Agreements and the New RMSR Agreements is
$76.1 billion, including $18.5 billion for which title has not transferred to NRZ. We and NRZ are currently discussing various
alternative arrangements for the servicing of these MSRs. As the third-party consents required for title to the MSRs to transfer
were not obtained by May 31, 2019, the New RMSR Agreements set forth a process under which NRZ’s $18.5 billion Rights to
MSRs may (i) be acquired by Ocwen at a price determined in accordance with the terms of the New RMSR Agreements, at the
option of Ocwen, or (ii) be sold, together with Ocwen’s title to those MSRs, to a third party in accordance with the terms of the
New RMSR Agreements, subject to an additional Ocwen option to acquire at a price based on the winning third-party bid rather
than selling to the third party. If the Rights to MSRs are not transferred pursuant to these alternatives, then the Rights to MSRs
will remain subject to the New RMSR Agreements.
In addition, as noted above, during the Initial Term, NRZ has the right to terminate the $18.5 billion New RMSR
Agreements for convenience, in whole but not in part, subject to payment of a termination fee and 180 days’ notice. If NRZ
exercises this termination right, NRZ has the option of seeking (i) the transfer of the MSRs through a sale to a third party of its
Rights to MSRs (together with a transfer of Ocwen’s title to those MSRs) or (ii) a substitute RMSR arrangement that
substantially replicates the Rights to MSRs structure (a Substitute RMSR Arrangement) under which we would transfer title to
the MSRs to a successor servicer and NRZ would continue to own the economic rights and obligations related to the MSRs. In
the case of option (i), we have a purchase option as specified in the New RMSR Agreements. If NRZ is not able to sell the
Rights to MSRs or establish a Substitute RMSR Arrangement with another servicer, NRZ has the right to revoke its termination
notice and re-instate the Servicing Addendum or to establish a subservicing arrangement whereby the MSRs remaining subject
to the New RMSR Agreements would be transferred to up to three subservicers who would subservice under Ocwen’s
oversight. If such a subservicing arrangement were established, Ocwen would receive an oversight fee and reimbursement of
expenses. We may also agree on alternative arrangements that are not contemplated under our existing agreements or that are
variations of those contemplated under our existing agreements.
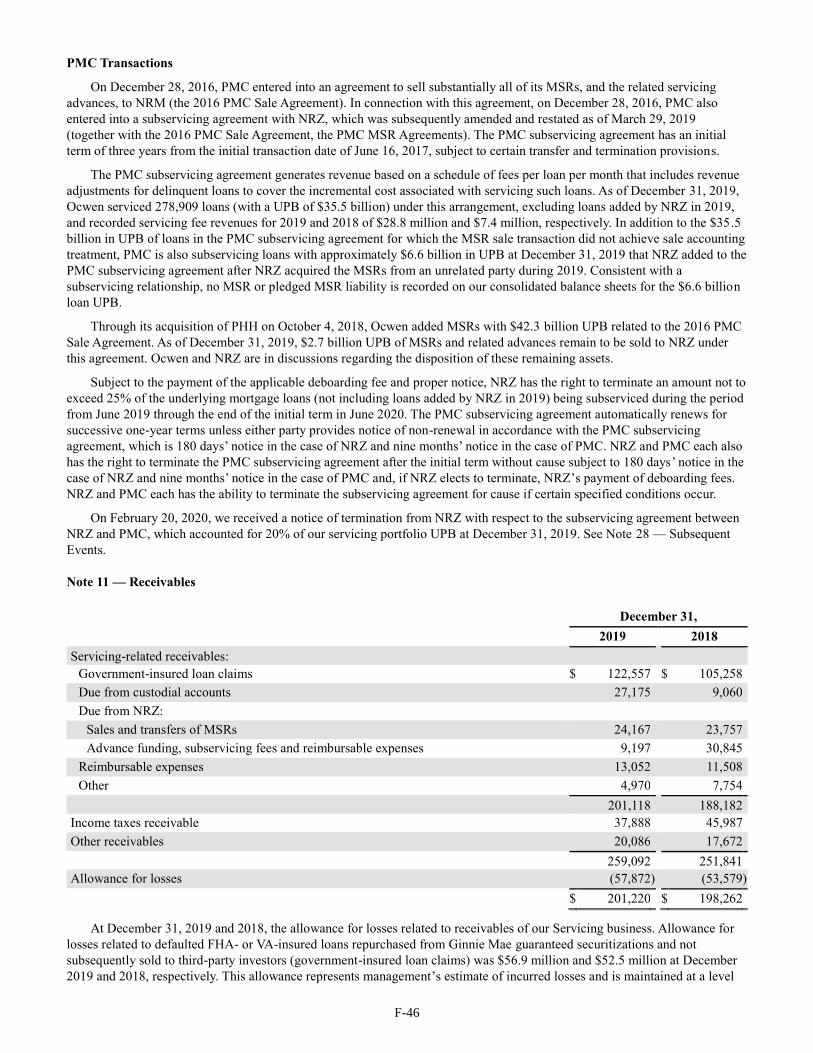
F-46
PMC Transactions
On December 28, 2016, PMC entered into an agreement to sell substantially all of its MSRs, and the related servicing
advances, to NRM (the 2016 PMC Sale Agreement). In connection with this agreement, on December 28, 2016, PMC also
entered into a subservicing agreement with NRZ, which was subsequently amended and restated as of March 29, 2019
(together with the 2016 PMC Sale Agreement, the PMC MSR Agreements). The PMC subservicing agreement has an initial
term of three years from the initial transaction date of June 16, 2017, subject to certain transfer and termination provisions.
The PMC subservicing agreement generates revenue based on a schedule of fees per loan per month that includes revenue
adjustments for delinquent loans to cover the incremental cost associated with servicing such loans. As of December 31, 2019,
Ocwen serviced 278,909 loans (with a UPB of $35.5 billion) under this arrangement, excluding loans added by NRZ in 2019,
and recorded servicing fee revenues for 2019 and 2018 of $28.8 million and $7.4 million, respectively. In addition to the $35.5
billion in UPB of loans in the PMC subservicing agreement for which the MSR sale transaction did not achieve sale accounting
treatment, PMC is also subservicing loans with approximately $6.6 billion in UPB at December 31, 2019 that NRZ added to the
PMC subservicing agreement after NRZ acquired the MSRs from an unrelated party during 2019. Consistent with a
subservicing relationship, no MSR or pledged MSR liability is recorded on our consolidated balance sheets for the $6.6 billion
loan UPB.
Through its acquisition of PHH on October 4, 2018, Ocwen added MSRs with $42.3 billion UPB related to the 2016 PMC
Sale Agreement. As of December 31, 2019, $2.7 billion UPB of MSRs and related advances remain to be sold to NRZ under
this agreement. Ocwen and NRZ are in discussions regarding the disposition of these remaining assets.
Subject to the payment of the applicable deboarding fee and proper notice, NRZ has the right to terminate an amount not to
exceed 25% of the underlying mortgage loans (not including loans added by NRZ in 2019) being subserviced during the period
from June 2019 through the end of the initial term in June 2020. The PMC subservicing agreement automatically renews for
successive one-year terms unless either party provides notice of non-renewal in accordance with the PMC subservicing
agreement, which is 180 days’ notice in the case of NRZ and nine months’ notice in the case of PMC. NRZ and PMC each also
has the right to terminate the PMC subservicing agreement after the initial term without cause subject to 180 days’ notice in the
case of NRZ and nine months’ notice in the case of PMC and, if NRZ elects to terminate, NRZ’s payment of deboarding fees.
NRZ and PMC each has the ability to terminate the subservicing agreement for cause if certain specified conditions occur.
On February 20, 2020, we received a notice of termination from NRZ with respect to the subservicing agreement between
NRZ and PMC, which accounted for 20% of our servicing portfolio UPB at December 31, 2019. See Note 28 — Subsequent
Events.
Note 11 — Receivables
December 31,
2019 2018
Servicing-related receivables:
Government-insured loan claims $ 122,557 $ 105,258
Due from custodial accounts 27,175 9,060
Due from NRZ:
Sales and transfers of MSRs 24,167 23,757
Advance funding, subservicing fees and reimbursable expenses 9,197 30,845
Reimbursable expenses 13,052 11,508
Other 4,970 7,754
201,118 188,182
Income taxes receivable 37,888 45,987
Other receivables 20,086 17,672
259,092 251,841
Allowance for losses (57,872 ) (53,579 )
$ 201,220 $ 198,262
At December 31, 2019 and 2018, the allowance for losses related to receivables of our Servicing business. Allowance for
losses related to defaulted FHA- or VA-insured loans repurchased from Ginnie Mae guaranteed securitizations and not
subsequently sold to third-party investors (government-insured loan claims) was $56.9 million and $52.5 million at December
2019 and 2018, respectively. This allowance represents management’s estimate of incurred losses and is maintained at a level

F-47
that management considers adequate based upon continuing assessments of collectibility, current trends, and historical loss
experience.
Allowance for Losses - Government-Insured Loan Claims
Years Ended December 31,
2019 2018 2017
Beginning balance $ 52,497 $ 53,340 $ 53,258
Provision 29,034 37,352 40,424
Charge-offs and other, net (24,663 ) (38,195 ) (40,342 )
Ending balance $ 56,868 $ 52,497 $ 53,340
Note 12 — Premises and Equipment
December 31,
2019 2018
Computer hardware $ 32,747 $ 34,240
Operating lease right-of-use assets 31,329 —
Computer software 24,377 46,029
Leasehold improvements 22,019 27,798
Buildings 8,550 9,689
Office equipment 6,929 7,370
Furniture and fixtures 3,506 4,674
Other 44 818
129,501 130,618
Less accumulated depreciation and amortization (91,227 ) (97,201 )
$ 38,274 $ 33,417
Note 13 — Other Assets
December 31,
2019 2018
Contingent loan repurchase asset $ 492,900 $ 302,581
Other prepaid expenses 21,996 27,647
Prepaid representation, warranty and indemnification claims - Agency MSR sale 15,173 15,173
Prepaid lender fees, net (1) 8,647 6,589
REO 8,556 7,368
Derivatives, at fair value 6,007 4,552
Deferred tax assets, net 2,169 5,289
Security deposits 2,163 2,278
Mortgage-backed securities, at fair value 2,075 1,502
Interest-earning time deposits 390 1,338
Other 3,164 5,250
$ 563,240 $ 379,567
(1) We amortize these costs to the earlier of the scheduled amortization date, contractual maturity date or prepayment date of the debt.

F-48
Note 14 — Borrowings
Match Funded Liabilities
December 31, 2019 December 31, 2018
Borrowing Type Maturity
(1)
Amorti-zation
Date (1)
Available Borrowing Capacity
(2)
Weighted Average Interest Rate (3) Balance
Weighted Average Interest Rate (3) Balance
Advance Financing Facilities
Advance Receivables Backed Notes - Series 2015-VF5 (4) Dec. 2049 Dec. 2020 $ 9,445
3.36
$ 190,555
4.06
$ 216,559
Advance Receivables Backed Notes - Series 2016-T2 (5) Aug. 2049 Aug. 2019 —
—
—
2.99
235,000
Advance Receivables Backed Notes, Series 2018-T1 (5) Aug. 2049 Aug. 2019 —
—
—
3.50
150,000
Advance Receivables Backed Notes, Series 2018-T2 (5) Aug. 2050 Aug. 2020 —
—
—
3.81
150,000
Advance Receivables Backed Notes, Series 2019-T1 (5) Aug. 2050 Aug. 2020 —
2.62
185,000
—
—
Advance Receivables Backed Notes, Series 2019-T2 (5) Aug. 2051 Aug. 2021 —
2.53
285,000
—
—
Total Ocwen Master Advance Receivables Trust (OMART) 9,445
2.79
660,555
3.56
751,559
Ocwen Freddie Advance Funding (OFAF) - Advance Receivables Backed Notes, Series 2015-VF1 (6) Jun. 2050 Jun. 2020 41,446
3.53
18,554
5.03
26,725
$ 50,891 2.81 % $ 679,109 3.61 % $ 778,284
(1) The amortization date of our facilities is the date on which the revolving period ends under each advance facility note and repayment of
the outstanding balance must begin if the note is not renewed or extended. The maturity date is the date on which all outstanding
balances must be repaid. In all of our advance facilities, there are multiple notes outstanding. For each note, after the amortization date,
all collections that represent the repayment of advances pledged to the facility must be applied ratably to each outstanding amortizing
note to reduce the balance and as such the collection of advances allocated to the amortizing note may not be used to fund new advances.
(2) Borrowing capacity under the OMART and OFAF facilities is available to us provided that we have sufficient eligible collateral to
pledge. At December 31, 2019, none of the available borrowing capacity of our advance financing notes could be used based on the
amount of eligible collateral.
(3) 1ML was 1.76% and 2.50% at December 31, 2019 and 2018, respectively.
(4) On December 12, 2019, we renewed this facility through December 11, 2020 and borrowing capacity was reduced from $225.0 million
to $200.0 million, with interest computed based on the lender’s cost of funds plus a margin. At December 31, 2019, the weighted
average interest margin was 136 bps.
(5) On August 14, 2019, we issued two fixed-rate term notes of $185.0 million (Series 2019 T-1) and $285.0 million (Series 2019-T2) with
amortization dates of August 17, 2020 and August 16, 2021, respectively, for a total combined borrowing capacity of $470.0 million.
The weighted average rate of the notes at December 31, 2019 is 2.57% with rates on the individual classes of notes ranging from 2.42%
to 4.44%. The Series 2016-T2, 2018-T1 and 2018-T2 fixed-rate term notes were all redeemed on August 15, 2019.
(6) On June 6, 2019, we renewed this facility through June 5, 2020 and borrowing capacity was reduced from $65.0 million to $60.0 million
with interest computed based on the lender’s cost of funds plus a margin. At December 31, 2019, the weighted average interest margin
was 157 bps.
Pursuant to the 2017 Agreements and New RMSR Agreements, NRZ is obligated to fund new servicing advances with
respect to the MSRs underlying the Rights to MSRs. We are dependent upon NRZ for funding the servicing advance
obligations for Rights to MSRs where we are the servicer. As the servicer, we are contractually required under our servicing
agreements to make certain servicing advances even if NRZ does not perform its contractual obligations to fund those
advances. NRZ currently uses advance financing facilities in order to fund a substantial portion of the servicing advances that
they are contractually obligated to purchase pursuant to our agreements with them. As of December 31, 2019, we were the
servicer of Rights to MSRs sold to NRZ pertaining to $18.5 billion in UPB, which excludes those Rights to MSRs where legal
title has transferred to NRZ. NRZ’s associated outstanding servicing advances as of such date were approximately $704.2
million. Should NRZ’s advance financing facilities fail to perform as envisaged or should NRZ otherwise be unable to meet its
advance funding obligations, our liquidity, financial condition, result of operations and business could be materially and
adversely affected. As the servicer, we are contractually required under our servicing agreements to make certain servicing
advances even if NRZ does not perform its contractual obligations to fund those advances. See Note 10 — Rights to MSRs for
additional information.

F-49
In addition, although we are not an obligor or guarantor under NRZ’s advance financing facilities, we are a party to certain
of the facility documents as the servicer of the underlying loans on which advances are being financed. As the servicer, we
make certain representations, warranties and covenants, including representations and warranties in connection with advances
subsequently sold to, or reimbursed by, NRZ.
Financing Liabilities Outstanding Balance at
December 31,
Borrowing Type Collateral Interest
Rate Maturity 2019 2018
HMBS-Related Borrowings, at fair value (1)
Loans held for
investment 1ML + 260 bps (1) $ 6,063,435
$ 5,380,448
Other Financing Liabilities
MSRs pledged (Rights to MSRs), at fair value:
Original Rights to MSRs Agreements MSRs (2) (2) 603,046 436,511
2017 Agreements and New RMSR Agreements MSRs (3) (3) 35,445 138,854
PMC MSR Agreements MSRs (4) (4) 312,102 457,491
950,593 1,032,856
Financing liability - Owed to securitization investors, at fair value:
IndyMac Mortgage Loan Trust (INDX 2004-AR11) (5)
Loans held for
investment (5) (5) 9,794
11,012
Residential Asset Securitization Trust 2003-A11 (RAST 2003-A11) (5)
Loans held for
investment (5) (5) 12,208
13,803
22,002 24,815
Advances pledged (6) Advances on loans (6) —
4,419
Total Other financing liabilities 972,595 1,062,090
$ 7,036,030 $ 6,442,538
(1) Represents amounts due to the holders of beneficial interests in Ginnie Mae guaranteed HMBS which did not qualify for sale accounting
treatment of HECM loans. Under this accounting treatment, the HECM loans securitized with Ginnie Mae remain on our consolidated
balance sheet and the proceeds from the sale are recognized as a secured liability. The beneficial interests have no maturity dates, and the
borrowings mature as the related loans are repaid. We elected to record the HMBS-related borrowings at fair value consistent with the
related HECM loans. Changes in fair value are reported within Reverse mortgage revenue, net.
(2) This pledged MSR liability is recognized due to the accounting treatment of MSR sale transactions with NRZ which did not qualify as
sales for accounting purposes. Under this accounting treatment, the MSRs transferred to NRZ remain on the consolidated balance sheet
and the proceeds from the sale are recognized as a secured liability. This financing liability has no contractual maturity or repayment
schedule. We elected to record the liability at fair value consistent with the related MSRs. The balance of the liability is adjusted each
reporting period to its fair value based on the present value of the estimated future cash flows underlying the related MSRs. Changes in
fair value are reported within Pledged MSR liability expense, and are offset by corresponding changes in fair value of the MSR pledged
to NRZ within MSR valuation adjustments, net.
(3) This financing liability arose in connection with lump sum payments of $54.6 million received upon transfer of legal title of the MSRs
related to the Rights to MSRs transactions to NRZ in September 2017. In connection with the execution of the New RMSR Agreements
in January 2018, we received a lump sum payment of $279.6 million as compensation for foregoing certain payments under the Original
Rights to MSRs Agreements. The balance of the liability is adjusted each reporting period to its fair value based on the present value of
the estimated future cash flows. The expected maturity of the liability is April 30, 2020, the date through which we were scheduled to be
the servicer on loans underlying the Rights to MSRs per the Original Rights to MSRs Agreements.
(4) Represents a liability for sales of MSRs to NRZ which did not qualify for sale accounting treatment and are accounted for as a secured
borrowing which we assumed in connection with the acquisition of PHH. Under this accounting treatment, the MSRs transferred to NRZ
remain on the consolidated balance sheet and the proceeds from the sale are recognized as a secured liability. We elected to record the
liability at fair value consistent with the related MSRs.
(5) Consists of securitization debt certificates due to third parties that represent beneficial interests in trusts that we include in our
consolidated financial statements, as more fully described in Note 4 — Securitizations and Variable Interest Entities. The holders of
these certificates have no recourse against the assets of Ocwen. The certificates in the INDX 2004-AR11 Trust pay interest based on
variable rates which are generally based on weighted average net mortgage rates and which range between 3.39% and 3.85% at

F-50
December 31, 2019. The certificates in the RAST 2003-A11 Trust pay interest based on fixed rates ranging between 4.25% and 5.75%
and a variable rate based on 1ML plus 0.45%. The maturity of the certificates occurs upon maturity of the loans held by the trust. The
remaining loans in the INDX 2004-AR11 Trust and RAST 2003-A11 Trust have maturity dates extending through November 2034 and
October 2033, respectively.
(6) Certain sales of advances did not qualify for sales accounting treatment and were accounted for as a financing. This financing liability
has no contractual maturity. The effective interest rate is based on 1ML plus a margin of 450 bps.

F-51
Other Secured Borrowings Outstanding Balance at
December 31,
Borrowing Type Collateral Interest Rate Termination / Maturity
Available Borrowing Capacity
(1) 2019 2018
SSTL (2) (2)
1-MonthEuro-dollar
rate + 500 bps with a
Eurodollar floor of 100
bps (2) Dec. 2020 $ — $ 326,066 $ 231,500
Mortgage loan warehouse facilities
Master repurchase agreement (3)
Loans held for sale (LHFS)
1ML + 195 - 300 bps Sep. 2020 8,427 91,573 74,693
Participation agreements (4) LHFS N/A Jul. 2019 — — 42,331
Mortgage warehouse agreement (5)
LHFS (reverse
mortgages)
1ML + 250 bps; 1ML
floor of 350 bps Aug. 2020 — 72,443 8,009
Master repurchase agreement (6)
LHFS (forward
and reverse mortgages)
1ML + 225 bps forward; 1ML + 275 bps reverse Dec. 2020 60,773 139,227 30,680
Master repurchase agreement (7)
LHFS (reverse
mortgages) Prime - 0.25% (3.75% floor) Jan. 2020 — 898 —
Master repurchase agreement (8) N/A
1ML + 170 bps N/A — — —
Participation agreement (9) LHFS (9) Feb. 2020 — 17,304 —
Mortgage warehouse agreement (10)
LHFS (reverse
mortgages)
1ML + 350 bps; 1ML
floor of 525 bps Dec. 2020 39,220 10,780 —
108,420 332,225 155,713
Agency MSR financing facility (11) MSRs
1ML + 300 bps Jun. 2020 152,294 147,706 —
Ginnie Mae MSR financing facility (12) MSRs
1ML + 395 bps Nov. 2021 27,680 72,320 —
Ocwen Excess Spread-Collateralized Notes, Series 2019-PLS1 (13) MSRs 5.07% Nov. 2024 — 94,395 —
Ocwen Asset Servicing Income Series Notes, Series 2014-1 (14) MSRs (14) Feb. 2028 — 57,594 65,523
179,974 372,015 65,523
$ 288,394 1,030,306 452,736
Unamortized debt issuance costs - SSTL and PLS Notes (3,381 ) (3,098 )
Discount - SSTL (1,134 ) (1,577 )
$ 1,025,791 $ 448,061
Weighted average interest rate 4.74 % 4.70 %

F-52
(1) Available borrowing capacity for our mortgage loan warehouse facilities does not consider the amount of the facility that the lender has
extended on an uncommitted basis. Of the borrowing capacity extended on a committed basis, none of the available borrowing capacity
could be used at December 31, 2019 based on the amount of eligible collateral that could be pledged.
(2) On March 18, 2019, we entered into a Joinder and Amendment Agreement which amends the existing Amended and Restated SSTL
Facility Agreement dated December 5, 2016 to provide an additional term loan of $120.0 million subject to the same maturity, interest
rate and other material terms of existing borrowings under the SSTL. Effective with this amendment, the quarterly principal payment
increased from $4.2 million to $6.4 million beginning March 31, 2019. See information regarding collateral in the table below.
Borrowings bear interest, at the election of Ocwen, at a rate per annum equal to either (a) the base rate (the greatest of (i) the prime rate
in effect on such day, (ii) the federal funds rate in effect on such day plus 0.50% and (iii) 1ML, plus a margin of 4.00% and subject to a
base rate floor of 2.00% or (b) 1ML, plus a margin of 5.00% and subject to a 1ML floor of 1.00%. To date we have elected option (b) to
determine the interest rate.
On January 27, 2020, we prepaid $126.1 million of the outstanding balance at December 31, 2019 and executed an additional
amendment to the SSTL which reduced the maximum borrowing capacity to $200.0 million, extended the maturity date to May 15,
2022, reduced the quarterly principal payment to $5.0 million and modified the interest rate. See Note 28 — Subsequent Events for
additional information.
(3) The maximum borrowing under this agreement is $175.0 million, of which $100.0 million is available on a committed basis and the
remainder is available at the discretion of the lender. On September 27, 2019, we renewed this facility through September 25, 2020.
(4) Effective with the mergers of Homeward Residential, Inc. (Homeward) into PMC in February 2019 and Ocwen Loan Servicing, LLC
(OLS) into PMC in June 2019, the participation agreements with total uncommitted borrowing capacity of $250.0 million were
terminated.
(5) Under this participation agreement, the lender provides financing for $100.0 million on an uncommitted basis. The participation
agreement allows the lender to acquire a 100% beneficial interest in the underlying mortgage loans. The transaction does not qualify for
sale accounting treatment and is accounted for as a secured borrowing. On August 13, 2019, we renewed this facility through August 14,
2020.
(6) On December 6, 2019, we renewed this facility through December 5, 2020. The maximum borrowing under this agreement is $250.0
million, of which $200.0 million is available on a committed basis and the remainder is available on an uncommitted basis. The
agreement allows the lender to acquire a 100% beneficial interest in the underlying mortgage loans. The transaction does not qualify for
sale accounting treatment and is accounted for as a secured borrowing.
(7) Under this agreement, the lender provides financing for up to $50.0 million on an uncommitted basis. This facility expired on January
22, 2020 and was not renewed.
(8) This agreement was originally entered into by PHH and subsequently assumed by Ocwen in connection with its acquisition of PHH. The
lender provides financing for up to $200.0 million at the discretion of the lender. The agreement has no stated maturity date.
(9) We entered into a master participation agreement on February 4, 2019 under which the lender will provide $300.0 million of borrowing
capacity to PMC on an uncommitted basis. The participation agreement allows the lender to acquire a 100% beneficial interest in the
underlying mortgage loans. The transaction does not qualify for sale accounting treatment and is accounted for as a secured borrowing.
The lender earns the stated interest rate of the underlying mortgage loans less 25 bps while the loans are financed under the participation
agreement. On January 27, 2020, we renewed this facility through April 3, 2020.
(10) On December 26, 2019, PMC entered into a warehouse facility. Under this agreement, the lender provides financing for up to $50.0
million on a committed basis. The lender earns the stated interest rate of 1ML plus a margin of 350 bps .
(11) On July 1, 2019, PMC entered into a financing facility that is secured by certain Fannie Mae and Freddie Mac MSRs. In connection with
this facility, PMC entered into repurchase agreements pursuant to which PMC sold trust certificates representing certain indirect
economic interests in the MSRs and agreed to repurchase such trust certificates at a future date at the repurchase price set forth in the
repurchase agreements. PMC’s obligations under this facility are secured by a lien on the related MSRs. Ocwen guarantees the
obligations of PMC under this facility. The maximum amount which we may borrow pursuant to the repurchase agreements is $300.0
million on a committed basis. The lender earns the stated interest rate of 1ML plus a margin of 300 bps. See Note 4 — Securitizations
and Variable Interest Entities for additional information.
(12) On November 26, 2019, PMC entered into a financing facility that is secured by certain Ginnie Mae MSRs. In connection with the
facility, PMC entered into a repurchase agreement pursuant to which PMC has sold a participation certificate representing certain
economic interests in the Ginnie Mae MSRs and has agreed to repurchase such participation certificate at a future date at the repurchase
price set forth in the repurchase agreement. PMC’s obligations under the facility are secured by a lien on the related Ginnie Mae MSRs.
Ocwen guarantees the obligations of PMC under the facility. The maximum amount available to be borrowed pursuant to the facility is
$27.7 million on a committed basis. The lender earns the stated interest rate of 1ML plus a margin of 395 bps.
(13) On November 26, 2019, PMC issued the PLS Notes secured by certain of PMC’s MSRs (PLS MSRs) pursuant to a credit agreement.
PLS Issuer’s obligations under the facility are secured by a lien on the related PLS MSRs. Ocwen guarantees the obligations of PLS
Issuer under the facility. The Class A PLS Notes issued pursuant to the credit agreement have an initial principal amount of $100.0
million and amortize in accordance with a pre-determined schedule subject to modification under certain events. The notes have a stated
coupon rate of 5.07%. See Note 4 — Securitizations and Variable Interest Entities for additional information.
(14) OASIS noteholders are entitled to receive a monthly payment equal to the sum of: (a) 21 basis points of the UPB of the reference pool of
Freddie Mac mortgages; (b) any termination payment amounts; (c) any excess refinance amounts; and (d) the note redemption amounts,
each as defined in the indenture supplement for the notes. Monthly amortization of the liability is estimated using the proportion of
monthly projected service fees on the underlying MSRs as a percentage of lifetime projected fees, adjusted for the term of the notes.

F-53
Senior Notes
Outstanding Balance at December 31,
Interest Rate Maturity 2019 2018
Senior unsecured notes:
PHH (1) (2) 7.375% Sep. 2019 $ — $ 97,521
PHH (2) 6.375% Aug. 2021 21,543 21,543
21,543 119,064
Senior secured notes (3) 8.375% Nov. 2022 291,509 330,878
313,052 449,942
Unamortized debt issuance costs (1,470 ) (2,075 )
Fair value adjustments (2) (497 ) 860
$ 311,085 $ 448,727
(1) On September 2, 2019, we redeemed all of the Senior unsecured notes due in September 2019, at a redemption price of 100.0% of the
outstanding principal balance plus accrued and unpaid interest.
(2) These notes were originally issued by PHH and subsequently assumed by Ocwen in connection with its acquisition of PHH. We
recorded the notes at their respective fair values on the date of acquisition, and we are amortizing the resulting fair value purchase
accounting adjustments over the remaining term of the notes. We have the option to redeem the notes due in August 2021, in whole or in
part, on or after January 1, 2019 at a redemption price equal to 100.0% of the principal amount plus any accrued and unpaid interest.
(3) During July and August 2019, we repurchased a total of $39.4 million of our 8.375% Senior secured notes in the open market for a price
of $34.3 million. We recognized a gain of $5.1 million on these repurchases which is reported in Gain on repurchases of senior secured
notes in the consolidated statement of operations.
At any time, we may redeem all or a part of the 8.375% Senior secured notes, upon not less than 30 nor more than 60 days’
notice at a specified redemption price, plus accrued and unpaid interest to the date of redemption. We may redeem all or a part
of these notes at the redemption prices (expressed as percentages of principal amount) specified in the Indenture. The
redemption prices during the twelve-month periods beginning on November 15th of each year are as follows:
Year Redemption Price
2018 106.281 %
2019 104.188
2020 102.094
2021 and thereafter 100.000
Upon a change of control (as defined in the Indenture), we are required to make an offer to the holders of the 8.375%
Senior secured notes to repurchase all or a portion of each holder’s notes at a purchase price equal to 101.0% of the principal
amount of the notes purchased plus accrued and unpaid interest to the date of purchase.
The Indenture contains certain covenants, including, but not limited to, limitations and restrictions on Ocwen’s ability and
the ability of its restricted subsidiaries (including PMC as the surviving entity in the merger with OLS) to (i) incur additional
debt or issue preferred stock; (ii) pay dividends or make distributions on or purchase equity interests of Ocwen (iii) repurchase
or redeem subordinated debt prior to maturity; (iv) make investments or other restricted payments; (v) create liens on assets to
secure debt of PMC or any Guarantor; (vi) sell or transfer assets; (vii) enter into transactions with affiliates; and (viii) enter into
mergers, consolidations, or sales of all or substantially all of the assets of Ocwen and its restricted subsidiaries, taken as a
whole. As of the date of the Indenture, all of Ocwen’s subsidiaries are restricted subsidiaries. The restrictive covenants set forth
in the Indenture are subject to important exceptions and qualifications. Many of the restrictive covenants will be suspended if
(i) the Senior Secured Notes achieve an investment grade rating from both Moody’s and S&P and (ii) no default or event of
default has occurred and is continuing under the Indenture. Covenants that are suspended as a result of achieving these ratings
will again apply if one or both of Moody’s and S&P withdraws its investment grade rating or downgrades the rating assigned to
the Senior Secured Notes below an investment grade rating.
Credit Ratings
Credit ratings are intended to be an indicator of the creditworthiness of a company’s debt obligation. At December 31,
2019, the S&P issuer credit rating for Ocwen was “B-”. On June 1, 2019, OLS, the borrower under the SSTL and 8.375%
Senior secured notes, merged with PMC which became the successor obligor for these borrowings. As a result, on July 3, 2019,
S&P withdrew the ratings of OLS and assigned a B- issuer credit rating with Negative outlook to PMC. On January 27, 2020
S&P upgraded the outlook for the issuer rating from Negative to Stable simultaneously with the closing of the SSTL

F-54
transaction. On September 11, 2019 Moody’s withdrew the Caa1 corporate family rating of Ocwen as it no longer maintained
any rated debt outstanding and issued a corporate family rating of Caa1 with negative outlook to PMC. It is possible that
additional actions by credit rating agencies could have a material adverse impact on our liquidity and funding position,
including materially changing the terms on which we may be able to borrow money.
Covenants
Under the terms of our debt agreements, we are subject to various qualitative and quantitative covenants. Collectively,
these covenants include:
• Financial covenants;
• Covenants to operate in material compliance with applicable laws;
• Restrictions on our ability to engage in various activities, including but not limited to incurring additional forms of
debt, paying dividends or making distributions on or purchasing equity interests of Ocwen, repurchasing or redeeming
capital stock or junior capital, repurchasing or redeeming subordinated debt prior to maturity, issuing preferred stock,
selling or transferring assets or making loans or investments or acquisitions or other restricted payments, entering into
mergers or consolidations or sales of all or substantially all of the assets of Ocwen and its subsidiaries, creating liens
on assets to secure debt of any guarantor, entering into transactions with affiliates;
• Monitoring and reporting of various specified transactions or events, including specific reporting on defined events
affecting collateral underlying certain debt agreements; and
• Requirements to provide audited financial statements within specified timeframes, including requirements that
Ocwen’s financial statements and the related audit report be unqualified as to going concern.
Many of the restrictive covenants arising from the indenture for the Senior Secured Notes will be suspended if the Senior
Secured Notes achieve an investment-grade rating from both Moody’s and S&P and if no default or event of default has
occurred and is continuing.
Financial covenants in certain of our debt agreements require that we maintain, among other things:
• a 40% loan to collateral value ratio (i.e., the ratio of total outstanding loans under the SSTL to certain collateral and
other assets as defined under the SSTL) as of the last date of any fiscal quarter; and
• specified levels of tangible net worth and liquidity at the consolidated Ocwen level.
Certain new financial covenants were added as part of the amendment and extension of our SSTL which closed on January
27, 2020. These include i) maintain a minimum unencumbered asset coverage ratio (i.e., the ratio of unrestricted cash and
certain first priority perfected collateral to total outstanding loans under the SSTL) as of the last day of any fiscal quarter of
200% increasing to 225% after December 31, 2020 and ii) maintain minimum unrestricted cash of $125.0 million as of the last
day of each fiscal quarter.
As of December 31, 2019, the most restrictive consolidated tangible net worth requirements contained in our debt
agreements were for a minimum of $200.0 million in consolidated tangible net worth, as defined, under certain of our match
funded debt, MSR financing facilities and mortgage warehouse agreements. The most restrictive liquidity requirements were
for a minimum of $100.0 million in consolidated liquidity, as defined, under certain of our match funded debt and mortgage
warehouse agreements.
As a result of the covenants to which we are subject, we may be limited in the manner in which we conduct our business
and may be limited in our ability to engage in favorable business and investment activities or raise certain types of capital to
finance future operations or satisfy future liquidity needs. In addition, breaches or events that may result in a default under our
debt agreements include, among other things, nonpayment of principal or interest, noncompliance with our covenants, breach
of representations, the occurrence of a material adverse change, insolvency, bankruptcy, certain material judgments and
changes of control.
Covenants and default provisions of this type are commonly found in debt agreements such as ours. Certain of these
covenants and default provisions are open to subjective interpretation and, if our interpretation was contested by a lender, a
court may ultimately be required to determine compliance or lack thereof. In addition, our debt agreements generally include
cross default provisions such that a default under one agreement could trigger defaults under other agreements. If we fail to
comply with our debt agreements and are unable to avoid, remedy or secure a waiver of any resulting default, we may be
subject to adverse action by our lenders, including termination of further funding, acceleration of outstanding obligations,
enforcement of liens against the assets securing or otherwise supporting our obligations and other legal remedies. Our lenders
can waive their contractual rights in the event of a default.
We believe we were in compliance with all of the qualitative and quantitative covenants in our debt agreements as of the
date of these financial statements.
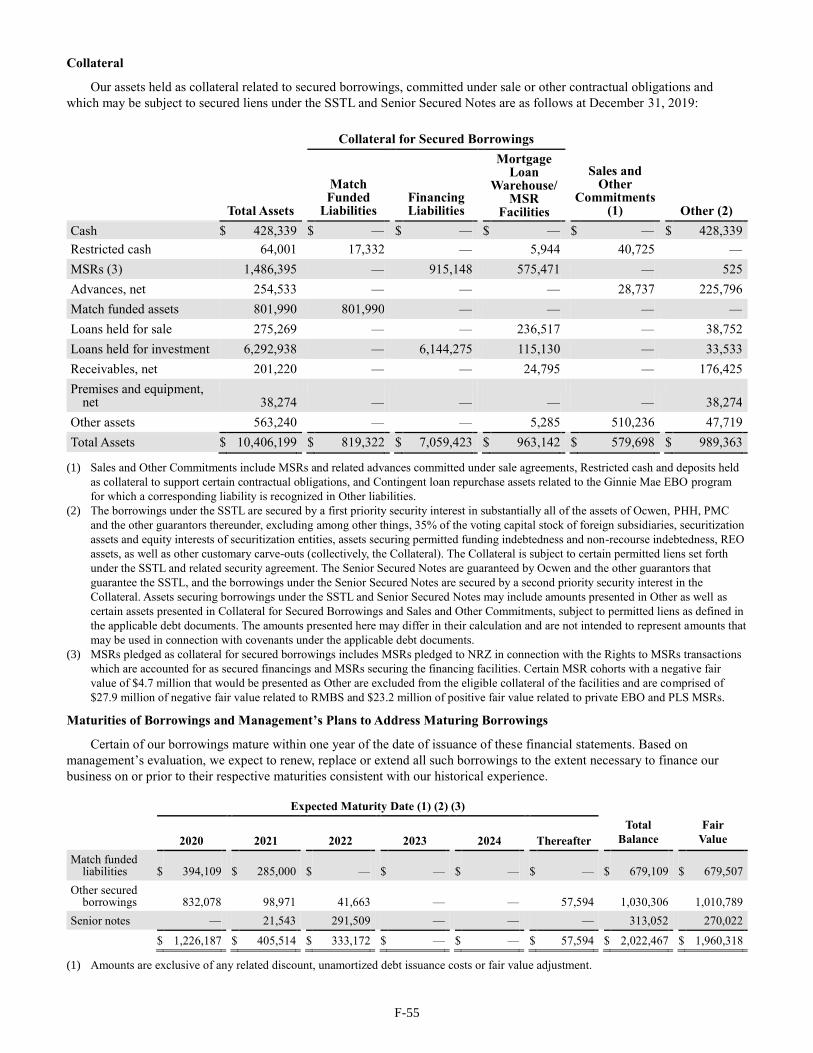
F-55
Collateral
Our assets held as collateral related to secured borrowings, committed under sale or other contractual obligations and
which may be subject to secured liens under the SSTL and Senior Secured Notes are as follows at December 31, 2019:
Collateral for Secured Borrowings
Total Assets
Match Funded
Liabilities Financing Liabilities
Mortgage Loan
Warehouse/MSR
Facilities
Sales and Other
Commitments (1) Other (2)
Cash $ 428,339 $ — $ — $ — $ — $ 428,339
Restricted cash 64,001 17,332 — 5,944 40,725 —
MSRs (3) 1,486,395 — 915,148 575,471 — 525
Advances, net 254,533 — — — 28,737 225,796
Match funded assets 801,990 801,990 — — — —
Loans held for sale 275,269 — — 236,517 — 38,752
Loans held for investment 6,292,938 — 6,144,275 115,130 — 33,533
Receivables, net 201,220 — — 24,795 — 176,425
Premises and equipment, net 38,274
—
—
—
—
38,274
Other assets 563,240 — — 5,285 510,236 47,719
Total Assets $ 10,406,199 $ 819,322 $ 7,059,423 $ 963,142 $ 579,698 $ 989,363
(1) Sales and Other Commitments include MSRs and related advances committed under sale agreements, Restricted cash and deposits held
as collateral to support certain contractual obligations, and Contingent loan repurchase assets related to the Ginnie Mae EBO program
for which a corresponding liability is recognized in Other liabilities.
(2) The borrowings under the SSTL are secured by a first priority security interest in substantially all of the assets of Ocwen, PHH, PMC
and the other guarantors thereunder, excluding among other things, 35% of the voting capital stock of foreign subsidiaries, securitization
assets and equity interests of securitization entities, assets securing permitted funding indebtedness and non-recourse indebtedness, REO
assets, as well as other customary carve-outs (collectively, the Collateral). The Collateral is subject to certain permitted liens set forth
under the SSTL and related security agreement. The Senior Secured Notes are guaranteed by Ocwen and the other guarantors that
guarantee the SSTL, and the borrowings under the Senior Secured Notes are secured by a second priority security interest in the
Collateral. Assets securing borrowings under the SSTL and Senior Secured Notes may include amounts presented in Other as well as
certain assets presented in Collateral for Secured Borrowings and Sales and Other Commitments, subject to permitted liens as defined in
the applicable debt documents. The amounts presented here may differ in their calculation and are not intended to represent amounts that
may be used in connection with covenants under the applicable debt documents.
(3) MSRs pledged as collateral for secured borrowings includes MSRs pledged to NRZ in connection with the Rights to MSRs transactions
which are accounted for as secured financings and MSRs securing the financing facilities. Certain MSR cohorts with a negative fair
value of $4.7 million that would be presented as Other are excluded from the eligible collateral of the facilities and are comprised of
$27.9 million of negative fair value related to RMBS and $23.2 million of positive fair value related to private EBO and PLS MSRs.
Maturities of Borrowings and Management’s Plans to Address Maturing Borrowings
Certain of our borrowings mature within one year of the date of issuance of these financial statements. Based on
management’s evaluation, we expect to renew, replace or extend all such borrowings to the extent necessary to finance our
business on or prior to their respective maturities consistent with our historical experience.
Expected Maturity Date (1) (2) (3)
2020 2021 2022 2023 2024 Thereafter
Total
Balance
Fair
Value
Match funded liabilities $ 394,109
$ 285,000
$ —
$ —
$ —
$ —
$ 679,109
$ 679,507
Other secured borrowings 832,078
98,971
41,663
—
—
57,594
1,030,306
1,010,789
Senior notes — 21,543 291,509 — — — 313,052 270,022
$ 1,226,187 $ 405,514 $ 333,172 $ — $ — $ 57,594 $ 2,022,467 $ 1,960,318
(1) Amounts are exclusive of any related discount, unamortized debt issuance costs or fair value adjustment.

F-56
(2) For match funded liabilities, the Expected Maturity Date is the date on which the revolving period ends for each advance financing
facility note and repayment of the outstanding balance must begin if the note is not renewed or extended.
(3) Excludes financing liabilities recognized in connection with asset sales transactions accounted for as financings, including $1.0 billion
recorded in connection with sales of Rights to MSRs and MSRs and $6.1 billion recorded in connection with the securitizations of
HMBS. These financing liabilities have no contractual maturity and are amortized over the life of the underlying assets.
Our MSR financing facilities provide funding based on an advance rate of MSR value that is subject to periodic mark-to-
market valuation adjustments. In the normal course, MSR value is expected to decline over time due to runoff of the loan
balances in our servicing portfolio. As a result, we anticipate having to repay a portion of our MSR debt over a given time
period. The requirements to repay MSR debt including those due to unfavorable fair value adjustment may require us to
allocate a substantial amount of our available liquidity or future cash flows to meet these requirements.
Note 15 — Other Liabilities
December 31,
2019 2018
Contingent loan repurchase liability $ 492,900 $ 302,581
Servicing-related obligations 88,167 41,922
Other accrued expenses 67,241 94,835
Due to NRZ - Advance collections and servicing fees 63,596 53,001
Liability for indemnification obligations 52,785 51,574
Lease liability 44,488 —
Checks held for escheat 31,959 20,686
Accrued legal fees and settlements 30,663 62,763
Liability for uncertain tax positions 17,197 13,739
Liability for unfunded pension obligation 13,383 12,683
Accrued interest payable 5,964 7,209
Liability for mortgage insurance contingency 6,820 6,820
Liability for unfunded India gratuity plan 5,331 4,904
Deferred revenue 488 4,441
Derivatives, at fair value 100 4,986
Other 21,091 21,492
$ 942,173 $ 703,636
Accrued Legal Fees and Settlements
Years Ended December 31,
2019 2018 2017
Beginning balance $ 62,763 $ 51,057 $ 93,797
Accrual for probable losses (1) 3,011 19,774 131,113
Payments (2) (30,356 ) (12,983 ) (174,941 )
Assumed in connection with the acquisition of PHH — 9,960 —
Issuance of common stock in settlement of litigation (3) — (5,719 ) (1,937 )
Net increase (decrease) in accrued legal fees (4,884 ) (1,917 ) 482
Other 129 2,591 2,543
Ending balance $ 30,663 $ 62,763 $ 51,057
(1) Consists of amounts accrued for probable losses in connection with legal and regulatory settlements and judgments. Such amounts are
reported in Professional services expense in the consolidated statements of operations.
(2) Includes cash payments made in connection with resolved legal and regulatory matters.
(3) See Note 16 — Equity for additional information.

F-57
Note 16 — Equity
Common Stock
In 2017, Ocwen and NRZ entered into a share purchase agreement pursuant to which Ocwen sold NRZ 6,075,510 shares of
newly-issued Ocwen common stock for $13.9 million. Ocwen received the sales proceeds from NRZ on July 24, 2017 and
issued the shares. The shares have not been registered under the Securities Act of 1933 and were issued and sold in reliance
upon the exemption from registration contained in Section 4(a)(2) of the Act and Rule 506(b) promulgated thereunder.
In 2017, Ocwen agreed to issue an aggregate of 2,500,000 shares of common stock in connection with a mediated
settlement of litigation. Ocwen issued 625,000 of the shares in December 2017 and the remaining 1,875,000 shares in January
2018. The shares have not been registered under the Securities Act of 1933 and were issued in reliance upon the exemption
from registration set forth in Section 3(a)(10) of the Act.
Accumulated Other Comprehensive Loss
The components of accumulated other comprehensive loss (AOCL), net of income taxes, were as follows:
December 31,
2019 2018
Unfunded pension plan obligation, net $ 6,789 $ 3,347
Unrealized losses on cash flow hedges, net 832 979
Other (27 ) (69 )
$ 7,594 $ 4,257
Note 17 — Derivative Financial Instruments and Hedging Activities
The following table summarizes derivative activity, including the derivatives used in each of our identified hedging
programs. The notional amount of our contracts does not represent our exposure to credit loss. None of the derivatives were
designated as a hedge for accounting purposes as of or during the years ended December 31, 2019, 2018 and 2017:
Interest Rate Risk
MSR
Hedging
IRLCs and Loans Held
for Sale Borrowings
IRLCs
TBA / Forward
MBS Trades Forward Trades
Interest Rate Caps
Notional balance at December 31, 2019 $ 232,566 $ 1,200,000 $ 60,000 $ 27,083
Maturity Jan. 2020 - Mar. 2020
Jan. 2020 - Mar. 2020 Jan. 2020 May 2020
Fair value of derivative assets (liabilities) at:
December 31, 2019 $ 4,878 1,121 $ (92 ) $ —
December 31, 2018 3,871 — (4,983 ) 678
Gains (losses) on derivatives during the years ended:
Gain on loans held for sale,
net
MSR valuation
adjustments, net
Gain on loans held for sale,
net Other, net
December 31, 2019 $ 756 525 $ (2,689 ) $ (358 )
December 31, 2018 3,809 — 136 (841 )
We report derivatives at fair value in Other assets or in Other liabilities on our consolidated balance sheets. Derivative
instruments are generally entered into as economic hedges against changes in the fair value of a recognized asset or liability
and are not designated as hedges for accounting purposes. We report the changes in fair value of such derivative instruments in
the same line item in the consolidated statement of operations as the changes in fair value of the related asset or liability. For all
other derivative instruments not designated as a hedging instrument, we report changes in fair value in Other, net.

F-58
Foreign Currency Exchange Rate Risk
Our operations in India and the Philippines expose us to foreign currency exchange rate risk to the extent that our foreign
exchange positions remain unhedged. We have not entered into any forward exchange contracts during the reported periods to
hedge against the effect of changes in the value of the India Rupee or Philippine Peso. Foreign currency remeasurement
exchange gains (losses) were $(0.2) million, $(3.2) million and $1.7 million during the years ended December 31, 2019, 2018
and 2017, respectively, and are reported in Other, net in the consolidated statements of operations.
Interest Rate Risk
MSR Hedging
MSRs are carried at fair value with changes in fair value being recorded in earnings in the period in which the changes
occur. The fair value of MSRs is subject to changes in market interest rates and prepayment speeds, among other factors.
Beginning in September 2019, management implemented a hedging strategy to partially offset the changes in fair value of our
net MSR portfolio to interest rate changes. We define our net MSR portfolio exposure as follows:
• our more interest rate-sensitive Agency MSR portfolio,
• less the Agency MSRs subject to our agreements with NRZ (See Note 10 — Rights to MSRs),
• less the asset value for securitized HECM loans, net of the corresponding HMBS-related borrowings, and
• less the net value of our held for sale loan portfolio and interest rate lock commitments (pipeline).
We determine and monitor daily a hedge coverage based on the duration and interest rate sensitivity measures of our net
MSR portfolio exposure, considering market and liquidity conditions. At December 31, 2019, our hedging strategy provides for
a partial coverage of our net MSR portfolio exposure.
We use forward trades of MBS or Agency TBAs with different banking counterparties as hedging instruments that are not
designated as accounting hedges. TBAs, or To-Be-Announced securities are actively traded, forward contracts to purchase or
sell Agency MBS on a specific future date. We report changes in fair value of these derivative instruments in MSR valuation
adjustments, net in our consolidated statements of operations.
The TBAs are subject to margin requirements. Ocwen may be required to post or may be entitled to receive cash collateral
with its counterparties, based on daily value changes of the instruments. Changes in market factors, including interest rates, and
our credit rating could require us to post additional cash collateral and could have a material adverse impact on our financial
condition and liquidity.
Interest Rate Lock Commitments
A loan commitment binds us (subject to the loan approval process) to fund the loan at the specified rate, regardless of
whether interest rates have changed between the commitment date and the loan funding date. As such, outstanding IRLCs are
subject to interest rate risk and related price risk during the period from the date of the commitment through the loan funding
date or expiration date. The borrower is not obligated to obtain the loan; thus, we are subject to fallout risk related to IRLCs,
which is realized if approved borrowers choose not to close on the loans within the terms of the IRLCs. Our interest rate
exposure on these derivative loan commitments had previously been economically hedged with freestanding derivatives such as
forward contracts. Beginning in September 2019, this exposure is not individually hedged, but rather used as an offset to our
MSR exposure and managed as part of our MSR hedging strategy described above.
Loans Held for Sale, at Fair Value
Mortgage loans held for sale that we carry at fair value are subject to interest rate and price risk from the loan funding date
until the date the loan is sold into the secondary market. Generally, the fair value of a loan will decline in value when interest
rates increase and will rise in value when interest rates decrease. To mitigate this risk, we had previously entered into forward
MBS trades to provide an economic hedge against those changes in fair value on mortgage loans held for sale. Forward MBS
trades were primarily used to fix the forward sales price that would be realized upon the sale of mortgage loans into the
secondary market. Beginning in September 2019, this exposure is not individually hedged, but rather used as an offset to our
MSR exposure and managed as part of our MSR hedging strategy described above.
Match Funded Liabilities
When required by our advance financing arrangements, we purchase interest rate caps to minimize future interest rate
exposure from increases in the interest on our variable rate debt as a result of increases in the index, such as 1ML, which is
used in determining the interest rate on the debt. We currently do not hedge our fixed-rate debt.

59
Note 18 — Interest Income
Years Ended December 31,
2019 2018 2017
Loans held for sale $ 14,669 $ 10,756 $ 11,100
Interest earning cash deposits and other 2,435 2,850 1,796
Automotive dealer financing notes — 420 3,069
$ 17,104 $ 14,026 $ 15,965
Note 19 — Interest Expense
Years Ended December 31,
2019 2018 2017
Senior notes $ 31,804 $ 31,280 $ 29,806
Match funded liabilities 26,902 31,870 47,624
Other secured borrowings 46,278 35,412 45,099
Financing liabilities — 66 635
Other 9,145 4,743 3,763
$ 114,129 $ 103,371 $ 126,927
Note 20 — Income Taxes
On December 22, 2017, the U.S. government enacted comprehensive tax legislation commonly referred to as the Tax Cuts
and Jobs Act (Tax Act), which made broad and complex changes to the U.S. federal corporate income tax rules. The Tax Act
amends the Internal Revenue Code to reduce tax rates, requires companies to pay a one-time transition tax on earnings of
certain foreign subsidiaries that were previously tax deferred and creates new taxes on certain foreign-sourced earnings, among
other provisions. For businesses, the Tax Act reduced the corporate federal tax rate from a maximum of 35% to a flat 21% rate.
The rate reduction took effect on January 1, 2018. The Tax Act significantly changed the taxation of U.S.-based multinational
corporations.
The reduction in the statutory U.S. federal rate is expected to positively impact our future U.S. after-tax earnings.
However, the ultimate impact is subject to the effect of other complex provisions in the Tax Act (including the BEAT, Global
Intangible Low-Taxed Income (GILTI), and revised interest deductibility limitations). The U.S. Treasury Department, the U.S.
Internal Revenue Service and state tax authorities have issued and are expected to continue to issue guidance on how the
provisions of the Tax Act will be applied or otherwise administered. As regulations and guidance evolve with respect to the Tax
Act, the results of newly issued guidance could be adverse and may differ from previous estimates. As such, we are continuing
to evaluate the impact of the new U.S. tax legislation, including recently issued regulations on our global tax position.
SAB 118 Measurement Period
We applied the guidance in SAB 118 when accounting for the enactment date effects of the Tax Act in 2017 and
throughout 2018. At December 31, 2017, we had not completed our accounting for all of the enactment-date income tax effects
of the Tax Act under ASC 740, Income Taxes; therefore, we recorded provisional amounts related to the one-time deemed
repatriation tax (Transition Tax) liability related to the undistributed earnings of certain foreign subsidiaries that were not
previously taxed and adjusted deferred tax assets and liabilities to account for the reduction in the statutory U.S. federal rate. As
of December 31, 2018, we had completed our accounting for all of the enactment-date income tax effects of the Tax Act. As
further discussed below, during 2018, we recognized adjustments to the provisional amounts recorded at December 31, 2017,
which produced changes in the amount of deferred tax assets recorded in the U.S. and USVI jurisdictions. As the net deferred
tax assets in these jurisdictions have full valuation allowances, the adjustments to the provisional amounts recorded under SAB
118 did not have an impact on our consolidated statements of financial position or consolidated statements of operations.
One-Time Transition Tax
Under the Tax Act, the transition to a new territorial tax system caused Ocwen to incur a Transition Tax on our total post-
1986 undistributed earnings and profits (E&P) of our non-U.S. subsidiaries, the tax on which we previously deferred from U.S.
income taxes under U.S. law. The amount of the Transition Tax was dependent upon many factors, including the accumulated
E&P of Ocwen’s non-U.S. subsidiaries, our ability and willingness to utilize foreign tax credits and/or net operating loss (NOL)

F-60
carryforwards, and 2017 taxable income or loss amounts in the U.S. and non-U.S. jurisdictions. We recorded a provisional
amount for our one-time Transition Tax liability in our December 31, 2017 financial statements as a reduction to the U.S.
federal NOL carryforward of $16.9 million. The reduction of the NOL deferred tax asset resulted in an offsetting release of the
valuation allowance.
Due to the various factors affecting the calculation, our decision regarding how best to utilize the foreign tax credits and/or
NOL carryforwards was subject to change as we continued to wait for further guidance and analyze additional information
necessary to finalize the calculations and maximize the long-term value to Ocwen. Upon further analysis of the Tax Act as well
as notices and regulations issued and proposed by the U.S. Department of the Treasury and the Internal Revenue Service, we
finalized our calculations of the Transition Tax liability in 2018. We increased our December 31, 2017 provisional amount by
increasing foreign tax credits by $19.9 million and further reducing the U.S. federal NOL carryforward by $51.7 million. As the
net deferred tax asset in the U.S. jurisdiction has a full valuation allowance, the recording of the changes to these deferred tax
assets does not have an impact on our consolidated balance sheets or consolidated statements of operations.
Deferred Tax Assets & Liabilities
As a result of the reduction in the corporate income tax rate, we revalued our U.S. and USVI net deferred tax assets at
December 31, 2017. In 2017, we recorded a provisional decrease to our net deferred tax assets in the U.S. and USVI
jurisdictions of $36.1 million and $26.6 million, respectively, due to the change in the corporate tax rate. Upon further analysis
of certain aspects of the Tax Act as well as notices and regulations issued and proposed by the U.S. Department of the Treasury
and the Internal Revenue Service and refinement of our calculations during 2018, we adjusted our provisional amount by
recording an increase to our net deferred tax assets in the U.S. and USVI jurisdictions of $6.0 million and $4.6 million,
respectively. This increase resulted in a net decrease to the deferred tax assets in 2018 in the U.S. and USVI jurisdictions of
$30.1 million and $22.0 million, respectively. As the net deferred tax assets in these jurisdictions have full valuation
allowances, the revaluation of our net deferred tax assets did not have any impact on our consolidated balance sheets or
consolidated statements of operations.
Global Intangible Low-Taxed Income (GILTI)
The Tax Act subjects a U.S. shareholder to tax on GILTI earned by certain foreign subsidiaries. The FASB Staff Q&A,
Topic 740, No. 5, Accounting for Global Intangible Low-Taxed Income, states that an entity can make an accounting policy
election to either recognize deferred taxes for temporary basis differences expected to reverse as GILTI in future years or to
provide for the tax expense related to GILTI in the year the tax is incurred as a period expense only. Because we were
evaluating the provision of GILTI at December 31, 2017, we recorded no GILTI-related deferred taxes in 2017. After further
consideration in 2018, we elected to account for GILTI in the year the tax is incurred.
For income tax purposes, the components of loss from continuing operations before taxes were as follows:
Years Ended December 31,
2019 2018 2017
Domestic $ (93,487 ) $ 11,477 $ (75,143 )
Foreign (33,004 ) (82,953 ) (68,830 )
$ (126,491 ) $ (71,476 ) $ (143,973 )

F-61
The components of income tax expense (benefit) were as follows:
Years Ended December 31,
2019 2018 2017
Current:
Federal $ 873 $ (7,670 ) $ (21,859 )
State 4,460 356 (3,938 )
Foreign 7,181 11,132 9,550
12,514 3,818 (16,247 )
Deferred:
Federal (40,429 ) 23,991 27,289
State (914 ) 319 702
Foreign 11,993 (4,252 ) 2,719
Provision for (reversal of) valuation allowance on deferred tax assets 32,470 (23,347 ) (29,979 )
3,120 (3,289 ) 731
Total $ 15,634 $ 529 $ (15,516 )
Ocwen is a global company with operations in the USVI, India and the Philippines, among other jurisdictions. In the
effective tax rate reconciliation, we first calculate income tax expense attributable to worldwide continuing operations at the
U.S. statutory tax rate. The foreign tax rate differential therefore represents the difference in tax expense between jurisdictional
income taxed at the U.S. statutory rate and each respective jurisdictional statutory rate.
Income tax expense differs from the amounts computed by applying the U.S. Federal corporate income tax rate as follows:
Years Ended December 31,
2019 2018 2017
Expected income tax expense (benefit) at statutory rate (1) $ (26,563 ) $ (15,010 ) $ (50,391 )
Differences between expected and actual income tax expense (2):
Bargain purchase gain disallowance 80 (13,448 ) —
Revaluation of deferred tax assets related to legal entity mergers (25,509 ) — —
Reduction in tax attributes for Section 382 & 383 limitations — 55,668 —
U.S. Tax Reform - Change in Federal rate — (10,666 ) 62,758
U.S. Tax Reform - Transition Tax — 14,412 34,846
U.S. Tax Reform - BEAT Tax (555 ) 1,076 —
U.S. Tax Reform - GILTI inclusion 11,859 — —
Foreign tax differential including effectively connected income (3) 15,979 22,990 (12,140 )
Provision for (reversal of) liability for uncertain tax positions 4,198 (3,987 ) (16,925 )
Provision for (reversal of) valuation allowance on deferred tax assets (4) 32,470 (23,347 ) (29,979 )
Provision for liability for intra-entity transactions (5) — — 2,484
State tax, after Federal tax benefit (784 ) 675 (3,938 )
Excess tax benefits from share-based compensation 381 (356 ) (3,701 )
Other permanent differences 66 122 (267 )
Foreign tax credit (generation) utilization 263 (25,601 ) —
Executive compensation disallowance 1,344 959 221
Subpart F income — 3,222 2,824
Other provision to return differences 1,242 (6,559 ) 221
Other 1,163 379 (1,529 )
Actual income tax expense (benefit) $ 15,634 $ 529 $ (15,516 )
(1) The U.S. Federal corporate income tax rate is 21% beginning January 1, 2018 and was 35% until December 31, 2017.

F-62
(2) ASC 740-10-50 and SEC Regulation S-X, Rule 4-08(h) require the disclosure of significant reconciling items in the effective tax rate
reconciliation schedule. We have prepared the 2019 effective tax rate reconciliation consistent with prior years, taking into account the
materiality of reconciling items, comparability with prior years and the usefulness of the information.
(3) The foreign tax differential includes expense recognized in 2019 and a benefit recognized in 2018 and 2017 for taxable income or
losses earned by Ocwen Mortgage Servicing, Inc. (OMS) prior to the merger of OMS into OVIS in 2019 as disclosed below, which
are taxable in the U.S. as effectively connected income (ECI). The impact of ECI to income tax expense (benefit) for 2019, 2018 and
2017 was $2.6 million, $(3.3) million and $(28.5) million, respectively.
(4) The benefit recorded for the provision for valuation allowance in 2017 relates primarily to the reduction in the valuation allowance
necessary as a result of revaluing our deferred tax assets due to U.S. tax reform and the reduction in the corporate tax rate. This benefit
is partially offset by an increase in valuation allowance necessary for current year losses.
(5) ASU 2016-16 requires an entity to recognize the income tax consequences of intra-entity transfers of assets other than inventory when
the transfer occurs. Previously, recognition of current and deferred income taxes for an intra-entity transfer was prohibited until the
asset had been sold to an outside party. We adopted this standard on a modified retrospective basis on January 1, 2018 by recording a
cumulative-effect reduction of $5.6 million to retained earnings.
Net deferred tax assets were comprised of the following:
December 31,
2019 2018
Deferred tax assets
Net operating loss carryforwards - federal and foreign $ 64,817 $ 31,587
Net operating loss carryforwards and credits - state and local 70,254 —
Reserve for servicing exposure 7,711 10,331
Accrued other liabilities 6,377 8,966
Foreign deferred assets 3,620 7,142
Partnership losses 7,029 6,681
Stock-based compensation expense 5,297 5,610
Interest expense disallowance 12,423 4,773
Intangible asset amortization 4,946 4,579
Accrued incentive compensation 5,063 4,527
Accrued legal settlements 6,028 4,350
Bad debt and allowance for loan losses 2,530 3,498
Tax residuals and deferred income on tax residuals 2,885 2,905
Foreign tax credit 94 357
Lease liabilities 5,459 580
Deferred income 8,493 —
Other 8,708 8,252
221,734 104,138
Deferred tax liabilities
Mortgage servicing rights amortization 16,358 27,860
Foreign undistributed earnings 1,615 2,059
Other 1,151 804
19,124 30,723
202,610 73,415
Valuation allowance (200,441 ) (68,126 )
Deferred tax assets, net $ 2,169 $ 5,289
As of December 31, 2019, we had a deferred tax asset, net of deferred tax liability, including $199.5 million in the U.S.
Valuation Allowances
We conduct periodic evaluations of positive and negative evidence to determine whether it is more likely than not that the
deferred tax asset can be realized in future periods. In these evaluations, we gave more significant weight to objective evidence,
such as our actual financial condition and historical results of operations, as compared to subjective evidence, such as
projections of future taxable income or losses. Both the U.S. and USVI jurisdictions are in a three-year cumulative loss position
as of December 31, 2019. Other factors considered in these evaluations are estimates of future taxable income, future reversals

F-63
of temporary differences, taxable income in prior carryback years, tax character and the impact of tax planning strategies that
may be implemented, if warranted.
As a result of these evaluations, we recorded a valuation allowance of $199.5 million and $46.3 million on our U.S. net
deferred tax assets at December 31, 2019 and 2018, respectively, and a valuation allowance of $0.4 million and $21.3 million
on our USVI net deferred tax assets at December 31, 2019 and 2018, respectively. These U.S. and USVI jurisdictional deferred
tax assets are not considered to be more likely than not realizable based on all available positive and negative evidence. We
intend to continue maintaining a full valuation allowance on our deferred tax assets in both the U.S. and USVI until there is
sufficient evidence to support the reversal of all or some portion of these allowances.
Net Operating Loss Carryforwards
At December 31, 2019, we had U.S. NOL carryforwards of $306.5 million. In addition to our historic NOL carryforwards,
this amount includes U.S. NOL carryforwards of $125.7 million acquired in connection with the acquisition of PHH. At
December 31, 2019, we had state NOL and tax credit carryforwards valued at $70.3 million, including state NOLs and tax
credits acquired in connection with the acquisition of PHH of $54.3 million. All of the acquired tax attributes were fully offset
by a valuation allowance.
These U.S. federal and state NOL carryforwards will expire beginning 2020 through 2039 with U.S. federal NOLs
generated after 2017 never expiring. We believe that it is more likely than not that the benefit from certain U.S. federal and
state NOL carryforwards will not be realized. In recognition of this risk, we have provided a total valuation allowance of $64.4
million and $70.3 million on the deferred tax assets relating to the U.S. federal and state NOL carryforwards, respectively. If
our assumptions change and we determine we will be able to realize these NOLs, the tax benefits relating to any reversal of the
valuation allowance on deferred tax assets as of December 31, 2019 will be accounted for as a reduction of income tax expense.
Additionally, $334.5 million of USVI NOLs have been carried back to offset prior period tax due in the USVI and we have,
therefore, reflected the tax-effect of this attribute as a $12.9 million income taxes receivable. We also have U.S. capital loss
carryforwards of $7.6 million at December 31, 2019 against which a valuation allowance has been recorded.
Change of Control: Annual Limitations on Utilization of Tax Attributes
NOL carryforwards may be subject to annual limitations under Internal Revenue Code Section 382 (Section 382) (or
comparable provisions of foreign or state law) in the event that certain changes in ownership were to occur. We periodically
evaluate our NOL carryforwards and whether certain changes in ownership have occurred that would limit our ability to utilize
a portion of our NOL and tax credit carryforwards. If it is determined that an ownership change(s) has occurred, there may be
annual limitations on the use of these NOL and tax credit carryforwards under Section 382 (or comparable provisions of foreign
or state law).
Generally, a Section 382 ownership change occurs if, over a rolling three-year period, there has been an aggregate increase
of 50 percentage points or more in the percentage of our stock owned by one or more “5-percent shareholders.” Ownership for
Section 382 purposes is determined primarily by an economic test, while the SEC definition of beneficial ownership focuses
generally on the right to vote or control disposition of the shares. In general, the Section 382 economic test looks to who has the
right to receive dividends paid with respect to shares, and who has the right to receive proceeds from the sale or other
disposition of shares. Section 382 also contains certain constructive ownership rules, which generally attribute ownership of
stock held by estates, trusts, corporations, partnerships or other entities to the ultimate indirect individual owner of the shares,
or to related individuals. Generally, a person’s direct or indirect economic ownership interest in shares (rather than record title,
voting control or other factors) is taken into account for Section 382 purposes.
For purposes of determining the existence and identity of, and the amount of stock owned by any shareholder, the Internal
Revenue Service permits us to rely on the existence or absence of filings with the SEC of Schedules 13D, 13F and 13G (or
similar filings) as of any date, subject to our actual knowledge of the ownership of our common stock. Investors who file a
Schedule 13G or Schedule 13D (or list our common stock in their Schedules 13F) may beneficially own 5% or more of our
common stock for SEC reporting purposes but nonetheless may not be Section 382 “5-percent shareholders” and therefore their
beneficial ownership will not result in a Section 382 ownership change.
We have evaluated whether we experienced an ownership change, as defined under Section 382, and determined that an
ownership change did occur in the U.S. jurisdiction in January 2015 and in December 2017, which also results in an ownership
change under Section 382 in the USVI jurisdiction. In addition, a Section 382 ownership change occurred at PHH when Ocwen
acquired the stock of PHH in October 2018. PHH was a loss corporation as defined under Section 382 at the date of the
acquisition. PHH also had an existing Section 382 ownership change on March 31, 2018. For certain states, an additional
Section 382 ownership change occurred on August 9, 2017. These Section 382 ownership changes may limit our ability to fully
utilize NOLs, tax credit carryforwards, deductions and/or certain built-in losses that existed as of each respective ownership
change date in various jurisdictions.
F-64
Due to the Section 382 and 383 limitations and the maximum carryforward period for our NOLs and tax credits, we will be
unable to fully recognize certain deferred tax assets. Accordingly, as of December 31, 2018, we reduced our gross deferred tax
asset related to our U.S. federal and USVI NOLs by $160.9 million, our foreign tax credit deferred tax asset by $29.5 million,
and corresponding valuation allowance by $55.7 million. The realization of all or a portion of our remaining deferred income
tax assets (including NOLs and tax credits) is dependent upon the generation of future taxable income during the statutory
carryforward periods. In addition, the limitation on the utilization of our NOL and tax credit carryforwards could result in
Ocwen incurring a current tax liability in future tax years. Our inability to utilize our pre-ownership change NOL
carryforwards, any future recognized built-in losses or deductions, and tax credit carryforwards could have an adverse effect on
our financial condition, results of operations and cash flows.
As part of our Section 382 evaluation and consistent with the rules provided within Section 382, Ocwen relies strictly on
the existence or absence, as well as the information contained in certain publicly available documents (e.g., Schedule 13D,
Schedule 13G or other documents filed with the SEC) to identify shareholders that own a 5-percent or greater interest in Ocwen
stock throughout the period tested. Further, Ocwen relies on such public filings to identify dates in which such 5-percent
shareholders acquired, disposed, or otherwise transacted in Ocwen common stock. As the requirement for filing such notices of
ownership from the SEC is to report beneficial ownership, as opposed to actual economic ownership of the stock of Ocwen,
certain SEC filings may not represent ownership in Ocwen stock that should be considered in determining whether Ocwen
experienced an ownership change under the Section 382 rules. Notwithstanding the preceding sentences (regarding Ocwen’ s
ability to rely on the existence and absence of information in publicly filed Schedules 13D and 13G), the rules prescribed in
Section 382 and the regulations thereunder provide that Ocwen may (but is not required to) seek additional clarification from
shareholders filing such Schedules 13D and 13G if there are questions or uncertainty regarding the true economic ownership of
shares reported in such filing (whether due to ambiguity in the filing, an overly complex ownership structure, the type of
instruments owned and reported in the filings, etc.) (often referred to “actual knowledge” questionnaires). Such information can
be sought on a filer by filer basis (i.e., there is no requirement that if actual knowledge is sought with respect to one
shareholder, actual knowledge must be sought with respect to all shareholders that filed schedules 13D or 13G). While the
seeking of actual knowledge can be beneficial in some instances it may be detrimental in others. Once such actual knowledge is
received, Section 382 requires the inclusion of such actual knowledge, even if such inclusion is detrimental to the conclusion
reached.
Ocwen has performed its analysis of the rules under Section 382 and, based on all currently available information,
identified it experienced an ownership change for Section 382 purposes in January 2015 and December 2017. Prior to 2018,
Ocwen was aware of shareholder activity in 2015 and 2017 that may have caused a Section 382 ownership change(s) but
determined that additional information could potentially be obtained from certain shareholders that would indicate a Section
382 ownership change had not occurred. In completing this analysis, Ocwen identified several shareholders that filed a
schedule 13G during the period disclosing a greater than 5-percent interest in Ocwen stock where beneficial versus economic
ownership of the stock was unclear, and Ocwen therefore requested further details. As of the date of this Form 10-K, Ocwen
has not received all requested responses from selected shareholders and will continue to consider such shareholders as
economic owners of Ocwen’s stock until actual knowledge is otherwise received.
Ocwen is continuing to monitor the ownership in its stock to evaluate information that will become available in 2020 and
that may result in a different outcome for Section 382 purposes and our future cash tax obligations. As part of this monitoring,
Ocwen periodically evaluates whether it is appropriate and beneficial to retroactively seek actual knowledge on certain
previously identified and included 5-percent shareholders, whereby, depending on the responses received, Ocwen may
conclude that either the January 2015 or December 2017 Section 382 ownership changes may have instead occurred on a
different date, or did not occur at all. As such, our analysis regarding the amount of tax attributes that may be available to offset
taxable income in the future without restrictions imposed by Section 382 may continue to evolve.
Uncertain Tax Positions
Our major jurisdiction tax years that remain subject to examination are our U.S. federal tax return for the years ended
December 31, 2016 through the present, our USVI corporate tax return for the years ended December 31, 2013 through the
present, and our India corporate tax returns for the years ended March 31, 2010 through the present. We are currently under
audit in the USVI jurisdiction for tax years 2013 - 2016 due to the carryback of losses generated in 2015 and 2016 to tax years
2013 and 2014, respectively.

F-65
A reconciliation of the beginning and ending amounts of the total unrecognized tax benefits for uncertain tax positions,
which are included in the Liability for uncertain tax positions in Other liabilities, is as follows:
Years Ended December 31,
2019 2018 2017
Beginning balance $ 9,622 $ 2,281 $ 16,994
Additions - PHH acquisition — 13,108 —
Additions for tax positions of current year 207 412 —
Additions for tax positions of prior years 3,110 1,354 2,281
Reductions for tax positions of prior years — (236 ) —
Reductions for settlements (1,293 ) (3,188 ) (387 )
Lapses in statute of limitations (1,057 ) (4,109 ) (16,607 )
Ending balance $ 10,589 $ 9,622 $ 2,281
We recognized total interest and penalties of $2.7 million, $2.9 million and $5.1 million as income tax expense or benefit
in 2019, 2018 and 2017, respectively. At December 31, 2019 and 2018, accruals for interest and penalties were $6.6 million and
$4.1 million, respectively, and are included in the Liability for uncertain tax positions in Other liabilities. As of December 31,
2019 and 2018, we had unrecognized tax benefits for uncertain tax positions, excluding accrued interest and penalties, of $10.6
million and $9.6 million, respectively, all of which if recognized would affect the effective tax rate.
It is reasonably possible that there could be a change in the amount of our unrecognized tax benefits within the next 12
months due to activities of the Internal Revenue Service or other taxing authorities, including proposed assessments of
additional tax, possible settlement of audit issues, or the expiration of applicable statutes of limitations. We believe that it is
reasonably possible that a decrease of up to $8.8 million in unrecognized tax benefits may be necessary within the next 12
months.
Undistributed Foreign Earnings and Non-U.S. Jurisdictions
As of December 31, 2019, we have recognized a deferred tax liability of $1.6 million for foreign subsidiary undistributed
earnings. We do not consider our foreign subsidiary undistributed earnings to be indefinitely invested outside the U.S.
OVIS (and formerly OMS) is headquartered in St. Croix, USVI and is located in a federally recognized economic
development zone where qualified entities are eligible for certain benefits. We refer to these benefits as “EDC benefits” as they
are granted by the USVI Economic Development Commission. We were approved as a Category IIA service business, and are
therefore entitled to receive benefits that may have a favorable impact on our effective tax rate. These benefits, among others,
enable us to avail ourselves of a credit of 90% of income taxes on certain qualified income related to our servicing business.
The exemption was granted as of October 1, 2012 and is available for a period of 30 years until expiration on September 30,
2042. The EDC benefits had no impact on our current foreign tax benefit in 2019, 2018 and 2017 because we are incurring
current losses in the USVI and do not have carryback potential for these losses. As a result, no current benefit can be
recognized for these losses.
During 2019, in connection with our acquisition of PHH, overall corporate simplification and cost reduction efforts, we
executed a legal entity reorganization whereby OLS, through which we previously conducted a substantial portion of our
servicing business, was merged into PHH. OLS was previously the wholly-owned subsidiary of OMS, which was incorporated
and headquartered in the USVI prior to its merger with OVIS, an entity which is also organized and headquartered in the USVI.
As a result of this reorganization, the majority of our USVI operations and assets were transferred to the U.S. We plan to
continue to maintain operations and the EDC Benefits in the USVI until, through and after the reorganization. We expect the
reorganization to result in efficiencies and operational cost savings through reduced complexity and a simplification of our
global structure.
Note 21 — Basic and Diluted Earnings (Loss) per Share
Basic earnings or loss per share excludes common stock equivalents and is calculated by dividing net income or loss
attributable to Ocwen common stockholders by the weighted average number of common shares outstanding during the year.
We calculate diluted earnings or loss per share by dividing net income or loss attributable to Ocwen by the weighted average
number of common shares outstanding including the potential dilutive common shares related to outstanding stock options and
restricted stock awards. For 2019, 2018 and 2017, we have excluded the effect of all stock options and common stock awards
from the computation of diluted loss per share because of the anti-dilutive effect of our reported net loss.

F-66
Years Ended December 31,
2019 2018 2017
Loss from continuing operations, net of tax attributable to Ocwen common stockholders $ (142,125 ) $ (72,181 ) $ (127,966 )
Income from discontinued operations, net of tax — 1,409 —
Net loss attributable to Ocwen stockholders $ (142,125 ) $ (70,772 ) $ (127,966 )
Weighted average shares of common stock outstanding - Basic and Diluted 134,444,402 133,703,359 127,082,058
Earnings (loss) per share - Basic and Diluted
Continuing operations $ (1.06 ) $ (0.54 ) $ (1.01 )
Discontinued operations $ — $ 0.01 $ —
Total attributable to Ocwen stockholders $ (1.06 ) $ (0.53 ) $ (1.01 )
Stock options and common stock awards excluded from the
computation of diluted earnings per share
Anti-dilutive (1) 3,167,624 4,989,725 5,487,164
Market-based (2) 787,204 670,829 862,446
(1) Includes stock options that are anti-dilutive because their exercise price was greater than the average market price of Ocwen’s stock, and
stock awards that are anti-dilutive based on the application of the treasury stock method.
(2) Shares that are issuable upon the achievement of certain market-based performance criteria related to Ocwen’s stock price.
Note 22 — Employee Compensation and Benefit Plans
We maintain defined contribution plans to provide post-retirement benefits to our eligible employees and non-contributory
defined benefit pension plans which are frozen and cover certain former eligible employees. We also maintain additional
incentive compensation plans for certain employees. We designed these plans to facilitate a pay-for-performance culture,
further align the interests of our officers and key employees with the interests of our shareholders and to assist in attracting and
retaining employees vital to our long-term success. These plans are summarized below.
Defined Contribution Savings Plans
We sponsor defined contribution savings plans for eligible employees in the U.S (401(k) plan) and India (Provident Fund).
Effective July 1, 2019, the PHH Corporation Employee Savings Plan and the PHH Home Loans, LLC Employee Savings Plan
were merged into the Ocwen Financial Corporation 401(k) Savings Plan which applied to all current and former employees
with account balances as of the date of the merger.
Contributions of participating employees to the plans are matched on the basis specified by these plans. For the 401(k)
plans, we match 50% of the first 6% of each eligible participant’s contribution to the 401(k) plans with maximum aggregate
matching of $8,400 for 2019. For the Provident Fund, both the employee and the employer are required to make minimum
contributions to the fund at a predetermined rate (currently 12%) applied to a portion of the employee's salary. Employers are
not required to make contributions beyond this minimum.
Our contributions to these plans were $5.9 million, $4.8 million and $5.3 million for the years ended December 31, 2019,
2018 and 2017, respectively.
Defined Benefit Pension Plans
Ocwen sponsors different non-contributory defined benefit pension plans for which benefits are based on an employee’s
years of credited service and a percentage of final average compensation, or as otherwise described by the plan. Both defined
benefit pension plans were assumed as part of business acquisitions and are frozen, wherein the plans only accrue additional
benefits for a limited number of employees and no additional employees are eligible for participation in the plans.

F-67
The following table shows the total change in the benefit obligation, plan assets and funded status for the pension plans:
December 31,
2019 2018
Benefit obligation $ 54,603 $ 49,122
Fair value of plan assets 41,220 36,439
Unfunded status recognized in Other liabilities $ (13,383 ) $ (12,683 )
Amounts recognized in Accumulated other comprehensive income $ 6,864 $ 3,422
The net periodic benefit cost related to the defined benefit pension plans, included in Other expenses, was $(2.0) million
and $0.4 million for 2019 and 2018, respectively, and insignificant for 2017.
As of December 31, 2019, future expected benefit payments to be made from the assets of the defined benefit pension
plans is $2.9 million for the year ending December 31, 2020, $2.8 million for the years ending December 31, 2021 through
2023 and $3.1 million for the year ending December 31, 2024. The expected benefit payments to be made for the subsequent
five years ending December 31, 2025 through 2029 are $15.7 million.
Ocwen contributes to the defined benefit pension plans amounts sufficient to meet minimum funding requirements as set
forth in employee benefit and tax laws as well as additional amounts at their discretion. Our contributions to the defined benefit
pension plans were $0.8 million, $0.2 million and $0.1 million for the years ended December 31, 2019, 2018 and 2017,
respectively. On October 4, 2018, Ocwen assumed all benefit obligations associated with PHH’s defined benefit pension plan
as a result of its completed acquisition of PHH and no contribution was required to be made during the post-acquisition period
ended December 31, 2018.
Gratuity Plan
In accordance with India law, OFSPL provides for a defined benefit retirement plan (Gratuity Plan) covering all of its
employees in India. The Gratuity Plan provides a lump-sum payment to vested employees at retirement or termination of
employment based upon the respective employee’s salary and years of employment. OFSPL provides for the gratuity benefit
through actuarially determined valuations.
The following table shows the total change in the benefit obligation, plan assets and funded status for the Gratuity Plan:
December 31,
2019 2018
Benefit obligation $ 5,370 $ 4,941
Fair value of plan assets 39 37
Unfunded status recognized in Other liabilities $ (5,331 ) $ (4,904 )
During the years ended December 31, 2019 and 2018, benefits of $0.9 million and $0.3 million were paid by OFSPL. As of
December 31, 2019, future expected benefit payments to be made from the assets of the Gratuity Plan, which reflect expected
future service, is $1.0 million, $0.9 million, $0.8 million, $0.7 million and $0.6 million for the years ending December 31,
2020, 2021, 2022, 2023 and 2024, respectively. The expected benefit payments to be made for the subsequent five years ending
December 31, 2025 through 2029 are $1.9 million.
Annual Incentive Plan
The Ocwen Financial Corporation Amended 1998 Annual Incentive Plan and the 2017 Performance Incentive Plan (the
2017 Equity Plan) are our primary incentive compensation plans for executives and other eligible employees. Previously issued
equity awards remain outstanding under the 2007 Equity Incentive Plan (the 2007 Equity Plan). Under the terms of these plans,
participants can earn cash and equity-based awards as determined by the Compensation and Human Capital Committee of the
Board of Directors (the Committee). The awards are based on objective and subjective performance criteria established by the
Committee. The Committee may at its discretion adjust performance measurements to reflect significant unforeseen events. We
recognized $16.6 million, $20.5 million and $24.5 million of compensation expense during 2019, 2018 and 2017, respectively,
related to annual incentive compensation awarded in cash.
The 2007 Equity Plan and the 2017 Equity Plan authorize the grant of stock options, restricted stock, stock units or other
equity-based awards, including cash-settled awards, to employees. Effective with the approval of the 2017 Equity Plan by
Ocwen shareholders on May 24, 2017, no new awards will be granted under the 2007 Equity Plan. The number of remaining
shares available for award grants under the 2007 Equity Plan became available for award grants under the 2017 Equity Plan

F-68
effective upon shareholder approval. At December 31, 2019, there were 6,841,386 shares of common stock remaining available
for future issuance under these plans.
Equity Awards
Outstanding equity awards granted under the 2007 Equity Plan and the 2017 Equity Plan had the following characteristics
in common:
Type of Award
Percent of Total
Equity Award Vesting Period
2011 - 2014 Awards:
Options:
Service Condition:
Time-based 60 % Ratably over four years (25% on each of the four anniversaries of the grant date)
Market Condition:
Market performance-based
35
Over three years beginning with 25% vesting on the date that the stock price has at least doubled over the exercise price and the compounded annual gain over the exercise price is at least 20% and then ratably over three years (25% on each of the next three anniversaries of the achievement of the market condition)
Extraordinary market performance-based
5
Over three years beginning with 25% vesting on the date that the stock price has at least tripled over the exercise price and the compounded annual gain over the exercise price is at least 25% and then ratably over three years (25% on each of the next three anniversaries of the achievement of the market condition)
Total Award 100 %
2015 - 2016 Awards:
Options:
Service Condition:
Time-based 34 %
Ratably over four years (25% vesting on each of the first four anniversaries of the grant date.)
Stock Units:
Service Condition:
Time-based —
Over four years with 1/3 vesting on each of the 2nd, 3rd and 4th anniversaries of the grant date.
Market Condition:
Time-based vesting schedule and Market performance-based vesting date
66
Vest over four years with 25% vesting on each of the four anniversaries of the grant date. However, none are considered vested until the first trading day (if any) on or before the 4th anniversary of the award date on which the average stock price equals or exceeds the price set in the individual award agreement, at which time all units that have met their time-based vesting schedule vest immediately with the remainder vesting in accordance with their time-based schedule.
Total Award 100 %
2017 - 2019 Awards:
Options:
Service Condition:
Time-based 15 %
Ratably over three years (1/3 vesting on each of the first three anniversaries of the grant date).
Stock Units:
Service Condition:
Time-based 56
Over three years with 1/3 vesting on each of the first three anniversaries of the grant date.
Market Condition:

F-69
Type of Award
Percent of Total
Equity Award Vesting Period
Time-based vesting schedule and Market performance-based vesting date
29
Vest over four years with 25% vesting on each of the four anniversaries of the grant date. However, none are considered vested until the first trading day (if any) on or before the 4th anniversary of the award date on which the average stock price equals or exceeds the price set in the individual award agreement, at which time all units that have met their time-based vesting schedule vest immediately with the remainder vesting in accordance with their time-based schedule.
Total Award 100 %
The contractual term of all options granted is ten years from the grant date, except where employment terminates by reason
of death, disability or retirement, in which case, the agreement may provide for an earlier termination of the options. The terms
of the market-based options do not include a retirement provision. Stock units have a three-year or four-year term. If the market
conditions are not met by the third or fourth anniversary of the award of stock units, those units terminate on that date.
Years Ended December 31,
Stock Options 2019 2018 2017
Number of
Options
Weighted Average Exercise
Price Number of
Options
Weighted Average Exercise
Price Number of
Options
Weighted Average Exercise
Price
Outstanding at beginning of year 2,092,599 $ 19.22 6,708,655 $ 9.97 6,926,634 $ 9.88
Granted (1) (2) 51,409 2.08 348,385 3.66 — —
Exercised — — — — — —
Forfeited / Expired (3) (164,577 ) 18.69 (4,964,441 ) 5.62 (217,979 ) 7.16
Outstanding at end of year (4)(5) 1,979,431 $ 18.82 2,092,599 $ 19.22 6,708,655 $ 9.97
Exercisable at end of year (4)(5)(6) 1,580,766 $ 20.16 1,520,039 $ 21.29 6,234,830 $ 8.87
(1) Stock options granted in 2019 include 33,180 options awarded to Ocwen’s Chief Financial Officer at a strike price of $2.17 equal to the
closing price of our common stock on the effective date of her employment. Stock options granted in 2018 include 266,990 options
awarded to Ocwen’s current Chief Executive Officer (CEO) at an exercise price of $4.12 equal to the closing price of our common stock
on the effective date of his employment, which was the closing date of the PHH acquisition.
(2) The weighted average grant date fair value of stock options granted in 2019 was $1.49.
(3) Includes 73,696 and 4,719,750 options which expired unexercised in 2019 and 2018, because their exercise price was greater than the
market price of Ocwen’s stock.
(4) At December 31, 2019, 115,000 options with a market condition for vesting based on an average common stock trading price of $38.41,
had not met their performance criteria. Outstanding and exercisable stock options at December 31, 2019 have a net aggregate intrinsic
value of $0. A total of 810,939 market-based options were outstanding at December 31, 2019, of which 695,939 were exercisable.
(5) At December 31, 2019, the weighted average remaining contractual term of options outstanding and options exercisable was 4.13 years
and 3.28 years, respectively.
(6) The total fair value of stock options that vested and became exercisable during 2019, 2018 and 2017, based on grant-date fair value, was
$0.6 million, $0.6 million and $0.7 million, respectively.
Years Ended December 31,
Stock Units - Equity Awards 2019 2018 2017
Number of Stock Units
Weighted Average
Grant Date Fair Value
Number of Stock Units
Weighted Average
Grant Date Fair Value
Number of Stock Units
Weighted Average
Grant Date Fair Value
Unvested at beginning of year 2,946,800 $ 3.75 2,753,918 $ 3.69 2,752,054 $ 3.91
Granted (1)(2) 1,256,952 2.00 1,809,373 3.57 971,761 2.56
Vested (3)(4) (1,137,696 ) 3.08 (796,856 ) 2.78 (896,272 ) 3.26
Forfeited/Cancelled (1) (406,931 ) 9.58 (819,635 ) 4.57 (73,625 ) 2.20
Unvested at end of year (5)(6) 2,659,125 $ 2.63 2,946,800 $ 3.75 2,753,918 $ 3.69
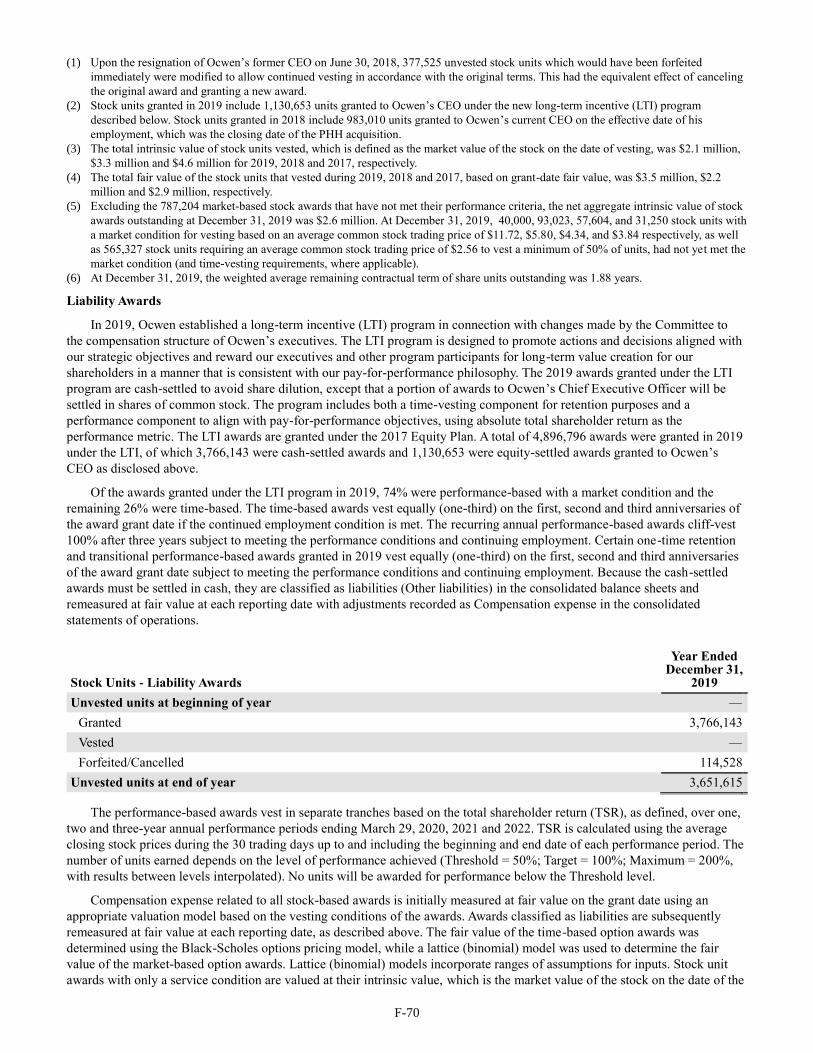
F-70
(1) Upon the resignation of Ocwen’s former CEO on June 30, 2018, 377,525 unvested stock units which would have been forfeited
immediately were modified to allow continued vesting in accordance with the original terms. This had the equivalent effect of canceling
the original award and granting a new award.
(2) Stock units granted in 2019 include 1,130,653 units granted to Ocwen’s CEO under the new long-term incentive (LTI) program
described below. Stock units granted in 2018 include 983,010 units granted to Ocwen’s current CEO on the effective date of his
employment, which was the closing date of the PHH acquisition.
(3) The total intrinsic value of stock units vested, which is defined as the market value of the stock on the date of vesting, was $2.1 million,
$3.3 million and $4.6 million for 2019, 2018 and 2017, respectively.
(4) The total fair value of the stock units that vested during 2019, 2018 and 2017, based on grant-date fair value, was $3.5 million, $2.2
million and $2.9 million, respectively.
(5) Excluding the 787,204 market-based stock awards that have not met their performance criteria, the net aggregate intrinsic value of stock
awards outstanding at December 31, 2019 was $2.6 million. At December 31, 2019, 40,000, 93,023, 57,604, and 31,250 stock units with
a market condition for vesting based on an average common stock trading price of $11.72, $5.80, $4.34, and $3.84 respectively, as well
as 565,327 stock units requiring an average common stock trading price of $2.56 to vest a minimum of 50% of units, had not yet met the
market condition (and time-vesting requirements, where applicable).
(6) At December 31, 2019, the weighted average remaining contractual term of share units outstanding was 1.88 years.
Liability Awards
In 2019, Ocwen established a long-term incentive (LTI) program in connection with changes made by the Committee to
the compensation structure of Ocwen’s executives. The LTI program is designed to promote actions and decisions aligned with
our strategic objectives and reward our executives and other program participants for long-term value creation for our
shareholders in a manner that is consistent with our pay-for-performance philosophy. The 2019 awards granted under the LTI
program are cash-settled to avoid share dilution, except that a portion of awards to Ocwen’s Chief Executive Officer will be
settled in shares of common stock. The program includes both a time-vesting component for retention purposes and a
performance component to align with pay-for-performance objectives, using absolute total shareholder return as the
performance metric. The LTI awards are granted under the 2017 Equity Plan. A total of 4,896,796 awards were granted in 2019
under the LTI, of which 3,766,143 were cash-settled awards and 1,130,653 were equity-settled awards granted to Ocwen’s
CEO as disclosed above.
Of the awards granted under the LTI program in 2019, 74% were performance-based with a market condition and the
remaining 26% were time-based. The time-based awards vest equally (one-third) on the first, second and third anniversaries of
the award grant date if the continued employment condition is met. The recurring annual performance-based awards cliff-vest
100% after three years subject to meeting the performance conditions and continuing employment. Certain one-time retention
and transitional performance-based awards granted in 2019 vest equally (one-third) on the first, second and third anniversaries
of the award grant date subject to meeting the performance conditions and continuing employment. Because the cash-settled
awards must be settled in cash, they are classified as liabilities (Other liabilities) in the consolidated balance sheets and
remeasured at fair value at each reporting date with adjustments recorded as Compensation expense in the consolidated
statements of operations.
Stock Units - Liability Awards
Year Ended December 31,
2019
Unvested units at beginning of year —
Granted 3,766,143
Vested —
Forfeited/Cancelled 114,528
Unvested units at end of year 3,651,615
The performance-based awards vest in separate tranches based on the total shareholder return (TSR), as defined, over one,
two and three-year annual performance periods ending March 29, 2020, 2021 and 2022. TSR is calculated using the average
closing stock prices during the 30 trading days up to and including the beginning and end date of each performance period. The
number of units earned depends on the level of performance achieved (Threshold = 50%; Target = 100%; Maximum = 200%,
with results between levels interpolated). No units will be awarded for performance below the Threshold level.
Compensation expense related to all stock-based awards is initially measured at fair value on the grant date using an
appropriate valuation model based on the vesting conditions of the awards. Awards classified as liabilities are subsequently
remeasured at fair value at each reporting date, as described above. The fair value of the time-based option awards was
determined using the Black-Scholes options pricing model, while a lattice (binomial) model was used to determine the fair
value of the market-based option awards. Lattice (binomial) models incorporate ranges of assumptions for inputs. Stock unit
awards with only a service condition are valued at their intrinsic value, which is the market value of the stock on the date of the
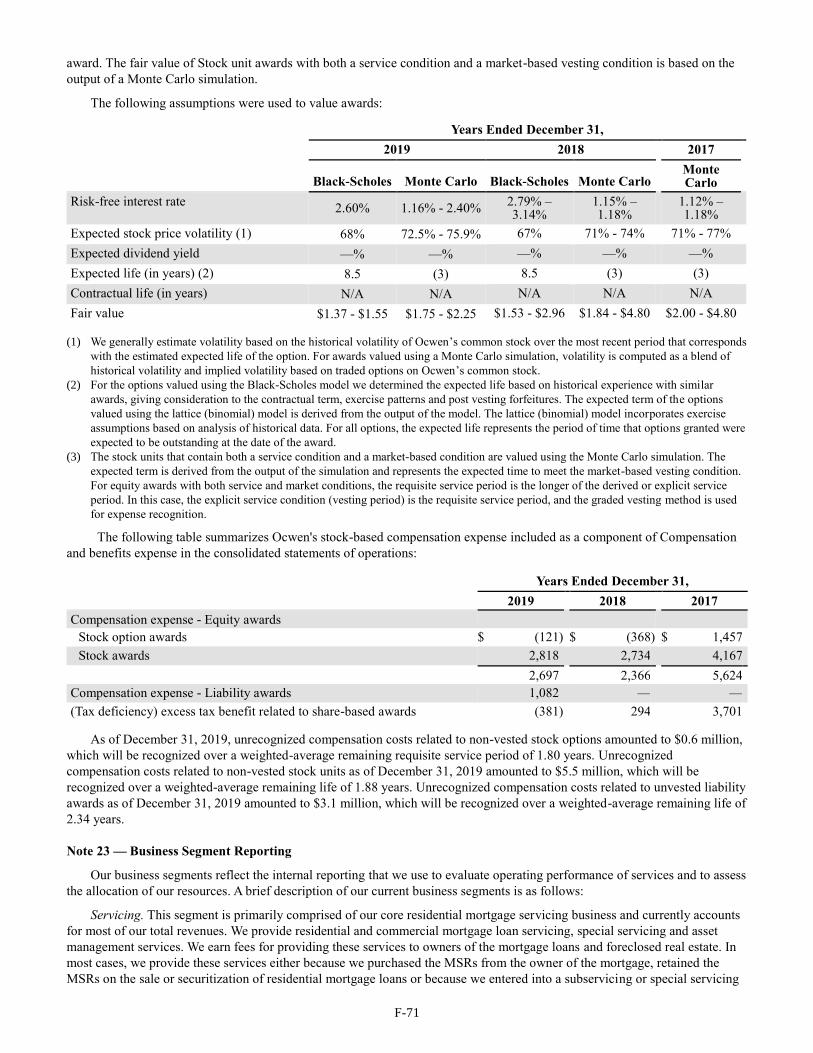
F-71
award. The fair value of Stock unit awards with both a service condition and a market-based vesting condition is based on the
output of a Monte Carlo simulation.
The following assumptions were used to value awards:
Years Ended December 31,
2019 2018 2017
Black-Scholes Monte Carlo Black-Scholes Monte Carlo Monte Carlo
Risk-free interest rate 2.60% 1.16% - 2.40%
2.79% – 3.14%
1.15% – 1.18%
1.12% – 1.18%
Expected stock price volatility (1) 68% 72.5% - 75.9% 67% 71% - 74% 71% - 77%
Expected dividend yield —% —% —% —% —%
Expected life (in years) (2) 8.5 (3) 8.5 (3) (3)
Contractual life (in years) N/A N/A N/A N/A N/A
Fair value $1.37 - $1.55 $1.75 - $2.25 $1.53 - $2.96 $1.84 - $4.80 $2.00 - $4.80
(1) We generally estimate volatility based on the historical volatility of Ocwen’s common stock over the most recent period that corresponds
with the estimated expected life of the option. For awards valued using a Monte Carlo simulation, volatility is computed as a blend of
historical volatility and implied volatility based on traded options on Ocwen’s common stock.
(2) For the options valued using the Black-Scholes model we determined the expected life based on historical experience with similar
awards, giving consideration to the contractual term, exercise patterns and post vesting forfeitures. The expected term of the options
valued using the lattice (binomial) model is derived from the output of the model. The lattice (binomial) model incorporates exercise
assumptions based on analysis of historical data. For all options, the expected life represents the period of time that options granted were
expected to be outstanding at the date of the award.
(3) The stock units that contain both a service condition and a market-based condition are valued using the Monte Carlo simulation. The
expected term is derived from the output of the simulation and represents the expected time to meet the market-based vesting condition.
For equity awards with both service and market conditions, the requisite service period is the longer of the derived or explicit service
period. In this case, the explicit service condition (vesting period) is the requisite service period, and the graded vesting method is used
for expense recognition.
The following table summarizes Ocwen's stock-based compensation expense included as a component of Compensation
and benefits expense in the consolidated statements of operations:
Years Ended December 31,
2019 2018 2017
Compensation expense - Equity awards
Stock option awards $ (121 ) $ (368 ) $ 1,457
Stock awards 2,818 2,734 4,167
2,697 2,366 5,624
Compensation expense - Liability awards 1,082 — —
(Tax deficiency) excess tax benefit related to share-based awards (381 ) 294 3,701
As of December 31, 2019, unrecognized compensation costs related to non-vested stock options amounted to $0.6 million,
which will be recognized over a weighted-average remaining requisite service period of 1.80 years. Unrecognized
compensation costs related to non-vested stock units as of December 31, 2019 amounted to $5.5 million, which will be
recognized over a weighted-average remaining life of 1.88 years. Unrecognized compensation costs related to unvested liability
awards as of December 31, 2019 amounted to $3.1 million, which will be recognized over a weighted-average remaining life of
2.34 years.
Note 23 — Business Segment Reporting
Our business segments reflect the internal reporting that we use to evaluate operating performance of services and to assess
the allocation of our resources. A brief description of our current business segments is as follows:
Servicing. This segment is primarily comprised of our core residential mortgage servicing business and currently accounts
for most of our total revenues. We provide residential and commercial mortgage loan servicing, special servicing and asset
management services. We earn fees for providing these services to owners of the mortgage loans and foreclosed real estate. In
most cases, we provide these services either because we purchased the MSRs from the owner of the mortgage, retained the
MSRs on the sale or securitization of residential mortgage loans or because we entered into a subservicing or special servicing

F-72
agreement with the entity that owns the MSR. Our residential servicing portfolio includes conventional, government-insured
and non-Agency loans. Non-Agency loans include subprime loans, which represent residential loans that generally did not
qualify under GSE guidelines or have subsequently become delinquent.
Lending. The Lending segment purchases and originates conventional and government-insured residential forward and
reverse mortgage loans. The loans are typically sold shortly after origination into a liquid market on a servicing retained
(securitization) or servicing released (sale to a third party) basis. We originate forward mortgage loans directly with customers
(retail channel) as well as through correspondent lending arrangements since the second quarter of 2019. We originate reverse
mortgage loans in all three channels through our correspondent lending arrangements, broker relationships (wholesale) and
retail channels. In 2017, we closed our forward correspondent lending channel and exited the forward wholesale lending
business due to higher liquidity and capital requirements versus the available liquidity at the time. We wrote off the capitalized
balance of software developed internally for the forward wholesale lending business and recorded a loss of $6.8 million in
Other expenses in 2017.
Corporate Items and Other. Corporate Items and Other includes revenues and expenses of corporate support services, CR
Limited (CRL), our wholly-owned captive reinsurance subsidiary, discontinued operations and inactive entities, business
activities that are individually insignificant, revenues and expenses that are not directly related to other reportable segments,
interest income on short-term investments of cash and interest expense on corporate debt. Corporate Items and Other also
includes severance, retention, facility-related and other expenses incurred in 2019 related to our cost re-engineering plan. Our
cash balances are included in Corporate Items and Other. CRL provides re-insurance related to coverage on foreclosed real
estate properties owned or serviced by us. In January 2018, we decided to exit the ACS business and have liquidated our
portfolio of inventory-secured loans to independent used car dealers.
We allocate a portion of interest income to each business segment, including interest earned on cash balances and short-
term investments. We also allocate expenses incurred by corporate support services to each business segment. Interest expense
on direct asset-backed financings are recorded in the respective Servicing and Lending segments, while interest expense on the
SSTL and Senior Notes is recorded in Corporate Items and Other and is not allocated.
Financial information for our segments is as follows:
Results of Operations Servicing Lending
Corporate Items and
Other Corporate
Eliminations
Business Segments
Consolidated
Year Ended December 31, 2019
Revenue $ 985,102 $ 125,086 $ 13,187 $ — $ 1,123,375
MSR valuation adjustments, net (120,646 ) (230 ) — — (120,876 )
Operating expenses (1) (2) 536,153 84,280 53,506 — 673,939
Other income (expense):
Interest income 8,051 7,277 1,776 — 17,104
Interest expense (47,347 ) (7,911 ) (58,871 ) — (114,129 )
Pledged MSR liability expense (372,172 ) — 83 — (372,089 )
Gain on repurchase of senior secured notes —
—
5,099
—
5,099
Bargain purchase gain — — (381 ) (381 )
Gain on sale of MSRs, net 453 — — — 453
Other, net 11,942 791 (3,841 ) — 8,892
Other income (expense), net (399,073 ) 157 (56,135 ) — (455,051 )
Income (loss) before income taxes $ (70,770 ) $ 40,733 $ (96,454 ) $ — $ (126,491 )
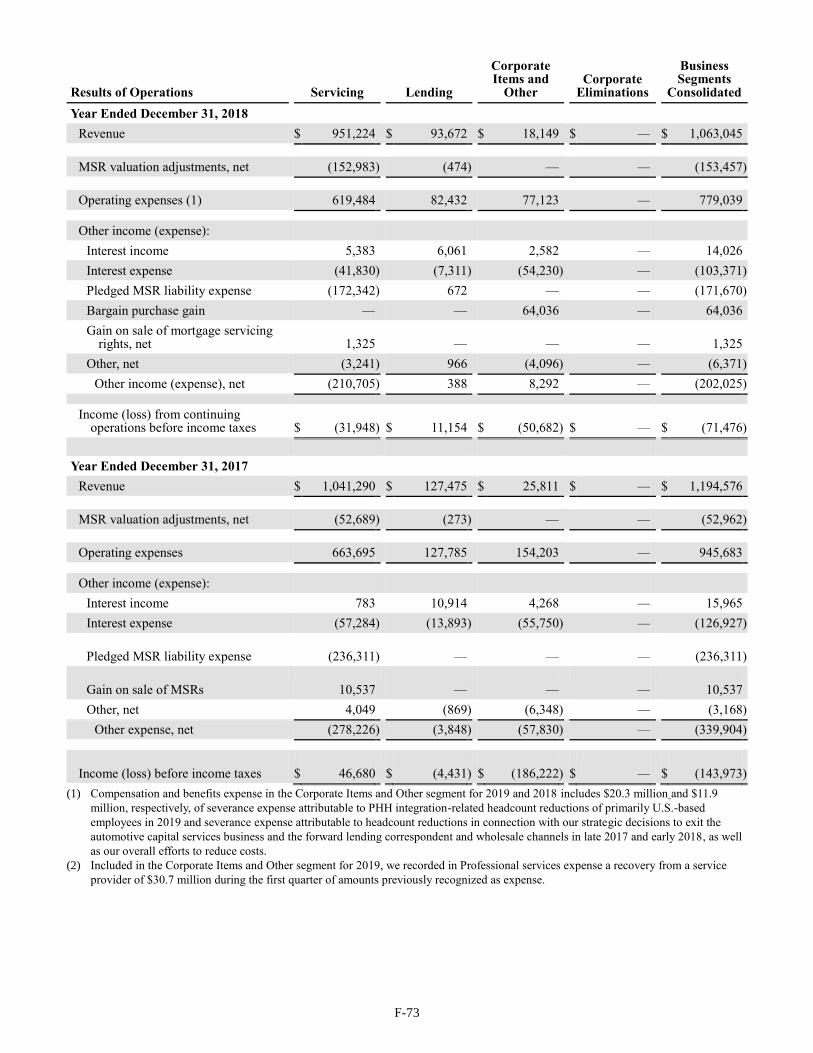
F-73
Results of Operations Servicing Lending
Corporate Items and
Other Corporate
Eliminations
Business Segments
Consolidated
Year Ended December 31, 2018
Revenue $ 951,224 $ 93,672 $ 18,149 $ — $ 1,063,045
MSR valuation adjustments, net (152,983 ) (474 ) — — (153,457 )
Operating expenses (1) 619,484 82,432 77,123 — 779,039
Other income (expense):
Interest income 5,383 6,061 2,582 — 14,026
Interest expense (41,830 ) (7,311 ) (54,230 ) — (103,371 )
Pledged MSR liability expense (172,342 ) 672 — — (171,670 )
Bargain purchase gain — — 64,036 — 64,036
Gain on sale of mortgage servicing rights, net 1,325
—
—
—
1,325
Other, net (3,241 ) 966 (4,096 ) — (6,371 )
Other income (expense), net (210,705 ) 388 8,292 — (202,025 )
Income (loss) from continuing
operations before income taxes $ (31,948 ) $ 11,154
$ (50,682 ) $ —
$ (71,476 )
Year Ended December 31, 2017
Revenue $ 1,041,290 $ 127,475 $ 25,811 $ — $ 1,194,576
MSR valuation adjustments, net (52,689 ) (273 ) — — (52,962 )
Operating expenses 663,695 127,785 154,203 — 945,683
Other income (expense):
Interest income 783 10,914 4,268 — 15,965
Interest expense (57,284 ) (13,893 ) (55,750 ) — (126,927 )
Pledged MSR liability expense (236,311 ) —
—
—
(236,311 )
Gain on sale of MSRs 10,537
—
—
—
10,537
Other, net 4,049 (869 ) (6,348 ) — (3,168 )
Other expense, net (278,226 ) (3,848 ) (57,830 ) — (339,904 )
Income (loss) before income taxes $ 46,680
$ (4,431 ) $ (186,222 ) $ —
$ (143,973 ) (1) Compensation and benefits expense in the Corporate Items and Other segment for 2019 and 2018 includes $20.3 million and $11.9
million, respectively, of severance expense attributable to PHH integration-related headcount reductions of primarily U.S.-based
employees in 2019 and severance expense attributable to headcount reductions in connection with our strategic decisions to exit the
automotive capital services business and the forward lending correspondent and wholesale channels in late 2017 and early 2018, as well
as our overall efforts to reduce costs.
(2) Included in the Corporate Items and Other segment for 2019, we recorded in Professional services expense a recovery from a service
provider of $30.7 million during the first quarter of amounts previously recognized as expense.

F-74
Total Assets Servicing Lending
Corporate Items and
Other Corporate
Eliminations
Business Segments
Consolidated
December 31, 2019 $ 3,378,515 $ 6,459,367 $ 568,317 $ — $ 10,406,199
December 31, 2018 3,306,208 5,603,481 484,527 — 9,394,216
December 31, 2017 3,033,243 4,945,456 424,465 — 8,403,164
Depreciation and Amortization Expense Servicing Lending
Corporate Items and
Other
Business Segments
Consolidated
Year Ended December 31, 2019:
Depreciation expense $ 1,925 $ 93 $ 29,893 $ 31,911
Amortization of debt discount — — 1,342 1,342
Amortization of debt issuance costs 71 — 3,099 3,170
Year Ended December 31, 2018:
Depreciation expense $ 4,601 $ 103 $ 22,498 $ 27,202
Amortization of debt discount — — 1,183 1,183
Amortization of debt issuance costs — — 2,921 2,921
Year Ended December 31, 2017:
Depreciation expense $ 5,797 $ 194 $ 20,895 $ 26,886
Amortization of mortgage servicing rights 51,515 273 — 51,788
Amortization of debt discount — — 1,114 1,114
Amortization of debt issuance costs — — 2,738 2,738
Note 24 — Regulatory Requirements
Our business is subject to extensive regulation by federal, state and local governmental authorities, including the Consumer
Financial Protection Bureau (CFPB), HUD, the SEC and various state agencies that license and conduct examinations of our
servicing and lending activities. In addition, we operate under a number of regulatory settlements that subject us to ongoing
reporting and other obligations. From time to time, we also receive requests (including requests in the form of subpoenas and
civil investigative demands) from federal, state and local agencies for records, documents and information relating to our
servicing and lending activities. The GSEs (and their conservator, the Federal Housing Finance Authority (FHFA)), Ginnie
Mae, the United States Treasury Department, various investors, non-Agency securitization trustees and others also subject us to
periodic reviews and audits.
In the current regulatory environment, we have faced and expect to continue to face heightened regulatory and public
scrutiny as an organization as well as stricter and more comprehensive regulation of the entire mortgage sector. We continue to
work diligently to assess and understand the implications of the evolving regulatory environment in which we operate and to
meet its requirements. We devote substantial resources to regulatory compliance, while, at the same time, striving to meet the
needs and expectations of our customers, clients and other stakeholders. Our failure to comply with applicable federal, state and
local laws, regulations and licensing requirements could lead to (i) administrative fines and penalties and litigation, (ii) loss of
our licenses and approvals to engage in our servicing and lending businesses, (iii) governmental investigations and enforcement
actions, (iv) civil and criminal liability, including class action lawsuits and actions to recover incentive and other payments
made by governmental entities, (v) breaches of covenants and representations under our servicing, debt or other agreements,
(vi) damage to our reputation, (vii) inability to raise capital or otherwise fund our operations and (viii) inability to execute on
our business strategy. In addition to amounts paid to resolve regulatory matters, we have in the past incurred, and may in the
future incur, costs to comply with the terms of such resolutions, including staffing costs, legal costs and, in certain cases the
costs of audits, reviews and third-party firms to monitor our compliance with such resolutions.

F-75
We must comply with a large number of federal, state and local consumer protection and other laws and regulations,
including, among others, the Dodd-Frank Wall Street Reform and Consumer Protection Act (the Dodd-Frank Act), the
Telephone Consumer Protection Act (TCPA), the Gramm-Leach-Bliley Act, the Fair Debt Collection Practices Act (FDCPA),
the Real Estate Settlement Procedures Act (RESPA), the Truth in Lending Act (TILA), the Servicemembers Civil Relief Act,
the Homeowners Protection Act, the Federal Trade Commission Act, the Fair Credit Reporting Act, the Equal Credit
Opportunity Act, as well as individual state licensing and foreclosure laws, individual state and local laws relating to
registration of vacant or foreclosed properties, and federal and local bankruptcy rules. These laws and regulations apply to
many facets of our business, including loan origination, default servicing and collections, use of credit reports, safeguarding of
non-public personally identifiable information about our customers, foreclosure and claims handling, investment of, and
interest payments on, escrow balances and escrow payment features and fees assessed on borrowers, and they mandate certain
disclosures and notices to borrowers. These requirements can and do change as laws and regulations are enacted, promulgated,
amended, interpreted and enforced, including through CFPB interpretive bulletins and other regulatory pronouncements. In
addition, the actions of legislative bodies and regulatory agencies relating to a particular matter or business practice may or
may not be coordinated or consistent. As a result, ensuring ongoing compliance with applicable legal and regulatory
requirements can be challenging. Over the past decade, the general trend among federal, state and local legislative bodies and
regulatory agencies as well as state attorneys general has been toward increasing laws, regulations, investigative proceedings
and enforcement actions with regard to residential real estate lenders and servicers. New regulatory and legislative measures, or
changes in enforcement practices, including those related to the technology we use, could, either individually or in the
aggregate, require significant changes to our business practices, impose additional costs on us, limit our product offerings, limit
our ability to efficiently pursue business opportunities, negatively impact asset values or reduce our revenues. Accordingly,
they could materially and adversely affect our business, financial condition, liquidity and results of operations.
As further described below and in Note 26 — Contingencies, in recent years Ocwen has entered into a number of
significant settlements with federal and state regulators and state attorneys general that have imposed additional requirements
on our business. For example, we made various commitments relating to the process of transferring loans off the
REALServicing® servicing system and onto the Black Knight Financial Services, Inc. (Black Knight) LoanSphere MSP®
servicing system (Black Knight MSP), we have engaged a third-party auditor to perform an analysis with respect to our
compliance with certain federal and state laws relating to the escrow of mortgage loan payments, we have revised various
aspects of our complaint handling processes and we have extensive review and reporting obligations to various regulatory
bodies with respect to various matters, including our financial condition. We devote significant management time and resources
to compliance with these additional requirements. These requirements are generally unique to Ocwen and, while certain of our
competitors may have entered into regulatory-related settlements of their own, our competitors are generally not subject to
either the same specific or the same breadth of additional requirements to which we are subject.
Ocwen has various subsidiaries that are licensed to originate and/or service forward and reverse mortgage loans in those
jurisdictions in which they operate, and which require licensing. Our licensed entities are required to renew their licenses,
typically on an annual basis, and to do so they must satisfy the license renewal requirements of each jurisdiction, which
generally include financial requirements such as providing audited financial statements and satisfying minimum net worth
requirements and non-financial requirements such as satisfactory completion of examinations relating to the licensee’s
compliance with applicable laws and regulations. Failure to satisfy any of the requirements to which our licensed entities are
subject could result in a variety of regulatory actions ranging from a fine, a directive requiring a certain step to be taken, entry
into a consent order, a suspension or, ultimately, a revocation of a license, any of which could have a material adverse impact
on our business, reputation, results of operations and financial condition. The minimum net worth requirements to which our
licensed entities are subject are unique to each state and type of license. We believe our licensed entities were in compliance
with all of their minimum net worth requirements at December 31, 2019.
PMC and Liberty are also subject to seller/servicer obligations under agreements with one or more of the GSEs, HUD,
FHA, VA and Ginnie Mae. These seller/servicer obligations contain financial requirements, including capital requirements
related to tangible net worth, as defined by the applicable agency, an obligation to provide audited consolidated financial
statements within 90 days of the applicable entity’s fiscal year end as well as extensive requirements regarding servicing,
selling and other matters. To the extent that these requirements are not met or waived, the applicable agency may, at its option,
utilize a variety of remedies including requirements to provide certain information or take actions at the direction of the
applicable agency, requirements to deposit funds as security for our obligations, sanctions, suspension or even termination of
approved seller/servicer status, which would prohibit future originations or securitizations of forward or reverse mortgage loans
or servicing for the applicable agency. Any of these actions could have a material adverse impact on us. To date, none of these
counterparties has communicated any material sanction, suspension or prohibition in connection with our seller/servicer
obligations. We believe we were in compliance with applicable net worth requirements at December 31, 2019. Our non-Agency
servicing agreements also contain requirements regarding servicing practices and other matters, and a failure to comply with
these requirements could have a material adverse impact on our business.

F-76
The most restrictive of the various net worth requirements for licensing and seller/servicer obligations referenced above is
due to Fannie Mae’s eligibility requirements for PMC related to a decline in lender adjusted net worth. Fannie Mae required
PMC to demonstrate an adjusted net worth of $268.7 million at December 31, 2019. PMC’s net worth was $341.5 million at
December 31, 2019.
In addition, a number of foreign laws and regulations apply to our operations outside of the U.S., including laws and
regulations that govern licensing, privacy, employment, safety, taxes and insurance and laws and regulations that govern the
creation, continuation and the winding up of companies as well as the relationships between shareholders, our corporate
entities, the public and the government in these countries. Non-compliance with these laws and regulations could result in
adverse actions against us, including (i) restrictions on our operations in these countries, (ii) fines, penalties or sanctions or (iii)
reputational damage.
New York Department of Financial Services. In March 2017, we entered into a consent order with the NY DFS (the 2017
NY Consent Order) that provided for the termination of the engagement of a monitor appointed pursuant to an earlier 2014
consent order and for us to address certain concerns raised by the NY DFS that primarily relate to our servicing operations, as
well as for us to comply with certain reporting and other obligations. In addition, in connection with the NY DFS’ approval in
September 2018 of our acquisition of PHH, we agreed to satisfy certain post-closing requirements, including reporting
obligations and record retention and other requirements relating to the transfer of loans collateralized by New York property
(New York loans) onto Black Knight MSP and certain requirements with respect to the evaluation and supervision of
management of both Ocwen and PMC. In addition, we were prohibited from boarding any additional loans onto the
REALServicing system and we were required to transfer all New York loans off the REALServicing system by April 30, 2020.
The conditional approval also modified a preexisting restriction on our ability to acquire MSRs such that the restriction applies
only to New York loans and, with respect to New York loans, provides that Ocwen may not increase its aggregate portfolio of
New York loans serviced or subserviced by Ocwen by more than 2% per year (based on the unpaid principal balance of loans
serviced at the prior calendar year-end). This restriction will remain in place until the NY DFS determines that all loans
serviced on the REALServicing system have been successfully migrated to Black Knight MSP and that Ocwen has developed a
satisfactory infrastructure to board sizable portfolios of MSRs. We have transferred all loans onto Black Knight MSP and no
longer service any loans on the REALServicing system.
We continue to work with the NY DFS to address matters they continue to raise with us as well as to fulfill our
commitments under the 2017 NY Consent Order and PHH acquisition conditional approval. To the extent that we fail to
address adequately any concerns raised by the NY DFS or fail to fulfill our commitments to the NY DFS, the NY DFS could
take regulatory action against us, including imposing fines or penalties or otherwise further restricting our business activities.
Any such actions could have a material adverse impact on our business, financial condition, liquidity and results of operations.
California Department of Business Oversight. In January 2015, OLS entered into a consent order (the 2015 CA Consent
Order) with the CA DBO relating to our alleged failure to produce certain information and documents during a routine
licensing examination. In February 2017, we entered into another consent order with the CA DBO (the 2017 CA Consent
Order) that terminated the 2015 CA Consent Order and resolved open matters between us and the CA DBO. We believe that we
have completed those obligations of the 2017 CA Consent Order that have already come due, and we have so notified the CA
DBO. We have certain remaining reporting and other obligations under the 2017 CA Consent Order. Pursuant to the 2017 CA
Consent Order, the CA DBO has engaged a third-party administrator who, at the expense of the CA DBO, has commenced
work to confirm that Ocwen has completed certain commitments under the 2017 CA Consent Order. Still outstanding, however,
is confirmation of our completion of $198.0 million in debt forgiveness for California borrowers by June 30, 2019. We believe
that we fulfilled this requirement during the first quarter of 2019. However, our completion of this requirement is subject to
testing by the CA DBO’s third-party administrator who must confirm, among other things, that modified loans have remained
current for specified time periods. If we are unable to satisfy this requirement or obtain an extension, the 2017 CA Consent
Order obligates us to pay the remaining amount to the CA DBO in cash. Our debt forgiveness activities take place as we
modify loans - our loan modifications are designed to be sustainable for homeowners while providing a net present value for
mortgage loan investors that is superior to that of foreclosure. Debt forgiveness as part of a loan modification is determined on
a case-by-case basis in accordance with the applicable servicing agreement. Debt forgiveness does not involve an expense to
Ocwen other than the operating expense incurred in arranging the modification, which is part of Ocwen’s role as loan servicer.
If the CA DBO were to allege that we failed to comply with our obligations under the 2017 CA Consent Order or that we
otherwise were in breach of applicable laws, regulations or licensing requirements, the CA DBO could also take regulatory
actions against us, including imposing fines or penalties or otherwise restricting our business activities. Any such actions could
have a material adverse impact on our business, financial condition, liquidity and results of operations.

F-77
Note 25 — Commitments
Unfunded Lending Commitments
We have originated floating-rate reverse mortgage loans under which the borrowers have additional borrowing capacity of
$1.5 billion at December 31, 2019. This additional borrowing capacity is available on a scheduled or unscheduled payment
basis. We also had short-term commitments to lend $204.0 million and $28.5 million in connection with our forward and
reverse mortgage loan IRLCs, respectively, outstanding at December 31, 2019. We finance originated and purchased forward
and reverse mortgage loans with repurchase and participation agreements, commonly referred to as warehouse lines.
HMBS Issuer Obligations
As an HMBS issuer, we assume certain obligations related to each security issued. The most significant obligation is the
requirement to purchase loans out of the Ginnie Mae securitization pools once the outstanding principal balance of the related
HECM is equal to or greater than 98% of the maximum claim amount (MCA repurchases). Active repurchased loans are
assigned to HUD and payment is received from HUD, typically within 60 days of repurchase. HUD reimburses us for the
outstanding principal balance on the loan up to the maximum claim amount. We bear the risk of exposure if the amount of the
outstanding principal balance on a loan exceeds the maximum claim amount. Inactive repurchased loans (the borrower is
deceased, no longer occupies the property or is delinquent on tax and insurance payments) are generally liquidated through
foreclosure and subsequent sale of REO, with a claim filed with HUD for recoverable remaining principal and advance
balances. The recovery timeline for inactive repurchased loans depends on various factors, including foreclosure status at the
time of repurchase, state-level foreclosure timelines, and the post-foreclosure REO liquidation timeline.
The timing and amount of our obligation with respect to MCA repurchases is uncertain as repurchase is dependent largely
on circumstances outside of our control including the amount and timing of future draws and the status of the loan. MCA
repurchases are expected to continue to increase due to the increased flow of HECMs and REO that are reaching 98% of their
maximum claim amount. Activity with regard to HMBS repurchases, including MCA repurchases, follows:
Year Ended December 31, 2019
Active Inactive Total
Number Amount Number Amount Number Amount
Beginning balance 10 $ 2,047 252 $ 14,833 262 $ 16,880
Additions (1) 81 19,671 241 24,517 322 44,188
Recoveries, net (2) (30 ) (10,414 ) (234 ) (12,520 ) (264 ) (22,934 )
Transfers 1 (785 ) (1 ) 785 — —
Changes in value — 27 — (2,468 ) — (2,441 )
Ending balance 62 $ 10,546 258 $ 25,147 320 $ 35,693
(1) Total repurchases during the year ended December 31, 2019, includes 189 loans totaling $38.4 million related to MCA repurchases.
(2) Includes amounts received upon assignment of loan to HUD, loan payoff, REO liquidation and claim proceeds less any amounts
charged off as unrecoverable.
Active loan repurchases are classified as Receivables as reimbursement from HUD is generally received within 60 days
and are initially recorded at fair value. Inactive loan repurchases are classified as Loans held for sale and are initially recorded
at fair value. Loans are reclassified to REO in Other assets or Receivables as the loans move through the resolution process and
permissible claims are submitted to HUD for reimbursement. Loans held for sale repurchased prior to October 1, 2018 are
carried at the lower of cost or fair value. Receivables are valued at net realizable value. REO is valued at the estimated value of
the underlying property less cost to sell.

F-78
Lease Commitments
We lease certain of our premises and equipment under non-cancelable operating leases with terms expiring through 2025
exclusive of renewal option periods. At December 31, 2019, the weighted average remaining term of our leases was 3.3 years.
A maturity analysis of our lease liability as of December 31, 2019 is summarized as follows:
2020 $ 16,652
2021 15,356
2022 13,102
2023 3,088
2024 697
Thereafter 654
49,549
Less: Adjustment to present value (5,061 )
Total lease payments, net $ 44,488
(1) At December 31, 2019, the weighted average of the discount rate used to estimate the present value was 7.5% based on our incremental
borrowing rate.
We converted rental commitments for our facilities outside the U.S. to U.S. dollars using exchange rates in effect at
December 31, 2019. Operating lease cost for 2019 and Rent expense for 2018 and 2017 was $26.1 million, $16.6 million and
$18.8 million, respectively. The operating lease cost for 2019 includes $5.4 million of variable lease expense.
We have subleased certain of our premises with terms expiring through 2022. Sublease income for 2019, 2018 and 2017
was $1.5 million, $0.9 million and $0.8 million, respectively. For 2020, 2021 and 2022, our future annual aggregate minimum
sublease income is $1.7 million, $1.6 million and $1.2 million, respectively.
NRZ Relationship
Our Servicing segment has exposure to concentration risk and client retention risk. As of December 31, 2019, our servicing
portfolio included significant client relationships with NRZ which represented 56% and 61% of our servicing portfolio UPB
and loan count, respectively. The NRZ servicing portfolio accounts for approximately 74% of all delinquent loans that Ocwen
services. The current terms of our agreements with NRZ extend through June 2020, subject to an automatic renewal provision
(legacy PMC agreement) and July 2022 (legacy Ocwen agreements).
Currently, subject to proper notice (generally 180 days’ notice), the payment of deboarding fees (in the case of the legacy
PMC agreement) and termination fees (in the case of the legacy Ocwen agreements) and certain other provisions, NRZ has
rights to terminate these agreements for convenience. Because of the large percentage of our servicing business that is
represented by agreements with NRZ, if NRZ exercised all or a significant portion of these termination rights, we might need to
right-size or restructure certain aspects of our servicing business as well as the related corporate support functions.
We currently account for the MSR sale agreements with NRZ as secured financings as the transactions did not achieve sale
accounting treatment. Accordingly, our balance sheet reflects a $915.1 million MSR asset pledged to NRZ out of a total $1.5
billion MSRs at fair value at December 31, 2019, and a corresponding $915.1 million pledged MSR liability at fair value within
Other financing liabilities. Similarly, our statement of operations reflects $437.7 million net servicing fee collected on behalf
of, and remitted to NRZ out of a total $975.5 million Servicing and subservicing fees for the year ended December 31, 2019,
and a corresponding $437.7 million expense reported within Pledged MSR liability expense. The $437.7 million net servicing
fees collected on behalf of, and remitted to NRZ did not affect our net earnings. In addition, we recognize amortization income
related to lump sum payments we received from NRZ in 2017 and 2018, through April 2020, with an outstanding unamortized
balance of $35.4 million at December 31, 2019. The reporting of MSRs and revenue gross versus net in our financial
statements is required until sale accounting criteria are met, upon the earliest of the terms of the agreements or any termination
notice.
The NRZ agreements affect our net earnings through the recognition of subservicing fees we retain, which amounted
$139.3 million for the year ended December 31, 2019, and ancillary income, which we estimated to be $84.7 million for the
year ended December 31, 2019. If NRZ were to exercise its termination rights, our net earnings would be affected by the loss of
such subservicing revenue and the decrease of operating expenses for servicing the NRZ portfolio and the associated corporate
overhead allocation.
Selected assets and liabilities recorded on our consolidated balance sheets as well as the impacts to our consolidated
statements of operations in connection with our NRZ agreements are disclosed in Note 10 — Rights to MSRs.

F-79
On February 20, 2020, we received a notice of termination from NRZ with respect to the subservicing agreement between
NRZ and PMC, which accounted for 20% of our servicing portfolio UPB at December 31, 2019. See Note 28 — Subsequent
Events.
Note 26 — Contingencies
When we become aware of a matter involving uncertainty for which we may incur a loss, we assess the likelihood of any
loss. If a loss contingency is probable and the amount of the loss can be reasonably estimated, we record an accrual for the loss.
In such cases, there may be an exposure to potential loss in excess of the amount accrued. Where a loss is not probable but is
reasonably possible or where a loss in excess of the amount accrued is reasonably possible, we disclose an estimate of the
amount of the loss or range of possible losses for the claim if a reasonable estimate can be made, unless the amount of such
reasonably possible loss is not material to our financial position, results of operations or cash flows. If a reasonable estimate of
loss cannot be made, we do not accrue for any loss or disclose any estimate of exposure to potential loss even if the potential
loss could be material and adverse to our business, reputation, financial condition and results of operations. An assessment
regarding the ultimate outcome of any such matter involves judgments about future events, actions and circumstances that are
inherently uncertain. The actual outcome could differ materially. Where we have retained external legal counsel or other
professional advisers, such advisers assist us in making such assessments.
Litigation
In the ordinary course of business, we are a defendant in, or a party or potential party to, many threatened and pending
legal proceedings, including proceedings brought by regulatory agencies (discussed further under “Regulatory” below), those
brought on behalf of various classes of claimants, those brought derivatively on behalf of Ocwen against certain current or
former officers and directors or others and those brought by commercial counterparties, including claims by parties to whom
we have sold MSRs or other assets or those on whose behalf we service mortgage loans.
The majority of these proceedings are based on alleged violations of federal, state and local laws and regulations governing
our mortgage servicing and lending activities, including, among others, the Dodd-Frank Act, the Gramm-Leach-Bliley Act, the
FDCPA, the RESPA, the TILA, the Fair Credit Reporting Act, the Servicemembers Civil Relief Act, the Homeowners
Protection Act, the Federal Trade Commission Act, the TCPA, the Equal Credit Opportunity Act, as well as individual state
licensing and foreclosure laws and federal and local bankruptcy rules. Such proceedings include wrongful foreclosure and
eviction actions, allegations of wrongdoing in connection with lender-placed insurance and mortgage reinsurance
arrangements, claims relating to our property preservation activities, claims related to REO management, claims relating to our
written and telephonic communications with our borrowers such as claims under the TCPA, claims related to our payment,
escrow and other processing operations, claims relating to fees imposed on borrowers relating to payment processing, payment
facilitation or payment convenience, claims related to ancillary products marketed and sold to borrowers, and claims regarding
certifications of our legal compliance related to our participation in certain government programs. In some of these
proceedings, claims for substantial monetary damages are asserted against us. For example, we are currently a defendant in
various matters alleging that (1) certain fees imposed on borrowers relating to payment processing, payment facilitation or
payment convenience violate the FDCPA and similar state laws, (2) certain fees we assess on borrowers are marked up
improperly in violation of applicable state and federal law, (3) we breached fiduciary duties we purportedly owe to benefit
plans due to the discretion we exercise in servicing certain securitized mortgage loans and (4) certain legacy mortgage
reinsurance arrangements violated RESPA. In the future, we are likely to become subject to other private legal proceedings
alleging failures to comply with applicable laws and regulations, including putative class actions, in the ordinary course of our
business.
In view of the inherent difficulty of predicting the outcome of any threatened or pending legal proceedings, particularly
where the claimants seek very large or indeterminate damages, including punitive damages, or where the matters present novel
legal theories or involve a large number of parties, we generally cannot predict what the eventual outcome of such proceedings
will be, what the timing of the ultimate resolution will be, or what the eventual loss, if any, will be. Any material adverse
resolution could materially and adversely affect our business, reputation, financial condition, liquidity and results of operations.
Where we determine that a loss contingency is probable in connection with a pending or threatened legal proceeding and
the amount of our loss can be reasonably estimated, we record an accrual for the loss. We have accrued for losses relating to
threatened and pending litigation that we believe are probable and reasonably estimable based on current information regarding
these matters. Where we determine that a loss is not probable but is reasonably possible or where a loss in excess of the amount
accrued is reasonably possible, we disclose an estimate of the amount of the loss or range of possible losses for the claim if a
reasonable estimate can be made, unless the amount of such reasonably possible loss is not material to our financial position,
results of operations or cash flows. It is possible that we will incur losses relating to threatened and pending litigation that
materially exceed the amount accrued. Our accrual for probable and estimable legal and regulatory matters, including accrued
legal fees, was $30.7 million at December 31, 2019. We cannot currently estimate the amount, if any, of reasonably possible
losses above amounts that have been recorded at December 31, 2019.

F-80
In 2014, plaintiffs filed a putative class action against Ocwen in the United States District Court for the Northern District
of Alabama, alleging that Ocwen violated the FDCPA by charging borrowers a convenience fee for making certain loan
payments. See McWhorter et al. v. Ocwen Loan Servicing, LLC (N.D. Ala.). The plaintiffs sought statutory damages under the
FDCPA, compensatory damages and injunctive relief. We subsequently entered into an agreement in principle to resolve this
matter, and in August 2019, the court granted final approval of the class settlement. While we believe we had sound legal and
factual defenses, we agreed to this settlement in order to avoid the uncertain outcome of litigation and the additional expense
and demands on the time of our senior management that such litigation would involve. Our accrual with respect to this matter is
included in the $30.7 million legal and regulatory accrual referenced above. We are also subject to individual lawsuits relating
to our FDCPA compliance and putative state law class actions based on state laws similar to the FDCPA. At this time, we
cannot estimate the amount, if any, of reasonably possible loss related to these matters.
Ocwen has been named in putative class actions and individual actions related to its compliance with the TCPA. Generally,
plaintiffs in these actions allege that Ocwen knowingly and willfully violated the TCPA by using an automated telephone
dialing system to call individuals’ cell phones without their consent. In July 2017, Ocwen entered into an agreement in
principle to resolve two such putative class actions, which have been consolidated in the United States District Court for the
Northern District of Illinois. See Snyder v. Ocwen Loan Servicing, LLC (N.D. Ill.); Beecroft v. Ocwen Loan Servicing, LLC
(N.D. Ill.). In October 2017, the court preliminarily approved the settlement and, thereafter, we paid a settlement amount into
an escrow account held by the settlement administrator. However, in September 2018, the Court denied the motion for final
approval. In November 2018, the parties engaged in mediation to address the issues raised by the Court in its denial order. The
parties thereafter reached agreement on a revised settlement. In June 2019, the court entered an order approving the settlement,
which provided for the establishment of a settlement fund to be distributed to class members that submit claims for settlement
benefits pursuant to a claims administration process. While Ocwen believes that it has sound legal and factual defenses, Ocwen
agreed to the settlement in order to avoid the uncertain outcome of litigation and the additional expense and demands on the
time of its senior management that such litigation would involve.
Ocwen is also involved in a related TCPA class action that involves claims against trustees of RMBS trusts based on
vicarious liability for Ocwen’s alleged non-compliance with the TCPA. The trustees have sought indemnification from Ocwen
based on the vicarious liability claims. Additional lawsuits have been and may be filed against us in relation to our TCPA
compliance. Our accrual with respect to TCPA matters is included in the $30.7 million legal and regulatory accrual referenced
above. At this time, Ocwen is unable to predict the outcome of existing lawsuits or any additional lawsuits that may be filed,
the possible loss or range of loss, if any, above the amount accrued or the potential impact such lawsuits may have on us or our
operations. Ocwen intends to vigorously defend against these lawsuits. If our efforts to defend these lawsuits are not successful,
our business, reputation, financial condition, liquidity and results of operations could be materially and adversely affected.
From time to time we are also subject to indemnification claims from contractual parties on whose behalf we service or
subservice loans. We are currently involved in a dispute with a former subservicing client relating to alleged violations of our
contractual agreements, including that we did not properly submit mortgage insurance and other claims for reimbursement. We
are presently engaged in a dispute resolution process relating to these claims. Ocwen is currently unable to predict the outcome
of this dispute or estimate the size of any loss which could result from a potential resolution reached through mediation,
following litigation or otherwise.
We have settled two “opt-out” securities fraud actions brought on behalf of certain putative shareholders of Ocwen based
on allegations in connection with the restatements of our 2013 and first quarter 2014 financial statements, among other matters.
See Brahman Partners et al. v. Ocwen Financial Corporation et al. (S.D. Fla.) and Owl Creek et al. v. Ocwen Financial
Corporation et al. (S.D. Fla.). Both of these cases were dismissed with prejudice in February 2019.
We have previously disclosed that as a result of the federal and state regulatory actions taken in April 2017 and shortly
thereafter, which are described below under “Regulatory”, and the impact on our stock price, several putative securities fraud
class action lawsuits were filed against Ocwen and certain of its officers that contain allegations in connection with Ocwen’s
statements concerning its efforts to satisfy the evolving regulatory environment, and the resources it devoted to regulatory
compliance, among other matters. Those lawsuits were consolidated in the United States District Court for the Southern District
of Florida in the matter captioned Carvelli v. Ocwen Financial Corporation et al. (S.D. Fla.). In April 2018, the court in
Carvelli granted our motion to dismiss, and dismissed the consolidated case with prejudice. Plaintiffs thereafter filed a notice of
appeal with the Court of Appeals for the Eleventh Circuit, and a hearing took place in June 2019. In August 2019, the Court of
Appeals affirmed the district court’s ruling dismissing the consolidated case with prejudice. Plaintiffs had until November 13,
2019 to appeal to the United States Supreme Court, but did not do so. Therefore, the case remains dismissed with prejudice.
Over the past several years, lawsuits have been filed by RMBS trust investors alleging that the trustees and master
servicers breached their contractual and statutory duties by (i) failing to require loan servicers to abide by their contractual
obligations; (ii) failing to declare that certain alleged servicing events of default under the applicable contracts occurred; and
(iii) failing to demand that loan sellers repurchase allegedly defective loans, among other things. Ocwen has received several
letters from trustees and master servicers purporting to put Ocwen on notice that the trustees and master servicers may
F-81
ultimately seek indemnification from Ocwen in connection with the litigations. Ocwen has not yet been impleaded into any of
these cases, but it has produced and continues to produce documents to the parties in response to third-party subpoenas.
Ocwen has, however, been impleaded as a third-party defendant into five consolidated loan repurchase cases first filed
against Nomura Credit & Capital, Inc. in 2012 and 2013. Ocwen is vigorously defending itself in those cases against
allegations by the mortgage loan seller-defendant that Ocwen failed to inform its contractual counterparties that it had
discovered defective loans in the course of servicing them and had otherwise failed to service the loans in accordance with
accepted standards. Ocwen is unable at this time to predict the ultimate outcome of these matters, the possible loss or range of
loss, if any, associated with the resolution of these matters or any potential impact they may have on us or our operations. If,
however, we were required to compensate claimants for losses related to the alleged loan servicing breaches, then our business,
reputation, financial condition, liquidity and results of operations could be adversely affected.
In addition, several RMBS trustees have received notices of default alleging material failures by servicers to comply with
applicable servicing agreements. Although Ocwen has not yet been sued by an RMBS trustee in response to a notice of default,
there is a risk that Ocwen could be replaced as servicer as a result of said notices, that the trustees could take legal action on
behalf of the trust certificateholders, or, under certain circumstances, that the RMBS investors who issue notices of default
could seek to press their allegations against Ocwen, independent of the trustees. We are unable at this time to predict what, if
any, actions any trustee will take in response to a notice of default, nor can we predict at this time the potential loss or range of
loss, if any, associated with the resolution of any notices of default or the potential impact on our operations. If Ocwen were to
be terminated as servicer, or other related legal actions were pursued against Ocwen, it could have an adverse effect on
Ocwen’s business, reputation, financial condition, liquidity and results of operations.
Regulatory
We are subject to a number of ongoing federal and state regulatory examinations, consent orders, inquiries, subpoenas,
civil investigative demands, requests for information and other actions. Where we determine that a loss contingency is probable
in connection with a regulatory matter and the amount of our loss can be reasonably estimated, we record an accrual for the
loss. Where we determine that a loss is not probable but is reasonably possible or where a loss in excess of the amount accrued
is reasonably possible, we disclose an estimate of the amount of the loss or range of possible losses for the claim if a reasonable
estimate can be made, unless the amount of such reasonably possible loss is not material to our financial position, results of
operations or cash flows. It is possible that we will incur losses relating to regulatory matters that materially exceed any
accrued amount. Predicting the outcome of any regulatory matter is inherently difficult and we generally cannot predict the
eventual outcome of any regulatory matter or the eventual loss, if any, associated with the outcome.
To the extent that an examination, audit or other regulatory engagement results in an alleged failure by us to comply with
applicable laws, regulations or licensing requirements, or if allegations are made that we have failed to comply with applicable
laws, regulations or licensing requirements or the commitments we have made in connection with our regulatory settlements
(whether such allegations are made through administrative actions such as cease and desist orders, through legal proceedings or
otherwise) or if other regulatory actions of a similar or different nature are taken in the future against us, this could lead to (i)
administrative fines and penalties and litigation, (ii) loss of our licenses and approvals to engage in our servicing and lending
businesses, (iii) governmental investigations and enforcement actions, (iv) civil and criminal liability, including class action
lawsuits and actions to recover incentive and other payments made by governmental entities, (v) breaches of covenants and
representations under our servicing, debt or other agreements, (vi) damage to our reputation, (vii) inability to raise capital or
otherwise fund our operations and (viii) inability to execute on our business strategy. Any of these occurrences could increase
our operating expenses and reduce our revenues, hamper our ability to grow or otherwise materially and adversely affect our
business, reputation, financial condition, liquidity and results of operations.
CFPB
In April 2017, the CFPB filed a lawsuit in the federal district court for the Southern District of Florida against Ocwen,
OMS and OLS alleging violations of federal consumer financial laws relating to our servicing business dating back to 2014.
The CFPB’s claims include allegations regarding (1) the adequacy of Ocwen’s servicing system and integrity of Ocwen’s
mortgage servicing data, (2) Ocwen’s foreclosure practices and (3) various purported servicer errors with respect to borrower
escrow accounts, hazard insurance policies, timely cancellation of private mortgage insurance, handling of customer
complaints, and marketing of optional products. The CFPB alleges violations of laws prohibiting unfair, deceptive or abusive
acts or practices, as well as violations of other laws or regulations. The CFPB does not claim specific monetary damages,
although it does seek consumer relief, disgorgement of allegedly improper gains, and civil money penalties. We believe we
have factual and legal defenses to the CFPB’s allegations and are vigorously defending ourselves. In September 2019, the court
issued a ruling on our motion to dismiss, granting it in part and denying it in part. The court granted our motion dismissing the
entire complaint without prejudice because the court found that the CFPB engaged in impermissible “shotgun pleading,”
holding that the CFPB must amend its complaint to specifically allege and distinguish the facts between all claims. The CFPB
filed an amended complaint in October 2019, and we filed our answer and affirmative defenses on November 1, 2019.

F-82
Prior to the initiation of legal proceedings, we had been engaged with the CFPB in efforts to resolve the matter and
recorded $12.5 million as of December 31, 2016 as a result of these discussions. Our accrual with respect to this matter is
included in the $30.7 million legal and regulatory accrual referenced above. The outcome of the matters raised by the CFPB,
whether through negotiated settlements, court rulings or otherwise, could potentially involve monetary fines or penalties or
additional restrictions on our business and could have a material adverse impact on our business, reputation, financial
condition, liquidity and results of operations.
State Licensing, State Attorneys General and Other Matters
Our licensed entities are required to renew their licenses, typically on an annual basis, and to do so they must satisfy the
license renewal requirements of each jurisdiction, which generally include financial requirements such as providing audited
financial statements or satisfying minimum net worth requirements and non-financial requirements such as satisfactorily
completing examinations as to the licensee’s compliance with applicable laws and regulations. Failure to satisfy any of the
requirements to which our licensed entities are subject could result in a variety of regulatory actions ranging from a fine, a
directive requiring a certain step to be taken, entry into a consent order, a suspension or ultimately a revocation of a license, any
of which could have a material adverse impact on our results of operations and financial condition. In addition, we receive
information requests and other inquiries, both formal and informal in nature, from our state financial regulators as part of their
general regulatory oversight of our servicing and lending businesses. We also regularly engage with state attorneys general and
the CFPB and, on occasion, we engage with other federal agencies, including the Department of Justice and various inspectors
general on various matters, including responding to information requests and other inquiries. Many of our regulatory
engagements arise from a complaint that the entity is investigating, although some are formal investigations or proceedings.
The GSEs (and their conservator, FHFA), HUD, FHA, VA, Ginnie Mae, the United States Treasury Department, and others also
subject us to periodic reviews and audits. We have in the past resolved, and may in the future resolve, matters via consent
orders, payments of monetary amounts and other agreements in order to settle issues identified in connection with examinations
or other oversight activities, and such resolutions could have material and adverse effects on our business, reputation,
operations, results of operations and financial condition.
In April 2017 and shortly thereafter, mortgage and banking regulatory agencies from 29 states and the District of Columbia
took regulatory actions against OLS and certain other Ocwen companies that alleged deficiencies in our compliance with laws
and regulations relating to our servicing and lending activities. An additional state regulator brought legal action together with
that state’s attorney general, as described below. In general, the regulatory actions took the form of orders styled as “cease and
desist orders,” and we use that term to refer to all of the orders for ease of reference; for ease of reference we also include the
District of Columbia as a state when we reference states below. All of the cease and desist orders were applicable to OLS, but
additional Ocwen entities were named in some orders, including Ocwen Financial Corporation, OMS, Homeward, Liberty,
OFSPL and Ocwen Business Solutions, Inc. (OBS).
We entered into agreements with all 29 states plus the District of Columbia to resolve these regulatory actions. These
agreements generally contained the following key terms (the Multi-State Common Settlement Terms):
• Ocwen would not acquire any new residential MSRs until April 30, 2018.
• Ocwen would develop a plan of action and milestones regarding its transition from the REALServicing servicing
system to an alternate servicing system and, with certain exceptions, would not board any new loans onto the
REALServicing system.
• In the event that Ocwen chose to merge with or acquire an unaffiliated company or its assets in order to effectuate a
transfer of loans from the REALServicing system, Ocwen was required to comply with regulatory notice and waiting
period requirements.
• Ocwen would engage a third-party auditor to perform an analysis with respect to our compliance with certain federal
and state laws relating to escrow by testing approximately 9,000 loan files relating to residential real property in
various states, and Ocwen would develop corrective action plans for any errors identified by the third-party auditor.
• Ocwen would develop and submit for review a plan to enhance our consumer complaint handling processes.
• Ocwen would provide financial condition reporting on a confidential basis as part of each state’s supervisory
framework through September 2020.
In addition to the terms described above, Ocwen entered into settlements with certain states on different or additional
terms, which include making additional communications with and for borrowers, certain restrictions, certain review, reporting
and remediation obligations, and the following additional terms:
• Ocwen agreed with the Connecticut Department of Banking to pay certain amounts only in the event we fail to comply
with certain requirements under our agreement with Connecticut.
• In its agreement with the Maryland Office of the Commissioner of Financial Regulation, Ocwen agreed to complete an
independent management assessment and enterprise risk assessment and to a prohibition, with certain de minimis
exceptions, on repurchases of our stock until December 7, 2018. Ocwen also agreed to make certain payments to

F-83
Maryland, to provide remediation to certain borrowers in the form of cash payments or credits and to pay certain
amounts only in the event we fail to comply with certain requirements under our agreement with Maryland.
• Ocwen agreed with the Massachusetts Division of Banks to pay $1.0 million to the Commonwealth of Massachusetts
Mortgage Education Trust. Ocwen and the Massachusetts regulatory agency also agreed on a schedule pursuant to
which we would regain eligibility to acquire residential MSRs on Massachusetts loans (including loans originated by
Ocwen) as we met certain thresholds in our transition to a new servicing system. Pursuant to this agreement, all
restrictions on Massachusetts MSR acquisitions would be lifted when Ocwen completed the second phase of a three-
phase data integrity audit. Having now completed both the first and second phases of this audit, Ocwen is no longer
bound by any restriction on the volume of MSR acquisitions in Massachusetts.
• Ocwen agreed with the Nebraska Department of Banking and Finance until April 30, 2019, to limit its growth through
acquisition from correspondent relationships to no more than ten percent per year for Nebraska loans (based on the
total number of loans held at the prior calendar year-end).
Accordingly, we have now resolved all of the administrative actions (but not all of the legal actions, which are described
below) taken by state regulators in April 2017 and shortly thereafter.
We have taken substantial steps toward fulfilling our commitments under the agreements described above, including
completing the transfer of loans to Black Knight MSP, completing pre-transfer and post-transfer data integrity audits as
described above, developing and implementing certain enhancements to our consumer complaint process, engaging a third-
party auditor who has completed the initial testing phase of its escrow review and ongoing reporting and information sharing.
Concurrent with the issuance of the cease and desist orders and the filing of the CFPB lawsuit discussed above, two state
attorneys general took actions against us relating to our servicing practices. The Florida Attorney General, together with the
Florida Office of Financial Regulation, filed a lawsuit in the federal district court for the Southern District of Florida against
Ocwen, OMS and OLS alleging violations of federal and state consumer financial laws relating to our servicing business. These
claims are similar to the claims made by the CFPB. The Florida lawsuit seeks injunctive and equitable relief, costs, and civil
money penalties in excess of $10,000 per confirmed violation of the applicable statute. In September 2019, the court issued its
ruling on our motion to dismiss, granting it in part and denying it in part. The court granted our motion dismissing the entire
complaint without prejudice because the court found that the plaintiffs engaged in impermissible “shotgun pleading,” holding
that the plaintiffs must amend their complaint to specifically allege and distinguish the facts between all claims. The plaintiffs
filed an amended complaint on November 1, 2019. We filed a partial motion to dismiss the amended complaint on December 6,
2019. We believe we have factual and legal defenses to the allegations raised in this lawsuit and are vigorously defending
ourselves. The outcome of this lawsuit, whether through a negotiated settlement, court rulings or otherwise, could potentially
involve monetary fines or penalties or additional restrictions on our business and could be materially adverse to our business,
reputation, financial condition, liquidity and results of operations. Our accrual with respect to this matter is included in the
$30.7 million litigation and regulatory matters accrual referenced above. We cannot currently estimate the amount, if any, of
reasonably possible loss above the amount currently accrued.
The Massachusetts Attorney General filed a lawsuit against OLS in the Superior Court for the Commonwealth of
Massachusetts alleging violations of state consumer financial laws relating to our servicing business, including with respect to
our activities relating to lender-placed insurance and property preservation fees. In April 2019, we agreed to resolve this matter
without admitting liability. The resolution includes a payment to the Commonwealth of Massachusetts of $675,000, a loan
modification program for certain eligible Massachusetts borrowers, and certain already-completed relief. The settlement
amount of $675,000 was paid in April 2019.
Our accrual with respect to the administrative and legal actions initiated in April 2017 is included in the $30.7 million litigation
and regulatory matters accrual referenced above. We have also incurred, and will continue to incur costs to comply with the terms of
the settlements we have entered into, including the costs of conducting an escrow review, Maryland organizational assessments and
Massachusetts data integrity audits, and costs relating to the transition to Black Knight MSP. With respect to the escrow review,
although the initial testing phase is now complete, the third-party auditor continues its work, including drafting its final report. To
the extent that errors that have been identified require remediation, we will incur costs in connection with remediating those errors.
In addition, it is possible that legal or other actions could be taken against us with respect to such errors, which could result in
additional costs or other adverse impacts. If we fail to comply with the terms of our settlements, additional legal or other actions
could be taken against us. Such actions could have a materially adverse impact on our business, reputation, financial condition,
liquidity and results of operations.
Certain of the state regulators’ cease and desist orders referenced a confidential supervisory memorandum of understanding
(MOU) that we entered into with the Multistate Mortgage Committee (MMC) and six states relating to a servicing examination
from 2013 to 2015. Among other things, the MOU prohibited us from repurchasing stock during the development of a going
forward plan and, thereafter, except as permitted by the plan. We submitted a plan in 2016 that contained no stock repurchase
restrictions and, therefore, we do not believe we are currently restricted from repurchasing stock. We requested confirmation

F-84
from the signatories of the MOU that they agree with this interpretation, and received affirmative responses from the MMC and
five states, and a response declining to take a legal position from the remaining state.
On occasion, we engage with agencies of the federal government on various matters. For example, OLS received a letter
from the Department of Justice, Civil Rights Division, notifying OLS that the Department of Justice had initiated a general
investigation into OLS’s policies and procedures to determine whether violations of the Servicemembers Civil Relief Act by
OLS might exist. The Department of Justice has informed us that it has decided not to take enforcement action related to this
matter at this time and has, consequently, closed its investigation. In addition, Ocwen was named as a defendant in a HUD
administrative complaint filed by a non-profit organization alleging discrimination in the manner in which the company
maintains REO properties in minority communities. In February 2018, this matter was administratively closed, and similar
claims were filed in federal court. We believe these claims are without merit and intend to vigorously defend ourselves.
In May 2016, Ocwen received a subpoena from the Office of Inspector General of HUD requesting the production of
documentation related to HECM loans originated by Liberty. We understand that other lenders in the industry have received
similar subpoenas. In April 2017, Ocwen received a subpoena from the Office of Inspector General of HUD requesting the
production of documentation related to lender-placed insurance arrangements with a mortgage insurer and the amounts paid for
such insurance. We understand that other servicers in the industry have received similar subpoenas. In May 2017, Ocwen
received a subpoena from the Office of the Special Inspector General for the Troubled Asset Relief Program requesting
documents and information related to Ocwen’s participation from 2009 to the present in the Treasury Department’s Making
Home Affordable Program and its HAMP. We have been providing documents and information in response to these subpoenas.
In April 2019, PMC received a subpoena from the VA Office of the Inspector General requesting the production of
documentation related to the origination and underwriting of loans guaranteed by the Veterans Benefits Administration. We
understand that other servicers in the industry have received similar subpoenas.
Loan Put-Back and Related Contingencies
Our contracts with purchasers of originated loans contain provisions that require indemnification or repurchase of the
related loans under certain circumstances. While the language in the purchase contracts varies, they generally contain
provisions that require us to indemnify purchasers of related loans or repurchase such loans if:
• representations and warranties concerning loan quality, contents of the loan file or loan underwriting circumstances are
inaccurate;
• adequate mortgage insurance is not secured within a certain period after closing;
• a mortgage insurance provider denies coverage; or
• there is a failure to comply, at the individual loan level or otherwise, with regulatory requirements.
We received origination representations and warranties from our network of approved originators in connection with loans
we purchased through our correspondent lending channel. To the extent that we have recourse against a third-party originator,
we may recover part or all of any loss we incur.
We believe that, as a result of historical actions by investors, many purchasers of residential mortgage loans are
particularly aware of the conditions under which originators must indemnify or repurchase loans and under which such
purchasers would benefit from enforcing any indemnification rights and repurchase remedies they may have.
In our lending business, we have exposure to indemnification risks and repurchase requests. In our servicing business,
claims alleging that we did not comply with our servicing obligations may require us to repurchase mortgage loans, make
whole or otherwise indemnify investors or other parties. If home values were to decrease, our realized losses from loan
repurchases and indemnifications may increase as well. As a result, our liability for repurchases may increase beyond our
current expectations. If we are required to indemnify or repurchase loans that we originate and sell, or where we have assumed
this risk on loans that we service, as discussed above, in either case resulting in losses that exceed our related liability, our
business, financial condition and results of operations could be adversely affected.
We have exposure to origination representation, warranty and indemnification obligations relating to our lending, sales and
securitization activities. We initially recognize these obligations at fair value. Thereafter, the estimation of the liability
considers probable future obligations based on industry data of loans of similar type segregated by year of origination, to the
extent applicable, and estimated loss severity based on current loss rates for similar loans, our historical rescission rates and the
current pipeline of unresolved demands. Our historical loss severity considers the historical loss experience that we incur upon
loan sale or collateral liquidation as well as current market conditions. We have exposure to servicing representation, warranty
and indemnification obligations relating to our servicing practices. We record an accrual for a loss contingency if the loss
contingency is probable and the amount can be reasonably estimated. We monitor the adequacy of the overall liability and
make adjustments, as necessary, after consideration of our historical losses and other qualitative factors including ongoing
dialogue and experience with our counterparties.

F-85
At December 31, 2019 and 2018, we had outstanding representation and warranty repurchase demands of $47.0 million
UPB (285 loans) and $51.3 million UPB (316 loans), respectively. We review each demand and monitor through resolution,
primarily through rescission, loan repurchase or make-whole payment.
The following table presents the changes in our liability for representation and warranty obligations, compensatory fees for
foreclosures that may ultimately exceed investor timelines and similar indemnification obligations:
Years Ended December 31,
2019 2018 2017
Beginning balance (1) $ 49,267 $ 19,229 $ 24,285
Provision (reversal) for representation and warranty obligations (11,701 ) 4,649 (1,371 )
New production reserves 304 7,437 702
Obligation assumed in connection with the acquisition of PHH — 27,736 —
Charge-offs and other (2) (3) 12,968 (9,784 ) (4,387 )
Ending balance (1) $ 50,838 $ 49,267 $ 19,229
(1) The liability for representation and warranty obligations and compensatory fees for foreclosures is reported in Other liabilities (a
component of Liability for indemnification obligations) on our consolidated balance sheets.
(2) Includes principal and interest losses realized in connection with repurchased loans, make-whole, indemnification and fee payments and
settlements net of recoveries, if any.
(3) Includes $18.0 million liability for representation and warranty obligations related to sold advances previously presented as allowance
for losses. See Note 7 — Advances.
We believe that it is reasonably possible that losses beyond amounts currently recorded for potential representation and
warranty obligations and other claims described above could occur, and such losses could have an adverse impact on our results
of operations, financial condition or cash flows. However, based on currently available information, we are unable to estimate a
range of reasonably possible losses above amounts that have been recorded at December 31, 2019.
Other
Ocwen, on its own behalf and on behalf of various mortgage loan investors, is engaged in a variety of activities to seek
payments from mortgage insurers for unpaid claims, including claims where the mortgage insurers paid less than the full claim
amount. Ocwen believes that many of the actions by mortgage insurers were in violation of the applicable insurance policies
and insurance law. In some cases, Ocwen has entered into tolling agreements, initiated arbitration or litigation, engaged in
settlement discussions, or taken other similar actions. To date, Ocwen has settled with four mortgage insurers, and expects the
ultimate outcome to result in recovery of additional unpaid claims, although we cannot quantify the likely amount at this time.
We may, from time to time, have affirmative indemnification and other claims against parties from whom we acquired
MSRs or other assets. We collected $29.9 million during the quarter ended December 31, 2017 under one such claim in
connection with the acquisition of MSRs and advances in 2013. Although we pursue these claims, we cannot currently estimate
the amount, if any, of further recoveries. Similarly, from time to time, indemnification and other claims are made against us by
parties to whom we sold MSRs or other assets or by parties on whose behalf we service mortgage loans. We cannot currently
estimate the amount, if any, of reasonably possible loss above amounts recorded.

86
Note 27 — Quarterly Results of Operations (Unaudited)
Quarters Ended
December 31,
2019 September 30,
2019 June 30, 2019 March 31,
2019
Revenue $ 261,171 $ 283,660 $ 274,493 $ 304,051
MSR valuation adjustments, net (1) 829 134,561 (147,268 ) (108,998 )
Operating expenses 138,858 179,430 184,381 171,270
Other income (expense), net (85,899 ) (277,108 ) (27,177 ) (64,867 )
Income (loss) before income taxes 37,243 (38,317 ) (84,333 ) (41,084 )
Income tax expense 2,370 4,450 5,404 3,410
Net income (loss) attributable to Ocwen stockholders $ 34,873
$ (42,767 ) $ (89,737 ) $ (44,494 )
Earnings (loss) per share attributable to Ocwen
stockholders
Basic $ 0.26 $ (0.32 ) $ (0.67 ) $ (0.33 )
Diluted 0.26 (0.32 ) (0.67 ) (0.33 )
(1) Positive valuation adjustments indicated in the above table represent fair value gains and negative valuation adjustments represent fair
value losses.
Quarters Ended
December 31,
2018 (1) September 30,
2018 June 30, 2018 March 31,
2018
Revenue $ 310,929 $ 238,278 $ 253,581 $ 260,257
MSR valuation adjustments, net (61,762 ) (41,448 ) (33,118 ) (17,129 )
Operating expenses 241,057 176,078 172,532 189,372
Other income (expense), net (2) (15,873 ) (61,025 ) (76,336 ) (48,791 )
Income (loss) from continuing operations before income taxes (7,763 ) (40,273 ) (28,405 ) 4,965
Income tax expense (benefit) (4,012 ) 845 1,348 2,348
Income (loss) from continuing operations (3,751 ) (41,118 ) (29,753 ) 2,617
Income from discontinued operations, net of income taxes 1,409
—
—
—
Net income (loss) (2,342 ) (41,118 ) (29,753 ) 2,617
Net income attributable to non-controlling interests — (29 ) (78 ) (69 )
Net loss (income) attributable to Ocwen stockholders $ (2,342 ) $ (41,147 ) $ (29,831 ) $ 2,548
Earnings (loss) per share attributable to Ocwen
stockholders - Basic and Diluted
Continuing operations $ (0.03 ) $ (0.31 ) $ (0.22 ) $ 0.02
Discontinued operations 0.01 — — —
$ (0.02 ) $ (0.31 ) $ (0.22 ) $ 0.02
(1) The quarter ended December 31, 2018 includes the results of operations of PHH from the acquisition date of October 4, 2018 through
December 31, 2018. See Note 2 — Business Acquisition for additional information.
(2) Includes a bargain purchase gain, net of tax, of $64.0 million recognized during the quarter ended December 31, 2018 in connection with
the acquisition of PHH.

F-87
Note 28 — Subsequent Events
On January 27, 2020, we entered into a Joinder and Second Amendment Agreement (the Amendment) which amends the
Amended and Restated SSTL Facility Agreement dated as of December 5, 2016, as amended by a Joinder and Amendment
Agreement dated as of March 18, 2019. The Amendment provides for a net prepayment of $126.1 million of the outstanding loan
amounts as of December 31, 2019 such that the facility has a maximum size and total initial outstanding amount of $200.0 million.
The Amendment also (i) extends the maturity of the remaining outstanding loans under the SSTL to May 15, 2022, (ii) provides that
the loans under the SSTL will bear interest at the one, two, three or six month Eurodollar Rate or the Base Rate (as defined in the
SSTL), at our option, plus a margin of 6.00% per annum for Eurodollar Rate loans or 5.00% per annum for Base Rate loans
(increasing to a margin of 6.50% per annum for Eurodollar Rate loans or 5.50% per annum for Base Rate loans on January 27, 2021)
and (iii) provides for a prepayment premium of 2.00% until January 27, 2022. The loans under the amended SSTL are subject to
quarterly principal payments of $5.0 million.
On February 3, 2020, Ocwen’s Board of Directors authorized a share repurchase program for an aggregate amount of up to
$5.0 million of Ocwen’s issued and outstanding shares of common stock. Repurchases may be made in open market
transactions at prevailing market prices. The timing and execution of any related share repurchases is subject to market
conditions, among other factors. Unless we amend the share repurchase program or repurchase the full $5.0 million amount by
an earlier date, the share repurchase program will continue through February 3, 2021. No assurances can be given as to the
amount of shares, if any, that we may repurchase in any given period.
On February 20, 2020, we received a notice of termination from NRZ with respect to the PMC subservicing agreement
discussed in Note 10 — Rights to MSRs. The notice states that the effective date of termination is June 19, 2020 with respect
to 25% of the Initial Mortgage Loans under the agreement and August 18, 2020 for the remainder of the loans under the
agreement. The portfolio subject to termination accounted for $42.1 billion in UPB, or 20% of our total servicing portfolio UPB
at December 31, 2019, and $28.8 million servicing fees, or 4% of our total servicing and subservicing fees in 2019 (excluding
ancillary income). The loans that were added by NRZ under the PMC subservicing agreement in 2019 and amounted to
approximately $6.6 billion in UPB are subject to the termination with the stated effective date of August 18, 2020. At
December 31, 2019, we reported a $312.1 million MSR asset at fair value for the servicing agreement subject to termination, or
3% of our total assets, and a corresponding $312.1 million pledged MSR liability at fair value. In connection with the
termination, we estimate that we will receive loan deboarding fees of approximately $6.1 million from NRZ. This termination
is for convenience and not for cause. We intend to work with NRZ to transfer the servicing of the loans in an orderly manner.
NRZ has not provided notice of termination with respect to its other servicing agreements.

[This page intentionally left blank]


BR675746-0420-COMBO