
Q2|2022 Fiverr Shareholder Letter 08.03.2022 FINAL ...
19
Q1 | 2022 Shareholder Letter Q2 | 2022 Shareholder Letter F I V E R R . C O M 1 Sarah Gordon, Seller Founder and Owner Contese Agency Valencia, Spain
-
Upload
khangminh22 -
Category
Documents
-
view
0 -
download
0
Transcript of Q2|2022 Fiverr Shareholder Letter 08.03.2022 FINAL ...

Q1 | 2022 Shareholder Letter Q2 | 2022 Shareholder Letter
F I V E R R . C O M
1
Sarah Gordon, SellerFounder and OwnerContese AgencyValencia, Spain

Q1 | 2022 Shareholder Letter Q2 | 2022 Shareholder Letter Q2 | 2022 Shareholder Letter
On the cover:
SARAH GORDON, Seller
Founder and Owner
Contese
Valencia, Spain
2
Sarah Gordon started freelancing on Fiverr in 2018 after working at the Telegraph and Daily Mail in the UK. What started as editorial freelancing is now an 11-person creative content agency with a global client base and an office in Valencia, Spain. The agency, Contese, set up with her business partner and SEO expert Joe, has three offering pillars: Branding, Content, and Editorial. Today, the agency makes roughly $200K a year on Fiverr, and Fiverr continues to be a meaningful channel for them. Over the years, Sarah has been able to grow the agency without a dedicated sales team, thanks to Fiverr’s unique e-commerce model that does not require sellers to make an outbound sales effort or bid on projects.
Contese has also tried other platforms and direct marketingto drive traffic, but those efforts have not proven fruitful compared to Fiverr’s steady and efficient channel.In addition, some of Contese’s self-sourced new clients prefer to work through the Fiverr platform to streamline the process, consolidate workflow, and ensure on-time invoicing and payments.
The access to global clients through Fiverr helped Sarah grow her agency without being constrained by stay-at-home orders over the past two years. Fiverr also allows the agency to stay on top of the latest buyer trends and lean into their needs effortlessly. For example, during COVID, Contese helped clients with a heavy load of website content as many businesses were starting to understand the importance of having an online presence. Fiverr was the platform they found to solve that. Now the agency is seeing more robust branding and editorial projects. Often, Contese gets in on the ground floor with branding, helps with the website content and SEO, and then regularly produces editorial content for blog posts and social media content.
Sarah is an active participant in the Fiverr ecosystem of products; She is a Pro seller, a Fiverr Business vetted seller, a Seller Plus subscriber who enjoys a bundle of tools and features that strengthen her buyer retention and business growth, and a Fiverr Learn instructor for the course, “SEO Copywriting: Optimize Your Website Copy.” She also invests in Promoted Gigs monthly and has completed 15 online courses with Fiverr Learn.
“The platform helps us reach a global audience with a steady stream of clients that has proven to be more effective to our growth than other marketing methods.”
“Fiverr helps us tap into business trends and ensure that our agency will stay up-to-date with clients needs.”

Q2 | 2022 Shareholder Letter
Second Quarter 2022 and Recent Highlights
● Q2 Results demonstrated solid Adjusted EBITDA. Revenue grew 13% y/y to $85 million as SMB spending grew more cautious. We delivered solid Adjusted EBITDA of $4.6 million, or 5.4% in Adjusted EBITDA margin, as a result of strong execution and disciplined expense management.
● Strong and resilient growth in SPB. Spend per buyer increased 14% y/y to $259 with continued expansion of wallet share especially among our larger customers. Buyers with annual spend of over $10K grew over 60% y/y.
● Innovations to unlock larger projects and longer engagement. We rolled out project briefing capabilities to allow buyers to describe projects with complex scope in a structured way. We continued to expand Subscriptions on our marketplace, especially in digital marketing categories, as buyers place recurring orders to engage with sellers for longer duration.
● Strengthen growth and profitability profile. Post the second quarter, we took steps to recalibrate our spending priorities, resulting in a workforce reduction of approximately 60 people across our offices. The streamlined cost structure, together with a strong balance sheet, provides us with financial strength to build for long-term success.
● Guidance update. Our updated revenue guidance reflects the increased macro headwinds on SMB spending as reflected in our second quarter results. We are increasing our Adjusted EBITDA expectations based on the steps we took to streamline costs and recalibrate investment spending. We are committed to delivering continued EBITDA expansion and growing towards our long-term margin target.
(1) See “Key Performance Metrics and Non-GAAP Financial Measures” for additional information regarding key performance metrics and non-GAAP metrics used in this shareholder letter
Second Quarter 2022 Key Results
Financial Outlook
Q3 2022 FY 2022
REVENUE $82.0 - $84.0 million16%-17% y/y growth
$330.0 - $345.0 million17%-22% y/y growth
ADJUSTED EBITDA(1) $3.0 - $4.0 million $8.0 - $17.0 million
REVENUE $85.0 million13% y/y growth
ACTIVE BUYERS (1) 4.2 million6% y/y growth
SPEND PER BUYER (1) $25914% y/y growth
TAKE RATE (1) 29.8%200 bps y/y improvement
GROSS MARGIN 79.4% 82.7%GAAP NON-GAAP(1)
GAAP NET LOSS ($41.9) million
ADJUSTED EBITDA(1) $4.6 million
ADJUSTED EBITDA MARGIN(1) 5.4%
3
Q3 2022 FY 2022 FY 2022 PRIOR GUIDANCE
REVENUE$80.5 - $82.5million8-11% y/y growth
$332.0 - $340.0 million12-14% y/y growth
$345.0 - $365.0 million16-23% y/y growth
ADJUSTED EBITDA(1) $5.0 - $6.0million
$19.5 - $21.5 million
$10.0 - $17.0million

Q1 | 2022 Shareholder Letter Q2 | 2022 Shareholder Letter
In Q2’22, revenue grew 13% y/y to $85 million as Fiverr continues to empower millions of buyers to connect with talents across the world.While SMB spending grew more cautious within a shifting macro environment, we see continued expansion of wallet share especiallyamong our larger customers. Spend per buyer grew 14% year over year, and the number of customers who spent over $10K a year grew over 60% year over year. Take rate remains strong at 29.8%, as PromotedGigs continue to expand its exposure on the marketplace.
Strong execution, together with continued discipline on expense management, allowed us to deliver strong Adjusted EBITDA,ahead of the top end of our guidance. Adjusted EBITDA was $4.6 million, representing a 5.4% Adjusted EBITDA margin. Post the second quarter, we took steps to recalibrate our spending priorities, resulting in the headcount reduction of approximately 60 people across our offices. The process was rigorous and thoughtful to ensure that our long-term roadmap remains intact. These actions also focus the team’s efforts on maximizing the execution of our core marketplace and Fiverr Business in the current environment. With the completion of this process, we expect to deliver continued Adjusted EBITDA growth while building for long-term success.
Growth has and will always be our priority. However, with market conditions worse than anticipated, when growth becomes expensive, instead of growing at any cost, we decided to prioritize EBITDA and free cash flow, and accelerate the pace towards our long-term target model. We believe this puts us in a stronger financial position to double down on growth investments when market conditions improve.
To Our Shareholders,
4
Q1 | 2022 Shareholder Letter Q2 | 2022 Shareholder Letter
1. Bring new buyers onto the platform
In the twelve months ended June 30, 2022, active buyers grew 6% y/y to 4.2 million. The second quarter of 2022 showed a continued development of the trends that emerged at the end of the first quarter. European activity levels continued to slide although more modestly and U.S. activity levels started to be impacted in June. That said, our marketing efforts continue to bring new buyers to our marketplace at a significantly higher level than pre-pandemic. This has allowed us to continue growing our active buyer base despite the significant cohort size we acquired during the pandemic that is moving to its stabilization phase.
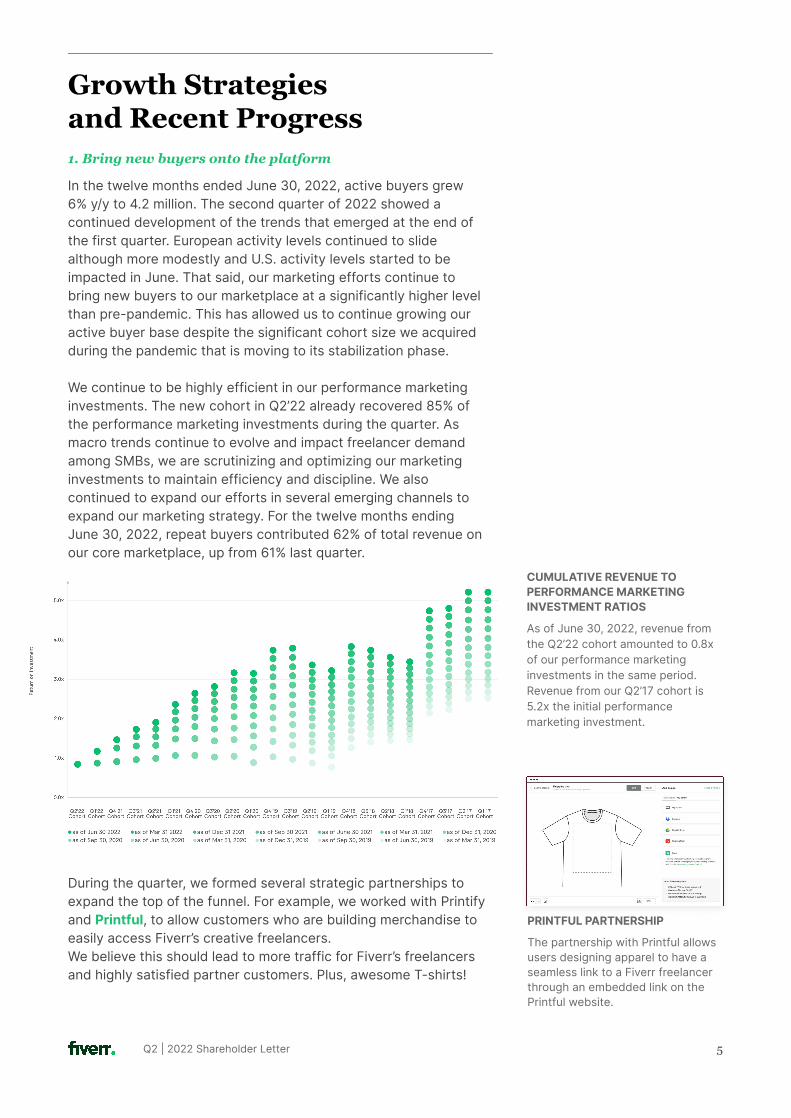
We continue to be highly efficient in our performance marketing investments. The new cohort in Q2’22 already recovered 85% of the performance marketing investments during the quarter. As macro trends continue to evolve and impact freelancer demand among SMBs, we are scrutinizing and optimizing our marketing investments to maintain efficiency and discipline. We also continued to expand our efforts in several emerging channels to expand our marketing strategy. For the twelve months ending June 30, 2022, repeat buyers contributed 62% of total revenue on our core marketplace, up from 61% last quarter.
During the quarter, we formed several strategic partnerships to expand the top of the funnel. For example, we worked with Printify and Printful, to allow customers who are building merchandise to easily access Fiverr’s creative freelancers.We believe this should lead to more traffic for Fiverr’s freelancers and highly satisfied partner customers. Plus, awesome T-shirts!
Growth Strategies and Recent Progress
5
PRINTFUL PARTNERSHIP
The partnership with Printful allows users designing apparel to have a seamless link to a Fiverr freelancer through an embedded link on the Printful website.
CUMULATIVE REVENUE TO PERFORMANCE MARKETING INVESTMENT RATIOS
As of June 30, 2022, revenue from the Q2’22 cohort amounted to 0.8x of our performance marketing investments in the same period. Revenue from our Q2’17 cohort is 5.2x the initial performance marketing investment.

Q1 | 2022 Shareholder Letter Q2 | 2022 Shareholder Letter Q2 | 2022 Shareholder Letter
We also partnered with Hostinger to embed Fiverr’s freelancer service into their product to empower more web property owners with digital services on Fiverr. We expanded the capacity of our affiliate program to enable self-serve sign-ups and account servicing. These efforts will further extend Fiverr’s reach and drive additional adoption.
On brand marketing, we continue to invest across channels including digital channels as well as linear TV and streaming. While brand investments have a longer horizon and are harder to measure, we continue to improve our attribution infrastructure in order to be thoughtful and measured in how we invest in long-term brand equity. We also partnered with many social media influencers to build virality of the Fiverr brand. The collaboration with the "Old Gays” is such an example.
We continued to build Fiverr’s thought leadership in the freelancer industry. Our latest U.S. Freelance Economic Impact Report shows that independent work and remote work are powerful economic forces that were accelerated during the pandemic and will continue to shift how we work for years ahead. Freelancers demand more control over how they work, the projects they take on, where they work, and how much to charge - all of these are central to what Fiverr as a platform strives to provide to our community.
2. Go upmarket
In the twelve months ended June 30, 2022, spend per buyer on our platform increased 14% y/y to $259. We see continued expansion in wallet share across our buyer base, evidenced by spend per buyer growth across all cohorts. We are also seeing increasing adoption from business buyers with significantly larger wallet size. Buyers who spend over $10K annually grew over 60% compared to last year.
The continued strong growth of spend per buyer underlines the success in our upmarket initiatives, including: investments in Fiverr Business, improvements of our offering catalog, enhancements to the overall quality of the marketplace experience, the expansion of the product capability to enable larger projects, and targeting larger customers in our marketing.
Subscriptions, a product we launched over a year ago, allow our buyers to make recurring purchases from a seller over a longer period of time. We have seen enthusiastic adoption among our buyers and sellers, especially in digital marketing categories that naturally require a longer term engagement in order to drive business results for buyers. The majority of those subscription contracts reach full completion and this drives a meaningful uplift in retention and engagement size for those categories.
6
FREELANCE ECONOMICIMPACT REPORT
In May 2022, Rockbridge Associates published the fifth annual Freelance Economic Impact Report. There are an estimated 6.3 million independent professionals in the U.S. as of 2021. This workforce is estimated to have earned $247 billion in revenue in 2021, up from an estimated $234 billion in 2020. They represent 3.9% of the U.S. labor force and their earnings comprise 1.1% of total U.S. gross domestic product (GDP)in 2021.
MY FOUR FABULOUS UNCLES
Fiverr and Tiktok Stars, The Old Gays, Published an Inclusive Children’s Book for Pride Titled “My Four Fabulous Uncles”

Q1 | 2022 Shareholder Letter Q2 | 2022 Shareholder Letter Q2 | 2022 Shareholder Letter 7
On Fiverr Business, during the second quarter, we continued to double down on supply work to create a vetted catalog for business buyers. Every talent on Fiverr Business is being vetted by a domain expert. We also started to drive certain performance marketing dollars to funnel traffic directly into Fiverr Business as initial tests have yielded encouraging conversion rates. We continue to build the freelance management capabilities on our marketplace, allowing our buyers to not only engage with talent on Fiverr's marketplace, but also integrate and manage their offline sellers in a consolidated manner.
3. Expand our catalog
In addition to going upmarket through Fiverr Business, we continue to improve the offerings in our core marketplace. During the second quarter, we saw above trend revenue growth in categories such as, menu design and trade booth design, as well as continued strength in categories related to social media, 3D animation, data, and search engine optimization. Crowdfunding, online tutoring and several marketing related categories saw below trend growth.
The rise of the creator economy is the latest trend that Fiverr is able to lean into. Independent content creators, curators and community builders often operate in a solopreneur or small business fashion, with limited resources and a high cadence of digital needs especially in content and digital marketing. Fiverr’s unique e-commerce model - fast, cost efficient, global talent access - resonates well with this community. For example, we have seen orders for TikTok services grow over 20% sequentially in Q2’22. The marketplace has thousands of offerings across numerous categories for TikTok. A buyer can use Fiverr to do everything from setting up an account, creating or editing videos, or influencer strategy.
In Fiverr Business, we ramped up our vetted supply during the quarter and expect to continue fervently growing our supply base in the coming quarters. The growing supply in conjunction with our marketing efforts and product enhancements have led to strong performance.
4. Innovate technology and services
At the core of Fiverr is our technology innovation. This quarter there were a couple noteworthy developments that drove increased conversion on our marketplace. Fiverr’s unique service-as-a-product model has revolutionized how businesses can engage with freelancers. The e-commerce like catalog experience allows buyers to find a seller in just 15 minutes, compared to a typical hiring process of several weeks.
TIKTOK OFFERING ON FIVERR
Fiverr has seen strong growth in orders to support the TikTok community. Tiktok orders grew over 20% sequentially in Q2’22.

Q1 | 2022 Shareholder Letter Q2 | 2022 Shareholder Letter Q2 | 2022 Shareholder Letter 8
That said, for new buyers or those with complex projects, a customized contract is sometimes needed. For those buyers,we launched the capability to submit a project brief on the marketplace, which will then be matched with the most relevant sellers by our algorithm. It is a new way to search for buyers who know what they want to accomplish, but do not know what offerings to search for. The feature also allows buyers to describe larger projects that require multiple offerings to complete.
We also did a few funnel optimizations that are expected to increase engagement, reduce friction, and ultimately drive growth. This quarter, we added touch points throughout the buyer experience to encourage app downloads, which lead to a significant uplift. Buyers with Fiverr’s app can enjoy a better and easier in-order experience and retention engagement. We also introduced Fast Response badges. We have found sellers’ responsiveness is a key factor in a buyers’ purchase decisions.By providing buyers the information on who can respond faster, we saw more buyer conversions and increased revenue for the sellers who respond faster. We believe it is the continuous optimization that accumulates over time to create a great user experience and higher buyer conversion.
5. Expand our geographic footprint
On the international front, the focus on localization to improve the user experience and conversion is underway. We are in the process of optimizing our algo’s to prioritize local supply in order to improve matching satisfaction. The translations services we use are also being enhanced to be more accurate for the offering and the deliverable.
We find that when the buyer and sellers are both in their native language the experience is better. To this end, we took initiative at the start of the year to create local supply job pages.The job pages in Spain and Germany in particular have had strong success in driving SEO traffic to local sites. We have seen higher conversion, higher spend per buyer, and a better long term value when we are able to match locally.
A FAST RESPONSE BADGE
A new feature that shows prospective buyers that the seller responds quickly. Quick responses lead to better conversion.
SPANISH JOB PAGE
A spanish job page on Fiverr has seen success attracting local talent that our algo’s match with local demand for a better experience.
PROJECT BRIEF
An enhanced feature that allows buyers to describe what they want done in a brief and be matchedwith sellers by the algo.

Q1 | 2022 Shareholder Letter Q2 | 2022 Shareholder Letter Q2 | 2022 Shareholder Letter
Financial DiscussionIn Q2’22 revenue increased 13% y/y to $85 million.Adjusted EBITDA was $4.6 million or 5.4% in Adjusted EBITDA margin. GAAP Net loss was ($41.9) million. Unless otherwise noted, all comparisons are on a year-over-year basis.
RevenueRevenue for Q2’22 was $85.0 million, up 13% from $75.3 million in Q2’21, driven by continued growth in both active buyers and spend per buyer. The year-over-year growth rate also benefited from the increase of our take rate, which grew to 29.8% for the 12 months ended June 30, 2022 from 27.8% for the twelve months ended June 30, 2021. Revenue during the quarter continued to be highly diversified, with no buyer contributing more than 1% of revenue, and no single category accounting for more than 10% of total revenue on the core marketplace. The majority of our categories represent less than 1% of our revenue.
Active Buyers
In the twelve months ended June 30, 2022, our active buyers were 4.2 million, representing 6% y/y growth. Our y/y active buyer growth benefited from high levels of new buyers coming to the platform offset by reductions from large cohorts that are in their stabilization period. We also continue to focus on higher lifetime value by targeting buyers with larger budgets benefiting SPB more than active buyers.
Spend Per Buyer
The second driver of our revenue growth is the annual spend per buyer, or SPB. In the twelve months ended June 30, 2022, SPB grew to $259, up 14% y/y from $226. SPB is an indicator of our buyers’ purchasing patterns and is impacted by the number of active buyers, buyers purchasing from multiple categories, average price per purchase, and our ability to acquire buyers with a higher lifetime value.
9

Q1 | 2022 Shareholder Letter Q2 | 2022 Shareholder Letter Q2 | 2022 Shareholder Letter 10
Take Rate
For the twelve months ended June 30, 2022, our take rate was 29.8%, an increase of 200 bps y/y. We believe our industry-leading take rate reflects the value our platform delivers to both buyers and sellers. The increase in our take rate was driven by the 50 bps increase in service fee during 2021, and other value-added services such as Promoted Gigs that our buyers and sellers can utilize.
Gross Profit and Margin
Gross profit on a GAAP basis for Q2'22 was $67.5 million, up 7.6% from $62.7 million in Q2’21. Gross margin was 79.4%, a decrease from 83.4% in Q2’21. Non-GAAP gross margin was 82.7% in Q2’22, a decrease of 170 basis points from 84.4% in Q2’21. Margins decreased year-over-year as we did some catch-up hiring early in the year. We continue to enjoy strong gross margins with an attractive business model.
Operating Expenses
Total operating expenses on a GAAP basis for Q2’22 were $110.1 million, compared to $71.1 million in Q2’21. Non-GAAP operating expenses for Q2’22 were $65.7 million, or 77.2% of revenue, compared to $56.1 million, or 74.6% of revenue in Q2’21.
Research and development (R&D)
Expenses on a GAAP basis were $24.5 million, or 28.8% of revenue in Q2’22. Non-GAAP research and development expenses were $17.8 million, or 20.9% of revenue, compared to 19.9% in the prior year period. The increase is largely due to the expansion of product and engineering teams earlier in the year partially offset by optimizing costs during the quarter.
Sales and marketing (S&M)
Expenses on a GAAP basis were $44.3 million, or 52.1% of revenue in Q2’22. Non-GAAP sales and marketing expenses were $38.9 million, or 45.8% of revenue in Q2’22, compared to 44.7% in the prior year period. We continue to invest in our marketing efforts with discipline measuring each campaign’s effectiveness. We are scaling emerging marketing platforms and seeking ways to attract larger business customers to match our upmarket product efforts. We also constantly invest in brand marketing and are long-term believers in building brand awareness and trust.

Q1 | 2022 Shareholder Letter Q2 | 2022 Shareholder Letter Q2 | 2022 Shareholder Letter 11
General and administrative (G&A)
Expenses on a GAAP basis were $13.7 million, or 16.1% of revenue in Q2’22. Non-GAAP general and administrative expenses were $8.9 million, or 10.5% of revenue in Q2’22, compared to 9.9% in the prior year period. The increase is largely due to the increase in personnel costs as we grow our business, partially offset by scrutinizing expenses during the quarter.
Net Loss and Adjusted EBITDA
Net loss on a GAAP basis in Q2’22 was ($41.9) million, compared to ($13.3) million in the second quarter of 2021. Adjusted EBITDA was $4.6 million, or 5.4% of revenue in Q2’22, compared to $7.4 million or 9.8% in the second quarter of 2021.
Our Q3’22 outlook and updated full year 2022 guidance reflects the recent trends in our marketplace as global SMB spending grew more cautious leading to less demand for freelancers. We expect to continue improving Adjusted EBITDA from the recent cost reductions and a strengthening investment focus.
Q3 2022 FY 2022
REVENUE $80.5 - $82.5 million $332.0 - $340.0 million
y/y growth 8%-11% y/y 12%-14% y/y
ADJUSTED EBITDA $5.0 - $6.0 million $19.5 - $21.5 million
Financial Outlook

Q1 | 2022 Shareholder Letter Q2 | 2022 Shareholder Letter Q2 | 2022 Shareholder Letter 12
Conference Call DetailsFiverr will host a conference call to discuss its financial results on Thursday, August 4, 2022 at 8:30 a.m. Eastern Time. A live webcast of the call can be accessed from Fiverr’s Investor Relations website. An archived version will be available on the website after the call. Investors and analysts can participate in the conference call by dialing +1 (844) 200-6205, or +1 (929) 526-1599 for callers outside the United States, and enter passcode 805771.
Investor [email protected]
Micha Kaufman
Founder and Chief Executive Officer
Ofer Katz
President and Chief Financial Officer

Q1 | 2022 Shareholder Letter Q2 | 2022 Shareholder Letter Q2 | 2022 Shareholder Letter 13
CONSOLIDATED BALANCE SHEETS(in thousands)
June 30, December 31, 2022 2021
(Unaudited) (Audited)
AssetsCurrent assets:Cash and cash equivalents $ 98,122 $ 71,151Restricted cash - 2,919Marketable securities 209,060 118,150User funds 142,575 127,713Bank deposits 110,000 134,000Restricted deposit 1,172 35Other receivables 16,095 14,250Total current assets 577,024 468,218
Marketable securities 221,136 317,524Property and equipment, net 6,253 6,555Operating lease right of use asset, net 10,612 11,727Intangible assets, net 17,624 49,221Goodwill 77,270 77,270Other non-current assets 2,113 1,055Total assets $ 912,032 $ 931,570
Liabilities and Shareholders' EquityCurrent liabilities:Trade payables $ 3,957 $ 8,699User accounts 132,442 118,616Deferred revenue 12,291 12,145Other account payables and accrued expenses 62,022 44,260Operating lease liabilities 3,140 3,055Current maturities of long-term loan - 2,269Total current liabilities 213,852 189,044
Long-term liabilities:Convertible notes 451,499 372,076Operating lease liabilities 7,853 10,483Long-term loan and other non-current liabilities 1,057 13,099Total long-term liabilities 460,409 395,658Total liabilities $ 674,261 $ 584,702
Shareholders' equity:Share capital and additional paid-in capital 527,494 585,548Accumulated deficit (275,390) (237,585)Accumulated other comprehensive income (loss) (14,333) (1,095)Total shareholders' equity 237,771 346,868Total liabilities and shareholders' equity $ 912,032 $ 931,570

Q1 | 2022 Shareholder Letter Q2 | 2022 Shareholder Letter Q2 | 2022 Shareholder Letter 14
CONSOLIDATED STATEMENTS OF OPERATIONS(in thousands, except share and per share data)
Revenue $ 85,010 $ 75,263 $ 171,695 $ 143,583Cost of revenue 17,526 12,528 34,503 24,074Gross profit 67,484 62,735 137,192 119,509
Operating expenses:Research and development 24,523 20,106 48,297 36,979Sales and marketing 44,325 38,184 92,192 80,823General and administrative 13,658 12,789 28,910 23,876Impairment of intangible assets 27,629 - 27,629 -Total operating expenses 110,135 71,079 197,028 141,678Operating loss (42,651) (8,344) (59,836) (22,169)Financial income (expenses), net 841 (4,944) 1,071 (8,918)Loss before income taxes (41,810) (13,288) (58,765) (31,087)Income taxes (53) (11) (73) (56)Net loss attributable to ordinary shareholders $ (41,863) $ (13,299) $ (58,838) $ (31,143)Basic and diluted net loss per share attributable to ordinary shareholders $ (1.13) $ (0.37) $ (1.60) $ (0.87)
Basic and diluted weighted average ordinary shares 37,027,317 36,338,172 36,846,989 35,988,608
Six Months EndedJune 30,
20212022
(Unaudited)(Unaudited)
Three Months EndedJune 30,
20212022

Q1 | 2022 Shareholder Letter Q2 | 2022 Shareholder Letter Q2 | 2022 Shareholder Letter 15
CONSOLIDATED STATEMENTS OF CASH FLOWS(in thousands)
Operating ActivitiesNet loss $ (41,863) $ (13,299) $ (58,838) $ (31,143)Adjustments to reconcile net loss to net cash provided by operating activities:Depreciation and amortization 3,142 1,373 6,252 2,691Loss from disposal of property and equipment (12) - (12) -Amortization of discount of marketable securities, net 1,997 1,658 3,684 3,481Amortization of discount and issuance costs of convertible notes 631 4,973 1,262 9,877
Shared-based compensation 19,114 13,174 37,117 23,657Net gain from exchange rate fluctuations 314 393 171 302Impairment of intangible assets 27,629 - 27,629 -Changes in assets and liabilities:User funds 4,441 (1,286) (14,862) (23,629)Operating lease ROU assets and liabilities, net (1,101) 272 (1,430) (257)Other receivables (2,677) (559) (2,435) (1,267)Trade payables 662 (837) (4,757) 253Deferred revenue (1,237) 121 146 2,395User accounts (3,904) 1,403 13,826 21,696Account payables, accrued expenses and other 3,964 8,630 11,178 12,736Revaluation of contingent consideration (3,152) - (3,842) -Payment of contingent consideration (504) (507) (504) (507)Non-current liabilities (353) 6 216 (235)Net cash provided by operating activities 7,091 15,515 14,801 20,050
Investing ActivitiesInvestment in marketable securities (45,160) (40,833) (90,007) (166,831)Proceeds from sale of marketable securities 49,737 39,065 83,346 78,995Bank and restricted deposits 24,000 (39,000) 22,863 (39,000)Acquisition of business, net of cash acquired - (410) - (9,288)Acquisition of intangible asset (175) - (175) -Purchase of property and equipment (338) (389) (831) (700)Capitalization of internal-use software (504) (180) (903) (322)Other non-current assets (1,000) - (1,078) -Net cash provided by (used in) investing activities 26,560 (41,747) 13,215 (137,146)
Financing ActivitiesPayment of deferred issuance costs related to follow on offering - (5) - (381)
Payment of convertible notes deferred issuance costs - - - (34)Payment of contingent consideration (1,105) (1,105) (1,105) (1,105)Proceeds from exercise of share options 1,000 1,563 1,711 6,351Tax withholding in connection with employees' options exercises and vested RSUs (556) (10,951) (2,130) (8,629)
Repayment of long-term loan - (139) (2,269) (273)Net cash (used in) financing activities (661) (10,673) (3,793) (4,071)
Effect of exchange rate fluctuations on cash and cash equivalents (314) 236 (171) (141)
Increase/(Decrease) in cash, cash equivalents and restricted cash 32,676 (36,633) 24,052 (121,308)
Cash, cash equivalents and restricted cash at the beginning of period 65,446 183,355 74,070 268,030
Cash and cash equivalents at the end of period $ 98,122 $ 146,722 98,122 $ 146,722
Six Months EndedJune 30,
20212022
(Unaudited)(Unaudited)
Three Months EndedJune 30,
20212022

Q1 | 2022 Shareholder Letter Q2 | 2022 Shareholder Letter Q2 | 2022 Shareholder Letter 16
Annual active buyers (in thousands) 4,220 3,998Annual spend per buyer ($) $ 259 226
KEY PERFORMANCE METRICS
RECONCILIATION OF GAAP TO NON-GAAP GROSS PROFIT(in thousands, except gross margin data)
GAAP gross profit $ 67,484 $ 62,735 $ 137,192 $ 119,509Add:Share-based compensation and other 771 338 1,478 617Depreciation and amortization 2,017 440 3,973 877Non-GAAP gross profit $ 70,272 $ 63,513 $ 142,643 $ 121,003Non-GAAP gross margin 82.7% 84.4% 83.1% 84.3%
RECONCILIATION OF GAAP NET LOSS TO NON-GAAP NET INCOME AND NET INCOME PER SHARE(in thousands, except share and per share data)
GAAP net loss attributable to ordinary shareholders $ (41,863) $ (13,299) $ (58,838) $ (31,143)Add:Depreciation and amortization 3,142 1,373 6,252 2,691Share-based compensation 19,114 13,174 37,117 23,657
Impairment of intangible assets 27,629 - 27,629 -
Contingent consideration revaluation, acquisition related costs and other (2,627) 1,201 (2,690) 2,521
Convertible notes amortization of discount and issuance costs 631 4,973 1,262 9,877Exchange rate (Gain)/Loss, net (1,155) 432 (1,248) (23)Non-GAAP net income $ 4,871 $ 7,854 $ 9,484 $ 7,580
Weighted average number of ordinary shares - basic 37,027,317 36,338,172 36,846,989 35,988,608
Non-GAAP basic net income per share attributable to ordinary shareholders $ 0.13 $ 0.22 $ 0.26 $ 0.21
Weighted average number of ordinary shares - diluted 40,767,393 40,921,663 41,009,735 40,854,045
Non-GAAP diluted net income per share attributable to ordinary shareholders $ 0.12 $ 0.19 $ 0.23 $ 0.19
Three Months EndedJune 30,
20212022
Six Months EndedJune 30,
20212022
(Unaudited)(Unaudited)
Three Months EndedJune 30,
20212022
Six Months EndedJune 30,
20212022
(Unaudited)(Unaudited)
Three Months EndedJune 30,
20212022

Q1 | 2022 Shareholder Letter Q2 | 2022 Shareholder Letter Q2 | 2022 Shareholder Letter 17
RECONCILIATION OF GAAP NET LOSS TO ADJUSTED EBITDA(in thousands, except adjusted EBITDA margin data)
RECONCILIATION OF GAAP TO NON-GAAP OPERATING EXPENSES(in thousands)
GAAP net loss $ (41,863) $ (13,299) $ (58,838) $ (31,143)Add:Financial (income) expenses, net (841) 4,944 (1,071) 8,918Income taxes 53 11 73 56Depreciation and amortization 3,142 1,373 6,252 2,691Share-based compensation 19,114 13,174 37,117 23,657Impairment of intangible assets 27,629 - 27,629 -Contingent consideration revaluation, acquisitionrelated costs and other (2,627) 1,201 (2,690) 2,521
Adjusted EBITDA $ 4,607 $ 7,404 $ 8,472 $ 6,700Adjusted EBITDA margin 5.4% 9.8% 4.9% 4.7%
GAAP research and development $ 24,523 $ 20,106 $ 48,297 $ 36,979Less:Share-based compensation 6,521 4,909 12,726 9,011Depreciation and amortization 202 190 403 377Non-GAAP research and development $ 17,800 $ 15,007 $ 35,168 $ 27,591
GAAP sales and marketing $ 44,325 $ 38,184 $ 92,192 $ 80,823Less:Share-based compensation 4,575 3,457 9,005 6,045Depreciation and amortization 821 686 1,681 1,325Contingent consideration revaluation, acquisition related costs and other - 398 - 695
Non-GAAP sales and marketing $ 38,929 $ 33,643 $ 81,506 $ 72,758
GAAP general and administrative $ 13,658 $ 12,789 $ 28,910 $ 23,876Less:Share-based compensation 7,247 4,470 13,908 7,984Depreciation and amortization 102 57 195 112Contingent consideration revaluation, acquisition related costs and other (2,627) 803 (2,690) 1,826
Non-GAAP general and administrative $ 8,936 $ 7,459 $ 17,497 $ 13,954
Six Months EndedJune 30,
20212022
(Unaudited)
Three Months EndedJune 30,
20212022
(Unaudited)
Six Months EndedJune 30,
20212022
(Unaudited)
Three Months EndedJune 30,
20212022
(Unaudited)

Q1 | 2022 Shareholder Letter Q2 | 2022 Shareholder Letter Q2 | 2022 Shareholder Letter 18
Key Performance Metrics and Non-GAAP Financial Measures
This shareholder letter includes certain key performance metrics and financial measures not based on GAAP, including Adjusted EBITDA, Adjusted EBITDA margin, Non-GAAP gross profit, Non-GAAP gross margin, Non-GAAP operating expenses, Non-GAAP net income (loss) and Non-GAAP net income (loss) per share as well as operating metrics, including GMV, active buyers, spend per buyer, take rate and tROI.
We define GMV or Gross Merchandise Value as the total value of transactions ordered through our platform, excluding value added tax, goods and services tax, service chargebacks and refunds. Active buyers on any given date is defined as buyers who have ordered a Gig or other services on our platform within the last 12-month period, irrespective of cancellations. Spend per buyer on any given date is calculated by dividing our GMV within the last 12-month period by the number of active buyers as of such date. Take rate is revenue for any such period divided by GMV for the same period.
We define tROI or Time to Return On Investment as the number of months required to recover performance marketing investments during a particular period of time from the revenue generated by the new buyers acquired during that period. We use tROI to measure the efficiency of our buyer acquisition strategy. Performance marketing investments in new buyer acquisition is determined by aggregating online advertising spend across various channels, including search engine optimization, search engine marketing, video and social media used for buyer acquisition. Our performance marketing investments exclude certain fixed costs, including out of home advertising and fixed labor costs. Our performance marketing investment differs from sales and marketing expenses presented in accordance with GAAP and should not be considered as an alternative to sales and marketing expenses. Our performance marketing investment has limitations as an analytical tool, including that it does not reflect certain expenditures necessary to the operation of our business, and should not be considered in isolation. Certain fixed costs are excluded from performance marketing investments and related tROl calculations because performance marketing investments represent our direct variable costs related to buyer acquisition and its corresponding revenue generation. tROl measures the efficiency of such variable marketing investments and is an indicator actively used by management to make day-to-day operational decisions.
Management and our board of directors use these metrics as supplemental measures of our performance that is not required by, or presented in accordance with GAAP because they assist us in comparing our operating performance on a consistent basis, as they remove the impact of items not directly resulting from our core operations. We also use these metrics for planning purposes, including the preparation of our internal annual operating budget and financial projections, to evaluate the performance and effectiveness of our strategic initiatives and to evaluate our capacity to and capital expenditures and expand our business.
Adjusted EBITDA, Adjusted EBITDA margin, Non-GAAP gross profit, Non-GAAP gross margin, Non-GAAP operating expenses, Non-GAAP net loss and Non-GAAP net loss per share as well as operating metrics, including GMV, active buyers, spend per buyer, take rate and tROI should not be considered in isolation, as an alternative to, or superior to net loss, revenue, cash flows or other performance measure derived in accordance with GAAP. These metrics are frequently used by analysts, investors and other interested parties to evaluate companies in our industry. Management believes that the presentation of non-GAAP metrics is an appropriate measure of operating performance because they eliminate the impact of expenses that do not relate directly to the performance of our underlying business.
These non-GAAP metrics should not be construed as an inference that our future results will be unaffected by unusual or other items. Additionally, Adjusted EBITDA and other non-GAAP metrics used herein are not intended to be a measure of free cash flow for management’s discretionary use, as they do not reflect our tax payments and certain other cash costs that may recur in the future, including, among other things, cash requirements for costs to replace assets being depreciated and amortized. Management compensates for these limitations by relying on our GAAP results in addition to using Adjusted EBITDA and other non-GAAP metrics as supplemental measures of our performance. Our measure of Adjusted EBITDA and other non-GAAP metrics used herein is not necessarily comparable to similarly titled captions of other companies due to different methods of calculation.
See the tables above regarding reconciliations of these non-GAAP measures to the most directly comparable GAAP measures.
We are not able to provide a reconciliation of Adjusted EBITDA guidance for the third quarter of 2022, or the fiscal year ending December 31, 2022 to net loss, the comparable GAAP measure, because certain items that are excluded from Adjusted EBITDA cannot be reasonably predicted or are not in our control. In particular, we are unable to forecast the timing or magnitude of share based compensation, amortization of intangible assets, impairment of intangible assets, income or loss on revaluation of contingent consideration, other acquisition-related costs, convertible notes amortization of discount and issuance costs and exchange rate income or loss, as applicable without unreasonable efforts, and these items could significantly impact, either individually or in the aggregate, GAAP measures in the future.

Q1 | 2022 Shareholder Letter Q2 | 2022 Shareholder Letter Q2 | 2022 Shareholder Letter
Forward Looking Statements
This shareholder letter contains forward-looking statements within the meaning of the Private Securities Litigation Reform Act of 1995. All statements contained in this shareholder letter that do not relate to matters of historical fact should be considered forward-looking statements, including, without limitation, statements regarding our expected financial performance and operational performance for the third quarter of 2022, and the fiscal year ending December 31, 2022, our expected future Adjusted EBITDA profitability, our business plans and strategy, as well as statements that include the words “expect,” “intend,” “plan,” “believe,” “project,” “forecast,” “estimate,” “may,” “should,” “anticipate” and similar statements of a future or forward-looking nature. These forward-looking statements are based on management’s current expectations. These statements are neither promises nor guarantees, but involve known and unknown risks, uncertainties and other important factors that may cause actual results, performance or achievements to be materially different from any future results, performance or achievements expressed or implied by the forward-looking statements, including, but not limited to: our ability to attract and retain a large community of buyers and freelancers; our ability to achieve profitability; our ability to maintain and enhance our brand; our dependence on the continued growth and expansion of the market for freelancers and the services they offer; our ability to maintain user engagement on our website and to maintain and improve the quality of our platform; our dependence on the interoperability of our platform with mobile operating systems that we do not control; our ability to successfully implement our business plan during a global economic downturn that may impact the demand for our services or have a material adverse impact on our and our business partners’ financial condition and results of operations; our ability and the ability of third parties to protect our users’ personal or other data from a security breach and to comply with laws and regulations relating to consumer data privacy and data protection; our ability to detect errors, defects or disruptions in our platform; our ability to comply with the terms of underlying licenses of open source software components on our platform; our ability to expand into markets outside the United States and our ability to manage the business and economic risks of international expansion and operations; our ability to achieve desired operating margins; our compliance with a wide variety of U.S. and international laws and regulations; our ability to protect our intellectual property rights and to successfully halt the operations of copycat websites or misappropriation of data; our reliance on Amazon Web Services; our ability to mitigate payment and fraud risks; our dependence on relationships with payment partners, banks and disbursement partners; our dependence on our senior management and our ability to attract new talent; the impact of currency exchange rate fluctuations on our results of operations; impacts resulting from inflationary pressures and geopolitical turmoil, including the war in Ukraine; and the other important factors discussed under the caption “Risk Factors” in our annual report on Form 20-F filed with the U.S. Securities and Exchange Commission (“SEC”) on February 17, 2022 as such factors may be updated from time to time in our other filings with the SEC, which are accessible on the SEC’s website at www.sec.gov. In addition, we operate in a very competitive and rapidly changing environment. New risks emerge from time to time. It is not possible for our management to predict all risks, nor can we assess the impact of all factors on its business or the extent to which any factor, or combination of factors, may cause actual results to differ materially from those contained in any forward-looking statements that we may make. In light of these risks, uncertainties and assumptions, the forward-looking events and circumstances discussed in this release are inherently uncertain and may not occur, and actual results could differ materially and adversely from those anticipated or implied in the forward-looking statements. Accordingly, you should not rely upon forward-looking statements as predictions of future events. In addition, the forward-looking statements made in this release relate only to events or information as of the date on which the statements are made in this release. Except as required by law, we undertake no obligation to update or revise publicly any forward-looking statements, whether as a result of new information, future events or otherwise, after the date on which the statements are made or to reflect the occurrence of unanticipated events.
19