Fabrication of magnetic gold nanorod particles for immunomagnetic separation and SERS application
Upload
independentCategory
view
0download
0
Geophys. J. Int. (2007) 170, 1053–1066 doi: 10.1111/j.1365-246X.2007.03489.x
GJI
Geo
mag
netism
,ro
ckm
agne
tism
and
pala
eom
agne
tism
Efficiency of heavy liquid separation to concentrate magneticparticles
Christine Franke,1,2 Thomas Frederichs1 and Mark J. Dekkers2
1Department of Geosciences, University of Bremen, P.O. Box 330 440, D-28334 Bremen, Germany. E-mail: [email protected] Laboratory ‘Fort Hoofddijk’, Utrecht University, Budapestlaan 17, 3584 CD Utrecht, The Netherlands
Accepted 2007 May 7. Received 2007 May 7; in original form 2006 March 31
S U M M A R YLow-temperature rock magnetic measurements have distinct diagnostic value. However, inmost bulk marine sediments the concentration of ferrimagnetic and antiferromagnetic min-erals is extremely low, so even sensitive instrumentation often responds to the paramagneticcontribution of the silicate matrix in the residual field of the magnetometer. Analysis of mag-netic extracts is usually performed to solve the problems raised by low magnetic concentrations.Additionally magnetic extracts can be used for several other analyses, for example electronmicroscopy or X-ray diffraction. The magnetic extraction technique is generally sufficient forsediments dominated by magnetite. In this study however, we show that high-coercivity com-ponents are rather underrepresented in magnetic extracts of sediments with a more complexmagnetic mineralogy. We test heavy liquid separation, using hydrophilic sodium polytung-stenate solution Na6[H2W12O40], to demonstrate the efficiencies of both concentration tech-niques. Low-temperature cycling of zero-field-cooled, field-cooled and saturation isothermalremanent magnetization acquired at room temperature was performed on dry bulk sediments,magnetic extracts, and heavy liquid separates of clay-rich pelagic sediments originating fromthe Equatorial Atlantic. The results of the thermomagnetic measurements clarify that magneticextraction favours components with high spontaneous magnetization, such as magnetite andtitanomagnetite. The heavy liquid separation is unbiased with respect to high- and low-coerciveminerals, thus it represents the entire magnetic assemblage.
Key words: heavy liquid separation, magnetic extraction, marine sediments, rock magnetism.
1 I N T RO D U C T I O N
Rock magnetic investigations of marine sediments aim at unrav-elling depositional history and diagenetic changes of the magneticmineralogy for geomagnetic and palaeoceanographic investigations.As a rule in marine sediments, mixed magnetic components occurin very low concentration, down to the ppm range. In addition, thegrain size range of such particles spans from a few tens of microme-tres down to the nanometres range.
Besides carbonates and silica, clay minerals are the most abundantnon-ferrimagnetic components in the sediment, and may interferewith the performance of several non-magnetic mineral identifica-tion techniques, for example, microscopy or X-ray diffraction. Ad-ditionally, they are important for a proper interpretation of low-temperature magnetic measurements of the bulk sediment, due totheir paramagnetic behaviour. Because of their abundance, clay min-erals may induce distinct magnetic moments even in the small resid-ual fields prevailing in the magnetometer. Moreover, at temperaturesbelow 25 K, paramagnetic (clay) minerals start to show collec-tive magnetic behaviour that may give rise to appreciable magneticmoments (e.g. Coey 1988). Therefore, they attenuate diagnostic
temperature-dependent transitions of ferrimagnetic and antiferro-magnetic phases, such as the Verwey-, 34 K-, and Morin-transitionof magnetite, pyrrhotite and hematite, respectively.
The standard tool to enhance the concentration of the magneticfraction for various analyses is the magnetic extraction. Variousextraction protocols exist (e.g. Petersen et al. 1986; von Dobeneck1987; Dekkers 1988; Hounslow & Maher 1999). In some recipes car-bonates are dissolved by leaching the bulk sample material in aceticacid (pH 4–5). Magnetic extraction can be easily applied to wetbulk sediments of marine origin which yield a reasonable amountof extracted magnetic material, that subsequently can be analysed,for example, with a sensitive Magnetic Properties MeasurementSystem (MPMS) or in an electron microscope. The extraction dura-tion and careful implementation is crucial for the extraction yield.Nevertheless, the amount of magnetic extract is generally still toolow to allow easy mass determination with a (semi-)microbalance.This expounds problems of true quantification, required for budgetcalculations.
Hounslow & Maher (1996) presented a detailed quantitative studyon magnetic extracts from a broad variety of sediment samples.The extraction efficiency was calculated by comparing before- and
C© 2007 The Authors 1053Journal compilation C© 2007 RAS
1054 C. Franke, T. Frederichs and M. J. Dekkers
after-extraction rock magnetic measurements. They conclude thatthe extraction yield is strongly dependent on the magnetic miner-alogy, the morphology of the magnetic particles, and the lithologyof the bulk sediment sample. Comparisons of magnetic extract datawith the original bulk sediment signal, in order to determine how rep-resentative the extract actually is, are not always feasible in practice.Magnetic extraction methods favour (rather strongly) ferrimagneticmineral phases (mainly (titano-)magnetite, maghemite, pyrrhotiteand greigite), being magnetically softer, over magnetically harderantiferromagnetic phases (such as hematite or goethite) (Dekkers1988; Hounslow & Maher 1999). Extraction efficiencies of over75 per cent were achieved by Hounslow & Maher (1996) for mag-netite dominated sediments, but were rather low for sediments dom-inated by iron sulphides or high-coercive minerals efficiencies.
In this study, we explored heavy liquid separation on marine drybulk sediments comprising complex magnetic mineralogies (Franke2006; Franke et al. 2007b.) as an alternative extraction methodto achieve a more complete ‘magnetic’ fraction, consisting of theheavy mineral portion (density >3.0 × 10³ kg m−3). This fractionshould include all magnetic mineral phases present in the sample.Hydrophilic sodium polytungstenate solution Na6[H2W12O40] wasapplied, providing the possibility to separate the magnetic fractionin very fine-grained material, particularly in clay-rich samples.
Watery lithium heteropolytungsten solution with a density of2.85 × 103 kg m−3 was advantageously used by Lagroix et al.(2004) to separate the magnetic Fe–Ti oxide fraction from the vol-canic glass fraction in their tephra samples. This specific Old Crowtephra occurs intercalated in loess deposits at Halfway House incentral Alaska. By classical gravity separation for 24 h, they man-aged to divide the magnetic fraction into the lighter volcanic glass(<2.85 × 10³ kg m−3) and the rest of the (coarser grained) magneticFe–Ti oxides (>5.0 × 10³ kg m−3). The heavy fraction representsbetween 0.5 and 1.5 per cent of the bulk sample mass. They arguethat their light mineral fraction still contains most of the SP parti-cles. The density separation certainly enhanced the possibilities toidentify the Fe–Ti oxides in the heavy fraction, but concentrationsin the light fraction were still high enough to magnetically identifyits composition.
The overwhelming amount of paramagnetic components in ma-rine sediments complicates the separation. Therefore, we use hy-drophilic sodium polytungstenate solution with an even higher den-sity of 3.0 × 10⁻³ kg m−3 in our study combined with ultrasonicdispersion and centrifuging techniques to ‘purify’ the magnetic frac-tion from the siliceous components in the bulk sediment. The ad-vantage of this non-magnetic separation method is that all magneticcomponents are extracted regardless of their magnetic moment.
2 S A M P L E M AT E R I A L
The chosen sample suite includes six specimens from clay-rich pelagic sediments of three gravity cores of a west–eastprofile throughout the Equatorial Atlantic. The gravity coreswere recovered from the Ceara Rise (CER; GeoB 1523-1;3◦50.8′N/41◦36.6′W), the equatorial Mid-Atlantic Ridge (MAR;GeoB 4313-2; 4◦02.8′N/33◦26.3′W) and the Sierra Leone Rise(SLR; GeoB 2910-1; 4◦50.7′N/21◦03.2′W) during RV Meteorcruises M16/2, M29/3 and M38/1. This zone in the Equatorial At-lantic is presently oligotrophic (Funk et al. 2004b). The pelagicsediments of all three gravity cores are characterized as clay- andforam-bearing nannofossil oozes. Magnetic particles in these sedi-ments originate from several distinct sources: continental eolian dust
(Sahara), fluvial discharge (Amazon River) and submarine weath-ered ocean ridge basalts (Mid-Atlantic Ridge). Authigenic sourcesfor magnetic particles include the biogenic formation of bacterialmagnetosomes and the (inorganic) recrystallization of earlier ironsulphides (Franke 2006). For further details on gravity core local-ities and general settings see Schulz et al. (1991), Henrich et al.(1994), Fischer et al. (1998), Funk et al. (2004a,b) and Reitz et al.(2004).
Two discrete samples were processed from each of the three grav-ity cores, one corresponding to Marine Isotope Stage (MIS) 4, thatis, a glacial stage, and the other to MIS 5.5 (Eemian), an interglacialstage. These samples, chosen for the detailed studies, represent typ-ical conditions throughout the gravity cores. In glacial conditions acoarser magnetic inventory is found, while interglacial conditionsare characterized by a finer magnetic grain size distribution (Funket al. 2004a,b; Franke 2006; Franke et al. 2007b). So, the perfor-mance of magnetic separation procedures can be assessed for dif-ferent compositions formed under contrasting climatic conditions.In the following, we will simply refer to these two time slices as‘glacial’ and ‘interglacial’.
3 M I N E R A L C O N C E N T R AT I O NP RO C E D U R E S
3.1 Magnetic extraction
Magnetic extraction was performed on 10 cm3 of the wet bulk sedi-ment samples using the method of Petersen et al. (1986). The ex-traction run was usually stopped after 8–12 hrs per sample, whenno visible gain in material was achieved anymore. The extractedparticles were stored in small glass vials filled with ethanol. ForMPMS measurements the fluid (containing the magnetic extract)was applied into a gelatine capsule, which was subsequently driedat room temperature, by evaporating the ethanol in air. Since the ex-tracts were stored in ethanol, the application of the wet extract intothe delicate gelatine capsules (that dissolve rapidly in water) posesno problems. Mass determination of the magnetic extracts with asemi-microbalance was not possible, since the typical amount of ma-terial is beyond the metering precision of a semi-microbalance (d =10−8 kg). Other, more detailed MPMS sample preparation aspectsand instrumental settings are outlined in Frederichs et al. (2003).
3.2 Heavy liquid separation
Heavy liquid separation was performed on typically 0.8 × 10⁻³ kg ofthe freeze-dried bulk sediments (referred to as dry bulk sediment).After weighing, the samples were dispersed in 20 ml hydrophilicsodium polytungstenate solution (Na6[H2W12O40]), with a densityof exactly 3.0 × 10³ kg m−3 (manual shaking until no obviousclustering was visible anymore, followed by 10 min of ultrasonicbath agitation). Hereafter, the 50 ml plastic centrifuge vessels withthe sediment-fluid suspension, were directly centrifuged for 5 minusing a Heraeus Minifuge T at 4000 rps. During this process, thesediment-fluid suspension separates into a floating light sedimentfraction (LF) with a density <3.0 × 10³ kg m−3, the so-called fluidmirror (= 3.0 × 10³ kg m−3) in the middle of the centrifuge tube anda heavy sediment fraction (HF) at the bottom, with a density >3.0 ×10³ kg m−3. If necessary, the 5 min centrifuge run was repeated with-out re-homogenizing the sample. The LF on top of the fluid mirrorand the fluid mirror itself were separated from the HF using a special10 ml precision pipette, and both fractions were suction filtered sep-arately after separation. For filtration, cellulose acetate filters with
C© 2007 The Authors, GJI, 170, 1053–1066
Journal compilation C© 2007 RAS

Efficiency of heavy liquid separation 1055
0.1 µm pores were applied. Further rock magnetic measurementsclearly indicate that the <0.1 µm fraction was retained in the HF,presumably due to the clustering tendency of these particles (seeSection 4). The sediment fractions were dried in air over night atroom temperature, removed from the filters, weighed and placed ingelatine capsules for MPMS measurements.
3.3 Extraction efficiency
In Table 1, the mass of the starting material of the dry bulk sedimentis given, in comparison with the mass of the light and heavy fractionsresulting from the density separation. The heavy mineral fractionfor this sample set ranged from 0.022 to 0.04 × 10⁻⁴ kg, typically1.4 per cent of the starting bulk material. The discrepancy betweenstarting material and the sum of light and heavy fractions stemsfrom material remaining on the filters and can be further estimatedby weighing the filters before and after the heavy liquid separation.A small fraction of the material is not removable from the filters any-more since it penetrates the filter membrane. The amount of materialremaining on the filters is typically ∼7.4 per cent and comparablefor both density fractions.
The yield of the magnetic extracts for the same sample set us-ing a much higher amount of starting material (10 cm3 of wet bulksediment) is much lower, and cannot be meaningfully mass quan-tified. With the exception of the magnetic extract measurements,all thermomagnetic curves are mass normalized (Table 2) in thefollowing. An additional advantage of the sodium polytungstenatesolution as a heavy liquid solution is its non-toxicity. Further, the sep-arates can be flushed or washed extensively during filtration, due tothe hydrophilic character of the sodium polytungstenate solution.
The extraction efficiency (Table 1) of both concentration tech-niques can be quantified by comparing the remanence values of thebulk sediment to the values from the respective residuals. In caseof the magnetic extraction, the residuals were recovered from thesuspension by simple drying in air. The residuals of the heavy liquidseparation are represented by the light fraction. The efficiency forthe magnetic extraction technique was calculated by the ratio of themass specific IRM values (measured at 2.5 T and room temperature)for the bulk sediment (rBS) and the respective residuals (rRes) afterthe extraction run (see eq. 1). For the heavy liquid separation, theextraction efficiencies were derived by the ratio of the mass specificSIRM (measured at 5 T and 300 K) for the bulk sediment (rBS)and the respective light fractions (rLF) (see eq. 2). The magneticextraction efficiencies range from 8 to 76 per cent whereas the effi-ciencies for the heavy liquid separation show values between 30 and98 per cent.
Efficiencymagn.extration = 100 ×(
1 − rRes
rBS
)% (1)
Efficiencyheavy.liquid.sep. = 100 ×(
1 − rLF
rBS
)% (2)
4 T H E R M O M A G N E T I C O B S E RVAT I O N S
4.1 Thermomagnetic measurements
For clarity the various thermomagnetic measurement types per-formed are summarized in Table 3. Low-temperature zero-field-cooled (ZFC) and field-cooled (FC) measurements were performedwithin several weeks after drying the various extracts and sepa-rates, using a Quantum Design XL7 Magnetic Properties Measure-ment System (MPMS; noise level ∼10−11 Am2). Low-temperature T
able
1.M
asse
sof
star
ting
mat
eria
l,as
wel
las
the
sepa
rate
dli
ghta
ndhe
avy
frac
tion
s,an
dth
em
ater
ialo
nth
efi
lter
sfo
rhe
avy
liqu
idse
para
tion
(giv
enin
per
cent
ofth
est
arti
ngm
ater
ial)
.
Sam
ple
Mas
sof
star
ting
Tota
lmas
sli
ght
Tota
lmas
she
avy
Mat
eria
lon
filt
ers
Mag
neti
cex
trac
tion
Hea
vyli
quid
sepa
rati
onm
ater
ial
frac
tion
frac
tion
(per
cent
)ef
fici
ency
effi
cien
cy(g
)(p
erce
nt)
(per
cent
)(p
erce
nt)
(per
cent
)
Geo
B15
23-1
,160
cm0.
8557
595
.30.
64.
110
.297
.7G
eoB
1523
-1,3
11cm
0.65
728
89.8
1.4
8.6
53.9
45.0
Geo
B43
13-2
,130
cm0.
6825
190
.71.
47.
98.
137
.7G
eoB
4313
-2,2
45cm
0.79
249
89.4
2.8
7.9
75.7
39.6
Geo
B29
10-1
,60
cm0.
9742
192
.40.
47.
220
.130
.2G
eoB
2910
-1,1
41cm
0.87
386
89.7
1.7
8.6
29.7
45.7
The
last
two
colu
mns
show
the
effi
cien
cies
ofm
agne
tic
extr
acti
onan
dhe
avy
liqu
idse
para
tion
(for
effi
cien
cyca
lcul
atio
nse
eS
ecti
on3.
3).
C© 2007 The Authors, GJI, 170, 1053–1066
Journal compilation C© 2007 RAS

1056 C. Franke, T. Frederichs and M. J. Dekkers
Table 2. Masses of the dry bulk sediment, light and heavy fraction samplesused for thermomagnetic measurements.
Sample Mass dry bulk Mass light Mass heavysediment fraction fraction
(g) (g) (g)
GeoB 1523-1, 160 cm 0.03153 0.0625 0.0050GeoB 1523-1, 311 cm 0.02663 0.0609 0.0092GeoB 4313-2, 130 cm 0.02806 0.0510 0.0096GeoB 4313-2, 245 cm 0.03429 0.0288 0.0221GeoB 2910-1, 60 cm 0.02902 0.0491 0.0041GeoB 2910-1, 141 cm 0.03446 0.0475 0.0145
These masses were applied for mass specific normalization. Measurementson dry bulk sediment were performed on identical material with samplemasses given in the second column. Note that only a minor portion of thelight fraction was used for MPMS measurements.
warming curves (5–300 K) were determined for dry bulk sediments,magnetic extracts, and heavy liquid separates, all monitored in 2 Kincrements. For the ZFC measurements, the field was applied at5 K (in case of dry bulk sediments at 10 K) and switched off beforewarming back to 300 K, whereas for the FC measurements, the fieldwas applied at 300 K throughout cooling and switched off beforewarming back to 300 K. Where appropriate, the first derivatives ofboth ZFC and FC remanences versus temperature were calculated(with a 6 K running average) in order to better visualize changes ofthe magnetic state during sample warming.
To test for the presence of high-coercivity components (specifi-cally goethite) in the samples (see Section 4.3), dedicated heatingexperiments were performed. First of all, a portion of pristine drybulk sediment samples was heated in air up to 340◦C and subse-quently cooled in zero-field back to room temperature. Afterwards,the same procedure for low-temperature ZFC and FC runs in theMPMS was performed. The original pristine and the heated bulk sed-iment samples were weighed before performing the low-temperaturemeasurements; therefore, mass-normalized curves are directlycomparable.
For identification of the high-coercivity component(s), additionalhigh-temperature field cycling was performed on the dry bulk sed-iment samples, applying a 7 T field at room temperature. The sam-ples were run in-field (FH) from 300 to 400 K (heating) and back to300 K (cooling), followed by a zero-field (ZFH) cycle within thesame temperature range. All high-temperature measurements us-ing the MPMS were also monitored in 2 K increments. FH curvesare corrected for the paramagnetic contribution of the sample. Thiswas done by measuring the magnetic moment in fields between 4and 7 T at room temperature, assuming linear behaviour betweenthese fields. This assumption is reasonable because at room tem-perature paramagnetism is linear with field up to hundreds of Tesla.Goethite on the other hand is not entirely saturated in such fields(e.g. Rochette et al. 2005). However, the deviation of the in-fieldmagnetization from linearity is small.
Table 3. Summary of all thermomagnetic measurements performed on bulk sediments, magnetic extracts, light and heavy fractions.
ZFC FC RT-SIRM FH ZFH
Applied field (T) 5 5 5 7 7Temperature range (K) 5 (10) to 300 5 (10) to 300 300 to 5 300 to 400 300 to 400Temperature increment (K) 5 5 5 2 2Cooling/warming rates (K/min) 2 2 2 2 2
The numbers in brackets give the starting temperature for the bulk sediment samples. ZFC = zero-field-cooled remanence, FC = fieldcooled remanence, FH = field-heated magnetization, ZFH zero-field-heated remanence, RT-SIRM = room-temperature saturationisothermal remanent magnetization.
Room temperature saturation isothermal remanent magnetization(RT-SIRM) measurements were performed on dry bulk sediments,magnetic extracts, and heavy liquid separates. A 5 T field was ap-plied at RT, subsequently the sample was cycled from 300 to 5 K(cooling) and back to 300 K (warming) in zero-field, monitored in2 K increments.
4.2 Low-temperature ZFC and FC resultsof dry bulk sediments
For all dry bulk sediment measurements, the low-temperature warm-ing curves of ZFC and FC remanence did not show any pronouncedremanence transitions (Fig. 1). A rapid decrease in ZFC and FCremanence between 10 and 40 K (corresponding to the local mini-mum in the respective first derivative curves) was observed for allsix samples. A similar phenomenon was observed in partially oxi-dized magnetite of synthetic (Ozdemir et al. 1993) as well as naturalorigin (Smirnov & Tarduno 2000). In the latter, co-existing ultrafine-grained superparamagnetic (SP) material is argued to occur. Passier& Dekkers (2002) discussed the possibilities of magnetic interac-tion, surface effects in very fine grains, or the presence of surfacelayers around coarser magnetic particles as other possible explana-tions for such behaviour.
The most important observation of all dry bulk sediment experi-ments was the remarkable discrepancy between corresponding ZFCand FC curves. These divergences are maximum at 10 K and dis-appear towards room temperature in our samples, as described alsoby Smirnov & Tarduno (2000). Divergences are generally largerin glacial samples (Figs 1a, c and e) than in interglacial samples(Figs 1b, d and f).
4.3 Heating experiments of dry bulk sediments
The hypothesis of the presence of goethite was tested by the heatingexperiments outlined in Section 4.1. The discrepancy between ZFCand FC curves decreased dramatically after heating. For most ofthe samples, ZFC and FC curves merge at temperatures >40–60 K(compare Fig. 1 with Fig. 2). Through its transformation to hematite,goethite is chemically removed from the sediment by heating to340◦C. Therefore, the low-temperature ZFC-FC divergence and itssubstantial decrease after the heating to 340◦C is interpreted as beingrelated to goethite.
Further high-temperature remanence measurements (see Sec-tion 4.1) were performed to confirm this interpretation and checkfor the possibility of thin maghemitized surface layers of magnetitegrains (van Velzen & Zijderveld 1992, 1995; van Velzen & Dekkers1999a,b). All ZFH and FH curves and their first derivatives (Figs 3and 4) show a drop at 390 K (∼117◦C), indicating the Neel pointof goethite (e.g. Hedley 1971; Dekkers 1989). The original non-smoothed raw data (not shown here) confirms a clear decreasingtrend of the curve around that temperature. Due to instrumental
C© 2007 The Authors, GJI, 170, 1053–1066
Journal compilation C© 2007 RAS

Efficiency of heavy liquid separation 1057
glacial interglacial
0 60 120 180 240 300Temperature [K]
0
2
4
6
8
10
12
Rem
anen
t Mag
netis
atio
n [1
0-3 A
m2
kg-1
]
0
4
8
12
16
20
24
28
Rem
anen
t Mag
netis
atio
n [1
0-3 A
m2
kg-1
]
0
2
4
6
8
10
12
Rem
anen
t Mag
netis
atio
n [1
0-3 A
m2
kg-1
]
0
4
8
12
16
20
24
28
Rem
anen
t Mag
netis
atio
n [1
0-3 A
m2
kg-1
]
0
2
4
6
8
10
12
Rem
anen
t Mag
netis
atio
n [1
0-3
Am
2 kg
-1]
0
4
8
12
16
20
24
28
Rem
anen
t Mag
netis
atio
n [1
0-3
Am
2 kg
-1]
0 60 120 180 240 300Temperature [K]
-20
-16
-12
-8
-4
0
4
dM/dT
[10-5 A
m2 kg
-1 K-1]
-10
-8
-6
-4
-2
0
2
dM/dT
[10-5 A
m2 kg
-1 K-1]
-40
-30
-20
-10
0
10
dM/dT
[10-5 A
m2 kg
-1 K-1]
-12
-10
-8
-6
-4
-2
0
2
dM/dT
[10-5 A
m2 kg
-1 K-1]
-10
-8
-6
-4
-2
0
2
dM/dT
[10-5 A
m2 kg
-1 K-1]
-10
-8
-6
-4
-2
0
2
dM/dT
[10-5 A
m2 kg
-1 K-1]
GeoB 1523-1, 160 cm
GeoB 2910-1, 60 cm
GeoB 4313-2, 130 cm
GeoB 1523-1, 311 cm
GeoB 2910-1, 141 cm
GeoB 4313-2, 245 cm
ZFC waming curve FC warming curveZFC first derivative FC first derivative
a b
c d
e f
Figure 1. Low-temperature ZFC and FC remanent magnetization curves for six dry bulk sediment samples (solid line = ZFC, dashed line = FC) along anEquatorial Atlantic west–east profile (from top to bottom). Glacial samples are shown on the left (scaled to a maximum value of 28 × 10−3 Am2 kg−1) andinterglacial samples are shown on the right (scaled to a maximum value of 12 × 10−3 Am2 kg−1), for instrumental settings see Table 3. The first derivativesare given in grey, filled symbols for ZFC and open symbols for FC.
restrictions the maximum temperature available is 400 K, but thecharacteristic drop just below this temperature is not caused by aninstrumental setting and varies slightly in temperature for each sam-ple. During cooling of the ZFH curves (Fig. 3) no new remanenceshould be acquired by the samples, due to the lack of an inducingfield. The minor remanence acquisition in some of the ZFH cool-ing curves is caused by a small remaining field (in the order of∼150 µT), which is still present after the quenching of the MPMSmagnet (Kosterov et al. 2006). The FH heating curves show a char-acteristic Hopkinson peak at 360 K (∼87◦C, e.g. Heller 1978) formost of the samples (Figs 4c–f weakly expressed in Fig. 4a). Thisfeature is even more prominent in the first derivative curves of theFH of samples from GeoB 4313-2 (Figs 4c and d). Note that the in-tensities of the samples increase after heating above the Neel pointof goethite. This is a further indication that indeed most likely somegoethite is present in these samples.
4.4 Low-temperature ZFC and FC resultsof magnetic extracts
Due to the low amount of magnetic extract, the curves (both ZFCand FC) have been simply normalized to the ZFC value at 5 K.
The ZFC and FC curves depict a slightly broadened Verwey tran-sition at ∼110 K for the samples from the westernmost and thecentral equatorial sediment cores (GeoB 1523-1 and GeoB 4313-2;Figs 5a–d). No Verwey transition was observed for GeoB 2910-1,the easternmost site (Figs 5e and f). The shift to lower transitiontemperatures is indicative of non-stoichiometric slightly oxidizedmagnetite (Ozdemir et al. 1993; Kosterov 2003).
The evident discrepancy between ZFC and FC warming curvesin the dry bulk sediments was not observed in the magnetic extractdata (compare Fig. 1 with Fig. 5). ZFC and FC warming curvesof the magnetic extracts diverge only between 5 and 30 K. Theyare more or less merged at temperatures from ∼110 K up to roomtemperature (see also Smirnov & Tarduno 2000). The substantiallyreduced ZFC-FC divergence in the magnetic extracts as compared tothe bulk material would comply with the (near) absence of goethite inthe magnetic extracts, because magnetic separation is biased towardsstrongly magnetic low-coercivity material.
4.5 Low-temperature ZFC and FC results of heavyliquid separates
Low-temperature warming curves of ZFC and FC remanence of theseparated heavy fraction are overall an order of magnitude higher
C© 2007 The Authors, GJI, 170, 1053–1066
Journal compilation C© 2007 RAS
1058 C. Franke, T. Frederichs and M. J. Dekkers
0 60 120 180 240 300Temperature [K]
0
2
4
6
8
10
12
Rem
anen
ent M
agne
tisat
ion
[10-3
Am
2 kg
-1]
0
4
8
12
16
20
24
28
Rem
anen
ent M
agne
tisat
ion
[10-3
Am
2 kg
-1]
0
2
4
6
8
10
12
Rem
anen
ent M
agne
tisat
ion
[10-3
Am
2 kg
-1]
0
4
8
12
16
20
24
28
Rem
anen
ent M
agne
tisat
ion
[10-3
Am
2 kg
-1]
0
2
4
6
8
10
12
Rem
anen
ent M
agne
tisat
ion
[10-3
Am
2 kg
-1]
0
4
8
12
16
20
24
28
Rem
anen
ent M
agne
tisat
ion
[10-3
Am
2 kg
-1]
0 60 120 180 240 300Temperature [K]
GeoB 1523-1, 160 cm
GeoB 2910-1, 60 cm
GeoB 4313-2, 130 cm
glacialGeoB 1523-1, 311 cm
GeoB 2910-1, 141 cm
GeoB 4313-2, 245 cm
ZFC non-heated FC non-heatedZFC heated FC heated
interglaciala b
c d
e f
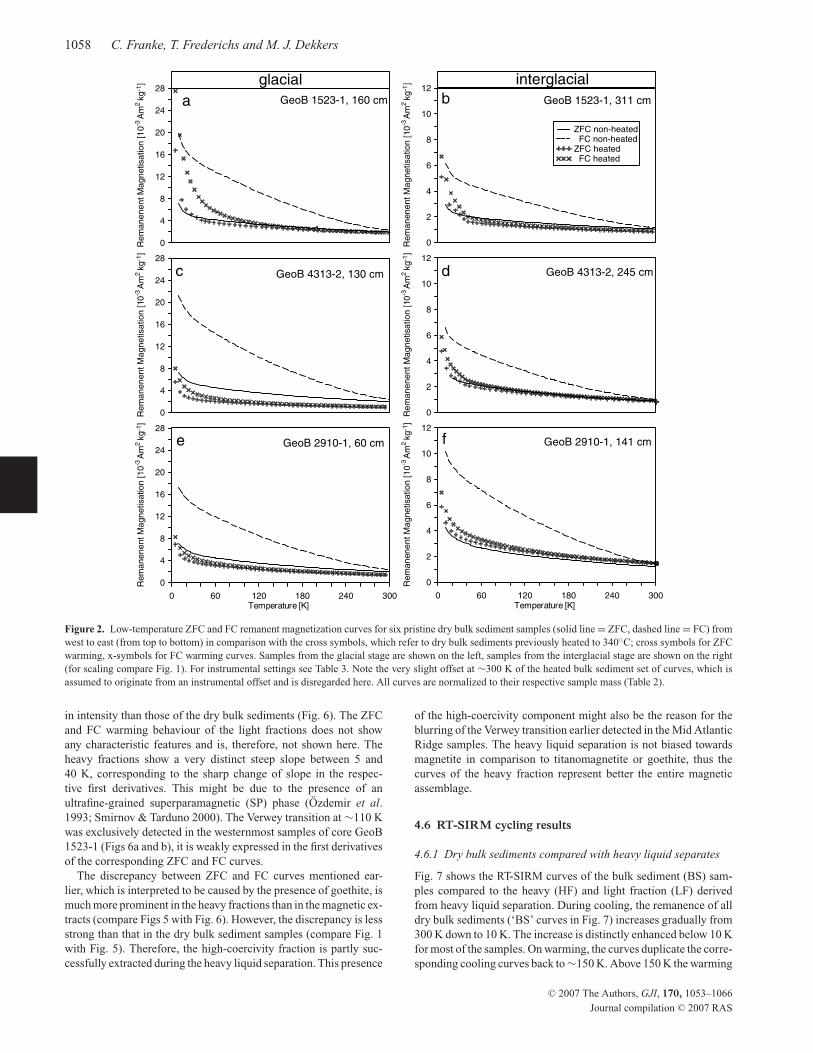
Figure 2. Low-temperature ZFC and FC remanent magnetization curves for six pristine dry bulk sediment samples (solid line = ZFC, dashed line = FC) fromwest to east (from top to bottom) in comparison with the cross symbols, which refer to dry bulk sediments previously heated to 340◦C; cross symbols for ZFCwarming, x-symbols for FC warming curves. Samples from the glacial stage are shown on the left, samples from the interglacial stage are shown on the right(for scaling compare Fig. 1). For instrumental settings see Table 3. Note the very slight offset at ∼300 K of the heated bulk sediment set of curves, which isassumed to originate from an instrumental offset and is disregarded here. All curves are normalized to their respective sample mass (Table 2).
in intensity than those of the dry bulk sediments (Fig. 6). The ZFCand FC warming behaviour of the light fractions does not showany characteristic features and is, therefore, not shown here. Theheavy fractions show a very distinct steep slope between 5 and40 K, corresponding to the sharp change of slope in the respec-tive first derivatives. This might be due to the presence of anultrafine-grained superparamagnetic (SP) phase (Ozdemir et al.1993; Smirnov & Tarduno 2000). The Verwey transition at ∼110 Kwas exclusively detected in the westernmost samples of core GeoB1523-1 (Figs 6a and b), it is weakly expressed in the first derivativesof the corresponding ZFC and FC curves.
The discrepancy between ZFC and FC curves mentioned ear-lier, which is interpreted to be caused by the presence of goethite, ismuch more prominent in the heavy fractions than in the magnetic ex-tracts (compare Figs 5 with Fig. 6). However, the discrepancy is lessstrong than that in the dry bulk sediment samples (compare Fig. 1with Fig. 5). Therefore, the high-coercivity fraction is partly suc-cessfully extracted during the heavy liquid separation. This presence
of the high-coercivity component might also be the reason for theblurring of the Verwey transition earlier detected in the Mid AtlanticRidge samples. The heavy liquid separation is not biased towardsmagnetite in comparison to titanomagnetite or goethite, thus thecurves of the heavy fraction represent better the entire magneticassemblage.
4.6 RT-SIRM cycling results
4.6.1 Dry bulk sediments compared with heavy liquid separates
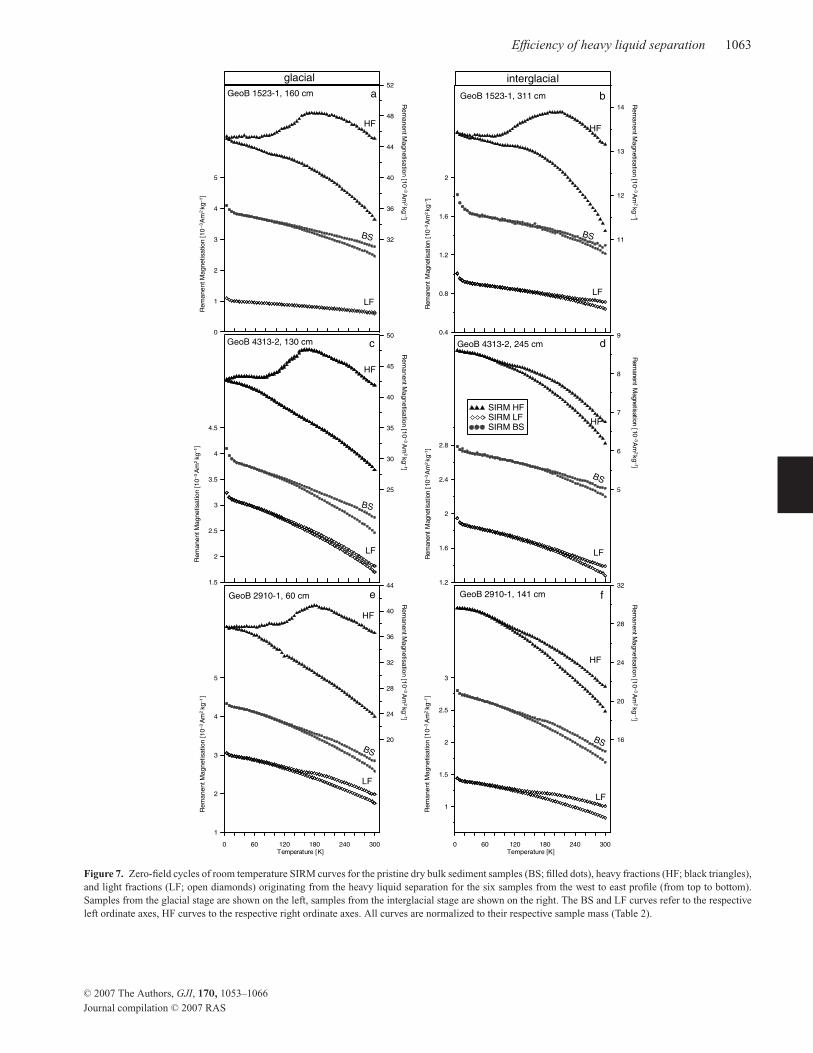
Fig. 7 shows the RT-SIRM curves of the bulk sediment (BS) sam-ples compared to the heavy (HF) and light fraction (LF) derivedfrom heavy liquid separation. During cooling, the remanence of alldry bulk sediments (‘BS’ curves in Fig. 7) increases gradually from300 K down to 10 K. The increase is distinctly enhanced below 10 Kfor most of the samples. On warming, the curves duplicate the corre-sponding cooling curves back to ∼150 K. Above 150 K the warming
C© 2007 The Authors, GJI, 170, 1053–1066
Journal compilation C© 2007 RAS

Efficiency of heavy liquid separation 1059
-1.6
-1.2
-0.8
-0.4
dM/d
T [1
0-5
Am
2 kg
-1 K
-1]
0.8
0.9
1
1.1
Rem
anent Magnetisation [10
-3A
m2 kg
-1]
-0.5
-0.4
-0.3
-0.2
dM/d
T [1
0-5
Am
2 kg
-1 K
-1]
1.4
1.6
1.8
2
2.2
2.4
2.6
Rem
anent Magnetisation [1
0-3 A
m2 kg
-1]
ZFH
GeoB 1523-1, 160 cm
320 360 400Temperature [K]
-1.6
-1.2
-0.8
-0.4
dM/d
T [1
0-5
Am
2 kg
-1 K
-1]
320 360 400Temperature [K]
1
1.2
1.4
1.6
Rem
anent Magnetisation [1
0-3 A
m2 kg
-1]
-1
-0.8
-0.6
-0.4
dM/d
T [1
0-5
Am
2 kg
-1 K
-1]
1.6
1.8
2
2.2
2.4
2.6
Rem
anent Magnetisation [10
-3 Am
2 kg-1]
-2.4
-2
-1.6
-1.2
-0.8
-0.4
dM/d
T [1
0-5
Am
2 kg
-1 K
-1]
0.6
0.7
0.8
0.9
1
1.1
Rem
anent Magnetisation [10
-3 Am
2 kg-1]
-0.6
-0.5
-0.4
-0.3
-0.2
-0.1
dM/d
T [1
0-5
Am
2 kg
-1 K
-1]
1.2
1.6
2
2.4
2.8
Rem
anent Magnetisation [10
-3 Am
2 kg-1]
ZFH
GeoB 4313-2, 130 cm
ZFH GeoB 2910-1, 60 cm
glacial
ZFH
GeoB 1523-1, 311cm
ZFH GeoB 4313-2, 245 cm
ZFH GeoB 2910-1, 141 cm
interglacial
a b
c d
e f
Figure 3. High-temperature cycling of the dry bulk sediments in zero-field (ZFH, solid line), for instrumental settings see Table 3. Grey shaded areas markthe sharp drop in remanence at 390–395 K. Filled symbols show the first derivative of the ZFH heating curve. Note that the ZFH cycle was performed after theFH cycle (compare Fig. 4). All curves are normalized to their respective sample mass (Table 2). The magnetic non-goethite amount are established by linearextrapolation (dashed lines, after Dekkers 1989) of the decay curve from temperatures above the bending point (vertical bold arrows).
curves are below the cooling curves. No specific magnetic transi-tions were noted in the dry bulk sediment measurements.
The remarkable increase in remanence occurring in the verylow temperature range between 10 and 5 K can also be observedin the room temperature SIRM curves of the light fraction (LF;Figs 7a–f). Therefore, it is most likely due to low-temperaturemagnetic ordering of paramagnetic (clay-)minerals (Coey 1988).Because the residual field of the MPMS is very low, this low-temperature ordering of the clay minerals in zero-field could becaused by the SIRM residing in magnetic mineral phases. This couldmagnetically couple to, for example, clay mineral coatings or ferri-hydrite in the direct vicinity of the magnetic particles. Transmissionelectron microscopic (TEM) investigations of the samples supportthe presence of such mineral phases (Franke 2006; Franke et al.
2007b). This would also suggest that the LF still contains part of thevery fine-grained SP fraction.
Usually the shape of the LF curves is quite similar to that ofthe dry bulk sediment curves (Fig. 7; compare LF and BS). Gener-ally, they show a less steep slope towards lower temperatures anda weaker total intensity. No specific magnetic transitions are de-tected in the LF. This seems reasonable, because the heavy mag-netic minerals are present in the HF (and of course in the dry bulksediments), whereas the LF should be dominated by the lighternon-magnetic mineral fraction, such as clays, silicates, carbonates,etc.
If the separation would be 100 per cent successful, the LFwould not carry any magnetic remanence and, therefore, wouldshow a purely paramagnetic low-temperature curve. In practice, the
C© 2007 The Authors, GJI, 170, 1053–1066
Journal compilation C© 2007 RAS

1060 C. Franke, T. Frederichs and M. J. Dekkers
-13
-12
-11
-10
-9
dM/d
T [1
0-4
Am
2 kg
-1 K
-1]
-8
-4
0
4
8
Magnetisation [10
-3A
m2 kg
-1]
-7
-6
-5
-4
-3
dM/d
T [1
0-4
Am
2 kg
-1 K
-1]
160
180
200
220
Magnetisation [10
-3 Am
2 kg-1]
FH
GeoB 1523-1, 160 cm
320 360 400Temperature [K]
-6
-5
-4
-3
-2
dM/d
T [1
0-4
Am
2 kg
-1 K
-1]
320 360 400Temperature [K]
0
2
4
6
8
10
12
Magnetisation [10
-3 Am
2 kg-1]
-4
-3
-2
dM/d
T [1
0-4
Am
2 kg
-1 K
-1]
0
2
4
6
8
Magnetisation [10
-3 Am
2 kg-1]
-10
-9
-8
-7
-6
-5
dM/d
T [1
0-4
Am
2 kg
-1 K
-1]
-2
0
2
4
6
8
10
Magnetisation [10
-3 Am
2 kg-1]
-4
-3
-2
-1
dM/d
T [1
0-4
Am
2 kg
-1 K
-1]
16
20
24
28
Magnetisation [10
-3 Am
2 kg-1]
FH
GeoB 4313-2, 130 cm
FH GeoB 2910-1, 60 cm
glacialFH
GeoB 1523-1, 311 cm
FH
GeoB 4313-2, 245 cm
FH GeoB 2910-1, 141 cm
interglacial
c
ba
d
e f
Figure 4. High-temperature cycling of induced magnetization of pristine dry bulk sediments (FH, solid line) for instrumental settings see Table 3. The FHmagnetization curves are corrected for the paramagnetic contribution. According to the Curie-Weiss-Law, the paramagnetic contribution is linear with theinverse of the absolute temperature. It was calculated from field-dependent measurements of the dry bulk sediments between 4 and 7 T at room temperature(not shown here). Open symbols show the first derivatives of the FH heating curves. Grey shaded areas indicate the position of the Hopkinson peak in FHheating curves between 370 and 380 K in samples from core GeoB 4313-2. Cooling curves of the FH measurements show an increase in induced magnetizationat room temperature, except for sample GeoB 1523-1, 160 cm. All curves are normalized to their respective sample mass (Table 2).
separation is 30–97 per cent efficient. Therefore, we see the signalof a minor antiferromagnetic component in the LF, possibly mingledwith a lesser ferrimagnetic contribution.
The RT-SIRM curves of the HF (Fig. 7) show characteristic low-temperature curves for (titano-)magnetite (Ozdemir et al. 2002;Kosterov 2003; Lagroix et al. 2004; Ozdemir & Dunlop 2003;Garming et al. 2007), although we realize that RT-SIRM behaviourof (titano-)magnetites is not really well covered in the literature.Comparison of our HF curves with the titanomagnetite resultsfrom Ozdemir & Dunlop (2003), Lagroix et al. (2004) and theRT-SIRM curves of Engelmann et al. (personal communication,2006) from synthetic Fe-Ti oxide phases of various well defined
Ti-content (Lattard et al. 2005) confirm the presence of (slightly ox-idized) magnetite, various titanomagnetite, and titanohematite com-ponents in our samples. The occurrence of various Ti-Fe oxides isexpressed by several minor changes of the cooling curve slope be-tween 240 and 180 K (Figs 8a–f). The undulations in the coolingcurves above ∼210 K should document the low-temperature mag-netic ordering of titanohematite, induced by the room temperatureremanent magnetization of the intergrown titanomagnetite phase(Garming et al. 2007). The undulations detected on cooling be-low 210 K can be explained as magnetoelastical domain wall pin-ning postulated for this temperature range by Ozdemir & Dunlop(2003).
C© 2007 The Authors, GJI, 170, 1053–1066
Journal compilation C© 2007 RAS

Efficiency of heavy liquid separation 1061
0 60 120 180 240 300Temperature [K]
-14
-12
-10
-8
-6
-4
-2
0
dM/d
T [1
0-3 ]
-14
-12
-10
-8
-6
-4
-2
0
dM/d
T [1
0-3 ]
-14
-12
-10
-8
-6
-4
-2
0
dM/d
T [1
0-3 ]
0 60 120 180 240 300Temperature [K]
0.2
0.4
0.6
0.8
1
1.2
Norm
alised remanence
0.2
0.4
0.6
0.8
1
1.2
Norm
alised remanence
0.2
0.4
0.6
0.8
1
1.2
Norm
alised remanence
GeoB 1523-1, 160 cm GeoB 1523-1, 311 cm
GeoB 2910-1, 60 cm GeoB 2910-1, 141 cm
GeoB 4313-2, 130 cm GeoB 4313-2, 245 cm
glacial interglacial
ZFC magnetic extract FC magnetic extractZFC first derivative FC first derivative
ZFC5K = 3.28*10-7 Am2
ZFC5K = 2.18*10-7 Am2
ZFC5K = 1.32*10-7 Am2 ZFC5K = 0.691*10-7 Am2
ZFC5K = 3.84*10-7 Am2 ZFC5K = 7.44*10-7 Am2
a b
c d
e f
Figure 5. Low-temperature ZFC and FC remanence warming curves for magnetic extracts of all six samples from the west to east profile (from top to bottom).Lines refer to the ZFC and FC warming curves of the magnetic extract (solid line = ZFC, dashed line = FC), for instrumental settings see Table 3. Curves arenormalized to the magnitude of the respective ZFC value at 5 K (given for each individual panel). Grey squares refer to the first derivatives of the remanencecurves (filled symbols = slope of ZFC, open symbols = slope of FC). All ZFC and FC curves have the same ordinate scale.
4.6.2 Magnetic extracts compared with heavy liquid separates
Fig. 8 shows the RT-SIRM curves of the magnetic extracts comparedto the HF. For the sake of comparison, all curves were normalized totheir value at 300 K. The RT-SIRM curves of the magnetic extracts(ME) clearly show ferrimagnetism-dominated curves, typically ofmagnetite (Ozdemir et al. 2002; Kosterov 2003). The cooling andwarming ME curves are more or less reversible in the tempera-ture range between 5 and 110 K. The relative changes of the rema-nence loss (derived from the absolute values) during the completecooling-warming-cycle are only subtle. Generally samples fromthe westernmost sediment core (CER; Figs 8a and b) show rema-nence losses of ∼9 per cent, the samples from the Mid-AtlanticRidge site (Figs 8c and d) result in ∼8 per cent remanence loss andthe easternmost samples (SLR; Figs 8e and f) have the largest rema-nence losses of ∼13 per cent. The smooth increase with decreasingtemperature in the HF curves, caused by the high-coercivity com-ponent, is not present in the magnetic extract curves. Comparing the
differences between 125 and 105 K for both types of curves (MEand HF) shows that this drop in remanence – which is closely relatedto the presence of magnetite – is two times larger in the magneticextracts relative to the HF curves.
All cooling branches of the RT-SIRM curves (Fig. 8) of the HFshow this continuous increase with decreasing temperature if onecompares the initial value at 300 K and the value at 5 K. Vice versa,the reversed trend is observed in the RT-SIRM warming branchesof the HF curves. This effect is attributed to the goethite componentdiscussed before (Lowrie & Heller 1982; Dekkers 1989). The gen-eral shapes of the RT-SIRM curves of the HF were already brieflydescribed before.
The RT-SIRM cycles of the interglacial HF samples of the coresGeoB 4313-2 and GeoB 2910-1 (Figs 8d and f) rather demonstratecurves characteristic for very Ti-rich oxide phases (Engelmannet al. personal communication, 2006) showing a reversing rema-nence behaviour during cooling and warming between 110 and 5 K.This is also expressed in the remanence loss behaviour of the HF
C© 2007 The Authors, GJI, 170, 1053–1066
Journal compilation C© 2007 RAS

1062 C. Franke, T. Frederichs and M. J. Dekkers
0 60 120 180 240 300Temperature [K]
-30
-20
-10
0dM
/dT
[10-
4 A
m2
kg-1
K-1
]
-50
-40
-30
-20
-10
0
dM/d
T [1
0-4
Am
2 kg
-1 K
-1]
-8
-6
-4
-2
0
dM/d
T [1
0-4
Am
2 kg
-1 K
-1]
-50
-40
-30
-20
-10
0
dM/d
T [1
0-4
Am
2 kg
-1 K
-1]
-10
-8
-6
-4
-2
0
dM/d
T [1
0-4
Am
2 kg
-1 K
-1]
-50
-40
-30
-20
-10
0
dM/d
T [1
0-4
Am
2 kg
-1 K
-1]
0 60 120 180 240 300Temperature [K]
0
40
80
120
160
200
Rem
anent Magnetisation [10
-3 Am
2 kg-1]
0
40
80
120
160
200
Rem
anent Magnetisation [10
-3 Am
2 kg-1]
0
40
80
120
160
200
Rem
anent Magnetisation [10
-3 Am
2 kg-1]
0
40
80
120 Rem
anent Magnetisation [10
-3 Am
2 kg-1]
0
10
20
30
40 Rem
anent Magnetisation [10
-3 Am
2 kg-1]
0
10
20
30
40
50 Rem
anent Magnetisation [10
-3 Am
2 kg-1]
glacial interglacial
GeoB 1523-1, 311 cm
GeoB 2910-1, 141 cm
GeoB 4313-2, 245 cm
ZFC heavy fraction FC heavy fractionZFC first derivative FC first derivative
GeoB 1523-1, 160 cm
GeoB 2910-1, 60 cm
GeoB 4313-2, 130 cm
a b
c d
e f
Figure 6. Low-temperature ZFC and FC remanence warming curves for the heavy fractions of the heavy liquid separates of the six samples from the west toeast profile (from top to bottom). Lines refer to the ZFC and FC warming curves of the heavy fraction (solid line = ZFC, dashed line = FC), for instrumentalsetting see Table 3. Grey triangles refer to the first derivative of the respective remanence curves (filled symbols = slope of ZFC, open symbols = slope of FC).All curves are normalized to their respective sample mass (Table 2).
samples (calculated from the respective initial and final absolutevalues): the westernmost sediment core GeoB 1523-1 shows a re-manence loss of ∼15 per cent (Fig. 8b) for the interglacial sample,comparable to the remanence loss of ∼12 per cent for the interglacialsamples from the Mid Atlantic Ridge (GeoB 4313-2; Fig. 8d) andthe easternmost core (GeoB 2910-1; Fig. 8f). In contrast, the glacialsamples of cores GeoB 1523-1 (Fig. 8a), GeoB 4313-2 (Fig. 8c), andGeoB 2910-1 (Fig. 8e) have the largest remanence loss of 25–35 percent. This corresponds with findings of Ozdemir et al. (2002), whodescribe an increasing remanence loss for stoichiometric magnetiteof increasing grain size.
5 D I S C U S S I O N
The expression of the Verwey transition in the ZFC and FCcurves in the magnetic extracts can be totally suppressed by oxi-dation/maghemitization of z = 0.3 (e.g. Ozdemir et al. 1993) or bya fairly low Ti-content of x ≥ 0.04 in magnetite (e.g. Kakol et al.1994). The Ti-content is expressed by the characteristic shape of theRT-SIRM curves of the HF from GeoB 4313-2 and GeoB 2910-1 asearlier discussed in Section 4.6. SEM observations, using elementdispersive spectroscopy (Goldstein et al. 1992), confirm the differ-
ent Ti-content in the magnetic mineral assemblage of these sedi-ments (Franke 2006; Franke et al. 2007b). In addition, accessoryTi-rich titanohematite particles have been identified with electronbackscatter diffraction techniques (Franke et al. 2007a).
The magnetic extracts do not contain much of the high-coercivitycomponent. Therefore, they mainly express the low-temperature be-haviour of the low-coercivity fraction in the magnetic assembly. ZFCand FC warming curves of the interglacial samples have a slightlysteeper slope than those of the glacial samples. This indicates a finermagnetic grain size of the low-coercivity fraction, which concurswith other magnetic grain size observations in the dry bulk sedimentmeasurements.
In the heavy liquid extraction procedure high-coercivity compo-nents, such as goethite, were successfully extracted and contributedistinctly to the characteristics of the magnetic signal. In particularthe RT-SIRM curves offer additional mineralogical and grain sizeinformation, which was not detected by the low-temperature SIRMcurves. Therefore, low-temperature measurements on marine sedi-ments using the heavy fraction might result in more detailed curvesof more complete and quantitative samples. Comparison of theresults from the glacial and interglacial samples showed thatthe HF distinguished between their coarser and finer magnetic
C© 2007 The Authors, GJI, 170, 1053–1066
Journal compilation C© 2007 RAS
Efficiency of heavy liquid separation 1063
0 60 120 180 240 300Temperature [K]
1
2
3
4
5
Rem
ane
nt M
agne
tisat
ion
[10–
3 Am
2 kg
–1]
1.5
2
2.5
3
3.5
4
4.5
Rem
anen
t Mag
netis
atio
n [1
0–3A
m2 kg
–1]
0.4
0.8
1.2
1.6
2
Rem
anen
t M
agne
tisat
ion
[10
–3A
m2 kg
–1]
0
1
2
3
4
5
Rem
anen
t Mag
netis
atio
n [1
0–
3A
m2 kg
–1]
0 60 120 180 240 300Temperature [K]
20
24
28
32
36
40
44
Rem
anent M
agnetisation [10
–3 Am
2 kg–1]
25
30
35
40
45
50
Rem
anent M
agnetisation [10–3 A
m2 kg
–1]
32
36
40
44
48
52
Rem
anent Magnetisation [10
–3 A
m2 kg
–1]
16
20
24
28
32
Rem
anent M
agnetisation [10
–3 Am
2 kg–1]
5
6
7
8
9
Rem
anent Magnetisation [10
–3Am
2 kg–1]
11
12
13
14
Rem
anent Magnetisation [10
–3 A
m2 kg
–1]
1.2
1.6
2
2.4
2.8
Rem
anen
t M
agne
tisat
ion
[10
–3 A
m2 kg
–1]
1
1.5
2
2.5
3
Rem
ane
nt M
agne
tisat
ion
[10–
3 Am
2 kg
–1]
GeoB 1523-1, 160 cm
GeoB 2910-1, 60 cm
GeoB 4313-2, 130 cm
GeoB 1523-1, 311 cm
GeoB 4313-2, 245 cm
GeoB 2910-1, 141 cm
HF
BS
LF
HF
HF
HF
HF
HF
BS
BS
LF
BS
LF
BS
SIRM HFSIRM LFSIRM BS
BS
LF
LF
LF
glacial interglaciala b
c d
e f
Figure 7. Zero-field cycles of room temperature SIRM curves for the pristine dry bulk sediment samples (BS; filled dots), heavy fractions (HF; black triangles),and light fractions (LF; open diamonds) originating from the heavy liquid separation for the six samples from the west to east profile (from top to bottom).Samples from the glacial stage are shown on the left, samples from the interglacial stage are shown on the right. The BS and LF curves refer to the respectiveleft ordinate axes, HF curves to the respective right ordinate axes. All curves are normalized to their respective sample mass (Table 2).
C© 2007 The Authors, GJI, 170, 1053–1066
Journal compilation C© 2007 RAS

1064 C. Franke, T. Frederichs and M. J. Dekkers
0.7
0.8
0.9
1
1.1
Nor
mal
ised
rem
anen
ce
0.8
0.9
1
1.1
Norm
alised remanence
0.6
0.8
1
1.2
Nor
mal
ised
rem
anen
ce
0.8
0.9
1
1.1
1.2
1.3
1.4
Norm
alised remanence
0.6
0.7
0.8
0.9
1
1.1
1.2
Nor
mal
ised
rem
anen
ce
0 60 120 180 240 300Temperature [K]
0 60 120 180 240 300Temperature [K]
0.9
1
1.1
1.2
1.3
Norm
alised remanence
GeoB 1523-1, 160 cm
GeoB 2910-1, 60 cm
GeoB 4313-2, 130 cm
HF
HF
HF
ME
ME
ME
GeoB 1523-1, 311 cm
GeoB 4313-2, 245 cm
GeoB 2910-1, 141 cm
ME
ME
ME
HF
SIRM heavy fraction (HF)
SIRM magn. extract (ME)
HF
HF
glacial interglacial
a b
c d
e f
Figure 8. Comparisons of the zero-field cycles of RT-SIRM for the heavy fractions (HF; black triangles) and the magnetic extracts (ME; open squares) of thesix samples from the west to east profile (from top to bottom). ME curves are clearly dominated by the soft component magnetite, where as the HF curves showa steeper slope due to the high coercivity component goethite. Further detailed transitions in the temperature range between 240 and 180 K corresponding tothe various present Fe-Ti phases. All ME and HF curves are normalized to the value of the respective ZFC curve at 300 K as weight normalization was notmeaningful in case of the ME samples. The magnetically coarser samples from the glacial stage are shown in the left column and the magnetically finer samplesfrom the interglacial stage are shown in the right column.
inventory and also showed a clear west–east trend in dependenceof the Ti-content. Funk et al. (2004a) described the magnetic grainsizes of MIS 4 (glacial) as much coarser than those of MIS 5.5(interglacial). This concurs with the reasoning that the (enhanced)presence of SP material is coupled to an increased discrepancy ofZFC and FC curves for the interglacial samples. Another reasonableexplanation of these ZFC and FC curve discrepancies was found inthe temperature-dependent behaviour of goethite (Smirnov & Tar-
duno 2000). In this study, we are dealing with natural samples ofobviously complex compositions and grain size distributions and,therefore, our RT-SIRM curves reflect the features of all presentcomponents in a non-trivial manner. The absence in the HF mea-surements of the ferrimagnetic ordering of paramagnetic materialat very low temperatures confirms the success in separating the dia-and paramagnetic fraction from the ferrimagnetic and antiferromag-netic fractions.
C© 2007 The Authors, GJI, 170, 1053–1066
Journal compilation C© 2007 RAS

Efficiency of heavy liquid separation 1065
When comparing both extraction methods, the magnetic ex-tract (nearly) exclusively represents the soft magnetic compo-nents of the dry bulk sediment. Within the range of soft magneticcomponents, magnetite has the highest spontaneous magnetizationand is, therefore, preferably extracted by methods such as describedby Petersen et al. (1986) or Dekkers (1988). Additionally, the mag-netic extraction leads generally to extracts that are relatively coarser-grained than the starting bulk sediment.
The extraction efficiencies presented in Table 1 show that theyield of the extraction is strongly dependent on the lithology ofthe starting material (particularly of its clay-mineral content), theprevailing magnetic mineral assemblage, and its grain size distri-bution. Quantification by performing before- and after-extractionmagnetic measurements is, therefore, strongly influenced by theproportion of low- to high-coercive magnetic components in theresulting concentrate. Even if the concentration of goethite in asample is much higher than that of (titano-)magnetite, the magne-tization still is mainly carried by the low-coercive mineral fraction.Therefore, the extraction efficiency of the heavy liquid separationcan be regarded as an ‘absolute’ efficiency because both coercivityfractions are equally extracted from the bulk sediment sample. Theefficiency for the magnetic extraction technique is rather a ‘maxi-mum’ efficiency, since it prefers the low-coercive fraction. This hasto be kept in mind when comparing the results of both concentrationtechniques.
Any sample concentration technique can potentially alter the orig-inal material. For marine sediments from suboxic or anoxic en-vironments, this could actually cause undesired oxidation of ironsulphide mineral phases (e.g. greigite or pyrite). If the samplesare suspended in a sediment slurry, the suspension should be de-oxygenized by purging with an inert gas. This can be achievedby performing the upgrading in a closed cycle under argon at-mosphere and the usage of ethanol instead of water as suspensionmedium.
Non-toxic sodium polytungstenate solution Na6[H2W12O40]does not react with the sample material and causes no additionaloxidation. Its hydrophilic character allows to disperse the relativelyclay-rich homogenized dry bulk sediment reasonably well withoutusage of any additional peptiser. No chemical leaching had to beused, so the risk of alteration or even dissolution, particularly ofthe magnetic nanoparticles can be disregarded. The combination ofheavy liquid separation, mechanical and ultrasonic agitation, andcentrifuging accelerates the gravity separation method and leads togenerally better results for marine sediment samples, avoiding clus-tering problems due to high clay content. The light fraction alwaysserves as a control measure for the success of the separation. Al-ternatively, as shown in Lagroix et al. (2004), the specific densityof the heavy liquid can be easily adjusted so that slightly differentmagnetic fractions can be separated. In case of presence of param-agnetic heavy minerals, such as barite or siderite, these minerals areevidently included in the heavy fraction and have to be taken intoaccount during low-temperature measurements (Frederichs et al.2003).
The magnetic results for the heavy liquid separates presentedhere, confirm that the heavy fraction represents the complete mag-netic inventory to a reasonable extent. Using this technique, a muchlarger amount of magnetic material is available for measurements,which can be sufficiently quantified. The success of the separationis generally dependent on the grain size distribution of the magneticinventory. Especially components such as ultrafine SP material re-main difficult to extract completely.
6 C O N C L U S I O N S
(1) Magnetic extracts are not always representative of the magneticinventory in bulk sediments. Soft ferrimagnetic material is over-represented in the extract. Vice versa, much more weakly magnetic(antiferromagnetic) material, is underrepresented. This has to bekept in mind during interpretation of the mineral magnetic data, forexample, low-temperature remanence curves.
(2) Heavy liquid separation (with sodium polytungstenate solu-tion) is a useful tool to achieve a more complete ‘magnetic’ extract.It is as straightforward as magnetic extraction, both methods do notdemand much experimental time. Heavy liquid separation allows thequantification of the resulting heavy and light mineral fractions andleads to larger yields of ‘magnetic’ extracts in particular for clay-richmaterial. Applied to fine-grained unconsolidated marine sediments,the combination of a hydrophilic heavy liquid (polytungstenate) dis-persion with ultrasonic waves and subsequent centrifuging was verysuccessful in separating the lighter dia- and paramagnetic mineralfraction from the heavy ferrimagnetic fraction. In sediments with ap-preciable non-ferrimagnetic heavy minerals, these will be includedin the heavy liquid separate as well.
(3) Comparison of the glacial and interglacial samples showedthat the heavy liquid extraction improves in quality with increas-ing magnetic grain size. However, even very fine material is stillreasonably well extracted.
(4) The RT-SIRM curves turned out to be the most indicativemeasurements for our marine sediment samples. Due to the variableTi-content of the magnetite particles these curves are more diagnos-tic in comparison to LT-ZFC and FC warming curves. Nevertheless,we recommend a combination of both remanence measurements forthe sake of completeness and understanding of the low-temperaturerock magnetic analysis.
A C K N O W L E D G M E N T S
The authors would like to thank Mark Hounslow and France Lagroixfor their helpful reviews. The heavy liquid separation was performedat facilities of the Marine Geochemistry section, University of Bre-men, we would like to thank particularly Michael Schweizer andNatascha Riedinger for their assistance. TC-Tungsten CompoundsEnterprises provided advice and heavy liquid solution for test runs.We also owe thanks to the members of the Marine Geophysics sec-tion (University of Bremen) and the Palaeomagnetic Laboratory(Utrecht University) for their support and advice. Financial supportof CF was provided by the DFG through the European GraduateCollege EUROPROX, (Universities of Bremen and Utrecht) andby NWO through the VMSG, Vening Meinesz Research School ofGeodynamics (Utrecht University). This investigation is also asso-ciated to the Research Center Ocean Margins (RCOM publicationno. 0504) at the University of Bremen.
R E F E R E N C E S
Coey, J.M.D., 1988. Magnetic properties of iron in soil iron oxides and clayminerals, in Iron in Soils and Clay Minerals, pp. 397–466, eds Stucki,J.W., Goodman, B.A. & Schwertmann, U. Reidel Publishing Company,Dortrecht.
Dekkers, M.J., 1988. Some rockmagnetic parameters for natural goethite,pyrrhotite and fine-grained hematite, Geologica Ultraiectina, 51,Ph.D. thesis, Utrecht University, 231 p.
Dekkers, M.J., 1989. Magnetic properties of natural goethite – II. TRMbehaviour during thermal and alternating field demagnetization and low-temperature treatment, Geophys. J., 97, 341–355.
C© 2007 The Authors, GJI, 170, 1053–1066
Journal compilation C© 2007 RAS

1066 C. Franke, T. Frederichs and M. J. Dekkers
Fischer, G. & cruise participants, 1998. Report and preliminary results ofMeteor cruise M38/1, Las Palmas – Recife, 25.1.-1.3.1997, Ber. Fachber.Geowiss. Univ. Bremen, 94, 178 p.
Franke, C., 2006. Investigating lithologic characteristics of marine magneticproxy parameters, Geologica Ultraiectina, 263, Ph.D. thesis. Utrecht Uni-versity, 146 p.
Franke, C., Pennock, G.M., Drury, M.R., Lattard, D., Engelmann, R.,Garming, J.F.L., von Dobeneck, T. & Dekkers, M.J., 2007a. Identifica-tion of magnetic Fe-Ti oxides in marine sediments by electron backscatterdiffraction in scanning electron microscopy, Geophys. J. Int., 170, 545–555.
Franke, C., von Dobeneck, T., Drury, M.R., Meeldijk, J.D. & Dekkers, M.J.,2007b. Magnetic petrology of equatorial atlantic sediments: electron mi-croscopy results and their implications for environmental magnetic inter-pretation, Paleoceanography, in press.
Frederichs, T., von Dobeneck, T., Bleil, U. & Dekkers, M.J., 2003. Towardsthe identification of siderite, rhodochrosite and vivianite in sediments bytheir low-temperature magnetic properties, Phys. Chem. Earth, 28, 669–679.
Funk, J.A., von Dobeneck, T. & Reitz, A., 2004a. Integrated rock magneticand geochemical quantification of redoxomorphic iron mineral diagenesisin Late Quaternary sediments from the Equatorial Atlantic, in The SouthAtlantic in the Late Quaternary: Reconstruction of Material Budget andCurrent Systems, pp. 237–260, eds Wefer, G., Mulitza, S. & Ratmeyer,V., Springer-Verlag, Heidelberg, Berlin, New York.
Funk, J.A., von Dobeneck, T., Wagner, T. & Kasten, S., 2004b. Late quater-nary sedimentation and early diagenesis in the equatorial Atlantic Ocean:patterns, trends and processes deduced from rock magnetic and geochemi-cal records, in The South Atlantic in the Late Quaternary: Reconstructionof Material Budget and Current Systems, pp. 461–497, eds Wefer, G.,Mulitza, S. & Ratmeyer, V., Springer-Verlag, Heidelberg, Berlin, NewYork.
Garming, J.F.L., Bleil, U., Franke, C. & von Dobeneck, T., 2007. Low-temperature partial magnetic self-reversal in marine sediments, Geophys.J. Int., in press.
Goldstein, J.I., Newbury, D.E., Echlin, P., Joy, D.C., Romig, A.D. Jr., Lyman,C.E., Fiori, C. & Lifshin, E., 1992. Scanning Electron Microscopy andX-Ray Microanalysis, 2nd edn, Plenum Press, New York, 820 p.
Hedley, I.G., 1971. The weak ferromagnetism of goethite (α-FeOOH), Z.Geophy., 37, 409–420.
Heller, F., 1978. Rockmagnetic studies of Upper Jurassic limestones fromSouthern Germany, J. Geophys., 44, 525–543.
Henrich, R. & cruise participants, 1994. Report and preliminary results ofMeteor cruise M29/3, Rio de Janeiro – Las Palmas 11.8. – 5.9.1994. Ber.Fachber. Geowiss. Univ. Bremen, 60, 155 p.
Hounslow, M.W. & Maher, B.A., 1996. Quantitative extraction and analysisof carriers of magnetization in sediments, Geophys. J. Int., 124, 57–74.
Hounslow, M.W. & Maher, B.A., 1999. Laboratory procedures for quan-titavive extraction and analysis of magnetic minerals from sediments,in Environmental Magnetism, a Practical Guide, Vol. 6, pp. 139–164,eds Walden, J., Oldfield, F. & Smith, J., Quaternary Research As-sociation, Technical Guide, London, http://www.geography.lancs.ac.uk/cemp/publications/walden-chap.zip.
Kakol, Z., Sabol, J., Stickler, J., Kozlowski, A. & Honig, J.M., 1994. Influenceof titanium doping on the magnetocrystalline anisotropy of magnetite,Phys. Rev. B, 49, 12 767–12 772.
Kosterov, A., 2003. Low-temperature magnetization and AC susceptibilityof magnetite: effect of thermomagnetic history, Geophys. J. Int., 154,58–71.
Kosterov, A., Frederichs, T. & von Dobeneck, T., 2006. Low-temperaturemagnetic properties of rhodochrosite (MnCO3), Phys. Earth Planet. Inter.,154, 234–242.
Lagroix, F., Banerjee, S.K. & Jackson, M.J., 2004. Magnetic properties ofthe Old Crow tephra: identification of a complex iron titanium oxide min-eralogy, J. Geophys. Res., 109, B01 104, doi:10.1029/2003JB002678.
Lattard, D., Sauerzapf, U. & Kasemann, M., 2005. New calibration data forthe Fe-Ti oxide thermo-oxybarometers from experiments in the Fe-Ti-Osystem at 1 bar, 1,000–1,300◦C and a large range of oxygen fugacities,Contrib. Mineral. Petrol., 149, 735–754.
Lowrie, W. & Heller, F., 1982. Magnetic properties of marine limestones,Rev. Geophys. Space. Phys., 20, 171–192.
Ozdemir, O. & Dunlop, D.J., 2003. Low-temperature behaviour and mem-ory of iron-rich titanomagnetites (Mt. Haruna, Japan and Mt. Pinatubo,Philippines), Earth Plant. Sci. Lett., 216, 193–200.
Ozdemir, O., Dunlop, D.J. & Moskowitz, B.M., 1993. The effect of oxidationon the Verwey transition in magnetite, Geophys. Res. Lett., 20, 1671–1674.
Ozdemir, O., Dunlop, D. & Moskowitz, B.M., 2002. Changes in remanence,coercivity and domain state at low temperature in magnetite, Earth Planet.Sci. Lett., 194, 343–358.
Passier, H.F. & Dekkers, M.J., 2002. Iron oxide formation in the activeoxidation front above sapropel S1 in the eastern Mediterranean Sea asderived from low-temperature magnetism, Geophys. J. Int., 150, 230–240.
Petersen, N., von Dobeneck, T. & Vali, H., 1986. Fossil bacterial magnetite indeep-sea sediments from the South Atlantic Ocean, Nature, 320, 611–615.
Reitz, A., Hensen, C., Kasten, S., Funk, J.A. & de Lange, G.J., 2004. Acombined geochemical and rock-magnetic investigation of a redox hori-zon at the last glacial/interglacial transition, Phys. Chem. Earth, 29, 921–931.
Rochette, P., Mathe, P.-E., Esteban, L., Rakoto, H., Bouchez, J.-L., Liu, Q.& Torrent, J., 2005. Non-saturation of the defect moment of goethiteand fine-grained hematite up to 57 Teslas, Geophys. Res. Lett., 32,doi:10.1029/2005GL024196.
Smirnov, A.V. & Tarduno, J.A., 2000. Low-temperature magnetic proper-ties of pelagic sediments (Ocean Drilling Program Site 805C): tracersof maghemitization and magnetic mineral reduction, J. Geophys. Res.,107(B7), 16 457–16 471.
Schulz, H.D. & cruise participants, 1991. Report and preliminary resultsof Meteor cruise M16/2, Recife – Belem, 28.4.-20.5.1991, Ber. Fachber.Geowiss. Univ. Bremen, 19, 149 p.
Van Velzen, A.J. & Zijderveld, J.D.A., 1992. A method to study alterationsof magnetic minerals during thermal demagnetization applied to a fine-grained marine marl (Trubi Formation, Sicily), Geophys. J. Int., 110, 79–90.
Van Velzen, A.J. & Zijderveld, J.D.A., 1995. Effects of weathering on singledomain magnetite in early Pliocene marls, Geophys. J. Int., 121, 267–278.
Van Velzen A.J. & Dekkers M.J., 1999a. Low-temperature oxidation of mag-netite in loess-paleosol sequences: a correction of rock magnetic param-eters, Studia Geophysica et Geodaetica, 43(4), 357–375.
Van Velzen, A.J. & Dekkers M.J., 1999b. The incorporation of thermal meth-ods in mineral magnetism of loess-paleosol sequences: a brief overview,Chin. Sci. Bull., 44(Suppl. 1), 53–63.
von Dobeneck, T., Petersen, N. & Vali, H., 1987. Bakterielle Mag-netofossilien – palaomagnetische und palaontologische Spuren einerungewohnlichen Bakteriengruppe, Geowissenschaften in unserer Zeit, 1,27–35.
C© 2007 The Authors, GJI, 170, 1053–1066
Journal compilation C© 2007 RAS
Copyright © 2022 FDOKUMEN